University Heights, IA Map & Demographics
University Heights Map
University Heights Overview
$73,766
PER CAPITA INCOME
$151,250
AVG FAMILY INCOME
$102,838
AVG HOUSEHOLD INCOME
21.5%
WAGE / INCOME GAP [ % ]
78.5¢/ $1
WAGE / INCOME GAP [ $ ]
0.64
INEQUALITY / GINI INDEX
1,353
TOTAL POPULATION
671
MALE POPULATION
682
FEMALE POPULATION
98.39
MALES / 100 FEMALES
101.64
FEMALES / 100 MALES
27.5
MEDIAN AGE
3.2
AVG FAMILY SIZE
2.5
AVG HOUSEHOLD SIZE
748
LABOR FORCE [ PEOPLE ]
71.2%
PERCENT IN LABOR FORCE
1.6%
UNEMPLOYMENT RATE
Income in University Heights
Income Overview in University Heights
Per Capita Income in University Heights is $73,766, while median incomes of families and households are $151,250 and $102,838 respectively.
| Characteristic | Number | Measure |
| Per Capita Income | 1,353 | $73,766 |
| Median Family Income | 272 | $151,250 |
| Mean Family Income | 272 | $292,672 |
| Median Household Income | 552 | $102,838 |
| Mean Household Income | 552 | $177,971 |
| Income Deficit | 272 | $0 |
| Wage / Income Gap (%) | 1,353 | 21.49% |
| Wage / Income Gap ($) | 1,353 | 78.51¢ per $1 |
| Gini / Inequality Index | 1,353 | 0.64 |
Earnings by Sex in University Heights
Average Earnings in University Heights are $54,489, $63,250 for men and $49,655 for women, a difference of 21.5%.
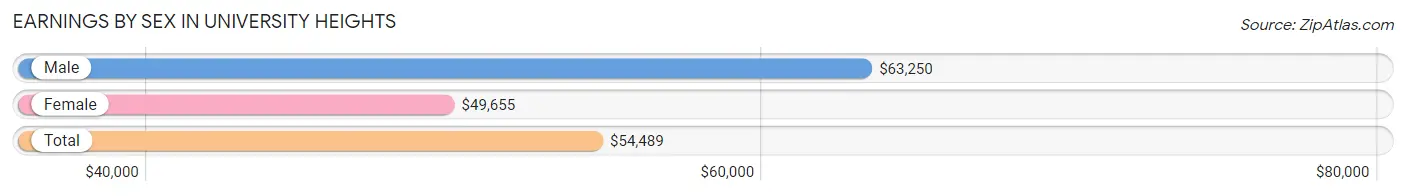
| Sex | Number | Average Earnings |
| Male | 417 (51.7%) | $63,250 |
| Female | 390 (48.3%) | $49,655 |
| Total | 807 (100.0%) | $54,489 |
Earnings by Sex by Income Bracket in University Heights
The most common earnings brackets in University Heights are $100,000+ for men (140 | 33.6%) and $100,000+ for women (108 | 27.7%).
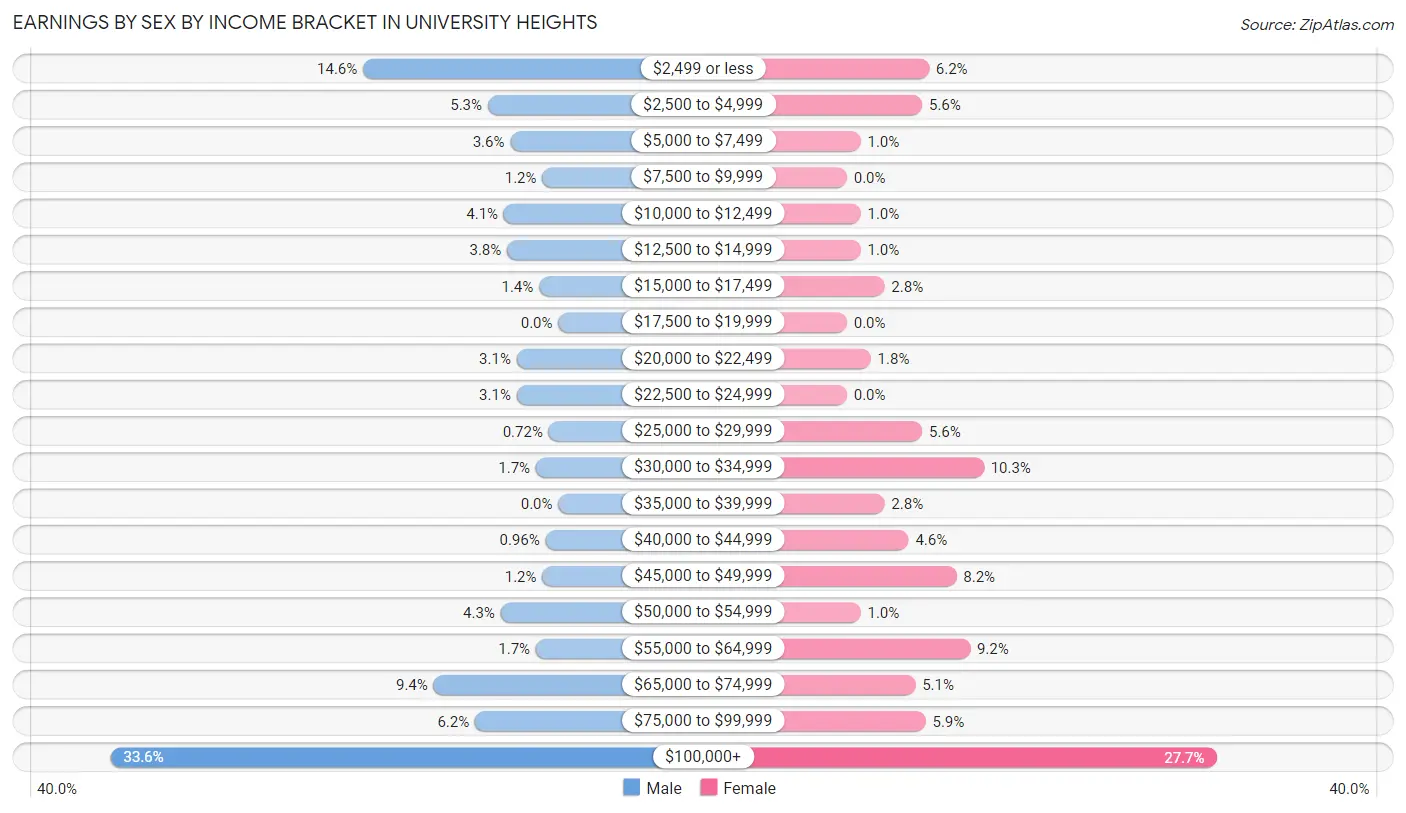
| Income | Male | Female |
| $2,499 or less | 61 (14.6%) | 24 (6.1%) |
| $2,500 to $4,999 | 22 (5.3%) | 22 (5.6%) |
| $5,000 to $7,499 | 15 (3.6%) | 4 (1.0%) |
| $7,500 to $9,999 | 5 (1.2%) | 0 (0.0%) |
| $10,000 to $12,499 | 17 (4.1%) | 4 (1.0%) |
| $12,500 to $14,999 | 16 (3.8%) | 4 (1.0%) |
| $15,000 to $17,499 | 6 (1.4%) | 11 (2.8%) |
| $17,500 to $19,999 | 0 (0.0%) | 0 (0.0%) |
| $20,000 to $22,499 | 13 (3.1%) | 7 (1.8%) |
| $22,500 to $24,999 | 13 (3.1%) | 0 (0.0%) |
| $25,000 to $29,999 | 3 (0.7%) | 22 (5.6%) |
| $30,000 to $34,999 | 7 (1.7%) | 40 (10.3%) |
| $35,000 to $39,999 | 0 (0.0%) | 11 (2.8%) |
| $40,000 to $44,999 | 4 (1.0%) | 18 (4.6%) |
| $45,000 to $49,999 | 5 (1.2%) | 32 (8.2%) |
| $50,000 to $54,999 | 18 (4.3%) | 4 (1.0%) |
| $55,000 to $64,999 | 7 (1.7%) | 36 (9.2%) |
| $65,000 to $74,999 | 39 (9.3%) | 20 (5.1%) |
| $75,000 to $99,999 | 26 (6.2%) | 23 (5.9%) |
| $100,000+ | 140 (33.6%) | 108 (27.7%) |
| Total | 417 (100.0%) | 390 (100.0%) |
Earnings by Sex by Educational Attainment in University Heights
Average earnings in University Heights are $91,563 for men and $74,688 for women, a difference of 18.4%. Men with an educational attainment of graduate degree enjoy the highest average annual earnings of $104,537, while those with bachelor's degree education earn the least with $65,250. Women with an educational attainment of graduate degree earn the most with the average annual earnings of $100,924, while those with college or associate's degree education have the smallest earnings of $48,594.
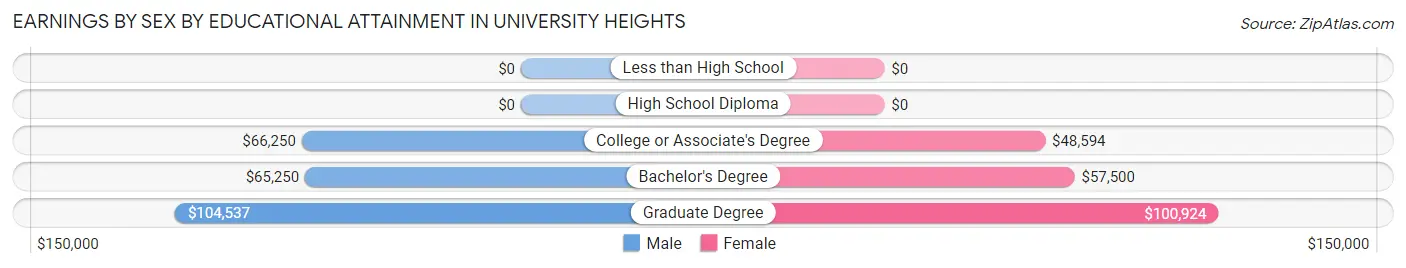
| Educational Attainment | Male Income | Female Income |
| Less than High School | - | - |
| High School Diploma | - | - |
| College or Associate's Degree | $66,250 | $48,594 |
| Bachelor's Degree | $65,250 | $57,500 |
| Graduate Degree | $104,537 | $100,924 |
| Total | $91,563 | $74,688 |
Family Income in University Heights
Family Income Brackets in University Heights
According to the University Heights family income data, there are 114 families falling into the $200,000+ income range, which is the most common income bracket and makes up 41.9% of all families.
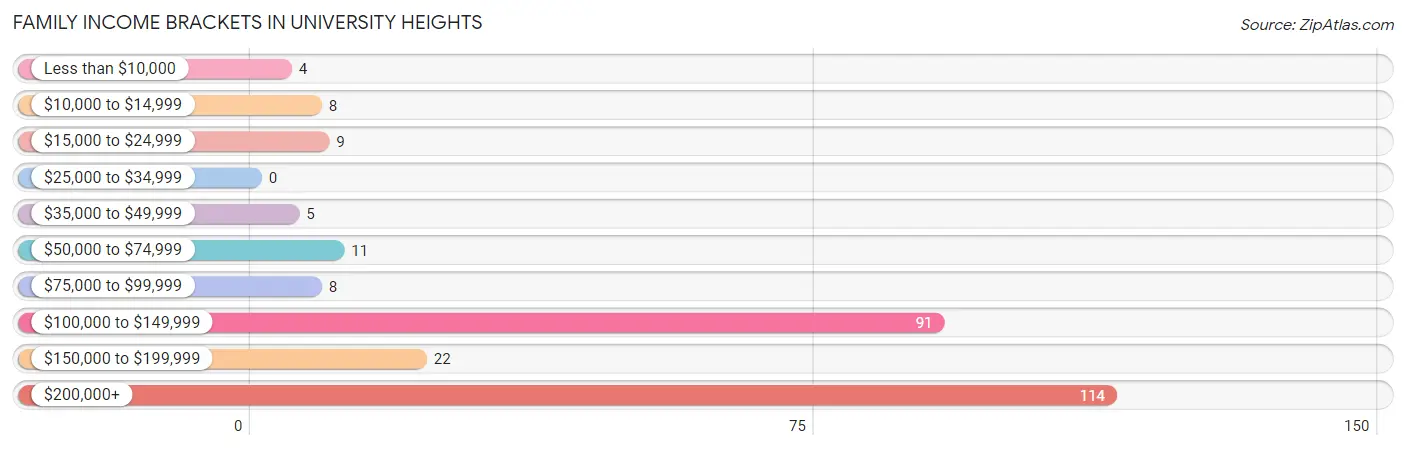
| Income Bracket | # Families | % Families |
| Less than $10,000 | 4 | 1.5% |
| $10,000 to $14,999 | 8 | 2.9% |
| $15,000 to $24,999 | 9 | 3.3% |
| $25,000 to $34,999 | 0 | 0.0% |
| $35,000 to $49,999 | 5 | 1.8% |
| $50,000 to $74,999 | 11 | 4.0% |
| $75,000 to $99,999 | 8 | 2.9% |
| $100,000 to $149,999 | 91 | 33.5% |
| $150,000 to $199,999 | 22 | 8.1% |
| $200,000+ | 114 | 41.9% |
Family Income by Famaliy Size in University Heights
5-person families (32 | 11.8%) account for the highest median family income in University Heights with $245,962 per family, while 2-person families (144 | 52.9%) have the highest median income of $74,375 per family member.
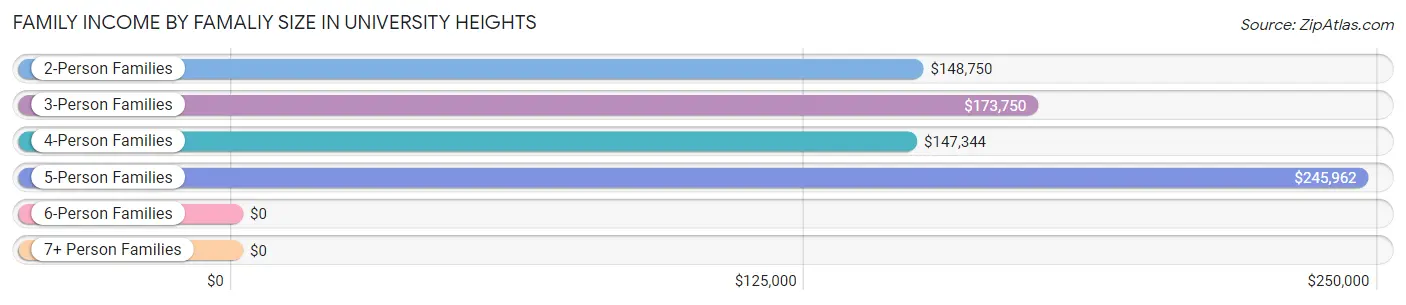
| Income Bracket | # Families | Median Income |
| 2-Person Families | 144 (52.9%) | $148,750 |
| 3-Person Families | 26 (9.6%) | $173,750 |
| 4-Person Families | 37 (13.6%) | $147,344 |
| 5-Person Families | 32 (11.8%) | $245,962 |
| 6-Person Families | 33 (12.1%) | $0 |
| 7+ Person Families | 0 (0.0%) | $0 |
| Total | 272 (100.0%) | $151,250 |
Family Income by Number of Earners in University Heights
The median family income in University Heights is $151,250, with families comprising 2 earners (162) having the highest median family income of $245,865, while families with 1 earner (87) have the lowest median family income of $104,583, accounting for 59.6% and 32.0% of families, respectively.
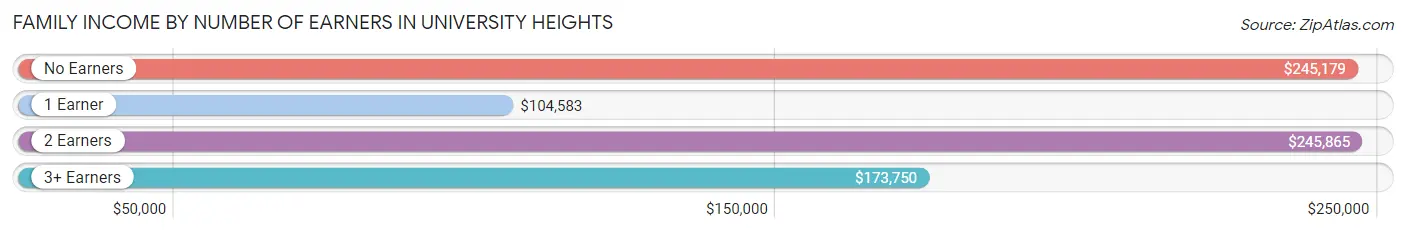
| Number of Earners | # Families | Median Income |
| No Earners | 17 (6.2%) | $245,179 |
| 1 Earner | 87 (32.0%) | $104,583 |
| 2 Earners | 162 (59.6%) | $245,865 |
| 3+ Earners | 6 (2.2%) | $173,750 |
| Total | 272 (100.0%) | $151,250 |
Household Income in University Heights
Household Income Brackets in University Heights
With 125 households falling in the category, the $100,000 to $149,999 income range is the most frequent in University Heights, accounting for 22.6% of all households. In contrast, only 14 households (2.5%) fall into the $25,000 to $34,999 income bracket, making it the least populous group.
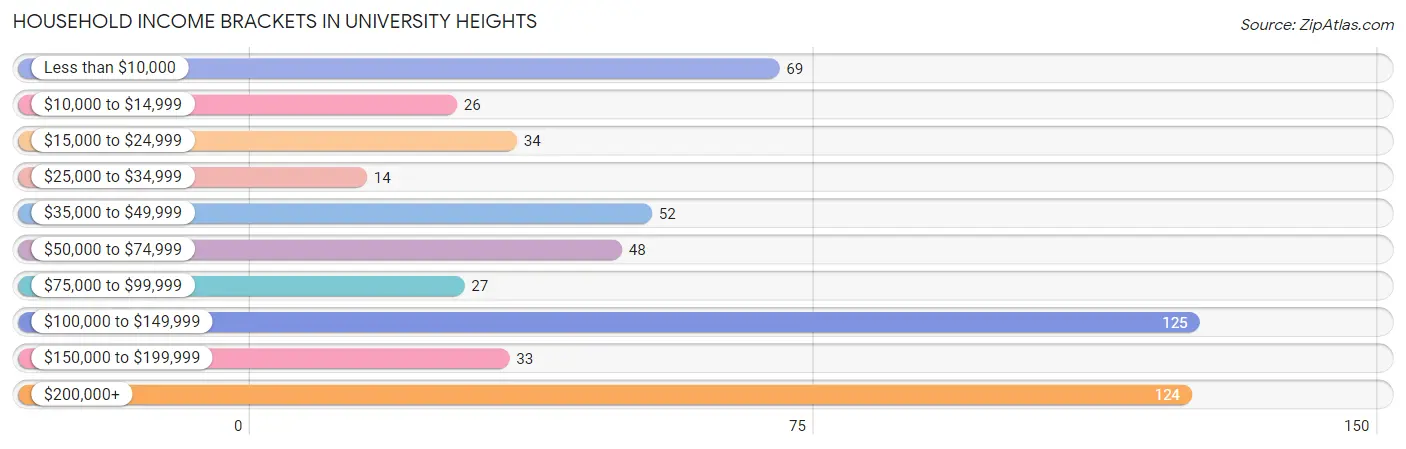
| Income Bracket | # Households | % Households |
| Less than $10,000 | 69 | 12.5% |
| $10,000 to $14,999 | 26 | 4.7% |
| $15,000 to $24,999 | 34 | 6.2% |
| $25,000 to $34,999 | 14 | 2.5% |
| $35,000 to $49,999 | 52 | 9.4% |
| $50,000 to $74,999 | 48 | 8.7% |
| $75,000 to $99,999 | 27 | 4.9% |
| $100,000 to $149,999 | 125 | 22.6% |
| $150,000 to $199,999 | 33 | 6.0% |
| $200,000+ | 124 | 22.5% |
Household Income by Householder Age in University Heights
The median household income in University Heights is $102,838, with the highest median household income of $245,536 found in the 65+ years age bracket for the primary householder. A total of 63 households (11.4%) fall into this category. Meanwhile, the 15 to 24 years age bracket for the primary householder has the lowest median household income of $31,250, with 125 households (22.6%) in this group.
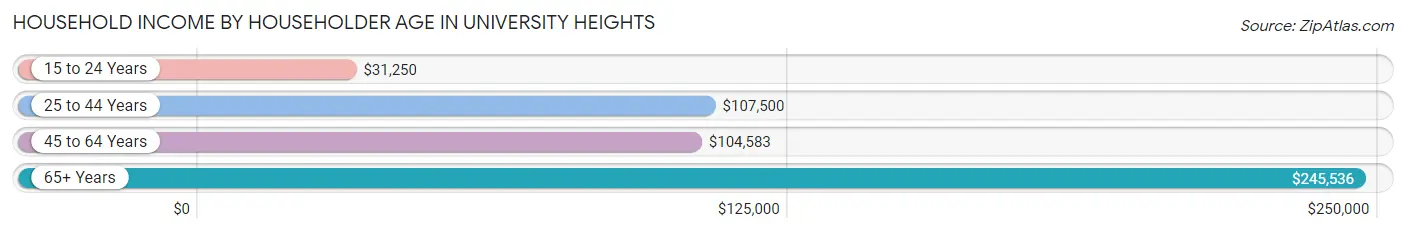
| Income Bracket | # Households | Median Income |
| 15 to 24 Years | 125 (22.6%) | $31,250 |
| 25 to 44 Years | 222 (40.2%) | $107,500 |
| 45 to 64 Years | 142 (25.7%) | $104,583 |
| 65+ Years | 63 (11.4%) | $245,536 |
| Total | 552 (100.0%) | $102,838 |
Poverty in University Heights
Income Below Poverty by Sex and Age in University Heights
With 23.4% poverty level for males and 12.2% for females among the residents of University Heights, 18 to 24 year old males and 18 to 24 year old females are the most vulnerable to poverty, with 108 males (66.3%) and 48 females (33.3%) in their respective age groups living below the poverty level.
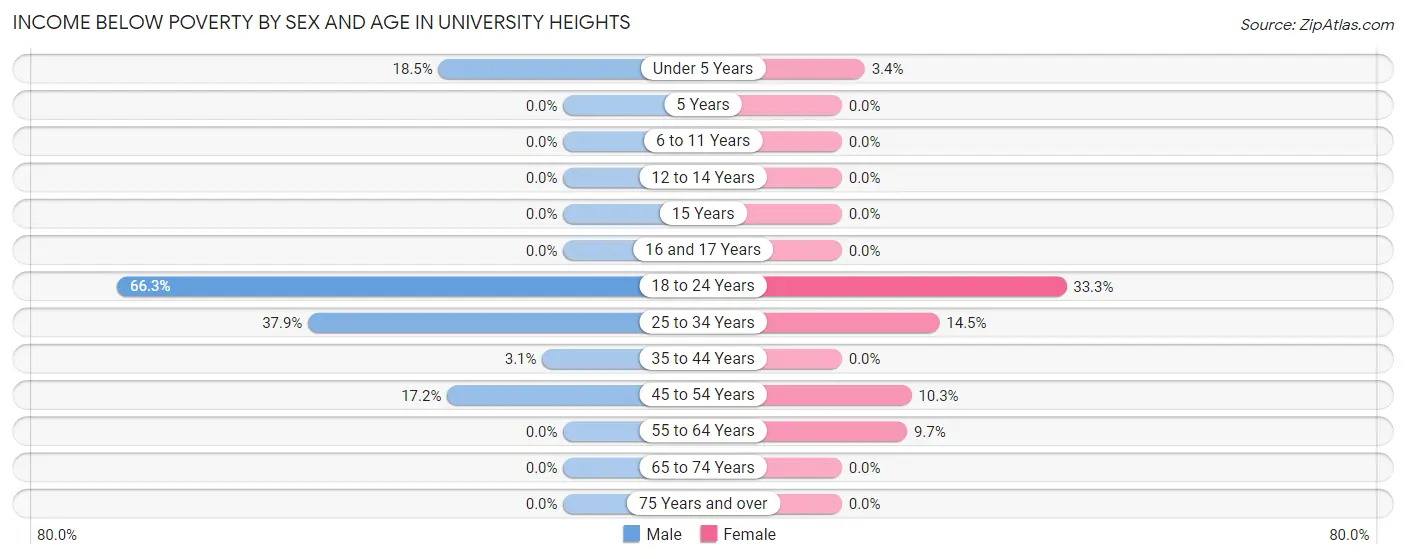
| Age Bracket | Male | Female |
| Under 5 Years | 5 (18.5%) | 3 (3.4%) |
| 5 Years | 0 (0.0%) | 0 (0.0%) |
| 6 to 11 Years | 0 (0.0%) | 0 (0.0%) |
| 12 to 14 Years | 0 (0.0%) | 0 (0.0%) |
| 15 Years | 0 (0.0%) | 0 (0.0%) |
| 16 and 17 Years | 0 (0.0%) | 0 (0.0%) |
| 18 to 24 Years | 108 (66.3%) | 48 (33.3%) |
| 25 to 34 Years | 36 (37.9%) | 20 (14.5%) |
| 35 to 44 Years | 3 (3.1%) | 0 (0.0%) |
| 45 to 54 Years | 5 (17.2%) | 3 (10.3%) |
| 55 to 64 Years | 0 (0.0%) | 9 (9.7%) |
| 65 to 74 Years | 0 (0.0%) | 0 (0.0%) |
| 75 Years and over | 0 (0.0%) | 0 (0.0%) |
| Total | 157 (23.4%) | 83 (12.2%) |
Income Above Poverty by Sex and Age in University Heights
According to the poverty statistics in University Heights, males aged 5 years and females aged 5 years are the age groups that are most secure financially, with 100.0% of males and 100.0% of females in these age groups living above the poverty line.
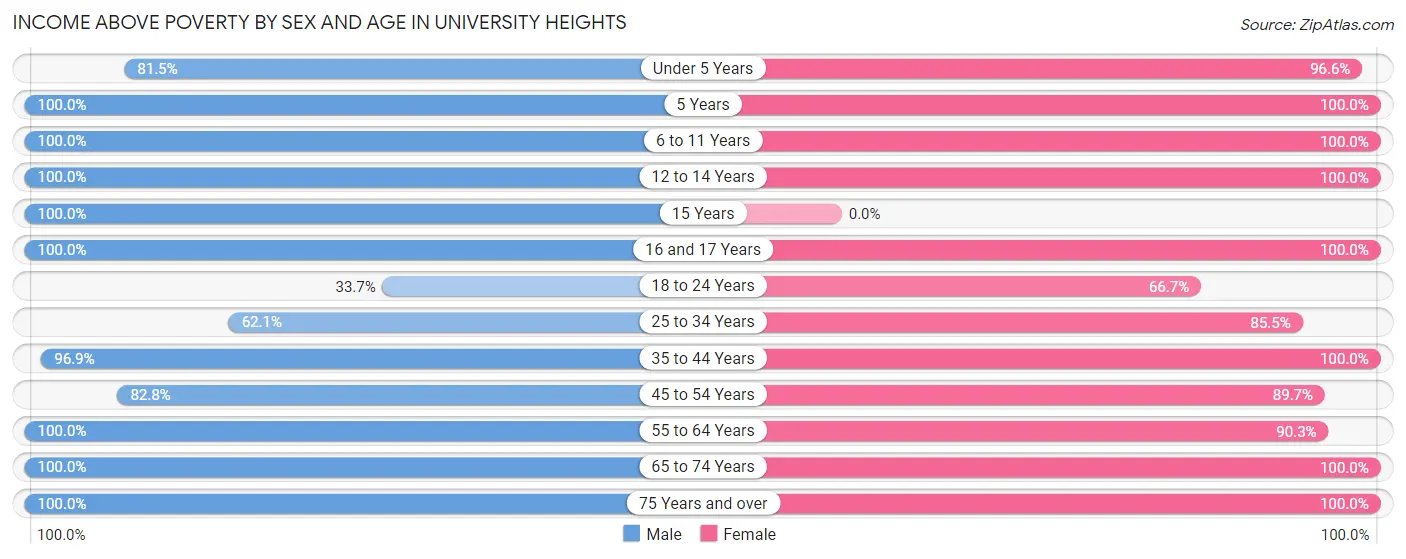
| Age Bracket | Male | Female |
| Under 5 Years | 22 (81.5%) | 85 (96.6%) |
| 5 Years | 3 (100.0%) | 5 (100.0%) |
| 6 to 11 Years | 74 (100.0%) | 50 (100.0%) |
| 12 to 14 Years | 33 (100.0%) | 8 (100.0%) |
| 15 Years | 14 (100.0%) | 0 (0.0%) |
| 16 and 17 Years | 4 (100.0%) | 4 (100.0%) |
| 18 to 24 Years | 55 (33.7%) | 96 (66.7%) |
| 25 to 34 Years | 59 (62.1%) | 118 (85.5%) |
| 35 to 44 Years | 93 (96.9%) | 65 (100.0%) |
| 45 to 54 Years | 24 (82.8%) | 26 (89.7%) |
| 55 to 64 Years | 74 (100.0%) | 84 (90.3%) |
| 65 to 74 Years | 40 (100.0%) | 31 (100.0%) |
| 75 Years and over | 19 (100.0%) | 27 (100.0%) |
| Total | 514 (76.6%) | 599 (87.8%) |
Income Below Poverty Among Married-Couple Families in University Heights
The poverty statistics for married-couple families in University Heights show that 1.7% or 4 of the total 237 families live below the poverty line. Families with 1 or 2 children have the highest poverty rate of 7.5%, comprising of 4 families. On the other hand, families with no children have the lowest poverty rate of 0.0%, which includes 0 families.
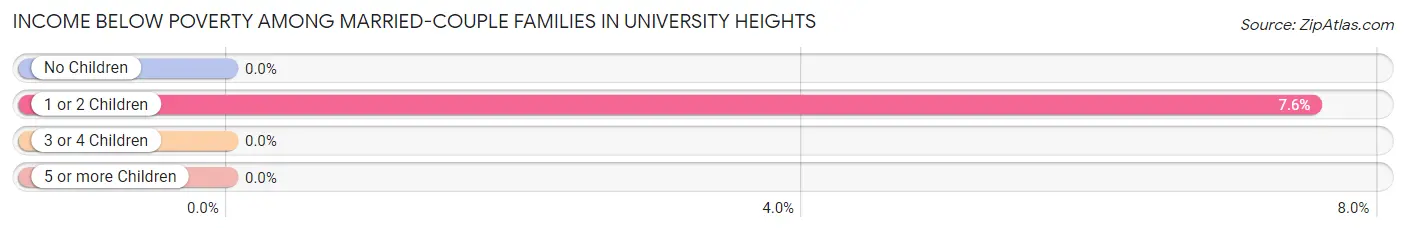
| Children | Above Poverty | Below Poverty |
| No Children | 120 (100.0%) | 0 (0.0%) |
| 1 or 2 Children | 49 (92.4%) | 4 (7.5%) |
| 3 or 4 Children | 64 (100.0%) | 0 (0.0%) |
| 5 or more Children | 0 (0.0%) | 0 (0.0%) |
| Total | 233 (98.3%) | 4 (1.7%) |
Income Below Poverty Among Single-Parent Households in University Heights
According to the poverty data in University Heights, 100.0% or 10 single-father households and 20.0% or 5 single-mother households are living below the poverty line. Among single-father households, those with no children have the highest poverty rate, with 10 households (100.0%) experiencing poverty. Likewise, among single-mother households, those with no children have the highest poverty rate, with 4 households (26.7%) falling below the poverty line.
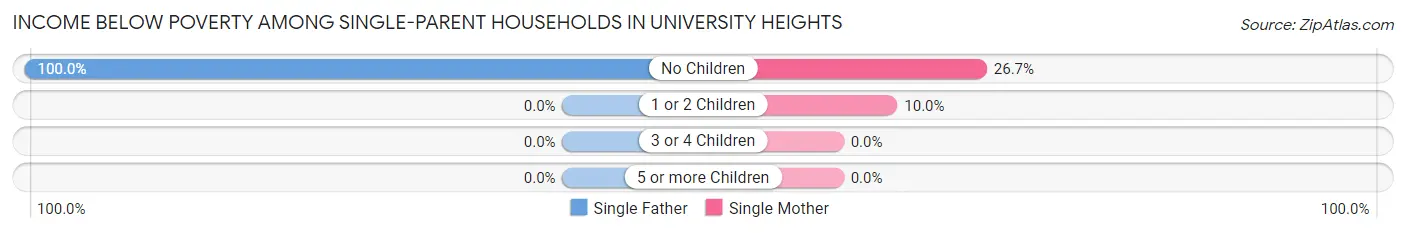
| Children | Single Father | Single Mother |
| No Children | 10 (100.0%) | 4 (26.7%) |
| 1 or 2 Children | 0 (0.0%) | 1 (10.0%) |
| 3 or 4 Children | 0 (0.0%) | 0 (0.0%) |
| 5 or more Children | 0 (0.0%) | 0 (0.0%) |
| Total | 10 (100.0%) | 5 (20.0%) |
Income Below Poverty Among Married-Couple vs Single-Parent Households in University Heights
The poverty data for University Heights shows that 4 of the married-couple family households (1.7%) and 15 of the single-parent households (42.9%) are living below the poverty level. Within the married-couple family households, those with 1 or 2 children have the highest poverty rate, with 4 households (7.5%) falling below the poverty line. Among the single-parent households, those with no children have the highest poverty rate, with 14 household (56.0%) living below poverty.
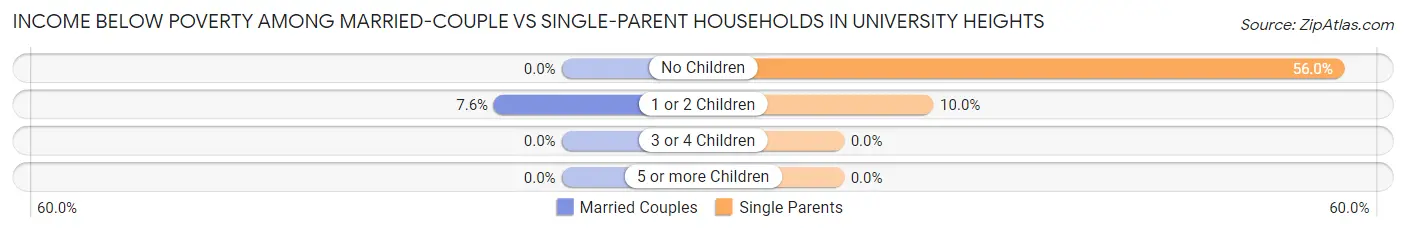
| Children | Married-Couple Families | Single-Parent Households |
| No Children | 0 (0.0%) | 14 (56.0%) |
| 1 or 2 Children | 4 (7.5%) | 1 (10.0%) |
| 3 or 4 Children | 0 (0.0%) | 0 (0.0%) |
| 5 or more Children | 0 (0.0%) | 0 (0.0%) |
| Total | 4 (1.7%) | 15 (42.9%) |
Race in University Heights
The most populous races in University Heights are White / Caucasian (1,202 | 88.8%), Asian (80 | 5.9%), and Hispanic or Latino (38 | 2.8%).
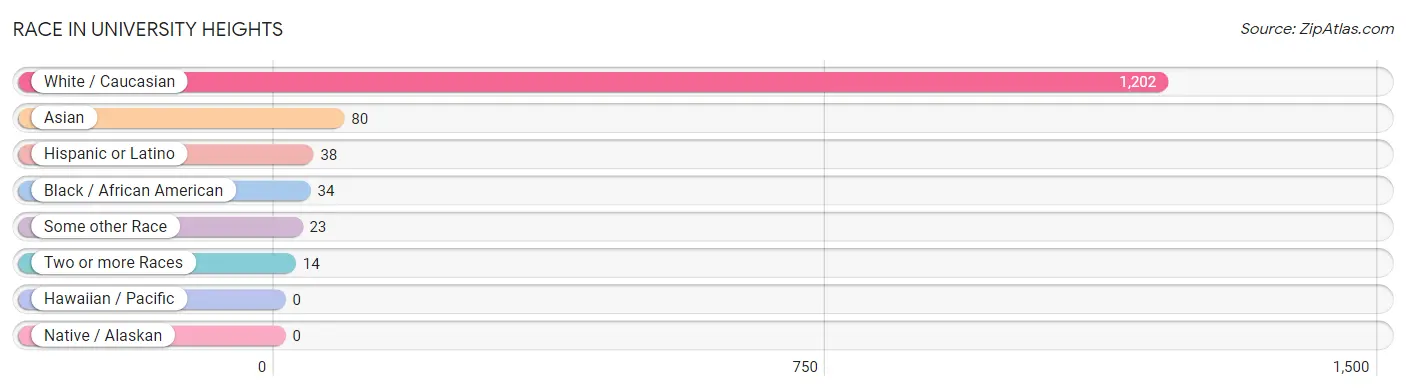
| Race | # Population | % Population |
| Asian | 80 | 5.9% |
| Black / African American | 34 | 2.5% |
| Hawaiian / Pacific | 0 | 0.0% |
| Hispanic or Latino | 38 | 2.8% |
| Native / Alaskan | 0 | 0.0% |
| White / Caucasian | 1,202 | 88.8% |
| Two or more Races | 14 | 1.0% |
| Some other Race | 23 | 1.7% |
| Total | 1,353 | 100.0% |
Ancestry in University Heights
The most populous ancestries reported in University Heights are German (349 | 25.8%), Irish (303 | 22.4%), English (123 | 9.1%), Dutch (118 | 8.7%), and Indian (Asian) (54 | 4.0%), together accounting for 70.0% of all University Heights residents.
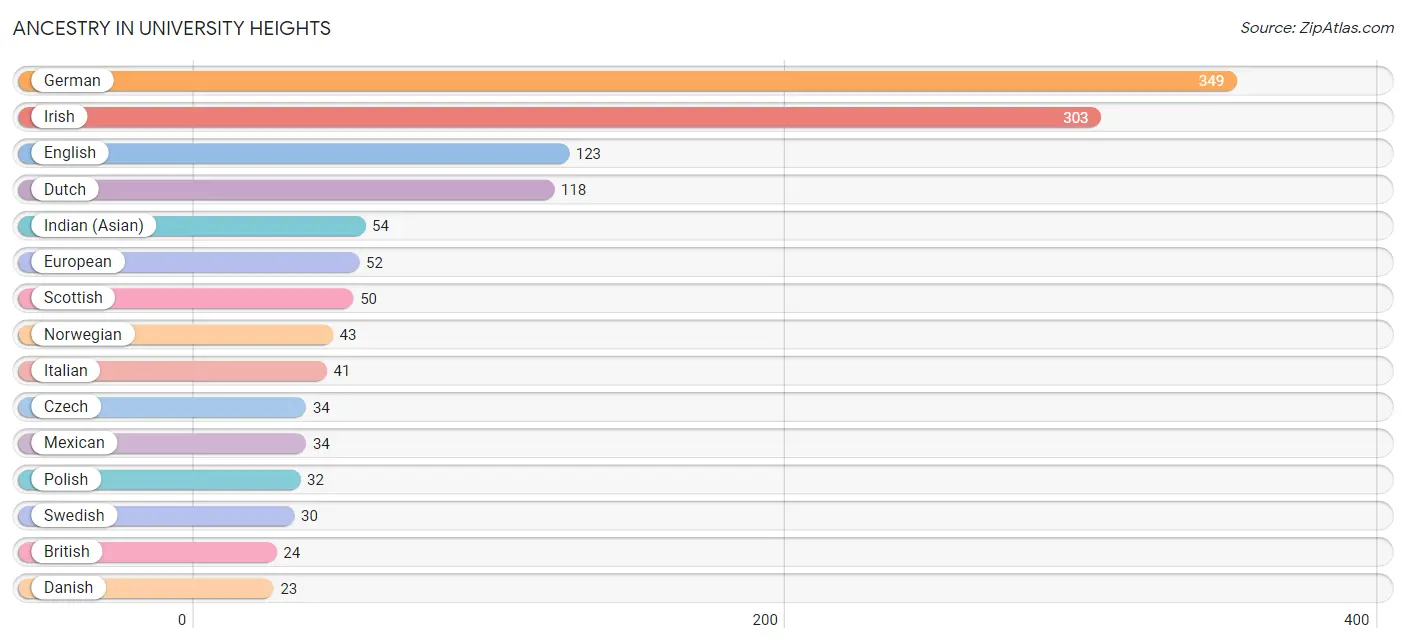
| Ancestry | # Population | % Population |
| American | 16 | 1.2% |
| Arab | 2 | 0.2% |
| Austrian | 4 | 0.3% |
| Belgian | 2 | 0.2% |
| British | 24 | 1.8% |
| Burmese | 3 | 0.2% |
| Cherokee | 5 | 0.4% |
| Czech | 34 | 2.5% |
| Danish | 23 | 1.7% |
| Dutch | 118 | 8.7% |
| Eastern European | 13 | 1.0% |
| Ecuadorian | 2 | 0.2% |
| Egyptian | 2 | 0.2% |
| English | 123 | 9.1% |
| European | 52 | 3.8% |
| Filipino | 3 | 0.2% |
| Finnish | 2 | 0.2% |
| French | 14 | 1.0% |
| German | 349 | 25.8% |
| Greek | 5 | 0.4% |
| Hungarian | 4 | 0.3% |
| Indian (Asian) | 54 | 4.0% |
| Irish | 303 | 22.4% |
| Italian | 41 | 3.0% |
| Laotian | 4 | 0.3% |
| Lithuanian | 5 | 0.4% |
| Luxembourger | 11 | 0.8% |
| Maltese | 4 | 0.3% |
| Mexican | 34 | 2.5% |
| Mexican American Indian | 2 | 0.2% |
| Northern European | 1 | 0.1% |
| Norwegian | 43 | 3.2% |
| Polish | 32 | 2.4% |
| Puerto Rican | 2 | 0.2% |
| Romanian | 6 | 0.4% |
| Russian | 3 | 0.2% |
| Scandinavian | 11 | 0.8% |
| Scotch-Irish | 13 | 1.0% |
| Scottish | 50 | 3.7% |
| Serbian | 4 | 0.3% |
| South American | 2 | 0.2% |
| Swedish | 30 | 2.2% |
| Swiss | 19 | 1.4% |
| Thai | 20 | 1.5% |
| Turkish | 3 | 0.2% |
| Ukrainian | 8 | 0.6% |
| Welsh | 7 | 0.5% | View All 47 Rows |
Immigrants in University Heights
The most numerous immigrant groups reported in University Heights came from Asia (63 | 4.7%), China (48 | 3.5%), Eastern Asia (48 | 3.5%), Europe (29 | 2.1%), and Western Europe (21 | 1.5%), together accounting for 15.5% of all University Heights residents.
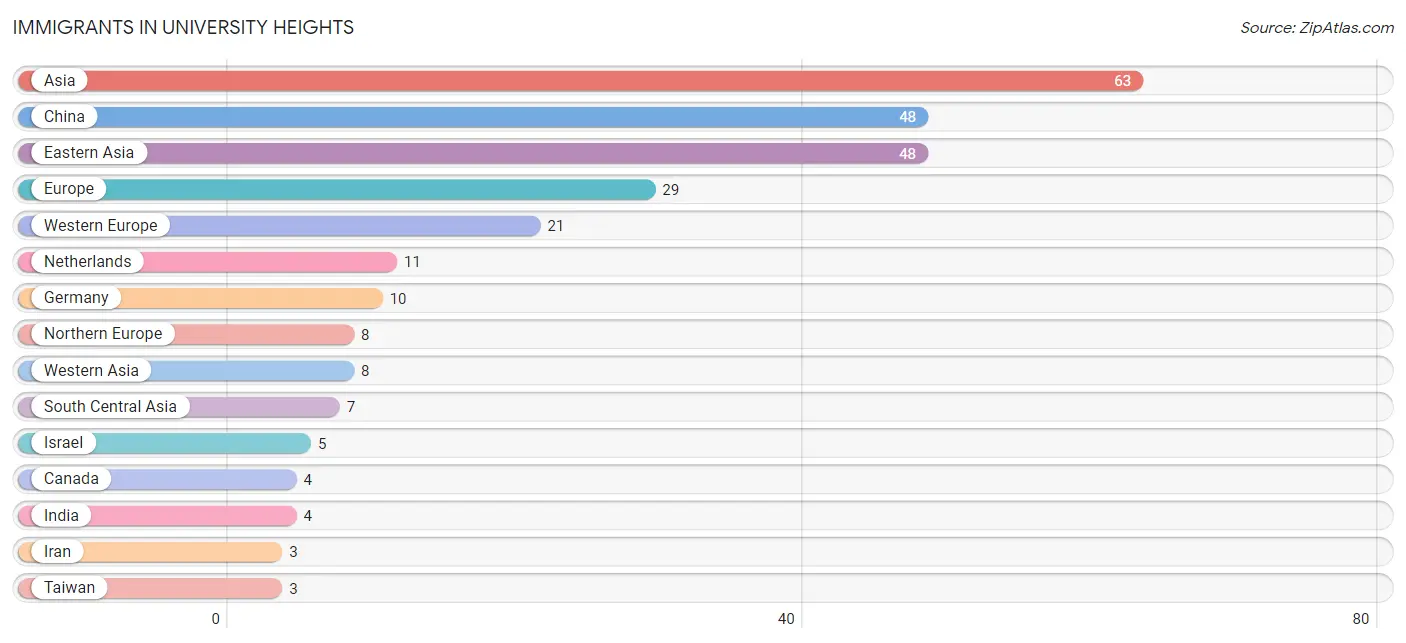
| Immigration Origin | # Population | % Population |
| Asia | 63 | 4.7% |
| Canada | 4 | 0.3% |
| China | 48 | 3.5% |
| Eastern Asia | 48 | 3.5% |
| Ecuador | 2 | 0.2% |
| England | 1 | 0.1% |
| Europe | 29 | 2.1% |
| Germany | 10 | 0.7% |
| India | 4 | 0.3% |
| Iran | 3 | 0.2% |
| Israel | 5 | 0.4% |
| Latin America | 2 | 0.2% |
| Netherlands | 11 | 0.8% |
| Northern Europe | 8 | 0.6% |
| South America | 2 | 0.2% |
| South Central Asia | 7 | 0.5% |
| Taiwan | 3 | 0.2% |
| Turkey | 3 | 0.2% |
| Western Asia | 8 | 0.6% |
| Western Europe | 21 | 1.5% | View All 20 Rows |
Sex and Age in University Heights
Sex and Age in University Heights
The most populous age groups in University Heights are 20 to 24 Years (128 | 19.1%) for men and 20 to 24 Years (128 | 18.8%) for women.
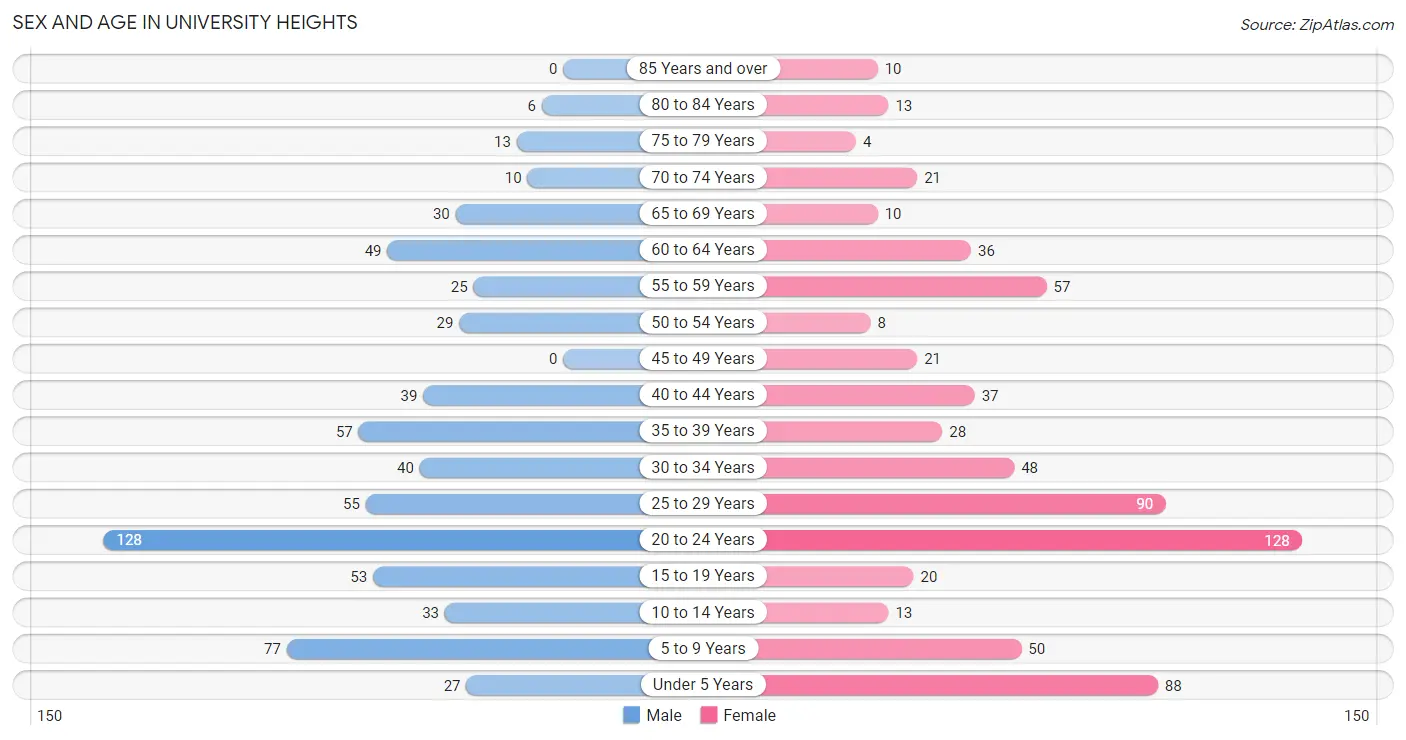
| Age Bracket | Male | Female |
| Under 5 Years | 27 (4.0%) | 88 (12.9%) |
| 5 to 9 Years | 77 (11.5%) | 50 (7.3%) |
| 10 to 14 Years | 33 (4.9%) | 13 (1.9%) |
| 15 to 19 Years | 53 (7.9%) | 20 (2.9%) |
| 20 to 24 Years | 128 (19.1%) | 128 (18.8%) |
| 25 to 29 Years | 55 (8.2%) | 90 (13.2%) |
| 30 to 34 Years | 40 (6.0%) | 48 (7.0%) |
| 35 to 39 Years | 57 (8.5%) | 28 (4.1%) |
| 40 to 44 Years | 39 (5.8%) | 37 (5.4%) |
| 45 to 49 Years | 0 (0.0%) | 21 (3.1%) |
| 50 to 54 Years | 29 (4.3%) | 8 (1.2%) |
| 55 to 59 Years | 25 (3.7%) | 57 (8.4%) |
| 60 to 64 Years | 49 (7.3%) | 36 (5.3%) |
| 65 to 69 Years | 30 (4.5%) | 10 (1.5%) |
| 70 to 74 Years | 10 (1.5%) | 21 (3.1%) |
| 75 to 79 Years | 13 (1.9%) | 4 (0.6%) |
| 80 to 84 Years | 6 (0.9%) | 13 (1.9%) |
| 85 Years and over | 0 (0.0%) | 10 (1.5%) |
| Total | 671 (100.0%) | 682 (100.0%) |
Families and Households in University Heights
Median Family Size in University Heights
The median family size in University Heights is 3.18 persons per family, with married-couple families (237 | 87.1%) accounting for the largest median family size of 3.26 persons per family. On the other hand, single male/father families (10 | 3.7%) represent the smallest median family size with 1.90 persons per family.
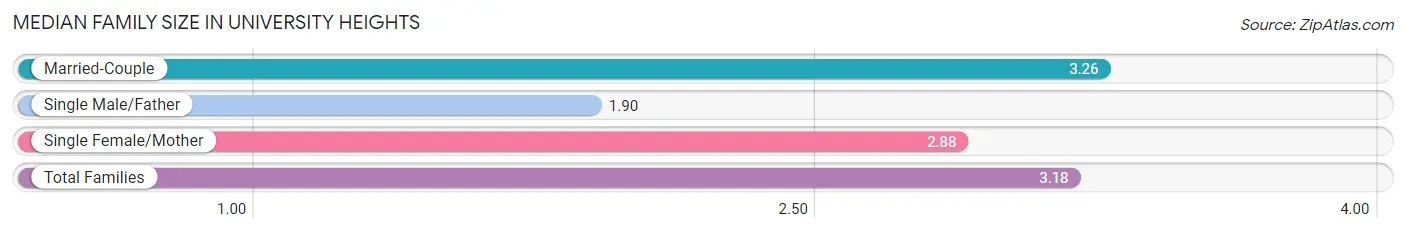
| Family Type | # Families | Family Size |
| Married-Couple | 237 (87.1%) | 3.26 |
| Single Male/Father | 10 (3.7%) | 1.90 |
| Single Female/Mother | 25 (9.2%) | 2.88 |
| Total Families | 272 (100.0%) | 3.18 |
Median Household Size in University Heights
The median household size in University Heights is 2.45 persons per household, with married-couple households (237 | 42.9%) accounting for the largest median household size of 3.27 persons per household. non-family households (280 | 50.7%) represent the smallest median household size with 1.71 persons per household.
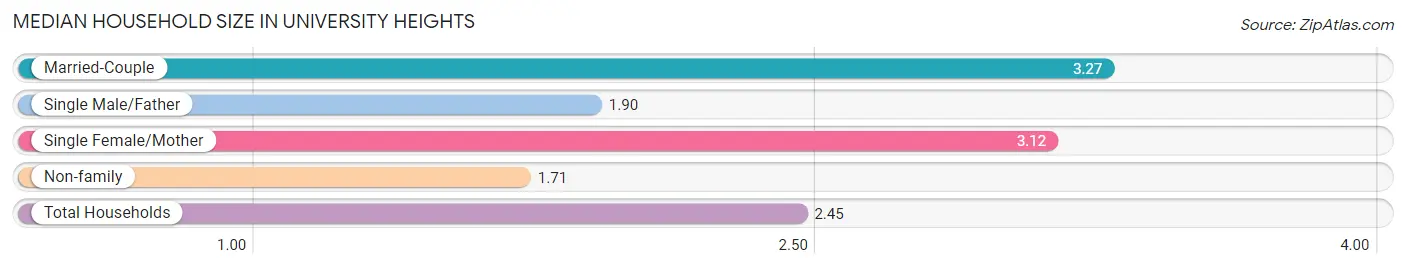
| Household Type | # Households | Household Size |
| Married-Couple | 237 (42.9%) | 3.27 |
| Single Male/Father | 10 (1.8%) | 1.90 |
| Single Female/Mother | 25 (4.5%) | 3.12 |
| Non-family | 280 (50.7%) | 1.71 |
| Total Households | 552 (100.0%) | 2.45 |
Household Size by Marriage Status in University Heights
Out of a total of 552 households in University Heights, 272 (49.3%) are family households, while 280 (50.7%) are nonfamily households. The most numerous type of family households are 2-person households, comprising 139, and the most common type of nonfamily households are 1-person households, comprising 163.
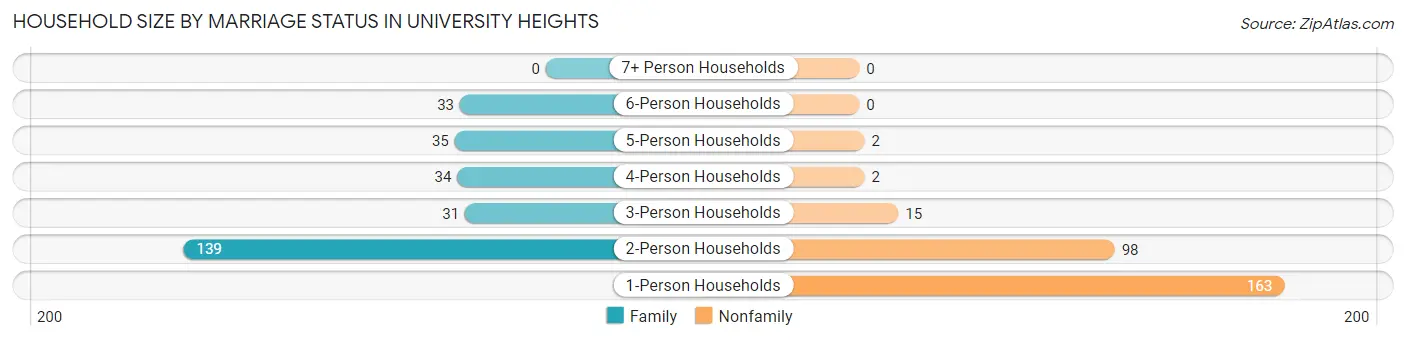
| Household Size | Family Households | Nonfamily Households |
| 1-Person Households | - | 163 (29.5%) |
| 2-Person Households | 139 (25.2%) | 98 (17.7%) |
| 3-Person Households | 31 (5.6%) | 15 (2.7%) |
| 4-Person Households | 34 (6.2%) | 2 (0.4%) |
| 5-Person Households | 35 (6.3%) | 2 (0.4%) |
| 6-Person Households | 33 (6.0%) | 0 (0.0%) |
| 7+ Person Households | 0 (0.0%) | 0 (0.0%) |
| Total | 272 (49.3%) | 280 (50.7%) |
Female Fertility in University Heights
Fertility by Age in University Heights
Average fertility rate in University Heights is 21.0 births per 1,000 women. Women in the age bracket of 35 to 50 years have the highest fertility rate with 33.0 births per 1,000 women. Women in the age bracket of 20 to 34 years acount for 62.5% of all women with births.
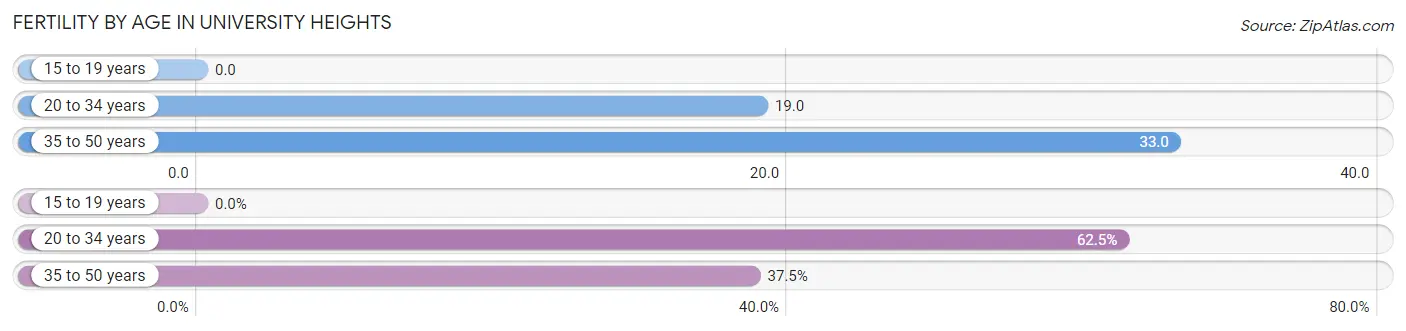
| Age Bracket | Women with Births | Births / 1,000 Women |
| 15 to 19 years | 0 (0.0%) | 0.0 |
| 20 to 34 years | 5 (62.5%) | 19.0 |
| 35 to 50 years | 3 (37.5%) | 33.0 |
| Total | 8 (100.0%) | 21.0 |
Fertility by Age by Marriage Status in University Heights
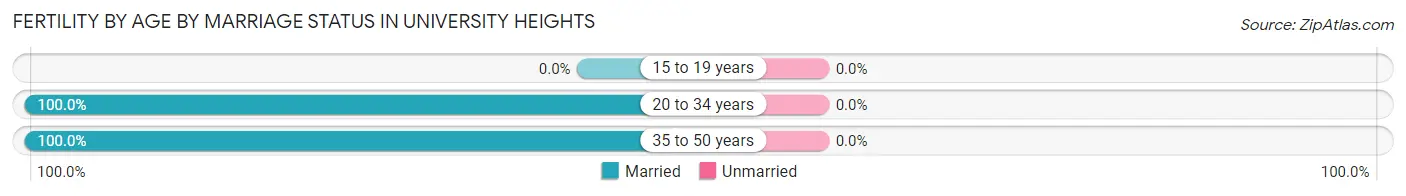
| Age Bracket | Married | Unmarried |
| 15 to 19 years | 0 (0.0%) | 0 (0.0%) |
| 20 to 34 years | 5 (100.0%) | 0 (0.0%) |
| 35 to 50 years | 3 (100.0%) | 0 (0.0%) |
| Total | 8 (100.0%) | 0 (0.0%) |
Fertility by Education in University Heights
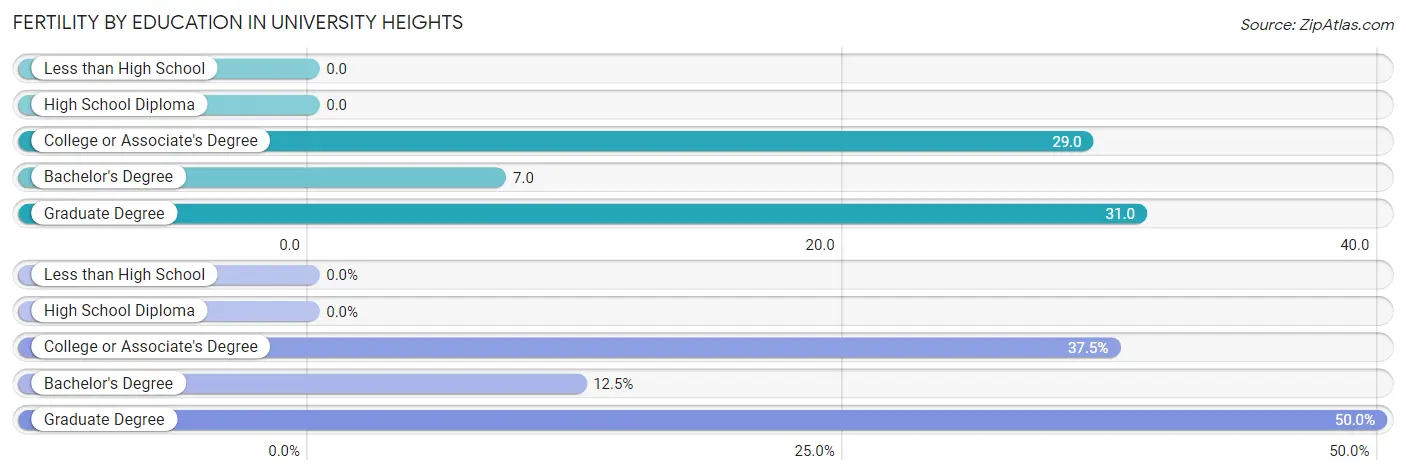
| Educational Attainment | Women with Births | Births / 1,000 Women |
| Less than High School | 0 (0.0%) | 0.0 |
| High School Diploma | 0 (0.0%) | 0.0 |
| College or Associate's Degree | 3 (37.5%) | 29.0 |
| Bachelor's Degree | 1 (12.5%) | 7.0 |
| Graduate Degree | 4 (50.0%) | 31.0 |
| Total | 8 (100.0%) | 21.0 |
Fertility by Education by Marriage Status in University Heights
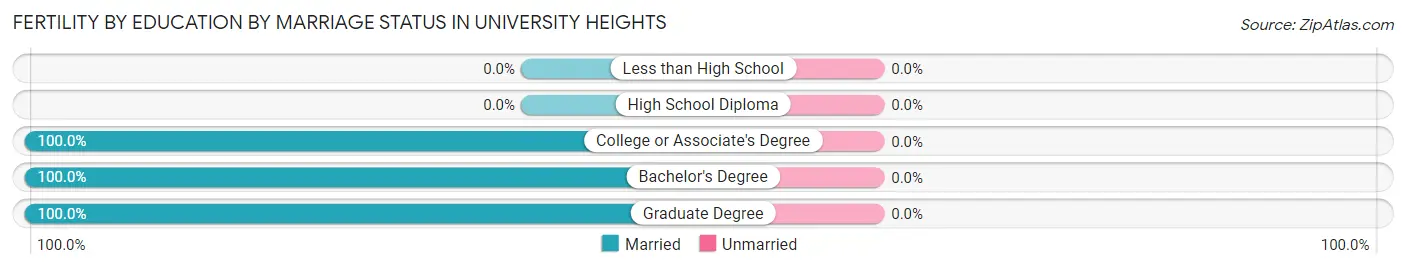
| Educational Attainment | Married | Unmarried |
| Less than High School | 0 (0.0%) | 0 (0.0%) |
| High School Diploma | 0 (0.0%) | 0 (0.0%) |
| College or Associate's Degree | 3 (100.0%) | 0 (0.0%) |
| Bachelor's Degree | 1 (100.0%) | 0 (0.0%) |
| Graduate Degree | 4 (100.0%) | 0 (0.0%) |
| Total | 8 (100.0%) | 0 (0.0%) |
Employment Characteristics in University Heights
Employment by Class of Employer in University Heights
Among the 717 employed individuals in University Heights, state government employees (313 | 43.6%), private company employees (199 | 27.8%), and not-for-profit organizations (98 | 13.7%) make up the most common classes of employment.
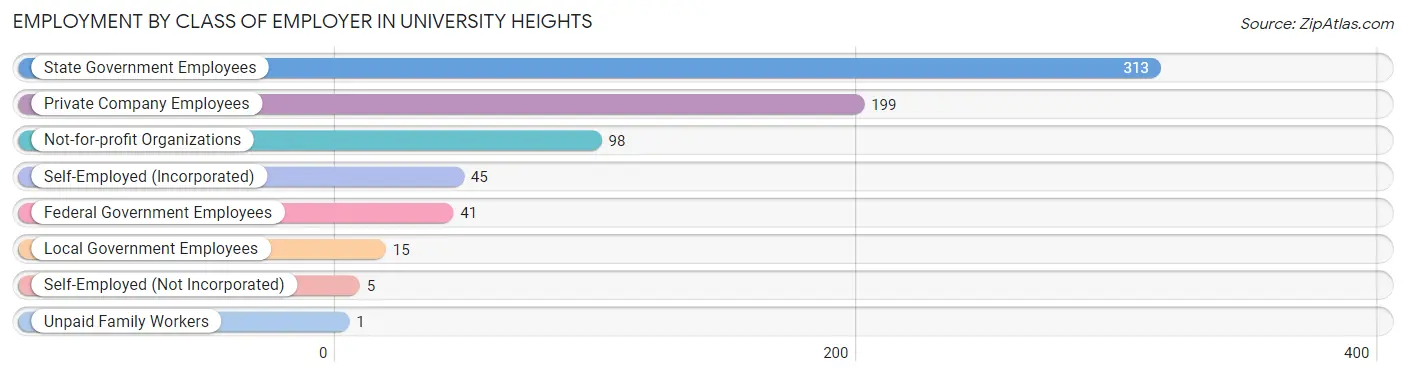
| Employer Class | # Employees | % Employees |
| Private Company Employees | 199 | 27.8% |
| Self-Employed (Incorporated) | 45 | 6.3% |
| Self-Employed (Not Incorporated) | 5 | 0.7% |
| Not-for-profit Organizations | 98 | 13.7% |
| Local Government Employees | 15 | 2.1% |
| State Government Employees | 313 | 43.6% |
| Federal Government Employees | 41 | 5.7% |
| Unpaid Family Workers | 1 | 0.1% |
| Total | 717 | 100.0% |
Employment Status by Age in University Heights
According to the labor force statistics for University Heights, out of the total population over 16 years of age (1,051), 71.2% or 748 individuals are in the labor force, with 1.6% or 12 of them unemployed. The age group with the highest labor force participation rate is 35 to 44 years, with 96.3% or 155 individuals in the labor force. Within the labor force, the 35 to 44 years age range has the highest percentage of unemployed individuals, with 4.5% or 7 of them being unemployed.
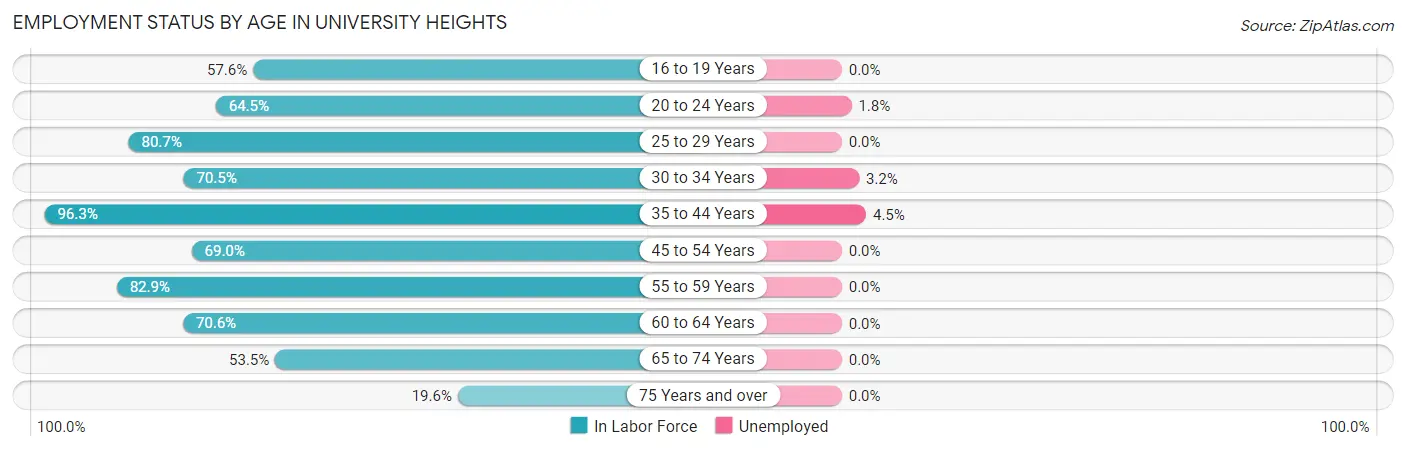
| Age Bracket | In Labor Force | Unemployed |
| 16 to 19 Years | 34 (57.6%) | 0 (0.0%) |
| 20 to 24 Years | 165 (64.5%) | 3 (1.8%) |
| 25 to 29 Years | 117 (80.7%) | 0 (0.0%) |
| 30 to 34 Years | 62 (70.5%) | 2 (3.2%) |
| 35 to 44 Years | 155 (96.3%) | 7 (4.5%) |
| 45 to 54 Years | 40 (69.0%) | 0 (0.0%) |
| 55 to 59 Years | 68 (82.9%) | 0 (0.0%) |
| 60 to 64 Years | 60 (70.6%) | 0 (0.0%) |
| 65 to 74 Years | 38 (53.5%) | 0 (0.0%) |
| 75 Years and over | 9 (19.6%) | 0 (0.0%) |
| Total | 748 (71.2%) | 12 (1.6%) |
Employment Status by Educational Attainment in University Heights
According to labor force statistics for University Heights, 81.1% of individuals (502) out of the total population between 25 and 64 years of age (619) are in the labor force, with 1.8% or 9 of them being unemployed. The group with the highest labor force participation rate are those with the educational attainment of college / associate degree, with 87.5% or 56 individuals in the labor force. Within the labor force, individuals with bachelor's degree or higher education have the highest percentage of unemployment, with 2.0% or 9 of them being unemployed.
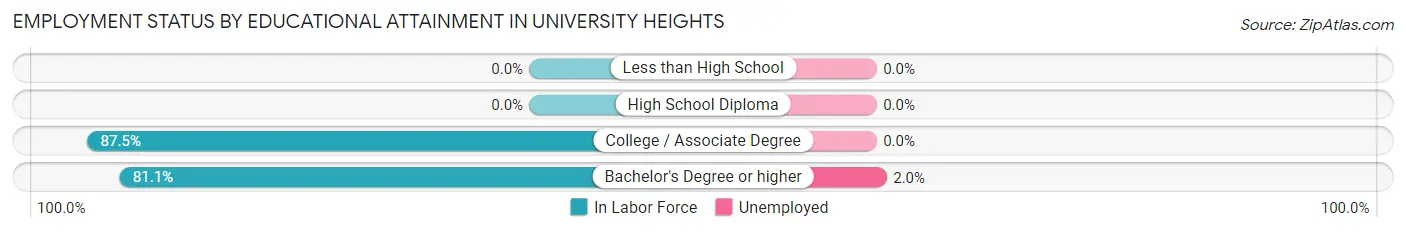
| Educational Attainment | In Labor Force | Unemployed |
| Less than High School | 0 (0.0%) | 0 (0.0%) |
| High School Diploma | 0 (0.0%) | 0 (0.0%) |
| College / Associate Degree | 56 (87.5%) | 0 (0.0%) |
| Bachelor's Degree or higher | 446 (81.1%) | 11 (2.0%) |
| Total | 502 (81.1%) | 11 (1.8%) |
Employment Occupations by Sex in University Heights
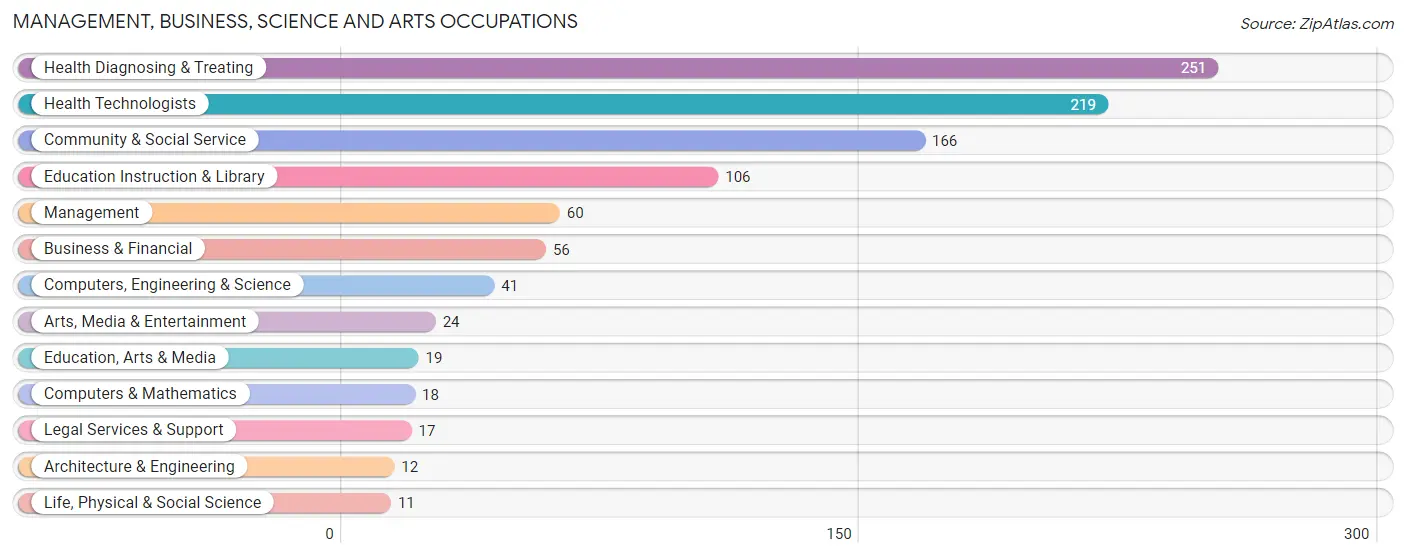
Management, Business, Science and Arts Occupations
The most common Management, Business, Science and Arts occupations in University Heights are Health Diagnosing & Treating (251 | 34.1%), Health Technologists (219 | 29.8%), Community & Social Service (166 | 22.6%), Education Instruction & Library (106 | 14.4%), and Management (60 | 8.2%).
Management, Business, Science and Arts Occupations by Sex
Within the Management, Business, Science and Arts occupations in University Heights, the most male-oriented occupations are Legal Services & Support (94.1%), Business & Financial (78.6%), and Computers & Mathematics (77.8%), while the most female-oriented occupations are Architecture & Engineering (75.0%), Life, Physical & Social Science (72.7%), and Health Technologists (63.5%).
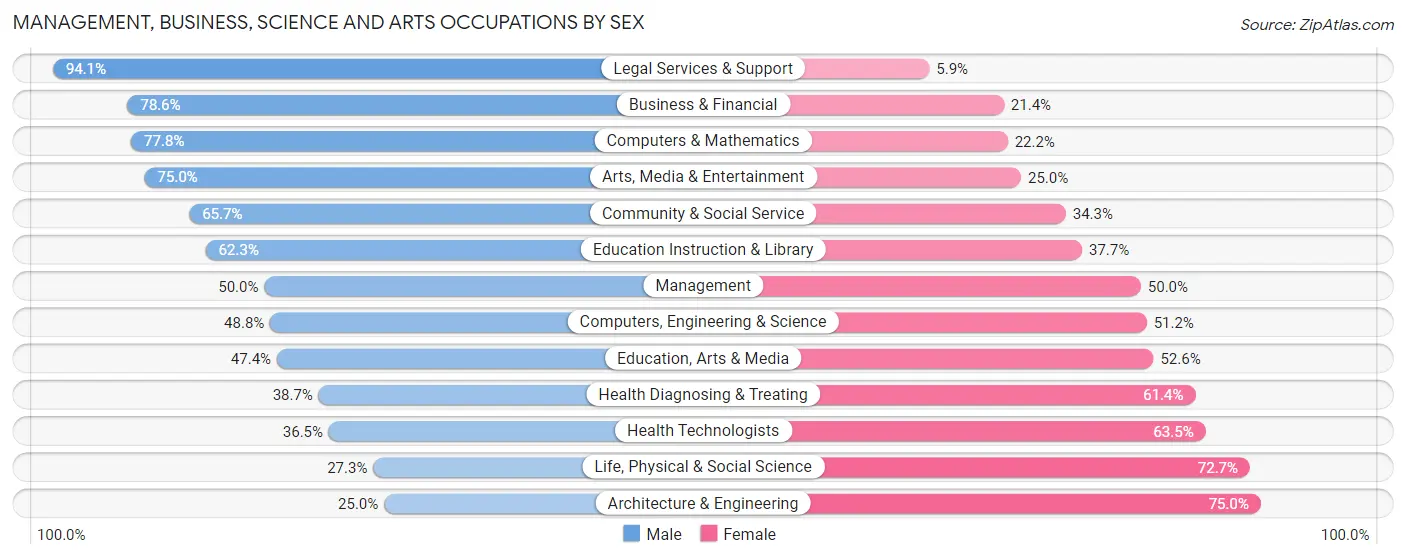
| Occupation | Male | Female |
| Management | 30 (50.0%) | 30 (50.0%) |
| Business & Financial | 44 (78.6%) | 12 (21.4%) |
| Computers, Engineering & Science | 20 (48.8%) | 21 (51.2%) |
| Computers & Mathematics | 14 (77.8%) | 4 (22.2%) |
| Architecture & Engineering | 3 (25.0%) | 9 (75.0%) |
| Life, Physical & Social Science | 3 (27.3%) | 8 (72.7%) |
| Community & Social Service | 109 (65.7%) | 57 (34.3%) |
| Education, Arts & Media | 9 (47.4%) | 10 (52.6%) |
| Legal Services & Support | 16 (94.1%) | 1 (5.9%) |
| Education Instruction & Library | 66 (62.3%) | 40 (37.7%) |
| Arts, Media & Entertainment | 18 (75.0%) | 6 (25.0%) |
| Health Diagnosing & Treating | 97 (38.7%) | 154 (61.4%) |
| Health Technologists | 80 (36.5%) | 139 (63.5%) |
| Total (Category) | 300 (52.3%) | 274 (47.7%) |
| Total (Overall) | 376 (51.1%) | 360 (48.9%) |
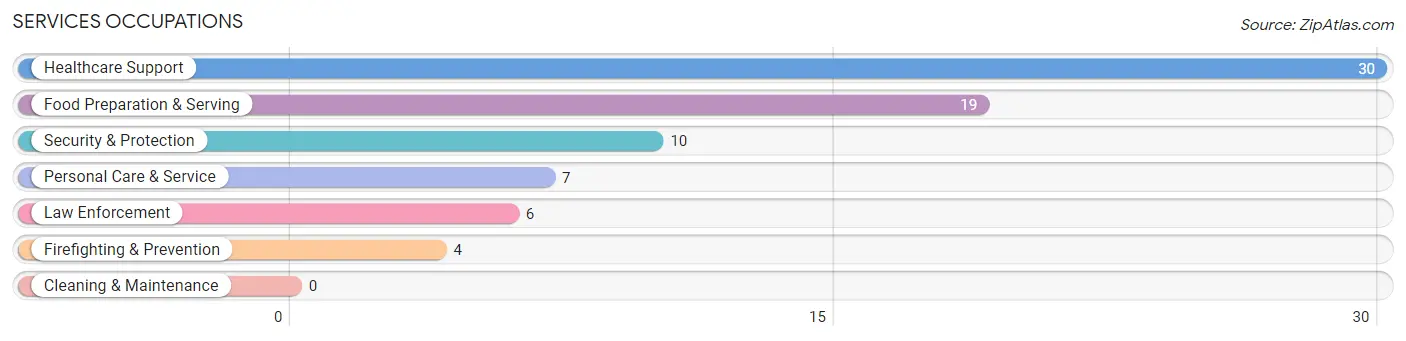
Services Occupations
The most common Services occupations in University Heights are Healthcare Support (30 | 4.1%), Food Preparation & Serving (19 | 2.6%), Security & Protection (10 | 1.4%), Personal Care & Service (7 | 0.9%), and Law Enforcement (6 | 0.8%).
Services Occupations by Sex
Within the Services occupations in University Heights, the most male-oriented occupations are Law Enforcement (100.0%), Personal Care & Service (71.4%), and Security & Protection (60.0%), while the most female-oriented occupations are Healthcare Support (100.0%), Firefighting & Prevention (100.0%), and Food Preparation & Serving (42.1%).
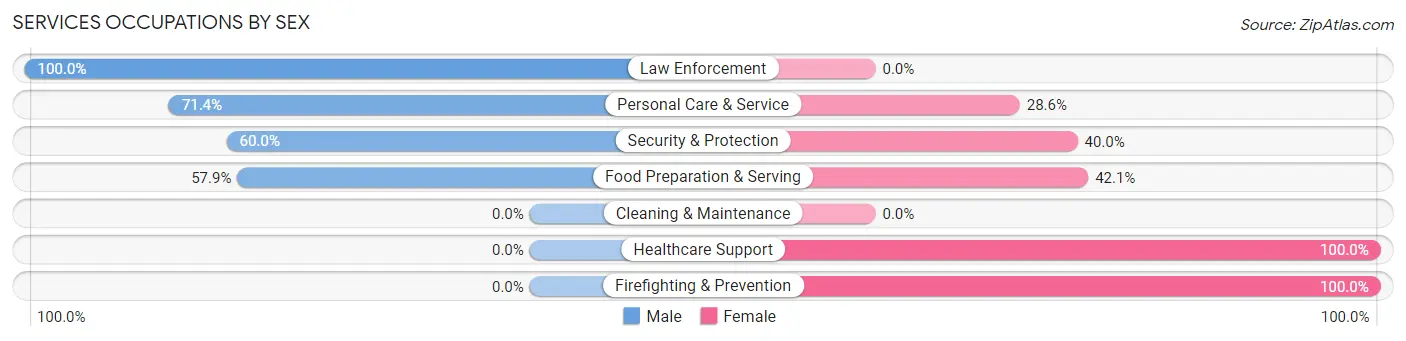
| Occupation | Male | Female |
| Healthcare Support | 0 (0.0%) | 30 (100.0%) |
| Security & Protection | 6 (60.0%) | 4 (40.0%) |
| Firefighting & Prevention | 0 (0.0%) | 4 (100.0%) |
| Law Enforcement | 6 (100.0%) | 0 (0.0%) |
| Food Preparation & Serving | 11 (57.9%) | 8 (42.1%) |
| Cleaning & Maintenance | 0 (0.0%) | 0 (0.0%) |
| Personal Care & Service | 5 (71.4%) | 2 (28.6%) |
| Total (Category) | 22 (33.3%) | 44 (66.7%) |
| Total (Overall) | 376 (51.1%) | 360 (48.9%) |
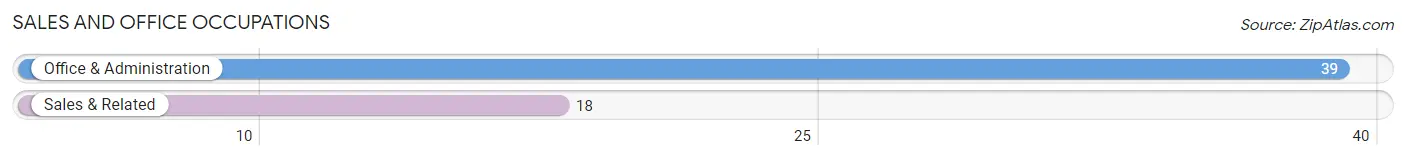
Sales and Office Occupations
The most common Sales and Office occupations in University Heights are Office & Administration (39 | 5.3%), and Sales & Related (18 | 2.5%).
Sales and Office Occupations by Sex
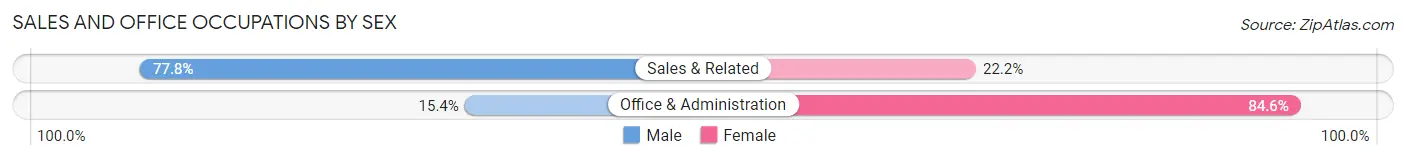
| Occupation | Male | Female |
| Sales & Related | 14 (77.8%) | 4 (22.2%) |
| Office & Administration | 6 (15.4%) | 33 (84.6%) |
| Total (Category) | 20 (35.1%) | 37 (64.9%) |
| Total (Overall) | 376 (51.1%) | 360 (48.9%) |
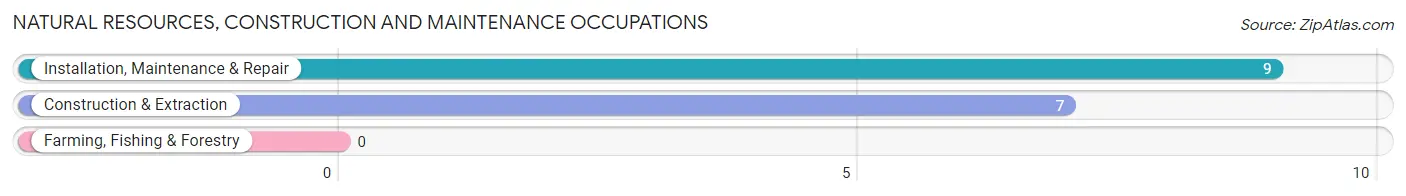
Natural Resources, Construction and Maintenance Occupations
The most common Natural Resources, Construction and Maintenance occupations in University Heights are Installation, Maintenance & Repair (9 | 1.2%), and Construction & Extraction (7 | 0.9%).
Natural Resources, Construction and Maintenance Occupations by Sex
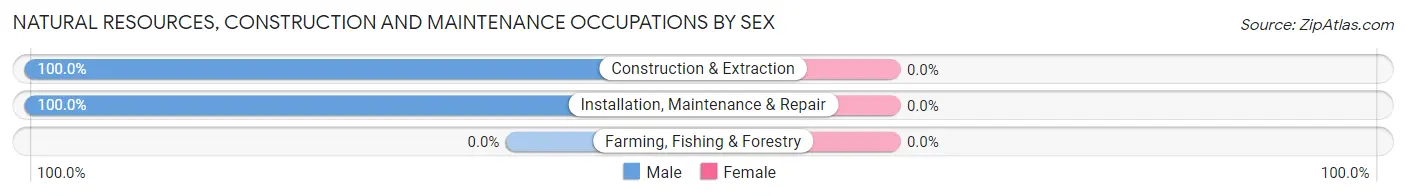
| Occupation | Male | Female |
| Farming, Fishing & Forestry | 0 (0.0%) | 0 (0.0%) |
| Construction & Extraction | 7 (100.0%) | 0 (0.0%) |
| Installation, Maintenance & Repair | 9 (100.0%) | 0 (0.0%) |
| Total (Category) | 16 (100.0%) | 0 (0.0%) |
| Total (Overall) | 376 (51.1%) | 360 (48.9%) |
Production, Transportation and Moving Occupations
The most common Production, Transportation and Moving occupations in University Heights are Material Moving (19 | 2.6%), and Production (4 | 0.5%).
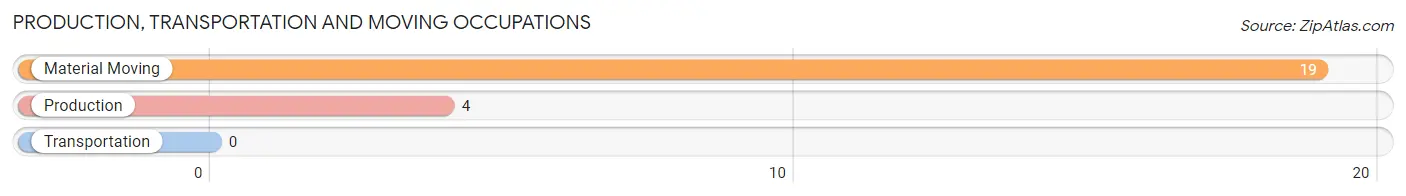
Production, Transportation and Moving Occupations by Sex
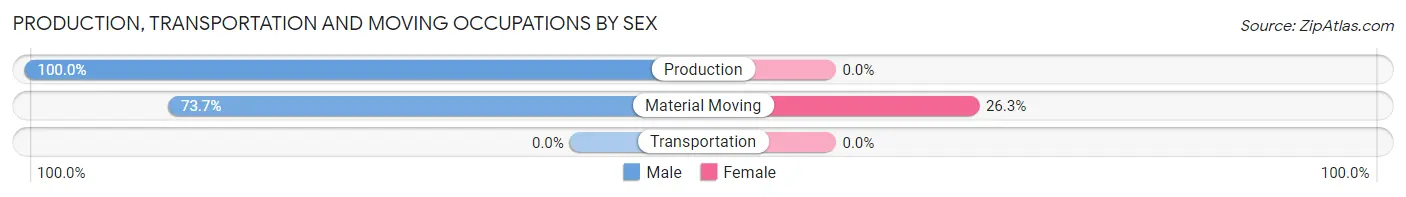
| Occupation | Male | Female |
| Production | 4 (100.0%) | 0 (0.0%) |
| Transportation | 0 (0.0%) | 0 (0.0%) |
| Material Moving | 14 (73.7%) | 5 (26.3%) |
| Total (Category) | 18 (78.3%) | 5 (21.7%) |
| Total (Overall) | 376 (51.1%) | 360 (48.9%) |
Employment Industries by Sex in University Heights
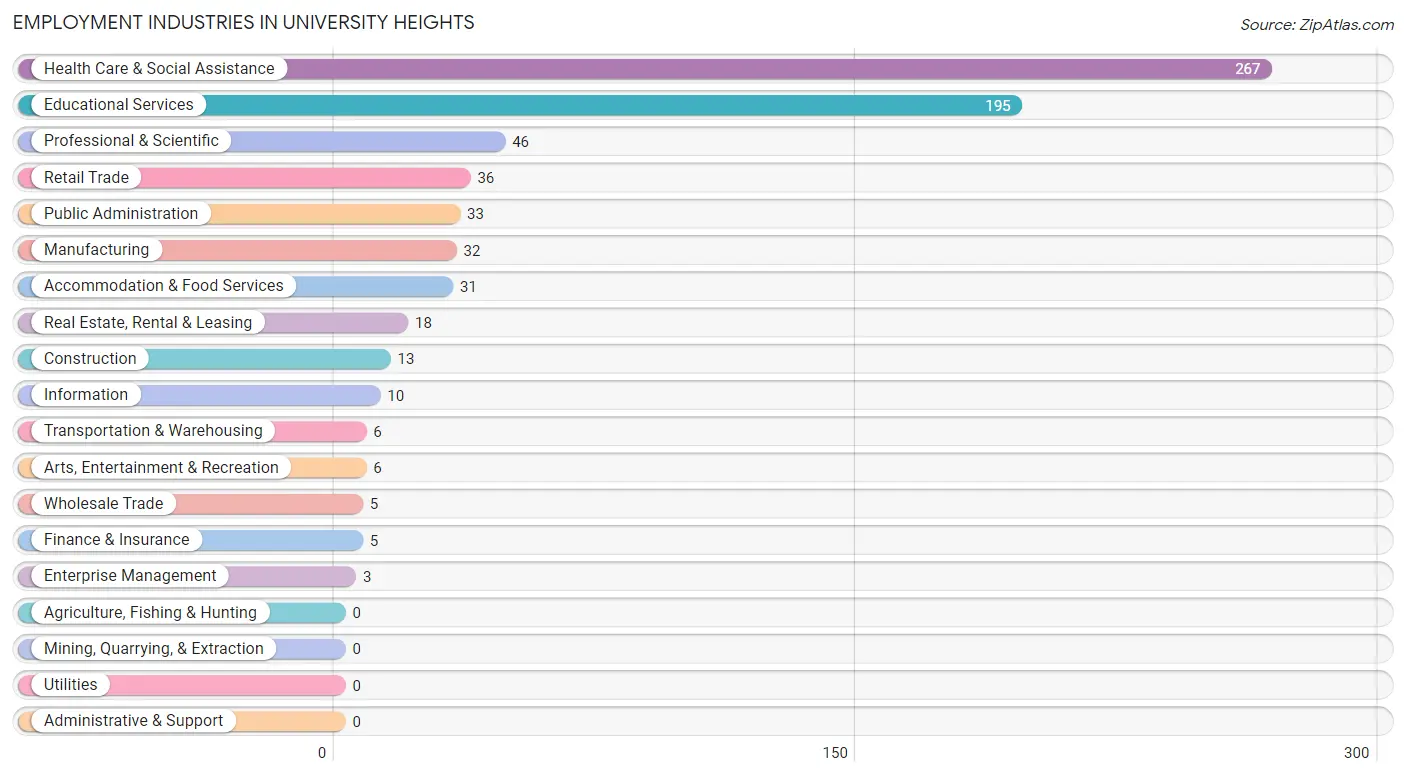
Employment Industries in University Heights
The major employment industries in University Heights include Health Care & Social Assistance (267 | 36.3%), Educational Services (195 | 26.5%), Professional & Scientific (46 | 6.2%), Retail Trade (36 | 4.9%), and Public Administration (33 | 4.5%).
Employment Industries by Sex in University Heights
The University Heights industries that see more men than women are Construction (100.0%), Wholesale Trade (100.0%), and Transportation & Warehousing (100.0%), whereas the industries that tend to have a higher number of women are Enterprise Management (100.0%), Arts, Entertainment & Recreation (100.0%), and Finance & Insurance (80.0%).
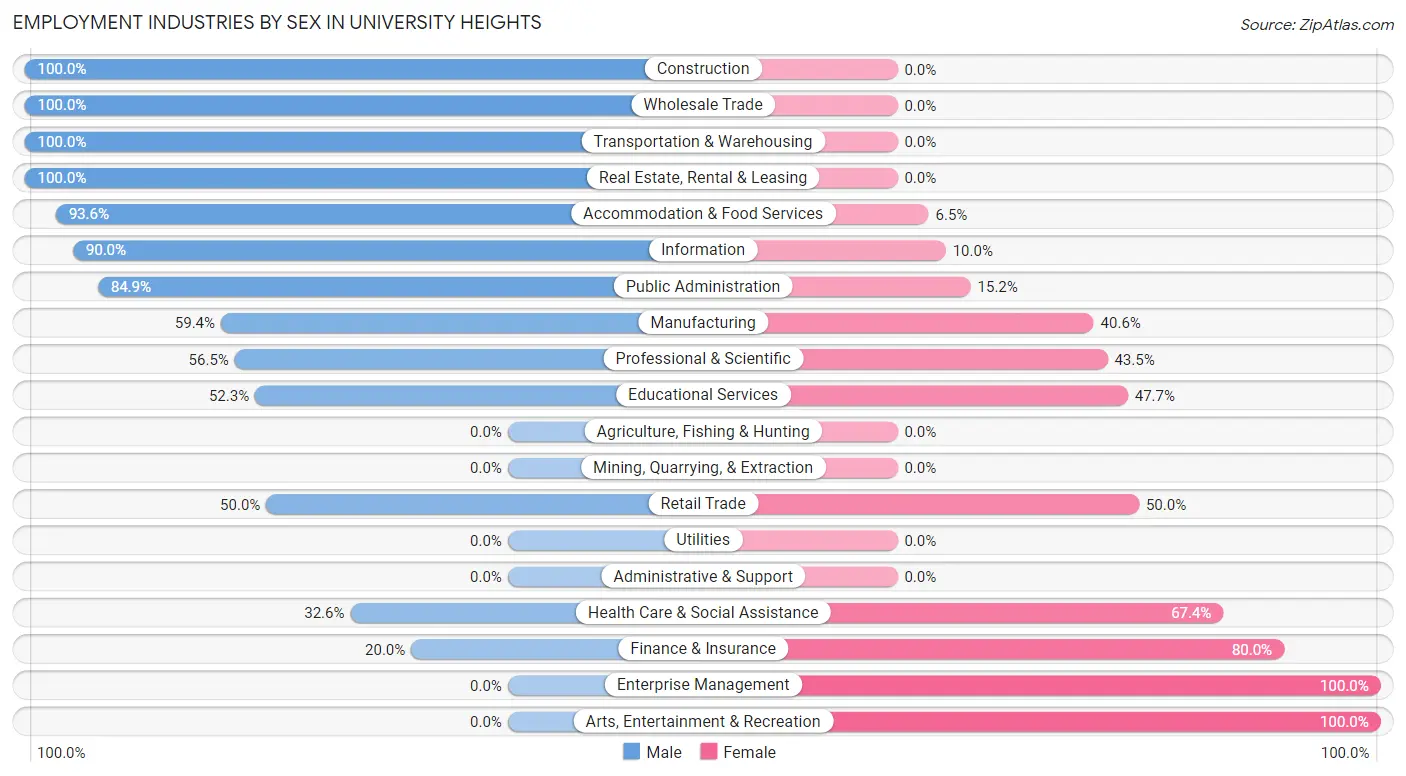
| Industry | Male | Female |
| Agriculture, Fishing & Hunting | 0 (0.0%) | 0 (0.0%) |
| Mining, Quarrying, & Extraction | 0 (0.0%) | 0 (0.0%) |
| Construction | 13 (100.0%) | 0 (0.0%) |
| Manufacturing | 19 (59.4%) | 13 (40.6%) |
| Wholesale Trade | 5 (100.0%) | 0 (0.0%) |
| Retail Trade | 18 (50.0%) | 18 (50.0%) |
| Transportation & Warehousing | 6 (100.0%) | 0 (0.0%) |
| Utilities | 0 (0.0%) | 0 (0.0%) |
| Information | 9 (90.0%) | 1 (10.0%) |
| Finance & Insurance | 1 (20.0%) | 4 (80.0%) |
| Real Estate, Rental & Leasing | 18 (100.0%) | 0 (0.0%) |
| Professional & Scientific | 26 (56.5%) | 20 (43.5%) |
| Enterprise Management | 0 (0.0%) | 3 (100.0%) |
| Administrative & Support | 0 (0.0%) | 0 (0.0%) |
| Educational Services | 102 (52.3%) | 93 (47.7%) |
| Health Care & Social Assistance | 87 (32.6%) | 180 (67.4%) |
| Arts, Entertainment & Recreation | 0 (0.0%) | 6 (100.0%) |
| Accommodation & Food Services | 29 (93.5%) | 2 (6.5%) |
| Public Administration | 28 (84.9%) | 5 (15.1%) |
| Total | 376 (51.1%) | 360 (48.9%) |
Education in University Heights
School Enrollment in University Heights
The most common levels of schooling among the 532 students in University Heights are graduate / professional (174 | 32.7%), college / undergraduate (134 | 25.2%), and elementary school (71 | 13.4%).
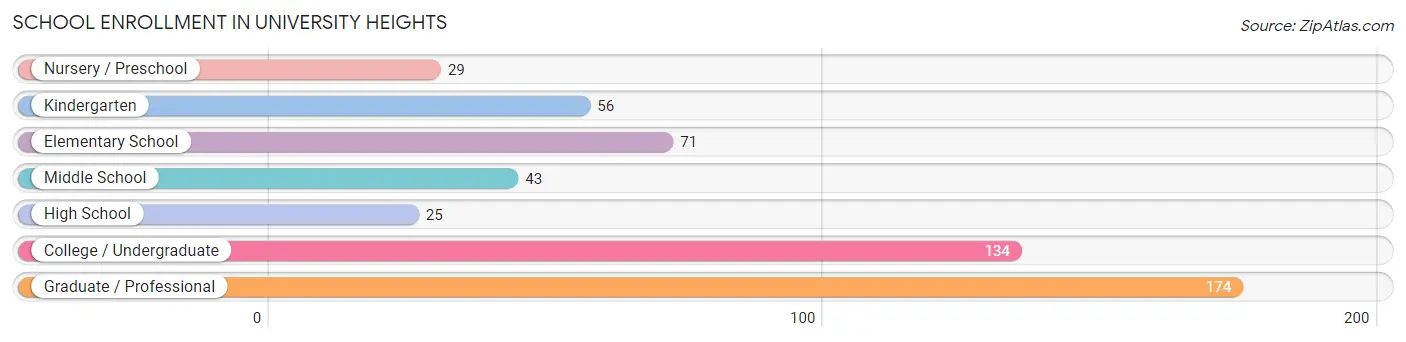
| School Level | # Students | % Students |
| Nursery / Preschool | 29 | 5.4% |
| Kindergarten | 56 | 10.5% |
| Elementary School | 71 | 13.4% |
| Middle School | 43 | 8.1% |
| High School | 25 | 4.7% |
| College / Undergraduate | 134 | 25.2% |
| Graduate / Professional | 174 | 32.7% |
| Total | 532 | 100.0% |
School Enrollment by Age by Funding Source in University Heights
Out of a total of 532 students who are enrolled in schools in University Heights, 54 (10.2%) attend a private institution, while the remaining 478 (89.8%) are enrolled in public schools. The age group of 3 to 4 year olds has the highest likelihood of being enrolled in private schools, with 26 (89.7% in the age bracket) enrolled. Conversely, the age group of 15 to 17 year olds has the lowest likelihood of being enrolled in a private school, with 22 (100.0% in the age bracket) attending a public institution.
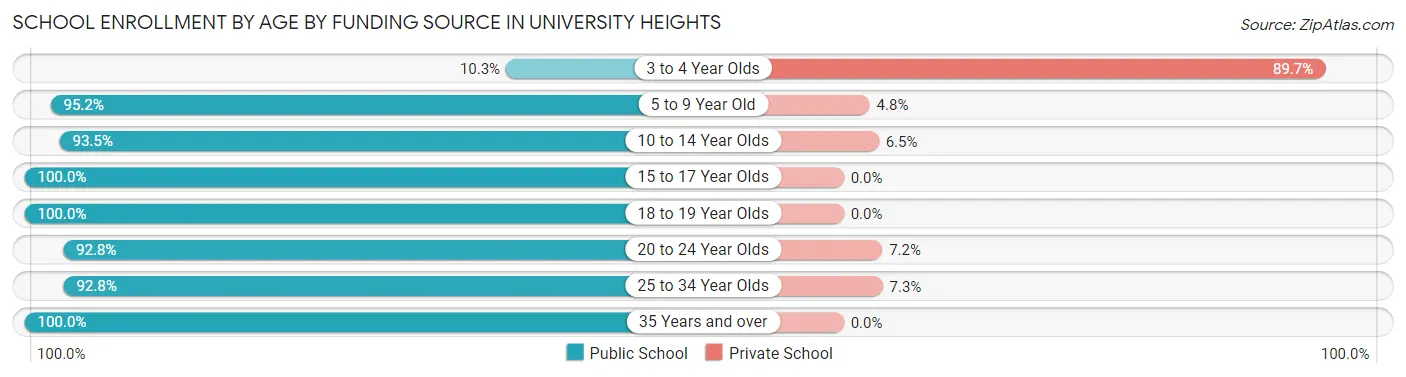
| Age Bracket | Public School | Private School |
| 3 to 4 Year Olds | 3 (10.3%) | 26 (89.7%) |
| 5 to 9 Year Old | 118 (95.2%) | 6 (4.8%) |
| 10 to 14 Year Olds | 43 (93.5%) | 3 (6.5%) |
| 15 to 17 Year Olds | 22 (100.0%) | 0 (0.0%) |
| 18 to 19 Year Olds | 42 (100.0%) | 0 (0.0%) |
| 20 to 24 Year Olds | 181 (92.8%) | 14 (7.2%) |
| 25 to 34 Year Olds | 64 (92.7%) | 5 (7.2%) |
| 35 Years and over | 5 (100.0%) | 0 (0.0%) |
| Total | 478 (89.8%) | 54 (10.2%) |
Educational Attainment by Field of Study in University Heights
Bio, nature & agricultural (127 | 17.9%), science & technology (97 | 13.6%), social sciences (83 | 11.7%), business (70 | 9.9%), and computers & mathematics (55 | 7.7%) are the most common fields of study among 711 individuals in University Heights who have obtained a bachelor's degree or higher.
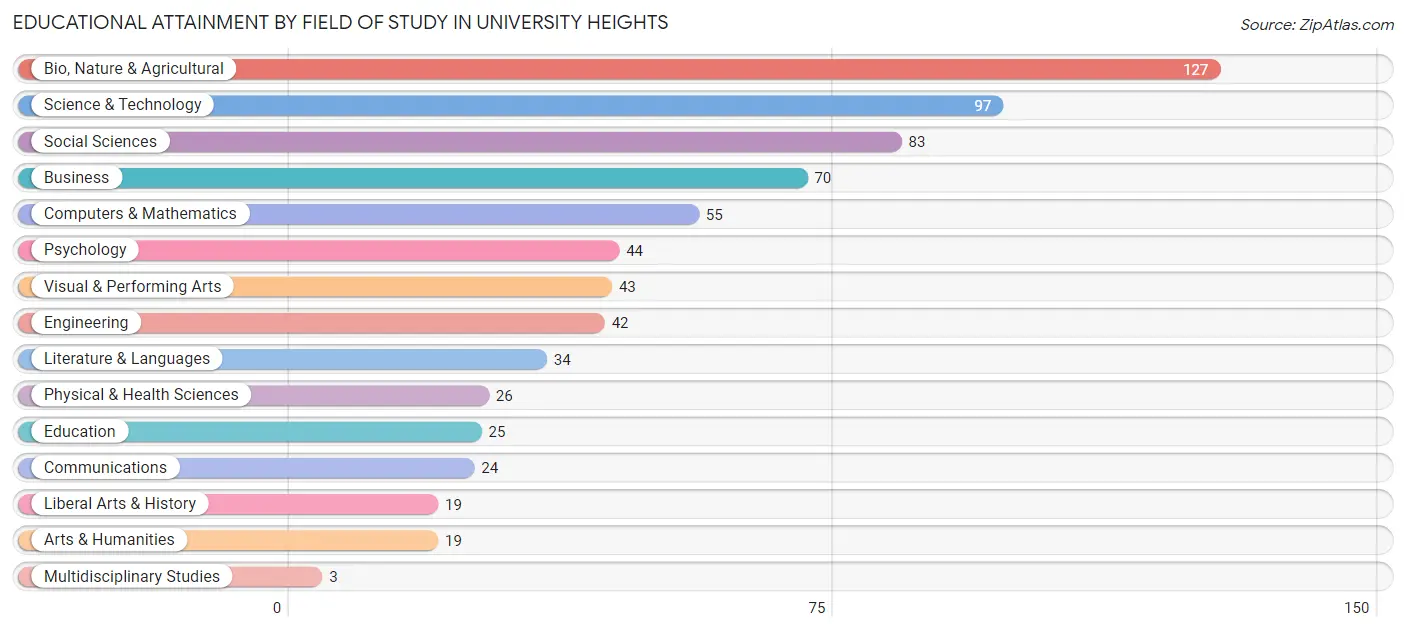
| Field of Study | # Graduates | % Graduates |
| Computers & Mathematics | 55 | 7.7% |
| Bio, Nature & Agricultural | 127 | 17.9% |
| Physical & Health Sciences | 26 | 3.7% |
| Psychology | 44 | 6.2% |
| Social Sciences | 83 | 11.7% |
| Engineering | 42 | 5.9% |
| Multidisciplinary Studies | 3 | 0.4% |
| Science & Technology | 97 | 13.6% |
| Business | 70 | 9.9% |
| Education | 25 | 3.5% |
| Literature & Languages | 34 | 4.8% |
| Liberal Arts & History | 19 | 2.7% |
| Visual & Performing Arts | 43 | 6.0% |
| Communications | 24 | 3.4% |
| Arts & Humanities | 19 | 2.7% |
| Total | 711 | 100.0% |
Transportation & Commute in University Heights
Vehicle Availability by Sex in University Heights
The most prevalent vehicle ownership categories in University Heights are males with 2 vehicles (172, accounting for 46.9%) and females with 2 vehicles (198, making up 49.1%).
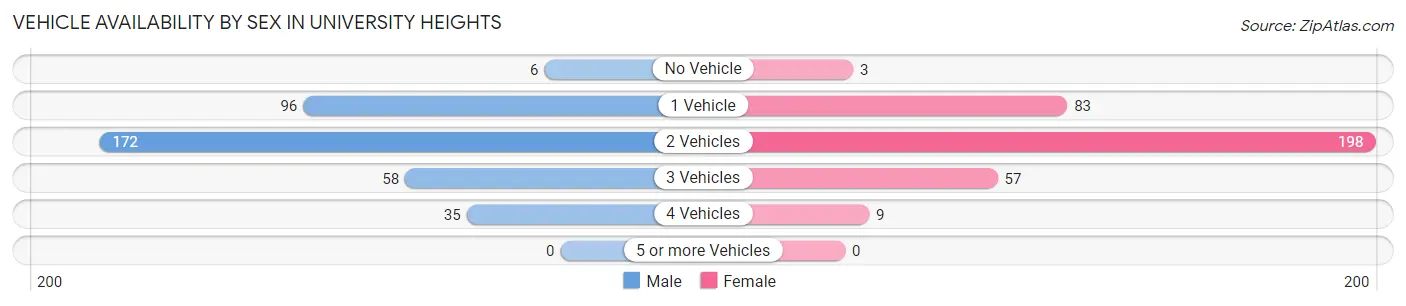
| Vehicles Available | Male | Female |
| No Vehicle | 6 (1.6%) | 3 (0.9%) |
| 1 Vehicle | 96 (26.2%) | 83 (23.7%) |
| 2 Vehicles | 172 (46.9%) | 198 (56.6%) |
| 3 Vehicles | 58 (15.8%) | 57 (16.3%) |
| 4 Vehicles | 35 (9.5%) | 9 (2.6%) |
| 5 or more Vehicles | 0 (0.0%) | 0 (0.0%) |
| Total | 367 (100.0%) | 350 (100.0%) |
Commute Time in University Heights
The most frequently occuring commute durations in University Heights are 15 to 19 minutes (190 commuters, 32.5%), 10 to 14 minutes (134 commuters, 22.9%), and 5 to 9 minutes (97 commuters, 16.6%).
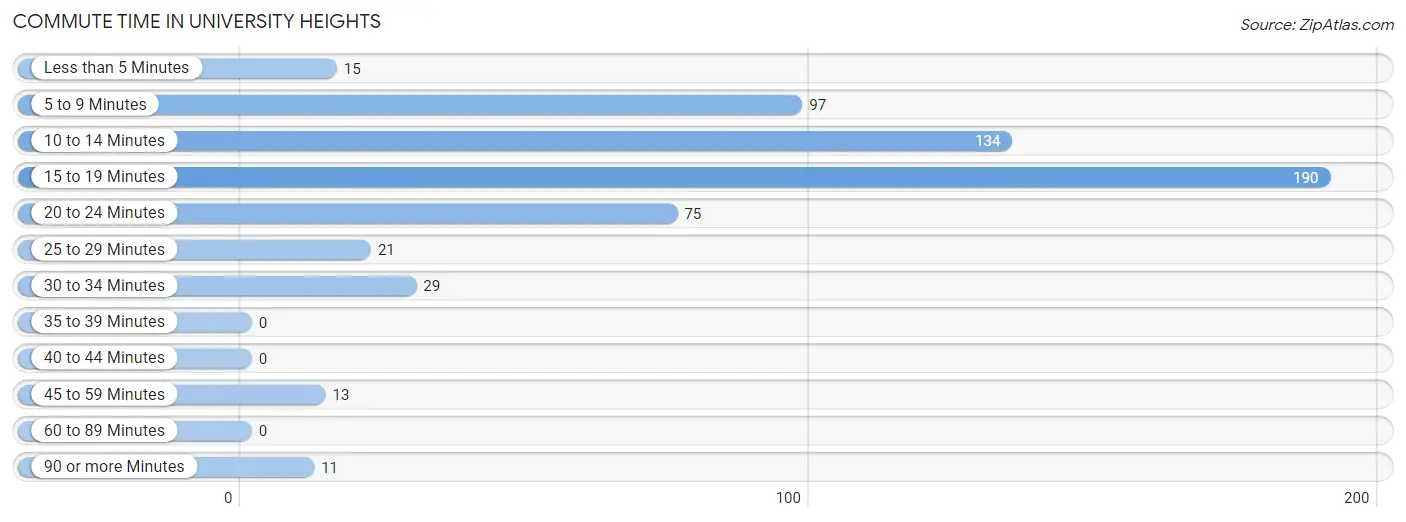
| Commute Time | # Commuters | % Commuters |
| Less than 5 Minutes | 15 | 2.6% |
| 5 to 9 Minutes | 97 | 16.6% |
| 10 to 14 Minutes | 134 | 22.9% |
| 15 to 19 Minutes | 190 | 32.5% |
| 20 to 24 Minutes | 75 | 12.8% |
| 25 to 29 Minutes | 21 | 3.6% |
| 30 to 34 Minutes | 29 | 5.0% |
| 35 to 39 Minutes | 0 | 0.0% |
| 40 to 44 Minutes | 0 | 0.0% |
| 45 to 59 Minutes | 13 | 2.2% |
| 60 to 89 Minutes | 0 | 0.0% |
| 90 or more Minutes | 11 | 1.9% |
Commute Time by Sex in University Heights
The most common commute times in University Heights are 15 to 19 minutes (82 commuters, 29.0%) for males and 15 to 19 minutes (108 commuters, 35.8%) for females.
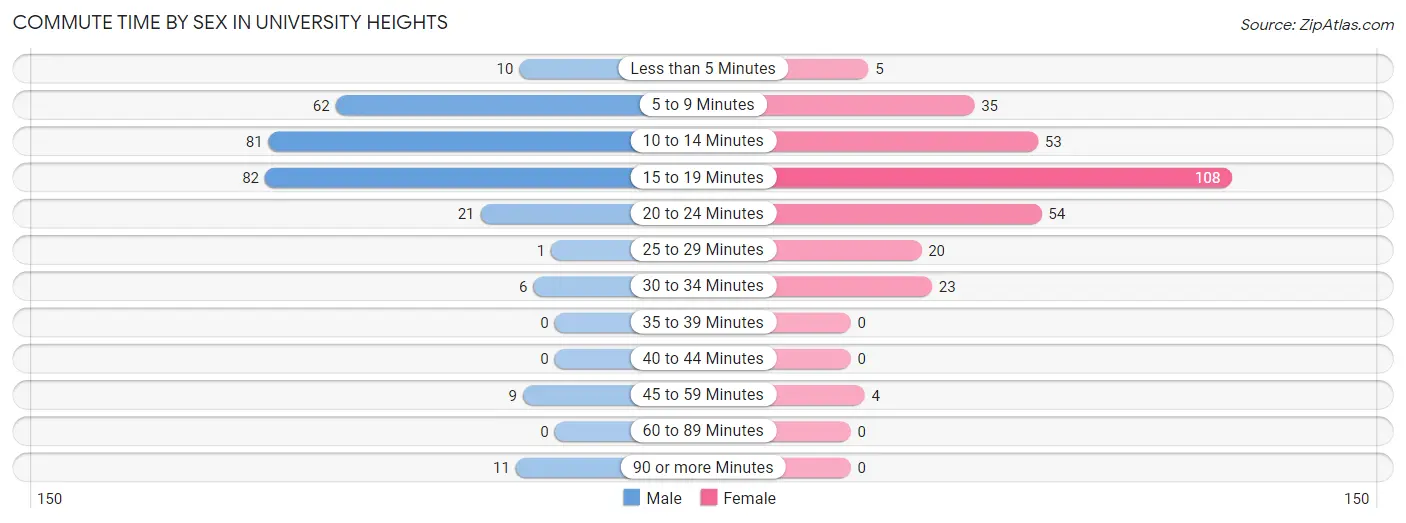
| Commute Time | Male | Female |
| Less than 5 Minutes | 10 (3.5%) | 5 (1.7%) |
| 5 to 9 Minutes | 62 (21.9%) | 35 (11.6%) |
| 10 to 14 Minutes | 81 (28.6%) | 53 (17.5%) |
| 15 to 19 Minutes | 82 (29.0%) | 108 (35.8%) |
| 20 to 24 Minutes | 21 (7.4%) | 54 (17.9%) |
| 25 to 29 Minutes | 1 (0.4%) | 20 (6.6%) |
| 30 to 34 Minutes | 6 (2.1%) | 23 (7.6%) |
| 35 to 39 Minutes | 0 (0.0%) | 0 (0.0%) |
| 40 to 44 Minutes | 0 (0.0%) | 0 (0.0%) |
| 45 to 59 Minutes | 9 (3.2%) | 4 (1.3%) |
| 60 to 89 Minutes | 0 (0.0%) | 0 (0.0%) |
| 90 or more Minutes | 11 (3.9%) | 0 (0.0%) |
Time of Departure to Work by Sex in University Heights
The most frequent times of departure to work in University Heights are 7:30 AM to 7:59 AM (92, 32.5%) for males and 7:30 AM to 7:59 AM (62, 20.5%) for females.
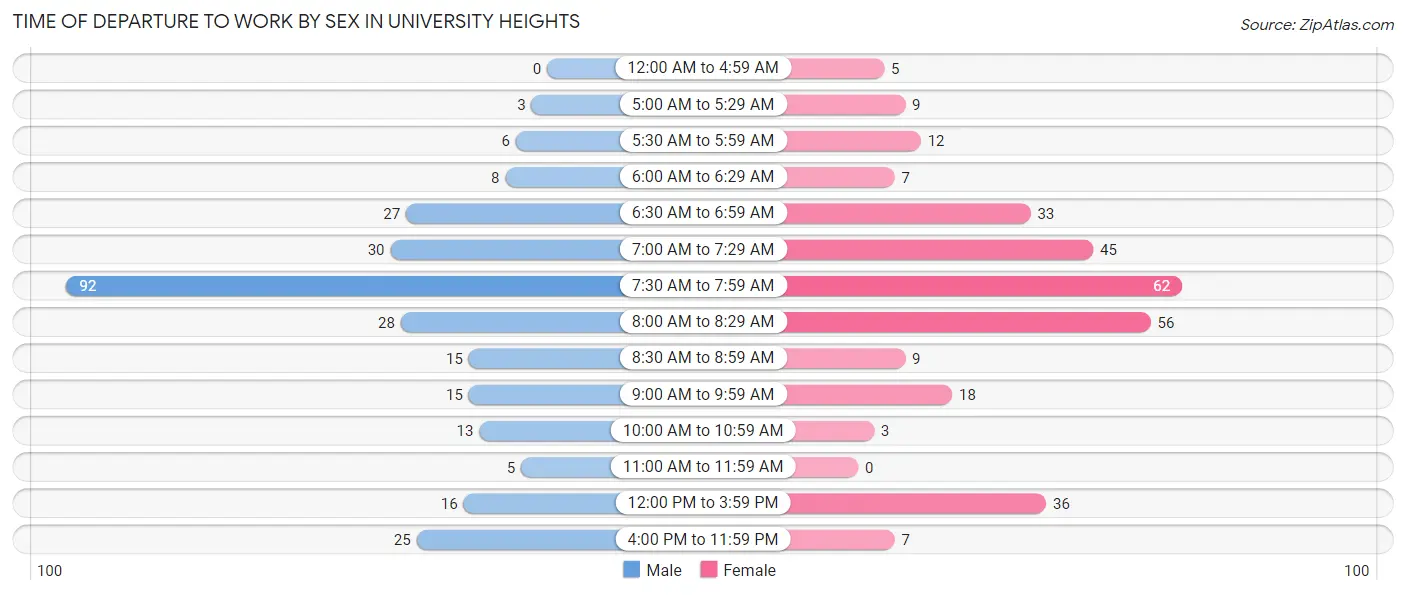
| Time of Departure | Male | Female |
| 12:00 AM to 4:59 AM | 0 (0.0%) | 5 (1.7%) |
| 5:00 AM to 5:29 AM | 3 (1.1%) | 9 (3.0%) |
| 5:30 AM to 5:59 AM | 6 (2.1%) | 12 (4.0%) |
| 6:00 AM to 6:29 AM | 8 (2.8%) | 7 (2.3%) |
| 6:30 AM to 6:59 AM | 27 (9.5%) | 33 (10.9%) |
| 7:00 AM to 7:29 AM | 30 (10.6%) | 45 (14.9%) |
| 7:30 AM to 7:59 AM | 92 (32.5%) | 62 (20.5%) |
| 8:00 AM to 8:29 AM | 28 (9.9%) | 56 (18.5%) |
| 8:30 AM to 8:59 AM | 15 (5.3%) | 9 (3.0%) |
| 9:00 AM to 9:59 AM | 15 (5.3%) | 18 (6.0%) |
| 10:00 AM to 10:59 AM | 13 (4.6%) | 3 (1.0%) |
| 11:00 AM to 11:59 AM | 5 (1.8%) | 0 (0.0%) |
| 12:00 PM to 3:59 PM | 16 (5.7%) | 36 (11.9%) |
| 4:00 PM to 11:59 PM | 25 (8.8%) | 7 (2.3%) |
| Total | 283 (100.0%) | 302 (100.0%) |
Housing Occupancy in University Heights
Occupancy by Ownership in University Heights
Of the total 552 dwellings in University Heights, owner-occupied units account for 313 (56.7%), while renter-occupied units make up 239 (43.3%).
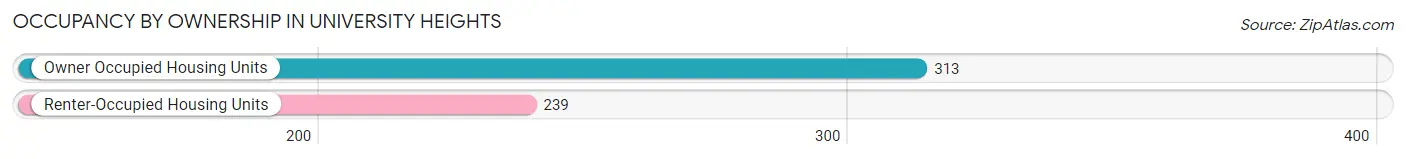
| Occupancy | # Housing Units | % Housing Units |
| Owner Occupied Housing Units | 313 | 56.7% |
| Renter-Occupied Housing Units | 239 | 43.3% |
| Total Occupied Housing Units | 552 | 100.0% |
Occupancy by Household Size in University Heights
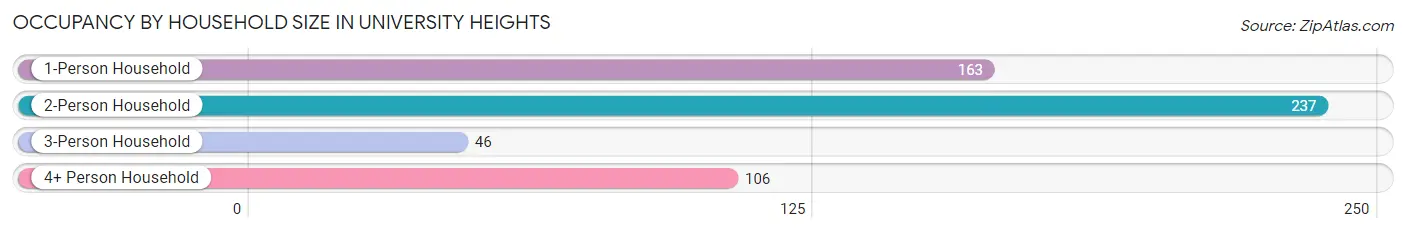
| Household Size | # Housing Units | % Housing Units |
| 1-Person Household | 163 | 29.5% |
| 2-Person Household | 237 | 42.9% |
| 3-Person Household | 46 | 8.3% |
| 4+ Person Household | 106 | 19.2% |
| Total Housing Units | 552 | 100.0% |
Occupancy by Ownership by Household Size in University Heights
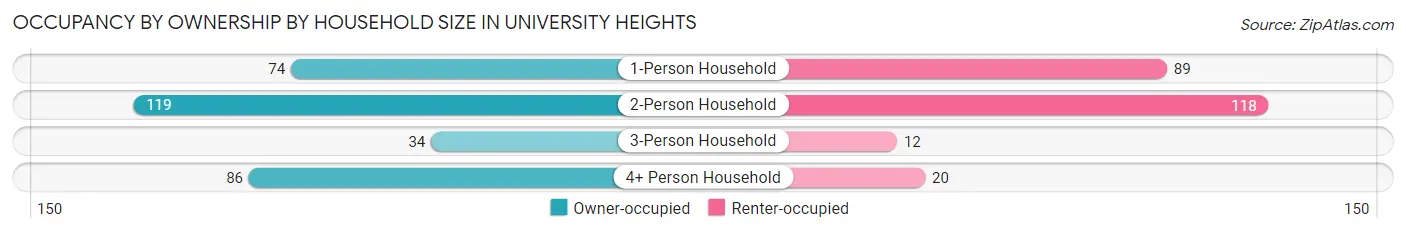
| Household Size | Owner-occupied | Renter-occupied |
| 1-Person Household | 74 (45.4%) | 89 (54.6%) |
| 2-Person Household | 119 (50.2%) | 118 (49.8%) |
| 3-Person Household | 34 (73.9%) | 12 (26.1%) |
| 4+ Person Household | 86 (81.1%) | 20 (18.9%) |
| Total Housing Units | 313 (56.7%) | 239 (43.3%) |
Occupancy by Educational Attainment in University Heights
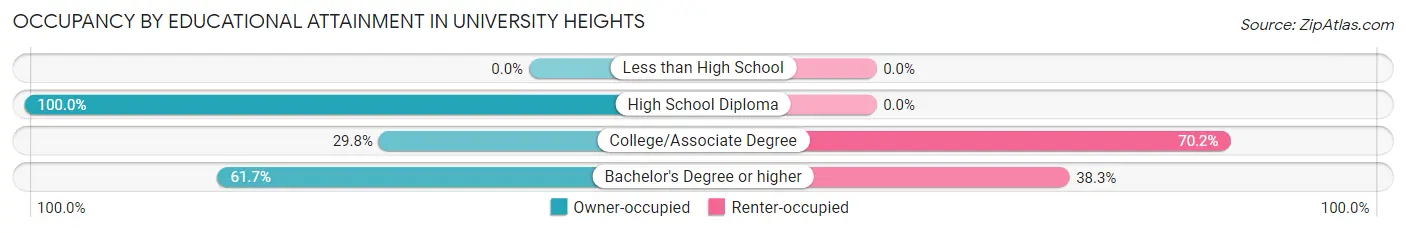
| Household Size | Owner-occupied | Renter-occupied |
| Less than High School | 0 (0.0%) | 0 (0.0%) |
| High School Diploma | 6 (100.0%) | 0 (0.0%) |
| College/Associate Degree | 28 (29.8%) | 66 (70.2%) |
| Bachelor's Degree or higher | 279 (61.7%) | 173 (38.3%) |
Occupancy by Age of Householder in University Heights
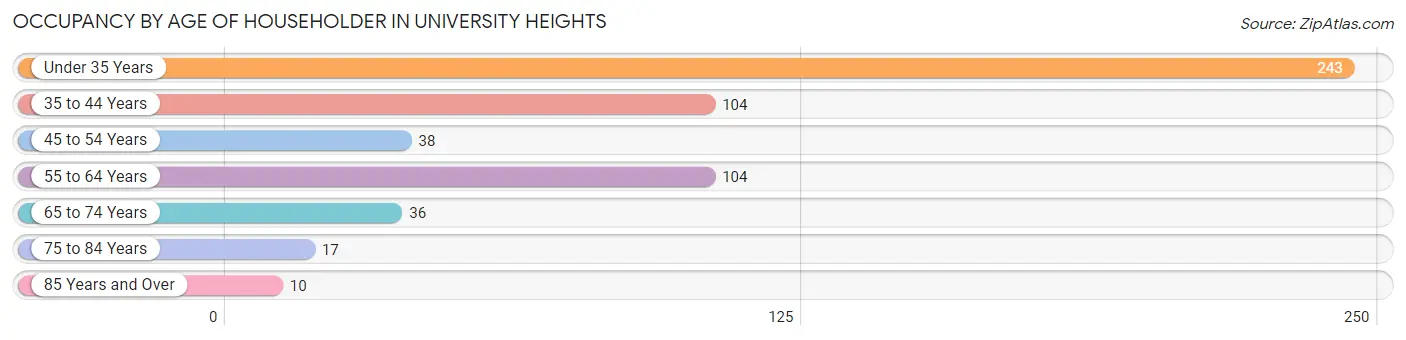
| Age Bracket | # Households | % Households |
| Under 35 Years | 243 | 44.0% |
| 35 to 44 Years | 104 | 18.8% |
| 45 to 54 Years | 38 | 6.9% |
| 55 to 64 Years | 104 | 18.8% |
| 65 to 74 Years | 36 | 6.5% |
| 75 to 84 Years | 17 | 3.1% |
| 85 Years and Over | 10 | 1.8% |
| Total | 552 | 100.0% |
Housing Finances in University Heights
Median Income by Occupancy in University Heights
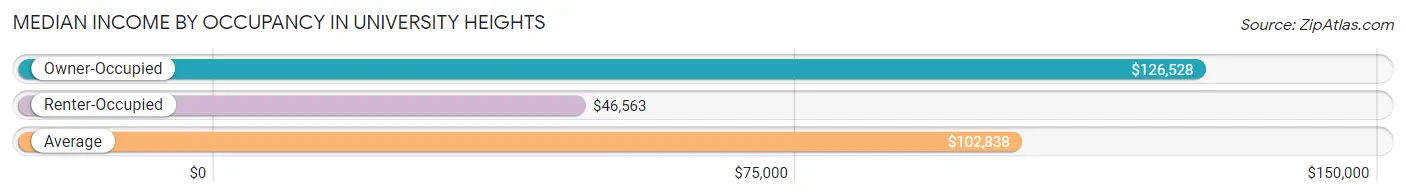
| Occupancy Type | # Households | Median Income |
| Owner-Occupied | 313 (56.7%) | $126,528 |
| Renter-Occupied | 239 (43.3%) | $46,563 |
| Average | 552 (100.0%) | $102,838 |
Occupancy by Householder Income Bracket in University Heights
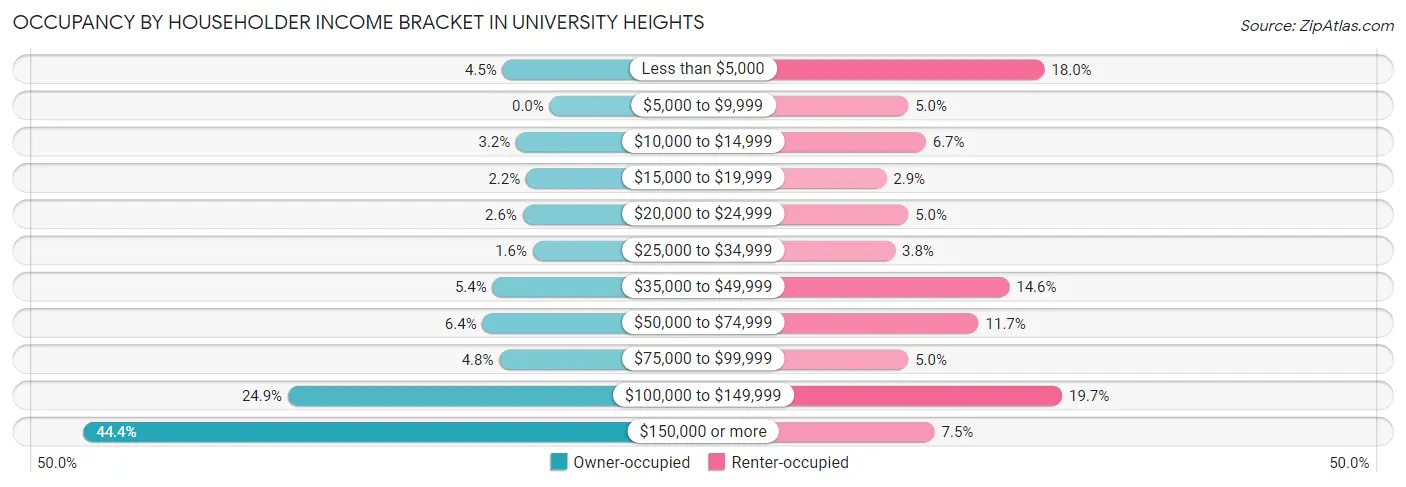
| Income Bracket | Owner-occupied | Renter-occupied |
| Less than $5,000 | 14 (4.5%) | 43 (18.0%) |
| $5,000 to $9,999 | 0 (0.0%) | 12 (5.0%) |
| $10,000 to $14,999 | 10 (3.2%) | 16 (6.7%) |
| $15,000 to $19,999 | 7 (2.2%) | 7 (2.9%) |
| $20,000 to $24,999 | 8 (2.6%) | 12 (5.0%) |
| $25,000 to $34,999 | 5 (1.6%) | 9 (3.8%) |
| $35,000 to $49,999 | 17 (5.4%) | 35 (14.6%) |
| $50,000 to $74,999 | 20 (6.4%) | 28 (11.7%) |
| $75,000 to $99,999 | 15 (4.8%) | 12 (5.0%) |
| $100,000 to $149,999 | 78 (24.9%) | 47 (19.7%) |
| $150,000 or more | 139 (44.4%) | 18 (7.5%) |
| Total | 313 (100.0%) | 239 (100.0%) |
Monthly Housing Cost Tiers in University Heights
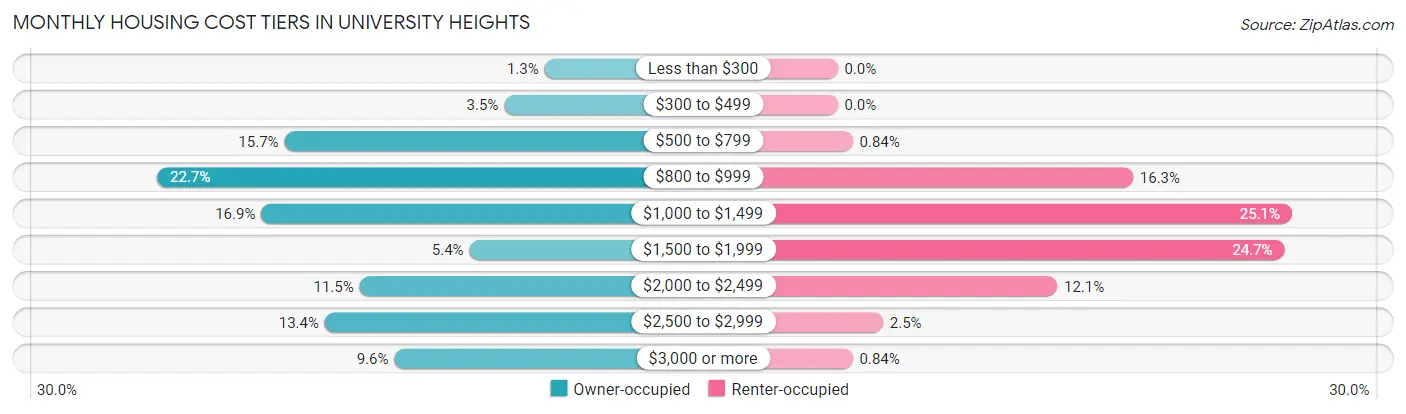
| Monthly Cost | Owner-occupied | Renter-occupied |
| Less than $300 | 4 (1.3%) | 0 (0.0%) |
| $300 to $499 | 11 (3.5%) | 0 (0.0%) |
| $500 to $799 | 49 (15.7%) | 2 (0.8%) |
| $800 to $999 | 71 (22.7%) | 39 (16.3%) |
| $1,000 to $1,499 | 53 (16.9%) | 60 (25.1%) |
| $1,500 to $1,999 | 17 (5.4%) | 59 (24.7%) |
| $2,000 to $2,499 | 36 (11.5%) | 29 (12.1%) |
| $2,500 to $2,999 | 42 (13.4%) | 6 (2.5%) |
| $3,000 or more | 30 (9.6%) | 2 (0.8%) |
| Total | 313 (100.0%) | 239 (100.0%) |
Physical Housing Characteristics in University Heights
Housing Structures in University Heights
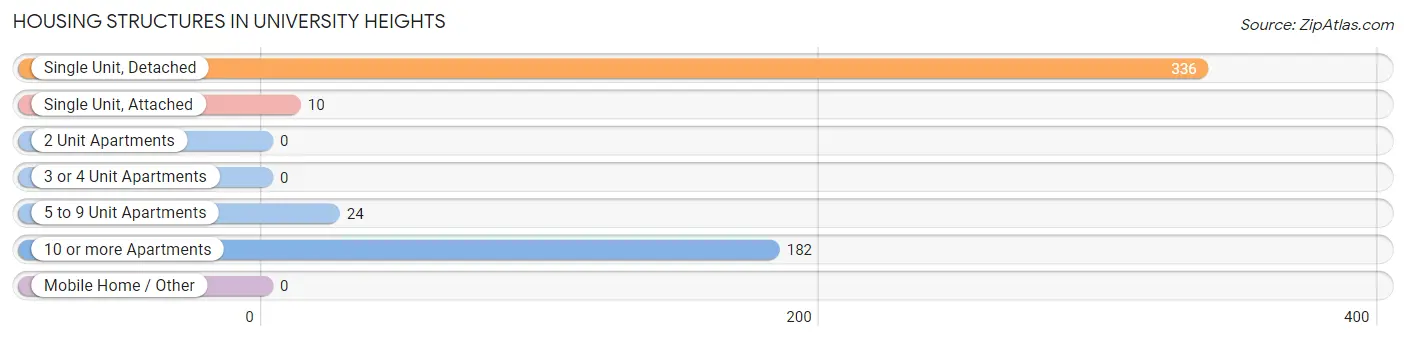
| Structure Type | # Housing Units | % Housing Units |
| Single Unit, Detached | 336 | 60.9% |
| Single Unit, Attached | 10 | 1.8% |
| 2 Unit Apartments | 0 | 0.0% |
| 3 or 4 Unit Apartments | 0 | 0.0% |
| 5 to 9 Unit Apartments | 24 | 4.3% |
| 10 or more Apartments | 182 | 33.0% |
| Mobile Home / Other | 0 | 0.0% |
| Total | 552 | 100.0% |
Housing Structures by Occupancy in University Heights
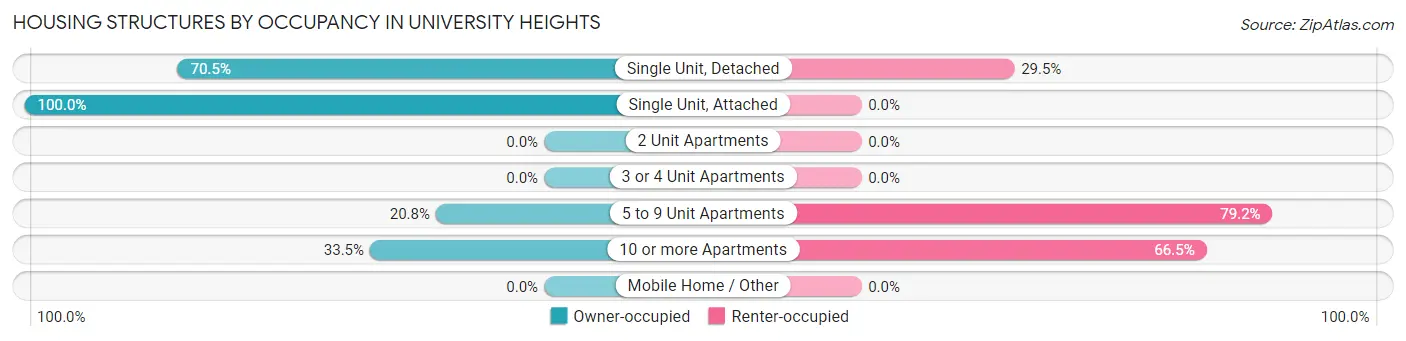
| Structure Type | Owner-occupied | Renter-occupied |
| Single Unit, Detached | 237 (70.5%) | 99 (29.5%) |
| Single Unit, Attached | 10 (100.0%) | 0 (0.0%) |
| 2 Unit Apartments | 0 (0.0%) | 0 (0.0%) |
| 3 or 4 Unit Apartments | 0 (0.0%) | 0 (0.0%) |
| 5 to 9 Unit Apartments | 5 (20.8%) | 19 (79.2%) |
| 10 or more Apartments | 61 (33.5%) | 121 (66.5%) |
| Mobile Home / Other | 0 (0.0%) | 0 (0.0%) |
| Total | 313 (56.7%) | 239 (43.3%) |
Housing Structures by Number of Rooms in University Heights
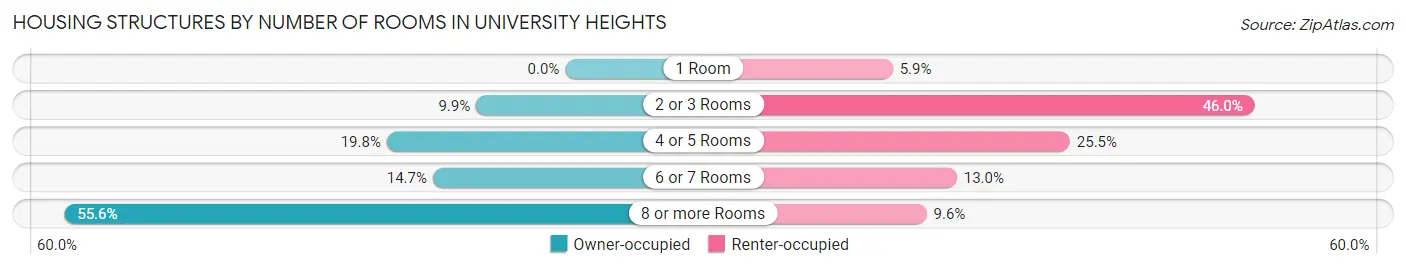
| Number of Rooms | Owner-occupied | Renter-occupied |
| 1 Room | 0 (0.0%) | 14 (5.9%) |
| 2 or 3 Rooms | 31 (9.9%) | 110 (46.0%) |
| 4 or 5 Rooms | 62 (19.8%) | 61 (25.5%) |
| 6 or 7 Rooms | 46 (14.7%) | 31 (13.0%) |
| 8 or more Rooms | 174 (55.6%) | 23 (9.6%) |
| Total | 313 (100.0%) | 239 (100.0%) |
Housing Structure by Heating Type in University Heights
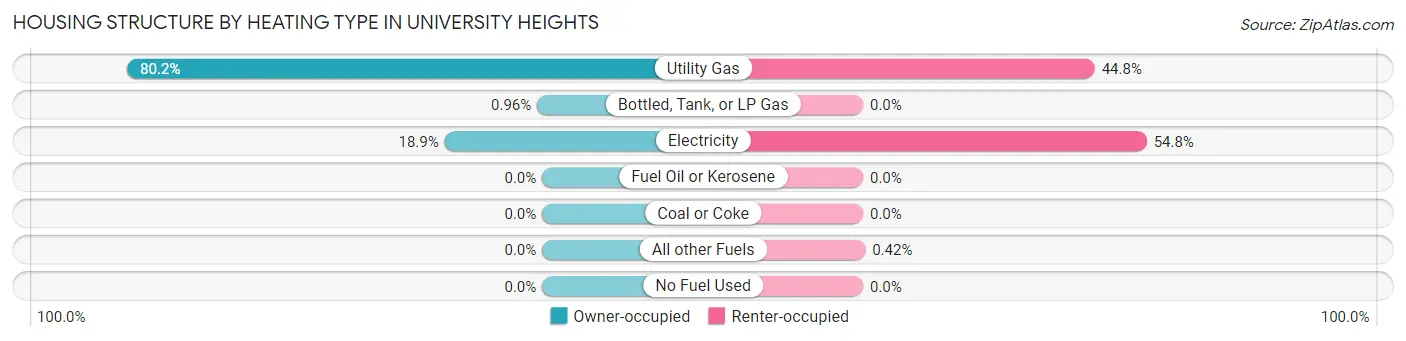
| Heating Type | Owner-occupied | Renter-occupied |
| Utility Gas | 251 (80.2%) | 107 (44.8%) |
| Bottled, Tank, or LP Gas | 3 (1.0%) | 0 (0.0%) |
| Electricity | 59 (18.9%) | 131 (54.8%) |
| Fuel Oil or Kerosene | 0 (0.0%) | 0 (0.0%) |
| Coal or Coke | 0 (0.0%) | 0 (0.0%) |
| All other Fuels | 0 (0.0%) | 1 (0.4%) |
| No Fuel Used | 0 (0.0%) | 0 (0.0%) |
| Total | 313 (100.0%) | 239 (100.0%) |
Household Vehicle Usage in University Heights
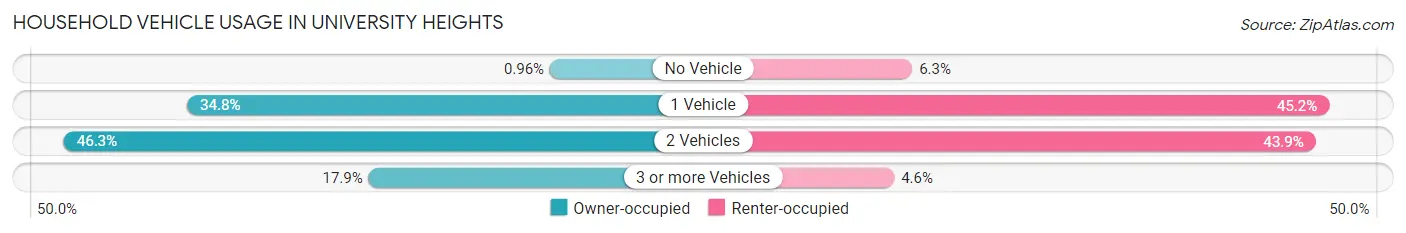
| Vehicles per Household | Owner-occupied | Renter-occupied |
| No Vehicle | 3 (1.0%) | 15 (6.3%) |
| 1 Vehicle | 109 (34.8%) | 108 (45.2%) |
| 2 Vehicles | 145 (46.3%) | 105 (43.9%) |
| 3 or more Vehicles | 56 (17.9%) | 11 (4.6%) |
| Total | 313 (100.0%) | 239 (100.0%) |
Real Estate & Mortgages in University Heights
Real Estate and Mortgage Overview in University Heights
| Characteristic | Without Mortgage | With Mortgage |
| Housing Units | 184 | 129 |
| Median Property Value | $353,000 | $419,300 |
| Median Household Income | $104,483 | $81 |
| Monthly Housing Costs | $862 | $30 |
| Real Estate Taxes | $6,857 | $0 |
Property Value by Mortgage Status in University Heights
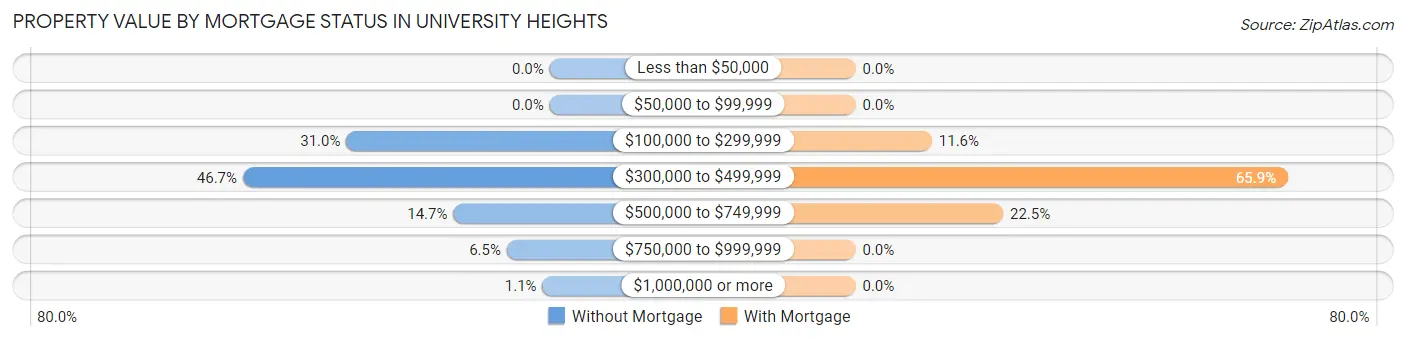
| Property Value | Without Mortgage | With Mortgage |
| Less than $50,000 | 0 (0.0%) | 0 (0.0%) |
| $50,000 to $99,999 | 0 (0.0%) | 0 (0.0%) |
| $100,000 to $299,999 | 57 (31.0%) | 15 (11.6%) |
| $300,000 to $499,999 | 86 (46.7%) | 85 (65.9%) |
| $500,000 to $749,999 | 27 (14.7%) | 29 (22.5%) |
| $750,000 to $999,999 | 12 (6.5%) | 0 (0.0%) |
| $1,000,000 or more | 2 (1.1%) | 0 (0.0%) |
| Total | 184 (100.0%) | 129 (100.0%) |
Household Income by Mortgage Status in University Heights
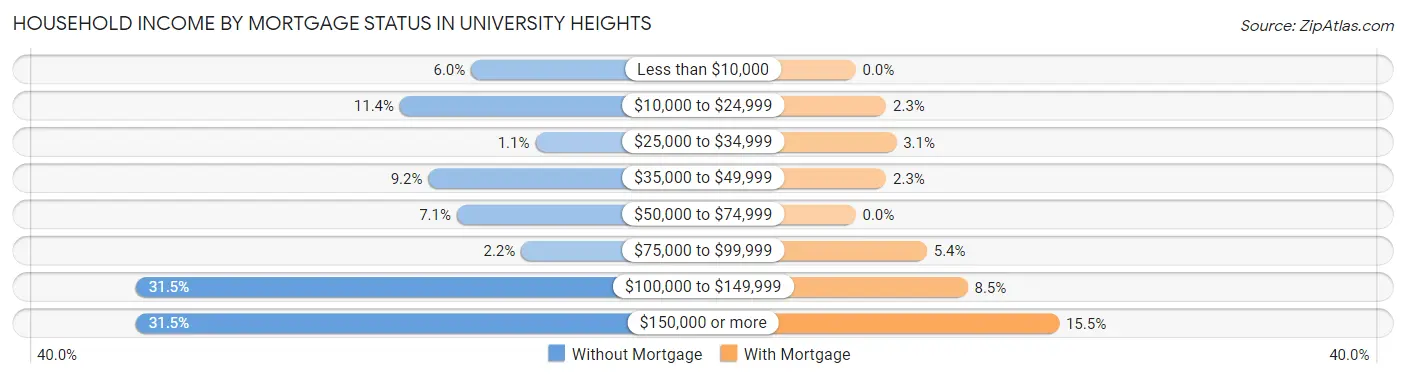
| Household Income | Without Mortgage | With Mortgage |
| Less than $10,000 | 11 (6.0%) | 0 (0.0%) |
| $10,000 to $24,999 | 21 (11.4%) | 3 (2.3%) |
| $25,000 to $34,999 | 2 (1.1%) | 4 (3.1%) |
| $35,000 to $49,999 | 17 (9.2%) | 3 (2.3%) |
| $50,000 to $74,999 | 13 (7.1%) | 0 (0.0%) |
| $75,000 to $99,999 | 4 (2.2%) | 7 (5.4%) |
| $100,000 to $149,999 | 58 (31.5%) | 11 (8.5%) |
| $150,000 or more | 58 (31.5%) | 20 (15.5%) |
| Total | 184 (100.0%) | 129 (100.0%) |
Property Value to Household Income Ratio in University Heights
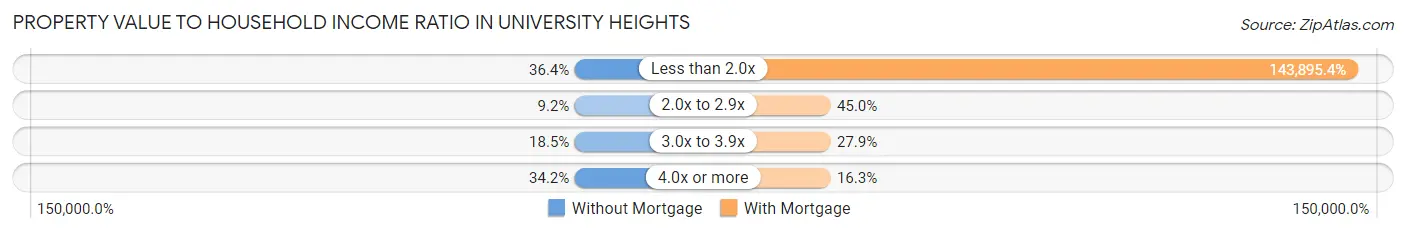
| Value-to-Income Ratio | Without Mortgage | With Mortgage |
| Less than 2.0x | 67 (36.4%) | 185,625 (143,895.4%) |
| 2.0x to 2.9x | 17 (9.2%) | 58 (45.0%) |
| 3.0x to 3.9x | 34 (18.5%) | 36 (27.9%) |
| 4.0x or more | 63 (34.2%) | 21 (16.3%) |
| Total | 184 (100.0%) | 129 (100.0%) |
Real Estate Taxes by Mortgage Status in University Heights
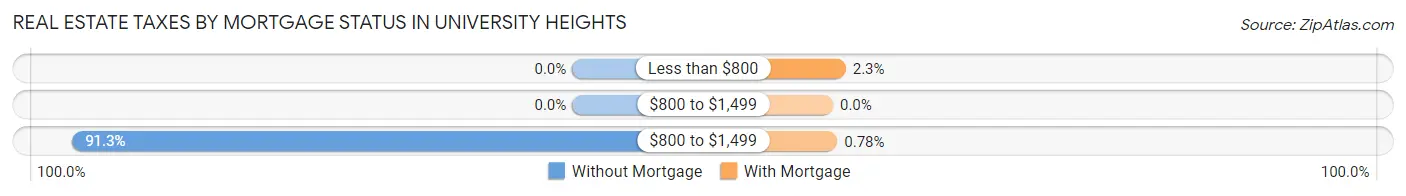
| Property Taxes | Without Mortgage | With Mortgage |
| Less than $800 | 0 (0.0%) | 3 (2.3%) |
| $800 to $1,499 | 0 (0.0%) | 0 (0.0%) |
| $800 to $1,499 | 168 (91.3%) | 1 (0.8%) |
| Total | 184 (100.0%) | 129 (100.0%) |
Health & Disability in University Heights
Health Insurance Coverage by Age in University Heights
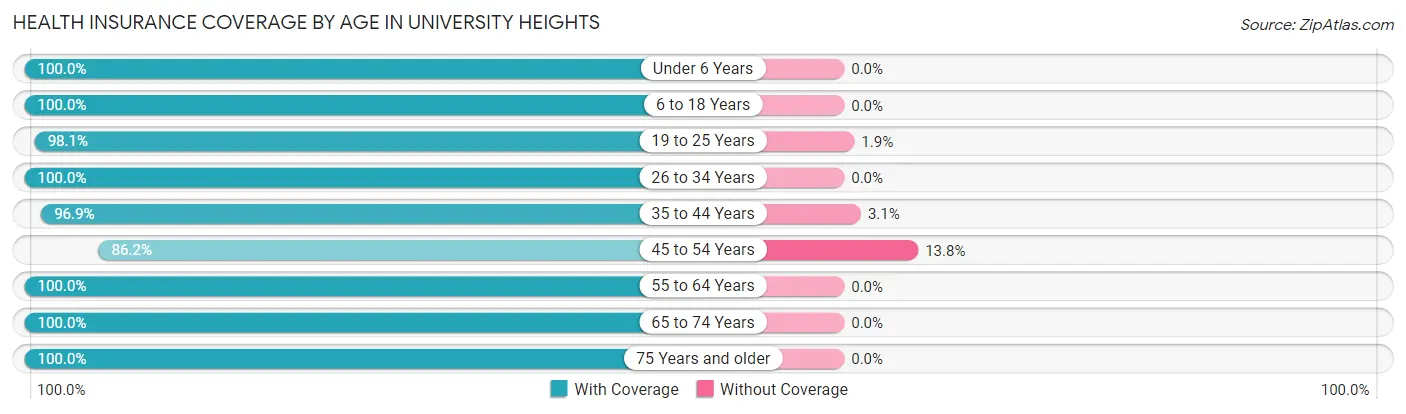
| Age Bracket | With Coverage | Without Coverage |
| Under 6 Years | 123 (100.0%) | 0 (0.0%) |
| 6 to 18 Years | 194 (100.0%) | 0 (0.0%) |
| 19 to 25 Years | 311 (98.1%) | 6 (1.9%) |
| 26 to 34 Years | 216 (100.0%) | 0 (0.0%) |
| 35 to 44 Years | 156 (96.9%) | 5 (3.1%) |
| 45 to 54 Years | 50 (86.2%) | 8 (13.8%) |
| 55 to 64 Years | 167 (100.0%) | 0 (0.0%) |
| 65 to 74 Years | 71 (100.0%) | 0 (0.0%) |
| 75 Years and older | 46 (100.0%) | 0 (0.0%) |
| Total | 1,334 (98.6%) | 19 (1.4%) |
Health Insurance Coverage by Citizenship Status in University Heights
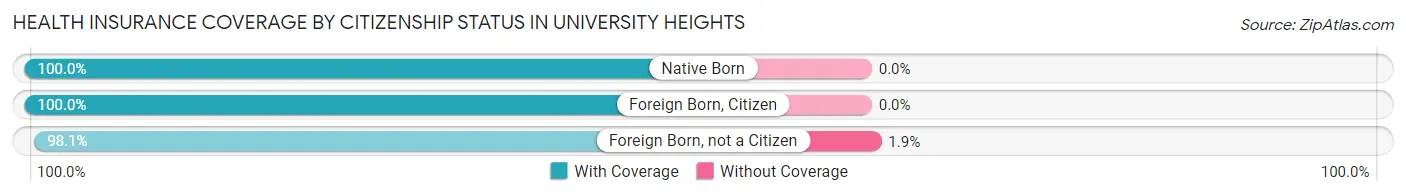
| Citizenship Status | With Coverage | Without Coverage |
| Native Born | 123 (100.0%) | 0 (0.0%) |
| Foreign Born, Citizen | 194 (100.0%) | 0 (0.0%) |
| Foreign Born, not a Citizen | 311 (98.1%) | 6 (1.9%) |
Health Insurance Coverage by Household Income in University Heights
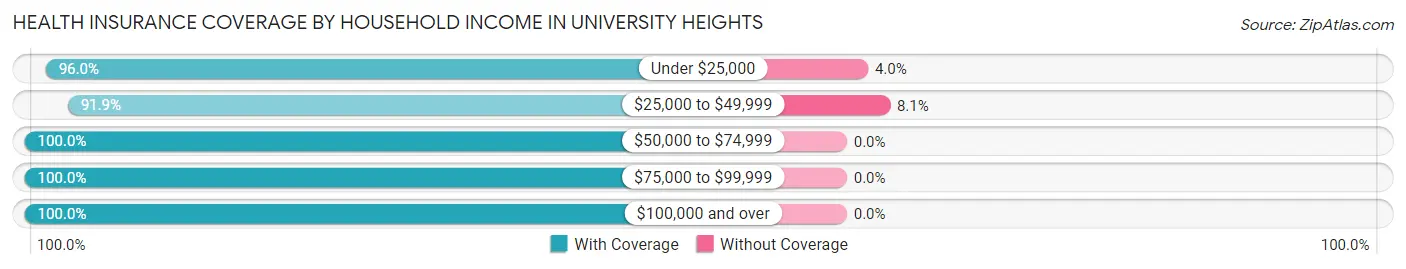
| Household Income | With Coverage | Without Coverage |
| Under $25,000 | 194 (96.0%) | 8 (4.0%) |
| $25,000 to $49,999 | 125 (91.9%) | 11 (8.1%) |
| $50,000 to $74,999 | 91 (100.0%) | 0 (0.0%) |
| $75,000 to $99,999 | 49 (100.0%) | 0 (0.0%) |
| $100,000 and over | 875 (100.0%) | 0 (0.0%) |
Public vs Private Health Insurance Coverage by Age in University Heights
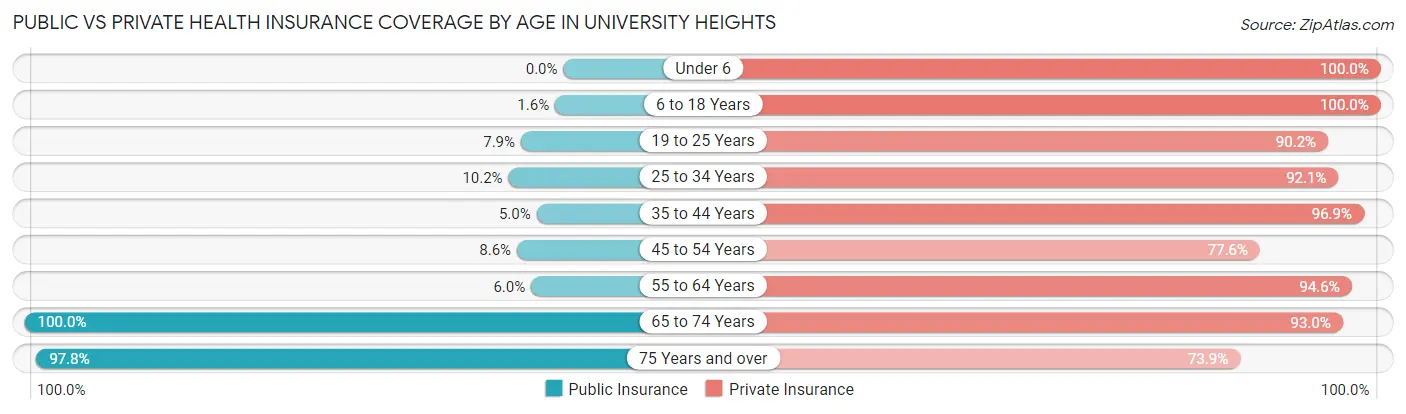
| Age Bracket | Public Insurance | Private Insurance |
| Under 6 | 0 (0.0%) | 123 (100.0%) |
| 6 to 18 Years | 3 (1.5%) | 194 (100.0%) |
| 19 to 25 Years | 25 (7.9%) | 286 (90.2%) |
| 25 to 34 Years | 22 (10.2%) | 199 (92.1%) |
| 35 to 44 Years | 8 (5.0%) | 156 (96.9%) |
| 45 to 54 Years | 5 (8.6%) | 45 (77.6%) |
| 55 to 64 Years | 10 (6.0%) | 158 (94.6%) |
| 65 to 74 Years | 71 (100.0%) | 66 (93.0%) |
| 75 Years and over | 45 (97.8%) | 34 (73.9%) |
| Total | 189 (14.0%) | 1,261 (93.2%) |
Disability Status by Sex by Age in University Heights
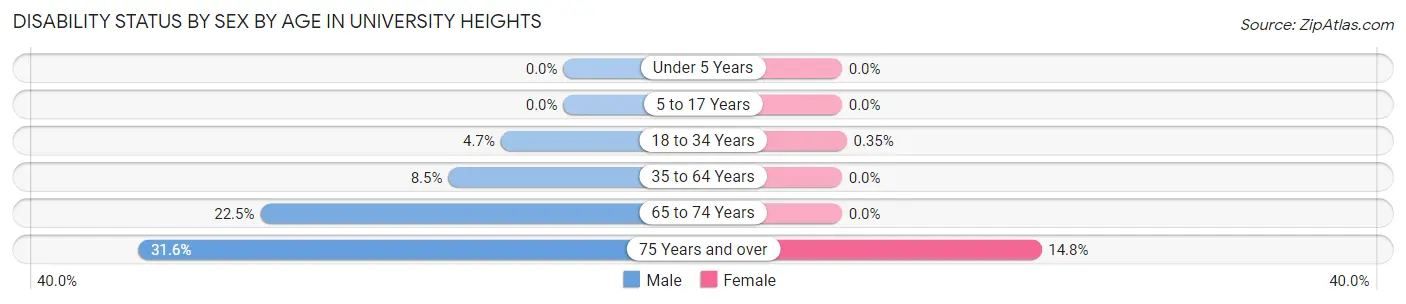
| Age Bracket | Male | Female |
| Under 5 Years | 0 (0.0%) | 0 (0.0%) |
| 5 to 17 Years | 0 (0.0%) | 0 (0.0%) |
| 18 to 34 Years | 12 (4.6%) | 1 (0.4%) |
| 35 to 64 Years | 17 (8.5%) | 0 (0.0%) |
| 65 to 74 Years | 9 (22.5%) | 0 (0.0%) |
| 75 Years and over | 6 (31.6%) | 4 (14.8%) |
Disability Class by Sex by Age in University Heights
Disability Class: Hearing Difficulty
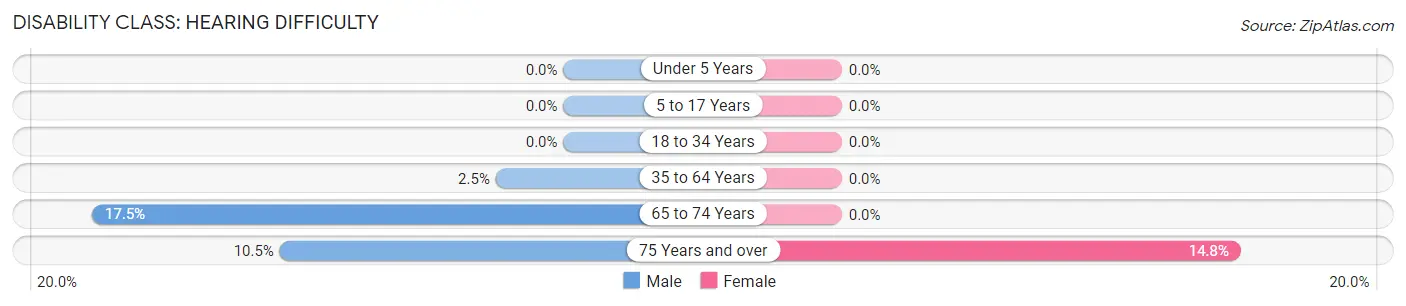
| Age Bracket | Male | Female |
| Under 5 Years | 0 (0.0%) | 0 (0.0%) |
| 5 to 17 Years | 0 (0.0%) | 0 (0.0%) |
| 18 to 34 Years | 0 (0.0%) | 0 (0.0%) |
| 35 to 64 Years | 5 (2.5%) | 0 (0.0%) |
| 65 to 74 Years | 7 (17.5%) | 0 (0.0%) |
| 75 Years and over | 2 (10.5%) | 4 (14.8%) |
Disability Class: Vision Difficulty
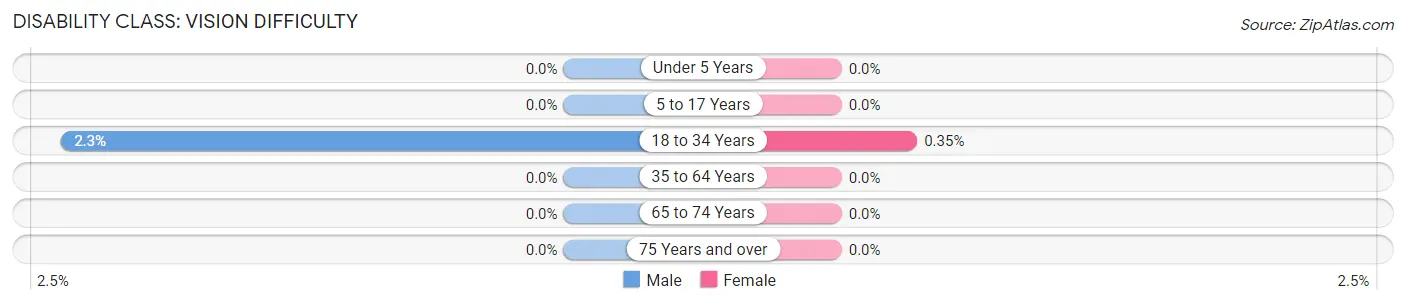
| Age Bracket | Male | Female |
| Under 5 Years | 0 (0.0%) | 0 (0.0%) |
| 5 to 17 Years | 0 (0.0%) | 0 (0.0%) |
| 18 to 34 Years | 6 (2.3%) | 1 (0.4%) |
| 35 to 64 Years | 0 (0.0%) | 0 (0.0%) |
| 65 to 74 Years | 0 (0.0%) | 0 (0.0%) |
| 75 Years and over | 0 (0.0%) | 0 (0.0%) |
Disability Class: Cognitive Difficulty
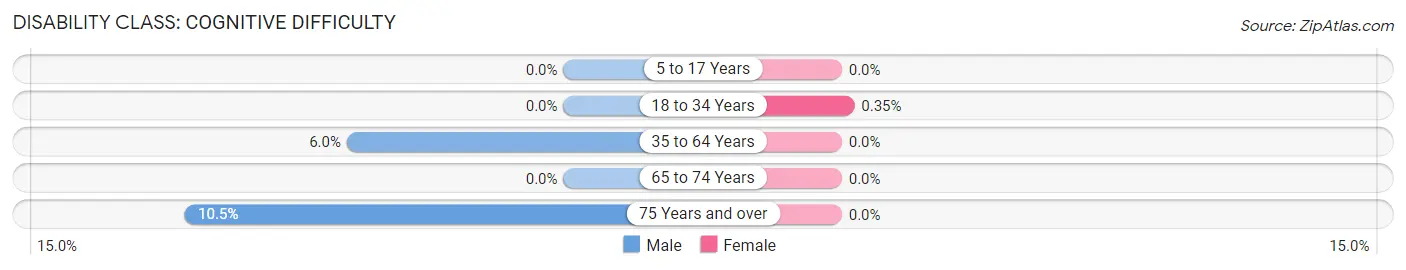
| Age Bracket | Male | Female |
| 5 to 17 Years | 0 (0.0%) | 0 (0.0%) |
| 18 to 34 Years | 0 (0.0%) | 1 (0.4%) |
| 35 to 64 Years | 12 (6.0%) | 0 (0.0%) |
| 65 to 74 Years | 0 (0.0%) | 0 (0.0%) |
| 75 Years and over | 2 (10.5%) | 0 (0.0%) |
Disability Class: Ambulatory Difficulty
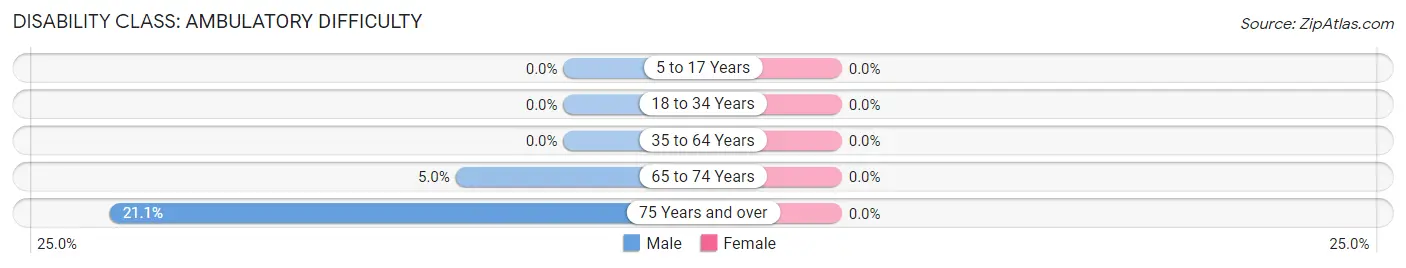
| Age Bracket | Male | Female |
| 5 to 17 Years | 0 (0.0%) | 0 (0.0%) |
| 18 to 34 Years | 0 (0.0%) | 0 (0.0%) |
| 35 to 64 Years | 0 (0.0%) | 0 (0.0%) |
| 65 to 74 Years | 2 (5.0%) | 0 (0.0%) |
| 75 Years and over | 4 (21.0%) | 0 (0.0%) |
Disability Class: Self-Care Difficulty
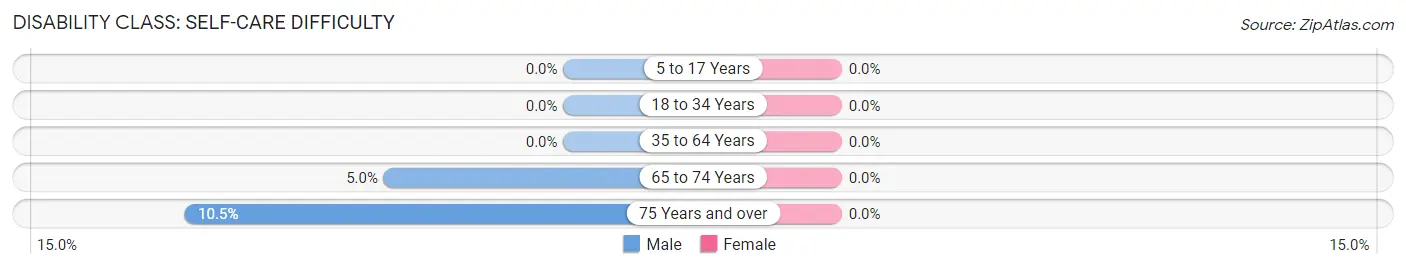
| Age Bracket | Male | Female |
| 5 to 17 Years | 0 (0.0%) | 0 (0.0%) |
| 18 to 34 Years | 0 (0.0%) | 0 (0.0%) |
| 35 to 64 Years | 0 (0.0%) | 0 (0.0%) |
| 65 to 74 Years | 2 (5.0%) | 0 (0.0%) |
| 75 Years and over | 2 (10.5%) | 0 (0.0%) |
Technology Access in University Heights
Computing Device Access in University Heights
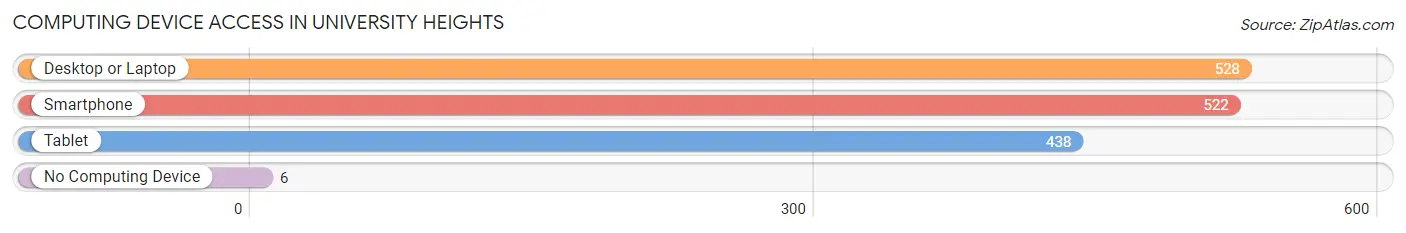
| Device Type | # Households | % Households |
| Desktop or Laptop | 528 | 95.7% |
| Smartphone | 522 | 94.6% |
| Tablet | 438 | 79.3% |
| No Computing Device | 6 | 1.1% |
| Total | 552 | 100.0% |
Internet Access in University Heights
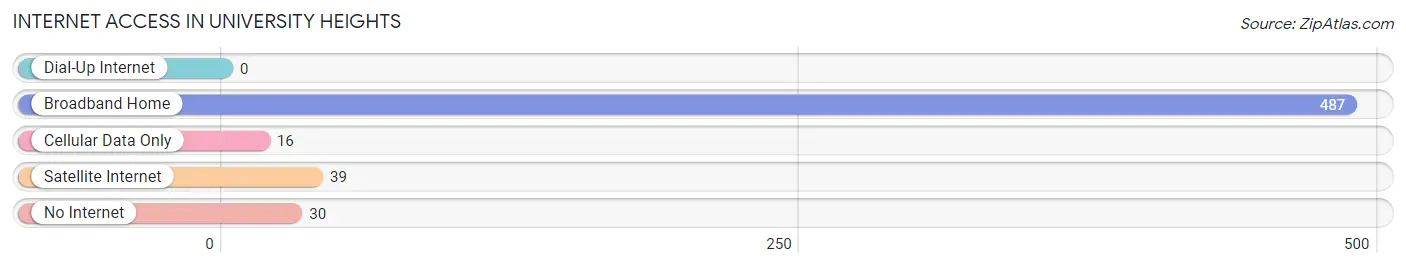
| Internet Type | # Households | % Households |
| Dial-Up Internet | 0 | 0.0% |
| Broadband Home | 487 | 88.2% |
| Cellular Data Only | 16 | 2.9% |
| Satellite Internet | 39 | 7.1% |
| No Internet | 30 | 5.4% |
| Total | 552 | 100.0% |
University Heights Summary
History
University Heights is a city located in Johnson County, Iowa, United States. It is part of the Iowa City, Coralville, and North Liberty Metropolitan Statistical Area. The city was incorporated in 1959 and is home to the University of Iowa.
The area that is now University Heights was originally inhabited by the Meskwaki Native Americans. The first settlers arrived in the area in the early 1800s, and the first post office was established in 1854. The area was known as "College Township" until it was incorporated as University Heights in 1959.
The city was named after the University of Iowa, which was founded in 1847. The university has been a major influence on the city since its founding. The university has provided jobs and economic growth to the city, as well as educational opportunities for its residents.
Geography
University Heights is located in Johnson County, Iowa, United States. It is part of the Iowa City, Coralville, and North Liberty Metropolitan Statistical Area. The city is situated on the west side of the Iowa River, and is bordered by the cities of Iowa City, Coralville, and North Liberty.
The city has a total area of 1.3 square miles, all of which is land. The terrain is mostly flat, with some rolling hills. The city is located in the Central Lowland region of the United States, and is part of the Driftless Area.
Economy
University Heights is a small city with a population of just over 4,000 people. The city is home to the University of Iowa, which is the largest employer in the city. The university provides jobs for many of the city's residents, as well as educational opportunities.
The city also has a number of small businesses, including restaurants, retail stores, and professional services. The city is also home to a number of medical facilities, including the University of Iowa Hospitals and Clinics.
Demographics
As of the 2010 census, the population of University Heights was 4,093. The racial makeup of the city was 87.3% White, 5.2% African American, 0.3% Native American, 3.2% Asian, 0.1% Pacific Islander, 1.2% from other races, and 2.9% from two or more races. Hispanic or Latino of any race were 4.2% of the population.
The median household income in University Heights was $50,945, and the median family income was $63,917. The per capita income for the city was $25,945. About 8.2% of families and 11.2% of the population were below the poverty line, including 15.2% of those under age 18 and 4.2% of those age 65 or over.
Common Questions
What is Per Capita Income in University Heights?
Per Capita income in University Heights is $73,766.
What is the Median Family Income in University Heights?
Median Family Income in University Heights is $151,250.
What is the Median Household income in University Heights?
Median Household Income in University Heights is $102,838.
What is Income or Wage Gap in University Heights?
Income or Wage Gap in University Heights is 21.5%.
Women in University Heights earn 78.5 cents for every dollar earned by a man.
What is Inequality or Gini Index in University Heights?
Inequality or Gini Index in University Heights is 0.64.
What is the Total Population of University Heights?
Total Population of University Heights is 1,353.
What is the Total Male Population of University Heights?
Total Male Population of University Heights is 671.
What is the Total Female Population of University Heights?
Total Female Population of University Heights is 682.
What is the Ratio of Males per 100 Females in University Heights?
There are 98.39 Males per 100 Females in University Heights.
What is the Ratio of Females per 100 Males in University Heights?
There are 101.64 Females per 100 Males in University Heights.
What is the Median Population Age in University Heights?
Median Population Age in University Heights is 27.5 Years.
What is the Average Family Size in University Heights
Average Family Size in University Heights is 3.2 People.
What is the Average Household Size in University Heights
Average Household Size in University Heights is 2.5 People.
How Large is the Labor Force in University Heights?
There are 748 People in the Labor Forcein in University Heights.
What is the Percentage of People in the Labor Force in University Heights?
71.2% of People are in the Labor Force in University Heights.
What is the Unemployment Rate in University Heights?
Unemployment Rate in University Heights is 1.6%.