Ribera, NM Map & Demographics
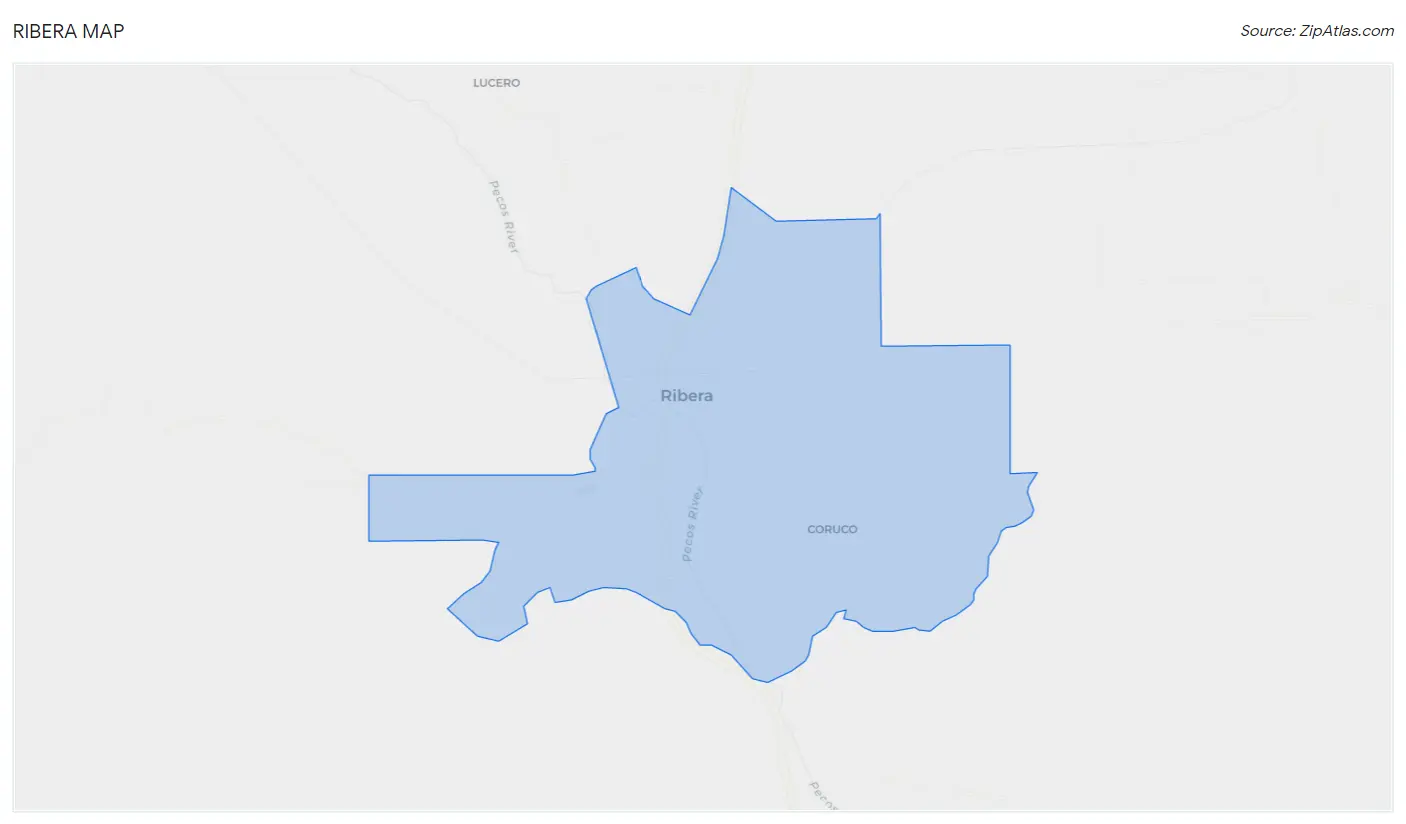
Ribera Map
Ribera Overview
$21,135
PER CAPITA INCOME
$47,237
AVG HOUSEHOLD INCOME
0.29
INEQUALITY / GINI INDEX
330
TOTAL POPULATION
179
MALE POPULATION
151
FEMALE POPULATION
118.54
MALES / 100 FEMALES
84.36
FEMALES / 100 MALES
30.2
MEDIAN AGE
3.1
AVG FAMILY SIZE
2.3
AVG HOUSEHOLD SIZE
164
LABOR FORCE [ PEOPLE ]
57.7%
PERCENT IN LABOR FORCE
23.2%
UNEMPLOYMENT RATE
Ribera Zip Codes
Ribera Area Codes
Income in Ribera
Income Overview in Ribera
| Characteristic | Number | Measure |
| Per Capita Income | 330 | $21,135 |
| Median Family Income | 73 | $0 |
| Mean Family Income | 73 | $0 |
| Median Household Income | 138 | $47,237 |
| Mean Household Income | 138 | $53,438 |
| Income Deficit | 73 | $0 |
| Wage / Income Gap (%) | 330 | 0.00% |
| Wage / Income Gap ($) | 330 | 100.00¢ per $1 |
| Gini / Inequality Index | 330 | 0.29 |
Earnings by Sex in Ribera
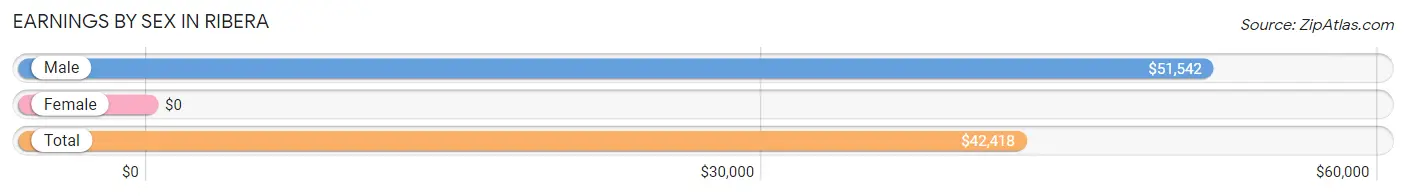
| Sex | Number | Average Earnings |
| Male | 93 (69.4%) | $51,542 |
| Female | 41 (30.6%) | $0 |
| Total | 134 (100.0%) | $42,418 |
Earnings by Sex by Income Bracket in Ribera
The most common earnings brackets in Ribera are $55,000 to $64,999 for men (35 | 37.6%) and $40,000 to $44,999 for women (37 | 90.2%).
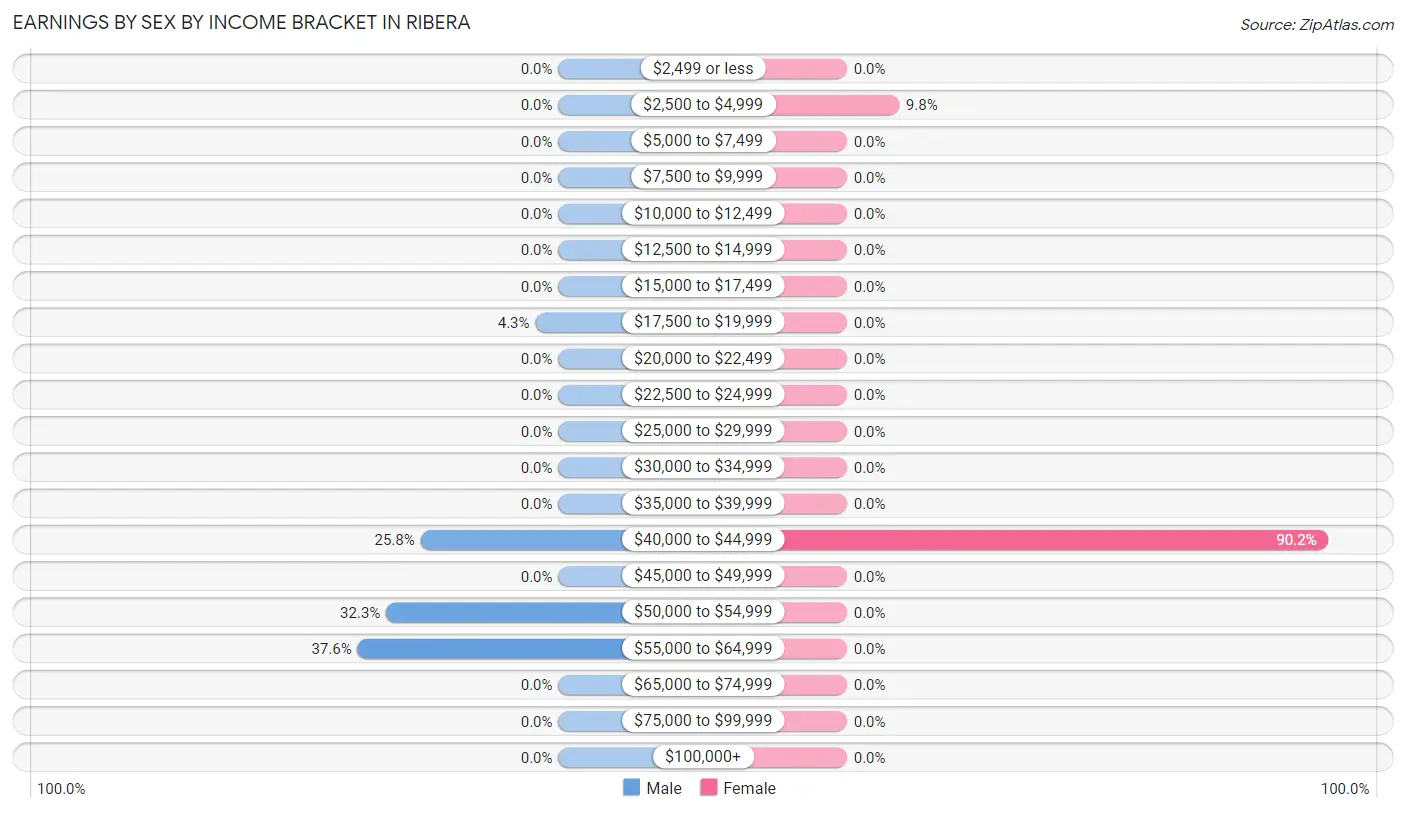
| Income | Male | Female |
| $2,499 or less | 0 (0.0%) | 0 (0.0%) |
| $2,500 to $4,999 | 0 (0.0%) | 4 (9.8%) |
| $5,000 to $7,499 | 0 (0.0%) | 0 (0.0%) |
| $7,500 to $9,999 | 0 (0.0%) | 0 (0.0%) |
| $10,000 to $12,499 | 0 (0.0%) | 0 (0.0%) |
| $12,500 to $14,999 | 0 (0.0%) | 0 (0.0%) |
| $15,000 to $17,499 | 0 (0.0%) | 0 (0.0%) |
| $17,500 to $19,999 | 4 (4.3%) | 0 (0.0%) |
| $20,000 to $22,499 | 0 (0.0%) | 0 (0.0%) |
| $22,500 to $24,999 | 0 (0.0%) | 0 (0.0%) |
| $25,000 to $29,999 | 0 (0.0%) | 0 (0.0%) |
| $30,000 to $34,999 | 0 (0.0%) | 0 (0.0%) |
| $35,000 to $39,999 | 0 (0.0%) | 0 (0.0%) |
| $40,000 to $44,999 | 24 (25.8%) | 37 (90.2%) |
| $45,000 to $49,999 | 0 (0.0%) | 0 (0.0%) |
| $50,000 to $54,999 | 30 (32.3%) | 0 (0.0%) |
| $55,000 to $64,999 | 35 (37.6%) | 0 (0.0%) |
| $65,000 to $74,999 | 0 (0.0%) | 0 (0.0%) |
| $75,000 to $99,999 | 0 (0.0%) | 0 (0.0%) |
| $100,000+ | 0 (0.0%) | 0 (0.0%) |
| Total | 93 (100.0%) | 41 (100.0%) |
Earnings by Sex by Educational Attainment in Ribera
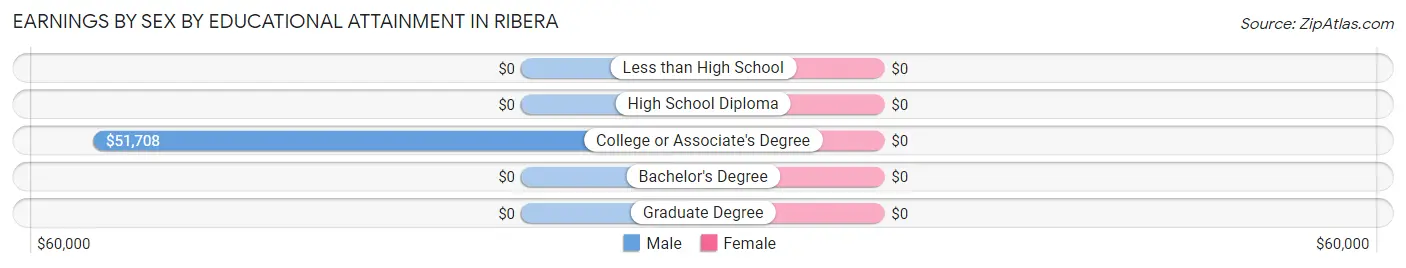
| Educational Attainment | Male Income | Female Income |
| Less than High School | - | - |
| High School Diploma | - | - |
| College or Associate's Degree | $51,708 | $0 |
| Bachelor's Degree | - | - |
| Graduate Degree | - | - |
| Total | $51,542 | $0 |
Family Income in Ribera
Family Income Brackets in Ribera
According to the Ribera family income data, there are 38 families falling into the less than $10,000 income range, which is the most common income bracket and makes up 52.0% of all families.
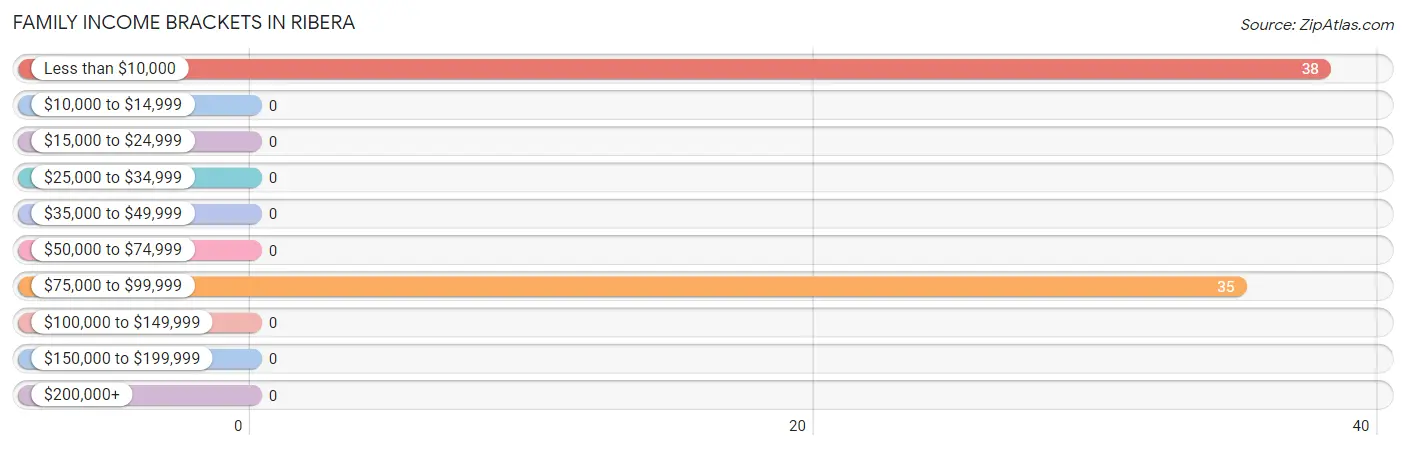
| Income Bracket | # Families | % Families |
| Less than $10,000 | 38 | 52.1% |
| $10,000 to $14,999 | 0 | 0.0% |
| $15,000 to $24,999 | 0 | 0.0% |
| $25,000 to $34,999 | 0 | 0.0% |
| $35,000 to $49,999 | 0 | 0.0% |
| $50,000 to $74,999 | 0 | 0.0% |
| $75,000 to $99,999 | 35 | 47.9% |
| $100,000 to $149,999 | 0 | 0.0% |
| $150,000 to $199,999 | 0 | 0.0% |
| $200,000+ | 0 | 0.0% |
Family Income by Famaliy Size in Ribera
| Income Bracket | # Families | Median Income |
| 2-Person Families | 38 (52.0%) | $0 |
| 3-Person Families | 0 (0.0%) | $0 |
| 4-Person Families | 35 (47.9%) | $0 |
| 5-Person Families | 0 (0.0%) | $0 |
| 6-Person Families | 0 (0.0%) | $0 |
| 7+ Person Families | 0 (0.0%) | $0 |
| Total | 73 (100.0%) | $0 |
Family Income by Number of Earners in Ribera
| Number of Earners | # Families | Median Income |
| No Earners | 38 (52.0%) | $0 |
| 1 Earner | 0 (0.0%) | $0 |
| 2 Earners | 35 (47.9%) | $0 |
| 3+ Earners | 0 (0.0%) | $0 |
| Total | 73 (100.0%) | $0 |
Household Income in Ribera
Household Income Brackets in Ribera
With 38 households falling in the category, the $35,000 to $49,999 income range is the most frequent in Ribera, accounting for 27.5% of all households.
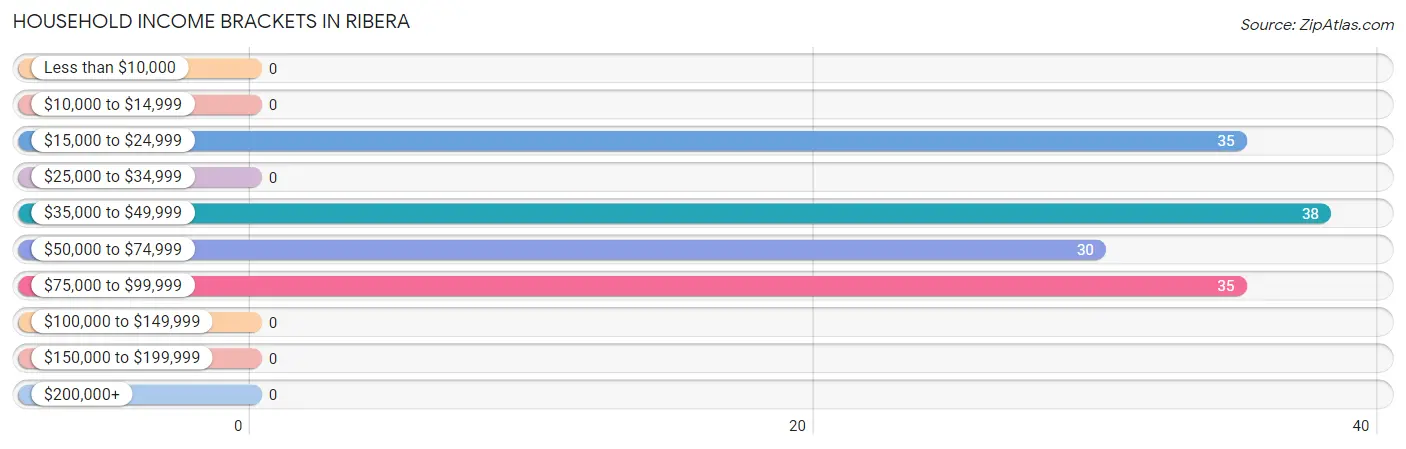
| Income Bracket | # Households | % Households |
| Less than $10,000 | 0 | 0.0% |
| $10,000 to $14,999 | 0 | 0.0% |
| $15,000 to $24,999 | 35 | 25.4% |
| $25,000 to $34,999 | 0 | 0.0% |
| $35,000 to $49,999 | 38 | 27.5% |
| $50,000 to $74,999 | 30 | 21.7% |
| $75,000 to $99,999 | 35 | 25.4% |
| $100,000 to $149,999 | 0 | 0.0% |
| $150,000 to $199,999 | 0 | 0.0% |
| $200,000+ | 0 | 0.0% |
Household Income by Householder Age in Ribera
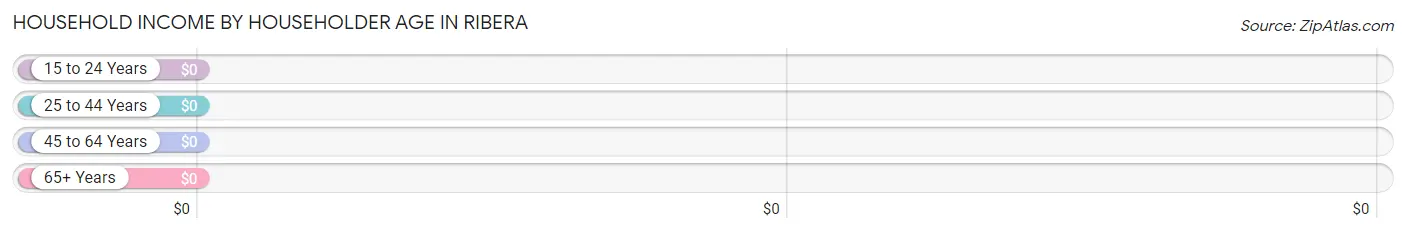
| Income Bracket | # Households | Median Income |
| 15 to 24 Years | 38 (27.5%) | $0 |
| 25 to 44 Years | 0 (0.0%) | $0 |
| 45 to 64 Years | 65 (47.1%) | $0 |
| 65+ Years | 35 (25.4%) | $0 |
| Total | 138 (100.0%) | $47,237 |
Poverty in Ribera
Income Below Poverty by Sex and Age in Ribera
With 27.7% poverty level for males and 25.9% for females among the residents of Ribera, under 5 year old males and 18 to 24 year old females are the most vulnerable to poverty, with 46 males (100.0%) and 38 females (50.7%) in their respective age groups living below the poverty level.
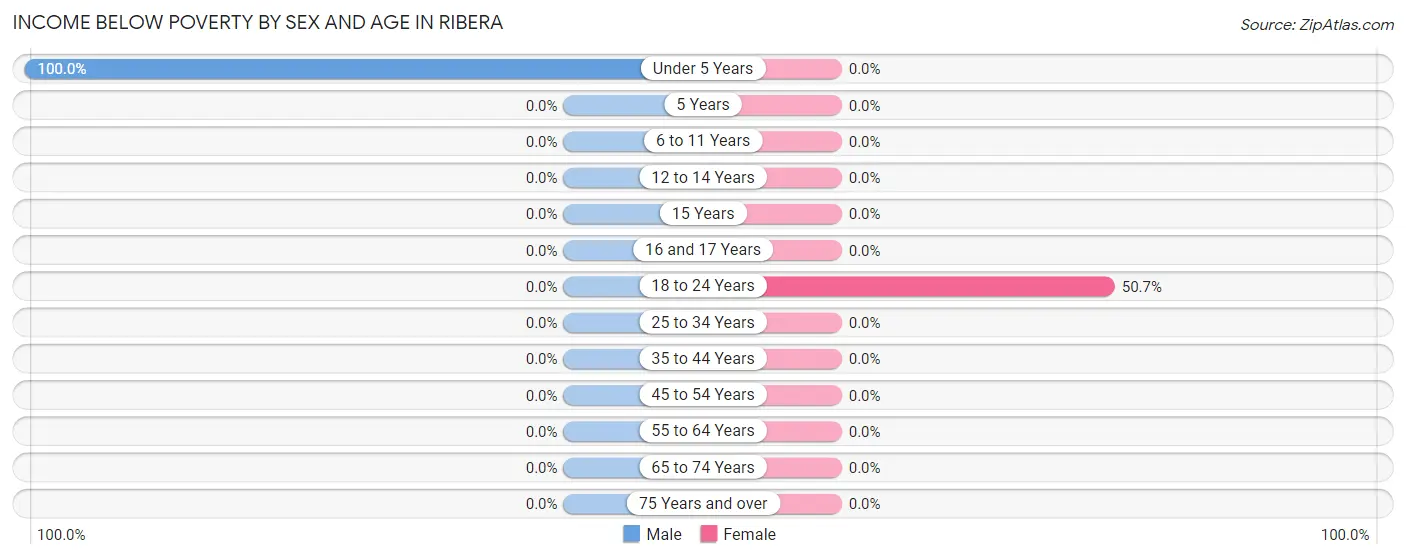
| Age Bracket | Male | Female |
| Under 5 Years | 46 (100.0%) | 0 (0.0%) |
| 5 Years | 0 (0.0%) | 0 (0.0%) |
| 6 to 11 Years | 0 (0.0%) | 0 (0.0%) |
| 12 to 14 Years | 0 (0.0%) | 0 (0.0%) |
| 15 Years | 0 (0.0%) | 0 (0.0%) |
| 16 and 17 Years | 0 (0.0%) | 0 (0.0%) |
| 18 to 24 Years | 0 (0.0%) | 38 (50.7%) |
| 25 to 34 Years | 0 (0.0%) | 0 (0.0%) |
| 35 to 44 Years | 0 (0.0%) | 0 (0.0%) |
| 45 to 54 Years | 0 (0.0%) | 0 (0.0%) |
| 55 to 64 Years | 0 (0.0%) | 0 (0.0%) |
| 65 to 74 Years | 0 (0.0%) | 0 (0.0%) |
| 75 Years and over | 0 (0.0%) | 0 (0.0%) |
| Total | 46 (27.7%) | 38 (25.9%) |
Income Above Poverty by Sex and Age in Ribera
According to the poverty statistics in Ribera, males aged 16 and 17 years and females aged 35 to 44 years are the age groups that are most secure financially, with 100.0% of males and 100.0% of females in these age groups living above the poverty line.
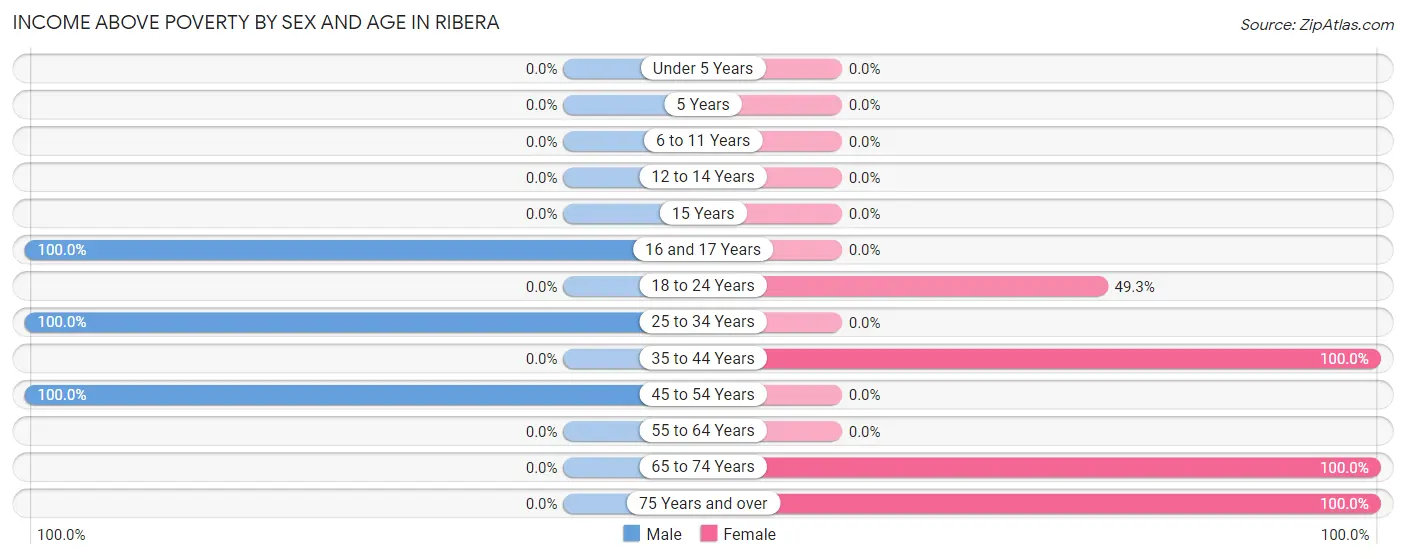
| Age Bracket | Male | Female |
| Under 5 Years | 0 (0.0%) | 0 (0.0%) |
| 5 Years | 0 (0.0%) | 0 (0.0%) |
| 6 to 11 Years | 0 (0.0%) | 0 (0.0%) |
| 12 to 14 Years | 0 (0.0%) | 0 (0.0%) |
| 15 Years | 0 (0.0%) | 0 (0.0%) |
| 16 and 17 Years | 31 (100.0%) | 0 (0.0%) |
| 18 to 24 Years | 0 (0.0%) | 37 (49.3%) |
| 25 to 34 Years | 24 (100.0%) | 0 (0.0%) |
| 35 to 44 Years | 0 (0.0%) | 37 (100.0%) |
| 45 to 54 Years | 65 (100.0%) | 0 (0.0%) |
| 55 to 64 Years | 0 (0.0%) | 0 (0.0%) |
| 65 to 74 Years | 0 (0.0%) | 1 (100.0%) |
| 75 Years and over | 0 (0.0%) | 34 (100.0%) |
| Total | 120 (72.3%) | 109 (74.2%) |
Income Below Poverty Among Married-Couple Families in Ribera
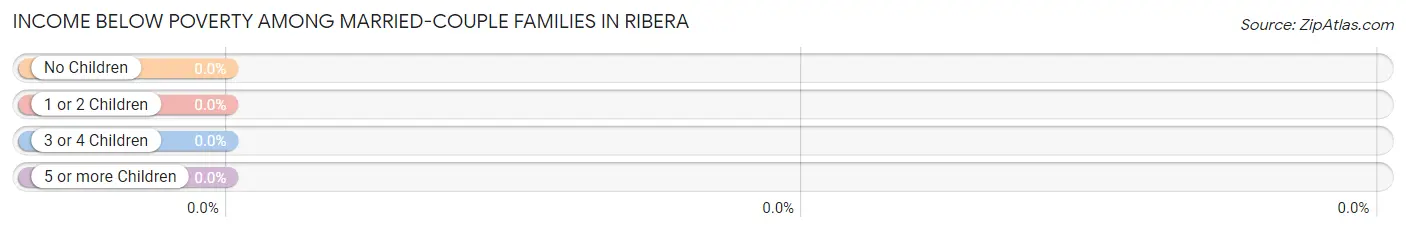
| Children | Above Poverty | Below Poverty |
| No Children | 0 (0.0%) | 0 (0.0%) |
| 1 or 2 Children | 35 (100.0%) | 0 (0.0%) |
| 3 or 4 Children | 0 (0.0%) | 0 (0.0%) |
| 5 or more Children | 0 (0.0%) | 0 (0.0%) |
| Total | 35 (100.0%) | 0 (0.0%) |
Income Below Poverty Among Single-Parent Households in Ribera
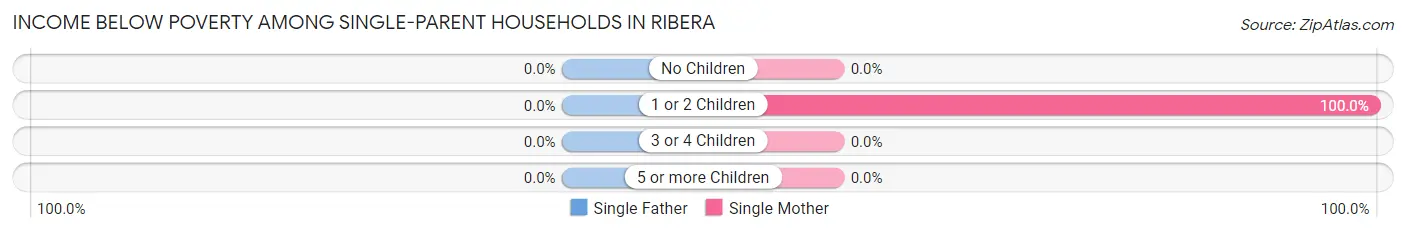
| Children | Single Father | Single Mother |
| No Children | 0 (0.0%) | 0 (0.0%) |
| 1 or 2 Children | 0 (0.0%) | 38 (100.0%) |
| 3 or 4 Children | 0 (0.0%) | 0 (0.0%) |
| 5 or more Children | 0 (0.0%) | 0 (0.0%) |
| Total | 0 (0.0%) | 38 (100.0%) |
Income Below Poverty Among Married-Couple vs Single-Parent Households in Ribera
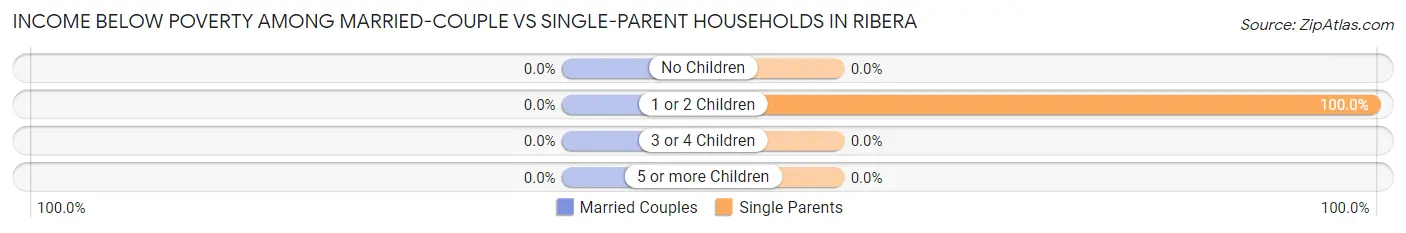
| Children | Married-Couple Families | Single-Parent Households |
| No Children | 0 (0.0%) | 0 (0.0%) |
| 1 or 2 Children | 0 (0.0%) | 38 (100.0%) |
| 3 or 4 Children | 0 (0.0%) | 0 (0.0%) |
| 5 or more Children | 0 (0.0%) | 0 (0.0%) |
| Total | 0 (0.0%) | 38 (100.0%) |
Race in Ribera
The most populous races in Ribera are Hispanic or Latino (234 | 70.9%), White / Caucasian (154 | 46.7%), and Some other Race (146 | 44.2%).
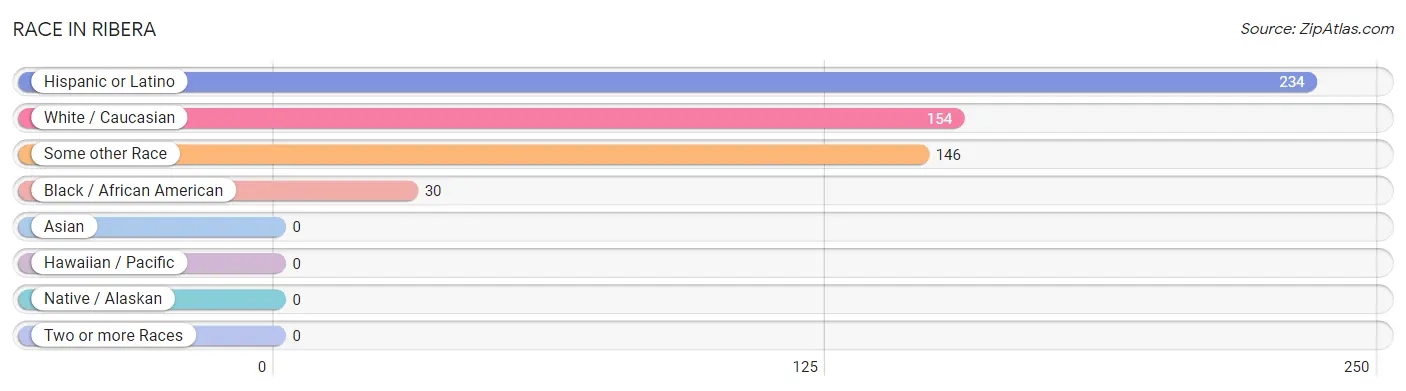
| Race | # Population | % Population |
| Asian | 0 | 0.0% |
| Black / African American | 30 | 9.1% |
| Hawaiian / Pacific | 0 | 0.0% |
| Hispanic or Latino | 234 | 70.9% |
| Native / Alaskan | 0 | 0.0% |
| White / Caucasian | 154 | 46.7% |
| Two or more Races | 0 | 0.0% |
| Some other Race | 146 | 44.2% |
| Total | 330 | 100.0% |
Ancestry in Ribera
The most populous ancestries reported in Ribera are Italian (70 | 21.2%), German (38 | 11.5%), Mexican (10 | 3.0%), Norwegian (4 | 1.2%), and Scotch-Irish (4 | 1.2%), together accounting for 38.2% of all Ribera residents.
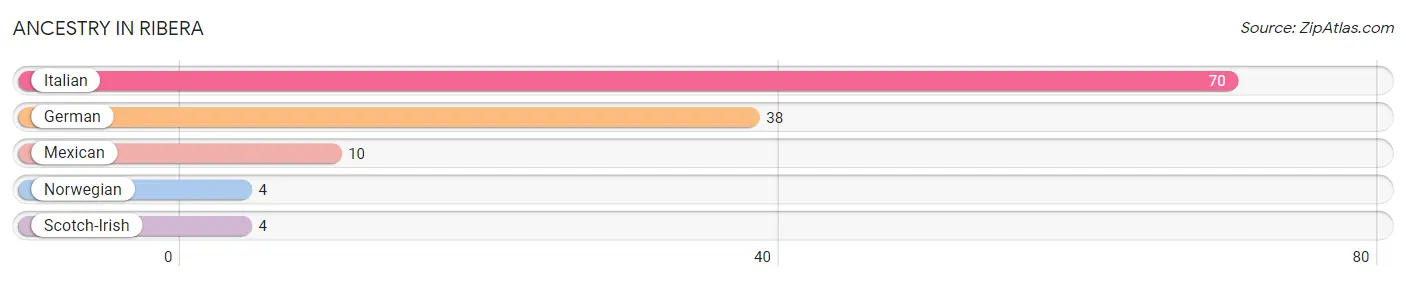
| Ancestry | # Population | % Population |
| German | 38 | 11.5% |
| Italian | 70 | 21.2% |
| Mexican | 10 | 3.0% |
| Norwegian | 4 | 1.2% |
| Scotch-Irish | 4 | 1.2% | View All 5 Rows |
Immigrants in Ribera

| Immigration Origin | # Population | % Population | View All 0 Rows |
Sex and Age in Ribera
Sex and Age in Ribera
The most populous age groups in Ribera are Under 5 Years (46 | 25.7%) for men and 20 to 24 Years (79 | 52.3%) for women.
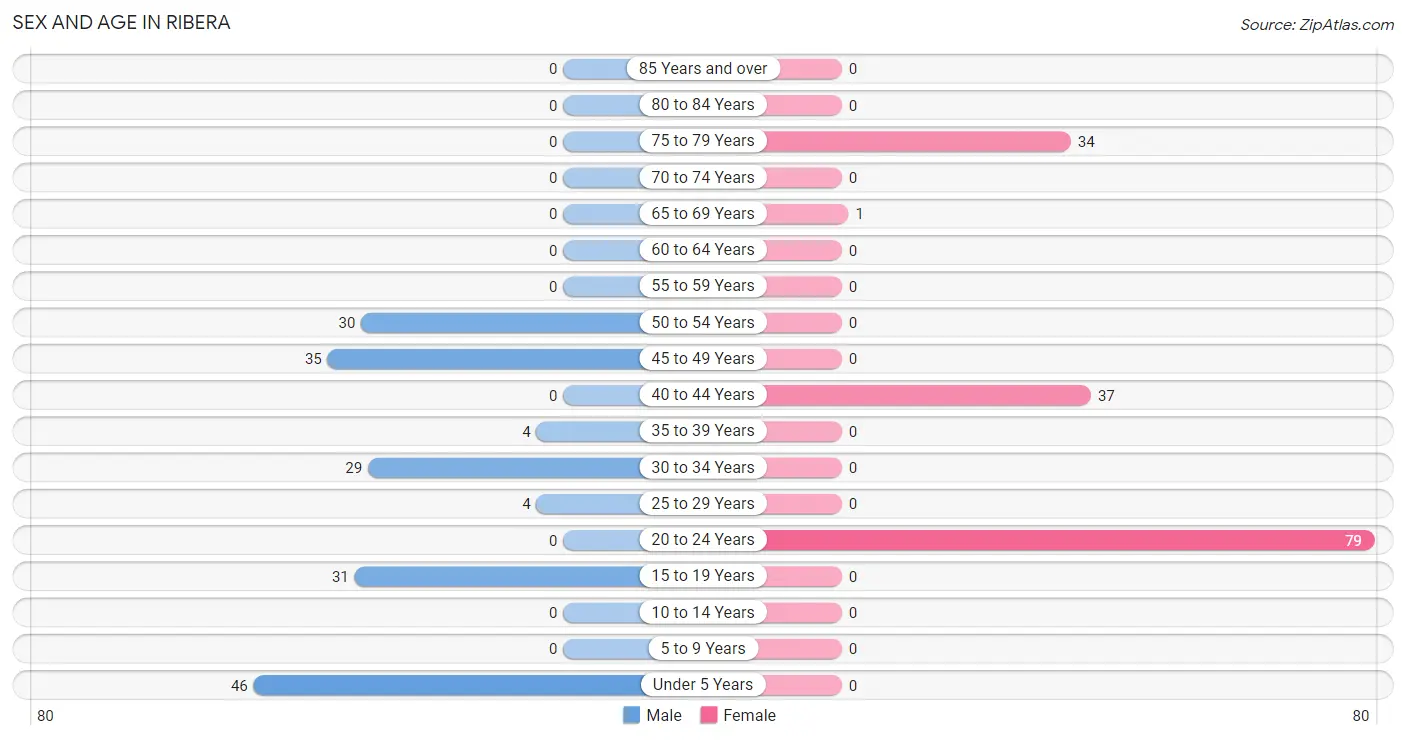
| Age Bracket | Male | Female |
| Under 5 Years | 46 (25.7%) | 0 (0.0%) |
| 5 to 9 Years | 0 (0.0%) | 0 (0.0%) |
| 10 to 14 Years | 0 (0.0%) | 0 (0.0%) |
| 15 to 19 Years | 31 (17.3%) | 0 (0.0%) |
| 20 to 24 Years | 0 (0.0%) | 79 (52.3%) |
| 25 to 29 Years | 4 (2.2%) | 0 (0.0%) |
| 30 to 34 Years | 29 (16.2%) | 0 (0.0%) |
| 35 to 39 Years | 4 (2.2%) | 0 (0.0%) |
| 40 to 44 Years | 0 (0.0%) | 37 (24.5%) |
| 45 to 49 Years | 35 (19.6%) | 0 (0.0%) |
| 50 to 54 Years | 30 (16.8%) | 0 (0.0%) |
| 55 to 59 Years | 0 (0.0%) | 0 (0.0%) |
| 60 to 64 Years | 0 (0.0%) | 0 (0.0%) |
| 65 to 69 Years | 0 (0.0%) | 1 (0.7%) |
| 70 to 74 Years | 0 (0.0%) | 0 (0.0%) |
| 75 to 79 Years | 0 (0.0%) | 34 (22.5%) |
| 80 to 84 Years | 0 (0.0%) | 0 (0.0%) |
| 85 Years and over | 0 (0.0%) | 0 (0.0%) |
| Total | 179 (100.0%) | 151 (100.0%) |
Families and Households in Ribera
Median Family Size in Ribera
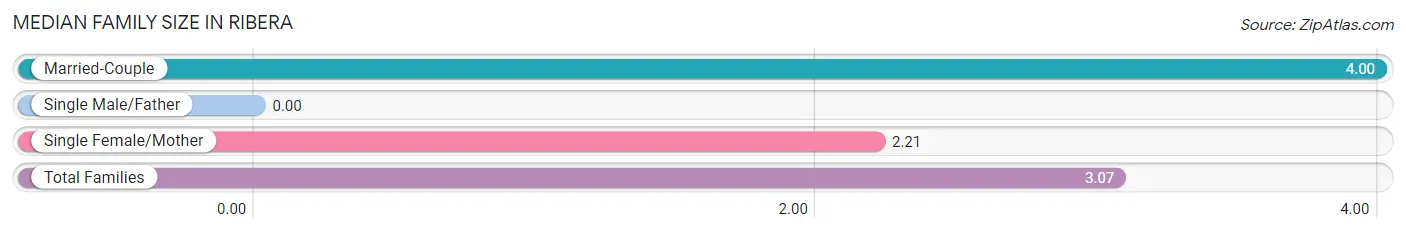
| Family Type | # Families | Family Size |
| Married-Couple | 35 (47.9%) | 4.00 |
| Single Male/Father | 0 (0.0%) | - |
| Single Female/Mother | 38 (52.0%) | 2.21 |
| Total Families | 73 (100.0%) | 3.07 |
Median Household Size in Ribera
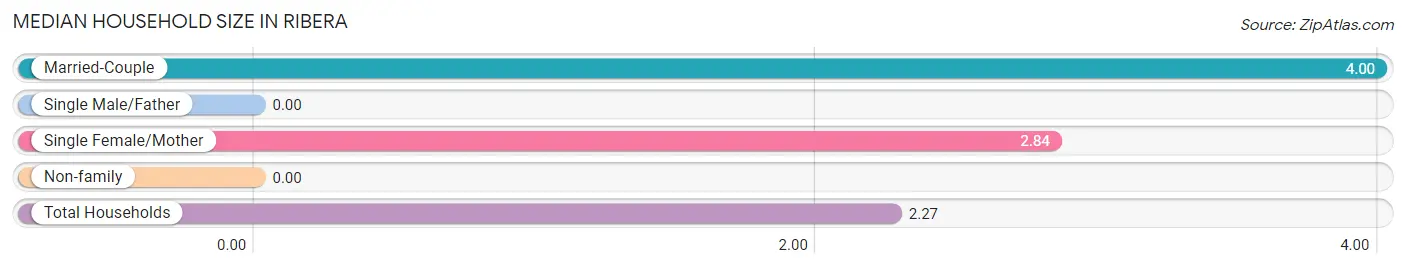
| Household Type | # Households | Household Size |
| Married-Couple | 35 (25.4%) | 4.00 |
| Single Male/Father | 0 (0.0%) | - |
| Single Female/Mother | 38 (27.5%) | 2.84 |
| Non-family | 65 (47.1%) | - |
| Total Households | 138 (100.0%) | 2.27 |
Household Size by Marriage Status in Ribera
Out of a total of 138 households in Ribera, 73 (52.9%) are family households, while 65 (47.1%) are nonfamily households. The most numerous type of family households are 3-person households, comprising 38, and the most common type of nonfamily households are 1-person households, comprising 65.
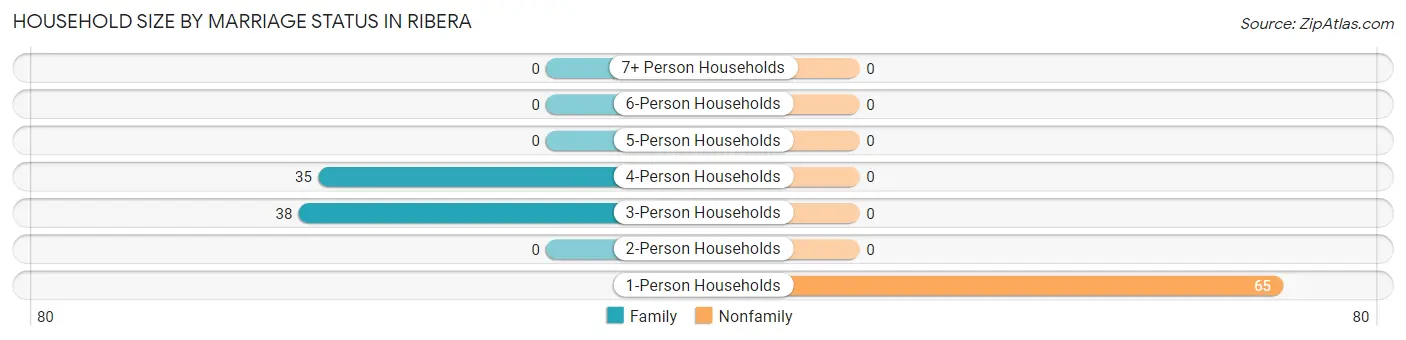
| Household Size | Family Households | Nonfamily Households |
| 1-Person Households | - | 65 (47.1%) |
| 2-Person Households | 0 (0.0%) | 0 (0.0%) |
| 3-Person Households | 38 (27.5%) | 0 (0.0%) |
| 4-Person Households | 35 (25.4%) | 0 (0.0%) |
| 5-Person Households | 0 (0.0%) | 0 (0.0%) |
| 6-Person Households | 0 (0.0%) | 0 (0.0%) |
| 7+ Person Households | 0 (0.0%) | 0 (0.0%) |
| Total | 73 (52.9%) | 65 (47.1%) |
Female Fertility in Ribera
Fertility by Age in Ribera
Average fertility rate in Ribera is 328.0 births per 1,000 women. Women in the age bracket of 20 to 34 years have the highest fertility rate with 481.0 births per 1,000 women. Women in the age bracket of 20 to 34 years acount for 100.0% of all women with births.
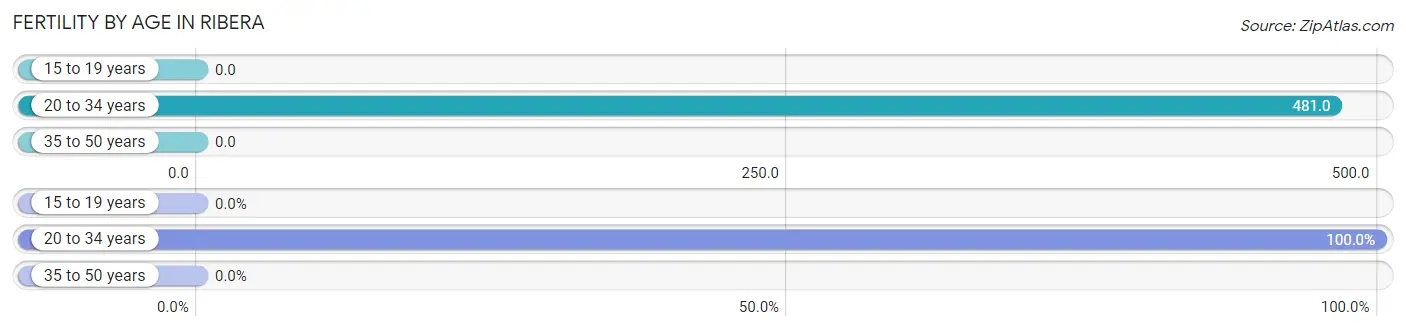
| Age Bracket | Women with Births | Births / 1,000 Women |
| 15 to 19 years | 0 (0.0%) | 0.0 |
| 20 to 34 years | 38 (100.0%) | 481.0 |
| 35 to 50 years | 0 (0.0%) | 0.0 |
| Total | 38 (100.0%) | 328.0 |
Fertility by Age by Marriage Status in Ribera
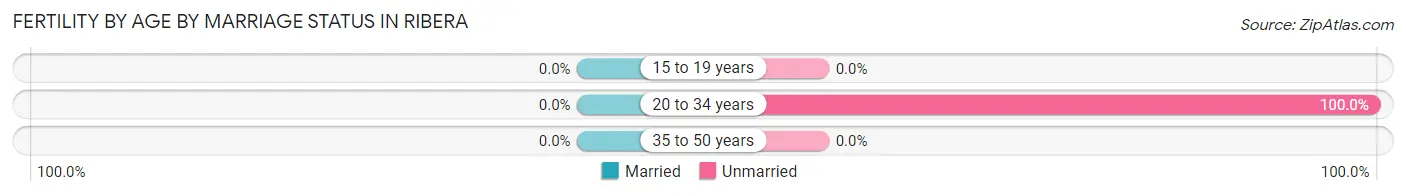
| Age Bracket | Married | Unmarried |
| 15 to 19 years | 0 (0.0%) | 0 (0.0%) |
| 20 to 34 years | 0 (0.0%) | 38 (100.0%) |
| 35 to 50 years | 0 (0.0%) | 0 (0.0%) |
| Total | 0 (0.0%) | 38 (100.0%) |
Fertility by Education in Ribera
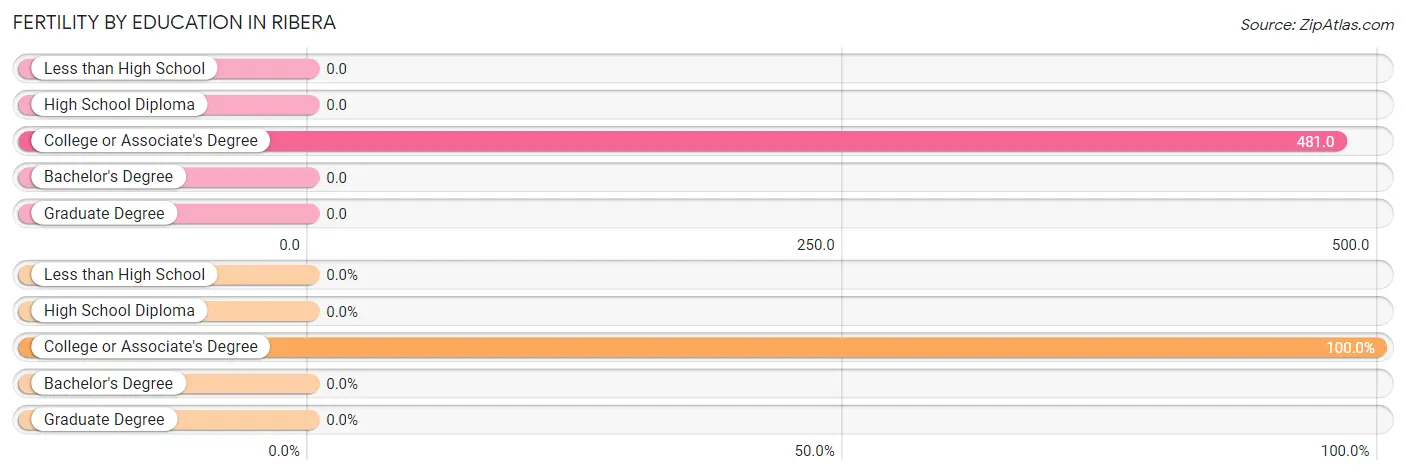
| Educational Attainment | Women with Births | Births / 1,000 Women |
| Less than High School | 0 (0.0%) | 0.0 |
| High School Diploma | 0 (0.0%) | 0.0 |
| College or Associate's Degree | 38 (100.0%) | 481.0 |
| Bachelor's Degree | 0 (0.0%) | 0.0 |
| Graduate Degree | 0 (0.0%) | 0.0 |
| Total | 38 (100.0%) | 328.0 |
Fertility by Education by Marriage Status in Ribera
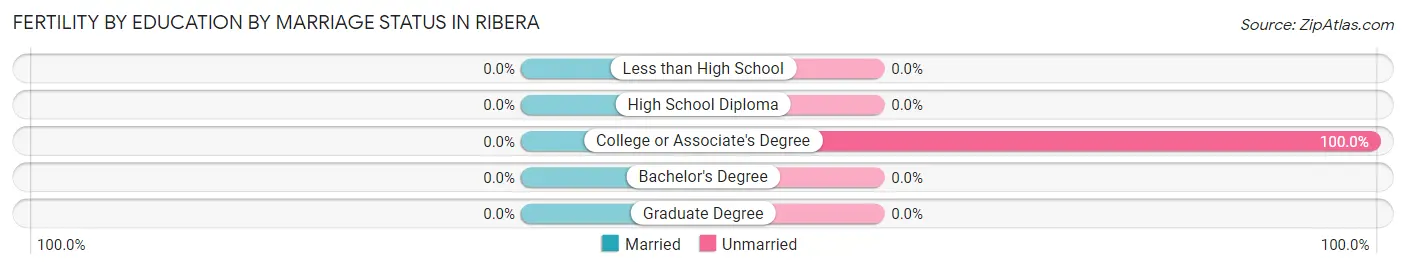
| Educational Attainment | Married | Unmarried |
| Less than High School | 0 (0.0%) | 0 (0.0%) |
| High School Diploma | 0 (0.0%) | 0 (0.0%) |
| College or Associate's Degree | 0 (0.0%) | 38 (100.0%) |
| Bachelor's Degree | 0 (0.0%) | 0 (0.0%) |
| Graduate Degree | 0 (0.0%) | 0 (0.0%) |
| Total | 0 (0.0%) | 38 (100.0%) |
Employment Characteristics in Ribera
Employment by Class of Employer in Ribera
Among the 126 employed individuals in Ribera, private company employees (102 | 80.9%), and state government employees (24 | 19.1%) make up the most common classes of employment.
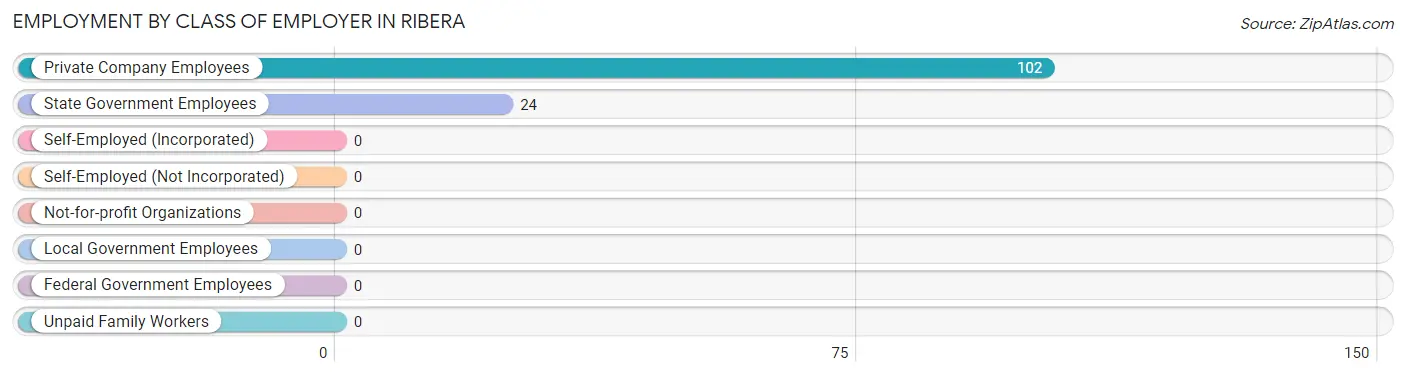
| Employer Class | # Employees | % Employees |
| Private Company Employees | 102 | 80.9% |
| Self-Employed (Incorporated) | 0 | 0.0% |
| Self-Employed (Not Incorporated) | 0 | 0.0% |
| Not-for-profit Organizations | 0 | 0.0% |
| Local Government Employees | 0 | 0.0% |
| State Government Employees | 24 | 19.1% |
| Federal Government Employees | 0 | 0.0% |
| Unpaid Family Workers | 0 | 0.0% |
| Total | 126 | 100.0% |
Employment Status by Age in Ribera
According to the labor force statistics for Ribera, out of the total population over 16 years of age (284), 57.7% or 164 individuals are in the labor force, with 23.2% or 38 of them unemployed. The age group with the highest labor force participation rate is 45 to 54 years, with 100.0% or 65 individuals in the labor force. Within the labor force, the 20 to 24 years age range has the highest percentage of unemployed individuals, with 100.0% or 38 of them being unemployed.
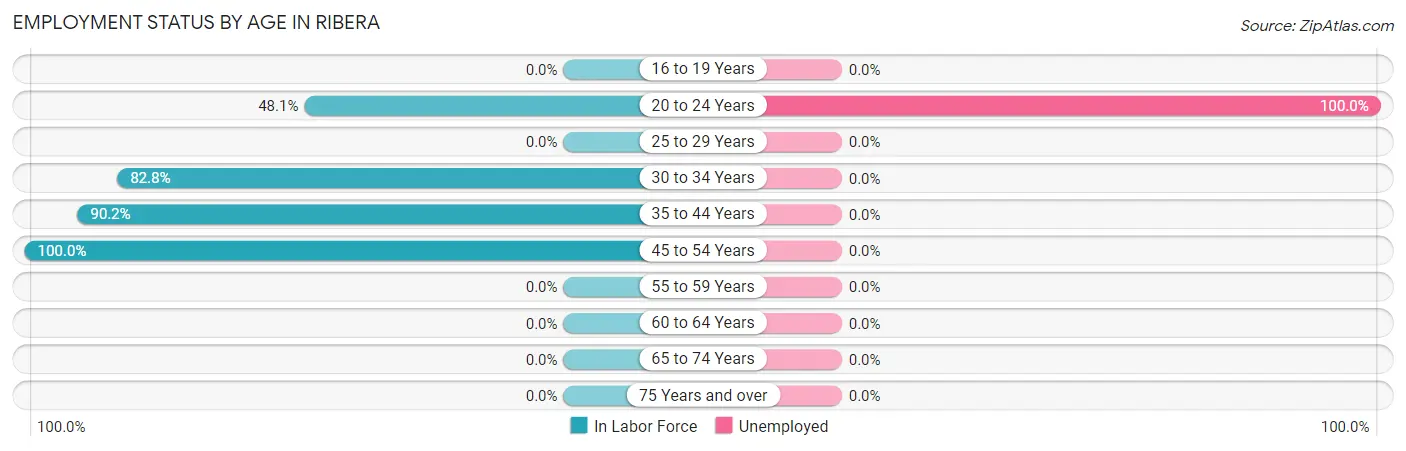
| Age Bracket | In Labor Force | Unemployed |
| 16 to 19 Years | 0 (0.0%) | 0 (0.0%) |
| 20 to 24 Years | 38 (48.1%) | 38 (100.0%) |
| 25 to 29 Years | 0 (0.0%) | 0 (0.0%) |
| 30 to 34 Years | 24 (82.8%) | 0 (0.0%) |
| 35 to 44 Years | 37 (90.2%) | 0 (0.0%) |
| 45 to 54 Years | 65 (100.0%) | 0 (0.0%) |
| 55 to 59 Years | 0 (0.0%) | 0 (0.0%) |
| 60 to 64 Years | 0 (0.0%) | 0 (0.0%) |
| 65 to 74 Years | 0 (0.0%) | 0 (0.0%) |
| 75 Years and over | 0 (0.0%) | 0 (0.0%) |
| Total | 164 (57.7%) | 38 (23.2%) |
Employment Status by Educational Attainment in Ribera
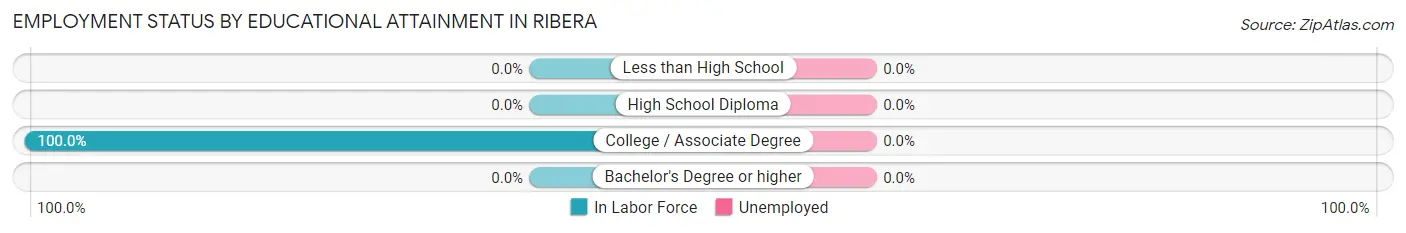
| Educational Attainment | In Labor Force | Unemployed |
| Less than High School | 0 (0.0%) | 0 (0.0%) |
| High School Diploma | 0 (0.0%) | 0 (0.0%) |
| College / Associate Degree | 126 (100.0%) | 0 (0.0%) |
| Bachelor's Degree or higher | 0 (0.0%) | 0 (0.0%) |
| Total | 126 (90.6%) | 0 (0.0%) |
Employment Occupations by Sex in Ribera
Management, Business, Science and Arts Occupations
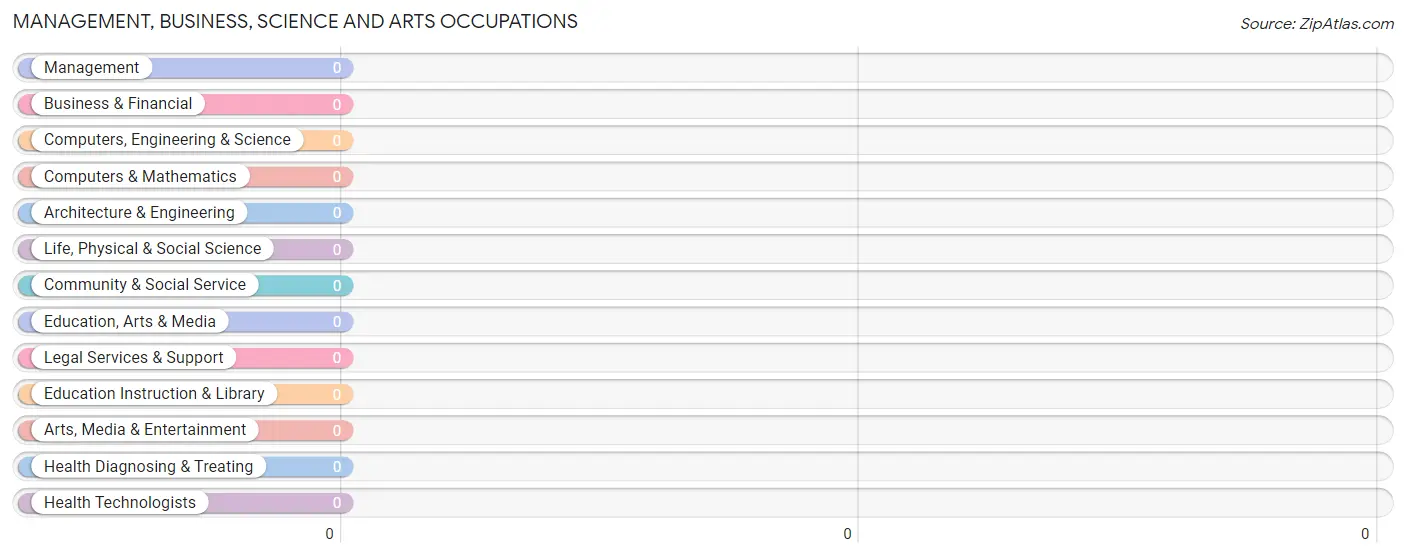
Management, Business, Science and Arts Occupations by Sex
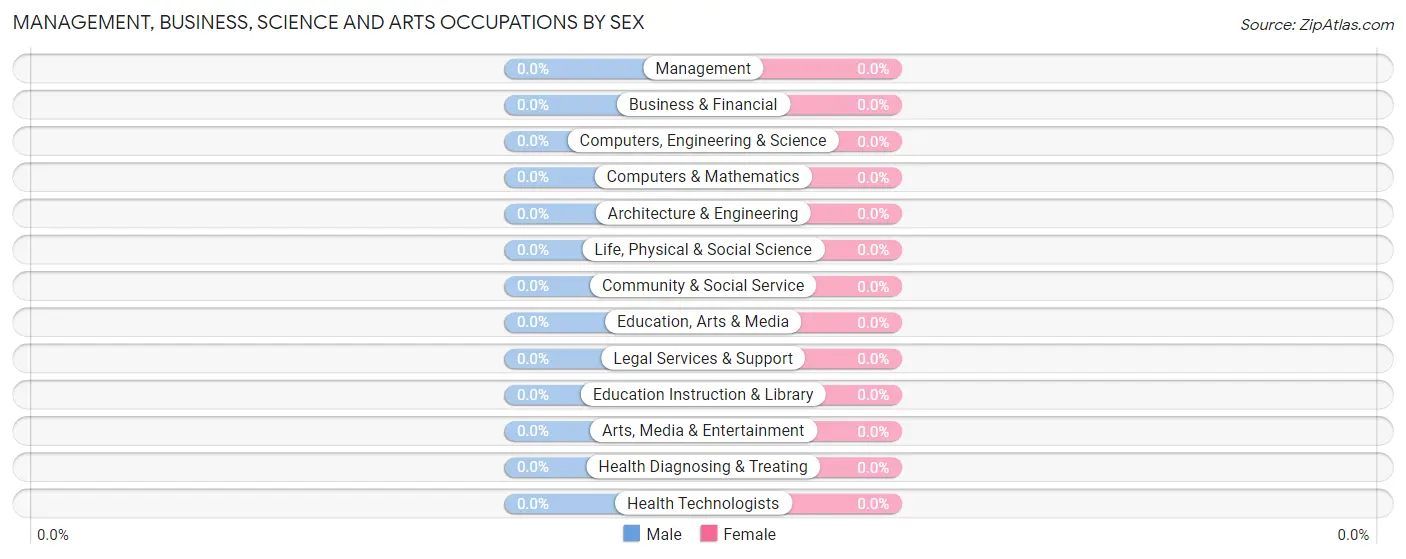
| Occupation | Male | Female |
| Management | 0 (0.0%) | 0 (0.0%) |
| Business & Financial | 0 (0.0%) | 0 (0.0%) |
| Computers, Engineering & Science | 0 (0.0%) | 0 (0.0%) |
| Computers & Mathematics | 0 (0.0%) | 0 (0.0%) |
| Architecture & Engineering | 0 (0.0%) | 0 (0.0%) |
| Life, Physical & Social Science | 0 (0.0%) | 0 (0.0%) |
| Community & Social Service | 0 (0.0%) | 0 (0.0%) |
| Education, Arts & Media | 0 (0.0%) | 0 (0.0%) |
| Legal Services & Support | 0 (0.0%) | 0 (0.0%) |
| Education Instruction & Library | 0 (0.0%) | 0 (0.0%) |
| Arts, Media & Entertainment | 0 (0.0%) | 0 (0.0%) |
| Health Diagnosing & Treating | 0 (0.0%) | 0 (0.0%) |
| Health Technologists | 0 (0.0%) | 0 (0.0%) |
| Total (Category) | 0 (0.0%) | 0 (0.0%) |
| Total (Overall) | 89 (70.6%) | 37 (29.4%) |
Services Occupations
Services Occupations by Sex
| Occupation | Male | Female |
| Healthcare Support | 0 (0.0%) | 0 (0.0%) |
| Security & Protection | 0 (0.0%) | 0 (0.0%) |
| Firefighting & Prevention | 0 (0.0%) | 0 (0.0%) |
| Law Enforcement | 0 (0.0%) | 0 (0.0%) |
| Food Preparation & Serving | 0 (0.0%) | 0 (0.0%) |
| Cleaning & Maintenance | 0 (0.0%) | 0 (0.0%) |
| Personal Care & Service | 0 (0.0%) | 0 (0.0%) |
| Total (Category) | 0 (0.0%) | 0 (0.0%) |
| Total (Overall) | 89 (70.6%) | 37 (29.4%) |
Sales and Office Occupations
The most common Sales and Office occupations in Ribera are Sales & Related (37 | 29.4%), and Office & Administration (24 | 19.1%).
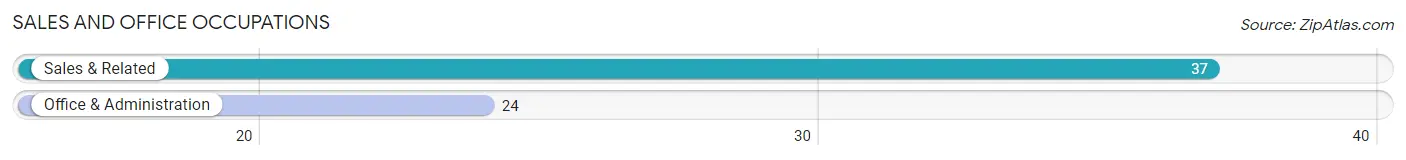
Sales and Office Occupations by Sex
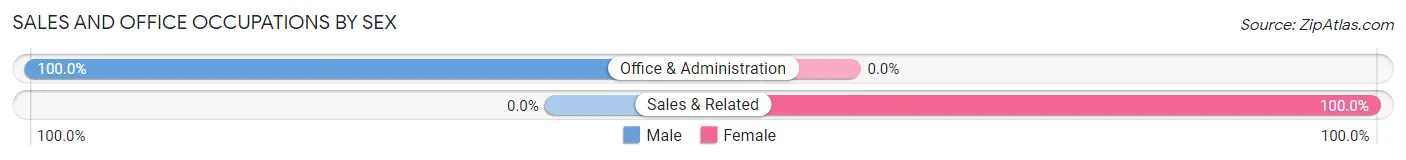
| Occupation | Male | Female |
| Sales & Related | 0 (0.0%) | 37 (100.0%) |
| Office & Administration | 24 (100.0%) | 0 (0.0%) |
| Total (Category) | 24 (39.3%) | 37 (60.7%) |
| Total (Overall) | 89 (70.6%) | 37 (29.4%) |
Natural Resources, Construction and Maintenance Occupations
Natural Resources, Construction and Maintenance Occupations by Sex
| Occupation | Male | Female |
| Farming, Fishing & Forestry | 0 (0.0%) | 0 (0.0%) |
| Construction & Extraction | 0 (0.0%) | 0 (0.0%) |
| Installation, Maintenance & Repair | 0 (0.0%) | 0 (0.0%) |
| Total (Category) | 0 (0.0%) | 0 (0.0%) |
| Total (Overall) | 89 (70.6%) | 37 (29.4%) |
Production, Transportation and Moving Occupations
The most common Production, Transportation and Moving occupations in Ribera are Transportation (35 | 27.8%), and Production (30 | 23.8%).
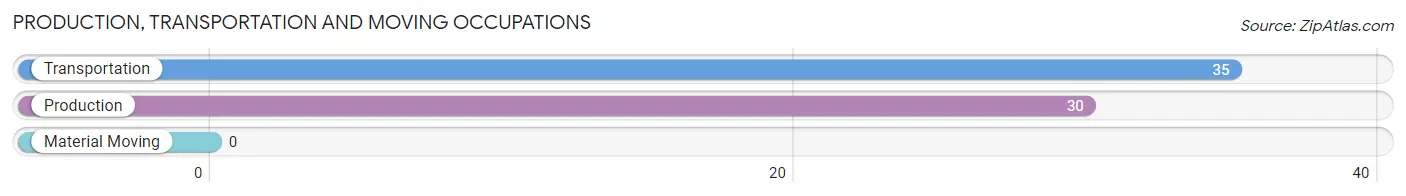
Production, Transportation and Moving Occupations by Sex
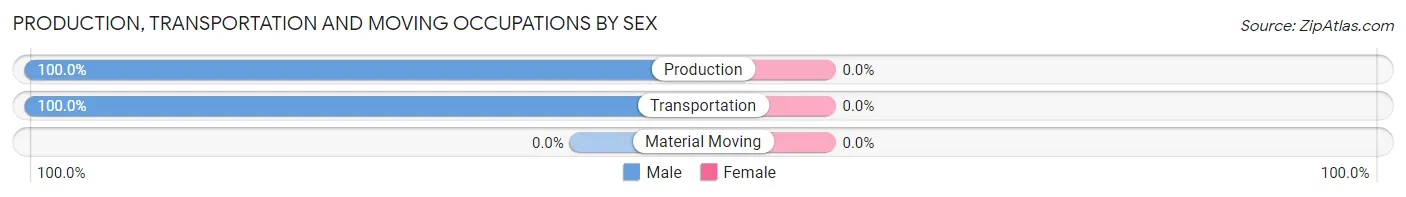
| Occupation | Male | Female |
| Production | 30 (100.0%) | 0 (0.0%) |
| Transportation | 35 (100.0%) | 0 (0.0%) |
| Material Moving | 0 (0.0%) | 0 (0.0%) |
| Total (Category) | 65 (100.0%) | 0 (0.0%) |
| Total (Overall) | 89 (70.6%) | 37 (29.4%) |
Employment Industries by Sex in Ribera
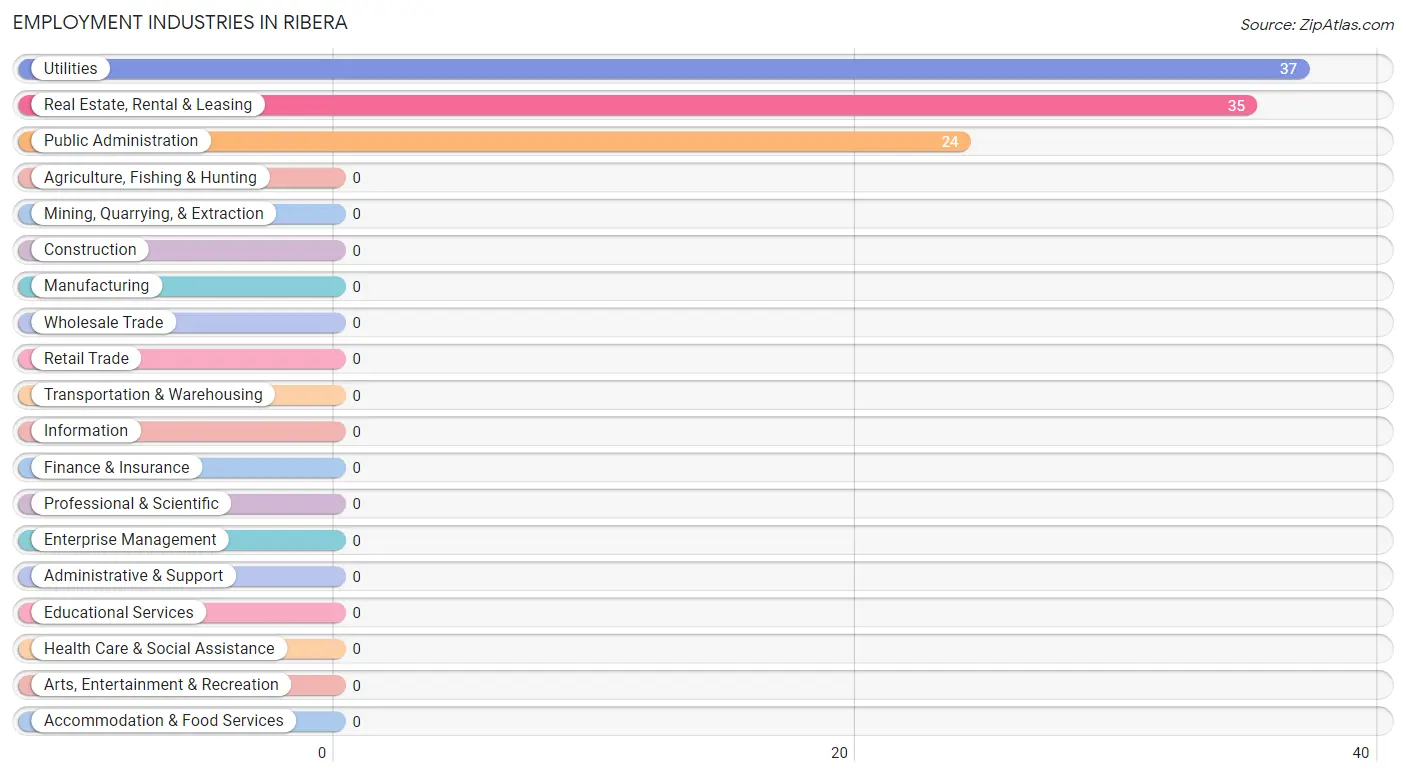
Employment Industries in Ribera
The major employment industries in Ribera include Utilities (37 | 29.4%), Real Estate, Rental & Leasing (35 | 27.8%), and Public Administration (24 | 19.1%).
Employment Industries by Sex in Ribera
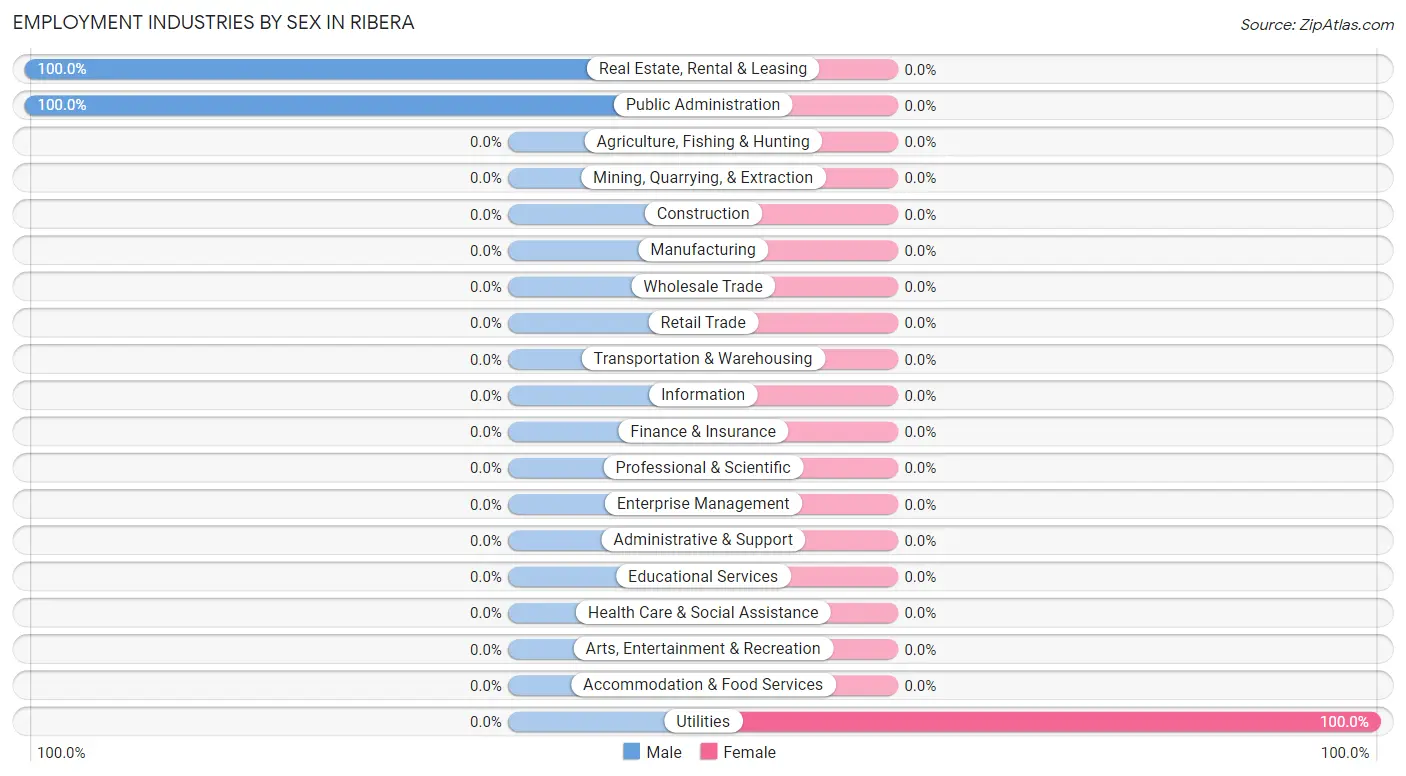
| Industry | Male | Female |
| Agriculture, Fishing & Hunting | 0 (0.0%) | 0 (0.0%) |
| Mining, Quarrying, & Extraction | 0 (0.0%) | 0 (0.0%) |
| Construction | 0 (0.0%) | 0 (0.0%) |
| Manufacturing | 0 (0.0%) | 0 (0.0%) |
| Wholesale Trade | 0 (0.0%) | 0 (0.0%) |
| Retail Trade | 0 (0.0%) | 0 (0.0%) |
| Transportation & Warehousing | 0 (0.0%) | 0 (0.0%) |
| Utilities | 0 (0.0%) | 37 (100.0%) |
| Information | 0 (0.0%) | 0 (0.0%) |
| Finance & Insurance | 0 (0.0%) | 0 (0.0%) |
| Real Estate, Rental & Leasing | 35 (100.0%) | 0 (0.0%) |
| Professional & Scientific | 0 (0.0%) | 0 (0.0%) |
| Enterprise Management | 0 (0.0%) | 0 (0.0%) |
| Administrative & Support | 0 (0.0%) | 0 (0.0%) |
| Educational Services | 0 (0.0%) | 0 (0.0%) |
| Health Care & Social Assistance | 0 (0.0%) | 0 (0.0%) |
| Arts, Entertainment & Recreation | 0 (0.0%) | 0 (0.0%) |
| Accommodation & Food Services | 0 (0.0%) | 0 (0.0%) |
| Public Administration | 24 (100.0%) | 0 (0.0%) |
| Total | 89 (70.6%) | 37 (29.4%) |
Education in Ribera
School Enrollment in Ribera
The most common levels of schooling among the 69 students in Ribera are graduate / professional (38 | 55.1%), and high school (31 | 44.9%).
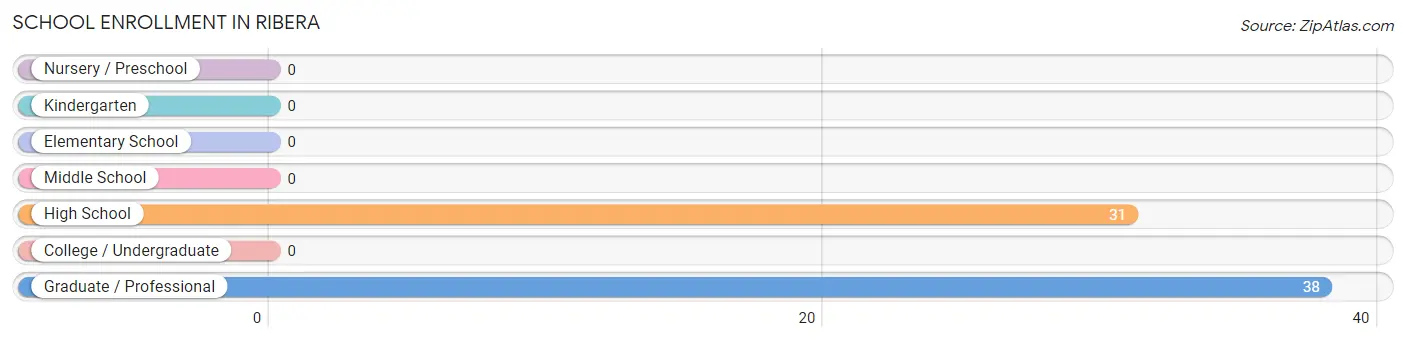
| School Level | # Students | % Students |
| Nursery / Preschool | 0 | 0.0% |
| Kindergarten | 0 | 0.0% |
| Elementary School | 0 | 0.0% |
| Middle School | 0 | 0.0% |
| High School | 31 | 44.9% |
| College / Undergraduate | 0 | 0.0% |
| Graduate / Professional | 38 | 55.1% |
| Total | 69 | 100.0% |
School Enrollment by Age by Funding Source in Ribera
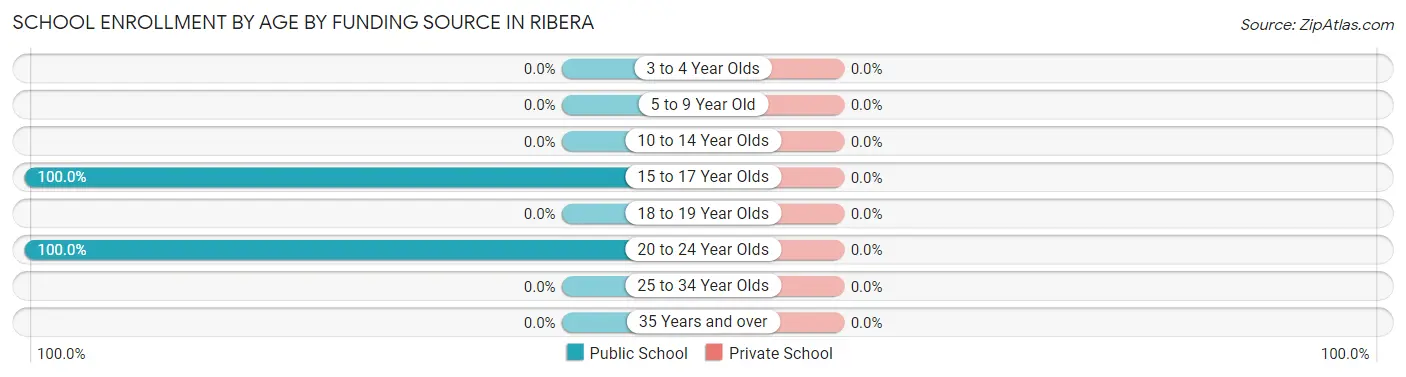
| Age Bracket | Public School | Private School |
| 3 to 4 Year Olds | 0 (0.0%) | 0 (0.0%) |
| 5 to 9 Year Old | 0 (0.0%) | 0 (0.0%) |
| 10 to 14 Year Olds | 0 (0.0%) | 0 (0.0%) |
| 15 to 17 Year Olds | 31 (100.0%) | 0 (0.0%) |
| 18 to 19 Year Olds | 0 (0.0%) | 0 (0.0%) |
| 20 to 24 Year Olds | 38 (100.0%) | 0 (0.0%) |
| 25 to 34 Year Olds | 0 (0.0%) | 0 (0.0%) |
| 35 Years and over | 0 (0.0%) | 0 (0.0%) |
| Total | 69 (100.0%) | 0 (0.0%) |
Educational Attainment by Field of Study in Ribera
| Field of Study | # Graduates | % Graduates |
| Computers & Mathematics | 0 | 0.0% |
| Bio, Nature & Agricultural | 0 | 0.0% |
| Physical & Health Sciences | 0 | 0.0% |
| Psychology | 0 | 0.0% |
| Social Sciences | 0 | 0.0% |
| Engineering | 0 | 0.0% |
| Multidisciplinary Studies | 0 | 0.0% |
| Science & Technology | 0 | 0.0% |
| Business | 0 | 0.0% |
| Education | 0 | 0.0% |
| Literature & Languages | 0 | 0.0% |
| Liberal Arts & History | 0 | 0.0% |
| Visual & Performing Arts | 0 | 0.0% |
| Communications | 0 | 0.0% |
| Arts & Humanities | 0 | 0.0% |
| Total | 0 | 0.0% |
Transportation & Commute in Ribera
Vehicle Availability by Sex in Ribera
The most prevalent vehicle ownership categories in Ribera are males with 3 vehicles (35, accounting for 39.3%) and females with 3 vehicles (37, making up 94.6%).
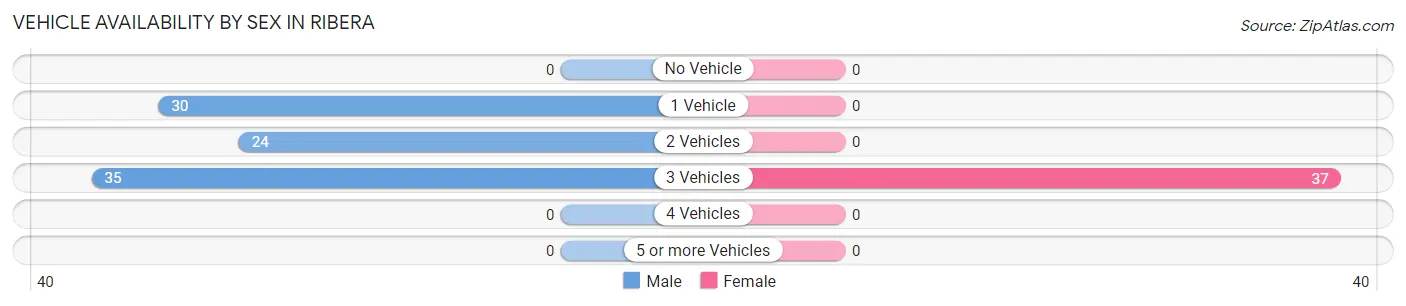
| Vehicles Available | Male | Female |
| No Vehicle | 0 (0.0%) | 0 (0.0%) |
| 1 Vehicle | 30 (33.7%) | 0 (0.0%) |
| 2 Vehicles | 24 (27.0%) | 0 (0.0%) |
| 3 Vehicles | 35 (39.3%) | 37 (100.0%) |
| 4 Vehicles | 0 (0.0%) | 0 (0.0%) |
| 5 or more Vehicles | 0 (0.0%) | 0 (0.0%) |
| Total | 89 (100.0%) | 37 (100.0%) |
Commute Time in Ribera
The most frequently occuring commute durations in Ribera are 30 to 34 minutes (61 commuters, 48.4%), 45 to 59 minutes (35 commuters, 27.8%), and less than 5 minutes (30 commuters, 23.8%).
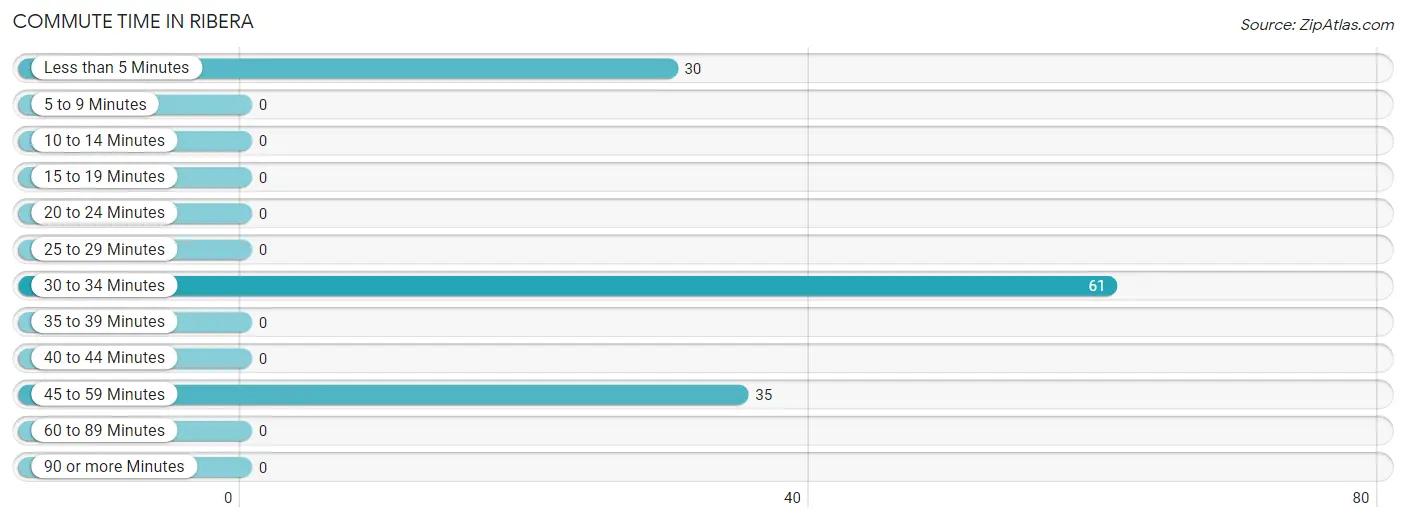
| Commute Time | # Commuters | % Commuters |
| Less than 5 Minutes | 30 | 23.8% |
| 5 to 9 Minutes | 0 | 0.0% |
| 10 to 14 Minutes | 0 | 0.0% |
| 15 to 19 Minutes | 0 | 0.0% |
| 20 to 24 Minutes | 0 | 0.0% |
| 25 to 29 Minutes | 0 | 0.0% |
| 30 to 34 Minutes | 61 | 48.4% |
| 35 to 39 Minutes | 0 | 0.0% |
| 40 to 44 Minutes | 0 | 0.0% |
| 45 to 59 Minutes | 35 | 27.8% |
| 60 to 89 Minutes | 0 | 0.0% |
| 90 or more Minutes | 0 | 0.0% |
Commute Time by Sex in Ribera
The most common commute times in Ribera are 45 to 59 minutes (35 commuters, 39.3%) for males and 30 to 34 minutes (37 commuters, 100.0%) for females.
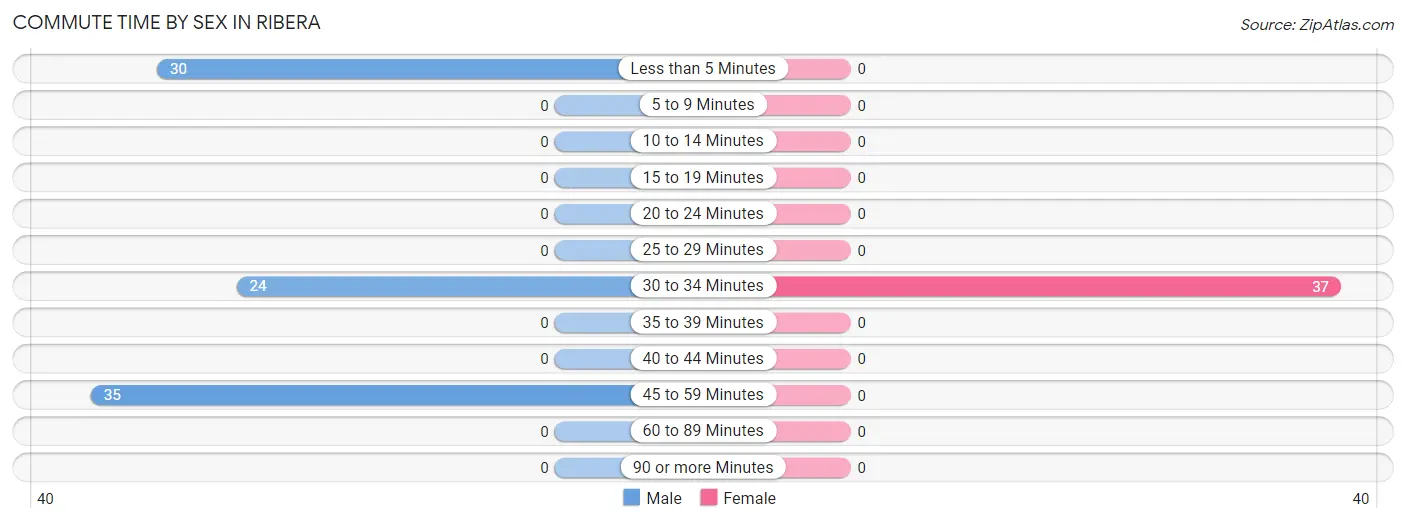
| Commute Time | Male | Female |
| Less than 5 Minutes | 30 (33.7%) | 0 (0.0%) |
| 5 to 9 Minutes | 0 (0.0%) | 0 (0.0%) |
| 10 to 14 Minutes | 0 (0.0%) | 0 (0.0%) |
| 15 to 19 Minutes | 0 (0.0%) | 0 (0.0%) |
| 20 to 24 Minutes | 0 (0.0%) | 0 (0.0%) |
| 25 to 29 Minutes | 0 (0.0%) | 0 (0.0%) |
| 30 to 34 Minutes | 24 (27.0%) | 37 (100.0%) |
| 35 to 39 Minutes | 0 (0.0%) | 0 (0.0%) |
| 40 to 44 Minutes | 0 (0.0%) | 0 (0.0%) |
| 45 to 59 Minutes | 35 (39.3%) | 0 (0.0%) |
| 60 to 89 Minutes | 0 (0.0%) | 0 (0.0%) |
| 90 or more Minutes | 0 (0.0%) | 0 (0.0%) |
Time of Departure to Work by Sex in Ribera
The most frequent times of departure to work in Ribera are 5:30 AM to 5:59 AM (35, 39.3%) for males and 7:30 AM to 7:59 AM (37, 100.0%) for females.
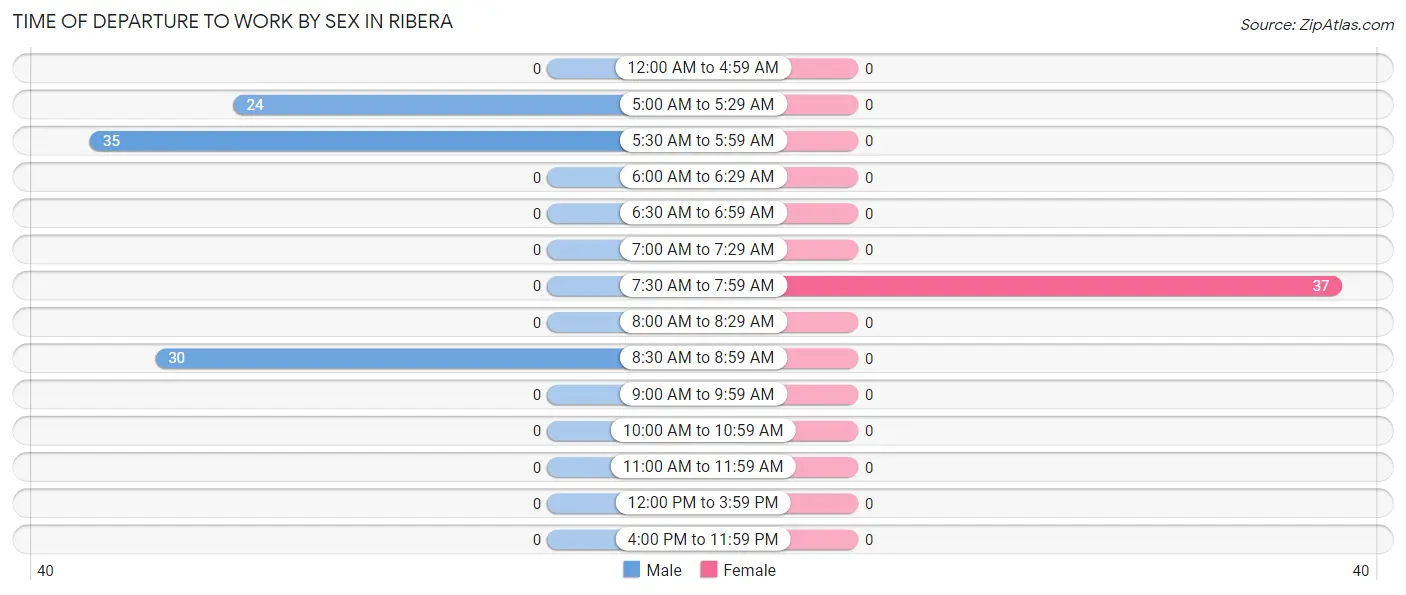
| Time of Departure | Male | Female |
| 12:00 AM to 4:59 AM | 0 (0.0%) | 0 (0.0%) |
| 5:00 AM to 5:29 AM | 24 (27.0%) | 0 (0.0%) |
| 5:30 AM to 5:59 AM | 35 (39.3%) | 0 (0.0%) |
| 6:00 AM to 6:29 AM | 0 (0.0%) | 0 (0.0%) |
| 6:30 AM to 6:59 AM | 0 (0.0%) | 0 (0.0%) |
| 7:00 AM to 7:29 AM | 0 (0.0%) | 0 (0.0%) |
| 7:30 AM to 7:59 AM | 0 (0.0%) | 37 (100.0%) |
| 8:00 AM to 8:29 AM | 0 (0.0%) | 0 (0.0%) |
| 8:30 AM to 8:59 AM | 30 (33.7%) | 0 (0.0%) |
| 9:00 AM to 9:59 AM | 0 (0.0%) | 0 (0.0%) |
| 10:00 AM to 10:59 AM | 0 (0.0%) | 0 (0.0%) |
| 11:00 AM to 11:59 AM | 0 (0.0%) | 0 (0.0%) |
| 12:00 PM to 3:59 PM | 0 (0.0%) | 0 (0.0%) |
| 4:00 PM to 11:59 PM | 0 (0.0%) | 0 (0.0%) |
| Total | 89 (100.0%) | 37 (100.0%) |
Housing Occupancy in Ribera
Occupancy by Ownership in Ribera
Of the total 138 dwellings in Ribera, owner-occupied units account for 70 (50.7%), while renter-occupied units make up 68 (49.3%).
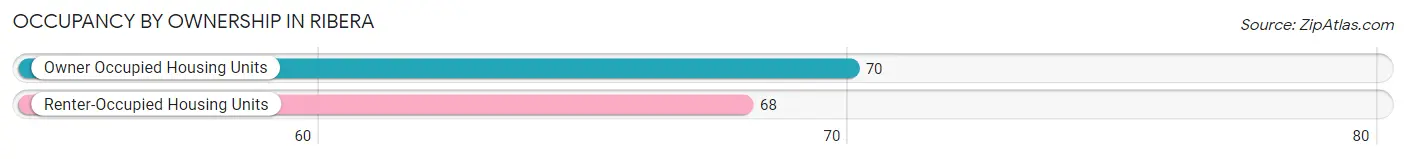
| Occupancy | # Housing Units | % Housing Units |
| Owner Occupied Housing Units | 70 | 50.7% |
| Renter-Occupied Housing Units | 68 | 49.3% |
| Total Occupied Housing Units | 138 | 100.0% |
Occupancy by Household Size in Ribera
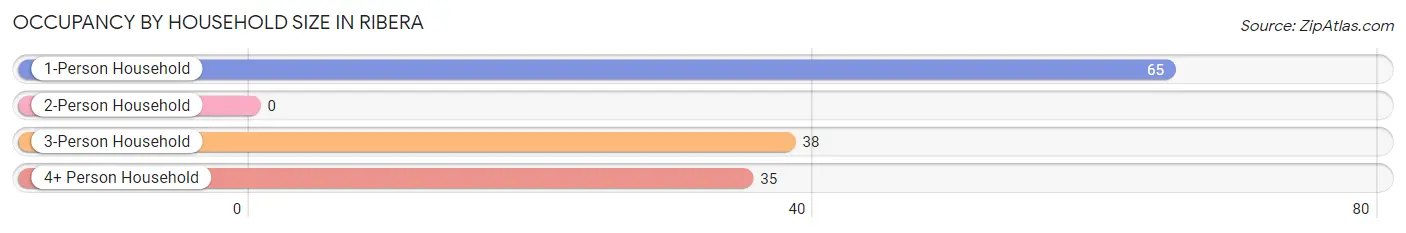
| Household Size | # Housing Units | % Housing Units |
| 1-Person Household | 65 | 47.1% |
| 2-Person Household | 0 | 0.0% |
| 3-Person Household | 38 | 27.5% |
| 4+ Person Household | 35 | 25.4% |
| Total Housing Units | 138 | 100.0% |
Occupancy by Ownership by Household Size in Ribera
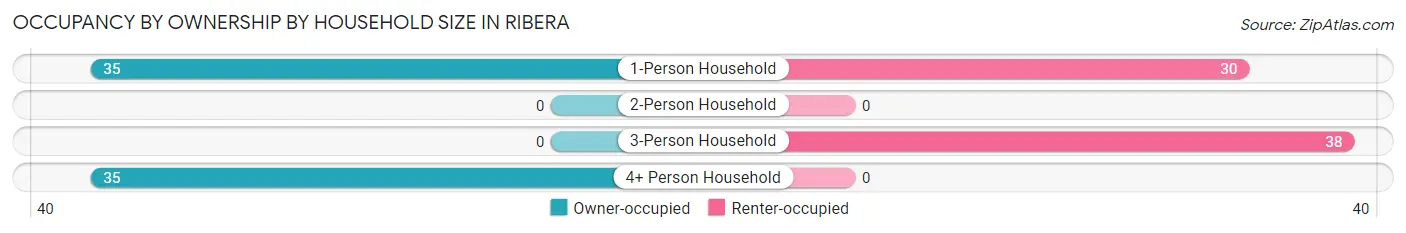
| Household Size | Owner-occupied | Renter-occupied |
| 1-Person Household | 35 (53.8%) | 30 (46.2%) |
| 2-Person Household | 0 (0.0%) | 0 (0.0%) |
| 3-Person Household | 0 (0.0%) | 38 (100.0%) |
| 4+ Person Household | 35 (100.0%) | 0 (0.0%) |
| Total Housing Units | 70 (50.7%) | 68 (49.3%) |
Occupancy by Educational Attainment in Ribera
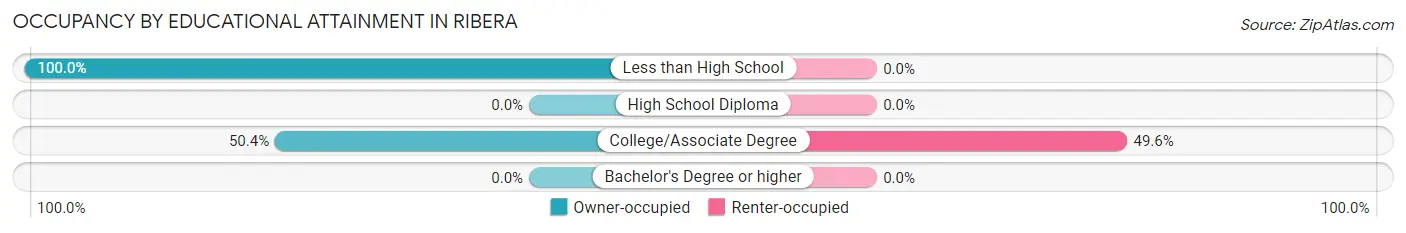
| Household Size | Owner-occupied | Renter-occupied |
| Less than High School | 1 (100.0%) | 0 (0.0%) |
| High School Diploma | 0 (0.0%) | 0 (0.0%) |
| College/Associate Degree | 69 (50.4%) | 68 (49.6%) |
| Bachelor's Degree or higher | 0 (0.0%) | 0 (0.0%) |
Occupancy by Age of Householder in Ribera
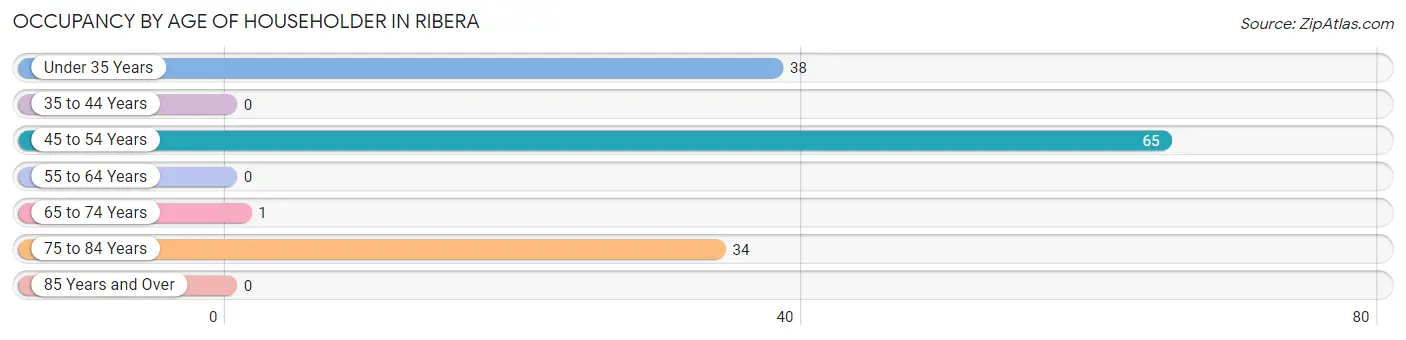
| Age Bracket | # Households | % Households |
| Under 35 Years | 38 | 27.5% |
| 35 to 44 Years | 0 | 0.0% |
| 45 to 54 Years | 65 | 47.1% |
| 55 to 64 Years | 0 | 0.0% |
| 65 to 74 Years | 1 | 0.7% |
| 75 to 84 Years | 34 | 24.6% |
| 85 Years and Over | 0 | 0.0% |
| Total | 138 | 100.0% |
Housing Finances in Ribera
Median Income by Occupancy in Ribera
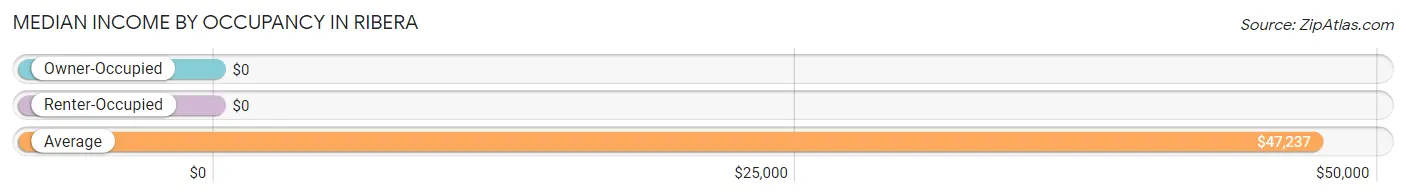
| Occupancy Type | # Households | Median Income |
| Owner-Occupied | 70 (50.7%) | $0 |
| Renter-Occupied | 68 (49.3%) | $0 |
| Average | 138 (100.0%) | $47,237 |
Occupancy by Householder Income Bracket in Ribera
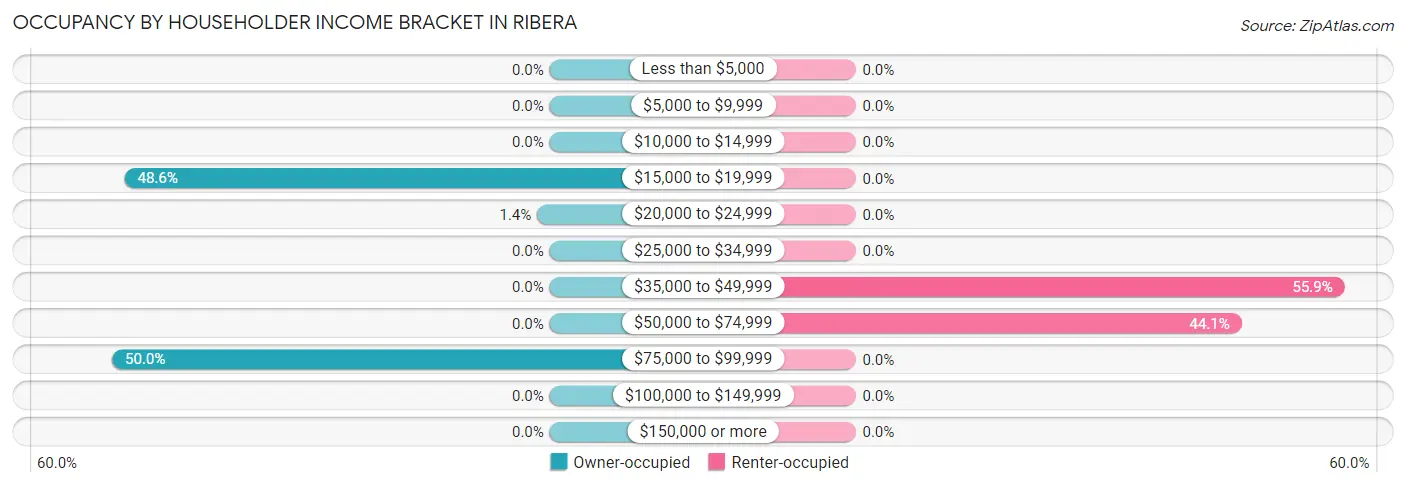
| Income Bracket | Owner-occupied | Renter-occupied |
| Less than $5,000 | 0 (0.0%) | 0 (0.0%) |
| $5,000 to $9,999 | 0 (0.0%) | 0 (0.0%) |
| $10,000 to $14,999 | 0 (0.0%) | 0 (0.0%) |
| $15,000 to $19,999 | 34 (48.6%) | 0 (0.0%) |
| $20,000 to $24,999 | 1 (1.4%) | 0 (0.0%) |
| $25,000 to $34,999 | 0 (0.0%) | 0 (0.0%) |
| $35,000 to $49,999 | 0 (0.0%) | 38 (55.9%) |
| $50,000 to $74,999 | 0 (0.0%) | 30 (44.1%) |
| $75,000 to $99,999 | 35 (50.0%) | 0 (0.0%) |
| $100,000 to $149,999 | 0 (0.0%) | 0 (0.0%) |
| $150,000 or more | 0 (0.0%) | 0 (0.0%) |
| Total | 70 (100.0%) | 68 (100.0%) |
Monthly Housing Cost Tiers in Ribera
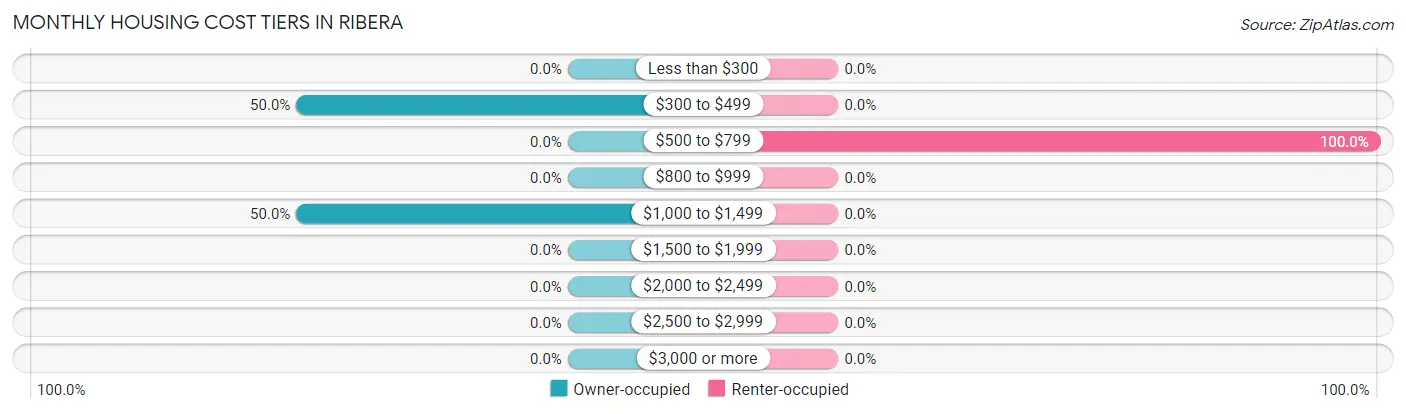
| Monthly Cost | Owner-occupied | Renter-occupied |
| Less than $300 | 0 (0.0%) | 0 (0.0%) |
| $300 to $499 | 35 (50.0%) | 0 (0.0%) |
| $500 to $799 | 0 (0.0%) | 68 (100.0%) |
| $800 to $999 | 0 (0.0%) | 0 (0.0%) |
| $1,000 to $1,499 | 35 (50.0%) | 0 (0.0%) |
| $1,500 to $1,999 | 0 (0.0%) | 0 (0.0%) |
| $2,000 to $2,499 | 0 (0.0%) | 0 (0.0%) |
| $2,500 to $2,999 | 0 (0.0%) | 0 (0.0%) |
| $3,000 or more | 0 (0.0%) | 0 (0.0%) |
| Total | 70 (100.0%) | 68 (100.0%) |
Physical Housing Characteristics in Ribera
Housing Structures in Ribera
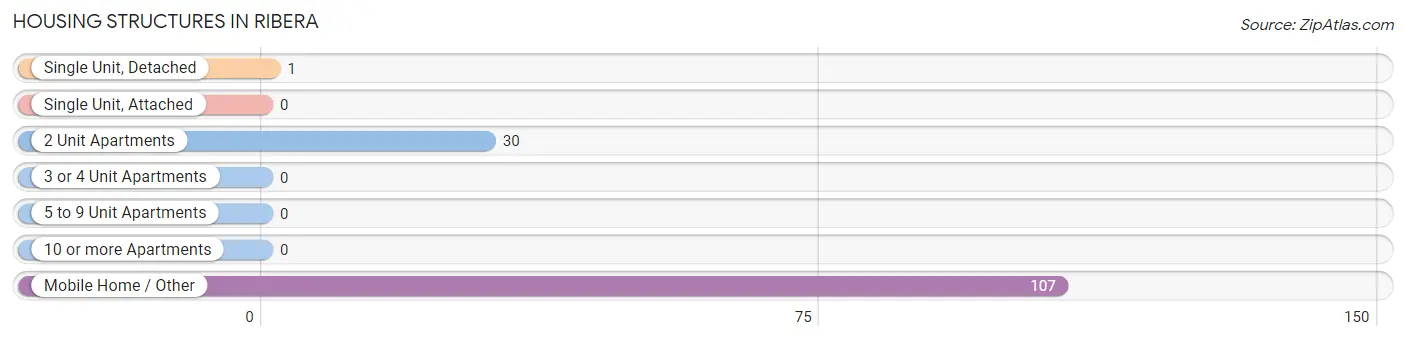
| Structure Type | # Housing Units | % Housing Units |
| Single Unit, Detached | 1 | 0.7% |
| Single Unit, Attached | 0 | 0.0% |
| 2 Unit Apartments | 30 | 21.7% |
| 3 or 4 Unit Apartments | 0 | 0.0% |
| 5 to 9 Unit Apartments | 0 | 0.0% |
| 10 or more Apartments | 0 | 0.0% |
| Mobile Home / Other | 107 | 77.5% |
| Total | 138 | 100.0% |
Housing Structures by Occupancy in Ribera
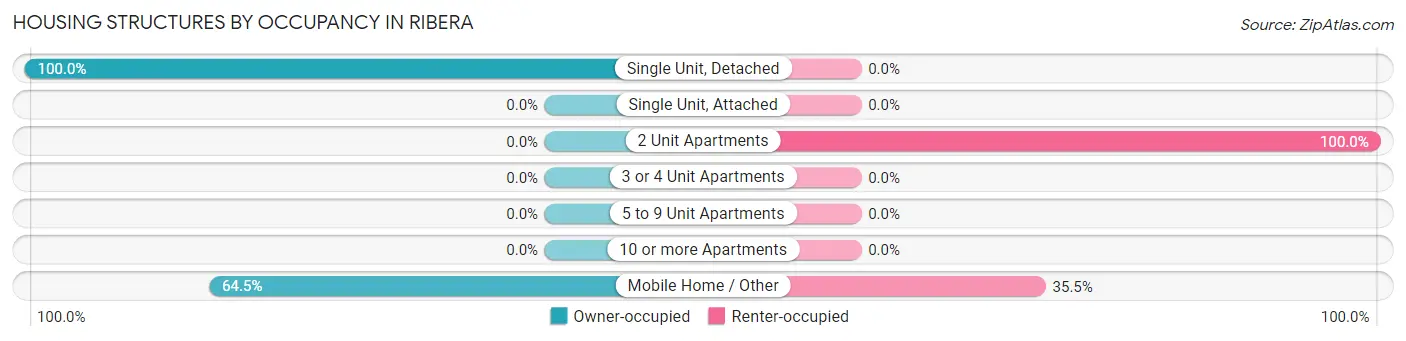
| Structure Type | Owner-occupied | Renter-occupied |
| Single Unit, Detached | 1 (100.0%) | 0 (0.0%) |
| Single Unit, Attached | 0 (0.0%) | 0 (0.0%) |
| 2 Unit Apartments | 0 (0.0%) | 30 (100.0%) |
| 3 or 4 Unit Apartments | 0 (0.0%) | 0 (0.0%) |
| 5 to 9 Unit Apartments | 0 (0.0%) | 0 (0.0%) |
| 10 or more Apartments | 0 (0.0%) | 0 (0.0%) |
| Mobile Home / Other | 69 (64.5%) | 38 (35.5%) |
| Total | 70 (50.7%) | 68 (49.3%) |
Housing Structures by Number of Rooms in Ribera
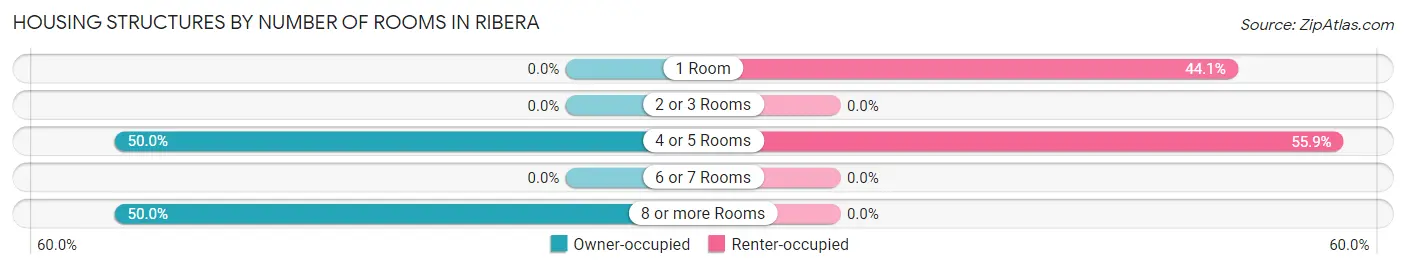
| Number of Rooms | Owner-occupied | Renter-occupied |
| 1 Room | 0 (0.0%) | 30 (44.1%) |
| 2 or 3 Rooms | 0 (0.0%) | 0 (0.0%) |
| 4 or 5 Rooms | 35 (50.0%) | 38 (55.9%) |
| 6 or 7 Rooms | 0 (0.0%) | 0 (0.0%) |
| 8 or more Rooms | 35 (50.0%) | 0 (0.0%) |
| Total | 70 (100.0%) | 68 (100.0%) |
Housing Structure by Heating Type in Ribera
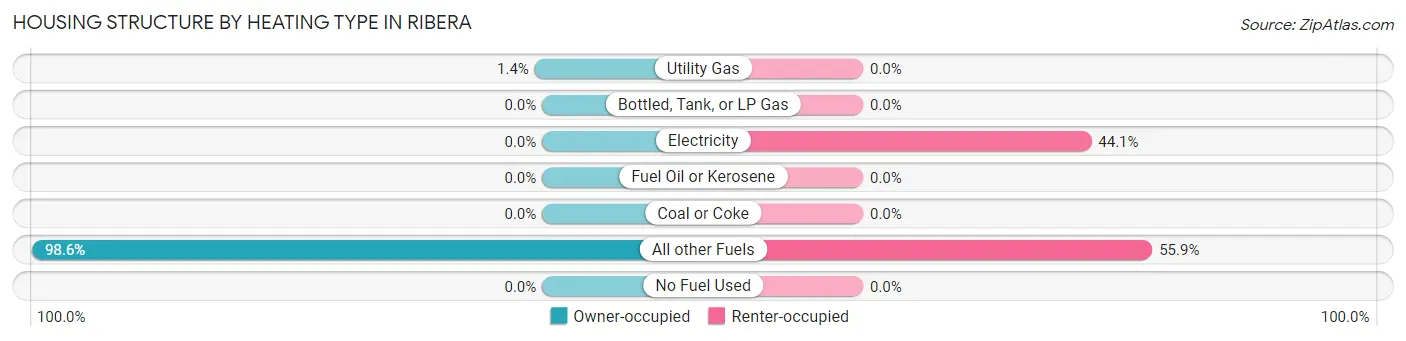
| Heating Type | Owner-occupied | Renter-occupied |
| Utility Gas | 1 (1.4%) | 0 (0.0%) |
| Bottled, Tank, or LP Gas | 0 (0.0%) | 0 (0.0%) |
| Electricity | 0 (0.0%) | 30 (44.1%) |
| Fuel Oil or Kerosene | 0 (0.0%) | 0 (0.0%) |
| Coal or Coke | 0 (0.0%) | 0 (0.0%) |
| All other Fuels | 69 (98.6%) | 38 (55.9%) |
| No Fuel Used | 0 (0.0%) | 0 (0.0%) |
| Total | 70 (100.0%) | 68 (100.0%) |
Household Vehicle Usage in Ribera
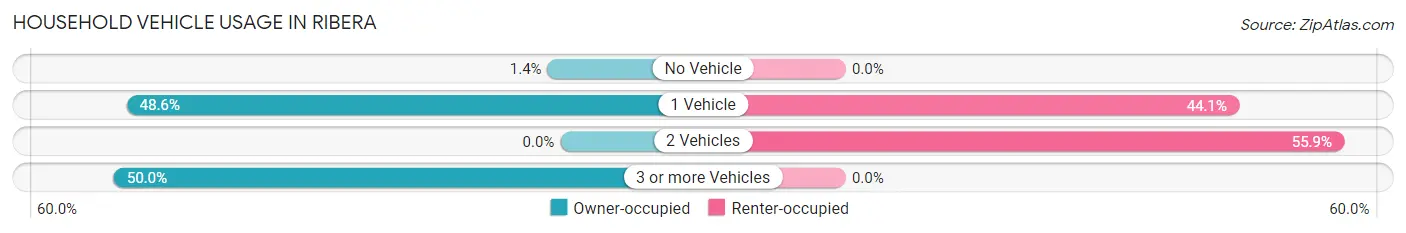
| Vehicles per Household | Owner-occupied | Renter-occupied |
| No Vehicle | 1 (1.4%) | 0 (0.0%) |
| 1 Vehicle | 34 (48.6%) | 30 (44.1%) |
| 2 Vehicles | 0 (0.0%) | 38 (55.9%) |
| 3 or more Vehicles | 35 (50.0%) | 0 (0.0%) |
| Total | 70 (100.0%) | 68 (100.0%) |
Real Estate & Mortgages in Ribera
Real Estate and Mortgage Overview in Ribera
| Characteristic | Without Mortgage | With Mortgage |
| Housing Units | 35 | 35 |
| Median Property Value | - | - |
| Median Household Income | - | - |
| Monthly Housing Costs | - | - |
| Real Estate Taxes | - | - |
Property Value by Mortgage Status in Ribera
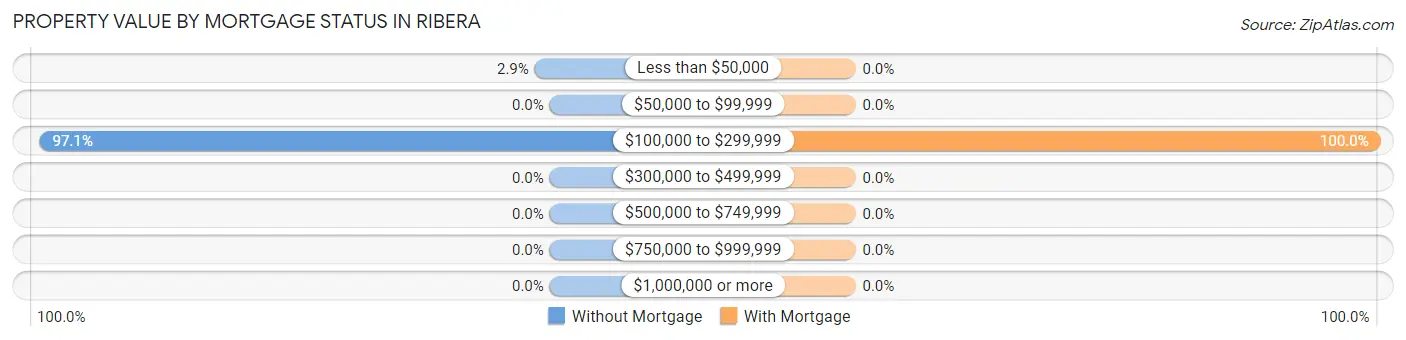
| Property Value | Without Mortgage | With Mortgage |
| Less than $50,000 | 1 (2.9%) | 0 (0.0%) |
| $50,000 to $99,999 | 0 (0.0%) | 0 (0.0%) |
| $100,000 to $299,999 | 34 (97.1%) | 35 (100.0%) |
| $300,000 to $499,999 | 0 (0.0%) | 0 (0.0%) |
| $500,000 to $749,999 | 0 (0.0%) | 0 (0.0%) |
| $750,000 to $999,999 | 0 (0.0%) | 0 (0.0%) |
| $1,000,000 or more | 0 (0.0%) | 0 (0.0%) |
| Total | 35 (100.0%) | 35 (100.0%) |
Household Income by Mortgage Status in Ribera
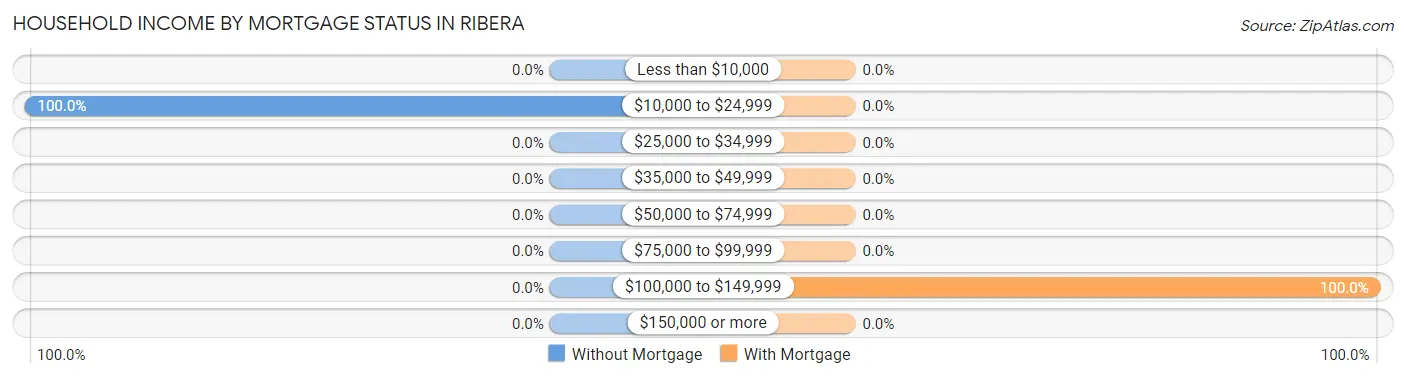
| Household Income | Without Mortgage | With Mortgage |
| Less than $10,000 | 0 (0.0%) | 0 (0.0%) |
| $10,000 to $24,999 | 35 (100.0%) | 0 (0.0%) |
| $25,000 to $34,999 | 0 (0.0%) | 0 (0.0%) |
| $35,000 to $49,999 | 0 (0.0%) | 0 (0.0%) |
| $50,000 to $74,999 | 0 (0.0%) | 0 (0.0%) |
| $75,000 to $99,999 | 0 (0.0%) | 0 (0.0%) |
| $100,000 to $149,999 | 0 (0.0%) | 35 (100.0%) |
| $150,000 or more | 0 (0.0%) | 0 (0.0%) |
| Total | 35 (100.0%) | 35 (100.0%) |
Property Value to Household Income Ratio in Ribera
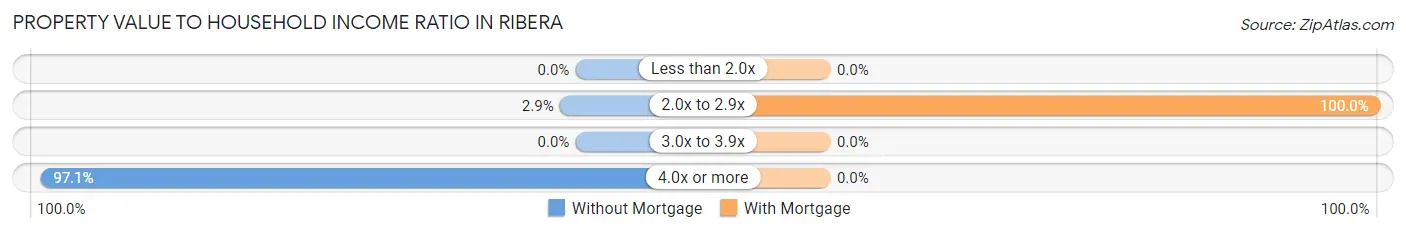
| Value-to-Income Ratio | Without Mortgage | With Mortgage |
| Less than 2.0x | 0 (0.0%) | 0 (0.0%) |
| 2.0x to 2.9x | 1 (2.9%) | 35 (100.0%) |
| 3.0x to 3.9x | 0 (0.0%) | 0 (0.0%) |
| 4.0x or more | 34 (97.1%) | 0 (0.0%) |
| Total | 35 (100.0%) | 35 (100.0%) |
Real Estate Taxes by Mortgage Status in Ribera
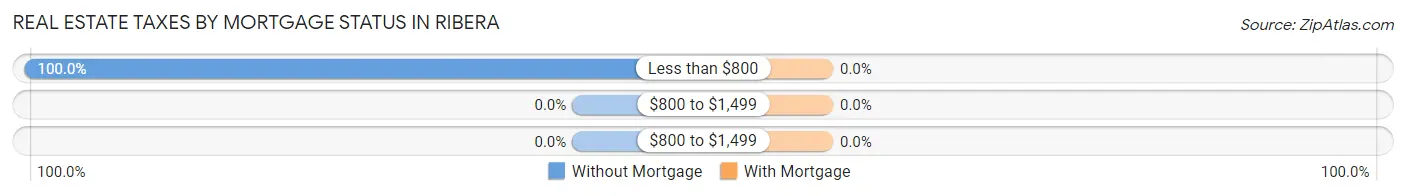
| Property Taxes | Without Mortgage | With Mortgage |
| Less than $800 | 35 (100.0%) | 0 (0.0%) |
| $800 to $1,499 | 0 (0.0%) | 0 (0.0%) |
| $800 to $1,499 | 0 (0.0%) | 0 (0.0%) |
| Total | 35 (100.0%) | 35 (100.0%) |
Health & Disability in Ribera
Health Insurance Coverage by Age in Ribera
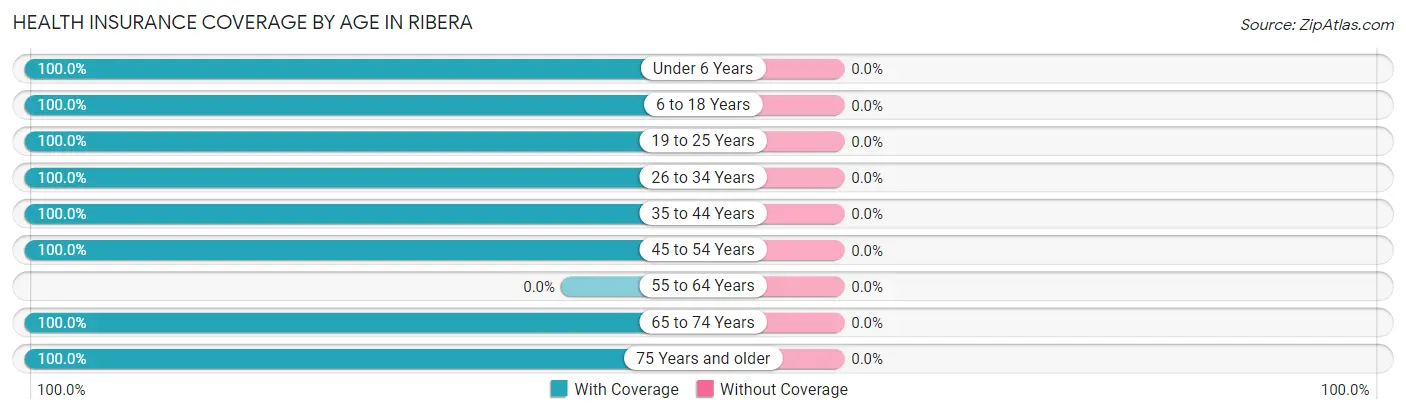
| Age Bracket | With Coverage | Without Coverage |
| Under 6 Years | 46 (100.0%) | 0 (0.0%) |
| 6 to 18 Years | 31 (100.0%) | 0 (0.0%) |
| 19 to 25 Years | 75 (100.0%) | 0 (0.0%) |
| 26 to 34 Years | 24 (100.0%) | 0 (0.0%) |
| 35 to 44 Years | 37 (100.0%) | 0 (0.0%) |
| 45 to 54 Years | 65 (100.0%) | 0 (0.0%) |
| 55 to 64 Years | 0 (0.0%) | 0 (0.0%) |
| 65 to 74 Years | 1 (100.0%) | 0 (0.0%) |
| 75 Years and older | 34 (100.0%) | 0 (0.0%) |
| Total | 313 (100.0%) | 0 (0.0%) |
Health Insurance Coverage by Citizenship Status in Ribera
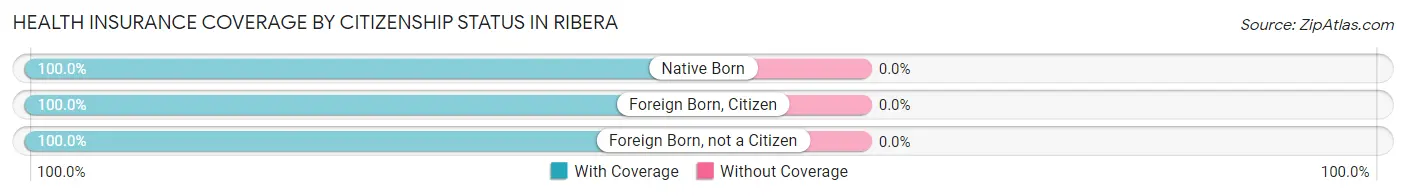
| Citizenship Status | With Coverage | Without Coverage |
| Native Born | 46 (100.0%) | 0 (0.0%) |
| Foreign Born, Citizen | 31 (100.0%) | 0 (0.0%) |
| Foreign Born, not a Citizen | 75 (100.0%) | 0 (0.0%) |
Health Insurance Coverage by Household Income in Ribera
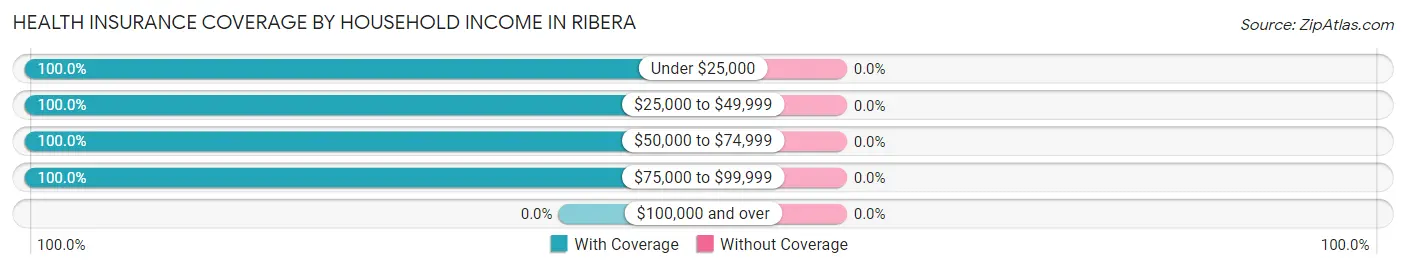
| Household Income | With Coverage | Without Coverage |
| Under $25,000 | 35 (100.0%) | 0 (0.0%) |
| $25,000 to $49,999 | 108 (100.0%) | 0 (0.0%) |
| $50,000 to $74,999 | 30 (100.0%) | 0 (0.0%) |
| $75,000 to $99,999 | 140 (100.0%) | 0 (0.0%) |
| $100,000 and over | 0 (0.0%) | 0 (0.0%) |
Public vs Private Health Insurance Coverage by Age in Ribera
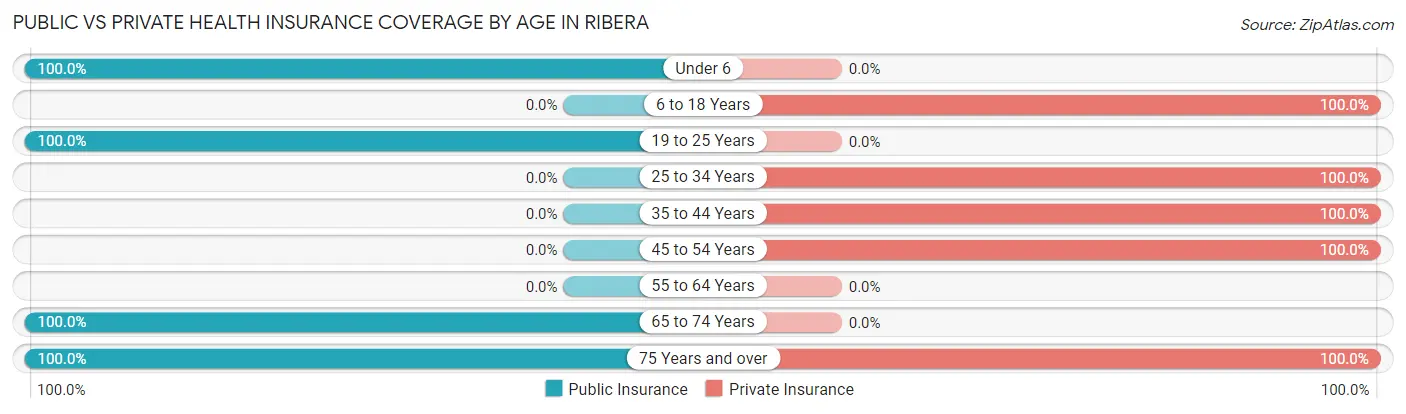
| Age Bracket | Public Insurance | Private Insurance |
| Under 6 | 46 (100.0%) | 0 (0.0%) |
| 6 to 18 Years | 0 (0.0%) | 31 (100.0%) |
| 19 to 25 Years | 75 (100.0%) | 0 (0.0%) |
| 25 to 34 Years | 0 (0.0%) | 24 (100.0%) |
| 35 to 44 Years | 0 (0.0%) | 37 (100.0%) |
| 45 to 54 Years | 0 (0.0%) | 65 (100.0%) |
| 55 to 64 Years | 0 (0.0%) | 0 (0.0%) |
| 65 to 74 Years | 1 (100.0%) | 0 (0.0%) |
| 75 Years and over | 34 (100.0%) | 34 (100.0%) |
| Total | 156 (49.8%) | 191 (61.0%) |
Disability Status by Sex by Age in Ribera
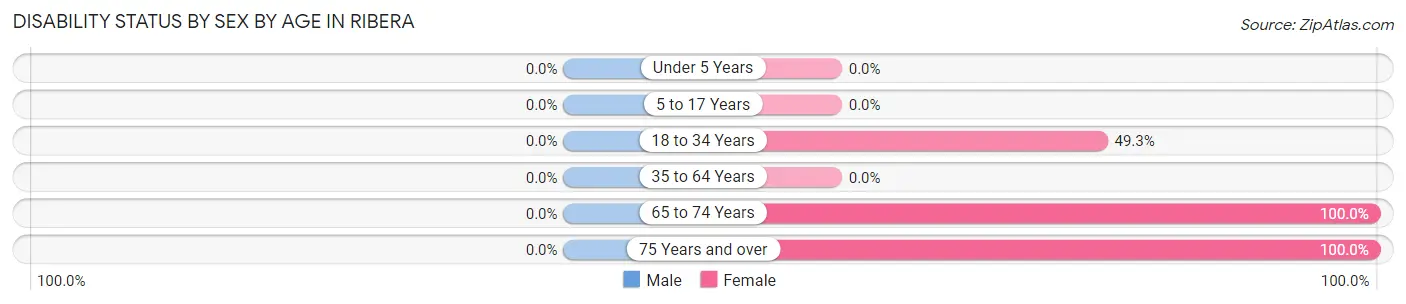
| Age Bracket | Male | Female |
| Under 5 Years | 0 (0.0%) | 0 (0.0%) |
| 5 to 17 Years | 0 (0.0%) | 0 (0.0%) |
| 18 to 34 Years | 0 (0.0%) | 37 (49.3%) |
| 35 to 64 Years | 0 (0.0%) | 0 (0.0%) |
| 65 to 74 Years | 0 (0.0%) | 1 (100.0%) |
| 75 Years and over | 0 (0.0%) | 34 (100.0%) |
Disability Class by Sex by Age in Ribera
Disability Class: Hearing Difficulty
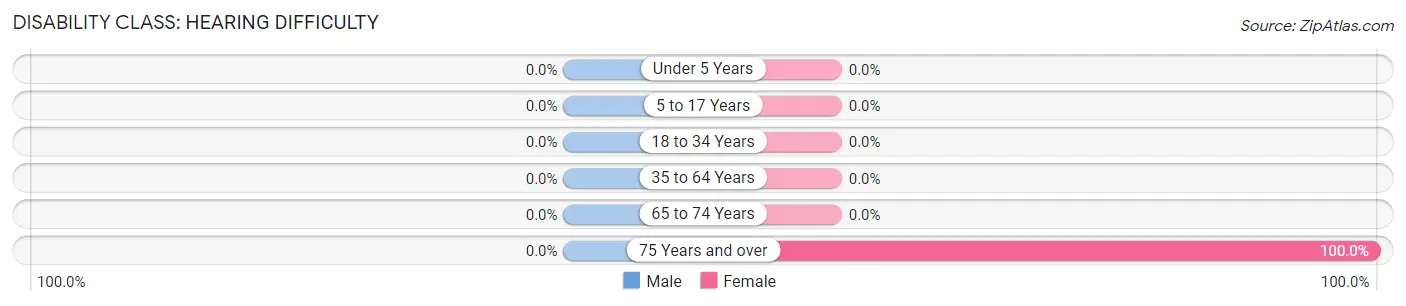
| Age Bracket | Male | Female |
| Under 5 Years | 0 (0.0%) | 0 (0.0%) |
| 5 to 17 Years | 0 (0.0%) | 0 (0.0%) |
| 18 to 34 Years | 0 (0.0%) | 0 (0.0%) |
| 35 to 64 Years | 0 (0.0%) | 0 (0.0%) |
| 65 to 74 Years | 0 (0.0%) | 0 (0.0%) |
| 75 Years and over | 0 (0.0%) | 34 (100.0%) |
Disability Class: Vision Difficulty
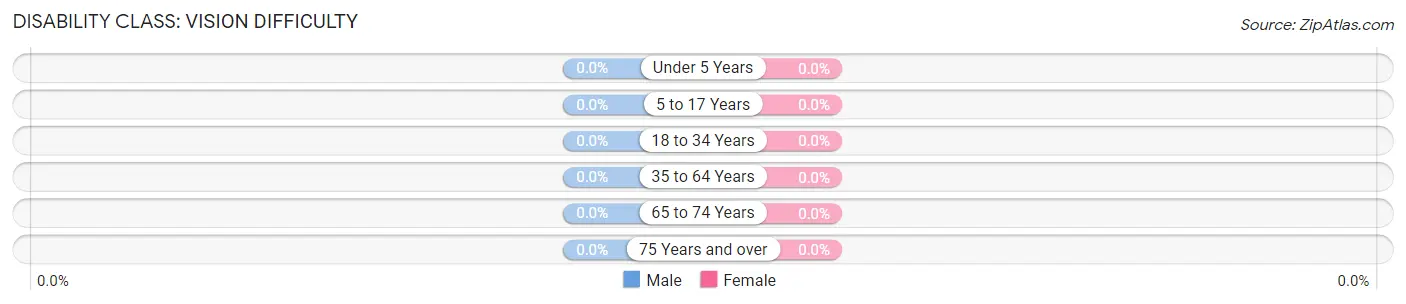
| Age Bracket | Male | Female |
| Under 5 Years | 0 (0.0%) | 0 (0.0%) |
| 5 to 17 Years | 0 (0.0%) | 0 (0.0%) |
| 18 to 34 Years | 0 (0.0%) | 0 (0.0%) |
| 35 to 64 Years | 0 (0.0%) | 0 (0.0%) |
| 65 to 74 Years | 0 (0.0%) | 0 (0.0%) |
| 75 Years and over | 0 (0.0%) | 0 (0.0%) |
Disability Class: Cognitive Difficulty
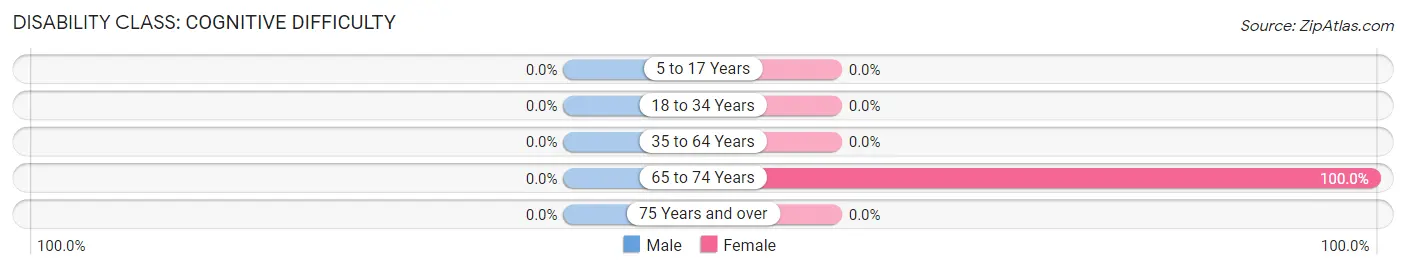
| Age Bracket | Male | Female |
| 5 to 17 Years | 0 (0.0%) | 0 (0.0%) |
| 18 to 34 Years | 0 (0.0%) | 0 (0.0%) |
| 35 to 64 Years | 0 (0.0%) | 0 (0.0%) |
| 65 to 74 Years | 0 (0.0%) | 1 (100.0%) |
| 75 Years and over | 0 (0.0%) | 0 (0.0%) |
Disability Class: Ambulatory Difficulty
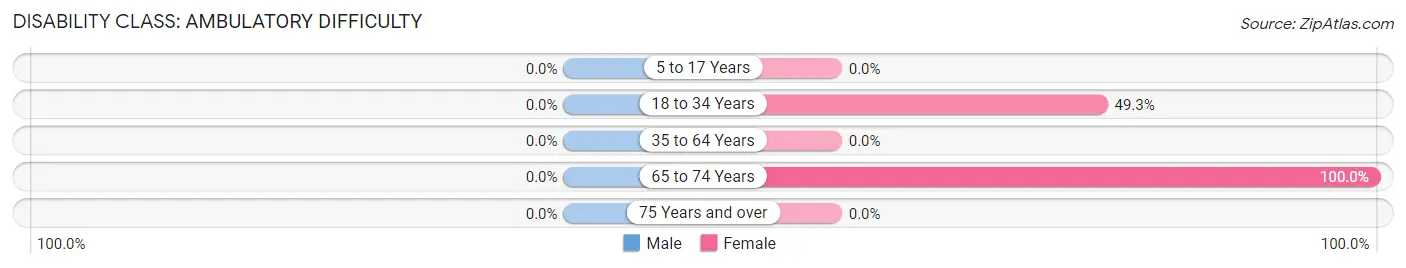
| Age Bracket | Male | Female |
| 5 to 17 Years | 0 (0.0%) | 0 (0.0%) |
| 18 to 34 Years | 0 (0.0%) | 37 (49.3%) |
| 35 to 64 Years | 0 (0.0%) | 0 (0.0%) |
| 65 to 74 Years | 0 (0.0%) | 1 (100.0%) |
| 75 Years and over | 0 (0.0%) | 0 (0.0%) |
Disability Class: Self-Care Difficulty
| Age Bracket | Male | Female |
| 5 to 17 Years | 0 (0.0%) | 0 (0.0%) |
| 18 to 34 Years | 0 (0.0%) | 0 (0.0%) |
| 35 to 64 Years | 0 (0.0%) | 0 (0.0%) |
| 65 to 74 Years | 0 (0.0%) | 0 (0.0%) |
| 75 Years and over | 0 (0.0%) | 0 (0.0%) |
Technology Access in Ribera
Computing Device Access in Ribera
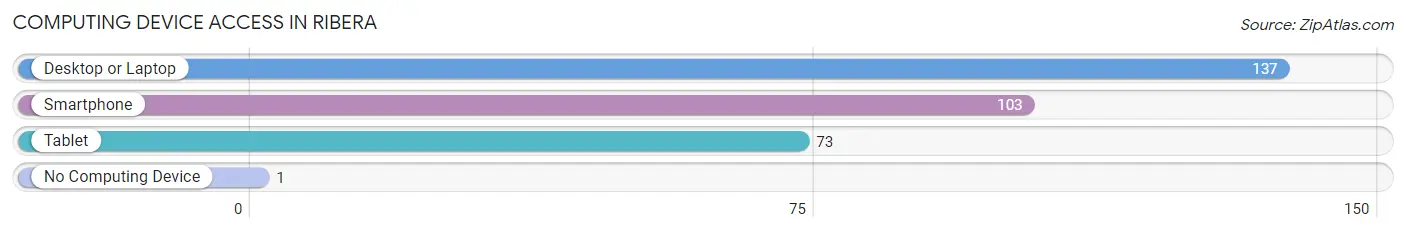
| Device Type | # Households | % Households |
| Desktop or Laptop | 137 | 99.3% |
| Smartphone | 103 | 74.6% |
| Tablet | 73 | 52.9% |
| No Computing Device | 1 | 0.7% |
| Total | 138 | 100.0% |
Internet Access in Ribera
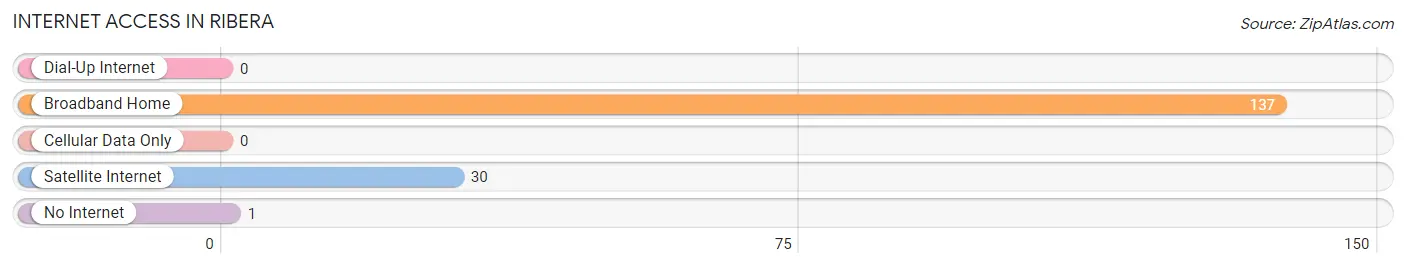
| Internet Type | # Households | % Households |
| Dial-Up Internet | 0 | 0.0% |
| Broadband Home | 137 | 99.3% |
| Cellular Data Only | 0 | 0.0% |
| Satellite Internet | 30 | 21.7% |
| No Internet | 1 | 0.7% |
| Total | 138 | 100.0% |
Ribera Summary
Ribera is a small village located in the San Miguel County of New Mexico. It is situated in the Chama River Valley, about 25 miles south of Las Vegas. The village has a population of about 500 people and is known for its rich cultural heritage and its unique landscape.
Geography
Ribera is located in the Chama River Valley, which is part of the Rio Grande Rift. The valley is surrounded by the Sangre de Cristo Mountains to the east and the San Juan Mountains to the west. The village is situated at an elevation of 6,000 feet and is located at the intersection of State Highway 3 and State Highway 518. The climate in Ribera is semi-arid, with hot summers and cold winters. The average annual precipitation is about 12 inches.
Economy
Ribera’s economy is largely based on agriculture and ranching. The village is home to several small farms and ranches, which produce a variety of crops, including alfalfa, corn, wheat, and hay. The village also has a small manufacturing sector, which produces furniture, clothing, and other goods.
Demographics
Ribera has a population of about 500 people. The majority of the population is of Hispanic or Latino origin. The median household income is about $30,000, and the median age is about 40 years old. The village has a high rate of poverty, with about 25% of the population living below the poverty line.
History
Ribera was founded in 1876 by a group of settlers from Mexico. The village was originally called “Ribera de San Miguel”, which means “river of Saint Michael”. The village was named after the nearby Chama River. The village was originally a farming and ranching community, and the settlers built several adobe homes and a church.
In the early 1900s, the village began to grow and develop. The railroad arrived in the village in 1910, and the village was incorporated in 1912. The village was a popular stop for travelers, and it became known for its hospitality and its unique culture.
In the 1950s, the village began to decline as the railroad stopped running and the population began to move away. The village was nearly abandoned by the 1970s, but it has since seen a resurgence in population and economic activity.
Today, Ribera is a small but vibrant village. The village is home to several small businesses, including a restaurant, a grocery store, and a post office. The village is also home to several cultural events, including the annual Ribera Fiesta, which celebrates the village’s unique culture and heritage.
Ribera is a unique and vibrant village with a rich cultural heritage. The village is home to a diverse population and a thriving economy. The village is a great place to visit and explore, and it is a reminder of the unique history and culture of New Mexico.
Common Questions
What is Per Capita Income in Ribera?
Per Capita income in Ribera is $21,135.
What is the Median Household income in Ribera?
Median Household Income in Ribera is $47,237.
What is Inequality or Gini Index in Ribera?
Inequality or Gini Index in Ribera is 0.29.
What is the Total Population of Ribera?
Total Population of Ribera is 330.
What is the Total Male Population of Ribera?
Total Male Population of Ribera is 179.
What is the Total Female Population of Ribera?
Total Female Population of Ribera is 151.
What is the Ratio of Males per 100 Females in Ribera?
There are 118.54 Males per 100 Females in Ribera.
What is the Ratio of Females per 100 Males in Ribera?
There are 84.36 Females per 100 Males in Ribera.
What is the Median Population Age in Ribera?
Median Population Age in Ribera is 30.2 Years.
What is the Average Family Size in Ribera
Average Family Size in Ribera is 3.1 People.
What is the Average Household Size in Ribera
Average Household Size in Ribera is 2.3 People.
How Large is the Labor Force in Ribera?
There are 164 People in the Labor Forcein in Ribera.
What is the Percentage of People in the Labor Force in Ribera?
57.7% of People are in the Labor Force in Ribera.
What is the Unemployment Rate in Ribera?
Unemployment Rate in Ribera is 23.2%.