Briarwood, ND Map & Demographics
Briarwood Map
Briarwood Overview
$104,984
PER CAPITA INCOME
$155,417
AVG FAMILY INCOME
$153,750
AVG HOUSEHOLD INCOME
0.56
INEQUALITY / GINI INDEX
56
TOTAL POPULATION
34
MALE POPULATION
22
FEMALE POPULATION
154.55
MALES / 100 FEMALES
64.71
FEMALES / 100 MALES
54.4
MEDIAN AGE
2.8
AVG FAMILY SIZE
2.7
AVG HOUSEHOLD SIZE
31
LABOR FORCE [ PEOPLE ]
64.6%
PERCENT IN LABOR FORCE
Briarwood Area Codes
Income in Briarwood
Income Overview in Briarwood
Per Capita Income in Briarwood is $104,984, while median incomes of families and households are $155,417 and $153,750 respectively.
| Characteristic | Number | Measure |
| Per Capita Income | 56 | $104,984 |
| Median Family Income | 19 | $155,417 |
| Mean Family Income | 19 | $388,089 |
| Median Household Income | 21 | $153,750 |
| Mean Household Income | 21 | $358,967 |
| Income Deficit | 19 | $0 |
| Wage / Income Gap (%) | 56 | 0.00% |
| Wage / Income Gap ($) | 56 | 100.00¢ per $1 |
| Gini / Inequality Index | 56 | 0.56 |
Earnings by Sex in Briarwood
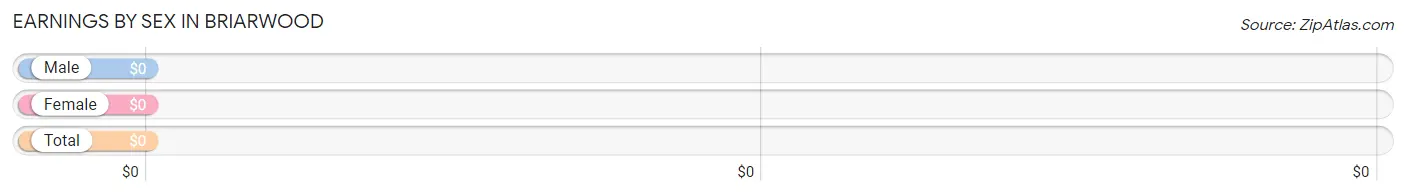
| Sex | Number | Average Earnings |
| Male | 24 (63.2%) | $0 |
| Female | 14 (36.8%) | $0 |
| Total | 38 (100.0%) | $0 |
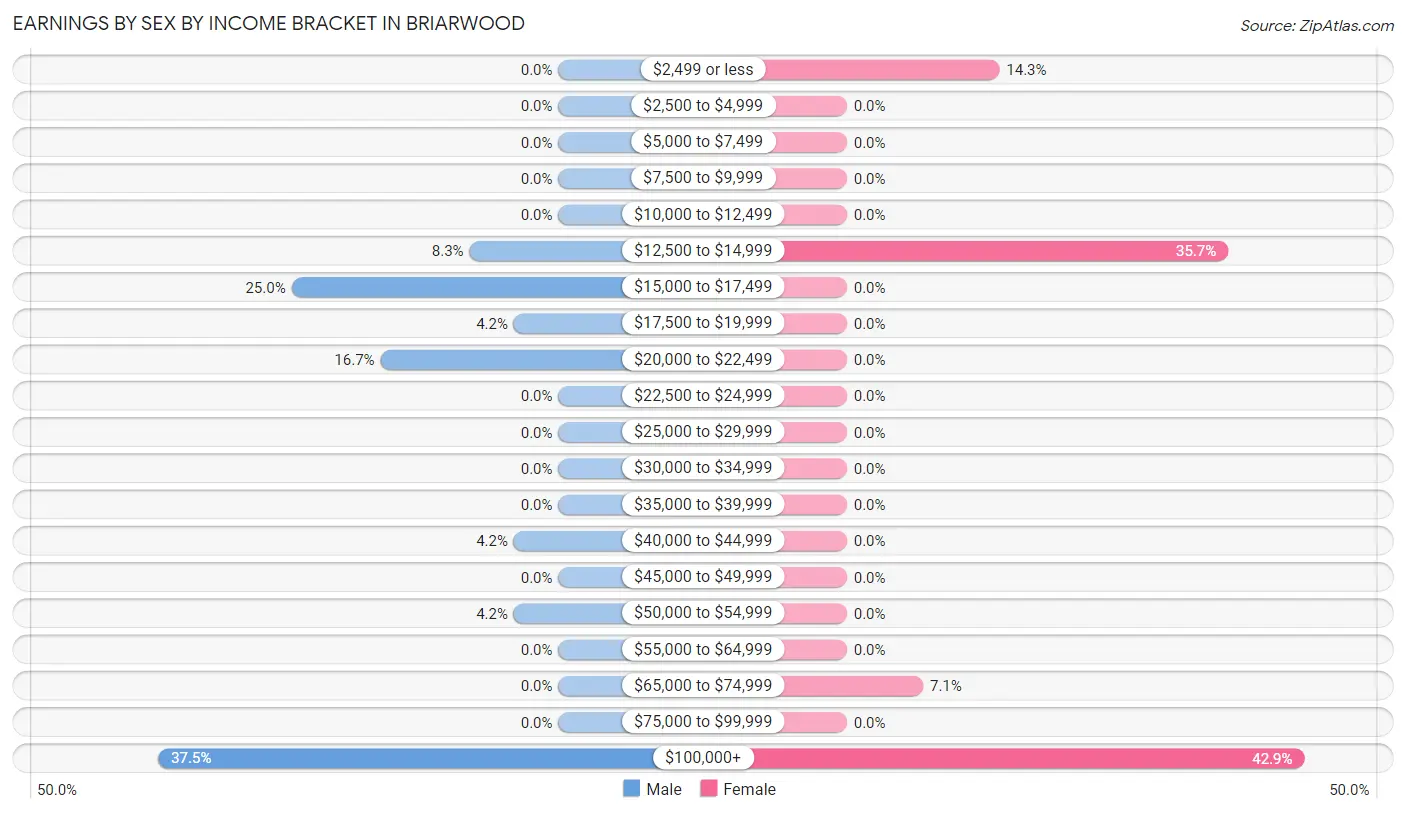
Earnings by Sex by Income Bracket in Briarwood
The most common earnings brackets in Briarwood are $100,000+ for men (9 | 37.5%) and $100,000+ for women (6 | 42.9%).
| Income | Male | Female |
| $2,499 or less | 0 (0.0%) | 2 (14.3%) |
| $2,500 to $4,999 | 0 (0.0%) | 0 (0.0%) |
| $5,000 to $7,499 | 0 (0.0%) | 0 (0.0%) |
| $7,500 to $9,999 | 0 (0.0%) | 0 (0.0%) |
| $10,000 to $12,499 | 0 (0.0%) | 0 (0.0%) |
| $12,500 to $14,999 | 2 (8.3%) | 5 (35.7%) |
| $15,000 to $17,499 | 6 (25.0%) | 0 (0.0%) |
| $17,500 to $19,999 | 1 (4.2%) | 0 (0.0%) |
| $20,000 to $22,499 | 4 (16.7%) | 0 (0.0%) |
| $22,500 to $24,999 | 0 (0.0%) | 0 (0.0%) |
| $25,000 to $29,999 | 0 (0.0%) | 0 (0.0%) |
| $30,000 to $34,999 | 0 (0.0%) | 0 (0.0%) |
| $35,000 to $39,999 | 0 (0.0%) | 0 (0.0%) |
| $40,000 to $44,999 | 1 (4.2%) | 0 (0.0%) |
| $45,000 to $49,999 | 0 (0.0%) | 0 (0.0%) |
| $50,000 to $54,999 | 1 (4.2%) | 0 (0.0%) |
| $55,000 to $64,999 | 0 (0.0%) | 0 (0.0%) |
| $65,000 to $74,999 | 0 (0.0%) | 1 (7.1%) |
| $75,000 to $99,999 | 0 (0.0%) | 0 (0.0%) |
| $100,000+ | 9 (37.5%) | 6 (42.9%) |
| Total | 24 (100.0%) | 14 (100.0%) |
Earnings by Sex by Educational Attainment in Briarwood
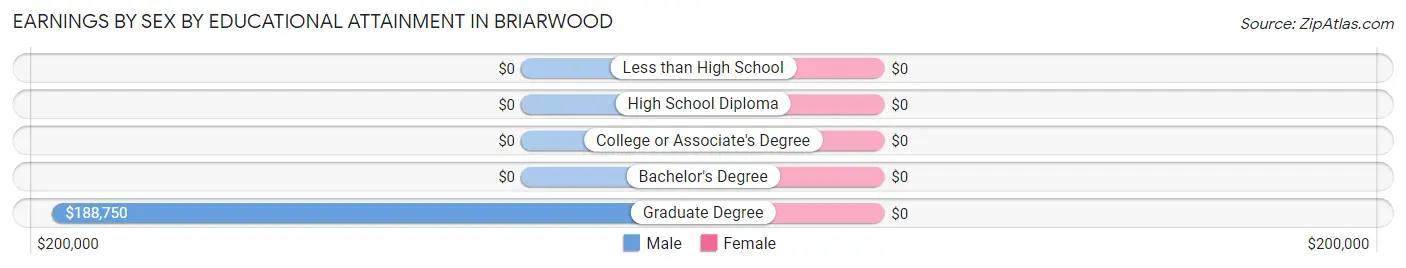
| Educational Attainment | Male Income | Female Income |
| Less than High School | - | - |
| High School Diploma | - | - |
| College or Associate's Degree | - | - |
| Bachelor's Degree | - | - |
| Graduate Degree | $188,750 | $0 |
| Total | - | - |
Family Income in Briarwood
Family Income Brackets in Briarwood
According to the Briarwood family income data, there are 7 families falling into the $200,000+ income range, which is the most common income bracket and makes up 36.8% of all families.
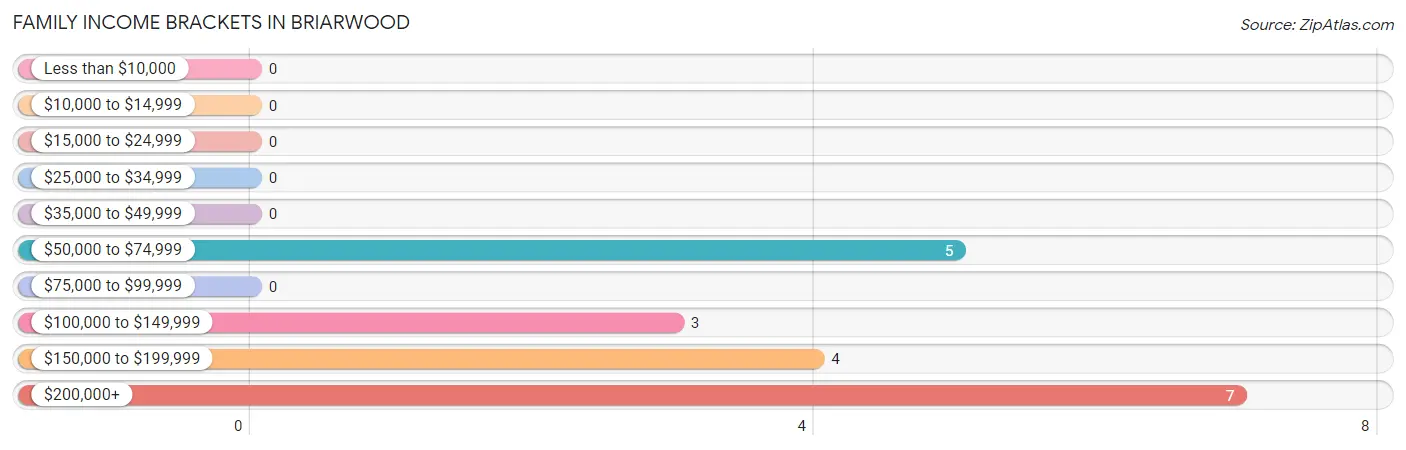
| Income Bracket | # Families | % Families |
| Less than $10,000 | 0 | 0.0% |
| $10,000 to $14,999 | 0 | 0.0% |
| $15,000 to $24,999 | 0 | 0.0% |
| $25,000 to $34,999 | 0 | 0.0% |
| $35,000 to $49,999 | 0 | 0.0% |
| $50,000 to $74,999 | 5 | 26.3% |
| $75,000 to $99,999 | 0 | 0.0% |
| $100,000 to $149,999 | 3 | 15.8% |
| $150,000 to $199,999 | 4 | 21.1% |
| $200,000+ | 7 | 36.8% |
Family Income by Famaliy Size in Briarwood
4-person families (6 | 31.6%) account for the highest median family income in Briarwood with $250,001 per family, while 2-person families (8 | 42.1%) have the highest median income of $77,500 per family member.
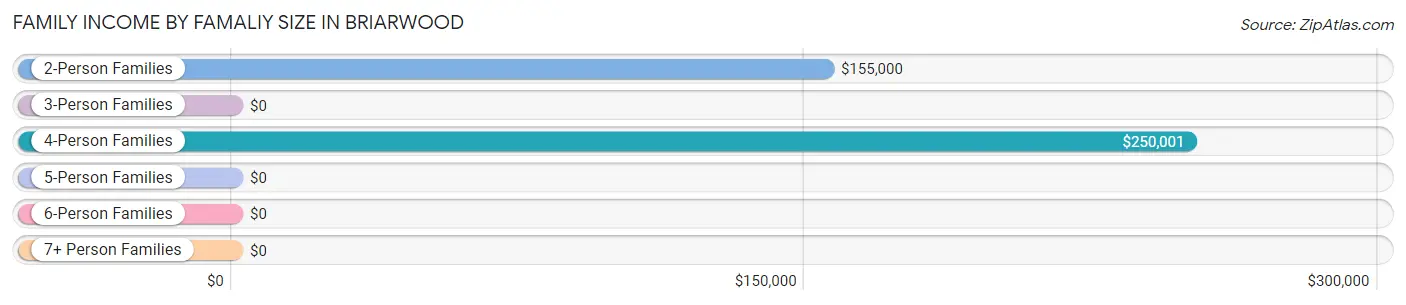
| Income Bracket | # Families | Median Income |
| 2-Person Families | 8 (42.1%) | $155,000 |
| 3-Person Families | 5 (26.3%) | $0 |
| 4-Person Families | 6 (31.6%) | $250,001 |
| 5-Person Families | 0 (0.0%) | $0 |
| 6-Person Families | 0 (0.0%) | $0 |
| 7+ Person Families | 0 (0.0%) | $0 |
| Total | 19 (100.0%) | $155,417 |
Family Income by Number of Earners in Briarwood
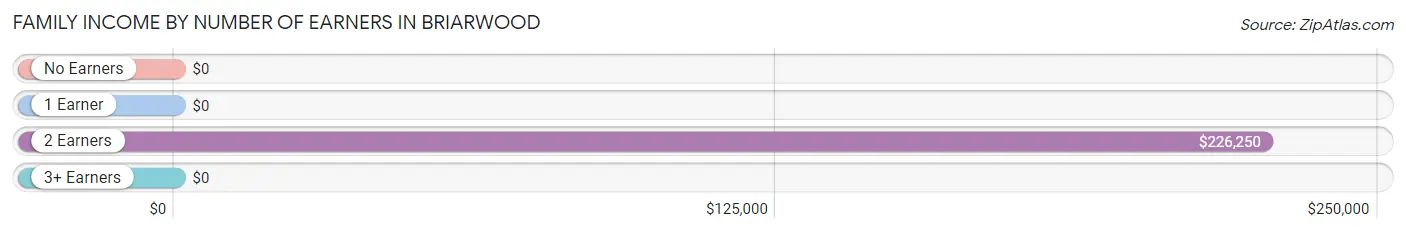
| Number of Earners | # Families | Median Income |
| No Earners | 1 (5.3%) | $0 |
| 1 Earner | 5 (26.3%) | $0 |
| 2 Earners | 8 (42.1%) | $226,250 |
| 3+ Earners | 5 (26.3%) | $0 |
| Total | 19 (100.0%) | $155,417 |
Household Income in Briarwood
Household Income Brackets in Briarwood
With 7 households falling in the category, the $200,000+ income range is the most frequent in Briarwood, accounting for 33.3% of all households.
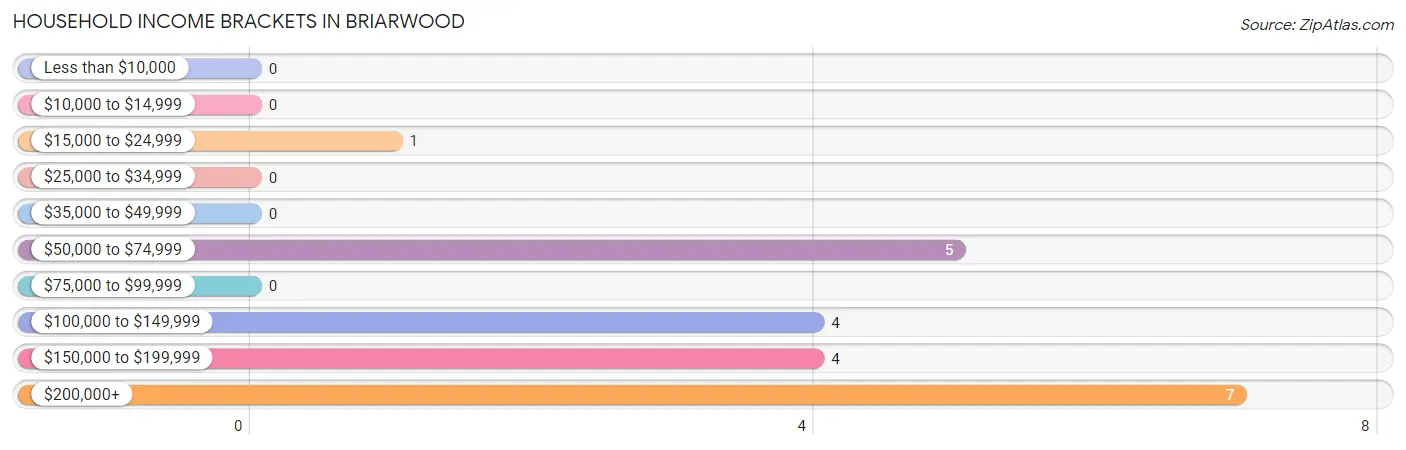
| Income Bracket | # Households | % Households |
| Less than $10,000 | 0 | 0.0% |
| $10,000 to $14,999 | 0 | 0.0% |
| $15,000 to $24,999 | 1 | 4.8% |
| $25,000 to $34,999 | 0 | 0.0% |
| $35,000 to $49,999 | 0 | 0.0% |
| $50,000 to $74,999 | 5 | 23.8% |
| $75,000 to $99,999 | 0 | 0.0% |
| $100,000 to $149,999 | 4 | 19.0% |
| $150,000 to $199,999 | 4 | 19.0% |
| $200,000+ | 7 | 33.3% |
Household Income by Householder Age in Briarwood
The median household income in Briarwood is $153,750, with the highest median household income of $155,833 found in the 45 to 64 years age bracket for the primary householder. A total of 18 households (85.7%) fall into this category.
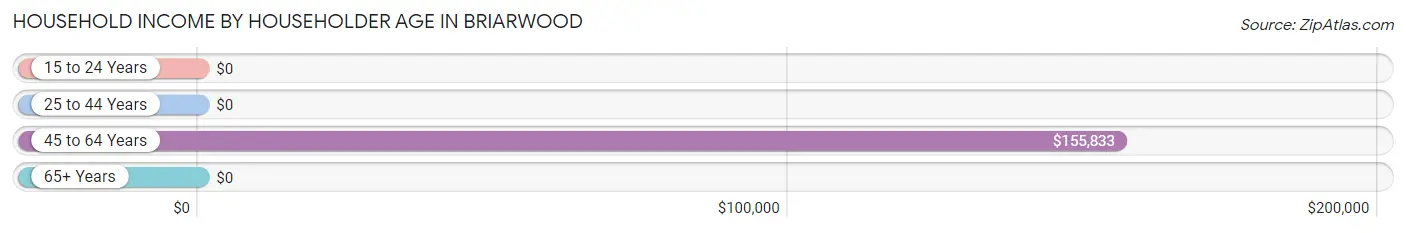
| Income Bracket | # Households | Median Income |
| 15 to 24 Years | 0 (0.0%) | $0 |
| 25 to 44 Years | 0 (0.0%) | $0 |
| 45 to 64 Years | 18 (85.7%) | $155,833 |
| 65+ Years | 3 (14.3%) | $0 |
| Total | 21 (100.0%) | $153,750 |
Poverty in Briarwood
Income Below Poverty by Sex and Age in Briarwood
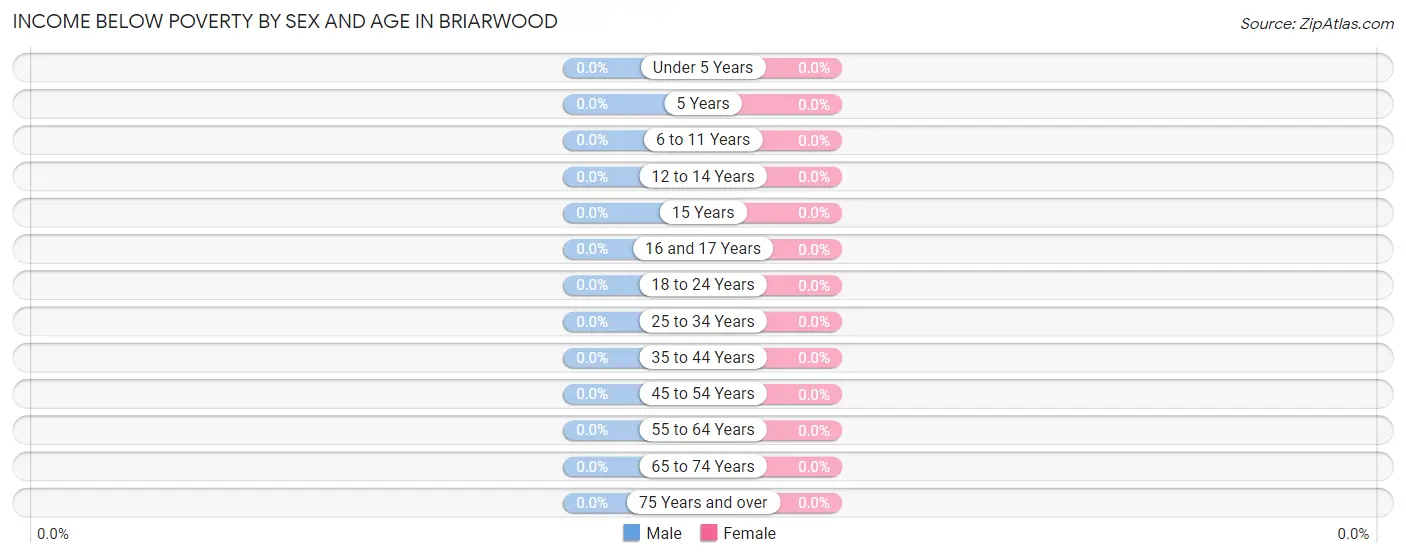
| Age Bracket | Male | Female |
| Under 5 Years | 0 (0.0%) | 0 (0.0%) |
| 5 Years | 0 (0.0%) | 0 (0.0%) |
| 6 to 11 Years | 0 (0.0%) | 0 (0.0%) |
| 12 to 14 Years | 0 (0.0%) | 0 (0.0%) |
| 15 Years | 0 (0.0%) | 0 (0.0%) |
| 16 and 17 Years | 0 (0.0%) | 0 (0.0%) |
| 18 to 24 Years | 0 (0.0%) | 0 (0.0%) |
| 25 to 34 Years | 0 (0.0%) | 0 (0.0%) |
| 35 to 44 Years | 0 (0.0%) | 0 (0.0%) |
| 45 to 54 Years | 0 (0.0%) | 0 (0.0%) |
| 55 to 64 Years | 0 (0.0%) | 0 (0.0%) |
| 65 to 74 Years | 0 (0.0%) | 0 (0.0%) |
| 75 Years and over | 0 (0.0%) | 0 (0.0%) |
| Total | 0 (0.0%) | 0 (0.0%) |
Income Above Poverty by Sex and Age in Briarwood
According to the poverty statistics in Briarwood, males aged 6 to 11 years and females aged 12 to 14 years are the age groups that are most secure financially, with 100.0% of males and 100.0% of females in these age groups living above the poverty line.
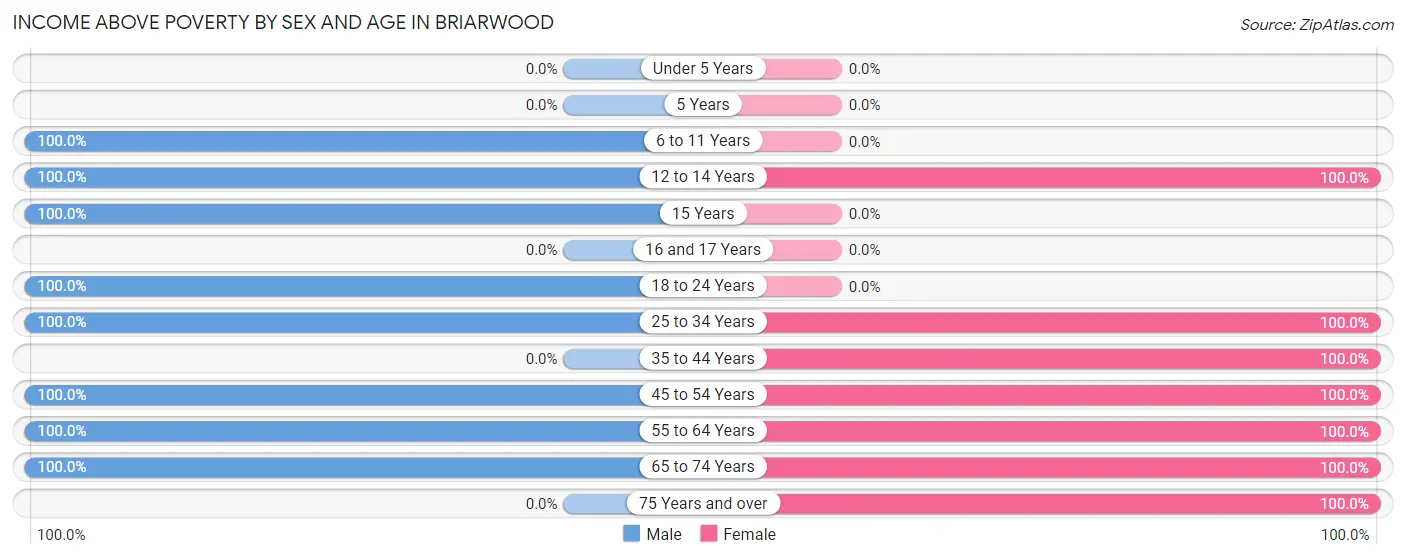
| Age Bracket | Male | Female |
| Under 5 Years | 0 (0.0%) | 0 (0.0%) |
| 5 Years | 0 (0.0%) | 0 (0.0%) |
| 6 to 11 Years | 1 (100.0%) | 0 (0.0%) |
| 12 to 14 Years | 3 (100.0%) | 1 (100.0%) |
| 15 Years | 3 (100.0%) | 0 (0.0%) |
| 16 and 17 Years | 0 (0.0%) | 0 (0.0%) |
| 18 to 24 Years | 6 (100.0%) | 0 (0.0%) |
| 25 to 34 Years | 1 (100.0%) | 1 (100.0%) |
| 35 to 44 Years | 0 (0.0%) | 1 (100.0%) |
| 45 to 54 Years | 5 (100.0%) | 9 (100.0%) |
| 55 to 64 Years | 11 (100.0%) | 7 (100.0%) |
| 65 to 74 Years | 4 (100.0%) | 2 (100.0%) |
| 75 Years and over | 0 (0.0%) | 1 (100.0%) |
| Total | 34 (100.0%) | 22 (100.0%) |
Income Below Poverty Among Married-Couple Families in Briarwood
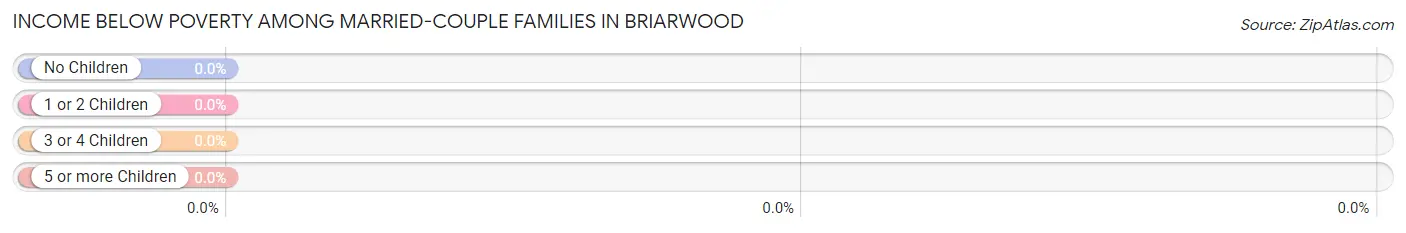
| Children | Above Poverty | Below Poverty |
| No Children | 13 (100.0%) | 0 (0.0%) |
| 1 or 2 Children | 6 (100.0%) | 0 (0.0%) |
| 3 or 4 Children | 0 (0.0%) | 0 (0.0%) |
| 5 or more Children | 0 (0.0%) | 0 (0.0%) |
| Total | 19 (100.0%) | 0 (0.0%) |
Income Below Poverty Among Single-Parent Households in Briarwood
| Children | Single Father | Single Mother |
| No Children | 0 (0.0%) | 0 (0.0%) |
| 1 or 2 Children | 0 (0.0%) | 0 (0.0%) |
| 3 or 4 Children | 0 (0.0%) | 0 (0.0%) |
| 5 or more Children | 0 (0.0%) | 0 (0.0%) |
| Total | 0 (0.0%) | 0 (0.0%) |
Income Below Poverty Among Married-Couple vs Single-Parent Households in Briarwood
| Children | Married-Couple Families | Single-Parent Households |
| No Children | 0 (0.0%) | 0 (0.0%) |
| 1 or 2 Children | 0 (0.0%) | 0 (0.0%) |
| 3 or 4 Children | 0 (0.0%) | 0 (0.0%) |
| 5 or more Children | 0 (0.0%) | 0 (0.0%) |
| Total | 0 (0.0%) | 0 (0.0%) |
Race in Briarwood
The most populous races in Briarwood are White / Caucasian (52 | 92.9%), and Asian (4 | 7.1%).
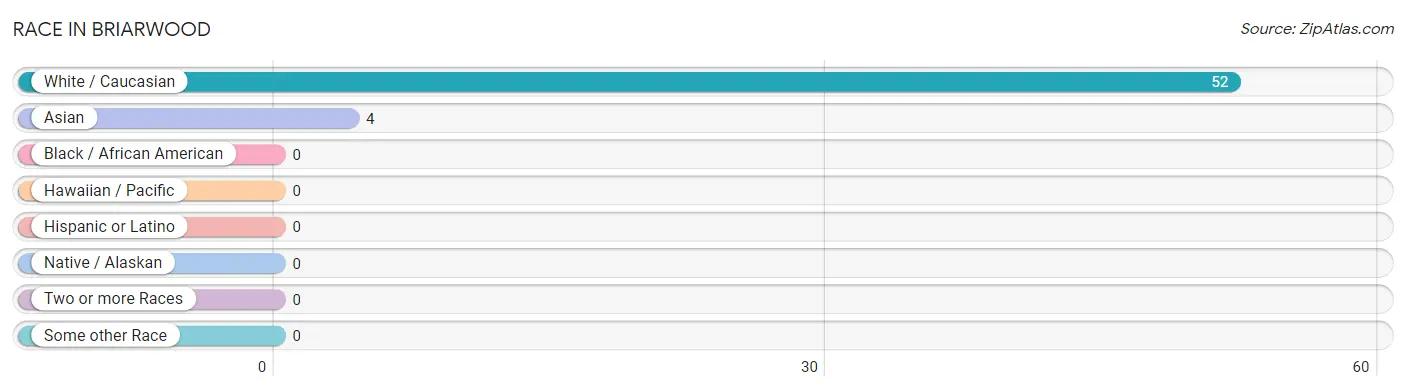
| Race | # Population | % Population |
| Asian | 4 | 7.1% |
| Black / African American | 0 | 0.0% |
| Hawaiian / Pacific | 0 | 0.0% |
| Hispanic or Latino | 0 | 0.0% |
| Native / Alaskan | 0 | 0.0% |
| White / Caucasian | 52 | 92.9% |
| Two or more Races | 0 | 0.0% |
| Some other Race | 0 | 0.0% |
| Total | 56 | 100.0% |
Ancestry in Briarwood
The most populous ancestries reported in Briarwood are Norwegian (17 | 30.4%), German (16 | 28.6%), Irish (8 | 14.3%), Thai (4 | 7.1%), and Scandinavian (3 | 5.4%), together accounting for 85.7% of all Briarwood residents.
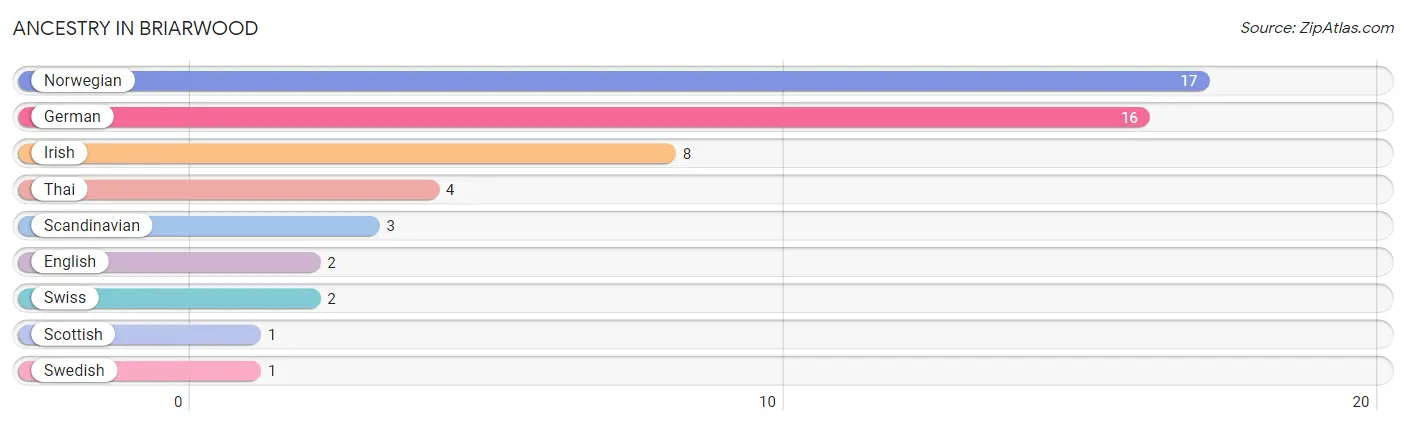
| Ancestry | # Population | % Population |
| English | 2 | 3.6% |
| German | 16 | 28.6% |
| Irish | 8 | 14.3% |
| Norwegian | 17 | 30.4% |
| Scandinavian | 3 | 5.4% |
| Scottish | 1 | 1.8% |
| Swedish | 1 | 1.8% |
| Swiss | 2 | 3.6% |
| Thai | 4 | 7.1% | View All 9 Rows |
Immigrants in Briarwood
The most numerous immigrant groups reported in Briarwood came from Africa (1 | 1.8%), Asia (1 | 1.8%), Canada (1 | 1.8%), Eastern Africa (1 | 1.8%), and Europe (1 | 1.8%), together accounting for 8.9% of all Briarwood residents.
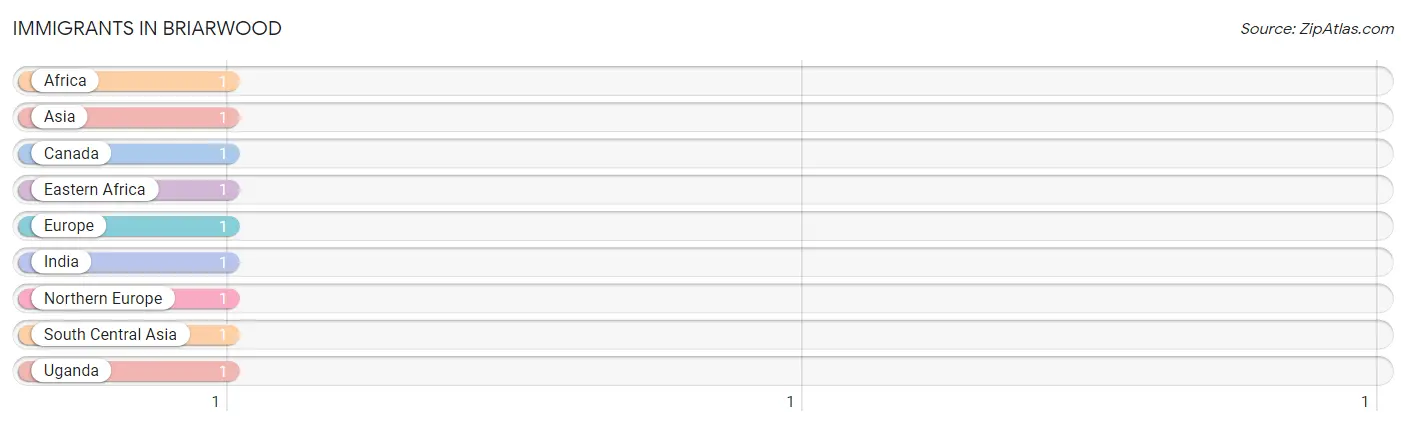
| Immigration Origin | # Population | % Population |
| Africa | 1 | 1.8% |
| Asia | 1 | 1.8% |
| Canada | 1 | 1.8% |
| Eastern Africa | 1 | 1.8% |
| Europe | 1 | 1.8% |
| India | 1 | 1.8% |
| Northern Europe | 1 | 1.8% |
| South Central Asia | 1 | 1.8% |
| Uganda | 1 | 1.8% | View All 9 Rows |
Sex and Age in Briarwood
Sex and Age in Briarwood
The most populous age groups in Briarwood are 55 to 59 Years (8 | 23.5%) for men and 55 to 59 Years (7 | 31.8%) for women.
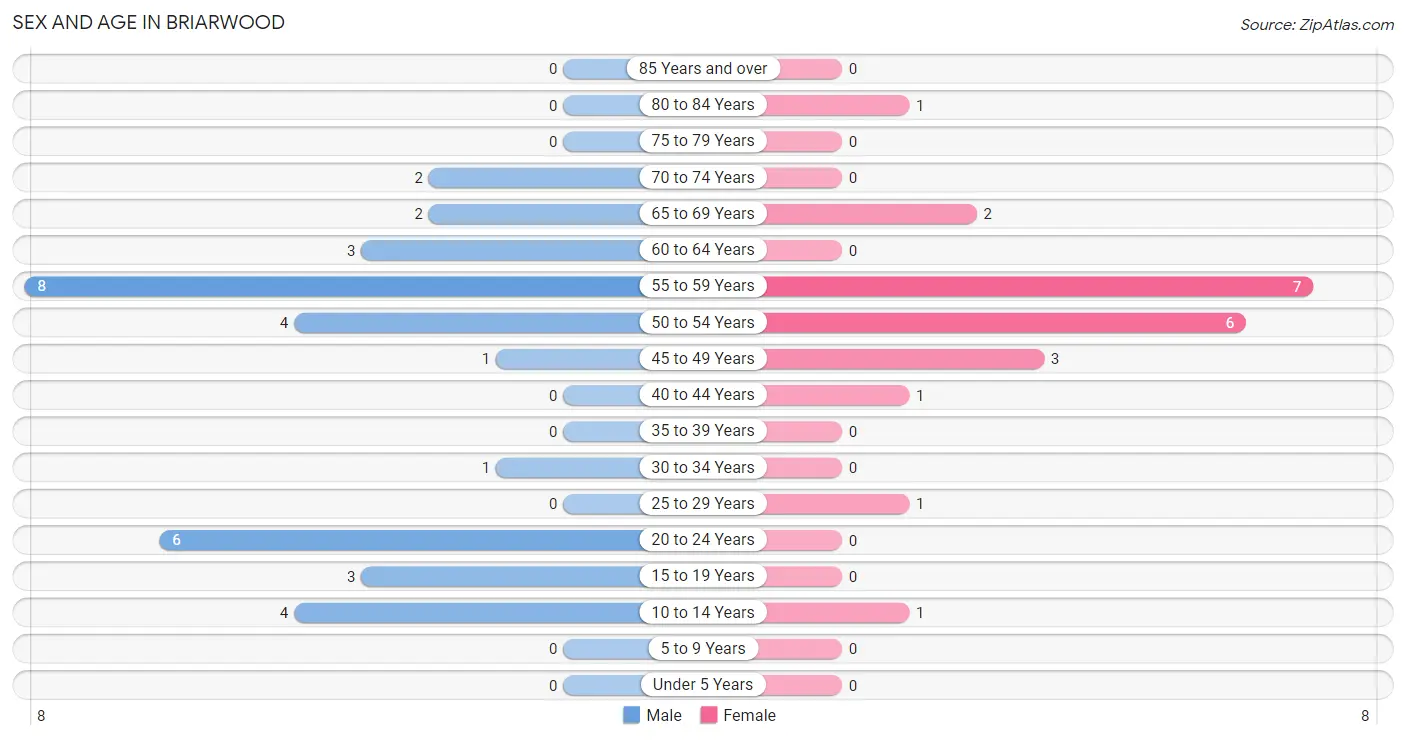
| Age Bracket | Male | Female |
| Under 5 Years | 0 (0.0%) | 0 (0.0%) |
| 5 to 9 Years | 0 (0.0%) | 0 (0.0%) |
| 10 to 14 Years | 4 (11.8%) | 1 (4.5%) |
| 15 to 19 Years | 3 (8.8%) | 0 (0.0%) |
| 20 to 24 Years | 6 (17.6%) | 0 (0.0%) |
| 25 to 29 Years | 0 (0.0%) | 1 (4.5%) |
| 30 to 34 Years | 1 (2.9%) | 0 (0.0%) |
| 35 to 39 Years | 0 (0.0%) | 0 (0.0%) |
| 40 to 44 Years | 0 (0.0%) | 1 (4.5%) |
| 45 to 49 Years | 1 (2.9%) | 3 (13.6%) |
| 50 to 54 Years | 4 (11.8%) | 6 (27.3%) |
| 55 to 59 Years | 8 (23.5%) | 7 (31.8%) |
| 60 to 64 Years | 3 (8.8%) | 0 (0.0%) |
| 65 to 69 Years | 2 (5.9%) | 2 (9.1%) |
| 70 to 74 Years | 2 (5.9%) | 0 (0.0%) |
| 75 to 79 Years | 0 (0.0%) | 0 (0.0%) |
| 80 to 84 Years | 0 (0.0%) | 1 (4.5%) |
| 85 Years and over | 0 (0.0%) | 0 (0.0%) |
| Total | 34 (100.0%) | 22 (100.0%) |
Families and Households in Briarwood
Median Family Size in Briarwood
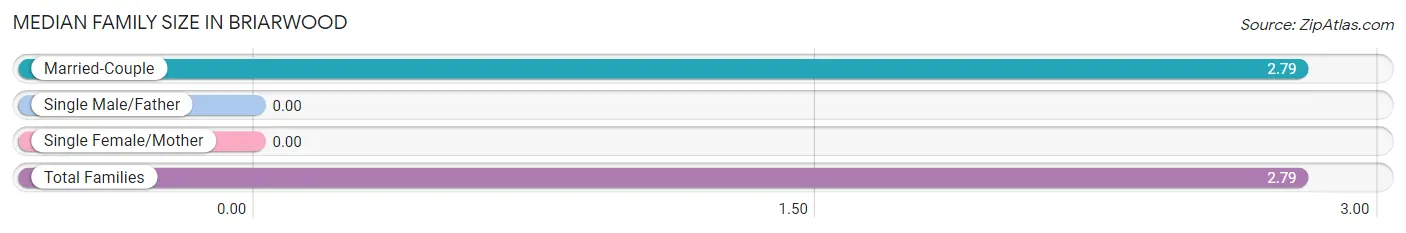
| Family Type | # Families | Family Size |
| Married-Couple | 19 (100.0%) | 2.79 |
| Single Male/Father | 0 (0.0%) | - |
| Single Female/Mother | 0 (0.0%) | - |
| Total Families | 19 (100.0%) | 2.79 |
Median Household Size in Briarwood
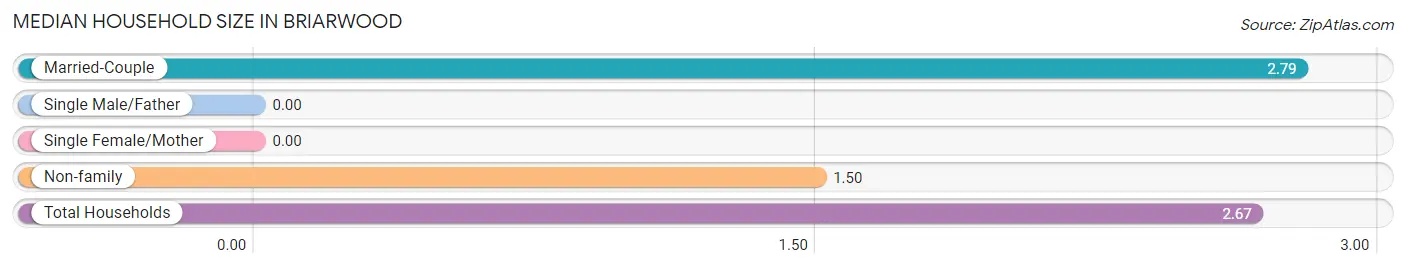
| Household Type | # Households | Household Size |
| Married-Couple | 19 (90.5%) | 2.79 |
| Single Male/Father | 0 (0.0%) | - |
| Single Female/Mother | 0 (0.0%) | - |
| Non-family | 2 (9.5%) | 1.50 |
| Total Households | 21 (100.0%) | 2.67 |
Household Size by Marriage Status in Briarwood
Out of a total of 21 households in Briarwood, 19 (90.5%) are family households, while 2 (9.5%) are nonfamily households. The most numerous type of family households are 2-person households, comprising 8, and the most common type of nonfamily households are 1-person households, comprising 1.
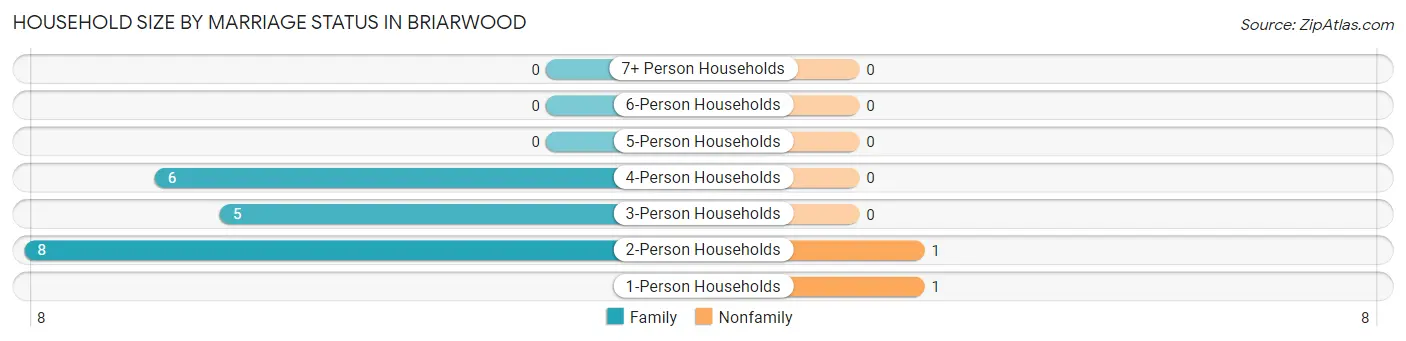
| Household Size | Family Households | Nonfamily Households |
| 1-Person Households | - | 1 (4.8%) |
| 2-Person Households | 8 (38.1%) | 1 (4.8%) |
| 3-Person Households | 5 (23.8%) | 0 (0.0%) |
| 4-Person Households | 6 (28.6%) | 0 (0.0%) |
| 5-Person Households | 0 (0.0%) | 0 (0.0%) |
| 6-Person Households | 0 (0.0%) | 0 (0.0%) |
| 7+ Person Households | 0 (0.0%) | 0 (0.0%) |
| Total | 19 (90.5%) | 2 (9.5%) |
Female Fertility in Briarwood
Fertility by Age in Briarwood
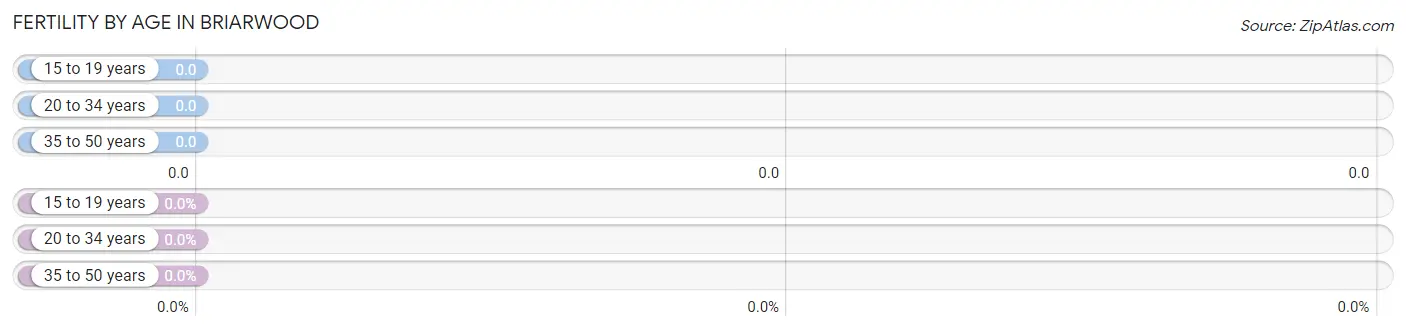
| Age Bracket | Women with Births | Births / 1,000 Women |
| 15 to 19 years | 0 (0.0%) | 0.0 |
| 20 to 34 years | 0 (0.0%) | 0.0 |
| 35 to 50 years | 0 (0.0%) | 0.0 |
| Total | 0 (0.0%) | 0.0 |
Fertility by Age by Marriage Status in Briarwood
| Age Bracket | Married | Unmarried |
| 15 to 19 years | 0 (0.0%) | 0 (0.0%) |
| 20 to 34 years | 0 (0.0%) | 0 (0.0%) |
| 35 to 50 years | 0 (0.0%) | 0 (0.0%) |
| Total | 0 (0.0%) | 0 (0.0%) |
Fertility by Education in Briarwood
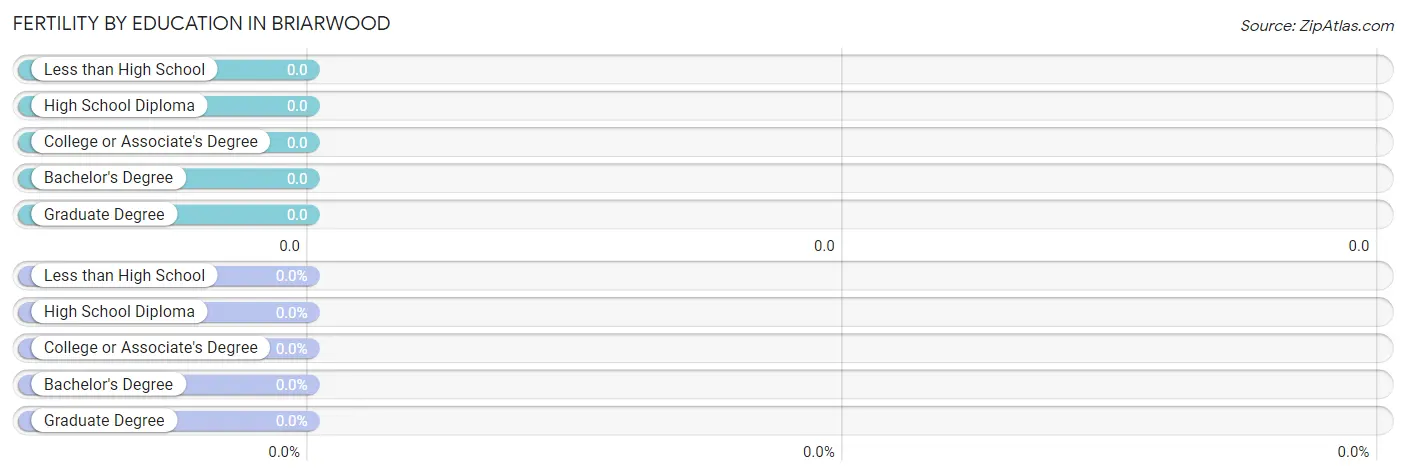
| Educational Attainment | Women with Births | Births / 1,000 Women |
| Less than High School | 0 (0.0%) | 0.0 |
| High School Diploma | 0 (0.0%) | 0.0 |
| College or Associate's Degree | 0 (0.0%) | 0.0 |
| Bachelor's Degree | 0 (0.0%) | 0.0 |
| Graduate Degree | 0 (0.0%) | 0.0 |
| Total | 0 (0.0%) | 0.0 |
Fertility by Education by Marriage Status in Briarwood
| Educational Attainment | Married | Unmarried |
| Less than High School | 0 (0.0%) | 0 (0.0%) |
| High School Diploma | 0 (0.0%) | 0 (0.0%) |
| College or Associate's Degree | 0 (0.0%) | 0 (0.0%) |
| Bachelor's Degree | 0 (0.0%) | 0 (0.0%) |
| Graduate Degree | 0 (0.0%) | 0 (0.0%) |
| Total | 0 (0.0%) | 0 (0.0%) |
Employment Characteristics in Briarwood
Employment by Class of Employer in Briarwood
Among the 31 employed individuals in Briarwood, private company employees (13 | 41.9%), self-employed (not incorporated) (9 | 29.0%), and not-for-profit organizations (4 | 12.9%) make up the most common classes of employment.
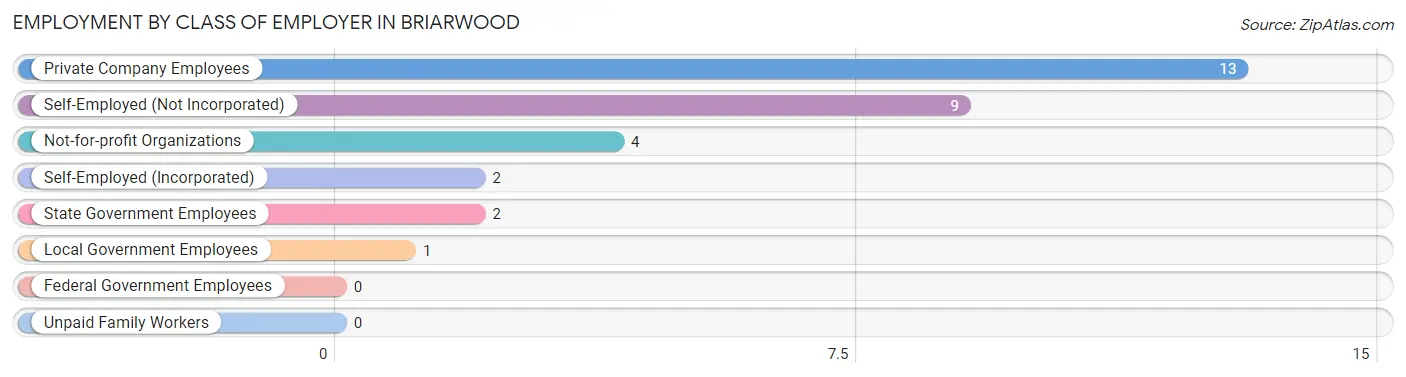
| Employer Class | # Employees | % Employees |
| Private Company Employees | 13 | 41.9% |
| Self-Employed (Incorporated) | 2 | 6.5% |
| Self-Employed (Not Incorporated) | 9 | 29.0% |
| Not-for-profit Organizations | 4 | 12.9% |
| Local Government Employees | 1 | 3.2% |
| State Government Employees | 2 | 6.5% |
| Federal Government Employees | 0 | 0.0% |
| Unpaid Family Workers | 0 | 0.0% |
| Total | 31 | 100.0% |
Employment Status by Age in Briarwood
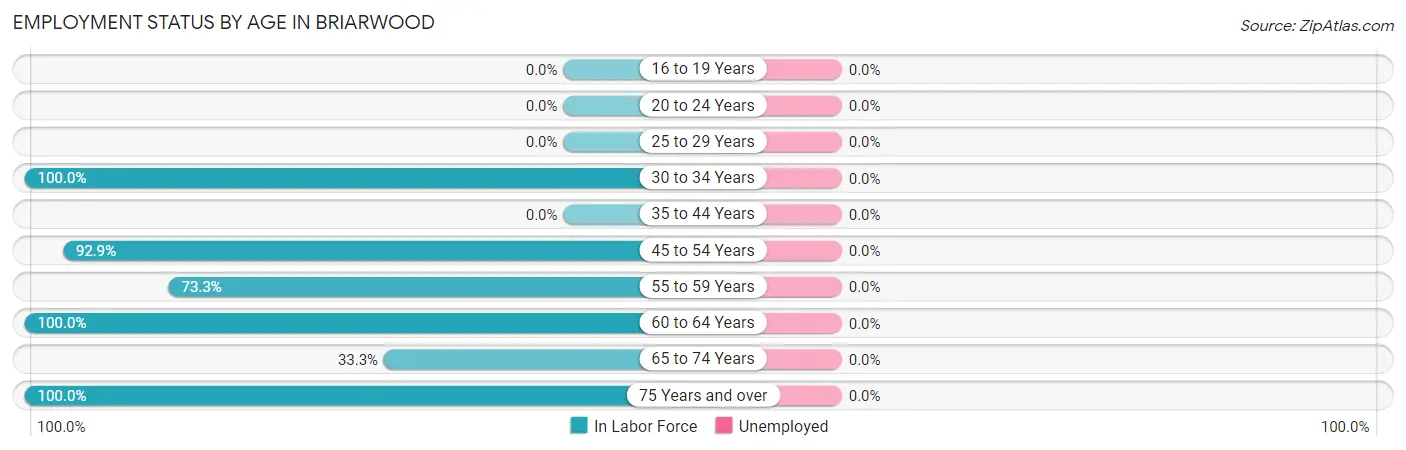
| Age Bracket | In Labor Force | Unemployed |
| 16 to 19 Years | 0 (0.0%) | 0 (0.0%) |
| 20 to 24 Years | 0 (0.0%) | 0 (0.0%) |
| 25 to 29 Years | 0 (0.0%) | 0 (0.0%) |
| 30 to 34 Years | 1 (100.0%) | 0 (0.0%) |
| 35 to 44 Years | 0 (0.0%) | 0 (0.0%) |
| 45 to 54 Years | 13 (92.9%) | 0 (0.0%) |
| 55 to 59 Years | 11 (73.3%) | 0 (0.0%) |
| 60 to 64 Years | 3 (100.0%) | 0 (0.0%) |
| 65 to 74 Years | 2 (33.3%) | 0 (0.0%) |
| 75 Years and over | 1 (100.0%) | 0 (0.0%) |
| Total | 31 (64.6%) | 0 (0.0%) |
Employment Status by Educational Attainment in Briarwood
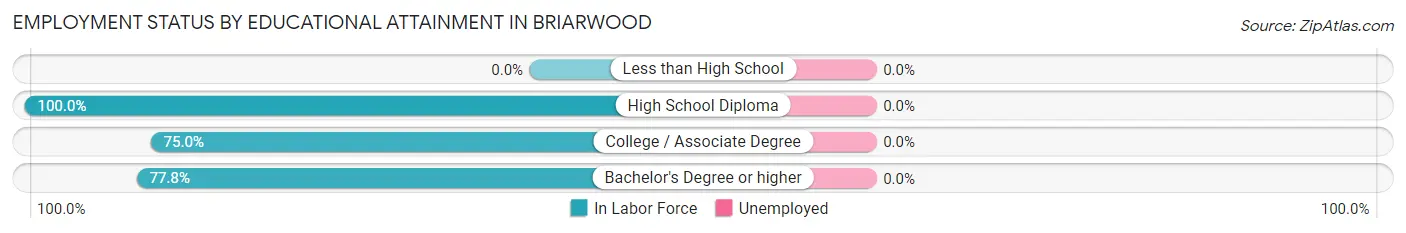
| Educational Attainment | In Labor Force | Unemployed |
| Less than High School | 0 (0.0%) | 0 (0.0%) |
| High School Diploma | 5 (100.0%) | 0 (0.0%) |
| College / Associate Degree | 9 (75.0%) | 0 (0.0%) |
| Bachelor's Degree or higher | 14 (77.8%) | 0 (0.0%) |
| Total | 28 (80.0%) | 0 (0.0%) |
Employment Occupations by Sex in Briarwood
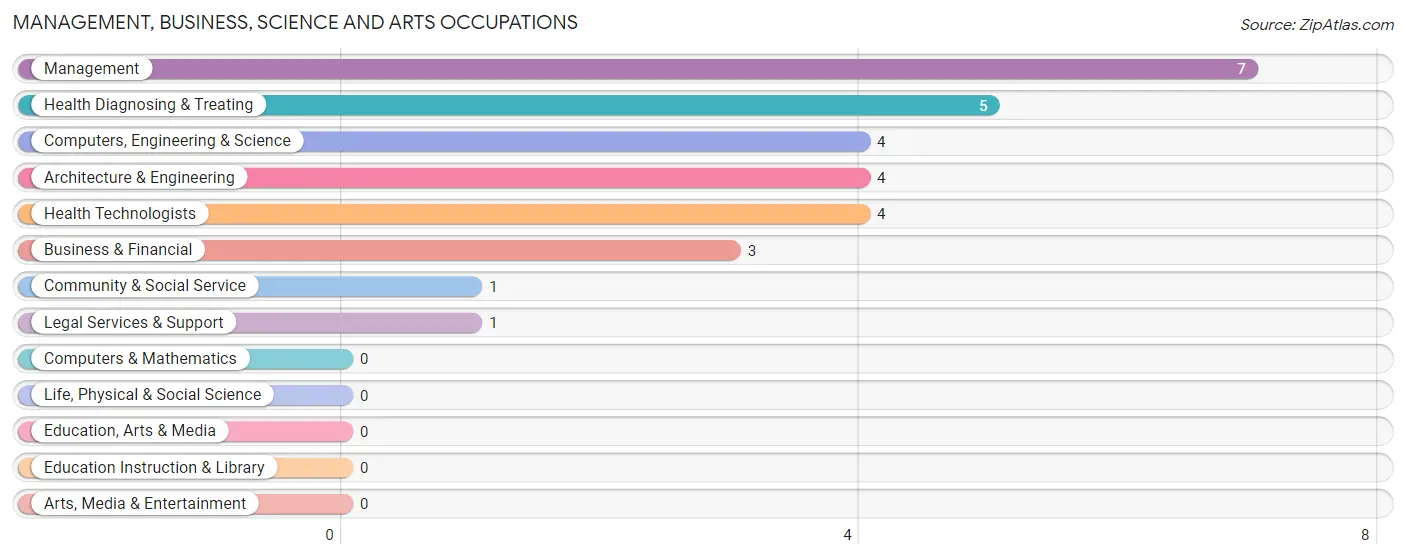
Management, Business, Science and Arts Occupations
The most common Management, Business, Science and Arts occupations in Briarwood are Management (7 | 22.6%), Health Diagnosing & Treating (5 | 16.1%), Computers, Engineering & Science (4 | 12.9%), Architecture & Engineering (4 | 12.9%), and Health Technologists (4 | 12.9%).
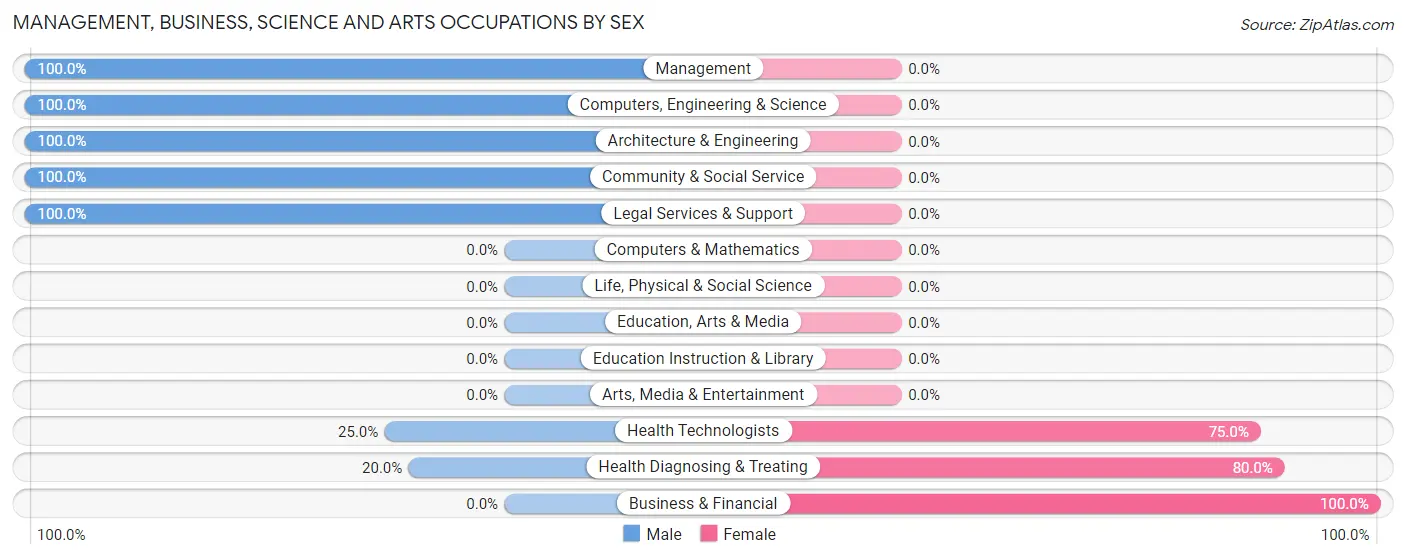
Management, Business, Science and Arts Occupations by Sex
Within the Management, Business, Science and Arts occupations in Briarwood, the most male-oriented occupations are Management (100.0%), Computers, Engineering & Science (100.0%), and Architecture & Engineering (100.0%), while the most female-oriented occupations are Business & Financial (100.0%), Health Diagnosing & Treating (80.0%), and Health Technologists (75.0%).
| Occupation | Male | Female |
| Management | 7 (100.0%) | 0 (0.0%) |
| Business & Financial | 0 (0.0%) | 3 (100.0%) |
| Computers, Engineering & Science | 4 (100.0%) | 0 (0.0%) |
| Computers & Mathematics | 0 (0.0%) | 0 (0.0%) |
| Architecture & Engineering | 4 (100.0%) | 0 (0.0%) |
| Life, Physical & Social Science | 0 (0.0%) | 0 (0.0%) |
| Community & Social Service | 1 (100.0%) | 0 (0.0%) |
| Education, Arts & Media | 0 (0.0%) | 0 (0.0%) |
| Legal Services & Support | 1 (100.0%) | 0 (0.0%) |
| Education Instruction & Library | 0 (0.0%) | 0 (0.0%) |
| Arts, Media & Entertainment | 0 (0.0%) | 0 (0.0%) |
| Health Diagnosing & Treating | 1 (20.0%) | 4 (80.0%) |
| Health Technologists | 1 (25.0%) | 3 (75.0%) |
| Total (Category) | 13 (65.0%) | 7 (35.0%) |
| Total (Overall) | 18 (58.1%) | 13 (41.9%) |
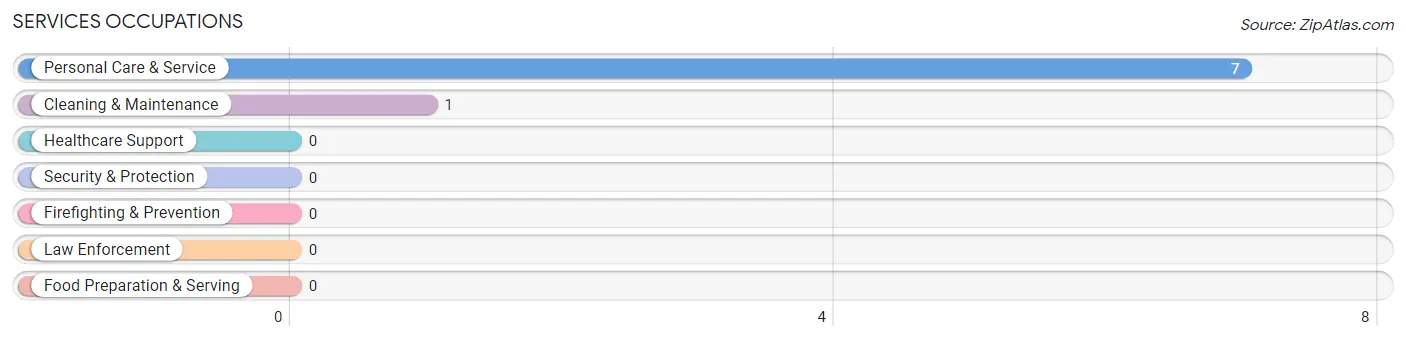
Services Occupations
The most common Services occupations in Briarwood are Personal Care & Service (7 | 22.6%), and Cleaning & Maintenance (1 | 3.2%).
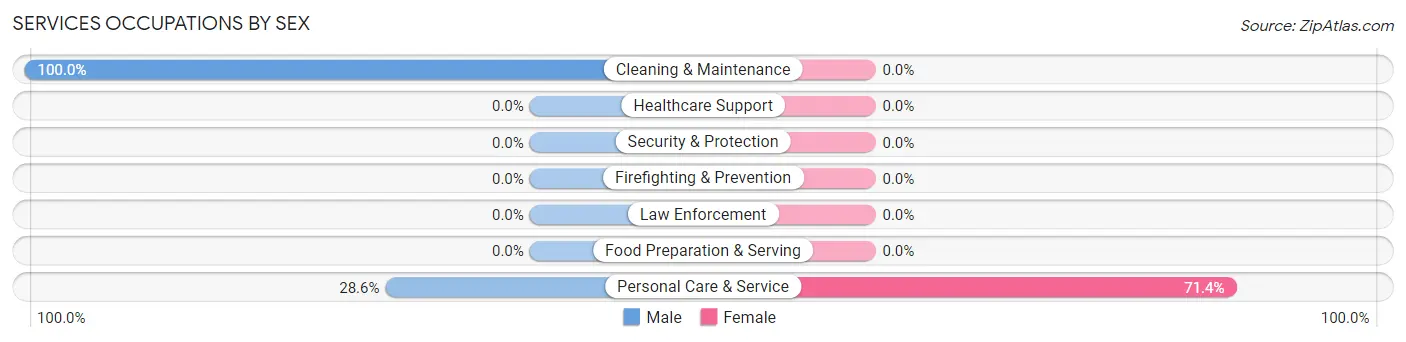
Services Occupations by Sex
| Occupation | Male | Female |
| Healthcare Support | 0 (0.0%) | 0 (0.0%) |
| Security & Protection | 0 (0.0%) | 0 (0.0%) |
| Firefighting & Prevention | 0 (0.0%) | 0 (0.0%) |
| Law Enforcement | 0 (0.0%) | 0 (0.0%) |
| Food Preparation & Serving | 0 (0.0%) | 0 (0.0%) |
| Cleaning & Maintenance | 1 (100.0%) | 0 (0.0%) |
| Personal Care & Service | 2 (28.6%) | 5 (71.4%) |
| Total (Category) | 3 (37.5%) | 5 (62.5%) |
| Total (Overall) | 18 (58.1%) | 13 (41.9%) |
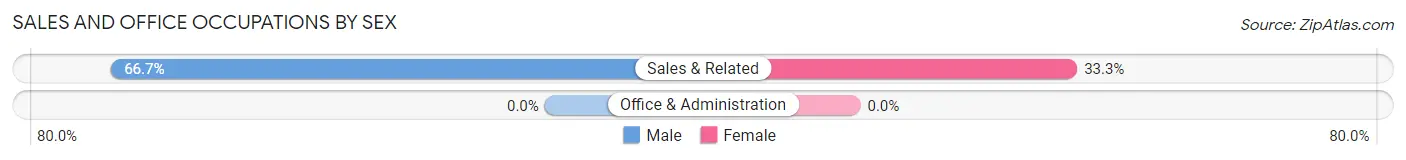
Sales and Office Occupations
The most common Sales and Office occupations in Briarwood are , and Sales & Related (3 | 9.7%).

Sales and Office Occupations by Sex
| Occupation | Male | Female |
| Sales & Related | 2 (66.7%) | 1 (33.3%) |
| Office & Administration | 0 (0.0%) | 0 (0.0%) |
| Total (Category) | 2 (66.7%) | 1 (33.3%) |
| Total (Overall) | 18 (58.1%) | 13 (41.9%) |
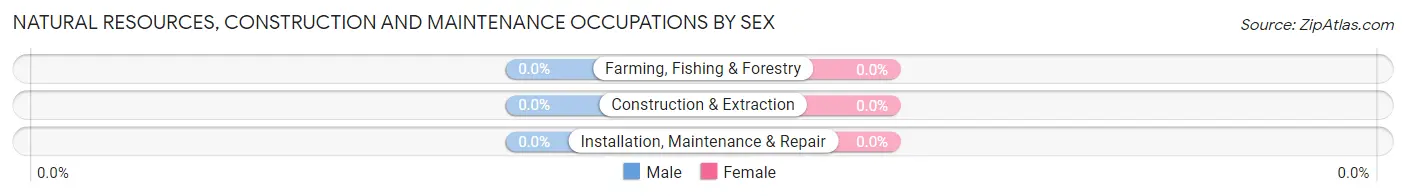
Natural Resources, Construction and Maintenance Occupations

Natural Resources, Construction and Maintenance Occupations by Sex
| Occupation | Male | Female |
| Farming, Fishing & Forestry | 0 (0.0%) | 0 (0.0%) |
| Construction & Extraction | 0 (0.0%) | 0 (0.0%) |
| Installation, Maintenance & Repair | 0 (0.0%) | 0 (0.0%) |
| Total (Category) | 0 (0.0%) | 0 (0.0%) |
| Total (Overall) | 18 (58.1%) | 13 (41.9%) |
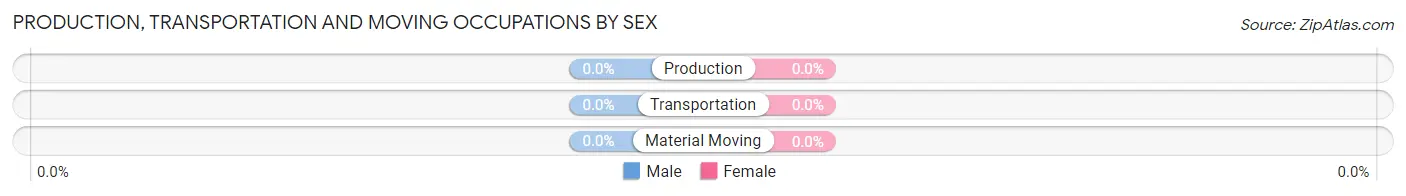
Production, Transportation and Moving Occupations
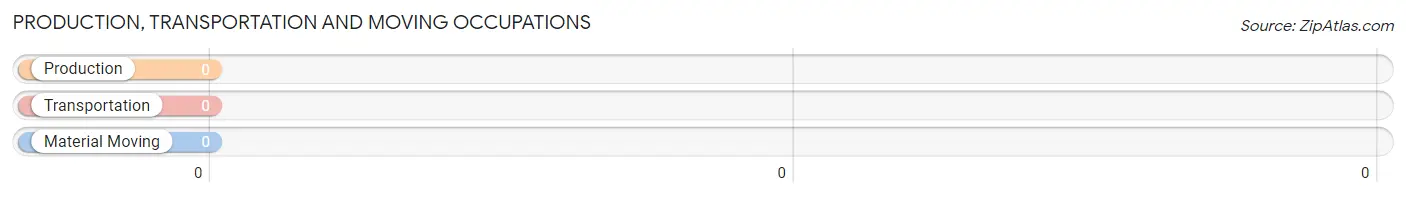
Production, Transportation and Moving Occupations by Sex
| Occupation | Male | Female |
| Production | 0 (0.0%) | 0 (0.0%) |
| Transportation | 0 (0.0%) | 0 (0.0%) |
| Material Moving | 0 (0.0%) | 0 (0.0%) |
| Total (Category) | 0 (0.0%) | 0 (0.0%) |
| Total (Overall) | 18 (58.1%) | 13 (41.9%) |
Employment Industries by Sex in Briarwood
Employment Industries in Briarwood
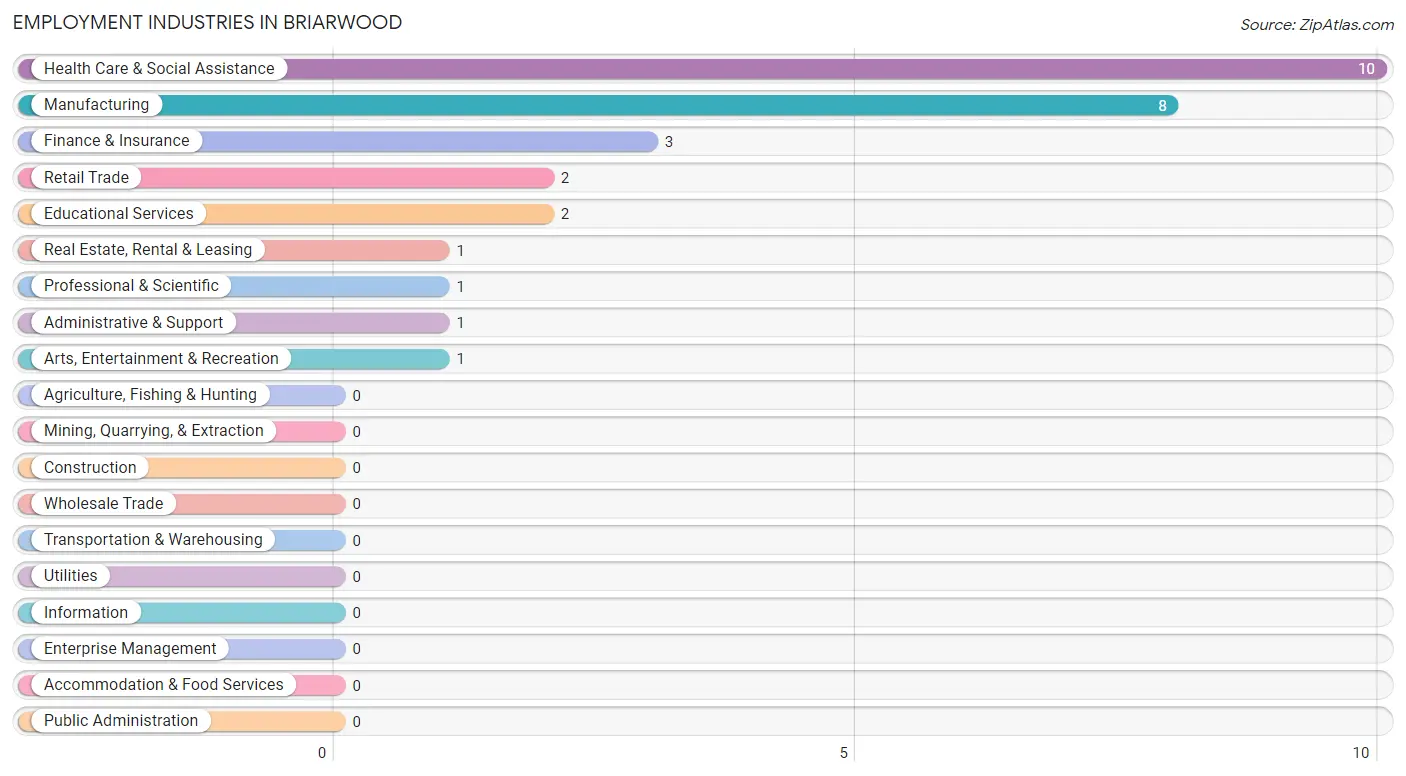
The major employment industries in Briarwood include Health Care & Social Assistance (10 | 32.3%), Manufacturing (8 | 25.8%), Finance & Insurance (3 | 9.7%), Retail Trade (2 | 6.5%), and Educational Services (2 | 6.5%).
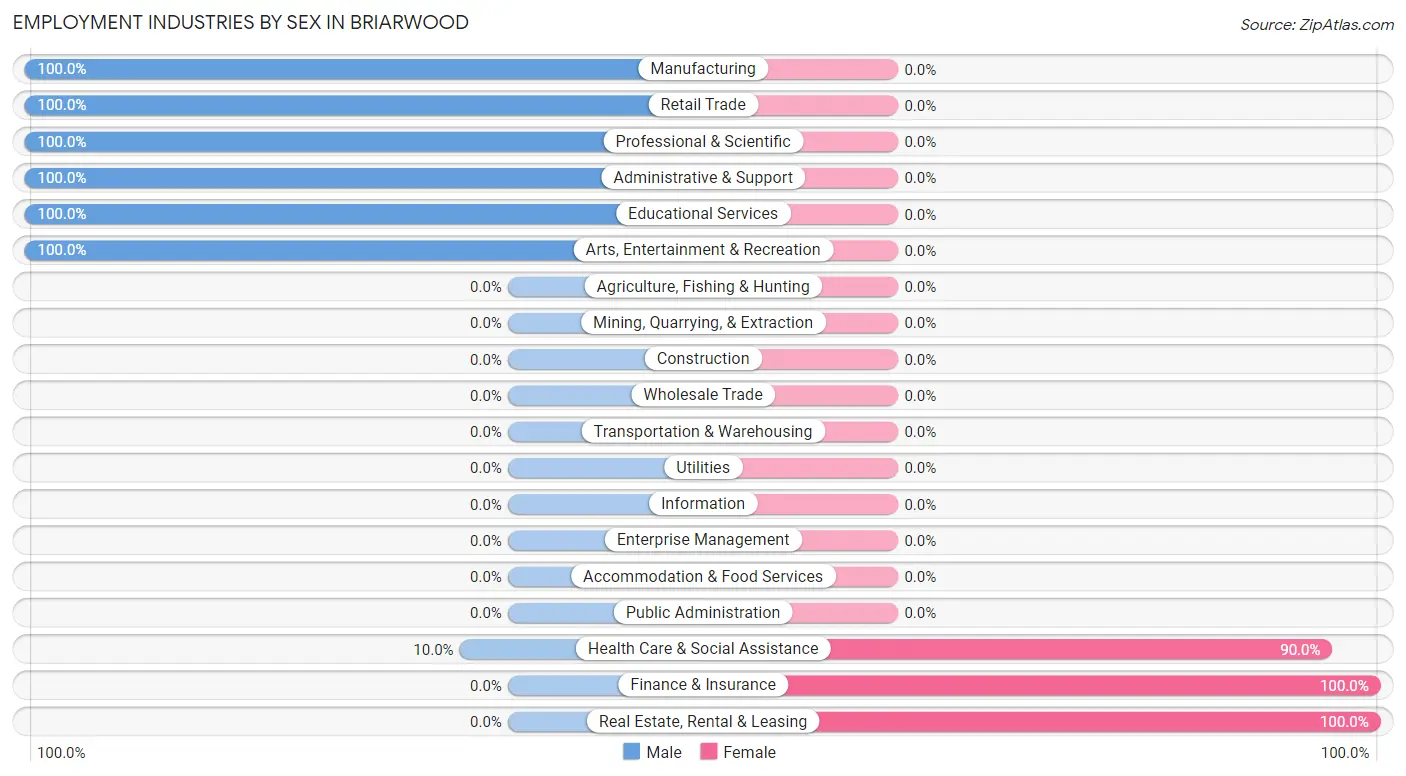
Employment Industries by Sex in Briarwood
The Briarwood industries that see more men than women are Manufacturing (100.0%), Retail Trade (100.0%), and Professional & Scientific (100.0%), whereas the industries that tend to have a higher number of women are Finance & Insurance (100.0%), Real Estate, Rental & Leasing (100.0%), and Health Care & Social Assistance (90.0%).
| Industry | Male | Female |
| Agriculture, Fishing & Hunting | 0 (0.0%) | 0 (0.0%) |
| Mining, Quarrying, & Extraction | 0 (0.0%) | 0 (0.0%) |
| Construction | 0 (0.0%) | 0 (0.0%) |
| Manufacturing | 8 (100.0%) | 0 (0.0%) |
| Wholesale Trade | 0 (0.0%) | 0 (0.0%) |
| Retail Trade | 2 (100.0%) | 0 (0.0%) |
| Transportation & Warehousing | 0 (0.0%) | 0 (0.0%) |
| Utilities | 0 (0.0%) | 0 (0.0%) |
| Information | 0 (0.0%) | 0 (0.0%) |
| Finance & Insurance | 0 (0.0%) | 3 (100.0%) |
| Real Estate, Rental & Leasing | 0 (0.0%) | 1 (100.0%) |
| Professional & Scientific | 1 (100.0%) | 0 (0.0%) |
| Enterprise Management | 0 (0.0%) | 0 (0.0%) |
| Administrative & Support | 1 (100.0%) | 0 (0.0%) |
| Educational Services | 2 (100.0%) | 0 (0.0%) |
| Health Care & Social Assistance | 1 (10.0%) | 9 (90.0%) |
| Arts, Entertainment & Recreation | 1 (100.0%) | 0 (0.0%) |
| Accommodation & Food Services | 0 (0.0%) | 0 (0.0%) |
| Public Administration | 0 (0.0%) | 0 (0.0%) |
| Total | 18 (58.1%) | 13 (41.9%) |
Education in Briarwood
School Enrollment in Briarwood
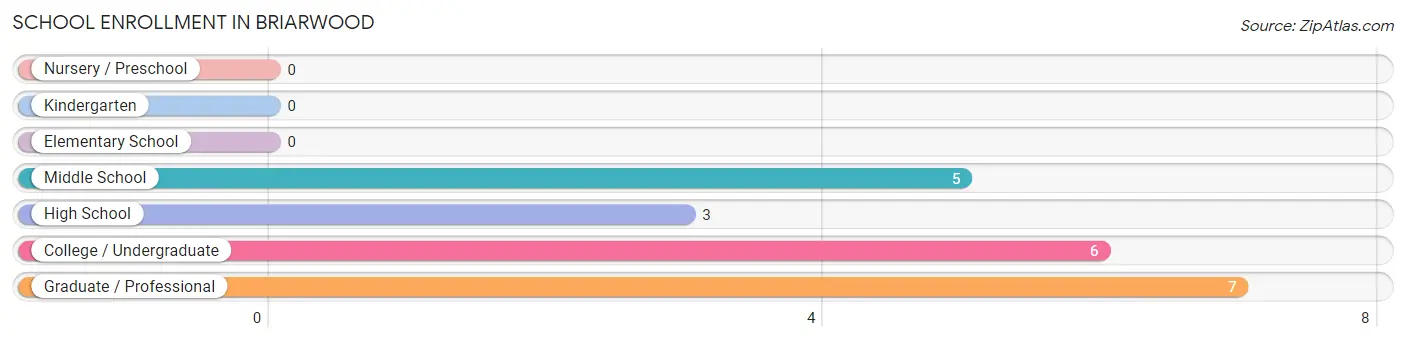
The most common levels of schooling among the 21 students in Briarwood are graduate / professional (7 | 33.3%), college / undergraduate (6 | 28.6%), and middle school (5 | 23.8%).
| School Level | # Students | % Students |
| Nursery / Preschool | 0 | 0.0% |
| Kindergarten | 0 | 0.0% |
| Elementary School | 0 | 0.0% |
| Middle School | 5 | 23.8% |
| High School | 3 | 14.3% |
| College / Undergraduate | 6 | 28.6% |
| Graduate / Professional | 7 | 33.3% |
| Total | 21 | 100.0% |
School Enrollment by Age by Funding Source in Briarwood
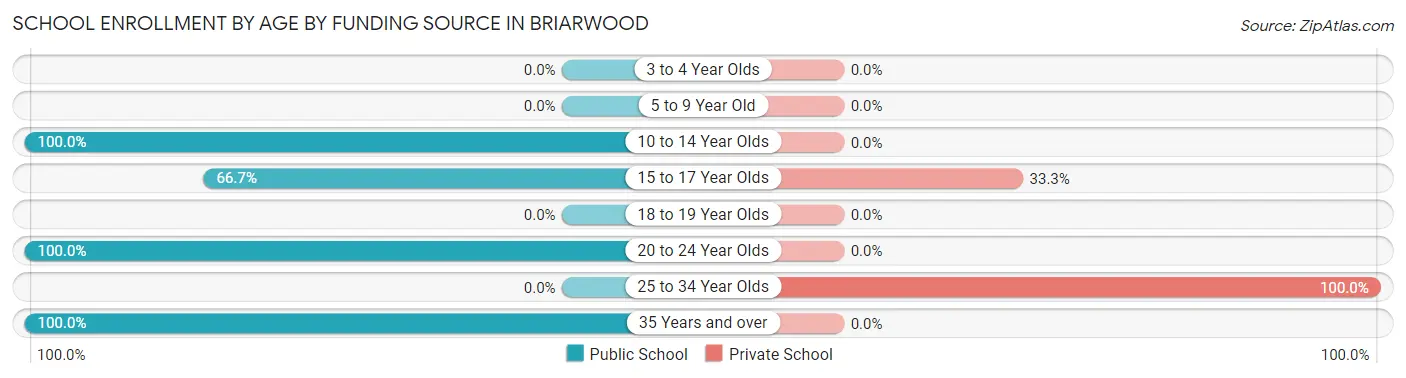
Out of a total of 21 students who are enrolled in schools in Briarwood, 2 (9.5%) attend a private institution, while the remaining 19 (90.5%) are enrolled in public schools. The age group of 25 to 34 year olds has the highest likelihood of being enrolled in private schools, with 1 (100.0% in the age bracket) enrolled. Conversely, the age group of 10 to 14 year olds has the lowest likelihood of being enrolled in a private school, with 5 (100.0% in the age bracket) attending a public institution.
| Age Bracket | Public School | Private School |
| 3 to 4 Year Olds | 0 (0.0%) | 0 (0.0%) |
| 5 to 9 Year Old | 0 (0.0%) | 0 (0.0%) |
| 10 to 14 Year Olds | 5 (100.0%) | 0 (0.0%) |
| 15 to 17 Year Olds | 2 (66.7%) | 1 (33.3%) |
| 18 to 19 Year Olds | 0 (0.0%) | 0 (0.0%) |
| 20 to 24 Year Olds | 6 (100.0%) | 0 (0.0%) |
| 25 to 34 Year Olds | 0 (0.0%) | 1 (100.0%) |
| 35 Years and over | 6 (100.0%) | 0 (0.0%) |
| Total | 19 (90.5%) | 2 (9.5%) |
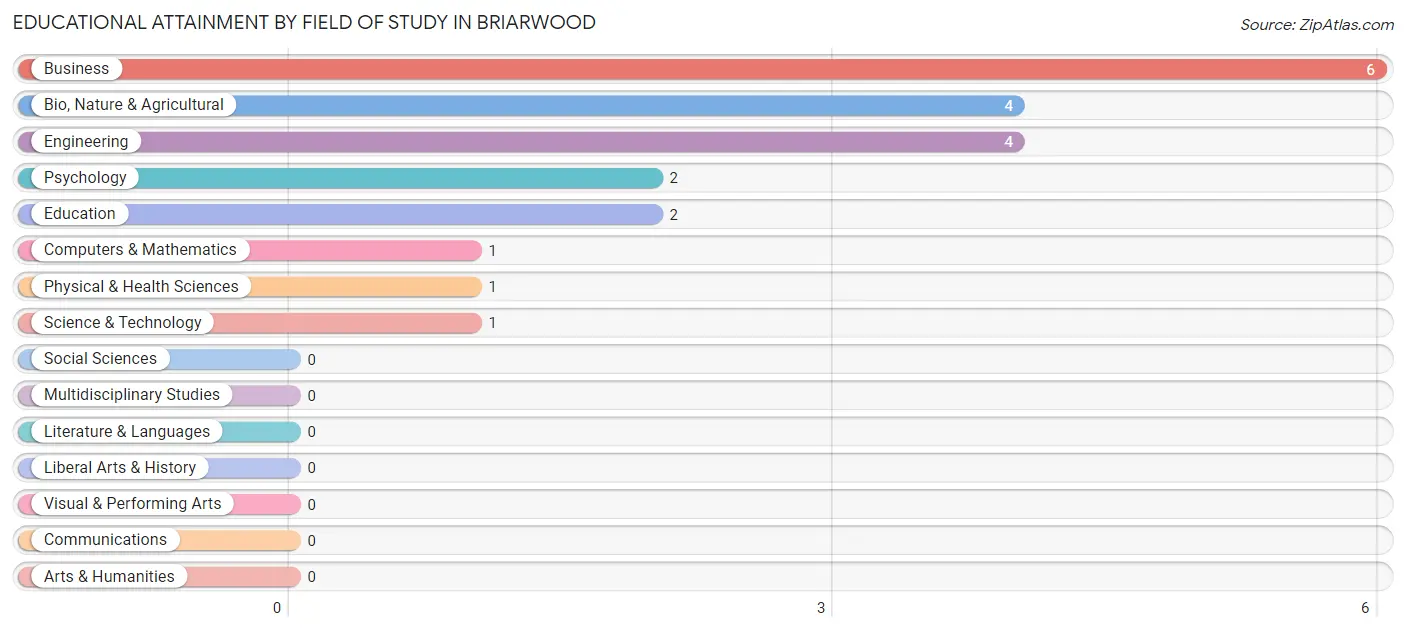
Educational Attainment by Field of Study in Briarwood
Business (6 | 28.6%), bio, nature & agricultural (4 | 19.1%), engineering (4 | 19.1%), psychology (2 | 9.5%), and education (2 | 9.5%) are the most common fields of study among 21 individuals in Briarwood who have obtained a bachelor's degree or higher.
| Field of Study | # Graduates | % Graduates |
| Computers & Mathematics | 1 | 4.8% |
| Bio, Nature & Agricultural | 4 | 19.1% |
| Physical & Health Sciences | 1 | 4.8% |
| Psychology | 2 | 9.5% |
| Social Sciences | 0 | 0.0% |
| Engineering | 4 | 19.1% |
| Multidisciplinary Studies | 0 | 0.0% |
| Science & Technology | 1 | 4.8% |
| Business | 6 | 28.6% |
| Education | 2 | 9.5% |
| Literature & Languages | 0 | 0.0% |
| Liberal Arts & History | 0 | 0.0% |
| Visual & Performing Arts | 0 | 0.0% |
| Communications | 0 | 0.0% |
| Arts & Humanities | 0 | 0.0% |
| Total | 21 | 100.0% |
Transportation & Commute in Briarwood
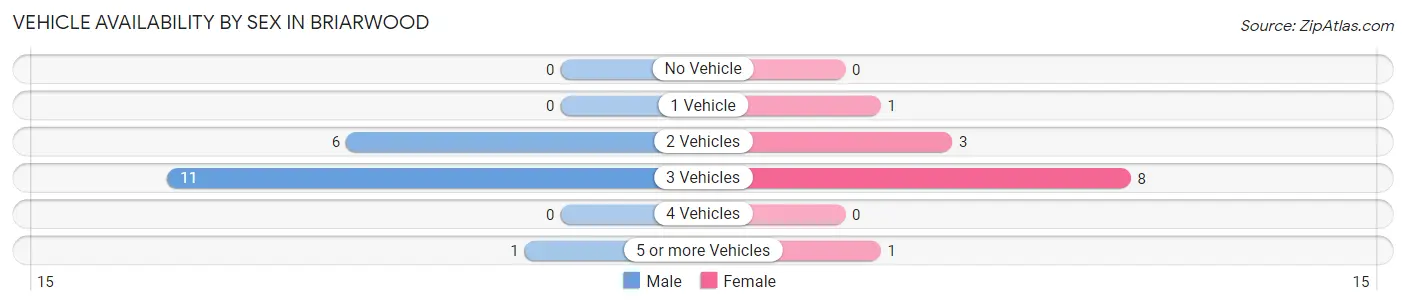
Vehicle Availability by Sex in Briarwood
The most prevalent vehicle ownership categories in Briarwood are males with 3 vehicles (11, accounting for 61.1%) and females with 3 vehicles (8, making up 84.6%).
| Vehicles Available | Male | Female |
| No Vehicle | 0 (0.0%) | 0 (0.0%) |
| 1 Vehicle | 0 (0.0%) | 1 (7.7%) |
| 2 Vehicles | 6 (33.3%) | 3 (23.1%) |
| 3 Vehicles | 11 (61.1%) | 8 (61.5%) |
| 4 Vehicles | 0 (0.0%) | 0 (0.0%) |
| 5 or more Vehicles | 1 (5.6%) | 1 (7.7%) |
| Total | 18 (100.0%) | 13 (100.0%) |
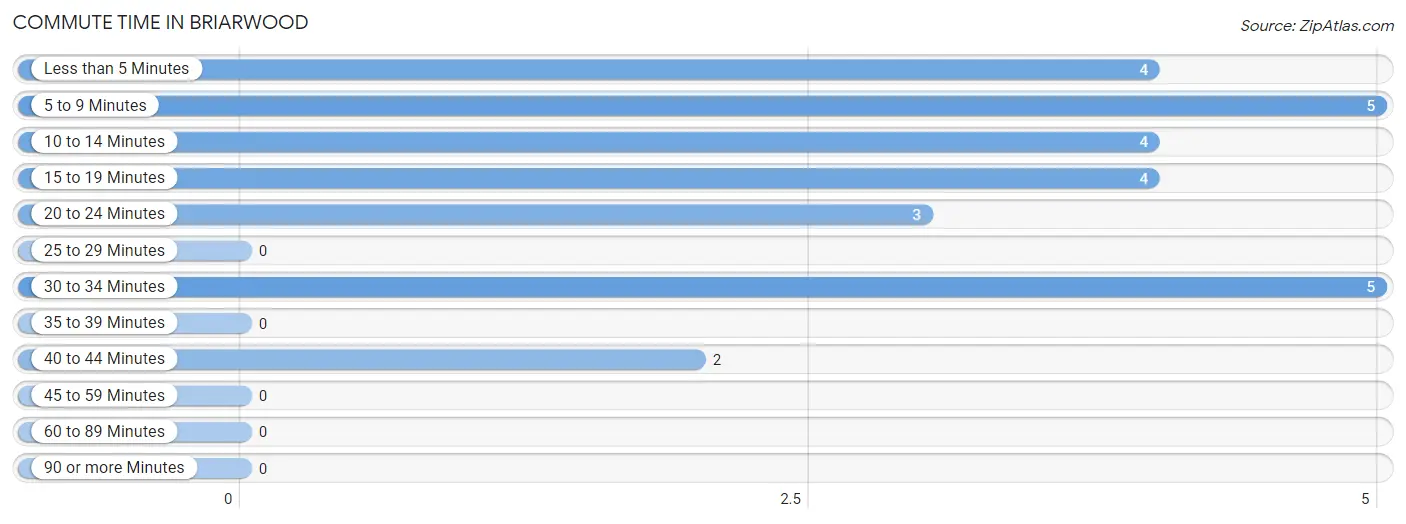
Commute Time in Briarwood
The most frequently occuring commute durations in Briarwood are 5 to 9 minutes (5 commuters, 18.5%), 30 to 34 minutes (5 commuters, 18.5%), and less than 5 minutes (4 commuters, 14.8%).
| Commute Time | # Commuters | % Commuters |
| Less than 5 Minutes | 4 | 14.8% |
| 5 to 9 Minutes | 5 | 18.5% |
| 10 to 14 Minutes | 4 | 14.8% |
| 15 to 19 Minutes | 4 | 14.8% |
| 20 to 24 Minutes | 3 | 11.1% |
| 25 to 29 Minutes | 0 | 0.0% |
| 30 to 34 Minutes | 5 | 18.5% |
| 35 to 39 Minutes | 0 | 0.0% |
| 40 to 44 Minutes | 2 | 7.4% |
| 45 to 59 Minutes | 0 | 0.0% |
| 60 to 89 Minutes | 0 | 0.0% |
| 90 or more Minutes | 0 | 0.0% |
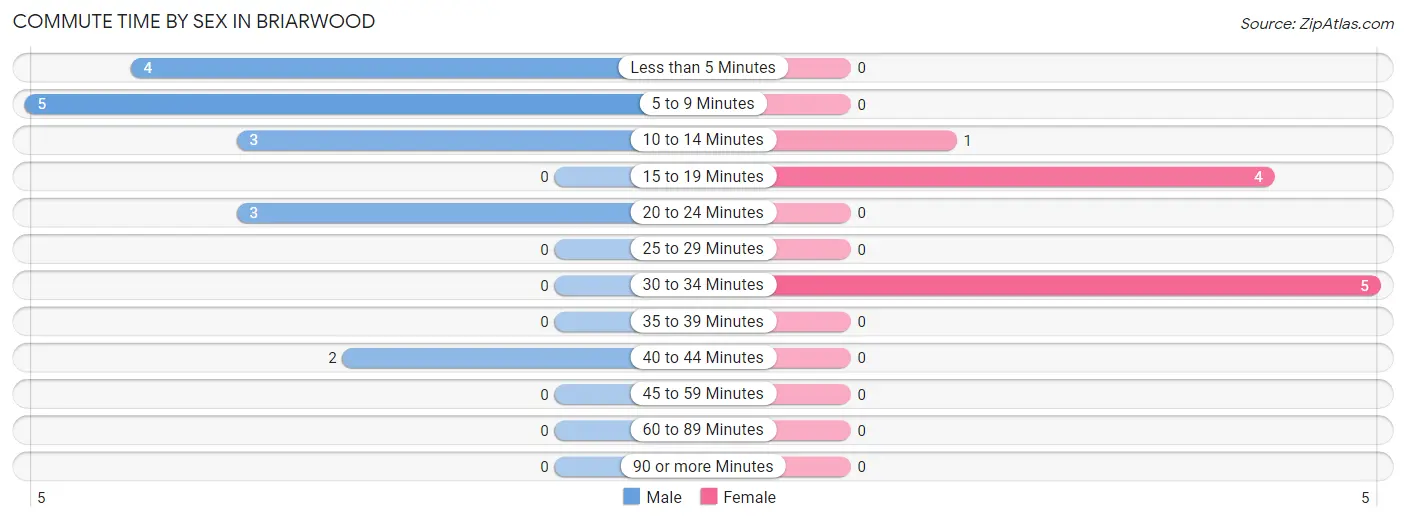
Commute Time by Sex in Briarwood
The most common commute times in Briarwood are 5 to 9 minutes (5 commuters, 29.4%) for males and 30 to 34 minutes (5 commuters, 50.0%) for females.
| Commute Time | Male | Female |
| Less than 5 Minutes | 4 (23.5%) | 0 (0.0%) |
| 5 to 9 Minutes | 5 (29.4%) | 0 (0.0%) |
| 10 to 14 Minutes | 3 (17.6%) | 1 (10.0%) |
| 15 to 19 Minutes | 0 (0.0%) | 4 (40.0%) |
| 20 to 24 Minutes | 3 (17.6%) | 0 (0.0%) |
| 25 to 29 Minutes | 0 (0.0%) | 0 (0.0%) |
| 30 to 34 Minutes | 0 (0.0%) | 5 (50.0%) |
| 35 to 39 Minutes | 0 (0.0%) | 0 (0.0%) |
| 40 to 44 Minutes | 2 (11.8%) | 0 (0.0%) |
| 45 to 59 Minutes | 0 (0.0%) | 0 (0.0%) |
| 60 to 89 Minutes | 0 (0.0%) | 0 (0.0%) |
| 90 or more Minutes | 0 (0.0%) | 0 (0.0%) |
Time of Departure to Work by Sex in Briarwood
The most frequent times of departure to work in Briarwood are 8:00 AM to 8:29 AM (10, 58.8%) for males and 7:00 AM to 7:29 AM (6, 60.0%) for females.
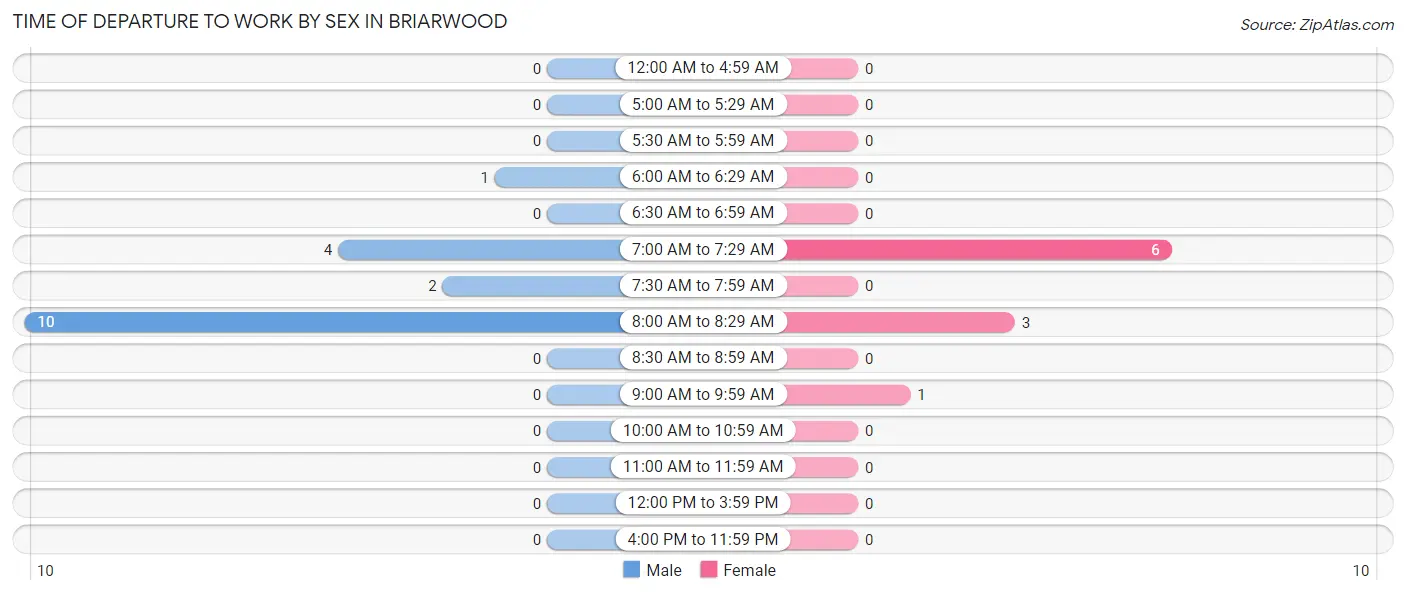
| Time of Departure | Male | Female |
| 12:00 AM to 4:59 AM | 0 (0.0%) | 0 (0.0%) |
| 5:00 AM to 5:29 AM | 0 (0.0%) | 0 (0.0%) |
| 5:30 AM to 5:59 AM | 0 (0.0%) | 0 (0.0%) |
| 6:00 AM to 6:29 AM | 1 (5.9%) | 0 (0.0%) |
| 6:30 AM to 6:59 AM | 0 (0.0%) | 0 (0.0%) |
| 7:00 AM to 7:29 AM | 4 (23.5%) | 6 (60.0%) |
| 7:30 AM to 7:59 AM | 2 (11.8%) | 0 (0.0%) |
| 8:00 AM to 8:29 AM | 10 (58.8%) | 3 (30.0%) |
| 8:30 AM to 8:59 AM | 0 (0.0%) | 0 (0.0%) |
| 9:00 AM to 9:59 AM | 0 (0.0%) | 1 (10.0%) |
| 10:00 AM to 10:59 AM | 0 (0.0%) | 0 (0.0%) |
| 11:00 AM to 11:59 AM | 0 (0.0%) | 0 (0.0%) |
| 12:00 PM to 3:59 PM | 0 (0.0%) | 0 (0.0%) |
| 4:00 PM to 11:59 PM | 0 (0.0%) | 0 (0.0%) |
| Total | 17 (100.0%) | 10 (100.0%) |
Housing Occupancy in Briarwood
Occupancy by Ownership in Briarwood
Of the total 21 dwellings in Briarwood, owner-occupied units account for 21 (100.0%), while renter-occupied units make up 0 (0.0%).
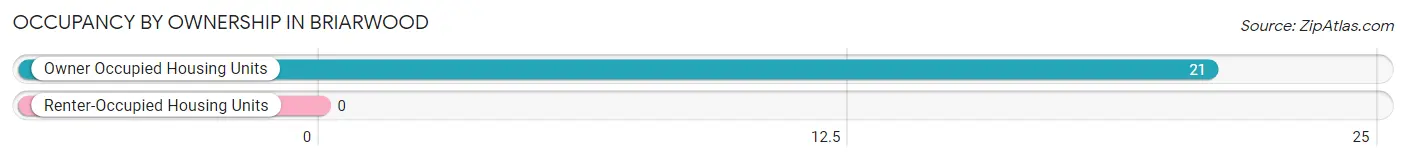
| Occupancy | # Housing Units | % Housing Units |
| Owner Occupied Housing Units | 21 | 100.0% |
| Renter-Occupied Housing Units | 0 | 0.0% |
| Total Occupied Housing Units | 21 | 100.0% |
Occupancy by Household Size in Briarwood
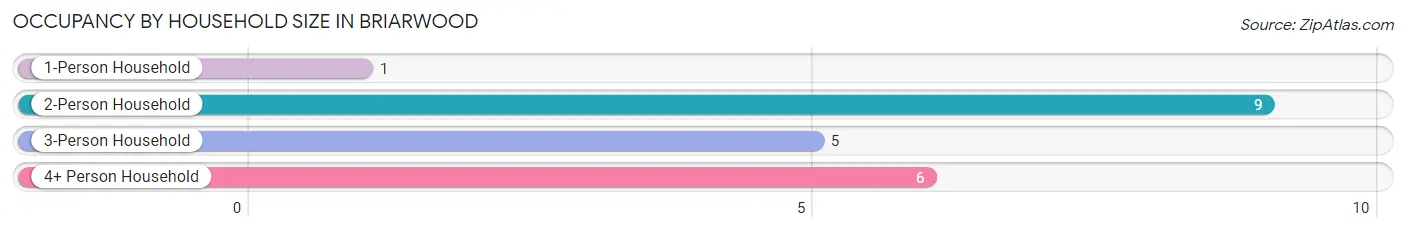
| Household Size | # Housing Units | % Housing Units |
| 1-Person Household | 1 | 4.8% |
| 2-Person Household | 9 | 42.9% |
| 3-Person Household | 5 | 23.8% |
| 4+ Person Household | 6 | 28.6% |
| Total Housing Units | 21 | 100.0% |
Occupancy by Ownership by Household Size in Briarwood
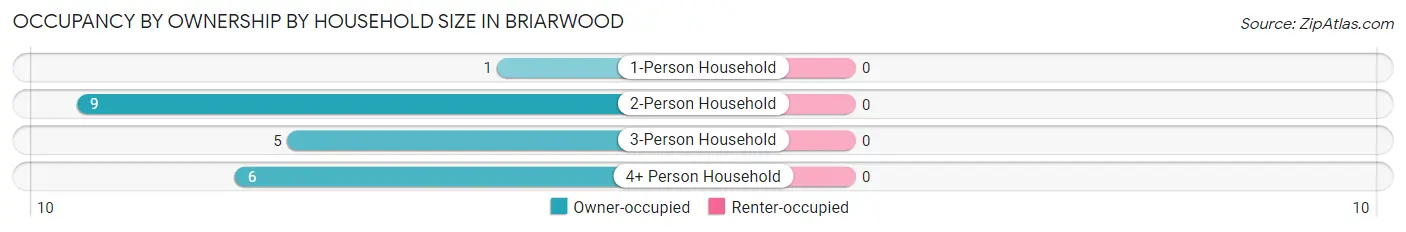
| Household Size | Owner-occupied | Renter-occupied |
| 1-Person Household | 1 (100.0%) | 0 (0.0%) |
| 2-Person Household | 9 (100.0%) | 0 (0.0%) |
| 3-Person Household | 5 (100.0%) | 0 (0.0%) |
| 4+ Person Household | 6 (100.0%) | 0 (0.0%) |
| Total Housing Units | 21 (100.0%) | 0 (0.0%) |
Occupancy by Educational Attainment in Briarwood
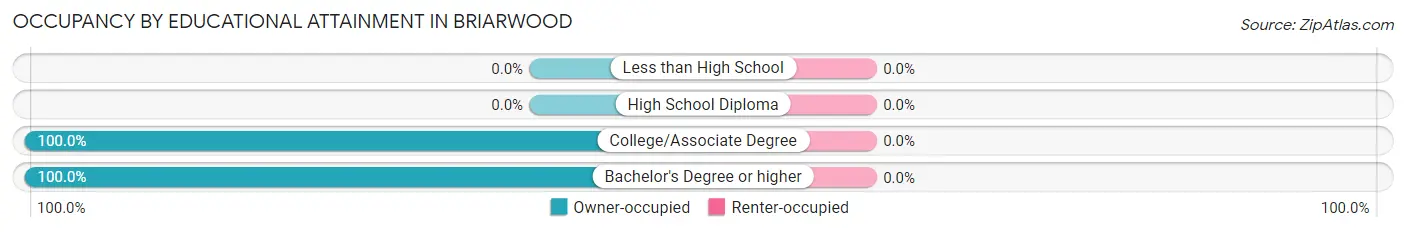
| Household Size | Owner-occupied | Renter-occupied |
| Less than High School | 0 (0.0%) | 0 (0.0%) |
| High School Diploma | 0 (0.0%) | 0 (0.0%) |
| College/Associate Degree | 11 (100.0%) | 0 (0.0%) |
| Bachelor's Degree or higher | 10 (100.0%) | 0 (0.0%) |
Occupancy by Age of Householder in Briarwood
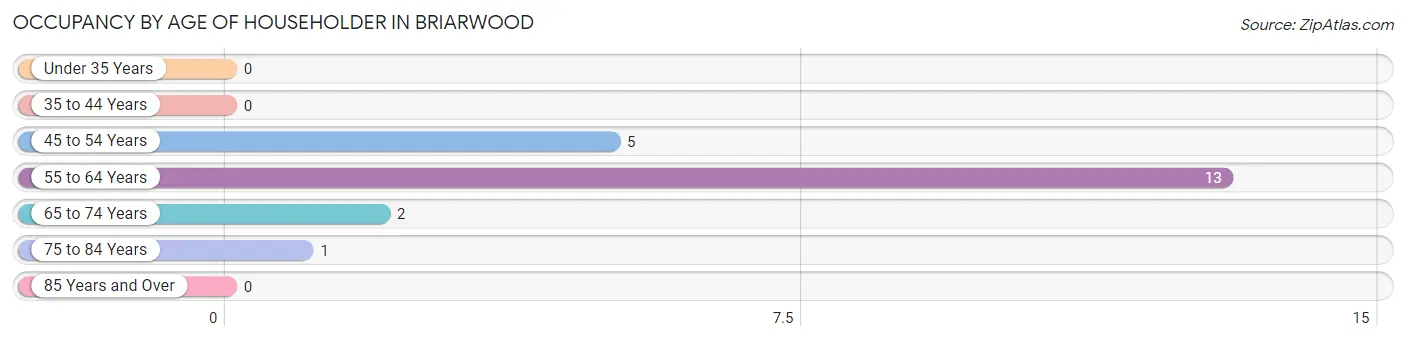
| Age Bracket | # Households | % Households |
| Under 35 Years | 0 | 0.0% |
| 35 to 44 Years | 0 | 0.0% |
| 45 to 54 Years | 5 | 23.8% |
| 55 to 64 Years | 13 | 61.9% |
| 65 to 74 Years | 2 | 9.5% |
| 75 to 84 Years | 1 | 4.8% |
| 85 Years and Over | 0 | 0.0% |
| Total | 21 | 100.0% |
Housing Finances in Briarwood
Median Income by Occupancy in Briarwood
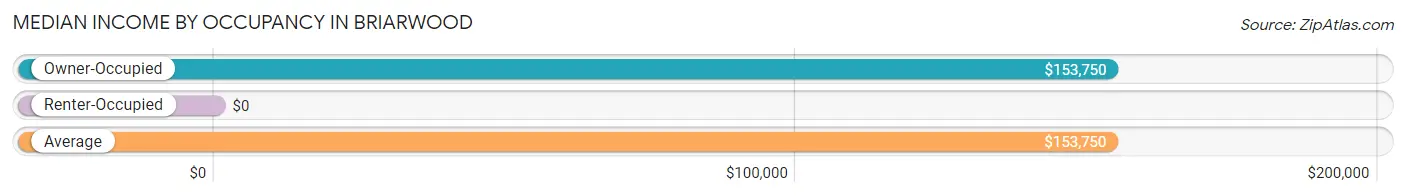
| Occupancy Type | # Households | Median Income |
| Owner-Occupied | 21 (100.0%) | $153,750 |
| Renter-Occupied | 0 (0.0%) | $0 |
| Average | 21 (100.0%) | $153,750 |
Occupancy by Householder Income Bracket in Briarwood
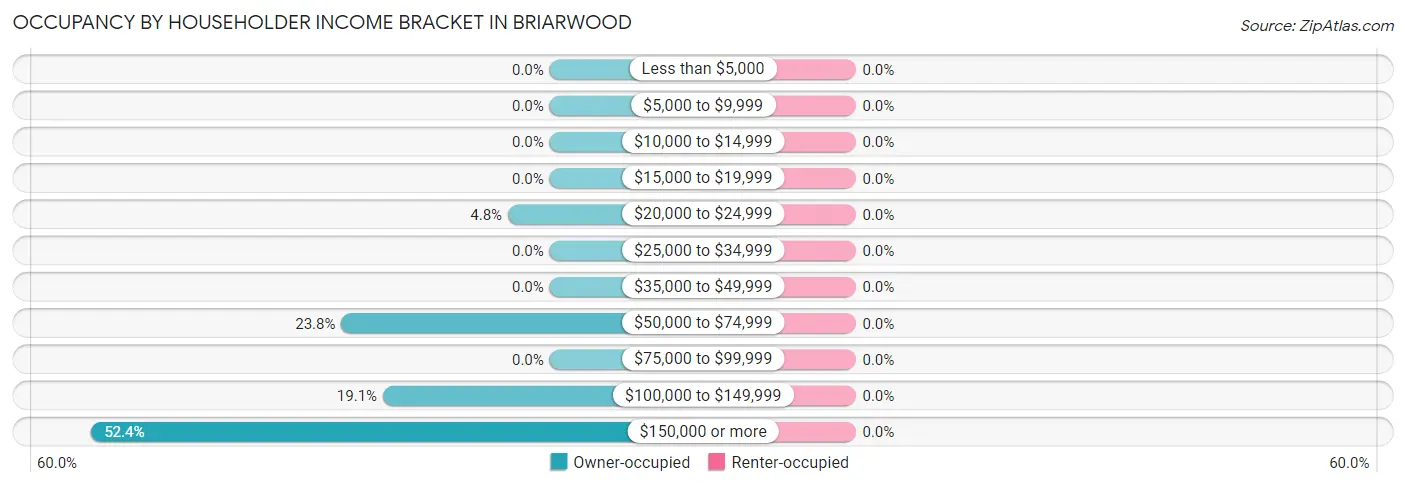
| Income Bracket | Owner-occupied | Renter-occupied |
| Less than $5,000 | 0 (0.0%) | 0 (0.0%) |
| $5,000 to $9,999 | 0 (0.0%) | 0 (0.0%) |
| $10,000 to $14,999 | 0 (0.0%) | 0 (0.0%) |
| $15,000 to $19,999 | 0 (0.0%) | 0 (0.0%) |
| $20,000 to $24,999 | 1 (4.8%) | 0 (0.0%) |
| $25,000 to $34,999 | 0 (0.0%) | 0 (0.0%) |
| $35,000 to $49,999 | 0 (0.0%) | 0 (0.0%) |
| $50,000 to $74,999 | 5 (23.8%) | 0 (0.0%) |
| $75,000 to $99,999 | 0 (0.0%) | 0 (0.0%) |
| $100,000 to $149,999 | 4 (19.1%) | 0 (0.0%) |
| $150,000 or more | 11 (52.4%) | 0 (0.0%) |
| Total | 21 (100.0%) | 0 (0.0%) |
Monthly Housing Cost Tiers in Briarwood
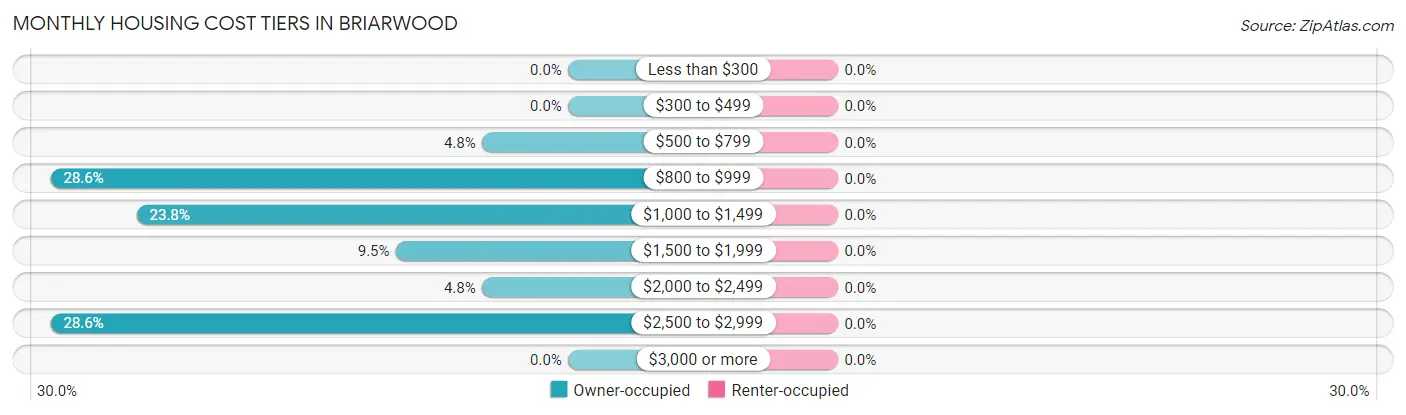
| Monthly Cost | Owner-occupied | Renter-occupied |
| Less than $300 | 0 (0.0%) | 0 (0.0%) |
| $300 to $499 | 0 (0.0%) | 0 (0.0%) |
| $500 to $799 | 1 (4.8%) | 0 (0.0%) |
| $800 to $999 | 6 (28.6%) | 0 (0.0%) |
| $1,000 to $1,499 | 5 (23.8%) | 0 (0.0%) |
| $1,500 to $1,999 | 2 (9.5%) | 0 (0.0%) |
| $2,000 to $2,499 | 1 (4.8%) | 0 (0.0%) |
| $2,500 to $2,999 | 6 (28.6%) | 0 (0.0%) |
| $3,000 or more | 0 (0.0%) | 0 (0.0%) |
| Total | 21 (100.0%) | 0 (0.0%) |
Physical Housing Characteristics in Briarwood
Housing Structures in Briarwood
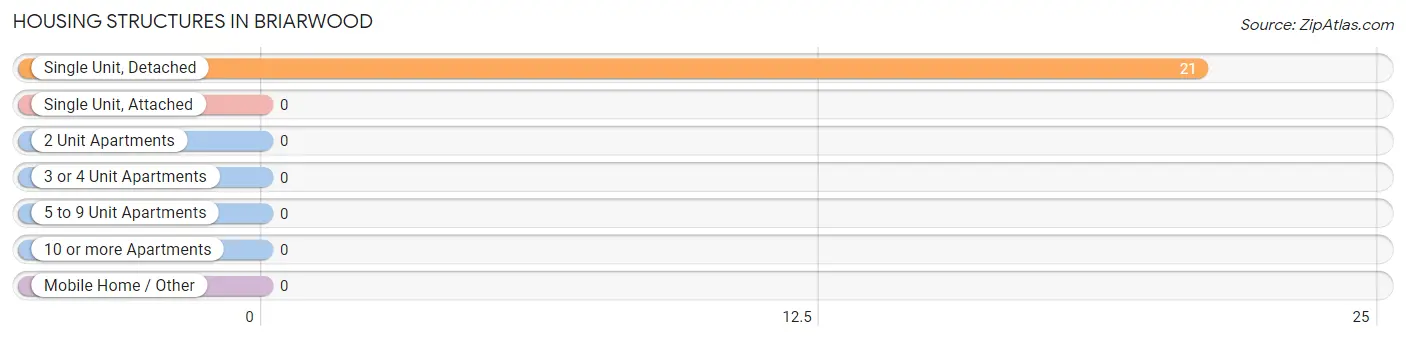
| Structure Type | # Housing Units | % Housing Units |
| Single Unit, Detached | 21 | 100.0% |
| Single Unit, Attached | 0 | 0.0% |
| 2 Unit Apartments | 0 | 0.0% |
| 3 or 4 Unit Apartments | 0 | 0.0% |
| 5 to 9 Unit Apartments | 0 | 0.0% |
| 10 or more Apartments | 0 | 0.0% |
| Mobile Home / Other | 0 | 0.0% |
| Total | 21 | 100.0% |
Housing Structures by Occupancy in Briarwood
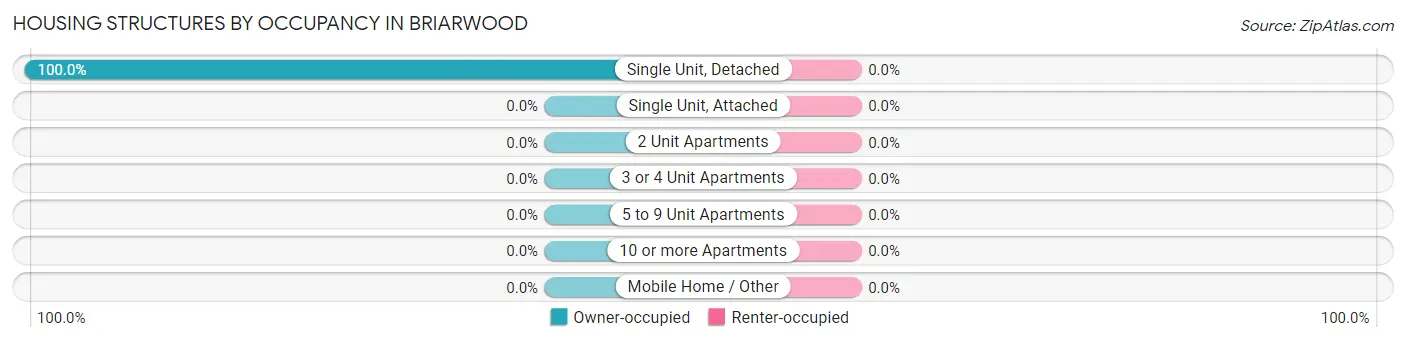
| Structure Type | Owner-occupied | Renter-occupied |
| Single Unit, Detached | 21 (100.0%) | 0 (0.0%) |
| Single Unit, Attached | 0 (0.0%) | 0 (0.0%) |
| 2 Unit Apartments | 0 (0.0%) | 0 (0.0%) |
| 3 or 4 Unit Apartments | 0 (0.0%) | 0 (0.0%) |
| 5 to 9 Unit Apartments | 0 (0.0%) | 0 (0.0%) |
| 10 or more Apartments | 0 (0.0%) | 0 (0.0%) |
| Mobile Home / Other | 0 (0.0%) | 0 (0.0%) |
| Total | 21 (100.0%) | 0 (0.0%) |
Housing Structures by Number of Rooms in Briarwood
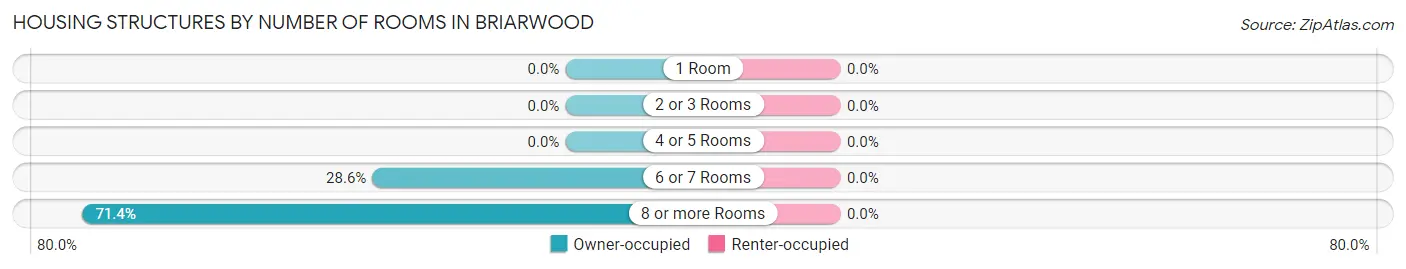
| Number of Rooms | Owner-occupied | Renter-occupied |
| 1 Room | 0 (0.0%) | 0 (0.0%) |
| 2 or 3 Rooms | 0 (0.0%) | 0 (0.0%) |
| 4 or 5 Rooms | 0 (0.0%) | 0 (0.0%) |
| 6 or 7 Rooms | 6 (28.6%) | 0 (0.0%) |
| 8 or more Rooms | 15 (71.4%) | 0 (0.0%) |
| Total | 21 (100.0%) | 0 (0.0%) |
Housing Structure by Heating Type in Briarwood
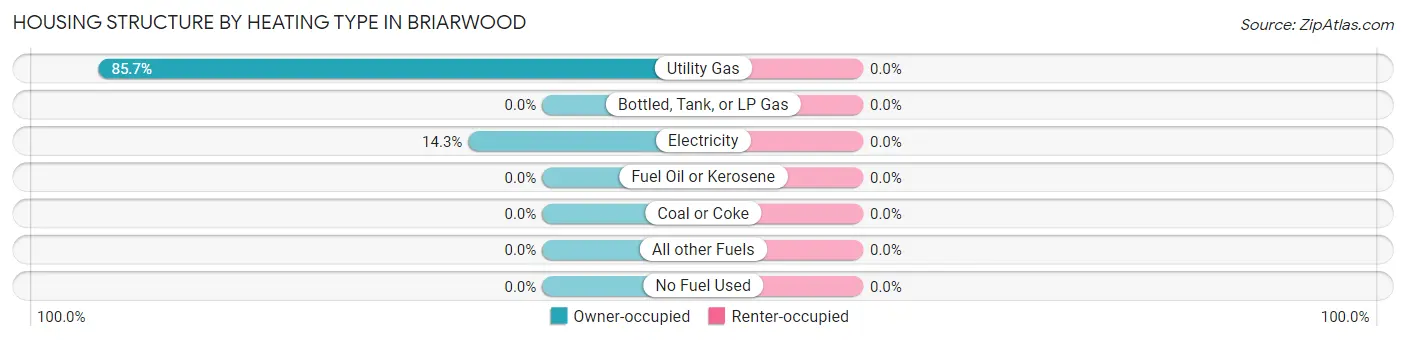
| Heating Type | Owner-occupied | Renter-occupied |
| Utility Gas | 18 (85.7%) | 0 (0.0%) |
| Bottled, Tank, or LP Gas | 0 (0.0%) | 0 (0.0%) |
| Electricity | 3 (14.3%) | 0 (0.0%) |
| Fuel Oil or Kerosene | 0 (0.0%) | 0 (0.0%) |
| Coal or Coke | 0 (0.0%) | 0 (0.0%) |
| All other Fuels | 0 (0.0%) | 0 (0.0%) |
| No Fuel Used | 0 (0.0%) | 0 (0.0%) |
| Total | 21 (100.0%) | 0 (0.0%) |
Household Vehicle Usage in Briarwood
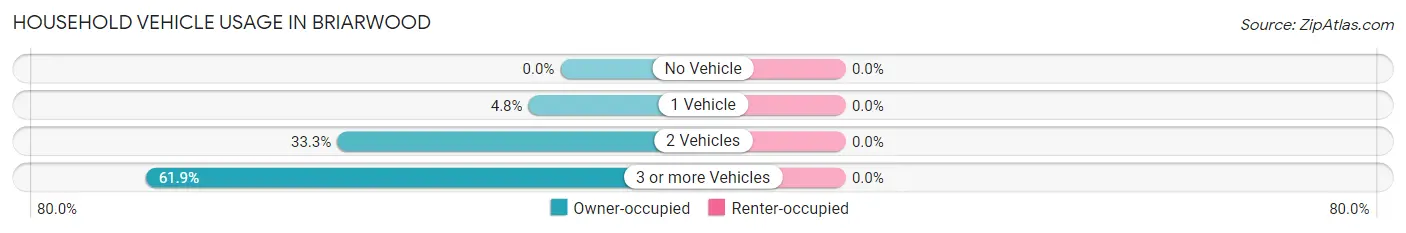
| Vehicles per Household | Owner-occupied | Renter-occupied |
| No Vehicle | 0 (0.0%) | 0 (0.0%) |
| 1 Vehicle | 1 (4.8%) | 0 (0.0%) |
| 2 Vehicles | 7 (33.3%) | 0 (0.0%) |
| 3 or more Vehicles | 13 (61.9%) | 0 (0.0%) |
| Total | 21 (100.0%) | 0 (0.0%) |
Real Estate & Mortgages in Briarwood
Real Estate and Mortgage Overview in Briarwood
| Characteristic | Without Mortgage | With Mortgage |
| Housing Units | 14 | 7 |
| Median Property Value | $583,300 | $531,300 |
| Median Household Income | $178,750 | $0 |
| Monthly Housing Costs | $1,050 | $0 |
| Real Estate Taxes | $5,833 | $0 |
Property Value by Mortgage Status in Briarwood
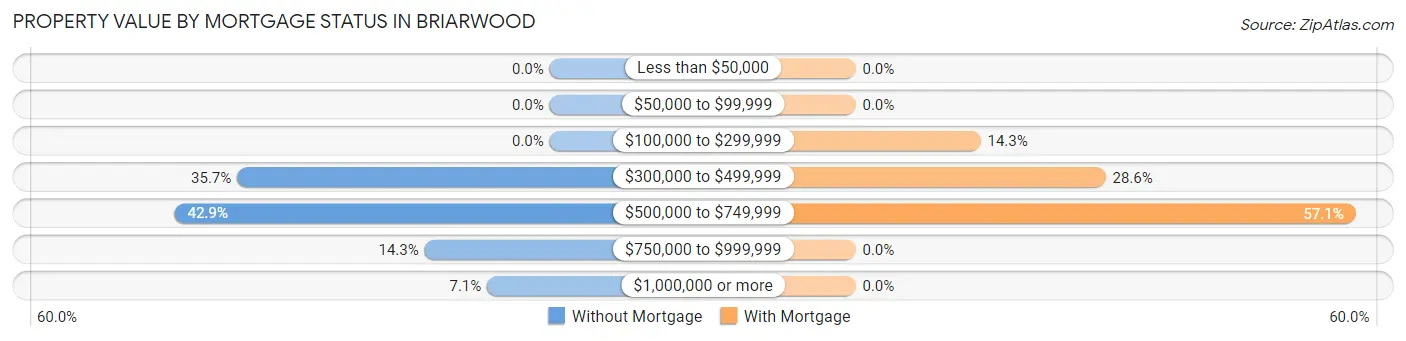
| Property Value | Without Mortgage | With Mortgage |
| Less than $50,000 | 0 (0.0%) | 0 (0.0%) |
| $50,000 to $99,999 | 0 (0.0%) | 0 (0.0%) |
| $100,000 to $299,999 | 0 (0.0%) | 1 (14.3%) |
| $300,000 to $499,999 | 5 (35.7%) | 2 (28.6%) |
| $500,000 to $749,999 | 6 (42.9%) | 4 (57.1%) |
| $750,000 to $999,999 | 2 (14.3%) | 0 (0.0%) |
| $1,000,000 or more | 1 (7.1%) | 0 (0.0%) |
| Total | 14 (100.0%) | 7 (100.0%) |
Household Income by Mortgage Status in Briarwood
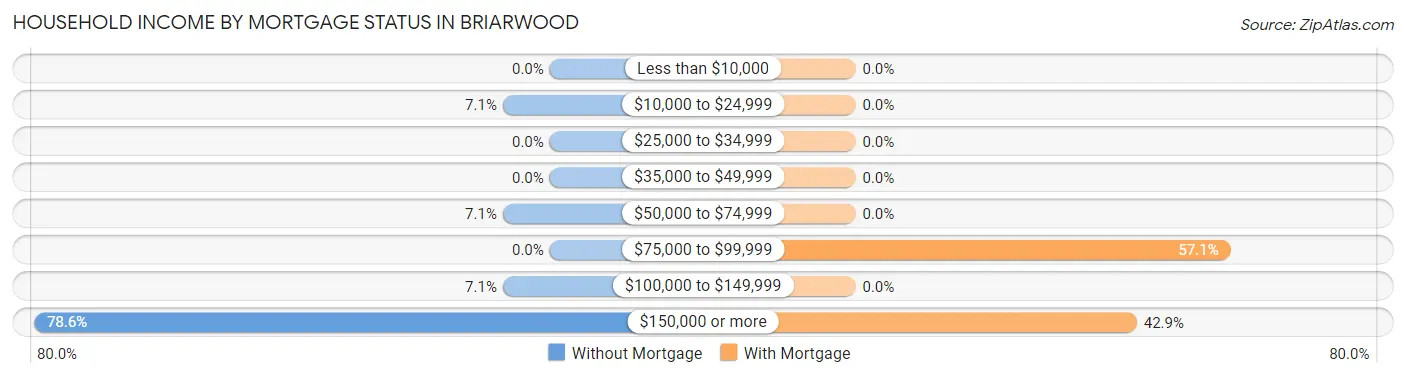
| Household Income | Without Mortgage | With Mortgage |
| Less than $10,000 | 0 (0.0%) | 0 (0.0%) |
| $10,000 to $24,999 | 1 (7.1%) | 0 (0.0%) |
| $25,000 to $34,999 | 0 (0.0%) | 0 (0.0%) |
| $35,000 to $49,999 | 0 (0.0%) | 0 (0.0%) |
| $50,000 to $74,999 | 1 (7.1%) | 0 (0.0%) |
| $75,000 to $99,999 | 0 (0.0%) | 4 (57.1%) |
| $100,000 to $149,999 | 1 (7.1%) | 0 (0.0%) |
| $150,000 or more | 11 (78.6%) | 3 (42.9%) |
| Total | 14 (100.0%) | 7 (100.0%) |
Property Value to Household Income Ratio in Briarwood
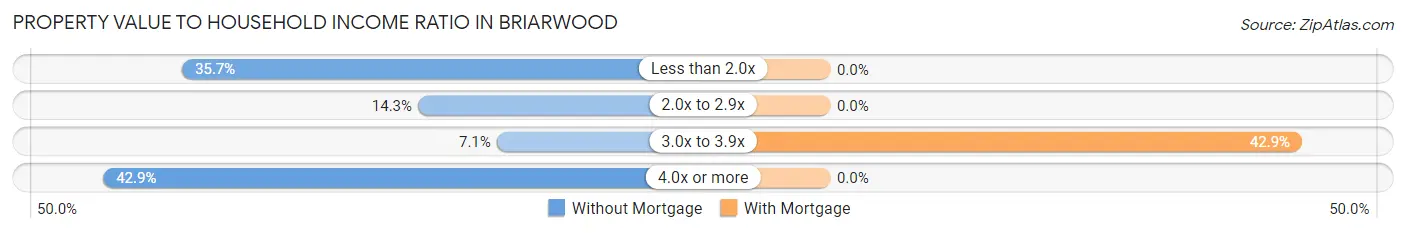
| Value-to-Income Ratio | Without Mortgage | With Mortgage |
| Less than 2.0x | 5 (35.7%) | 0 (0.0%) |
| 2.0x to 2.9x | 2 (14.3%) | 0 (0.0%) |
| 3.0x to 3.9x | 1 (7.1%) | 3 (42.9%) |
| 4.0x or more | 6 (42.9%) | 0 (0.0%) |
| Total | 14 (100.0%) | 7 (100.0%) |
Real Estate Taxes by Mortgage Status in Briarwood
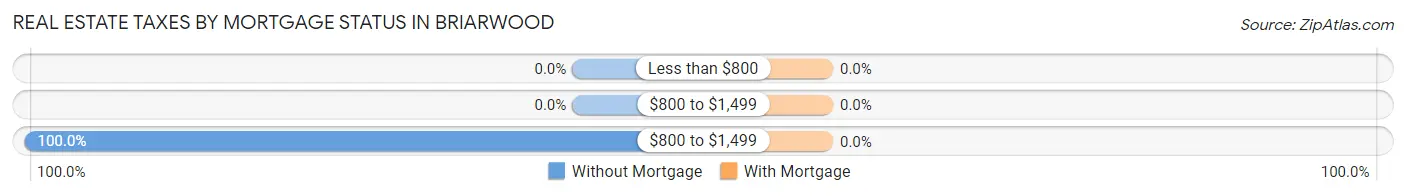
| Property Taxes | Without Mortgage | With Mortgage |
| Less than $800 | 0 (0.0%) | 0 (0.0%) |
| $800 to $1,499 | 0 (0.0%) | 0 (0.0%) |
| $800 to $1,499 | 14 (100.0%) | 0 (0.0%) |
| Total | 14 (100.0%) | 7 (100.0%) |
Health & Disability in Briarwood
Health Insurance Coverage by Age in Briarwood
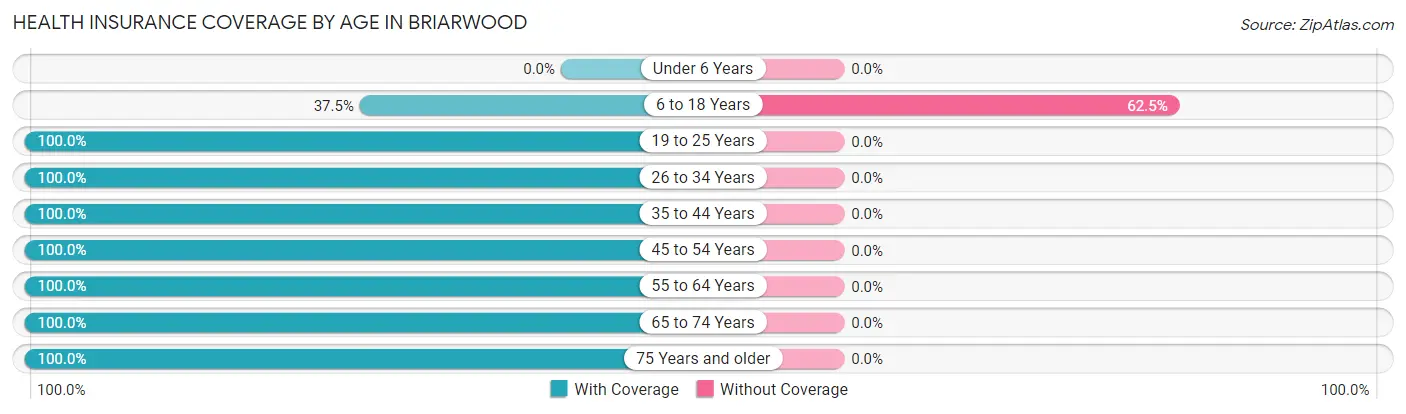
| Age Bracket | With Coverage | Without Coverage |
| Under 6 Years | 0 (0.0%) | 0 (0.0%) |
| 6 to 18 Years | 3 (37.5%) | 5 (62.5%) |
| 19 to 25 Years | 7 (100.0%) | 0 (0.0%) |
| 26 to 34 Years | 1 (100.0%) | 0 (0.0%) |
| 35 to 44 Years | 1 (100.0%) | 0 (0.0%) |
| 45 to 54 Years | 14 (100.0%) | 0 (0.0%) |
| 55 to 64 Years | 18 (100.0%) | 0 (0.0%) |
| 65 to 74 Years | 6 (100.0%) | 0 (0.0%) |
| 75 Years and older | 1 (100.0%) | 0 (0.0%) |
| Total | 51 (91.1%) | 5 (8.9%) |
Health Insurance Coverage by Citizenship Status in Briarwood
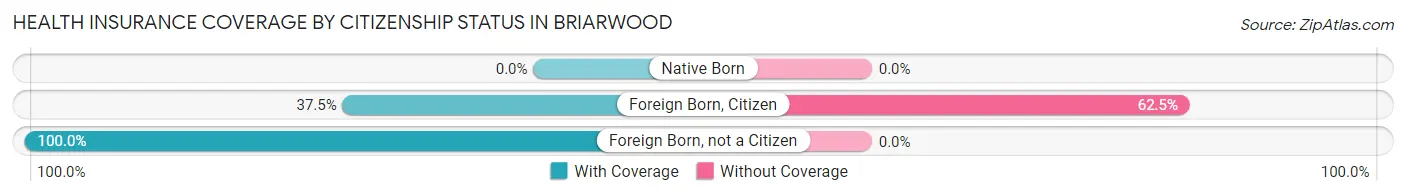
| Citizenship Status | With Coverage | Without Coverage |
| Native Born | 0 (0.0%) | 0 (0.0%) |
| Foreign Born, Citizen | 3 (37.5%) | 5 (62.5%) |
| Foreign Born, not a Citizen | 7 (100.0%) | 0 (0.0%) |
Health Insurance Coverage by Household Income in Briarwood
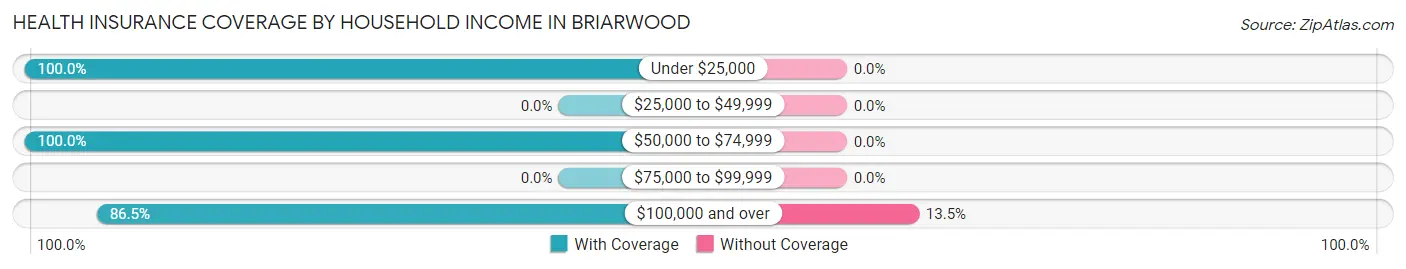
| Household Income | With Coverage | Without Coverage |
| Under $25,000 | 1 (100.0%) | 0 (0.0%) |
| $25,000 to $49,999 | 0 (0.0%) | 0 (0.0%) |
| $50,000 to $74,999 | 18 (100.0%) | 0 (0.0%) |
| $75,000 to $99,999 | 0 (0.0%) | 0 (0.0%) |
| $100,000 and over | 32 (86.5%) | 5 (13.5%) |
Public vs Private Health Insurance Coverage by Age in Briarwood
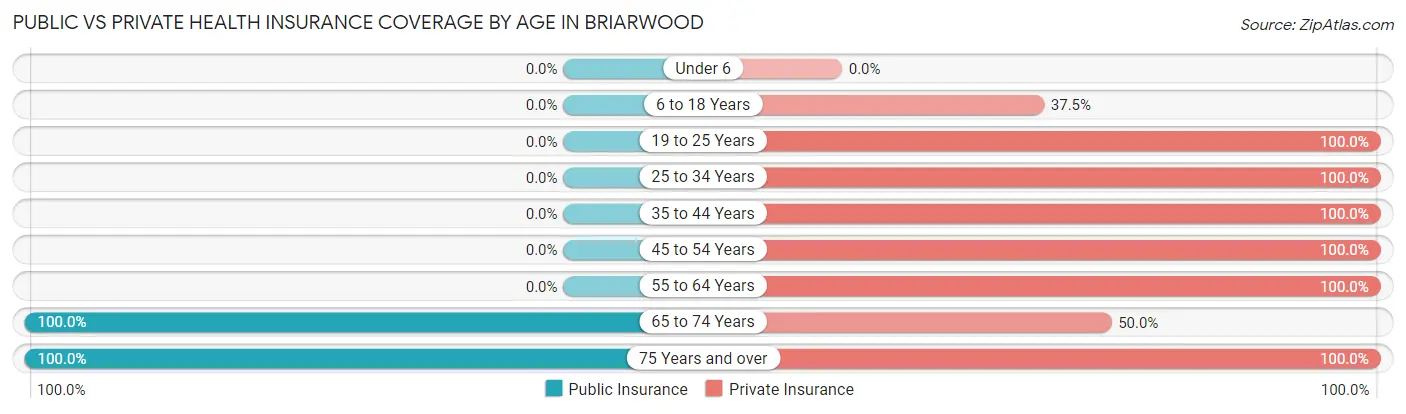
| Age Bracket | Public Insurance | Private Insurance |
| Under 6 | 0 (0.0%) | 0 (0.0%) |
| 6 to 18 Years | 0 (0.0%) | 3 (37.5%) |
| 19 to 25 Years | 0 (0.0%) | 7 (100.0%) |
| 25 to 34 Years | 0 (0.0%) | 1 (100.0%) |
| 35 to 44 Years | 0 (0.0%) | 1 (100.0%) |
| 45 to 54 Years | 0 (0.0%) | 14 (100.0%) |
| 55 to 64 Years | 0 (0.0%) | 18 (100.0%) |
| 65 to 74 Years | 6 (100.0%) | 3 (50.0%) |
| 75 Years and over | 1 (100.0%) | 1 (100.0%) |
| Total | 7 (12.5%) | 48 (85.7%) |
Disability Status by Sex by Age in Briarwood
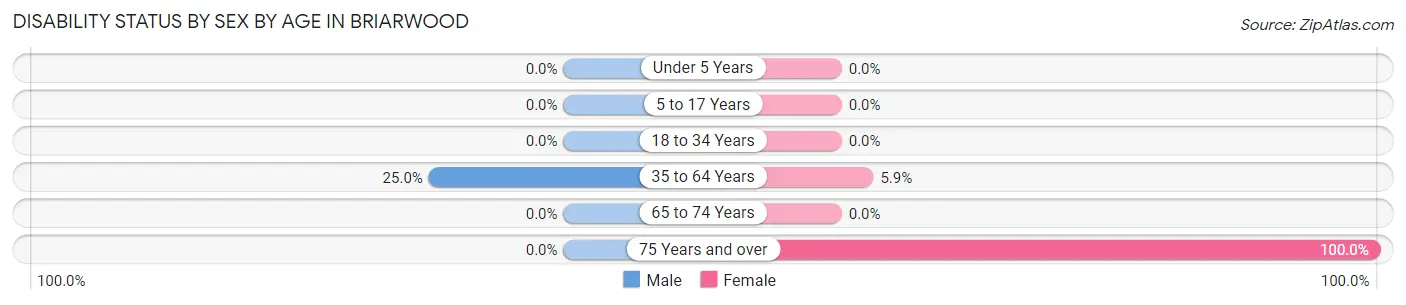
| Age Bracket | Male | Female |
| Under 5 Years | 0 (0.0%) | 0 (0.0%) |
| 5 to 17 Years | 0 (0.0%) | 0 (0.0%) |
| 18 to 34 Years | 0 (0.0%) | 0 (0.0%) |
| 35 to 64 Years | 4 (25.0%) | 1 (5.9%) |
| 65 to 74 Years | 0 (0.0%) | 0 (0.0%) |
| 75 Years and over | 0 (0.0%) | 1 (100.0%) |
Disability Class by Sex by Age in Briarwood
Disability Class: Hearing Difficulty
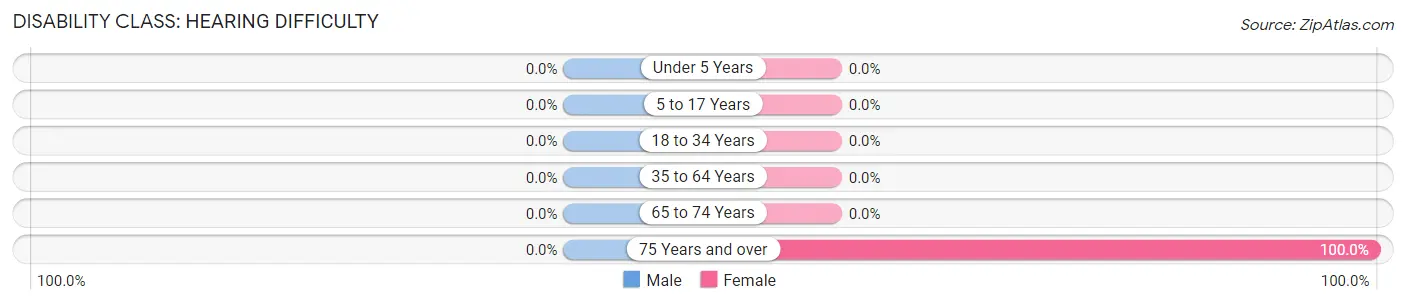
| Age Bracket | Male | Female |
| Under 5 Years | 0 (0.0%) | 0 (0.0%) |
| 5 to 17 Years | 0 (0.0%) | 0 (0.0%) |
| 18 to 34 Years | 0 (0.0%) | 0 (0.0%) |
| 35 to 64 Years | 0 (0.0%) | 0 (0.0%) |
| 65 to 74 Years | 0 (0.0%) | 0 (0.0%) |
| 75 Years and over | 0 (0.0%) | 1 (100.0%) |
Disability Class: Vision Difficulty
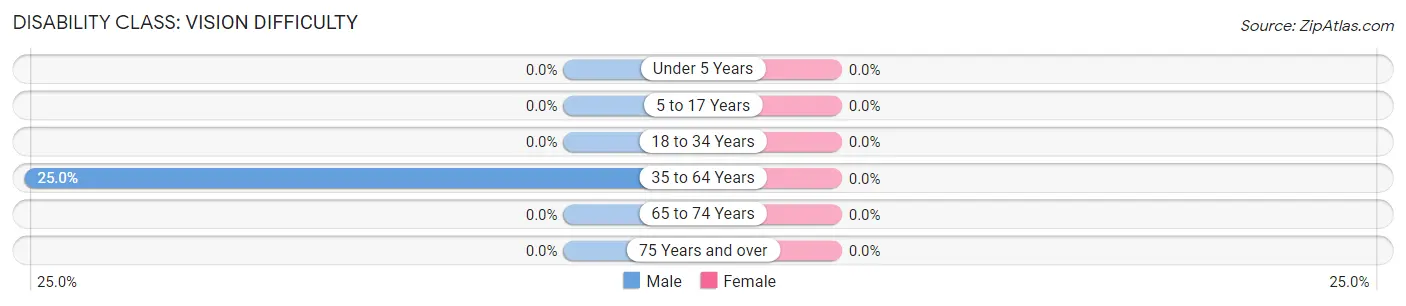
| Age Bracket | Male | Female |
| Under 5 Years | 0 (0.0%) | 0 (0.0%) |
| 5 to 17 Years | 0 (0.0%) | 0 (0.0%) |
| 18 to 34 Years | 0 (0.0%) | 0 (0.0%) |
| 35 to 64 Years | 4 (25.0%) | 0 (0.0%) |
| 65 to 74 Years | 0 (0.0%) | 0 (0.0%) |
| 75 Years and over | 0 (0.0%) | 0 (0.0%) |
Disability Class: Cognitive Difficulty
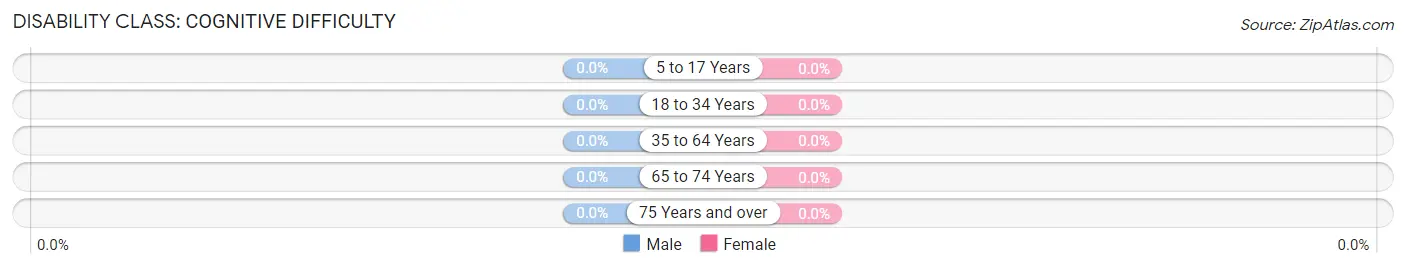
| Age Bracket | Male | Female |
| 5 to 17 Years | 0 (0.0%) | 0 (0.0%) |
| 18 to 34 Years | 0 (0.0%) | 0 (0.0%) |
| 35 to 64 Years | 0 (0.0%) | 0 (0.0%) |
| 65 to 74 Years | 0 (0.0%) | 0 (0.0%) |
| 75 Years and over | 0 (0.0%) | 0 (0.0%) |
Disability Class: Ambulatory Difficulty
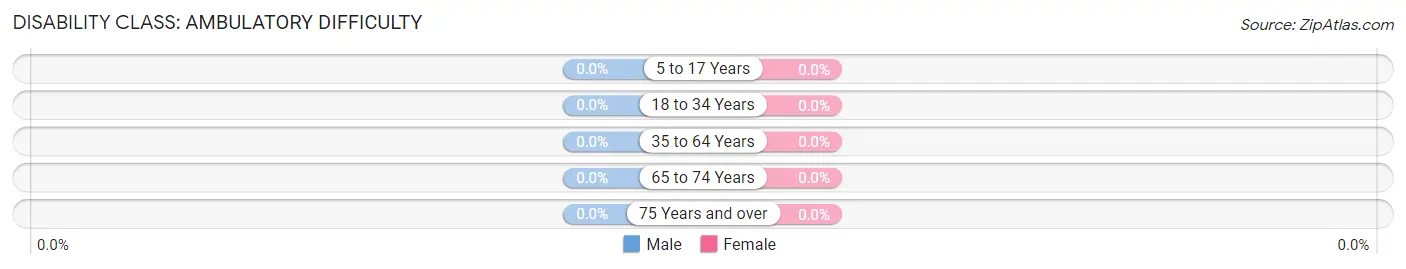
| Age Bracket | Male | Female |
| 5 to 17 Years | 0 (0.0%) | 0 (0.0%) |
| 18 to 34 Years | 0 (0.0%) | 0 (0.0%) |
| 35 to 64 Years | 0 (0.0%) | 0 (0.0%) |
| 65 to 74 Years | 0 (0.0%) | 0 (0.0%) |
| 75 Years and over | 0 (0.0%) | 0 (0.0%) |
Disability Class: Self-Care Difficulty
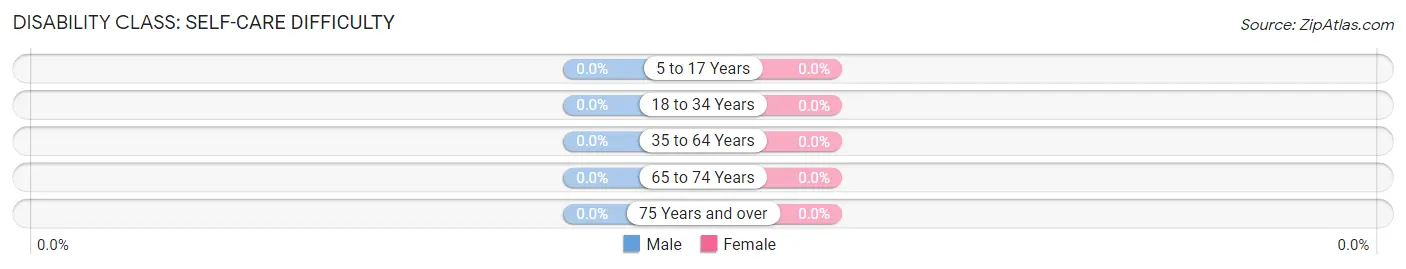
| Age Bracket | Male | Female |
| 5 to 17 Years | 0 (0.0%) | 0 (0.0%) |
| 18 to 34 Years | 0 (0.0%) | 0 (0.0%) |
| 35 to 64 Years | 0 (0.0%) | 0 (0.0%) |
| 65 to 74 Years | 0 (0.0%) | 0 (0.0%) |
| 75 Years and over | 0 (0.0%) | 0 (0.0%) |
Technology Access in Briarwood
Computing Device Access in Briarwood
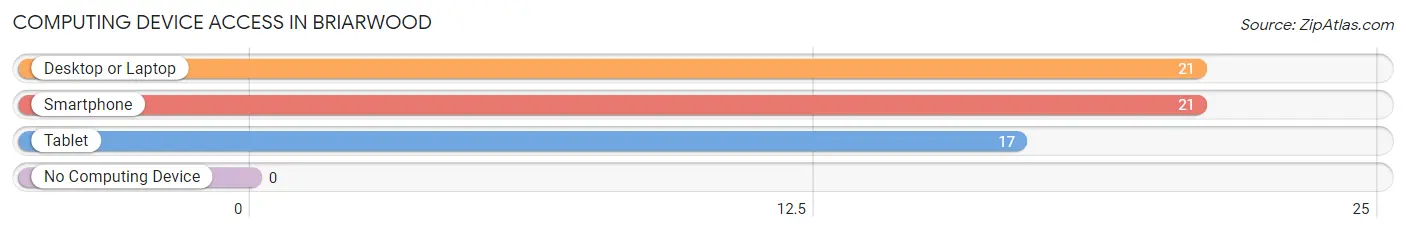
| Device Type | # Households | % Households |
| Desktop or Laptop | 21 | 100.0% |
| Smartphone | 21 | 100.0% |
| Tablet | 17 | 80.9% |
| No Computing Device | 0 | 0.0% |
| Total | 21 | 100.0% |
Internet Access in Briarwood
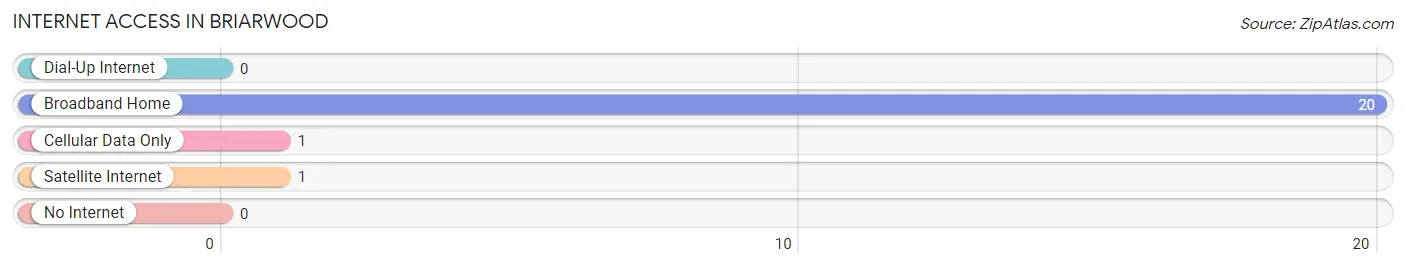
| Internet Type | # Households | % Households |
| Dial-Up Internet | 0 | 0.0% |
| Broadband Home | 20 | 95.2% |
| Cellular Data Only | 1 | 4.8% |
| Satellite Internet | 1 | 4.8% |
| No Internet | 0 | 0.0% |
| Total | 21 | 100.0% |
Briarwood Summary
Briarwood is a small town located in the state of North Dakota, United States. It is situated in the southeastern corner of the state, near the border with Minnesota. The town has a population of approximately 500 people, and is part of the Grand Forks metropolitan area.
History
Briarwood was founded in 1883 by a group of settlers from Minnesota. The town was named after the briarwood trees that grew in the area. The settlers were attracted to the area due to its fertile soil and abundant wildlife. The town quickly grew and by the early 1900s, it had become a thriving agricultural community.
In the early 20th century, Briarwood was a popular destination for tourists. The town was known for its picturesque scenery and its abundance of outdoor activities. In the 1950s, the town began to decline as many of its residents moved away in search of better economic opportunities.
Geography
Briarwood is located in the southeastern corner of North Dakota, near the border with Minnesota. The town is situated on the banks of the Red River of the North, which forms the border between the two states. The town is surrounded by rolling hills and prairies, and is located in the Red River Valley.
The climate in Briarwood is continental, with cold winters and hot summers. The average annual temperature is around 45°F (7°C). The town receives an average of 25 inches (63 cm) of precipitation per year.
Economy
The economy of Briarwood is largely based on agriculture. The town is home to several farms, which produce a variety of crops, including wheat, corn, soybeans, and hay. The town also has a small manufacturing sector, which produces a variety of products, including furniture and clothing.
The town is also home to several small businesses, including restaurants, grocery stores, and retail stores. The town is served by a small airport, which provides air service to the surrounding area.
Demographics
As of the 2010 census, the population of Briarwood was 498. The racial makeup of the town was 97.2% White, 0.2% African American, 0.4% Native American, 0.2% Asian, 0.2% from other races, and 1.9% from two or more races. Hispanic or Latino of any race were 0.8% of the population.
The median income for a household in Briarwood was $41,250, and the median income for a family was $45,625. The per capita income for the town was $18,945. About 8.2% of families and 10.2% of the population were below the poverty line, including 11.2% of those under age 18 and 8.3% of those age 65 or over.
Briarwood is a small town with a rich history and a strong agricultural economy. The town is home to a diverse population, and offers a variety of outdoor activities and attractions. The town is a great place to live, work, and raise a family.
Common Questions
What is Per Capita Income in Briarwood?
Per Capita income in Briarwood is $104,984.
What is the Median Family Income in Briarwood?
Median Family Income in Briarwood is $155,417.
What is the Median Household income in Briarwood?
Median Household Income in Briarwood is $153,750.
What is Inequality or Gini Index in Briarwood?
Inequality or Gini Index in Briarwood is 0.56.
What is the Total Population of Briarwood?
Total Population of Briarwood is 56.
What is the Total Male Population of Briarwood?
Total Male Population of Briarwood is 34.
What is the Total Female Population of Briarwood?
Total Female Population of Briarwood is 22.
What is the Ratio of Males per 100 Females in Briarwood?
There are 154.55 Males per 100 Females in Briarwood.
What is the Ratio of Females per 100 Males in Briarwood?
There are 64.71 Females per 100 Males in Briarwood.
What is the Median Population Age in Briarwood?
Median Population Age in Briarwood is 54.4 Years.
What is the Average Family Size in Briarwood
Average Family Size in Briarwood is 2.8 People.
What is the Average Household Size in Briarwood
Average Household Size in Briarwood is 2.7 People.
How Large is the Labor Force in Briarwood?
There are 31 People in the Labor Forcein in Briarwood.
What is the Percentage of People in the Labor Force in Briarwood?
64.6% of People are in the Labor Force in Briarwood.