Brant Lake South, SD Map & Demographics
Brant Lake South Map
Brant Lake South Overview
$44,719
PER CAPITA INCOME
$100,745
AVG FAMILY INCOME
$100,372
AVG HOUSEHOLD INCOME
76.4%
WAGE / INCOME GAP [ % ]
23.6¢/ $1
WAGE / INCOME GAP [ $ ]
0.40
INEQUALITY / GINI INDEX
223
TOTAL POPULATION
94
MALE POPULATION
129
FEMALE POPULATION
72.87
MALES / 100 FEMALES
137.23
FEMALES / 100 MALES
54.9
MEDIAN AGE
2.3
AVG FAMILY SIZE
2.1
AVG HOUSEHOLD SIZE
158
LABOR FORCE [ PEOPLE ]
72.8%
PERCENT IN LABOR FORCE
Income in Brant Lake South
Income Overview in Brant Lake South
Per Capita Income in Brant Lake South is $44,719, while median incomes of families and households are $100,745 and $100,372 respectively.
| Characteristic | Number | Measure |
| Per Capita Income | 223 | $44,719 |
| Median Family Income | 90 | $100,745 |
| Mean Family Income | 90 | $117,926 |
| Median Household Income | 104 | $100,372 |
| Mean Household Income | 104 | $104,287 |
| Income Deficit | 90 | $0 |
| Wage / Income Gap (%) | 223 | 76.36% |
| Wage / Income Gap ($) | 223 | 23.64¢ per $1 |
| Gini / Inequality Index | 223 | 0.40 |
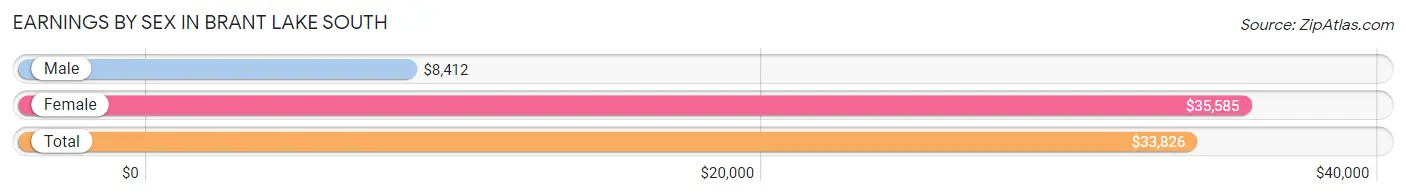
Earnings by Sex in Brant Lake South
Average Earnings in Brant Lake South are $33,826, $8,412 for men and $35,585 for women, a difference of 76.4%.
| Sex | Number | Average Earnings |
| Male | 85 (46.5%) | $8,412 |
| Female | 98 (53.5%) | $35,585 |
| Total | 183 (100.0%) | $33,826 |
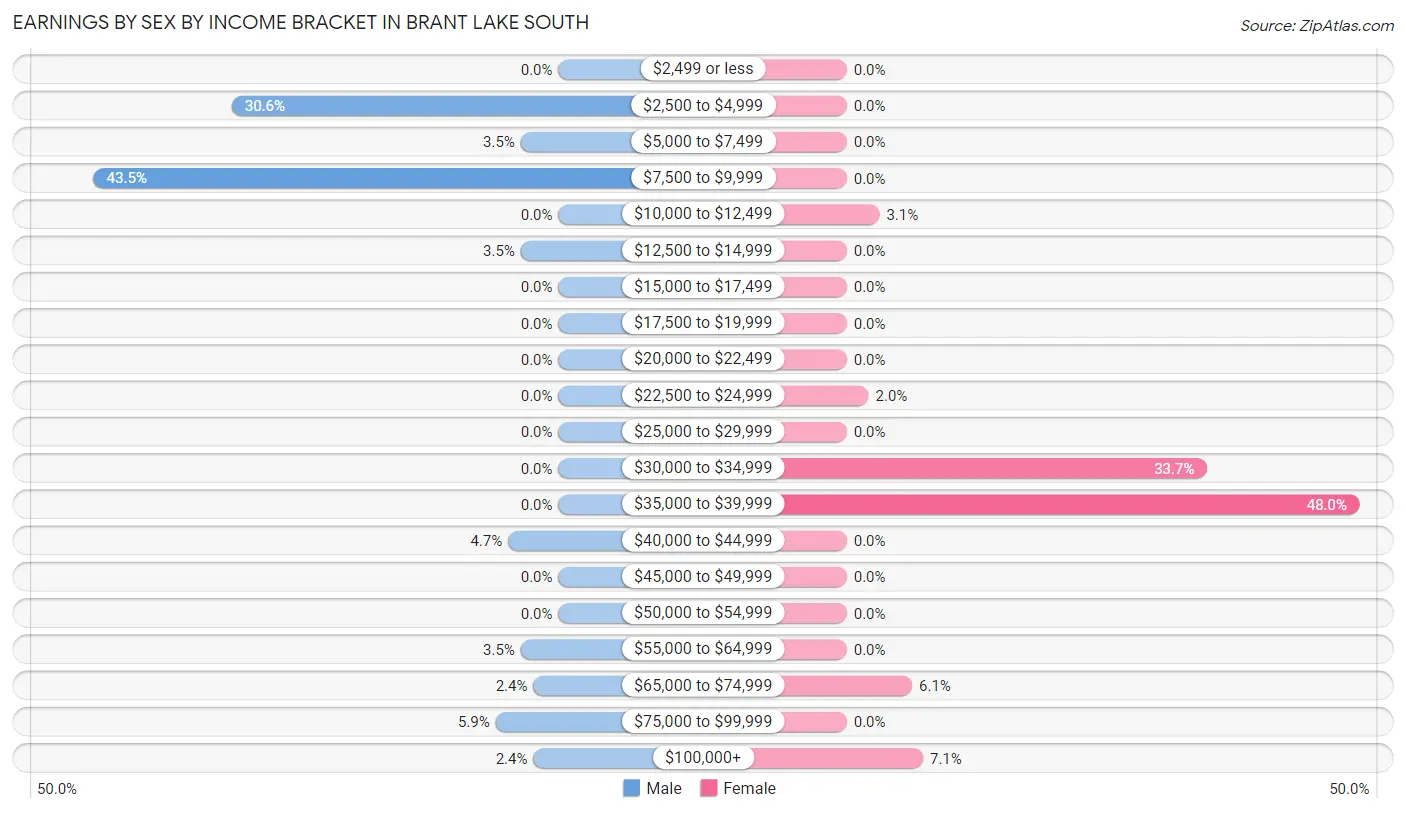
Earnings by Sex by Income Bracket in Brant Lake South
The most common earnings brackets in Brant Lake South are $7,500 to $9,999 for men (37 | 43.5%) and $35,000 to $39,999 for women (47 | 48.0%).
| Income | Male | Female |
| $2,499 or less | 0 (0.0%) | 0 (0.0%) |
| $2,500 to $4,999 | 26 (30.6%) | 0 (0.0%) |
| $5,000 to $7,499 | 3 (3.5%) | 0 (0.0%) |
| $7,500 to $9,999 | 37 (43.5%) | 0 (0.0%) |
| $10,000 to $12,499 | 0 (0.0%) | 3 (3.1%) |
| $12,500 to $14,999 | 3 (3.5%) | 0 (0.0%) |
| $15,000 to $17,499 | 0 (0.0%) | 0 (0.0%) |
| $17,500 to $19,999 | 0 (0.0%) | 0 (0.0%) |
| $20,000 to $22,499 | 0 (0.0%) | 0 (0.0%) |
| $22,500 to $24,999 | 0 (0.0%) | 2 (2.0%) |
| $25,000 to $29,999 | 0 (0.0%) | 0 (0.0%) |
| $30,000 to $34,999 | 0 (0.0%) | 33 (33.7%) |
| $35,000 to $39,999 | 0 (0.0%) | 47 (48.0%) |
| $40,000 to $44,999 | 4 (4.7%) | 0 (0.0%) |
| $45,000 to $49,999 | 0 (0.0%) | 0 (0.0%) |
| $50,000 to $54,999 | 0 (0.0%) | 0 (0.0%) |
| $55,000 to $64,999 | 3 (3.5%) | 0 (0.0%) |
| $65,000 to $74,999 | 2 (2.4%) | 6 (6.1%) |
| $75,000 to $99,999 | 5 (5.9%) | 0 (0.0%) |
| $100,000+ | 2 (2.4%) | 7 (7.1%) |
| Total | 85 (100.0%) | 98 (100.0%) |
Earnings by Sex by Educational Attainment in Brant Lake South

| Educational Attainment | Male Income | Female Income |
| Less than High School | - | - |
| High School Diploma | - | - |
| College or Associate's Degree | $8,953 | $0 |
| Bachelor's Degree | - | - |
| Graduate Degree | - | - |
| Total | $8,514 | $36,463 |
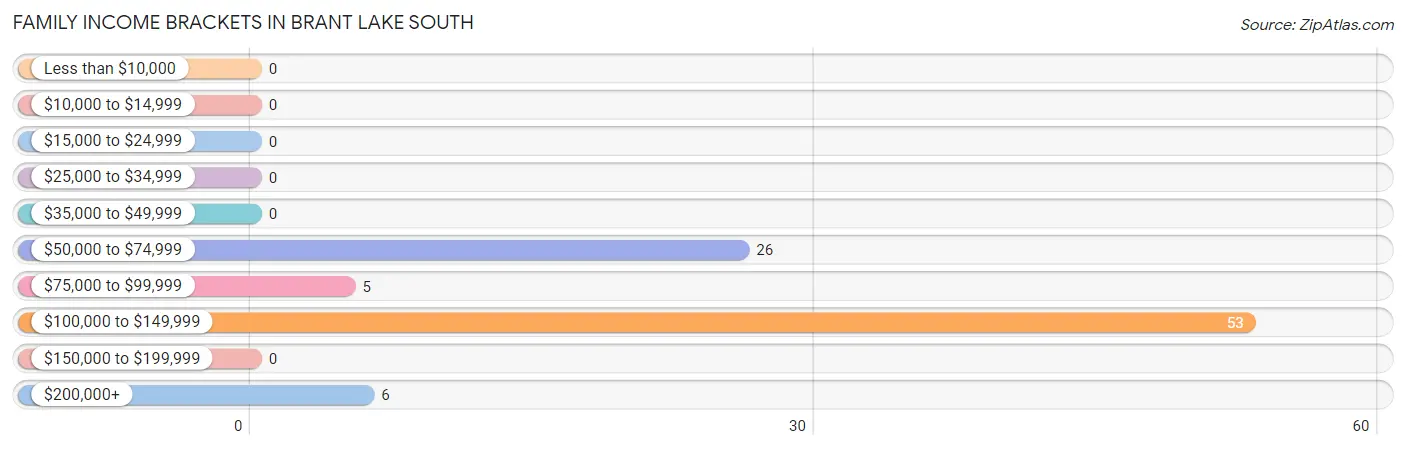
Family Income in Brant Lake South
Family Income Brackets in Brant Lake South
According to the Brant Lake South family income data, there are 53 families falling into the $100,000 to $149,999 income range, which is the most common income bracket and makes up 58.9% of all families.
| Income Bracket | # Families | % Families |
| Less than $10,000 | 0 | 0.0% |
| $10,000 to $14,999 | 0 | 0.0% |
| $15,000 to $24,999 | 0 | 0.0% |
| $25,000 to $34,999 | 0 | 0.0% |
| $35,000 to $49,999 | 0 | 0.0% |
| $50,000 to $74,999 | 26 | 28.9% |
| $75,000 to $99,999 | 5 | 5.6% |
| $100,000 to $149,999 | 53 | 58.9% |
| $150,000 to $199,999 | 0 | 0.0% |
| $200,000+ | 6 | 6.7% |
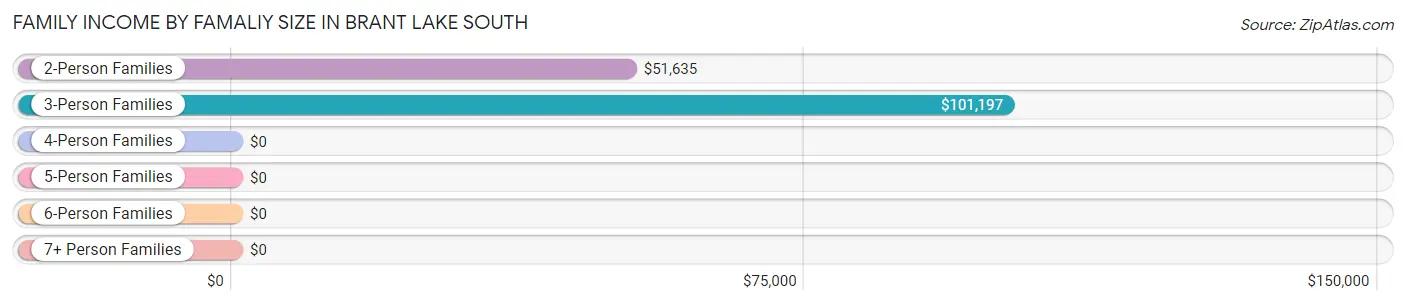
Family Income by Famaliy Size in Brant Lake South
3-person families (55 | 61.1%) account for the highest median family income in Brant Lake South with $101,197 per family, while 3-person families (55 | 61.1%) have the highest median income of $33,732 per family member.
| Income Bracket | # Families | Median Income |
| 2-Person Families | 34 (37.8%) | $51,635 |
| 3-Person Families | 55 (61.1%) | $101,197 |
| 4-Person Families | 1 (1.1%) | $0 |
| 5-Person Families | 0 (0.0%) | $0 |
| 6-Person Families | 0 (0.0%) | $0 |
| 7+ Person Families | 0 (0.0%) | $0 |
| Total | 90 (100.0%) | $100,745 |
Family Income by Number of Earners in Brant Lake South
| Number of Earners | # Families | Median Income |
| No Earners | 0 (0.0%) | $0 |
| 1 Earner | 26 (28.9%) | $0 |
| 2 Earners | 14 (15.6%) | $0 |
| 3+ Earners | 50 (55.6%) | $0 |
| Total | 90 (100.0%) | $100,745 |
Household Income in Brant Lake South
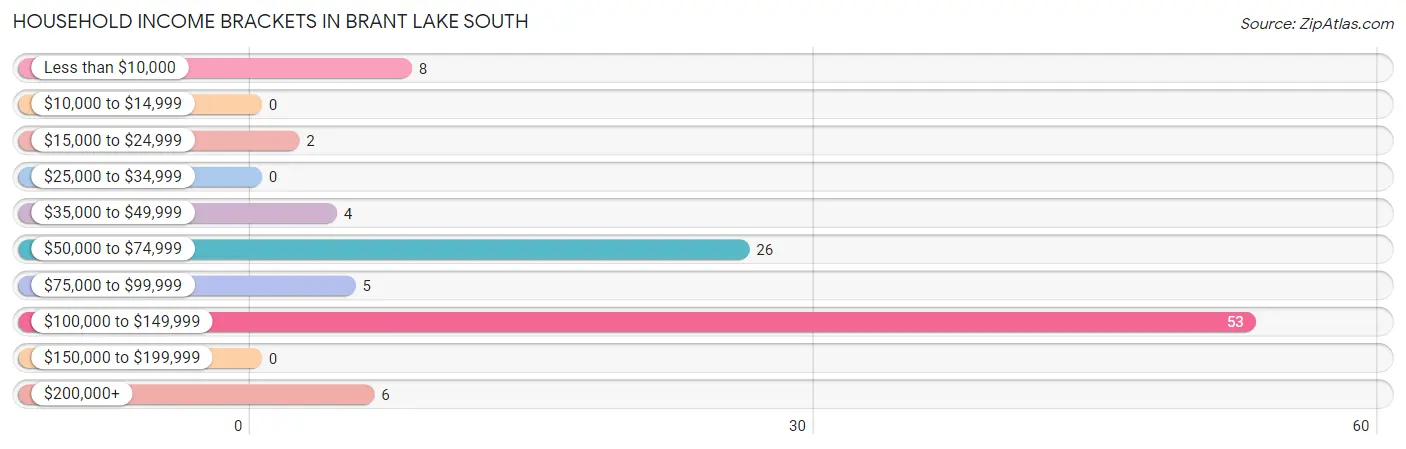
Household Income Brackets in Brant Lake South
With 53 households falling in the category, the $100,000 to $149,999 income range is the most frequent in Brant Lake South, accounting for 51.0% of all households.
| Income Bracket | # Households | % Households |
| Less than $10,000 | 8 | 7.7% |
| $10,000 to $14,999 | 0 | 0.0% |
| $15,000 to $24,999 | 2 | 1.9% |
| $25,000 to $34,999 | 0 | 0.0% |
| $35,000 to $49,999 | 4 | 3.8% |
| $50,000 to $74,999 | 26 | 25.0% |
| $75,000 to $99,999 | 5 | 4.8% |
| $100,000 to $149,999 | 53 | 51.0% |
| $150,000 to $199,999 | 0 | 0.0% |
| $200,000+ | 6 | 5.8% |
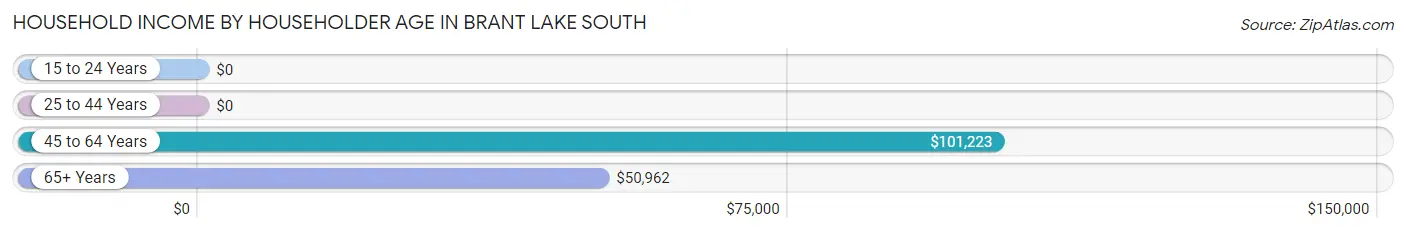
Household Income by Householder Age in Brant Lake South
The median household income in Brant Lake South is $100,372, with the highest median household income of $101,223 found in the 45 to 64 years age bracket for the primary householder. A total of 72 households (69.2%) fall into this category.
| Income Bracket | # Households | Median Income |
| 15 to 24 Years | 0 (0.0%) | $0 |
| 25 to 44 Years | 0 (0.0%) | $0 |
| 45 to 64 Years | 72 (69.2%) | $101,223 |
| 65+ Years | 32 (30.8%) | $50,962 |
| Total | 104 (100.0%) | $100,372 |
Poverty in Brant Lake South
Income Below Poverty by Sex and Age in Brant Lake South
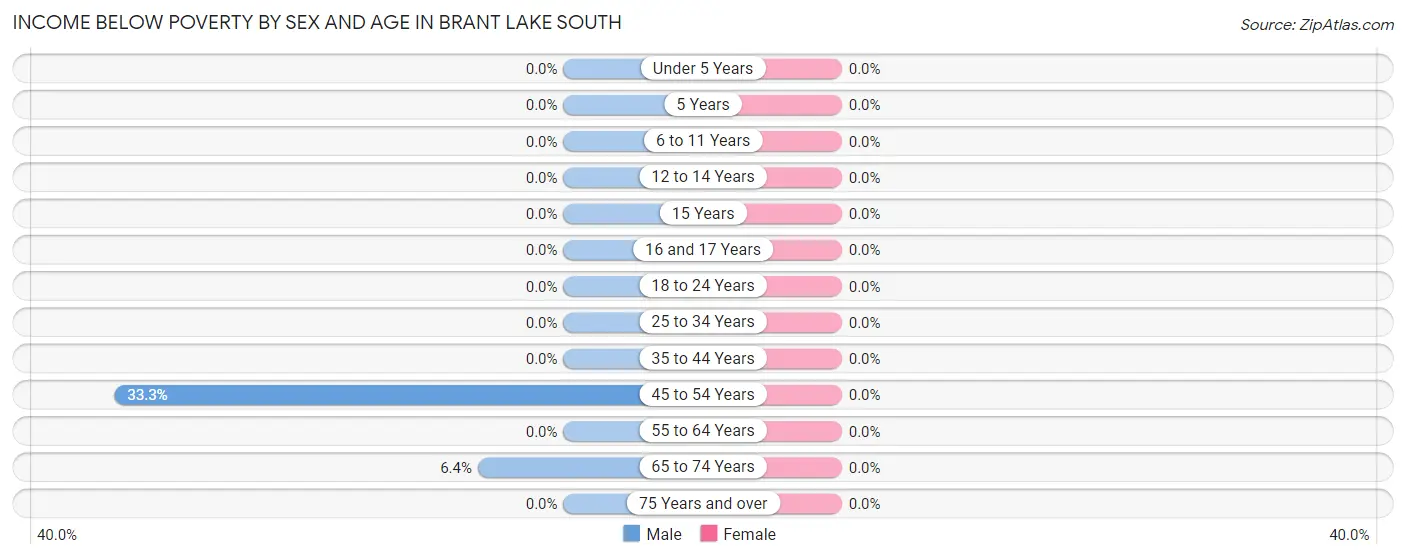
| Age Bracket | Male | Female |
| Under 5 Years | 0 (0.0%) | 0 (0.0%) |
| 5 Years | 0 (0.0%) | 0 (0.0%) |
| 6 to 11 Years | 0 (0.0%) | 0 (0.0%) |
| 12 to 14 Years | 0 (0.0%) | 0 (0.0%) |
| 15 Years | 0 (0.0%) | 0 (0.0%) |
| 16 and 17 Years | 0 (0.0%) | 0 (0.0%) |
| 18 to 24 Years | 0 (0.0%) | 0 (0.0%) |
| 25 to 34 Years | 0 (0.0%) | 0 (0.0%) |
| 35 to 44 Years | 0 (0.0%) | 0 (0.0%) |
| 45 to 54 Years | 4 (33.3%) | 0 (0.0%) |
| 55 to 64 Years | 0 (0.0%) | 0 (0.0%) |
| 65 to 74 Years | 4 (6.4%) | 0 (0.0%) |
| 75 Years and over | 0 (0.0%) | 0 (0.0%) |
| Total | 8 (8.5%) | 0 (0.0%) |
Income Above Poverty by Sex and Age in Brant Lake South
According to the poverty statistics in Brant Lake South, males aged under 5 years and females aged 12 to 14 years are the age groups that are most secure financially, with 100.0% of males and 100.0% of females in these age groups living above the poverty line.
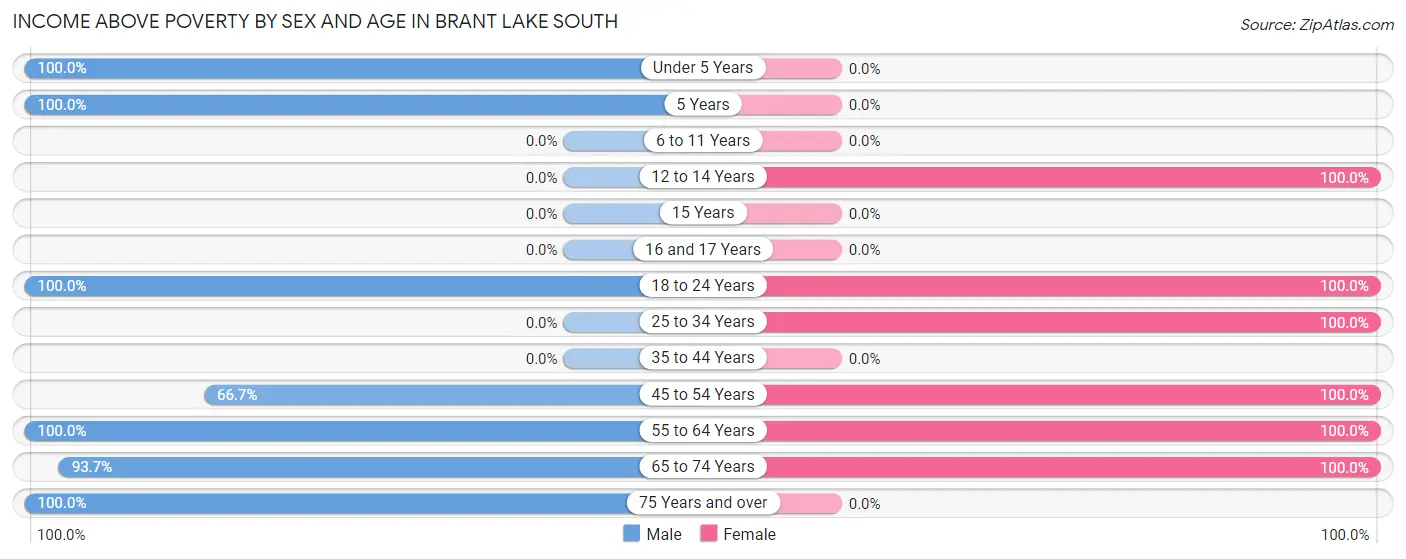
| Age Bracket | Male | Female |
| Under 5 Years | 1 (100.0%) | 0 (0.0%) |
| 5 Years | 2 (100.0%) | 0 (0.0%) |
| 6 to 11 Years | 0 (0.0%) | 0 (0.0%) |
| 12 to 14 Years | 0 (0.0%) | 3 (100.0%) |
| 15 Years | 0 (0.0%) | 0 (0.0%) |
| 16 and 17 Years | 0 (0.0%) | 0 (0.0%) |
| 18 to 24 Years | 3 (100.0%) | 33 (100.0%) |
| 25 to 34 Years | 0 (0.0%) | 2 (100.0%) |
| 35 to 44 Years | 0 (0.0%) | 0 (0.0%) |
| 45 to 54 Years | 8 (66.7%) | 56 (100.0%) |
| 55 to 64 Years | 11 (100.0%) | 9 (100.0%) |
| 65 to 74 Years | 59 (93.6%) | 26 (100.0%) |
| 75 Years and over | 2 (100.0%) | 0 (0.0%) |
| Total | 86 (91.5%) | 129 (100.0%) |
Income Below Poverty Among Married-Couple Families in Brant Lake South
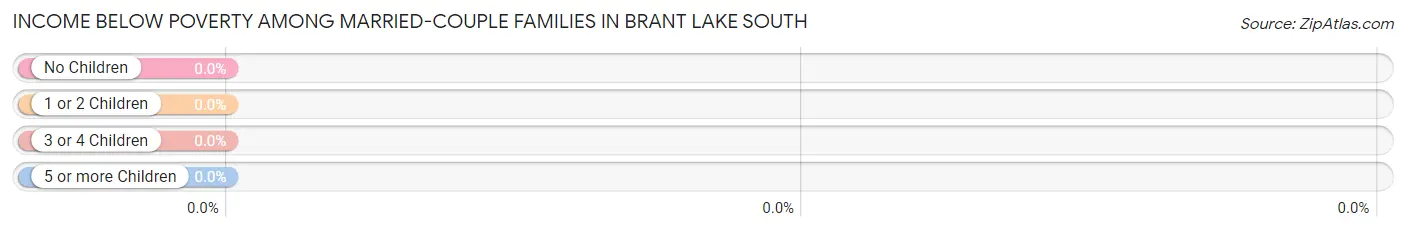
| Children | Above Poverty | Below Poverty |
| No Children | 39 (100.0%) | 0 (0.0%) |
| 1 or 2 Children | 4 (100.0%) | 0 (0.0%) |
| 3 or 4 Children | 0 (0.0%) | 0 (0.0%) |
| 5 or more Children | 0 (0.0%) | 0 (0.0%) |
| Total | 43 (100.0%) | 0 (0.0%) |
Income Below Poverty Among Single-Parent Households in Brant Lake South
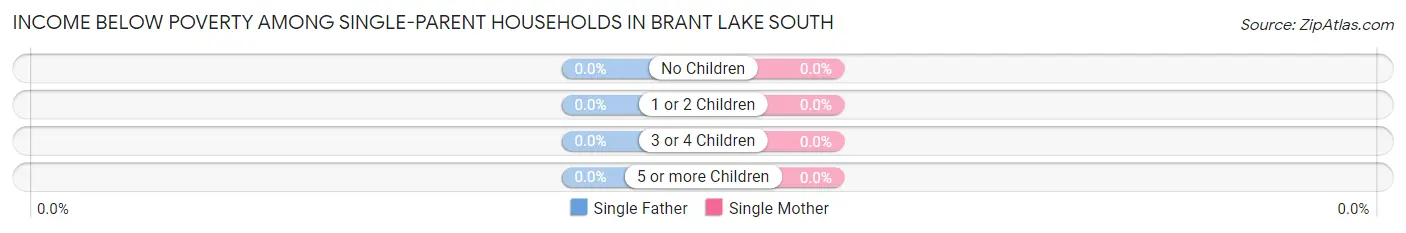
| Children | Single Father | Single Mother |
| No Children | 0 (0.0%) | 0 (0.0%) |
| 1 or 2 Children | 0 (0.0%) | 0 (0.0%) |
| 3 or 4 Children | 0 (0.0%) | 0 (0.0%) |
| 5 or more Children | 0 (0.0%) | 0 (0.0%) |
| Total | 0 (0.0%) | 0 (0.0%) |
Income Below Poverty Among Married-Couple vs Single-Parent Households in Brant Lake South
| Children | Married-Couple Families | Single-Parent Households |
| No Children | 0 (0.0%) | 0 (0.0%) |
| 1 or 2 Children | 0 (0.0%) | 0 (0.0%) |
| 3 or 4 Children | 0 (0.0%) | 0 (0.0%) |
| 5 or more Children | 0 (0.0%) | 0 (0.0%) |
| Total | 0 (0.0%) | 0 (0.0%) |
Race in Brant Lake South
The most populous races in Brant Lake South are White / Caucasian (143 | 64.1%), and Native / Alaskan (80 | 35.9%).
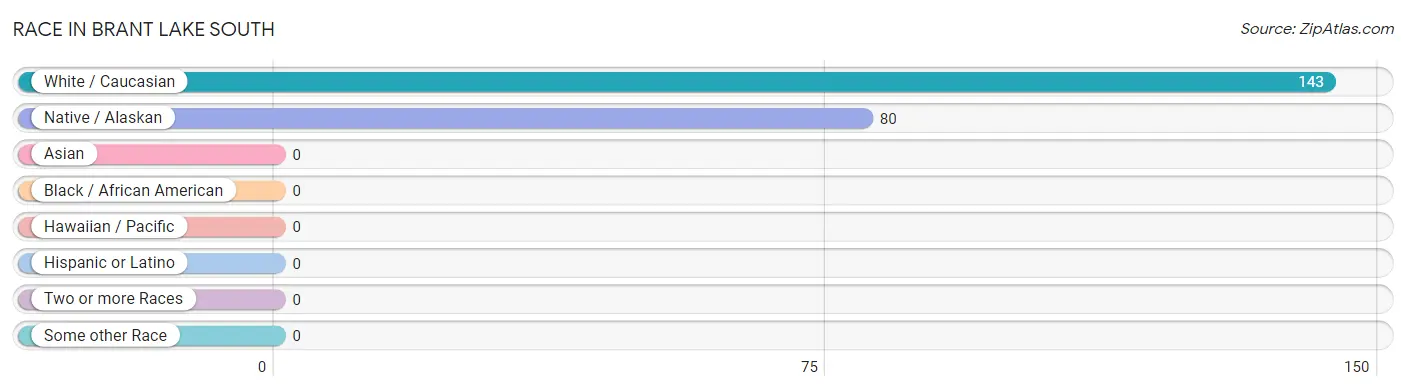
| Race | # Population | % Population |
| Asian | 0 | 0.0% |
| Black / African American | 0 | 0.0% |
| Hawaiian / Pacific | 0 | 0.0% |
| Hispanic or Latino | 0 | 0.0% |
| Native / Alaskan | 80 | 35.9% |
| White / Caucasian | 143 | 64.1% |
| Two or more Races | 0 | 0.0% |
| Some other Race | 0 | 0.0% |
| Total | 223 | 100.0% |
Ancestry in Brant Lake South
The most populous ancestries reported in Brant Lake South are Cherokee (80 | 35.9%), German (66 | 29.6%), Norwegian (53 | 23.8%), Irish (34 | 15.2%), and English (8 | 3.6%), together accounting for 108.1% of all Brant Lake South residents.
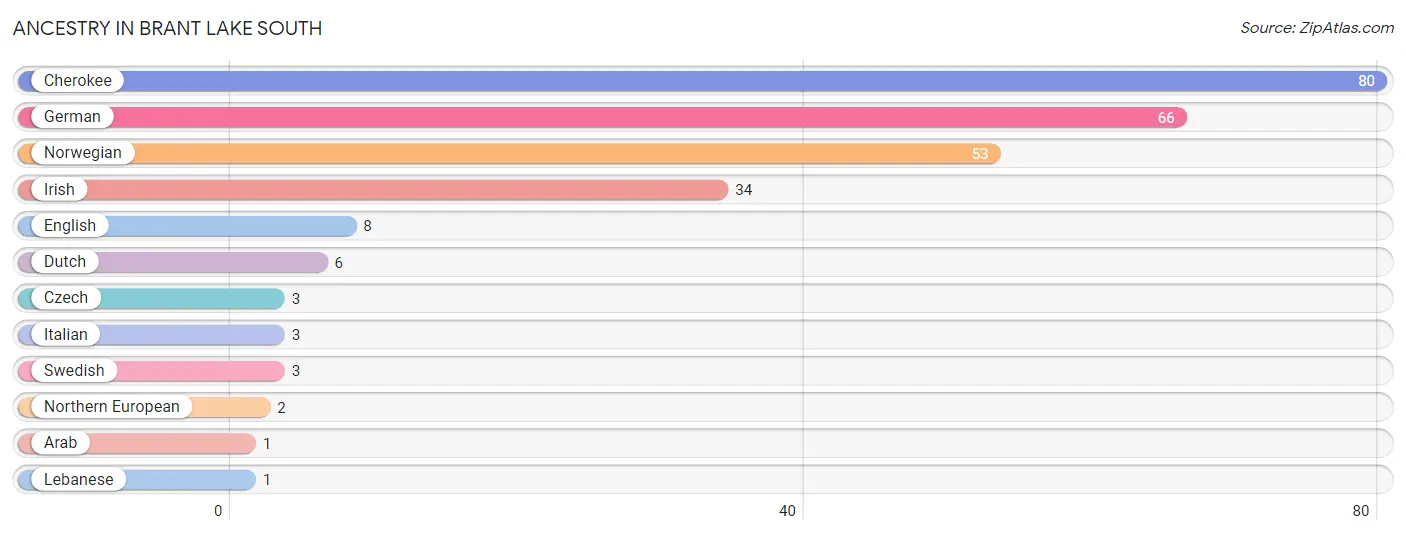
| Ancestry | # Population | % Population |
| Arab | 1 | 0.4% |
| Cherokee | 80 | 35.9% |
| Czech | 3 | 1.3% |
| Dutch | 6 | 2.7% |
| English | 8 | 3.6% |
| German | 66 | 29.6% |
| Irish | 34 | 15.2% |
| Italian | 3 | 1.3% |
| Lebanese | 1 | 0.4% |
| Northern European | 2 | 0.9% |
| Norwegian | 53 | 23.8% |
| Swedish | 3 | 1.3% | View All 12 Rows |
Immigrants in Brant Lake South

| Immigration Origin | # Population | % Population | View All 0 Rows |
Sex and Age in Brant Lake South
Sex and Age in Brant Lake South
The most populous age groups in Brant Lake South are 65 to 69 Years (41 | 43.6%) for men and 45 to 49 Years (53 | 41.1%) for women.
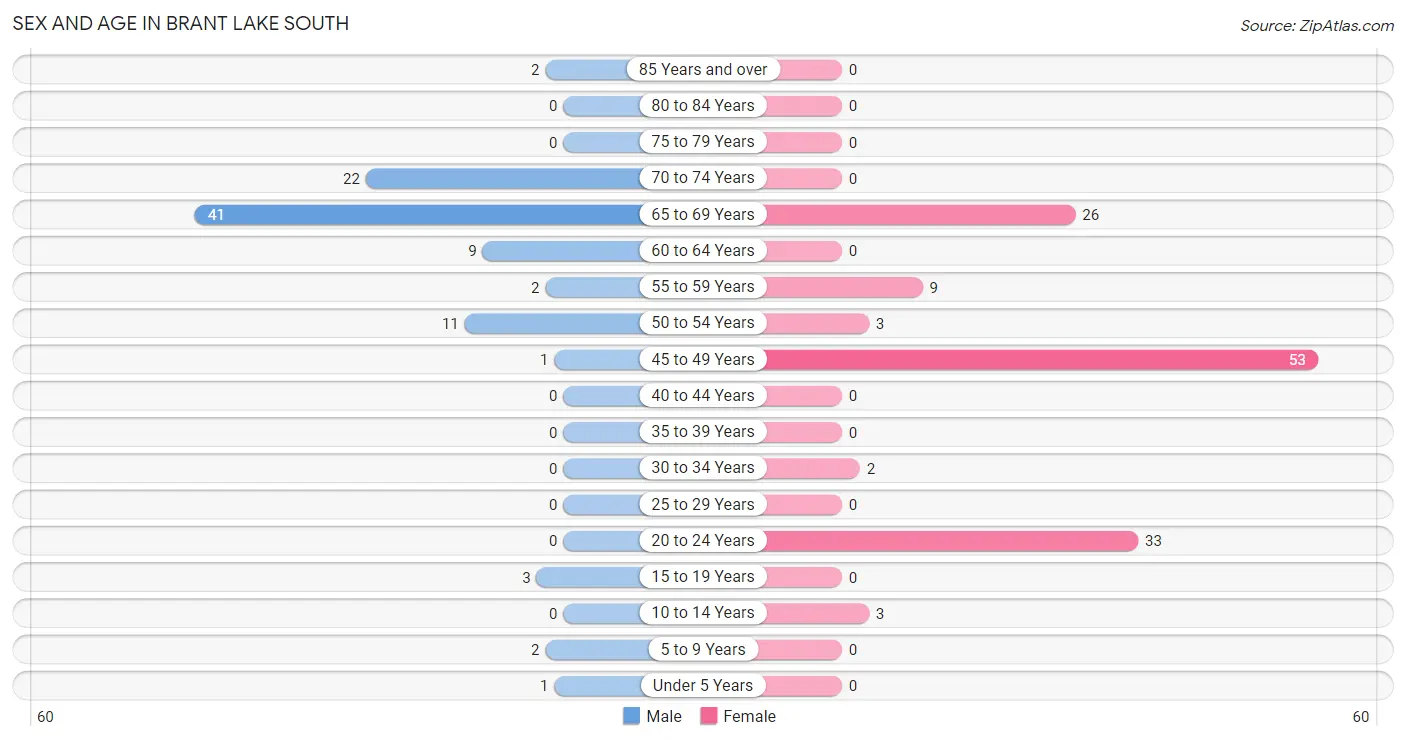
| Age Bracket | Male | Female |
| Under 5 Years | 1 (1.1%) | 0 (0.0%) |
| 5 to 9 Years | 2 (2.1%) | 0 (0.0%) |
| 10 to 14 Years | 0 (0.0%) | 3 (2.3%) |
| 15 to 19 Years | 3 (3.2%) | 0 (0.0%) |
| 20 to 24 Years | 0 (0.0%) | 33 (25.6%) |
| 25 to 29 Years | 0 (0.0%) | 0 (0.0%) |
| 30 to 34 Years | 0 (0.0%) | 2 (1.5%) |
| 35 to 39 Years | 0 (0.0%) | 0 (0.0%) |
| 40 to 44 Years | 0 (0.0%) | 0 (0.0%) |
| 45 to 49 Years | 1 (1.1%) | 53 (41.1%) |
| 50 to 54 Years | 11 (11.7%) | 3 (2.3%) |
| 55 to 59 Years | 2 (2.1%) | 9 (7.0%) |
| 60 to 64 Years | 9 (9.6%) | 0 (0.0%) |
| 65 to 69 Years | 41 (43.6%) | 26 (20.2%) |
| 70 to 74 Years | 22 (23.4%) | 0 (0.0%) |
| 75 to 79 Years | 0 (0.0%) | 0 (0.0%) |
| 80 to 84 Years | 0 (0.0%) | 0 (0.0%) |
| 85 Years and over | 2 (2.1%) | 0 (0.0%) |
| Total | 94 (100.0%) | 129 (100.0%) |
Families and Households in Brant Lake South
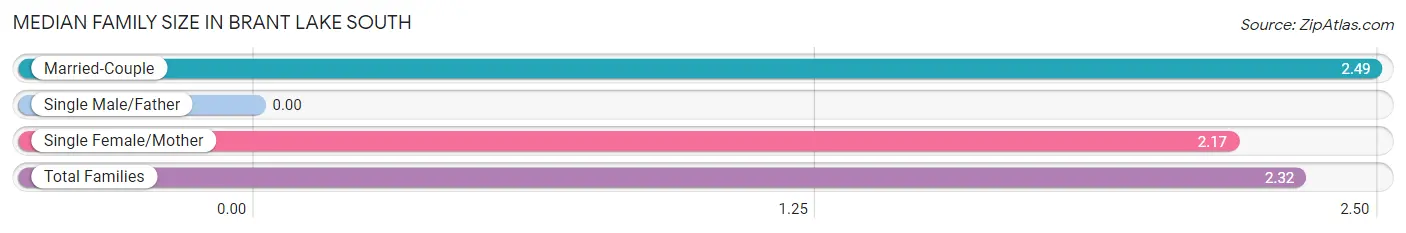
Median Family Size in Brant Lake South
| Family Type | # Families | Family Size |
| Married-Couple | 43 (47.8%) | 2.49 |
| Single Male/Father | 0 (0.0%) | - |
| Single Female/Mother | 47 (52.2%) | 2.17 |
| Total Families | 90 (100.0%) | 2.32 |
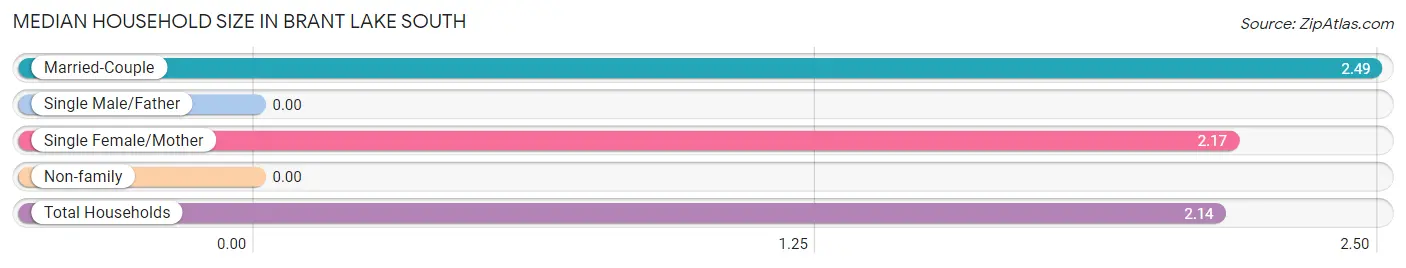
Median Household Size in Brant Lake South
| Household Type | # Households | Household Size |
| Married-Couple | 43 (41.3%) | 2.49 |
| Single Male/Father | 0 (0.0%) | - |
| Single Female/Mother | 47 (45.2%) | 2.17 |
| Non-family | 14 (13.5%) | - |
| Total Households | 104 (100.0%) | 2.14 |
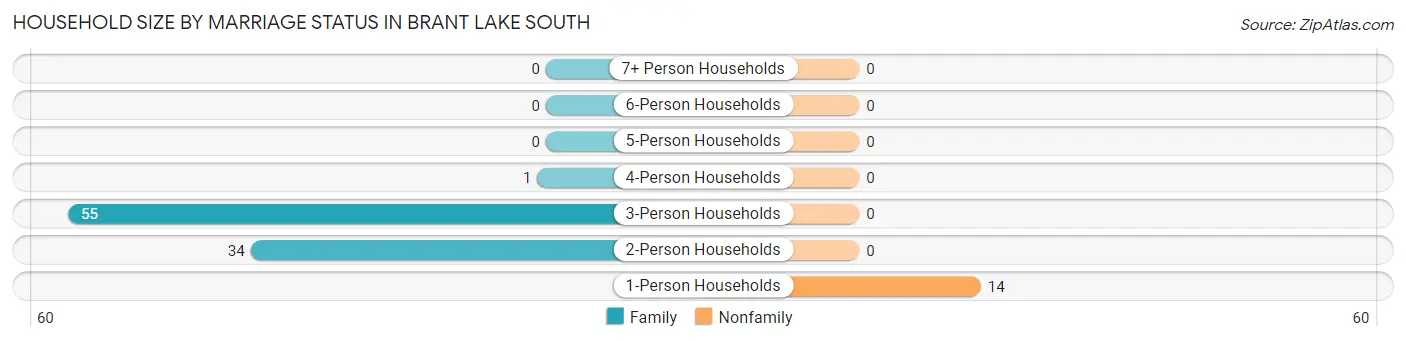
Household Size by Marriage Status in Brant Lake South
Out of a total of 104 households in Brant Lake South, 90 (86.5%) are family households, while 14 (13.5%) are nonfamily households. The most numerous type of family households are 3-person households, comprising 55, and the most common type of nonfamily households are 1-person households, comprising 14.
| Household Size | Family Households | Nonfamily Households |
| 1-Person Households | - | 14 (13.5%) |
| 2-Person Households | 34 (32.7%) | 0 (0.0%) |
| 3-Person Households | 55 (52.9%) | 0 (0.0%) |
| 4-Person Households | 1 (1.0%) | 0 (0.0%) |
| 5-Person Households | 0 (0.0%) | 0 (0.0%) |
| 6-Person Households | 0 (0.0%) | 0 (0.0%) |
| 7+ Person Households | 0 (0.0%) | 0 (0.0%) |
| Total | 90 (86.5%) | 14 (13.5%) |
Female Fertility in Brant Lake South
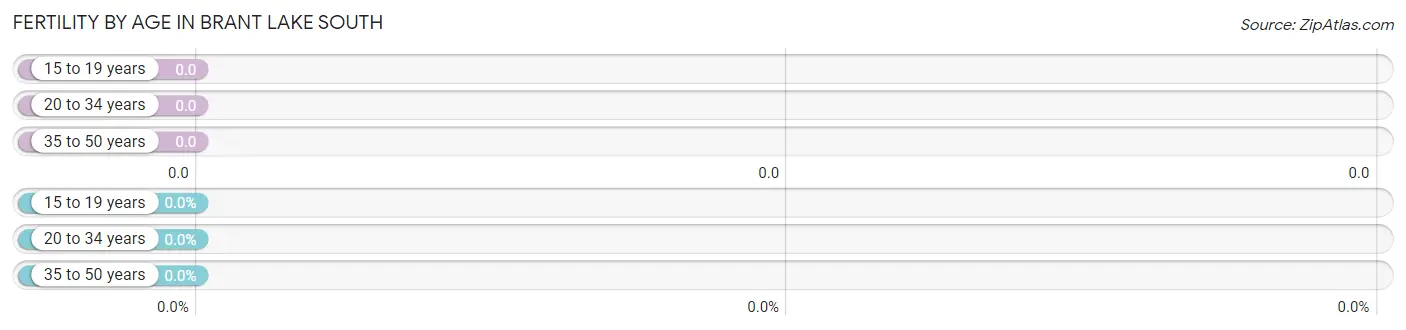
Fertility by Age in Brant Lake South
| Age Bracket | Women with Births | Births / 1,000 Women |
| 15 to 19 years | 0 (0.0%) | 0.0 |
| 20 to 34 years | 0 (0.0%) | 0.0 |
| 35 to 50 years | 0 (0.0%) | 0.0 |
| Total | 0 (0.0%) | 0.0 |
Fertility by Age by Marriage Status in Brant Lake South
| Age Bracket | Married | Unmarried |
| 15 to 19 years | 0 (0.0%) | 0 (0.0%) |
| 20 to 34 years | 0 (0.0%) | 0 (0.0%) |
| 35 to 50 years | 0 (0.0%) | 0 (0.0%) |
| Total | 0 (0.0%) | 0 (0.0%) |
Fertility by Education in Brant Lake South
| Educational Attainment | Women with Births | Births / 1,000 Women |
| Less than High School | 0 (0.0%) | 0.0 |
| High School Diploma | 0 (0.0%) | 0.0 |
| College or Associate's Degree | 0 (0.0%) | 0.0 |
| Bachelor's Degree | 0 (0.0%) | 0.0 |
| Graduate Degree | 0 (0.0%) | 0.0 |
| Total | 0 (0.0%) | 0.0 |
Fertility by Education by Marriage Status in Brant Lake South
| Educational Attainment | Married | Unmarried |
| Less than High School | 0 (0.0%) | 0 (0.0%) |
| High School Diploma | 0 (0.0%) | 0 (0.0%) |
| College or Associate's Degree | 0 (0.0%) | 0 (0.0%) |
| Bachelor's Degree | 0 (0.0%) | 0 (0.0%) |
| Graduate Degree | 0 (0.0%) | 0 (0.0%) |
| Total | 0 (0.0%) | 0 (0.0%) |
Employment Characteristics in Brant Lake South
Employment by Class of Employer in Brant Lake South
Among the 154 employed individuals in Brant Lake South, private company employees (138 | 89.6%), local government employees (6 | 3.9%), and self-employed (incorporated) (4 | 2.6%) make up the most common classes of employment.
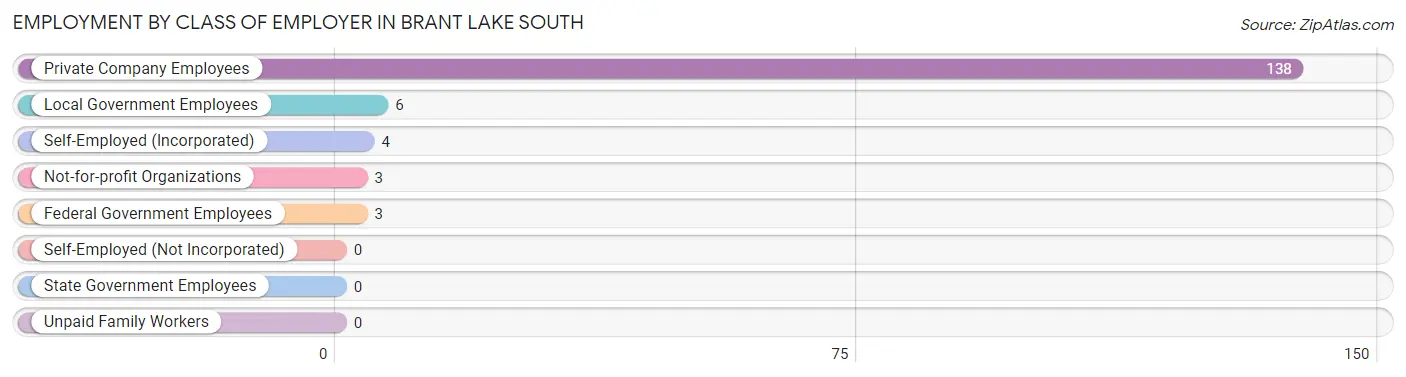
| Employer Class | # Employees | % Employees |
| Private Company Employees | 138 | 89.6% |
| Self-Employed (Incorporated) | 4 | 2.6% |
| Self-Employed (Not Incorporated) | 0 | 0.0% |
| Not-for-profit Organizations | 3 | 1.9% |
| Local Government Employees | 6 | 3.9% |
| State Government Employees | 0 | 0.0% |
| Federal Government Employees | 3 | 1.9% |
| Unpaid Family Workers | 0 | 0.0% |
| Total | 154 | 100.0% |
Employment Status by Age in Brant Lake South
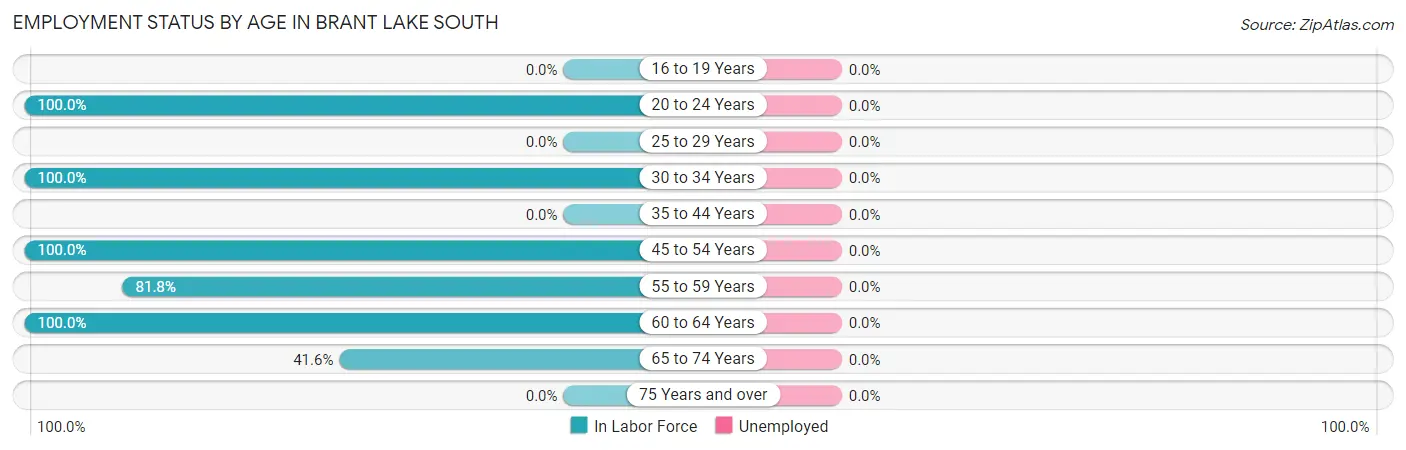
| Age Bracket | In Labor Force | Unemployed |
| 16 to 19 Years | 0 (0.0%) | 0 (0.0%) |
| 20 to 24 Years | 33 (100.0%) | 0 (0.0%) |
| 25 to 29 Years | 0 (0.0%) | 0 (0.0%) |
| 30 to 34 Years | 2 (100.0%) | 0 (0.0%) |
| 35 to 44 Years | 0 (0.0%) | 0 (0.0%) |
| 45 to 54 Years | 68 (100.0%) | 0 (0.0%) |
| 55 to 59 Years | 9 (81.8%) | 0 (0.0%) |
| 60 to 64 Years | 9 (100.0%) | 0 (0.0%) |
| 65 to 74 Years | 37 (41.6%) | 0 (0.0%) |
| 75 Years and over | 0 (0.0%) | 0 (0.0%) |
| Total | 158 (72.8%) | 0 (0.0%) |
Employment Status by Educational Attainment in Brant Lake South
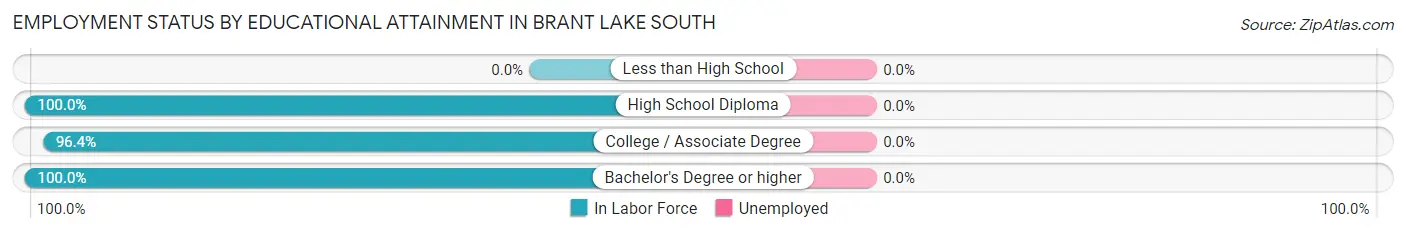
| Educational Attainment | In Labor Force | Unemployed |
| Less than High School | 0 (0.0%) | 0 (0.0%) |
| High School Diploma | 14 (100.0%) | 0 (0.0%) |
| College / Associate Degree | 53 (96.4%) | 0 (0.0%) |
| Bachelor's Degree or higher | 21 (100.0%) | 0 (0.0%) |
| Total | 88 (97.8%) | 0 (0.0%) |
Employment Occupations by Sex in Brant Lake South
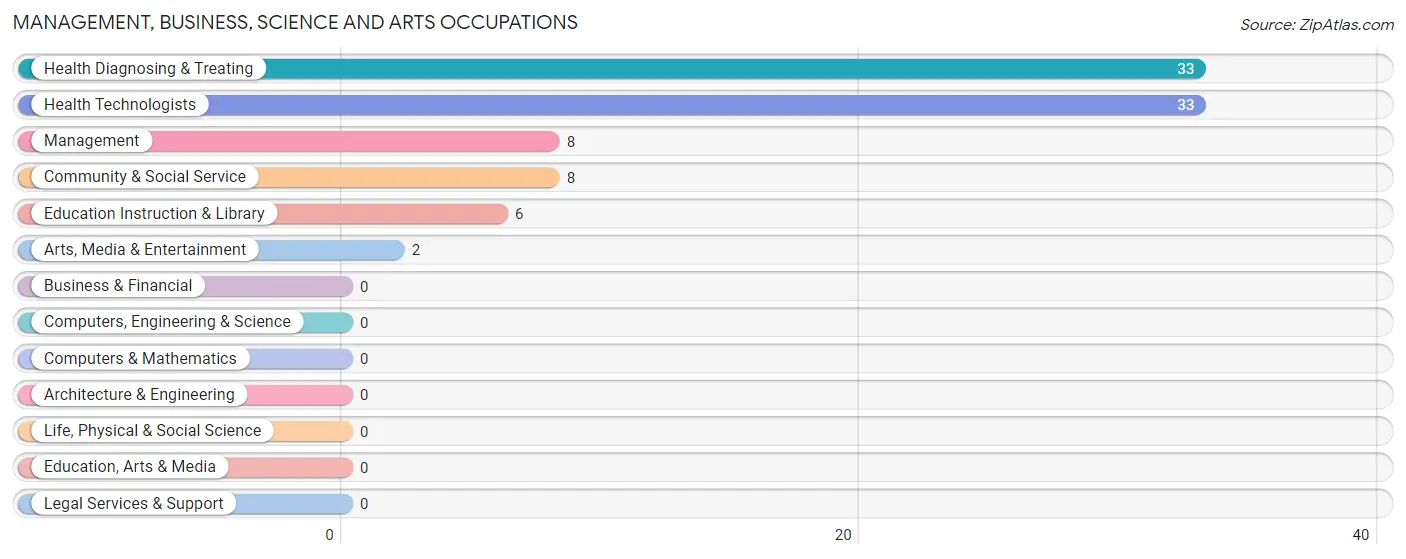
Management, Business, Science and Arts Occupations
The most common Management, Business, Science and Arts occupations in Brant Lake South are Health Diagnosing & Treating (33 | 20.9%), Health Technologists (33 | 20.9%), Management (8 | 5.1%), Community & Social Service (8 | 5.1%), and Education Instruction & Library (6 | 3.8%).
Management, Business, Science and Arts Occupations by Sex
Within the Management, Business, Science and Arts occupations in Brant Lake South, the most male-oriented occupations are Arts, Media & Entertainment (100.0%), Management (37.5%), and Community & Social Service (25.0%), while the most female-oriented occupations are Education Instruction & Library (100.0%), Health Diagnosing & Treating (100.0%), and Health Technologists (100.0%).
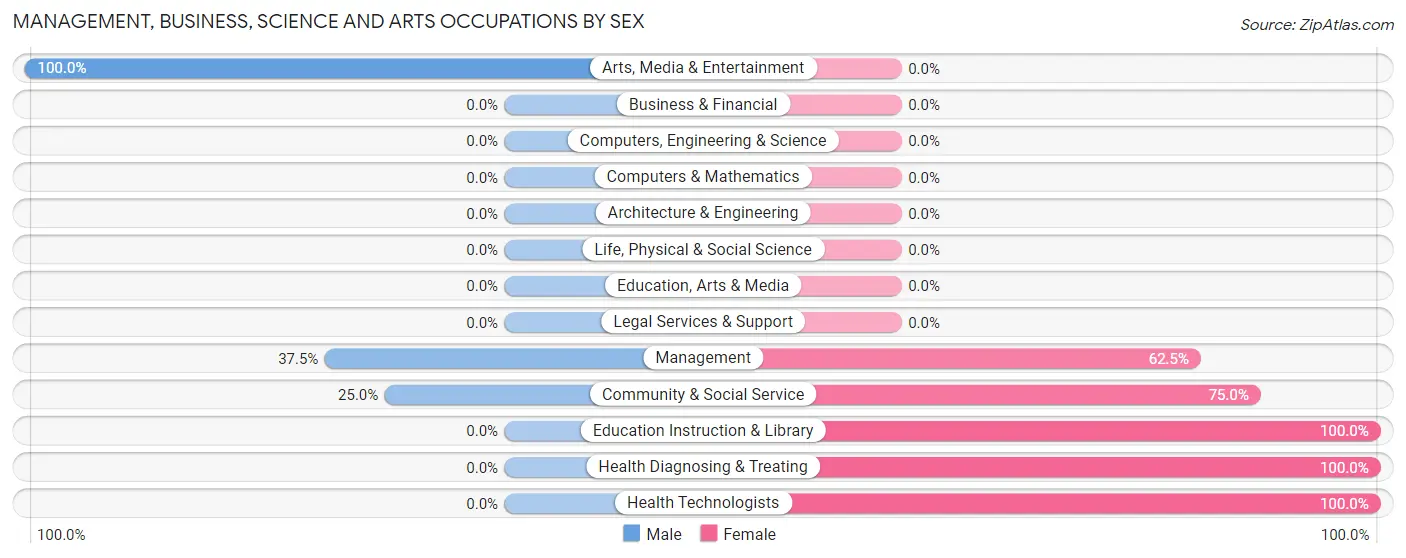
| Occupation | Male | Female |
| Management | 3 (37.5%) | 5 (62.5%) |
| Business & Financial | 0 (0.0%) | 0 (0.0%) |
| Computers, Engineering & Science | 0 (0.0%) | 0 (0.0%) |
| Computers & Mathematics | 0 (0.0%) | 0 (0.0%) |
| Architecture & Engineering | 0 (0.0%) | 0 (0.0%) |
| Life, Physical & Social Science | 0 (0.0%) | 0 (0.0%) |
| Community & Social Service | 2 (25.0%) | 6 (75.0%) |
| Education, Arts & Media | 0 (0.0%) | 0 (0.0%) |
| Legal Services & Support | 0 (0.0%) | 0 (0.0%) |
| Education Instruction & Library | 0 (0.0%) | 6 (100.0%) |
| Arts, Media & Entertainment | 2 (100.0%) | 0 (0.0%) |
| Health Diagnosing & Treating | 0 (0.0%) | 33 (100.0%) |
| Health Technologists | 0 (0.0%) | 33 (100.0%) |
| Total (Category) | 5 (10.2%) | 44 (89.8%) |
| Total (Overall) | 60 (38.0%) | 98 (62.0%) |
Services Occupations
Services Occupations by Sex
| Occupation | Male | Female |
| Healthcare Support | 0 (0.0%) | 0 (0.0%) |
| Security & Protection | 0 (0.0%) | 0 (0.0%) |
| Firefighting & Prevention | 0 (0.0%) | 0 (0.0%) |
| Law Enforcement | 0 (0.0%) | 0 (0.0%) |
| Food Preparation & Serving | 0 (0.0%) | 0 (0.0%) |
| Cleaning & Maintenance | 0 (0.0%) | 0 (0.0%) |
| Personal Care & Service | 0 (0.0%) | 0 (0.0%) |
| Total (Category) | 0 (0.0%) | 0 (0.0%) |
| Total (Overall) | 60 (38.0%) | 98 (62.0%) |
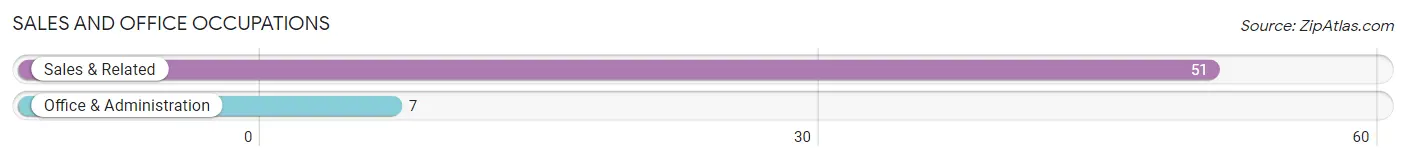
Sales and Office Occupations
The most common Sales and Office occupations in Brant Lake South are Sales & Related (51 | 32.3%), and Office & Administration (7 | 4.4%).
Sales and Office Occupations by Sex
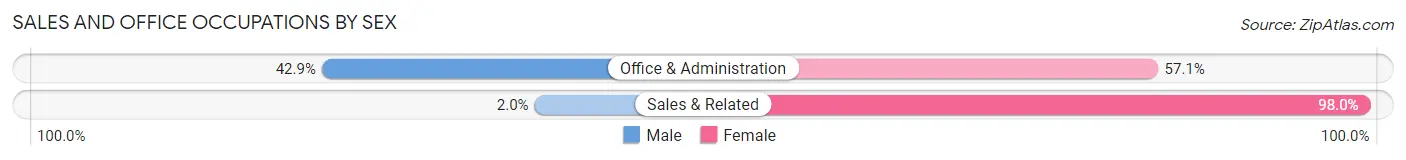
| Occupation | Male | Female |
| Sales & Related | 1 (2.0%) | 50 (98.0%) |
| Office & Administration | 3 (42.9%) | 4 (57.1%) |
| Total (Category) | 4 (6.9%) | 54 (93.1%) |
| Total (Overall) | 60 (38.0%) | 98 (62.0%) |
Natural Resources, Construction and Maintenance Occupations
The most common Natural Resources, Construction and Maintenance occupations in Brant Lake South are , and Installation, Maintenance & Repair (4 | 2.5%).
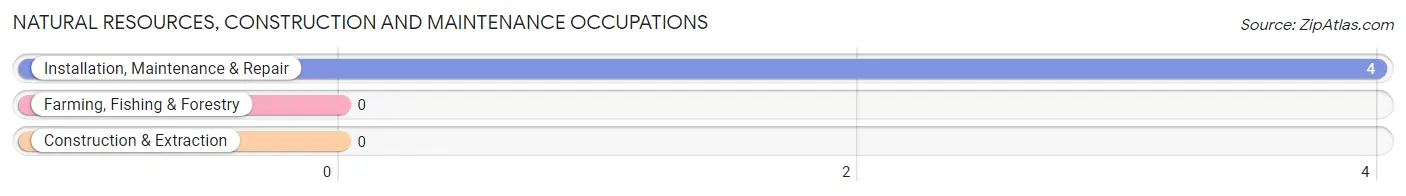
Natural Resources, Construction and Maintenance Occupations by Sex
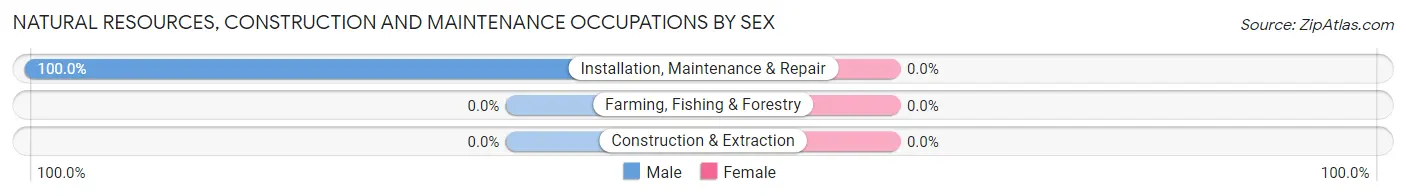
| Occupation | Male | Female |
| Farming, Fishing & Forestry | 0 (0.0%) | 0 (0.0%) |
| Construction & Extraction | 0 (0.0%) | 0 (0.0%) |
| Installation, Maintenance & Repair | 4 (100.0%) | 0 (0.0%) |
| Total (Category) | 4 (100.0%) | 0 (0.0%) |
| Total (Overall) | 60 (38.0%) | 98 (62.0%) |
Production, Transportation and Moving Occupations
The most common Production, Transportation and Moving occupations in Brant Lake South are Production (41 | 26.0%), and Transportation (6 | 3.8%).
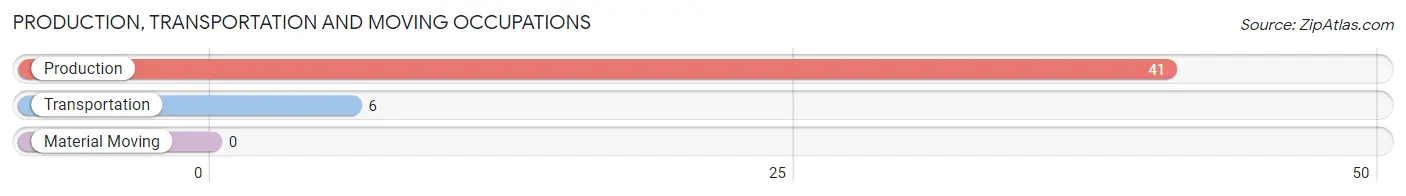
Production, Transportation and Moving Occupations by Sex
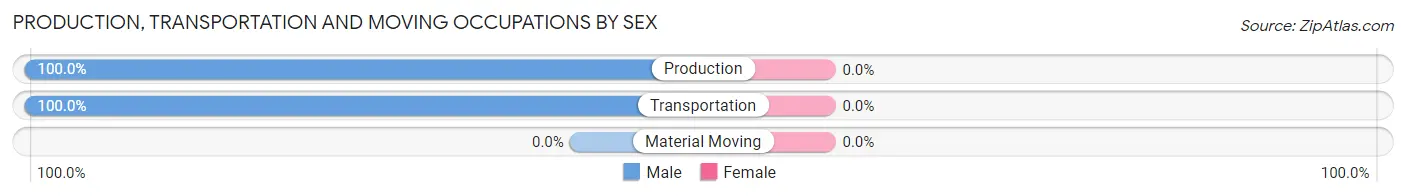
| Occupation | Male | Female |
| Production | 41 (100.0%) | 0 (0.0%) |
| Transportation | 6 (100.0%) | 0 (0.0%) |
| Material Moving | 0 (0.0%) | 0 (0.0%) |
| Total (Category) | 47 (100.0%) | 0 (0.0%) |
| Total (Overall) | 60 (38.0%) | 98 (62.0%) |
Employment Industries by Sex in Brant Lake South
Employment Industries in Brant Lake South
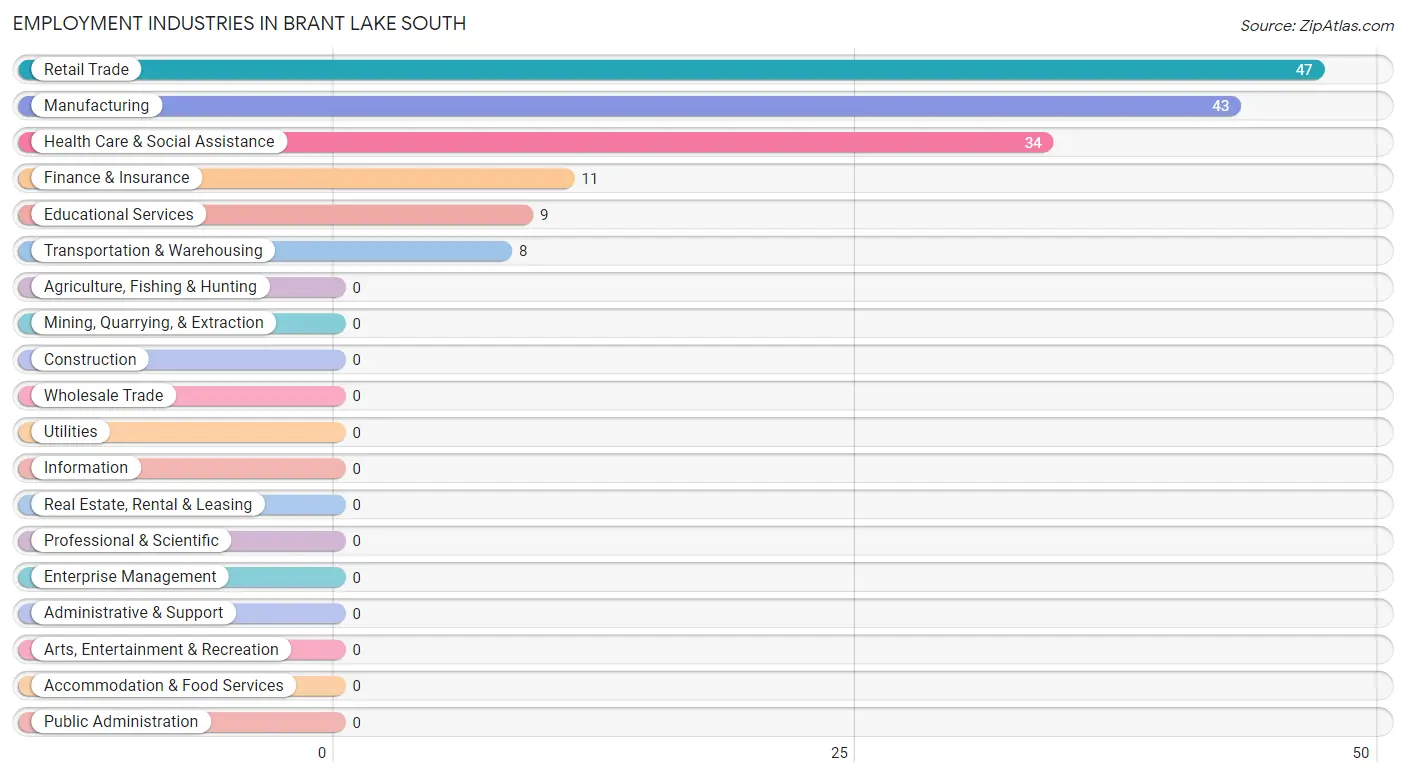
The major employment industries in Brant Lake South include Retail Trade (47 | 29.7%), Manufacturing (43 | 27.2%), Health Care & Social Assistance (34 | 21.5%), Finance & Insurance (11 | 7.0%), and Educational Services (9 | 5.7%).
Employment Industries by Sex in Brant Lake South
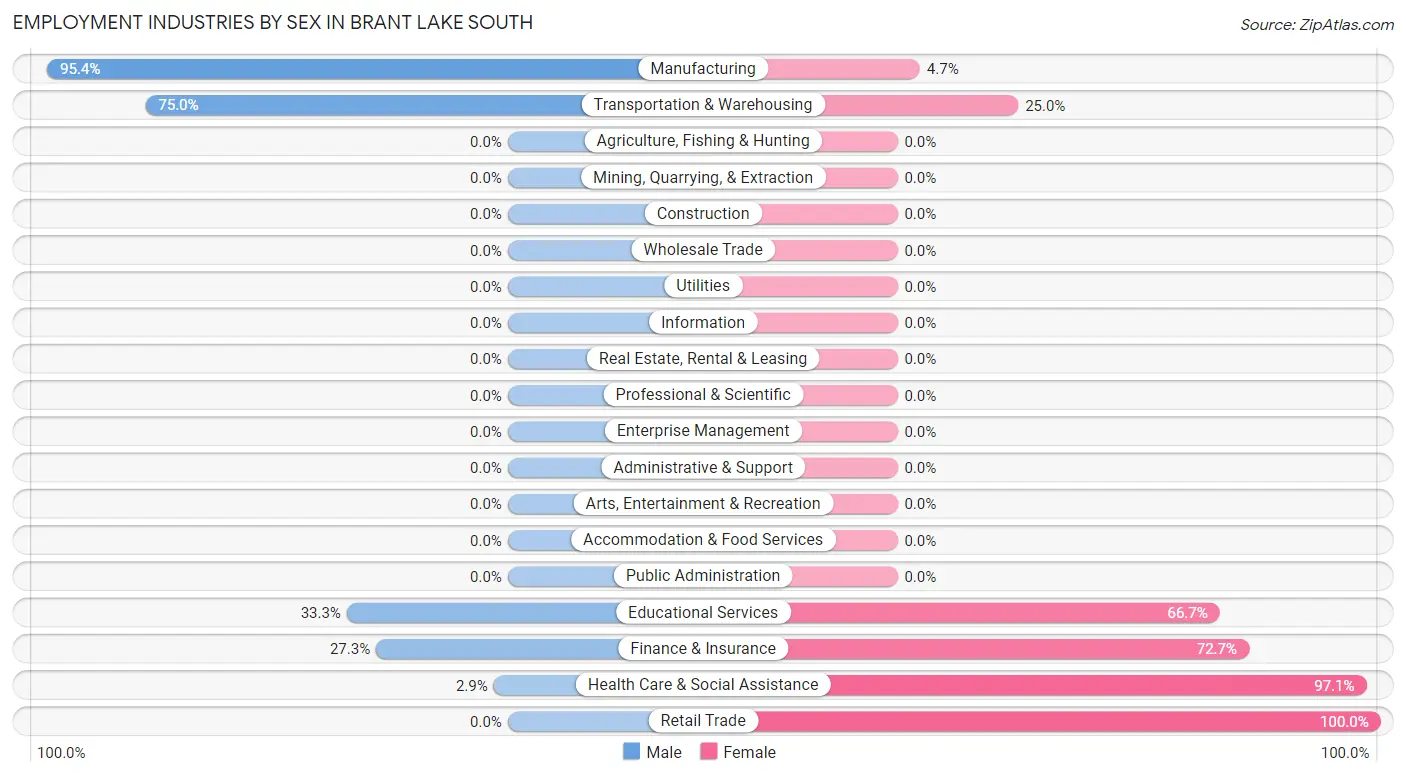
The Brant Lake South industries that see more men than women are Manufacturing (95.4%), Transportation & Warehousing (75.0%), and Educational Services (33.3%), whereas the industries that tend to have a higher number of women are Retail Trade (100.0%), Health Care & Social Assistance (97.1%), and Finance & Insurance (72.7%).
| Industry | Male | Female |
| Agriculture, Fishing & Hunting | 0 (0.0%) | 0 (0.0%) |
| Mining, Quarrying, & Extraction | 0 (0.0%) | 0 (0.0%) |
| Construction | 0 (0.0%) | 0 (0.0%) |
| Manufacturing | 41 (95.4%) | 2 (4.6%) |
| Wholesale Trade | 0 (0.0%) | 0 (0.0%) |
| Retail Trade | 0 (0.0%) | 47 (100.0%) |
| Transportation & Warehousing | 6 (75.0%) | 2 (25.0%) |
| Utilities | 0 (0.0%) | 0 (0.0%) |
| Information | 0 (0.0%) | 0 (0.0%) |
| Finance & Insurance | 3 (27.3%) | 8 (72.7%) |
| Real Estate, Rental & Leasing | 0 (0.0%) | 0 (0.0%) |
| Professional & Scientific | 0 (0.0%) | 0 (0.0%) |
| Enterprise Management | 0 (0.0%) | 0 (0.0%) |
| Administrative & Support | 0 (0.0%) | 0 (0.0%) |
| Educational Services | 3 (33.3%) | 6 (66.7%) |
| Health Care & Social Assistance | 1 (2.9%) | 33 (97.1%) |
| Arts, Entertainment & Recreation | 0 (0.0%) | 0 (0.0%) |
| Accommodation & Food Services | 0 (0.0%) | 0 (0.0%) |
| Public Administration | 0 (0.0%) | 0 (0.0%) |
| Total | 60 (38.0%) | 98 (62.0%) |
Education in Brant Lake South
School Enrollment in Brant Lake South
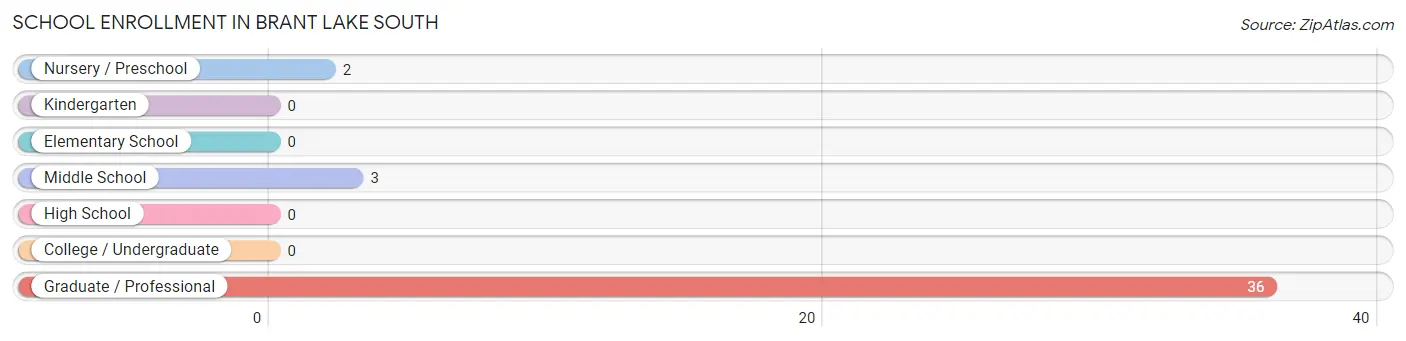
The most common levels of schooling among the 41 students in Brant Lake South are graduate / professional (36 | 87.8%), middle school (3 | 7.3%), and nursery / preschool (2 | 4.9%).
| School Level | # Students | % Students |
| Nursery / Preschool | 2 | 4.9% |
| Kindergarten | 0 | 0.0% |
| Elementary School | 0 | 0.0% |
| Middle School | 3 | 7.3% |
| High School | 0 | 0.0% |
| College / Undergraduate | 0 | 0.0% |
| Graduate / Professional | 36 | 87.8% |
| Total | 41 | 100.0% |
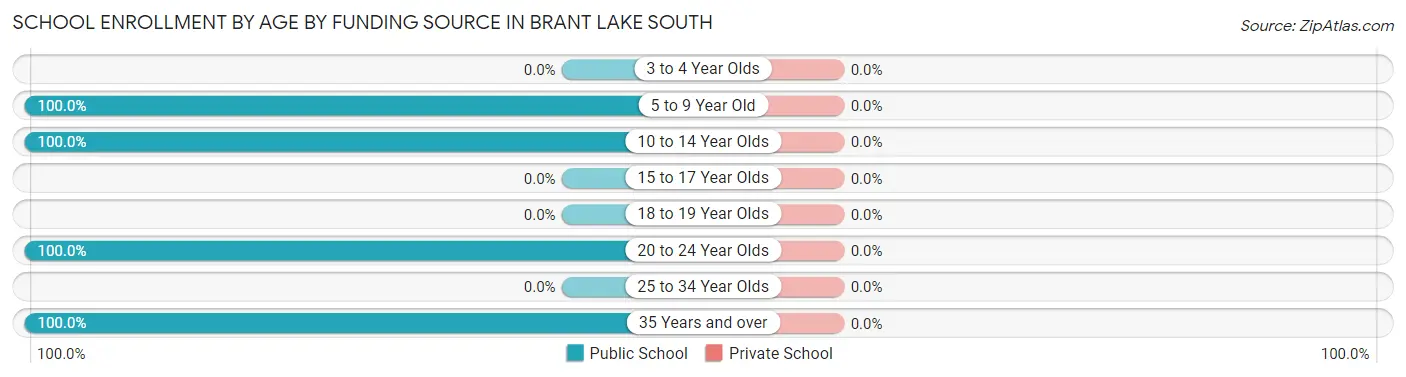
School Enrollment by Age by Funding Source in Brant Lake South
| Age Bracket | Public School | Private School |
| 3 to 4 Year Olds | 0 (0.0%) | 0 (0.0%) |
| 5 to 9 Year Old | 2 (100.0%) | 0 (0.0%) |
| 10 to 14 Year Olds | 3 (100.0%) | 0 (0.0%) |
| 15 to 17 Year Olds | 0 (0.0%) | 0 (0.0%) |
| 18 to 19 Year Olds | 0 (0.0%) | 0 (0.0%) |
| 20 to 24 Year Olds | 33 (100.0%) | 0 (0.0%) |
| 25 to 34 Year Olds | 0 (0.0%) | 0 (0.0%) |
| 35 Years and over | 3 (100.0%) | 0 (0.0%) |
| Total | 41 (100.0%) | 0 (0.0%) |
Educational Attainment by Field of Study in Brant Lake South
Science & technology (6 | 28.6%), business (6 | 28.6%), bio, nature & agricultural (3 | 14.3%), education (3 | 14.3%), and arts & humanities (3 | 14.3%) are the most common fields of study among 21 individuals in Brant Lake South who have obtained a bachelor's degree or higher.
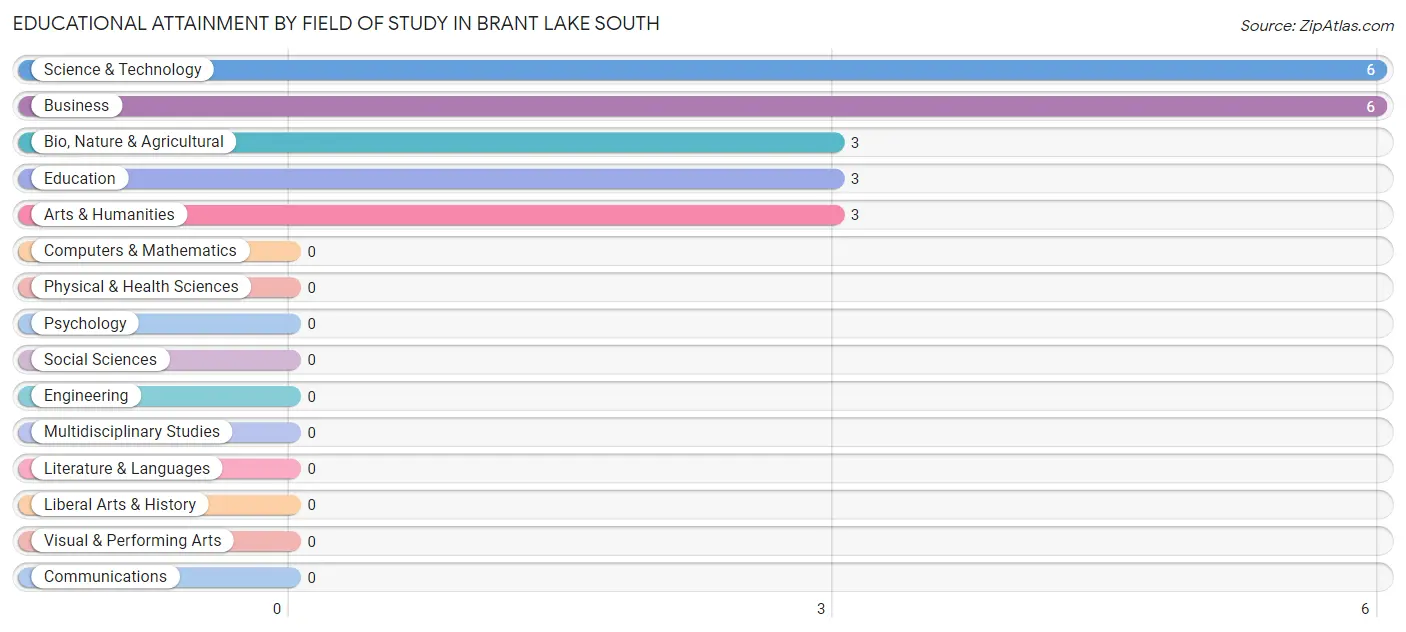
| Field of Study | # Graduates | % Graduates |
| Computers & Mathematics | 0 | 0.0% |
| Bio, Nature & Agricultural | 3 | 14.3% |
| Physical & Health Sciences | 0 | 0.0% |
| Psychology | 0 | 0.0% |
| Social Sciences | 0 | 0.0% |
| Engineering | 0 | 0.0% |
| Multidisciplinary Studies | 0 | 0.0% |
| Science & Technology | 6 | 28.6% |
| Business | 6 | 28.6% |
| Education | 3 | 14.3% |
| Literature & Languages | 0 | 0.0% |
| Liberal Arts & History | 0 | 0.0% |
| Visual & Performing Arts | 0 | 0.0% |
| Communications | 0 | 0.0% |
| Arts & Humanities | 3 | 14.3% |
| Total | 21 | 100.0% |
Transportation & Commute in Brant Lake South
Vehicle Availability by Sex in Brant Lake South
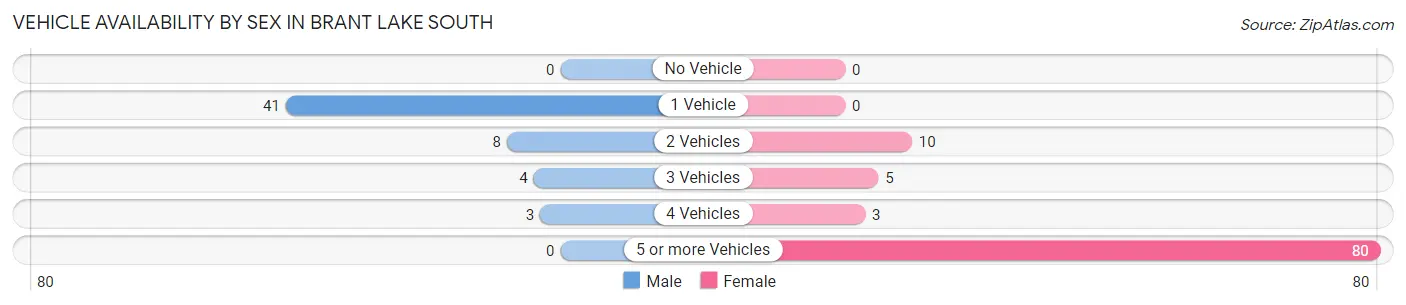
The most prevalent vehicle ownership categories in Brant Lake South are males with 1 vehicle (41, accounting for 73.2%) and females with 1 vehicle (0, making up 41.8%).
| Vehicles Available | Male | Female |
| No Vehicle | 0 (0.0%) | 0 (0.0%) |
| 1 Vehicle | 41 (73.2%) | 0 (0.0%) |
| 2 Vehicles | 8 (14.3%) | 10 (10.2%) |
| 3 Vehicles | 4 (7.1%) | 5 (5.1%) |
| 4 Vehicles | 3 (5.4%) | 3 (3.1%) |
| 5 or more Vehicles | 0 (0.0%) | 80 (81.6%) |
| Total | 56 (100.0%) | 98 (100.0%) |
Commute Time in Brant Lake South
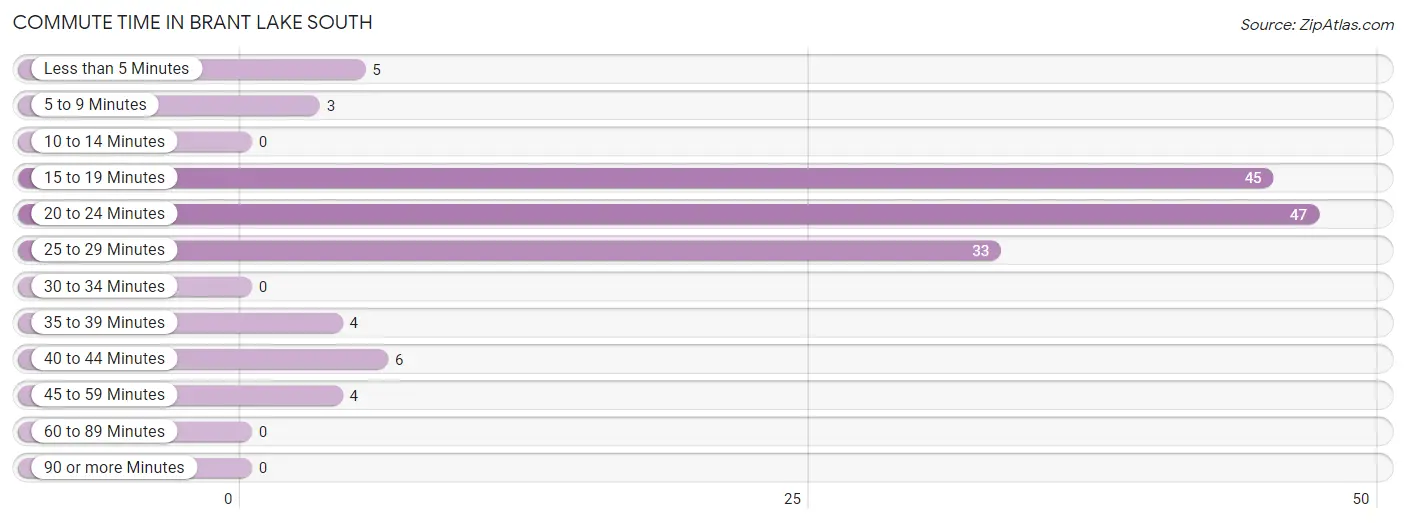
The most frequently occuring commute durations in Brant Lake South are 20 to 24 minutes (47 commuters, 32.0%), 15 to 19 minutes (45 commuters, 30.6%), and 25 to 29 minutes (33 commuters, 22.5%).
| Commute Time | # Commuters | % Commuters |
| Less than 5 Minutes | 5 | 3.4% |
| 5 to 9 Minutes | 3 | 2.0% |
| 10 to 14 Minutes | 0 | 0.0% |
| 15 to 19 Minutes | 45 | 30.6% |
| 20 to 24 Minutes | 47 | 32.0% |
| 25 to 29 Minutes | 33 | 22.5% |
| 30 to 34 Minutes | 0 | 0.0% |
| 35 to 39 Minutes | 4 | 2.7% |
| 40 to 44 Minutes | 6 | 4.1% |
| 45 to 59 Minutes | 4 | 2.7% |
| 60 to 89 Minutes | 0 | 0.0% |
| 90 or more Minutes | 0 | 0.0% |
Commute Time by Sex in Brant Lake South
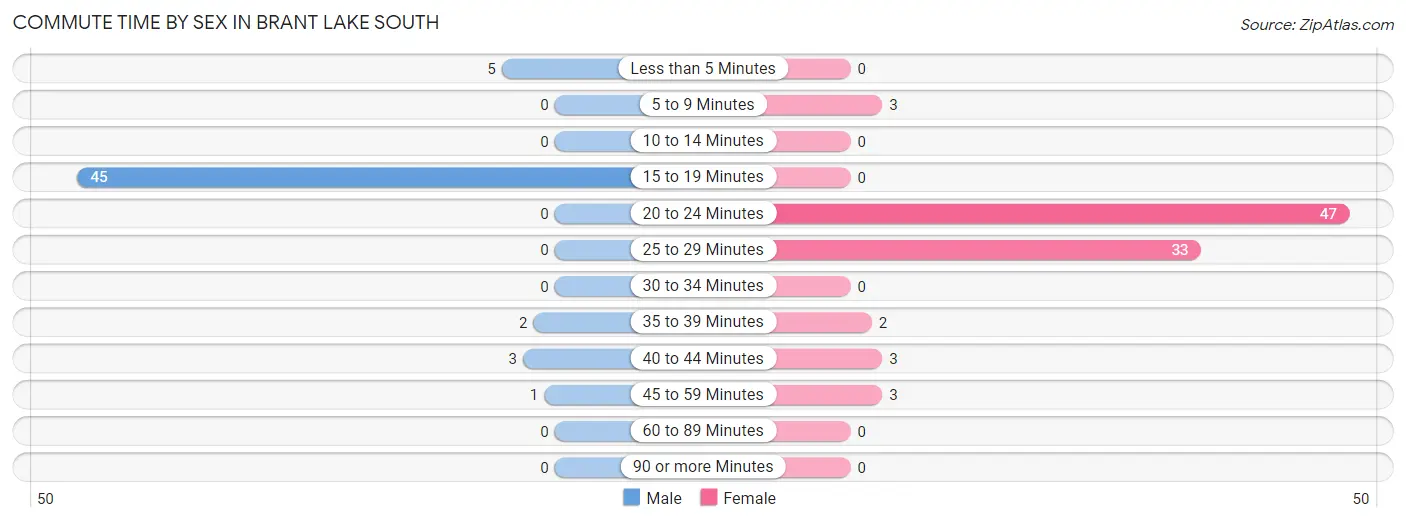
The most common commute times in Brant Lake South are 15 to 19 minutes (45 commuters, 80.4%) for males and 20 to 24 minutes (47 commuters, 51.6%) for females.
| Commute Time | Male | Female |
| Less than 5 Minutes | 5 (8.9%) | 0 (0.0%) |
| 5 to 9 Minutes | 0 (0.0%) | 3 (3.3%) |
| 10 to 14 Minutes | 0 (0.0%) | 0 (0.0%) |
| 15 to 19 Minutes | 45 (80.4%) | 0 (0.0%) |
| 20 to 24 Minutes | 0 (0.0%) | 47 (51.6%) |
| 25 to 29 Minutes | 0 (0.0%) | 33 (36.3%) |
| 30 to 34 Minutes | 0 (0.0%) | 0 (0.0%) |
| 35 to 39 Minutes | 2 (3.6%) | 2 (2.2%) |
| 40 to 44 Minutes | 3 (5.4%) | 3 (3.3%) |
| 45 to 59 Minutes | 1 (1.8%) | 3 (3.3%) |
| 60 to 89 Minutes | 0 (0.0%) | 0 (0.0%) |
| 90 or more Minutes | 0 (0.0%) | 0 (0.0%) |
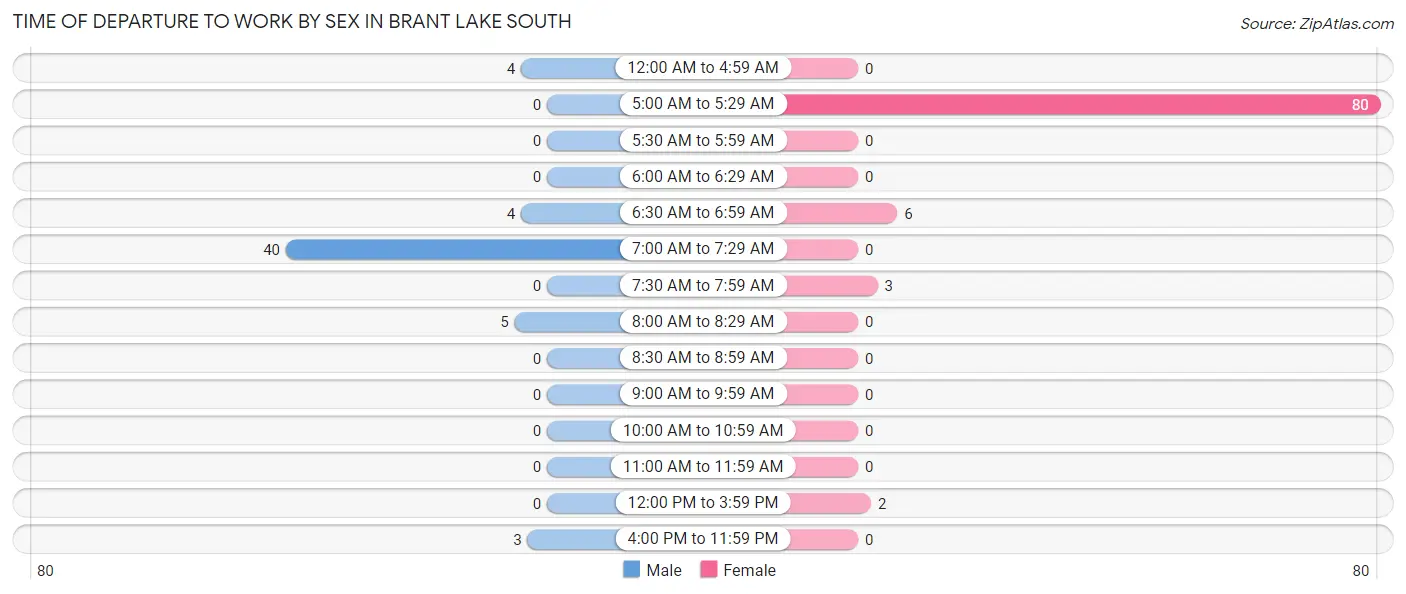
Time of Departure to Work by Sex in Brant Lake South
The most frequent times of departure to work in Brant Lake South are 7:00 AM to 7:29 AM (40, 71.4%) for males and 5:00 AM to 5:29 AM (80, 87.9%) for females.
| Time of Departure | Male | Female |
| 12:00 AM to 4:59 AM | 4 (7.1%) | 0 (0.0%) |
| 5:00 AM to 5:29 AM | 0 (0.0%) | 80 (87.9%) |
| 5:30 AM to 5:59 AM | 0 (0.0%) | 0 (0.0%) |
| 6:00 AM to 6:29 AM | 0 (0.0%) | 0 (0.0%) |
| 6:30 AM to 6:59 AM | 4 (7.1%) | 6 (6.6%) |
| 7:00 AM to 7:29 AM | 40 (71.4%) | 0 (0.0%) |
| 7:30 AM to 7:59 AM | 0 (0.0%) | 3 (3.3%) |
| 8:00 AM to 8:29 AM | 5 (8.9%) | 0 (0.0%) |
| 8:30 AM to 8:59 AM | 0 (0.0%) | 0 (0.0%) |
| 9:00 AM to 9:59 AM | 0 (0.0%) | 0 (0.0%) |
| 10:00 AM to 10:59 AM | 0 (0.0%) | 0 (0.0%) |
| 11:00 AM to 11:59 AM | 0 (0.0%) | 0 (0.0%) |
| 12:00 PM to 3:59 PM | 0 (0.0%) | 2 (2.2%) |
| 4:00 PM to 11:59 PM | 3 (5.4%) | 0 (0.0%) |
| Total | 56 (100.0%) | 91 (100.0%) |
Housing Occupancy in Brant Lake South
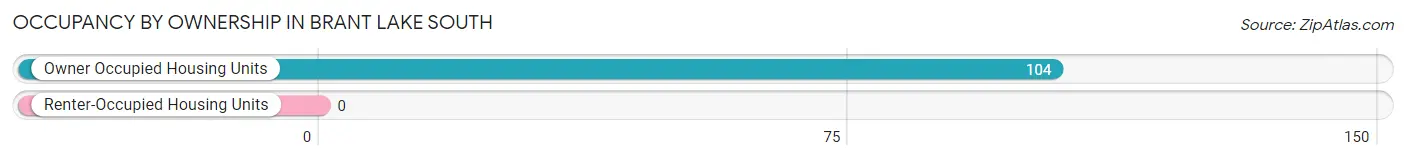
Occupancy by Ownership in Brant Lake South
Of the total 104 dwellings in Brant Lake South, owner-occupied units account for 104 (100.0%), while renter-occupied units make up 0 (0.0%).
| Occupancy | # Housing Units | % Housing Units |
| Owner Occupied Housing Units | 104 | 100.0% |
| Renter-Occupied Housing Units | 0 | 0.0% |
| Total Occupied Housing Units | 104 | 100.0% |
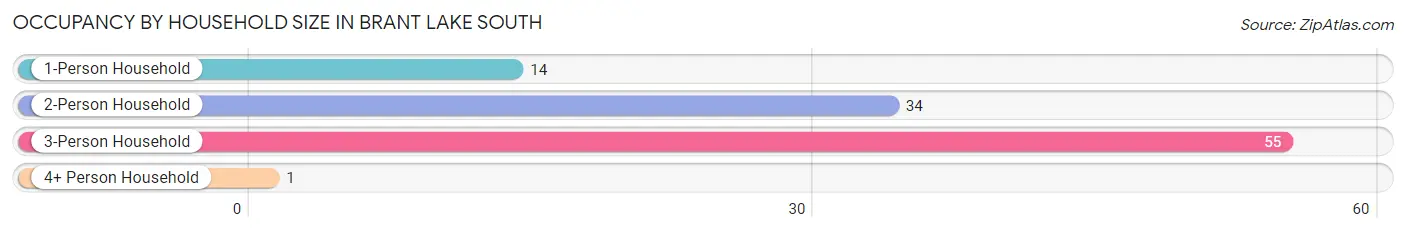
Occupancy by Household Size in Brant Lake South
| Household Size | # Housing Units | % Housing Units |
| 1-Person Household | 14 | 13.5% |
| 2-Person Household | 34 | 32.7% |
| 3-Person Household | 55 | 52.9% |
| 4+ Person Household | 1 | 1.0% |
| Total Housing Units | 104 | 100.0% |
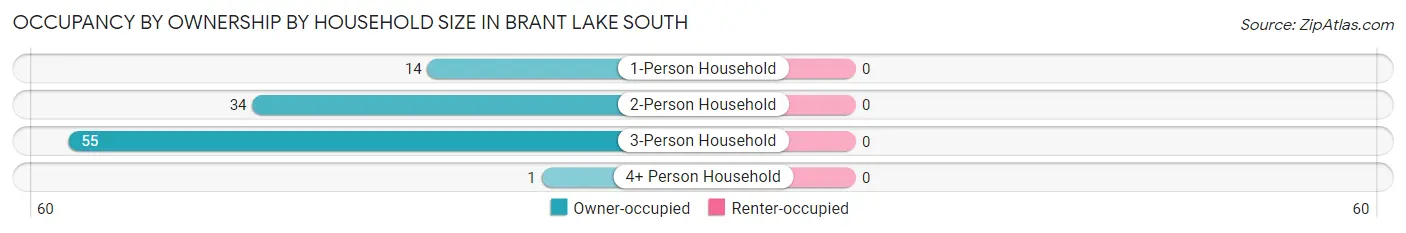
Occupancy by Ownership by Household Size in Brant Lake South
| Household Size | Owner-occupied | Renter-occupied |
| 1-Person Household | 14 (100.0%) | 0 (0.0%) |
| 2-Person Household | 34 (100.0%) | 0 (0.0%) |
| 3-Person Household | 55 (100.0%) | 0 (0.0%) |
| 4+ Person Household | 1 (100.0%) | 0 (0.0%) |
| Total Housing Units | 104 (100.0%) | 0 (0.0%) |
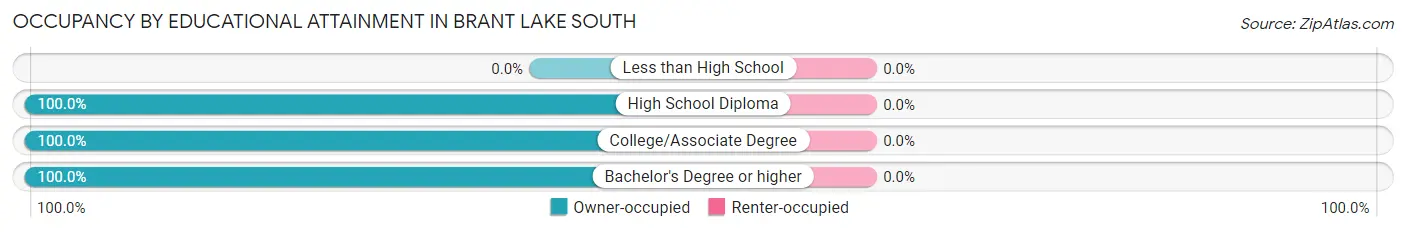
Occupancy by Educational Attainment in Brant Lake South
| Household Size | Owner-occupied | Renter-occupied |
| Less than High School | 0 (0.0%) | 0 (0.0%) |
| High School Diploma | 13 (100.0%) | 0 (0.0%) |
| College/Associate Degree | 79 (100.0%) | 0 (0.0%) |
| Bachelor's Degree or higher | 12 (100.0%) | 0 (0.0%) |
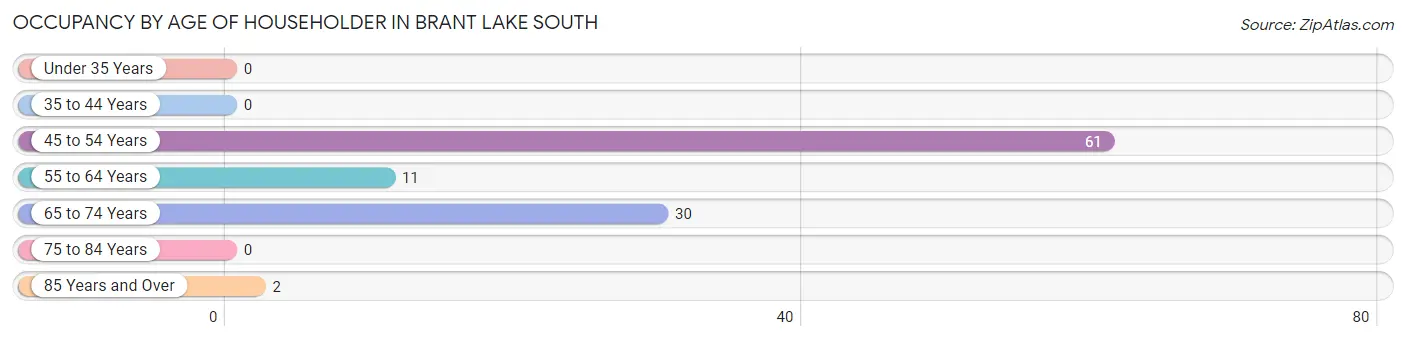
Occupancy by Age of Householder in Brant Lake South
| Age Bracket | # Households | % Households |
| Under 35 Years | 0 | 0.0% |
| 35 to 44 Years | 0 | 0.0% |
| 45 to 54 Years | 61 | 58.7% |
| 55 to 64 Years | 11 | 10.6% |
| 65 to 74 Years | 30 | 28.8% |
| 75 to 84 Years | 0 | 0.0% |
| 85 Years and Over | 2 | 1.9% |
| Total | 104 | 100.0% |
Housing Finances in Brant Lake South
Median Income by Occupancy in Brant Lake South
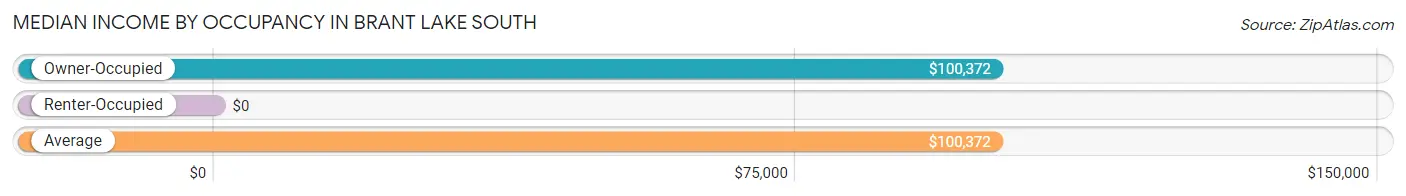
| Occupancy Type | # Households | Median Income |
| Owner-Occupied | 104 (100.0%) | $100,372 |
| Renter-Occupied | 0 (0.0%) | $0 |
| Average | 104 (100.0%) | $100,372 |
Occupancy by Householder Income Bracket in Brant Lake South
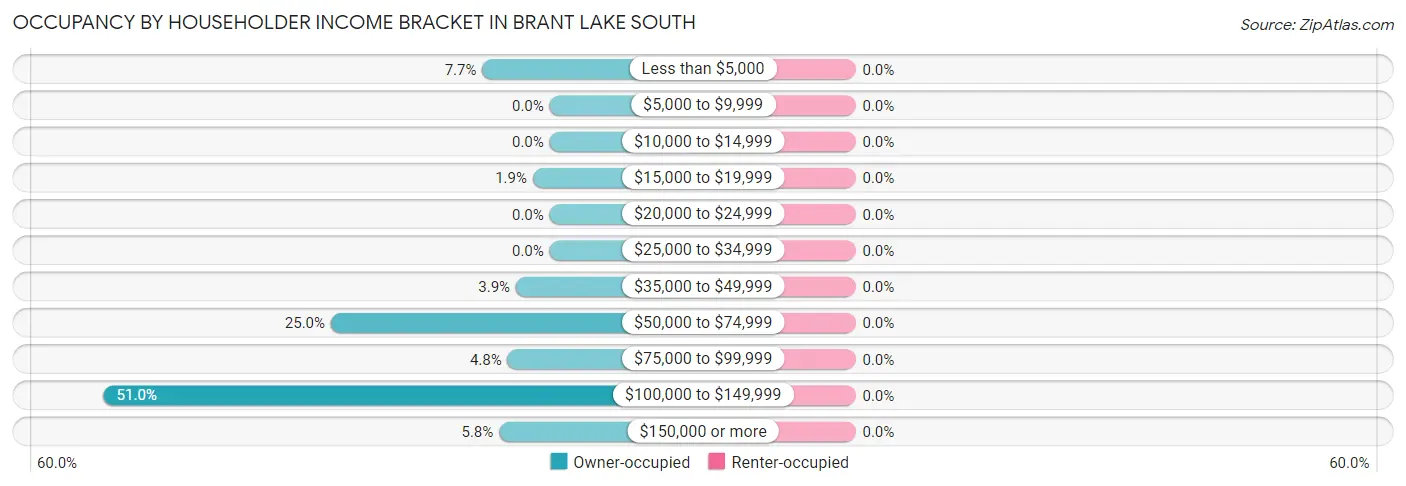
| Income Bracket | Owner-occupied | Renter-occupied |
| Less than $5,000 | 8 (7.7%) | 0 (0.0%) |
| $5,000 to $9,999 | 0 (0.0%) | 0 (0.0%) |
| $10,000 to $14,999 | 0 (0.0%) | 0 (0.0%) |
| $15,000 to $19,999 | 2 (1.9%) | 0 (0.0%) |
| $20,000 to $24,999 | 0 (0.0%) | 0 (0.0%) |
| $25,000 to $34,999 | 0 (0.0%) | 0 (0.0%) |
| $35,000 to $49,999 | 4 (3.8%) | 0 (0.0%) |
| $50,000 to $74,999 | 26 (25.0%) | 0 (0.0%) |
| $75,000 to $99,999 | 5 (4.8%) | 0 (0.0%) |
| $100,000 to $149,999 | 53 (51.0%) | 0 (0.0%) |
| $150,000 or more | 6 (5.8%) | 0 (0.0%) |
| Total | 104 (100.0%) | 0 (0.0%) |
Monthly Housing Cost Tiers in Brant Lake South
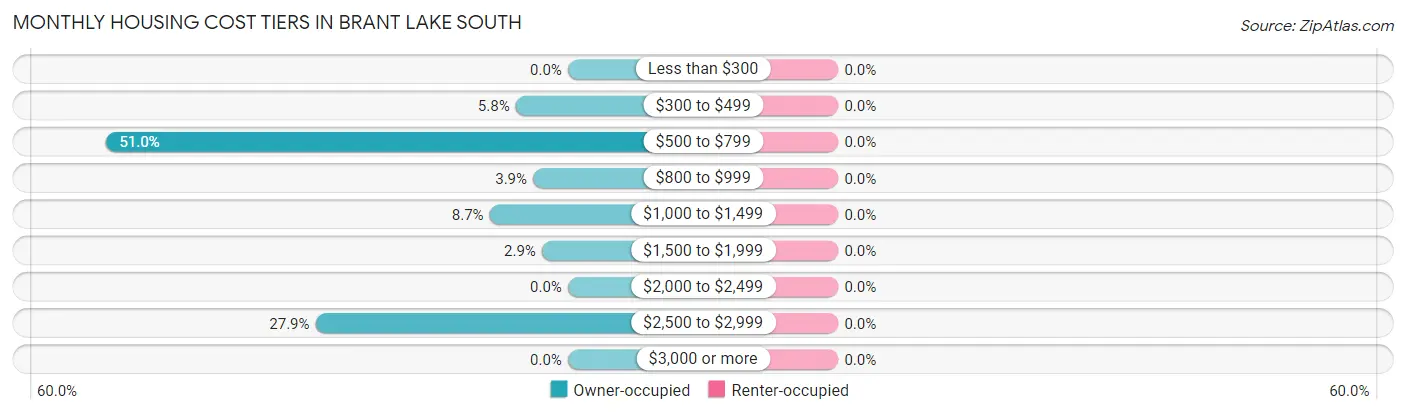
| Monthly Cost | Owner-occupied | Renter-occupied |
| Less than $300 | 0 (0.0%) | 0 (0.0%) |
| $300 to $499 | 6 (5.8%) | 0 (0.0%) |
| $500 to $799 | 53 (51.0%) | 0 (0.0%) |
| $800 to $999 | 4 (3.8%) | 0 (0.0%) |
| $1,000 to $1,499 | 9 (8.6%) | 0 (0.0%) |
| $1,500 to $1,999 | 3 (2.9%) | 0 (0.0%) |
| $2,000 to $2,499 | 0 (0.0%) | 0 (0.0%) |
| $2,500 to $2,999 | 29 (27.9%) | 0 (0.0%) |
| $3,000 or more | 0 (0.0%) | 0 (0.0%) |
| Total | 104 (100.0%) | 0 (0.0%) |
Physical Housing Characteristics in Brant Lake South
Housing Structures in Brant Lake South
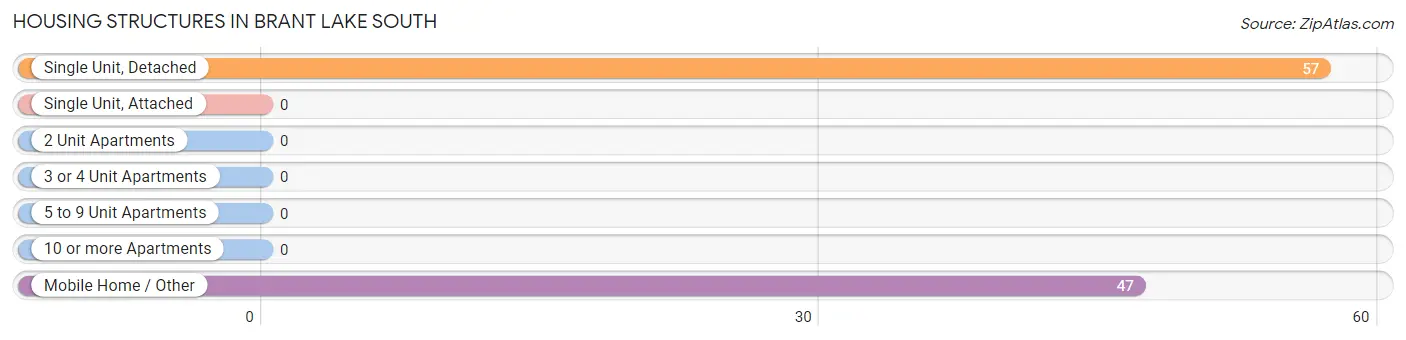
| Structure Type | # Housing Units | % Housing Units |
| Single Unit, Detached | 57 | 54.8% |
| Single Unit, Attached | 0 | 0.0% |
| 2 Unit Apartments | 0 | 0.0% |
| 3 or 4 Unit Apartments | 0 | 0.0% |
| 5 to 9 Unit Apartments | 0 | 0.0% |
| 10 or more Apartments | 0 | 0.0% |
| Mobile Home / Other | 47 | 45.2% |
| Total | 104 | 100.0% |
Housing Structures by Occupancy in Brant Lake South
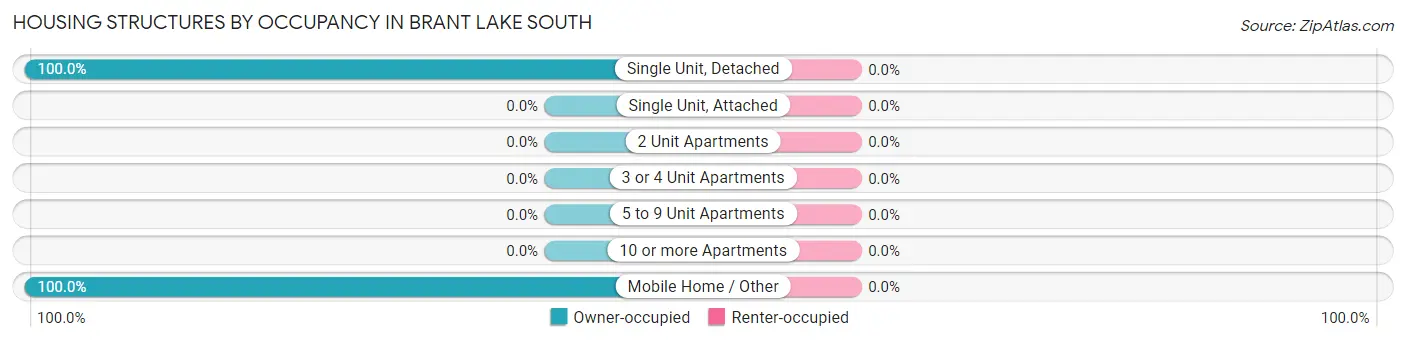
| Structure Type | Owner-occupied | Renter-occupied |
| Single Unit, Detached | 57 (100.0%) | 0 (0.0%) |
| Single Unit, Attached | 0 (0.0%) | 0 (0.0%) |
| 2 Unit Apartments | 0 (0.0%) | 0 (0.0%) |
| 3 or 4 Unit Apartments | 0 (0.0%) | 0 (0.0%) |
| 5 to 9 Unit Apartments | 0 (0.0%) | 0 (0.0%) |
| 10 or more Apartments | 0 (0.0%) | 0 (0.0%) |
| Mobile Home / Other | 47 (100.0%) | 0 (0.0%) |
| Total | 104 (100.0%) | 0 (0.0%) |
Housing Structures by Number of Rooms in Brant Lake South
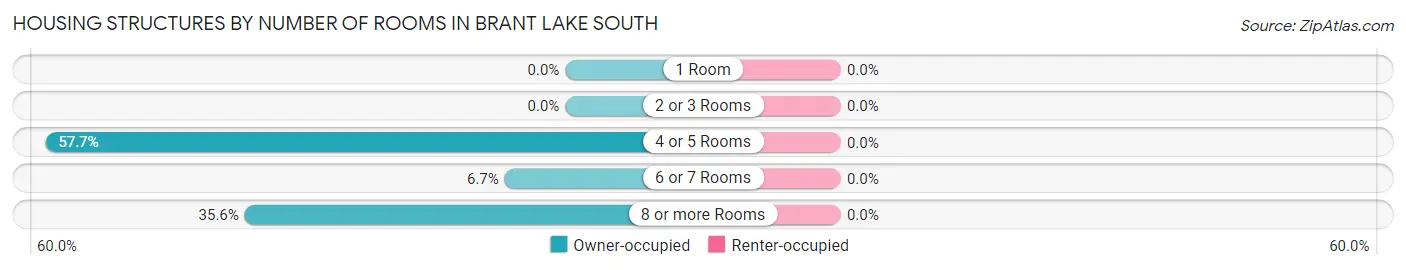
| Number of Rooms | Owner-occupied | Renter-occupied |
| 1 Room | 0 (0.0%) | 0 (0.0%) |
| 2 or 3 Rooms | 0 (0.0%) | 0 (0.0%) |
| 4 or 5 Rooms | 60 (57.7%) | 0 (0.0%) |
| 6 or 7 Rooms | 7 (6.7%) | 0 (0.0%) |
| 8 or more Rooms | 37 (35.6%) | 0 (0.0%) |
| Total | 104 (100.0%) | 0 (0.0%) |
Housing Structure by Heating Type in Brant Lake South
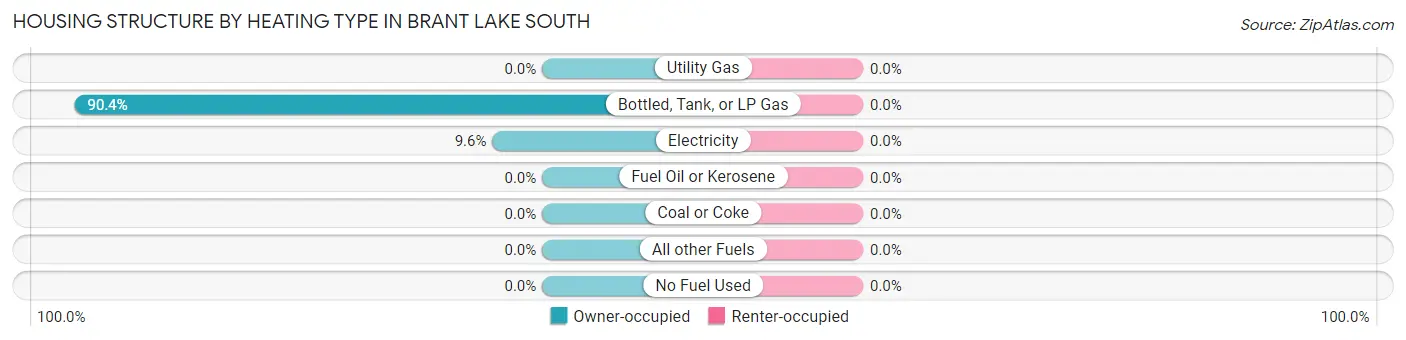
| Heating Type | Owner-occupied | Renter-occupied |
| Utility Gas | 0 (0.0%) | 0 (0.0%) |
| Bottled, Tank, or LP Gas | 94 (90.4%) | 0 (0.0%) |
| Electricity | 10 (9.6%) | 0 (0.0%) |
| Fuel Oil or Kerosene | 0 (0.0%) | 0 (0.0%) |
| Coal or Coke | 0 (0.0%) | 0 (0.0%) |
| All other Fuels | 0 (0.0%) | 0 (0.0%) |
| No Fuel Used | 0 (0.0%) | 0 (0.0%) |
| Total | 104 (100.0%) | 0 (0.0%) |
Household Vehicle Usage in Brant Lake South
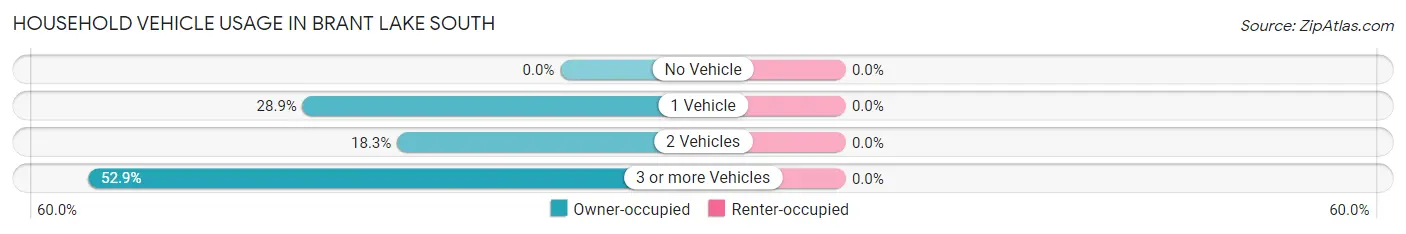
| Vehicles per Household | Owner-occupied | Renter-occupied |
| No Vehicle | 0 (0.0%) | 0 (0.0%) |
| 1 Vehicle | 30 (28.8%) | 0 (0.0%) |
| 2 Vehicles | 19 (18.3%) | 0 (0.0%) |
| 3 or more Vehicles | 55 (52.9%) | 0 (0.0%) |
| Total | 104 (100.0%) | 0 (0.0%) |
Real Estate & Mortgages in Brant Lake South
Real Estate and Mortgage Overview in Brant Lake South
| Characteristic | Without Mortgage | With Mortgage |
| Housing Units | 65 | 39 |
| Median Property Value | $96,500 | $432,800 |
| Median Household Income | $101,037 | $4 |
| Monthly Housing Costs | $556 | $0 |
| Real Estate Taxes | - | - |
Property Value by Mortgage Status in Brant Lake South
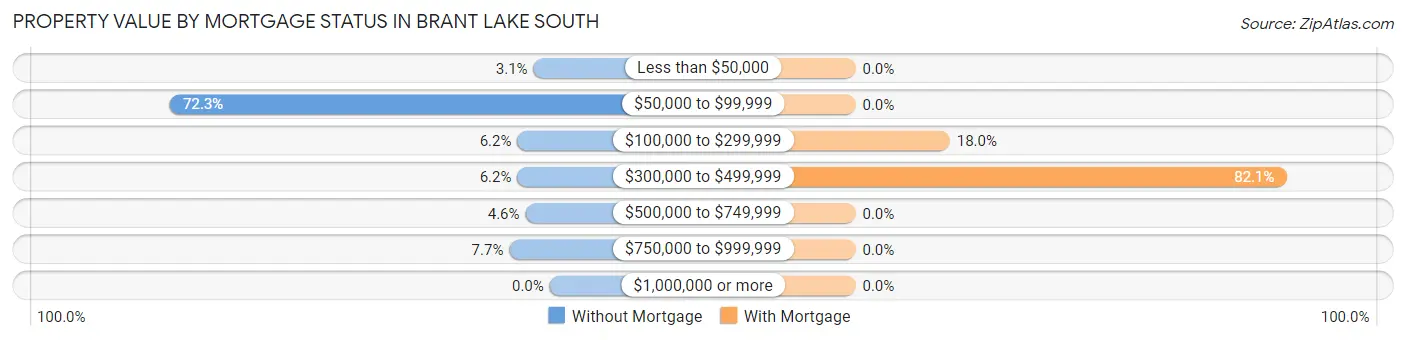
| Property Value | Without Mortgage | With Mortgage |
| Less than $50,000 | 2 (3.1%) | 0 (0.0%) |
| $50,000 to $99,999 | 47 (72.3%) | 0 (0.0%) |
| $100,000 to $299,999 | 4 (6.1%) | 7 (17.9%) |
| $300,000 to $499,999 | 4 (6.1%) | 32 (82.1%) |
| $500,000 to $749,999 | 3 (4.6%) | 0 (0.0%) |
| $750,000 to $999,999 | 5 (7.7%) | 0 (0.0%) |
| $1,000,000 or more | 0 (0.0%) | 0 (0.0%) |
| Total | 65 (100.0%) | 39 (100.0%) |
Household Income by Mortgage Status in Brant Lake South
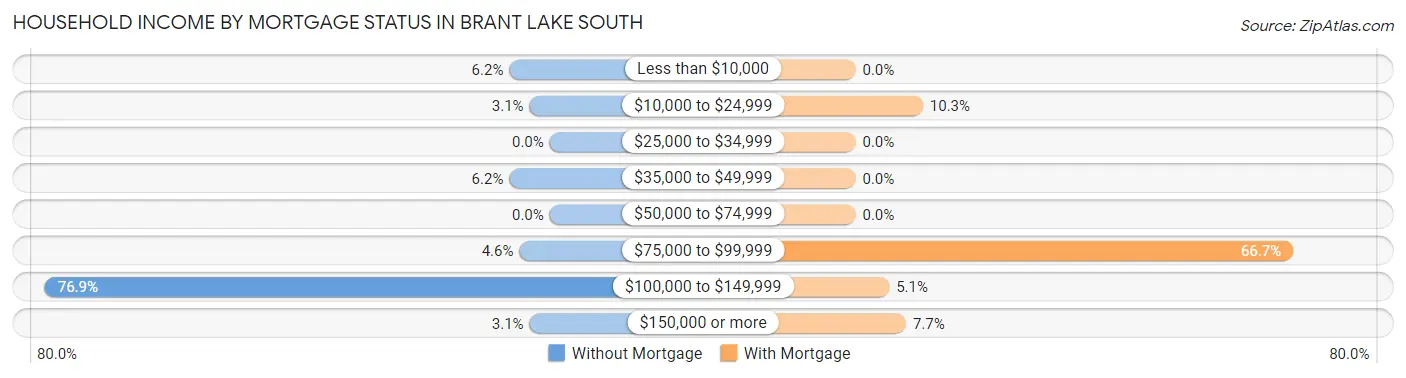
| Household Income | Without Mortgage | With Mortgage |
| Less than $10,000 | 4 (6.1%) | 0 (0.0%) |
| $10,000 to $24,999 | 2 (3.1%) | 4 (10.3%) |
| $25,000 to $34,999 | 0 (0.0%) | 0 (0.0%) |
| $35,000 to $49,999 | 4 (6.1%) | 0 (0.0%) |
| $50,000 to $74,999 | 0 (0.0%) | 0 (0.0%) |
| $75,000 to $99,999 | 3 (4.6%) | 26 (66.7%) |
| $100,000 to $149,999 | 50 (76.9%) | 2 (5.1%) |
| $150,000 or more | 2 (3.1%) | 3 (7.7%) |
| Total | 65 (100.0%) | 39 (100.0%) |
Property Value to Household Income Ratio in Brant Lake South
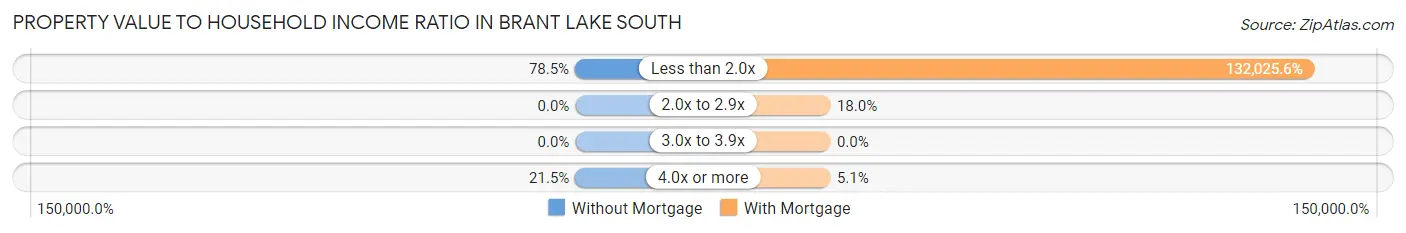
| Value-to-Income Ratio | Without Mortgage | With Mortgage |
| Less than 2.0x | 51 (78.5%) | 51,490 (132,025.6%) |
| 2.0x to 2.9x | 0 (0.0%) | 7 (17.9%) |
| 3.0x to 3.9x | 0 (0.0%) | 0 (0.0%) |
| 4.0x or more | 14 (21.5%) | 2 (5.1%) |
| Total | 65 (100.0%) | 39 (100.0%) |
Real Estate Taxes by Mortgage Status in Brant Lake South
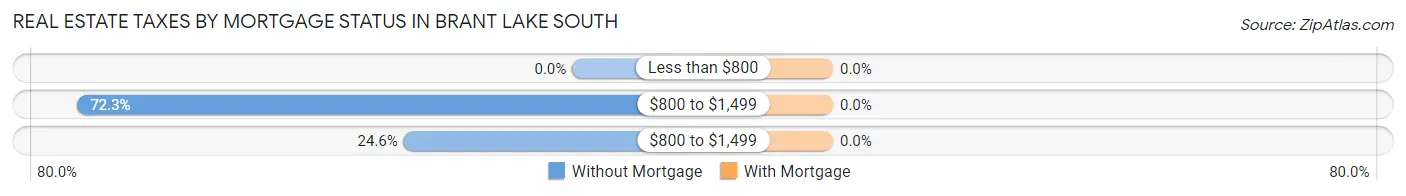
| Property Taxes | Without Mortgage | With Mortgage |
| Less than $800 | 0 (0.0%) | 0 (0.0%) |
| $800 to $1,499 | 47 (72.3%) | 0 (0.0%) |
| $800 to $1,499 | 16 (24.6%) | 0 (0.0%) |
| Total | 65 (100.0%) | 39 (100.0%) |
Health & Disability in Brant Lake South
Health Insurance Coverage by Age in Brant Lake South
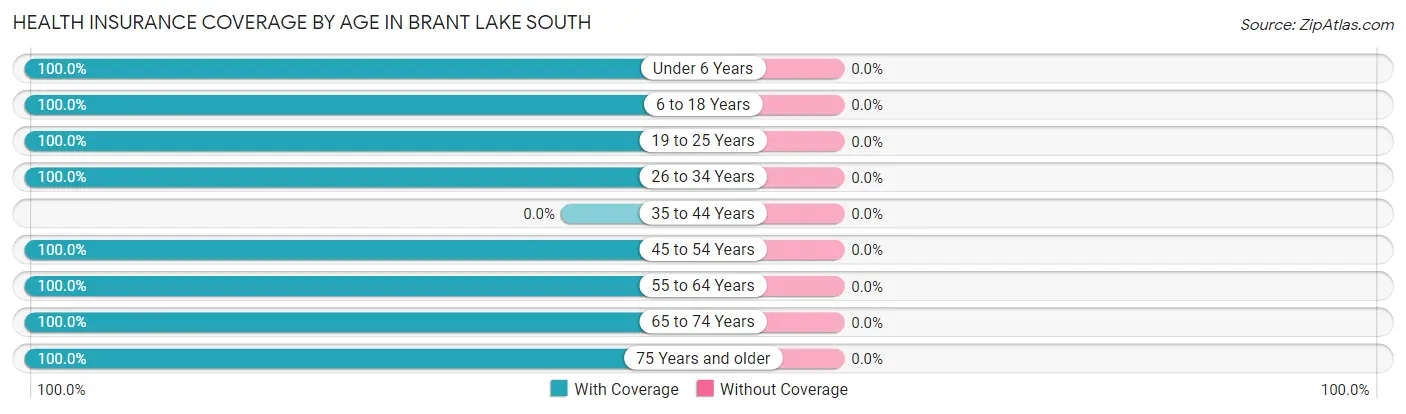
| Age Bracket | With Coverage | Without Coverage |
| Under 6 Years | 3 (100.0%) | 0 (0.0%) |
| 6 to 18 Years | 6 (100.0%) | 0 (0.0%) |
| 19 to 25 Years | 33 (100.0%) | 0 (0.0%) |
| 26 to 34 Years | 2 (100.0%) | 0 (0.0%) |
| 35 to 44 Years | 0 (0.0%) | 0 (0.0%) |
| 45 to 54 Years | 68 (100.0%) | 0 (0.0%) |
| 55 to 64 Years | 20 (100.0%) | 0 (0.0%) |
| 65 to 74 Years | 89 (100.0%) | 0 (0.0%) |
| 75 Years and older | 2 (100.0%) | 0 (0.0%) |
| Total | 223 (100.0%) | 0 (0.0%) |
Health Insurance Coverage by Citizenship Status in Brant Lake South
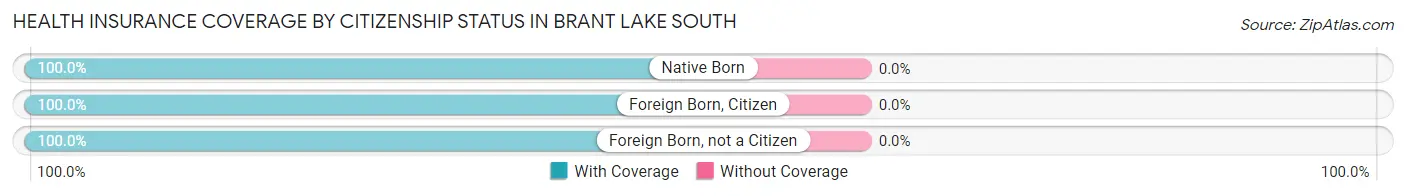
| Citizenship Status | With Coverage | Without Coverage |
| Native Born | 3 (100.0%) | 0 (0.0%) |
| Foreign Born, Citizen | 6 (100.0%) | 0 (0.0%) |
| Foreign Born, not a Citizen | 33 (100.0%) | 0 (0.0%) |
Health Insurance Coverage by Household Income in Brant Lake South
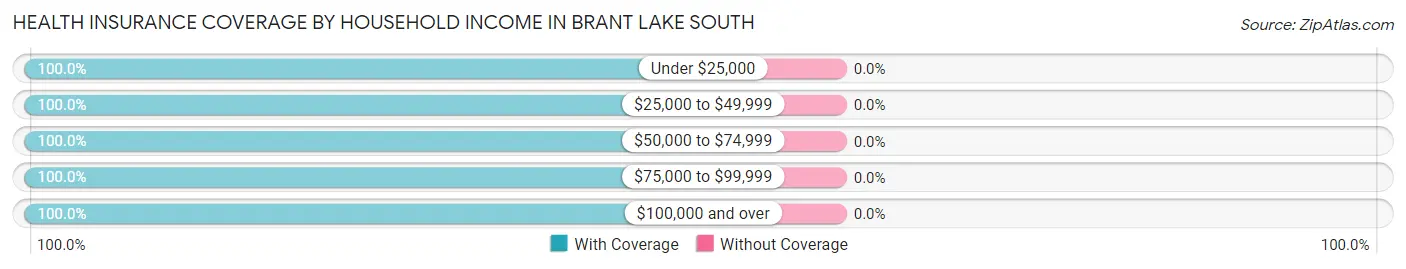
| Household Income | With Coverage | Without Coverage |
| Under $25,000 | 10 (100.0%) | 0 (0.0%) |
| $25,000 to $49,999 | 4 (100.0%) | 0 (0.0%) |
| $50,000 to $74,999 | 63 (100.0%) | 0 (0.0%) |
| $75,000 to $99,999 | 14 (100.0%) | 0 (0.0%) |
| $100,000 and over | 132 (100.0%) | 0 (0.0%) |
Public vs Private Health Insurance Coverage by Age in Brant Lake South
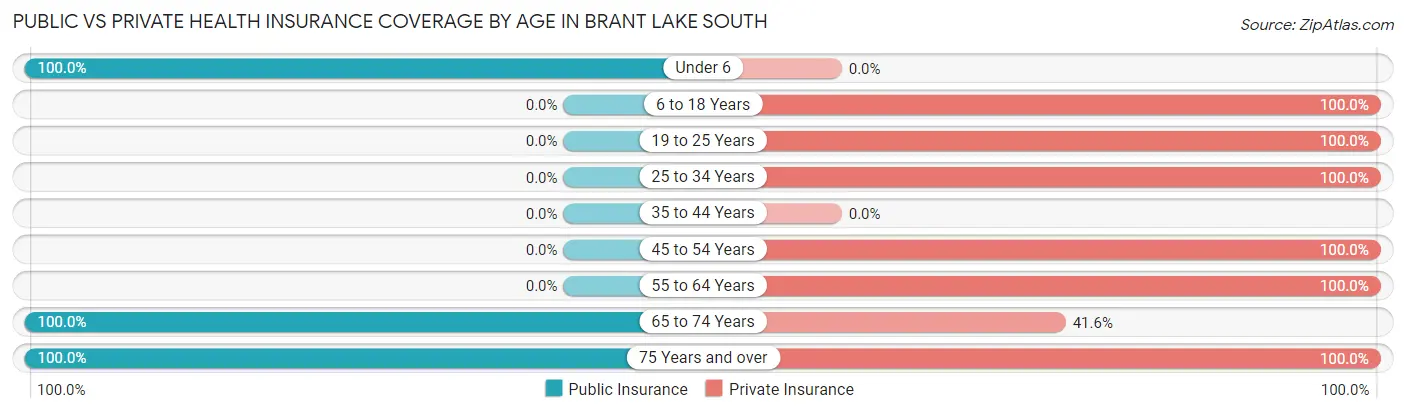
| Age Bracket | Public Insurance | Private Insurance |
| Under 6 | 3 (100.0%) | 0 (0.0%) |
| 6 to 18 Years | 0 (0.0%) | 6 (100.0%) |
| 19 to 25 Years | 0 (0.0%) | 33 (100.0%) |
| 25 to 34 Years | 0 (0.0%) | 2 (100.0%) |
| 35 to 44 Years | 0 (0.0%) | 0 (0.0%) |
| 45 to 54 Years | 0 (0.0%) | 68 (100.0%) |
| 55 to 64 Years | 0 (0.0%) | 20 (100.0%) |
| 65 to 74 Years | 89 (100.0%) | 37 (41.6%) |
| 75 Years and over | 2 (100.0%) | 2 (100.0%) |
| Total | 94 (42.1%) | 168 (75.3%) |
Disability Status by Sex by Age in Brant Lake South
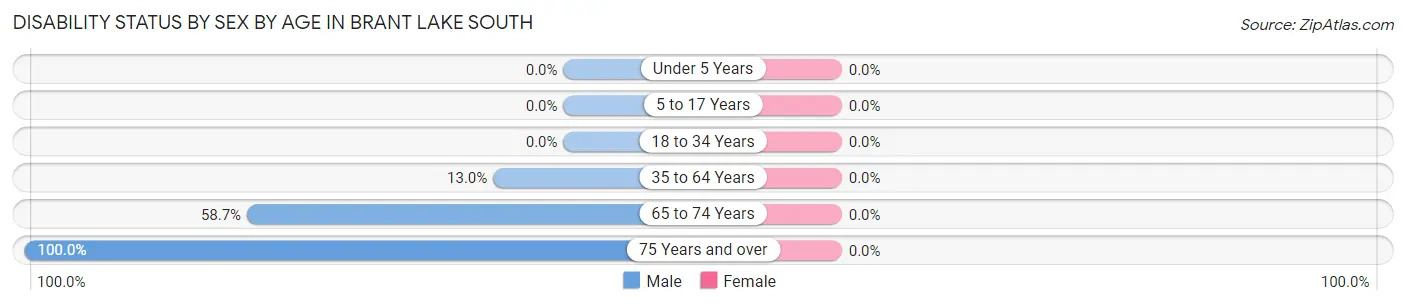
| Age Bracket | Male | Female |
| Under 5 Years | 0 (0.0%) | 0 (0.0%) |
| 5 to 17 Years | 0 (0.0%) | 0 (0.0%) |
| 18 to 34 Years | 0 (0.0%) | 0 (0.0%) |
| 35 to 64 Years | 3 (13.0%) | 0 (0.0%) |
| 65 to 74 Years | 37 (58.7%) | 0 (0.0%) |
| 75 Years and over | 2 (100.0%) | 0 (0.0%) |
Disability Class by Sex by Age in Brant Lake South
Disability Class: Hearing Difficulty
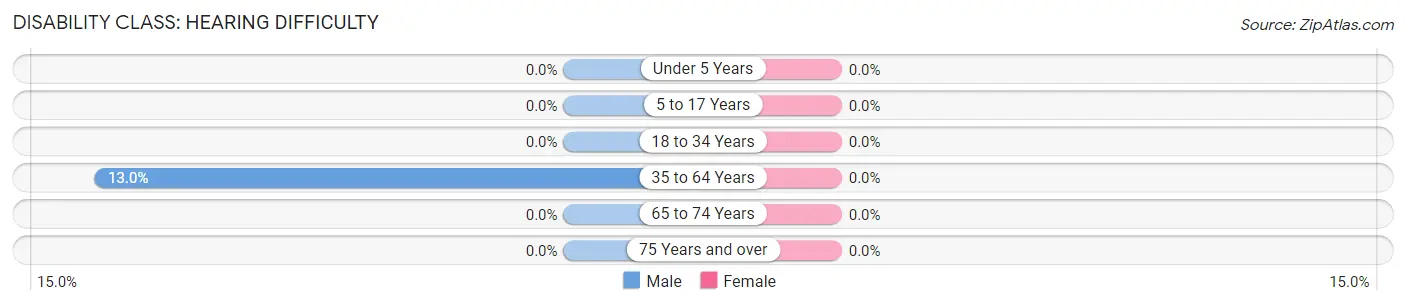
| Age Bracket | Male | Female |
| Under 5 Years | 0 (0.0%) | 0 (0.0%) |
| 5 to 17 Years | 0 (0.0%) | 0 (0.0%) |
| 18 to 34 Years | 0 (0.0%) | 0 (0.0%) |
| 35 to 64 Years | 3 (13.0%) | 0 (0.0%) |
| 65 to 74 Years | 0 (0.0%) | 0 (0.0%) |
| 75 Years and over | 0 (0.0%) | 0 (0.0%) |
Disability Class: Vision Difficulty
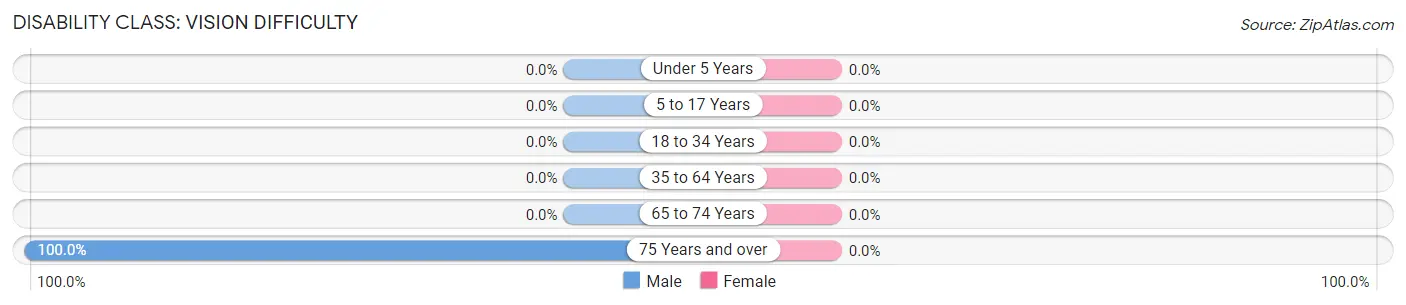
| Age Bracket | Male | Female |
| Under 5 Years | 0 (0.0%) | 0 (0.0%) |
| 5 to 17 Years | 0 (0.0%) | 0 (0.0%) |
| 18 to 34 Years | 0 (0.0%) | 0 (0.0%) |
| 35 to 64 Years | 0 (0.0%) | 0 (0.0%) |
| 65 to 74 Years | 0 (0.0%) | 0 (0.0%) |
| 75 Years and over | 2 (100.0%) | 0 (0.0%) |
Disability Class: Cognitive Difficulty
| Age Bracket | Male | Female |
| 5 to 17 Years | 0 (0.0%) | 0 (0.0%) |
| 18 to 34 Years | 0 (0.0%) | 0 (0.0%) |
| 35 to 64 Years | 0 (0.0%) | 0 (0.0%) |
| 65 to 74 Years | 0 (0.0%) | 0 (0.0%) |
| 75 Years and over | 0 (0.0%) | 0 (0.0%) |
Disability Class: Ambulatory Difficulty
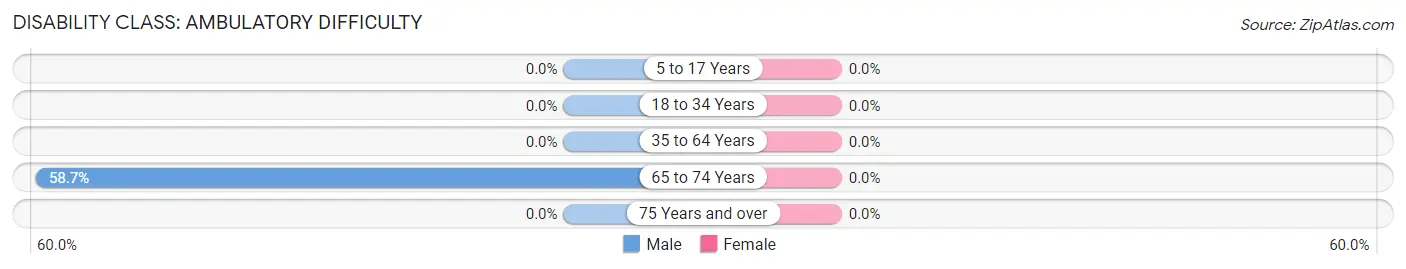
| Age Bracket | Male | Female |
| 5 to 17 Years | 0 (0.0%) | 0 (0.0%) |
| 18 to 34 Years | 0 (0.0%) | 0 (0.0%) |
| 35 to 64 Years | 0 (0.0%) | 0 (0.0%) |
| 65 to 74 Years | 37 (58.7%) | 0 (0.0%) |
| 75 Years and over | 0 (0.0%) | 0 (0.0%) |
Disability Class: Self-Care Difficulty
| Age Bracket | Male | Female |
| 5 to 17 Years | 0 (0.0%) | 0 (0.0%) |
| 18 to 34 Years | 0 (0.0%) | 0 (0.0%) |
| 35 to 64 Years | 0 (0.0%) | 0 (0.0%) |
| 65 to 74 Years | 0 (0.0%) | 0 (0.0%) |
| 75 Years and over | 0 (0.0%) | 0 (0.0%) |
Technology Access in Brant Lake South
Computing Device Access in Brant Lake South
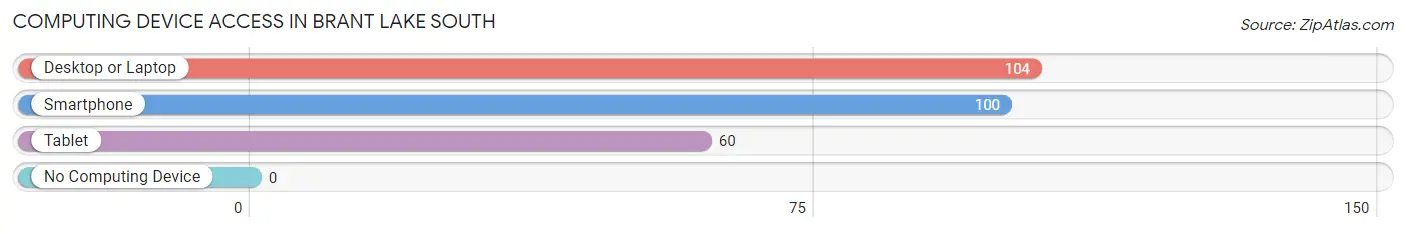
| Device Type | # Households | % Households |
| Desktop or Laptop | 104 | 100.0% |
| Smartphone | 100 | 96.2% |
| Tablet | 60 | 57.7% |
| No Computing Device | 0 | 0.0% |
| Total | 104 | 100.0% |
Internet Access in Brant Lake South
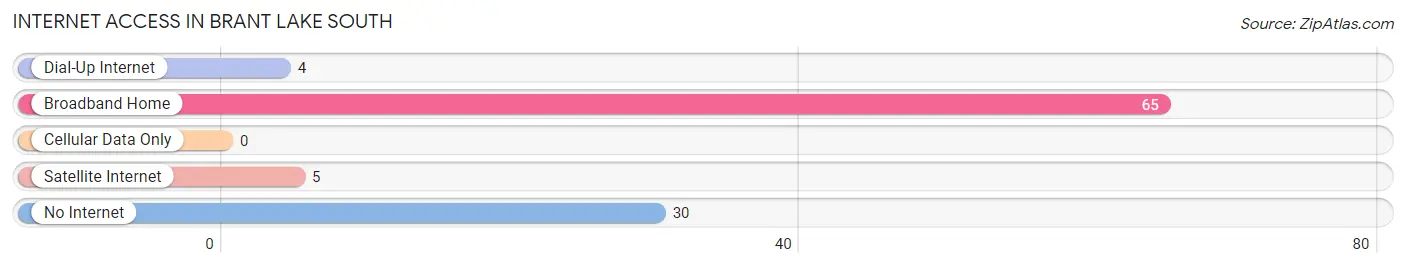
| Internet Type | # Households | % Households |
| Dial-Up Internet | 4 | 3.8% |
| Broadband Home | 65 | 62.5% |
| Cellular Data Only | 0 | 0.0% |
| Satellite Internet | 5 | 4.8% |
| No Internet | 30 | 28.8% |
| Total | 104 | 100.0% |
Brant Lake South Summary
Brant Lake South, South Dakota is a small unincorporated community located in the southeastern corner of the state. It is situated in the Black Hills region of South Dakota, and is surrounded by the Black Hills National Forest. The community is located on the shores of Brant Lake, a small lake that is part of the Black Hills National Forest.
History
Brant Lake South was first settled in the late 1800s by homesteaders who were drawn to the area by the abundance of natural resources. The area was originally known as "Brant Lake," but the name was changed to "Brant Lake South" in the early 1900s to distinguish it from the nearby town of Brant Lake, North Dakota.
The community was originally a logging and mining town, and the area was home to several sawmills and mines. The town was also home to a number of small businesses, including a general store, a post office, and a hotel.
In the early 1900s, the town was home to a large population of Native Americans, primarily Sioux. The town was also home to a number of European immigrants, including German, Swedish, and Norwegian settlers.
Geography
Brant Lake South is located in the southeastern corner of South Dakota, in the Black Hills region. The town is situated on the shores of Brant Lake, a small lake that is part of the Black Hills National Forest. The town is surrounded by rolling hills and forests, and is located near the town of Custer, South Dakota.
The town is located at an elevation of 4,890 feet, and has a total area of 0.2 square miles. The town has a humid continental climate, with cold winters and warm summers.
Economy
Brant Lake South is a small, rural community with a limited economy. The town is home to a number of small businesses, including a general store, a post office, and a hotel. The town is also home to a number of small farms and ranches.
The town is also home to a number of recreational activities, including fishing, hunting, and camping. The town is also home to a number of tourist attractions, including the Black Hills National Forest and the nearby town of Custer.
Demographics
As of the 2010 census, the population of Brant Lake South was 545. The town has a total area of 0.2 square miles, and a population density of 2,725 people per square mile. The town is predominantly white, with 95.3% of the population identifying as white. The town also has a small Native American population, with 4.7% of the population identifying as Native American. The town also has a small Hispanic population, with 1.1% of the population identifying as Hispanic or Latino.
The median household income in Brant Lake South is $37,500, and the median family income is $41,250. The town has a poverty rate of 16.7%, and the unemployment rate is 4.3%. The town has a high school graduation rate of 87.5%, and the town has a high school dropout rate of 12.5%.
Common Questions
What is Per Capita Income in Brant Lake South?
Per Capita income in Brant Lake South is $44,719.
What is the Median Family Income in Brant Lake South?
Median Family Income in Brant Lake South is $100,745.
What is the Median Household income in Brant Lake South?
Median Household Income in Brant Lake South is $100,372.
What is Income or Wage Gap in Brant Lake South?
Income or Wage Gap in Brant Lake South is 76.4%.
Women in Brant Lake South earn 23.6 cents for every dollar earned by a man.
What is Inequality or Gini Index in Brant Lake South?
Inequality or Gini Index in Brant Lake South is 0.40.
What is the Total Population of Brant Lake South?
Total Population of Brant Lake South is 223.
What is the Total Male Population of Brant Lake South?
Total Male Population of Brant Lake South is 94.
What is the Total Female Population of Brant Lake South?
Total Female Population of Brant Lake South is 129.
What is the Ratio of Males per 100 Females in Brant Lake South?
There are 72.87 Males per 100 Females in Brant Lake South.
What is the Ratio of Females per 100 Males in Brant Lake South?
There are 137.23 Females per 100 Males in Brant Lake South.
What is the Median Population Age in Brant Lake South?
Median Population Age in Brant Lake South is 54.9 Years.
What is the Average Family Size in Brant Lake South
Average Family Size in Brant Lake South is 2.3 People.
What is the Average Household Size in Brant Lake South
Average Household Size in Brant Lake South is 2.1 People.
How Large is the Labor Force in Brant Lake South?
There are 158 People in the Labor Forcein in Brant Lake South.
What is the Percentage of People in the Labor Force in Brant Lake South?
72.8% of People are in the Labor Force in Brant Lake South.