Berlin, ND Map & Demographics
Berlin Map
Berlin Overview
$32,969
PER CAPITA INCOME
$150,000
AVG FAMILY INCOME
$120,000
AVG HOUSEHOLD INCOME
0.32
INEQUALITY / GINI INDEX
51
TOTAL POPULATION
24
MALE POPULATION
27
FEMALE POPULATION
88.89
MALES / 100 FEMALES
112.50
FEMALES / 100 MALES
34.6
MEDIAN AGE
3.5
AVG FAMILY SIZE
3.2
AVG HOUSEHOLD SIZE
28
LABOR FORCE [ PEOPLE ]
77.8%
PERCENT IN LABOR FORCE
Berlin Zip Codes
Berlin Area Codes
Income in Berlin
Income Overview in Berlin
Per Capita Income in Berlin is $32,969, while median incomes of families and households are $150,000 and $120,000 respectively.
| Characteristic | Number | Measure |
| Per Capita Income | 51 | $32,969 |
| Median Family Income | 14 | $150,000 |
| Mean Family Income | 14 | $107,421 |
| Median Household Income | 16 | $120,000 |
| Mean Household Income | 16 | $98,950 |
| Income Deficit | 14 | $0 |
| Wage / Income Gap (%) | 51 | 0.00% |
| Wage / Income Gap ($) | 51 | 100.00¢ per $1 |
| Gini / Inequality Index | 51 | 0.32 |
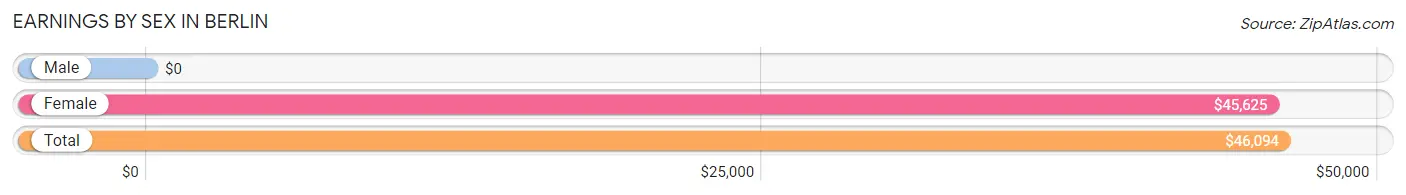
Earnings by Sex in Berlin
| Sex | Number | Average Earnings |
| Male | 15 (51.7%) | $0 |
| Female | 14 (48.3%) | $45,625 |
| Total | 29 (100.0%) | $46,094 |
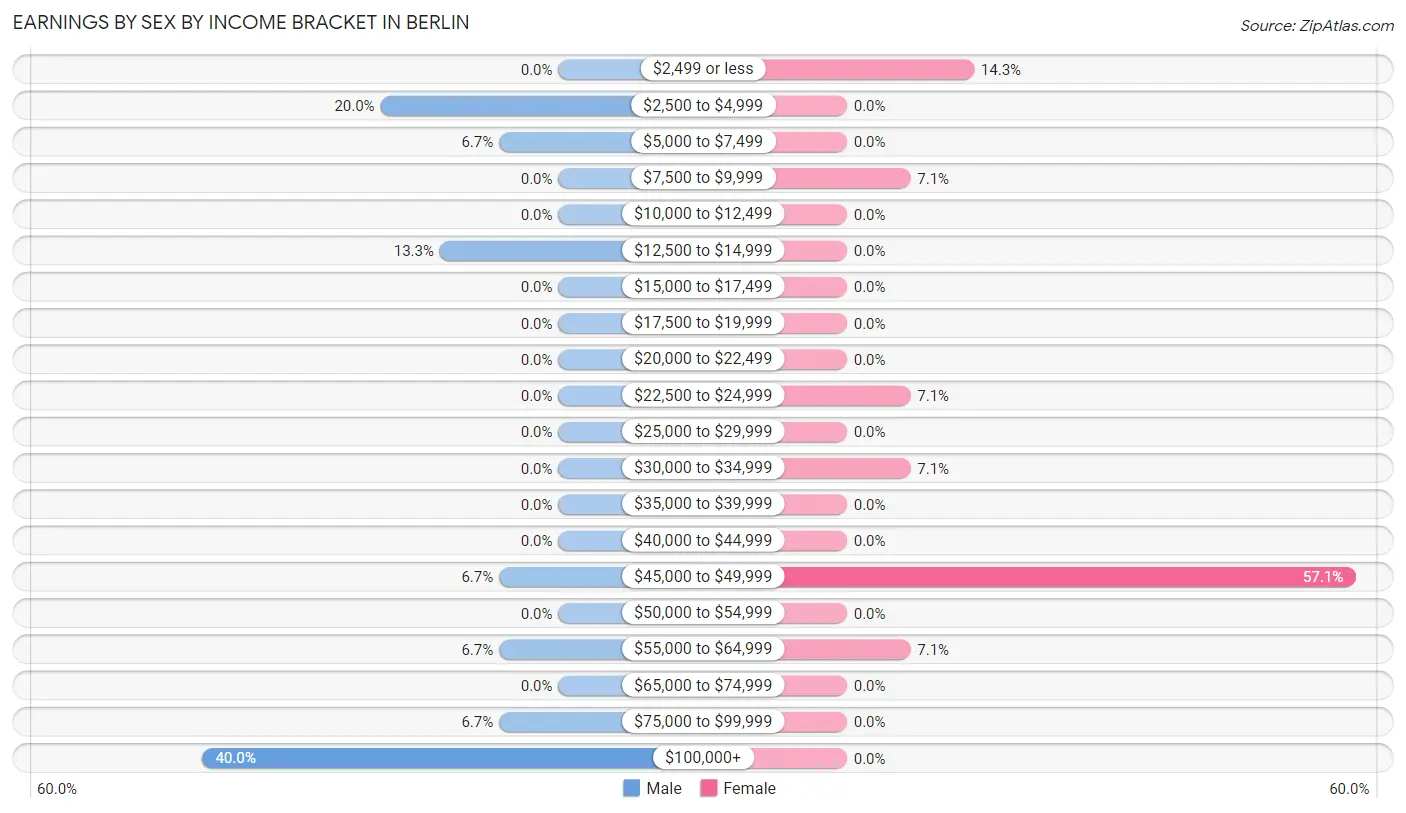
Earnings by Sex by Income Bracket in Berlin
The most common earnings brackets in Berlin are $100,000+ for men (6 | 40.0%) and $45,000 to $49,999 for women (8 | 57.1%).
| Income | Male | Female |
| $2,499 or less | 0 (0.0%) | 2 (14.3%) |
| $2,500 to $4,999 | 3 (20.0%) | 0 (0.0%) |
| $5,000 to $7,499 | 1 (6.7%) | 0 (0.0%) |
| $7,500 to $9,999 | 0 (0.0%) | 1 (7.1%) |
| $10,000 to $12,499 | 0 (0.0%) | 0 (0.0%) |
| $12,500 to $14,999 | 2 (13.3%) | 0 (0.0%) |
| $15,000 to $17,499 | 0 (0.0%) | 0 (0.0%) |
| $17,500 to $19,999 | 0 (0.0%) | 0 (0.0%) |
| $20,000 to $22,499 | 0 (0.0%) | 0 (0.0%) |
| $22,500 to $24,999 | 0 (0.0%) | 1 (7.1%) |
| $25,000 to $29,999 | 0 (0.0%) | 0 (0.0%) |
| $30,000 to $34,999 | 0 (0.0%) | 1 (7.1%) |
| $35,000 to $39,999 | 0 (0.0%) | 0 (0.0%) |
| $40,000 to $44,999 | 0 (0.0%) | 0 (0.0%) |
| $45,000 to $49,999 | 1 (6.7%) | 8 (57.1%) |
| $50,000 to $54,999 | 0 (0.0%) | 0 (0.0%) |
| $55,000 to $64,999 | 1 (6.7%) | 1 (7.1%) |
| $65,000 to $74,999 | 0 (0.0%) | 0 (0.0%) |
| $75,000 to $99,999 | 1 (6.7%) | 0 (0.0%) |
| $100,000+ | 6 (40.0%) | 0 (0.0%) |
| Total | 15 (100.0%) | 14 (100.0%) |
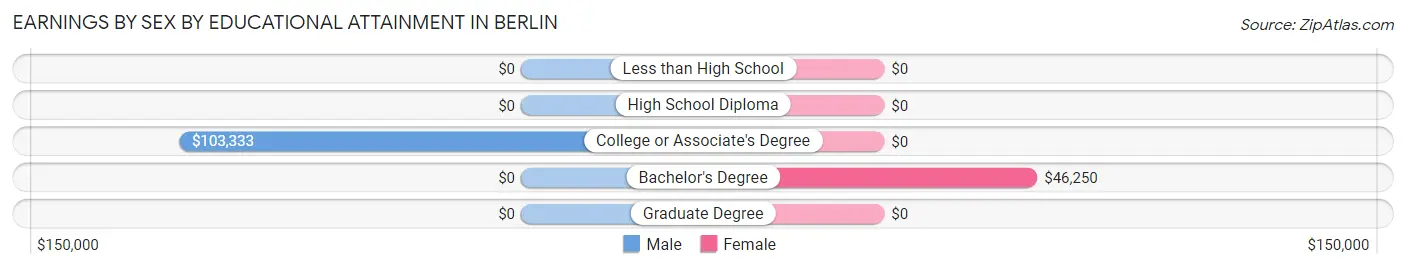
Earnings by Sex by Educational Attainment in Berlin
Average earnings in Berlin are $102,708 for men and $45,625 for women, a difference of 55.6%. Men with an educational attainment of college or associate's degree enjoy the highest average annual earnings of $103,333, while those with college or associate's degree education earn the least with $103,333. Women with an educational attainment of bachelor's degree earn the most with the average annual earnings of $46,250, while those with bachelor's degree education have the smallest earnings of $46,250.
| Educational Attainment | Male Income | Female Income |
| Less than High School | - | - |
| High School Diploma | - | - |
| College or Associate's Degree | $103,333 | $0 |
| Bachelor's Degree | - | - |
| Graduate Degree | - | - |
| Total | $102,708 | $45,625 |
Family Income in Berlin
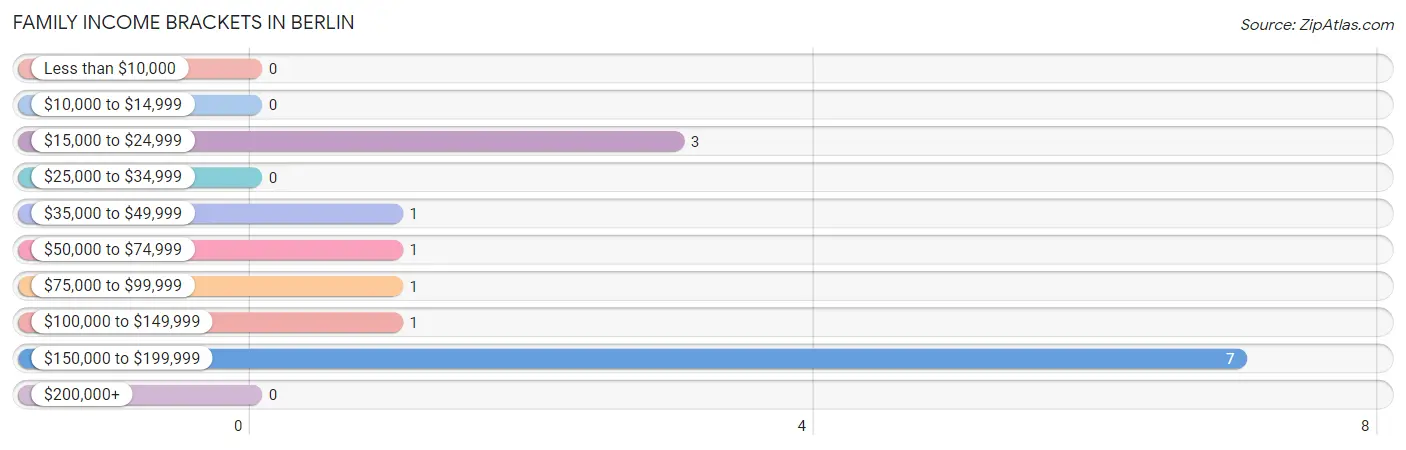
Family Income Brackets in Berlin
According to the Berlin family income data, there are 7 families falling into the $150,000 to $199,999 income range, which is the most common income bracket and makes up 50.0% of all families.
| Income Bracket | # Families | % Families |
| Less than $10,000 | 0 | 0.0% |
| $10,000 to $14,999 | 0 | 0.0% |
| $15,000 to $24,999 | 3 | 21.4% |
| $25,000 to $34,999 | 0 | 0.0% |
| $35,000 to $49,999 | 1 | 7.1% |
| $50,000 to $74,999 | 1 | 7.1% |
| $75,000 to $99,999 | 1 | 7.1% |
| $100,000 to $149,999 | 1 | 7.1% |
| $150,000 to $199,999 | 7 | 50.0% |
| $200,000+ | 0 | 0.0% |
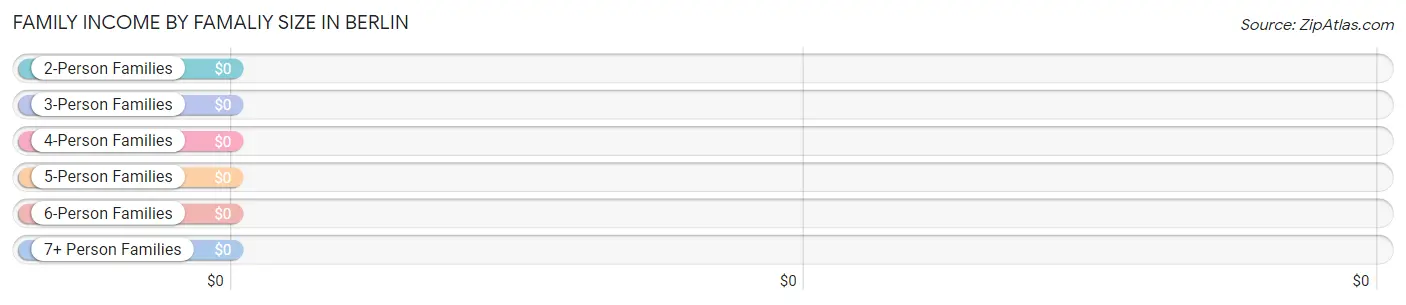
Family Income by Famaliy Size in Berlin
| Income Bracket | # Families | Median Income |
| 2-Person Families | 4 (28.6%) | $0 |
| 3-Person Families | 2 (14.3%) | $0 |
| 4-Person Families | 1 (7.1%) | $0 |
| 5-Person Families | 7 (50.0%) | $0 |
| 6-Person Families | 0 (0.0%) | $0 |
| 7+ Person Families | 0 (0.0%) | $0 |
| Total | 14 (100.0%) | $150,000 |
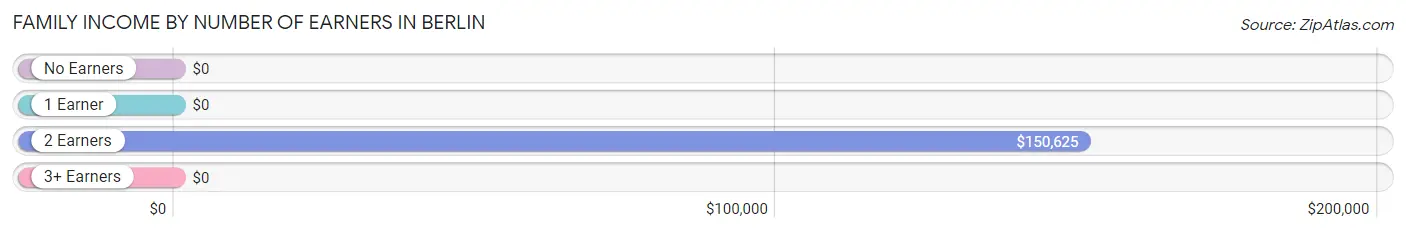
Family Income by Number of Earners in Berlin
| Number of Earners | # Families | Median Income |
| No Earners | 2 (14.3%) | $0 |
| 1 Earner | 1 (7.1%) | $0 |
| 2 Earners | 9 (64.3%) | $150,625 |
| 3+ Earners | 2 (14.3%) | $0 |
| Total | 14 (100.0%) | $150,000 |
Household Income in Berlin
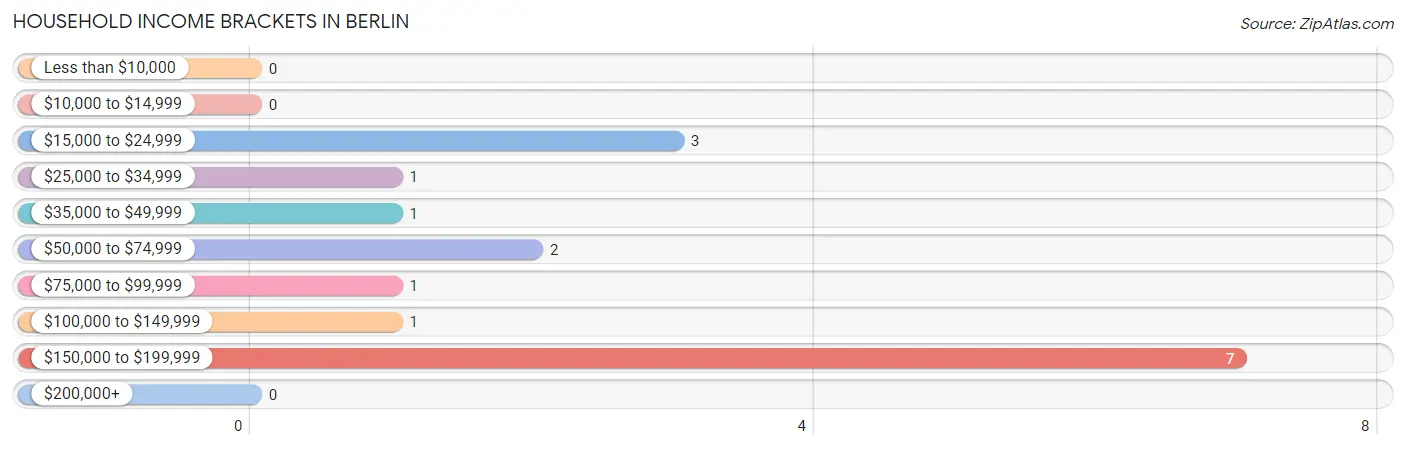
Household Income Brackets in Berlin
With 7 households falling in the category, the $150,000 to $199,999 income range is the most frequent in Berlin, accounting for 43.8% of all households.
| Income Bracket | # Households | % Households |
| Less than $10,000 | 0 | 0.0% |
| $10,000 to $14,999 | 0 | 0.0% |
| $15,000 to $24,999 | 3 | 18.8% |
| $25,000 to $34,999 | 1 | 6.3% |
| $35,000 to $49,999 | 1 | 6.3% |
| $50,000 to $74,999 | 2 | 12.5% |
| $75,000 to $99,999 | 1 | 6.3% |
| $100,000 to $149,999 | 1 | 6.3% |
| $150,000 to $199,999 | 7 | 43.8% |
| $200,000+ | 0 | 0.0% |
Household Income by Householder Age in Berlin
| Income Bracket | # Households | Median Income |
| 15 to 24 Years | 0 (0.0%) | $0 |
| 25 to 44 Years | 7 (43.8%) | $0 |
| 45 to 64 Years | 4 (25.0%) | $0 |
| 65+ Years | 5 (31.2%) | $0 |
| Total | 16 (100.0%) | $120,000 |
Poverty in Berlin
Income Below Poverty by Sex and Age in Berlin
| Age Bracket | Male | Female |
| Under 5 Years | 0 (0.0%) | 0 (0.0%) |
| 5 Years | 0 (0.0%) | 0 (0.0%) |
| 6 to 11 Years | 0 (0.0%) | 0 (0.0%) |
| 12 to 14 Years | 0 (0.0%) | 0 (0.0%) |
| 15 Years | 0 (0.0%) | 0 (0.0%) |
| 16 and 17 Years | 0 (0.0%) | 0 (0.0%) |
| 18 to 24 Years | 0 (0.0%) | 0 (0.0%) |
| 25 to 34 Years | 0 (0.0%) | 0 (0.0%) |
| 35 to 44 Years | 0 (0.0%) | 0 (0.0%) |
| 45 to 54 Years | 0 (0.0%) | 0 (0.0%) |
| 55 to 64 Years | 0 (0.0%) | 0 (0.0%) |
| 65 to 74 Years | 0 (0.0%) | 0 (0.0%) |
| 75 Years and over | 0 (0.0%) | 0 (0.0%) |
| Total | 0 (0.0%) | 0 (0.0%) |
Income Above Poverty by Sex and Age in Berlin
According to the poverty statistics in Berlin, males aged 6 to 11 years and females aged under 5 years are the age groups that are most secure financially, with 100.0% of males and 100.0% of females in these age groups living above the poverty line.
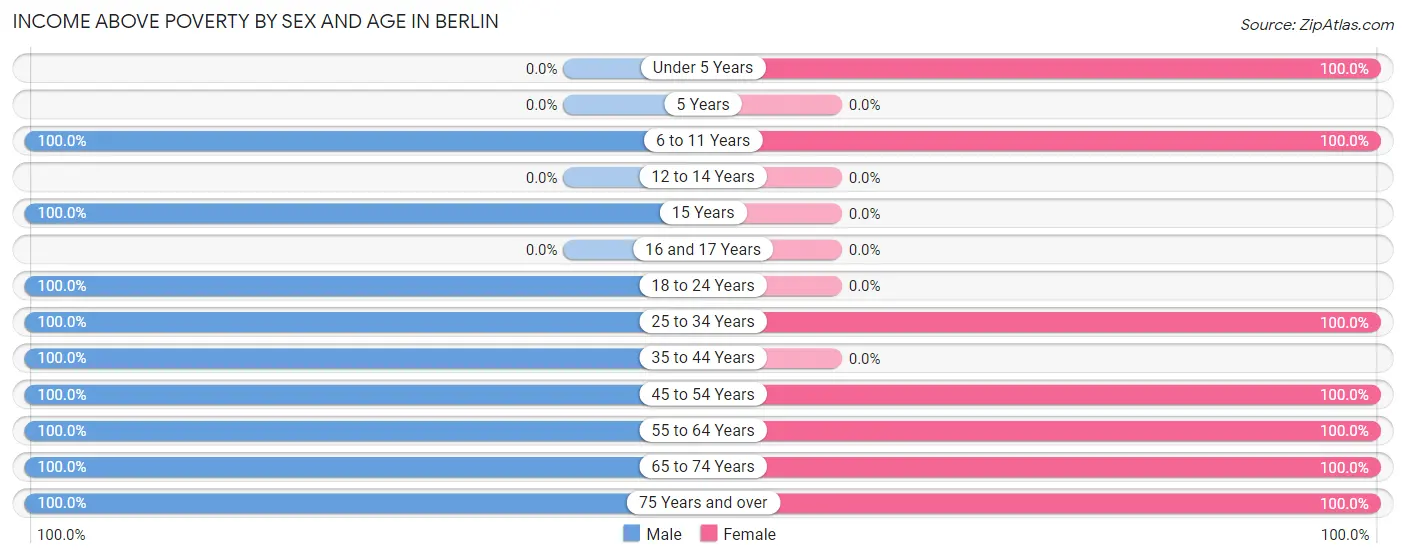
| Age Bracket | Male | Female |
| Under 5 Years | 0 (0.0%) | 2 (100.0%) |
| 5 Years | 0 (0.0%) | 0 (0.0%) |
| 6 to 11 Years | 5 (100.0%) | 7 (100.0%) |
| 12 to 14 Years | 0 (0.0%) | 0 (0.0%) |
| 15 Years | 1 (100.0%) | 0 (0.0%) |
| 16 and 17 Years | 0 (0.0%) | 0 (0.0%) |
| 18 to 24 Years | 4 (100.0%) | 0 (0.0%) |
| 25 to 34 Years | 1 (100.0%) | 9 (100.0%) |
| 35 to 44 Years | 6 (100.0%) | 0 (0.0%) |
| 45 to 54 Years | 3 (100.0%) | 4 (100.0%) |
| 55 to 64 Years | 1 (100.0%) | 1 (100.0%) |
| 65 to 74 Years | 1 (100.0%) | 1 (100.0%) |
| 75 Years and over | 2 (100.0%) | 3 (100.0%) |
| Total | 24 (100.0%) | 27 (100.0%) |
Income Below Poverty Among Married-Couple Families in Berlin
| Children | Above Poverty | Below Poverty |
| No Children | 6 (100.0%) | 0 (0.0%) |
| 1 or 2 Children | 2 (100.0%) | 0 (0.0%) |
| 3 or 4 Children | 6 (100.0%) | 0 (0.0%) |
| 5 or more Children | 0 (0.0%) | 0 (0.0%) |
| Total | 14 (100.0%) | 0 (0.0%) |
Income Below Poverty Among Single-Parent Households in Berlin
| Children | Single Father | Single Mother |
| No Children | 0 (0.0%) | 0 (0.0%) |
| 1 or 2 Children | 0 (0.0%) | 0 (0.0%) |
| 3 or 4 Children | 0 (0.0%) | 0 (0.0%) |
| 5 or more Children | 0 (0.0%) | 0 (0.0%) |
| Total | 0 (0.0%) | 0 (0.0%) |
Income Below Poverty Among Married-Couple vs Single-Parent Households in Berlin
| Children | Married-Couple Families | Single-Parent Households |
| No Children | 0 (0.0%) | 0 (0.0%) |
| 1 or 2 Children | 0 (0.0%) | 0 (0.0%) |
| 3 or 4 Children | 0 (0.0%) | 0 (0.0%) |
| 5 or more Children | 0 (0.0%) | 0 (0.0%) |
| Total | 0 (0.0%) | 0 (0.0%) |
Race in Berlin
The most populous races in Berlin are , and White / Caucasian (51 | 100.0%).
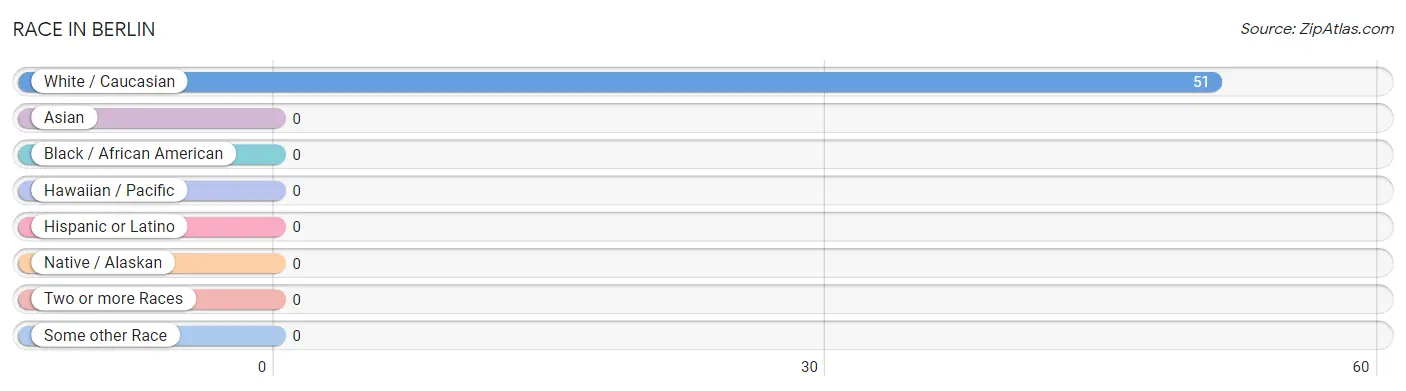
| Race | # Population | % Population |
| Asian | 0 | 0.0% |
| Black / African American | 0 | 0.0% |
| Hawaiian / Pacific | 0 | 0.0% |
| Hispanic or Latino | 0 | 0.0% |
| Native / Alaskan | 0 | 0.0% |
| White / Caucasian | 51 | 100.0% |
| Two or more Races | 0 | 0.0% |
| Some other Race | 0 | 0.0% |
| Total | 51 | 100.0% |
Ancestry in Berlin
The most populous ancestries reported in Berlin are German (31 | 60.8%), Yugoslavian (5 | 9.8%), Danish (4 | 7.8%), English (4 | 7.8%), and Irish (2 | 3.9%), together accounting for 90.2% of all Berlin residents.
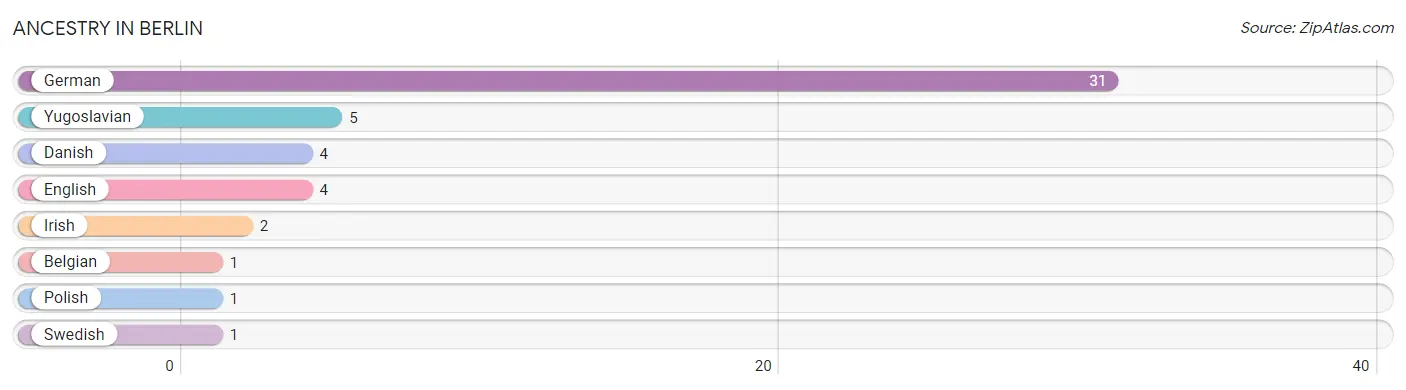
| Ancestry | # Population | % Population |
| Belgian | 1 | 2.0% |
| Danish | 4 | 7.8% |
| English | 4 | 7.8% |
| German | 31 | 60.8% |
| Irish | 2 | 3.9% |
| Polish | 1 | 2.0% |
| Swedish | 1 | 2.0% |
| Yugoslavian | 5 | 9.8% | View All 8 Rows |
Immigrants in Berlin

| Immigration Origin | # Population | % Population | View All 0 Rows |
Sex and Age in Berlin
Sex and Age in Berlin
The most populous age groups in Berlin are 35 to 39 Years (6 | 25.0%) for men and 30 to 34 Years (8 | 29.6%) for women.
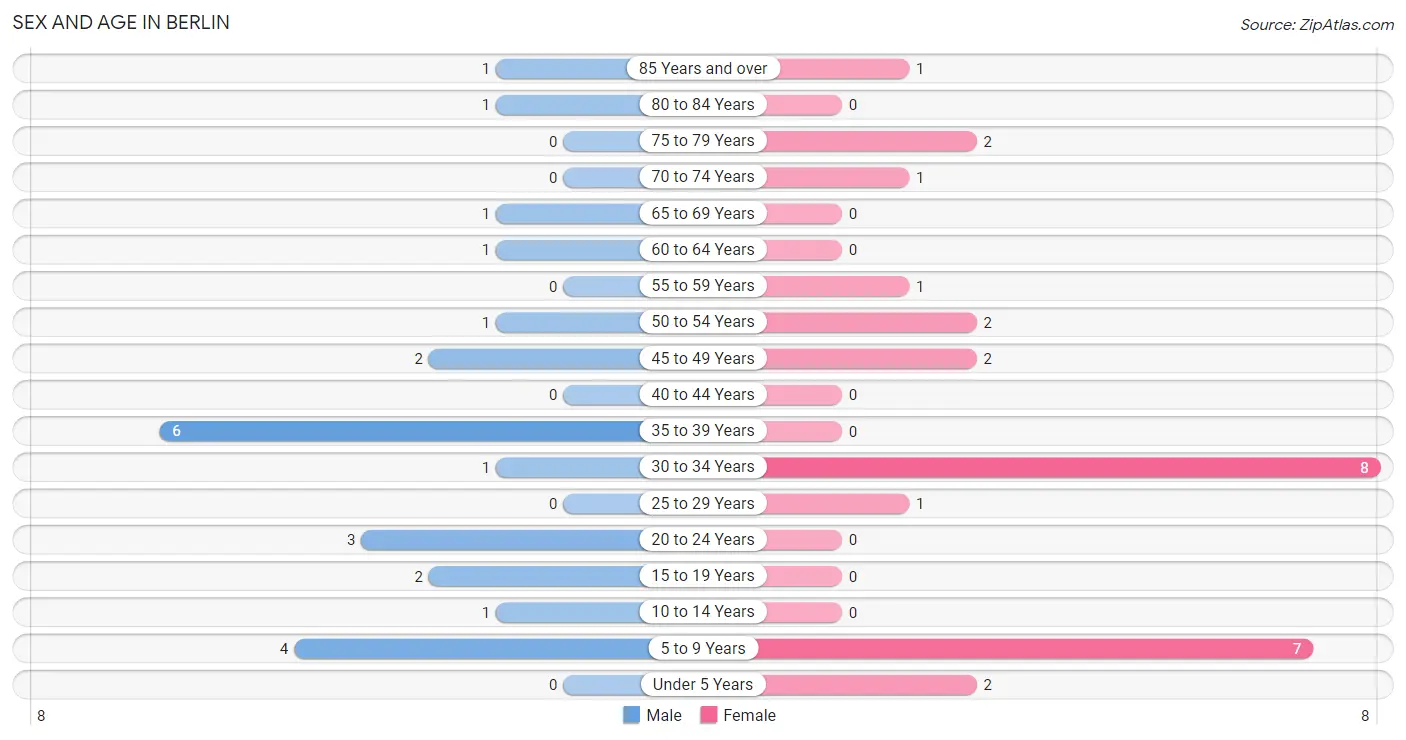
| Age Bracket | Male | Female |
| Under 5 Years | 0 (0.0%) | 2 (7.4%) |
| 5 to 9 Years | 4 (16.7%) | 7 (25.9%) |
| 10 to 14 Years | 1 (4.2%) | 0 (0.0%) |
| 15 to 19 Years | 2 (8.3%) | 0 (0.0%) |
| 20 to 24 Years | 3 (12.5%) | 0 (0.0%) |
| 25 to 29 Years | 0 (0.0%) | 1 (3.7%) |
| 30 to 34 Years | 1 (4.2%) | 8 (29.6%) |
| 35 to 39 Years | 6 (25.0%) | 0 (0.0%) |
| 40 to 44 Years | 0 (0.0%) | 0 (0.0%) |
| 45 to 49 Years | 2 (8.3%) | 2 (7.4%) |
| 50 to 54 Years | 1 (4.2%) | 2 (7.4%) |
| 55 to 59 Years | 0 (0.0%) | 1 (3.7%) |
| 60 to 64 Years | 1 (4.2%) | 0 (0.0%) |
| 65 to 69 Years | 1 (4.2%) | 0 (0.0%) |
| 70 to 74 Years | 0 (0.0%) | 1 (3.7%) |
| 75 to 79 Years | 0 (0.0%) | 2 (7.4%) |
| 80 to 84 Years | 1 (4.2%) | 0 (0.0%) |
| 85 Years and over | 1 (4.2%) | 1 (3.7%) |
| Total | 24 (100.0%) | 27 (100.0%) |
Families and Households in Berlin
Median Family Size in Berlin
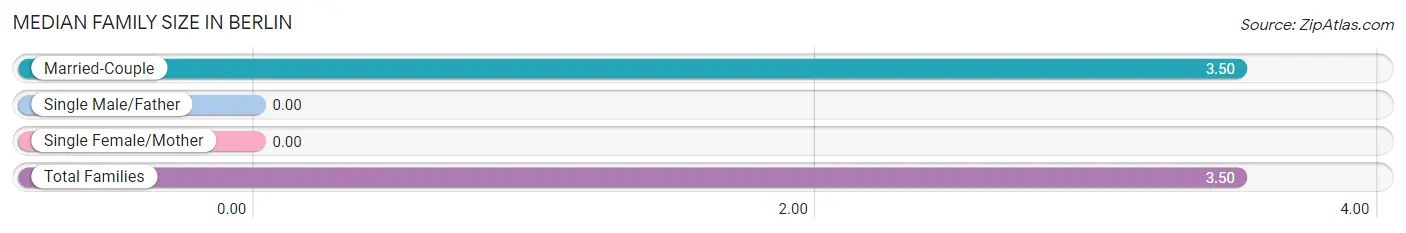
| Family Type | # Families | Family Size |
| Married-Couple | 14 (100.0%) | 3.50 |
| Single Male/Father | 0 (0.0%) | - |
| Single Female/Mother | 0 (0.0%) | - |
| Total Families | 14 (100.0%) | 3.50 |
Median Household Size in Berlin
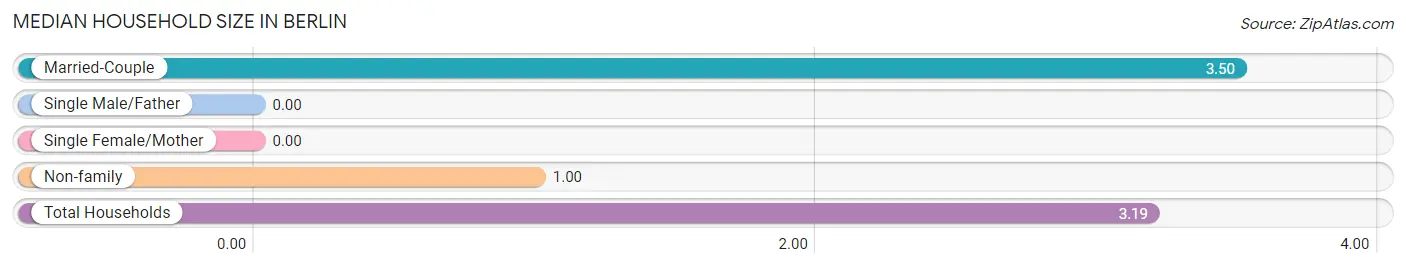
| Household Type | # Households | Household Size |
| Married-Couple | 14 (87.5%) | 3.50 |
| Single Male/Father | 0 (0.0%) | - |
| Single Female/Mother | 0 (0.0%) | - |
| Non-family | 2 (12.5%) | 1.00 |
| Total Households | 16 (100.0%) | 3.19 |
Household Size by Marriage Status in Berlin
Out of a total of 16 households in Berlin, 14 (87.5%) are family households, while 2 (12.5%) are nonfamily households. The most numerous type of family households are 5-person households, comprising 7, and the most common type of nonfamily households are 1-person households, comprising 2.
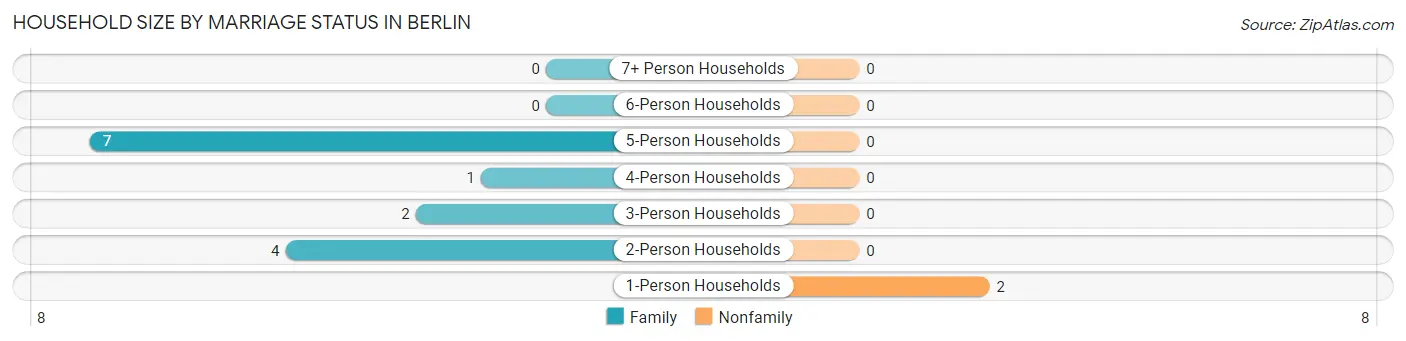
| Household Size | Family Households | Nonfamily Households |
| 1-Person Households | - | 2 (12.5%) |
| 2-Person Households | 4 (25.0%) | 0 (0.0%) |
| 3-Person Households | 2 (12.5%) | 0 (0.0%) |
| 4-Person Households | 1 (6.2%) | 0 (0.0%) |
| 5-Person Households | 7 (43.8%) | 0 (0.0%) |
| 6-Person Households | 0 (0.0%) | 0 (0.0%) |
| 7+ Person Households | 0 (0.0%) | 0 (0.0%) |
| Total | 14 (87.5%) | 2 (12.5%) |
Female Fertility in Berlin
Fertility by Age in Berlin
Average fertility rate in Berlin is 91.0 births per 1,000 women. Women in the age bracket of 20 to 34 years have the highest fertility rate with 111.0 births per 1,000 women. Women in the age bracket of 20 to 34 years acount for 100.0% of all women with births.
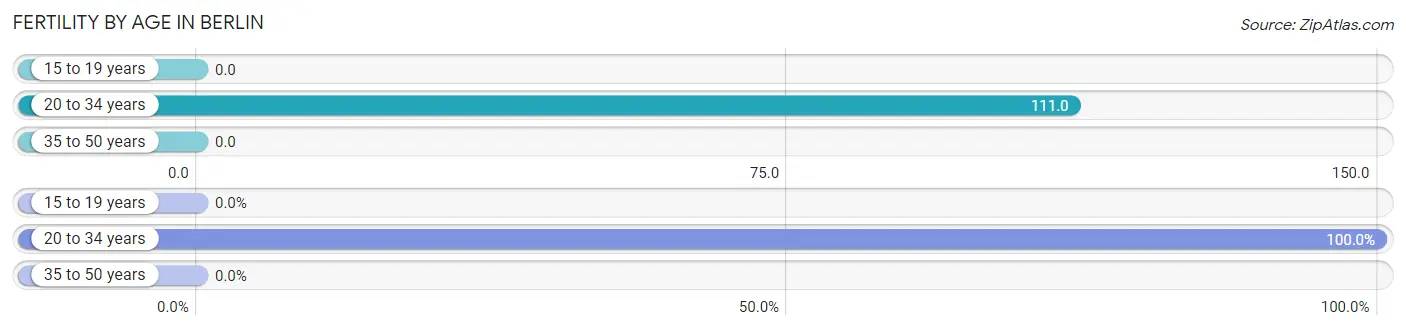
| Age Bracket | Women with Births | Births / 1,000 Women |
| 15 to 19 years | 0 (0.0%) | 0.0 |
| 20 to 34 years | 1 (100.0%) | 111.0 |
| 35 to 50 years | 0 (0.0%) | 0.0 |
| Total | 1 (100.0%) | 91.0 |
Fertility by Age by Marriage Status in Berlin
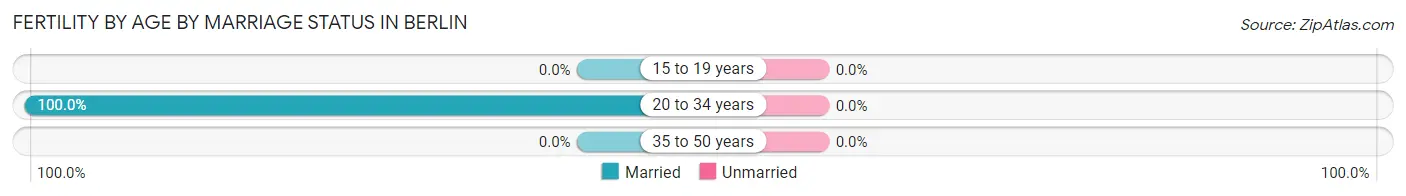
| Age Bracket | Married | Unmarried |
| 15 to 19 years | 0 (0.0%) | 0 (0.0%) |
| 20 to 34 years | 1 (100.0%) | 0 (0.0%) |
| 35 to 50 years | 0 (0.0%) | 0 (0.0%) |
| Total | 1 (100.0%) | 0 (0.0%) |
Fertility by Education in Berlin
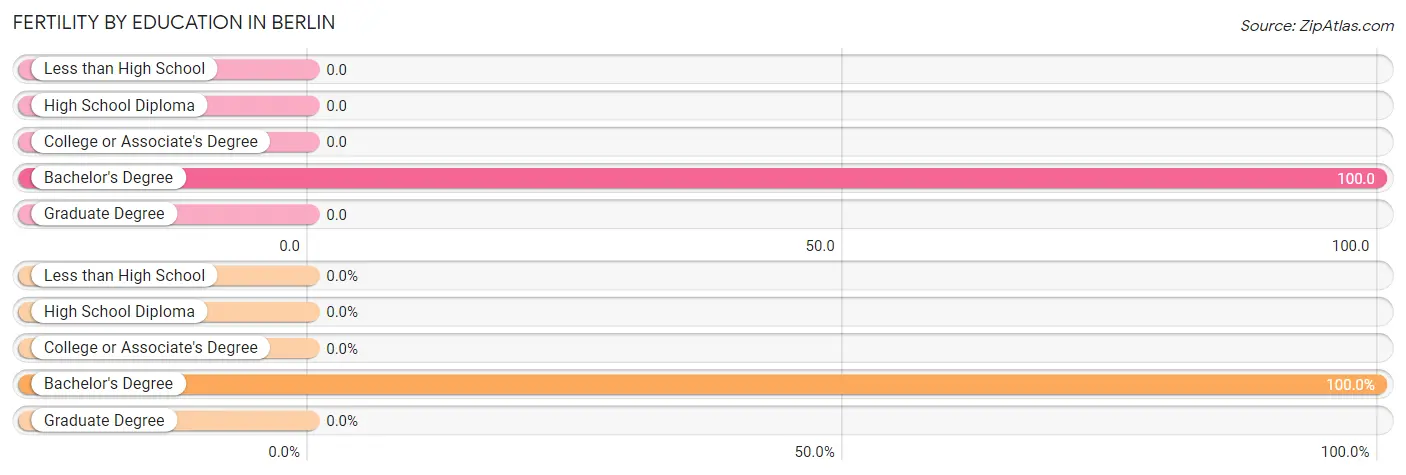
| Educational Attainment | Women with Births | Births / 1,000 Women |
| Less than High School | 0 (0.0%) | 0.0 |
| High School Diploma | 0 (0.0%) | 0.0 |
| College or Associate's Degree | 0 (0.0%) | 0.0 |
| Bachelor's Degree | 1 (100.0%) | 100.0 |
| Graduate Degree | 0 (0.0%) | 0.0 |
| Total | 1 (100.0%) | 91.0 |
Fertility by Education by Marriage Status in Berlin
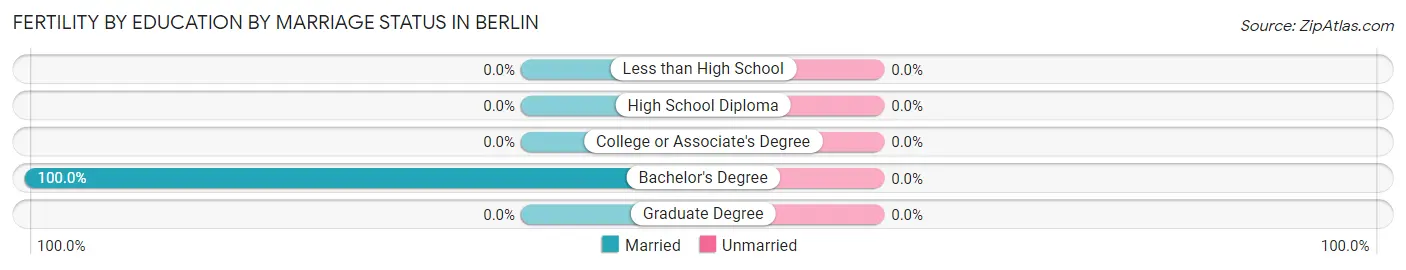
| Educational Attainment | Married | Unmarried |
| Less than High School | 0 (0.0%) | 0 (0.0%) |
| High School Diploma | 0 (0.0%) | 0 (0.0%) |
| College or Associate's Degree | 0 (0.0%) | 0 (0.0%) |
| Bachelor's Degree | 1 (100.0%) | 0 (0.0%) |
| Graduate Degree | 0 (0.0%) | 0 (0.0%) |
| Total | 1 (100.0%) | 0 (0.0%) |
Employment Characteristics in Berlin
Employment by Class of Employer in Berlin
Among the 25 employed individuals in Berlin, private company employees (22 | 88.0%), not-for-profit organizations (2 | 8.0%), and local government employees (1 | 4.0%) make up the most common classes of employment.
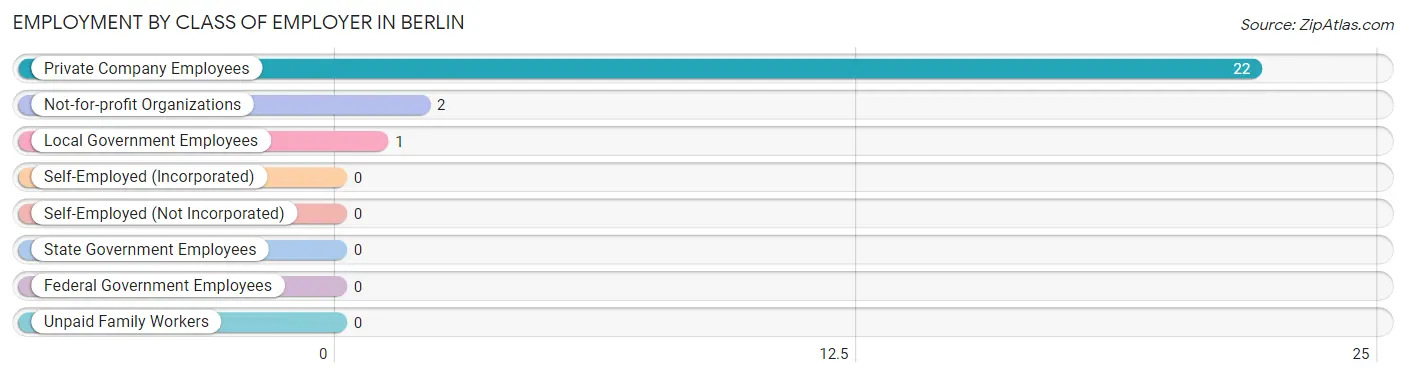
| Employer Class | # Employees | % Employees |
| Private Company Employees | 22 | 88.0% |
| Self-Employed (Incorporated) | 0 | 0.0% |
| Self-Employed (Not Incorporated) | 0 | 0.0% |
| Not-for-profit Organizations | 2 | 8.0% |
| Local Government Employees | 1 | 4.0% |
| State Government Employees | 0 | 0.0% |
| Federal Government Employees | 0 | 0.0% |
| Unpaid Family Workers | 0 | 0.0% |
| Total | 25 | 100.0% |
Employment Status by Age in Berlin
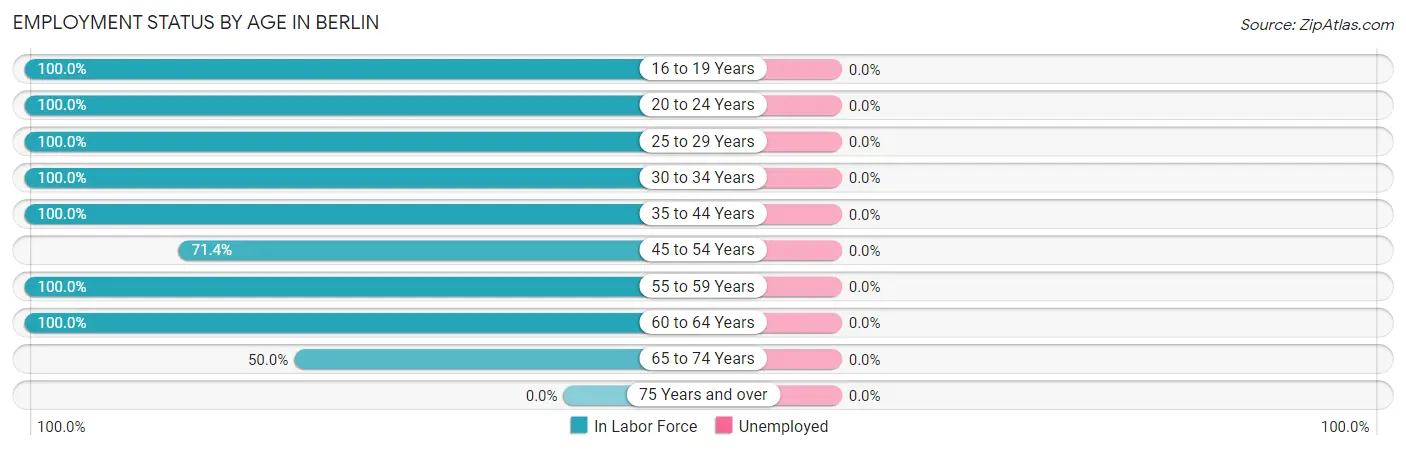
| Age Bracket | In Labor Force | Unemployed |
| 16 to 19 Years | 1 (100.0%) | 0 (0.0%) |
| 20 to 24 Years | 3 (100.0%) | 0 (0.0%) |
| 25 to 29 Years | 1 (100.0%) | 0 (0.0%) |
| 30 to 34 Years | 9 (100.0%) | 0 (0.0%) |
| 35 to 44 Years | 6 (100.0%) | 0 (0.0%) |
| 45 to 54 Years | 5 (71.4%) | 0 (0.0%) |
| 55 to 59 Years | 1 (100.0%) | 0 (0.0%) |
| 60 to 64 Years | 1 (100.0%) | 0 (0.0%) |
| 65 to 74 Years | 1 (50.0%) | 0 (0.0%) |
| 75 Years and over | 0 (0.0%) | 0 (0.0%) |
| Total | 28 (77.8%) | 0 (0.0%) |
Employment Status by Educational Attainment in Berlin
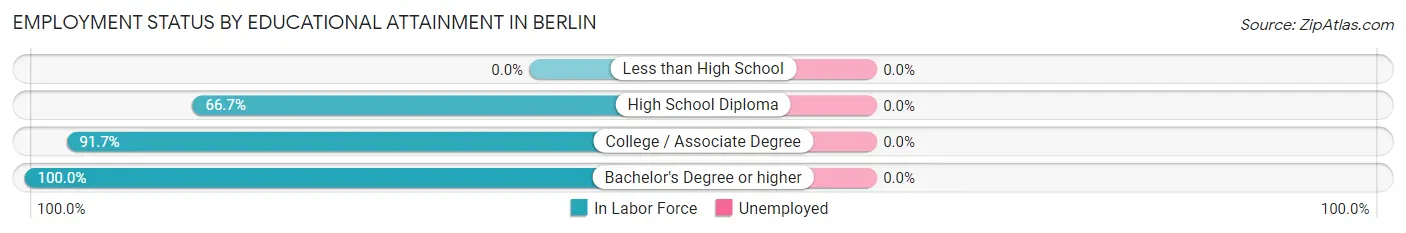
| Educational Attainment | In Labor Force | Unemployed |
| Less than High School | 0 (0.0%) | 0 (0.0%) |
| High School Diploma | 2 (66.7%) | 0 (0.0%) |
| College / Associate Degree | 11 (91.7%) | 0 (0.0%) |
| Bachelor's Degree or higher | 10 (100.0%) | 0 (0.0%) |
| Total | 23 (92.0%) | 0 (0.0%) |
Employment Occupations by Sex in Berlin
Management, Business, Science and Arts Occupations
The most common Management, Business, Science and Arts occupations in Berlin are Health Diagnosing & Treating (8 | 28.6%), Health Technologists (8 | 28.6%), Computers, Engineering & Science (1 | 3.6%), Computers & Mathematics (1 | 3.6%), and Community & Social Service (1 | 3.6%).
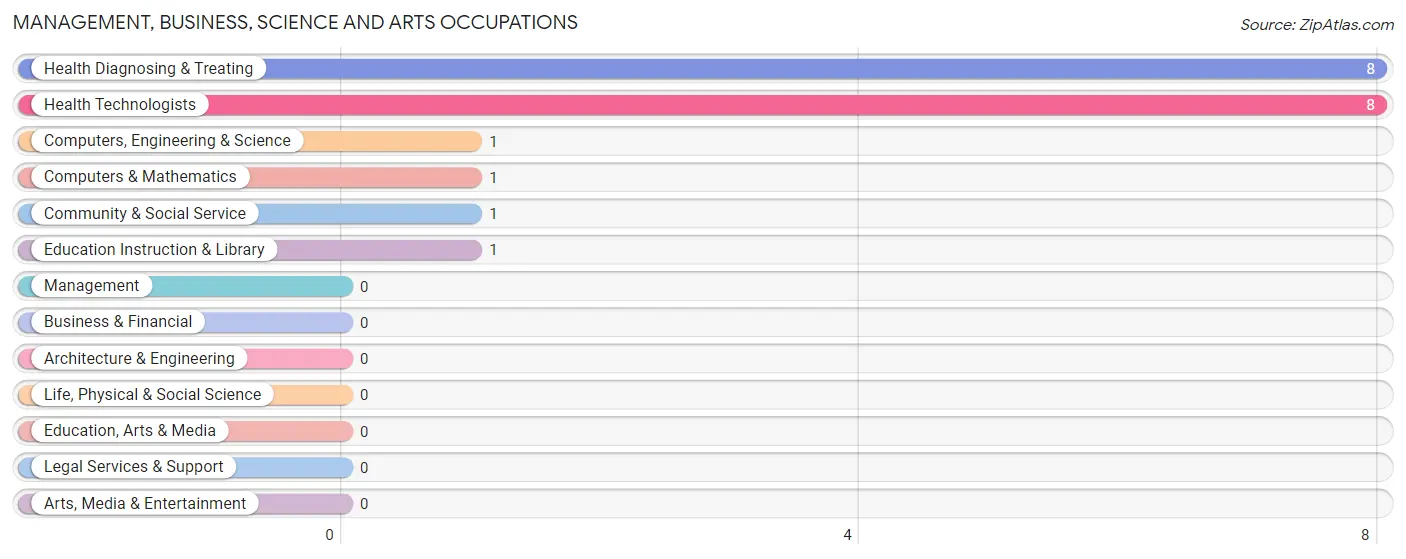
Management, Business, Science and Arts Occupations by Sex
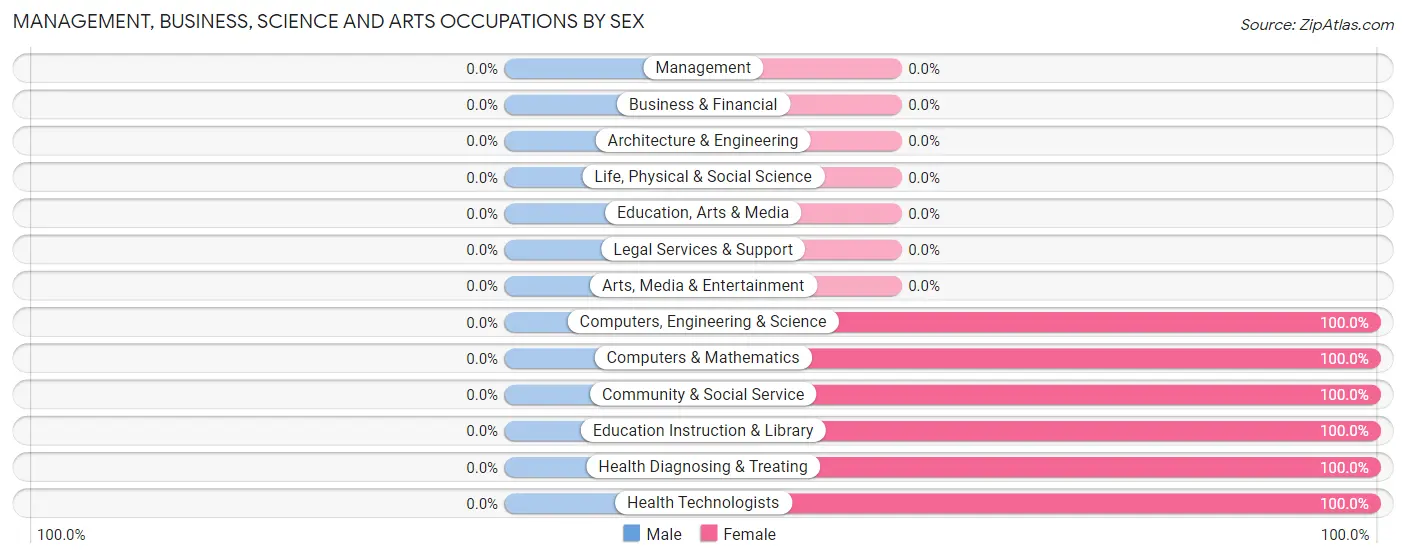
| Occupation | Male | Female |
| Management | 0 (0.0%) | 0 (0.0%) |
| Business & Financial | 0 (0.0%) | 0 (0.0%) |
| Computers, Engineering & Science | 0 (0.0%) | 1 (100.0%) |
| Computers & Mathematics | 0 (0.0%) | 1 (100.0%) |
| Architecture & Engineering | 0 (0.0%) | 0 (0.0%) |
| Life, Physical & Social Science | 0 (0.0%) | 0 (0.0%) |
| Community & Social Service | 0 (0.0%) | 1 (100.0%) |
| Education, Arts & Media | 0 (0.0%) | 0 (0.0%) |
| Legal Services & Support | 0 (0.0%) | 0 (0.0%) |
| Education Instruction & Library | 0 (0.0%) | 1 (100.0%) |
| Arts, Media & Entertainment | 0 (0.0%) | 0 (0.0%) |
| Health Diagnosing & Treating | 0 (0.0%) | 8 (100.0%) |
| Health Technologists | 0 (0.0%) | 8 (100.0%) |
| Total (Category) | 0 (0.0%) | 10 (100.0%) |
| Total (Overall) | 15 (53.6%) | 13 (46.4%) |
Services Occupations
The most common Services occupations in Berlin are , and Cleaning & Maintenance (3 | 10.7%).
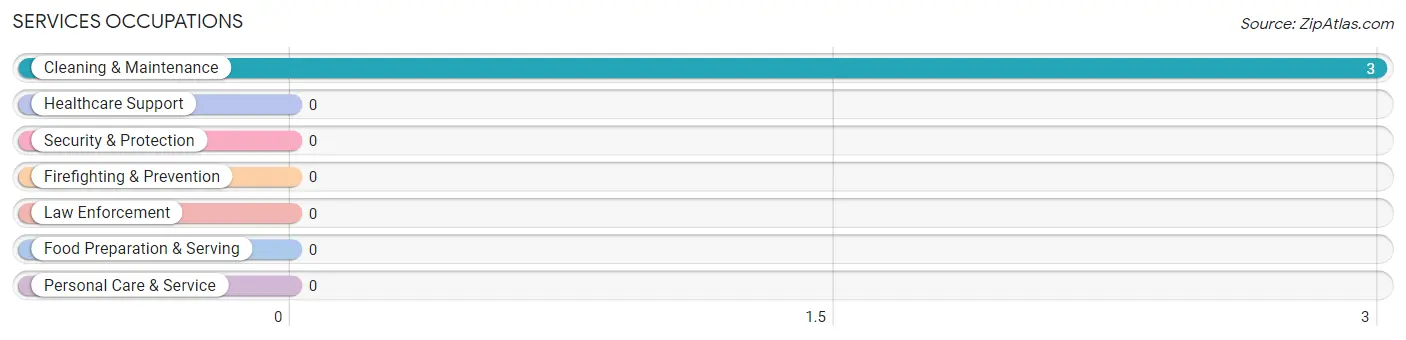
Services Occupations by Sex
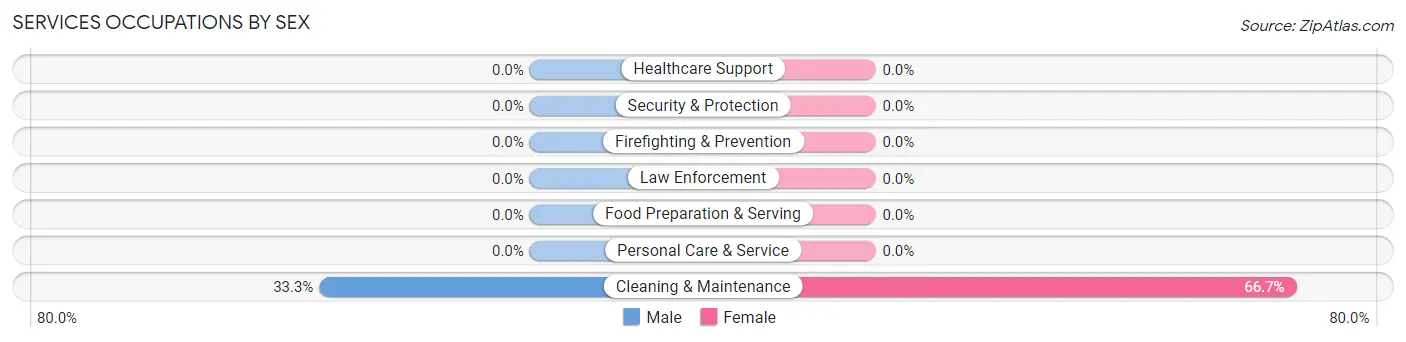
| Occupation | Male | Female |
| Healthcare Support | 0 (0.0%) | 0 (0.0%) |
| Security & Protection | 0 (0.0%) | 0 (0.0%) |
| Firefighting & Prevention | 0 (0.0%) | 0 (0.0%) |
| Law Enforcement | 0 (0.0%) | 0 (0.0%) |
| Food Preparation & Serving | 0 (0.0%) | 0 (0.0%) |
| Cleaning & Maintenance | 1 (33.3%) | 2 (66.7%) |
| Personal Care & Service | 0 (0.0%) | 0 (0.0%) |
| Total (Category) | 1 (33.3%) | 2 (66.7%) |
| Total (Overall) | 15 (53.6%) | 13 (46.4%) |
Sales and Office Occupations
The most common Sales and Office occupations in Berlin are Office & Administration (3 | 10.7%), and Sales & Related (1 | 3.6%).
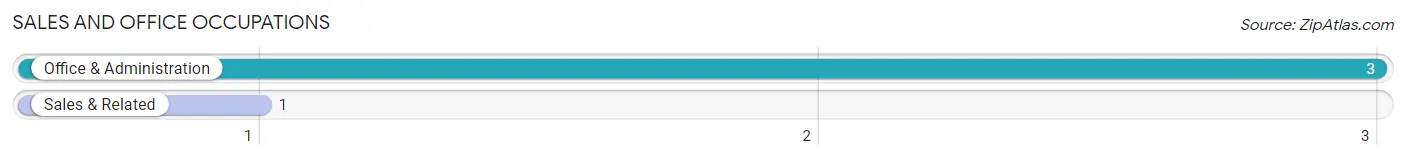
Sales and Office Occupations by Sex

| Occupation | Male | Female |
| Sales & Related | 1 (100.0%) | 0 (0.0%) |
| Office & Administration | 2 (66.7%) | 1 (33.3%) |
| Total (Category) | 3 (75.0%) | 1 (25.0%) |
| Total (Overall) | 15 (53.6%) | 13 (46.4%) |
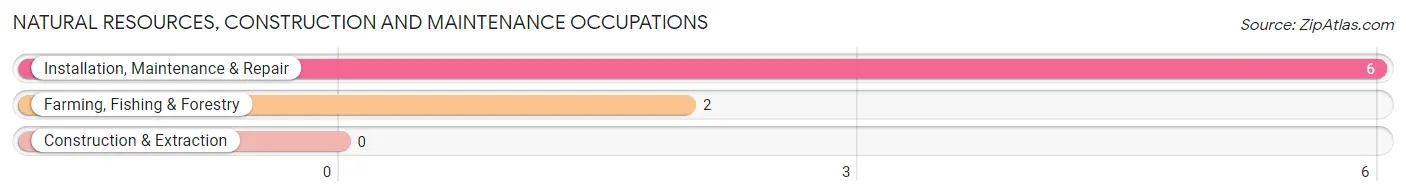
Natural Resources, Construction and Maintenance Occupations
The most common Natural Resources, Construction and Maintenance occupations in Berlin are Installation, Maintenance & Repair (6 | 21.4%), and Farming, Fishing & Forestry (2 | 7.1%).
Natural Resources, Construction and Maintenance Occupations by Sex
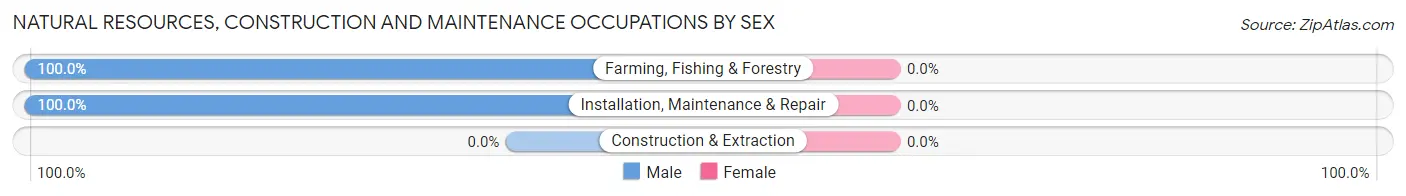
| Occupation | Male | Female |
| Farming, Fishing & Forestry | 2 (100.0%) | 0 (0.0%) |
| Construction & Extraction | 0 (0.0%) | 0 (0.0%) |
| Installation, Maintenance & Repair | 6 (100.0%) | 0 (0.0%) |
| Total (Category) | 8 (100.0%) | 0 (0.0%) |
| Total (Overall) | 15 (53.6%) | 13 (46.4%) |
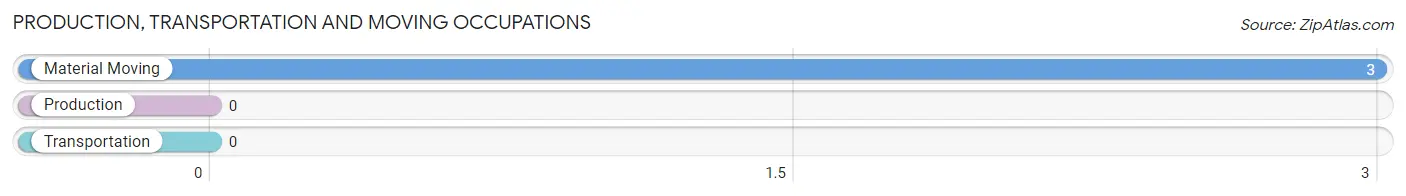
Production, Transportation and Moving Occupations
The most common Production, Transportation and Moving occupations in Berlin are , and Material Moving (3 | 10.7%).
Production, Transportation and Moving Occupations by Sex
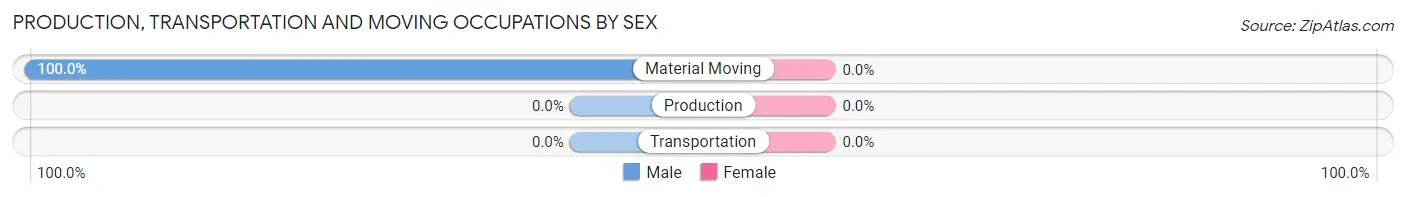
| Occupation | Male | Female |
| Production | 0 (0.0%) | 0 (0.0%) |
| Transportation | 0 (0.0%) | 0 (0.0%) |
| Material Moving | 3 (100.0%) | 0 (0.0%) |
| Total (Category) | 3 (100.0%) | 0 (0.0%) |
| Total (Overall) | 15 (53.6%) | 13 (46.4%) |
Employment Industries by Sex in Berlin
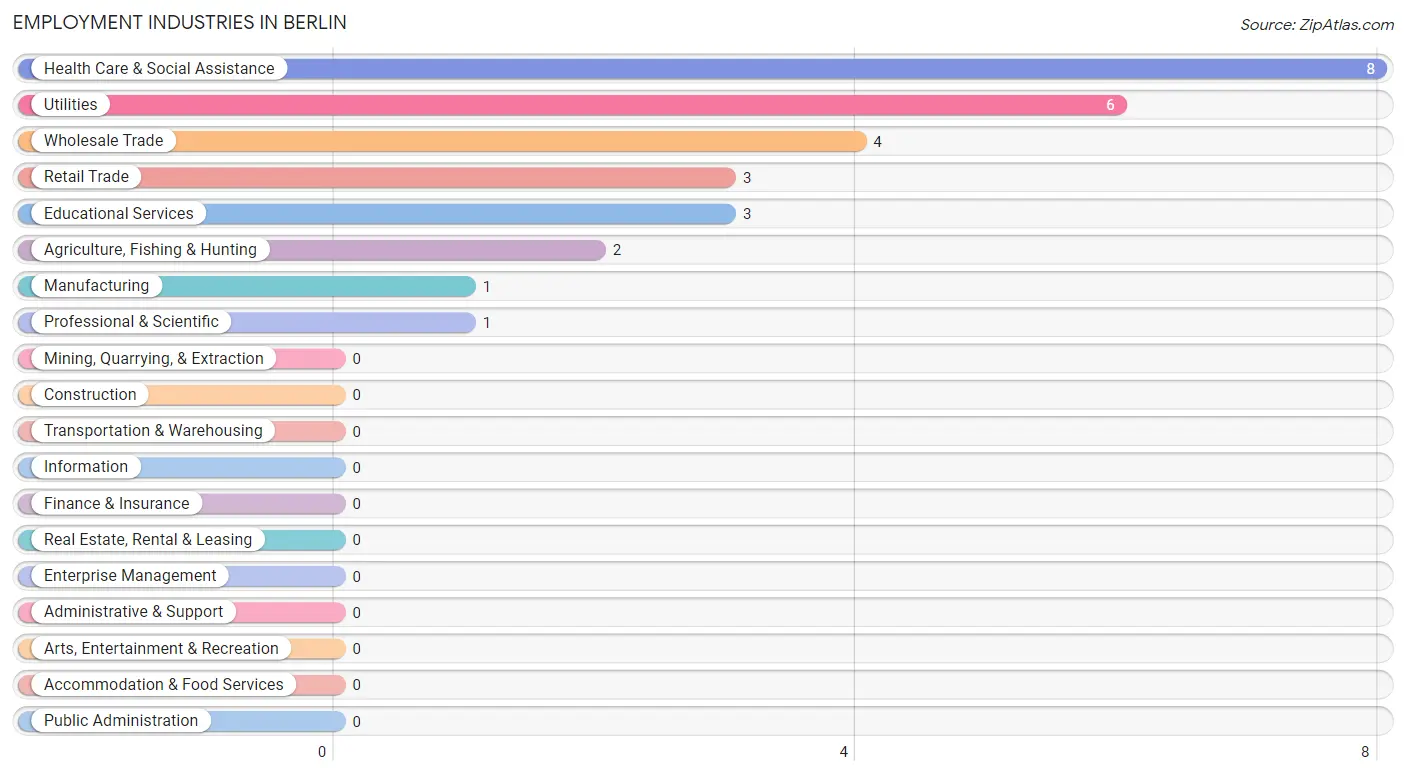
Employment Industries in Berlin
The major employment industries in Berlin include Health Care & Social Assistance (8 | 28.6%), Utilities (6 | 21.4%), Wholesale Trade (4 | 14.3%), Retail Trade (3 | 10.7%), and Educational Services (3 | 10.7%).
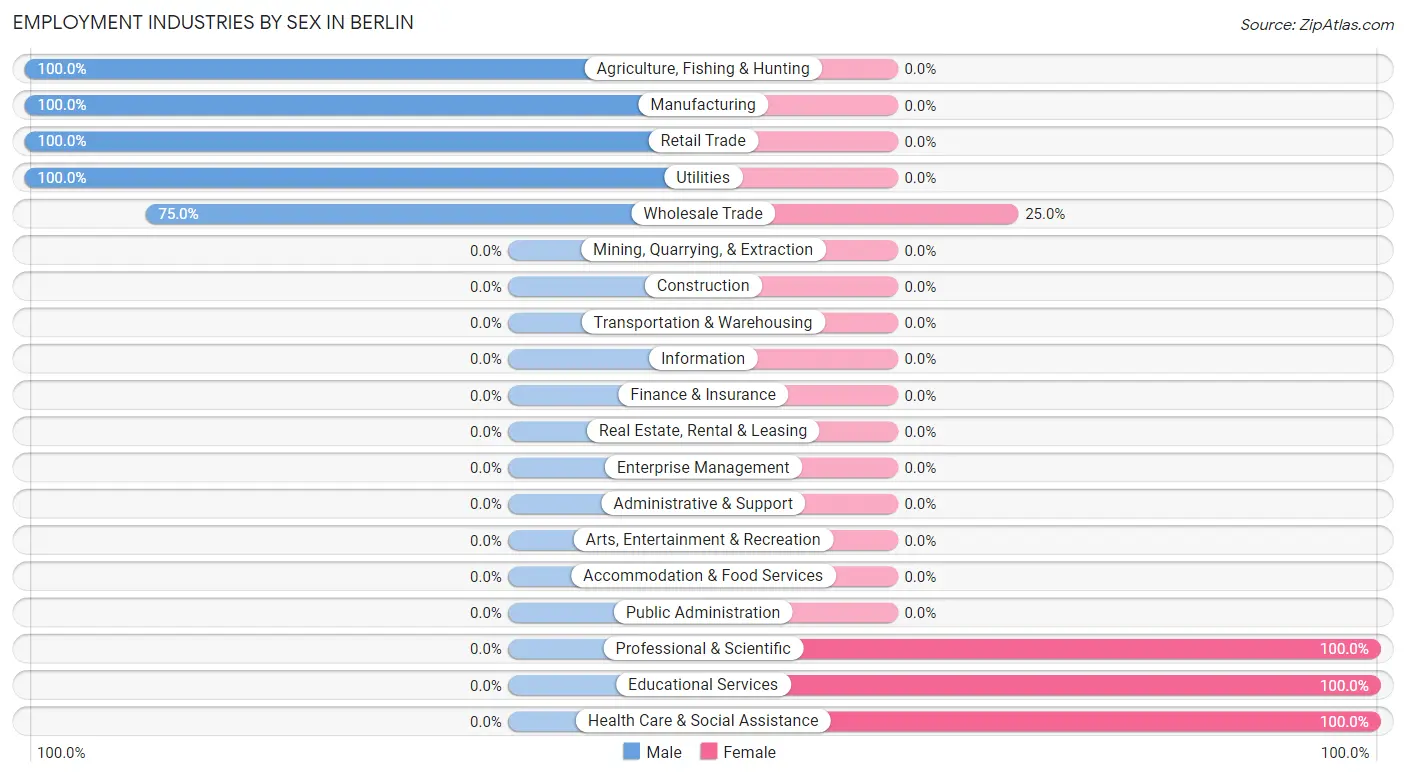
Employment Industries by Sex in Berlin
The Berlin industries that see more men than women are Agriculture, Fishing & Hunting (100.0%), Manufacturing (100.0%), and Retail Trade (100.0%), whereas the industries that tend to have a higher number of women are Professional & Scientific (100.0%), Educational Services (100.0%), and Health Care & Social Assistance (100.0%).
| Industry | Male | Female |
| Agriculture, Fishing & Hunting | 2 (100.0%) | 0 (0.0%) |
| Mining, Quarrying, & Extraction | 0 (0.0%) | 0 (0.0%) |
| Construction | 0 (0.0%) | 0 (0.0%) |
| Manufacturing | 1 (100.0%) | 0 (0.0%) |
| Wholesale Trade | 3 (75.0%) | 1 (25.0%) |
| Retail Trade | 3 (100.0%) | 0 (0.0%) |
| Transportation & Warehousing | 0 (0.0%) | 0 (0.0%) |
| Utilities | 6 (100.0%) | 0 (0.0%) |
| Information | 0 (0.0%) | 0 (0.0%) |
| Finance & Insurance | 0 (0.0%) | 0 (0.0%) |
| Real Estate, Rental & Leasing | 0 (0.0%) | 0 (0.0%) |
| Professional & Scientific | 0 (0.0%) | 1 (100.0%) |
| Enterprise Management | 0 (0.0%) | 0 (0.0%) |
| Administrative & Support | 0 (0.0%) | 0 (0.0%) |
| Educational Services | 0 (0.0%) | 3 (100.0%) |
| Health Care & Social Assistance | 0 (0.0%) | 8 (100.0%) |
| Arts, Entertainment & Recreation | 0 (0.0%) | 0 (0.0%) |
| Accommodation & Food Services | 0 (0.0%) | 0 (0.0%) |
| Public Administration | 0 (0.0%) | 0 (0.0%) |
| Total | 15 (53.6%) | 13 (46.4%) |
Education in Berlin
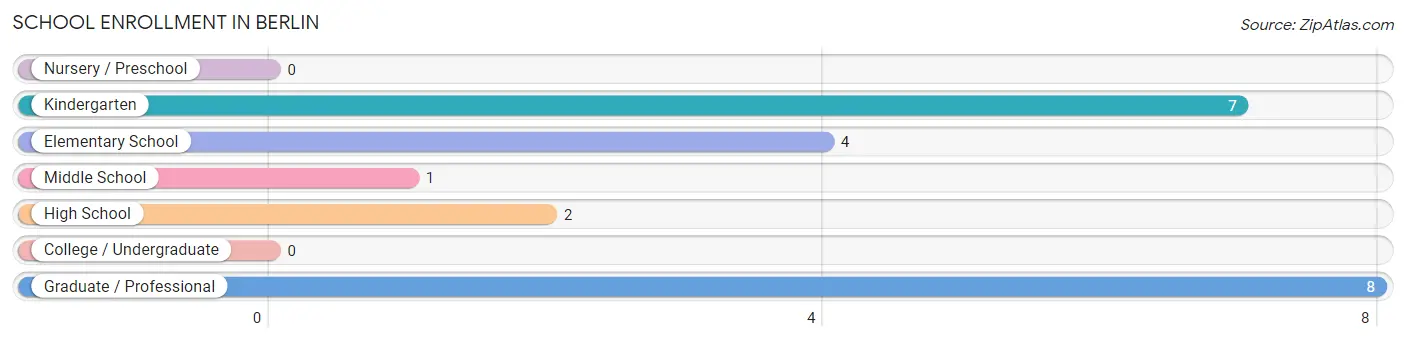
School Enrollment in Berlin
The most common levels of schooling among the 22 students in Berlin are graduate / professional (8 | 36.4%), kindergarten (7 | 31.8%), and elementary school (4 | 18.2%).
| School Level | # Students | % Students |
| Nursery / Preschool | 0 | 0.0% |
| Kindergarten | 7 | 31.8% |
| Elementary School | 4 | 18.2% |
| Middle School | 1 | 4.5% |
| High School | 2 | 9.1% |
| College / Undergraduate | 0 | 0.0% |
| Graduate / Professional | 8 | 36.4% |
| Total | 22 | 100.0% |
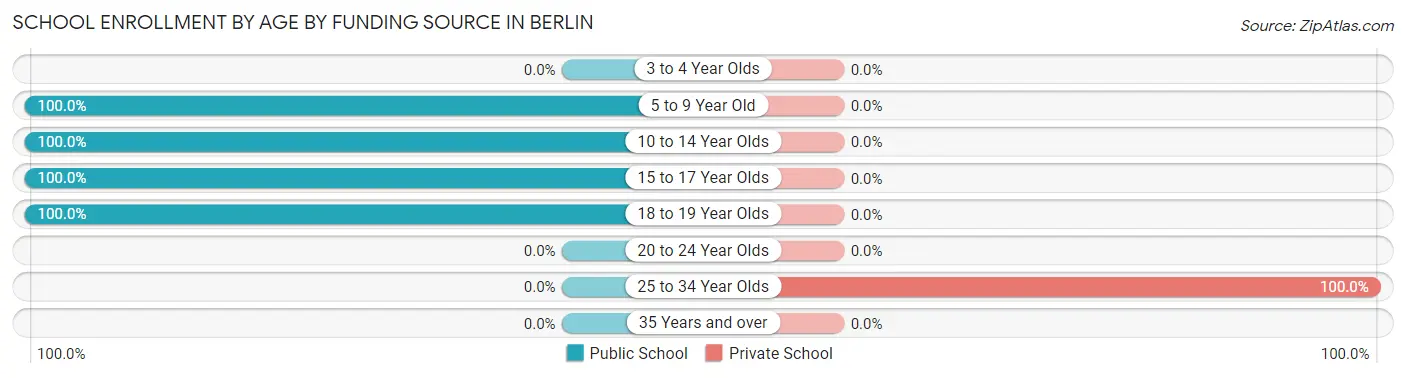
School Enrollment by Age by Funding Source in Berlin
Out of a total of 22 students who are enrolled in schools in Berlin, 8 (36.4%) attend a private institution, while the remaining 14 (63.6%) are enrolled in public schools. The age group of 25 to 34 year olds has the highest likelihood of being enrolled in private schools, with 8 (100.0% in the age bracket) enrolled. Conversely, the age group of 5 to 9 year old has the lowest likelihood of being enrolled in a private school, with 11 (100.0% in the age bracket) attending a public institution.
| Age Bracket | Public School | Private School |
| 3 to 4 Year Olds | 0 (0.0%) | 0 (0.0%) |
| 5 to 9 Year Old | 11 (100.0%) | 0 (0.0%) |
| 10 to 14 Year Olds | 1 (100.0%) | 0 (0.0%) |
| 15 to 17 Year Olds | 1 (100.0%) | 0 (0.0%) |
| 18 to 19 Year Olds | 1 (100.0%) | 0 (0.0%) |
| 20 to 24 Year Olds | 0 (0.0%) | 0 (0.0%) |
| 25 to 34 Year Olds | 0 (0.0%) | 8 (100.0%) |
| 35 Years and over | 0 (0.0%) | 0 (0.0%) |
| Total | 14 (63.6%) | 8 (36.4%) |
Educational Attainment by Field of Study in Berlin
Science & technology (8 | 80.0%), and business (2 | 20.0%) are the most common fields of study among 10 individuals in Berlin who have obtained a bachelor's degree or higher.
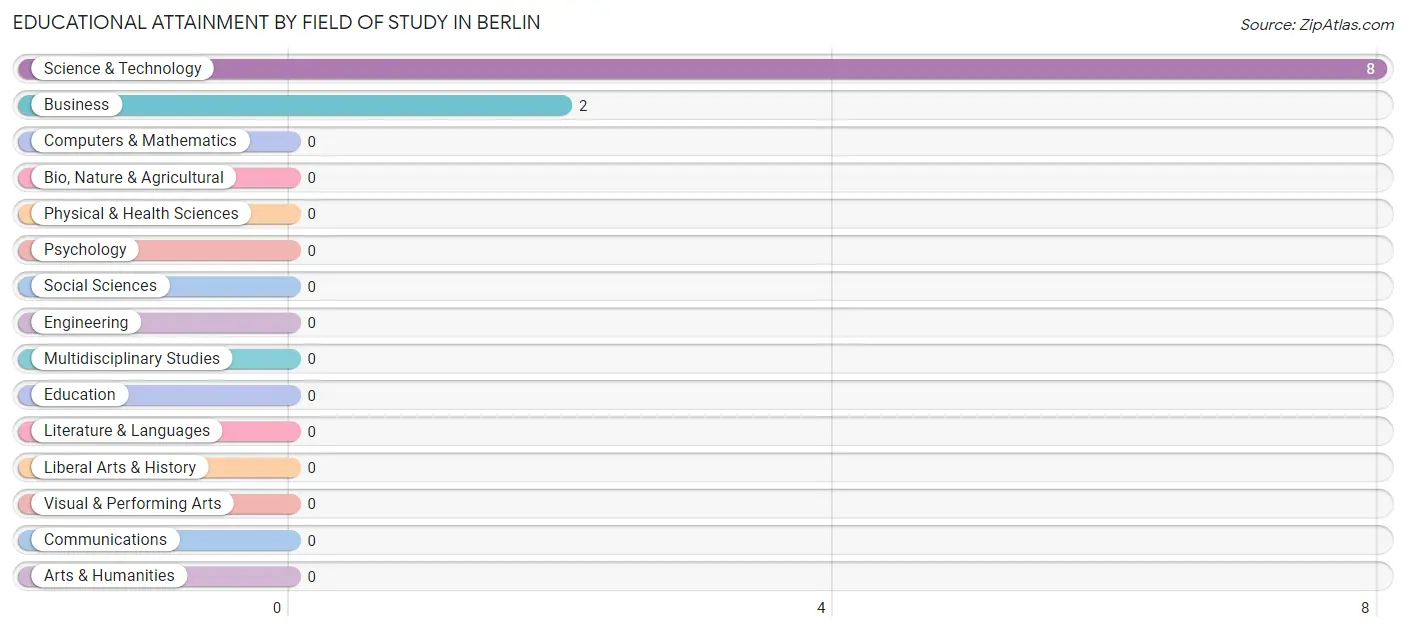
| Field of Study | # Graduates | % Graduates |
| Computers & Mathematics | 0 | 0.0% |
| Bio, Nature & Agricultural | 0 | 0.0% |
| Physical & Health Sciences | 0 | 0.0% |
| Psychology | 0 | 0.0% |
| Social Sciences | 0 | 0.0% |
| Engineering | 0 | 0.0% |
| Multidisciplinary Studies | 0 | 0.0% |
| Science & Technology | 8 | 80.0% |
| Business | 2 | 20.0% |
| Education | 0 | 0.0% |
| Literature & Languages | 0 | 0.0% |
| Liberal Arts & History | 0 | 0.0% |
| Visual & Performing Arts | 0 | 0.0% |
| Communications | 0 | 0.0% |
| Arts & Humanities | 0 | 0.0% |
| Total | 10 | 100.0% |
Transportation & Commute in Berlin
Vehicle Availability by Sex in Berlin
The most prevalent vehicle ownership categories in Berlin are males with 3 vehicles (8, accounting for 66.7%) and females with 3 vehicles (10, making up 61.5%).
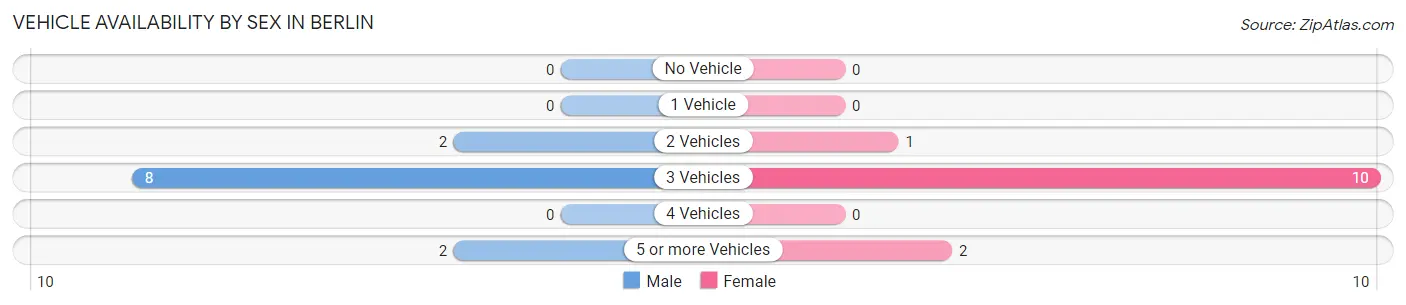
| Vehicles Available | Male | Female |
| No Vehicle | 0 (0.0%) | 0 (0.0%) |
| 1 Vehicle | 0 (0.0%) | 0 (0.0%) |
| 2 Vehicles | 2 (16.7%) | 1 (7.7%) |
| 3 Vehicles | 8 (66.7%) | 10 (76.9%) |
| 4 Vehicles | 0 (0.0%) | 0 (0.0%) |
| 5 or more Vehicles | 2 (16.7%) | 2 (15.4%) |
| Total | 12 (100.0%) | 13 (100.0%) |
Commute Time in Berlin
The most frequently occuring commute durations in Berlin are 10 to 14 minutes (9 commuters, 36.0%), 45 to 59 minutes (8 commuters, 32.0%), and 15 to 19 minutes (2 commuters, 8.0%).
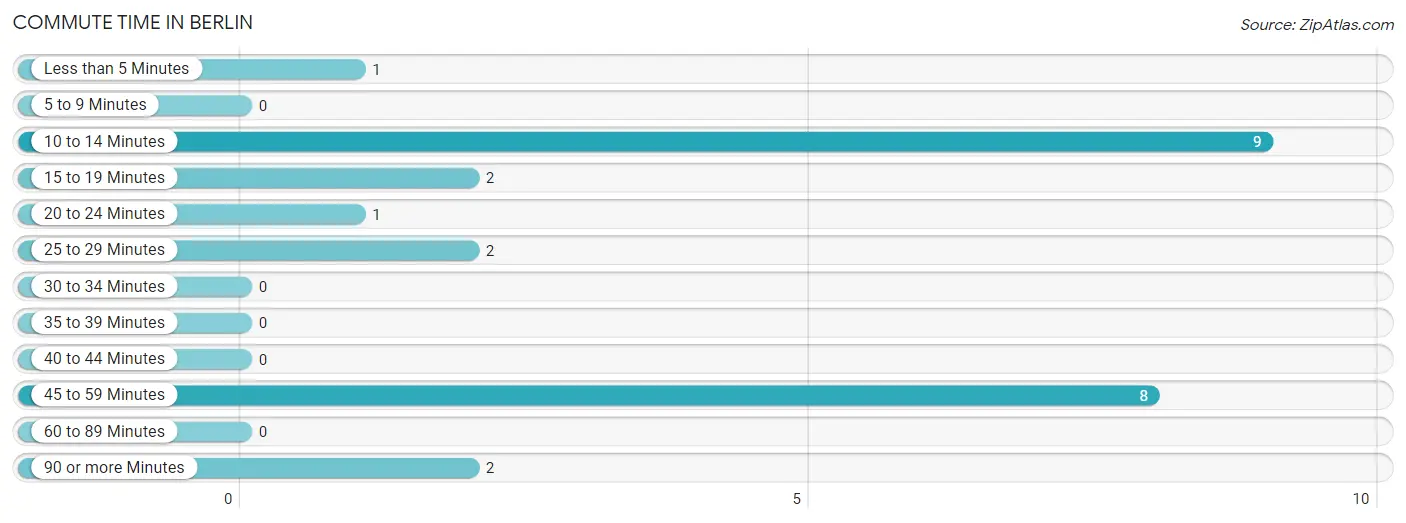
| Commute Time | # Commuters | % Commuters |
| Less than 5 Minutes | 1 | 4.0% |
| 5 to 9 Minutes | 0 | 0.0% |
| 10 to 14 Minutes | 9 | 36.0% |
| 15 to 19 Minutes | 2 | 8.0% |
| 20 to 24 Minutes | 1 | 4.0% |
| 25 to 29 Minutes | 2 | 8.0% |
| 30 to 34 Minutes | 0 | 0.0% |
| 35 to 39 Minutes | 0 | 0.0% |
| 40 to 44 Minutes | 0 | 0.0% |
| 45 to 59 Minutes | 8 | 32.0% |
| 60 to 89 Minutes | 0 | 0.0% |
| 90 or more Minutes | 2 | 8.0% |
Commute Time by Sex in Berlin
The most common commute times in Berlin are 45 to 59 minutes (8 commuters, 66.7%) for males and 10 to 14 minutes (9 commuters, 69.2%) for females.
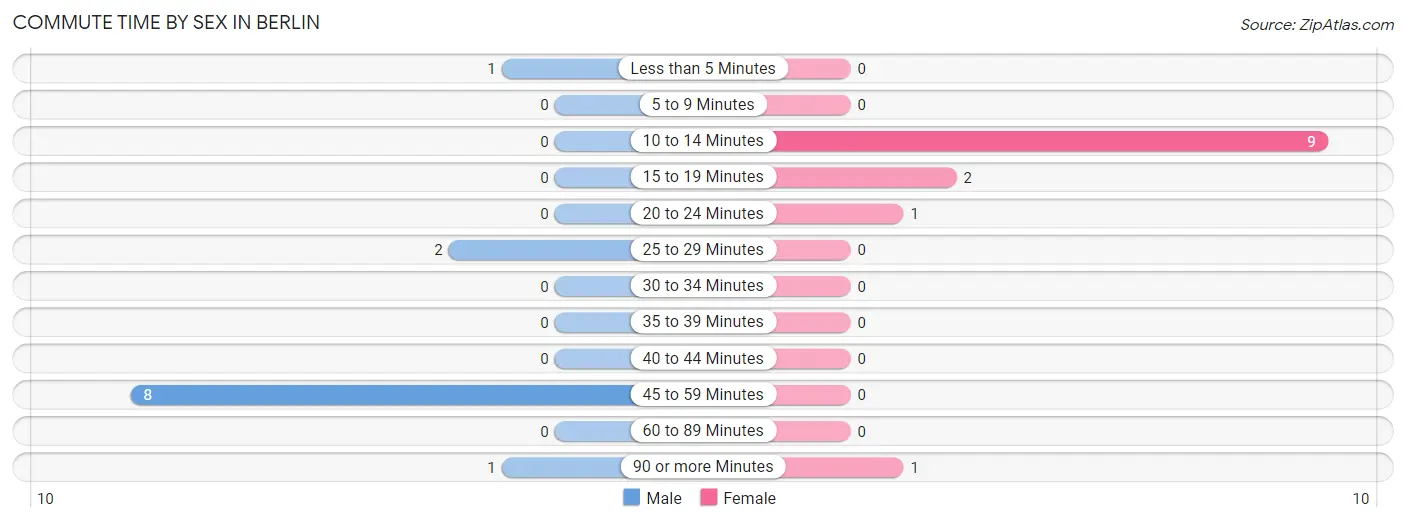
| Commute Time | Male | Female |
| Less than 5 Minutes | 1 (8.3%) | 0 (0.0%) |
| 5 to 9 Minutes | 0 (0.0%) | 0 (0.0%) |
| 10 to 14 Minutes | 0 (0.0%) | 9 (69.2%) |
| 15 to 19 Minutes | 0 (0.0%) | 2 (15.4%) |
| 20 to 24 Minutes | 0 (0.0%) | 1 (7.7%) |
| 25 to 29 Minutes | 2 (16.7%) | 0 (0.0%) |
| 30 to 34 Minutes | 0 (0.0%) | 0 (0.0%) |
| 35 to 39 Minutes | 0 (0.0%) | 0 (0.0%) |
| 40 to 44 Minutes | 0 (0.0%) | 0 (0.0%) |
| 45 to 59 Minutes | 8 (66.7%) | 0 (0.0%) |
| 60 to 89 Minutes | 0 (0.0%) | 0 (0.0%) |
| 90 or more Minutes | 1 (8.3%) | 1 (7.7%) |
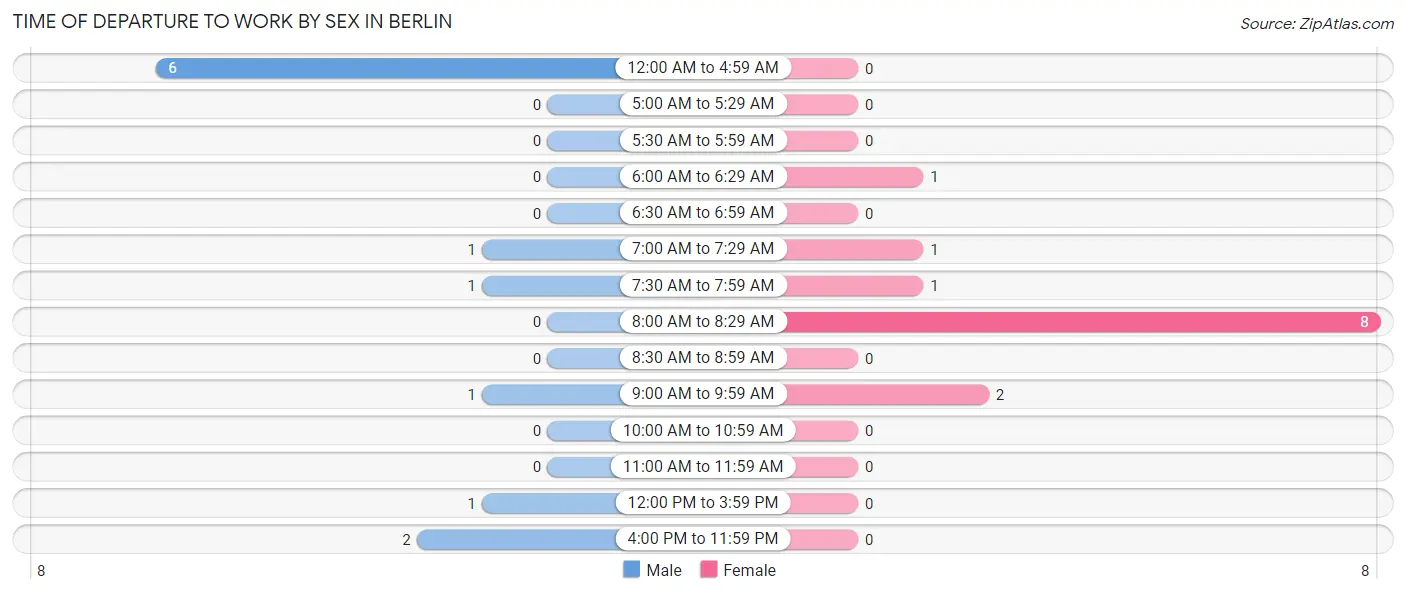
Time of Departure to Work by Sex in Berlin
The most frequent times of departure to work in Berlin are 12:00 AM to 4:59 AM (6, 50.0%) for males and 8:00 AM to 8:29 AM (8, 61.5%) for females.
| Time of Departure | Male | Female |
| 12:00 AM to 4:59 AM | 6 (50.0%) | 0 (0.0%) |
| 5:00 AM to 5:29 AM | 0 (0.0%) | 0 (0.0%) |
| 5:30 AM to 5:59 AM | 0 (0.0%) | 0 (0.0%) |
| 6:00 AM to 6:29 AM | 0 (0.0%) | 1 (7.7%) |
| 6:30 AM to 6:59 AM | 0 (0.0%) | 0 (0.0%) |
| 7:00 AM to 7:29 AM | 1 (8.3%) | 1 (7.7%) |
| 7:30 AM to 7:59 AM | 1 (8.3%) | 1 (7.7%) |
| 8:00 AM to 8:29 AM | 0 (0.0%) | 8 (61.5%) |
| 8:30 AM to 8:59 AM | 0 (0.0%) | 0 (0.0%) |
| 9:00 AM to 9:59 AM | 1 (8.3%) | 2 (15.4%) |
| 10:00 AM to 10:59 AM | 0 (0.0%) | 0 (0.0%) |
| 11:00 AM to 11:59 AM | 0 (0.0%) | 0 (0.0%) |
| 12:00 PM to 3:59 PM | 1 (8.3%) | 0 (0.0%) |
| 4:00 PM to 11:59 PM | 2 (16.7%) | 0 (0.0%) |
| Total | 12 (100.0%) | 13 (100.0%) |
Housing Occupancy in Berlin
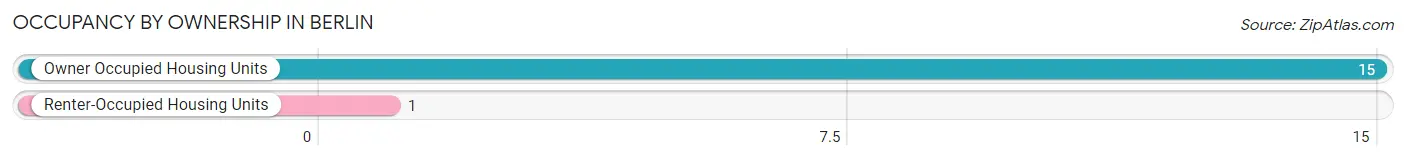
Occupancy by Ownership in Berlin
Of the total 16 dwellings in Berlin, owner-occupied units account for 15 (93.8%), while renter-occupied units make up 1 (6.2%).
| Occupancy | # Housing Units | % Housing Units |
| Owner Occupied Housing Units | 15 | 93.8% |
| Renter-Occupied Housing Units | 1 | 6.2% |
| Total Occupied Housing Units | 16 | 100.0% |
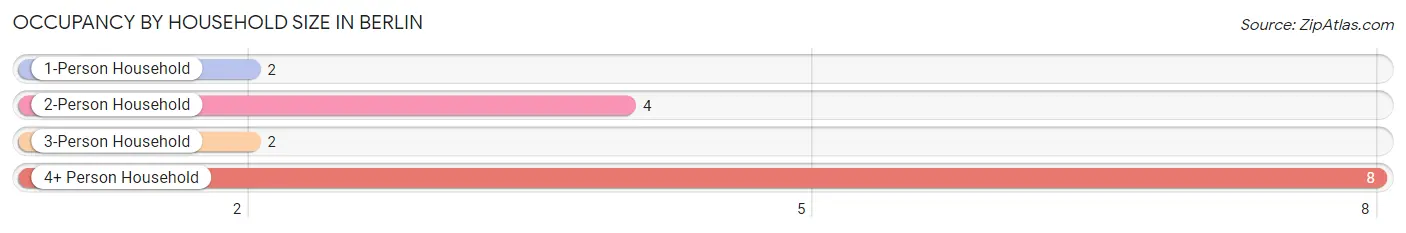
Occupancy by Household Size in Berlin
| Household Size | # Housing Units | % Housing Units |
| 1-Person Household | 2 | 12.5% |
| 2-Person Household | 4 | 25.0% |
| 3-Person Household | 2 | 12.5% |
| 4+ Person Household | 8 | 50.0% |
| Total Housing Units | 16 | 100.0% |
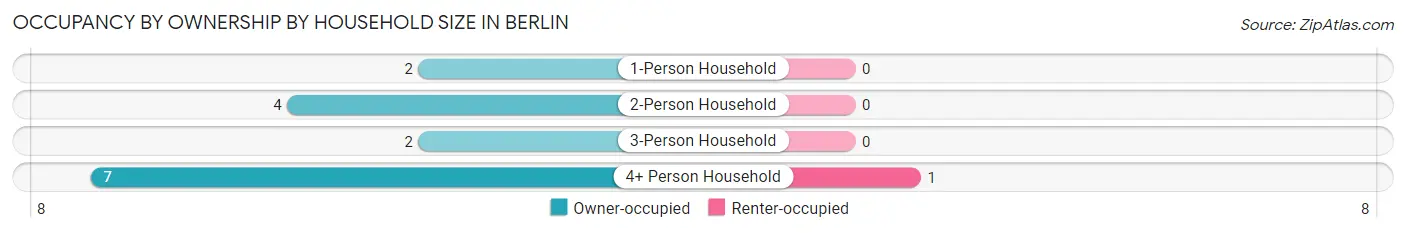
Occupancy by Ownership by Household Size in Berlin
| Household Size | Owner-occupied | Renter-occupied |
| 1-Person Household | 2 (100.0%) | 0 (0.0%) |
| 2-Person Household | 4 (100.0%) | 0 (0.0%) |
| 3-Person Household | 2 (100.0%) | 0 (0.0%) |
| 4+ Person Household | 7 (87.5%) | 1 (12.5%) |
| Total Housing Units | 15 (93.8%) | 1 (6.2%) |
Occupancy by Educational Attainment in Berlin
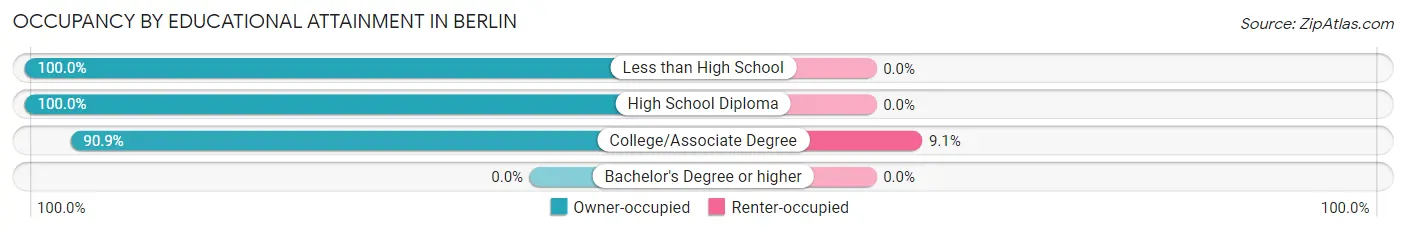
| Household Size | Owner-occupied | Renter-occupied |
| Less than High School | 2 (100.0%) | 0 (0.0%) |
| High School Diploma | 3 (100.0%) | 0 (0.0%) |
| College/Associate Degree | 10 (90.9%) | 1 (9.1%) |
| Bachelor's Degree or higher | 0 (0.0%) | 0 (0.0%) |
Occupancy by Age of Householder in Berlin
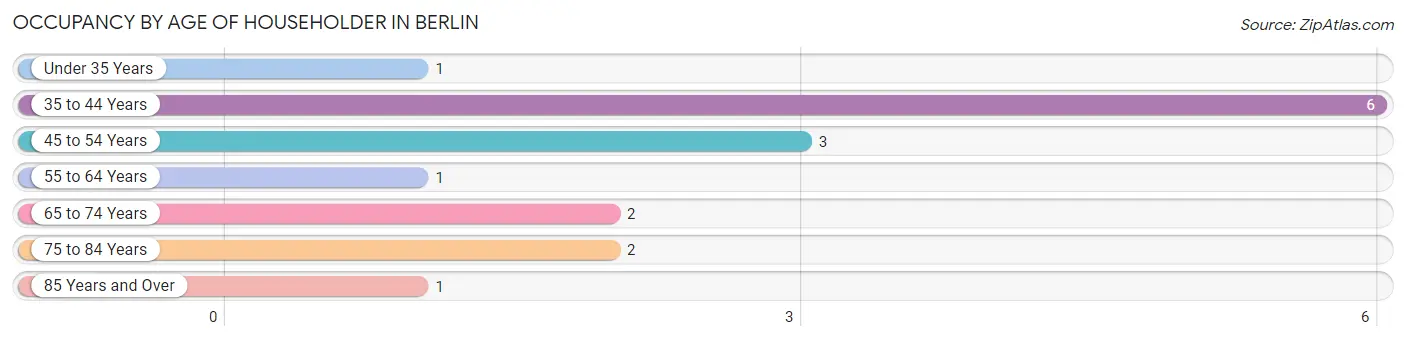
| Age Bracket | # Households | % Households |
| Under 35 Years | 1 | 6.2% |
| 35 to 44 Years | 6 | 37.5% |
| 45 to 54 Years | 3 | 18.8% |
| 55 to 64 Years | 1 | 6.2% |
| 65 to 74 Years | 2 | 12.5% |
| 75 to 84 Years | 2 | 12.5% |
| 85 Years and Over | 1 | 6.2% |
| Total | 16 | 100.0% |
Housing Finances in Berlin
Median Income by Occupancy in Berlin
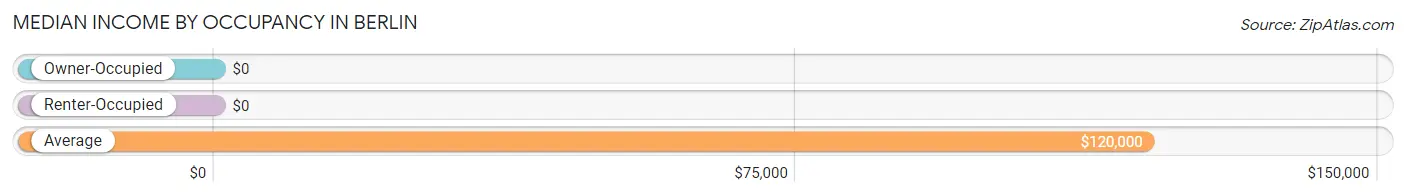
| Occupancy Type | # Households | Median Income |
| Owner-Occupied | 15 (93.8%) | $0 |
| Renter-Occupied | 1 (6.2%) | $0 |
| Average | 16 (100.0%) | $120,000 |
Occupancy by Householder Income Bracket in Berlin
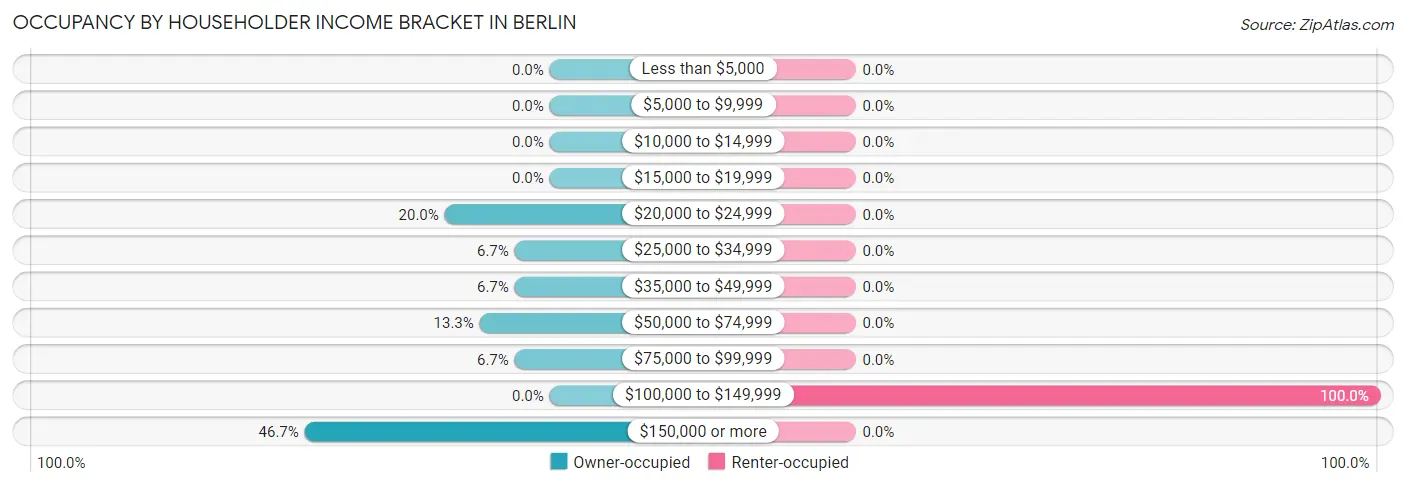
| Income Bracket | Owner-occupied | Renter-occupied |
| Less than $5,000 | 0 (0.0%) | 0 (0.0%) |
| $5,000 to $9,999 | 0 (0.0%) | 0 (0.0%) |
| $10,000 to $14,999 | 0 (0.0%) | 0 (0.0%) |
| $15,000 to $19,999 | 0 (0.0%) | 0 (0.0%) |
| $20,000 to $24,999 | 3 (20.0%) | 0 (0.0%) |
| $25,000 to $34,999 | 1 (6.7%) | 0 (0.0%) |
| $35,000 to $49,999 | 1 (6.7%) | 0 (0.0%) |
| $50,000 to $74,999 | 2 (13.3%) | 0 (0.0%) |
| $75,000 to $99,999 | 1 (6.7%) | 0 (0.0%) |
| $100,000 to $149,999 | 0 (0.0%) | 1 (100.0%) |
| $150,000 or more | 7 (46.7%) | 0 (0.0%) |
| Total | 15 (100.0%) | 1 (100.0%) |
Monthly Housing Cost Tiers in Berlin
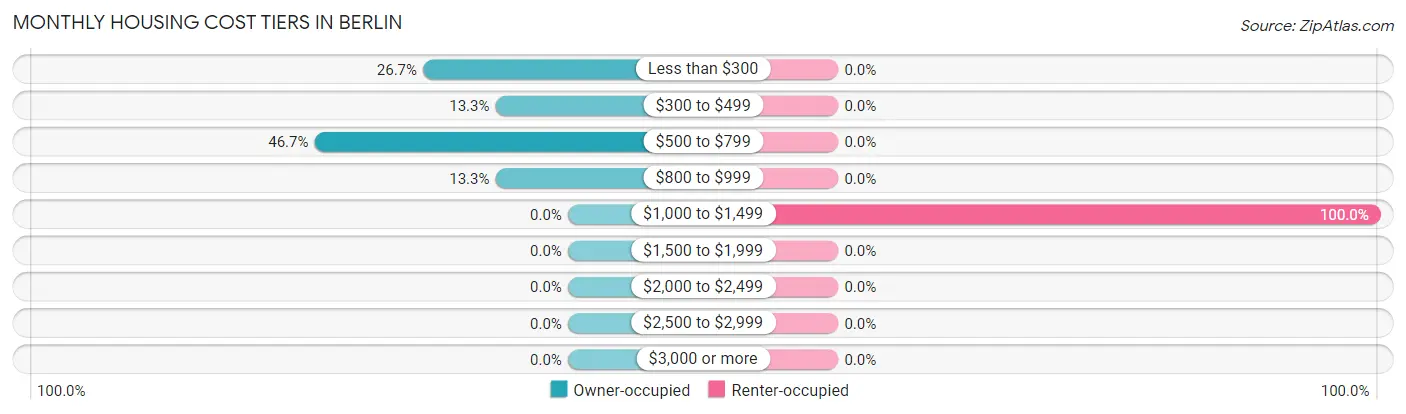
| Monthly Cost | Owner-occupied | Renter-occupied |
| Less than $300 | 4 (26.7%) | 0 (0.0%) |
| $300 to $499 | 2 (13.3%) | 0 (0.0%) |
| $500 to $799 | 7 (46.7%) | 0 (0.0%) |
| $800 to $999 | 2 (13.3%) | 0 (0.0%) |
| $1,000 to $1,499 | 0 (0.0%) | 1 (100.0%) |
| $1,500 to $1,999 | 0 (0.0%) | 0 (0.0%) |
| $2,000 to $2,499 | 0 (0.0%) | 0 (0.0%) |
| $2,500 to $2,999 | 0 (0.0%) | 0 (0.0%) |
| $3,000 or more | 0 (0.0%) | 0 (0.0%) |
| Total | 15 (100.0%) | 1 (100.0%) |
Physical Housing Characteristics in Berlin
Housing Structures in Berlin
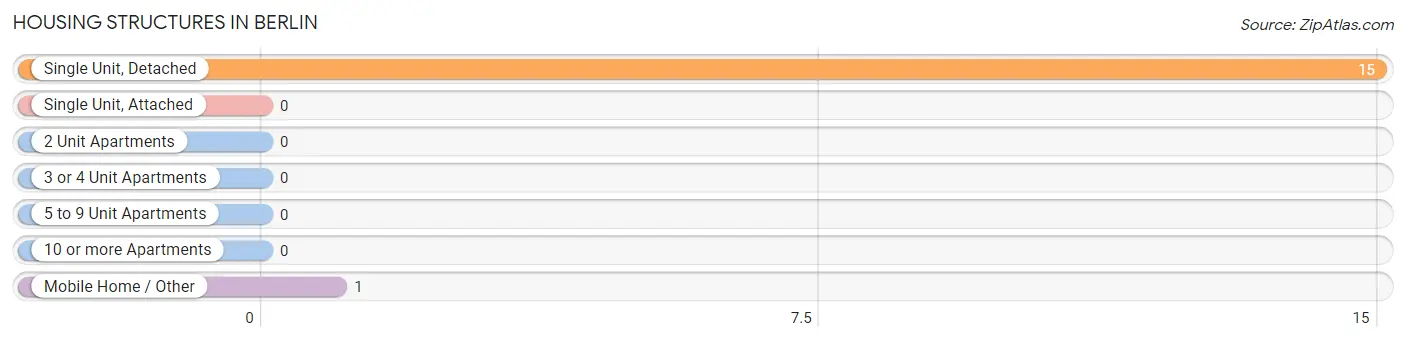
| Structure Type | # Housing Units | % Housing Units |
| Single Unit, Detached | 15 | 93.8% |
| Single Unit, Attached | 0 | 0.0% |
| 2 Unit Apartments | 0 | 0.0% |
| 3 or 4 Unit Apartments | 0 | 0.0% |
| 5 to 9 Unit Apartments | 0 | 0.0% |
| 10 or more Apartments | 0 | 0.0% |
| Mobile Home / Other | 1 | 6.2% |
| Total | 16 | 100.0% |
Housing Structures by Occupancy in Berlin
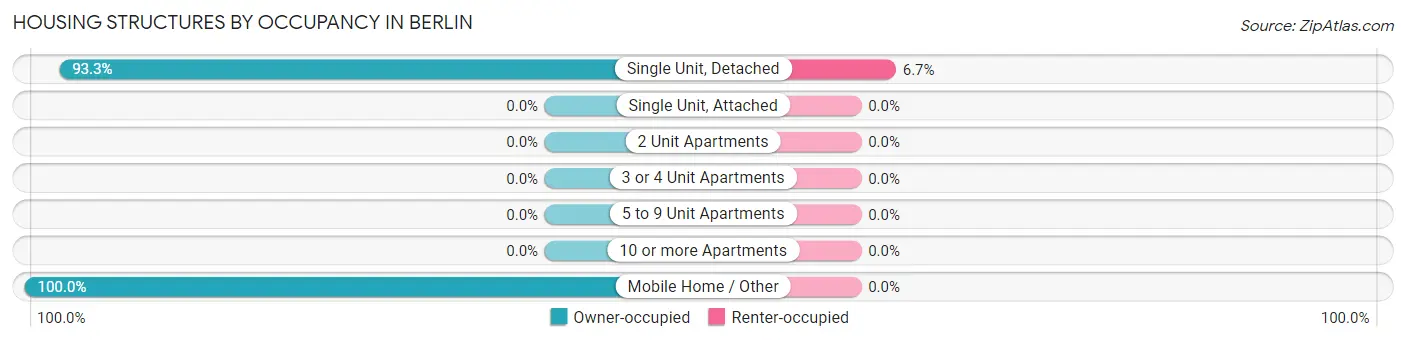
| Structure Type | Owner-occupied | Renter-occupied |
| Single Unit, Detached | 14 (93.3%) | 1 (6.7%) |
| Single Unit, Attached | 0 (0.0%) | 0 (0.0%) |
| 2 Unit Apartments | 0 (0.0%) | 0 (0.0%) |
| 3 or 4 Unit Apartments | 0 (0.0%) | 0 (0.0%) |
| 5 to 9 Unit Apartments | 0 (0.0%) | 0 (0.0%) |
| 10 or more Apartments | 0 (0.0%) | 0 (0.0%) |
| Mobile Home / Other | 1 (100.0%) | 0 (0.0%) |
| Total | 15 (93.8%) | 1 (6.2%) |
Housing Structures by Number of Rooms in Berlin
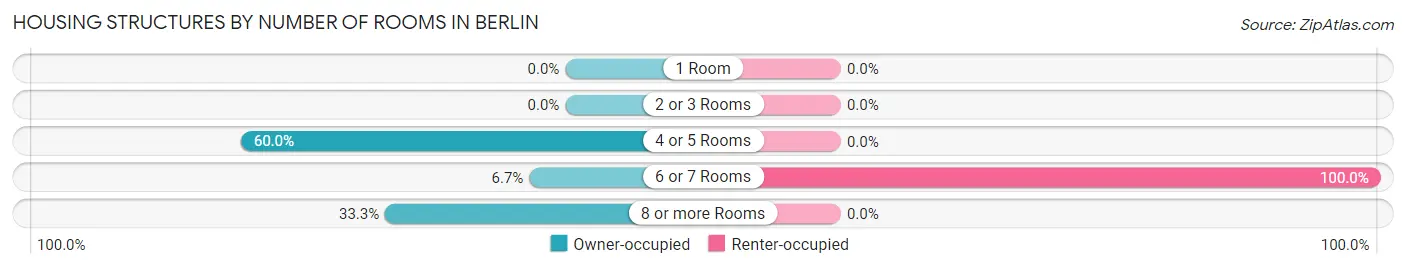
| Number of Rooms | Owner-occupied | Renter-occupied |
| 1 Room | 0 (0.0%) | 0 (0.0%) |
| 2 or 3 Rooms | 0 (0.0%) | 0 (0.0%) |
| 4 or 5 Rooms | 9 (60.0%) | 0 (0.0%) |
| 6 or 7 Rooms | 1 (6.7%) | 1 (100.0%) |
| 8 or more Rooms | 5 (33.3%) | 0 (0.0%) |
| Total | 15 (100.0%) | 1 (100.0%) |
Housing Structure by Heating Type in Berlin
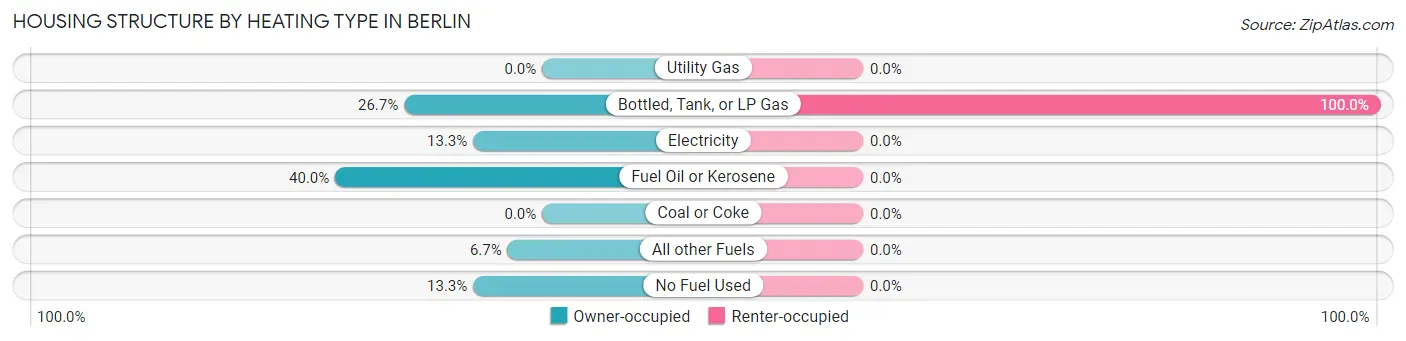
| Heating Type | Owner-occupied | Renter-occupied |
| Utility Gas | 0 (0.0%) | 0 (0.0%) |
| Bottled, Tank, or LP Gas | 4 (26.7%) | 1 (100.0%) |
| Electricity | 2 (13.3%) | 0 (0.0%) |
| Fuel Oil or Kerosene | 6 (40.0%) | 0 (0.0%) |
| Coal or Coke | 0 (0.0%) | 0 (0.0%) |
| All other Fuels | 1 (6.7%) | 0 (0.0%) |
| No Fuel Used | 2 (13.3%) | 0 (0.0%) |
| Total | 15 (100.0%) | 1 (100.0%) |
Household Vehicle Usage in Berlin
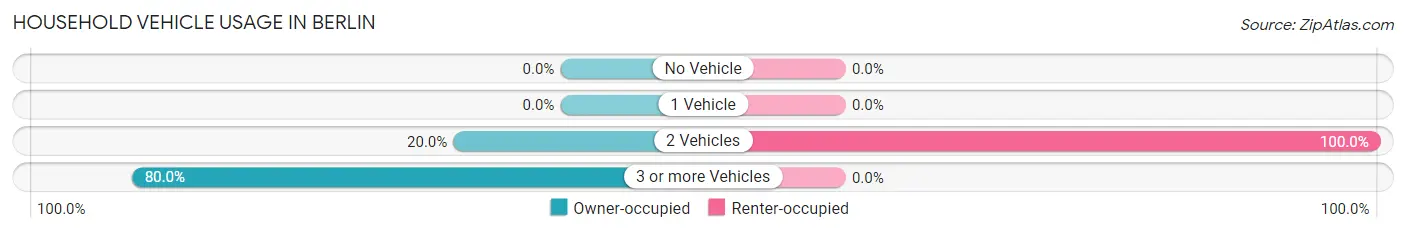
| Vehicles per Household | Owner-occupied | Renter-occupied |
| No Vehicle | 0 (0.0%) | 0 (0.0%) |
| 1 Vehicle | 0 (0.0%) | 0 (0.0%) |
| 2 Vehicles | 3 (20.0%) | 1 (100.0%) |
| 3 or more Vehicles | 12 (80.0%) | 0 (0.0%) |
| Total | 15 (100.0%) | 1 (100.0%) |
Real Estate & Mortgages in Berlin
Real Estate and Mortgage Overview in Berlin
| Characteristic | Without Mortgage | With Mortgage |
| Housing Units | 6 | 9 |
| Median Property Value | $85,000 | $45,600 |
| Median Household Income | $61,250 | $6 |
| Monthly Housing Costs | $250 | $0 |
| Real Estate Taxes | - | - |
Property Value by Mortgage Status in Berlin
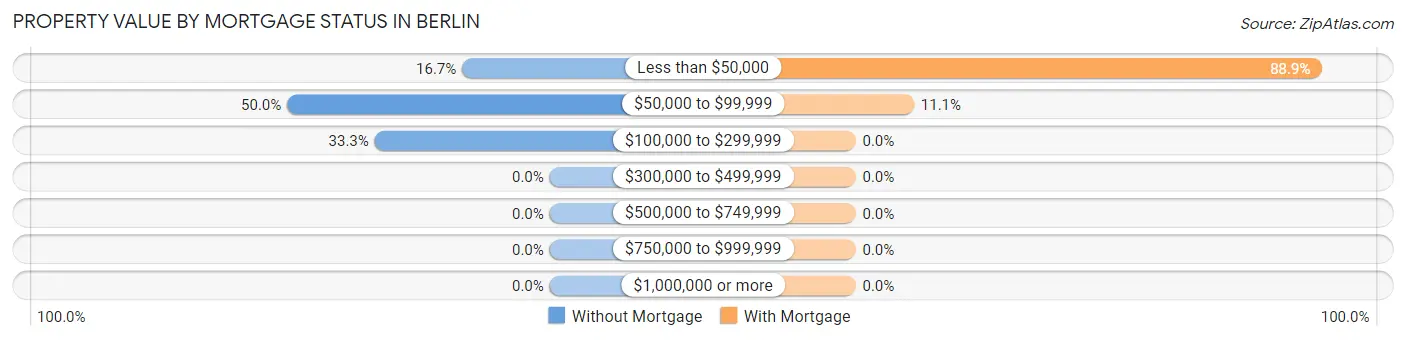
| Property Value | Without Mortgage | With Mortgage |
| Less than $50,000 | 1 (16.7%) | 8 (88.9%) |
| $50,000 to $99,999 | 3 (50.0%) | 1 (11.1%) |
| $100,000 to $299,999 | 2 (33.3%) | 0 (0.0%) |
| $300,000 to $499,999 | 0 (0.0%) | 0 (0.0%) |
| $500,000 to $749,999 | 0 (0.0%) | 0 (0.0%) |
| $750,000 to $999,999 | 0 (0.0%) | 0 (0.0%) |
| $1,000,000 or more | 0 (0.0%) | 0 (0.0%) |
| Total | 6 (100.0%) | 9 (100.0%) |
Household Income by Mortgage Status in Berlin
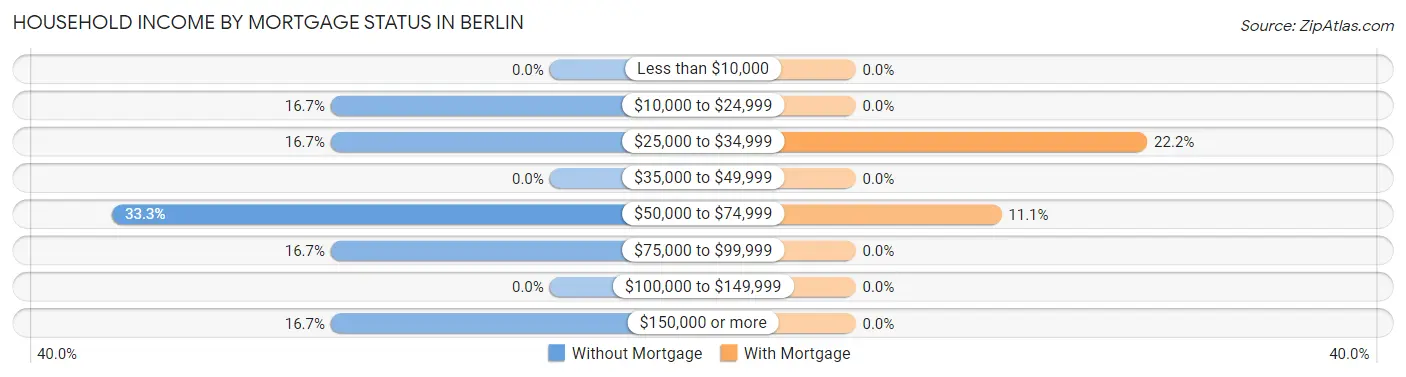
| Household Income | Without Mortgage | With Mortgage |
| Less than $10,000 | 0 (0.0%) | 0 (0.0%) |
| $10,000 to $24,999 | 1 (16.7%) | 0 (0.0%) |
| $25,000 to $34,999 | 1 (16.7%) | 2 (22.2%) |
| $35,000 to $49,999 | 0 (0.0%) | 0 (0.0%) |
| $50,000 to $74,999 | 2 (33.3%) | 1 (11.1%) |
| $75,000 to $99,999 | 1 (16.7%) | 0 (0.0%) |
| $100,000 to $149,999 | 0 (0.0%) | 0 (0.0%) |
| $150,000 or more | 1 (16.7%) | 0 (0.0%) |
| Total | 6 (100.0%) | 9 (100.0%) |
Property Value to Household Income Ratio in Berlin
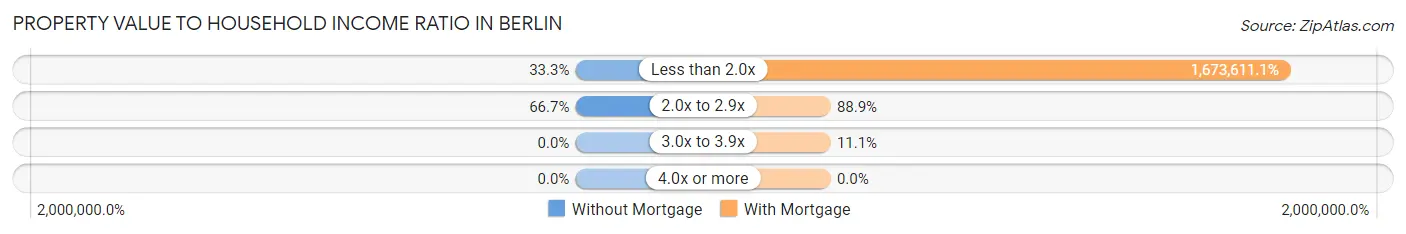
| Value-to-Income Ratio | Without Mortgage | With Mortgage |
| Less than 2.0x | 2 (33.3%) | 150,625 (1,673,611.1%) |
| 2.0x to 2.9x | 4 (66.7%) | 8 (88.9%) |
| 3.0x to 3.9x | 0 (0.0%) | 1 (11.1%) |
| 4.0x or more | 0 (0.0%) | 0 (0.0%) |
| Total | 6 (100.0%) | 9 (100.0%) |
Real Estate Taxes by Mortgage Status in Berlin
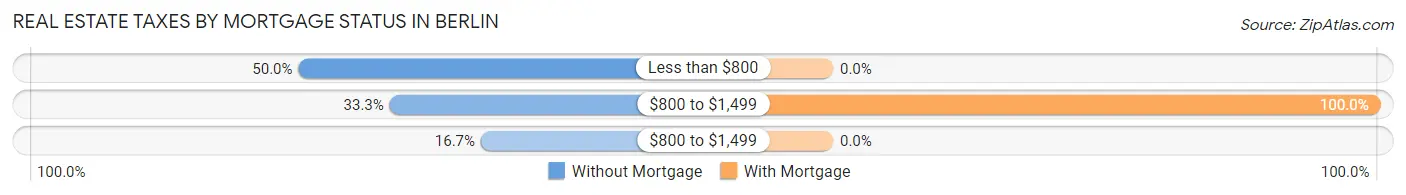
| Property Taxes | Without Mortgage | With Mortgage |
| Less than $800 | 3 (50.0%) | 0 (0.0%) |
| $800 to $1,499 | 2 (33.3%) | 9 (100.0%) |
| $800 to $1,499 | 1 (16.7%) | 0 (0.0%) |
| Total | 6 (100.0%) | 9 (100.0%) |
Health & Disability in Berlin
Health Insurance Coverage by Age in Berlin
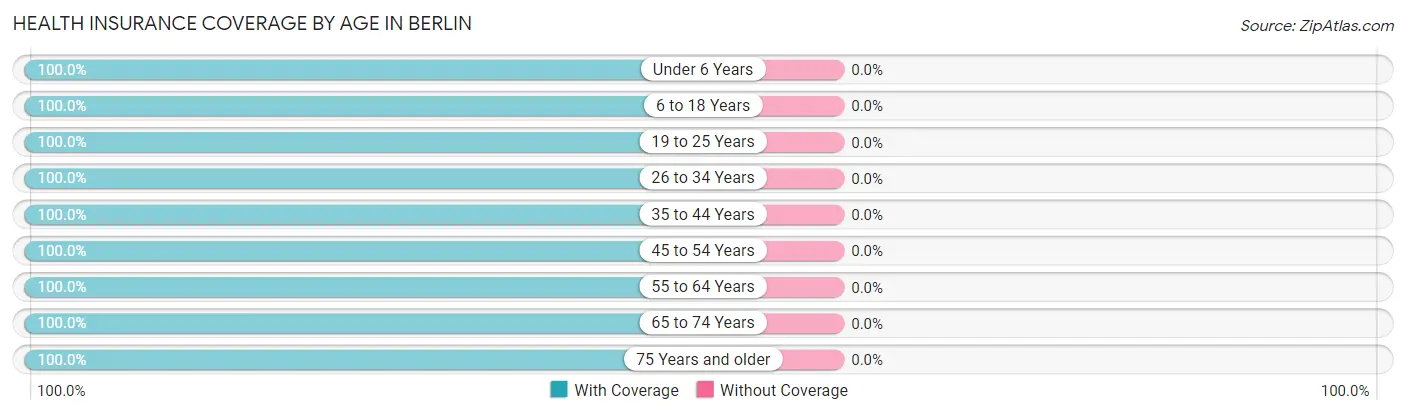
| Age Bracket | With Coverage | Without Coverage |
| Under 6 Years | 2 (100.0%) | 0 (0.0%) |
| 6 to 18 Years | 14 (100.0%) | 0 (0.0%) |
| 19 to 25 Years | 3 (100.0%) | 0 (0.0%) |
| 26 to 34 Years | 10 (100.0%) | 0 (0.0%) |
| 35 to 44 Years | 6 (100.0%) | 0 (0.0%) |
| 45 to 54 Years | 7 (100.0%) | 0 (0.0%) |
| 55 to 64 Years | 2 (100.0%) | 0 (0.0%) |
| 65 to 74 Years | 2 (100.0%) | 0 (0.0%) |
| 75 Years and older | 5 (100.0%) | 0 (0.0%) |
| Total | 51 (100.0%) | 0 (0.0%) |
Health Insurance Coverage by Citizenship Status in Berlin
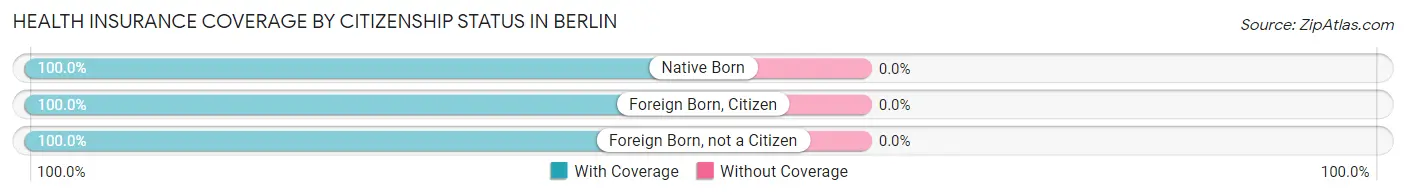
| Citizenship Status | With Coverage | Without Coverage |
| Native Born | 2 (100.0%) | 0 (0.0%) |
| Foreign Born, Citizen | 14 (100.0%) | 0 (0.0%) |
| Foreign Born, not a Citizen | 3 (100.0%) | 0 (0.0%) |
Health Insurance Coverage by Household Income in Berlin
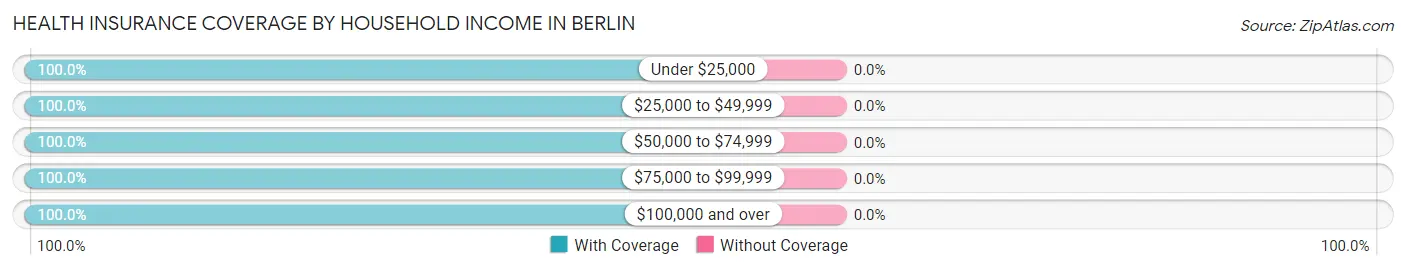
| Household Income | With Coverage | Without Coverage |
| Under $25,000 | 9 (100.0%) | 0 (0.0%) |
| $25,000 to $49,999 | 6 (100.0%) | 0 (0.0%) |
| $50,000 to $74,999 | 3 (100.0%) | 0 (0.0%) |
| $75,000 to $99,999 | 2 (100.0%) | 0 (0.0%) |
| $100,000 and over | 31 (100.0%) | 0 (0.0%) |
Public vs Private Health Insurance Coverage by Age in Berlin
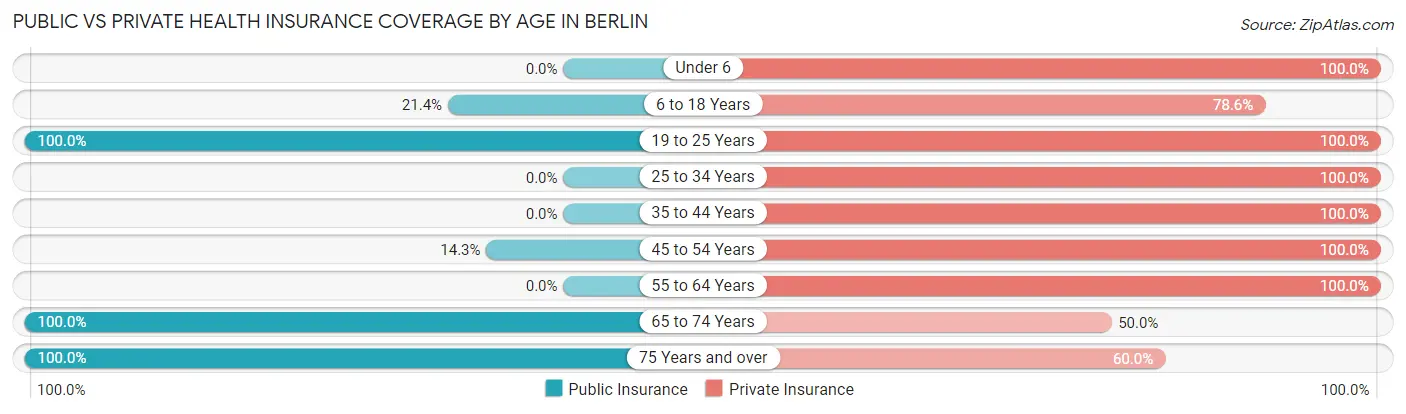
| Age Bracket | Public Insurance | Private Insurance |
| Under 6 | 0 (0.0%) | 2 (100.0%) |
| 6 to 18 Years | 3 (21.4%) | 11 (78.6%) |
| 19 to 25 Years | 3 (100.0%) | 3 (100.0%) |
| 25 to 34 Years | 0 (0.0%) | 10 (100.0%) |
| 35 to 44 Years | 0 (0.0%) | 6 (100.0%) |
| 45 to 54 Years | 1 (14.3%) | 7 (100.0%) |
| 55 to 64 Years | 0 (0.0%) | 2 (100.0%) |
| 65 to 74 Years | 2 (100.0%) | 1 (50.0%) |
| 75 Years and over | 5 (100.0%) | 3 (60.0%) |
| Total | 14 (27.5%) | 45 (88.2%) |
Disability Status by Sex by Age in Berlin
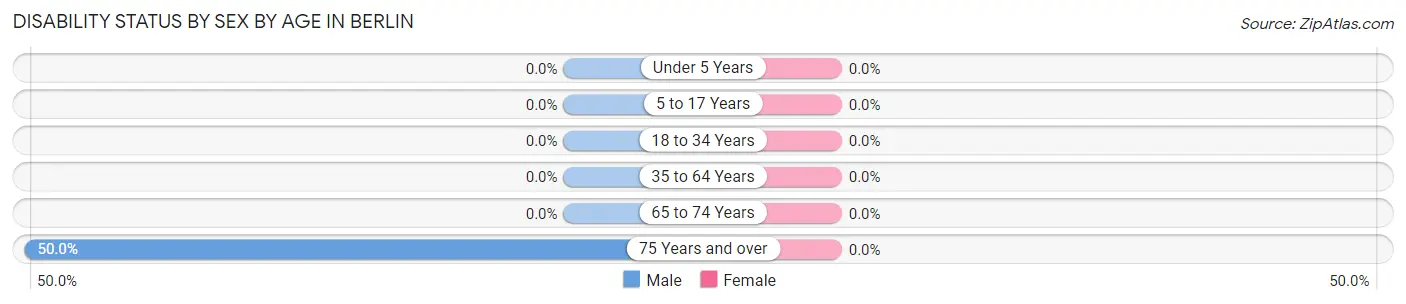
| Age Bracket | Male | Female |
| Under 5 Years | 0 (0.0%) | 0 (0.0%) |
| 5 to 17 Years | 0 (0.0%) | 0 (0.0%) |
| 18 to 34 Years | 0 (0.0%) | 0 (0.0%) |
| 35 to 64 Years | 0 (0.0%) | 0 (0.0%) |
| 65 to 74 Years | 0 (0.0%) | 0 (0.0%) |
| 75 Years and over | 1 (50.0%) | 0 (0.0%) |
Disability Class by Sex by Age in Berlin
Disability Class: Hearing Difficulty
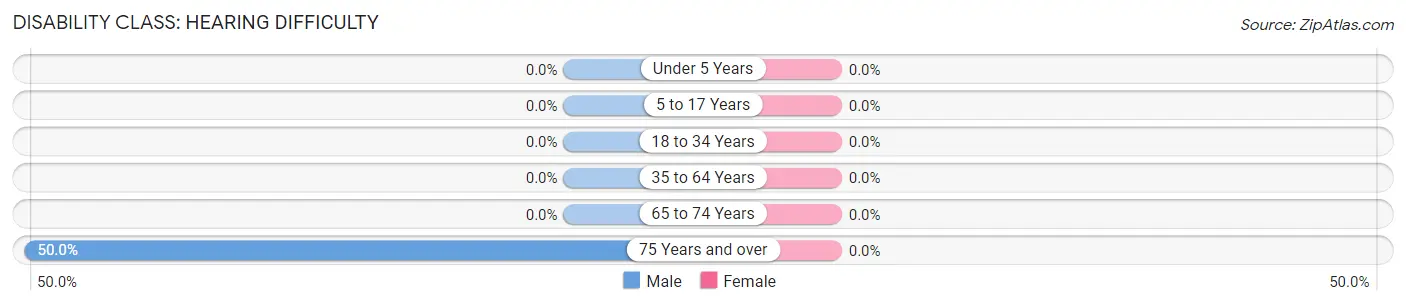
| Age Bracket | Male | Female |
| Under 5 Years | 0 (0.0%) | 0 (0.0%) |
| 5 to 17 Years | 0 (0.0%) | 0 (0.0%) |
| 18 to 34 Years | 0 (0.0%) | 0 (0.0%) |
| 35 to 64 Years | 0 (0.0%) | 0 (0.0%) |
| 65 to 74 Years | 0 (0.0%) | 0 (0.0%) |
| 75 Years and over | 1 (50.0%) | 0 (0.0%) |
Disability Class: Vision Difficulty
| Age Bracket | Male | Female |
| Under 5 Years | 0 (0.0%) | 0 (0.0%) |
| 5 to 17 Years | 0 (0.0%) | 0 (0.0%) |
| 18 to 34 Years | 0 (0.0%) | 0 (0.0%) |
| 35 to 64 Years | 0 (0.0%) | 0 (0.0%) |
| 65 to 74 Years | 0 (0.0%) | 0 (0.0%) |
| 75 Years and over | 0 (0.0%) | 0 (0.0%) |
Disability Class: Cognitive Difficulty
| Age Bracket | Male | Female |
| 5 to 17 Years | 0 (0.0%) | 0 (0.0%) |
| 18 to 34 Years | 0 (0.0%) | 0 (0.0%) |
| 35 to 64 Years | 0 (0.0%) | 0 (0.0%) |
| 65 to 74 Years | 0 (0.0%) | 0 (0.0%) |
| 75 Years and over | 0 (0.0%) | 0 (0.0%) |
Disability Class: Ambulatory Difficulty
| Age Bracket | Male | Female |
| 5 to 17 Years | 0 (0.0%) | 0 (0.0%) |
| 18 to 34 Years | 0 (0.0%) | 0 (0.0%) |
| 35 to 64 Years | 0 (0.0%) | 0 (0.0%) |
| 65 to 74 Years | 0 (0.0%) | 0 (0.0%) |
| 75 Years and over | 1 (50.0%) | 0 (0.0%) |
Disability Class: Self-Care Difficulty

| Age Bracket | Male | Female |
| 5 to 17 Years | 0 (0.0%) | 0 (0.0%) |
| 18 to 34 Years | 0 (0.0%) | 0 (0.0%) |
| 35 to 64 Years | 0 (0.0%) | 0 (0.0%) |
| 65 to 74 Years | 0 (0.0%) | 0 (0.0%) |
| 75 Years and over | 0 (0.0%) | 0 (0.0%) |
Technology Access in Berlin
Computing Device Access in Berlin
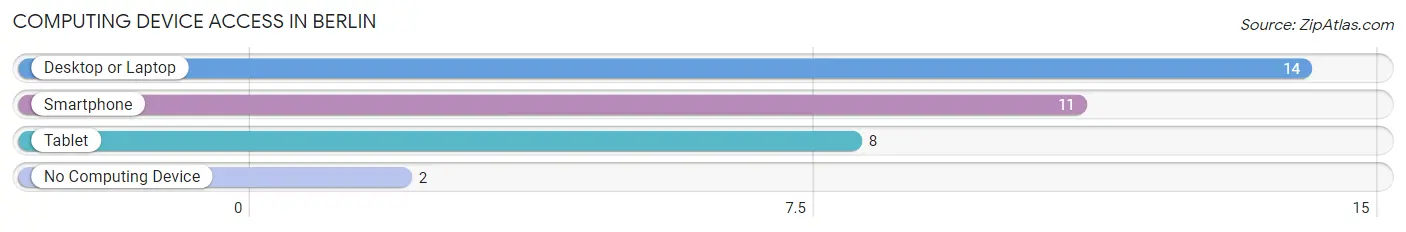
| Device Type | # Households | % Households |
| Desktop or Laptop | 14 | 87.5% |
| Smartphone | 11 | 68.8% |
| Tablet | 8 | 50.0% |
| No Computing Device | 2 | 12.5% |
| Total | 16 | 100.0% |
Internet Access in Berlin
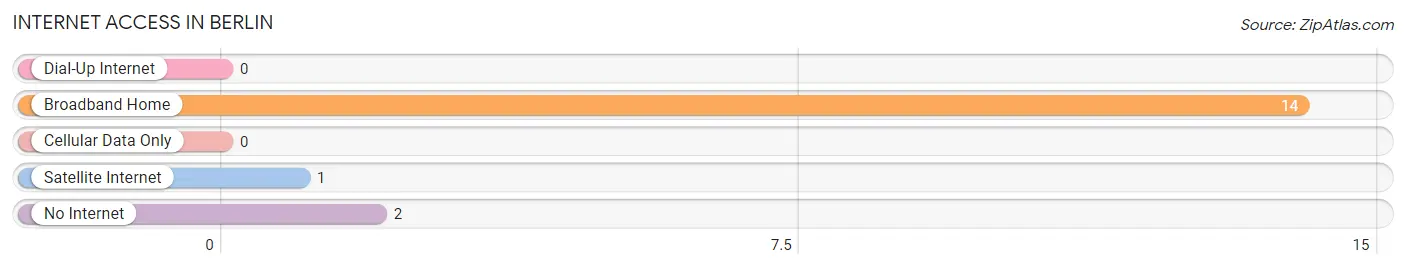
| Internet Type | # Households | % Households |
| Dial-Up Internet | 0 | 0.0% |
| Broadband Home | 14 | 87.5% |
| Cellular Data Only | 0 | 0.0% |
| Satellite Internet | 1 | 6.2% |
| No Internet | 2 | 12.5% |
| Total | 16 | 100.0% |
Berlin Summary
Berlin, North Dakota is a small city located in the southeastern corner of the state. It is the county seat of Lamoure County and is located on the Sheyenne River. The city has a population of 1,845 as of the 2020 census.
History
Berlin was founded in 1883 by German immigrants who had come to the area to homestead. The city was named after the German city of Berlin. The city was incorporated in 1887 and was the first city in North Dakota to be incorporated.
The city was an important trading center for the surrounding area and was the site of the first bank in the county. The city also had a number of businesses, including a flour mill, a creamery, a brewery, and a brickyard.
The city was also the site of the first school in the county, which was established in 1884. The school was later replaced by a larger school in 1906.
Geography
Berlin is located in the southeastern corner of North Dakota, in Lamoure County. The city is situated on the Sheyenne River, which flows through the city. The city is located about 40 miles south of Fargo and about 60 miles west of Grand Forks.
The city has a total area of 1.3 square miles, all of which is land. The city is located at an elevation of 1,072 feet above sea level.
Economy
The economy of Berlin is largely based on agriculture. The city is home to a number of farms and ranches, as well as a number of businesses related to agriculture.
The city is also home to a number of manufacturing businesses, including a furniture factory, a plastics factory, and a metal fabrication plant.
Demographics
As of the 2020 census, the population of Berlin was 1,845. The city has a population density of 1,400 people per square mile.
The racial makeup of the city is 97.3% White, 0.7% Native American, 0.3% Asian, 0.2% Black, and 1.5% from other races. The median age of the population is 43.7 years.
The median household income in Berlin is $45,938, and the median family income is $54,938. The per capita income in the city is $22,938. The poverty rate in the city is 11.3%.
Common Questions
What is Per Capita Income in Berlin?
Per Capita income in Berlin is $32,969.
What is the Median Family Income in Berlin?
Median Family Income in Berlin is $150,000.
What is the Median Household income in Berlin?
Median Household Income in Berlin is $120,000.
What is Inequality or Gini Index in Berlin?
Inequality or Gini Index in Berlin is 0.32.
What is the Total Population of Berlin?
Total Population of Berlin is 51.
What is the Total Male Population of Berlin?
Total Male Population of Berlin is 24.
What is the Total Female Population of Berlin?
Total Female Population of Berlin is 27.
What is the Ratio of Males per 100 Females in Berlin?
There are 88.89 Males per 100 Females in Berlin.
What is the Ratio of Females per 100 Males in Berlin?
There are 112.50 Females per 100 Males in Berlin.
What is the Median Population Age in Berlin?
Median Population Age in Berlin is 34.6 Years.
What is the Average Family Size in Berlin
Average Family Size in Berlin is 3.5 People.
What is the Average Household Size in Berlin
Average Household Size in Berlin is 3.2 People.
How Large is the Labor Force in Berlin?
There are 28 People in the Labor Forcein in Berlin.
What is the Percentage of People in the Labor Force in Berlin?
77.8% of People are in the Labor Force in Berlin.