Worcester, VT Map & Demographics
Worcester Map
Worcester Overview
$24,723
PER CAPITA INCOME
$58,750
AVG FAMILY INCOME
$71,250
AVG HOUSEHOLD INCOME
0.17
INEQUALITY / GINI INDEX
115
TOTAL POPULATION
59
MALE POPULATION
56
FEMALE POPULATION
105.36
MALES / 100 FEMALES
94.92
FEMALES / 100 MALES
33.2
MEDIAN AGE
3.8
AVG FAMILY SIZE
2.7
AVG HOUSEHOLD SIZE
61
LABOR FORCE [ PEOPLE ]
66.3%
PERCENT IN LABOR FORCE
39.3%
UNEMPLOYMENT RATE
Worcester Zip Codes
Worcester Area Codes
Income in Worcester
Income Overview in Worcester
Per Capita Income in Worcester is $24,723, while median incomes of families and households are $58,750 and $71,250 respectively.
| Characteristic | Number | Measure |
| Per Capita Income | 115 | $24,723 |
| Median Family Income | 26 | $58,750 |
| Mean Family Income | 26 | $62,015 |
| Median Household Income | 42 | $71,250 |
| Mean Household Income | 42 | $62,007 |
| Income Deficit | 26 | $0 |
| Wage / Income Gap (%) | 115 | 0.00% |
| Wage / Income Gap ($) | 115 | 100.00¢ per $1 |
| Gini / Inequality Index | 115 | 0.17 |
Earnings by Sex in Worcester
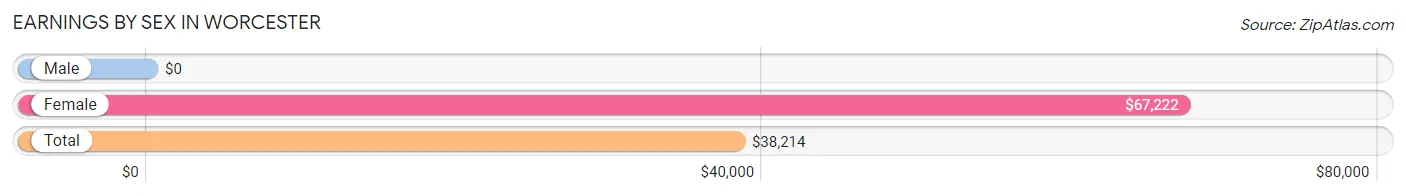
| Sex | Number | Average Earnings |
| Male | 42 (65.6%) | $0 |
| Female | 22 (34.4%) | $67,222 |
| Total | 64 (100.0%) | $38,214 |
Earnings by Sex by Income Bracket in Worcester
The most common earnings brackets in Worcester are $7,500 to $9,999 for men (24 | 57.1%) and $65,000 to $74,999 for women (19 | 86.4%).
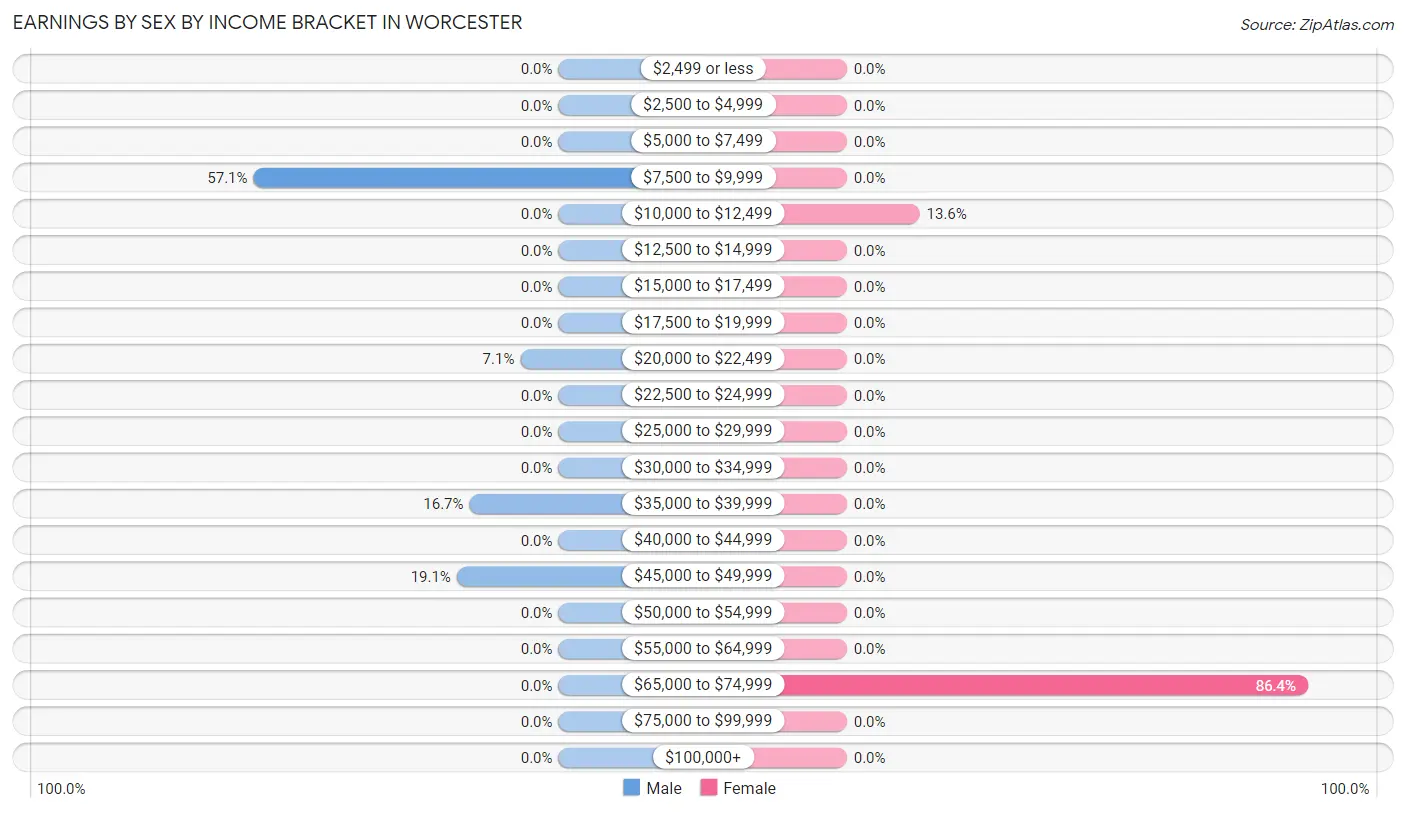
| Income | Male | Female |
| $2,499 or less | 0 (0.0%) | 0 (0.0%) |
| $2,500 to $4,999 | 0 (0.0%) | 0 (0.0%) |
| $5,000 to $7,499 | 0 (0.0%) | 0 (0.0%) |
| $7,500 to $9,999 | 24 (57.1%) | 0 (0.0%) |
| $10,000 to $12,499 | 0 (0.0%) | 3 (13.6%) |
| $12,500 to $14,999 | 0 (0.0%) | 0 (0.0%) |
| $15,000 to $17,499 | 0 (0.0%) | 0 (0.0%) |
| $17,500 to $19,999 | 0 (0.0%) | 0 (0.0%) |
| $20,000 to $22,499 | 3 (7.1%) | 0 (0.0%) |
| $22,500 to $24,999 | 0 (0.0%) | 0 (0.0%) |
| $25,000 to $29,999 | 0 (0.0%) | 0 (0.0%) |
| $30,000 to $34,999 | 0 (0.0%) | 0 (0.0%) |
| $35,000 to $39,999 | 7 (16.7%) | 0 (0.0%) |
| $40,000 to $44,999 | 0 (0.0%) | 0 (0.0%) |
| $45,000 to $49,999 | 8 (19.1%) | 0 (0.0%) |
| $50,000 to $54,999 | 0 (0.0%) | 0 (0.0%) |
| $55,000 to $64,999 | 0 (0.0%) | 0 (0.0%) |
| $65,000 to $74,999 | 0 (0.0%) | 19 (86.4%) |
| $75,000 to $99,999 | 0 (0.0%) | 0 (0.0%) |
| $100,000+ | 0 (0.0%) | 0 (0.0%) |
| Total | 42 (100.0%) | 22 (100.0%) |
Earnings by Sex by Educational Attainment in Worcester
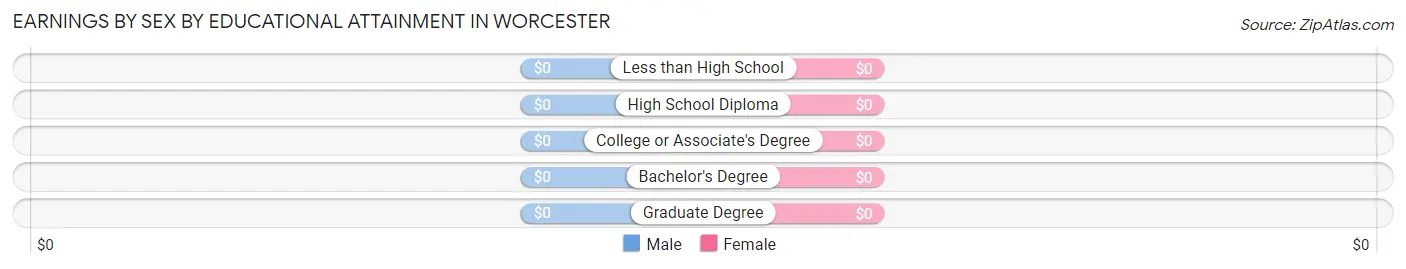
| Educational Attainment | Male Income | Female Income |
| Less than High School | - | - |
| High School Diploma | - | - |
| College or Associate's Degree | - | - |
| Bachelor's Degree | - | - |
| Graduate Degree | - | - |
| Total | $39,643 | $67,222 |
Family Income in Worcester
Family Income Brackets in Worcester
According to the Worcester family income data, there are 13 families falling into the $35,000 to $49,999 income range, which is the most common income bracket and makes up 50.0% of all families.
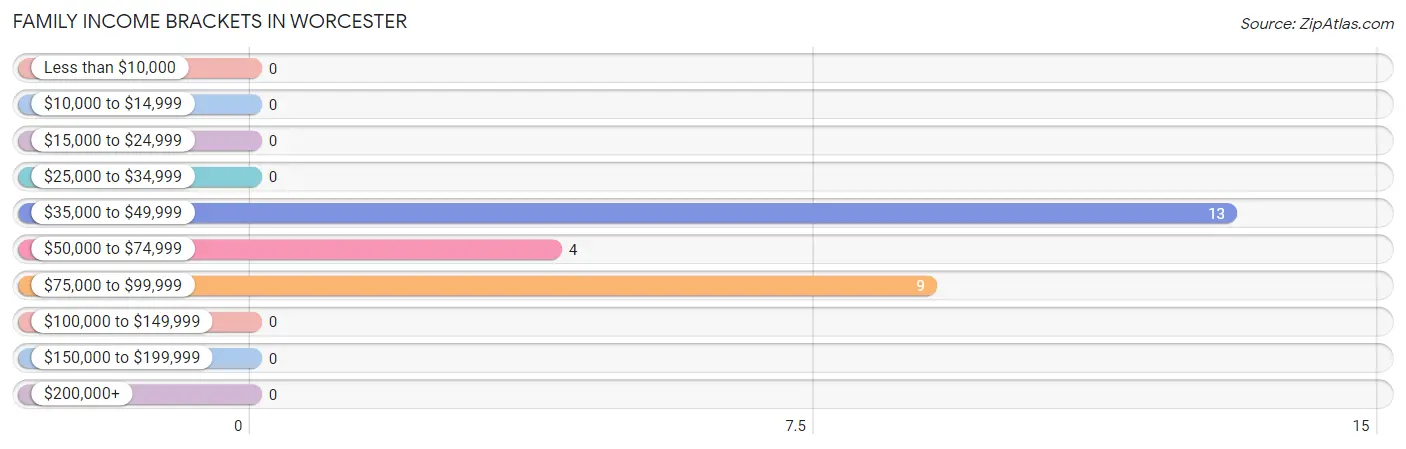
| Income Bracket | # Families | % Families |
| Less than $10,000 | 0 | 0.0% |
| $10,000 to $14,999 | 0 | 0.0% |
| $15,000 to $24,999 | 0 | 0.0% |
| $25,000 to $34,999 | 0 | 0.0% |
| $35,000 to $49,999 | 13 | 50.0% |
| $50,000 to $74,999 | 4 | 15.4% |
| $75,000 to $99,999 | 9 | 34.6% |
| $100,000 to $149,999 | 0 | 0.0% |
| $150,000 to $199,999 | 0 | 0.0% |
| $200,000+ | 0 | 0.0% |
Family Income by Famaliy Size in Worcester
3-person families (13 | 50.0%) account for the highest median family income in Worcester with $46,806 per family, while 3-person families (13 | 50.0%) have the highest median income of $15,602 per family member.
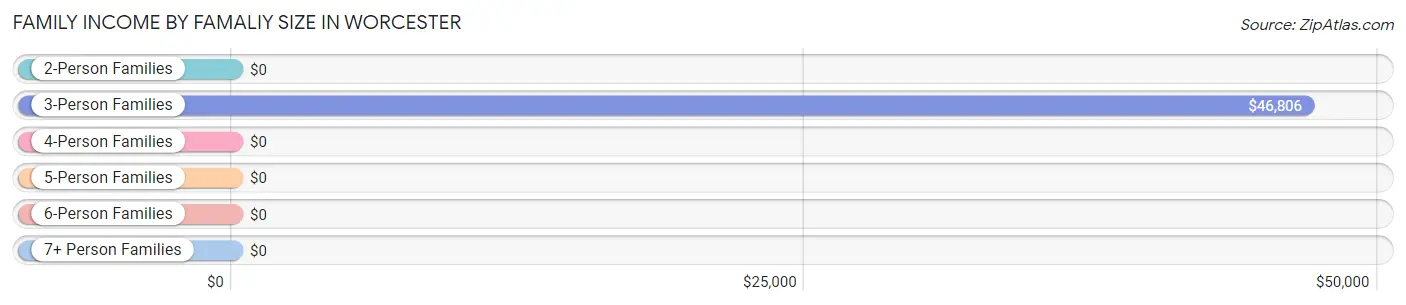
| Income Bracket | # Families | Median Income |
| 2-Person Families | 9 (34.6%) | $0 |
| 3-Person Families | 13 (50.0%) | $46,806 |
| 4-Person Families | 4 (15.4%) | $0 |
| 5-Person Families | 0 (0.0%) | $0 |
| 6-Person Families | 0 (0.0%) | $0 |
| 7+ Person Families | 0 (0.0%) | $0 |
| Total | 26 (100.0%) | $58,750 |
Family Income by Number of Earners in Worcester
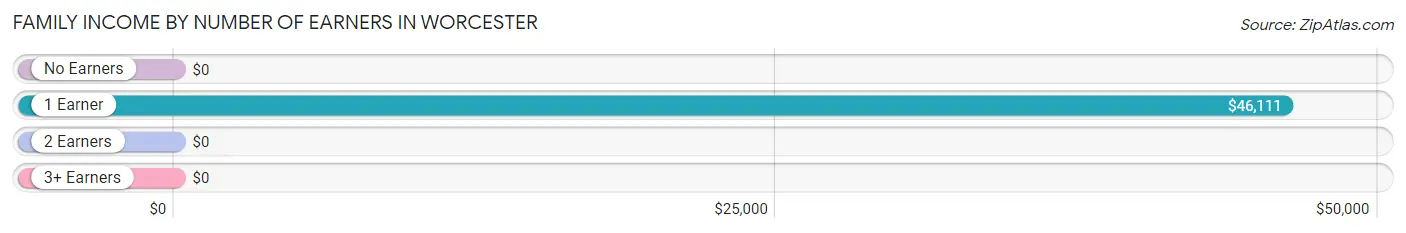
| Number of Earners | # Families | Median Income |
| No Earners | 4 (15.4%) | $0 |
| 1 Earner | 16 (61.5%) | $46,111 |
| 2 Earners | 6 (23.1%) | $0 |
| 3+ Earners | 0 (0.0%) | $0 |
| Total | 26 (100.0%) | $58,750 |
Household Income in Worcester
Household Income Brackets in Worcester
With 17 households falling in the category, the $50,000 to $74,999 income range is the most frequent in Worcester, accounting for 40.5% of all households.
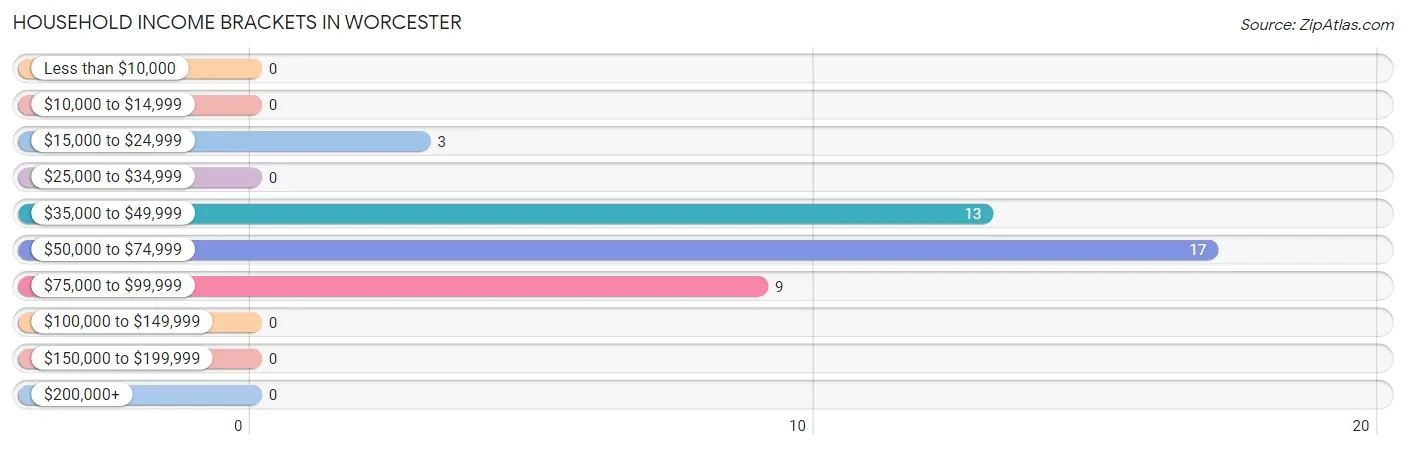
| Income Bracket | # Households | % Households |
| Less than $10,000 | 0 | 0.0% |
| $10,000 to $14,999 | 0 | 0.0% |
| $15,000 to $24,999 | 3 | 7.1% |
| $25,000 to $34,999 | 0 | 0.0% |
| $35,000 to $49,999 | 13 | 31.0% |
| $50,000 to $74,999 | 17 | 40.5% |
| $75,000 to $99,999 | 9 | 21.4% |
| $100,000 to $149,999 | 0 | 0.0% |
| $150,000 to $199,999 | 0 | 0.0% |
| $200,000+ | 0 | 0.0% |
Household Income by Householder Age in Worcester
The median household income in Worcester is $71,250, with the highest median household income of $74,125 found in the 45 to 64 years age bracket for the primary householder. A total of 19 households (45.2%) fall into this category.
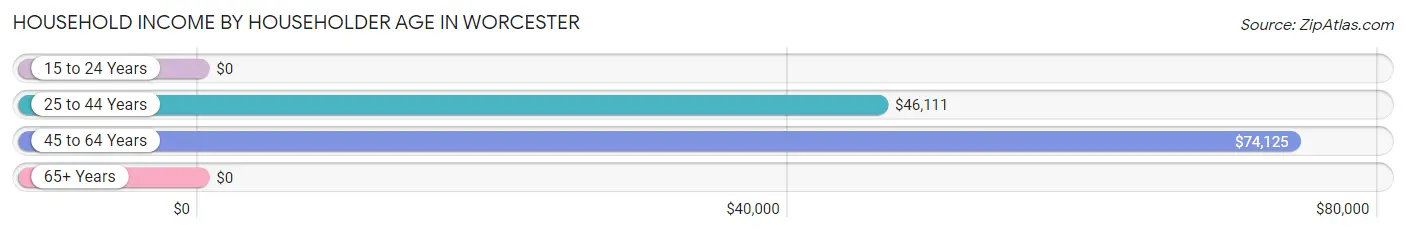
| Income Bracket | # Households | Median Income |
| 15 to 24 Years | 0 (0.0%) | $0 |
| 25 to 44 Years | 16 (38.1%) | $46,111 |
| 45 to 64 Years | 19 (45.2%) | $74,125 |
| 65+ Years | 7 (16.7%) | $0 |
| Total | 42 (100.0%) | $71,250 |
Poverty in Worcester
Income Below Poverty by Sex and Age in Worcester
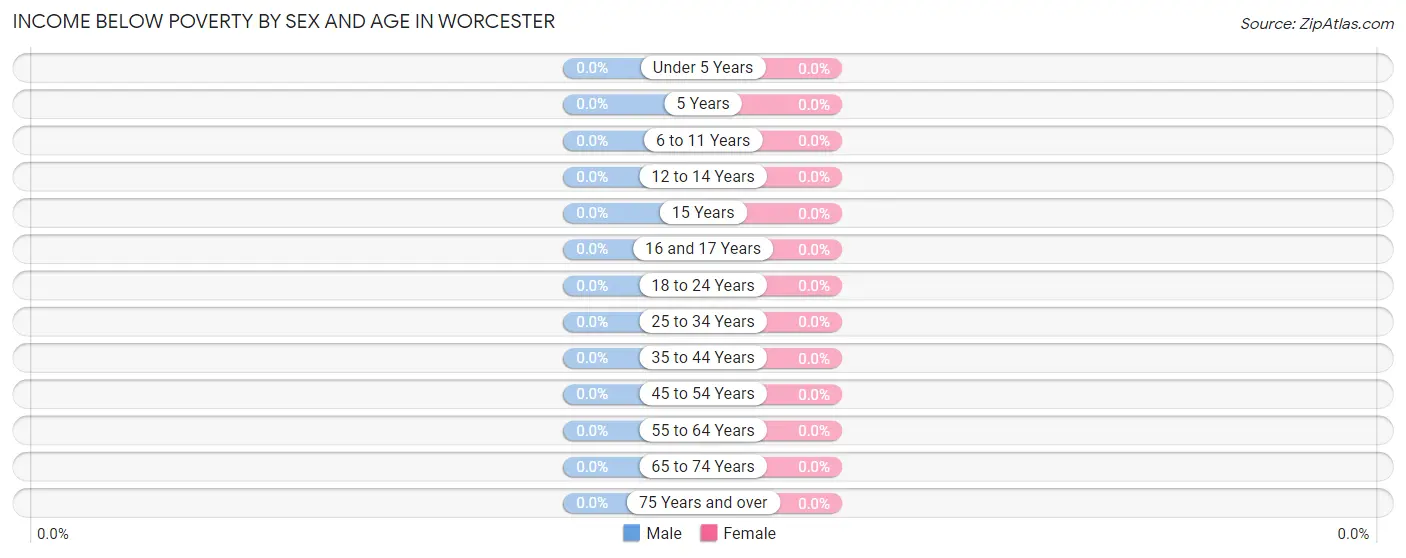
| Age Bracket | Male | Female |
| Under 5 Years | 0 (0.0%) | 0 (0.0%) |
| 5 Years | 0 (0.0%) | 0 (0.0%) |
| 6 to 11 Years | 0 (0.0%) | 0 (0.0%) |
| 12 to 14 Years | 0 (0.0%) | 0 (0.0%) |
| 15 Years | 0 (0.0%) | 0 (0.0%) |
| 16 and 17 Years | 0 (0.0%) | 0 (0.0%) |
| 18 to 24 Years | 0 (0.0%) | 0 (0.0%) |
| 25 to 34 Years | 0 (0.0%) | 0 (0.0%) |
| 35 to 44 Years | 0 (0.0%) | 0 (0.0%) |
| 45 to 54 Years | 0 (0.0%) | 0 (0.0%) |
| 55 to 64 Years | 0 (0.0%) | 0 (0.0%) |
| 65 to 74 Years | 0 (0.0%) | 0 (0.0%) |
| 75 Years and over | 0 (0.0%) | 0 (0.0%) |
| Total | 0 (0.0%) | 0 (0.0%) |
Income Above Poverty by Sex and Age in Worcester
According to the poverty statistics in Worcester, males aged 6 to 11 years and females aged under 5 years are the age groups that are most secure financially, with 100.0% of males and 100.0% of females in these age groups living above the poverty line.
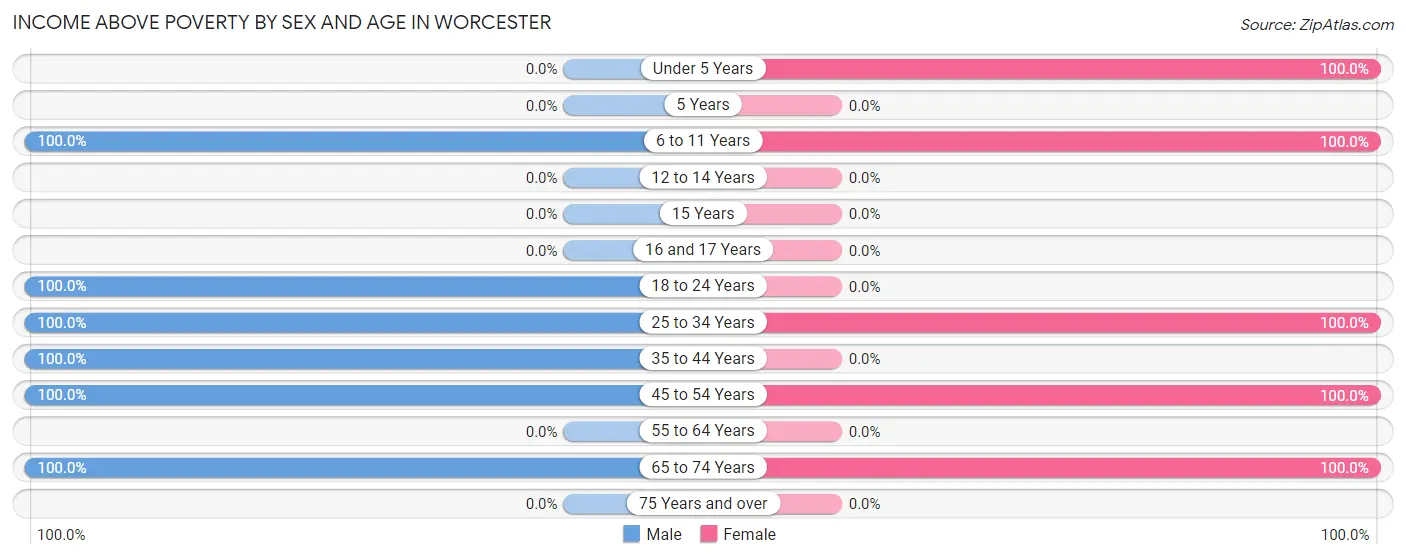
| Age Bracket | Male | Female |
| Under 5 Years | 0 (0.0%) | 10 (100.0%) |
| 5 Years | 0 (0.0%) | 0 (0.0%) |
| 6 to 11 Years | 6 (100.0%) | 7 (100.0%) |
| 12 to 14 Years | 0 (0.0%) | 0 (0.0%) |
| 15 Years | 0 (0.0%) | 0 (0.0%) |
| 16 and 17 Years | 0 (0.0%) | 0 (0.0%) |
| 18 to 24 Years | 24 (100.0%) | 0 (0.0%) |
| 25 to 34 Years | 11 (100.0%) | 12 (100.0%) |
| 35 to 44 Years | 8 (100.0%) | 0 (0.0%) |
| 45 to 54 Years | 3 (100.0%) | 20 (100.0%) |
| 55 to 64 Years | 0 (0.0%) | 0 (0.0%) |
| 65 to 74 Years | 7 (100.0%) | 7 (100.0%) |
| 75 Years and over | 0 (0.0%) | 0 (0.0%) |
| Total | 59 (100.0%) | 56 (100.0%) |
Income Below Poverty Among Married-Couple Families in Worcester
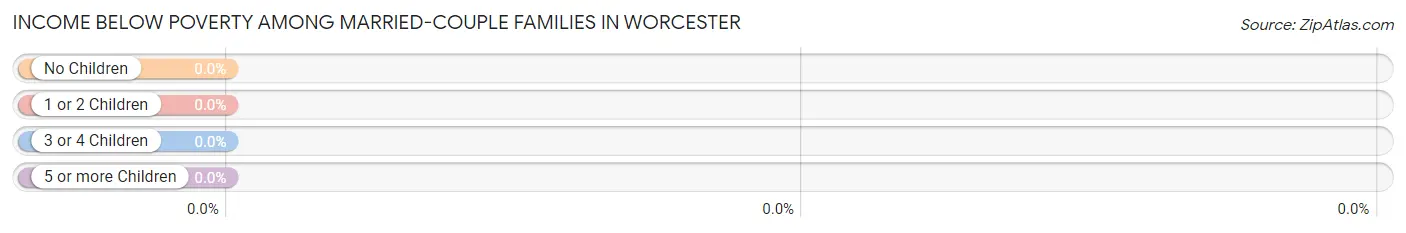
| Children | Above Poverty | Below Poverty |
| No Children | 7 (100.0%) | 0 (0.0%) |
| 1 or 2 Children | 13 (100.0%) | 0 (0.0%) |
| 3 or 4 Children | 0 (0.0%) | 0 (0.0%) |
| 5 or more Children | 0 (0.0%) | 0 (0.0%) |
| Total | 20 (100.0%) | 0 (0.0%) |
Income Below Poverty Among Single-Parent Households in Worcester
| Children | Single Father | Single Mother |
| No Children | 0 (0.0%) | 0 (0.0%) |
| 1 or 2 Children | 0 (0.0%) | 0 (0.0%) |
| 3 or 4 Children | 0 (0.0%) | 0 (0.0%) |
| 5 or more Children | 0 (0.0%) | 0 (0.0%) |
| Total | 0 (0.0%) | 0 (0.0%) |
Income Below Poverty Among Married-Couple vs Single-Parent Households in Worcester
| Children | Married-Couple Families | Single-Parent Households |
| No Children | 0 (0.0%) | 0 (0.0%) |
| 1 or 2 Children | 0 (0.0%) | 0 (0.0%) |
| 3 or 4 Children | 0 (0.0%) | 0 (0.0%) |
| 5 or more Children | 0 (0.0%) | 0 (0.0%) |
| Total | 0 (0.0%) | 0 (0.0%) |
Race in Worcester
The most populous races in Worcester are , and White / Caucasian (115 | 100.0%).
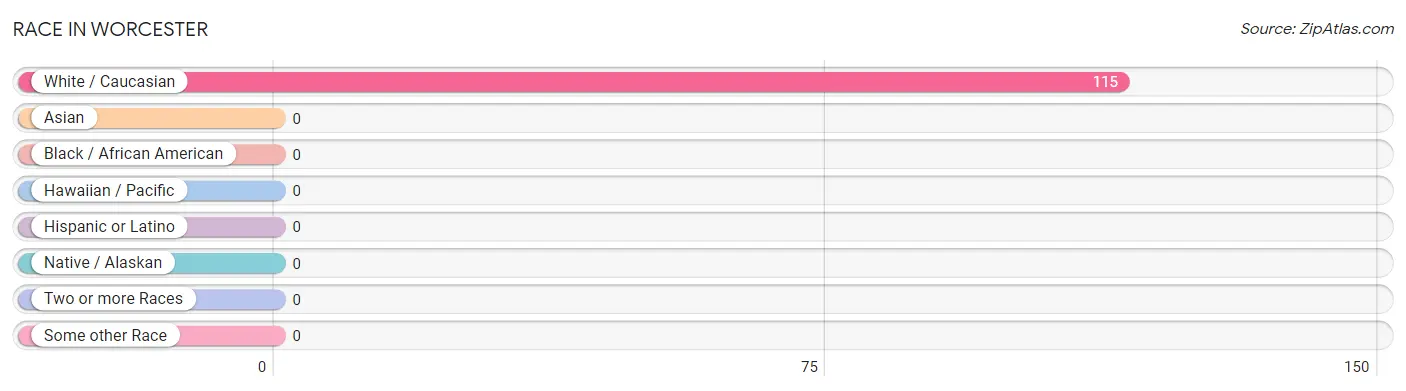
| Race | # Population | % Population |
| Asian | 0 | 0.0% |
| Black / African American | 0 | 0.0% |
| Hawaiian / Pacific | 0 | 0.0% |
| Hispanic or Latino | 0 | 0.0% |
| Native / Alaskan | 0 | 0.0% |
| White / Caucasian | 115 | 100.0% |
| Two or more Races | 0 | 0.0% |
| Some other Race | 0 | 0.0% |
| Total | 115 | 100.0% |
Ancestry in Worcester
The most populous ancestries reported in Worcester are English (37 | 32.2%), French (33 | 28.7%), German (20 | 17.4%), Irish (12 | 10.4%), and Italian (9 | 7.8%), together accounting for 96.5% of all Worcester residents.
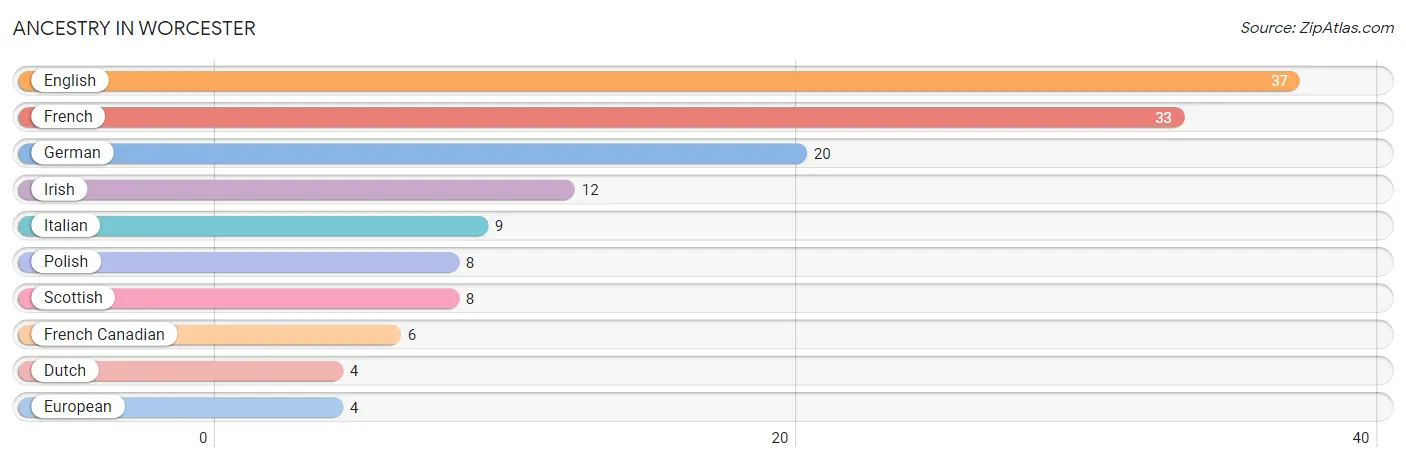
| Ancestry | # Population | % Population |
| Dutch | 4 | 3.5% |
| English | 37 | 32.2% |
| European | 4 | 3.5% |
| French | 33 | 28.7% |
| French Canadian | 6 | 5.2% |
| German | 20 | 17.4% |
| Irish | 12 | 10.4% |
| Italian | 9 | 7.8% |
| Polish | 8 | 7.0% |
| Scottish | 8 | 7.0% | View All 10 Rows |
Immigrants in Worcester
The most numerous immigrant groups reported in Worcester came from , and Canada (3 | 2.6%), together accounting for 2.6% of all Worcester residents.

| Immigration Origin | # Population | % Population |
| Canada | 3 | 2.6% | View All 1 Rows |
Sex and Age in Worcester
Sex and Age in Worcester
The most populous age groups in Worcester are 20 to 24 Years (24 | 40.7%) for men and 50 to 54 Years (16 | 28.6%) for women.
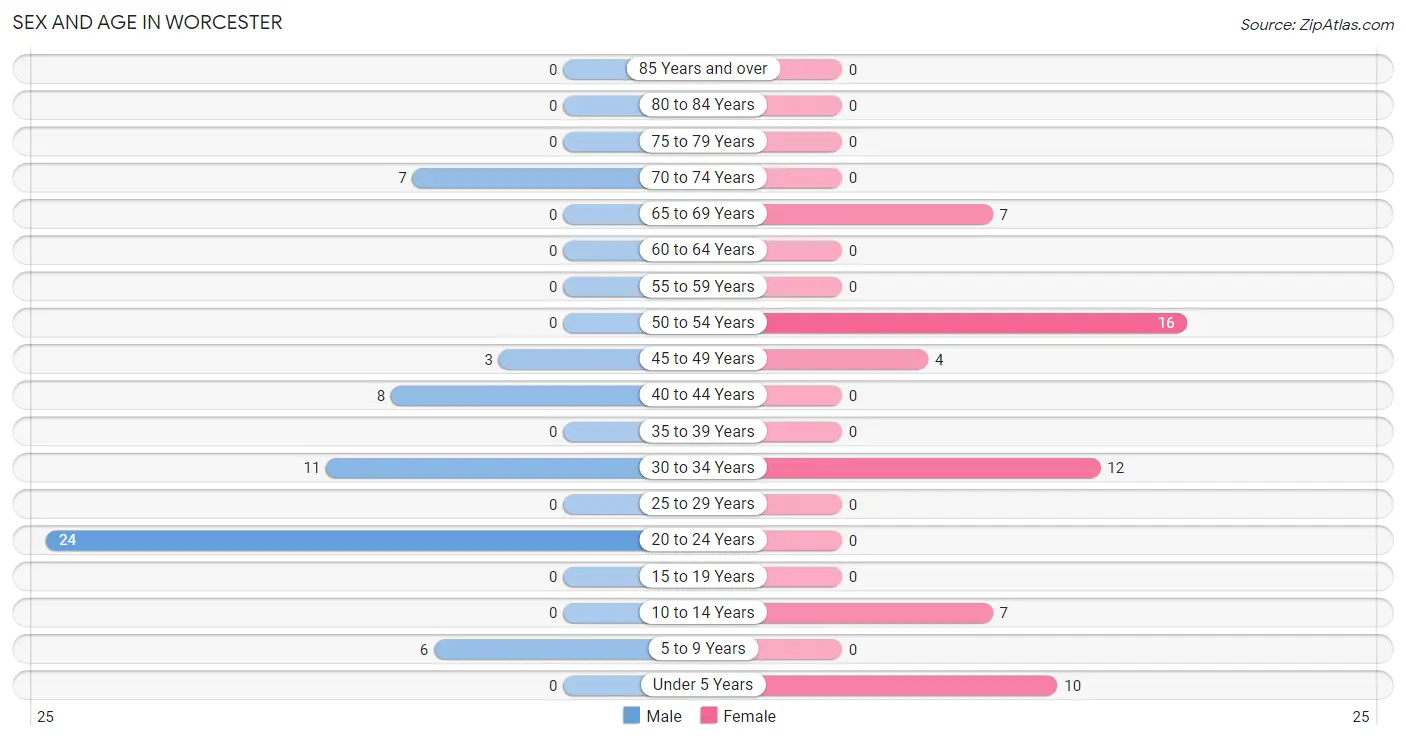
| Age Bracket | Male | Female |
| Under 5 Years | 0 (0.0%) | 10 (17.9%) |
| 5 to 9 Years | 6 (10.2%) | 0 (0.0%) |
| 10 to 14 Years | 0 (0.0%) | 7 (12.5%) |
| 15 to 19 Years | 0 (0.0%) | 0 (0.0%) |
| 20 to 24 Years | 24 (40.7%) | 0 (0.0%) |
| 25 to 29 Years | 0 (0.0%) | 0 (0.0%) |
| 30 to 34 Years | 11 (18.6%) | 12 (21.4%) |
| 35 to 39 Years | 0 (0.0%) | 0 (0.0%) |
| 40 to 44 Years | 8 (13.6%) | 0 (0.0%) |
| 45 to 49 Years | 3 (5.1%) | 4 (7.1%) |
| 50 to 54 Years | 0 (0.0%) | 16 (28.6%) |
| 55 to 59 Years | 0 (0.0%) | 0 (0.0%) |
| 60 to 64 Years | 0 (0.0%) | 0 (0.0%) |
| 65 to 69 Years | 0 (0.0%) | 7 (12.5%) |
| 70 to 74 Years | 7 (11.9%) | 0 (0.0%) |
| 75 to 79 Years | 0 (0.0%) | 0 (0.0%) |
| 80 to 84 Years | 0 (0.0%) | 0 (0.0%) |
| 85 Years and over | 0 (0.0%) | 0 (0.0%) |
| Total | 59 (100.0%) | 56 (100.0%) |
Families and Households in Worcester
Median Family Size in Worcester
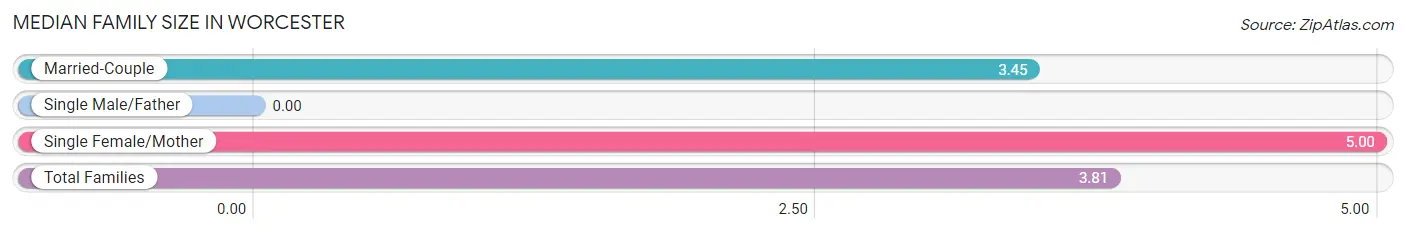
| Family Type | # Families | Family Size |
| Married-Couple | 20 (76.9%) | 3.45 |
| Single Male/Father | 0 (0.0%) | - |
| Single Female/Mother | 6 (23.1%) | 5.00 |
| Total Families | 26 (100.0%) | 3.81 |
Median Household Size in Worcester
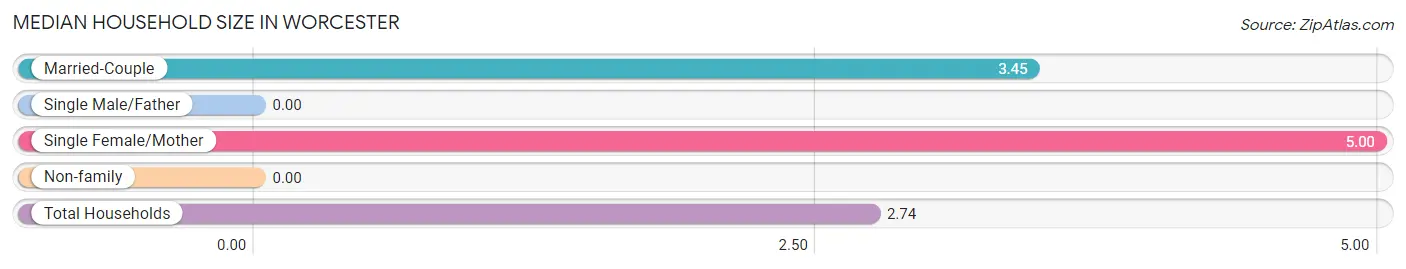
| Household Type | # Households | Household Size |
| Married-Couple | 20 (47.6%) | 3.45 |
| Single Male/Father | 0 (0.0%) | - |
| Single Female/Mother | 6 (14.3%) | 5.00 |
| Non-family | 16 (38.1%) | - |
| Total Households | 42 (100.0%) | 2.74 |
Household Size by Marriage Status in Worcester
Out of a total of 42 households in Worcester, 26 (61.9%) are family households, while 16 (38.1%) are nonfamily households. The most numerous type of family households are 3-person households, comprising 13, and the most common type of nonfamily households are 1-person households, comprising 16.
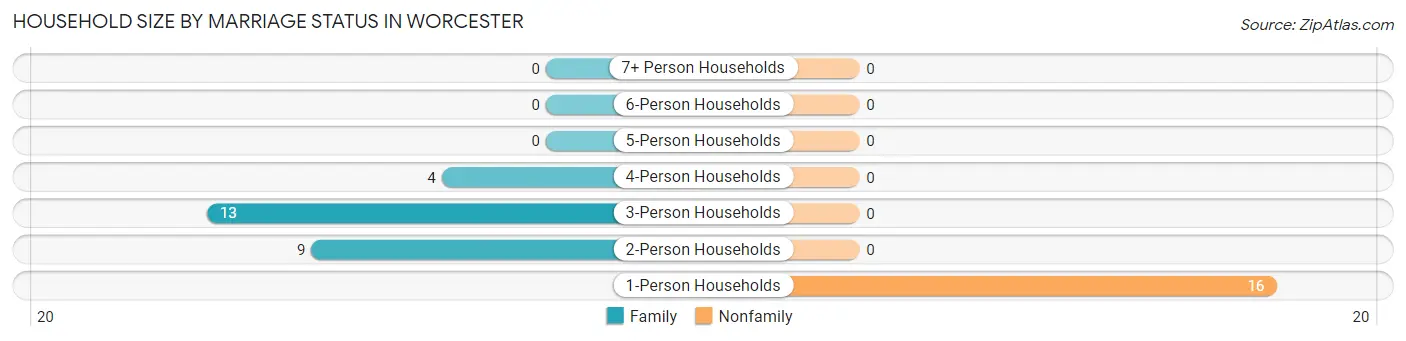
| Household Size | Family Households | Nonfamily Households |
| 1-Person Households | - | 16 (38.1%) |
| 2-Person Households | 9 (21.4%) | 0 (0.0%) |
| 3-Person Households | 13 (30.9%) | 0 (0.0%) |
| 4-Person Households | 4 (9.5%) | 0 (0.0%) |
| 5-Person Households | 0 (0.0%) | 0 (0.0%) |
| 6-Person Households | 0 (0.0%) | 0 (0.0%) |
| 7+ Person Households | 0 (0.0%) | 0 (0.0%) |
| Total | 26 (61.9%) | 16 (38.1%) |
Female Fertility in Worcester
Fertility by Age in Worcester
| Age Bracket | Women with Births | Births / 1,000 Women |
| 15 to 19 years | 0 (0.0%) | 0.0 |
| 20 to 34 years | 0 (0.0%) | 0.0 |
| 35 to 50 years | 0 (0.0%) | 0.0 |
| Total | 0 (0.0%) | 0.0 |
Fertility by Age by Marriage Status in Worcester
| Age Bracket | Married | Unmarried |
| 15 to 19 years | 0 (0.0%) | 0 (0.0%) |
| 20 to 34 years | 0 (0.0%) | 0 (0.0%) |
| 35 to 50 years | 0 (0.0%) | 0 (0.0%) |
| Total | 0 (0.0%) | 0 (0.0%) |
Fertility by Education in Worcester
| Educational Attainment | Women with Births | Births / 1,000 Women |
| Less than High School | 0 (0.0%) | 0.0 |
| High School Diploma | 0 (0.0%) | 0.0 |
| College or Associate's Degree | 0 (0.0%) | 0.0 |
| Bachelor's Degree | 0 (0.0%) | 0.0 |
| Graduate Degree | 0 (0.0%) | 0.0 |
| Total | 0 (0.0%) | 0.0 |
Fertility by Education by Marriage Status in Worcester
| Educational Attainment | Married | Unmarried |
| Less than High School | 0 (0.0%) | 0 (0.0%) |
| High School Diploma | 0 (0.0%) | 0 (0.0%) |
| College or Associate's Degree | 0 (0.0%) | 0 (0.0%) |
| Bachelor's Degree | 0 (0.0%) | 0 (0.0%) |
| Graduate Degree | 0 (0.0%) | 0 (0.0%) |
| Total | 0 (0.0%) | 0 (0.0%) |
Employment Characteristics in Worcester
Employment by Class of Employer in Worcester
Among the 37 employed individuals in Worcester, state government employees (16 | 43.2%), local government employees (14 | 37.8%), and private company employees (4 | 10.8%) make up the most common classes of employment.
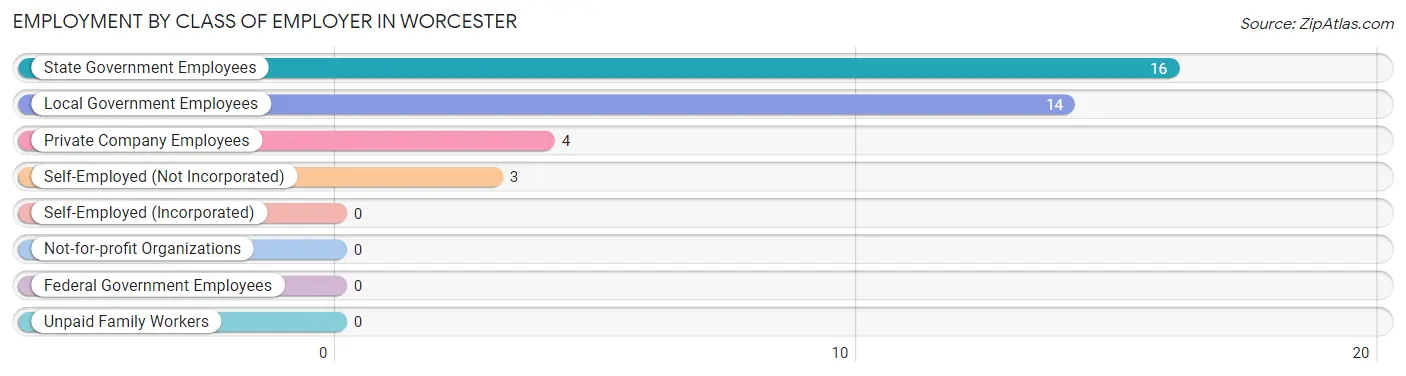
| Employer Class | # Employees | % Employees |
| Private Company Employees | 4 | 10.8% |
| Self-Employed (Incorporated) | 0 | 0.0% |
| Self-Employed (Not Incorporated) | 3 | 8.1% |
| Not-for-profit Organizations | 0 | 0.0% |
| Local Government Employees | 14 | 37.8% |
| State Government Employees | 16 | 43.2% |
| Federal Government Employees | 0 | 0.0% |
| Unpaid Family Workers | 0 | 0.0% |
| Total | 37 | 100.0% |
Employment Status by Age in Worcester
According to the labor force statistics for Worcester, out of the total population over 16 years of age (92), 66.3% or 61 individuals are in the labor force, with 39.3% or 24 of them unemployed. The age group with the highest labor force participation rate is 20 to 24 years, with 100.0% or 24 individuals in the labor force. Within the labor force, the 20 to 24 years age range has the highest percentage of unemployed individuals, with 100.0% or 24 of them being unemployed.
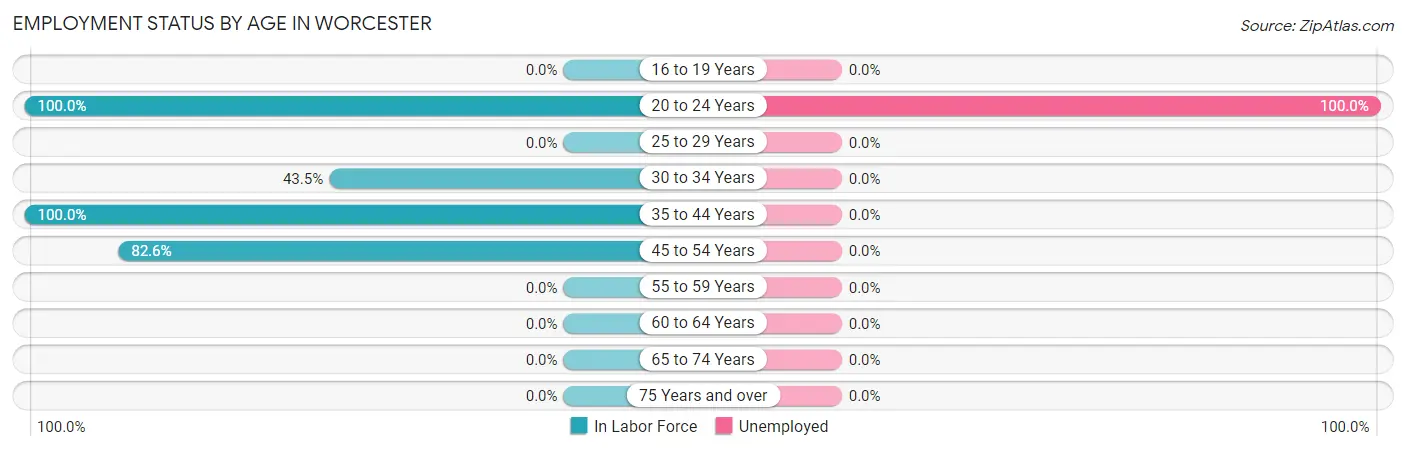
| Age Bracket | In Labor Force | Unemployed |
| 16 to 19 Years | 0 (0.0%) | 0 (0.0%) |
| 20 to 24 Years | 24 (100.0%) | 24 (100.0%) |
| 25 to 29 Years | 0 (0.0%) | 0 (0.0%) |
| 30 to 34 Years | 10 (43.5%) | 0 (0.0%) |
| 35 to 44 Years | 8 (100.0%) | 0 (0.0%) |
| 45 to 54 Years | 19 (82.6%) | 0 (0.0%) |
| 55 to 59 Years | 0 (0.0%) | 0 (0.0%) |
| 60 to 64 Years | 0 (0.0%) | 0 (0.0%) |
| 65 to 74 Years | 0 (0.0%) | 0 (0.0%) |
| 75 Years and over | 0 (0.0%) | 0 (0.0%) |
| Total | 61 (66.3%) | 24 (39.3%) |
Employment Status by Educational Attainment in Worcester
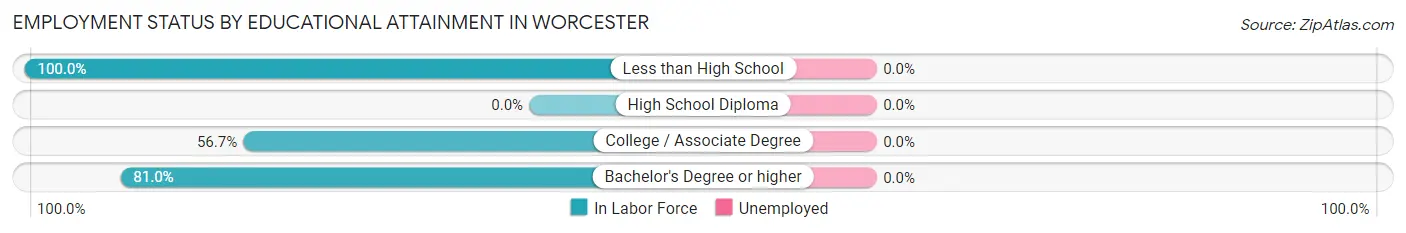
| Educational Attainment | In Labor Force | Unemployed |
| Less than High School | 3 (100.0%) | 0 (0.0%) |
| High School Diploma | 0 (0.0%) | 0 (0.0%) |
| College / Associate Degree | 17 (56.7%) | 0 (0.0%) |
| Bachelor's Degree or higher | 17 (81.0%) | 0 (0.0%) |
| Total | 37 (68.5%) | 0 (0.0%) |
Employment Occupations by Sex in Worcester
Management, Business, Science and Arts Occupations
The most common Management, Business, Science and Arts occupations in Worcester are Management (10 | 27.0%), Community & Social Service (10 | 27.0%), Education Instruction & Library (10 | 27.0%), Computers, Engineering & Science (4 | 10.8%), and Life, Physical & Social Science (4 | 10.8%).
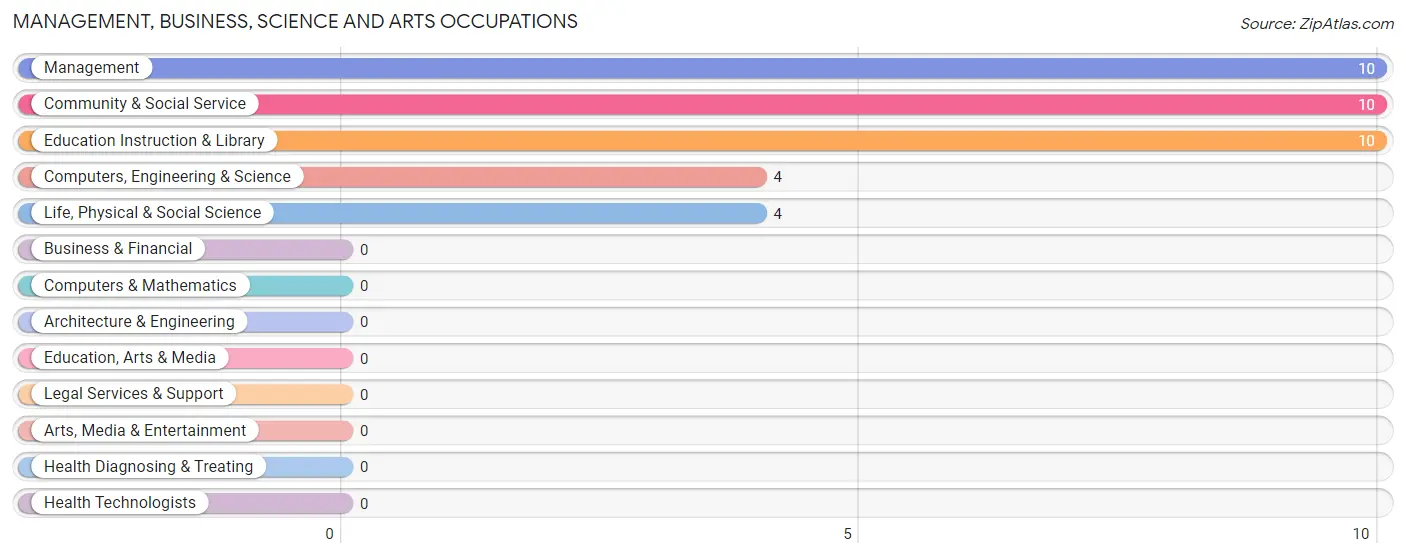
Management, Business, Science and Arts Occupations by Sex
Within the Management, Business, Science and Arts occupations in Worcester, the most male-oriented occupations are Computers, Engineering & Science (100.0%), Life, Physical & Social Science (100.0%), and Community & Social Service (70.0%), while the most female-oriented occupations are Management (100.0%), Community & Social Service (30.0%), and Education Instruction & Library (30.0%).
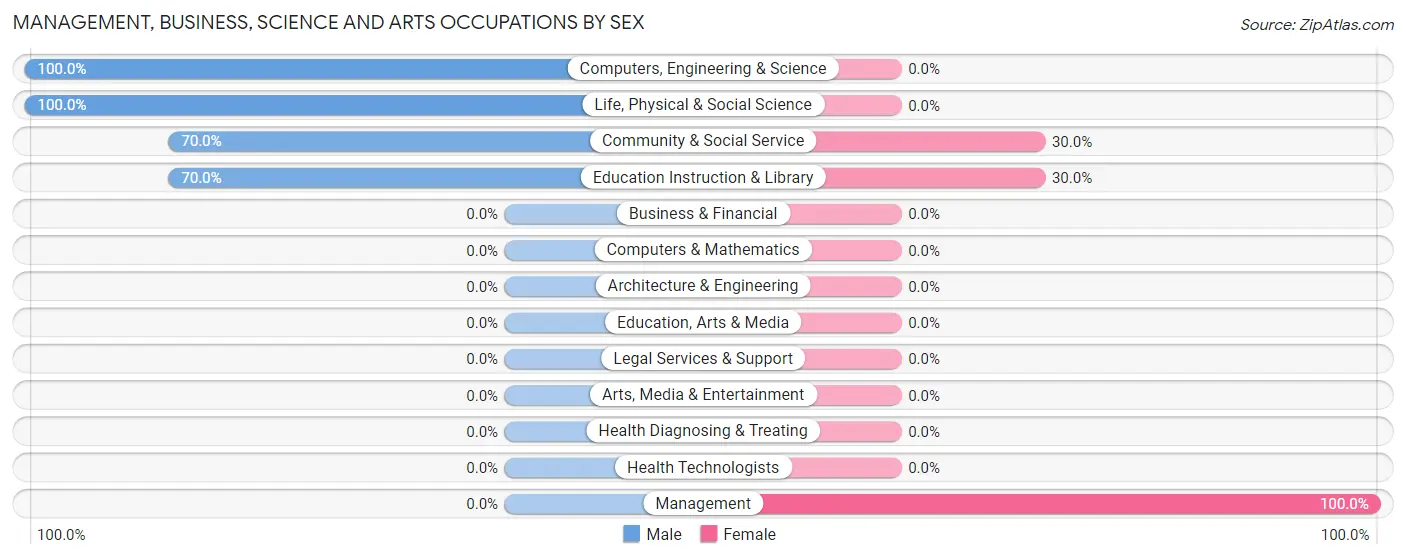
| Occupation | Male | Female |
| Management | 0 (0.0%) | 10 (100.0%) |
| Business & Financial | 0 (0.0%) | 0 (0.0%) |
| Computers, Engineering & Science | 4 (100.0%) | 0 (0.0%) |
| Computers & Mathematics | 0 (0.0%) | 0 (0.0%) |
| Architecture & Engineering | 0 (0.0%) | 0 (0.0%) |
| Life, Physical & Social Science | 4 (100.0%) | 0 (0.0%) |
| Community & Social Service | 7 (70.0%) | 3 (30.0%) |
| Education, Arts & Media | 0 (0.0%) | 0 (0.0%) |
| Legal Services & Support | 0 (0.0%) | 0 (0.0%) |
| Education Instruction & Library | 7 (70.0%) | 3 (30.0%) |
| Arts, Media & Entertainment | 0 (0.0%) | 0 (0.0%) |
| Health Diagnosing & Treating | 0 (0.0%) | 0 (0.0%) |
| Health Technologists | 0 (0.0%) | 0 (0.0%) |
| Total (Category) | 11 (45.8%) | 13 (54.2%) |
| Total (Overall) | 18 (48.6%) | 19 (51.3%) |
Services Occupations
Services Occupations by Sex
| Occupation | Male | Female |
| Healthcare Support | 0 (0.0%) | 0 (0.0%) |
| Security & Protection | 0 (0.0%) | 0 (0.0%) |
| Firefighting & Prevention | 0 (0.0%) | 0 (0.0%) |
| Law Enforcement | 0 (0.0%) | 0 (0.0%) |
| Food Preparation & Serving | 0 (0.0%) | 0 (0.0%) |
| Cleaning & Maintenance | 0 (0.0%) | 0 (0.0%) |
| Personal Care & Service | 0 (0.0%) | 0 (0.0%) |
| Total (Category) | 0 (0.0%) | 0 (0.0%) |
| Total (Overall) | 18 (48.6%) | 19 (51.3%) |
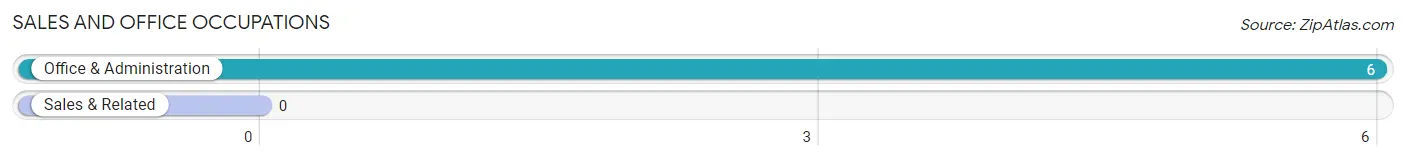
Sales and Office Occupations
The most common Sales and Office occupations in Worcester are , and Office & Administration (6 | 16.2%).
Sales and Office Occupations by Sex
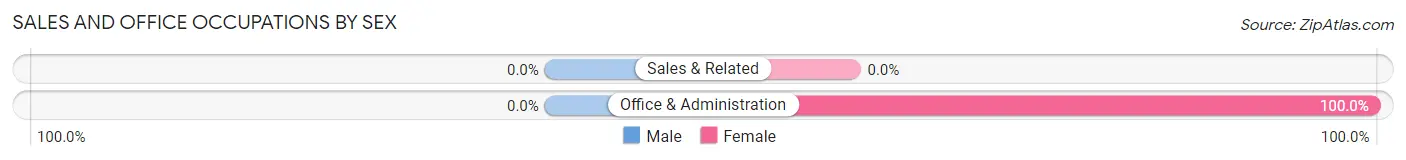
| Occupation | Male | Female |
| Sales & Related | 0 (0.0%) | 0 (0.0%) |
| Office & Administration | 0 (0.0%) | 6 (100.0%) |
| Total (Category) | 0 (0.0%) | 6 (100.0%) |
| Total (Overall) | 18 (48.6%) | 19 (51.3%) |
Natural Resources, Construction and Maintenance Occupations
The most common Natural Resources, Construction and Maintenance occupations in Worcester are , and Installation, Maintenance & Repair (4 | 10.8%).
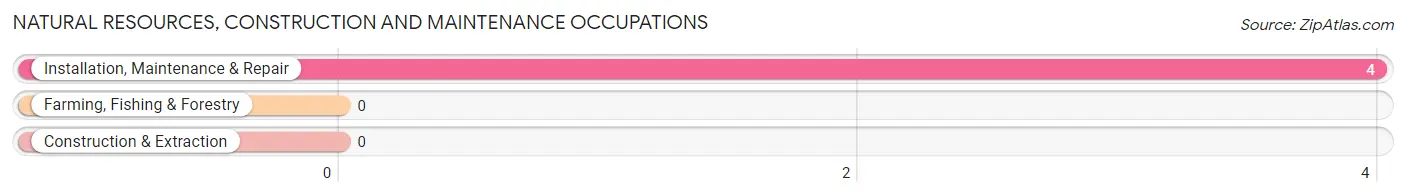
Natural Resources, Construction and Maintenance Occupations by Sex
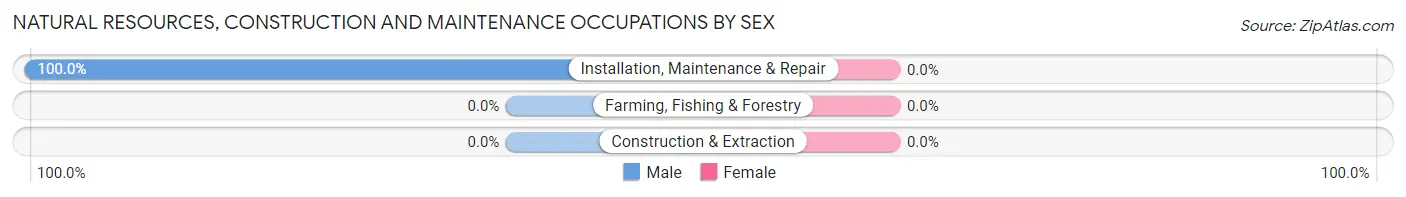
| Occupation | Male | Female |
| Farming, Fishing & Forestry | 0 (0.0%) | 0 (0.0%) |
| Construction & Extraction | 0 (0.0%) | 0 (0.0%) |
| Installation, Maintenance & Repair | 4 (100.0%) | 0 (0.0%) |
| Total (Category) | 4 (100.0%) | 0 (0.0%) |
| Total (Overall) | 18 (48.6%) | 19 (51.3%) |
Production, Transportation and Moving Occupations
The most common Production, Transportation and Moving occupations in Worcester are , and Production (3 | 8.1%).
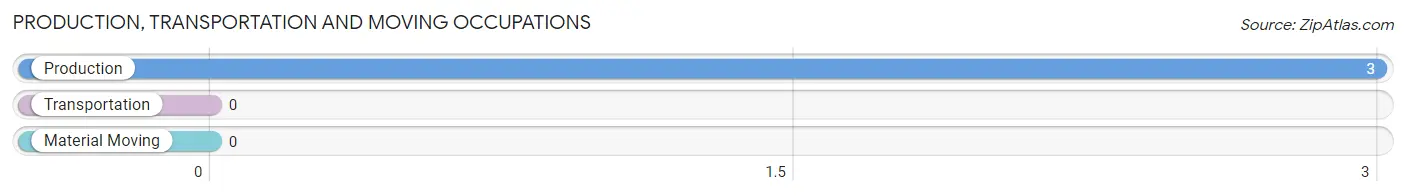
Production, Transportation and Moving Occupations by Sex
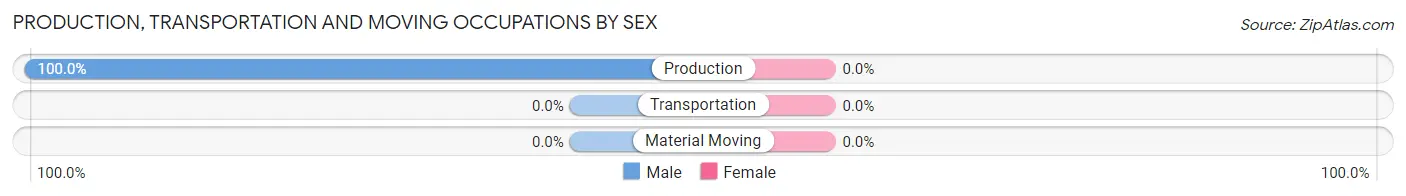
| Occupation | Male | Female |
| Production | 3 (100.0%) | 0 (0.0%) |
| Transportation | 0 (0.0%) | 0 (0.0%) |
| Material Moving | 0 (0.0%) | 0 (0.0%) |
| Total (Category) | 3 (100.0%) | 0 (0.0%) |
| Total (Overall) | 18 (48.6%) | 19 (51.3%) |
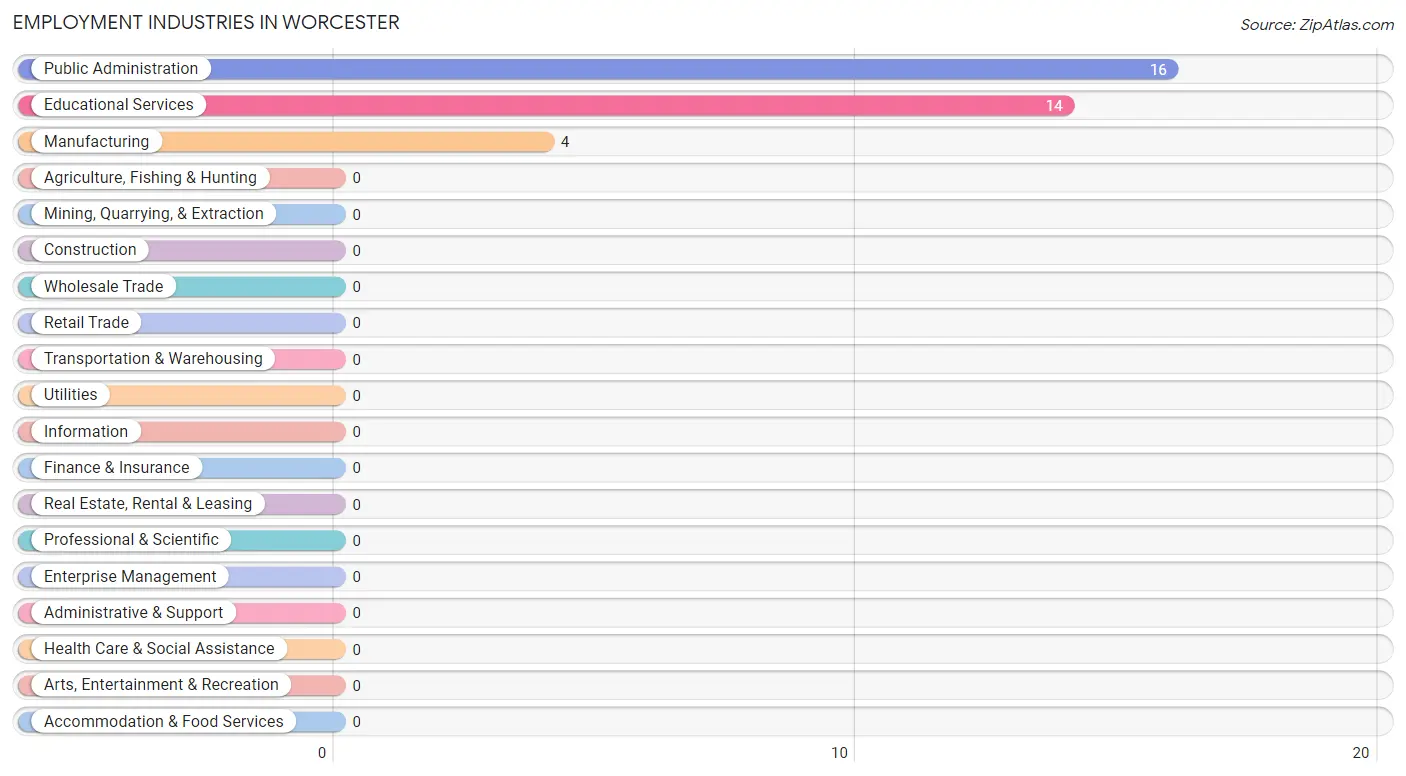
Employment Industries by Sex in Worcester
Employment Industries in Worcester
The major employment industries in Worcester include Public Administration (16 | 43.2%), Educational Services (14 | 37.8%), and Manufacturing (4 | 10.8%).
Employment Industries by Sex in Worcester
The Worcester industries that see more men than women are Manufacturing (100.0%), and Educational Services (78.6%), whereas the industries that tend to have a higher number of women are Public Administration (100.0%), and Educational Services (21.4%).
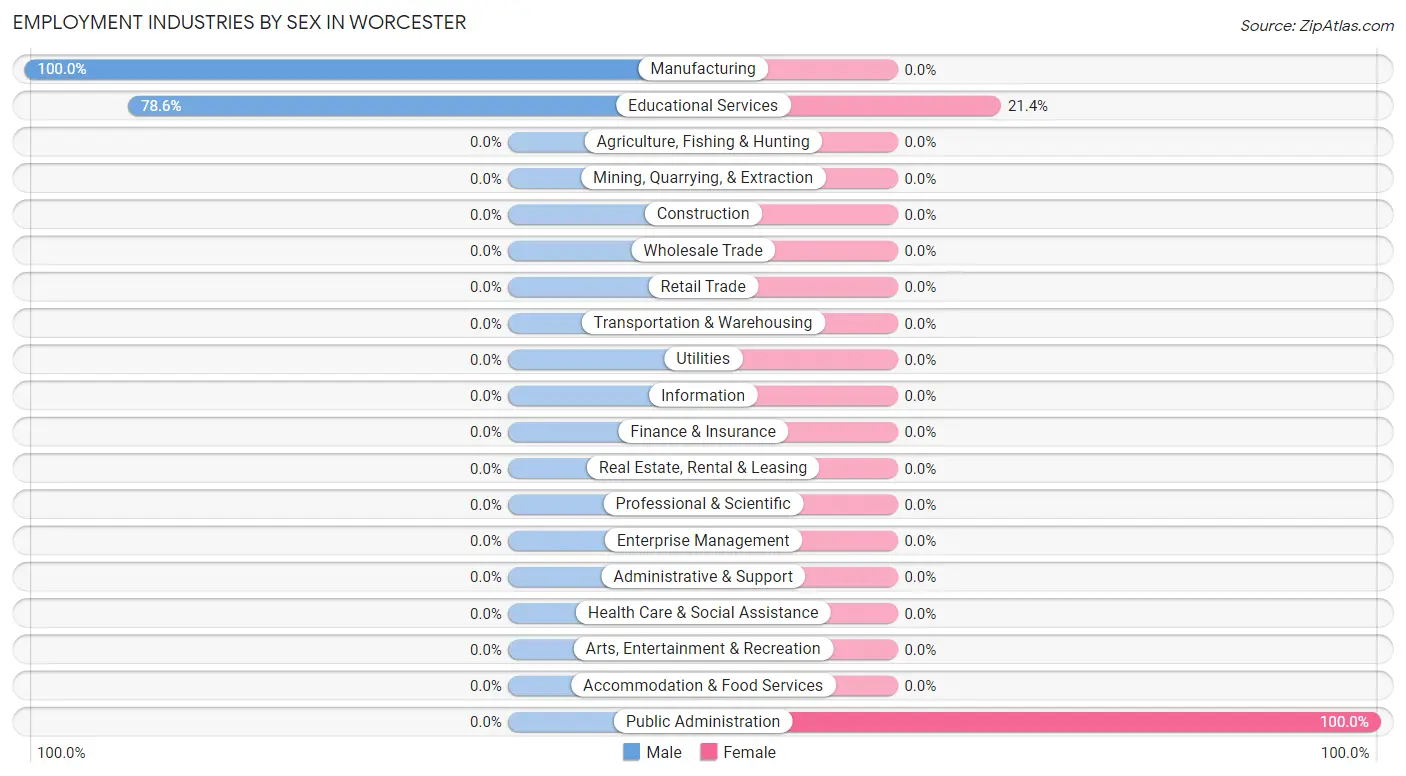
| Industry | Male | Female |
| Agriculture, Fishing & Hunting | 0 (0.0%) | 0 (0.0%) |
| Mining, Quarrying, & Extraction | 0 (0.0%) | 0 (0.0%) |
| Construction | 0 (0.0%) | 0 (0.0%) |
| Manufacturing | 4 (100.0%) | 0 (0.0%) |
| Wholesale Trade | 0 (0.0%) | 0 (0.0%) |
| Retail Trade | 0 (0.0%) | 0 (0.0%) |
| Transportation & Warehousing | 0 (0.0%) | 0 (0.0%) |
| Utilities | 0 (0.0%) | 0 (0.0%) |
| Information | 0 (0.0%) | 0 (0.0%) |
| Finance & Insurance | 0 (0.0%) | 0 (0.0%) |
| Real Estate, Rental & Leasing | 0 (0.0%) | 0 (0.0%) |
| Professional & Scientific | 0 (0.0%) | 0 (0.0%) |
| Enterprise Management | 0 (0.0%) | 0 (0.0%) |
| Administrative & Support | 0 (0.0%) | 0 (0.0%) |
| Educational Services | 11 (78.6%) | 3 (21.4%) |
| Health Care & Social Assistance | 0 (0.0%) | 0 (0.0%) |
| Arts, Entertainment & Recreation | 0 (0.0%) | 0 (0.0%) |
| Accommodation & Food Services | 0 (0.0%) | 0 (0.0%) |
| Public Administration | 0 (0.0%) | 16 (100.0%) |
| Total | 18 (48.6%) | 19 (51.3%) |
Education in Worcester
School Enrollment in Worcester
The most common levels of schooling among the 40 students in Worcester are graduate / professional (27 | 67.5%), middle school (7 | 17.5%), and elementary school (6 | 15.0%).
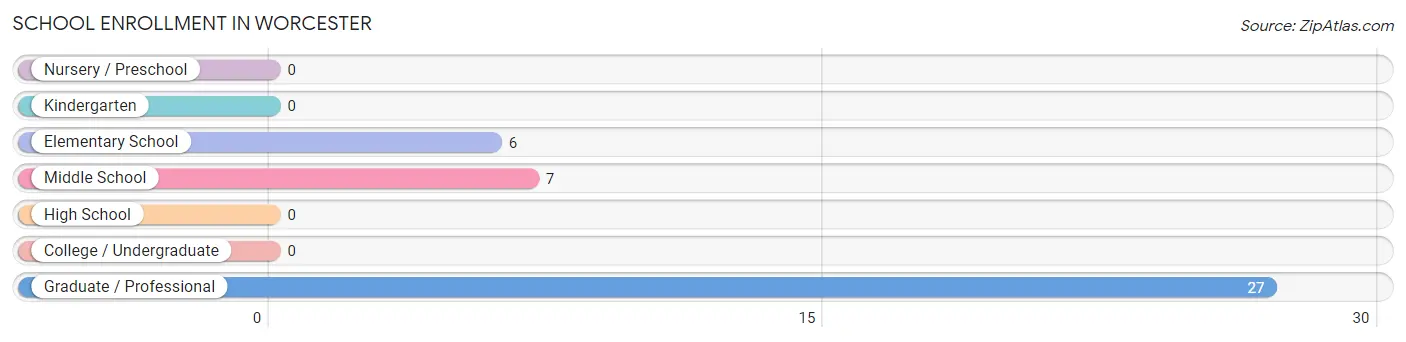
| School Level | # Students | % Students |
| Nursery / Preschool | 0 | 0.0% |
| Kindergarten | 0 | 0.0% |
| Elementary School | 6 | 15.0% |
| Middle School | 7 | 17.5% |
| High School | 0 | 0.0% |
| College / Undergraduate | 0 | 0.0% |
| Graduate / Professional | 27 | 67.5% |
| Total | 40 | 100.0% |
School Enrollment by Age by Funding Source in Worcester
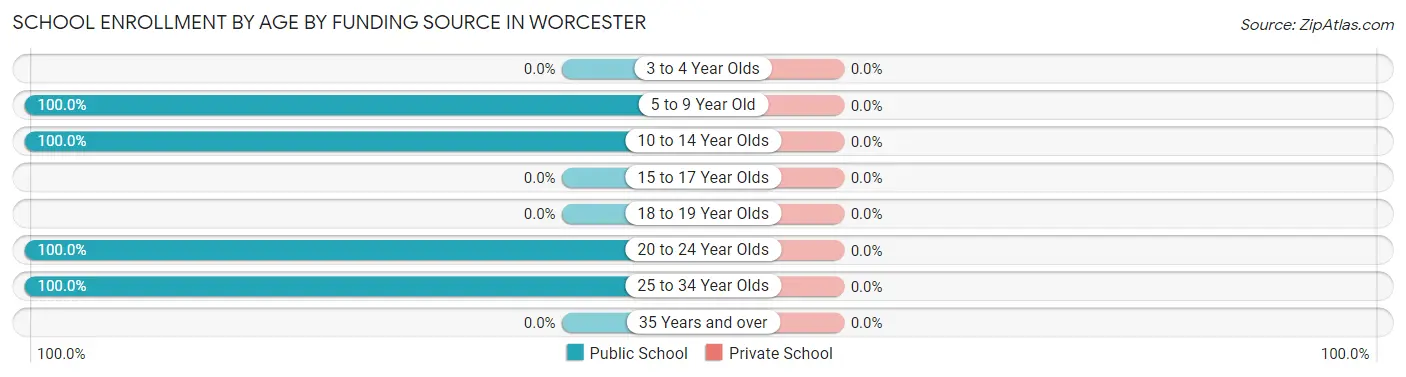
| Age Bracket | Public School | Private School |
| 3 to 4 Year Olds | 0 (0.0%) | 0 (0.0%) |
| 5 to 9 Year Old | 6 (100.0%) | 0 (0.0%) |
| 10 to 14 Year Olds | 7 (100.0%) | 0 (0.0%) |
| 15 to 17 Year Olds | 0 (0.0%) | 0 (0.0%) |
| 18 to 19 Year Olds | 0 (0.0%) | 0 (0.0%) |
| 20 to 24 Year Olds | 24 (100.0%) | 0 (0.0%) |
| 25 to 34 Year Olds | 3 (100.0%) | 0 (0.0%) |
| 35 Years and over | 0 (0.0%) | 0 (0.0%) |
| Total | 40 (100.0%) | 0 (0.0%) |
Educational Attainment by Field of Study in Worcester
Science & technology (11 | 29.7%), education (10 | 27.0%), psychology (4 | 10.8%), social sciences (4 | 10.8%), and literature & languages (4 | 10.8%) are the most common fields of study among 37 individuals in Worcester who have obtained a bachelor's degree or higher.
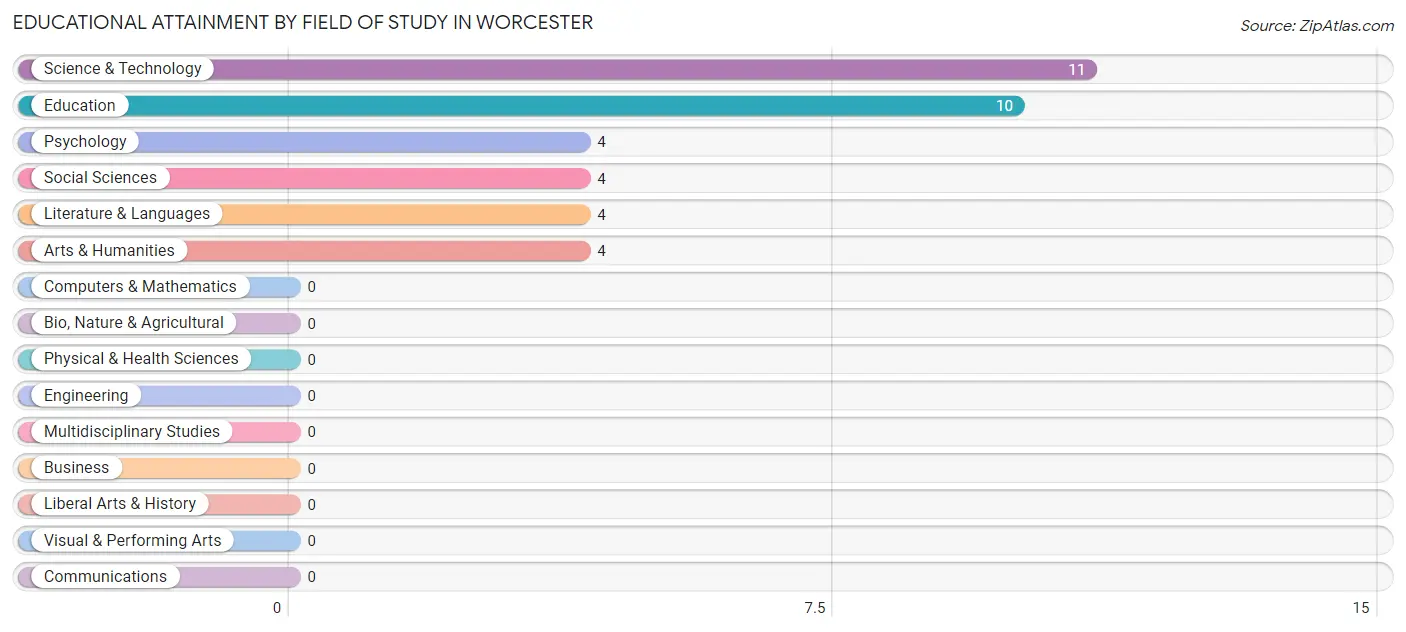
| Field of Study | # Graduates | % Graduates |
| Computers & Mathematics | 0 | 0.0% |
| Bio, Nature & Agricultural | 0 | 0.0% |
| Physical & Health Sciences | 0 | 0.0% |
| Psychology | 4 | 10.8% |
| Social Sciences | 4 | 10.8% |
| Engineering | 0 | 0.0% |
| Multidisciplinary Studies | 0 | 0.0% |
| Science & Technology | 11 | 29.7% |
| Business | 0 | 0.0% |
| Education | 10 | 27.0% |
| Literature & Languages | 4 | 10.8% |
| Liberal Arts & History | 0 | 0.0% |
| Visual & Performing Arts | 0 | 0.0% |
| Communications | 0 | 0.0% |
| Arts & Humanities | 4 | 10.8% |
| Total | 37 | 100.0% |
Transportation & Commute in Worcester
Vehicle Availability by Sex in Worcester
The most prevalent vehicle ownership categories in Worcester are males with 2 vehicles (11, accounting for 61.1%) and females with 2 vehicles (0, making up 57.9%).
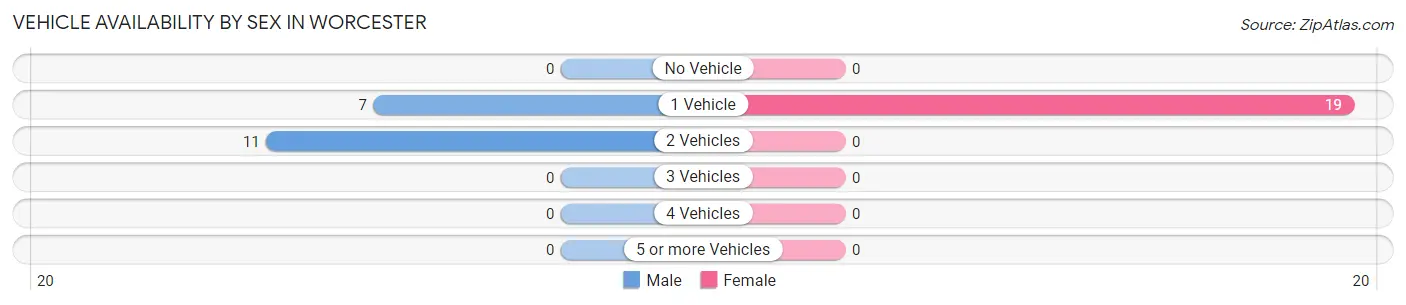
| Vehicles Available | Male | Female |
| No Vehicle | 0 (0.0%) | 0 (0.0%) |
| 1 Vehicle | 7 (38.9%) | 19 (100.0%) |
| 2 Vehicles | 11 (61.1%) | 0 (0.0%) |
| 3 Vehicles | 0 (0.0%) | 0 (0.0%) |
| 4 Vehicles | 0 (0.0%) | 0 (0.0%) |
| 5 or more Vehicles | 0 (0.0%) | 0 (0.0%) |
| Total | 18 (100.0%) | 19 (100.0%) |
Commute Time in Worcester
The most frequently occuring commute durations in Worcester are 25 to 29 minutes (14 commuters, 41.2%), 20 to 24 minutes (13 commuters, 38.2%), and 40 to 44 minutes (4 commuters, 11.8%).
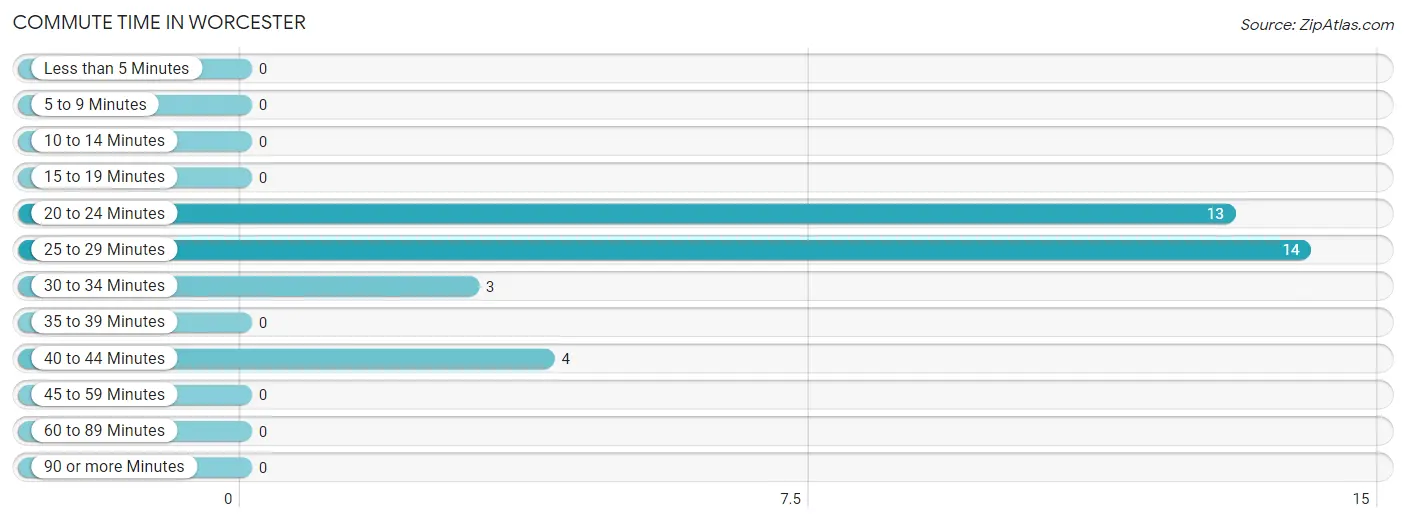
| Commute Time | # Commuters | % Commuters |
| Less than 5 Minutes | 0 | 0.0% |
| 5 to 9 Minutes | 0 | 0.0% |
| 10 to 14 Minutes | 0 | 0.0% |
| 15 to 19 Minutes | 0 | 0.0% |
| 20 to 24 Minutes | 13 | 38.2% |
| 25 to 29 Minutes | 14 | 41.2% |
| 30 to 34 Minutes | 3 | 8.8% |
| 35 to 39 Minutes | 0 | 0.0% |
| 40 to 44 Minutes | 4 | 11.8% |
| 45 to 59 Minutes | 0 | 0.0% |
| 60 to 89 Minutes | 0 | 0.0% |
| 90 or more Minutes | 0 | 0.0% |
Commute Time by Sex in Worcester
The most common commute times in Worcester are 20 to 24 minutes (7 commuters, 46.7%) for males and 25 to 29 minutes (10 commuters, 52.6%) for females.
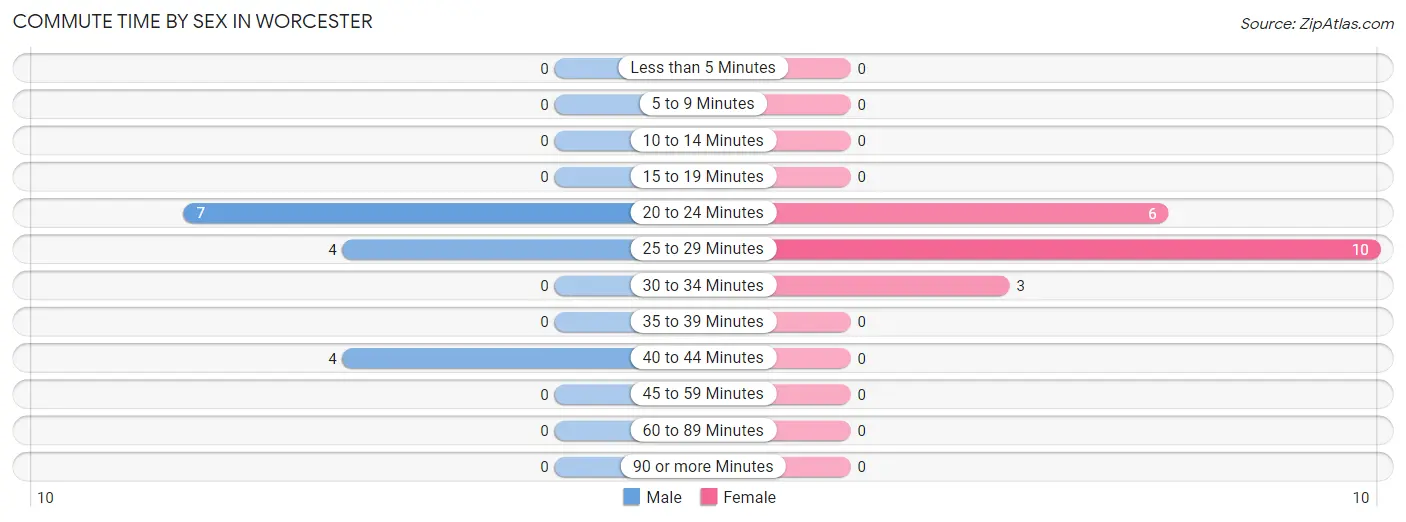
| Commute Time | Male | Female |
| Less than 5 Minutes | 0 (0.0%) | 0 (0.0%) |
| 5 to 9 Minutes | 0 (0.0%) | 0 (0.0%) |
| 10 to 14 Minutes | 0 (0.0%) | 0 (0.0%) |
| 15 to 19 Minutes | 0 (0.0%) | 0 (0.0%) |
| 20 to 24 Minutes | 7 (46.7%) | 6 (31.6%) |
| 25 to 29 Minutes | 4 (26.7%) | 10 (52.6%) |
| 30 to 34 Minutes | 0 (0.0%) | 3 (15.8%) |
| 35 to 39 Minutes | 0 (0.0%) | 0 (0.0%) |
| 40 to 44 Minutes | 4 (26.7%) | 0 (0.0%) |
| 45 to 59 Minutes | 0 (0.0%) | 0 (0.0%) |
| 60 to 89 Minutes | 0 (0.0%) | 0 (0.0%) |
| 90 or more Minutes | 0 (0.0%) | 0 (0.0%) |
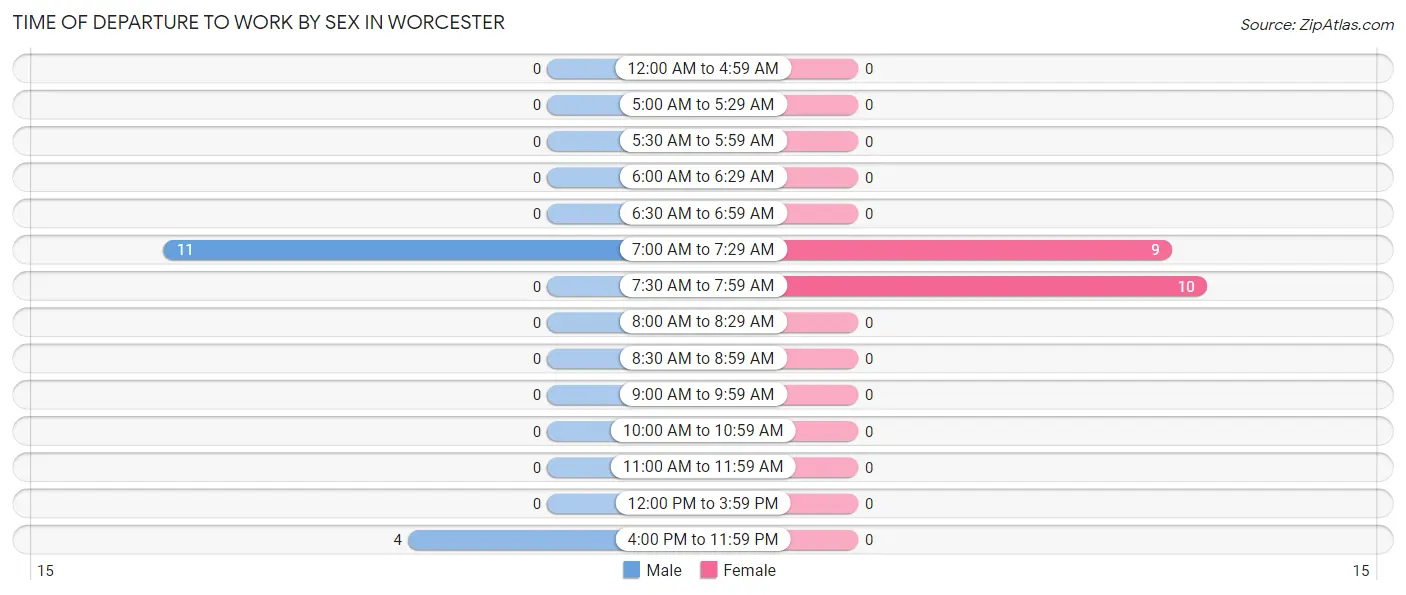
Time of Departure to Work by Sex in Worcester
The most frequent times of departure to work in Worcester are 7:00 AM to 7:29 AM (11, 73.3%) for males and 7:30 AM to 7:59 AM (10, 52.6%) for females.
| Time of Departure | Male | Female |
| 12:00 AM to 4:59 AM | 0 (0.0%) | 0 (0.0%) |
| 5:00 AM to 5:29 AM | 0 (0.0%) | 0 (0.0%) |
| 5:30 AM to 5:59 AM | 0 (0.0%) | 0 (0.0%) |
| 6:00 AM to 6:29 AM | 0 (0.0%) | 0 (0.0%) |
| 6:30 AM to 6:59 AM | 0 (0.0%) | 0 (0.0%) |
| 7:00 AM to 7:29 AM | 11 (73.3%) | 9 (47.4%) |
| 7:30 AM to 7:59 AM | 0 (0.0%) | 10 (52.6%) |
| 8:00 AM to 8:29 AM | 0 (0.0%) | 0 (0.0%) |
| 8:30 AM to 8:59 AM | 0 (0.0%) | 0 (0.0%) |
| 9:00 AM to 9:59 AM | 0 (0.0%) | 0 (0.0%) |
| 10:00 AM to 10:59 AM | 0 (0.0%) | 0 (0.0%) |
| 11:00 AM to 11:59 AM | 0 (0.0%) | 0 (0.0%) |
| 12:00 PM to 3:59 PM | 0 (0.0%) | 0 (0.0%) |
| 4:00 PM to 11:59 PM | 4 (26.7%) | 0 (0.0%) |
| Total | 15 (100.0%) | 19 (100.0%) |
Housing Occupancy in Worcester
Occupancy by Ownership in Worcester
Of the total 42 dwellings in Worcester, owner-occupied units account for 17 (40.5%), while renter-occupied units make up 25 (59.5%).
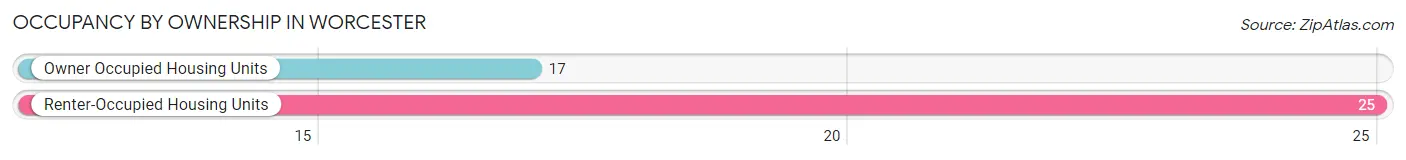
| Occupancy | # Housing Units | % Housing Units |
| Owner Occupied Housing Units | 17 | 40.5% |
| Renter-Occupied Housing Units | 25 | 59.5% |
| Total Occupied Housing Units | 42 | 100.0% |
Occupancy by Household Size in Worcester
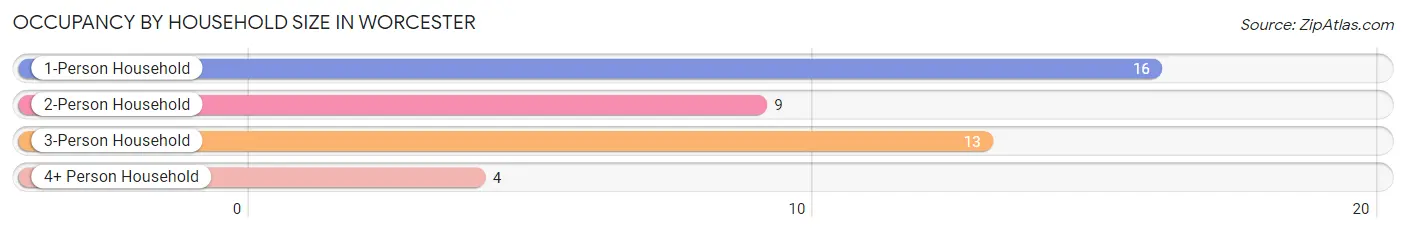
| Household Size | # Housing Units | % Housing Units |
| 1-Person Household | 16 | 38.1% |
| 2-Person Household | 9 | 21.4% |
| 3-Person Household | 13 | 30.9% |
| 4+ Person Household | 4 | 9.5% |
| Total Housing Units | 42 | 100.0% |
Occupancy by Ownership by Household Size in Worcester
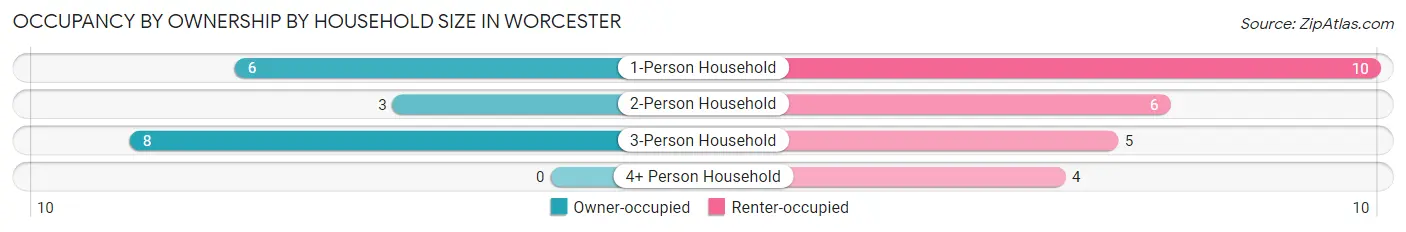
| Household Size | Owner-occupied | Renter-occupied |
| 1-Person Household | 6 (37.5%) | 10 (62.5%) |
| 2-Person Household | 3 (33.3%) | 6 (66.7%) |
| 3-Person Household | 8 (61.5%) | 5 (38.5%) |
| 4+ Person Household | 0 (0.0%) | 4 (100.0%) |
| Total Housing Units | 17 (40.5%) | 25 (59.5%) |
Occupancy by Educational Attainment in Worcester
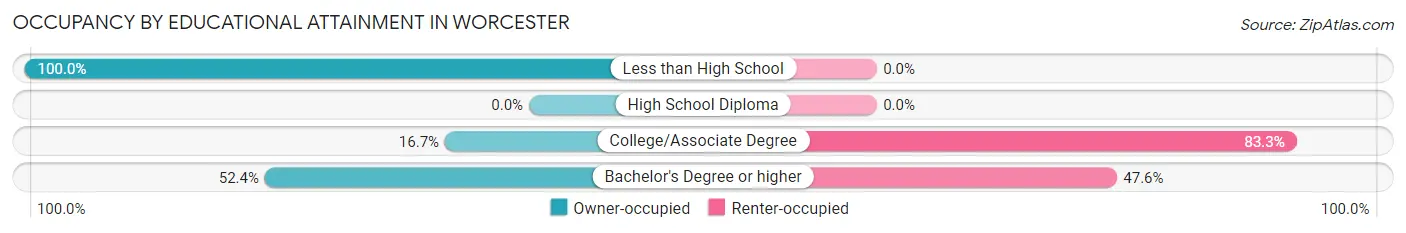
| Household Size | Owner-occupied | Renter-occupied |
| Less than High School | 3 (100.0%) | 0 (0.0%) |
| High School Diploma | 0 (0.0%) | 0 (0.0%) |
| College/Associate Degree | 3 (16.7%) | 15 (83.3%) |
| Bachelor's Degree or higher | 11 (52.4%) | 10 (47.6%) |
Occupancy by Age of Householder in Worcester
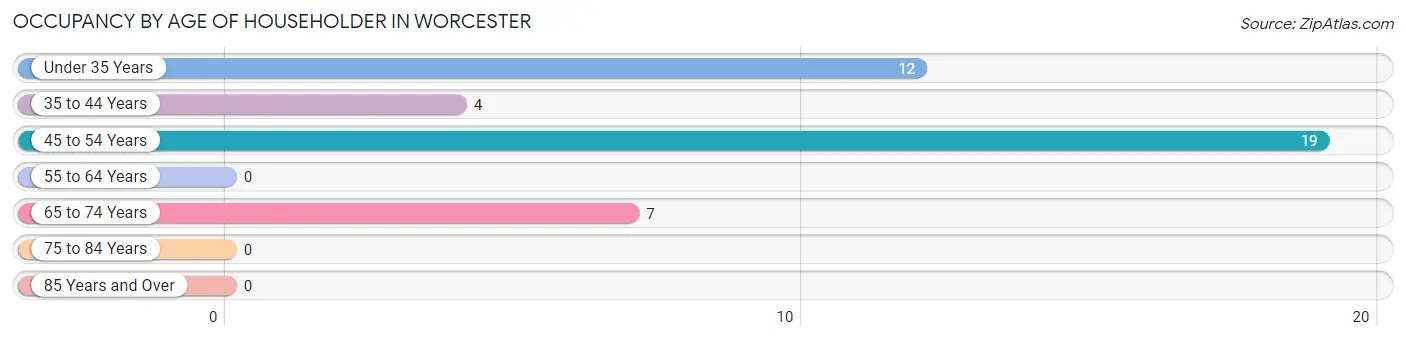
| Age Bracket | # Households | % Households |
| Under 35 Years | 12 | 28.6% |
| 35 to 44 Years | 4 | 9.5% |
| 45 to 54 Years | 19 | 45.2% |
| 55 to 64 Years | 0 | 0.0% |
| 65 to 74 Years | 7 | 16.7% |
| 75 to 84 Years | 0 | 0.0% |
| 85 Years and Over | 0 | 0.0% |
| Total | 42 | 100.0% |
Housing Finances in Worcester
Median Income by Occupancy in Worcester
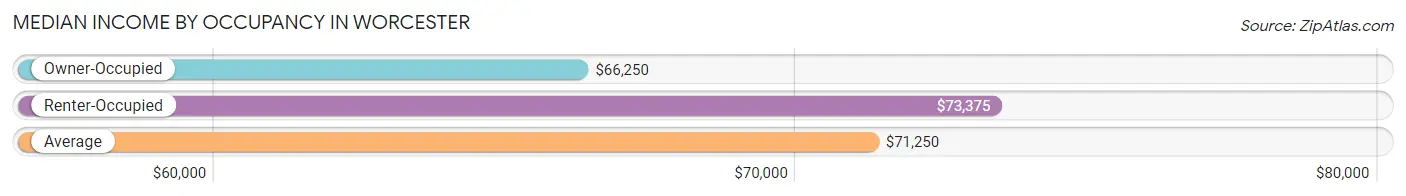
| Occupancy Type | # Households | Median Income |
| Owner-Occupied | 17 (40.5%) | $66,250 |
| Renter-Occupied | 25 (59.5%) | $73,375 |
| Average | 42 (100.0%) | $71,250 |
Occupancy by Householder Income Bracket in Worcester
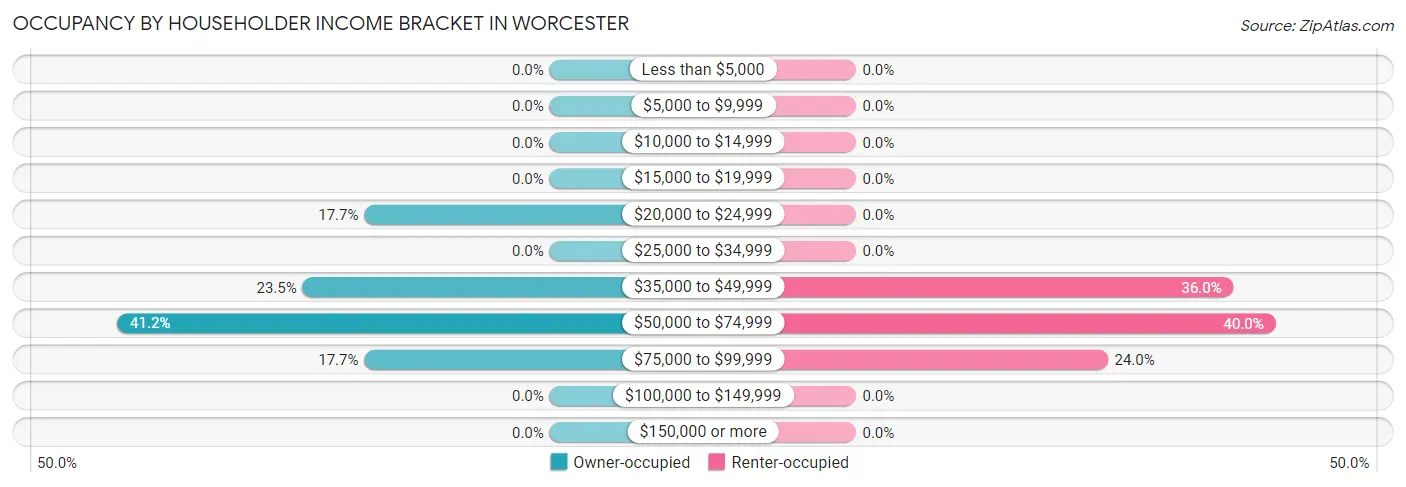
| Income Bracket | Owner-occupied | Renter-occupied |
| Less than $5,000 | 0 (0.0%) | 0 (0.0%) |
| $5,000 to $9,999 | 0 (0.0%) | 0 (0.0%) |
| $10,000 to $14,999 | 0 (0.0%) | 0 (0.0%) |
| $15,000 to $19,999 | 0 (0.0%) | 0 (0.0%) |
| $20,000 to $24,999 | 3 (17.6%) | 0 (0.0%) |
| $25,000 to $34,999 | 0 (0.0%) | 0 (0.0%) |
| $35,000 to $49,999 | 4 (23.5%) | 9 (36.0%) |
| $50,000 to $74,999 | 7 (41.2%) | 10 (40.0%) |
| $75,000 to $99,999 | 3 (17.6%) | 6 (24.0%) |
| $100,000 to $149,999 | 0 (0.0%) | 0 (0.0%) |
| $150,000 or more | 0 (0.0%) | 0 (0.0%) |
| Total | 17 (100.0%) | 25 (100.0%) |
Monthly Housing Cost Tiers in Worcester
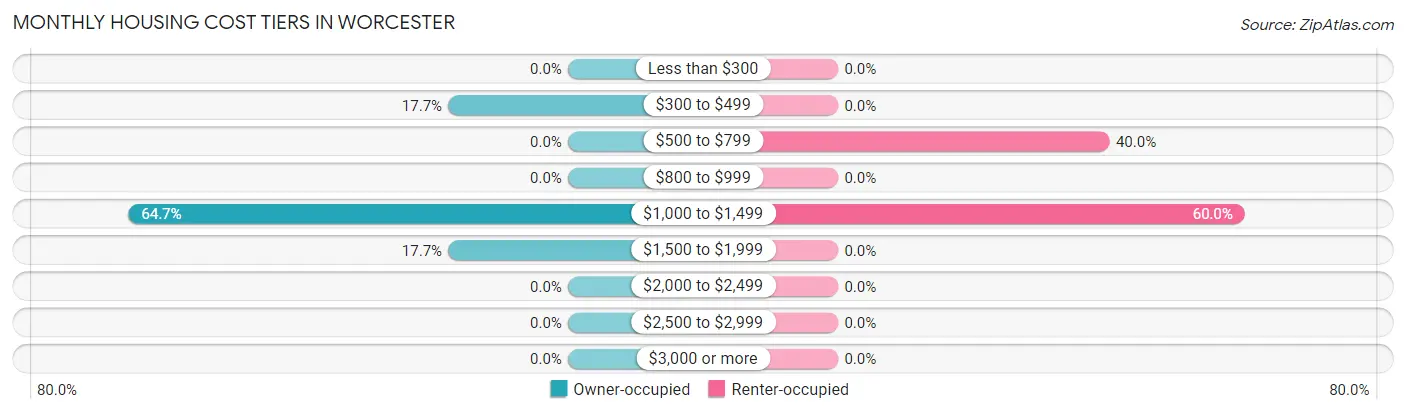
| Monthly Cost | Owner-occupied | Renter-occupied |
| Less than $300 | 0 (0.0%) | 0 (0.0%) |
| $300 to $499 | 3 (17.6%) | 0 (0.0%) |
| $500 to $799 | 0 (0.0%) | 10 (40.0%) |
| $800 to $999 | 0 (0.0%) | 0 (0.0%) |
| $1,000 to $1,499 | 11 (64.7%) | 15 (60.0%) |
| $1,500 to $1,999 | 3 (17.6%) | 0 (0.0%) |
| $2,000 to $2,499 | 0 (0.0%) | 0 (0.0%) |
| $2,500 to $2,999 | 0 (0.0%) | 0 (0.0%) |
| $3,000 or more | 0 (0.0%) | 0 (0.0%) |
| Total | 17 (100.0%) | 25 (100.0%) |
Physical Housing Characteristics in Worcester
Housing Structures in Worcester
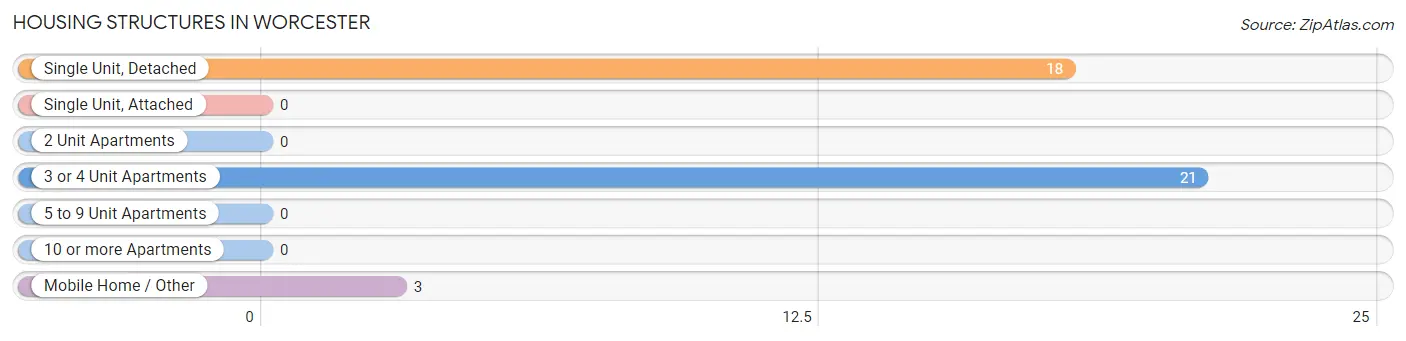
| Structure Type | # Housing Units | % Housing Units |
| Single Unit, Detached | 18 | 42.9% |
| Single Unit, Attached | 0 | 0.0% |
| 2 Unit Apartments | 0 | 0.0% |
| 3 or 4 Unit Apartments | 21 | 50.0% |
| 5 to 9 Unit Apartments | 0 | 0.0% |
| 10 or more Apartments | 0 | 0.0% |
| Mobile Home / Other | 3 | 7.1% |
| Total | 42 | 100.0% |
Housing Structures by Occupancy in Worcester
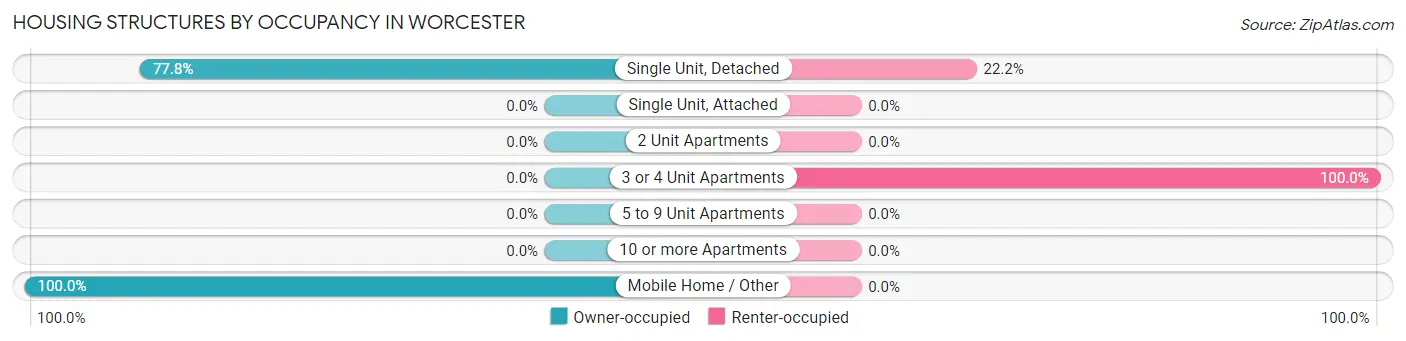
| Structure Type | Owner-occupied | Renter-occupied |
| Single Unit, Detached | 14 (77.8%) | 4 (22.2%) |
| Single Unit, Attached | 0 (0.0%) | 0 (0.0%) |
| 2 Unit Apartments | 0 (0.0%) | 0 (0.0%) |
| 3 or 4 Unit Apartments | 0 (0.0%) | 21 (100.0%) |
| 5 to 9 Unit Apartments | 0 (0.0%) | 0 (0.0%) |
| 10 or more Apartments | 0 (0.0%) | 0 (0.0%) |
| Mobile Home / Other | 3 (100.0%) | 0 (0.0%) |
| Total | 17 (40.5%) | 25 (59.5%) |
Housing Structures by Number of Rooms in Worcester
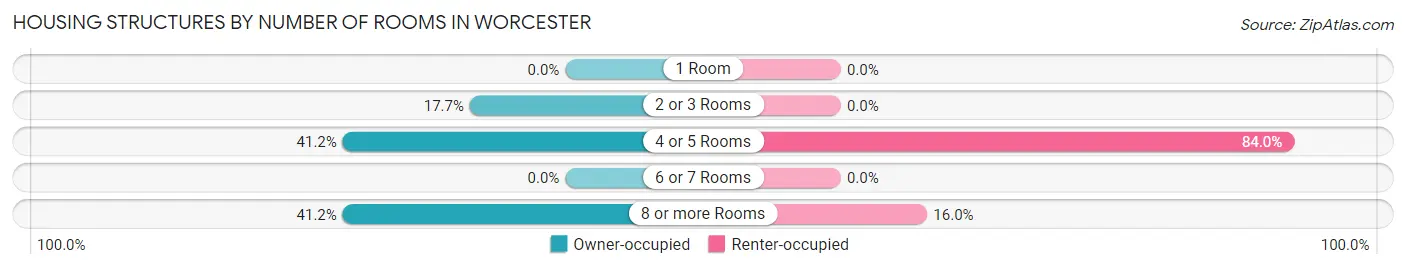
| Number of Rooms | Owner-occupied | Renter-occupied |
| 1 Room | 0 (0.0%) | 0 (0.0%) |
| 2 or 3 Rooms | 3 (17.6%) | 0 (0.0%) |
| 4 or 5 Rooms | 7 (41.2%) | 21 (84.0%) |
| 6 or 7 Rooms | 0 (0.0%) | 0 (0.0%) |
| 8 or more Rooms | 7 (41.2%) | 4 (16.0%) |
| Total | 17 (100.0%) | 25 (100.0%) |
Housing Structure by Heating Type in Worcester
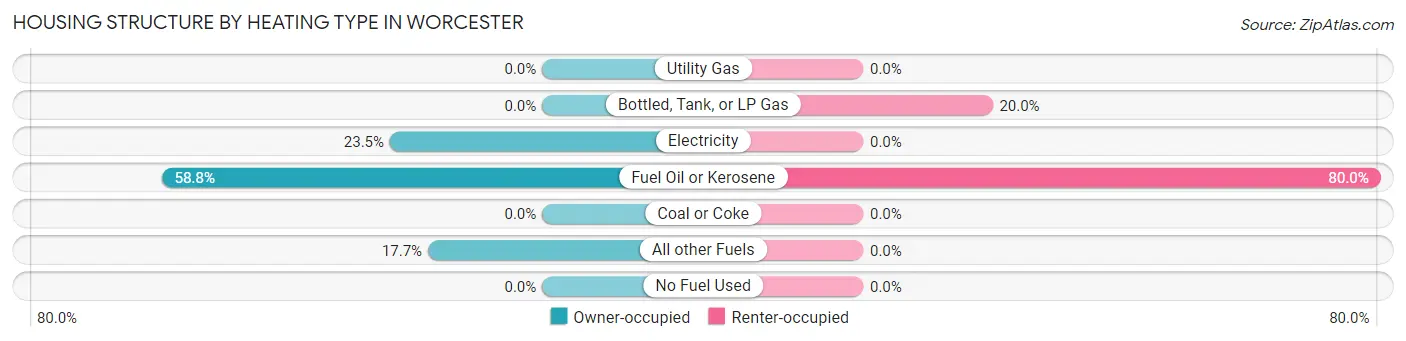
| Heating Type | Owner-occupied | Renter-occupied |
| Utility Gas | 0 (0.0%) | 0 (0.0%) |
| Bottled, Tank, or LP Gas | 0 (0.0%) | 5 (20.0%) |
| Electricity | 4 (23.5%) | 0 (0.0%) |
| Fuel Oil or Kerosene | 10 (58.8%) | 20 (80.0%) |
| Coal or Coke | 0 (0.0%) | 0 (0.0%) |
| All other Fuels | 3 (17.6%) | 0 (0.0%) |
| No Fuel Used | 0 (0.0%) | 0 (0.0%) |
| Total | 17 (100.0%) | 25 (100.0%) |
Household Vehicle Usage in Worcester
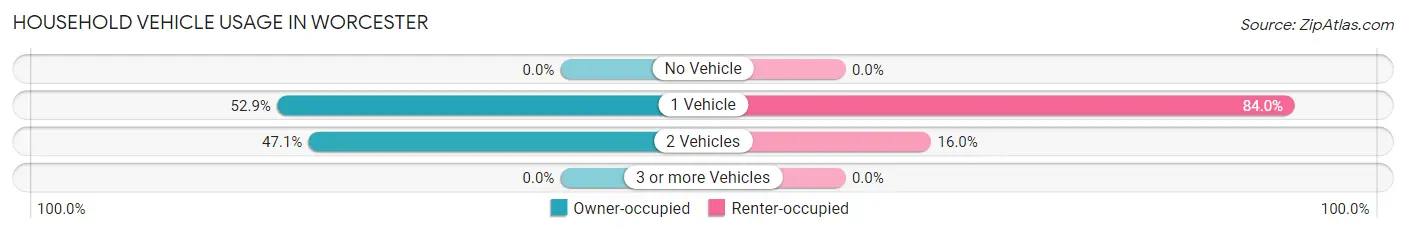
| Vehicles per Household | Owner-occupied | Renter-occupied |
| No Vehicle | 0 (0.0%) | 0 (0.0%) |
| 1 Vehicle | 9 (52.9%) | 21 (84.0%) |
| 2 Vehicles | 8 (47.1%) | 4 (16.0%) |
| 3 or more Vehicles | 0 (0.0%) | 0 (0.0%) |
| Total | 17 (100.0%) | 25 (100.0%) |
Real Estate & Mortgages in Worcester
Real Estate and Mortgage Overview in Worcester
| Characteristic | Without Mortgage | With Mortgage |
| Housing Units | 7 | 10 |
| Median Property Value | - | - |
| Median Household Income | - | - |
| Monthly Housing Costs | - | - |
| Real Estate Taxes | - | - |
Property Value by Mortgage Status in Worcester
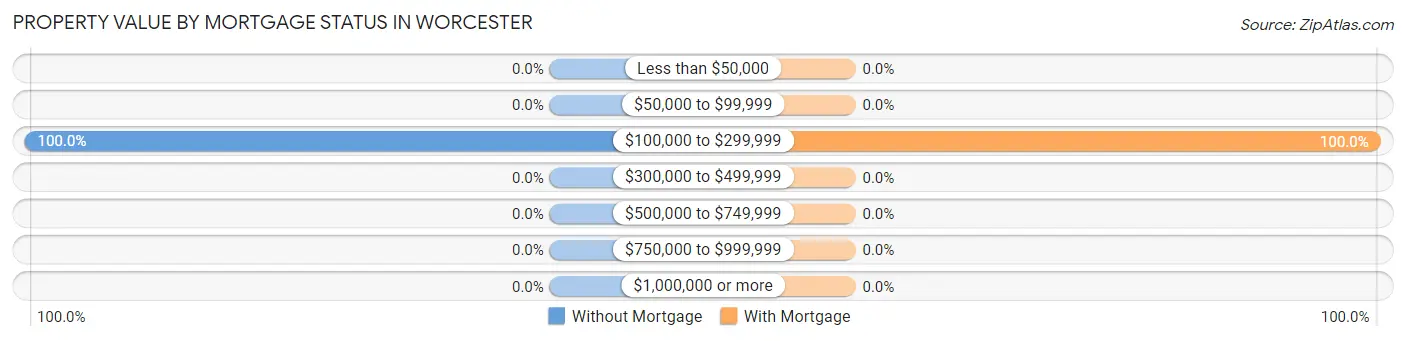
| Property Value | Without Mortgage | With Mortgage |
| Less than $50,000 | 0 (0.0%) | 0 (0.0%) |
| $50,000 to $99,999 | 0 (0.0%) | 0 (0.0%) |
| $100,000 to $299,999 | 7 (100.0%) | 10 (100.0%) |
| $300,000 to $499,999 | 0 (0.0%) | 0 (0.0%) |
| $500,000 to $749,999 | 0 (0.0%) | 0 (0.0%) |
| $750,000 to $999,999 | 0 (0.0%) | 0 (0.0%) |
| $1,000,000 or more | 0 (0.0%) | 0 (0.0%) |
| Total | 7 (100.0%) | 10 (100.0%) |
Household Income by Mortgage Status in Worcester
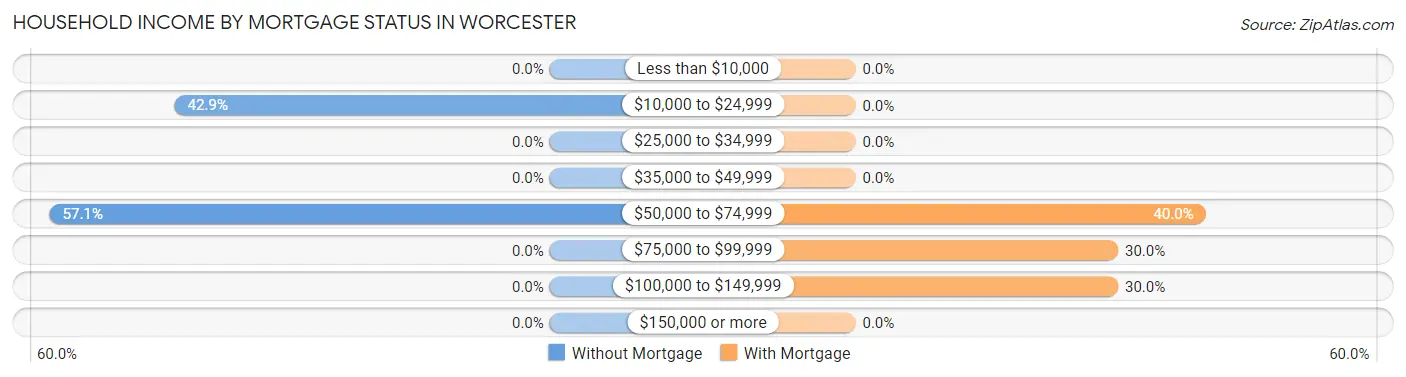
| Household Income | Without Mortgage | With Mortgage |
| Less than $10,000 | 0 (0.0%) | 0 (0.0%) |
| $10,000 to $24,999 | 3 (42.9%) | 0 (0.0%) |
| $25,000 to $34,999 | 0 (0.0%) | 0 (0.0%) |
| $35,000 to $49,999 | 0 (0.0%) | 0 (0.0%) |
| $50,000 to $74,999 | 4 (57.1%) | 4 (40.0%) |
| $75,000 to $99,999 | 0 (0.0%) | 3 (30.0%) |
| $100,000 to $149,999 | 0 (0.0%) | 3 (30.0%) |
| $150,000 or more | 0 (0.0%) | 0 (0.0%) |
| Total | 7 (100.0%) | 10 (100.0%) |
Property Value to Household Income Ratio in Worcester
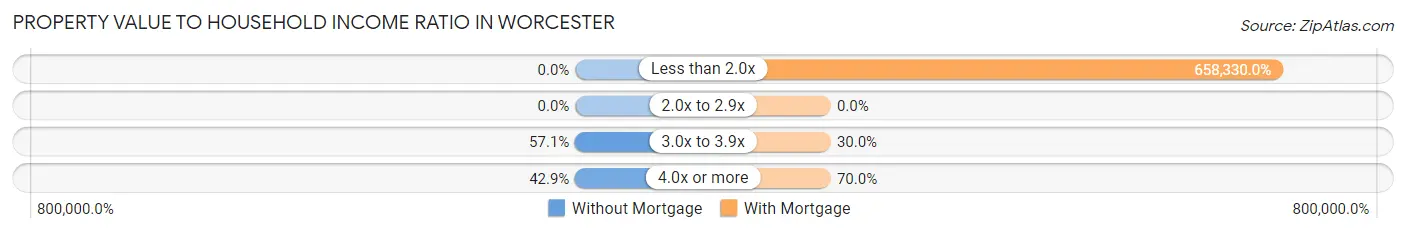
| Value-to-Income Ratio | Without Mortgage | With Mortgage |
| Less than 2.0x | 0 (0.0%) | 65,833 (658,330.0%) |
| 2.0x to 2.9x | 0 (0.0%) | 0 (0.0%) |
| 3.0x to 3.9x | 4 (57.1%) | 3 (30.0%) |
| 4.0x or more | 3 (42.9%) | 7 (70.0%) |
| Total | 7 (100.0%) | 10 (100.0%) |
Real Estate Taxes by Mortgage Status in Worcester
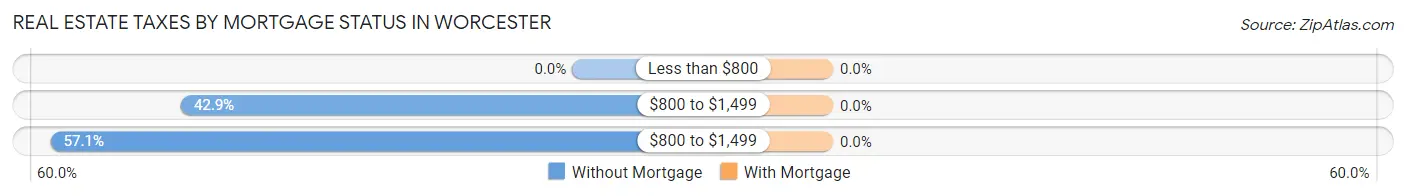
| Property Taxes | Without Mortgage | With Mortgage |
| Less than $800 | 0 (0.0%) | 0 (0.0%) |
| $800 to $1,499 | 3 (42.9%) | 0 (0.0%) |
| $800 to $1,499 | 4 (57.1%) | 0 (0.0%) |
| Total | 7 (100.0%) | 10 (100.0%) |
Health & Disability in Worcester
Health Insurance Coverage by Age in Worcester
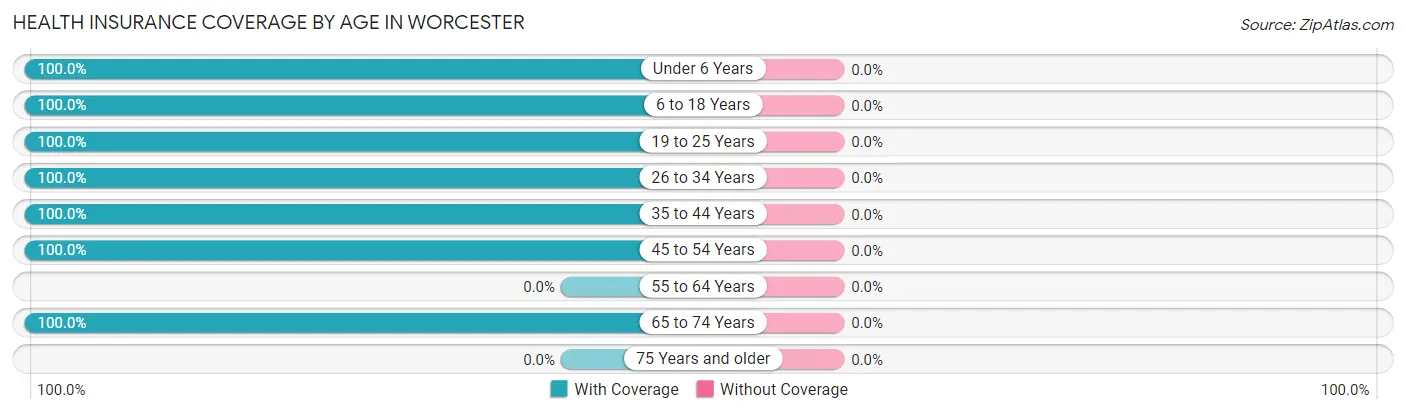
| Age Bracket | With Coverage | Without Coverage |
| Under 6 Years | 10 (100.0%) | 0 (0.0%) |
| 6 to 18 Years | 13 (100.0%) | 0 (0.0%) |
| 19 to 25 Years | 24 (100.0%) | 0 (0.0%) |
| 26 to 34 Years | 23 (100.0%) | 0 (0.0%) |
| 35 to 44 Years | 8 (100.0%) | 0 (0.0%) |
| 45 to 54 Years | 23 (100.0%) | 0 (0.0%) |
| 55 to 64 Years | 0 (0.0%) | 0 (0.0%) |
| 65 to 74 Years | 14 (100.0%) | 0 (0.0%) |
| 75 Years and older | 0 (0.0%) | 0 (0.0%) |
| Total | 115 (100.0%) | 0 (0.0%) |
Health Insurance Coverage by Citizenship Status in Worcester
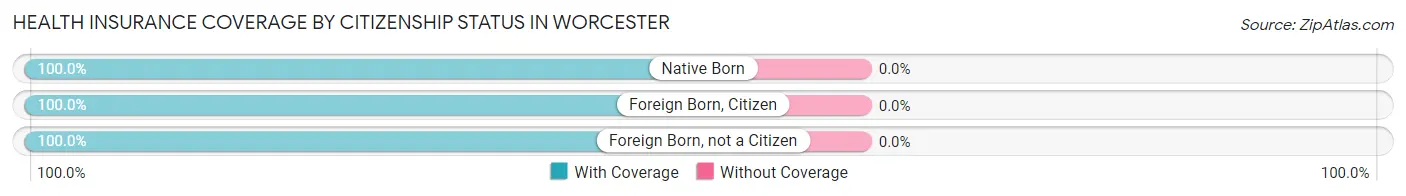
| Citizenship Status | With Coverage | Without Coverage |
| Native Born | 10 (100.0%) | 0 (0.0%) |
| Foreign Born, Citizen | 13 (100.0%) | 0 (0.0%) |
| Foreign Born, not a Citizen | 24 (100.0%) | 0 (0.0%) |
Health Insurance Coverage by Household Income in Worcester
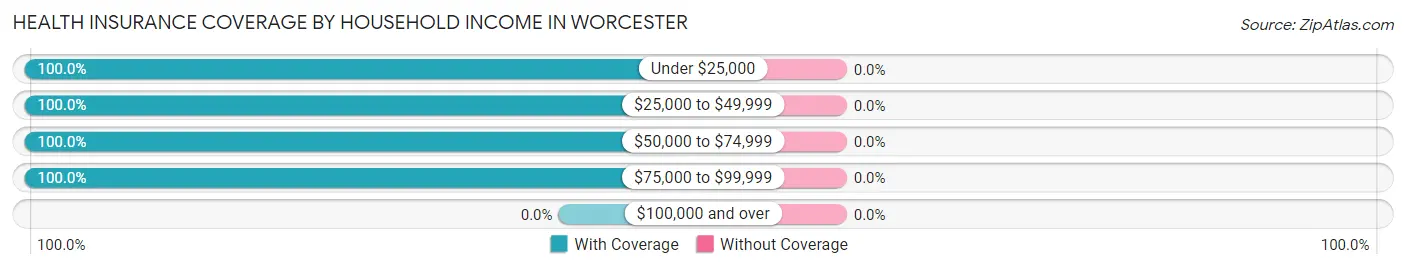
| Household Income | With Coverage | Without Coverage |
| Under $25,000 | 3 (100.0%) | 0 (0.0%) |
| $25,000 to $49,999 | 51 (100.0%) | 0 (0.0%) |
| $50,000 to $74,999 | 25 (100.0%) | 0 (0.0%) |
| $75,000 to $99,999 | 36 (100.0%) | 0 (0.0%) |
| $100,000 and over | 0 (0.0%) | 0 (0.0%) |
Public vs Private Health Insurance Coverage by Age in Worcester
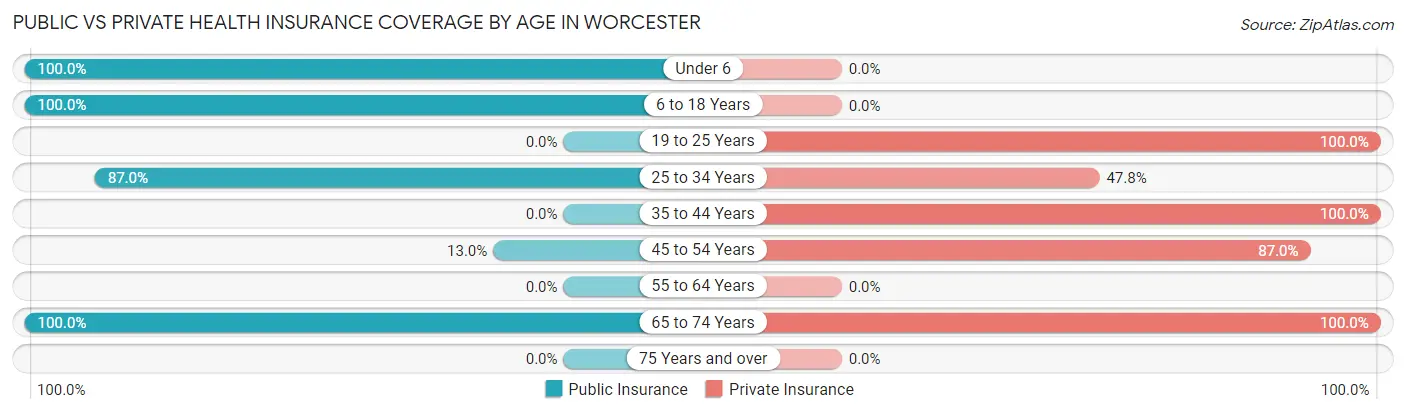
| Age Bracket | Public Insurance | Private Insurance |
| Under 6 | 10 (100.0%) | 0 (0.0%) |
| 6 to 18 Years | 13 (100.0%) | 0 (0.0%) |
| 19 to 25 Years | 0 (0.0%) | 24 (100.0%) |
| 25 to 34 Years | 20 (87.0%) | 11 (47.8%) |
| 35 to 44 Years | 0 (0.0%) | 8 (100.0%) |
| 45 to 54 Years | 3 (13.0%) | 20 (87.0%) |
| 55 to 64 Years | 0 (0.0%) | 0 (0.0%) |
| 65 to 74 Years | 14 (100.0%) | 14 (100.0%) |
| 75 Years and over | 0 (0.0%) | 0 (0.0%) |
| Total | 60 (52.2%) | 77 (67.0%) |
Disability Status by Sex by Age in Worcester
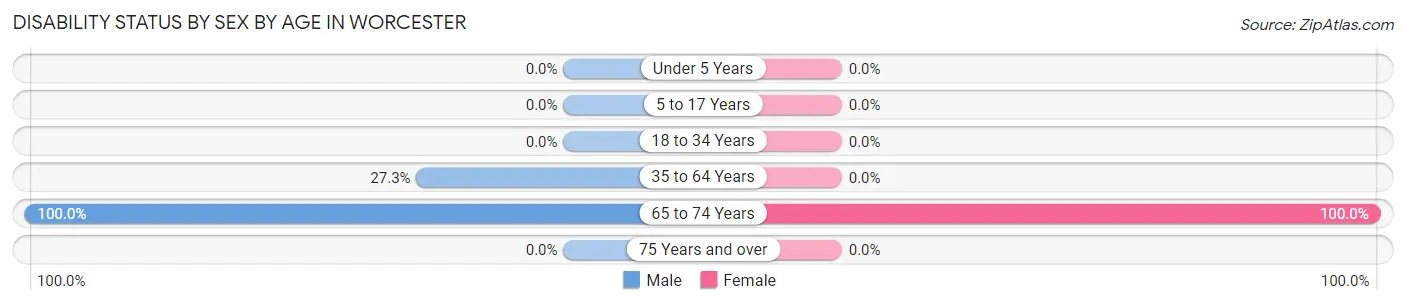
| Age Bracket | Male | Female |
| Under 5 Years | 0 (0.0%) | 0 (0.0%) |
| 5 to 17 Years | 0 (0.0%) | 0 (0.0%) |
| 18 to 34 Years | 0 (0.0%) | 0 (0.0%) |
| 35 to 64 Years | 3 (27.3%) | 0 (0.0%) |
| 65 to 74 Years | 7 (100.0%) | 7 (100.0%) |
| 75 Years and over | 0 (0.0%) | 0 (0.0%) |
Disability Class by Sex by Age in Worcester
Disability Class: Hearing Difficulty
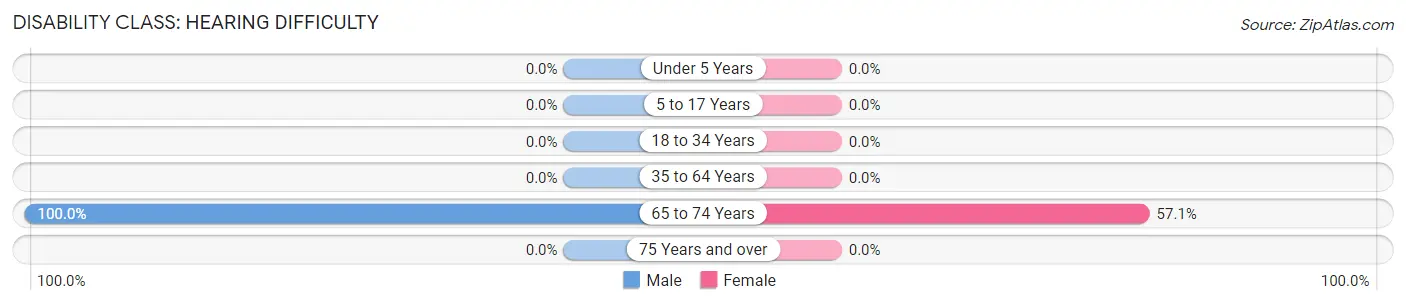
| Age Bracket | Male | Female |
| Under 5 Years | 0 (0.0%) | 0 (0.0%) |
| 5 to 17 Years | 0 (0.0%) | 0 (0.0%) |
| 18 to 34 Years | 0 (0.0%) | 0 (0.0%) |
| 35 to 64 Years | 0 (0.0%) | 0 (0.0%) |
| 65 to 74 Years | 7 (100.0%) | 4 (57.1%) |
| 75 Years and over | 0 (0.0%) | 0 (0.0%) |
Disability Class: Vision Difficulty
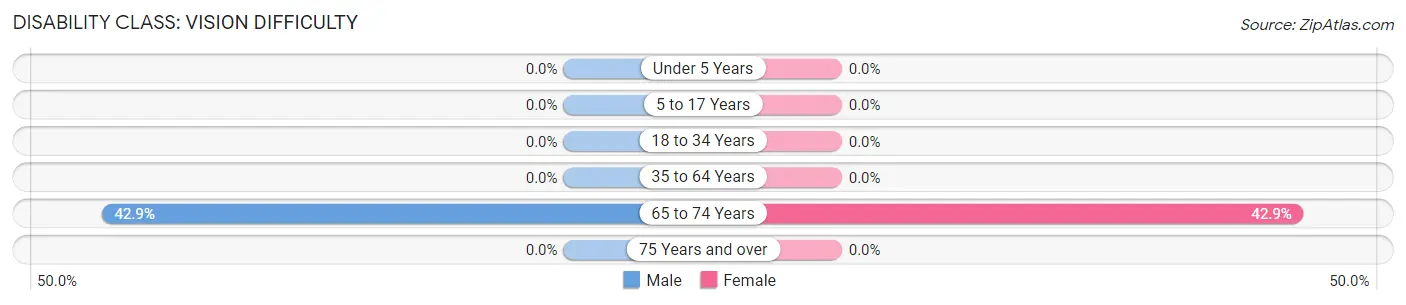
| Age Bracket | Male | Female |
| Under 5 Years | 0 (0.0%) | 0 (0.0%) |
| 5 to 17 Years | 0 (0.0%) | 0 (0.0%) |
| 18 to 34 Years | 0 (0.0%) | 0 (0.0%) |
| 35 to 64 Years | 0 (0.0%) | 0 (0.0%) |
| 65 to 74 Years | 3 (42.9%) | 3 (42.9%) |
| 75 Years and over | 0 (0.0%) | 0 (0.0%) |
Disability Class: Cognitive Difficulty
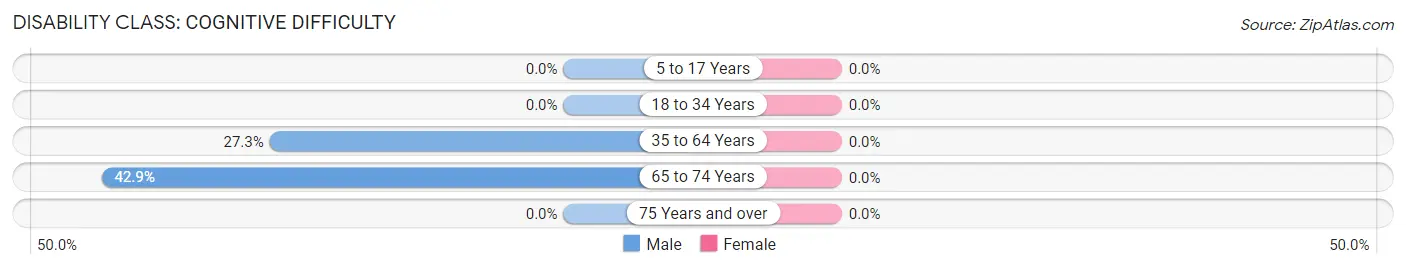
| Age Bracket | Male | Female |
| 5 to 17 Years | 0 (0.0%) | 0 (0.0%) |
| 18 to 34 Years | 0 (0.0%) | 0 (0.0%) |
| 35 to 64 Years | 3 (27.3%) | 0 (0.0%) |
| 65 to 74 Years | 3 (42.9%) | 0 (0.0%) |
| 75 Years and over | 0 (0.0%) | 0 (0.0%) |
Disability Class: Ambulatory Difficulty
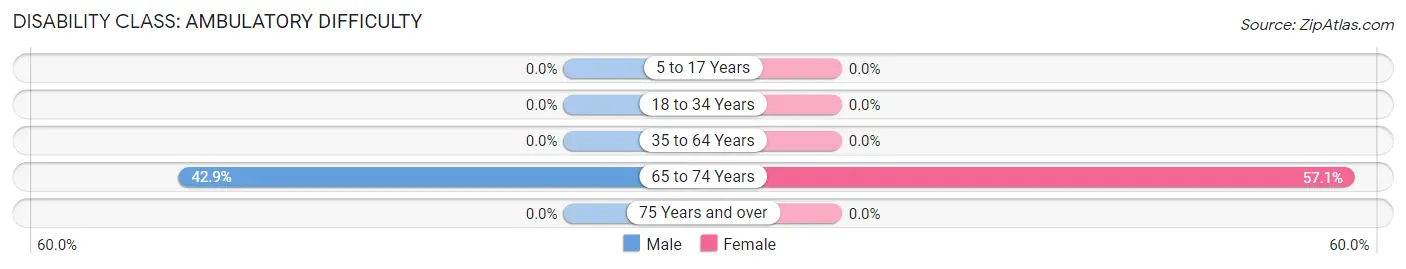
| Age Bracket | Male | Female |
| 5 to 17 Years | 0 (0.0%) | 0 (0.0%) |
| 18 to 34 Years | 0 (0.0%) | 0 (0.0%) |
| 35 to 64 Years | 0 (0.0%) | 0 (0.0%) |
| 65 to 74 Years | 3 (42.9%) | 4 (57.1%) |
| 75 Years and over | 0 (0.0%) | 0 (0.0%) |
Disability Class: Self-Care Difficulty
| Age Bracket | Male | Female |
| 5 to 17 Years | 0 (0.0%) | 0 (0.0%) |
| 18 to 34 Years | 0 (0.0%) | 0 (0.0%) |
| 35 to 64 Years | 0 (0.0%) | 0 (0.0%) |
| 65 to 74 Years | 0 (0.0%) | 0 (0.0%) |
| 75 Years and over | 0 (0.0%) | 0 (0.0%) |
Technology Access in Worcester
Computing Device Access in Worcester
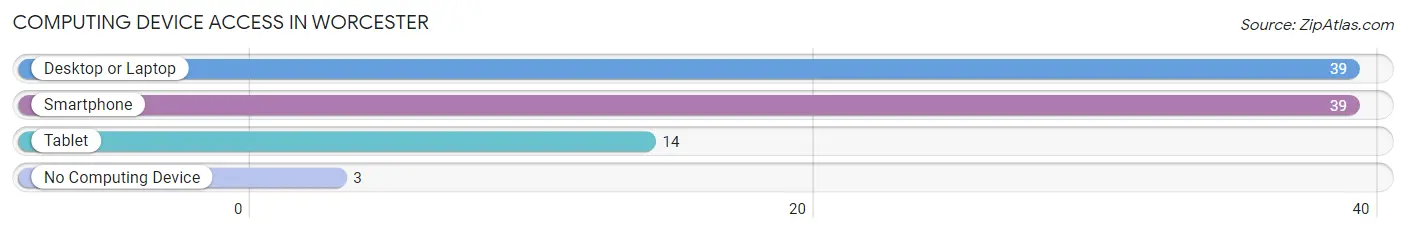
| Device Type | # Households | % Households |
| Desktop or Laptop | 39 | 92.9% |
| Smartphone | 39 | 92.9% |
| Tablet | 14 | 33.3% |
| No Computing Device | 3 | 7.1% |
| Total | 42 | 100.0% |
Internet Access in Worcester
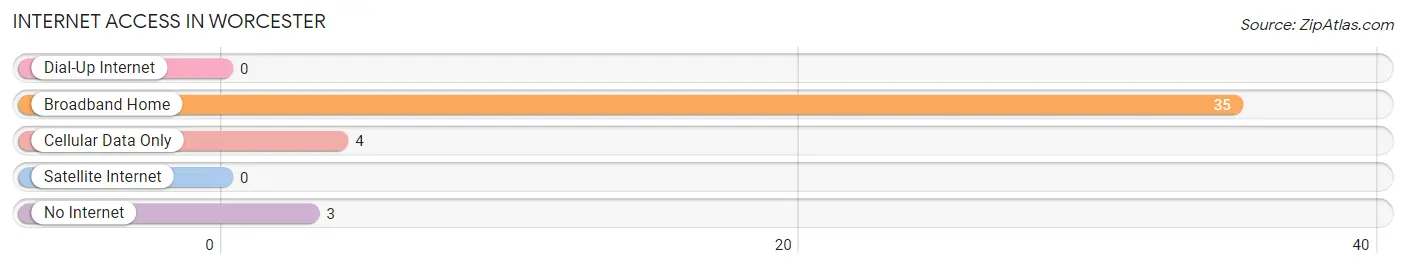
| Internet Type | # Households | % Households |
| Dial-Up Internet | 0 | 0.0% |
| Broadband Home | 35 | 83.3% |
| Cellular Data Only | 4 | 9.5% |
| Satellite Internet | 0 | 0.0% |
| No Internet | 3 | 7.1% |
| Total | 42 | 100.0% |
Worcester Summary
Worcester, Vermont is a small town located in the northern part of the state, in Washington County. It is situated in the Green Mountains, and is bordered by the towns of Cabot, Marshfield, and Walden. The town has a population of approximately 1,000 people, and is home to a variety of businesses, including a general store, a post office, a library, and a few restaurants.
Geography
Worcester is located in the northern part of Vermont, in Washington County. It is situated in the Green Mountains, and is bordered by the towns of Cabot, Marshfield, and Walden. The town is located at an elevation of 1,400 feet, and is surrounded by mountains and forests. The town is located on the banks of the Winooski River, and is home to several small lakes, including Lake Elmore and Lake Eden.
The town is located in a rural area, and is home to a variety of wildlife, including deer, moose, and black bear. The town is also home to a variety of birds, including bald eagles, hawks, and owls.
Economy
Worcester is a small, rural town, and its economy is largely based on agriculture and tourism. The town is home to several small farms, which produce a variety of crops, including corn, hay, and apples. The town is also home to several small businesses, including a general store, a post office, a library, and a few restaurants.
The town is also home to a variety of outdoor recreation activities, including hiking, fishing, and camping. The town is also home to several ski resorts, including Sugarbush and Mad River Glen.
Demographics
As of the 2010 census, Worcester had a population of 1,000 people. The town is predominantly white, with 95.2% of the population identifying as white. The town is also home to a small Hispanic population, with 2.2% of the population identifying as Hispanic or Latino. The town is also home to a small African American population, with 0.8% of the population identifying as African American.
The median household income in Worcester is $45,000, and the median home value is $150,000. The town has a poverty rate of 8.3%, and the unemployment rate is 4.2%.
Conclusion
Worcester, Vermont is a small, rural town located in the northern part of the state, in Washington County. The town is situated in the Green Mountains, and is bordered by the towns of Cabot, Marshfield, and Walden. The town has a population of approximately 1,000 people, and is home to a variety of businesses, including a general store, a post office, a library, and a few restaurants. The town's economy is largely based on agriculture and tourism, and the town is home to several small farms, businesses, and outdoor recreation activities. The town is predominantly white, with 95.2% of the population identifying as white. The median household income in Worcester is $45,000, and the median home value is $150,000.
Common Questions
What is Per Capita Income in Worcester?
Per Capita income in Worcester is $24,723.
What is the Median Family Income in Worcester?
Median Family Income in Worcester is $58,750.
What is the Median Household income in Worcester?
Median Household Income in Worcester is $71,250.
What is Inequality or Gini Index in Worcester?
Inequality or Gini Index in Worcester is 0.17.
What is the Total Population of Worcester?
Total Population of Worcester is 115.
What is the Total Male Population of Worcester?
Total Male Population of Worcester is 59.
What is the Total Female Population of Worcester?
Total Female Population of Worcester is 56.
What is the Ratio of Males per 100 Females in Worcester?
There are 105.36 Males per 100 Females in Worcester.
What is the Ratio of Females per 100 Males in Worcester?
There are 94.92 Females per 100 Males in Worcester.
What is the Median Population Age in Worcester?
Median Population Age in Worcester is 33.2 Years.
What is the Average Family Size in Worcester
Average Family Size in Worcester is 3.8 People.
What is the Average Household Size in Worcester
Average Household Size in Worcester is 2.7 People.
How Large is the Labor Force in Worcester?
There are 61 People in the Labor Forcein in Worcester.
What is the Percentage of People in the Labor Force in Worcester?
66.3% of People are in the Labor Force in Worcester.
What is the Unemployment Rate in Worcester?
Unemployment Rate in Worcester is 39.3%.