Belknap County, NH Map & Demographics
Belknap County Overview
$43,670
PER CAPITA INCOME
$101,175
AVG FAMILY INCOME
$80,719
AVG HOUSEHOLD INCOME
33.9%
WAGE / INCOME GAP [ % ]
66.1¢/ $1
WAGE / INCOME GAP [ $ ]
$8,062
FAMILY INCOME DEFICIT
0.44
INEQUALITY / GINI INDEX
63,914
TOTAL POPULATION
31,658
MALE POPULATION
32,256
FEMALE POPULATION
98.15
MALES / 100 FEMALES
101.89
FEMALES / 100 MALES
47.8
MEDIAN AGE
3.0
AVG FAMILY SIZE
2.4
AVG HOUSEHOLD SIZE
33,857
LABOR FORCE [ PEOPLE ]
62.7%
PERCENT IN LABOR FORCE
2.7%
UNEMPLOYMENT RATE
Belknap County Area Codes
Income in Belknap County
Income Overview in Belknap County
Per Capita Income in Belknap County is $43,670, while median incomes of families and households are $101,175 and $80,719 respectively.
| Characteristic | Number | Measure |
| Per Capita Income | 63,914 | $43,670 |
| Median Family Income | 17,100 | $101,175 |
| Mean Family Income | 17,100 | $121,047 |
| Median Household Income | 25,956 | $80,719 |
| Mean Household Income | 25,956 | $103,369 |
| Income Deficit | 17,100 | $8,062 |
| Wage / Income Gap (%) | 63,914 | 33.88% |
| Wage / Income Gap ($) | 63,914 | 66.12¢ per $1 |
| Gini / Inequality Index | 63,914 | 0.44 |
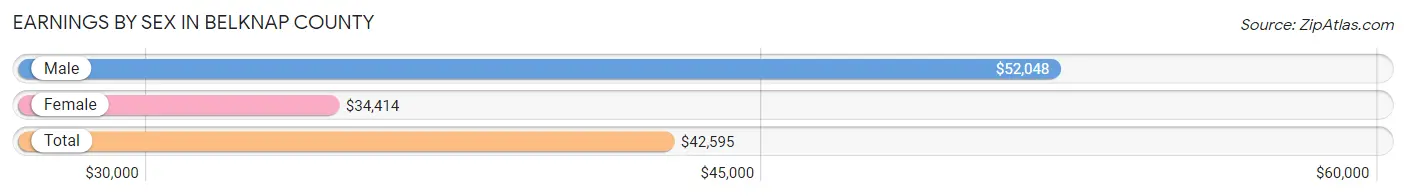
Earnings by Sex in Belknap County
Average Earnings in Belknap County are $42,595, $52,048 for men and $34,414 for women, a difference of 33.9%.
| Sex | Number | Average Earnings |
| Male | 18,479 (51.2%) | $52,048 |
| Female | 17,614 (48.8%) | $34,414 |
| Total | 36,093 (100.0%) | $42,595 |
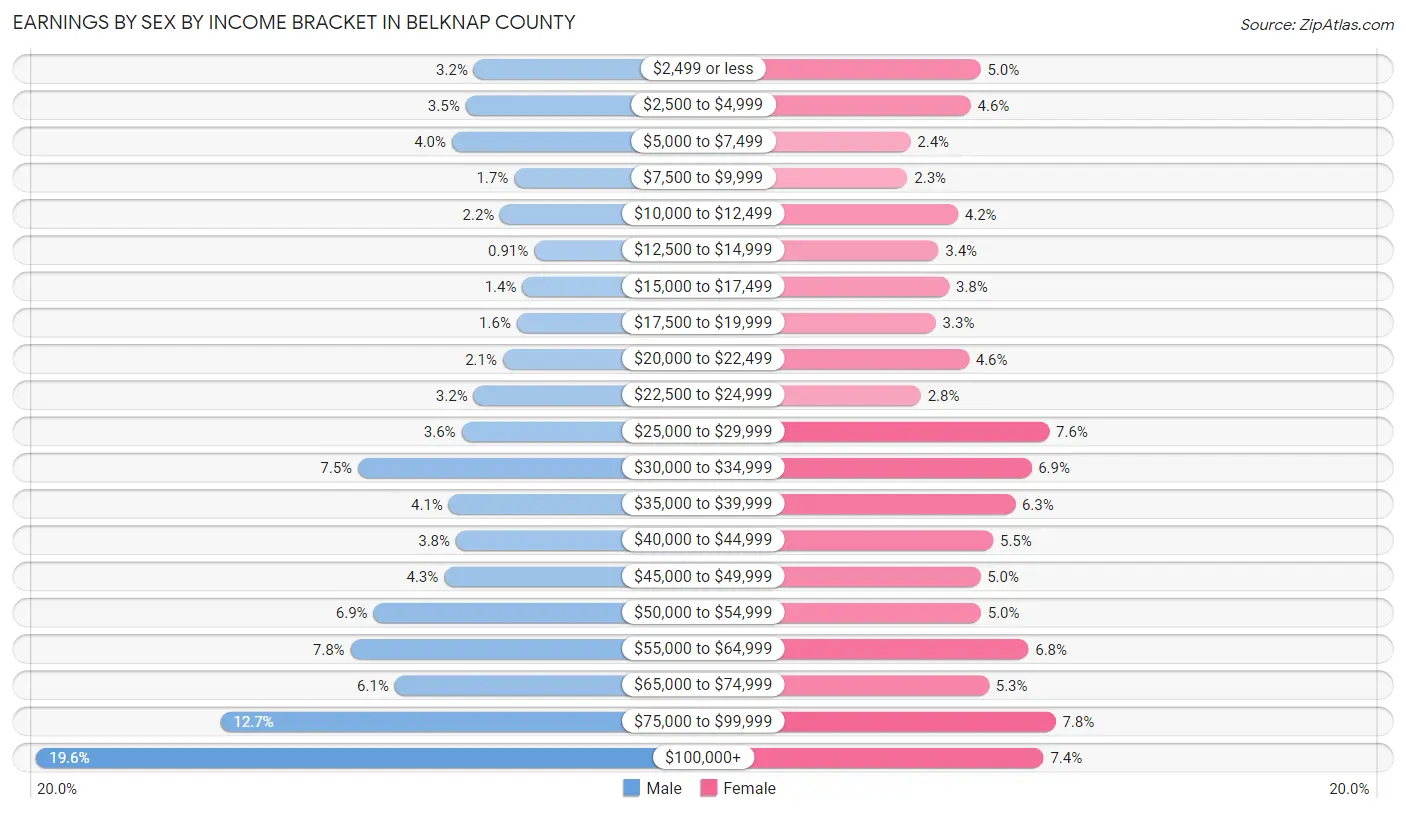
Earnings by Sex by Income Bracket in Belknap County
The most common earnings brackets in Belknap County are $100,000+ for men (3,615 | 19.6%) and $75,000 to $99,999 for women (1,377 | 7.8%).
| Income | Male | Female |
| $2,499 or less | 586 (3.2%) | 883 (5.0%) |
| $2,500 to $4,999 | 643 (3.5%) | 818 (4.6%) |
| $5,000 to $7,499 | 737 (4.0%) | 419 (2.4%) |
| $7,500 to $9,999 | 307 (1.7%) | 399 (2.3%) |
| $10,000 to $12,499 | 403 (2.2%) | 733 (4.2%) |
| $12,500 to $14,999 | 168 (0.9%) | 605 (3.4%) |
| $15,000 to $17,499 | 250 (1.3%) | 674 (3.8%) |
| $17,500 to $19,999 | 288 (1.6%) | 586 (3.3%) |
| $20,000 to $22,499 | 384 (2.1%) | 805 (4.6%) |
| $22,500 to $24,999 | 588 (3.2%) | 488 (2.8%) |
| $25,000 to $29,999 | 671 (3.6%) | 1,336 (7.6%) |
| $30,000 to $34,999 | 1,388 (7.5%) | 1,217 (6.9%) |
| $35,000 to $39,999 | 759 (4.1%) | 1,110 (6.3%) |
| $40,000 to $44,999 | 709 (3.8%) | 965 (5.5%) |
| $45,000 to $49,999 | 790 (4.3%) | 880 (5.0%) |
| $50,000 to $54,999 | 1,280 (6.9%) | 885 (5.0%) |
| $55,000 to $64,999 | 1,440 (7.8%) | 1,198 (6.8%) |
| $65,000 to $74,999 | 1,133 (6.1%) | 937 (5.3%) |
| $75,000 to $99,999 | 2,340 (12.7%) | 1,377 (7.8%) |
| $100,000+ | 3,615 (19.6%) | 1,299 (7.4%) |
| Total | 18,479 (100.0%) | 17,614 (100.0%) |
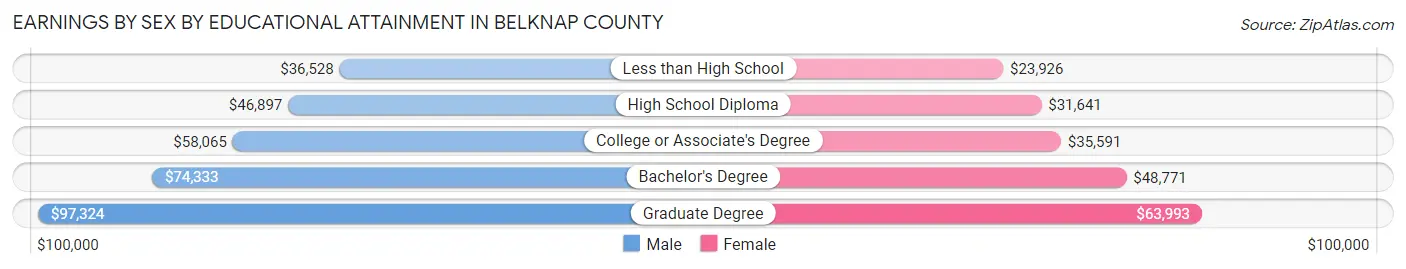
Earnings by Sex by Educational Attainment in Belknap County
Average earnings in Belknap County are $57,234 for men and $39,307 for women, a difference of 31.3%. Men with an educational attainment of graduate degree enjoy the highest average annual earnings of $97,324, while those with less than high school education earn the least with $36,528. Women with an educational attainment of graduate degree earn the most with the average annual earnings of $63,993, while those with less than high school education have the smallest earnings of $23,926.
| Educational Attainment | Male Income | Female Income |
| Less than High School | $36,528 | $23,926 |
| High School Diploma | $46,897 | $31,641 |
| College or Associate's Degree | $58,065 | $35,591 |
| Bachelor's Degree | $74,333 | $48,771 |
| Graduate Degree | $97,324 | $63,993 |
| Total | $57,234 | $39,307 |
Family Income in Belknap County
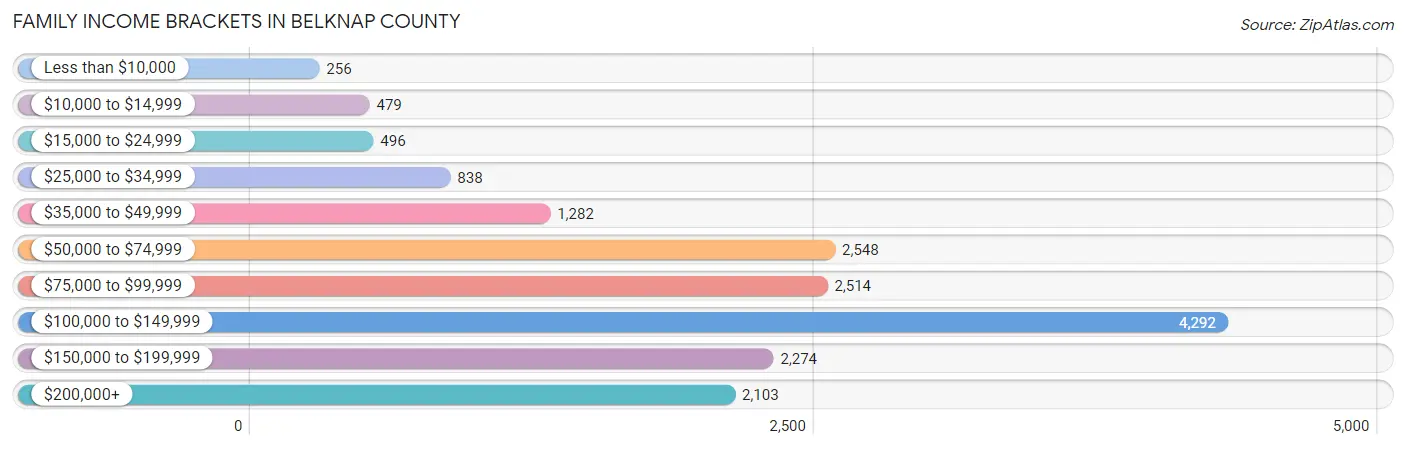
Family Income Brackets in Belknap County
According to the Belknap County family income data, there are 4,292 families falling into the $100,000 to $149,999 income range, which is the most common income bracket and makes up 25.1% of all families. Conversely, the less than $10,000 income bracket is the least frequent group with only 256 families (1.5%) belonging to this category.
| Income Bracket | # Families | % Families |
| Less than $10,000 | 256 | 1.5% |
| $10,000 to $14,999 | 479 | 2.8% |
| $15,000 to $24,999 | 496 | 2.9% |
| $25,000 to $34,999 | 838 | 4.9% |
| $35,000 to $49,999 | 1,282 | 7.5% |
| $50,000 to $74,999 | 2,548 | 14.9% |
| $75,000 to $99,999 | 2,514 | 14.7% |
| $100,000 to $149,999 | 4,292 | 25.1% |
| $150,000 to $199,999 | 2,274 | 13.3% |
| $200,000+ | 2,103 | 12.3% |
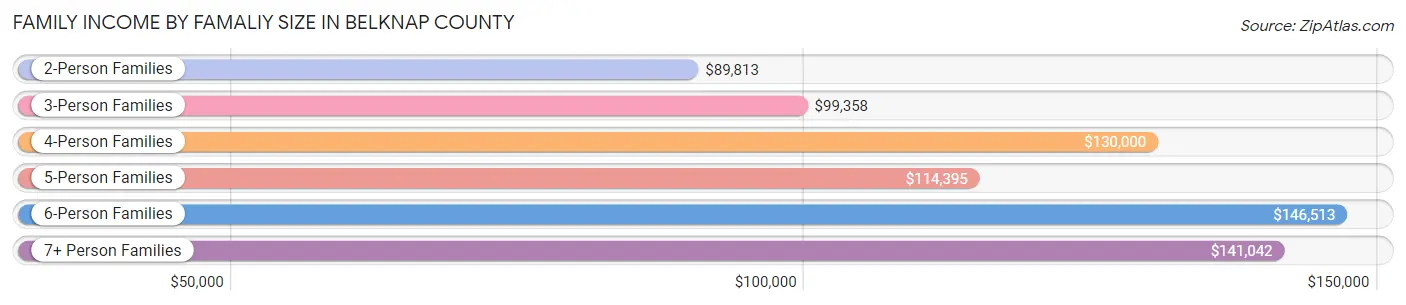
Family Income by Famaliy Size in Belknap County
6-person families (201 | 1.2%) account for the highest median family income in Belknap County with $146,513 per family, while 2-person families (9,741 | 57.0%) have the highest median income of $44,906 per family member.
| Income Bracket | # Families | Median Income |
| 2-Person Families | 9,741 (57.0%) | $89,813 |
| 3-Person Families | 3,413 (20.0%) | $99,358 |
| 4-Person Families | 2,628 (15.4%) | $130,000 |
| 5-Person Families | 927 (5.4%) | $114,395 |
| 6-Person Families | 201 (1.2%) | $146,513 |
| 7+ Person Families | 190 (1.1%) | $141,042 |
| Total | 17,100 (100.0%) | $101,175 |
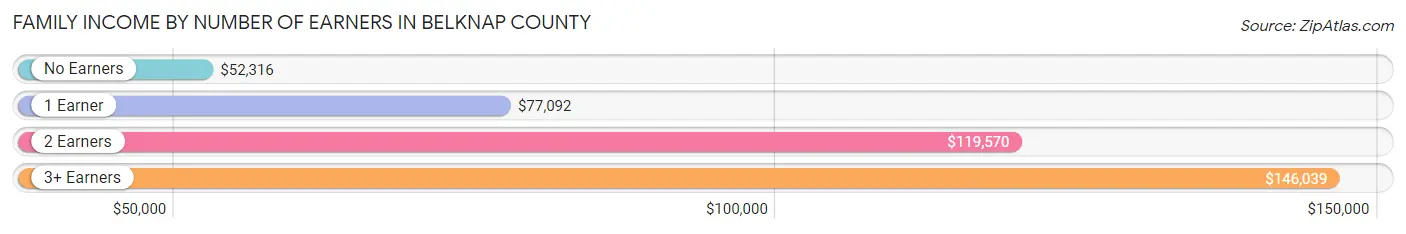
Family Income by Number of Earners in Belknap County
The median family income in Belknap County is $101,175, with families comprising 3+ earners (2,369) having the highest median family income of $146,039, while families with no earners (2,945) have the lowest median family income of $52,316, accounting for 13.9% and 17.2% of families, respectively.
| Number of Earners | # Families | Median Income |
| No Earners | 2,945 (17.2%) | $52,316 |
| 1 Earner | 5,082 (29.7%) | $77,092 |
| 2 Earners | 6,704 (39.2%) | $119,570 |
| 3+ Earners | 2,369 (13.9%) | $146,039 |
| Total | 17,100 (100.0%) | $101,175 |
Household Income in Belknap County
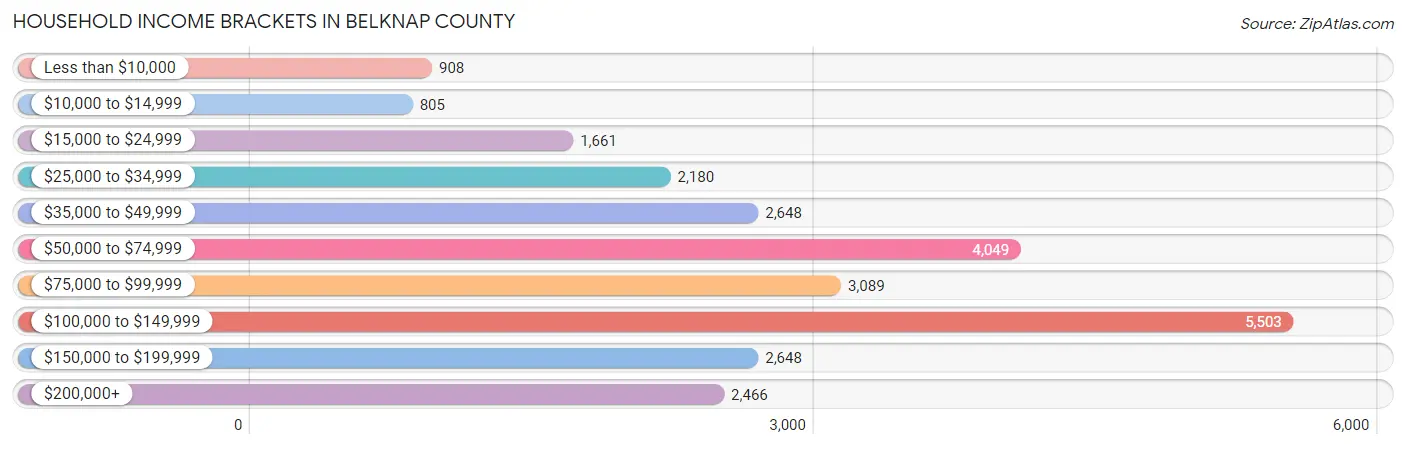
Household Income Brackets in Belknap County
With 5,503 households falling in the category, the $100,000 to $149,999 income range is the most frequent in Belknap County, accounting for 21.2% of all households. In contrast, only 805 households (3.1%) fall into the $10,000 to $14,999 income bracket, making it the least populous group.
| Income Bracket | # Households | % Households |
| Less than $10,000 | 908 | 3.5% |
| $10,000 to $14,999 | 805 | 3.1% |
| $15,000 to $24,999 | 1,661 | 6.4% |
| $25,000 to $34,999 | 2,180 | 8.4% |
| $35,000 to $49,999 | 2,648 | 10.2% |
| $50,000 to $74,999 | 4,049 | 15.6% |
| $75,000 to $99,999 | 3,089 | 11.9% |
| $100,000 to $149,999 | 5,503 | 21.2% |
| $150,000 to $199,999 | 2,648 | 10.2% |
| $200,000+ | 2,466 | 9.5% |
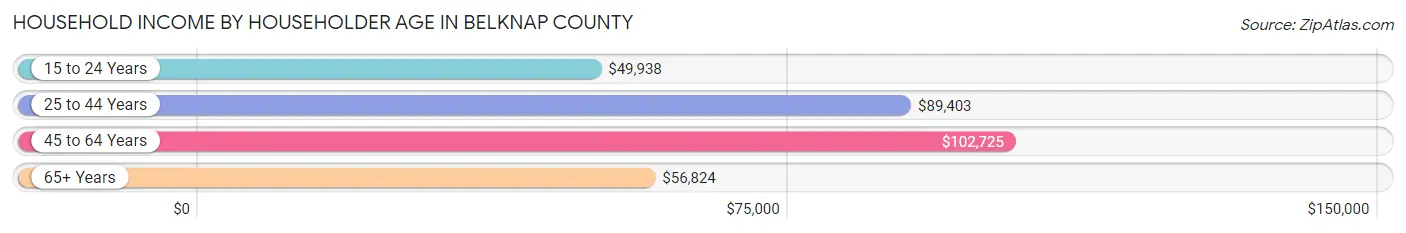
Household Income by Householder Age in Belknap County
The median household income in Belknap County is $80,719, with the highest median household income of $102,725 found in the 45 to 64 years age bracket for the primary householder. A total of 10,570 households (40.7%) fall into this category. Meanwhile, the 15 to 24 years age bracket for the primary householder has the lowest median household income of $49,938, with 257 households (1.0%) in this group.
| Income Bracket | # Households | Median Income |
| 15 to 24 Years | 257 (1.0%) | $49,938 |
| 25 to 44 Years | 6,220 (24.0%) | $89,403 |
| 45 to 64 Years | 10,570 (40.7%) | $102,725 |
| 65+ Years | 8,909 (34.3%) | $56,824 |
| Total | 25,956 (100.0%) | $80,719 |
Poverty in Belknap County
Income Below Poverty by Sex and Age in Belknap County
With 8.2% poverty level for males and 9.0% for females among the residents of Belknap County, 15 year old males and under 5 year old females are the most vulnerable to poverty, with 71 males (17.0%) and 310 females (23.5%) in their respective age groups living below the poverty level.
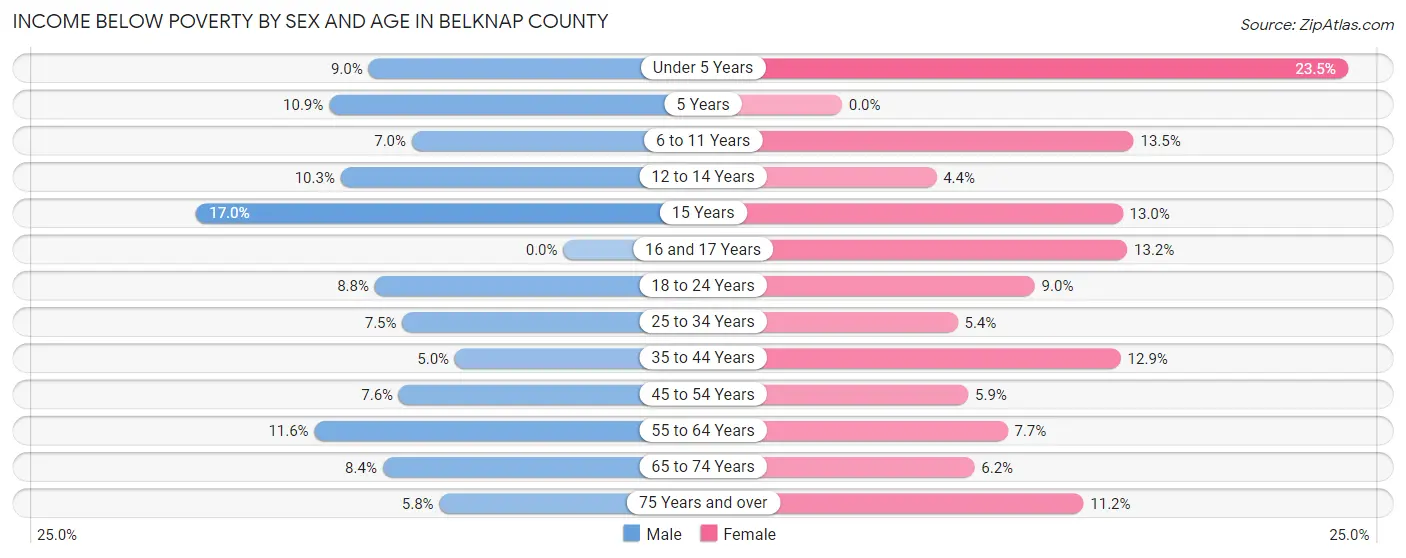
| Age Bracket | Male | Female |
| Under 5 Years | 112 (9.0%) | 310 (23.5%) |
| 5 Years | 20 (10.9%) | 0 (0.0%) |
| 6 to 11 Years | 140 (7.0%) | 247 (13.5%) |
| 12 to 14 Years | 117 (10.3%) | 48 (4.4%) |
| 15 Years | 71 (17.0%) | 34 (13.0%) |
| 16 and 17 Years | 0 (0.0%) | 107 (13.2%) |
| 18 to 24 Years | 197 (8.7%) | 195 (8.9%) |
| 25 to 34 Years | 260 (7.5%) | 175 (5.4%) |
| 35 to 44 Years | 175 (5.0%) | 475 (12.9%) |
| 45 to 54 Years | 311 (7.6%) | 238 (5.9%) |
| 55 to 64 Years | 650 (11.6%) | 438 (7.7%) |
| 65 to 74 Years | 364 (8.4%) | 283 (6.1%) |
| 75 Years and over | 126 (5.8%) | 315 (11.2%) |
| Total | 2,543 (8.2%) | 2,865 (9.0%) |
Income Above Poverty by Sex and Age in Belknap County
According to the poverty statistics in Belknap County, males aged 16 and 17 years and females aged 5 years are the age groups that are most secure financially, with 100.0% of males and 100.0% of females in these age groups living above the poverty line.
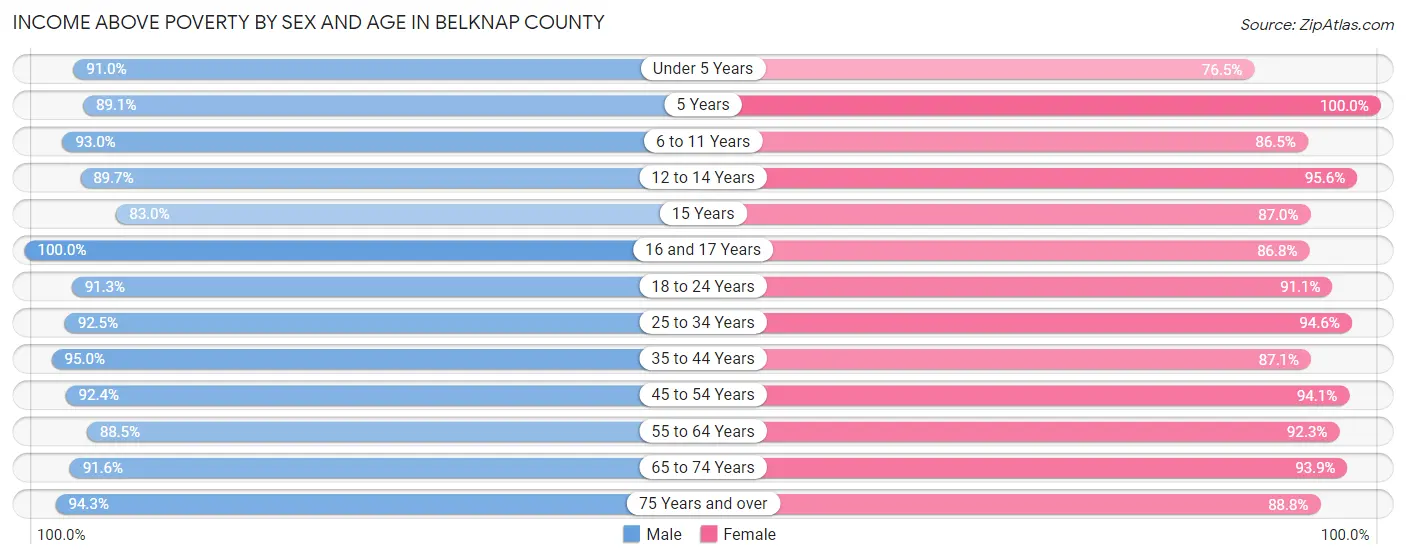
| Age Bracket | Male | Female |
| Under 5 Years | 1,127 (91.0%) | 1,011 (76.5%) |
| 5 Years | 164 (89.1%) | 368 (100.0%) |
| 6 to 11 Years | 1,851 (93.0%) | 1,577 (86.5%) |
| 12 to 14 Years | 1,016 (89.7%) | 1,049 (95.6%) |
| 15 Years | 346 (83.0%) | 227 (87.0%) |
| 16 and 17 Years | 745 (100.0%) | 701 (86.8%) |
| 18 to 24 Years | 2,054 (91.2%) | 1,984 (91.0%) |
| 25 to 34 Years | 3,222 (92.5%) | 3,081 (94.6%) |
| 35 to 44 Years | 3,303 (95.0%) | 3,195 (87.1%) |
| 45 to 54 Years | 3,764 (92.4%) | 3,821 (94.1%) |
| 55 to 64 Years | 4,976 (88.4%) | 5,257 (92.3%) |
| 65 to 74 Years | 3,978 (91.6%) | 4,318 (93.9%) |
| 75 Years and over | 2,067 (94.3%) | 2,494 (88.8%) |
| Total | 28,613 (91.8%) | 29,083 (91.0%) |
Income Below Poverty Among Married-Couple Families in Belknap County
The poverty statistics for married-couple families in Belknap County show that 3.6% or 488 of the total 13,675 families live below the poverty line. Families with no children have the highest poverty rate of 4.1%, comprising of 393 families. On the other hand, families with 3 or 4 children have the lowest poverty rate of 0.0%, which includes 0 families.
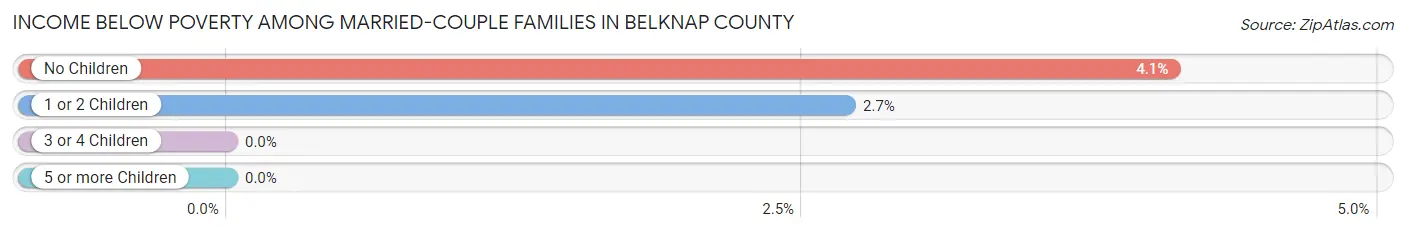
| Children | Above Poverty | Below Poverty |
| No Children | 9,181 (95.9%) | 393 (4.1%) |
| 1 or 2 Children | 3,434 (97.3%) | 95 (2.7%) |
| 3 or 4 Children | 555 (100.0%) | 0 (0.0%) |
| 5 or more Children | 17 (100.0%) | 0 (0.0%) |
| Total | 13,187 (96.4%) | 488 (3.6%) |
Income Below Poverty Among Single-Parent Households in Belknap County
According to the poverty data in Belknap County, 12.1% or 120 single-father households and 20.1% or 490 single-mother households are living below the poverty line. Among single-father households, those with no children have the highest poverty rate, with 55 households (13.2%) experiencing poverty. Likewise, among single-mother households, those with 3 or 4 children have the highest poverty rate, with 50 households (36.5%) falling below the poverty line.
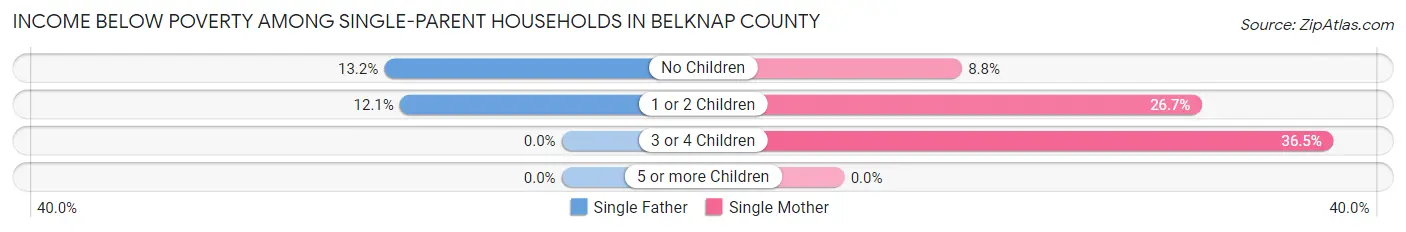
| Children | Single Father | Single Mother |
| No Children | 55 (13.2%) | 85 (8.8%) |
| 1 or 2 Children | 65 (12.1%) | 355 (26.7%) |
| 3 or 4 Children | 0 (0.0%) | 50 (36.5%) |
| 5 or more Children | 0 (0.0%) | 0 (0.0%) |
| Total | 120 (12.1%) | 490 (20.1%) |
Income Below Poverty Among Married-Couple vs Single-Parent Households in Belknap County
The poverty data for Belknap County shows that 488 of the married-couple family households (3.6%) and 610 of the single-parent households (17.8%) are living below the poverty level. Within the married-couple family households, those with no children have the highest poverty rate, with 393 households (4.1%) falling below the poverty line. Among the single-parent households, those with 3 or 4 children have the highest poverty rate, with 50 household (29.2%) living below poverty.
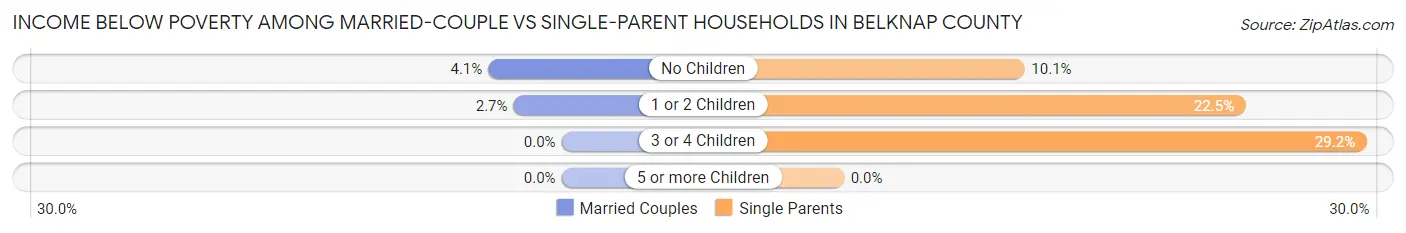
| Children | Married-Couple Families | Single-Parent Households |
| No Children | 393 (4.1%) | 140 (10.1%) |
| 1 or 2 Children | 95 (2.7%) | 420 (22.5%) |
| 3 or 4 Children | 0 (0.0%) | 50 (29.2%) |
| 5 or more Children | 0 (0.0%) | 0 (0.0%) |
| Total | 488 (3.6%) | 610 (17.8%) |
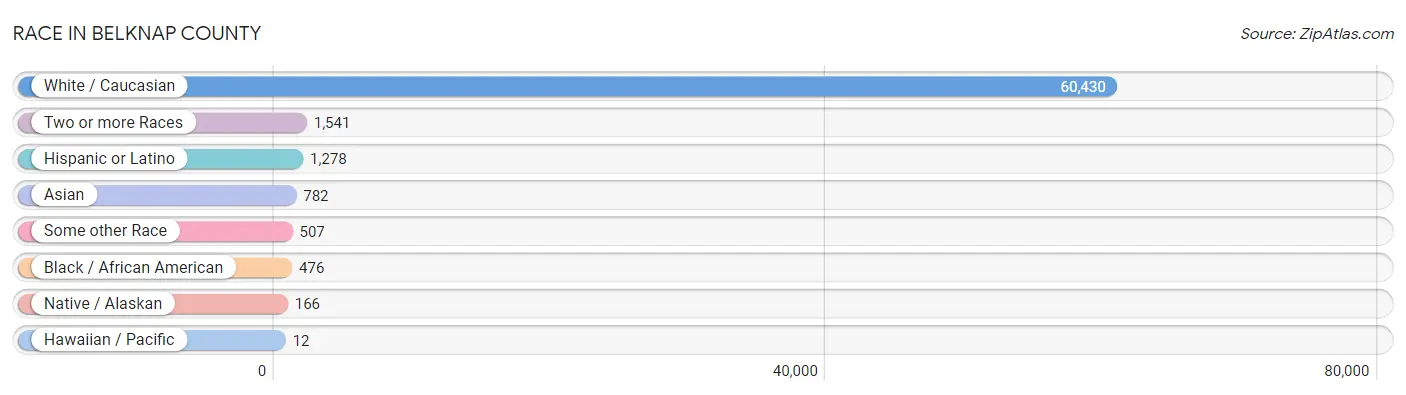
Race in Belknap County
The most populous races in Belknap County are White / Caucasian (60,430 | 94.6%), Two or more Races (1,541 | 2.4%), and Hispanic or Latino (1,278 | 2.0%).
| Race | # Population | % Population |
| Asian | 782 | 1.2% |
| Black / African American | 476 | 0.7% |
| Hawaiian / Pacific | 12 | 0.0% |
| Hispanic or Latino | 1,278 | 2.0% |
| Native / Alaskan | 166 | 0.3% |
| White / Caucasian | 60,430 | 94.6% |
| Two or more Races | 1,541 | 2.4% |
| Some other Race | 507 | 0.8% |
| Total | 63,914 | 100.0% |
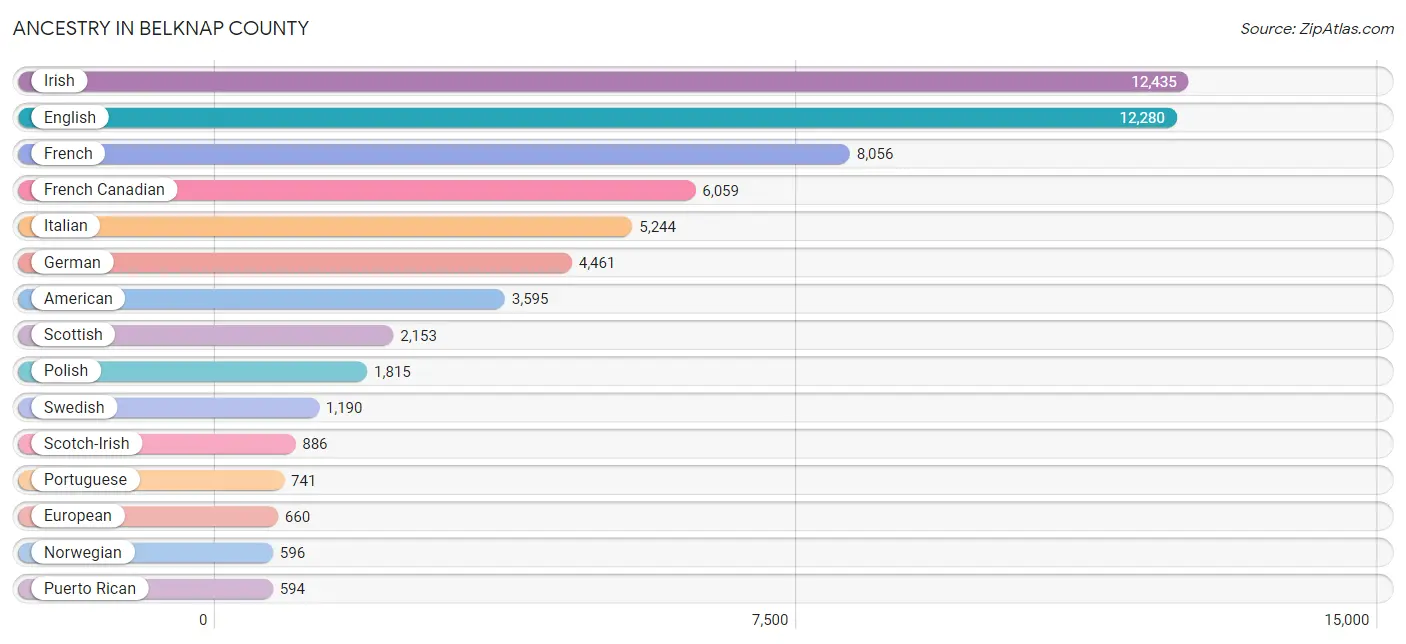
Ancestry in Belknap County
The most populous ancestries reported in Belknap County are Irish (12,435 | 19.5%), English (12,280 | 19.2%), French (8,056 | 12.6%), French Canadian (6,059 | 9.5%), and Italian (5,244 | 8.2%), together accounting for 68.9% of all Belknap County residents.
| Ancestry | # Population | % Population |
| Albanian | 179 | 0.3% |
| American | 3,595 | 5.6% |
| Apache | 3 | 0.0% |
| Arab | 47 | 0.1% |
| Armenian | 100 | 0.2% |
| Australian | 22 | 0.0% |
| Austrian | 137 | 0.2% |
| Basque | 20 | 0.0% |
| Belgian | 72 | 0.1% |
| Blackfeet | 16 | 0.0% |
| Brazilian | 39 | 0.1% |
| British | 409 | 0.6% |
| Burmese | 131 | 0.2% |
| Cambodian | 12 | 0.0% |
| Canadian | 293 | 0.5% |
| Celtic | 12 | 0.0% |
| Central American | 7 | 0.0% |
| Cherokee | 44 | 0.1% |
| Colombian | 101 | 0.2% |
| Croatian | 10 | 0.0% |
| Cuban | 54 | 0.1% |
| Cypriot | 31 | 0.1% |
| Czech | 119 | 0.2% |
| Czechoslovakian | 44 | 0.1% |
| Danish | 181 | 0.3% |
| Dominican | 44 | 0.1% |
| Dutch | 368 | 0.6% |
| Eastern European | 275 | 0.4% |
| English | 12,280 | 19.2% |
| Estonian | 3 | 0.0% |
| European | 660 | 1.0% |
| Fijian | 12 | 0.0% |
| Finnish | 151 | 0.2% |
| French | 8,056 | 12.6% |
| French American Indian | 13 | 0.0% |
| French Canadian | 6,059 | 9.5% |
| German | 4,461 | 7.0% |
| Greek | 559 | 0.9% |
| Hungarian | 143 | 0.2% |
| Icelander | 37 | 0.1% |
| Indian (Asian) | 130 | 0.2% |
| Iranian | 26 | 0.0% |
| Irish | 12,435 | 19.5% |
| Iroquois | 40 | 0.1% |
| Italian | 5,244 | 8.2% |
| Jamaican | 54 | 0.1% |
| Japanese | 1 | 0.0% |
| Korean | 159 | 0.3% |
| Latvian | 34 | 0.1% |
| Lebanese | 39 | 0.1% |
| Lithuanian | 286 | 0.4% |
| Malaysian | 135 | 0.2% |
| Mexican | 350 | 0.5% |
| Northern European | 87 | 0.1% |
| Norwegian | 596 | 0.9% |
| Pakistani | 24 | 0.0% |
| Peruvian | 5 | 0.0% |
| Polish | 1,815 | 2.8% |
| Portuguese | 741 | 1.2% |
| Puerto Rican | 594 | 0.9% |
| Romanian | 209 | 0.3% |
| Russian | 381 | 0.6% |
| Salvadoran | 7 | 0.0% |
| Scandinavian | 236 | 0.4% |
| Scotch-Irish | 886 | 1.4% |
| Scottish | 2,153 | 3.4% |
| Serbian | 31 | 0.1% |
| Slavic | 11 | 0.0% |
| Slovak | 21 | 0.0% |
| Slovene | 11 | 0.0% |
| South American | 106 | 0.2% |
| Spaniard | 54 | 0.1% |
| Sri Lankan | 36 | 0.1% |
| Swedish | 1,190 | 1.9% |
| Swiss | 36 | 0.1% |
| Syrian | 8 | 0.0% |
| Thai | 336 | 0.5% |
| Turkish | 5 | 0.0% |
| Ukrainian | 127 | 0.2% |
| Welsh | 350 | 0.5% |
| West Indian | 43 | 0.1% |
| Yugoslavian | 11 | 0.0% | View All 82 Rows |
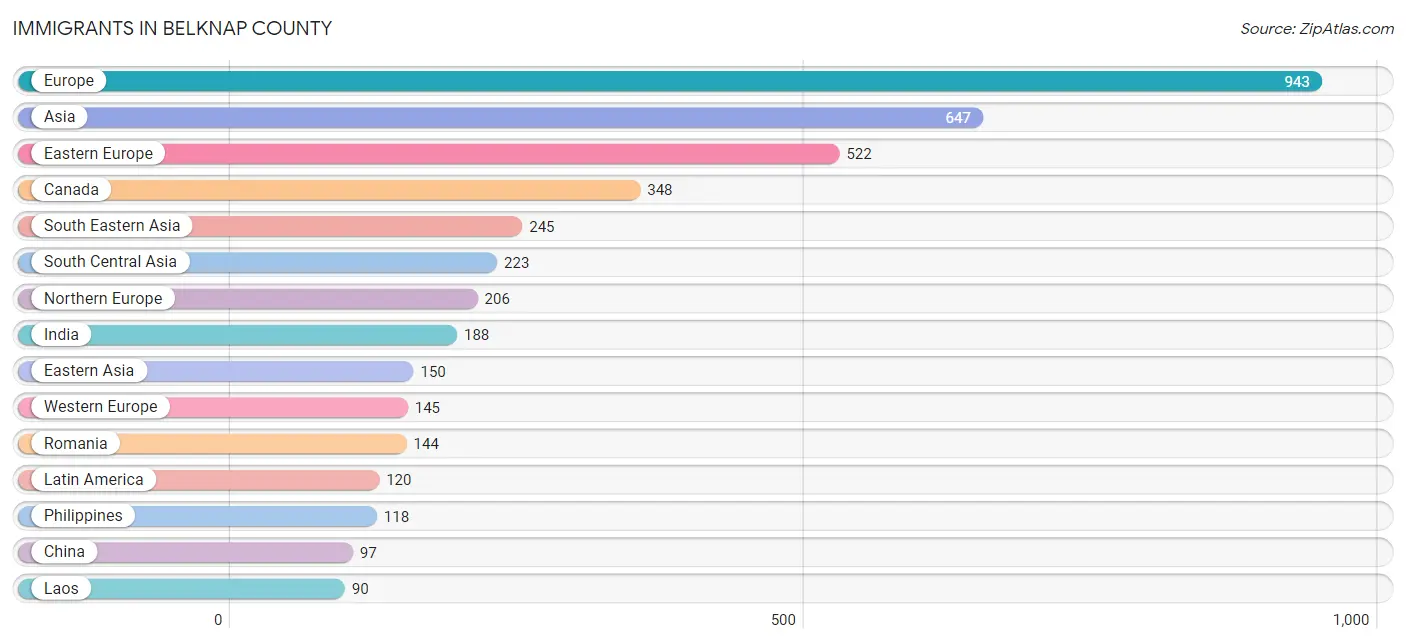
Immigrants in Belknap County
The most numerous immigrant groups reported in Belknap County came from Europe (943 | 1.5%), Asia (647 | 1.0%), Eastern Europe (522 | 0.8%), Canada (348 | 0.5%), and South Eastern Asia (245 | 0.4%), together accounting for 4.2% of all Belknap County residents.
| Immigration Origin | # Population | % Population |
| Argentina | 10 | 0.0% |
| Asia | 647 | 1.0% |
| Australia | 13 | 0.0% |
| Austria | 17 | 0.0% |
| Belgium | 20 | 0.0% |
| Cambodia | 1 | 0.0% |
| Canada | 348 | 0.5% |
| Caribbean | 68 | 0.1% |
| Central America | 7 | 0.0% |
| China | 97 | 0.2% |
| Colombia | 30 | 0.1% |
| Croatia | 41 | 0.1% |
| Denmark | 5 | 0.0% |
| Dominica | 1 | 0.0% |
| Dominican Republic | 13 | 0.0% |
| Eastern Asia | 150 | 0.2% |
| Eastern Europe | 522 | 0.8% |
| El Salvador | 7 | 0.0% |
| England | 42 | 0.1% |
| Europe | 943 | 1.5% |
| France | 20 | 0.0% |
| Germany | 78 | 0.1% |
| Greece | 9 | 0.0% |
| Hungary | 28 | 0.0% |
| India | 188 | 0.3% |
| Iran | 15 | 0.0% |
| Jamaica | 54 | 0.1% |
| Jordan | 6 | 0.0% |
| Korea | 53 | 0.1% |
| Laos | 90 | 0.1% |
| Latin America | 120 | 0.2% |
| Latvia | 7 | 0.0% |
| Lithuania | 23 | 0.0% |
| North Macedonia | 71 | 0.1% |
| Northern Europe | 206 | 0.3% |
| Norway | 22 | 0.0% |
| Oceania | 13 | 0.0% |
| Peru | 5 | 0.0% |
| Philippines | 118 | 0.2% |
| Poland | 9 | 0.0% |
| Portugal | 40 | 0.1% |
| Romania | 144 | 0.2% |
| Russia | 64 | 0.1% |
| Scotland | 33 | 0.1% |
| South America | 45 | 0.1% |
| South Central Asia | 223 | 0.4% |
| South Eastern Asia | 245 | 0.4% |
| Southern Europe | 70 | 0.1% |
| Spain | 21 | 0.0% |
| Switzerland | 10 | 0.0% |
| Taiwan | 35 | 0.1% |
| Thailand | 10 | 0.0% |
| Ukraine | 7 | 0.0% |
| Vietnam | 26 | 0.0% |
| Western Asia | 29 | 0.1% |
| Western Europe | 145 | 0.2% | View All 56 Rows |
Sex and Age in Belknap County
Sex and Age in Belknap County
The most populous age groups in Belknap County are 60 to 64 Years (3,032 | 9.6%) for men and 55 to 59 Years (2,989 | 9.3%) for women.
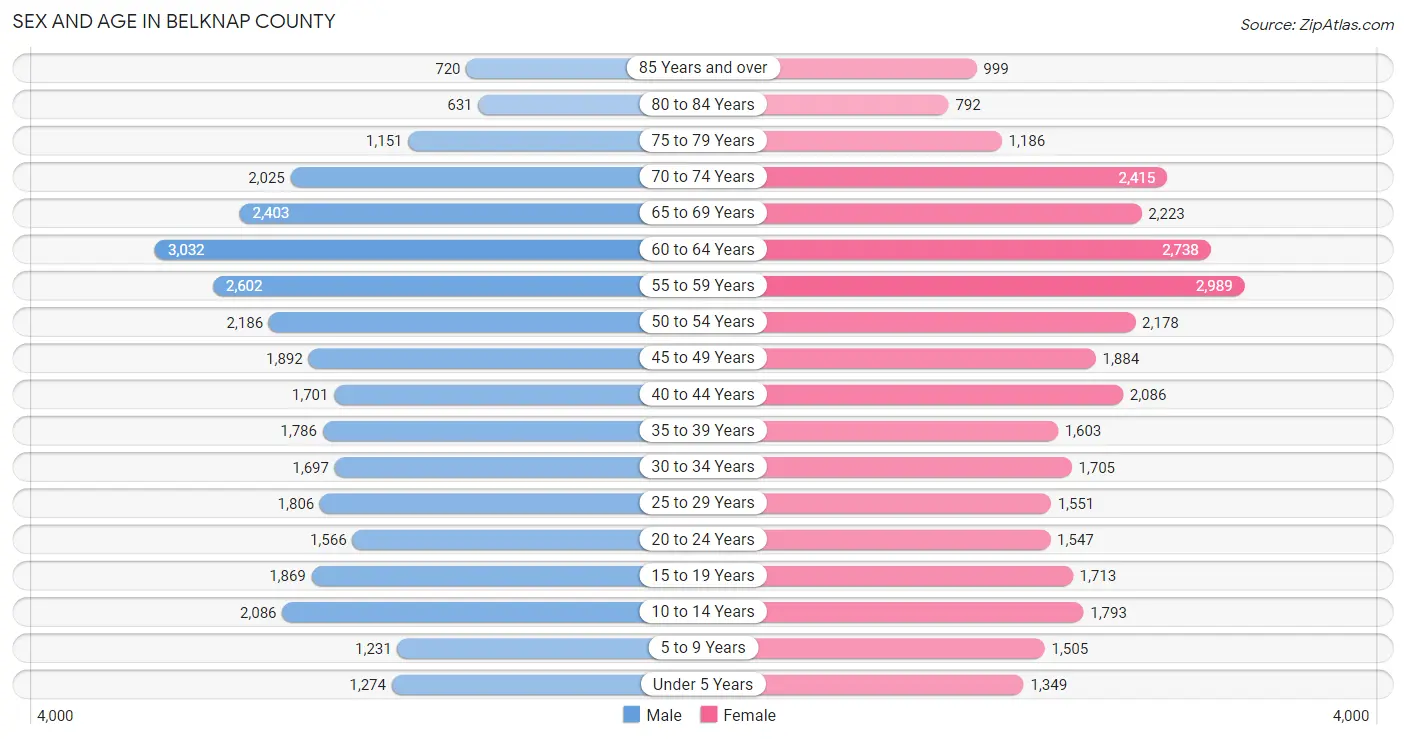
| Age Bracket | Male | Female |
| Under 5 Years | 1,274 (4.0%) | 1,349 (4.2%) |
| 5 to 9 Years | 1,231 (3.9%) | 1,505 (4.7%) |
| 10 to 14 Years | 2,086 (6.6%) | 1,793 (5.6%) |
| 15 to 19 Years | 1,869 (5.9%) | 1,713 (5.3%) |
| 20 to 24 Years | 1,566 (5.0%) | 1,547 (4.8%) |
| 25 to 29 Years | 1,806 (5.7%) | 1,551 (4.8%) |
| 30 to 34 Years | 1,697 (5.4%) | 1,705 (5.3%) |
| 35 to 39 Years | 1,786 (5.6%) | 1,603 (5.0%) |
| 40 to 44 Years | 1,701 (5.4%) | 2,086 (6.5%) |
| 45 to 49 Years | 1,892 (6.0%) | 1,884 (5.8%) |
| 50 to 54 Years | 2,186 (6.9%) | 2,178 (6.8%) |
| 55 to 59 Years | 2,602 (8.2%) | 2,989 (9.3%) |
| 60 to 64 Years | 3,032 (9.6%) | 2,738 (8.5%) |
| 65 to 69 Years | 2,403 (7.6%) | 2,223 (6.9%) |
| 70 to 74 Years | 2,025 (6.4%) | 2,415 (7.5%) |
| 75 to 79 Years | 1,151 (3.6%) | 1,186 (3.7%) |
| 80 to 84 Years | 631 (2.0%) | 792 (2.5%) |
| 85 Years and over | 720 (2.3%) | 999 (3.1%) |
| Total | 31,658 (100.0%) | 32,256 (100.0%) |
Families and Households in Belknap County
Median Family Size in Belknap County
The median family size in Belknap County is 2.96 persons per family, with single male/father families (989 | 5.8%) accounting for the largest median family size of 3.16 persons per family. On the other hand, married-couple families (13,675 | 80.0%) represent the smallest median family size with 2.93 persons per family.
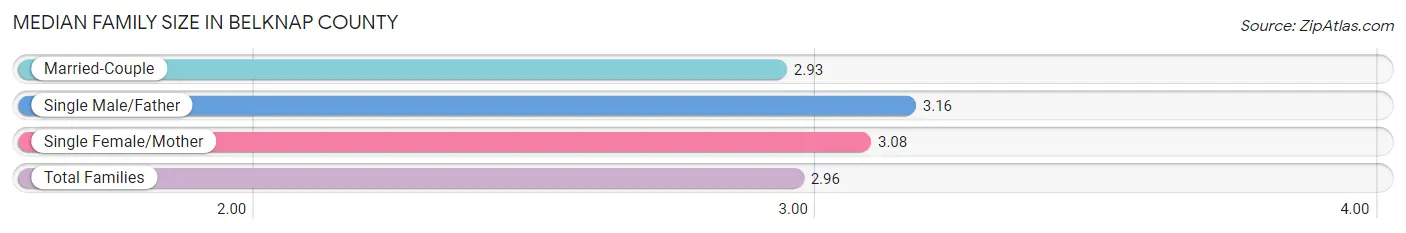
| Family Type | # Families | Family Size |
| Married-Couple | 13,675 (80.0%) | 2.93 |
| Single Male/Father | 989 (5.8%) | 3.16 |
| Single Female/Mother | 2,436 (14.2%) | 3.08 |
| Total Families | 17,100 (100.0%) | 2.96 |
Median Household Size in Belknap County
The median household size in Belknap County is 2.42 persons per household, with single male/father households (989 | 3.8%) accounting for the largest median household size of 3.72 persons per household. non-family households (8,856 | 34.1%) represent the smallest median household size with 1.18 persons per household.
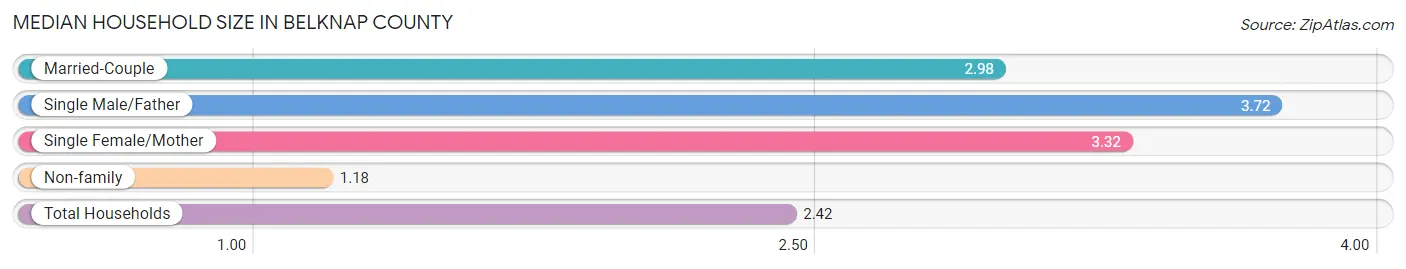
| Household Type | # Households | Household Size |
| Married-Couple | 13,675 (52.7%) | 2.98 |
| Single Male/Father | 989 (3.8%) | 3.72 |
| Single Female/Mother | 2,436 (9.4%) | 3.32 |
| Non-family | 8,856 (34.1%) | 1.18 |
| Total Households | 25,956 (100.0%) | 2.42 |
Household Size by Marriage Status in Belknap County
Out of a total of 25,956 households in Belknap County, 17,100 (65.9%) are family households, while 8,856 (34.1%) are nonfamily households. The most numerous type of family households are 2-person households, comprising 8,991, and the most common type of nonfamily households are 1-person households, comprising 7,616.
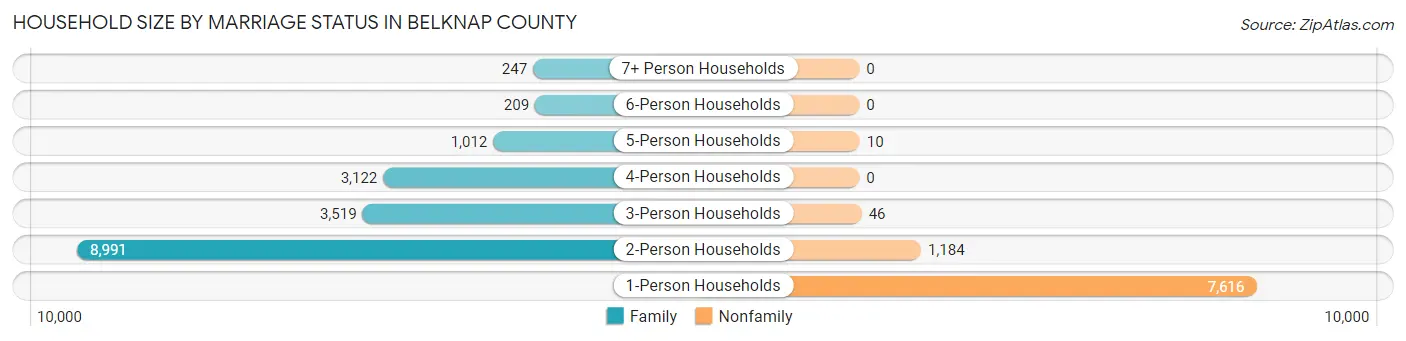
| Household Size | Family Households | Nonfamily Households |
| 1-Person Households | - | 7,616 (29.3%) |
| 2-Person Households | 8,991 (34.6%) | 1,184 (4.6%) |
| 3-Person Households | 3,519 (13.6%) | 46 (0.2%) |
| 4-Person Households | 3,122 (12.0%) | 0 (0.0%) |
| 5-Person Households | 1,012 (3.9%) | 10 (0.0%) |
| 6-Person Households | 209 (0.8%) | 0 (0.0%) |
| 7+ Person Households | 247 (0.9%) | 0 (0.0%) |
| Total | 17,100 (65.9%) | 8,856 (34.1%) |
Female Fertility in Belknap County
Fertility by Age in Belknap County
Average fertility rate in Belknap County is 62.0 births per 1,000 women. Women in the age bracket of 20 to 34 years have the highest fertility rate with 97.0 births per 1,000 women. Women in the age bracket of 20 to 34 years acount for 60.1% of all women with births.
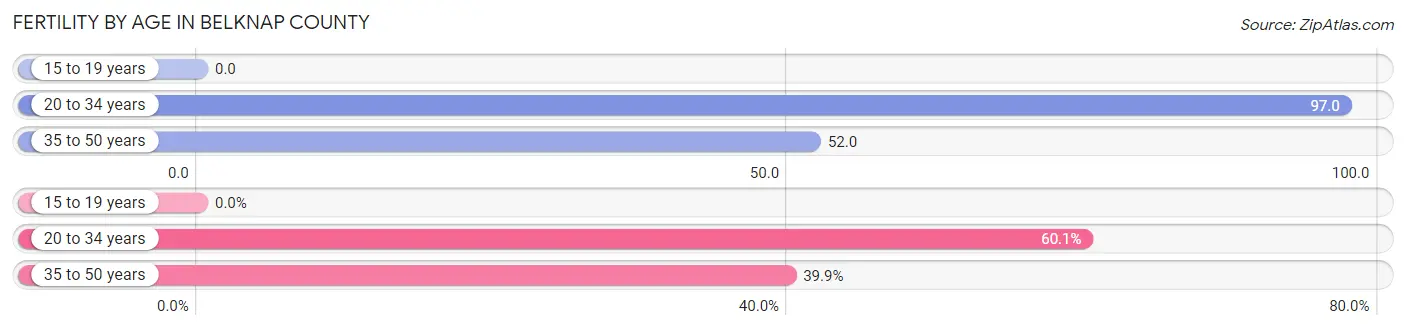
| Age Bracket | Women with Births | Births / 1,000 Women |
| 15 to 19 years | 0 (0.0%) | 0.0 |
| 20 to 34 years | 465 (60.1%) | 97.0 |
| 35 to 50 years | 309 (39.9%) | 52.0 |
| Total | 774 (100.0%) | 62.0 |
Fertility by Age by Marriage Status in Belknap County
74.5% of women with births (774) in Belknap County are married. The highest percentage of unmarried women with births falls into 20 to 34 years age bracket with 34.2% of them unmarried at the time of birth, while the lowest percentage of unmarried women with births belong to 35 to 50 years age bracket with 12.3% of them unmarried.
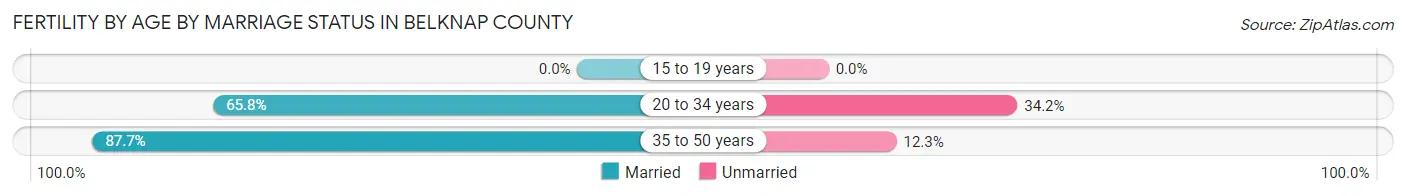
| Age Bracket | Married | Unmarried |
| 15 to 19 years | 0 (0.0%) | 0 (0.0%) |
| 20 to 34 years | 306 (65.8%) | 159 (34.2%) |
| 35 to 50 years | 271 (87.7%) | 38 (12.3%) |
| Total | 577 (74.6%) | 197 (25.5%) |
Fertility by Education in Belknap County
Average fertility rate in Belknap County is 62.0 births per 1,000 women. Women with the education attainment of bachelor's degree have the highest fertility rate of 115.0 births per 1,000 women, while women with the education attainment of high school diploma have the lowest fertility at 35.0 births per 1,000 women. Women with the education attainment of bachelor's degree represent 35.8% of all women with births.
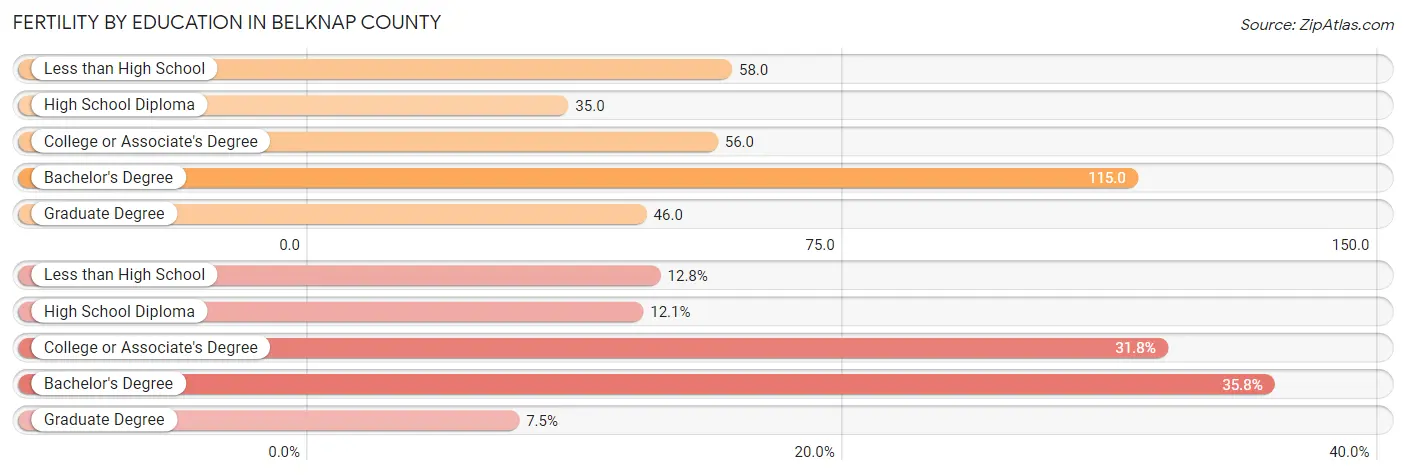
| Educational Attainment | Women with Births | Births / 1,000 Women |
| Less than High School | 99 (12.8%) | 58.0 |
| High School Diploma | 94 (12.1%) | 35.0 |
| College or Associate's Degree | 246 (31.8%) | 56.0 |
| Bachelor's Degree | 277 (35.8%) | 115.0 |
| Graduate Degree | 58 (7.5%) | 46.0 |
| Total | 774 (100.0%) | 62.0 |
Fertility by Education by Marriage Status in Belknap County
25.5% of women with births in Belknap County are unmarried. Women with the educational attainment of graduate degree are most likely to be married with 100.0% of them married at childbirth, while women with the educational attainment of less than high school are least likely to be married with 87.9% of them unmarried at childbirth.
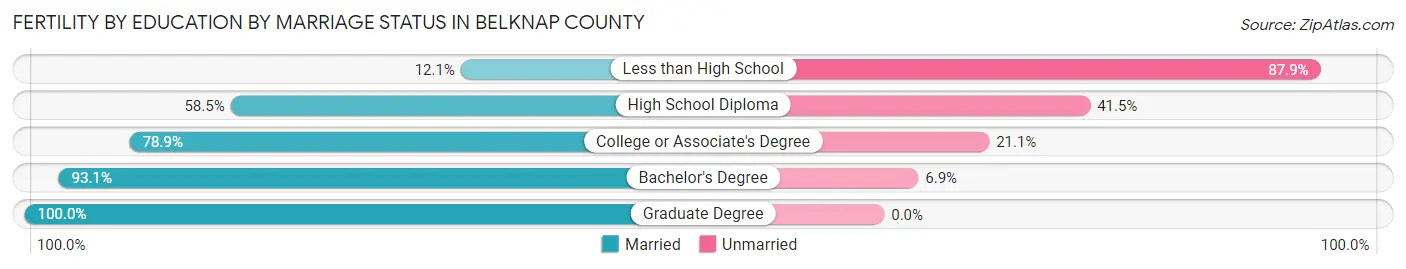
| Educational Attainment | Married | Unmarried |
| Less than High School | 12 (12.1%) | 87 (87.9%) |
| High School Diploma | 55 (58.5%) | 39 (41.5%) |
| College or Associate's Degree | 194 (78.9%) | 52 (21.1%) |
| Bachelor's Degree | 258 (93.1%) | 19 (6.9%) |
| Graduate Degree | 58 (100.0%) | 0 (0.0%) |
| Total | 577 (74.6%) | 197 (25.5%) |
Employment Characteristics in Belknap County
Employment by Class of Employer in Belknap County
Among the 32,144 employed individuals in Belknap County, private company employees (19,874 | 61.8%), not-for-profit organizations (3,776 | 11.7%), and local government employees (2,786 | 8.7%) make up the most common classes of employment.
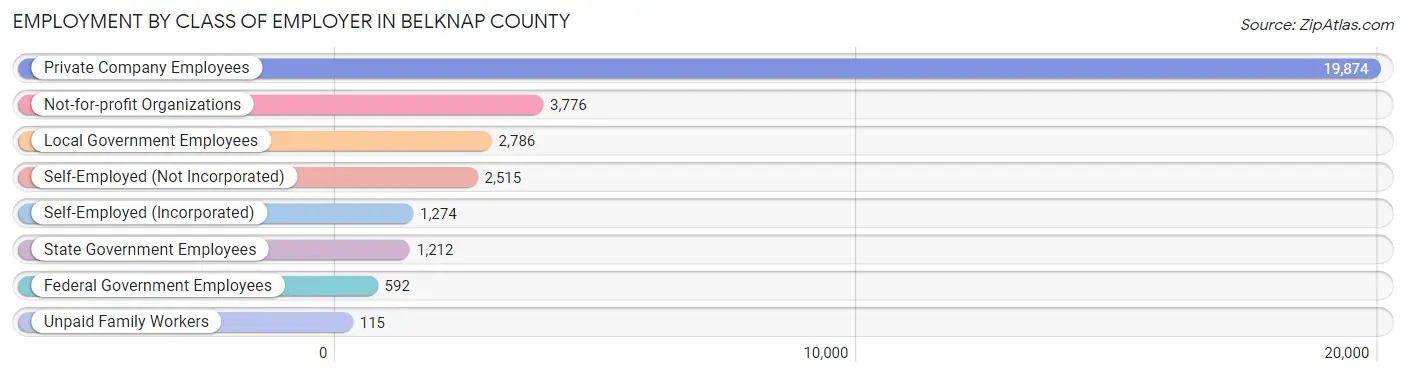
| Employer Class | # Employees | % Employees |
| Private Company Employees | 19,874 | 61.8% |
| Self-Employed (Incorporated) | 1,274 | 4.0% |
| Self-Employed (Not Incorporated) | 2,515 | 7.8% |
| Not-for-profit Organizations | 3,776 | 11.7% |
| Local Government Employees | 2,786 | 8.7% |
| State Government Employees | 1,212 | 3.8% |
| Federal Government Employees | 592 | 1.8% |
| Unpaid Family Workers | 115 | 0.4% |
| Total | 32,144 | 100.0% |
Employment Status by Age in Belknap County
According to the labor force statistics for Belknap County, out of the total population over 16 years of age (53,998), 62.7% or 33,857 individuals are in the labor force, with 2.7% or 914 of them unemployed. The age group with the highest labor force participation rate is 35 to 44 years, with 87.5% or 6,279 individuals in the labor force. Within the labor force, the 25 to 29 years age range has the highest percentage of unemployed individuals, with 7.5% or 206 of them being unemployed.
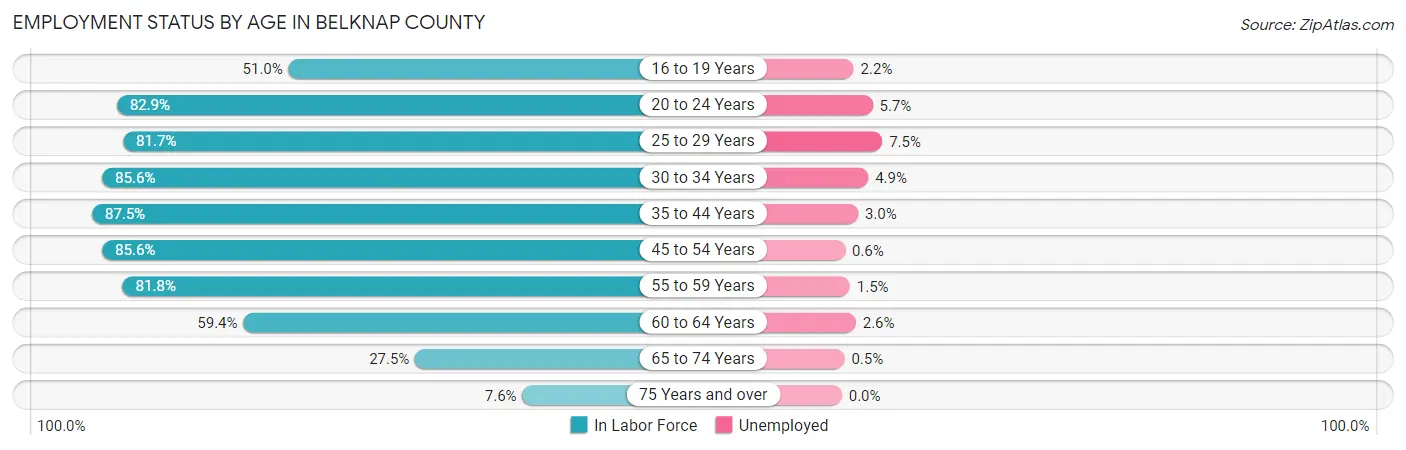
| Age Bracket | In Labor Force | Unemployed |
| 16 to 19 Years | 1,481 (51.0%) | 33 (2.2%) |
| 20 to 24 Years | 2,581 (82.9%) | 147 (5.7%) |
| 25 to 29 Years | 2,743 (81.7%) | 206 (7.5%) |
| 30 to 34 Years | 2,912 (85.6%) | 143 (4.9%) |
| 35 to 44 Years | 6,279 (87.5%) | 188 (3.0%) |
| 45 to 54 Years | 6,968 (85.6%) | 42 (0.6%) |
| 55 to 59 Years | 4,573 (81.8%) | 69 (1.5%) |
| 60 to 64 Years | 3,427 (59.4%) | 89 (2.6%) |
| 65 to 74 Years | 2,493 (27.5%) | 12 (0.5%) |
| 75 Years and over | 416 (7.6%) | 0 (0.0%) |
| Total | 33,857 (62.7%) | 914 (2.7%) |
Employment Status by Educational Attainment in Belknap County
According to labor force statistics for Belknap County, 80.4% of individuals (26,883) out of the total population between 25 and 64 years of age (33,436) are in the labor force, with 2.7% or 726 of them being unemployed. The group with the highest labor force participation rate are those with the educational attainment of bachelor's degree or higher, with 84.5% or 8,659 individuals in the labor force. Within the labor force, individuals with less than high school education have the highest percentage of unemployment, with 12.3% or 157 of them being unemployed.
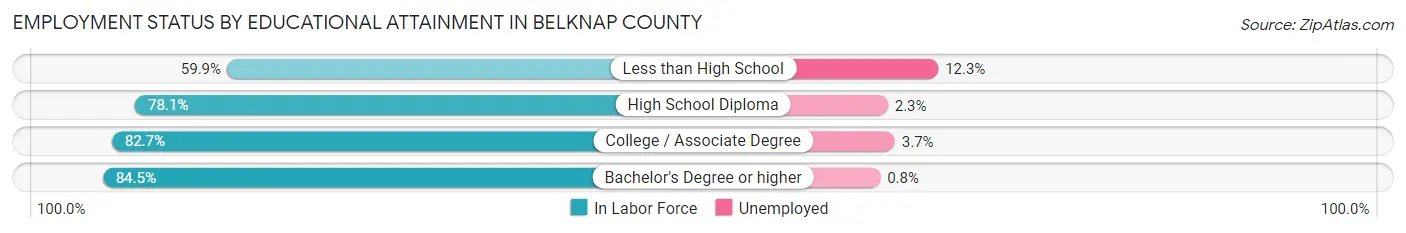
| Educational Attainment | In Labor Force | Unemployed |
| Less than High School | 1,277 (59.9%) | 262 (12.3%) |
| High School Diploma | 7,711 (78.1%) | 227 (2.3%) |
| College / Associate Degree | 9,249 (82.7%) | 414 (3.7%) |
| Bachelor's Degree or higher | 8,659 (84.5%) | 82 (0.8%) |
| Total | 26,883 (80.4%) | 903 (2.7%) |
Employment Occupations by Sex in Belknap County
Management, Business, Science and Arts Occupations
The most common Management, Business, Science and Arts occupations in Belknap County are Management (3,697 | 11.3%), Community & Social Service (3,350 | 10.2%), Education Instruction & Library (2,184 | 6.7%), Computers, Engineering & Science (1,948 | 5.9%), and Health Diagnosing & Treating (1,829 | 5.6%).
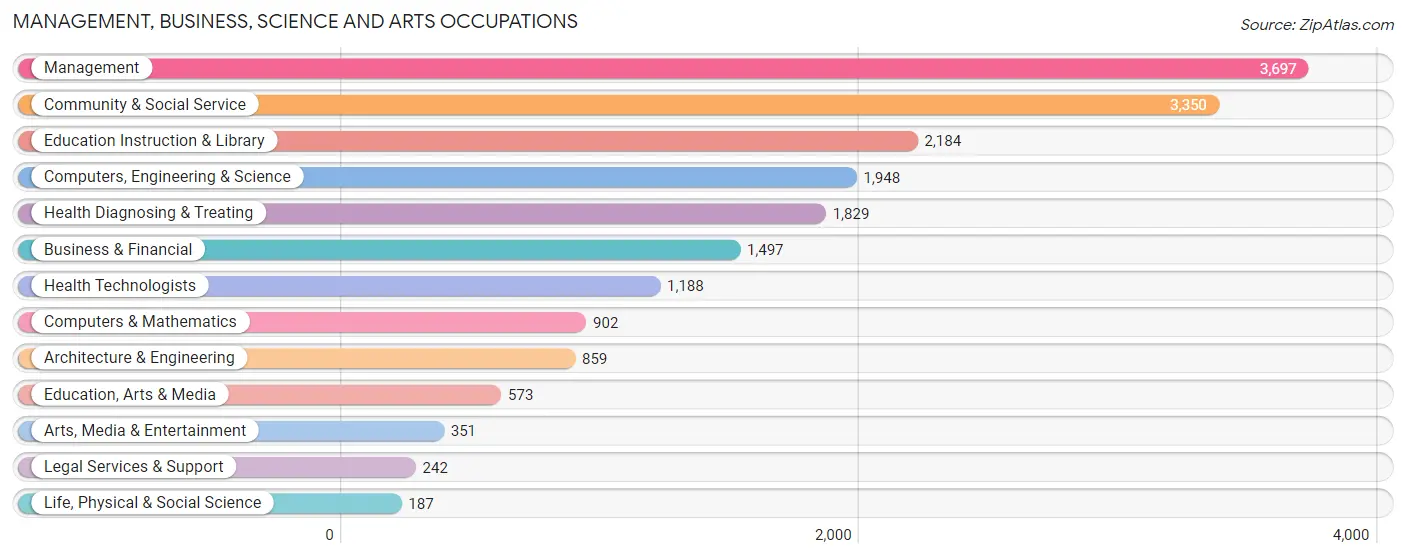
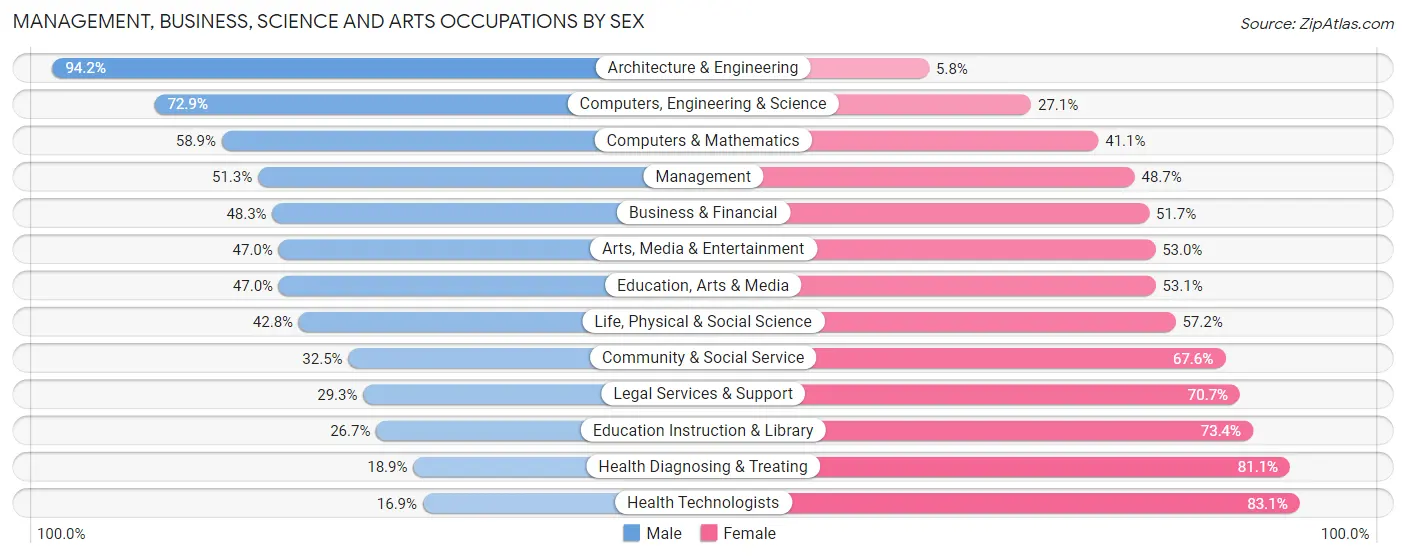
Management, Business, Science and Arts Occupations by Sex
Within the Management, Business, Science and Arts occupations in Belknap County, the most male-oriented occupations are Architecture & Engineering (94.2%), Computers, Engineering & Science (72.9%), and Computers & Mathematics (58.9%), while the most female-oriented occupations are Health Technologists (83.1%), Health Diagnosing & Treating (81.1%), and Education Instruction & Library (73.4%).
| Occupation | Male | Female |
| Management | 1,897 (51.3%) | 1,800 (48.7%) |
| Business & Financial | 723 (48.3%) | 774 (51.7%) |
| Computers, Engineering & Science | 1,420 (72.9%) | 528 (27.1%) |
| Computers & Mathematics | 531 (58.9%) | 371 (41.1%) |
| Architecture & Engineering | 809 (94.2%) | 50 (5.8%) |
| Life, Physical & Social Science | 80 (42.8%) | 107 (57.2%) |
| Community & Social Service | 1,087 (32.5%) | 2,263 (67.5%) |
| Education, Arts & Media | 269 (46.9%) | 304 (53.0%) |
| Legal Services & Support | 71 (29.3%) | 171 (70.7%) |
| Education Instruction & Library | 582 (26.7%) | 1,602 (73.4%) |
| Arts, Media & Entertainment | 165 (47.0%) | 186 (53.0%) |
| Health Diagnosing & Treating | 346 (18.9%) | 1,483 (81.1%) |
| Health Technologists | 201 (16.9%) | 987 (83.1%) |
| Total (Category) | 5,473 (44.4%) | 6,848 (55.6%) |
| Total (Overall) | 16,836 (51.3%) | 16,006 (48.7%) |
Services Occupations
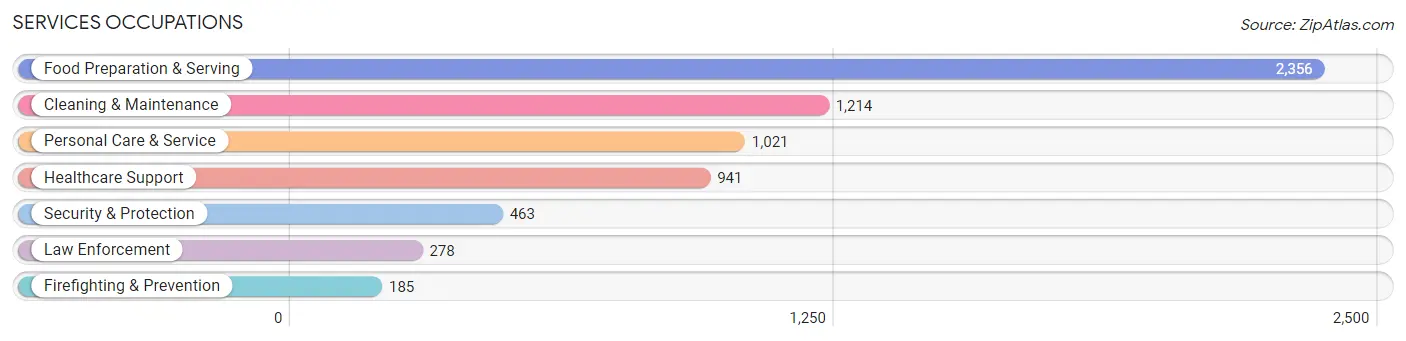
The most common Services occupations in Belknap County are Food Preparation & Serving (2,356 | 7.2%), Cleaning & Maintenance (1,214 | 3.7%), Personal Care & Service (1,021 | 3.1%), Healthcare Support (941 | 2.9%), and Security & Protection (463 | 1.4%).
Services Occupations by Sex
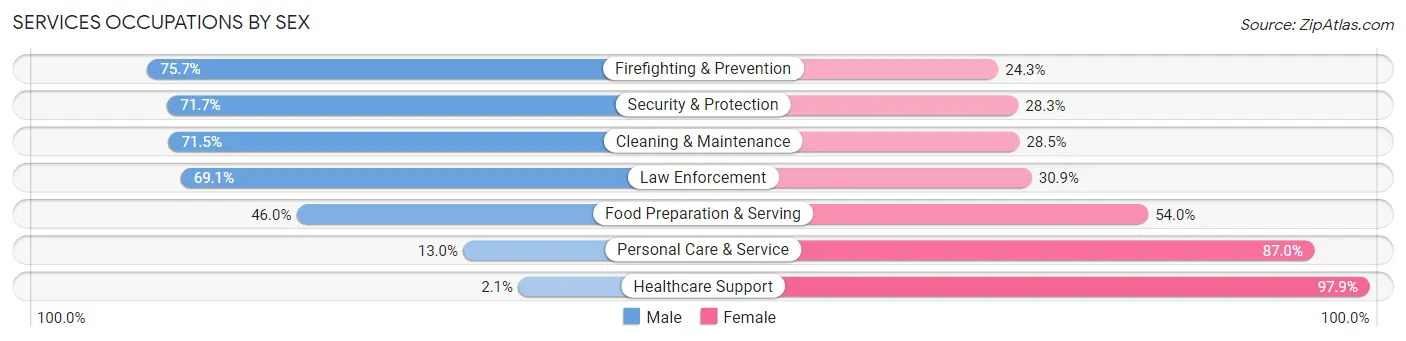
Within the Services occupations in Belknap County, the most male-oriented occupations are Firefighting & Prevention (75.7%), Security & Protection (71.7%), and Cleaning & Maintenance (71.5%), while the most female-oriented occupations are Healthcare Support (97.9%), Personal Care & Service (87.0%), and Food Preparation & Serving (54.0%).
| Occupation | Male | Female |
| Healthcare Support | 20 (2.1%) | 921 (97.9%) |
| Security & Protection | 332 (71.7%) | 131 (28.3%) |
| Firefighting & Prevention | 140 (75.7%) | 45 (24.3%) |
| Law Enforcement | 192 (69.1%) | 86 (30.9%) |
| Food Preparation & Serving | 1,084 (46.0%) | 1,272 (54.0%) |
| Cleaning & Maintenance | 868 (71.5%) | 346 (28.5%) |
| Personal Care & Service | 133 (13.0%) | 888 (87.0%) |
| Total (Category) | 2,437 (40.6%) | 3,558 (59.4%) |
| Total (Overall) | 16,836 (51.3%) | 16,006 (48.7%) |
Sales and Office Occupations
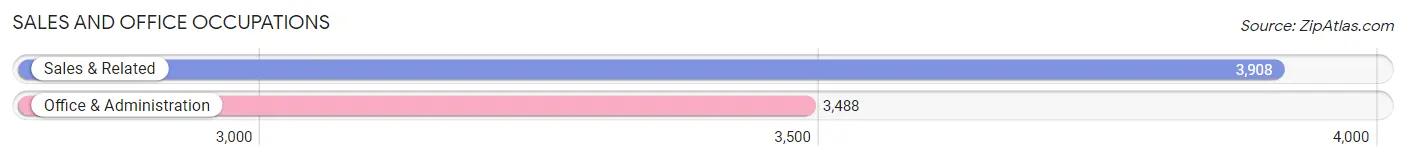
The most common Sales and Office occupations in Belknap County are Sales & Related (3,908 | 11.9%), and Office & Administration (3,488 | 10.6%).
Sales and Office Occupations by Sex
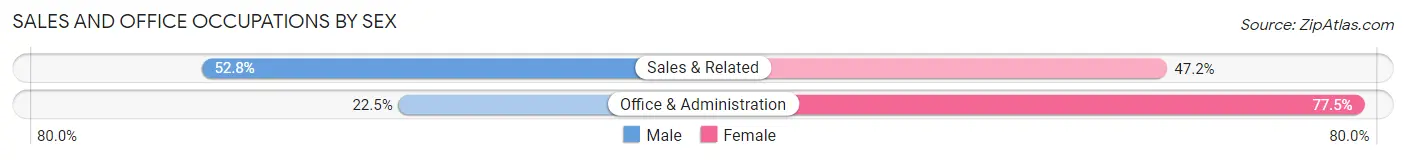
| Occupation | Male | Female |
| Sales & Related | 2,063 (52.8%) | 1,845 (47.2%) |
| Office & Administration | 784 (22.5%) | 2,704 (77.5%) |
| Total (Category) | 2,847 (38.5%) | 4,549 (61.5%) |
| Total (Overall) | 16,836 (51.3%) | 16,006 (48.7%) |
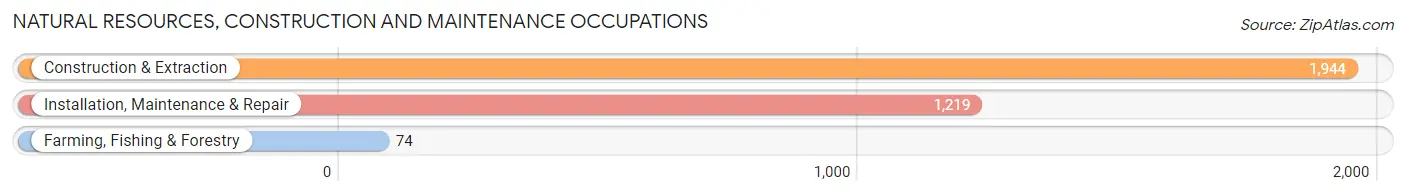
Natural Resources, Construction and Maintenance Occupations
The most common Natural Resources, Construction and Maintenance occupations in Belknap County are Construction & Extraction (1,944 | 5.9%), Installation, Maintenance & Repair (1,219 | 3.7%), and Farming, Fishing & Forestry (74 | 0.2%).
Natural Resources, Construction and Maintenance Occupations by Sex
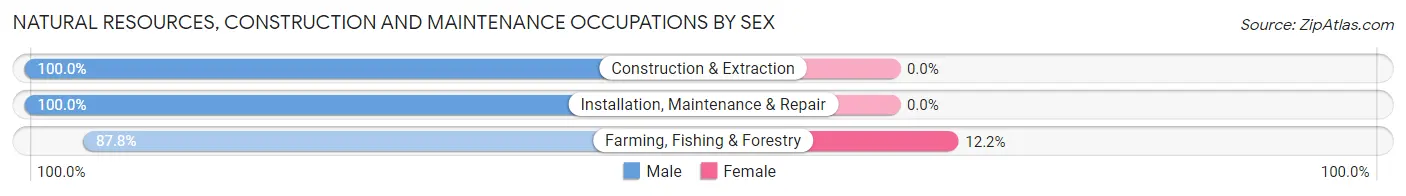
| Occupation | Male | Female |
| Farming, Fishing & Forestry | 65 (87.8%) | 9 (12.2%) |
| Construction & Extraction | 1,944 (100.0%) | 0 (0.0%) |
| Installation, Maintenance & Repair | 1,219 (100.0%) | 0 (0.0%) |
| Total (Category) | 3,228 (99.7%) | 9 (0.3%) |
| Total (Overall) | 16,836 (51.3%) | 16,006 (48.7%) |
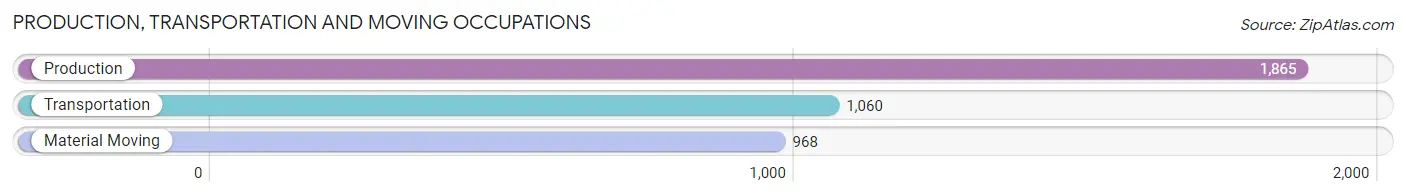
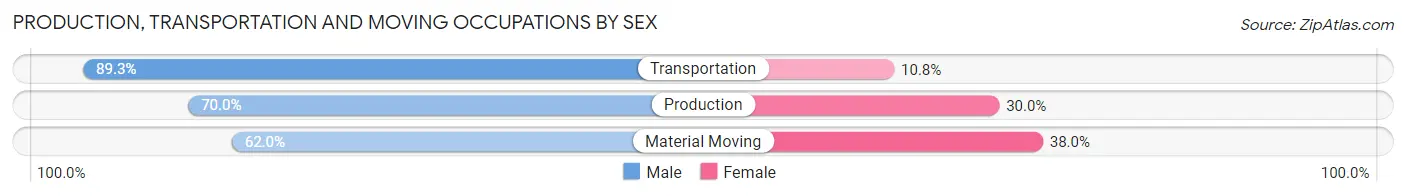
Production, Transportation and Moving Occupations
The most common Production, Transportation and Moving occupations in Belknap County are Production (1,865 | 5.7%), Transportation (1,060 | 3.2%), and Material Moving (968 | 2.9%).
Production, Transportation and Moving Occupations by Sex
| Occupation | Male | Female |
| Production | 1,305 (70.0%) | 560 (30.0%) |
| Transportation | 946 (89.2%) | 114 (10.7%) |
| Material Moving | 600 (62.0%) | 368 (38.0%) |
| Total (Category) | 2,851 (73.2%) | 1,042 (26.8%) |
| Total (Overall) | 16,836 (51.3%) | 16,006 (48.7%) |
Employment Industries by Sex in Belknap County
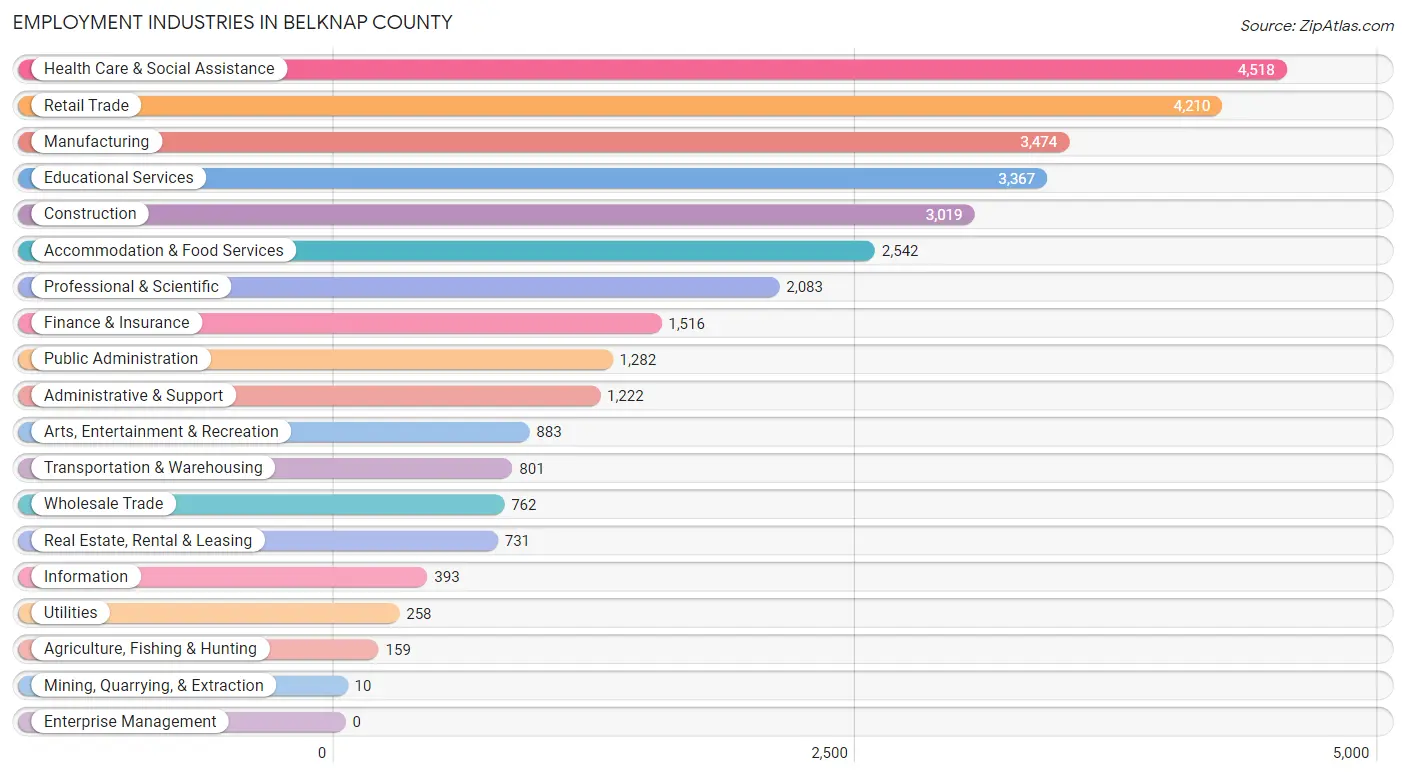
Employment Industries in Belknap County
The major employment industries in Belknap County include Health Care & Social Assistance (4,518 | 13.8%), Retail Trade (4,210 | 12.8%), Manufacturing (3,474 | 10.6%), Educational Services (3,367 | 10.2%), and Construction (3,019 | 9.2%).
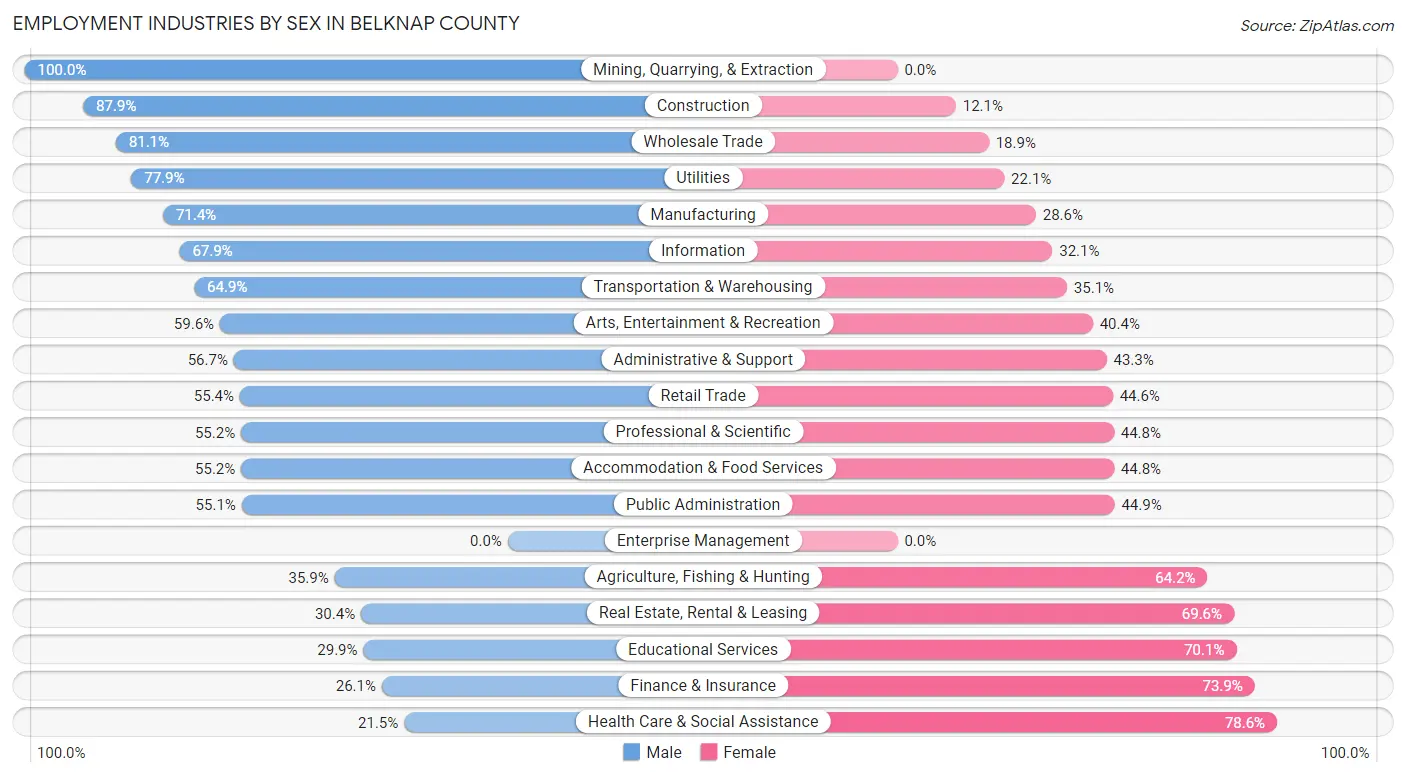
Employment Industries by Sex in Belknap County
The Belknap County industries that see more men than women are Mining, Quarrying, & Extraction (100.0%), Construction (87.9%), and Wholesale Trade (81.1%), whereas the industries that tend to have a higher number of women are Health Care & Social Assistance (78.5%), Finance & Insurance (73.9%), and Educational Services (70.1%).
| Industry | Male | Female |
| Agriculture, Fishing & Hunting | 57 (35.8%) | 102 (64.1%) |
| Mining, Quarrying, & Extraction | 10 (100.0%) | 0 (0.0%) |
| Construction | 2,654 (87.9%) | 365 (12.1%) |
| Manufacturing | 2,479 (71.4%) | 995 (28.6%) |
| Wholesale Trade | 618 (81.1%) | 144 (18.9%) |
| Retail Trade | 2,334 (55.4%) | 1,876 (44.6%) |
| Transportation & Warehousing | 520 (64.9%) | 281 (35.1%) |
| Utilities | 201 (77.9%) | 57 (22.1%) |
| Information | 267 (67.9%) | 126 (32.1%) |
| Finance & Insurance | 395 (26.1%) | 1,121 (73.9%) |
| Real Estate, Rental & Leasing | 222 (30.4%) | 509 (69.6%) |
| Professional & Scientific | 1,150 (55.2%) | 933 (44.8%) |
| Enterprise Management | 0 (0.0%) | 0 (0.0%) |
| Administrative & Support | 693 (56.7%) | 529 (43.3%) |
| Educational Services | 1,006 (29.9%) | 2,361 (70.1%) |
| Health Care & Social Assistance | 969 (21.4%) | 3,549 (78.5%) |
| Arts, Entertainment & Recreation | 526 (59.6%) | 357 (40.4%) |
| Accommodation & Food Services | 1,403 (55.2%) | 1,139 (44.8%) |
| Public Administration | 706 (55.1%) | 576 (44.9%) |
| Total | 16,836 (51.3%) | 16,006 (48.7%) |
Education in Belknap County
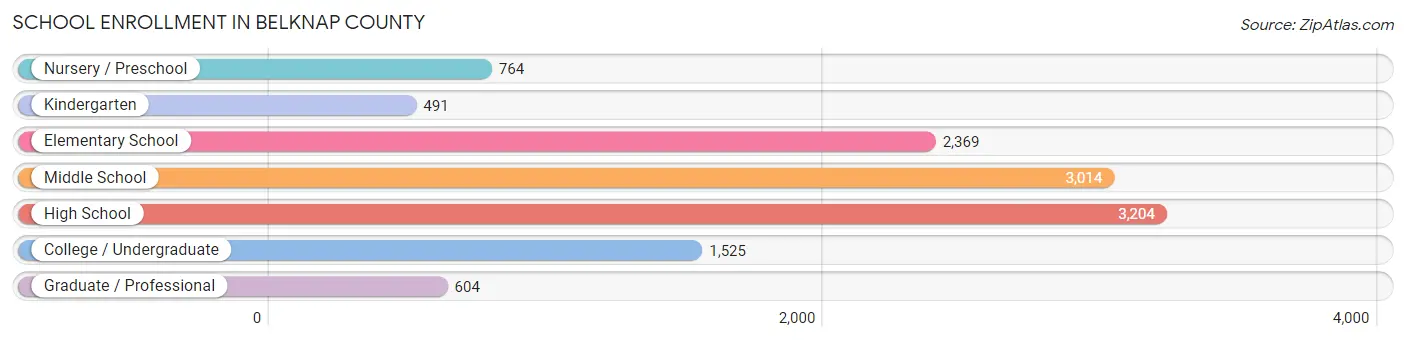
School Enrollment in Belknap County
The most common levels of schooling among the 11,971 students in Belknap County are high school (3,204 | 26.8%), middle school (3,014 | 25.2%), and elementary school (2,369 | 19.8%).
| School Level | # Students | % Students |
| Nursery / Preschool | 764 | 6.4% |
| Kindergarten | 491 | 4.1% |
| Elementary School | 2,369 | 19.8% |
| Middle School | 3,014 | 25.2% |
| High School | 3,204 | 26.8% |
| College / Undergraduate | 1,525 | 12.7% |
| Graduate / Professional | 604 | 5.1% |
| Total | 11,971 | 100.0% |
School Enrollment by Age by Funding Source in Belknap County
Out of a total of 11,971 students who are enrolled in schools in Belknap County, 1,628 (13.6%) attend a private institution, while the remaining 10,343 (86.4%) are enrolled in public schools. The age group of 3 to 4 year olds has the highest likelihood of being enrolled in private schools, with 317 (49.7% in the age bracket) enrolled. Conversely, the age group of 5 to 9 year old has the lowest likelihood of being enrolled in a private school, with 2,383 (93.2% in the age bracket) attending a public institution.
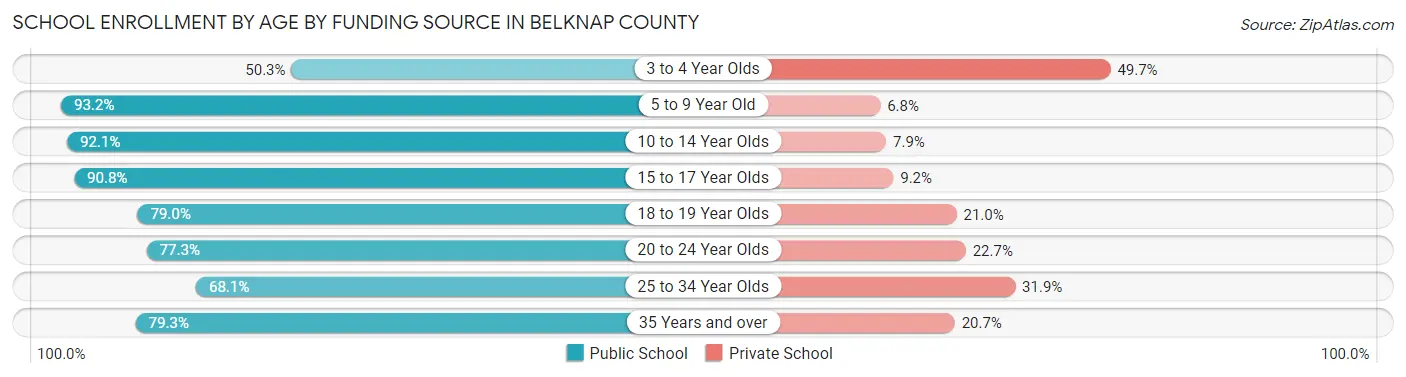
| Age Bracket | Public School | Private School |
| 3 to 4 Year Olds | 321 (50.3%) | 317 (49.7%) |
| 5 to 9 Year Old | 2,383 (93.2%) | 174 (6.8%) |
| 10 to 14 Year Olds | 3,544 (92.1%) | 304 (7.9%) |
| 15 to 17 Year Olds | 1,954 (90.8%) | 199 (9.2%) |
| 18 to 19 Year Olds | 706 (79.0%) | 188 (21.0%) |
| 20 to 24 Year Olds | 649 (77.3%) | 191 (22.7%) |
| 25 to 34 Year Olds | 228 (68.1%) | 107 (31.9%) |
| 35 Years and over | 560 (79.3%) | 146 (20.7%) |
| Total | 10,343 (86.4%) | 1,628 (13.6%) |
Educational Attainment by Field of Study in Belknap County
Business (3,319 | 20.5%), education (1,972 | 12.2%), science & technology (1,674 | 10.3%), engineering (1,176 | 7.3%), and social sciences (1,167 | 7.2%) are the most common fields of study among 16,173 individuals in Belknap County who have obtained a bachelor's degree or higher.
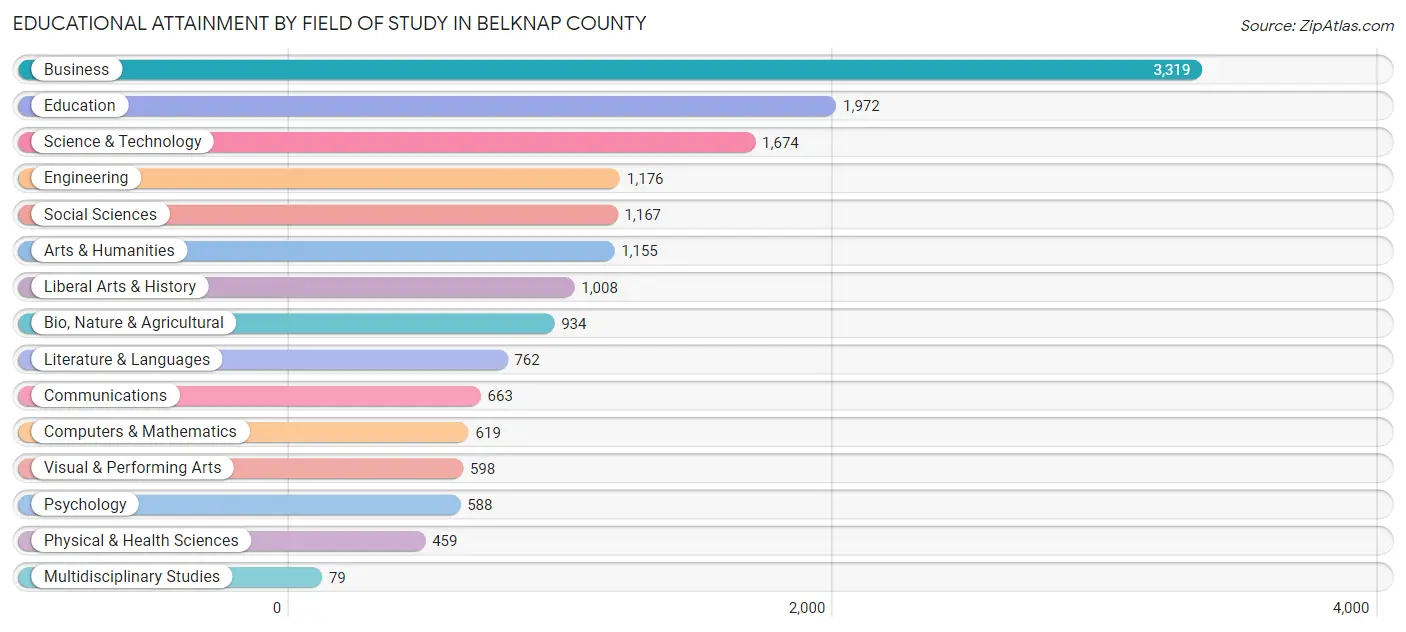
| Field of Study | # Graduates | % Graduates |
| Computers & Mathematics | 619 | 3.8% |
| Bio, Nature & Agricultural | 934 | 5.8% |
| Physical & Health Sciences | 459 | 2.8% |
| Psychology | 588 | 3.6% |
| Social Sciences | 1,167 | 7.2% |
| Engineering | 1,176 | 7.3% |
| Multidisciplinary Studies | 79 | 0.5% |
| Science & Technology | 1,674 | 10.3% |
| Business | 3,319 | 20.5% |
| Education | 1,972 | 12.2% |
| Literature & Languages | 762 | 4.7% |
| Liberal Arts & History | 1,008 | 6.2% |
| Visual & Performing Arts | 598 | 3.7% |
| Communications | 663 | 4.1% |
| Arts & Humanities | 1,155 | 7.1% |
| Total | 16,173 | 100.0% |
Transportation & Commute in Belknap County
Vehicle Availability by Sex in Belknap County
The most prevalent vehicle ownership categories in Belknap County are males with 2 vehicles (7,178, accounting for 43.3%) and females with 2 vehicles (5,845, making up 46.2%).
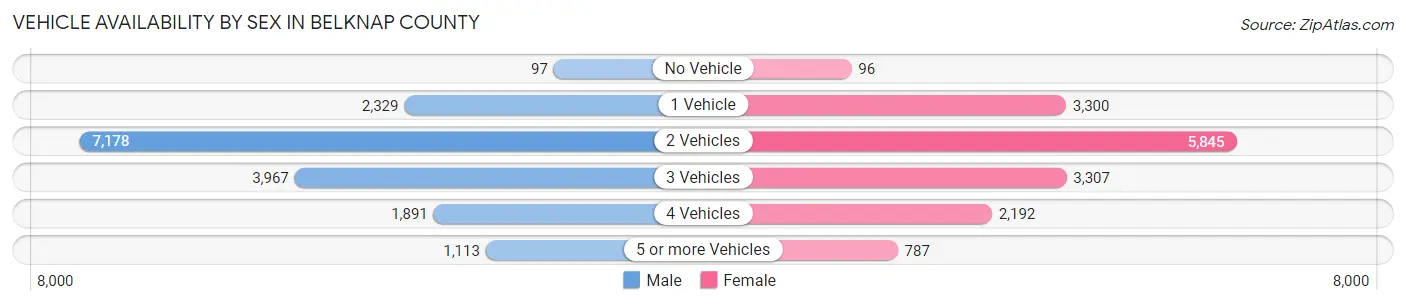
| Vehicles Available | Male | Female |
| No Vehicle | 97 (0.6%) | 96 (0.6%) |
| 1 Vehicle | 2,329 (14.1%) | 3,300 (21.2%) |
| 2 Vehicles | 7,178 (43.3%) | 5,845 (37.6%) |
| 3 Vehicles | 3,967 (23.9%) | 3,307 (21.3%) |
| 4 Vehicles | 1,891 (11.4%) | 2,192 (14.1%) |
| 5 or more Vehicles | 1,113 (6.7%) | 787 (5.1%) |
| Total | 16,575 (100.0%) | 15,527 (100.0%) |
Commute Time in Belknap County
The most frequently occuring commute durations in Belknap County are 10 to 14 minutes (4,474 commuters, 15.5%), 5 to 9 minutes (3,976 commuters, 13.8%), and 15 to 19 minutes (3,748 commuters, 13.0%).
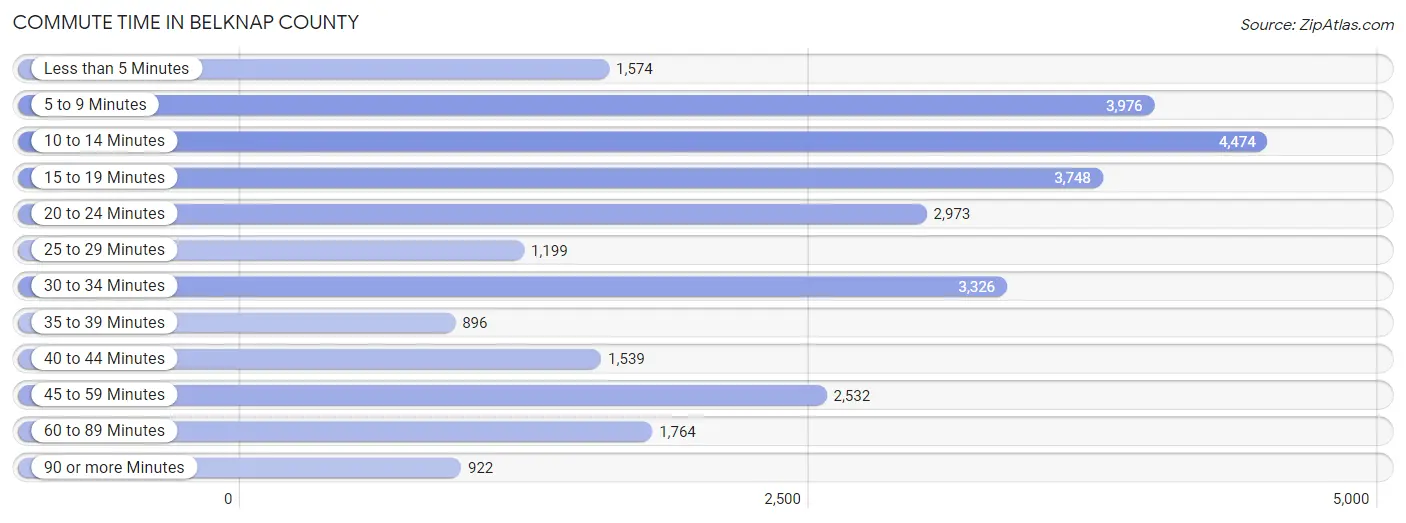
| Commute Time | # Commuters | % Commuters |
| Less than 5 Minutes | 1,574 | 5.4% |
| 5 to 9 Minutes | 3,976 | 13.8% |
| 10 to 14 Minutes | 4,474 | 15.5% |
| 15 to 19 Minutes | 3,748 | 13.0% |
| 20 to 24 Minutes | 2,973 | 10.3% |
| 25 to 29 Minutes | 1,199 | 4.2% |
| 30 to 34 Minutes | 3,326 | 11.5% |
| 35 to 39 Minutes | 896 | 3.1% |
| 40 to 44 Minutes | 1,539 | 5.3% |
| 45 to 59 Minutes | 2,532 | 8.7% |
| 60 to 89 Minutes | 1,764 | 6.1% |
| 90 or more Minutes | 922 | 3.2% |
Commute Time by Sex in Belknap County
The most common commute times in Belknap County are 10 to 14 minutes (2,204 commuters, 14.7%) for males and 10 to 14 minutes (2,270 commuters, 16.2%) for females.
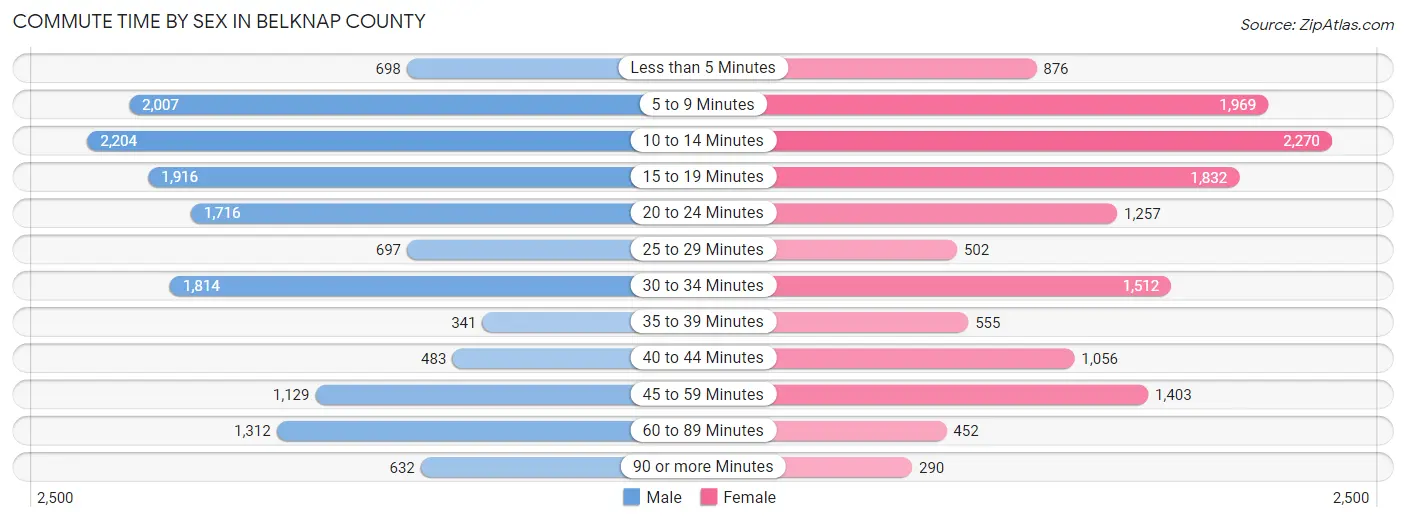
| Commute Time | Male | Female |
| Less than 5 Minutes | 698 (4.7%) | 876 (6.3%) |
| 5 to 9 Minutes | 2,007 (13.4%) | 1,969 (14.1%) |
| 10 to 14 Minutes | 2,204 (14.7%) | 2,270 (16.2%) |
| 15 to 19 Minutes | 1,916 (12.8%) | 1,832 (13.1%) |
| 20 to 24 Minutes | 1,716 (11.5%) | 1,257 (9.0%) |
| 25 to 29 Minutes | 697 (4.7%) | 502 (3.6%) |
| 30 to 34 Minutes | 1,814 (12.1%) | 1,512 (10.8%) |
| 35 to 39 Minutes | 341 (2.3%) | 555 (4.0%) |
| 40 to 44 Minutes | 483 (3.2%) | 1,056 (7.6%) |
| 45 to 59 Minutes | 1,129 (7.5%) | 1,403 (10.0%) |
| 60 to 89 Minutes | 1,312 (8.8%) | 452 (3.2%) |
| 90 or more Minutes | 632 (4.2%) | 290 (2.1%) |
Time of Departure to Work by Sex in Belknap County
The most frequent times of departure to work in Belknap County are 7:00 AM to 7:29 AM (2,451, 16.4%) for males and 7:30 AM to 7:59 AM (2,383, 17.1%) for females.
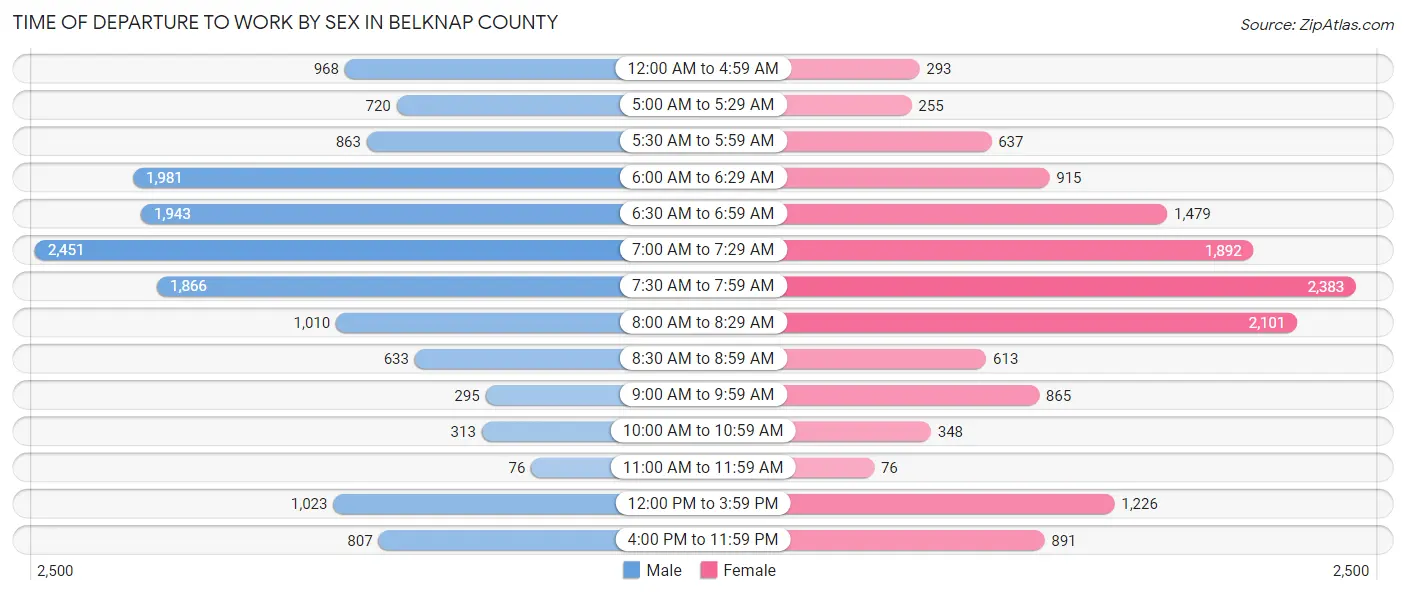
| Time of Departure | Male | Female |
| 12:00 AM to 4:59 AM | 968 (6.5%) | 293 (2.1%) |
| 5:00 AM to 5:29 AM | 720 (4.8%) | 255 (1.8%) |
| 5:30 AM to 5:59 AM | 863 (5.8%) | 637 (4.6%) |
| 6:00 AM to 6:29 AM | 1,981 (13.3%) | 915 (6.6%) |
| 6:30 AM to 6:59 AM | 1,943 (13.0%) | 1,479 (10.6%) |
| 7:00 AM to 7:29 AM | 2,451 (16.4%) | 1,892 (13.5%) |
| 7:30 AM to 7:59 AM | 1,866 (12.5%) | 2,383 (17.1%) |
| 8:00 AM to 8:29 AM | 1,010 (6.8%) | 2,101 (15.0%) |
| 8:30 AM to 8:59 AM | 633 (4.2%) | 613 (4.4%) |
| 9:00 AM to 9:59 AM | 295 (2.0%) | 865 (6.2%) |
| 10:00 AM to 10:59 AM | 313 (2.1%) | 348 (2.5%) |
| 11:00 AM to 11:59 AM | 76 (0.5%) | 76 (0.5%) |
| 12:00 PM to 3:59 PM | 1,023 (6.8%) | 1,226 (8.8%) |
| 4:00 PM to 11:59 PM | 807 (5.4%) | 891 (6.4%) |
| Total | 14,949 (100.0%) | 13,974 (100.0%) |
Housing Occupancy in Belknap County
Occupancy by Ownership in Belknap County
Of the total 25,956 dwellings in Belknap County, owner-occupied units account for 20,011 (77.1%), while renter-occupied units make up 5,945 (22.9%).
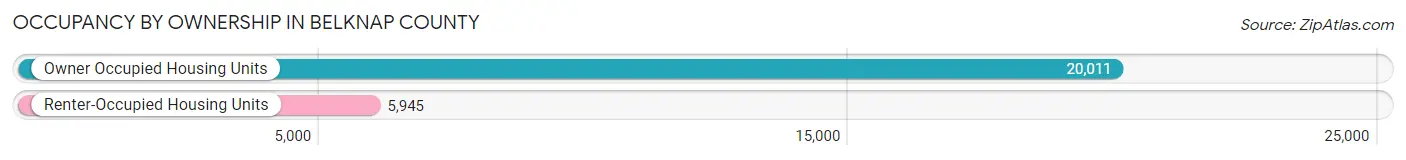
| Occupancy | # Housing Units | % Housing Units |
| Owner Occupied Housing Units | 20,011 | 77.1% |
| Renter-Occupied Housing Units | 5,945 | 22.9% |
| Total Occupied Housing Units | 25,956 | 100.0% |
Occupancy by Household Size in Belknap County
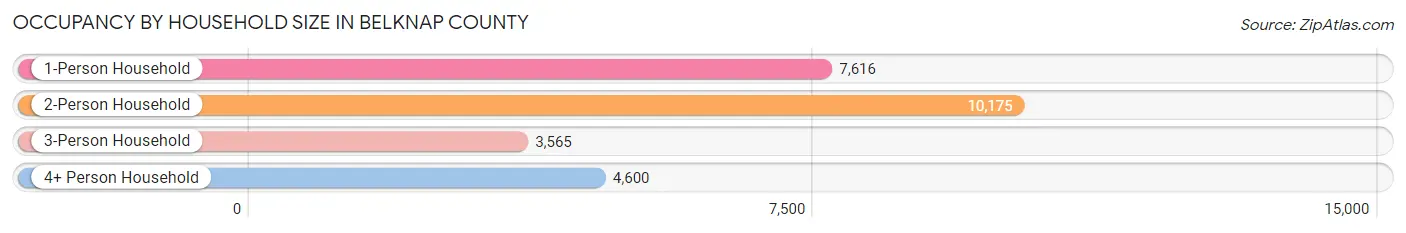
| Household Size | # Housing Units | % Housing Units |
| 1-Person Household | 7,616 | 29.3% |
| 2-Person Household | 10,175 | 39.2% |
| 3-Person Household | 3,565 | 13.7% |
| 4+ Person Household | 4,600 | 17.7% |
| Total Housing Units | 25,956 | 100.0% |
Occupancy by Ownership by Household Size in Belknap County
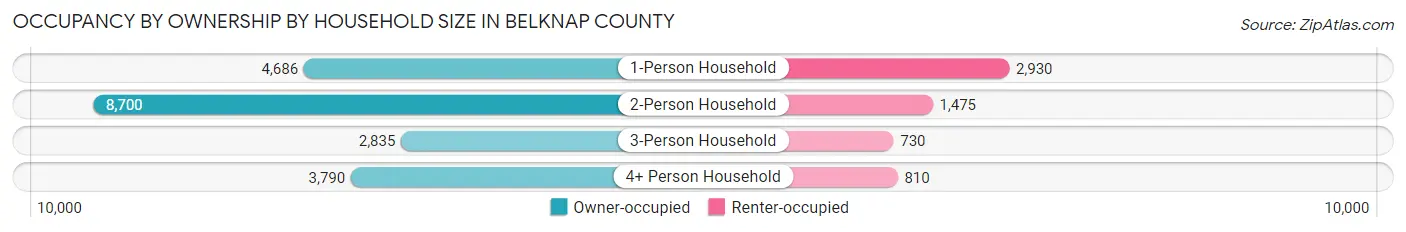
| Household Size | Owner-occupied | Renter-occupied |
| 1-Person Household | 4,686 (61.5%) | 2,930 (38.5%) |
| 2-Person Household | 8,700 (85.5%) | 1,475 (14.5%) |
| 3-Person Household | 2,835 (79.5%) | 730 (20.5%) |
| 4+ Person Household | 3,790 (82.4%) | 810 (17.6%) |
| Total Housing Units | 20,011 (77.1%) | 5,945 (22.9%) |
Occupancy by Educational Attainment in Belknap County
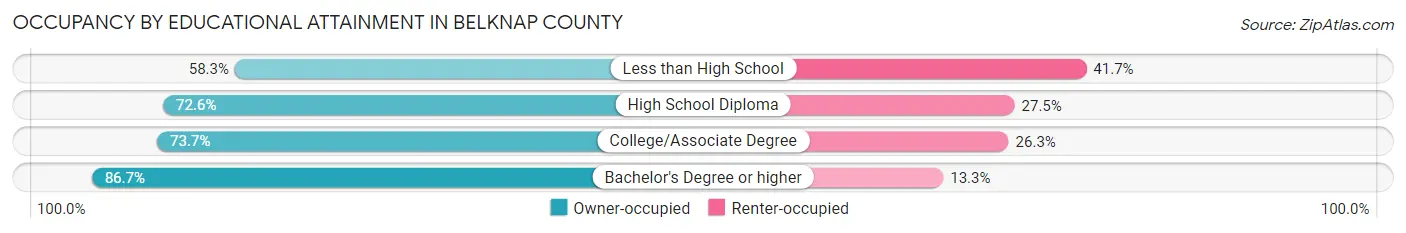
| Household Size | Owner-occupied | Renter-occupied |
| Less than High School | 890 (58.3%) | 636 (41.7%) |
| High School Diploma | 4,694 (72.6%) | 1,776 (27.5%) |
| College/Associate Degree | 6,496 (73.7%) | 2,315 (26.3%) |
| Bachelor's Degree or higher | 7,931 (86.7%) | 1,218 (13.3%) |
Occupancy by Age of Householder in Belknap County
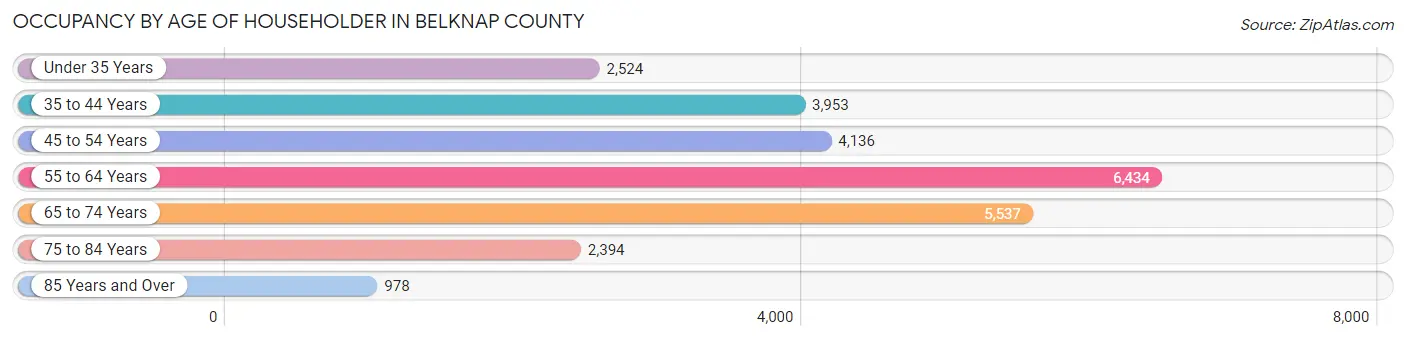
| Age Bracket | # Households | % Households |
| Under 35 Years | 2,524 | 9.7% |
| 35 to 44 Years | 3,953 | 15.2% |
| 45 to 54 Years | 4,136 | 15.9% |
| 55 to 64 Years | 6,434 | 24.8% |
| 65 to 74 Years | 5,537 | 21.3% |
| 75 to 84 Years | 2,394 | 9.2% |
| 85 Years and Over | 978 | 3.8% |
| Total | 25,956 | 100.0% |
Housing Finances in Belknap County
Median Income by Occupancy in Belknap County
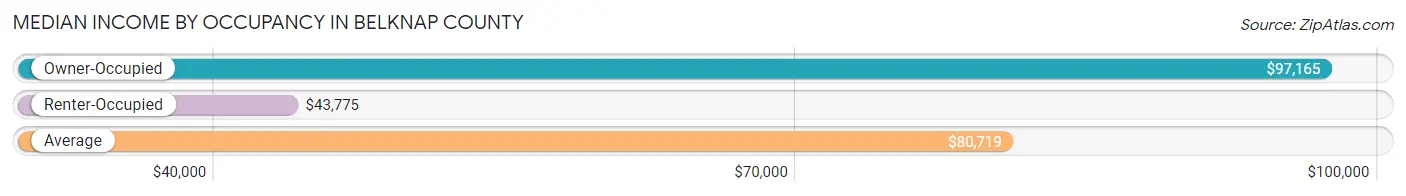
| Occupancy Type | # Households | Median Income |
| Owner-Occupied | 20,011 (77.1%) | $97,165 |
| Renter-Occupied | 5,945 (22.9%) | $43,775 |
| Average | 25,956 (100.0%) | $80,719 |
Occupancy by Householder Income Bracket in Belknap County
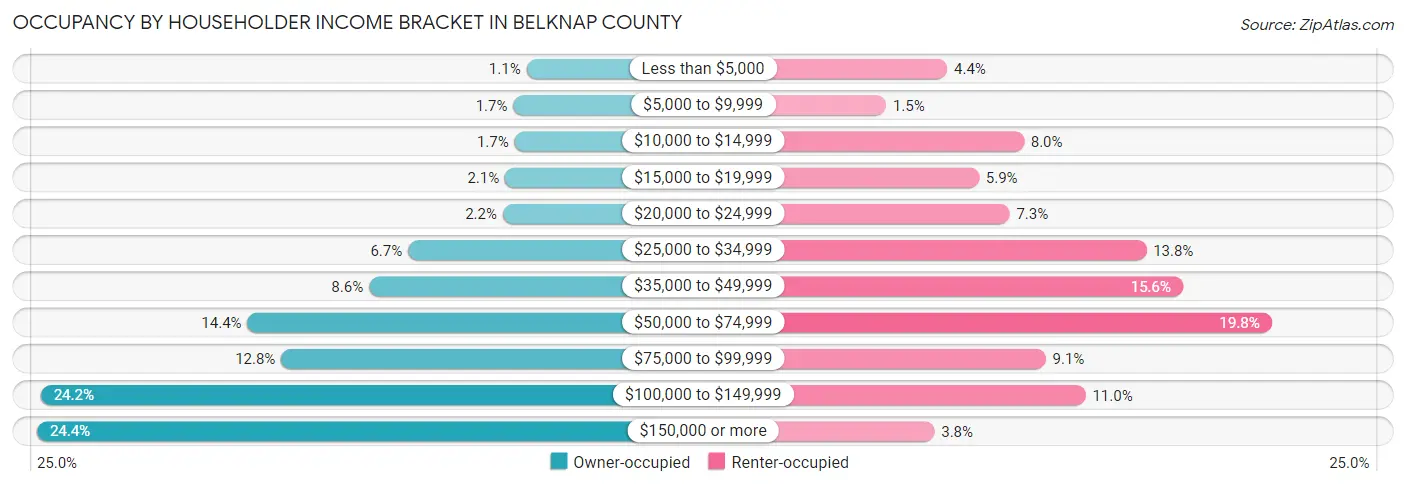
| Income Bracket | Owner-occupied | Renter-occupied |
| Less than $5,000 | 220 (1.1%) | 259 (4.4%) |
| $5,000 to $9,999 | 347 (1.7%) | 86 (1.5%) |
| $10,000 to $14,999 | 334 (1.7%) | 476 (8.0%) |
| $15,000 to $19,999 | 425 (2.1%) | 349 (5.9%) |
| $20,000 to $24,999 | 446 (2.2%) | 436 (7.3%) |
| $25,000 to $34,999 | 1,348 (6.7%) | 823 (13.8%) |
| $35,000 to $49,999 | 1,721 (8.6%) | 926 (15.6%) |
| $50,000 to $74,999 | 2,880 (14.4%) | 1,178 (19.8%) |
| $75,000 to $99,999 | 2,558 (12.8%) | 538 (9.0%) |
| $100,000 to $149,999 | 4,848 (24.2%) | 651 (11.0%) |
| $150,000 or more | 4,884 (24.4%) | 223 (3.7%) |
| Total | 20,011 (100.0%) | 5,945 (100.0%) |
Monthly Housing Cost Tiers in Belknap County
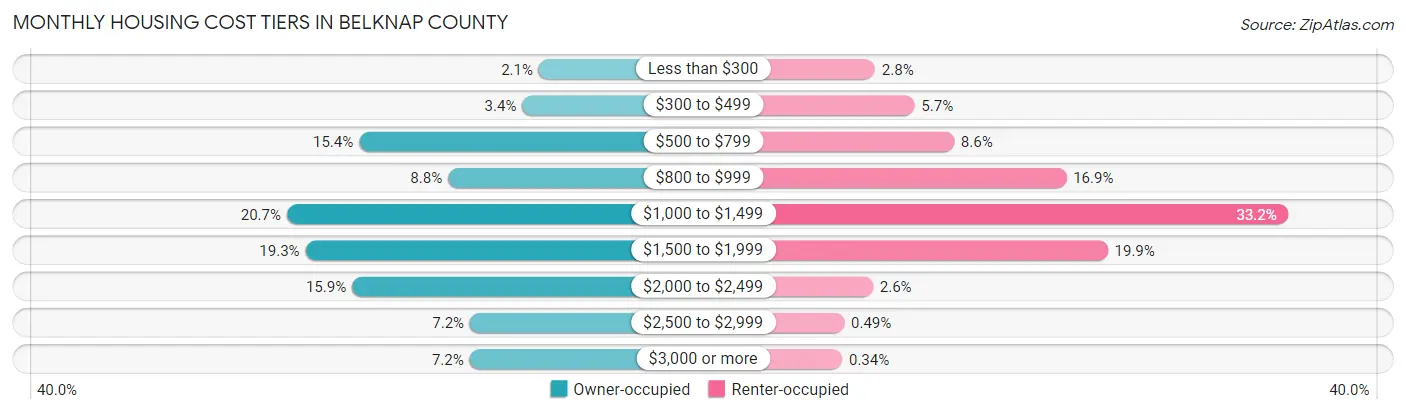
| Monthly Cost | Owner-occupied | Renter-occupied |
| Less than $300 | 426 (2.1%) | 164 (2.8%) |
| $300 to $499 | 670 (3.4%) | 337 (5.7%) |
| $500 to $799 | 3,075 (15.4%) | 510 (8.6%) |
| $800 to $999 | 1,765 (8.8%) | 1,002 (16.9%) |
| $1,000 to $1,499 | 4,141 (20.7%) | 1,975 (33.2%) |
| $1,500 to $1,999 | 3,867 (19.3%) | 1,183 (19.9%) |
| $2,000 to $2,499 | 3,180 (15.9%) | 155 (2.6%) |
| $2,500 to $2,999 | 1,440 (7.2%) | 29 (0.5%) |
| $3,000 or more | 1,447 (7.2%) | 20 (0.3%) |
| Total | 20,011 (100.0%) | 5,945 (100.0%) |
Physical Housing Characteristics in Belknap County
Housing Structures in Belknap County
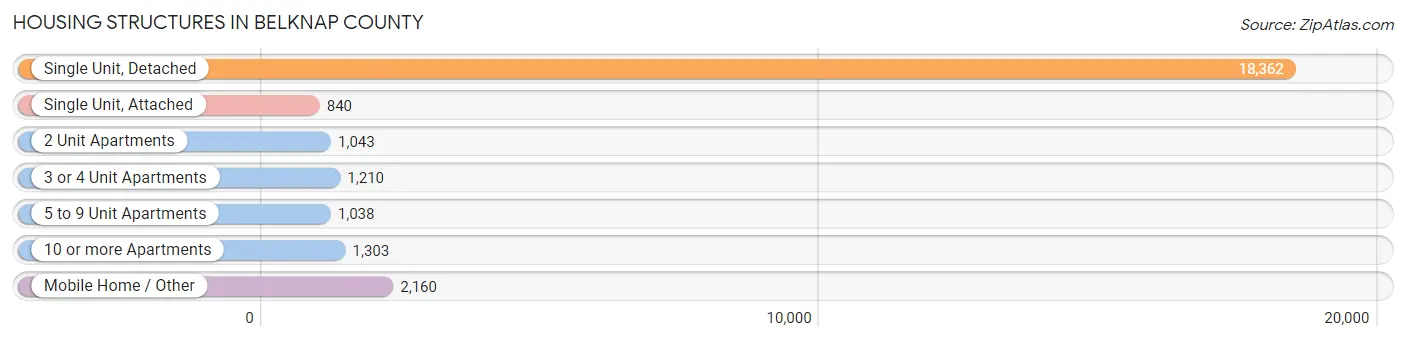
| Structure Type | # Housing Units | % Housing Units |
| Single Unit, Detached | 18,362 | 70.7% |
| Single Unit, Attached | 840 | 3.2% |
| 2 Unit Apartments | 1,043 | 4.0% |
| 3 or 4 Unit Apartments | 1,210 | 4.7% |
| 5 to 9 Unit Apartments | 1,038 | 4.0% |
| 10 or more Apartments | 1,303 | 5.0% |
| Mobile Home / Other | 2,160 | 8.3% |
| Total | 25,956 | 100.0% |
Housing Structures by Occupancy in Belknap County
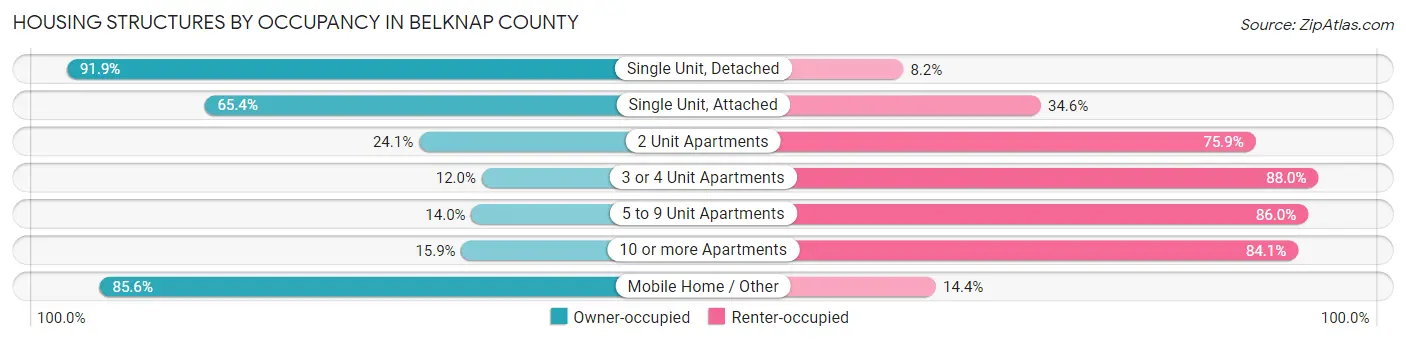
| Structure Type | Owner-occupied | Renter-occupied |
| Single Unit, Detached | 16,866 (91.8%) | 1,496 (8.2%) |
| Single Unit, Attached | 549 (65.4%) | 291 (34.6%) |
| 2 Unit Apartments | 251 (24.1%) | 792 (75.9%) |
| 3 or 4 Unit Apartments | 145 (12.0%) | 1,065 (88.0%) |
| 5 to 9 Unit Apartments | 145 (14.0%) | 893 (86.0%) |
| 10 or more Apartments | 207 (15.9%) | 1,096 (84.1%) |
| Mobile Home / Other | 1,848 (85.6%) | 312 (14.4%) |
| Total | 20,011 (77.1%) | 5,945 (22.9%) |
Housing Structures by Number of Rooms in Belknap County
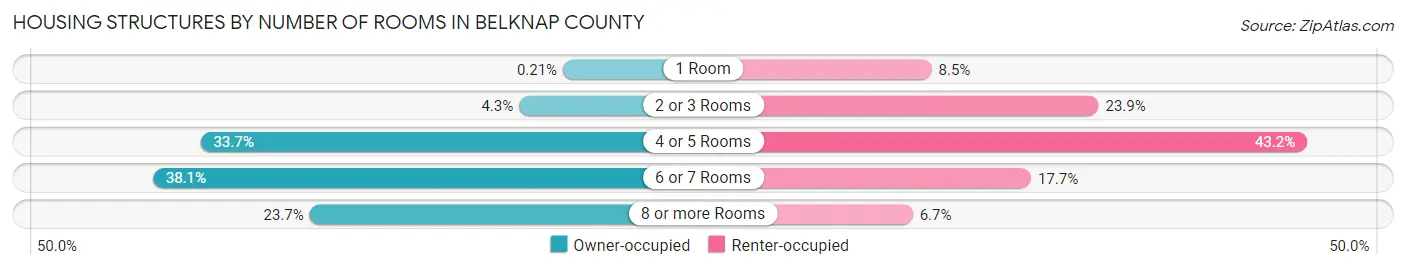
| Number of Rooms | Owner-occupied | Renter-occupied |
| 1 Room | 42 (0.2%) | 504 (8.5%) |
| 2 or 3 Rooms | 854 (4.3%) | 1,422 (23.9%) |
| 4 or 5 Rooms | 6,750 (33.7%) | 2,568 (43.2%) |
| 6 or 7 Rooms | 7,633 (38.1%) | 1,051 (17.7%) |
| 8 or more Rooms | 4,732 (23.6%) | 400 (6.7%) |
| Total | 20,011 (100.0%) | 5,945 (100.0%) |
Housing Structure by Heating Type in Belknap County
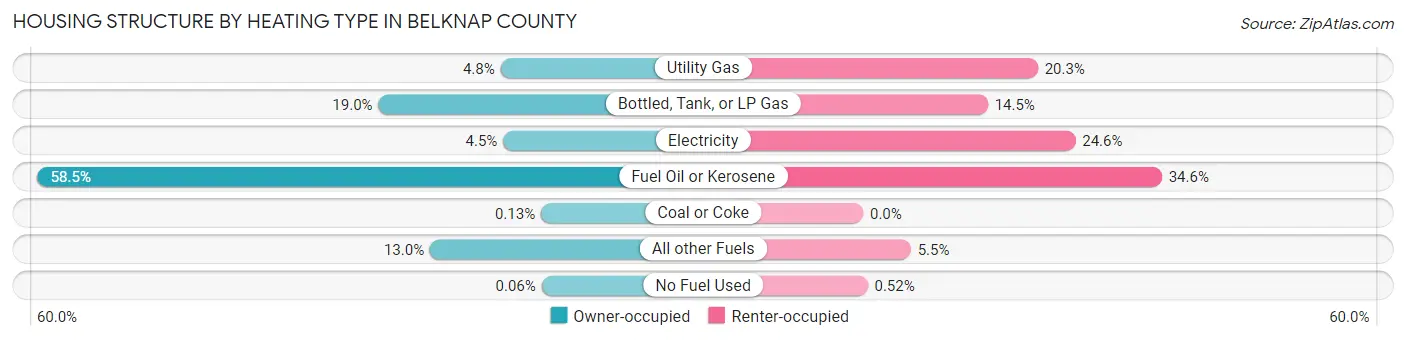
| Heating Type | Owner-occupied | Renter-occupied |
| Utility Gas | 964 (4.8%) | 1,204 (20.3%) |
| Bottled, Tank, or LP Gas | 3,799 (19.0%) | 859 (14.4%) |
| Electricity | 903 (4.5%) | 1,463 (24.6%) |
| Fuel Oil or Kerosene | 11,706 (58.5%) | 2,059 (34.6%) |
| Coal or Coke | 26 (0.1%) | 0 (0.0%) |
| All other Fuels | 2,601 (13.0%) | 329 (5.5%) |
| No Fuel Used | 12 (0.1%) | 31 (0.5%) |
| Total | 20,011 (100.0%) | 5,945 (100.0%) |
Household Vehicle Usage in Belknap County
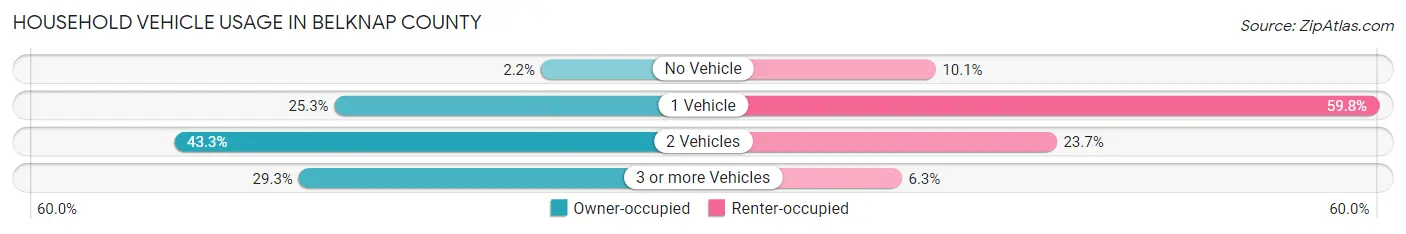
| Vehicles per Household | Owner-occupied | Renter-occupied |
| No Vehicle | 434 (2.2%) | 603 (10.1%) |
| 1 Vehicle | 5,060 (25.3%) | 3,556 (59.8%) |
| 2 Vehicles | 8,654 (43.2%) | 1,409 (23.7%) |
| 3 or more Vehicles | 5,863 (29.3%) | 377 (6.3%) |
| Total | 20,011 (100.0%) | 5,945 (100.0%) |
Real Estate & Mortgages in Belknap County
Real Estate and Mortgage Overview in Belknap County
| Characteristic | Without Mortgage | With Mortgage |
| Housing Units | 7,984 | 12,027 |
| Median Property Value | $304,500 | $292,300 |
| Median Household Income | $67,646 | $3,505 |
| Monthly Housing Costs | $803 | $1,302 |
| Real Estate Taxes | $4,577 | $135 |
Property Value by Mortgage Status in Belknap County
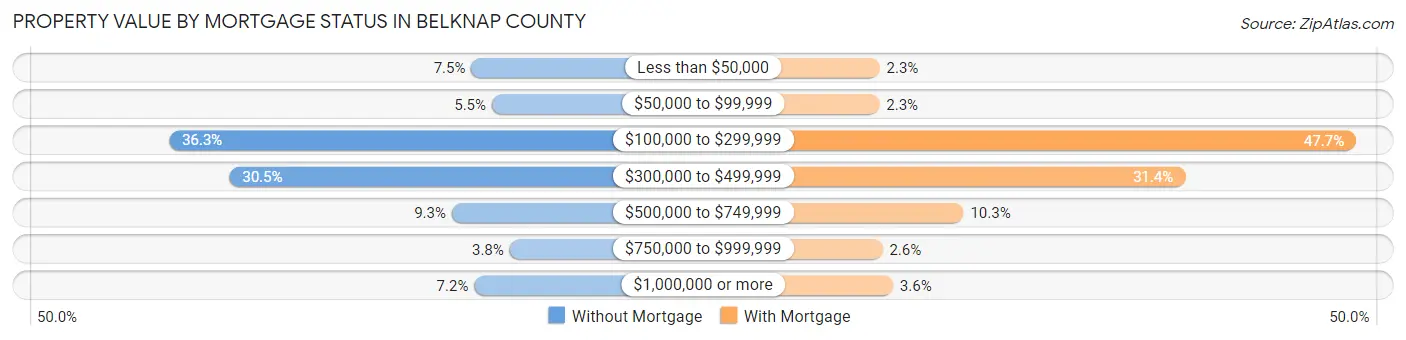
| Property Value | Without Mortgage | With Mortgage |
| Less than $50,000 | 596 (7.5%) | 275 (2.3%) |
| $50,000 to $99,999 | 439 (5.5%) | 273 (2.3%) |
| $100,000 to $299,999 | 2,894 (36.2%) | 5,732 (47.7%) |
| $300,000 to $499,999 | 2,435 (30.5%) | 3,775 (31.4%) |
| $500,000 to $749,999 | 743 (9.3%) | 1,236 (10.3%) |
| $750,000 to $999,999 | 304 (3.8%) | 308 (2.6%) |
| $1,000,000 or more | 573 (7.2%) | 428 (3.6%) |
| Total | 7,984 (100.0%) | 12,027 (100.0%) |
Household Income by Mortgage Status in Belknap County
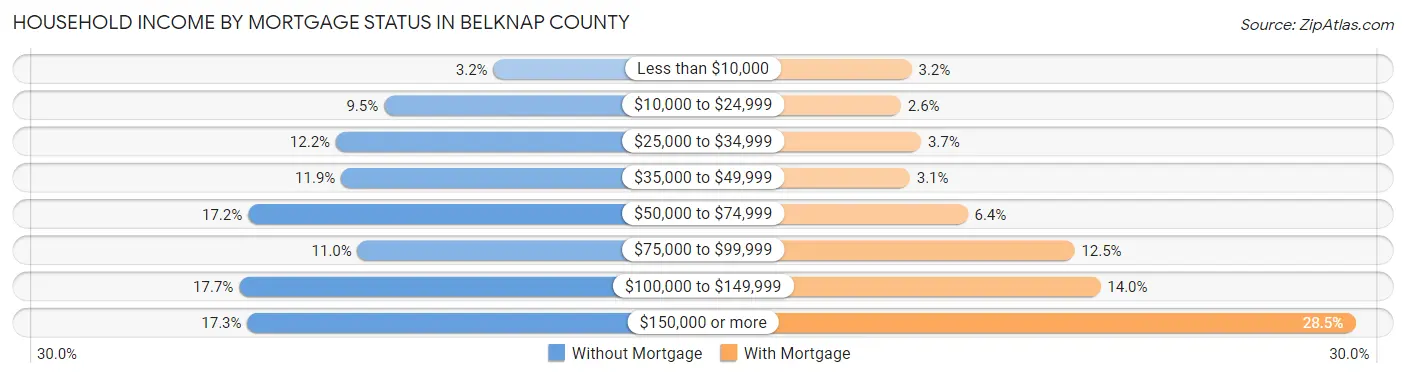
| Household Income | Without Mortgage | With Mortgage |
| Less than $10,000 | 256 (3.2%) | 385 (3.2%) |
| $10,000 to $24,999 | 755 (9.5%) | 311 (2.6%) |
| $25,000 to $34,999 | 975 (12.2%) | 450 (3.7%) |
| $35,000 to $49,999 | 951 (11.9%) | 373 (3.1%) |
| $50,000 to $74,999 | 1,376 (17.2%) | 770 (6.4%) |
| $75,000 to $99,999 | 876 (11.0%) | 1,504 (12.5%) |
| $100,000 to $149,999 | 1,416 (17.7%) | 1,682 (14.0%) |
| $150,000 or more | 1,379 (17.3%) | 3,432 (28.5%) |
| Total | 7,984 (100.0%) | 12,027 (100.0%) |
Property Value to Household Income Ratio in Belknap County
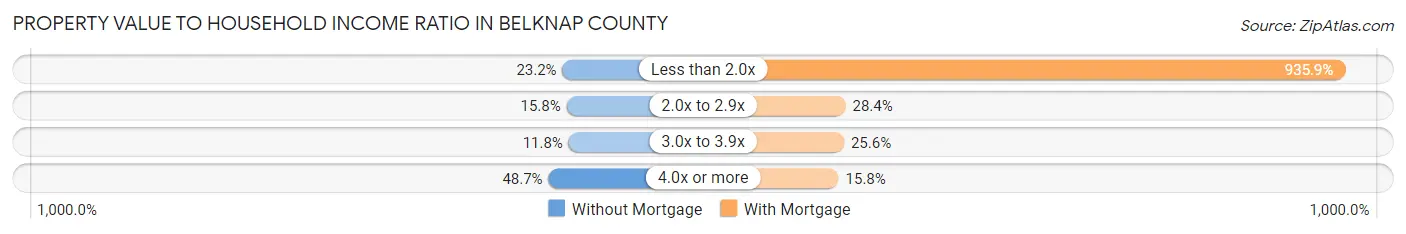
| Value-to-Income Ratio | Without Mortgage | With Mortgage |
| Less than 2.0x | 1,853 (23.2%) | 112,559 (935.9%) |
| 2.0x to 2.9x | 1,260 (15.8%) | 3,418 (28.4%) |
| 3.0x to 3.9x | 944 (11.8%) | 3,074 (25.6%) |
| 4.0x or more | 3,884 (48.6%) | 1,896 (15.8%) |
| Total | 7,984 (100.0%) | 12,027 (100.0%) |
Real Estate Taxes by Mortgage Status in Belknap County
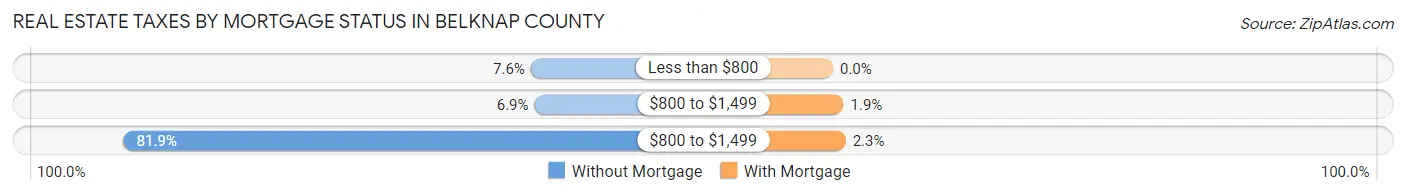
| Property Taxes | Without Mortgage | With Mortgage |
| Less than $800 | 604 (7.6%) | 0 (0.0%) |
| $800 to $1,499 | 550 (6.9%) | 231 (1.9%) |
| $800 to $1,499 | 6,540 (81.9%) | 278 (2.3%) |
| Total | 7,984 (100.0%) | 12,027 (100.0%) |
Health & Disability in Belknap County
Health Insurance Coverage by Age in Belknap County
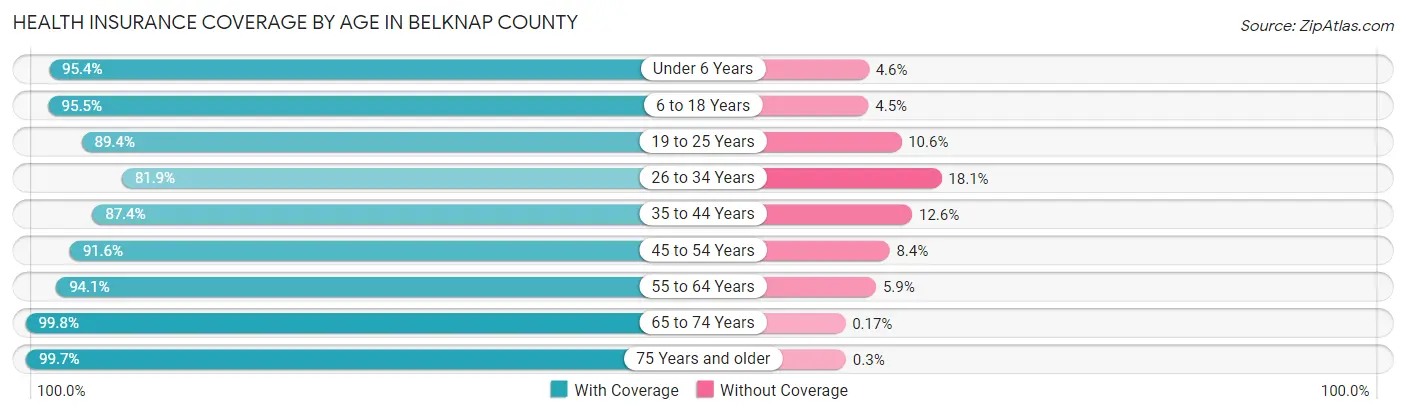
| Age Bracket | With Coverage | Without Coverage |
| Under 6 Years | 3,034 (95.4%) | 145 (4.6%) |
| 6 to 18 Years | 8,671 (95.5%) | 407 (4.5%) |
| 19 to 25 Years | 3,770 (89.4%) | 448 (10.6%) |
| 26 to 34 Years | 4,989 (81.9%) | 1,103 (18.1%) |
| 35 to 44 Years | 6,232 (87.4%) | 901 (12.6%) |
| 45 to 54 Years | 7,449 (91.6%) | 685 (8.4%) |
| 55 to 64 Years | 10,652 (94.1%) | 669 (5.9%) |
| 65 to 74 Years | 8,928 (99.8%) | 15 (0.2%) |
| 75 Years and older | 4,987 (99.7%) | 15 (0.3%) |
| Total | 58,712 (93.0%) | 4,388 (7.0%) |
Health Insurance Coverage by Citizenship Status in Belknap County
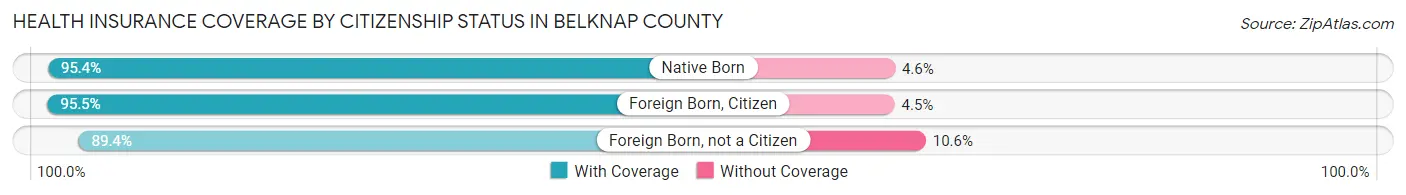
| Citizenship Status | With Coverage | Without Coverage |
| Native Born | 3,034 (95.4%) | 145 (4.6%) |
| Foreign Born, Citizen | 8,671 (95.5%) | 407 (4.5%) |
| Foreign Born, not a Citizen | 3,770 (89.4%) | 448 (10.6%) |
Health Insurance Coverage by Household Income in Belknap County
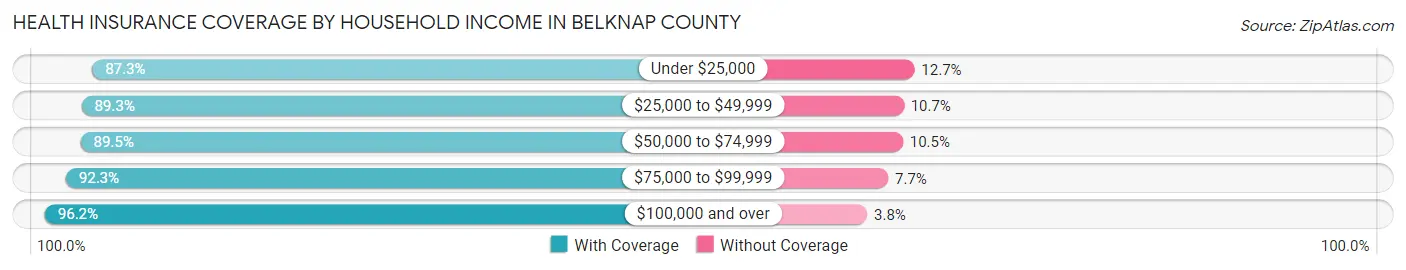
| Household Income | With Coverage | Without Coverage |
| Under $25,000 | 4,651 (87.3%) | 675 (12.7%) |
| $25,000 to $49,999 | 7,337 (89.3%) | 875 (10.7%) |
| $50,000 to $74,999 | 8,265 (89.5%) | 969 (10.5%) |
| $75,000 to $99,999 | 8,055 (92.3%) | 676 (7.7%) |
| $100,000 and over | 30,120 (96.2%) | 1,190 (3.8%) |
Public vs Private Health Insurance Coverage by Age in Belknap County

| Age Bracket | Public Insurance | Private Insurance |
| Under 6 | 1,104 (34.7%) | 2,078 (65.4%) |
| 6 to 18 Years | 3,237 (35.7%) | 5,797 (63.9%) |
| 19 to 25 Years | 1,064 (25.2%) | 2,813 (66.7%) |
| 25 to 34 Years | 1,230 (20.2%) | 3,910 (64.2%) |
| 35 to 44 Years | 1,402 (19.7%) | 4,939 (69.2%) |
| 45 to 54 Years | 1,217 (15.0%) | 6,693 (82.3%) |
| 55 to 64 Years | 1,788 (15.8%) | 9,304 (82.2%) |
| 65 to 74 Years | 8,339 (93.2%) | 5,875 (65.7%) |
| 75 Years and over | 4,949 (98.9%) | 3,253 (65.0%) |
| Total | 24,330 (38.6%) | 44,662 (70.8%) |
Disability Status by Sex by Age in Belknap County
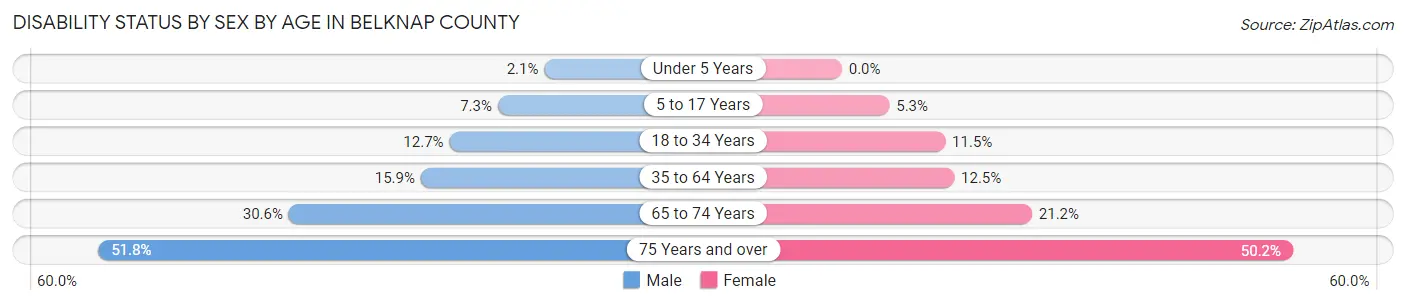
| Age Bracket | Male | Female |
| Under 5 Years | 27 (2.1%) | 0 (0.0%) |
| 5 to 17 Years | 327 (7.3%) | 231 (5.3%) |
| 18 to 34 Years | 718 (12.7%) | 626 (11.5%) |
| 35 to 64 Years | 2,091 (15.9%) | 1,679 (12.5%) |
| 65 to 74 Years | 1,328 (30.6%) | 974 (21.2%) |
| 75 Years and over | 1,136 (51.8%) | 1,411 (50.2%) |
Disability Class by Sex by Age in Belknap County
Disability Class: Hearing Difficulty
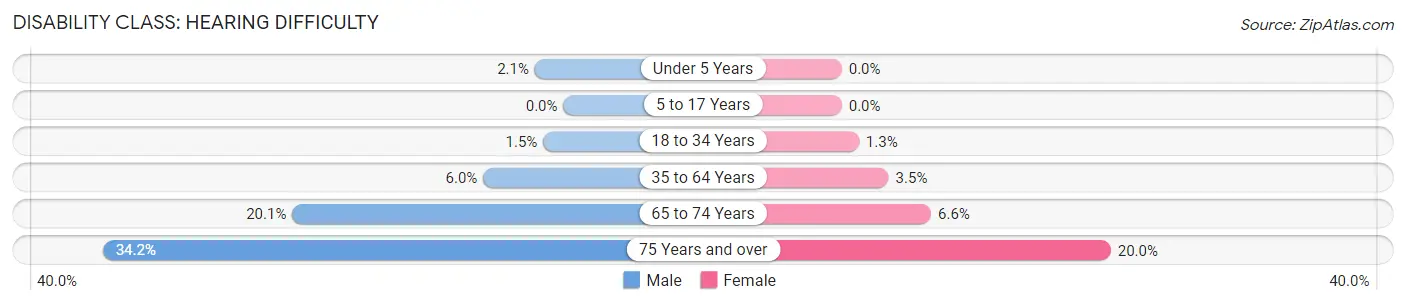
| Age Bracket | Male | Female |
| Under 5 Years | 27 (2.1%) | 0 (0.0%) |
| 5 to 17 Years | 0 (0.0%) | 0 (0.0%) |
| 18 to 34 Years | 85 (1.5%) | 69 (1.3%) |
| 35 to 64 Years | 783 (5.9%) | 467 (3.5%) |
| 65 to 74 Years | 874 (20.1%) | 305 (6.6%) |
| 75 Years and over | 750 (34.2%) | 561 (20.0%) |
Disability Class: Vision Difficulty
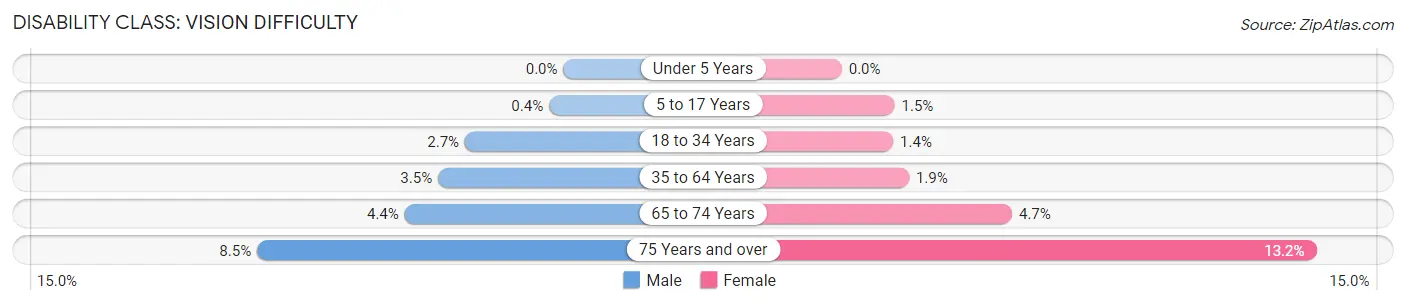
| Age Bracket | Male | Female |
| Under 5 Years | 0 (0.0%) | 0 (0.0%) |
| 5 to 17 Years | 18 (0.4%) | 64 (1.5%) |
| 18 to 34 Years | 155 (2.7%) | 78 (1.4%) |
| 35 to 64 Years | 460 (3.5%) | 251 (1.9%) |
| 65 to 74 Years | 192 (4.4%) | 218 (4.7%) |
| 75 Years and over | 187 (8.5%) | 371 (13.2%) |
Disability Class: Cognitive Difficulty
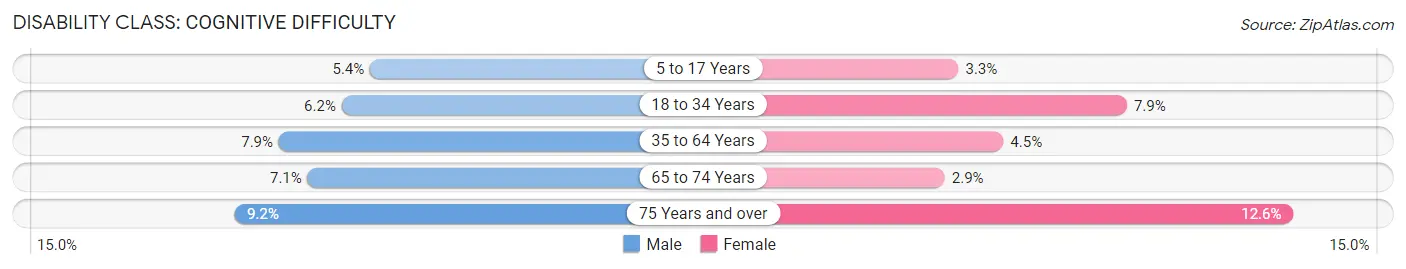
| Age Bracket | Male | Female |
| 5 to 17 Years | 241 (5.4%) | 142 (3.3%) |
| 18 to 34 Years | 349 (6.2%) | 432 (7.9%) |
| 35 to 64 Years | 1,043 (7.9%) | 604 (4.5%) |
| 65 to 74 Years | 309 (7.1%) | 132 (2.9%) |
| 75 Years and over | 201 (9.2%) | 353 (12.6%) |
Disability Class: Ambulatory Difficulty
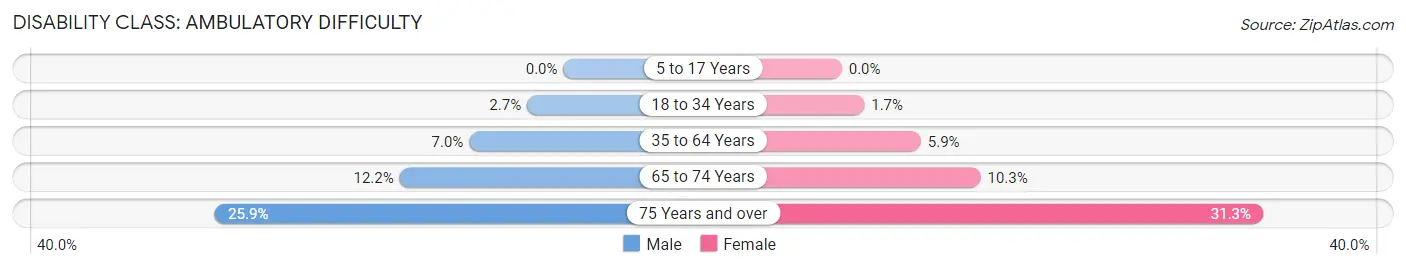
| Age Bracket | Male | Female |
| 5 to 17 Years | 0 (0.0%) | 0 (0.0%) |
| 18 to 34 Years | 153 (2.7%) | 91 (1.7%) |
| 35 to 64 Years | 920 (7.0%) | 788 (5.9%) |
| 65 to 74 Years | 528 (12.2%) | 474 (10.3%) |
| 75 Years and over | 567 (25.9%) | 878 (31.3%) |
Disability Class: Self-Care Difficulty
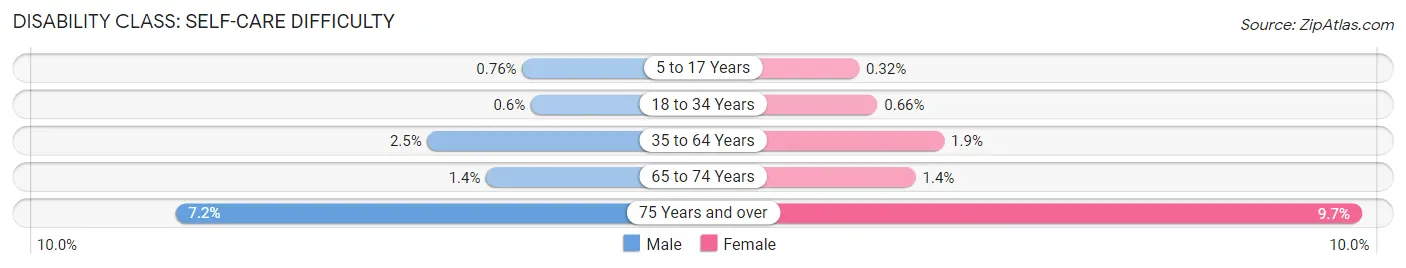
| Age Bracket | Male | Female |
| 5 to 17 Years | 34 (0.8%) | 14 (0.3%) |
| 18 to 34 Years | 34 (0.6%) | 36 (0.7%) |
| 35 to 64 Years | 332 (2.5%) | 255 (1.9%) |
| 65 to 74 Years | 62 (1.4%) | 63 (1.4%) |
| 75 Years and over | 158 (7.2%) | 271 (9.7%) |
Technology Access in Belknap County
Computing Device Access in Belknap County

| Device Type | # Households | % Households |
| Desktop or Laptop | 21,404 | 82.5% |
| Smartphone | 22,053 | 85.0% |
| Tablet | 16,781 | 64.6% |
| No Computing Device | 1,588 | 6.1% |
| Total | 25,956 | 100.0% |
Internet Access in Belknap County
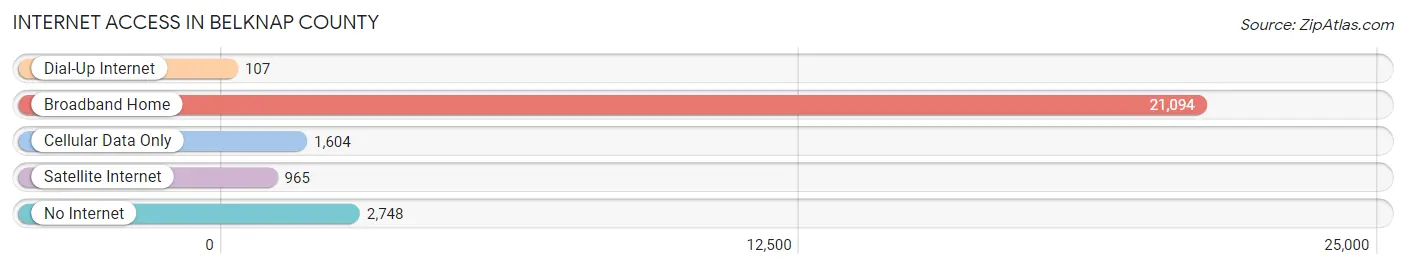
| Internet Type | # Households | % Households |
| Dial-Up Internet | 107 | 0.4% |
| Broadband Home | 21,094 | 81.3% |
| Cellular Data Only | 1,604 | 6.2% |
| Satellite Internet | 965 | 3.7% |
| No Internet | 2,748 | 10.6% |
| Total | 25,956 | 100.0% |
Belknap County Summary
Belknap County is located in the state of New Hampshire in the United States. It is one of the ten counties in the state and is the fifth most populous county in the state. The county seat is Laconia, and the largest city is Laconia. The county was established in 1840 and named after Dr. Jeremy Belknap, a prominent New England historian.
Geography
Belknap County is located in the central part of New Hampshire, bordered by Merrimack County to the north, Strafford County to the east, Carroll County to the south, and Grafton County to the west. The county covers an area of 576 square miles and is home to numerous lakes, rivers, and mountains. The highest point in the county is Mount Major, which has an elevation of 2,737 feet. The county is also home to the Lakes Region, which is a popular tourist destination.
Economy
Belknap County has a diverse economy that is largely driven by tourism, manufacturing, and agriculture. Tourism is a major industry in the county, with the Lakes Region being a popular destination for visitors. Manufacturing is also a major industry in the county, with companies such as BAE Systems, General Electric, and Laconia Motorcycle Company all having a presence in the county. Agriculture is also an important part of the economy, with dairy farming being the most common type of farming in the county.
Demographics
As of the 2010 census, Belknap County had a population of 60,088. The population was spread out with a median age of 43.7 years. The racial makeup of the county was 94.2% White, 1.3% African American, 0.7% Native American, 1.2% Asian, 0.1% Pacific Islander, 1.2% from other races, and 1.5% from two or more races. The largest ancestry groups in the county were English (30.2%), Irish (20.2%), French (13.2%), German (11.2%), and Italian (5.2%).
Belknap County is home to numerous educational institutions, including the University of New Hampshire, Plymouth State University, and Lakes Region Community College. The county also has a strong healthcare system, with several hospitals and medical centers located in the county.
Conclusion
Belknap County is a vibrant and diverse county located in the state of New Hampshire. It is home to numerous lakes, rivers, and mountains, and is a popular tourist destination. The county has a diverse economy that is largely driven by tourism, manufacturing, and agriculture. The population of the county is largely white, with English, Irish, French, German, and Italian being the largest ancestry groups. The county is also home to numerous educational institutions and a strong healthcare system.
Common Questions
What is Per Capita Income in Belknap County?
Per Capita income in Belknap County is $43,670.
What is the Median Family Income in Belknap County?
Median Family Income in Belknap County is $101,175.
What is the Median Household income in Belknap County?
Median Household Income in Belknap County is $80,719.
What is Income or Wage Gap in Belknap County?
Income or Wage Gap in Belknap County is 33.9%.
Women in Belknap County earn 66.1 cents for every dollar earned by a man.
What is Family Income Deficit in Belknap County?
Family Income Deficit in Belknap County is $8,062.
Families that are below poverty line in Belknap County earn $8,062 less on average than the poverty threshold level.
What is Inequality or Gini Index in Belknap County?
Inequality or Gini Index in Belknap County is 0.44.
What is the Total Population of Belknap County?
Total Population of Belknap County is 63,914.
What is the Total Male Population of Belknap County?
Total Male Population of Belknap County is 31,658.
What is the Total Female Population of Belknap County?
Total Female Population of Belknap County is 32,256.
What is the Ratio of Males per 100 Females in Belknap County?
There are 98.15 Males per 100 Females in Belknap County.
What is the Ratio of Females per 100 Males in Belknap County?
There are 101.89 Females per 100 Males in Belknap County.
What is the Median Population Age in Belknap County?
Median Population Age in Belknap County is 47.8 Years.
What is the Average Family Size in Belknap County
Average Family Size in Belknap County is 3.0 People.
What is the Average Household Size in Belknap County
Average Household Size in Belknap County is 2.4 People.
How Large is the Labor Force in Belknap County?
There are 33,857 People in the Labor Forcein in Belknap County.
What is the Percentage of People in the Labor Force in Belknap County?
62.7% of People are in the Labor Force in Belknap County.
What is the Unemployment Rate in Belknap County?
Unemployment Rate in Belknap County is 2.7%.