Milford, NH Map & Demographics
Milford Map
Milford Overview
$41,661
PER CAPITA INCOME
$106,758
AVG FAMILY INCOME
$71,065
AVG HOUSEHOLD INCOME
38.5%
WAGE / INCOME GAP [ % ]
61.5¢/ $1
WAGE / INCOME GAP [ $ ]
0.43
INEQUALITY / GINI INDEX
8,530
TOTAL POPULATION
3,914
MALE POPULATION
4,616
FEMALE POPULATION
84.79
MALES / 100 FEMALES
117.94
FEMALES / 100 MALES
40.2
MEDIAN AGE
3.0
AVG FAMILY SIZE
2.3
AVG HOUSEHOLD SIZE
4,844
LABOR FORCE [ PEOPLE ]
69.4%
PERCENT IN LABOR FORCE
4.9%
UNEMPLOYMENT RATE
Milford Zip Codes
Milford Area Codes
Income in Milford
Income Overview in Milford
Per Capita Income in Milford is $41,661, while median incomes of families and households are $106,758 and $71,065 respectively.
| Characteristic | Number | Measure |
| Per Capita Income | 8,530 | $41,661 |
| Median Family Income | 2,075 | $106,758 |
| Mean Family Income | 2,075 | $119,409 |
| Median Household Income | 3,700 | $71,065 |
| Mean Household Income | 3,700 | $95,255 |
| Income Deficit | 2,075 | $0 |
| Wage / Income Gap (%) | 8,530 | 38.50% |
| Wage / Income Gap ($) | 8,530 | 61.50¢ per $1 |
| Gini / Inequality Index | 8,530 | 0.43 |
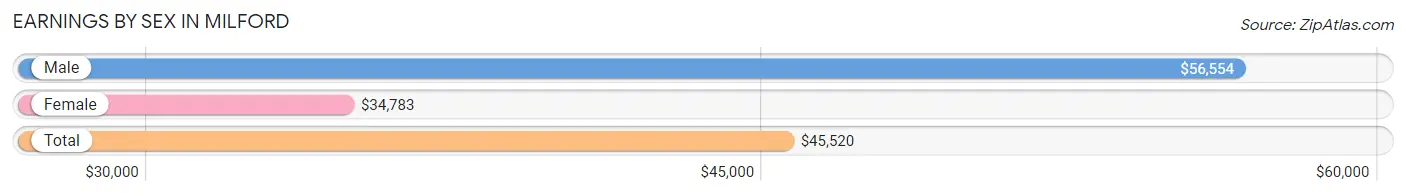
Earnings by Sex in Milford
Average Earnings in Milford are $45,520, $56,554 for men and $34,783 for women, a difference of 38.5%.
| Sex | Number | Average Earnings |
| Male | 2,585 (50.7%) | $56,554 |
| Female | 2,510 (49.3%) | $34,783 |
| Total | 5,095 (100.0%) | $45,520 |
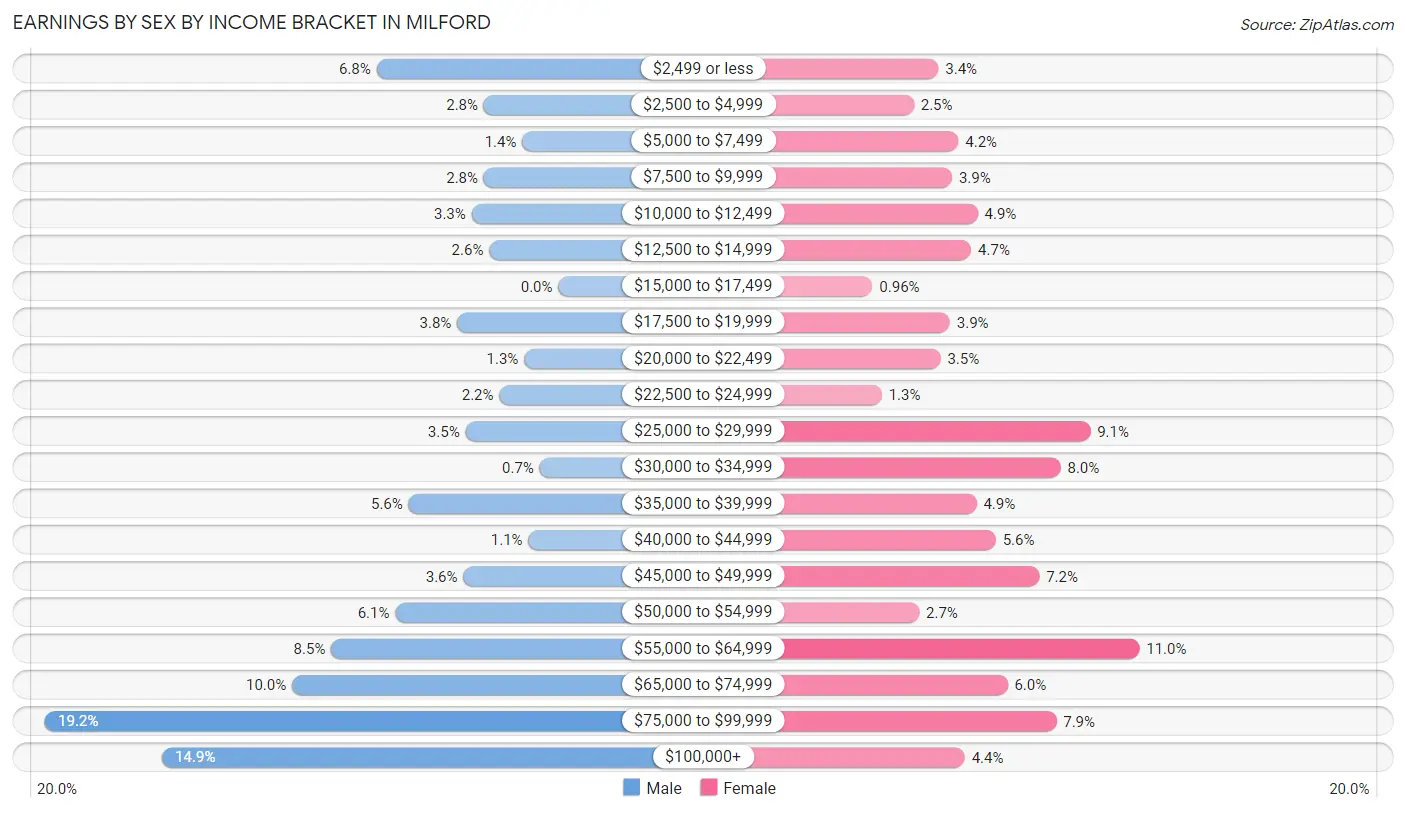
Earnings by Sex by Income Bracket in Milford
The most common earnings brackets in Milford are $75,000 to $99,999 for men (497 | 19.2%) and $55,000 to $64,999 for women (275 | 11.0%).
| Income | Male | Female |
| $2,499 or less | 176 (6.8%) | 86 (3.4%) |
| $2,500 to $4,999 | 72 (2.8%) | 63 (2.5%) |
| $5,000 to $7,499 | 35 (1.3%) | 105 (4.2%) |
| $7,500 to $9,999 | 72 (2.8%) | 99 (3.9%) |
| $10,000 to $12,499 | 84 (3.3%) | 123 (4.9%) |
| $12,500 to $14,999 | 67 (2.6%) | 117 (4.7%) |
| $15,000 to $17,499 | 0 (0.0%) | 24 (1.0%) |
| $17,500 to $19,999 | 98 (3.8%) | 97 (3.9%) |
| $20,000 to $22,499 | 33 (1.3%) | 88 (3.5%) |
| $22,500 to $24,999 | 57 (2.2%) | 33 (1.3%) |
| $25,000 to $29,999 | 90 (3.5%) | 229 (9.1%) |
| $30,000 to $34,999 | 18 (0.7%) | 201 (8.0%) |
| $35,000 to $39,999 | 145 (5.6%) | 122 (4.9%) |
| $40,000 to $44,999 | 29 (1.1%) | 140 (5.6%) |
| $45,000 to $49,999 | 92 (3.6%) | 181 (7.2%) |
| $50,000 to $54,999 | 158 (6.1%) | 68 (2.7%) |
| $55,000 to $64,999 | 220 (8.5%) | 275 (11.0%) |
| $65,000 to $74,999 | 258 (10.0%) | 151 (6.0%) |
| $75,000 to $99,999 | 497 (19.2%) | 197 (7.9%) |
| $100,000+ | 384 (14.8%) | 111 (4.4%) |
| Total | 2,585 (100.0%) | 2,510 (100.0%) |
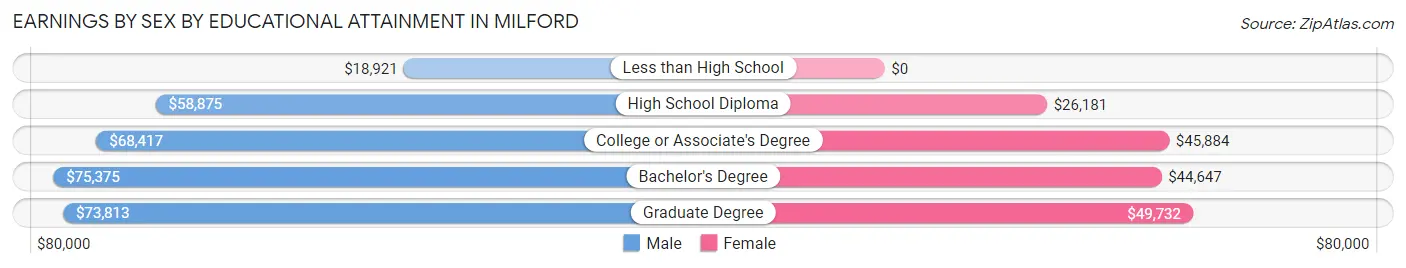
Earnings by Sex by Educational Attainment in Milford
Average earnings in Milford are $59,683 for men and $41,477 for women, a difference of 30.5%. Men with an educational attainment of bachelor's degree enjoy the highest average annual earnings of $75,375, while those with less than high school education earn the least with $18,921. Women with an educational attainment of graduate degree earn the most with the average annual earnings of $49,732, while those with high school diploma education have the smallest earnings of $26,181.
| Educational Attainment | Male Income | Female Income |
| Less than High School | $18,921 | $0 |
| High School Diploma | $58,875 | $26,181 |
| College or Associate's Degree | $68,417 | $45,884 |
| Bachelor's Degree | $75,375 | $44,647 |
| Graduate Degree | $73,813 | $49,732 |
| Total | $59,683 | $41,477 |
Family Income in Milford
Family Income Brackets in Milford
According to the Milford family income data, there are 672 families falling into the $100,000 to $149,999 income range, which is the most common income bracket and makes up 32.4% of all families.
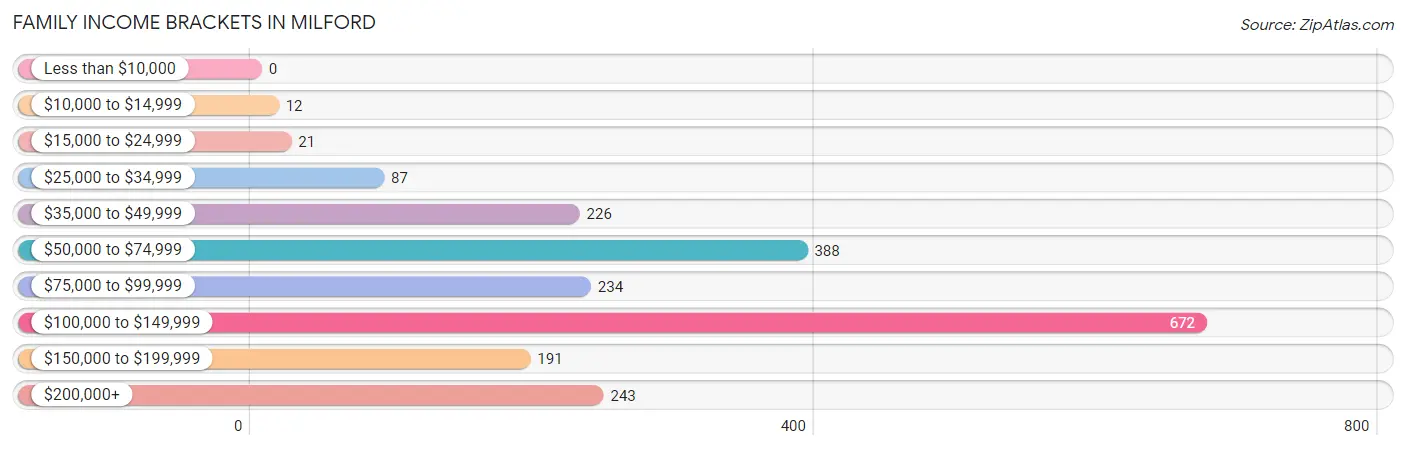
| Income Bracket | # Families | % Families |
| Less than $10,000 | 0 | 0.0% |
| $10,000 to $14,999 | 12 | 0.6% |
| $15,000 to $24,999 | 21 | 1.0% |
| $25,000 to $34,999 | 87 | 4.2% |
| $35,000 to $49,999 | 226 | 10.9% |
| $50,000 to $74,999 | 388 | 18.7% |
| $75,000 to $99,999 | 234 | 11.3% |
| $100,000 to $149,999 | 672 | 32.4% |
| $150,000 to $199,999 | 191 | 9.2% |
| $200,000+ | 243 | 11.7% |
Family Income by Famaliy Size in Milford
4-person families (223 | 10.7%) account for the highest median family income in Milford with $133,304 per family, while 3-person families (707 | 34.1%) have the highest median income of $37,986 per family member.
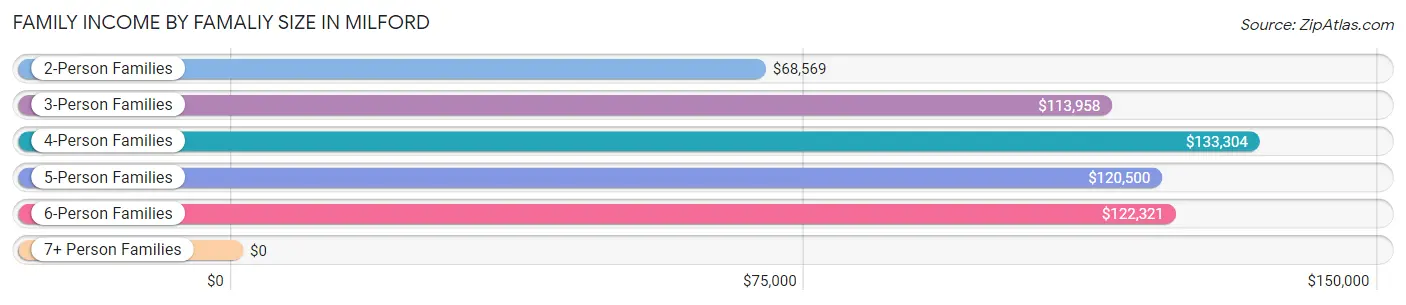
| Income Bracket | # Families | Median Income |
| 2-Person Families | 949 (45.7%) | $68,569 |
| 3-Person Families | 707 (34.1%) | $113,958 |
| 4-Person Families | 223 (10.7%) | $133,304 |
| 5-Person Families | 102 (4.9%) | $120,500 |
| 6-Person Families | 69 (3.3%) | $122,321 |
| 7+ Person Families | 25 (1.2%) | $0 |
| Total | 2,075 (100.0%) | $106,758 |
Family Income by Number of Earners in Milford
The median family income in Milford is $106,758, with families comprising 3+ earners (286) having the highest median family income of $147,800, while families with no earners (188) have the lowest median family income of $51,154, accounting for 13.8% and 9.1% of families, respectively.
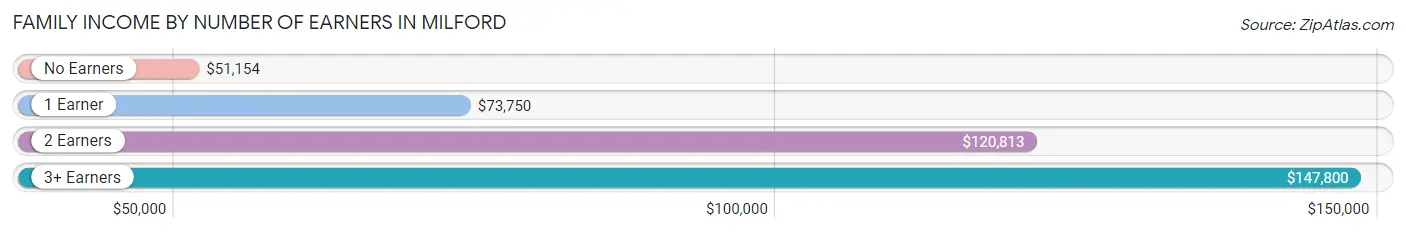
| Number of Earners | # Families | Median Income |
| No Earners | 188 (9.1%) | $51,154 |
| 1 Earner | 671 (32.3%) | $73,750 |
| 2 Earners | 930 (44.8%) | $120,813 |
| 3+ Earners | 286 (13.8%) | $147,800 |
| Total | 2,075 (100.0%) | $106,758 |
Household Income in Milford
Household Income Brackets in Milford
With 832 households falling in the category, the $100,000 to $149,999 income range is the most frequent in Milford, accounting for 22.5% of all households. In contrast, only 44 households (1.2%) fall into the less than $10,000 income bracket, making it the least populous group.
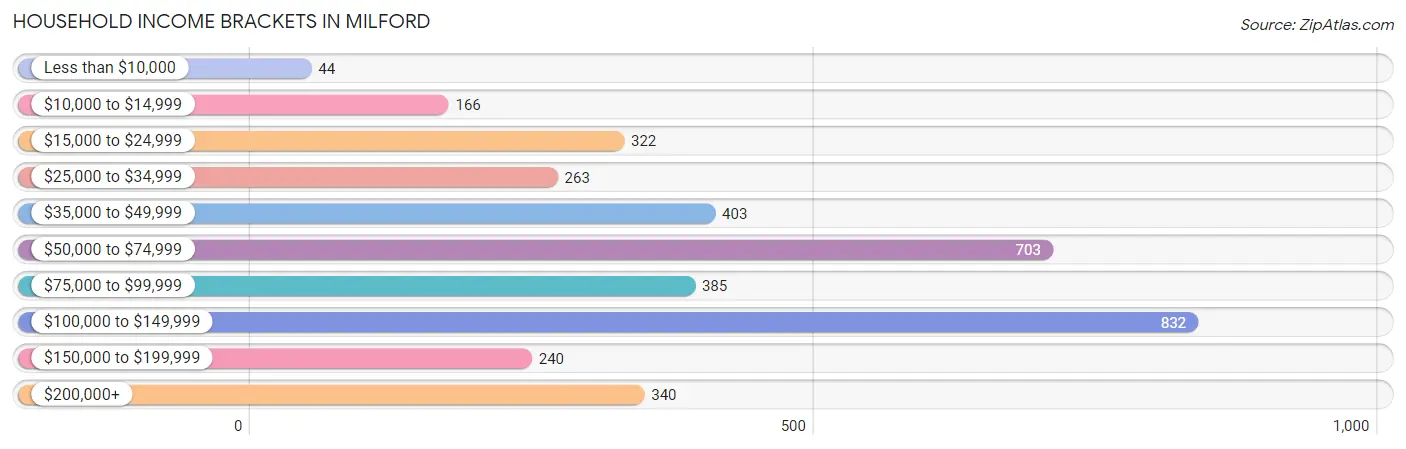
| Income Bracket | # Households | % Households |
| Less than $10,000 | 44 | 1.2% |
| $10,000 to $14,999 | 166 | 4.5% |
| $15,000 to $24,999 | 322 | 8.7% |
| $25,000 to $34,999 | 263 | 7.1% |
| $35,000 to $49,999 | 403 | 10.9% |
| $50,000 to $74,999 | 703 | 19.0% |
| $75,000 to $99,999 | 385 | 10.4% |
| $100,000 to $149,999 | 832 | 22.5% |
| $150,000 to $199,999 | 240 | 6.5% |
| $200,000+ | 340 | 9.2% |
Household Income by Householder Age in Milford
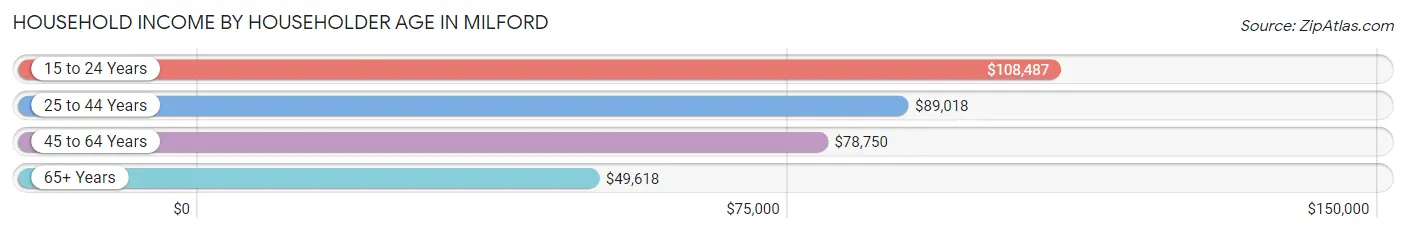
The median household income in Milford is $71,065, with the highest median household income of $108,487 found in the 15 to 24 years age bracket for the primary householder. A total of 107 households (2.9%) fall into this category. Meanwhile, the 65+ years age bracket for the primary householder has the lowest median household income of $49,618, with 953 households (25.8%) in this group.
| Income Bracket | # Households | Median Income |
| 15 to 24 Years | 107 (2.9%) | $108,487 |
| 25 to 44 Years | 1,523 (41.2%) | $89,018 |
| 45 to 64 Years | 1,117 (30.2%) | $78,750 |
| 65+ Years | 953 (25.8%) | $49,618 |
| Total | 3,700 (100.0%) | $71,065 |
Poverty in Milford
Income Below Poverty by Sex and Age in Milford
With 6.3% poverty level for males and 8.7% for females among the residents of Milford, 45 to 54 year old males and 5 year old females are the most vulnerable to poverty, with 93 males (16.9%) and 16 females (66.7%) in their respective age groups living below the poverty level.
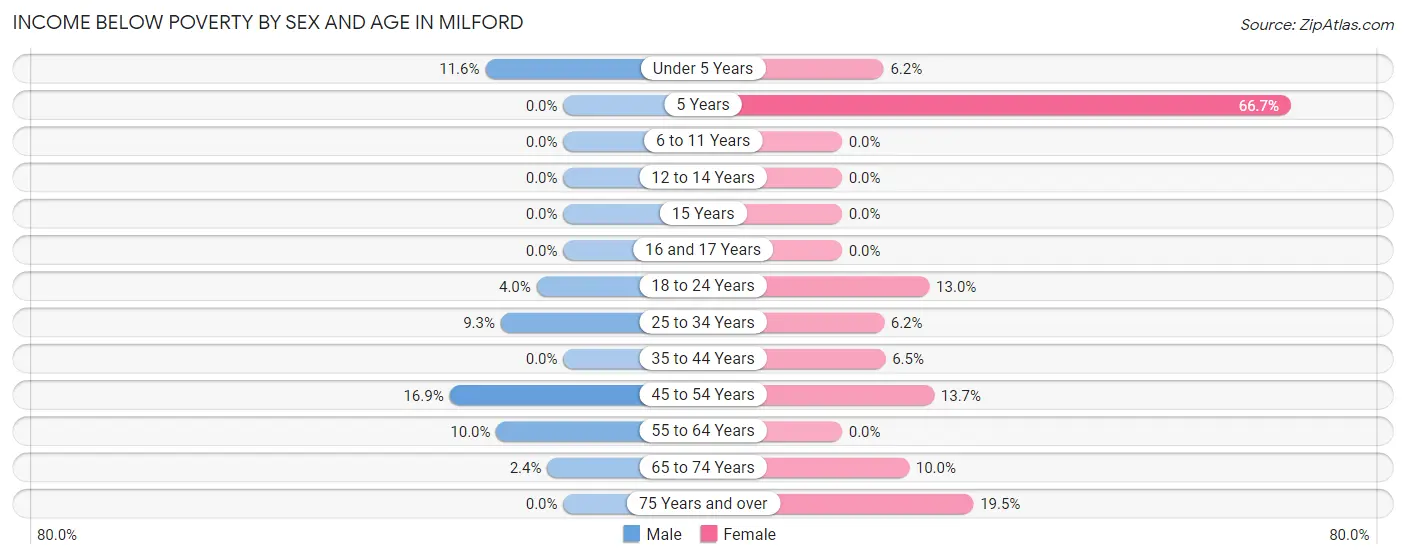
| Age Bracket | Male | Female |
| Under 5 Years | 27 (11.6%) | 25 (6.2%) |
| 5 Years | 0 (0.0%) | 16 (66.7%) |
| 6 to 11 Years | 0 (0.0%) | 0 (0.0%) |
| 12 to 14 Years | 0 (0.0%) | 0 (0.0%) |
| 15 Years | 0 (0.0%) | 0 (0.0%) |
| 16 and 17 Years | 0 (0.0%) | 0 (0.0%) |
| 18 to 24 Years | 12 (4.0%) | 55 (13.0%) |
| 25 to 34 Years | 58 (9.3%) | 38 (6.2%) |
| 35 to 44 Years | 0 (0.0%) | 41 (6.5%) |
| 45 to 54 Years | 93 (16.9%) | 73 (13.7%) |
| 55 to 64 Years | 42 (10.0%) | 0 (0.0%) |
| 65 to 74 Years | 11 (2.4%) | 39 (10.0%) |
| 75 Years and over | 0 (0.0%) | 104 (19.5%) |
| Total | 243 (6.3%) | 391 (8.7%) |
Income Above Poverty by Sex and Age in Milford
According to the poverty statistics in Milford, males aged 6 to 11 years and females aged 6 to 11 years are the age groups that are most secure financially, with 100.0% of males and 100.0% of females in these age groups living above the poverty line.
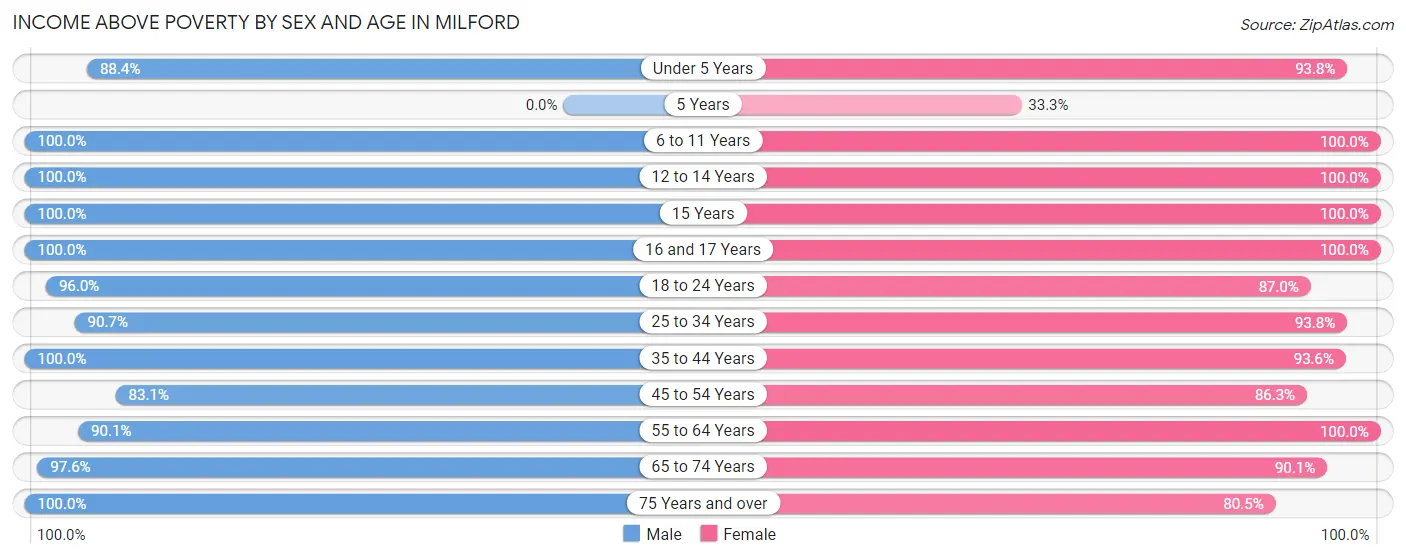
| Age Bracket | Male | Female |
| Under 5 Years | 206 (88.4%) | 379 (93.8%) |
| 5 Years | 0 (0.0%) | 8 (33.3%) |
| 6 to 11 Years | 312 (100.0%) | 237 (100.0%) |
| 12 to 14 Years | 74 (100.0%) | 140 (100.0%) |
| 15 Years | 50 (100.0%) | 62 (100.0%) |
| 16 and 17 Years | 72 (100.0%) | 52 (100.0%) |
| 18 to 24 Years | 290 (96.0%) | 369 (87.0%) |
| 25 to 34 Years | 566 (90.7%) | 572 (93.8%) |
| 35 to 44 Years | 600 (100.0%) | 595 (93.5%) |
| 45 to 54 Years | 457 (83.1%) | 461 (86.3%) |
| 55 to 64 Years | 380 (90.0%) | 464 (100.0%) |
| 65 to 74 Years | 451 (97.6%) | 353 (90.0%) |
| 75 Years and over | 148 (100.0%) | 429 (80.5%) |
| Total | 3,606 (93.7%) | 4,121 (91.3%) |
Income Below Poverty Among Married-Couple Families in Milford
The poverty statistics for married-couple families in Milford show that 1.3% or 20 of the total 1,496 families live below the poverty line. Families with no children have the highest poverty rate of 2.3%, comprising of 20 families. On the other hand, families with 1 or 2 children have the lowest poverty rate of 0.0%, which includes 0 families.
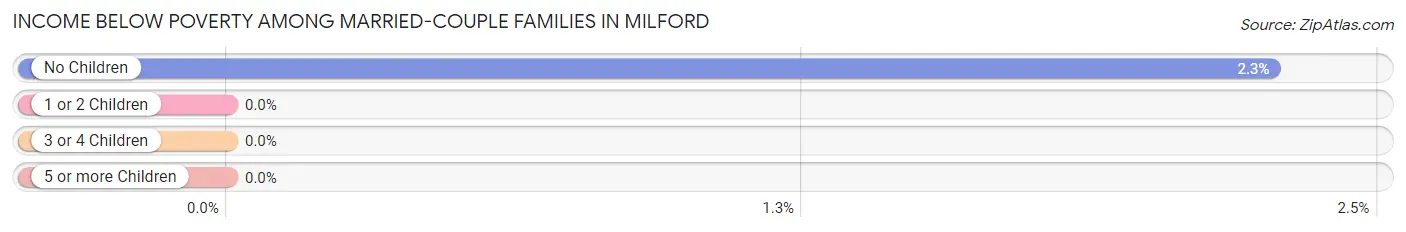
| Children | Above Poverty | Below Poverty |
| No Children | 861 (97.7%) | 20 (2.3%) |
| 1 or 2 Children | 567 (100.0%) | 0 (0.0%) |
| 3 or 4 Children | 48 (100.0%) | 0 (0.0%) |
| 5 or more Children | 0 (0.0%) | 0 (0.0%) |
| Total | 1,476 (98.7%) | 20 (1.3%) |
Income Below Poverty Among Single-Parent Households in Milford
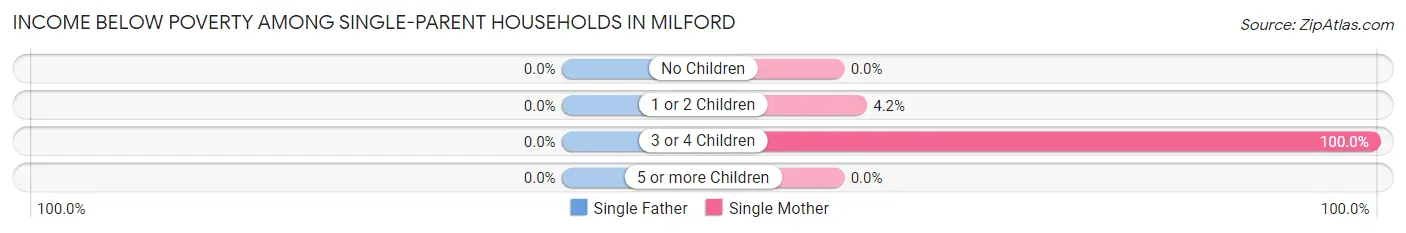
| Children | Single Father | Single Mother |
| No Children | 0 (0.0%) | 0 (0.0%) |
| 1 or 2 Children | 0 (0.0%) | 12 (4.2%) |
| 3 or 4 Children | 0 (0.0%) | 15 (100.0%) |
| 5 or more Children | 0 (0.0%) | 0 (0.0%) |
| Total | 0 (0.0%) | 27 (6.8%) |
Income Below Poverty Among Married-Couple vs Single-Parent Households in Milford
The poverty data for Milford shows that 20 of the married-couple family households (1.3%) and 27 of the single-parent households (4.7%) are living below the poverty level. Within the married-couple family households, those with no children have the highest poverty rate, with 20 households (2.3%) falling below the poverty line. Among the single-parent households, those with 3 or 4 children have the highest poverty rate, with 15 household (62.5%) living below poverty.
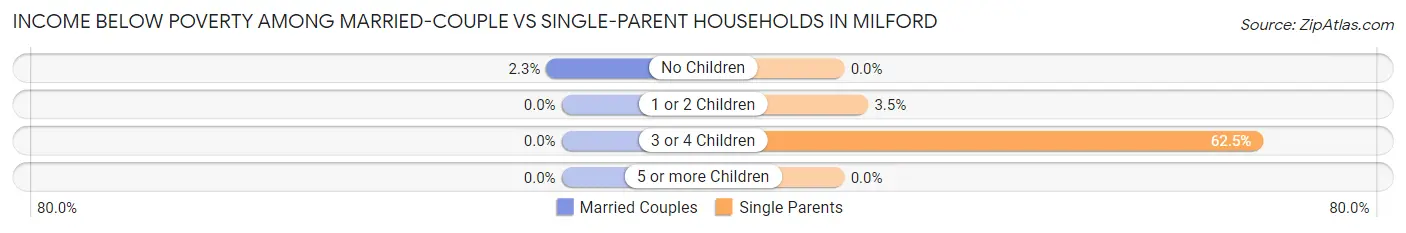
| Children | Married-Couple Families | Single-Parent Households |
| No Children | 20 (2.3%) | 0 (0.0%) |
| 1 or 2 Children | 0 (0.0%) | 12 (3.5%) |
| 3 or 4 Children | 0 (0.0%) | 15 (62.5%) |
| 5 or more Children | 0 (0.0%) | 0 (0.0%) |
| Total | 20 (1.3%) | 27 (4.7%) |
Race in Milford
The most populous races in Milford are White / Caucasian (8,011 | 93.9%), Hispanic or Latino (335 | 3.9%), and Two or more Races (335 | 3.9%).
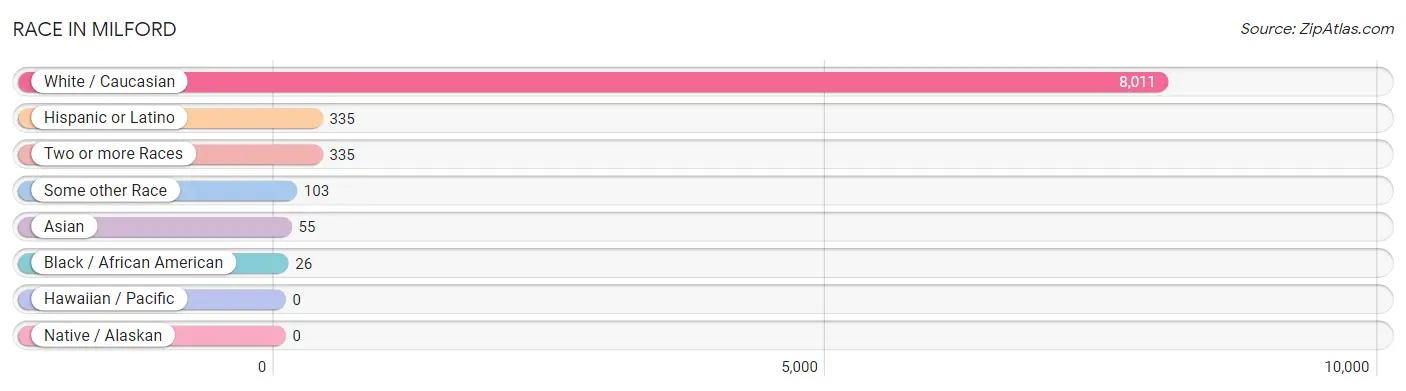
| Race | # Population | % Population |
| Asian | 55 | 0.6% |
| Black / African American | 26 | 0.3% |
| Hawaiian / Pacific | 0 | 0.0% |
| Hispanic or Latino | 335 | 3.9% |
| Native / Alaskan | 0 | 0.0% |
| White / Caucasian | 8,011 | 93.9% |
| Two or more Races | 335 | 3.9% |
| Some other Race | 103 | 1.2% |
| Total | 8,530 | 100.0% |
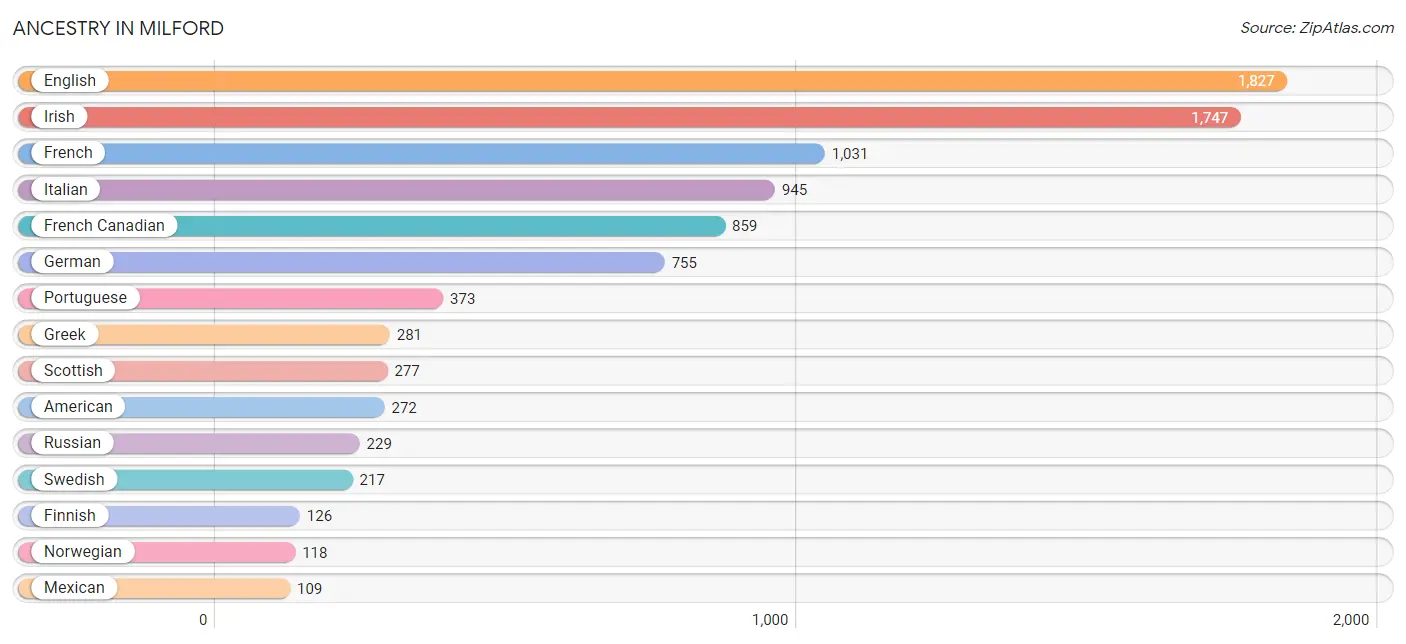
Ancestry in Milford
The most populous ancestries reported in Milford are English (1,827 | 21.4%), Irish (1,747 | 20.5%), French (1,031 | 12.1%), Italian (945 | 11.1%), and French Canadian (859 | 10.1%), together accounting for 75.1% of all Milford residents.
| Ancestry | # Population | % Population |
| American | 272 | 3.2% |
| Bhutanese | 43 | 0.5% |
| Brazilian | 45 | 0.5% |
| British | 19 | 0.2% |
| Bulgarian | 15 | 0.2% |
| Canadian | 81 | 0.9% |
| Cape Verdean | 26 | 0.3% |
| Celtic | 12 | 0.1% |
| Central American | 1 | 0.0% |
| Central American Indian | 9 | 0.1% |
| Cherokee | 15 | 0.2% |
| Colombian | 50 | 0.6% |
| Cuban | 29 | 0.3% |
| Czech | 15 | 0.2% |
| Czechoslovakian | 12 | 0.1% |
| Danish | 39 | 0.5% |
| Dominican | 67 | 0.8% |
| Dutch | 16 | 0.2% |
| Eastern European | 8 | 0.1% |
| English | 1,827 | 21.4% |
| European | 87 | 1.0% |
| Finnish | 126 | 1.5% |
| French | 1,031 | 12.1% |
| French Canadian | 859 | 10.1% |
| German | 755 | 8.8% |
| Greek | 281 | 3.3% |
| Indian (Asian) | 15 | 0.2% |
| Irish | 1,747 | 20.5% |
| Iroquois | 22 | 0.3% |
| Italian | 945 | 11.1% |
| Lithuanian | 17 | 0.2% |
| Mexican | 109 | 1.3% |
| Mexican American Indian | 9 | 0.1% |
| Native Hawaiian | 47 | 0.5% |
| Norwegian | 118 | 1.4% |
| Pennsylvania German | 60 | 0.7% |
| Polish | 94 | 1.1% |
| Portuguese | 373 | 4.4% |
| Puerto Rican | 79 | 0.9% |
| Russian | 229 | 2.7% |
| Salvadoran | 1 | 0.0% |
| Scandinavian | 33 | 0.4% |
| Scotch-Irish | 76 | 0.9% |
| Scottish | 277 | 3.3% |
| Sioux | 22 | 0.3% |
| South American | 50 | 0.6% |
| Sri Lankan | 40 | 0.5% |
| Subsaharan African | 26 | 0.3% |
| Swedish | 217 | 2.5% |
| Swiss | 19 | 0.2% |
| Thai | 11 | 0.1% |
| Turkish | 59 | 0.7% |
| Ukrainian | 21 | 0.3% |
| Welsh | 11 | 0.1% | View All 54 Rows |
Immigrants in Milford
The most numerous immigrant groups reported in Milford came from Latin America (100 | 1.2%), Europe (98 | 1.1%), Asia (83 | 1.0%), South America (67 | 0.8%), and Brazil (45 | 0.5%), together accounting for 4.6% of all Milford residents.
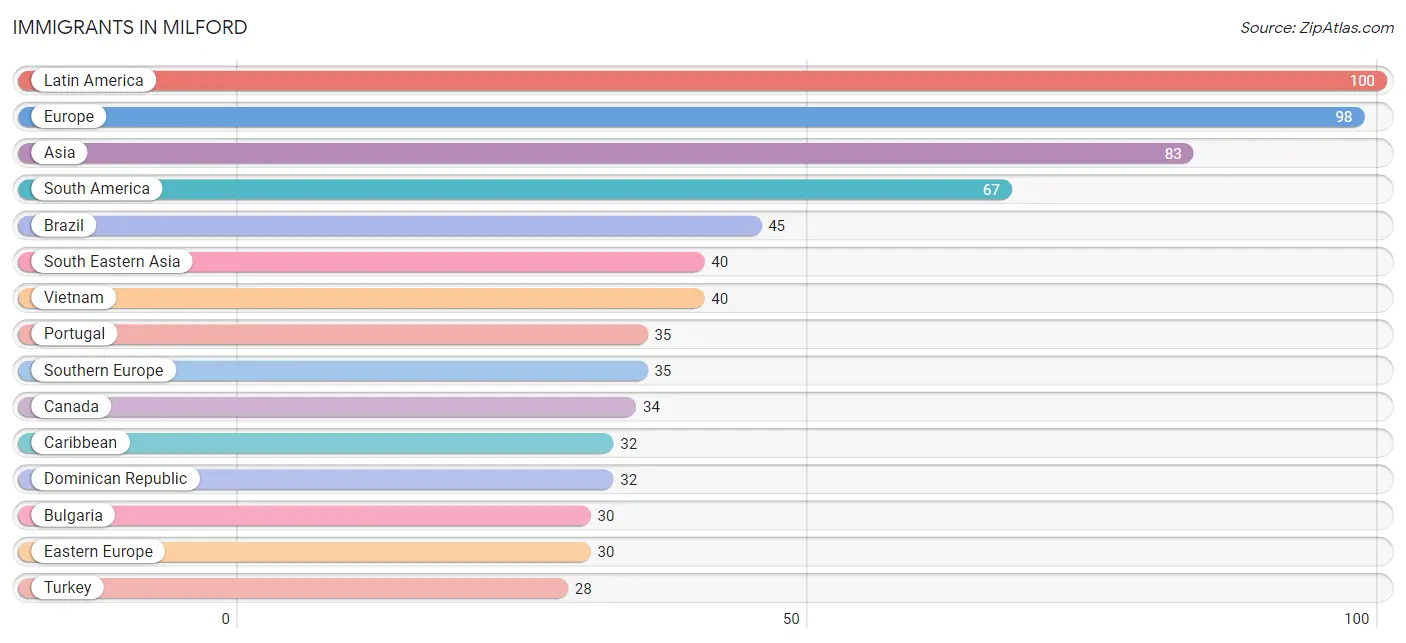
| Immigration Origin | # Population | % Population |
| Africa | 26 | 0.3% |
| Asia | 83 | 1.0% |
| Brazil | 45 | 0.5% |
| Bulgaria | 30 | 0.4% |
| Cabo Verde | 26 | 0.3% |
| Canada | 34 | 0.4% |
| Caribbean | 32 | 0.4% |
| Central America | 1 | 0.0% |
| China | 15 | 0.2% |
| Colombia | 22 | 0.3% |
| Dominican Republic | 32 | 0.4% |
| Eastern Asia | 15 | 0.2% |
| Eastern Europe | 30 | 0.4% |
| Europe | 98 | 1.1% |
| Germany | 16 | 0.2% |
| Ireland | 17 | 0.2% |
| Latin America | 100 | 1.2% |
| Mexico | 1 | 0.0% |
| Northern Europe | 17 | 0.2% |
| Portugal | 35 | 0.4% |
| South America | 67 | 0.8% |
| South Eastern Asia | 40 | 0.5% |
| Southern Europe | 35 | 0.4% |
| Taiwan | 15 | 0.2% |
| Turkey | 28 | 0.3% |
| Vietnam | 40 | 0.5% |
| Western Africa | 26 | 0.3% |
| Western Asia | 28 | 0.3% |
| Western Europe | 16 | 0.2% | View All 29 Rows |
Sex and Age in Milford
Sex and Age in Milford
The most populous age groups in Milford are 30 to 34 Years (351 | 9.0%) for men and Under 5 Years (404 | 8.7%) for women.
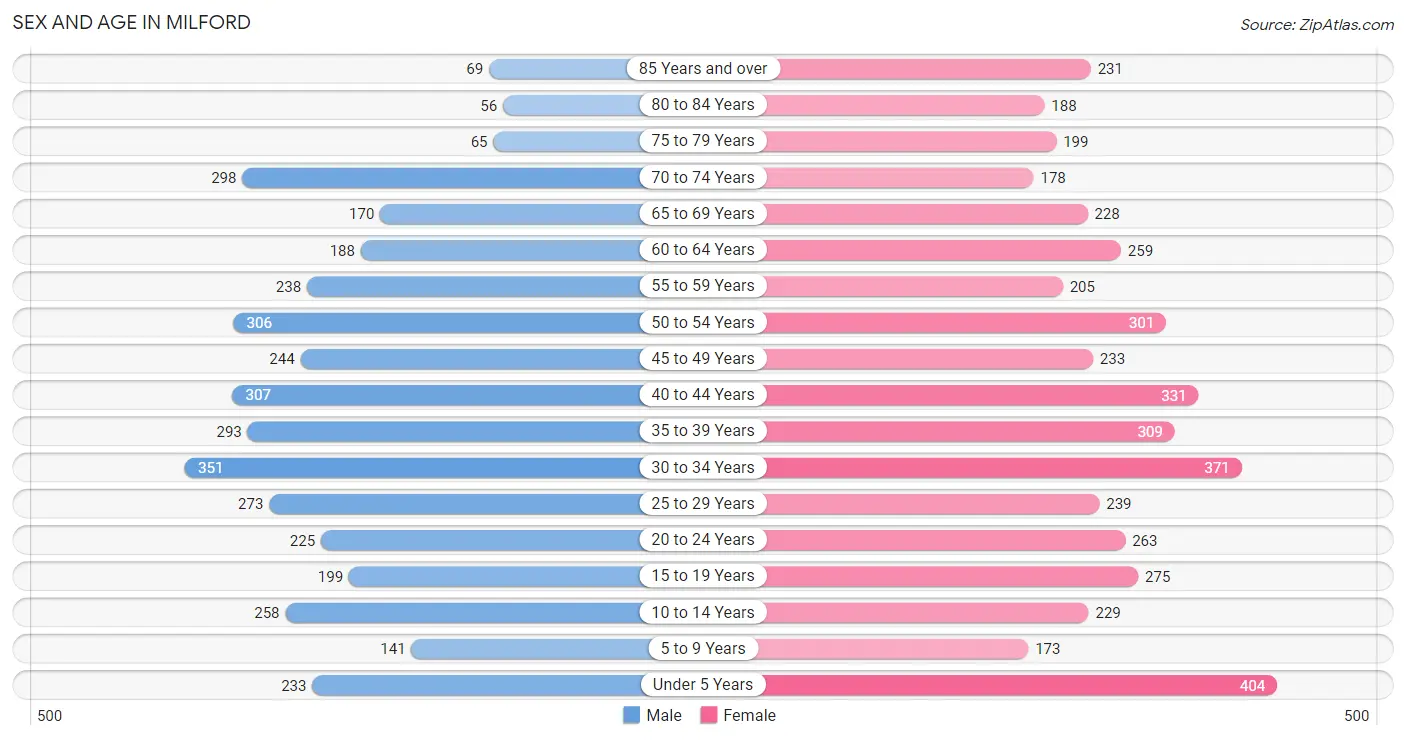
| Age Bracket | Male | Female |
| Under 5 Years | 233 (5.9%) | 404 (8.7%) |
| 5 to 9 Years | 141 (3.6%) | 173 (3.7%) |
| 10 to 14 Years | 258 (6.6%) | 229 (5.0%) |
| 15 to 19 Years | 199 (5.1%) | 275 (6.0%) |
| 20 to 24 Years | 225 (5.8%) | 263 (5.7%) |
| 25 to 29 Years | 273 (7.0%) | 239 (5.2%) |
| 30 to 34 Years | 351 (9.0%) | 371 (8.0%) |
| 35 to 39 Years | 293 (7.5%) | 309 (6.7%) |
| 40 to 44 Years | 307 (7.8%) | 331 (7.2%) |
| 45 to 49 Years | 244 (6.2%) | 233 (5.1%) |
| 50 to 54 Years | 306 (7.8%) | 301 (6.5%) |
| 55 to 59 Years | 238 (6.1%) | 205 (4.4%) |
| 60 to 64 Years | 188 (4.8%) | 259 (5.6%) |
| 65 to 69 Years | 170 (4.3%) | 228 (4.9%) |
| 70 to 74 Years | 298 (7.6%) | 178 (3.9%) |
| 75 to 79 Years | 65 (1.7%) | 199 (4.3%) |
| 80 to 84 Years | 56 (1.4%) | 188 (4.1%) |
| 85 Years and over | 69 (1.8%) | 231 (5.0%) |
| Total | 3,914 (100.0%) | 4,616 (100.0%) |
Families and Households in Milford
Median Family Size in Milford
The median family size in Milford is 2.95 persons per family, with single female/mother families (398 | 19.2%) accounting for the largest median family size of 3.04 persons per family. On the other hand, single male/father families (181 | 8.7%) represent the smallest median family size with 2.68 persons per family.
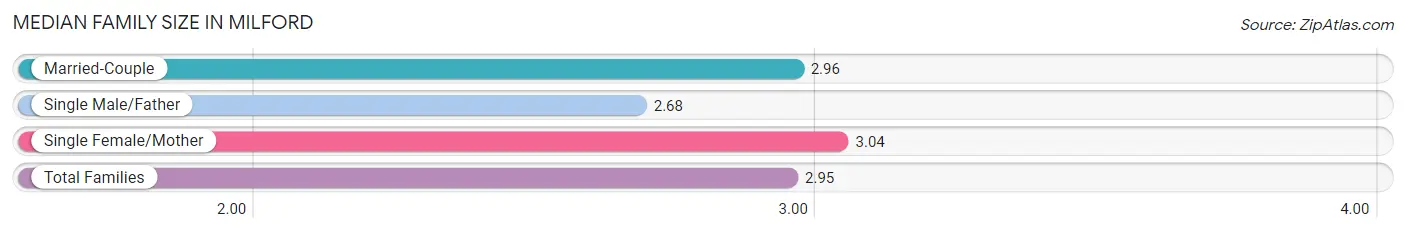
| Family Type | # Families | Family Size |
| Married-Couple | 1,496 (72.1%) | 2.96 |
| Single Male/Father | 181 (8.7%) | 2.68 |
| Single Female/Mother | 398 (19.2%) | 3.04 |
| Total Families | 2,075 (100.0%) | 2.95 |
Median Household Size in Milford
The median household size in Milford is 2.26 persons per household, with single female/mother households (398 | 10.8%) accounting for the largest median household size of 3.41 persons per household. non-family households (1,625 | 43.9%) represent the smallest median household size with 1.22 persons per household.
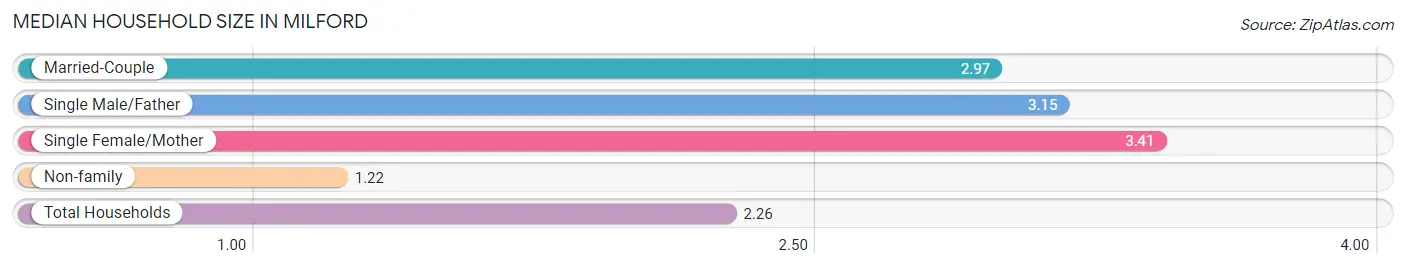
| Household Type | # Households | Household Size |
| Married-Couple | 1,496 (40.4%) | 2.97 |
| Single Male/Father | 181 (4.9%) | 3.15 |
| Single Female/Mother | 398 (10.8%) | 3.41 |
| Non-family | 1,625 (43.9%) | 1.22 |
| Total Households | 3,700 (100.0%) | 2.26 |
Household Size by Marriage Status in Milford
Out of a total of 3,700 households in Milford, 2,075 (56.1%) are family households, while 1,625 (43.9%) are nonfamily households. The most numerous type of family households are 2-person households, comprising 827, and the most common type of nonfamily households are 1-person households, comprising 1,323.
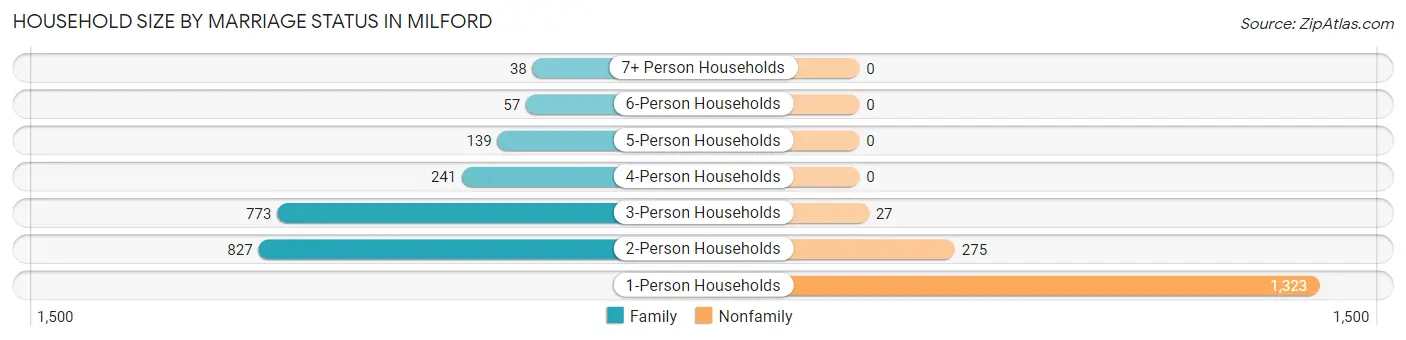
| Household Size | Family Households | Nonfamily Households |
| 1-Person Households | - | 1,323 (35.8%) |
| 2-Person Households | 827 (22.4%) | 275 (7.4%) |
| 3-Person Households | 773 (20.9%) | 27 (0.7%) |
| 4-Person Households | 241 (6.5%) | 0 (0.0%) |
| 5-Person Households | 139 (3.8%) | 0 (0.0%) |
| 6-Person Households | 57 (1.5%) | 0 (0.0%) |
| 7+ Person Households | 38 (1.0%) | 0 (0.0%) |
| Total | 2,075 (56.1%) | 1,625 (43.9%) |
Female Fertility in Milford
Fertility by Age in Milford
Average fertility rate in Milford is 17.0 births per 1,000 women. Women in the age bracket of 20 to 34 years have the highest fertility rate with 23.0 births per 1,000 women. Women in the age bracket of 20 to 34 years acount for 58.8% of all women with births.
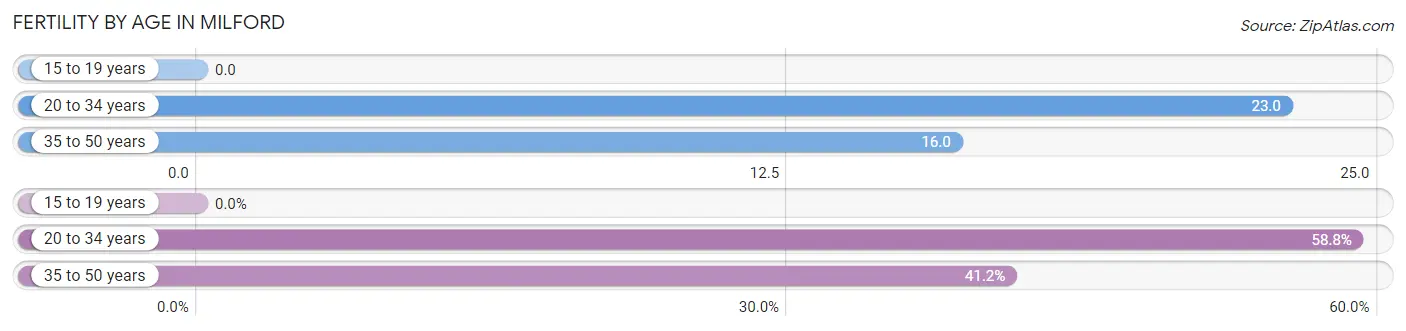
| Age Bracket | Women with Births | Births / 1,000 Women |
| 15 to 19 years | 0 (0.0%) | 0.0 |
| 20 to 34 years | 20 (58.8%) | 23.0 |
| 35 to 50 years | 14 (41.2%) | 16.0 |
| Total | 34 (100.0%) | 17.0 |
Fertility by Age by Marriage Status in Milford
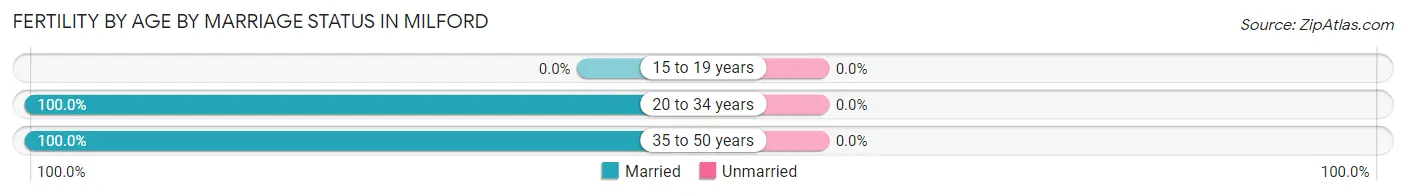
| Age Bracket | Married | Unmarried |
| 15 to 19 years | 0 (0.0%) | 0 (0.0%) |
| 20 to 34 years | 20 (100.0%) | 0 (0.0%) |
| 35 to 50 years | 14 (100.0%) | 0 (0.0%) |
| Total | 34 (100.0%) | 0 (0.0%) |
Fertility by Education in Milford
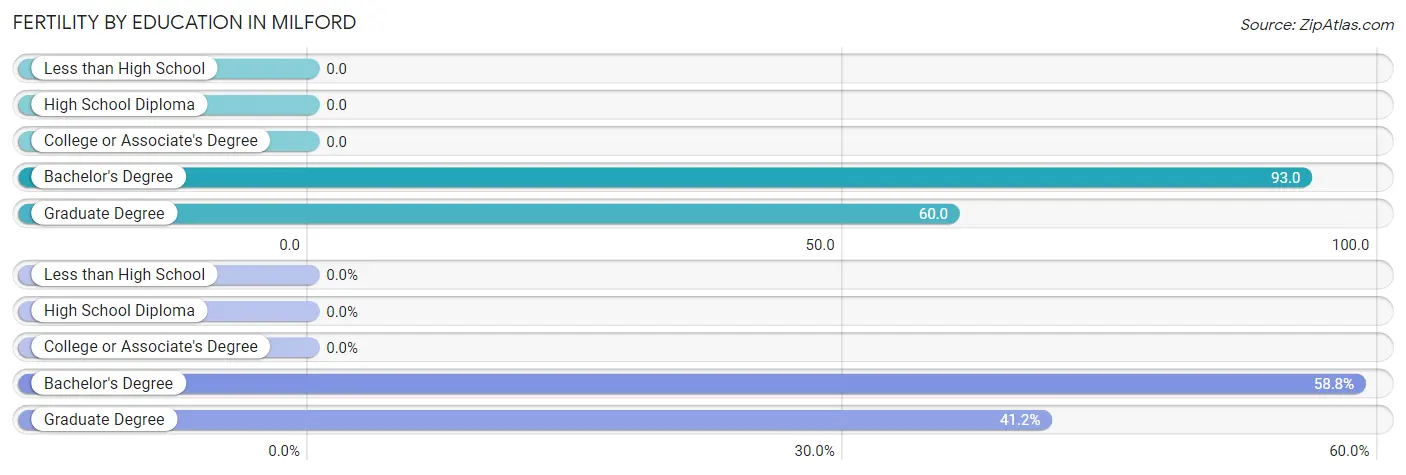
| Educational Attainment | Women with Births | Births / 1,000 Women |
| Less than High School | 0 (0.0%) | 0.0 |
| High School Diploma | 0 (0.0%) | 0.0 |
| College or Associate's Degree | 0 (0.0%) | 0.0 |
| Bachelor's Degree | 20 (58.8%) | 93.0 |
| Graduate Degree | 14 (41.2%) | 60.0 |
| Total | 34 (100.0%) | 17.0 |
Fertility by Education by Marriage Status in Milford
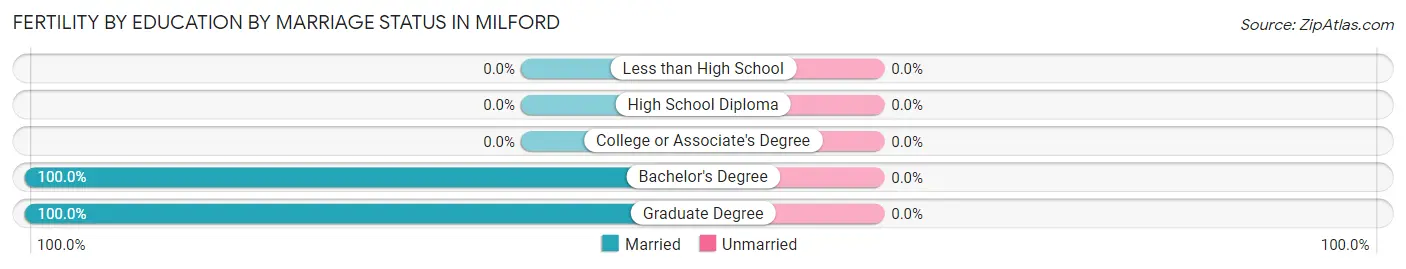
| Educational Attainment | Married | Unmarried |
| Less than High School | 0 (0.0%) | 0 (0.0%) |
| High School Diploma | 0 (0.0%) | 0 (0.0%) |
| College or Associate's Degree | 0 (0.0%) | 0 (0.0%) |
| Bachelor's Degree | 20 (100.0%) | 0 (0.0%) |
| Graduate Degree | 14 (100.0%) | 0 (0.0%) |
| Total | 34 (100.0%) | 0 (0.0%) |
Employment Characteristics in Milford
Employment by Class of Employer in Milford
Among the 4,461 employed individuals in Milford, private company employees (3,305 | 74.1%), not-for-profit organizations (352 | 7.9%), and self-employed (not incorporated) (283 | 6.3%) make up the most common classes of employment.
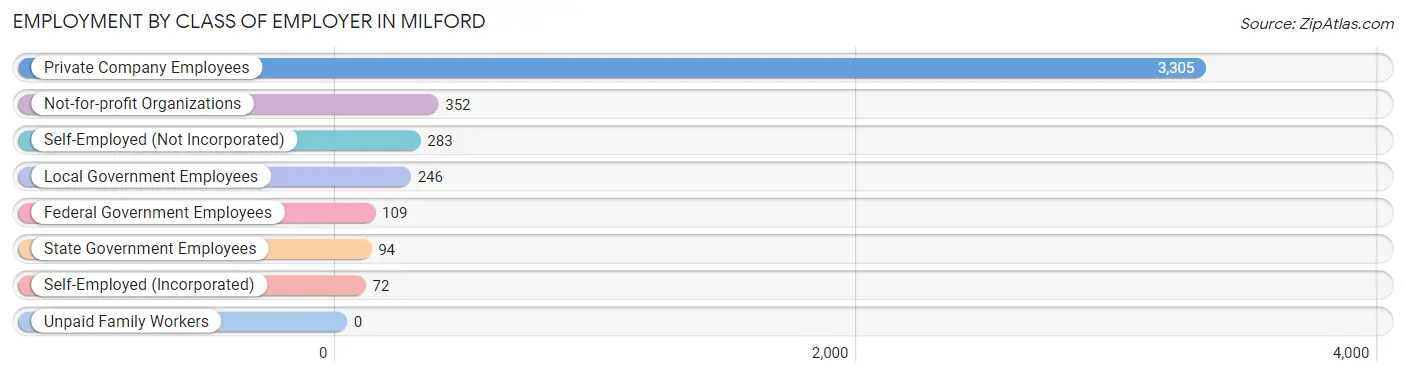
| Employer Class | # Employees | % Employees |
| Private Company Employees | 3,305 | 74.1% |
| Self-Employed (Incorporated) | 72 | 1.6% |
| Self-Employed (Not Incorporated) | 283 | 6.3% |
| Not-for-profit Organizations | 352 | 7.9% |
| Local Government Employees | 246 | 5.5% |
| State Government Employees | 94 | 2.1% |
| Federal Government Employees | 109 | 2.4% |
| Unpaid Family Workers | 0 | 0.0% |
| Total | 4,461 | 100.0% |
Employment Status by Age in Milford
According to the labor force statistics for Milford, out of the total population over 16 years of age (6,980), 69.4% or 4,844 individuals are in the labor force, with 4.9% or 237 of them unemployed. The age group with the highest labor force participation rate is 35 to 44 years, with 96.9% or 1,202 individuals in the labor force. Within the labor force, the 20 to 24 years age range has the highest percentage of unemployed individuals, with 15.8% or 71 of them being unemployed.
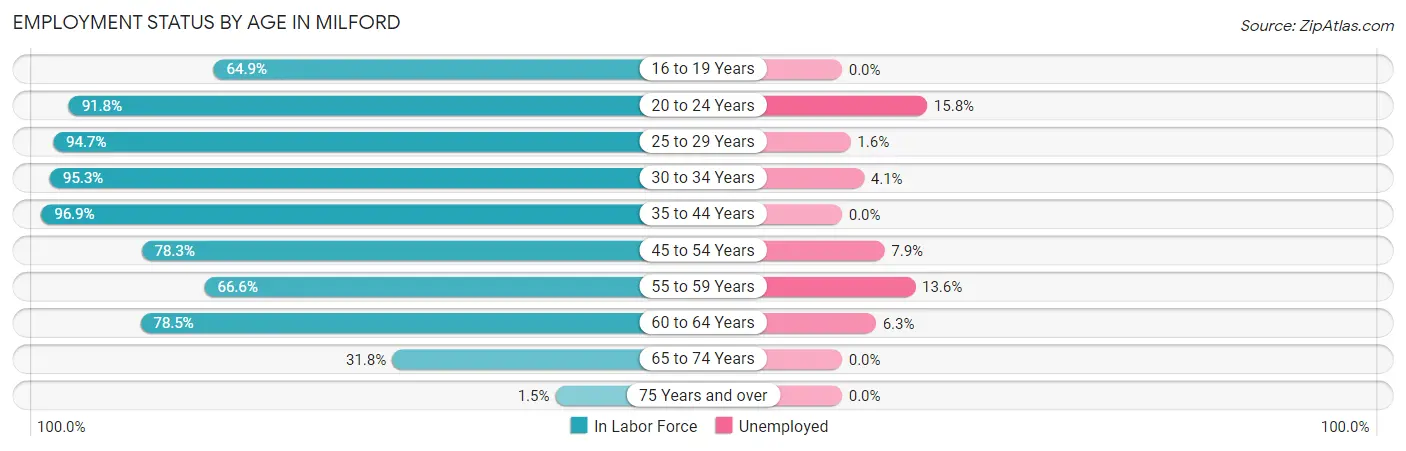
| Age Bracket | In Labor Force | Unemployed |
| 16 to 19 Years | 235 (64.9%) | 0 (0.0%) |
| 20 to 24 Years | 448 (91.8%) | 71 (15.8%) |
| 25 to 29 Years | 485 (94.7%) | 8 (1.6%) |
| 30 to 34 Years | 688 (95.3%) | 28 (4.1%) |
| 35 to 44 Years | 1,202 (96.9%) | 0 (0.0%) |
| 45 to 54 Years | 849 (78.3%) | 67 (7.9%) |
| 55 to 59 Years | 295 (66.6%) | 40 (13.6%) |
| 60 to 64 Years | 351 (78.5%) | 22 (6.3%) |
| 65 to 74 Years | 278 (31.8%) | 0 (0.0%) |
| 75 Years and over | 12 (1.5%) | 0 (0.0%) |
| Total | 4,844 (69.4%) | 237 (4.9%) |
Employment Status by Educational Attainment in Milford
According to labor force statistics for Milford, 87.0% of individuals (3,870) out of the total population between 25 and 64 years of age (4,448) are in the labor force, with 4.3% or 166 of them being unemployed. The group with the highest labor force participation rate are those with the educational attainment of bachelor's degree or higher, with 95.6% or 1,190 individuals in the labor force. Within the labor force, individuals with high school diploma education have the highest percentage of unemployment, with 9.7% or 119 of them being unemployed.
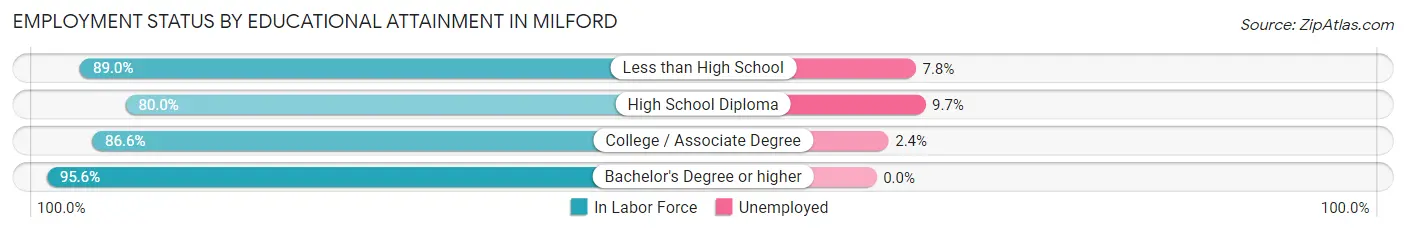
| Educational Attainment | In Labor Force | Unemployed |
| Less than High School | 218 (89.0%) | 19 (7.8%) |
| High School Diploma | 1,222 (80.0%) | 148 (9.7%) |
| College / Associate Degree | 1,239 (86.6%) | 34 (2.4%) |
| Bachelor's Degree or higher | 1,190 (95.6%) | 0 (0.0%) |
| Total | 3,870 (87.0%) | 191 (4.3%) |
Employment Occupations by Sex in Milford
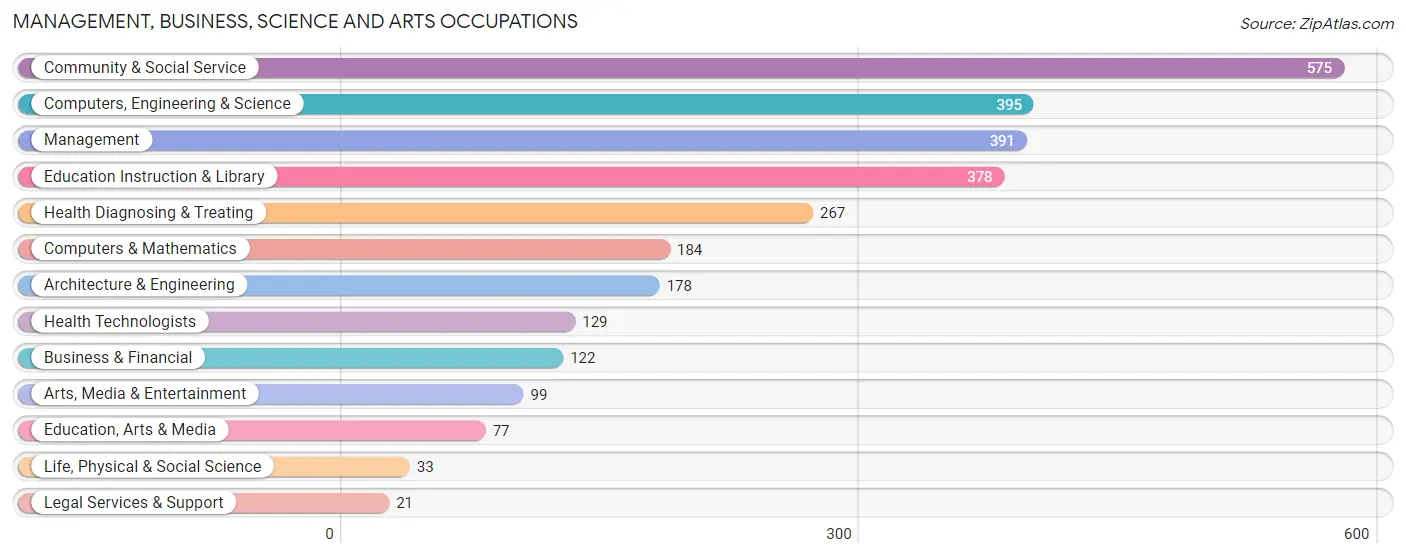
Management, Business, Science and Arts Occupations
The most common Management, Business, Science and Arts occupations in Milford are Community & Social Service (575 | 12.5%), Computers, Engineering & Science (395 | 8.6%), Management (391 | 8.5%), Education Instruction & Library (378 | 8.2%), and Health Diagnosing & Treating (267 | 5.8%).
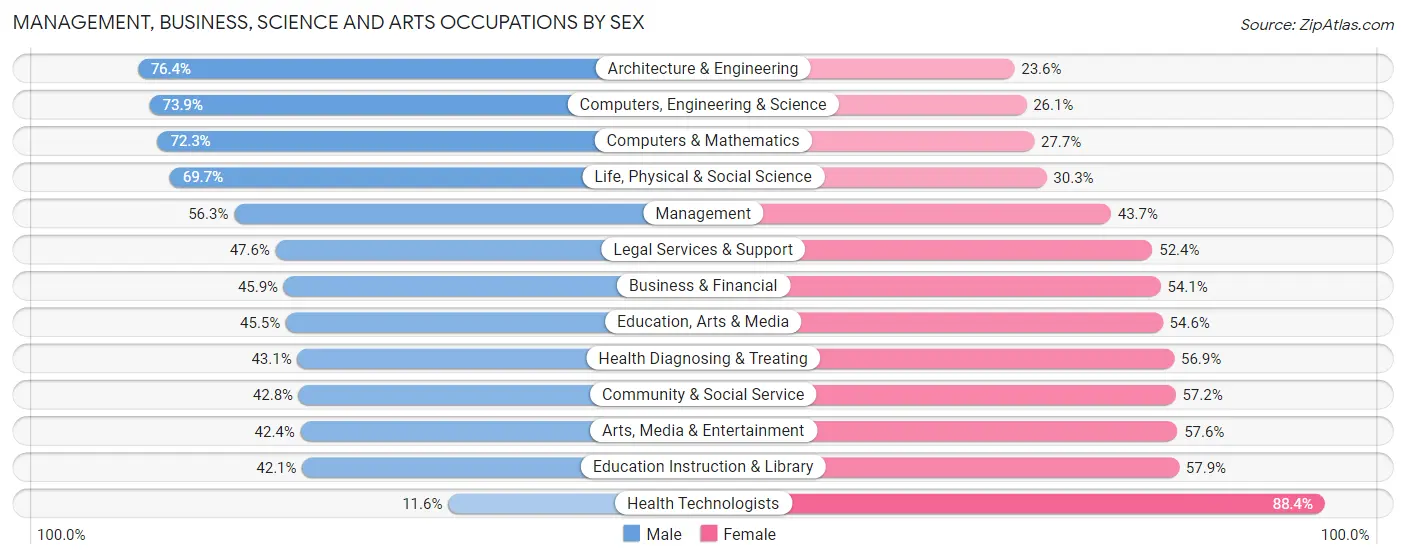
Management, Business, Science and Arts Occupations by Sex
Within the Management, Business, Science and Arts occupations in Milford, the most male-oriented occupations are Architecture & Engineering (76.4%), Computers, Engineering & Science (73.9%), and Computers & Mathematics (72.3%), while the most female-oriented occupations are Health Technologists (88.4%), Education Instruction & Library (57.9%), and Arts, Media & Entertainment (57.6%).
| Occupation | Male | Female |
| Management | 220 (56.3%) | 171 (43.7%) |
| Business & Financial | 56 (45.9%) | 66 (54.1%) |
| Computers, Engineering & Science | 292 (73.9%) | 103 (26.1%) |
| Computers & Mathematics | 133 (72.3%) | 51 (27.7%) |
| Architecture & Engineering | 136 (76.4%) | 42 (23.6%) |
| Life, Physical & Social Science | 23 (69.7%) | 10 (30.3%) |
| Community & Social Service | 246 (42.8%) | 329 (57.2%) |
| Education, Arts & Media | 35 (45.5%) | 42 (54.5%) |
| Legal Services & Support | 10 (47.6%) | 11 (52.4%) |
| Education Instruction & Library | 159 (42.1%) | 219 (57.9%) |
| Arts, Media & Entertainment | 42 (42.4%) | 57 (57.6%) |
| Health Diagnosing & Treating | 115 (43.1%) | 152 (56.9%) |
| Health Technologists | 15 (11.6%) | 114 (88.4%) |
| Total (Category) | 929 (53.1%) | 821 (46.9%) |
| Total (Overall) | 2,270 (49.3%) | 2,336 (50.7%) |
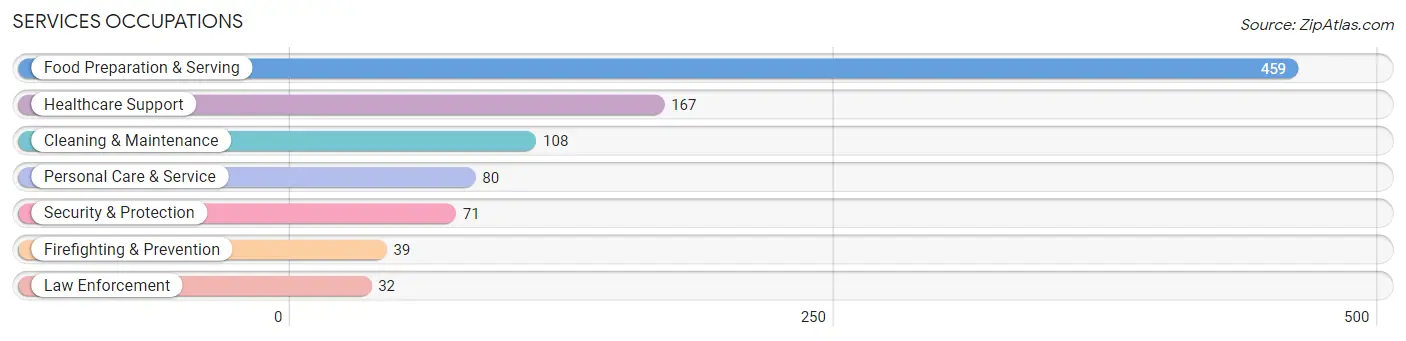
Services Occupations
The most common Services occupations in Milford are Food Preparation & Serving (459 | 10.0%), Healthcare Support (167 | 3.6%), Cleaning & Maintenance (108 | 2.3%), Personal Care & Service (80 | 1.7%), and Security & Protection (71 | 1.5%).
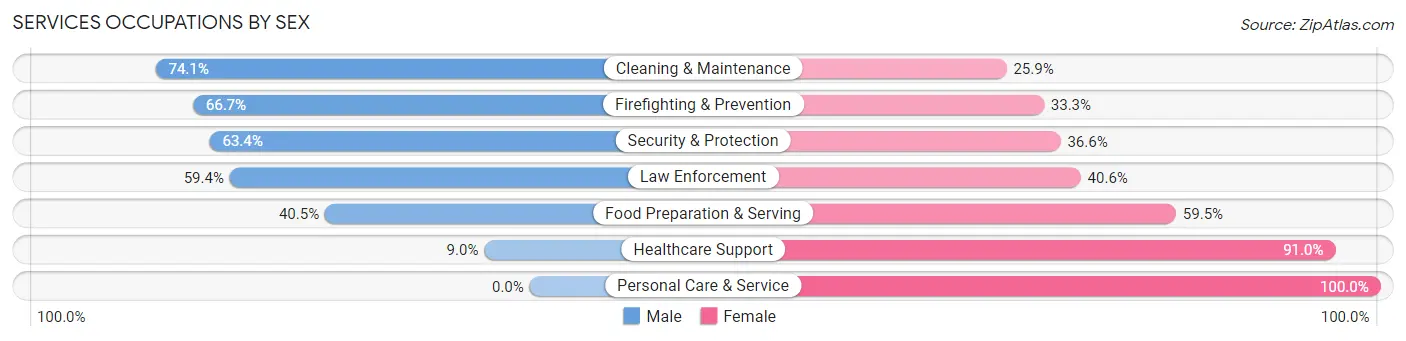
Services Occupations by Sex
Within the Services occupations in Milford, the most male-oriented occupations are Cleaning & Maintenance (74.1%), Firefighting & Prevention (66.7%), and Security & Protection (63.4%), while the most female-oriented occupations are Personal Care & Service (100.0%), Healthcare Support (91.0%), and Food Preparation & Serving (59.5%).
| Occupation | Male | Female |
| Healthcare Support | 15 (9.0%) | 152 (91.0%) |
| Security & Protection | 45 (63.4%) | 26 (36.6%) |
| Firefighting & Prevention | 26 (66.7%) | 13 (33.3%) |
| Law Enforcement | 19 (59.4%) | 13 (40.6%) |
| Food Preparation & Serving | 186 (40.5%) | 273 (59.5%) |
| Cleaning & Maintenance | 80 (74.1%) | 28 (25.9%) |
| Personal Care & Service | 0 (0.0%) | 80 (100.0%) |
| Total (Category) | 326 (36.8%) | 559 (63.2%) |
| Total (Overall) | 2,270 (49.3%) | 2,336 (50.7%) |
Sales and Office Occupations
The most common Sales and Office occupations in Milford are Office & Administration (598 | 13.0%), and Sales & Related (442 | 9.6%).
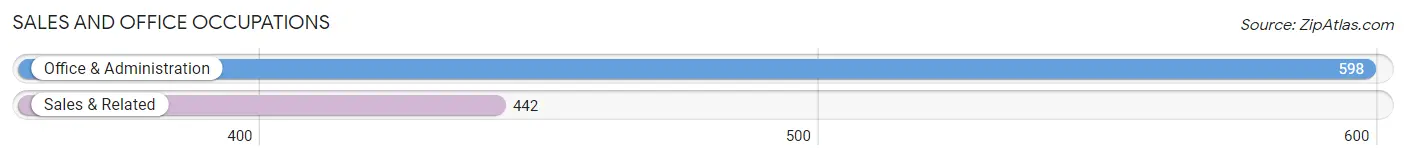
Sales and Office Occupations by Sex
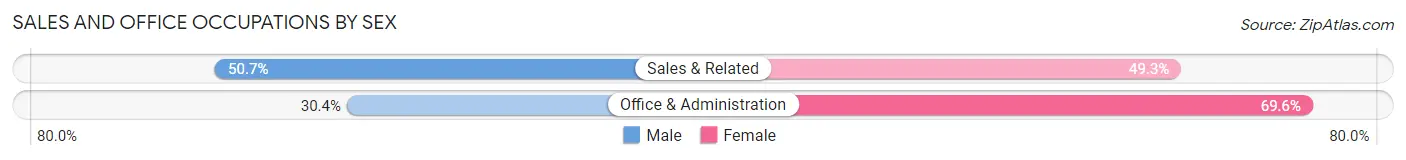
| Occupation | Male | Female |
| Sales & Related | 224 (50.7%) | 218 (49.3%) |
| Office & Administration | 182 (30.4%) | 416 (69.6%) |
| Total (Category) | 406 (39.0%) | 634 (61.0%) |
| Total (Overall) | 2,270 (49.3%) | 2,336 (50.7%) |
Natural Resources, Construction and Maintenance Occupations
The most common Natural Resources, Construction and Maintenance occupations in Milford are Construction & Extraction (226 | 4.9%), Installation, Maintenance & Repair (31 | 0.7%), and Farming, Fishing & Forestry (30 | 0.6%).
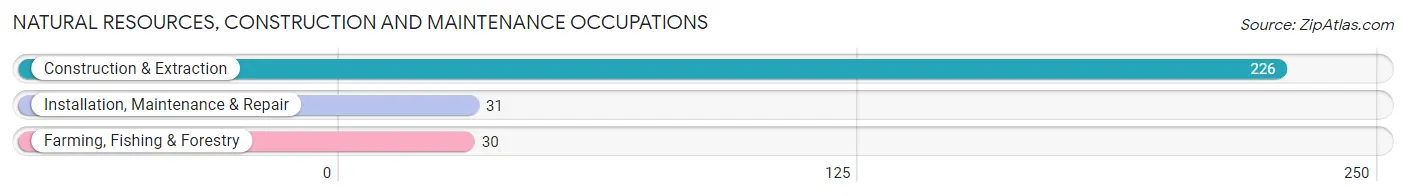
Natural Resources, Construction and Maintenance Occupations by Sex
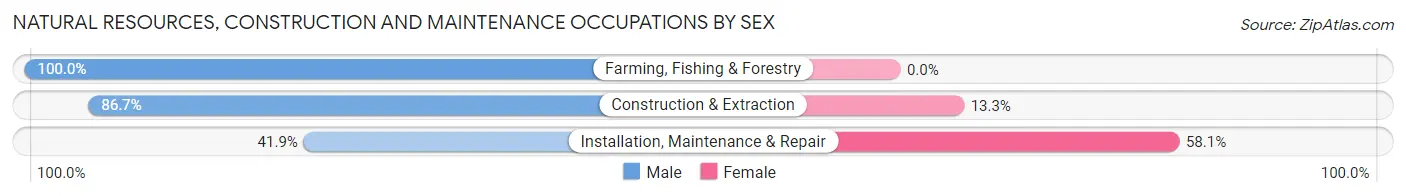
| Occupation | Male | Female |
| Farming, Fishing & Forestry | 30 (100.0%) | 0 (0.0%) |
| Construction & Extraction | 196 (86.7%) | 30 (13.3%) |
| Installation, Maintenance & Repair | 13 (41.9%) | 18 (58.1%) |
| Total (Category) | 239 (83.3%) | 48 (16.7%) |
| Total (Overall) | 2,270 (49.3%) | 2,336 (50.7%) |
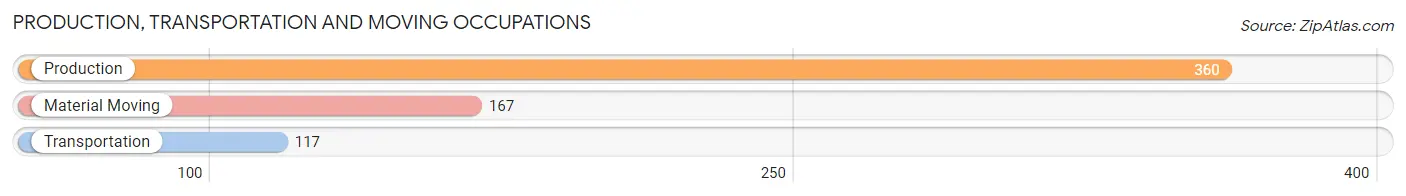
Production, Transportation and Moving Occupations
The most common Production, Transportation and Moving occupations in Milford are Production (360 | 7.8%), Material Moving (167 | 3.6%), and Transportation (117 | 2.5%).
Production, Transportation and Moving Occupations by Sex
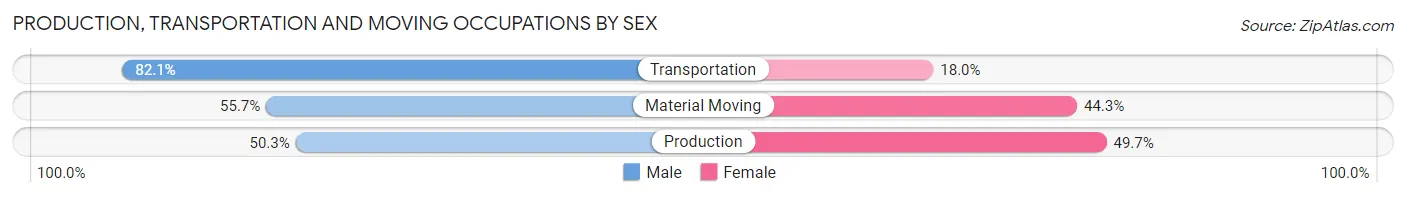
| Occupation | Male | Female |
| Production | 181 (50.3%) | 179 (49.7%) |
| Transportation | 96 (82.1%) | 21 (17.9%) |
| Material Moving | 93 (55.7%) | 74 (44.3%) |
| Total (Category) | 370 (57.5%) | 274 (42.5%) |
| Total (Overall) | 2,270 (49.3%) | 2,336 (50.7%) |
Employment Industries by Sex in Milford
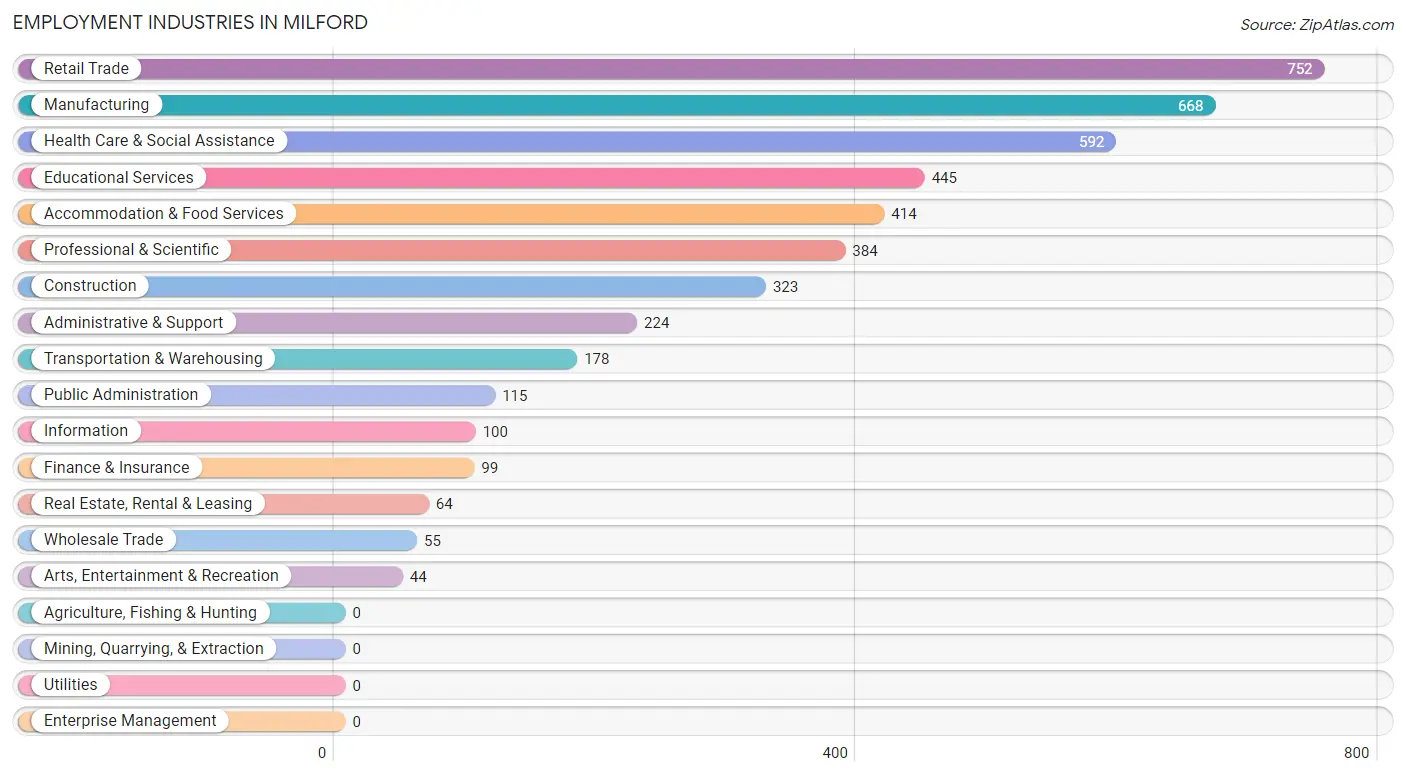
Employment Industries in Milford
The major employment industries in Milford include Retail Trade (752 | 16.3%), Manufacturing (668 | 14.5%), Health Care & Social Assistance (592 | 12.9%), Educational Services (445 | 9.7%), and Accommodation & Food Services (414 | 9.0%).
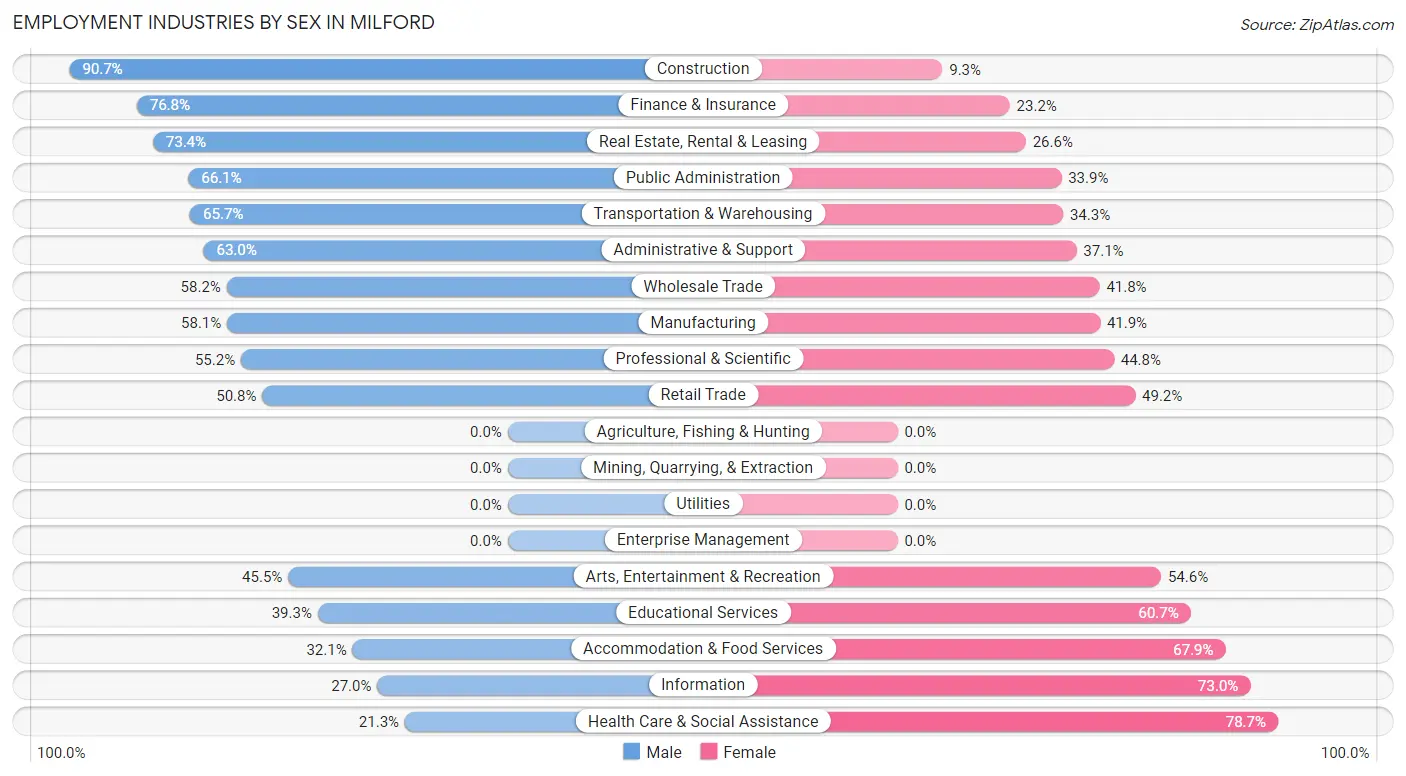
Employment Industries by Sex in Milford
The Milford industries that see more men than women are Construction (90.7%), Finance & Insurance (76.8%), and Real Estate, Rental & Leasing (73.4%), whereas the industries that tend to have a higher number of women are Health Care & Social Assistance (78.7%), Information (73.0%), and Accommodation & Food Services (67.9%).
| Industry | Male | Female |
| Agriculture, Fishing & Hunting | 0 (0.0%) | 0 (0.0%) |
| Mining, Quarrying, & Extraction | 0 (0.0%) | 0 (0.0%) |
| Construction | 293 (90.7%) | 30 (9.3%) |
| Manufacturing | 388 (58.1%) | 280 (41.9%) |
| Wholesale Trade | 32 (58.2%) | 23 (41.8%) |
| Retail Trade | 382 (50.8%) | 370 (49.2%) |
| Transportation & Warehousing | 117 (65.7%) | 61 (34.3%) |
| Utilities | 0 (0.0%) | 0 (0.0%) |
| Information | 27 (27.0%) | 73 (73.0%) |
| Finance & Insurance | 76 (76.8%) | 23 (23.2%) |
| Real Estate, Rental & Leasing | 47 (73.4%) | 17 (26.6%) |
| Professional & Scientific | 212 (55.2%) | 172 (44.8%) |
| Enterprise Management | 0 (0.0%) | 0 (0.0%) |
| Administrative & Support | 141 (62.9%) | 83 (37.0%) |
| Educational Services | 175 (39.3%) | 270 (60.7%) |
| Health Care & Social Assistance | 126 (21.3%) | 466 (78.7%) |
| Arts, Entertainment & Recreation | 20 (45.5%) | 24 (54.5%) |
| Accommodation & Food Services | 133 (32.1%) | 281 (67.9%) |
| Public Administration | 76 (66.1%) | 39 (33.9%) |
| Total | 2,270 (49.3%) | 2,336 (50.7%) |
Education in Milford
School Enrollment in Milford
The most common levels of schooling among the 1,774 students in Milford are middle school (438 | 24.7%), high school (330 | 18.6%), and college / undergraduate (297 | 16.7%).
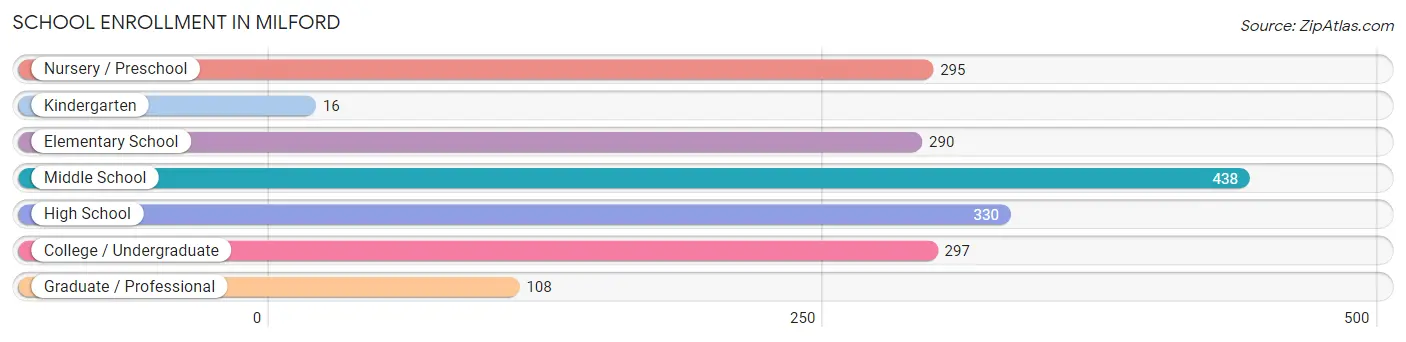
| School Level | # Students | % Students |
| Nursery / Preschool | 295 | 16.6% |
| Kindergarten | 16 | 0.9% |
| Elementary School | 290 | 16.4% |
| Middle School | 438 | 24.7% |
| High School | 330 | 18.6% |
| College / Undergraduate | 297 | 16.7% |
| Graduate / Professional | 108 | 6.1% |
| Total | 1,774 | 100.0% |
School Enrollment by Age by Funding Source in Milford
Out of a total of 1,774 students who are enrolled in schools in Milford, 406 (22.9%) attend a private institution, while the remaining 1,368 (77.1%) are enrolled in public schools. The age group of 3 to 4 year olds has the highest likelihood of being enrolled in private schools, with 239 (83.3% in the age bracket) enrolled. Conversely, the age group of 25 to 34 year olds has the lowest likelihood of being enrolled in a private school, with 73 (100.0% in the age bracket) attending a public institution.
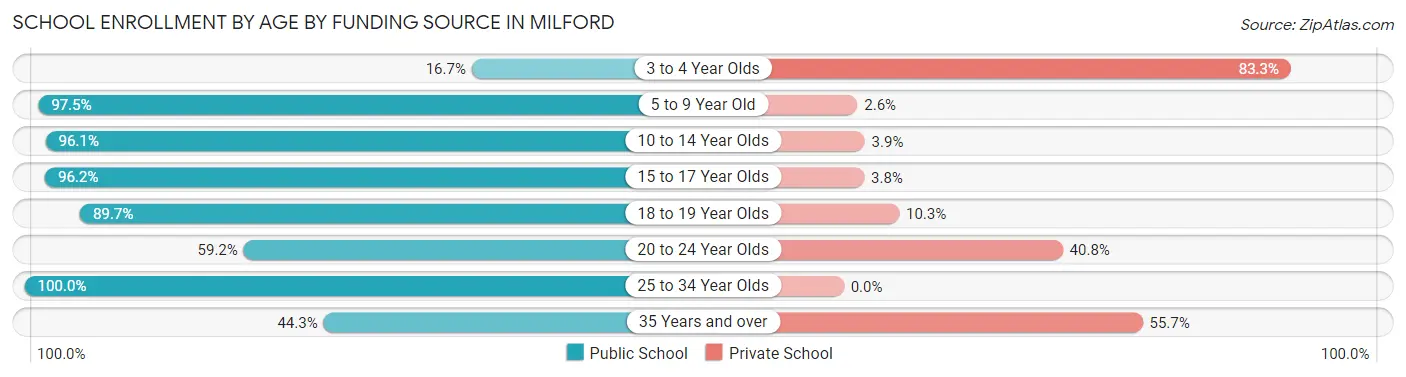
| Age Bracket | Public School | Private School |
| 3 to 4 Year Olds | 48 (16.7%) | 239 (83.3%) |
| 5 to 9 Year Old | 306 (97.5%) | 8 (2.5%) |
| 10 to 14 Year Olds | 442 (96.1%) | 18 (3.9%) |
| 15 to 17 Year Olds | 227 (96.2%) | 9 (3.8%) |
| 18 to 19 Year Olds | 139 (89.7%) | 16 (10.3%) |
| 20 to 24 Year Olds | 90 (59.2%) | 62 (40.8%) |
| 25 to 34 Year Olds | 73 (100.0%) | 0 (0.0%) |
| 35 Years and over | 43 (44.3%) | 54 (55.7%) |
| Total | 1,368 (77.1%) | 406 (22.9%) |
Educational Attainment by Field of Study in Milford
Business (375 | 18.4%), education (280 | 13.7%), liberal arts & history (229 | 11.2%), visual & performing arts (173 | 8.5%), and arts & humanities (162 | 7.9%) are the most common fields of study among 2,042 individuals in Milford who have obtained a bachelor's degree or higher.
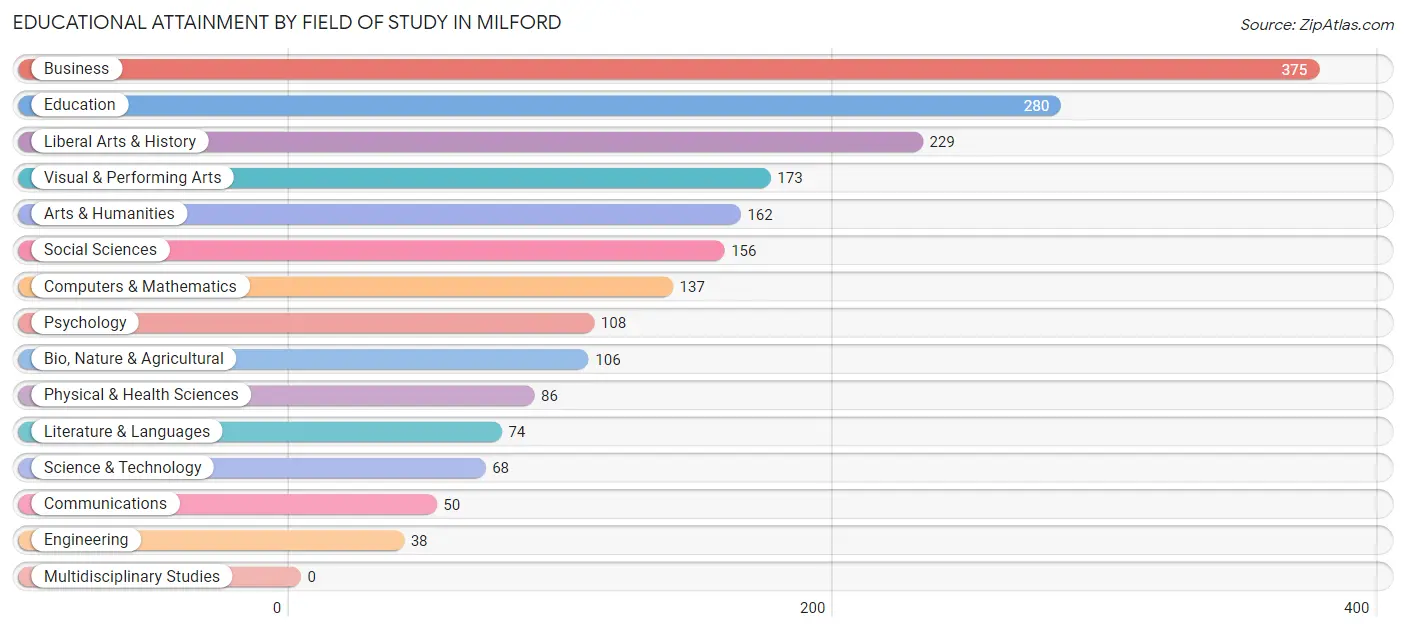
| Field of Study | # Graduates | % Graduates |
| Computers & Mathematics | 137 | 6.7% |
| Bio, Nature & Agricultural | 106 | 5.2% |
| Physical & Health Sciences | 86 | 4.2% |
| Psychology | 108 | 5.3% |
| Social Sciences | 156 | 7.6% |
| Engineering | 38 | 1.9% |
| Multidisciplinary Studies | 0 | 0.0% |
| Science & Technology | 68 | 3.3% |
| Business | 375 | 18.4% |
| Education | 280 | 13.7% |
| Literature & Languages | 74 | 3.6% |
| Liberal Arts & History | 229 | 11.2% |
| Visual & Performing Arts | 173 | 8.5% |
| Communications | 50 | 2.5% |
| Arts & Humanities | 162 | 7.9% |
| Total | 2,042 | 100.0% |
Transportation & Commute in Milford
Vehicle Availability by Sex in Milford
The most prevalent vehicle ownership categories in Milford are males with 2 vehicles (1,268, accounting for 58.7%) and females with 2 vehicles (1,002, making up 55.1%).
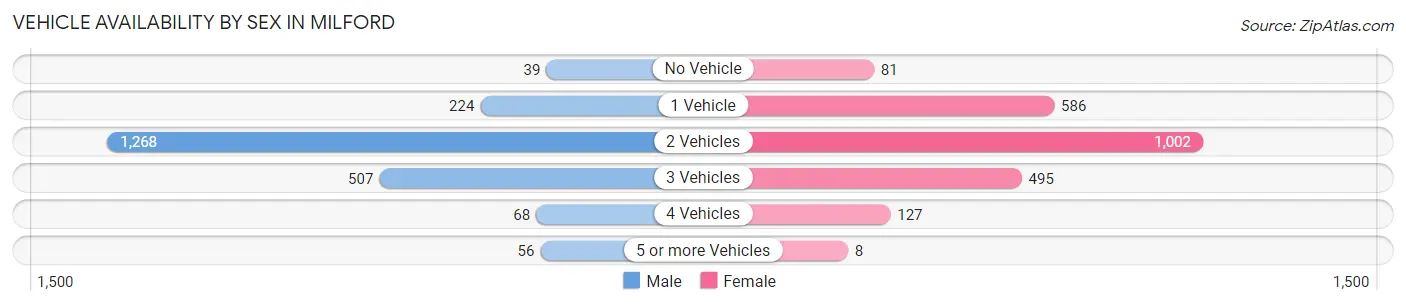
| Vehicles Available | Male | Female |
| No Vehicle | 39 (1.8%) | 81 (3.5%) |
| 1 Vehicle | 224 (10.4%) | 586 (25.5%) |
| 2 Vehicles | 1,268 (58.7%) | 1,002 (43.6%) |
| 3 Vehicles | 507 (23.4%) | 495 (21.5%) |
| 4 Vehicles | 68 (3.2%) | 127 (5.5%) |
| 5 or more Vehicles | 56 (2.6%) | 8 (0.4%) |
| Total | 2,162 (100.0%) | 2,299 (100.0%) |
Commute Time in Milford
The most frequently occuring commute durations in Milford are 5 to 9 minutes (596 commuters, 14.6%), 10 to 14 minutes (476 commuters, 11.6%), and 30 to 34 minutes (416 commuters, 10.2%).
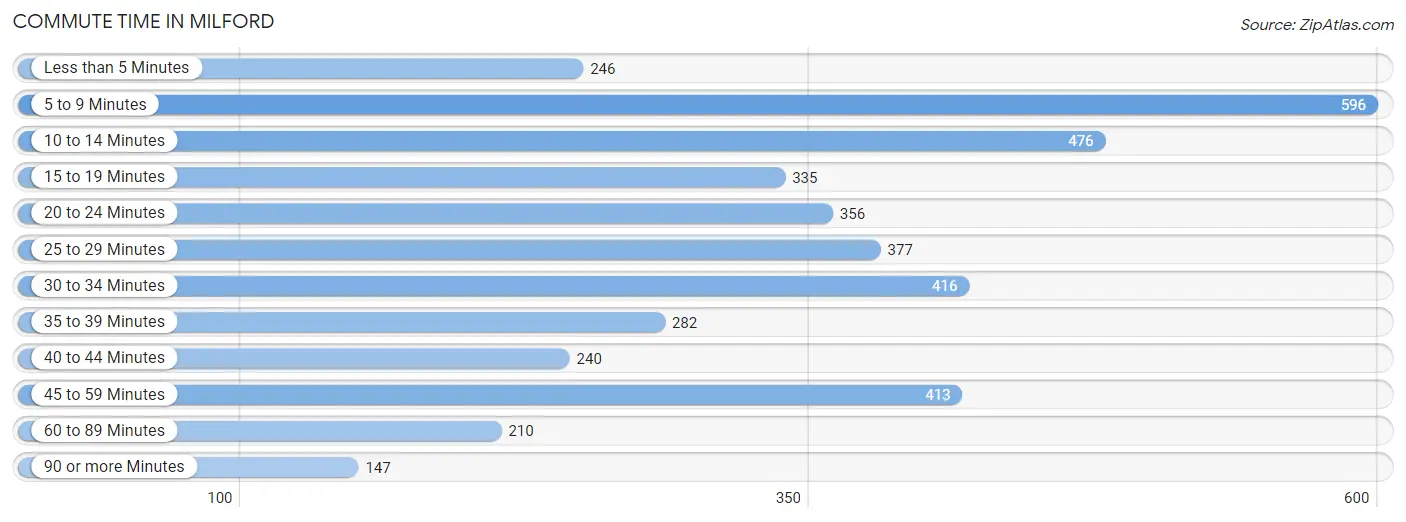
| Commute Time | # Commuters | % Commuters |
| Less than 5 Minutes | 246 | 6.0% |
| 5 to 9 Minutes | 596 | 14.6% |
| 10 to 14 Minutes | 476 | 11.6% |
| 15 to 19 Minutes | 335 | 8.2% |
| 20 to 24 Minutes | 356 | 8.7% |
| 25 to 29 Minutes | 377 | 9.2% |
| 30 to 34 Minutes | 416 | 10.2% |
| 35 to 39 Minutes | 282 | 6.9% |
| 40 to 44 Minutes | 240 | 5.9% |
| 45 to 59 Minutes | 413 | 10.1% |
| 60 to 89 Minutes | 210 | 5.1% |
| 90 or more Minutes | 147 | 3.6% |
Commute Time by Sex in Milford
The most common commute times in Milford are 5 to 9 minutes (237 commuters, 11.7%) for males and 5 to 9 minutes (359 commuters, 17.4%) for females.
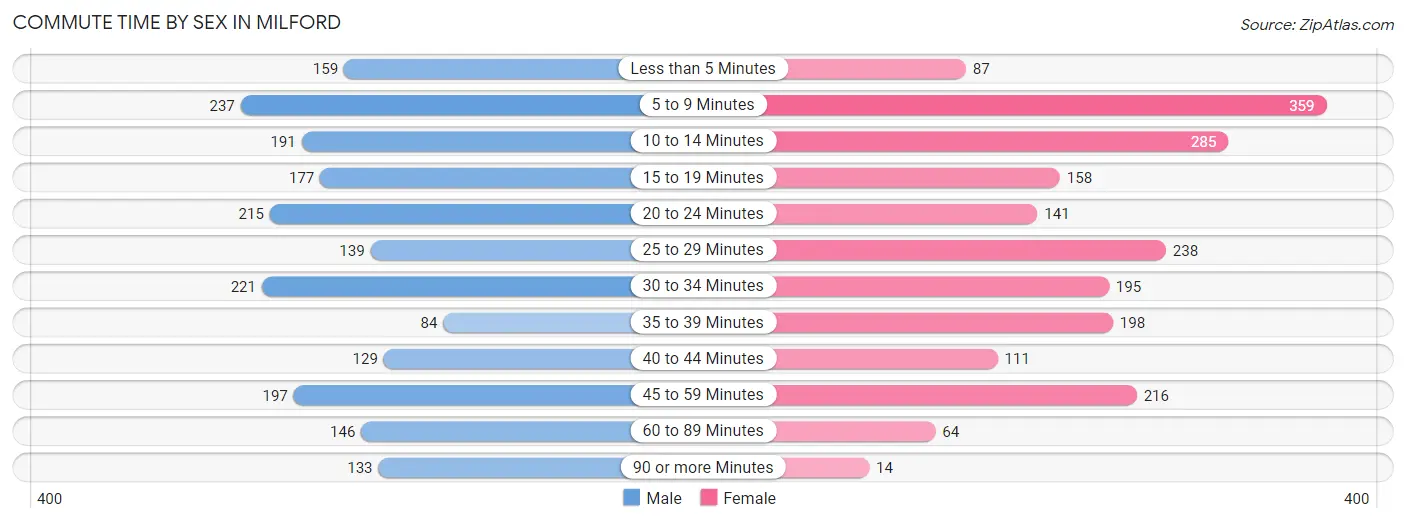
| Commute Time | Male | Female |
| Less than 5 Minutes | 159 (7.8%) | 87 (4.2%) |
| 5 to 9 Minutes | 237 (11.7%) | 359 (17.4%) |
| 10 to 14 Minutes | 191 (9.4%) | 285 (13.8%) |
| 15 to 19 Minutes | 177 (8.7%) | 158 (7.6%) |
| 20 to 24 Minutes | 215 (10.6%) | 141 (6.8%) |
| 25 to 29 Minutes | 139 (6.9%) | 238 (11.5%) |
| 30 to 34 Minutes | 221 (10.9%) | 195 (9.4%) |
| 35 to 39 Minutes | 84 (4.1%) | 198 (9.6%) |
| 40 to 44 Minutes | 129 (6.4%) | 111 (5.4%) |
| 45 to 59 Minutes | 197 (9.7%) | 216 (10.4%) |
| 60 to 89 Minutes | 146 (7.2%) | 64 (3.1%) |
| 90 or more Minutes | 133 (6.6%) | 14 (0.7%) |
Time of Departure to Work by Sex in Milford
The most frequent times of departure to work in Milford are 7:00 AM to 7:29 AM (318, 15.7%) for males and 7:30 AM to 7:59 AM (266, 12.9%) for females.
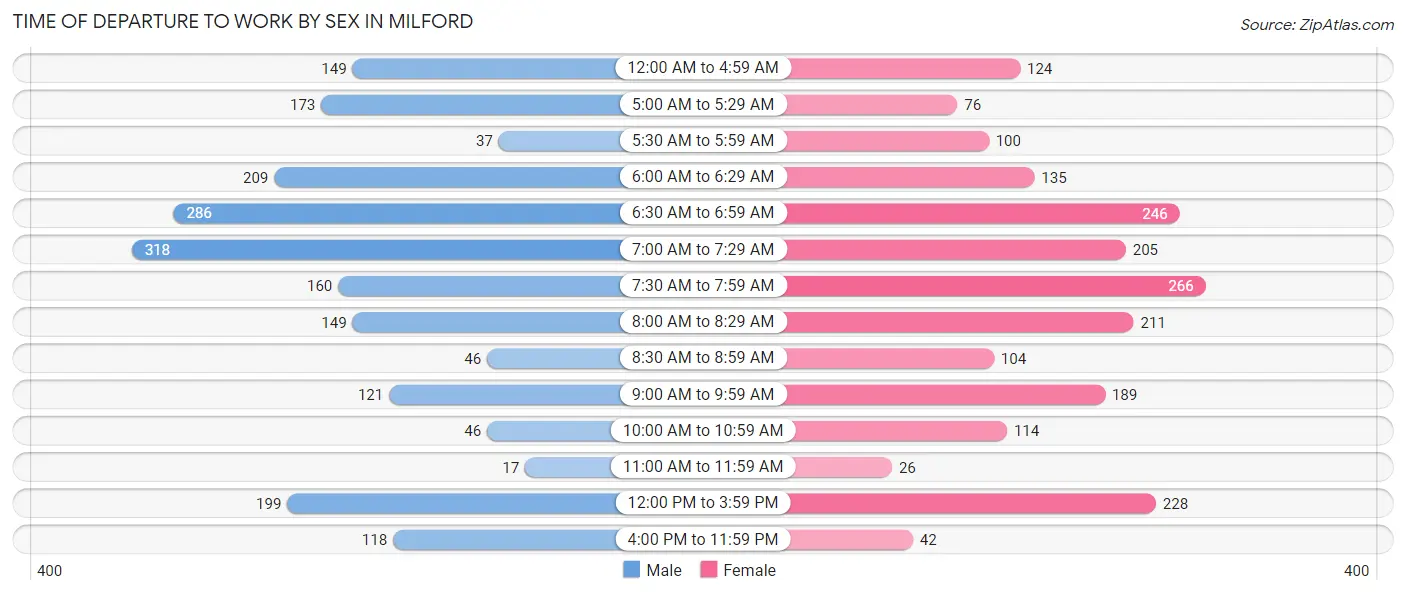
| Time of Departure | Male | Female |
| 12:00 AM to 4:59 AM | 149 (7.3%) | 124 (6.0%) |
| 5:00 AM to 5:29 AM | 173 (8.5%) | 76 (3.7%) |
| 5:30 AM to 5:59 AM | 37 (1.8%) | 100 (4.8%) |
| 6:00 AM to 6:29 AM | 209 (10.3%) | 135 (6.5%) |
| 6:30 AM to 6:59 AM | 286 (14.1%) | 246 (11.9%) |
| 7:00 AM to 7:29 AM | 318 (15.7%) | 205 (9.9%) |
| 7:30 AM to 7:59 AM | 160 (7.9%) | 266 (12.9%) |
| 8:00 AM to 8:29 AM | 149 (7.3%) | 211 (10.2%) |
| 8:30 AM to 8:59 AM | 46 (2.3%) | 104 (5.0%) |
| 9:00 AM to 9:59 AM | 121 (6.0%) | 189 (9.1%) |
| 10:00 AM to 10:59 AM | 46 (2.3%) | 114 (5.5%) |
| 11:00 AM to 11:59 AM | 17 (0.8%) | 26 (1.3%) |
| 12:00 PM to 3:59 PM | 199 (9.8%) | 228 (11.0%) |
| 4:00 PM to 11:59 PM | 118 (5.8%) | 42 (2.0%) |
| Total | 2,028 (100.0%) | 2,066 (100.0%) |
Housing Occupancy in Milford
Occupancy by Ownership in Milford
Of the total 3,700 dwellings in Milford, owner-occupied units account for 2,091 (56.5%), while renter-occupied units make up 1,609 (43.5%).
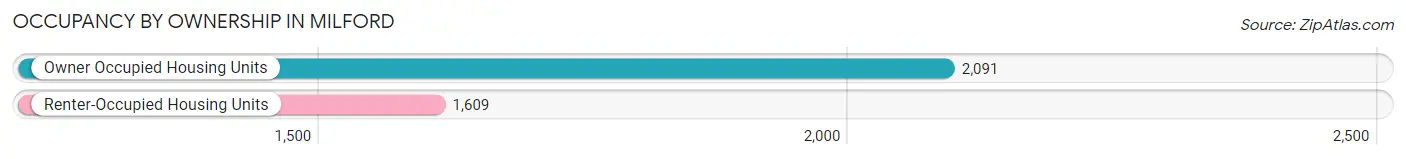
| Occupancy | # Housing Units | % Housing Units |
| Owner Occupied Housing Units | 2,091 | 56.5% |
| Renter-Occupied Housing Units | 1,609 | 43.5% |
| Total Occupied Housing Units | 3,700 | 100.0% |
Occupancy by Household Size in Milford
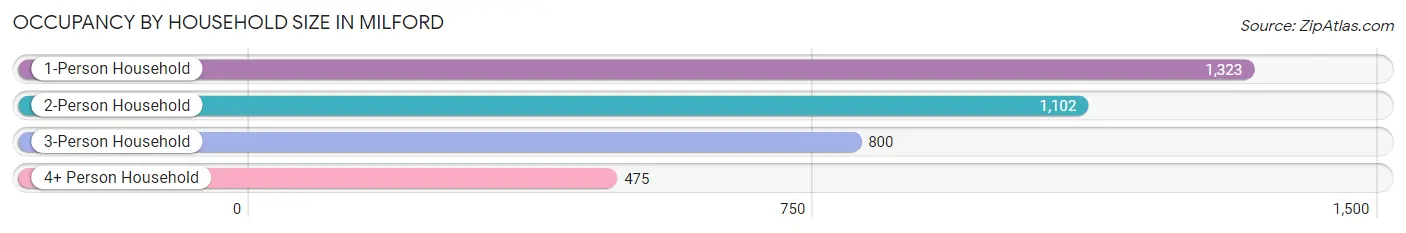
| Household Size | # Housing Units | % Housing Units |
| 1-Person Household | 1,323 | 35.8% |
| 2-Person Household | 1,102 | 29.8% |
| 3-Person Household | 800 | 21.6% |
| 4+ Person Household | 475 | 12.8% |
| Total Housing Units | 3,700 | 100.0% |
Occupancy by Ownership by Household Size in Milford
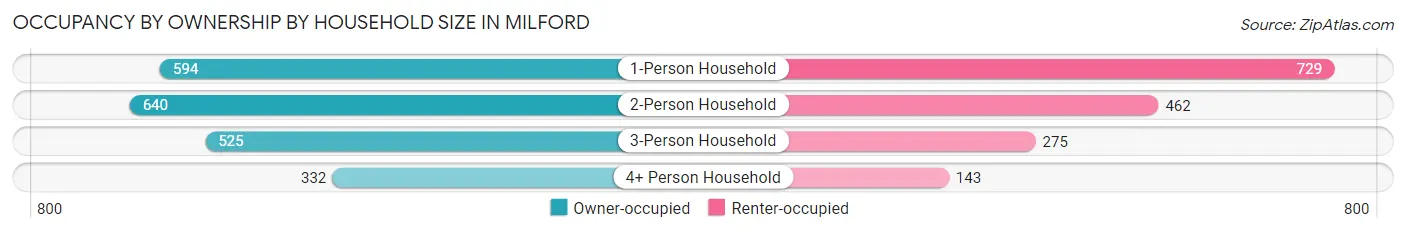
| Household Size | Owner-occupied | Renter-occupied |
| 1-Person Household | 594 (44.9%) | 729 (55.1%) |
| 2-Person Household | 640 (58.1%) | 462 (41.9%) |
| 3-Person Household | 525 (65.6%) | 275 (34.4%) |
| 4+ Person Household | 332 (69.9%) | 143 (30.1%) |
| Total Housing Units | 2,091 (56.5%) | 1,609 (43.5%) |
Occupancy by Educational Attainment in Milford
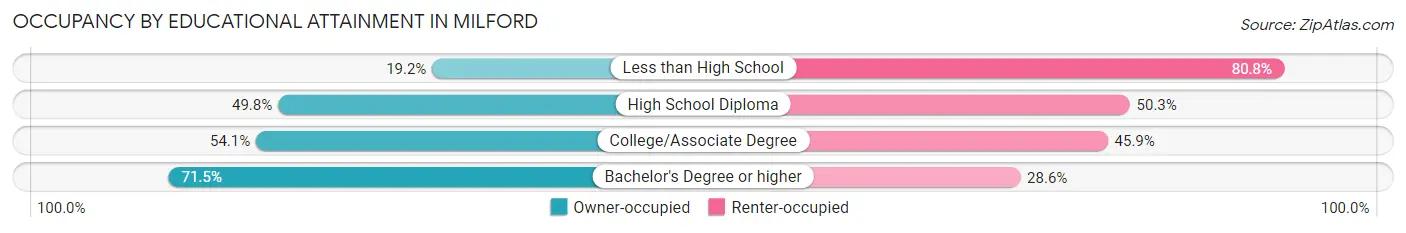
| Household Size | Owner-occupied | Renter-occupied |
| Less than High School | 33 (19.2%) | 139 (80.8%) |
| High School Diploma | 602 (49.7%) | 608 (50.2%) |
| College/Associate Degree | 625 (54.1%) | 530 (45.9%) |
| Bachelor's Degree or higher | 831 (71.5%) | 332 (28.5%) |
Occupancy by Age of Householder in Milford
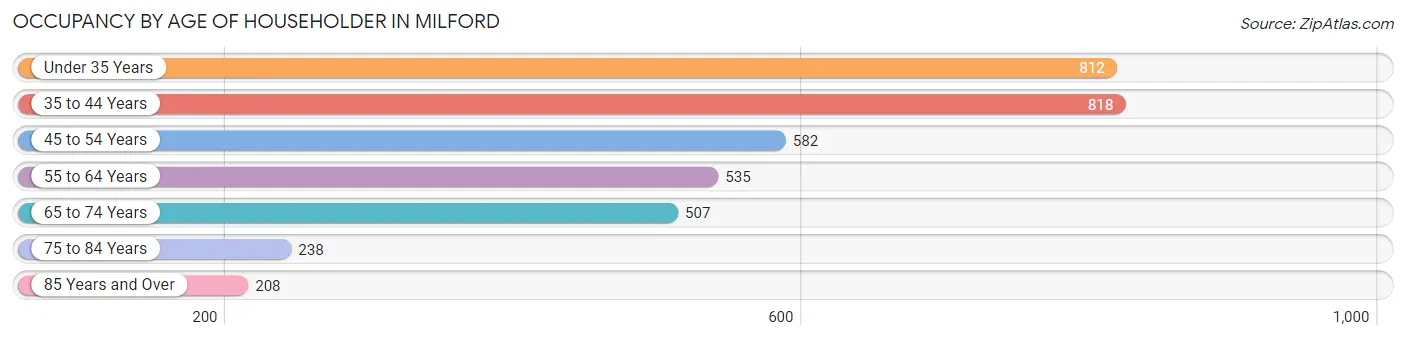
| Age Bracket | # Households | % Households |
| Under 35 Years | 812 | 22.0% |
| 35 to 44 Years | 818 | 22.1% |
| 45 to 54 Years | 582 | 15.7% |
| 55 to 64 Years | 535 | 14.5% |
| 65 to 74 Years | 507 | 13.7% |
| 75 to 84 Years | 238 | 6.4% |
| 85 Years and Over | 208 | 5.6% |
| Total | 3,700 | 100.0% |
Housing Finances in Milford
Median Income by Occupancy in Milford
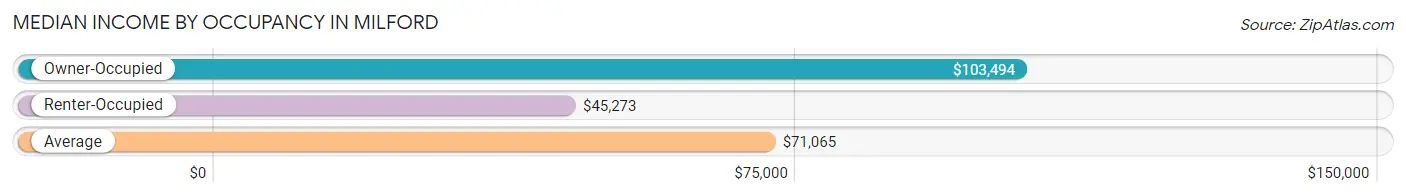
| Occupancy Type | # Households | Median Income |
| Owner-Occupied | 2,091 (56.5%) | $103,494 |
| Renter-Occupied | 1,609 (43.5%) | $45,273 |
| Average | 3,700 (100.0%) | $71,065 |
Occupancy by Householder Income Bracket in Milford
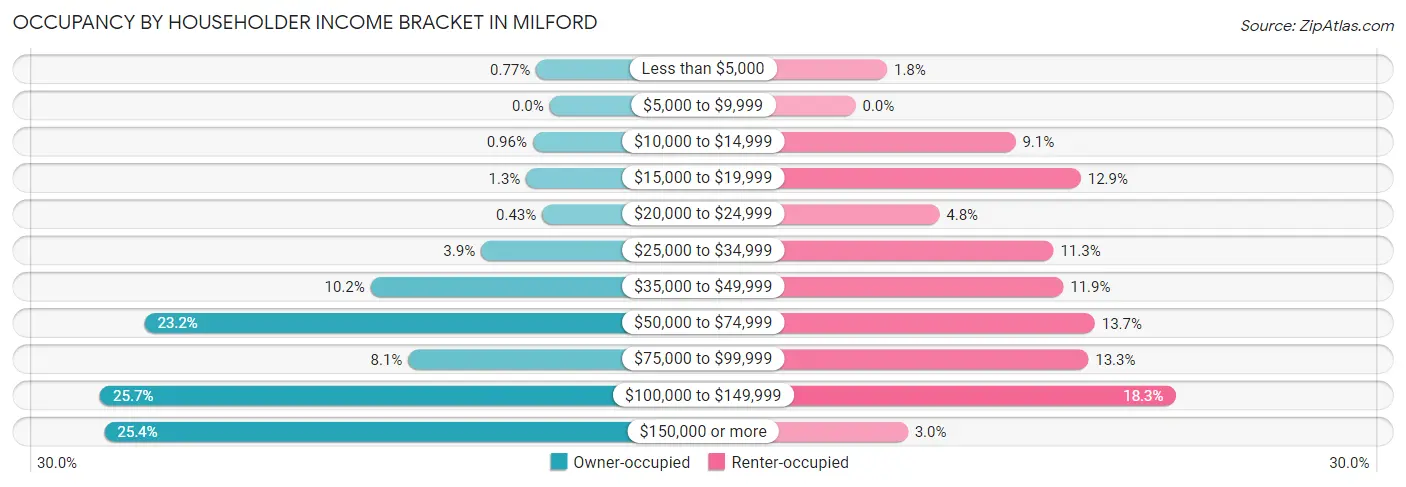
| Income Bracket | Owner-occupied | Renter-occupied |
| Less than $5,000 | 16 (0.8%) | 29 (1.8%) |
| $5,000 to $9,999 | 0 (0.0%) | 0 (0.0%) |
| $10,000 to $14,999 | 20 (1.0%) | 147 (9.1%) |
| $15,000 to $19,999 | 28 (1.3%) | 207 (12.9%) |
| $20,000 to $24,999 | 9 (0.4%) | 77 (4.8%) |
| $25,000 to $34,999 | 82 (3.9%) | 182 (11.3%) |
| $35,000 to $49,999 | 214 (10.2%) | 191 (11.9%) |
| $50,000 to $74,999 | 484 (23.2%) | 220 (13.7%) |
| $75,000 to $99,999 | 169 (8.1%) | 214 (13.3%) |
| $100,000 to $149,999 | 537 (25.7%) | 294 (18.3%) |
| $150,000 or more | 532 (25.4%) | 48 (3.0%) |
| Total | 2,091 (100.0%) | 1,609 (100.0%) |
Monthly Housing Cost Tiers in Milford
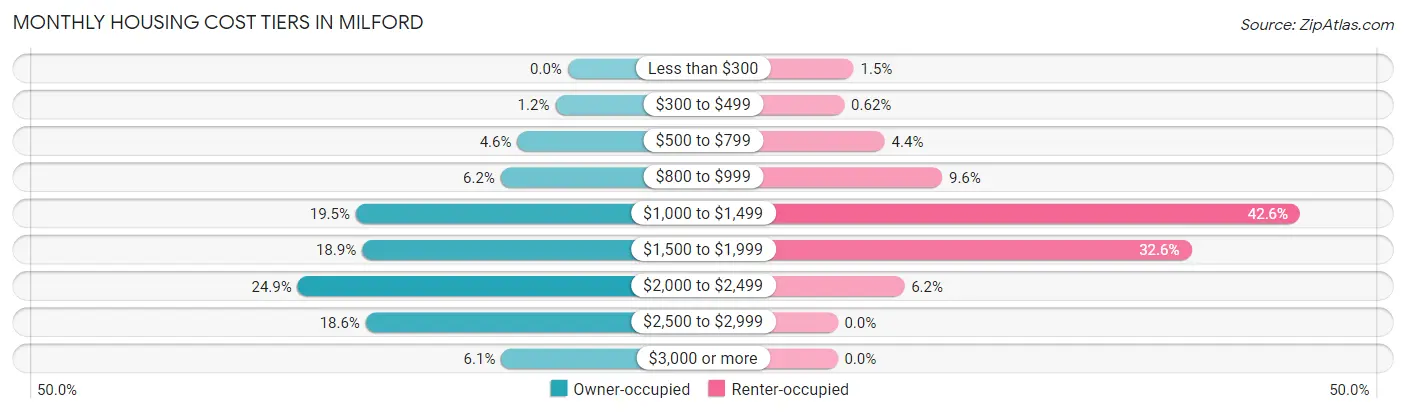
| Monthly Cost | Owner-occupied | Renter-occupied |
| Less than $300 | 0 (0.0%) | 24 (1.5%) |
| $300 to $499 | 24 (1.1%) | 10 (0.6%) |
| $500 to $799 | 97 (4.6%) | 70 (4.3%) |
| $800 to $999 | 129 (6.2%) | 155 (9.6%) |
| $1,000 to $1,499 | 408 (19.5%) | 685 (42.6%) |
| $1,500 to $1,999 | 396 (18.9%) | 524 (32.6%) |
| $2,000 to $2,499 | 520 (24.9%) | 99 (6.1%) |
| $2,500 to $2,999 | 389 (18.6%) | 0 (0.0%) |
| $3,000 or more | 128 (6.1%) | 0 (0.0%) |
| Total | 2,091 (100.0%) | 1,609 (100.0%) |
Physical Housing Characteristics in Milford
Housing Structures in Milford
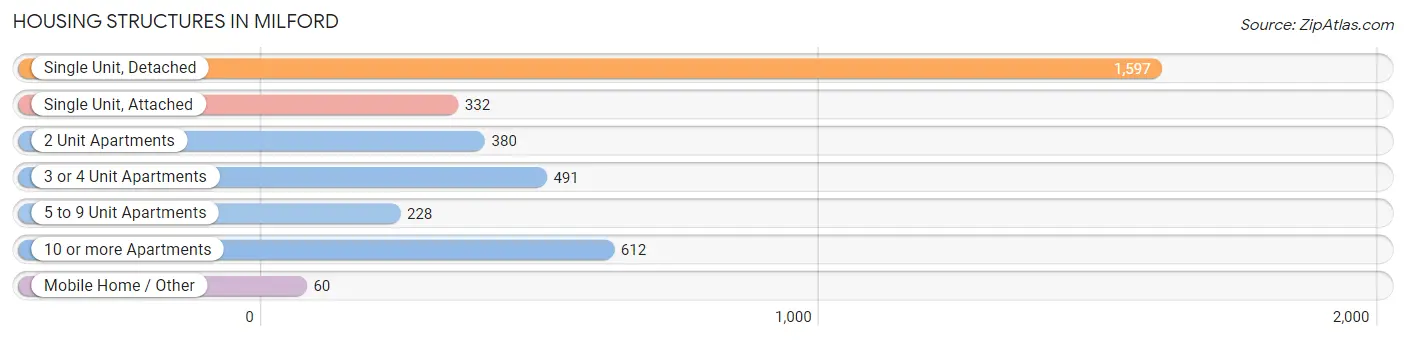
| Structure Type | # Housing Units | % Housing Units |
| Single Unit, Detached | 1,597 | 43.2% |
| Single Unit, Attached | 332 | 9.0% |
| 2 Unit Apartments | 380 | 10.3% |
| 3 or 4 Unit Apartments | 491 | 13.3% |
| 5 to 9 Unit Apartments | 228 | 6.2% |
| 10 or more Apartments | 612 | 16.5% |
| Mobile Home / Other | 60 | 1.6% |
| Total | 3,700 | 100.0% |
Housing Structures by Occupancy in Milford
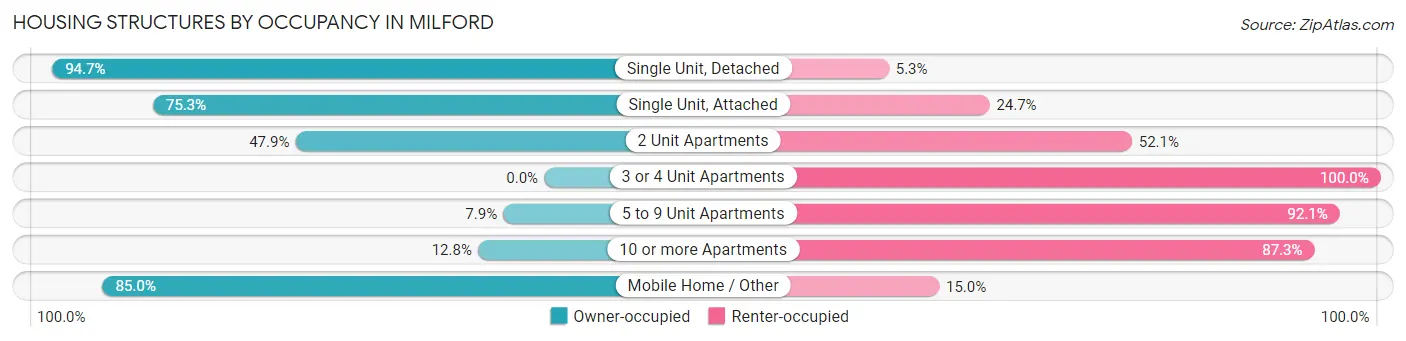
| Structure Type | Owner-occupied | Renter-occupied |
| Single Unit, Detached | 1,512 (94.7%) | 85 (5.3%) |
| Single Unit, Attached | 250 (75.3%) | 82 (24.7%) |
| 2 Unit Apartments | 182 (47.9%) | 198 (52.1%) |
| 3 or 4 Unit Apartments | 0 (0.0%) | 491 (100.0%) |
| 5 to 9 Unit Apartments | 18 (7.9%) | 210 (92.1%) |
| 10 or more Apartments | 78 (12.8%) | 534 (87.3%) |
| Mobile Home / Other | 51 (85.0%) | 9 (15.0%) |
| Total | 2,091 (56.5%) | 1,609 (43.5%) |
Housing Structures by Number of Rooms in Milford
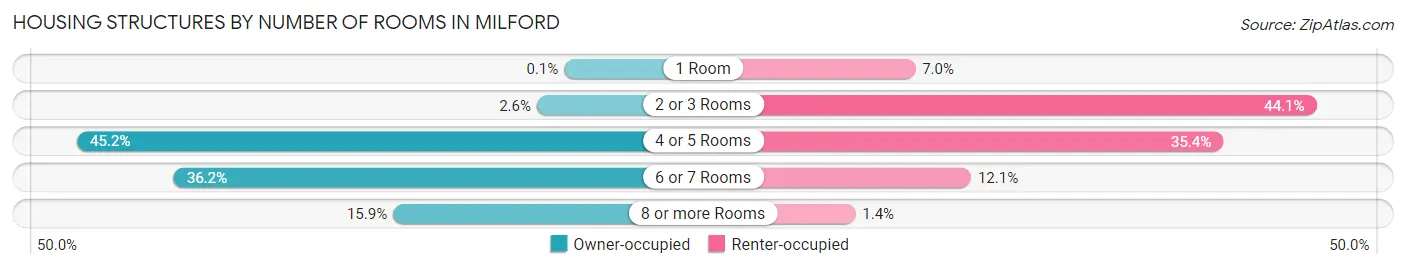
| Number of Rooms | Owner-occupied | Renter-occupied |
| 1 Room | 2 (0.1%) | 112 (7.0%) |
| 2 or 3 Rooms | 55 (2.6%) | 709 (44.1%) |
| 4 or 5 Rooms | 944 (45.2%) | 570 (35.4%) |
| 6 or 7 Rooms | 757 (36.2%) | 195 (12.1%) |
| 8 or more Rooms | 333 (15.9%) | 23 (1.4%) |
| Total | 2,091 (100.0%) | 1,609 (100.0%) |
Housing Structure by Heating Type in Milford
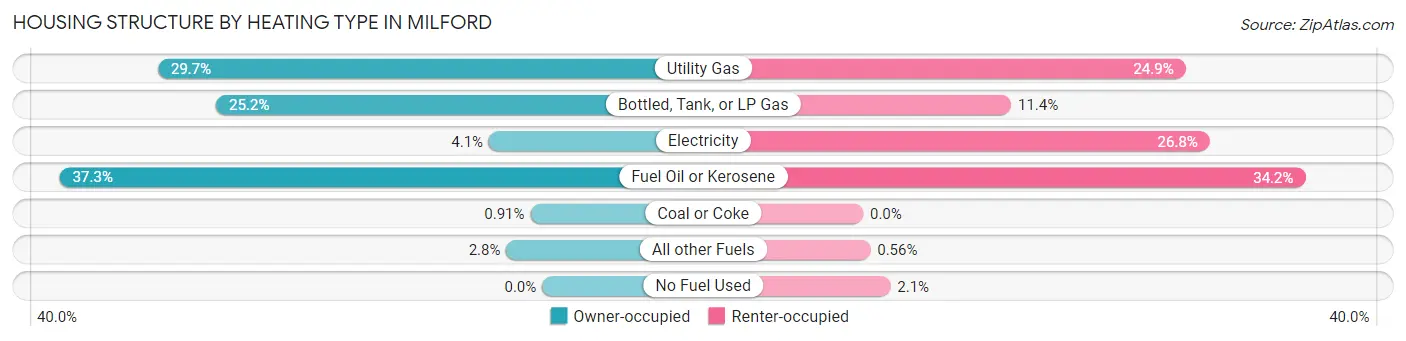
| Heating Type | Owner-occupied | Renter-occupied |
| Utility Gas | 621 (29.7%) | 401 (24.9%) |
| Bottled, Tank, or LP Gas | 527 (25.2%) | 184 (11.4%) |
| Electricity | 86 (4.1%) | 431 (26.8%) |
| Fuel Oil or Kerosene | 780 (37.3%) | 550 (34.2%) |
| Coal or Coke | 19 (0.9%) | 0 (0.0%) |
| All other Fuels | 58 (2.8%) | 9 (0.6%) |
| No Fuel Used | 0 (0.0%) | 34 (2.1%) |
| Total | 2,091 (100.0%) | 1,609 (100.0%) |
Household Vehicle Usage in Milford
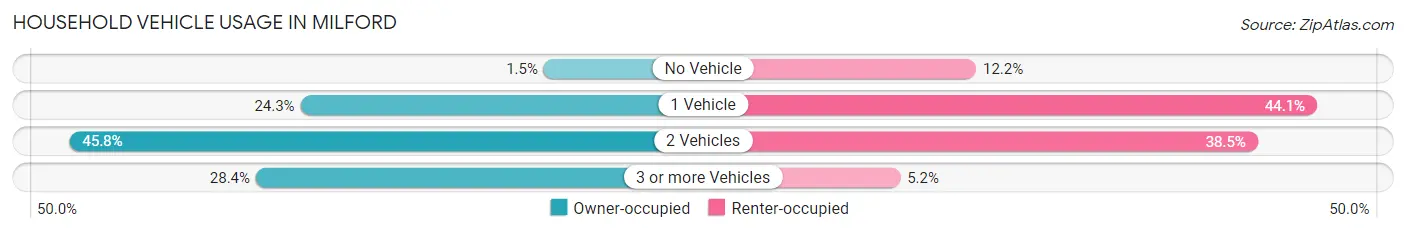
| Vehicles per Household | Owner-occupied | Renter-occupied |
| No Vehicle | 32 (1.5%) | 197 (12.2%) |
| 1 Vehicle | 507 (24.2%) | 709 (44.1%) |
| 2 Vehicles | 958 (45.8%) | 620 (38.5%) |
| 3 or more Vehicles | 594 (28.4%) | 83 (5.2%) |
| Total | 2,091 (100.0%) | 1,609 (100.0%) |
Real Estate & Mortgages in Milford
Real Estate and Mortgage Overview in Milford
| Characteristic | Without Mortgage | With Mortgage |
| Housing Units | 473 | 1,618 |
| Median Property Value | $304,600 | $313,600 |
| Median Household Income | $62,107 | $437 |
| Monthly Housing Costs | $981 | $128 |
| Real Estate Taxes | $6,173 | $0 |
Property Value by Mortgage Status in Milford
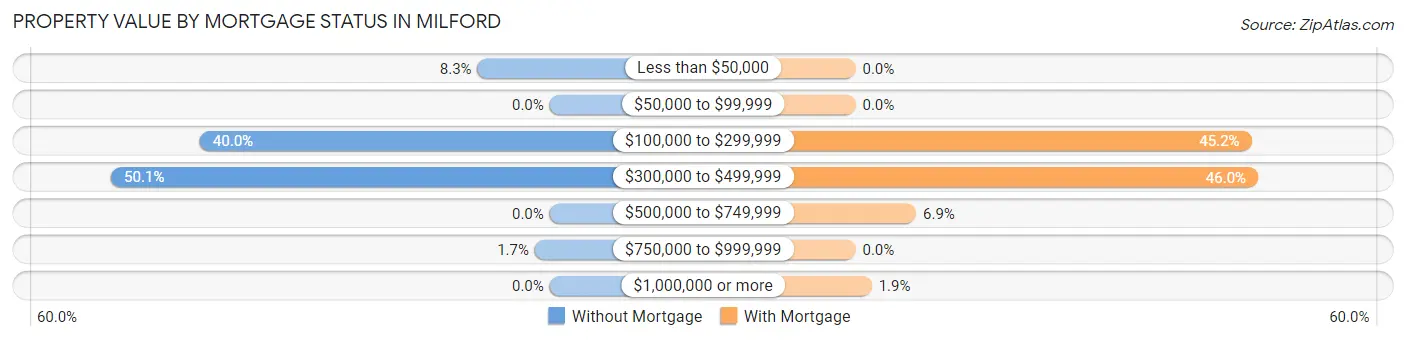
| Property Value | Without Mortgage | With Mortgage |
| Less than $50,000 | 39 (8.3%) | 0 (0.0%) |
| $50,000 to $99,999 | 0 (0.0%) | 0 (0.0%) |
| $100,000 to $299,999 | 189 (40.0%) | 732 (45.2%) |
| $300,000 to $499,999 | 237 (50.1%) | 744 (46.0%) |
| $500,000 to $749,999 | 0 (0.0%) | 112 (6.9%) |
| $750,000 to $999,999 | 8 (1.7%) | 0 (0.0%) |
| $1,000,000 or more | 0 (0.0%) | 30 (1.8%) |
| Total | 473 (100.0%) | 1,618 (100.0%) |
Household Income by Mortgage Status in Milford
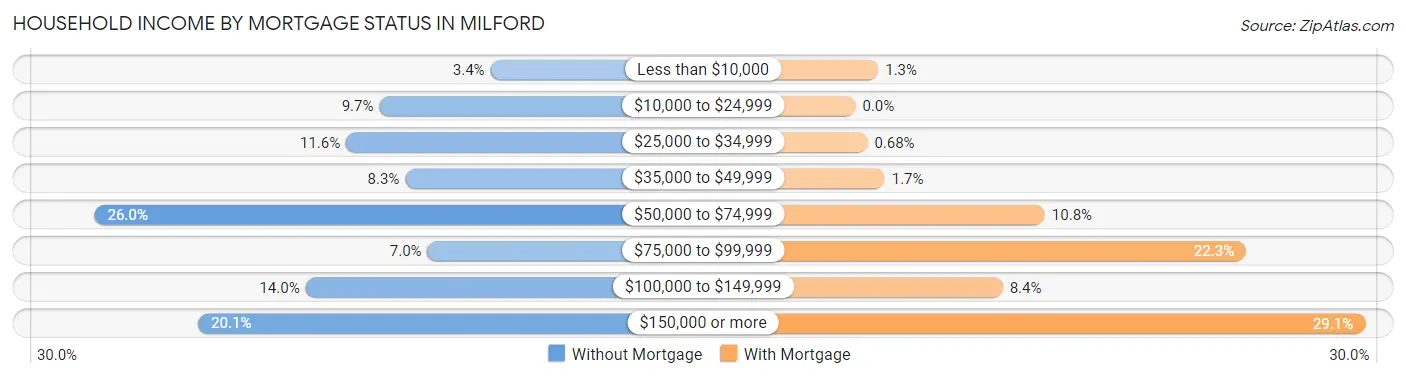
| Household Income | Without Mortgage | With Mortgage |
| Less than $10,000 | 16 (3.4%) | 21 (1.3%) |
| $10,000 to $24,999 | 46 (9.7%) | 0 (0.0%) |
| $25,000 to $34,999 | 55 (11.6%) | 11 (0.7%) |
| $35,000 to $49,999 | 39 (8.3%) | 27 (1.7%) |
| $50,000 to $74,999 | 123 (26.0%) | 175 (10.8%) |
| $75,000 to $99,999 | 33 (7.0%) | 361 (22.3%) |
| $100,000 to $149,999 | 66 (14.0%) | 136 (8.4%) |
| $150,000 or more | 95 (20.1%) | 471 (29.1%) |
| Total | 473 (100.0%) | 1,618 (100.0%) |
Property Value to Household Income Ratio in Milford
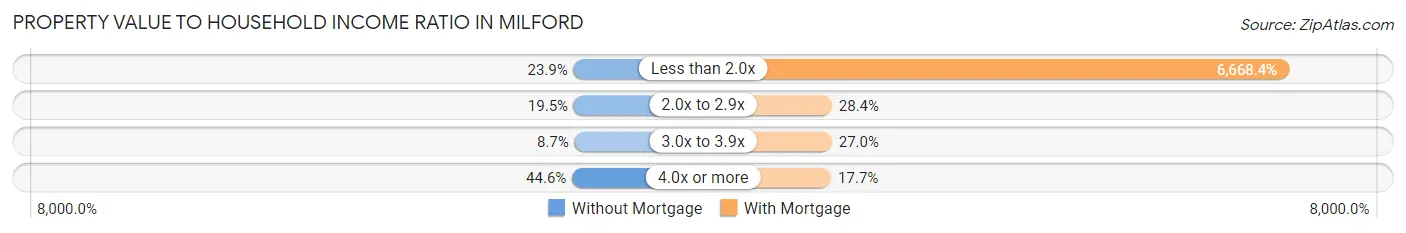
| Value-to-Income Ratio | Without Mortgage | With Mortgage |
| Less than 2.0x | 113 (23.9%) | 107,895 (6,668.4%) |
| 2.0x to 2.9x | 92 (19.5%) | 459 (28.4%) |
| 3.0x to 3.9x | 41 (8.7%) | 436 (27.0%) |
| 4.0x or more | 211 (44.6%) | 286 (17.7%) |
| Total | 473 (100.0%) | 1,618 (100.0%) |
Real Estate Taxes by Mortgage Status in Milford
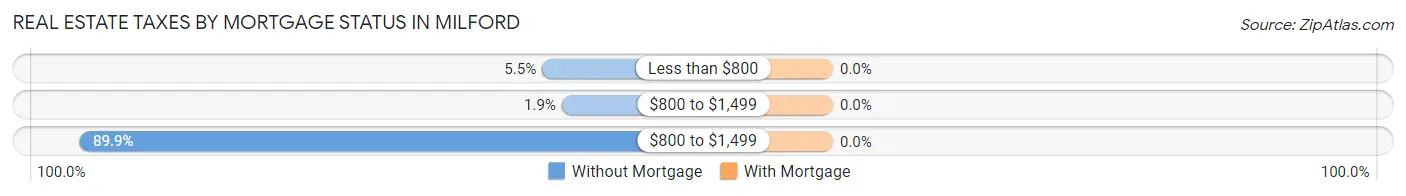
| Property Taxes | Without Mortgage | With Mortgage |
| Less than $800 | 26 (5.5%) | 0 (0.0%) |
| $800 to $1,499 | 9 (1.9%) | 0 (0.0%) |
| $800 to $1,499 | 425 (89.8%) | 0 (0.0%) |
| Total | 473 (100.0%) | 1,618 (100.0%) |
Health & Disability in Milford
Health Insurance Coverage by Age in Milford
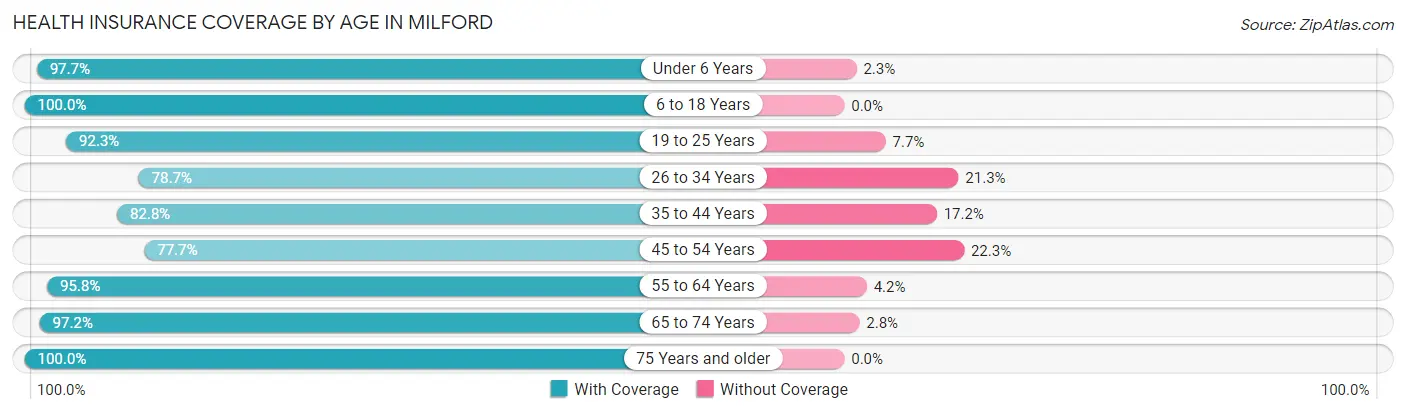
| Age Bracket | With Coverage | Without Coverage |
| Under 6 Years | 646 (97.7%) | 15 (2.3%) |
| 6 to 18 Years | 1,117 (100.0%) | 0 (0.0%) |
| 19 to 25 Years | 646 (92.3%) | 54 (7.7%) |
| 26 to 34 Years | 910 (78.7%) | 246 (21.3%) |
| 35 to 44 Years | 1,023 (82.8%) | 213 (17.2%) |
| 45 to 54 Years | 842 (77.7%) | 242 (22.3%) |
| 55 to 64 Years | 849 (95.8%) | 37 (4.2%) |
| 65 to 74 Years | 830 (97.2%) | 24 (2.8%) |
| 75 Years and older | 681 (100.0%) | 0 (0.0%) |
| Total | 7,544 (90.1%) | 831 (9.9%) |
Health Insurance Coverage by Citizenship Status in Milford
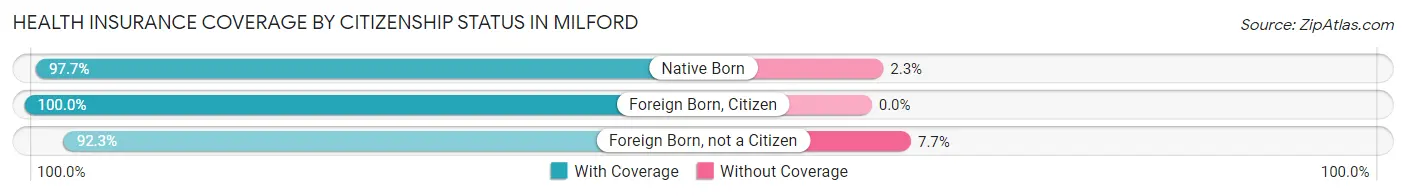
| Citizenship Status | With Coverage | Without Coverage |
| Native Born | 646 (97.7%) | 15 (2.3%) |
| Foreign Born, Citizen | 1,117 (100.0%) | 0 (0.0%) |
| Foreign Born, not a Citizen | 646 (92.3%) | 54 (7.7%) |
Health Insurance Coverage by Household Income in Milford
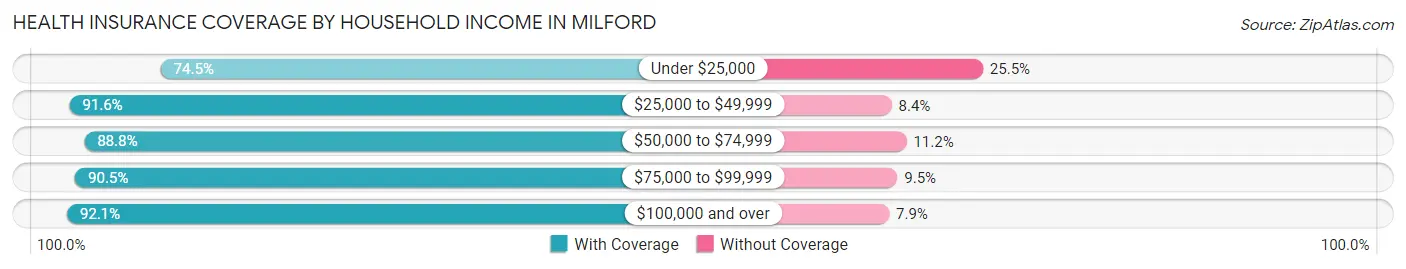
| Household Income | With Coverage | Without Coverage |
| Under $25,000 | 450 (74.5%) | 154 (25.5%) |
| $25,000 to $49,999 | 1,025 (91.6%) | 94 (8.4%) |
| $50,000 to $74,999 | 1,207 (88.8%) | 152 (11.2%) |
| $75,000 to $99,999 | 793 (90.5%) | 83 (9.5%) |
| $100,000 and over | 4,044 (92.1%) | 348 (7.9%) |
Public vs Private Health Insurance Coverage by Age in Milford
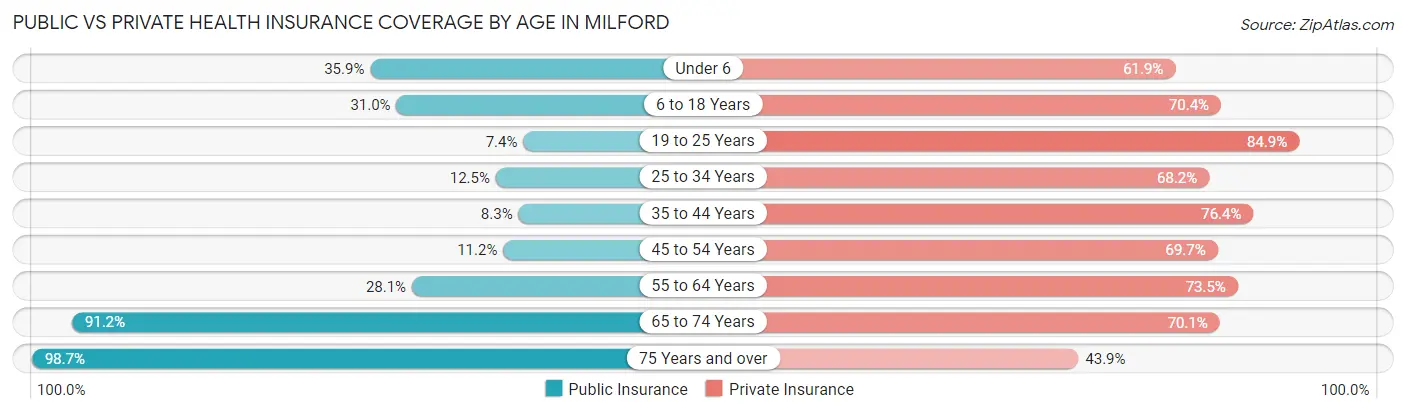
| Age Bracket | Public Insurance | Private Insurance |
| Under 6 | 237 (35.8%) | 409 (61.9%) |
| 6 to 18 Years | 346 (31.0%) | 786 (70.4%) |
| 19 to 25 Years | 52 (7.4%) | 594 (84.9%) |
| 25 to 34 Years | 145 (12.5%) | 788 (68.2%) |
| 35 to 44 Years | 103 (8.3%) | 944 (76.4%) |
| 45 to 54 Years | 121 (11.2%) | 756 (69.7%) |
| 55 to 64 Years | 249 (28.1%) | 651 (73.5%) |
| 65 to 74 Years | 779 (91.2%) | 599 (70.1%) |
| 75 Years and over | 672 (98.7%) | 299 (43.9%) |
| Total | 2,704 (32.3%) | 5,826 (69.6%) |
Disability Status by Sex by Age in Milford
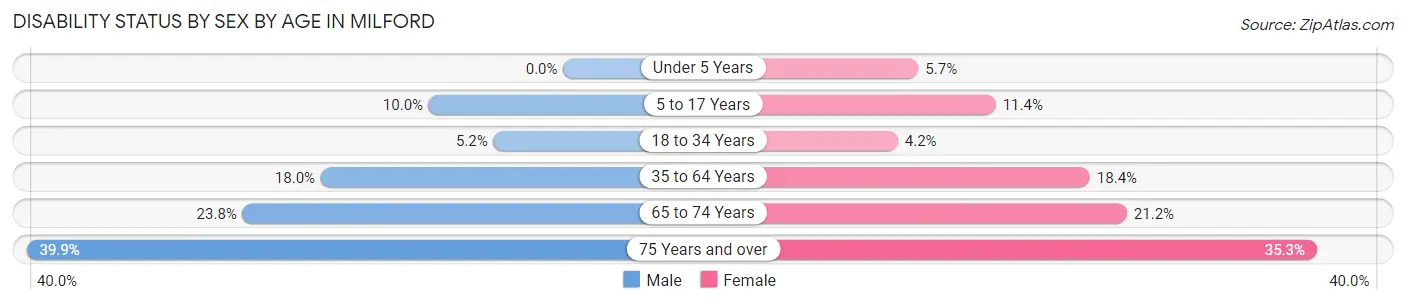
| Age Bracket | Male | Female |
| Under 5 Years | 0 (0.0%) | 23 (5.7%) |
| 5 to 17 Years | 52 (10.0%) | 59 (11.4%) |
| 18 to 34 Years | 48 (5.2%) | 43 (4.2%) |
| 35 to 64 Years | 283 (18.0%) | 301 (18.4%) |
| 65 to 74 Years | 110 (23.8%) | 83 (21.2%) |
| 75 Years and over | 59 (39.9%) | 188 (35.3%) |
Disability Class by Sex by Age in Milford
Disability Class: Hearing Difficulty
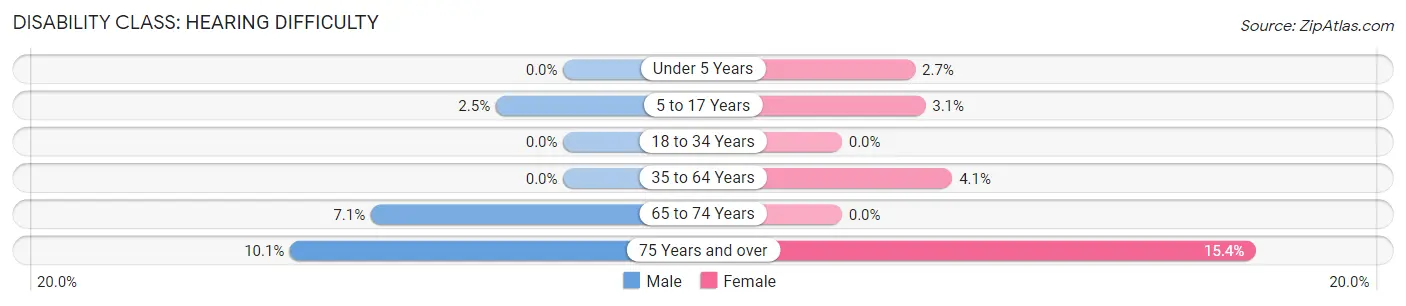
| Age Bracket | Male | Female |
| Under 5 Years | 0 (0.0%) | 11 (2.7%) |
| 5 to 17 Years | 13 (2.5%) | 16 (3.1%) |
| 18 to 34 Years | 0 (0.0%) | 0 (0.0%) |
| 35 to 64 Years | 0 (0.0%) | 67 (4.1%) |
| 65 to 74 Years | 33 (7.1%) | 0 (0.0%) |
| 75 Years and over | 15 (10.1%) | 82 (15.4%) |
Disability Class: Vision Difficulty
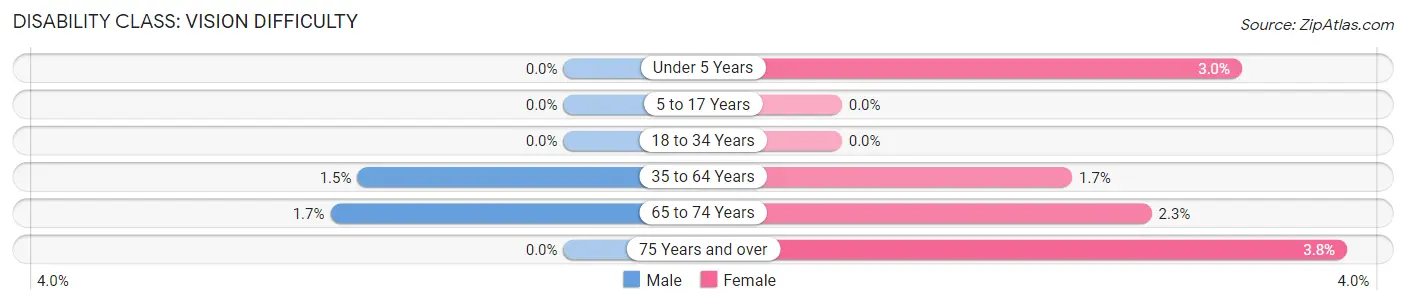
| Age Bracket | Male | Female |
| Under 5 Years | 0 (0.0%) | 12 (3.0%) |
| 5 to 17 Years | 0 (0.0%) | 0 (0.0%) |
| 18 to 34 Years | 0 (0.0%) | 0 (0.0%) |
| 35 to 64 Years | 24 (1.5%) | 28 (1.7%) |
| 65 to 74 Years | 8 (1.7%) | 9 (2.3%) |
| 75 Years and over | 0 (0.0%) | 20 (3.7%) |
Disability Class: Cognitive Difficulty
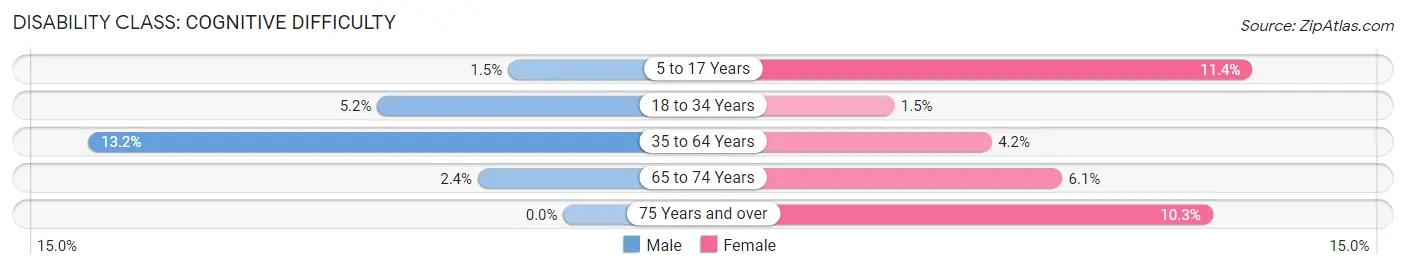
| Age Bracket | Male | Female |
| 5 to 17 Years | 8 (1.5%) | 59 (11.4%) |
| 18 to 34 Years | 48 (5.2%) | 15 (1.5%) |
| 35 to 64 Years | 208 (13.2%) | 68 (4.2%) |
| 65 to 74 Years | 11 (2.4%) | 24 (6.1%) |
| 75 Years and over | 0 (0.0%) | 55 (10.3%) |
Disability Class: Ambulatory Difficulty
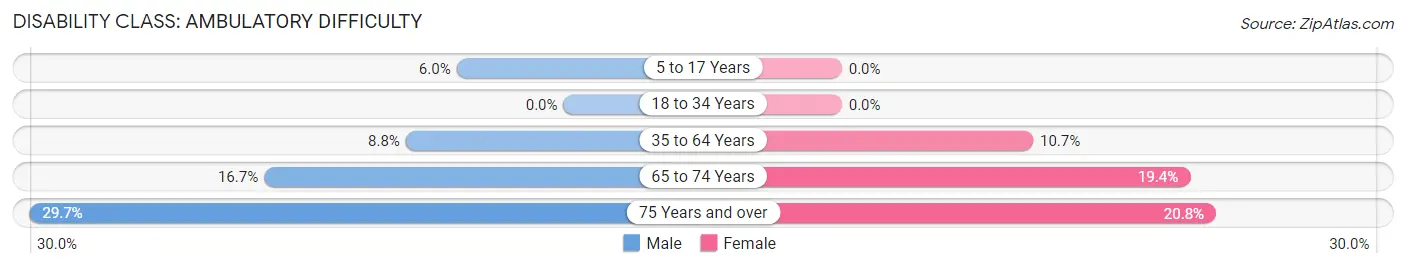
| Age Bracket | Male | Female |
| 5 to 17 Years | 31 (5.9%) | 0 (0.0%) |
| 18 to 34 Years | 0 (0.0%) | 0 (0.0%) |
| 35 to 64 Years | 138 (8.8%) | 174 (10.6%) |
| 65 to 74 Years | 77 (16.7%) | 76 (19.4%) |
| 75 Years and over | 44 (29.7%) | 111 (20.8%) |
Disability Class: Self-Care Difficulty
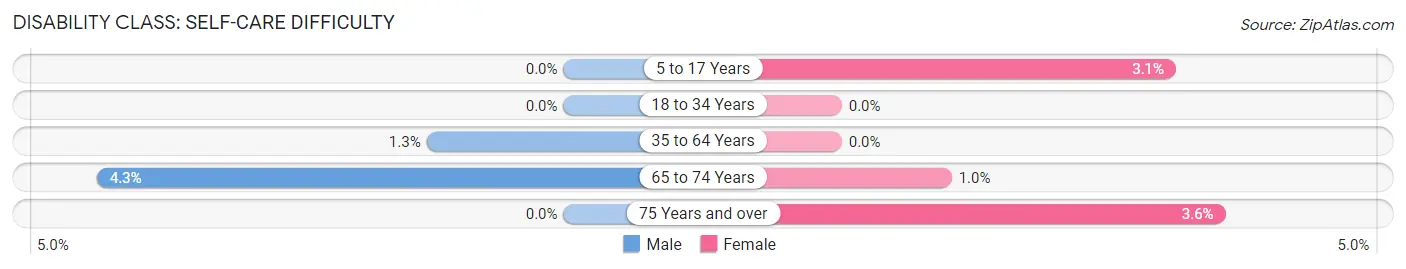
| Age Bracket | Male | Female |
| 5 to 17 Years | 0 (0.0%) | 16 (3.1%) |
| 18 to 34 Years | 0 (0.0%) | 0 (0.0%) |
| 35 to 64 Years | 20 (1.3%) | 0 (0.0%) |
| 65 to 74 Years | 20 (4.3%) | 4 (1.0%) |
| 75 Years and over | 0 (0.0%) | 19 (3.6%) |
Technology Access in Milford
Computing Device Access in Milford
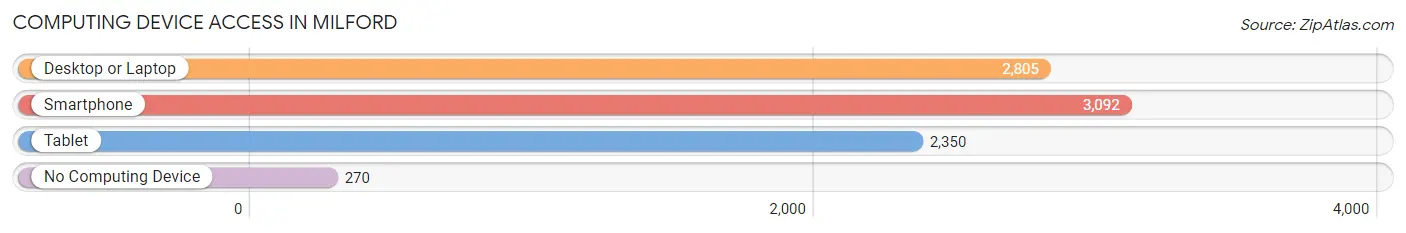
| Device Type | # Households | % Households |
| Desktop or Laptop | 2,805 | 75.8% |
| Smartphone | 3,092 | 83.6% |
| Tablet | 2,350 | 63.5% |
| No Computing Device | 270 | 7.3% |
| Total | 3,700 | 100.0% |
Internet Access in Milford
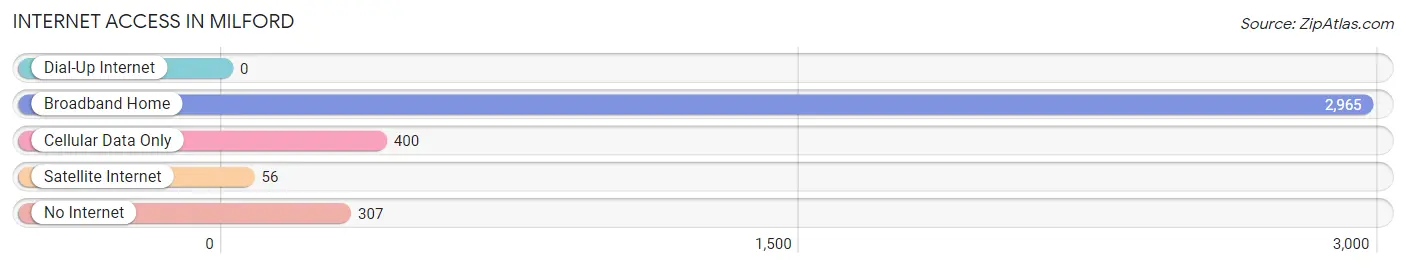
| Internet Type | # Households | % Households |
| Dial-Up Internet | 0 | 0.0% |
| Broadband Home | 2,965 | 80.1% |
| Cellular Data Only | 400 | 10.8% |
| Satellite Internet | 56 | 1.5% |
| No Internet | 307 | 8.3% |
| Total | 3,700 | 100.0% |
Milford Summary
Milford, New Hampshire is a small town located in Hillsborough County in the southern part of the state. It is situated on the Souhegan River, which is a tributary of the Merrimack River. The town was first settled in 1763 and was incorporated in 1794. As of the 2010 census, the population of Milford was 15,115.
History
The area that is now Milford was originally inhabited by the Pennacook tribe, a sub-tribe of the Abenaki people. The first European settlers arrived in the area in 1763, and the town was officially incorporated in 1794. The town was named after Milford Haven, a port in Wales.
In the 19th century, Milford was an important industrial center, with several mills located along the Souhegan River. The town was also home to several shoe factories, which produced shoes for the Union Army during the Civil War.
In the late 19th century, Milford became a popular summer resort destination, with several large hotels and resorts located in the area. The town was also home to several large amusement parks, including the Milford Amusement Park, which operated from 1891 to 1910.
Geography
Milford is located in Hillsborough County in the southern part of the state. It is situated on the Souhegan River, which is a tributary of the Merrimack River. The town is bordered by Amherst to the north, Mont Vernon to the east, Lyndeborough to the south, and Wilton to the west.
The town has a total area of 24.2 square miles, of which 23.9 square miles is land and 0.3 square miles is water. The highest point in Milford is the summit of Pack Monadnock, which has an elevation of 2,290 feet.
Economy
The economy of Milford is largely based on manufacturing and retail. The town is home to several large manufacturing companies, including the Milford Manufacturing Company, which produces industrial machinery, and the Milford Shoe Company, which produces shoes.
The town is also home to several retail stores, including the Milford Mall, which is the largest shopping center in the area. Other major employers in the town include the Milford Regional Medical Center, the Milford School District, and the Milford Public Library.
Demographics
As of the 2010 census, the population of Milford was 15,115. The racial makeup of the town was 94.2% White, 1.7% African American, 0.3% Native American, 1.3% Asian, 0.1% Pacific Islander, 1.2% from other races, and 1.4% from two or more races. Hispanic or Latino of any race were 3.2% of the population.
The median income for a household in Milford was $60,945, and the median income for a family was $71,945. The per capita income for the town was $27,945. About 4.2% of families and 5.7% of the population were below the poverty line, including 6.3% of those under age 18 and 4.2% of those age 65 or over.
Common Questions
What is Per Capita Income in Milford?
Per Capita income in Milford is $41,661.
What is the Median Family Income in Milford?
Median Family Income in Milford is $106,758.
What is the Median Household income in Milford?
Median Household Income in Milford is $71,065.
What is Income or Wage Gap in Milford?
Income or Wage Gap in Milford is 38.5%.
Women in Milford earn 61.5 cents for every dollar earned by a man.
What is Inequality or Gini Index in Milford?
Inequality or Gini Index in Milford is 0.43.
What is the Total Population of Milford?
Total Population of Milford is 8,530.
What is the Total Male Population of Milford?
Total Male Population of Milford is 3,914.
What is the Total Female Population of Milford?
Total Female Population of Milford is 4,616.
What is the Ratio of Males per 100 Females in Milford?
There are 84.79 Males per 100 Females in Milford.
What is the Ratio of Females per 100 Males in Milford?
There are 117.94 Females per 100 Males in Milford.
What is the Median Population Age in Milford?
Median Population Age in Milford is 40.2 Years.
What is the Average Family Size in Milford
Average Family Size in Milford is 3.0 People.
What is the Average Household Size in Milford
Average Household Size in Milford is 2.3 People.
How Large is the Labor Force in Milford?
There are 4,844 People in the Labor Forcein in Milford.
What is the Percentage of People in the Labor Force in Milford?
69.4% of People are in the Labor Force in Milford.
What is the Unemployment Rate in Milford?
Unemployment Rate in Milford is 4.9%.