Somersworth, NH Map & Demographics
Somersworth Map
Somersworth Overview
$39,754
PER CAPITA INCOME
$82,639
AVG FAMILY INCOME
$75,841
AVG HOUSEHOLD INCOME
21.4%
WAGE / INCOME GAP [ % ]
78.6¢/ $1
WAGE / INCOME GAP [ $ ]
0.37
INEQUALITY / GINI INDEX
11,994
TOTAL POPULATION
6,089
MALE POPULATION
5,905
FEMALE POPULATION
103.12
MALES / 100 FEMALES
96.98
FEMALES / 100 MALES
38.1
MEDIAN AGE
2.7
AVG FAMILY SIZE
2.3
AVG HOUSEHOLD SIZE
7,341
LABOR FORCE [ PEOPLE ]
72.2%
PERCENT IN LABOR FORCE
2.8%
UNEMPLOYMENT RATE
Somersworth Zip Codes
Somersworth Area Codes
Income in Somersworth
Income Overview in Somersworth
Per Capita Income in Somersworth is $39,754, while median incomes of families and households are $82,639 and $75,841 respectively.
| Characteristic | Number | Measure |
| Per Capita Income | 11,994 | $39,754 |
| Median Family Income | 3,046 | $82,639 |
| Mean Family Income | 3,046 | $102,542 |
| Median Household Income | 5,232 | $75,841 |
| Mean Household Income | 5,232 | $89,667 |
| Income Deficit | 3,046 | $0 |
| Wage / Income Gap (%) | 11,994 | 21.40% |
| Wage / Income Gap ($) | 11,994 | 78.60¢ per $1 |
| Gini / Inequality Index | 11,994 | 0.37 |
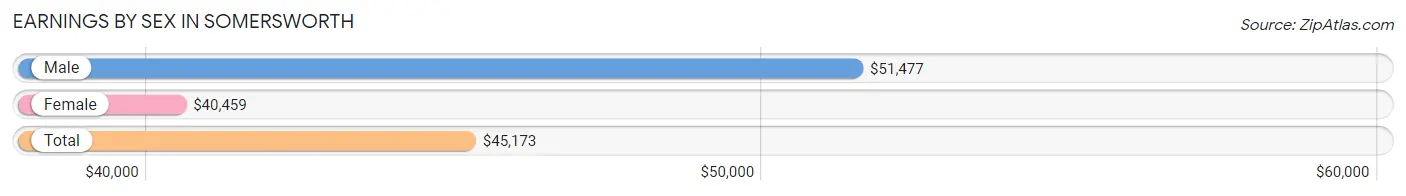
Earnings by Sex in Somersworth
Average Earnings in Somersworth are $45,173, $51,477 for men and $40,459 for women, a difference of 21.4%.
| Sex | Number | Average Earnings |
| Male | 4,125 (54.4%) | $51,477 |
| Female | 3,462 (45.6%) | $40,459 |
| Total | 7,587 (100.0%) | $45,173 |
Earnings by Sex by Income Bracket in Somersworth
The most common earnings brackets in Somersworth are $100,000+ for men (536 | 13.0%) and $40,000 to $44,999 for women (531 | 15.3%).
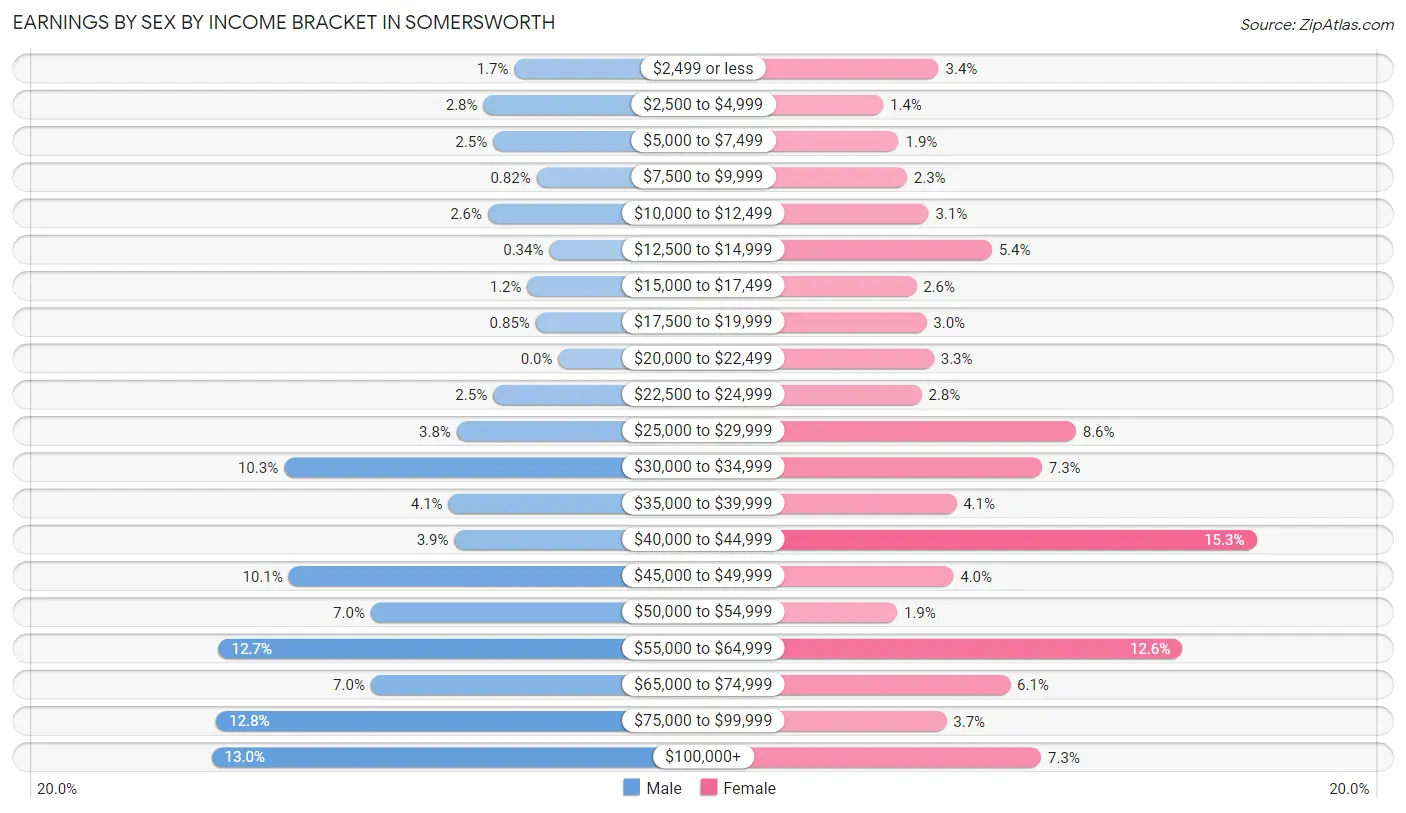
| Income | Male | Female |
| $2,499 or less | 68 (1.7%) | 119 (3.4%) |
| $2,500 to $4,999 | 116 (2.8%) | 47 (1.4%) |
| $5,000 to $7,499 | 101 (2.5%) | 67 (1.9%) |
| $7,500 to $9,999 | 34 (0.8%) | 78 (2.2%) |
| $10,000 to $12,499 | 109 (2.6%) | 106 (3.1%) |
| $12,500 to $14,999 | 14 (0.3%) | 188 (5.4%) |
| $15,000 to $17,499 | 48 (1.2%) | 90 (2.6%) |
| $17,500 to $19,999 | 35 (0.9%) | 103 (3.0%) |
| $20,000 to $22,499 | 0 (0.0%) | 113 (3.3%) |
| $22,500 to $24,999 | 101 (2.5%) | 97 (2.8%) |
| $25,000 to $29,999 | 157 (3.8%) | 297 (8.6%) |
| $30,000 to $34,999 | 424 (10.3%) | 253 (7.3%) |
| $35,000 to $39,999 | 170 (4.1%) | 142 (4.1%) |
| $40,000 to $44,999 | 161 (3.9%) | 531 (15.3%) |
| $45,000 to $49,999 | 417 (10.1%) | 138 (4.0%) |
| $50,000 to $54,999 | 290 (7.0%) | 65 (1.9%) |
| $55,000 to $64,999 | 525 (12.7%) | 435 (12.6%) |
| $65,000 to $74,999 | 290 (7.0%) | 212 (6.1%) |
| $75,000 to $99,999 | 529 (12.8%) | 129 (3.7%) |
| $100,000+ | 536 (13.0%) | 252 (7.3%) |
| Total | 4,125 (100.0%) | 3,462 (100.0%) |
Earnings by Sex by Educational Attainment in Somersworth
Average earnings in Somersworth are $55,489 for men and $43,429 for women, a difference of 21.7%. Men with an educational attainment of graduate degree enjoy the highest average annual earnings of $62,285, while those with less than high school education earn the least with $43,472. Women with an educational attainment of graduate degree earn the most with the average annual earnings of $66,691, while those with high school diploma education have the smallest earnings of $38,333.
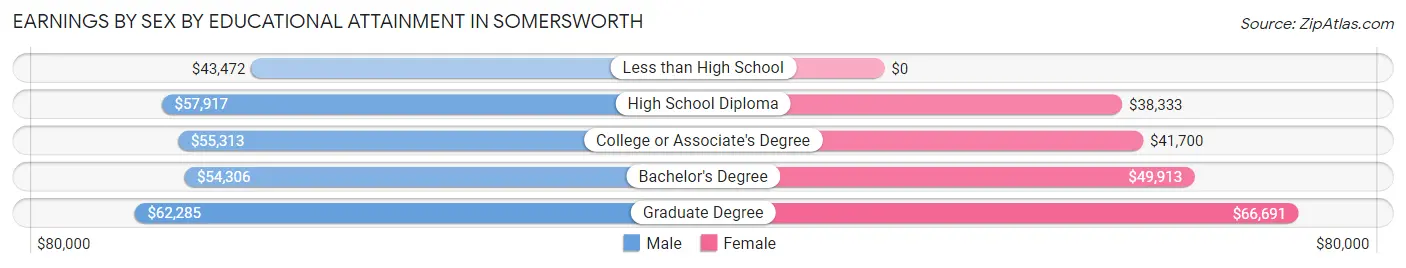
| Educational Attainment | Male Income | Female Income |
| Less than High School | $43,472 | $0 |
| High School Diploma | $57,917 | $38,333 |
| College or Associate's Degree | $55,313 | $41,700 |
| Bachelor's Degree | $54,306 | $49,913 |
| Graduate Degree | $62,285 | $66,691 |
| Total | $55,489 | $43,429 |
Family Income in Somersworth
Family Income Brackets in Somersworth
According to the Somersworth family income data, there are 670 families falling into the $75,000 to $99,999 income range, which is the most common income bracket and makes up 22.0% of all families. Conversely, the less than $10,000 income bracket is the least frequent group with only 49 families (1.6%) belonging to this category.
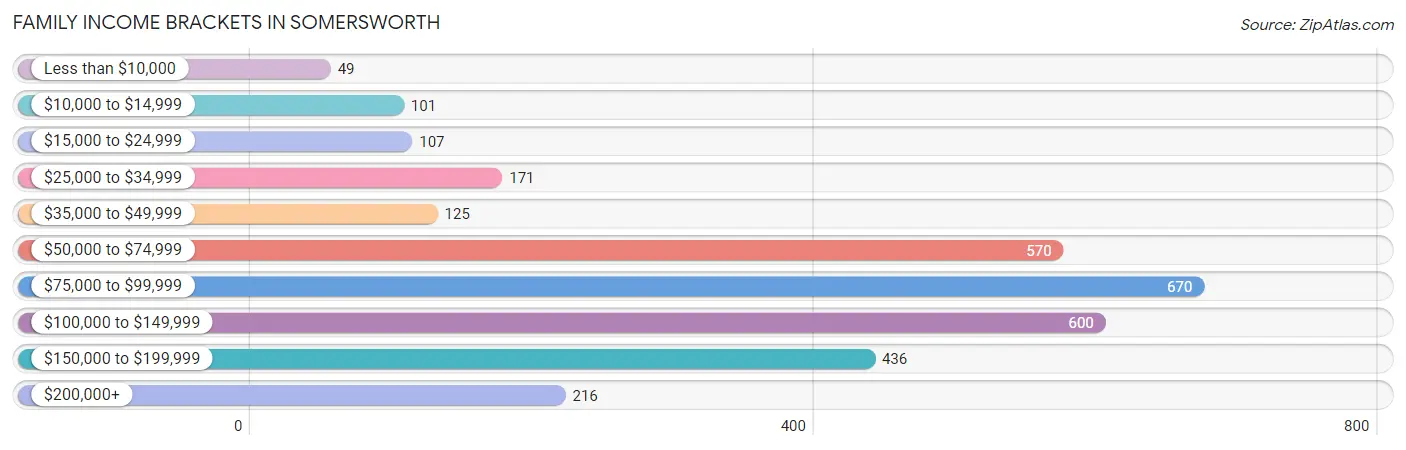
| Income Bracket | # Families | % Families |
| Less than $10,000 | 49 | 1.6% |
| $10,000 to $14,999 | 101 | 3.3% |
| $15,000 to $24,999 | 107 | 3.5% |
| $25,000 to $34,999 | 171 | 5.6% |
| $35,000 to $49,999 | 125 | 4.1% |
| $50,000 to $74,999 | 570 | 18.7% |
| $75,000 to $99,999 | 670 | 22.0% |
| $100,000 to $149,999 | 600 | 19.7% |
| $150,000 to $199,999 | 436 | 14.3% |
| $200,000+ | 216 | 7.1% |
Family Income by Famaliy Size in Somersworth
5-person families (112 | 3.7%) account for the highest median family income in Somersworth with $147,708 per family, while 2-person families (1,501 | 49.3%) have the highest median income of $37,744 per family member.
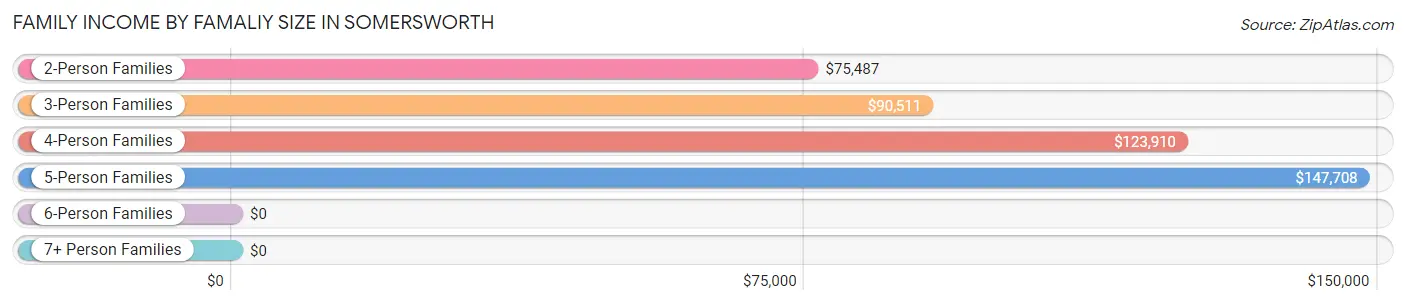
| Income Bracket | # Families | Median Income |
| 2-Person Families | 1,501 (49.3%) | $75,487 |
| 3-Person Families | 815 (26.8%) | $90,511 |
| 4-Person Families | 576 (18.9%) | $123,910 |
| 5-Person Families | 112 (3.7%) | $147,708 |
| 6-Person Families | 42 (1.4%) | $0 |
| 7+ Person Families | 0 (0.0%) | $0 |
| Total | 3,046 (100.0%) | $82,639 |
Family Income by Number of Earners in Somersworth
The median family income in Somersworth is $82,639, with families comprising 3+ earners (514) having the highest median family income of $149,792, while families with no earners (500) have the lowest median family income of $42,321, accounting for 16.9% and 16.4% of families, respectively.
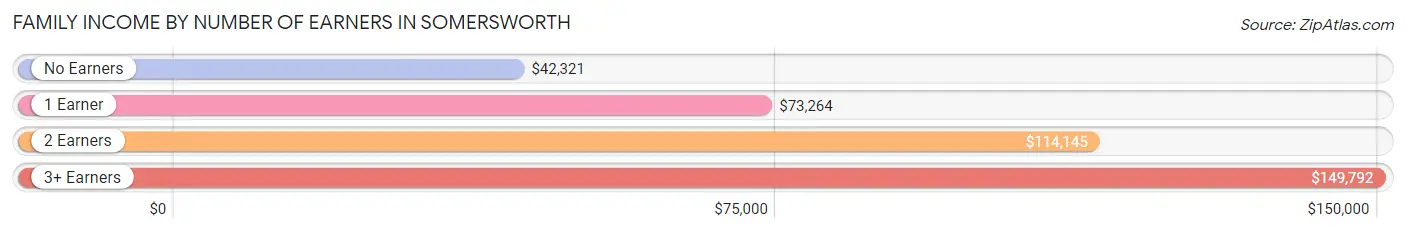
| Number of Earners | # Families | Median Income |
| No Earners | 500 (16.4%) | $42,321 |
| 1 Earner | 901 (29.6%) | $73,264 |
| 2 Earners | 1,131 (37.1%) | $114,145 |
| 3+ Earners | 514 (16.9%) | $149,792 |
| Total | 3,046 (100.0%) | $82,639 |
Household Income in Somersworth
Household Income Brackets in Somersworth
With 1,057 households falling in the category, the $50,000 to $74,999 income range is the most frequent in Somersworth, accounting for 20.2% of all households. In contrast, only 99 households (1.9%) fall into the less than $10,000 income bracket, making it the least populous group.
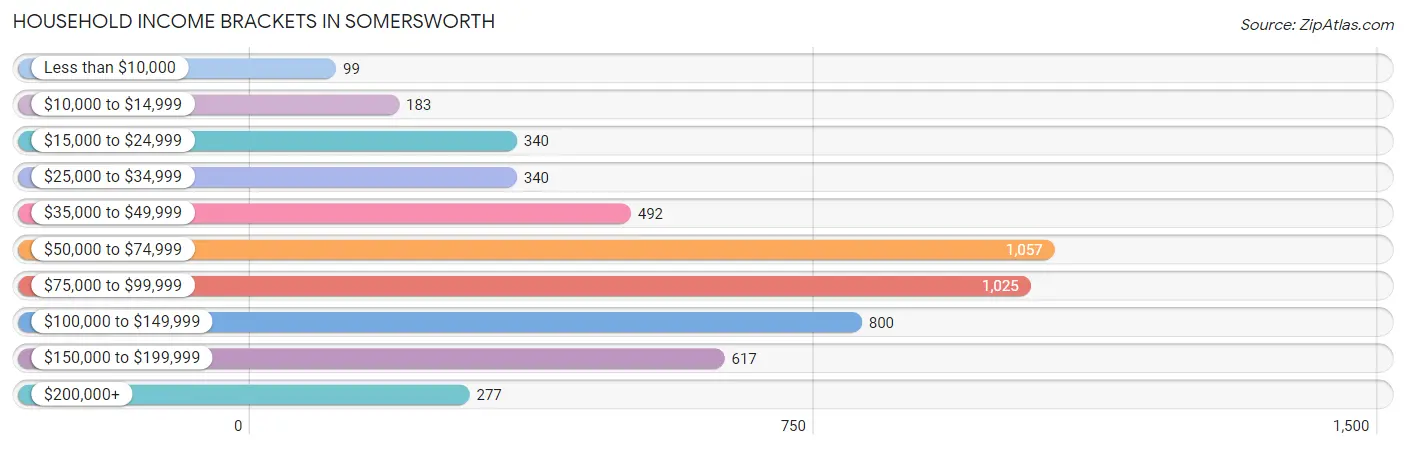
| Income Bracket | # Households | % Households |
| Less than $10,000 | 99 | 1.9% |
| $10,000 to $14,999 | 183 | 3.5% |
| $15,000 to $24,999 | 340 | 6.5% |
| $25,000 to $34,999 | 340 | 6.5% |
| $35,000 to $49,999 | 492 | 9.4% |
| $50,000 to $74,999 | 1,057 | 20.2% |
| $75,000 to $99,999 | 1,025 | 19.6% |
| $100,000 to $149,999 | 800 | 15.3% |
| $150,000 to $199,999 | 617 | 11.8% |
| $200,000+ | 277 | 5.3% |
Household Income by Householder Age in Somersworth
The median household income in Somersworth is $75,841, with the highest median household income of $88,510 found in the 25 to 44 years age bracket for the primary householder. A total of 1,763 households (33.7%) fall into this category. Meanwhile, the 15 to 24 years age bracket for the primary householder has the lowest median household income of $52,963, with 170 households (3.3%) in this group.
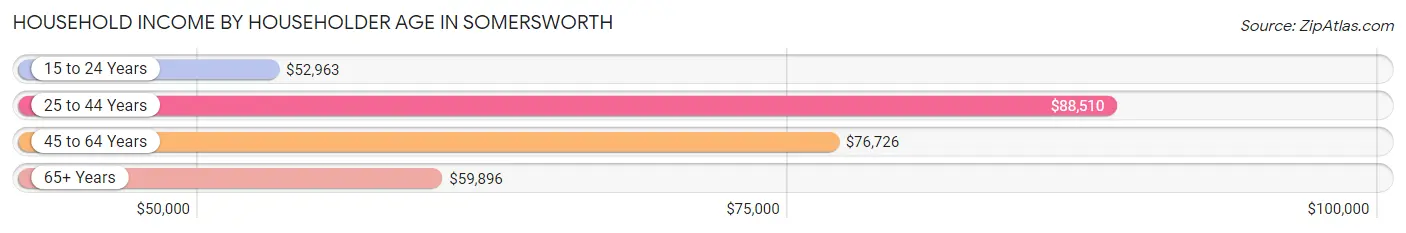
| Income Bracket | # Households | Median Income |
| 15 to 24 Years | 170 (3.3%) | $52,963 |
| 25 to 44 Years | 1,763 (33.7%) | $88,510 |
| 45 to 64 Years | 2,054 (39.3%) | $76,726 |
| 65+ Years | 1,245 (23.8%) | $59,896 |
| Total | 5,232 (100.0%) | $75,841 |
Poverty in Somersworth
Income Below Poverty by Sex and Age in Somersworth
With 7.4% poverty level for males and 10.0% for females among the residents of Somersworth, 75 year old and over males and 15 year old females are the most vulnerable to poverty, with 89 males (22.7%) and 38 females (38.0%) in their respective age groups living below the poverty level.
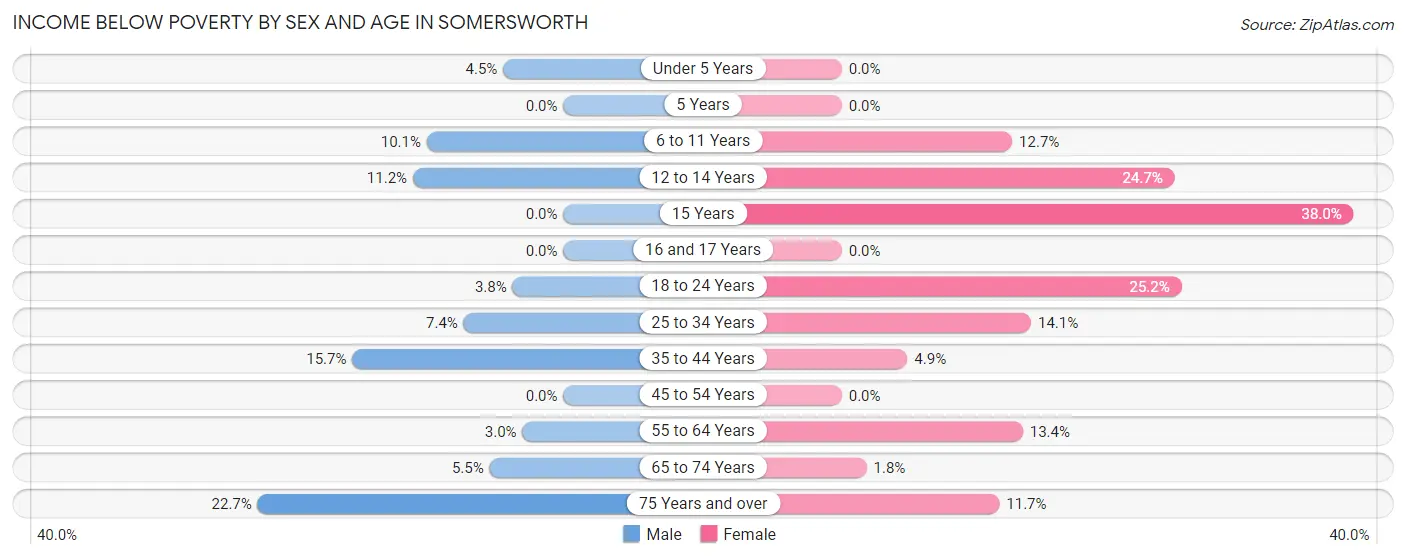
| Age Bracket | Male | Female |
| Under 5 Years | 13 (4.5%) | 0 (0.0%) |
| 5 Years | 0 (0.0%) | 0 (0.0%) |
| 6 to 11 Years | 37 (10.1%) | 43 (12.7%) |
| 12 to 14 Years | 23 (11.2%) | 42 (24.7%) |
| 15 Years | 0 (0.0%) | 38 (38.0%) |
| 16 and 17 Years | 0 (0.0%) | 0 (0.0%) |
| 18 to 24 Years | 16 (3.8%) | 114 (25.2%) |
| 25 to 34 Years | 96 (7.4%) | 160 (14.1%) |
| 35 to 44 Years | 123 (15.7%) | 33 (4.9%) |
| 45 to 54 Years | 0 (0.0%) | 0 (0.0%) |
| 55 to 64 Years | 26 (3.0%) | 109 (13.4%) |
| 65 to 74 Years | 24 (5.5%) | 12 (1.8%) |
| 75 Years and over | 89 (22.7%) | 31 (11.7%) |
| Total | 447 (7.4%) | 582 (10.0%) |
Income Above Poverty by Sex and Age in Somersworth
According to the poverty statistics in Somersworth, males aged 5 years and females aged under 5 years are the age groups that are most secure financially, with 100.0% of males and 100.0% of females in these age groups living above the poverty line.
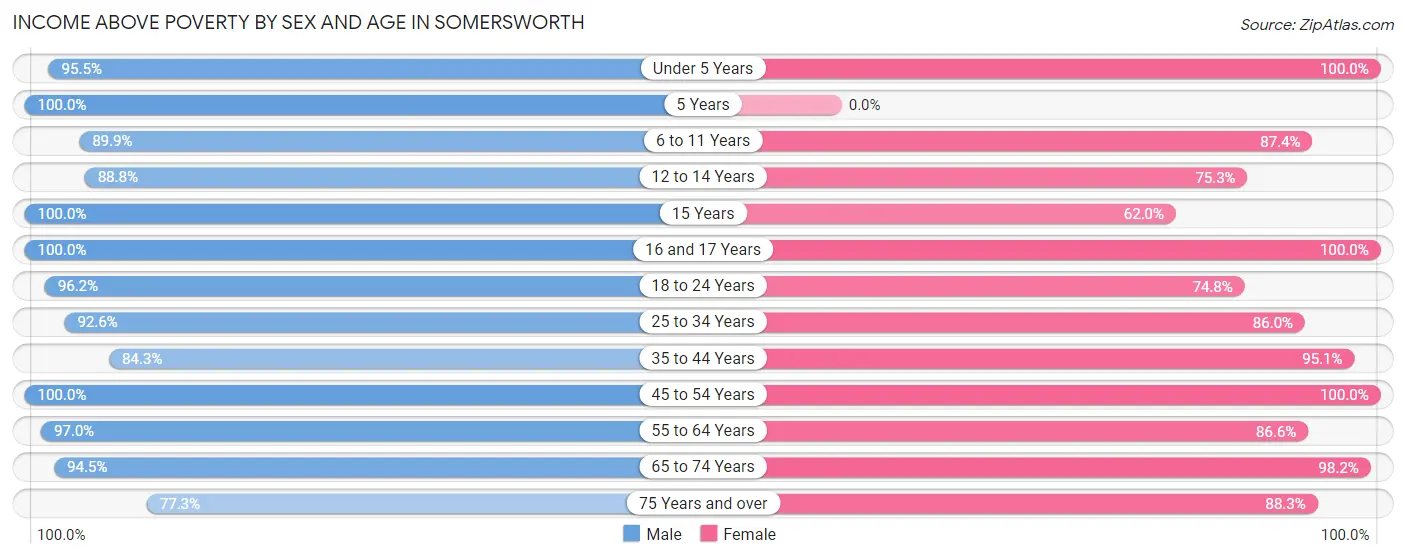
| Age Bracket | Male | Female |
| Under 5 Years | 278 (95.5%) | 168 (100.0%) |
| 5 Years | 10 (100.0%) | 0 (0.0%) |
| 6 to 11 Years | 328 (89.9%) | 297 (87.4%) |
| 12 to 14 Years | 183 (88.8%) | 128 (75.3%) |
| 15 Years | 61 (100.0%) | 62 (62.0%) |
| 16 and 17 Years | 183 (100.0%) | 137 (100.0%) |
| 18 to 24 Years | 408 (96.2%) | 338 (74.8%) |
| 25 to 34 Years | 1,201 (92.6%) | 979 (86.0%) |
| 35 to 44 Years | 662 (84.3%) | 645 (95.1%) |
| 45 to 54 Years | 727 (100.0%) | 922 (100.0%) |
| 55 to 64 Years | 830 (97.0%) | 702 (86.6%) |
| 65 to 74 Years | 414 (94.5%) | 641 (98.2%) |
| 75 Years and over | 303 (77.3%) | 234 (88.3%) |
| Total | 5,588 (92.6%) | 5,253 (90.0%) |
Income Below Poverty Among Married-Couple Families in Somersworth
The poverty statistics for married-couple families in Somersworth show that 5.2% or 117 of the total 2,258 families live below the poverty line. Families with no children have the highest poverty rate of 7.1%, comprising of 88 families. On the other hand, families with 3 or 4 children have the lowest poverty rate of 0.0%, which includes 0 families.
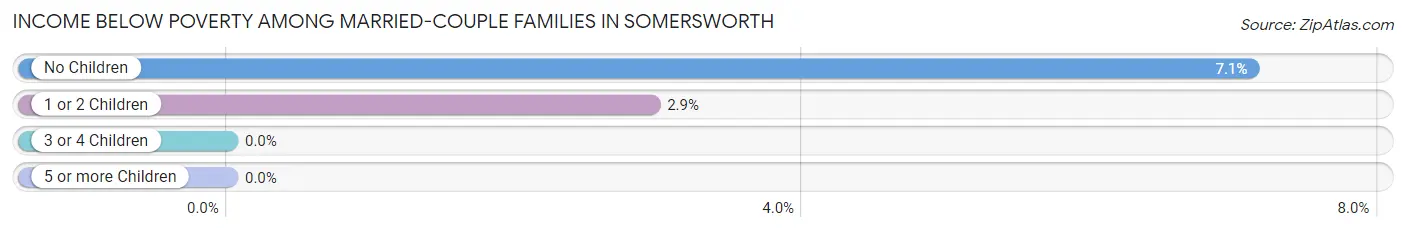
| Children | Above Poverty | Below Poverty |
| No Children | 1,150 (92.9%) | 88 (7.1%) |
| 1 or 2 Children | 958 (97.1%) | 29 (2.9%) |
| 3 or 4 Children | 33 (100.0%) | 0 (0.0%) |
| 5 or more Children | 0 (0.0%) | 0 (0.0%) |
| Total | 2,141 (94.8%) | 117 (5.2%) |
Income Below Poverty Among Single-Parent Households in Somersworth
According to the poverty data in Somersworth, 18.5% or 41 single-father households and 11.1% or 63 single-mother households are living below the poverty line. Among single-father households, those with 1 or 2 children have the highest poverty rate, with 41 households (22.7%) experiencing poverty. Likewise, among single-mother households, those with no children have the highest poverty rate, with 50 households (20.7%) falling below the poverty line.
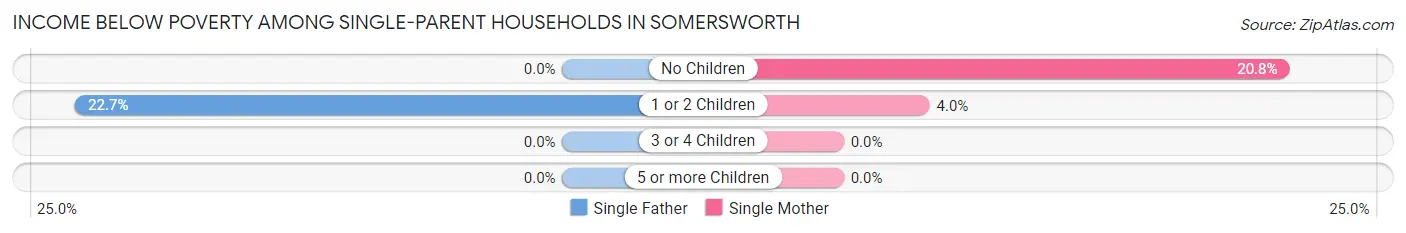
| Children | Single Father | Single Mother |
| No Children | 0 (0.0%) | 50 (20.7%) |
| 1 or 2 Children | 41 (22.7%) | 13 (4.0%) |
| 3 or 4 Children | 0 (0.0%) | 0 (0.0%) |
| 5 or more Children | 0 (0.0%) | 0 (0.0%) |
| Total | 41 (18.5%) | 63 (11.1%) |
Income Below Poverty Among Married-Couple vs Single-Parent Households in Somersworth
The poverty data for Somersworth shows that 117 of the married-couple family households (5.2%) and 104 of the single-parent households (13.2%) are living below the poverty level. Within the married-couple family households, those with no children have the highest poverty rate, with 88 households (7.1%) falling below the poverty line. Among the single-parent households, those with no children have the highest poverty rate, with 50 household (17.7%) living below poverty.
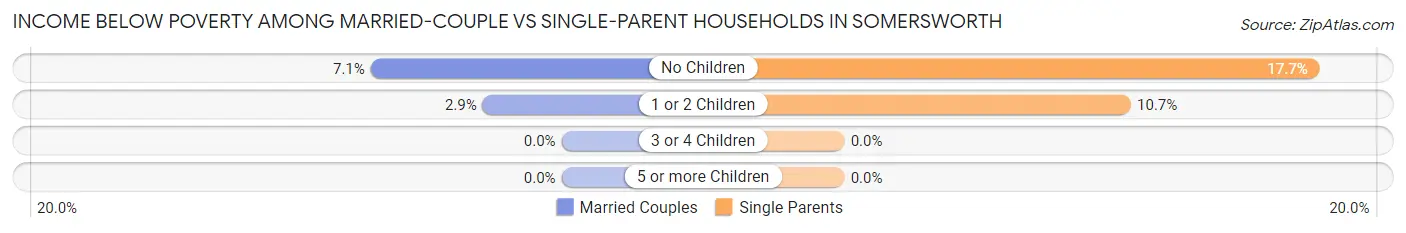
| Children | Married-Couple Families | Single-Parent Households |
| No Children | 88 (7.1%) | 50 (17.7%) |
| 1 or 2 Children | 29 (2.9%) | 54 (10.7%) |
| 3 or 4 Children | 0 (0.0%) | 0 (0.0%) |
| 5 or more Children | 0 (0.0%) | 0 (0.0%) |
| Total | 117 (5.2%) | 104 (13.2%) |
Race in Somersworth
The most populous races in Somersworth are White / Caucasian (10,243 | 85.4%), Two or more Races (765 | 6.4%), and Hispanic or Latino (553 | 4.6%).
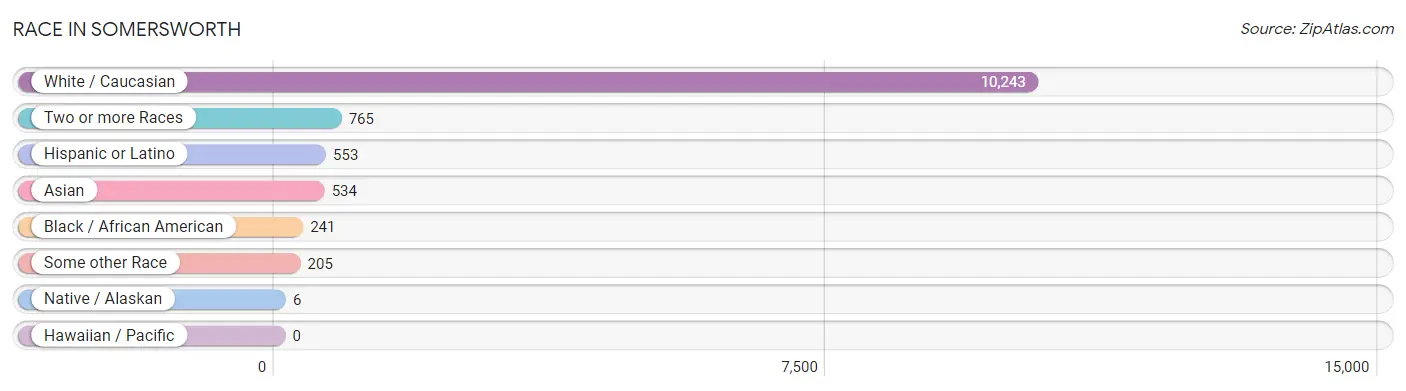
| Race | # Population | % Population |
| Asian | 534 | 4.4% |
| Black / African American | 241 | 2.0% |
| Hawaiian / Pacific | 0 | 0.0% |
| Hispanic or Latino | 553 | 4.6% |
| Native / Alaskan | 6 | 0.1% |
| White / Caucasian | 10,243 | 85.4% |
| Two or more Races | 765 | 6.4% |
| Some other Race | 205 | 1.7% |
| Total | 11,994 | 100.0% |
Ancestry in Somersworth
The most populous ancestries reported in Somersworth are Irish (2,599 | 21.7%), English (1,758 | 14.7%), French (1,661 | 13.9%), German (1,120 | 9.3%), and Italian (1,057 | 8.8%), together accounting for 68.3% of all Somersworth residents.
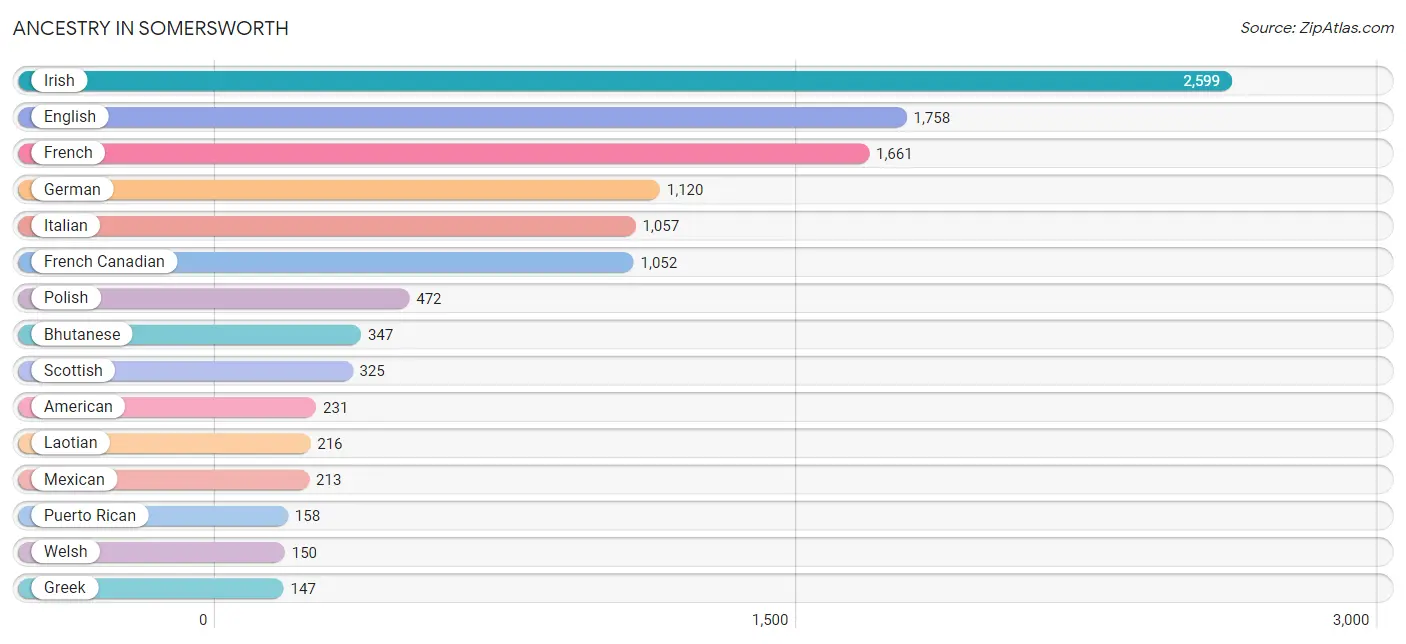
| Ancestry | # Population | % Population |
| American | 231 | 1.9% |
| Arab | 94 | 0.8% |
| Armenian | 11 | 0.1% |
| Austrian | 14 | 0.1% |
| Belgian | 35 | 0.3% |
| Bhutanese | 347 | 2.9% |
| Brazilian | 28 | 0.2% |
| British | 23 | 0.2% |
| Burmese | 20 | 0.2% |
| Canadian | 73 | 0.6% |
| Celtic | 11 | 0.1% |
| Central American | 68 | 0.6% |
| Czech | 12 | 0.1% |
| Dominican | 21 | 0.2% |
| Dutch | 69 | 0.6% |
| Ecuadorian | 67 | 0.6% |
| English | 1,758 | 14.7% |
| European | 134 | 1.1% |
| Finnish | 23 | 0.2% |
| French | 1,661 | 13.9% |
| French Canadian | 1,052 | 8.8% |
| German | 1,120 | 9.3% |
| Greek | 147 | 1.2% |
| Guatemalan | 68 | 0.6% |
| Hungarian | 10 | 0.1% |
| Indian (Asian) | 80 | 0.7% |
| Iranian | 13 | 0.1% |
| Irish | 2,599 | 21.7% |
| Italian | 1,057 | 8.8% |
| Jamaican | 38 | 0.3% |
| Korean | 31 | 0.3% |
| Laotian | 216 | 1.8% |
| Lebanese | 94 | 0.8% |
| Lithuanian | 71 | 0.6% |
| Mexican | 213 | 1.8% |
| Northern European | 42 | 0.4% |
| Norwegian | 108 | 0.9% |
| Polish | 472 | 3.9% |
| Portuguese | 12 | 0.1% |
| Puerto Rican | 158 | 1.3% |
| Russian | 12 | 0.1% |
| Scotch-Irish | 30 | 0.3% |
| Scottish | 325 | 2.7% |
| Slovak | 19 | 0.2% |
| South American | 67 | 0.6% |
| Spaniard | 2 | 0.0% |
| Spanish | 24 | 0.2% |
| Sri Lankan | 147 | 1.2% |
| Swedish | 135 | 1.1% |
| Welsh | 150 | 1.3% | View All 50 Rows |
Immigrants in Somersworth
The most numerous immigrant groups reported in Somersworth came from Asia (461 | 3.8%), South Eastern Asia (181 | 1.5%), Eastern Asia (135 | 1.1%), Europe (117 | 1.0%), and Philippines (116 | 1.0%), together accounting for 8.4% of all Somersworth residents.
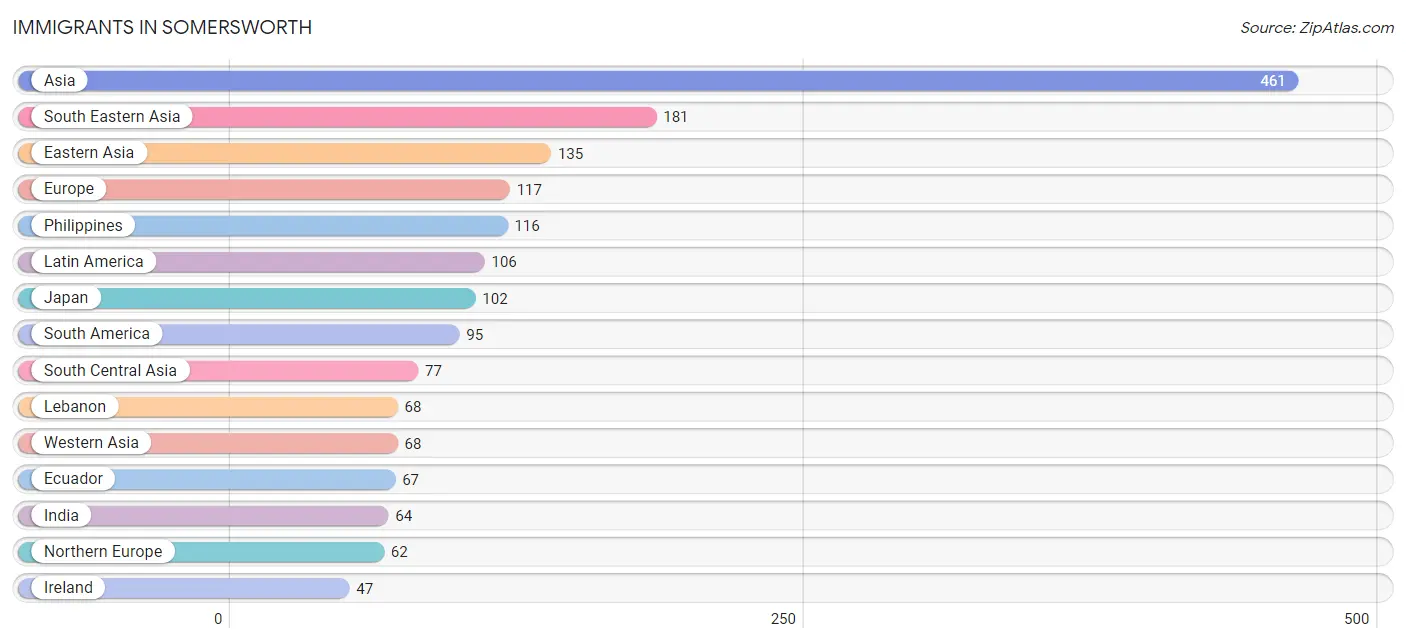
| Immigration Origin | # Population | % Population |
| Asia | 461 | 3.8% |
| Belgium | 19 | 0.2% |
| Brazil | 28 | 0.2% |
| Canada | 32 | 0.3% |
| Caribbean | 11 | 0.1% |
| China | 33 | 0.3% |
| Dominican Republic | 11 | 0.1% |
| Eastern Asia | 135 | 1.1% |
| Eastern Europe | 12 | 0.1% |
| Ecuador | 67 | 0.6% |
| Europe | 117 | 1.0% |
| Germany | 24 | 0.2% |
| India | 64 | 0.5% |
| Indonesia | 38 | 0.3% |
| Iran | 13 | 0.1% |
| Ireland | 47 | 0.4% |
| Japan | 102 | 0.9% |
| Latin America | 106 | 0.9% |
| Lebanon | 68 | 0.6% |
| Northern Europe | 62 | 0.5% |
| Philippines | 116 | 1.0% |
| Russia | 12 | 0.1% |
| Scotland | 15 | 0.1% |
| South America | 95 | 0.8% |
| South Central Asia | 77 | 0.6% |
| South Eastern Asia | 181 | 1.5% |
| Vietnam | 27 | 0.2% |
| Western Asia | 68 | 0.6% |
| Western Europe | 43 | 0.4% | View All 29 Rows |
Sex and Age in Somersworth
Sex and Age in Somersworth
The most populous age groups in Somersworth are 25 to 29 Years (709 | 11.6%) for men and 25 to 29 Years (646 | 10.9%) for women.
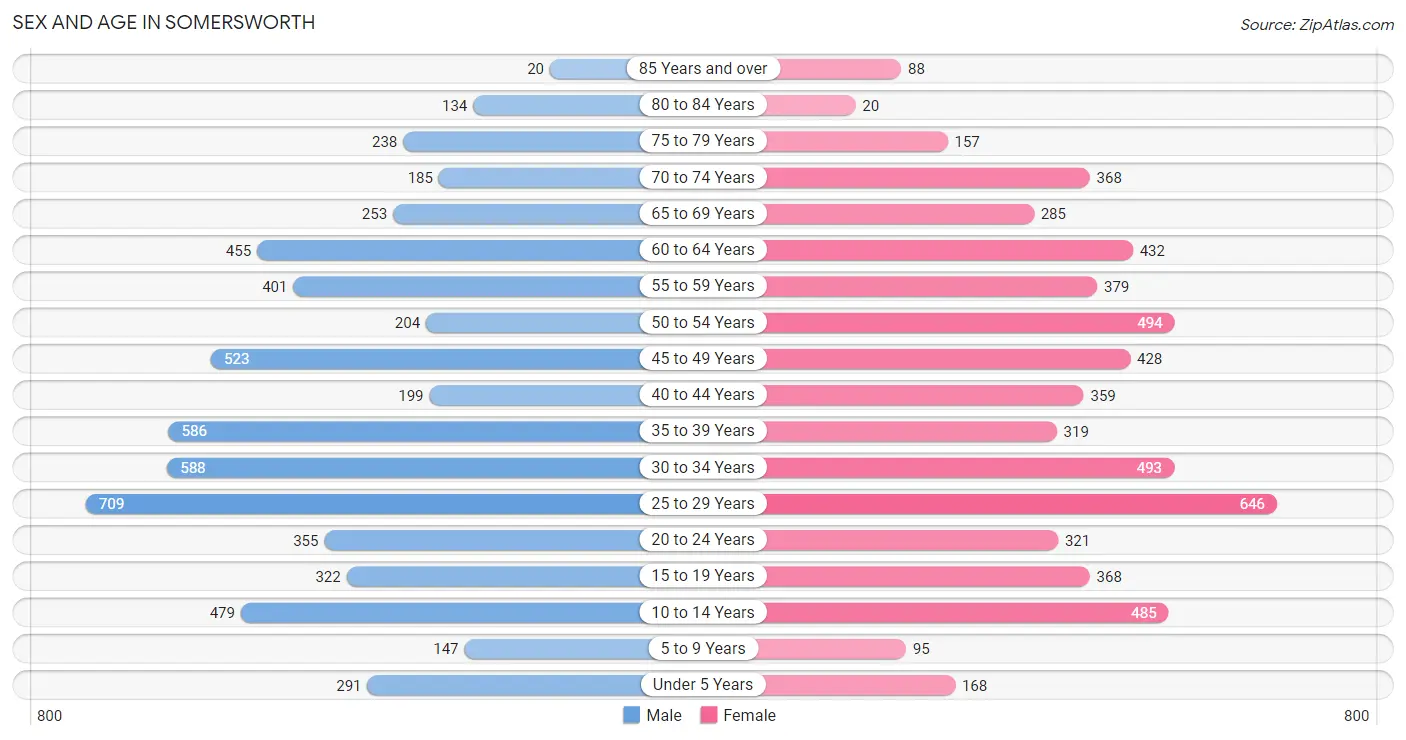
| Age Bracket | Male | Female |
| Under 5 Years | 291 (4.8%) | 168 (2.9%) |
| 5 to 9 Years | 147 (2.4%) | 95 (1.6%) |
| 10 to 14 Years | 479 (7.9%) | 485 (8.2%) |
| 15 to 19 Years | 322 (5.3%) | 368 (6.2%) |
| 20 to 24 Years | 355 (5.8%) | 321 (5.4%) |
| 25 to 29 Years | 709 (11.6%) | 646 (10.9%) |
| 30 to 34 Years | 588 (9.7%) | 493 (8.4%) |
| 35 to 39 Years | 586 (9.6%) | 319 (5.4%) |
| 40 to 44 Years | 199 (3.3%) | 359 (6.1%) |
| 45 to 49 Years | 523 (8.6%) | 428 (7.2%) |
| 50 to 54 Years | 204 (3.4%) | 494 (8.4%) |
| 55 to 59 Years | 401 (6.6%) | 379 (6.4%) |
| 60 to 64 Years | 455 (7.5%) | 432 (7.3%) |
| 65 to 69 Years | 253 (4.2%) | 285 (4.8%) |
| 70 to 74 Years | 185 (3.0%) | 368 (6.2%) |
| 75 to 79 Years | 238 (3.9%) | 157 (2.7%) |
| 80 to 84 Years | 134 (2.2%) | 20 (0.3%) |
| 85 Years and over | 20 (0.3%) | 88 (1.5%) |
| Total | 6,089 (100.0%) | 5,905 (100.0%) |
Families and Households in Somersworth
Median Family Size in Somersworth
The median family size in Somersworth is 2.74 persons per family, with single female/mother families (566 | 18.6%) accounting for the largest median family size of 2.89 persons per family. On the other hand, single male/father families (222 | 7.3%) represent the smallest median family size with 2.38 persons per family.
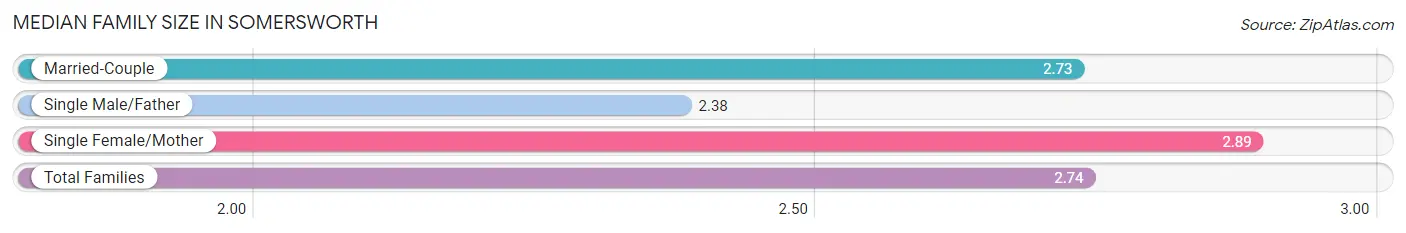
| Family Type | # Families | Family Size |
| Married-Couple | 2,258 (74.1%) | 2.73 |
| Single Male/Father | 222 (7.3%) | 2.38 |
| Single Female/Mother | 566 (18.6%) | 2.89 |
| Total Families | 3,046 (100.0%) | 2.74 |
Median Household Size in Somersworth
The median household size in Somersworth is 2.29 persons per household, with single female/mother households (566 | 10.8%) accounting for the largest median household size of 3.41 persons per household. non-family households (2,186 | 41.8%) represent the smallest median household size with 1.39 persons per household.
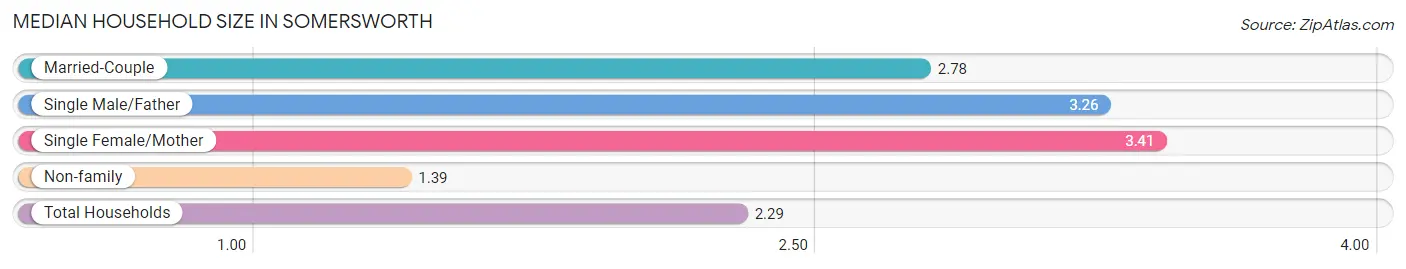
| Household Type | # Households | Household Size |
| Married-Couple | 2,258 (43.2%) | 2.78 |
| Single Male/Father | 222 (4.2%) | 3.26 |
| Single Female/Mother | 566 (10.8%) | 3.41 |
| Non-family | 2,186 (41.8%) | 1.39 |
| Total Households | 5,232 (100.0%) | 2.29 |
Household Size by Marriage Status in Somersworth
Out of a total of 5,232 households in Somersworth, 3,046 (58.2%) are family households, while 2,186 (41.8%) are nonfamily households. The most numerous type of family households are 2-person households, comprising 1,252, and the most common type of nonfamily households are 1-person households, comprising 1,692.
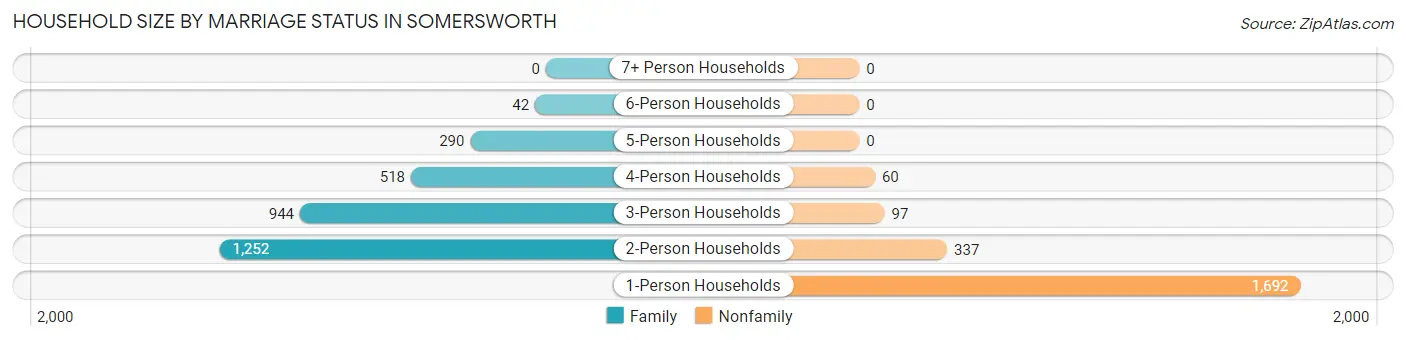
| Household Size | Family Households | Nonfamily Households |
| 1-Person Households | - | 1,692 (32.3%) |
| 2-Person Households | 1,252 (23.9%) | 337 (6.4%) |
| 3-Person Households | 944 (18.0%) | 97 (1.8%) |
| 4-Person Households | 518 (9.9%) | 60 (1.1%) |
| 5-Person Households | 290 (5.5%) | 0 (0.0%) |
| 6-Person Households | 42 (0.8%) | 0 (0.0%) |
| 7+ Person Households | 0 (0.0%) | 0 (0.0%) |
| Total | 3,046 (58.2%) | 2,186 (41.8%) |
Female Fertility in Somersworth
Fertility by Age in Somersworth
Average fertility rate in Somersworth is 64.0 births per 1,000 women. Women in the age bracket of 20 to 34 years have the highest fertility rate with 118.0 births per 1,000 women. Women in the age bracket of 20 to 34 years acount for 89.1% of all women with births.
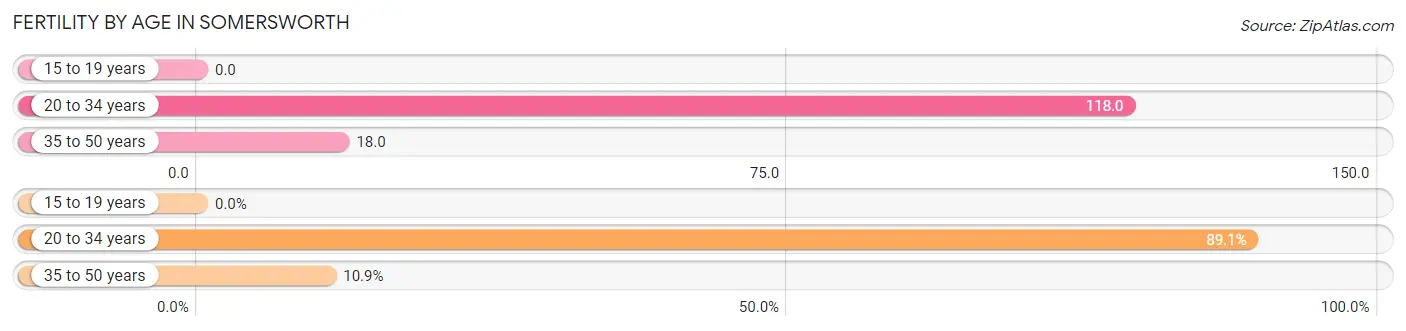
| Age Bracket | Women with Births | Births / 1,000 Women |
| 15 to 19 years | 0 (0.0%) | 0.0 |
| 20 to 34 years | 172 (89.1%) | 118.0 |
| 35 to 50 years | 21 (10.9%) | 18.0 |
| Total | 193 (100.0%) | 64.0 |
Fertility by Age by Marriage Status in Somersworth
51.8% of women with births (193) in Somersworth are married. The highest percentage of unmarried women with births falls into 35 to 50 years age bracket with 100.0% of them unmarried at the time of birth, while the lowest percentage of unmarried women with births belong to 20 to 34 years age bracket with 41.9% of them unmarried.
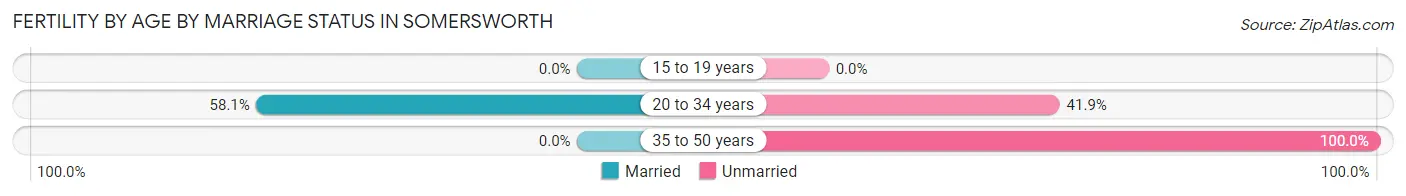
| Age Bracket | Married | Unmarried |
| 15 to 19 years | 0 (0.0%) | 0 (0.0%) |
| 20 to 34 years | 100 (58.1%) | 72 (41.9%) |
| 35 to 50 years | 0 (0.0%) | 21 (100.0%) |
| Total | 100 (51.8%) | 93 (48.2%) |
Fertility by Education in Somersworth
Average fertility rate in Somersworth is 64.0 births per 1,000 women. Women with the education attainment of high school diploma have the highest fertility rate of 142.0 births per 1,000 women, while women with the education attainment of bachelor's degree have the lowest fertility at 25.0 births per 1,000 women. Women with the education attainment of high school diploma represent 45.6% of all women with births.
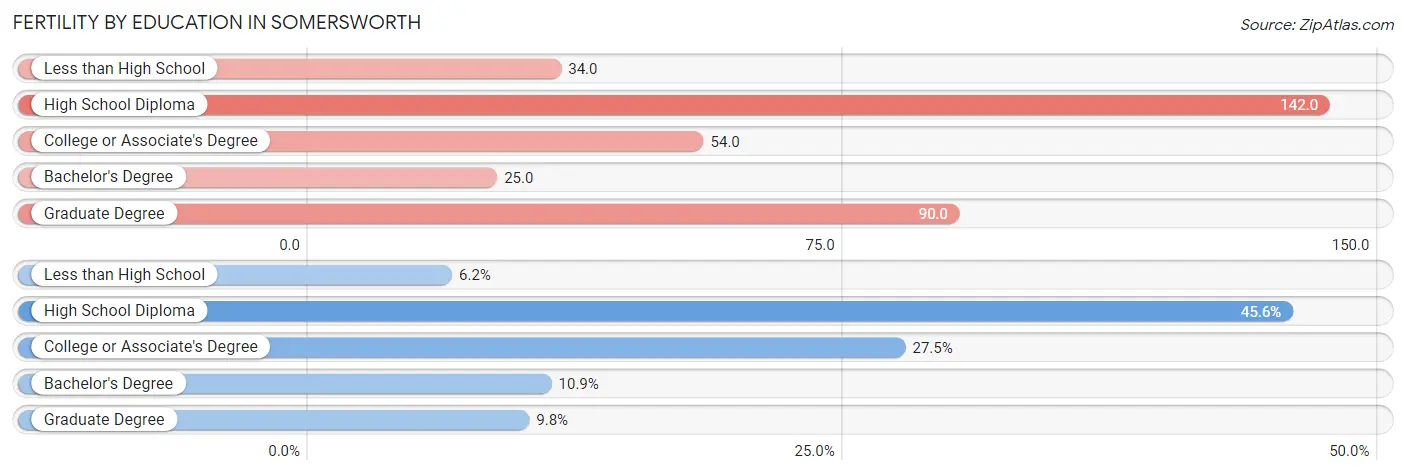
| Educational Attainment | Women with Births | Births / 1,000 Women |
| Less than High School | 12 (6.2%) | 34.0 |
| High School Diploma | 88 (45.6%) | 142.0 |
| College or Associate's Degree | 53 (27.5%) | 54.0 |
| Bachelor's Degree | 21 (10.9%) | 25.0 |
| Graduate Degree | 19 (9.8%) | 90.0 |
| Total | 193 (100.0%) | 64.0 |
Fertility by Education by Marriage Status in Somersworth
48.2% of women with births in Somersworth are unmarried. Women with the educational attainment of less than high school are most likely to be married with 100.0% of them married at childbirth, while women with the educational attainment of bachelor's degree are least likely to be married with 100.0% of them unmarried at childbirth.
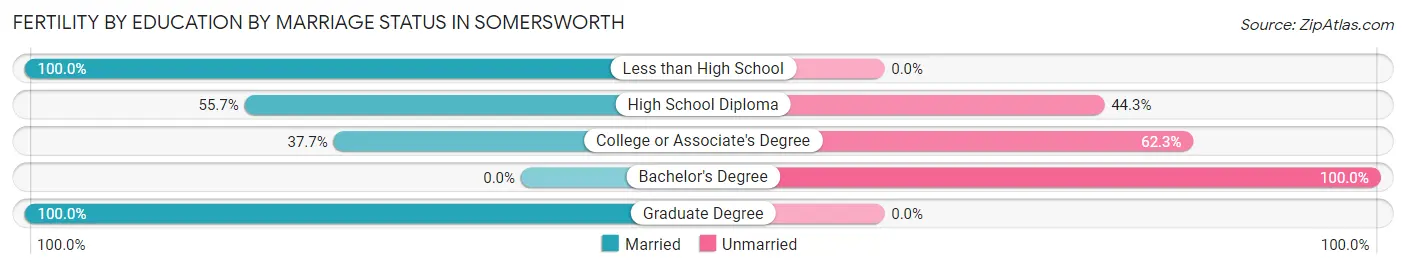
| Educational Attainment | Married | Unmarried |
| Less than High School | 12 (100.0%) | 0 (0.0%) |
| High School Diploma | 49 (55.7%) | 39 (44.3%) |
| College or Associate's Degree | 20 (37.7%) | 33 (62.3%) |
| Bachelor's Degree | 0 (0.0%) | 21 (100.0%) |
| Graduate Degree | 19 (100.0%) | 0 (0.0%) |
| Total | 100 (51.8%) | 93 (48.2%) |
Employment Characteristics in Somersworth
Employment by Class of Employer in Somersworth
Among the 6,930 employed individuals in Somersworth, private company employees (5,098 | 73.6%), not-for-profit organizations (573 | 8.3%), and federal government employees (543 | 7.8%) make up the most common classes of employment.
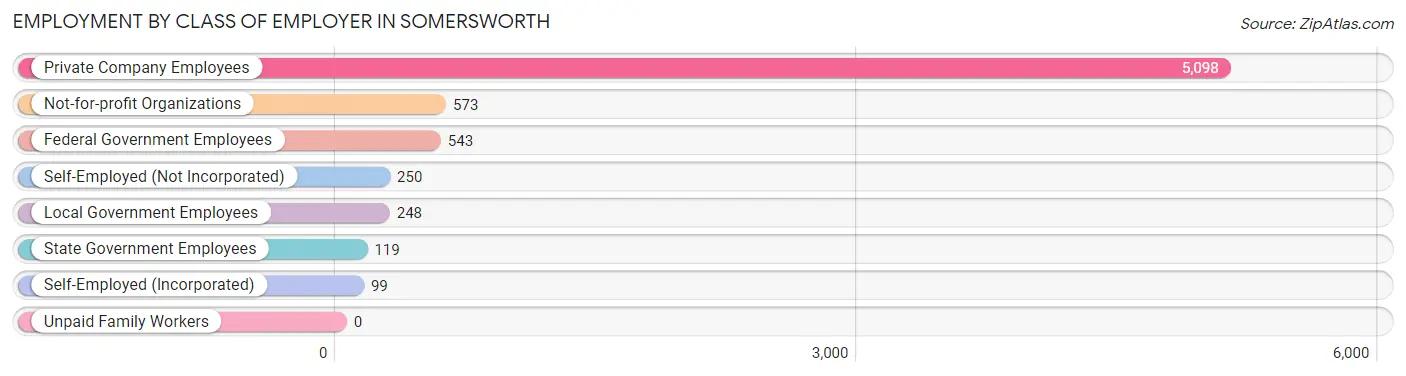
| Employer Class | # Employees | % Employees |
| Private Company Employees | 5,098 | 73.6% |
| Self-Employed (Incorporated) | 99 | 1.4% |
| Self-Employed (Not Incorporated) | 250 | 3.6% |
| Not-for-profit Organizations | 573 | 8.3% |
| Local Government Employees | 248 | 3.6% |
| State Government Employees | 119 | 1.7% |
| Federal Government Employees | 543 | 7.8% |
| Unpaid Family Workers | 0 | 0.0% |
| Total | 6,930 | 100.0% |
Employment Status by Age in Somersworth
According to the labor force statistics for Somersworth, out of the total population over 16 years of age (10,168), 72.2% or 7,341 individuals are in the labor force, with 2.8% or 206 of them unemployed. The age group with the highest labor force participation rate is 25 to 29 years, with 96.1% or 1,302 individuals in the labor force. Within the labor force, the 55 to 59 years age range has the highest percentage of unemployed individuals, with 5.3% or 25 of them being unemployed.
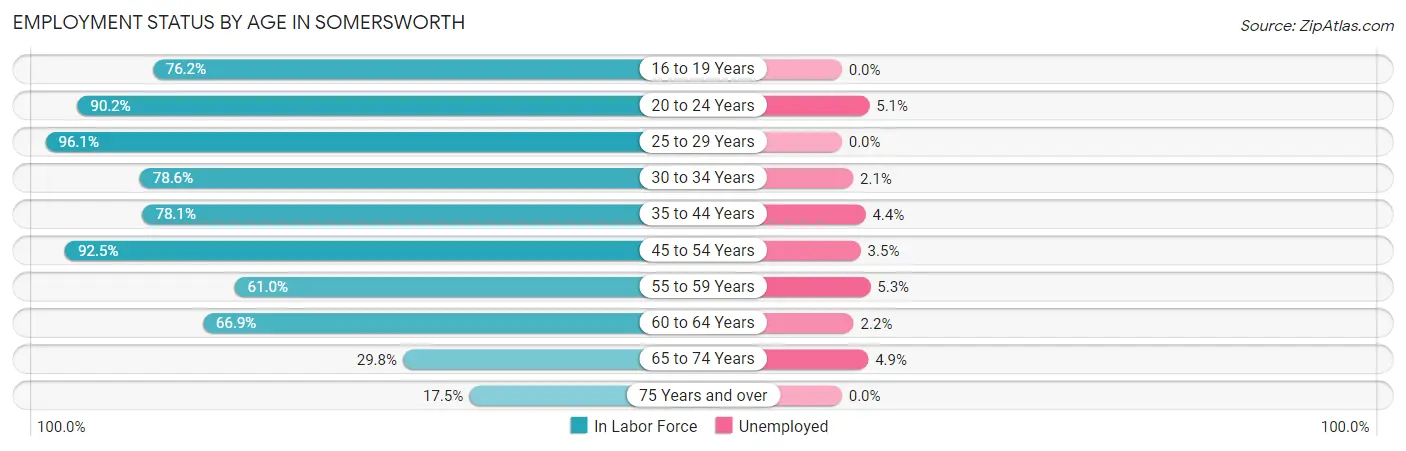
| Age Bracket | In Labor Force | Unemployed |
| 16 to 19 Years | 403 (76.2%) | 0 (0.0%) |
| 20 to 24 Years | 610 (90.2%) | 31 (5.1%) |
| 25 to 29 Years | 1,302 (96.1%) | 0 (0.0%) |
| 30 to 34 Years | 850 (78.6%) | 18 (2.1%) |
| 35 to 44 Years | 1,143 (78.1%) | 50 (4.4%) |
| 45 to 54 Years | 1,525 (92.5%) | 53 (3.5%) |
| 55 to 59 Years | 476 (61.0%) | 25 (5.3%) |
| 60 to 64 Years | 593 (66.9%) | 13 (2.2%) |
| 65 to 74 Years | 325 (29.8%) | 16 (4.9%) |
| 75 Years and over | 115 (17.5%) | 0 (0.0%) |
| Total | 7,341 (72.2%) | 206 (2.8%) |
Employment Status by Educational Attainment in Somersworth
According to labor force statistics for Somersworth, 81.6% of individuals (5,887) out of the total population between 25 and 64 years of age (7,215) are in the labor force, with 2.7% or 159 of them being unemployed. The group with the highest labor force participation rate are those with the educational attainment of college / associate degree, with 86.1% or 2,624 individuals in the labor force. Within the labor force, individuals with less than high school education have the highest percentage of unemployment, with 4.9% or 13 of them being unemployed.
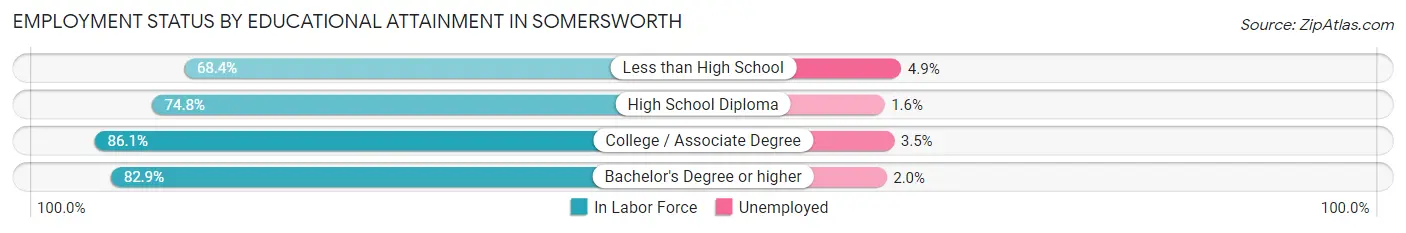
| Educational Attainment | In Labor Force | Unemployed |
| Less than High School | 266 (68.4%) | 19 (4.9%) |
| High School Diploma | 1,221 (74.8%) | 26 (1.6%) |
| College / Associate Degree | 2,624 (86.1%) | 107 (3.5%) |
| Bachelor's Degree or higher | 1,779 (82.9%) | 43 (2.0%) |
| Total | 5,887 (81.6%) | 195 (2.7%) |
Employment Occupations by Sex in Somersworth
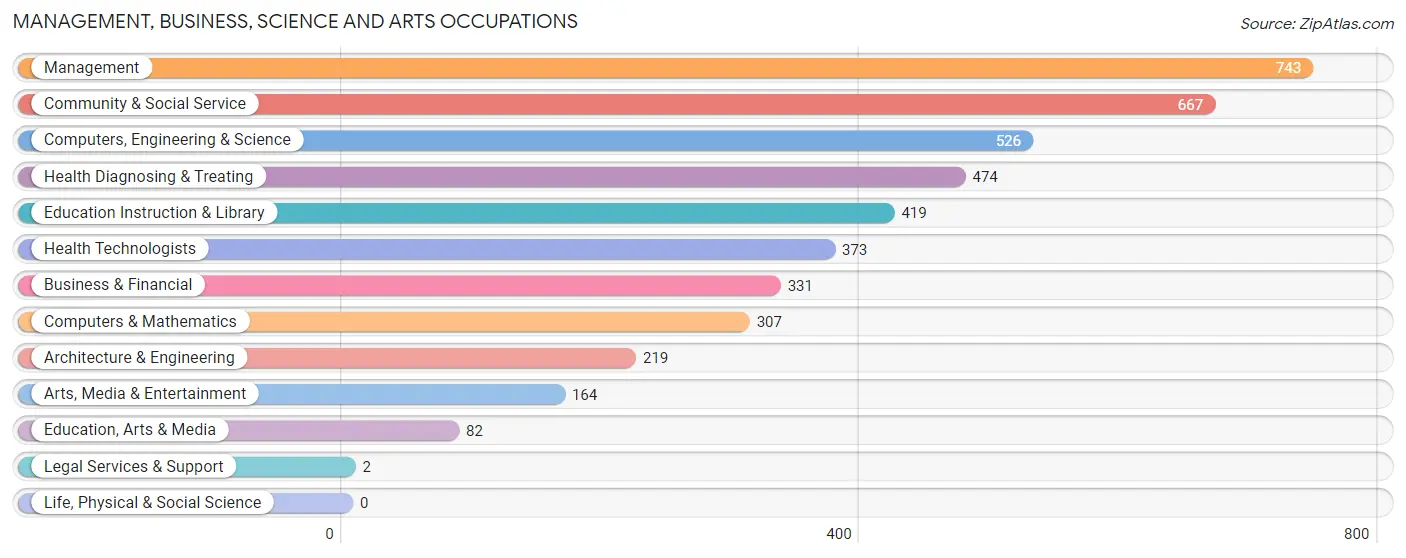
Management, Business, Science and Arts Occupations
The most common Management, Business, Science and Arts occupations in Somersworth are Management (743 | 10.6%), Community & Social Service (667 | 9.6%), Computers, Engineering & Science (526 | 7.5%), Health Diagnosing & Treating (474 | 6.8%), and Education Instruction & Library (419 | 6.0%).
Management, Business, Science and Arts Occupations by Sex
Within the Management, Business, Science and Arts occupations in Somersworth, the most male-oriented occupations are Computers & Mathematics (85.0%), Computers, Engineering & Science (85.0%), and Architecture & Engineering (84.9%), while the most female-oriented occupations are Legal Services & Support (100.0%), Health Diagnosing & Treating (97.3%), and Health Technologists (96.5%).
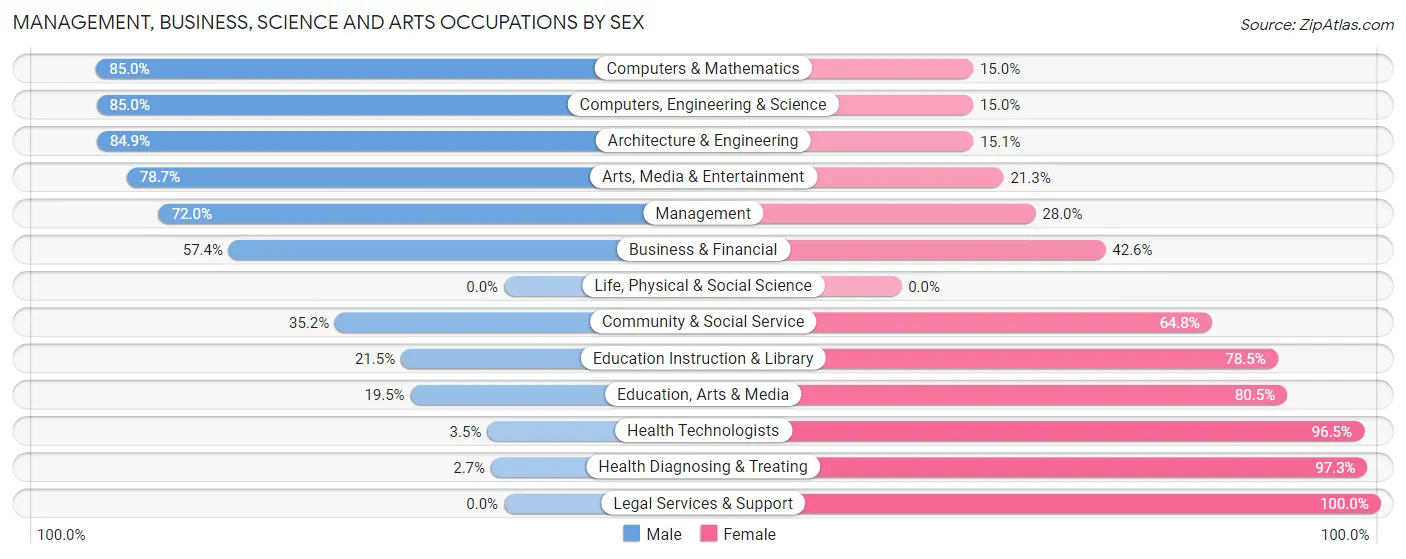
| Occupation | Male | Female |
| Management | 535 (72.0%) | 208 (28.0%) |
| Business & Financial | 190 (57.4%) | 141 (42.6%) |
| Computers, Engineering & Science | 447 (85.0%) | 79 (15.0%) |
| Computers & Mathematics | 261 (85.0%) | 46 (15.0%) |
| Architecture & Engineering | 186 (84.9%) | 33 (15.1%) |
| Life, Physical & Social Science | 0 (0.0%) | 0 (0.0%) |
| Community & Social Service | 235 (35.2%) | 432 (64.8%) |
| Education, Arts & Media | 16 (19.5%) | 66 (80.5%) |
| Legal Services & Support | 0 (0.0%) | 2 (100.0%) |
| Education Instruction & Library | 90 (21.5%) | 329 (78.5%) |
| Arts, Media & Entertainment | 129 (78.7%) | 35 (21.3%) |
| Health Diagnosing & Treating | 13 (2.7%) | 461 (97.3%) |
| Health Technologists | 13 (3.5%) | 360 (96.5%) |
| Total (Category) | 1,420 (51.8%) | 1,321 (48.2%) |
| Total (Overall) | 3,773 (54.0%) | 3,214 (46.0%) |
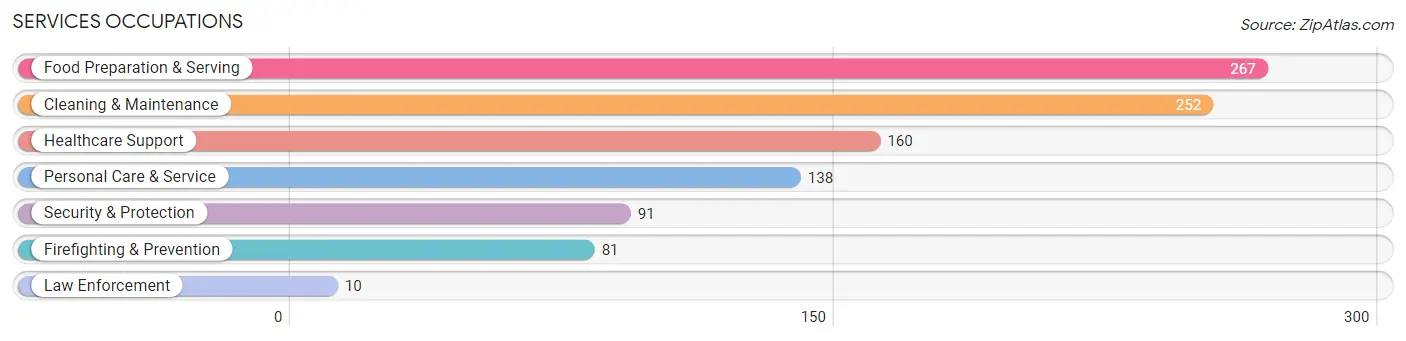
Services Occupations
The most common Services occupations in Somersworth are Food Preparation & Serving (267 | 3.8%), Cleaning & Maintenance (252 | 3.6%), Healthcare Support (160 | 2.3%), Personal Care & Service (138 | 2.0%), and Security & Protection (91 | 1.3%).
Services Occupations by Sex
Within the Services occupations in Somersworth, the most male-oriented occupations are Security & Protection (100.0%), Firefighting & Prevention (100.0%), and Law Enforcement (100.0%), while the most female-oriented occupations are Personal Care & Service (87.0%), Healthcare Support (78.7%), and Food Preparation & Serving (69.3%).
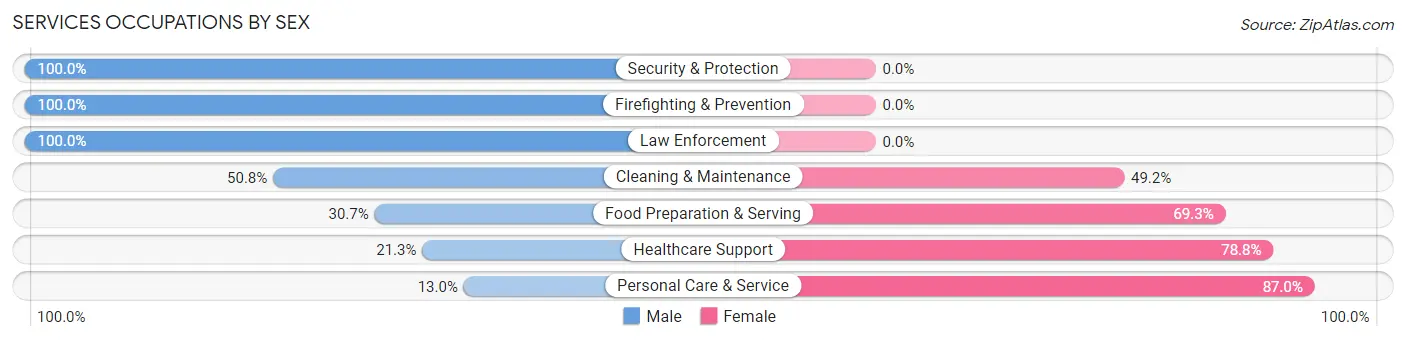
| Occupation | Male | Female |
| Healthcare Support | 34 (21.2%) | 126 (78.7%) |
| Security & Protection | 91 (100.0%) | 0 (0.0%) |
| Firefighting & Prevention | 81 (100.0%) | 0 (0.0%) |
| Law Enforcement | 10 (100.0%) | 0 (0.0%) |
| Food Preparation & Serving | 82 (30.7%) | 185 (69.3%) |
| Cleaning & Maintenance | 128 (50.8%) | 124 (49.2%) |
| Personal Care & Service | 18 (13.0%) | 120 (87.0%) |
| Total (Category) | 353 (38.9%) | 555 (61.1%) |
| Total (Overall) | 3,773 (54.0%) | 3,214 (46.0%) |
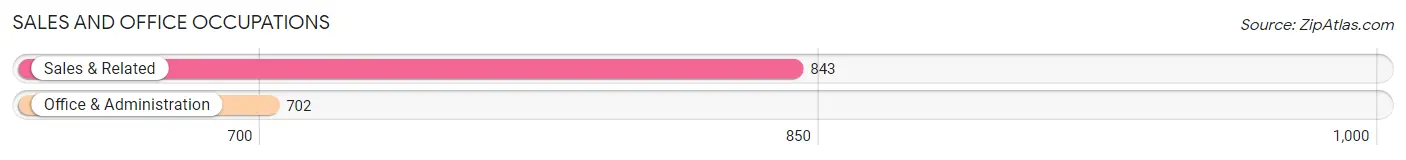
Sales and Office Occupations
The most common Sales and Office occupations in Somersworth are Sales & Related (843 | 12.1%), and Office & Administration (702 | 10.1%).
Sales and Office Occupations by Sex
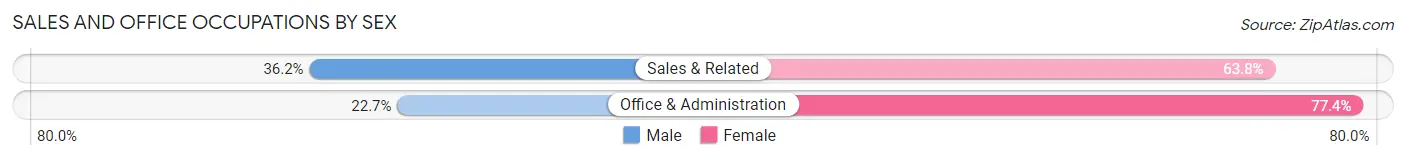
| Occupation | Male | Female |
| Sales & Related | 305 (36.2%) | 538 (63.8%) |
| Office & Administration | 159 (22.7%) | 543 (77.3%) |
| Total (Category) | 464 (30.0%) | 1,081 (70.0%) |
| Total (Overall) | 3,773 (54.0%) | 3,214 (46.0%) |
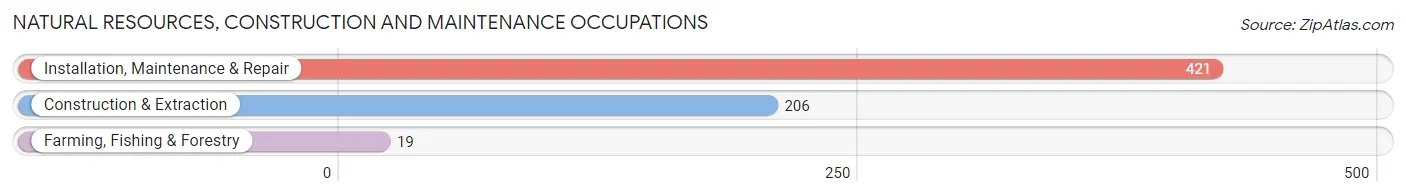
Natural Resources, Construction and Maintenance Occupations
The most common Natural Resources, Construction and Maintenance occupations in Somersworth are Installation, Maintenance & Repair (421 | 6.0%), Construction & Extraction (206 | 2.9%), and Farming, Fishing & Forestry (19 | 0.3%).
Natural Resources, Construction and Maintenance Occupations by Sex
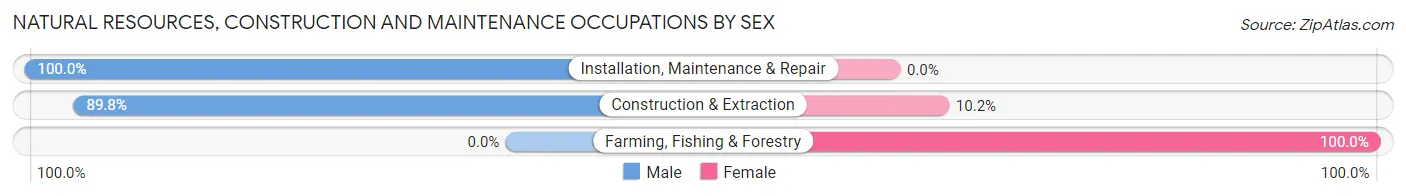
| Occupation | Male | Female |
| Farming, Fishing & Forestry | 0 (0.0%) | 19 (100.0%) |
| Construction & Extraction | 185 (89.8%) | 21 (10.2%) |
| Installation, Maintenance & Repair | 421 (100.0%) | 0 (0.0%) |
| Total (Category) | 606 (93.8%) | 40 (6.2%) |
| Total (Overall) | 3,773 (54.0%) | 3,214 (46.0%) |
Production, Transportation and Moving Occupations
The most common Production, Transportation and Moving occupations in Somersworth are Production (791 | 11.3%), Transportation (181 | 2.6%), and Material Moving (175 | 2.5%).
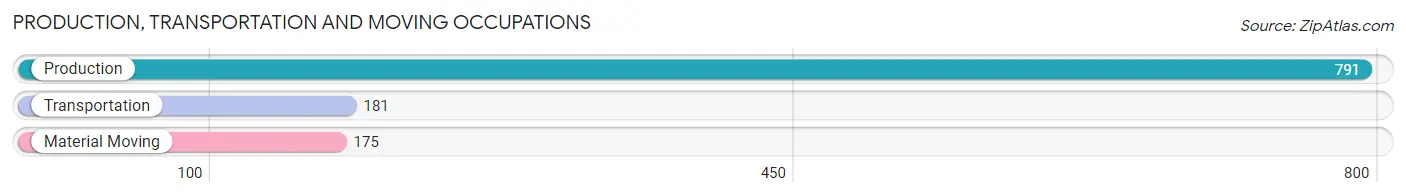
Production, Transportation and Moving Occupations by Sex
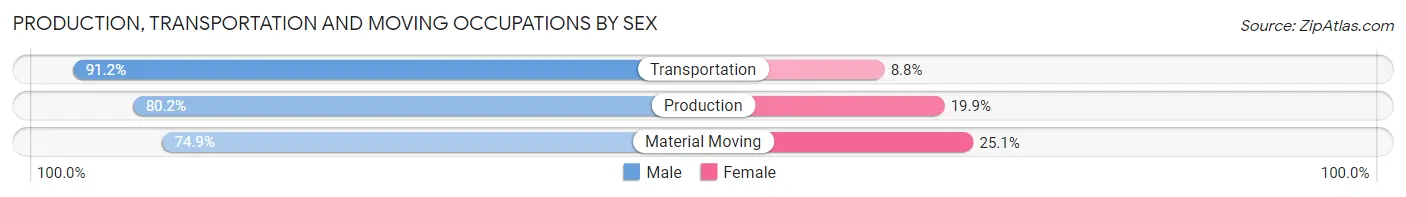
| Occupation | Male | Female |
| Production | 634 (80.1%) | 157 (19.9%) |
| Transportation | 165 (91.2%) | 16 (8.8%) |
| Material Moving | 131 (74.9%) | 44 (25.1%) |
| Total (Category) | 930 (81.1%) | 217 (18.9%) |
| Total (Overall) | 3,773 (54.0%) | 3,214 (46.0%) |
Employment Industries by Sex in Somersworth
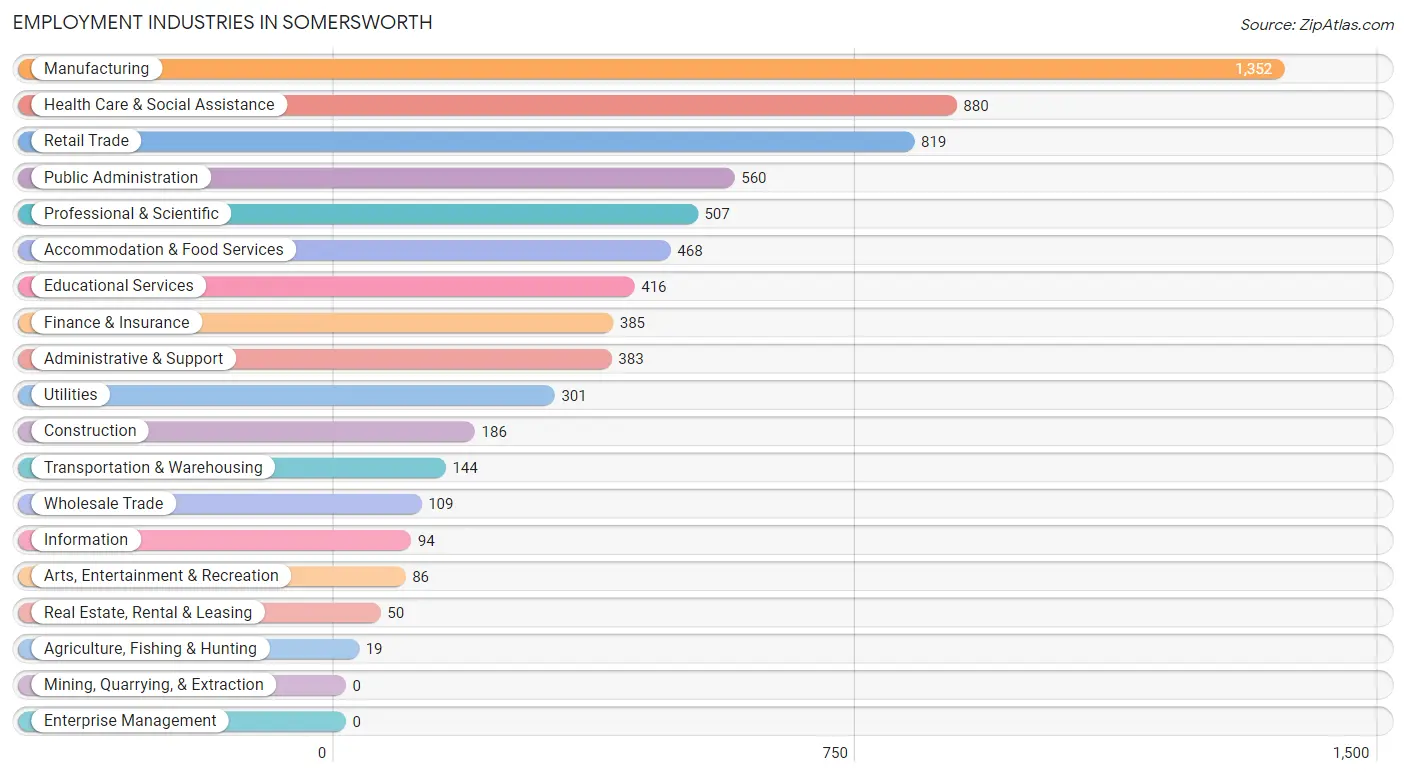
Employment Industries in Somersworth
The major employment industries in Somersworth include Manufacturing (1,352 | 19.4%), Health Care & Social Assistance (880 | 12.6%), Retail Trade (819 | 11.7%), Public Administration (560 | 8.0%), and Professional & Scientific (507 | 7.3%).
Employment Industries by Sex in Somersworth
The Somersworth industries that see more men than women are Transportation & Warehousing (100.0%), Construction (90.9%), and Arts, Entertainment & Recreation (87.2%), whereas the industries that tend to have a higher number of women are Agriculture, Fishing & Hunting (100.0%), Health Care & Social Assistance (93.2%), and Wholesale Trade (83.5%).
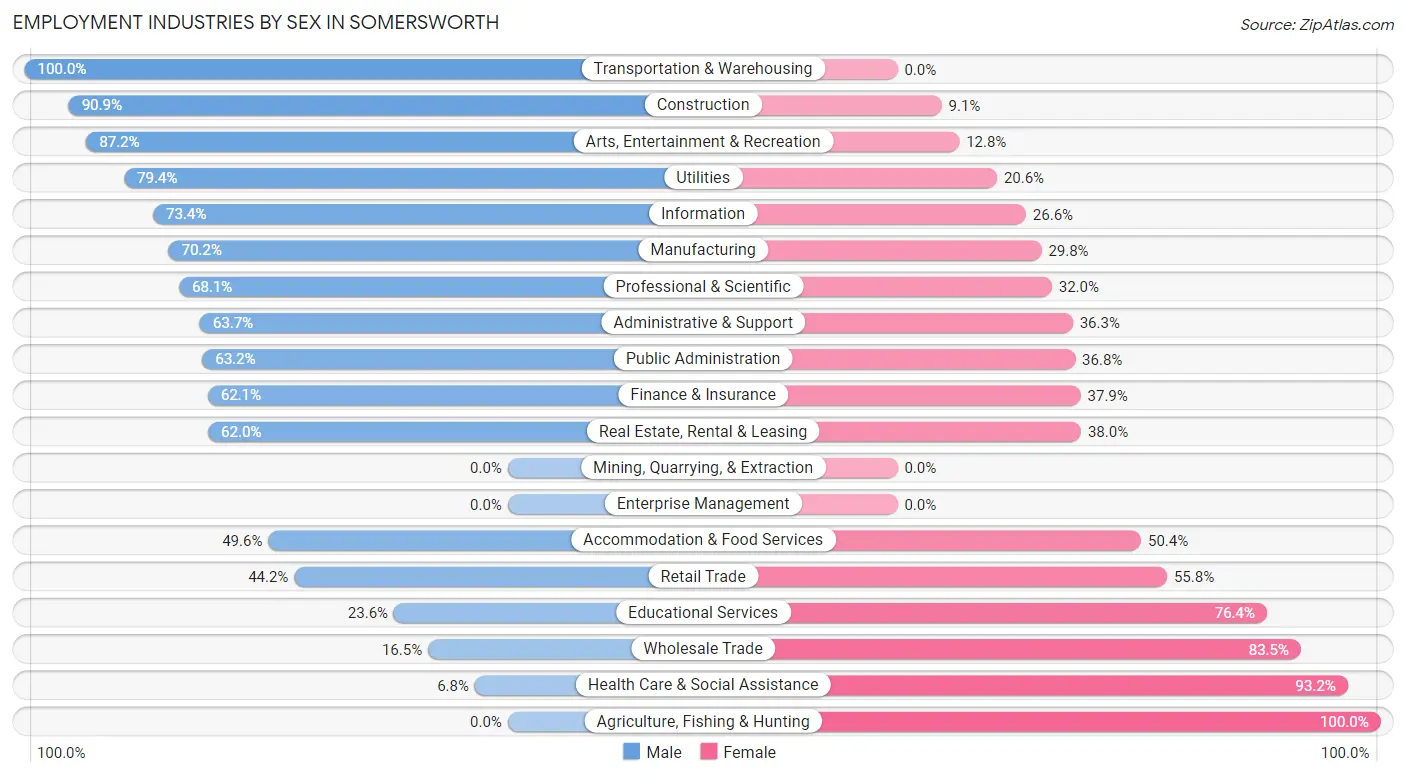
| Industry | Male | Female |
| Agriculture, Fishing & Hunting | 0 (0.0%) | 19 (100.0%) |
| Mining, Quarrying, & Extraction | 0 (0.0%) | 0 (0.0%) |
| Construction | 169 (90.9%) | 17 (9.1%) |
| Manufacturing | 949 (70.2%) | 403 (29.8%) |
| Wholesale Trade | 18 (16.5%) | 91 (83.5%) |
| Retail Trade | 362 (44.2%) | 457 (55.8%) |
| Transportation & Warehousing | 144 (100.0%) | 0 (0.0%) |
| Utilities | 239 (79.4%) | 62 (20.6%) |
| Information | 69 (73.4%) | 25 (26.6%) |
| Finance & Insurance | 239 (62.1%) | 146 (37.9%) |
| Real Estate, Rental & Leasing | 31 (62.0%) | 19 (38.0%) |
| Professional & Scientific | 345 (68.0%) | 162 (32.0%) |
| Enterprise Management | 0 (0.0%) | 0 (0.0%) |
| Administrative & Support | 244 (63.7%) | 139 (36.3%) |
| Educational Services | 98 (23.6%) | 318 (76.4%) |
| Health Care & Social Assistance | 60 (6.8%) | 820 (93.2%) |
| Arts, Entertainment & Recreation | 75 (87.2%) | 11 (12.8%) |
| Accommodation & Food Services | 232 (49.6%) | 236 (50.4%) |
| Public Administration | 354 (63.2%) | 206 (36.8%) |
| Total | 3,773 (54.0%) | 3,214 (46.0%) |
Education in Somersworth
School Enrollment in Somersworth
The most common levels of schooling among the 2,378 students in Somersworth are middle school (790 | 33.2%), college / undergraduate (532 | 22.4%), and high school (520 | 21.9%).
| School Level | # Students | % Students |
| Nursery / Preschool | 58 | 2.4% |
| Kindergarten | 0 | 0.0% |
| Elementary School | 353 | 14.8% |
| Middle School | 790 | 33.2% |
| High School | 520 | 21.9% |
| College / Undergraduate | 532 | 22.4% |
| Graduate / Professional | 125 | 5.3% |
| Total | 2,378 | 100.0% |
School Enrollment by Age by Funding Source in Somersworth
Out of a total of 2,378 students who are enrolled in schools in Somersworth, 473 (19.9%) attend a private institution, while the remaining 1,905 (80.1%) are enrolled in public schools. The age group of 25 to 34 year olds has the highest likelihood of being enrolled in private schools, with 151 (64.0% in the age bracket) enrolled. Conversely, the age group of 3 to 4 year olds has the lowest likelihood of being enrolled in a private school, with 48 (100.0% in the age bracket) attending a public institution.
| Age Bracket | Public School | Private School |
| 3 to 4 Year Olds | 48 (100.0%) | 0 (0.0%) |
| 5 to 9 Year Old | 208 (100.0%) | 0 (0.0%) |
| 10 to 14 Year Olds | 774 (80.3%) | 190 (19.7%) |
| 15 to 17 Year Olds | 407 (83.9%) | 78 (16.1%) |
| 18 to 19 Year Olds | 133 (95.7%) | 6 (4.3%) |
| 20 to 24 Year Olds | 166 (77.2%) | 49 (22.8%) |
| 25 to 34 Year Olds | 85 (36.0%) | 151 (64.0%) |
| 35 Years and over | 83 (100.0%) | 0 (0.0%) |
| Total | 1,905 (80.1%) | 473 (19.9%) |
Educational Attainment by Field of Study in Somersworth
Social sciences (427 | 15.2%), business (409 | 14.6%), bio, nature & agricultural (263 | 9.4%), education (222 | 7.9%), and psychology (206 | 7.3%) are the most common fields of study among 2,803 individuals in Somersworth who have obtained a bachelor's degree or higher.
| Field of Study | # Graduates | % Graduates |
| Computers & Mathematics | 147 | 5.2% |
| Bio, Nature & Agricultural | 263 | 9.4% |
| Physical & Health Sciences | 94 | 3.4% |
| Psychology | 206 | 7.3% |
| Social Sciences | 427 | 15.2% |
| Engineering | 149 | 5.3% |
| Multidisciplinary Studies | 0 | 0.0% |
| Science & Technology | 198 | 7.1% |
| Business | 409 | 14.6% |
| Education | 222 | 7.9% |
| Literature & Languages | 166 | 5.9% |
| Liberal Arts & History | 131 | 4.7% |
| Visual & Performing Arts | 160 | 5.7% |
| Communications | 81 | 2.9% |
| Arts & Humanities | 150 | 5.3% |
| Total | 2,803 | 100.0% |
Transportation & Commute in Somersworth
Vehicle Availability by Sex in Somersworth
The most prevalent vehicle ownership categories in Somersworth are males with 2 vehicles (1,819, accounting for 47.2%) and females with 2 vehicles (1,463, making up 59.2%).
| Vehicles Available | Male | Female |
| No Vehicle | 17 (0.4%) | 57 (1.8%) |
| 1 Vehicle | 716 (18.6%) | 579 (18.8%) |
| 2 Vehicles | 1,819 (47.2%) | 1,463 (47.6%) |
| 3 Vehicles | 627 (16.3%) | 395 (12.9%) |
| 4 Vehicles | 553 (14.3%) | 328 (10.7%) |
| 5 or more Vehicles | 123 (3.2%) | 253 (8.2%) |
| Total | 3,855 (100.0%) | 3,075 (100.0%) |
Commute Time in Somersworth
The most frequently occuring commute durations in Somersworth are 10 to 14 minutes (1,248 commuters, 19.4%), 20 to 24 minutes (1,022 commuters, 15.9%), and 30 to 34 minutes (710 commuters, 11.0%).
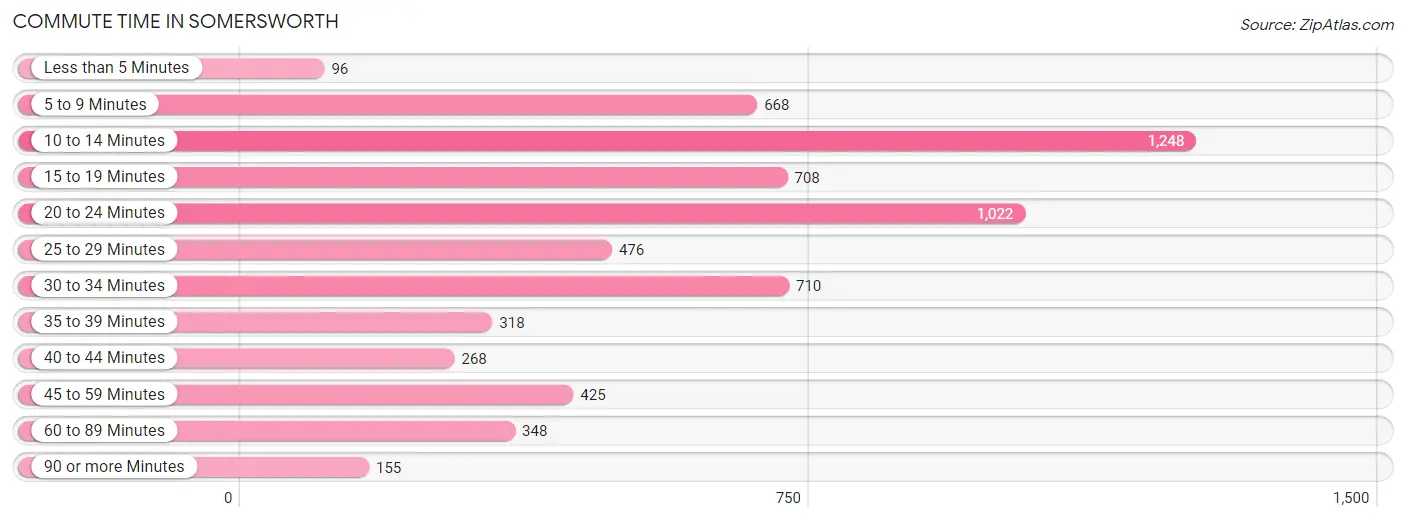
| Commute Time | # Commuters | % Commuters |
| Less than 5 Minutes | 96 | 1.5% |
| 5 to 9 Minutes | 668 | 10.4% |
| 10 to 14 Minutes | 1,248 | 19.4% |
| 15 to 19 Minutes | 708 | 11.0% |
| 20 to 24 Minutes | 1,022 | 15.9% |
| 25 to 29 Minutes | 476 | 7.4% |
| 30 to 34 Minutes | 710 | 11.0% |
| 35 to 39 Minutes | 318 | 4.9% |
| 40 to 44 Minutes | 268 | 4.2% |
| 45 to 59 Minutes | 425 | 6.6% |
| 60 to 89 Minutes | 348 | 5.4% |
| 90 or more Minutes | 155 | 2.4% |
Commute Time by Sex in Somersworth
The most common commute times in Somersworth are 20 to 24 minutes (783 commuters, 21.6%) for males and 10 to 14 minutes (673 commuters, 23.9%) for females.
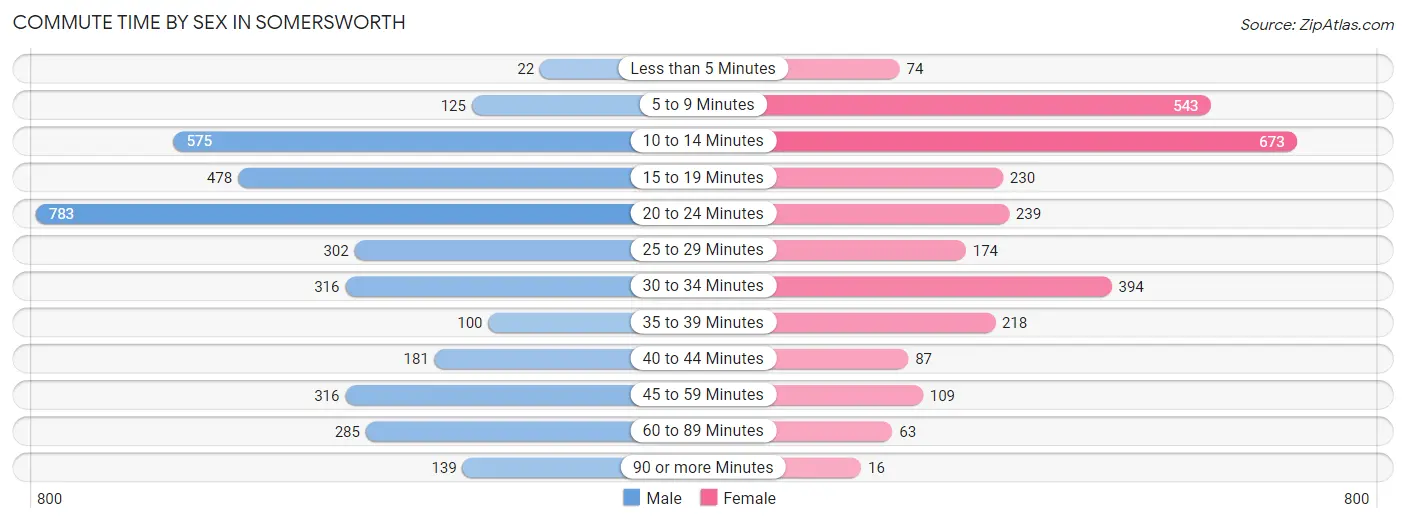
| Commute Time | Male | Female |
| Less than 5 Minutes | 22 (0.6%) | 74 (2.6%) |
| 5 to 9 Minutes | 125 (3.5%) | 543 (19.3%) |
| 10 to 14 Minutes | 575 (15.9%) | 673 (23.9%) |
| 15 to 19 Minutes | 478 (13.2%) | 230 (8.2%) |
| 20 to 24 Minutes | 783 (21.6%) | 239 (8.5%) |
| 25 to 29 Minutes | 302 (8.3%) | 174 (6.2%) |
| 30 to 34 Minutes | 316 (8.7%) | 394 (14.0%) |
| 35 to 39 Minutes | 100 (2.8%) | 218 (7.7%) |
| 40 to 44 Minutes | 181 (5.0%) | 87 (3.1%) |
| 45 to 59 Minutes | 316 (8.7%) | 109 (3.9%) |
| 60 to 89 Minutes | 285 (7.9%) | 63 (2.2%) |
| 90 or more Minutes | 139 (3.8%) | 16 (0.6%) |
Time of Departure to Work by Sex in Somersworth
The most frequent times of departure to work in Somersworth are 12:00 PM to 3:59 PM (570, 15.7%) for males and 6:00 AM to 6:29 AM (479, 17.0%) for females.
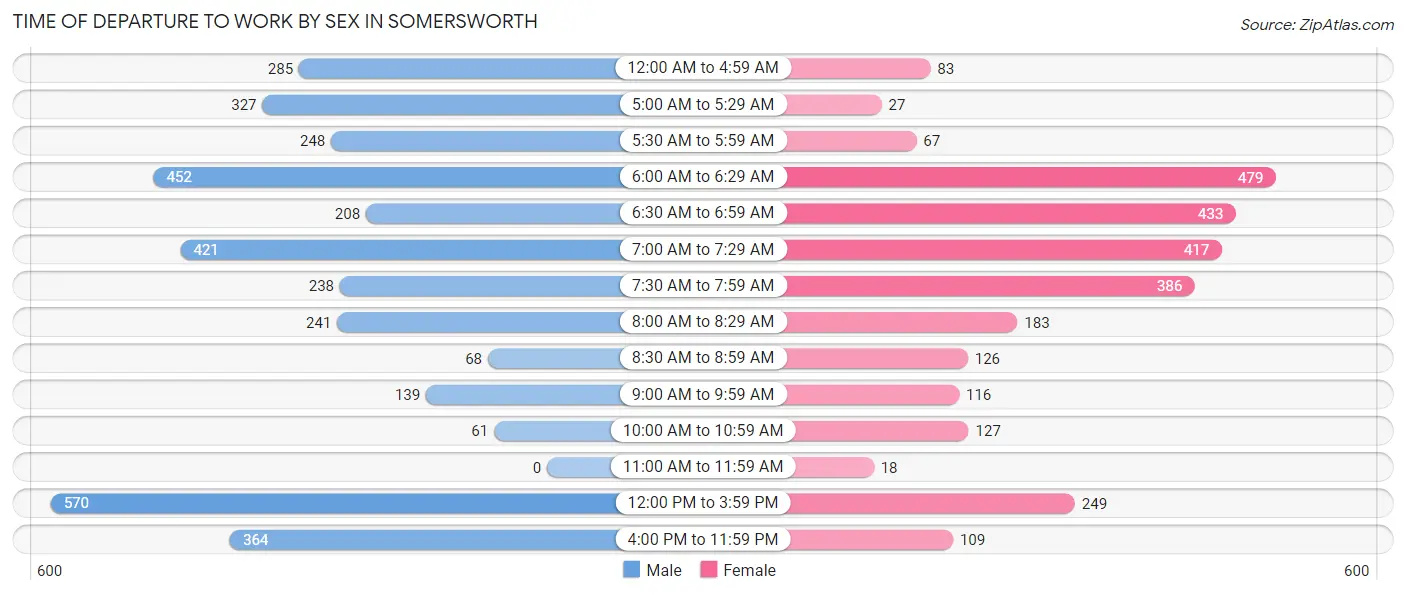
| Time of Departure | Male | Female |
| 12:00 AM to 4:59 AM | 285 (7.9%) | 83 (2.9%) |
| 5:00 AM to 5:29 AM | 327 (9.0%) | 27 (1.0%) |
| 5:30 AM to 5:59 AM | 248 (6.9%) | 67 (2.4%) |
| 6:00 AM to 6:29 AM | 452 (12.5%) | 479 (17.0%) |
| 6:30 AM to 6:59 AM | 208 (5.7%) | 433 (15.3%) |
| 7:00 AM to 7:29 AM | 421 (11.6%) | 417 (14.8%) |
| 7:30 AM to 7:59 AM | 238 (6.6%) | 386 (13.7%) |
| 8:00 AM to 8:29 AM | 241 (6.7%) | 183 (6.5%) |
| 8:30 AM to 8:59 AM | 68 (1.9%) | 126 (4.5%) |
| 9:00 AM to 9:59 AM | 139 (3.8%) | 116 (4.1%) |
| 10:00 AM to 10:59 AM | 61 (1.7%) | 127 (4.5%) |
| 11:00 AM to 11:59 AM | 0 (0.0%) | 18 (0.6%) |
| 12:00 PM to 3:59 PM | 570 (15.7%) | 249 (8.8%) |
| 4:00 PM to 11:59 PM | 364 (10.1%) | 109 (3.9%) |
| Total | 3,622 (100.0%) | 2,820 (100.0%) |
Housing Occupancy in Somersworth
Occupancy by Ownership in Somersworth
Of the total 5,232 dwellings in Somersworth, owner-occupied units account for 3,388 (64.8%), while renter-occupied units make up 1,844 (35.2%).
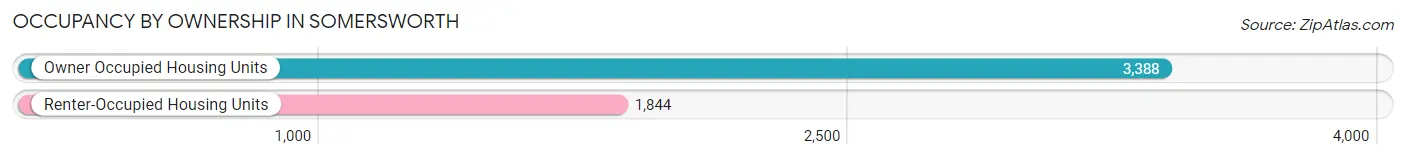
| Occupancy | # Housing Units | % Housing Units |
| Owner Occupied Housing Units | 3,388 | 64.8% |
| Renter-Occupied Housing Units | 1,844 | 35.2% |
| Total Occupied Housing Units | 5,232 | 100.0% |
Occupancy by Household Size in Somersworth
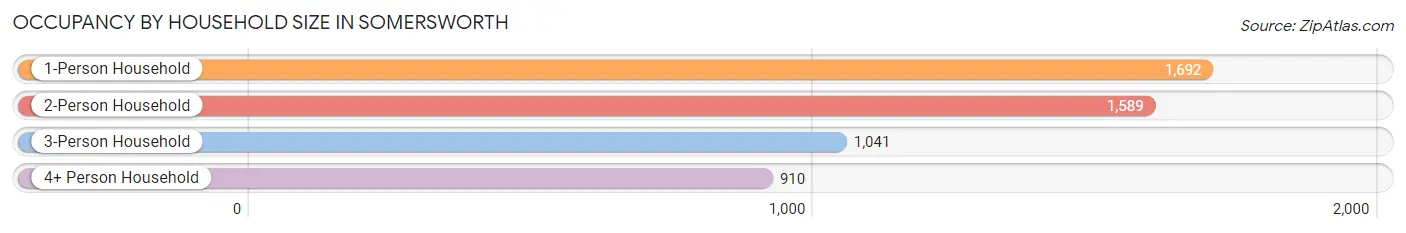
| Household Size | # Housing Units | % Housing Units |
| 1-Person Household | 1,692 | 32.3% |
| 2-Person Household | 1,589 | 30.4% |
| 3-Person Household | 1,041 | 19.9% |
| 4+ Person Household | 910 | 17.4% |
| Total Housing Units | 5,232 | 100.0% |
Occupancy by Ownership by Household Size in Somersworth
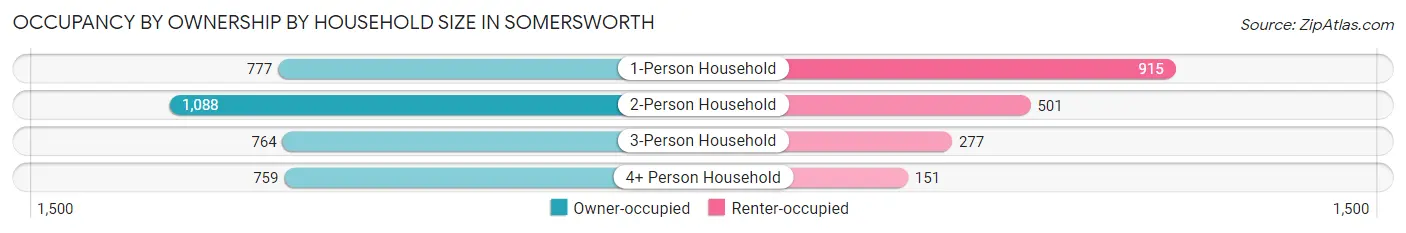
| Household Size | Owner-occupied | Renter-occupied |
| 1-Person Household | 777 (45.9%) | 915 (54.1%) |
| 2-Person Household | 1,088 (68.5%) | 501 (31.5%) |
| 3-Person Household | 764 (73.4%) | 277 (26.6%) |
| 4+ Person Household | 759 (83.4%) | 151 (16.6%) |
| Total Housing Units | 3,388 (64.8%) | 1,844 (35.2%) |
Occupancy by Educational Attainment in Somersworth
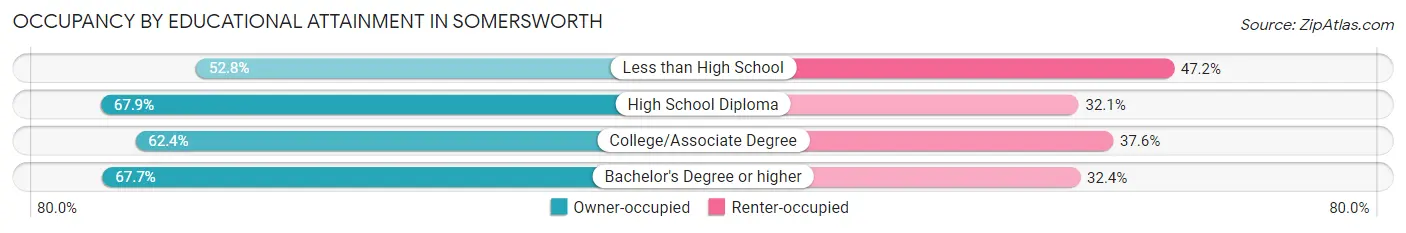
| Household Size | Owner-occupied | Renter-occupied |
| Less than High School | 104 (52.8%) | 93 (47.2%) |
| High School Diploma | 846 (67.9%) | 400 (32.1%) |
| College/Associate Degree | 1,497 (62.4%) | 901 (37.6%) |
| Bachelor's Degree or higher | 941 (67.6%) | 450 (32.4%) |
Occupancy by Age of Householder in Somersworth
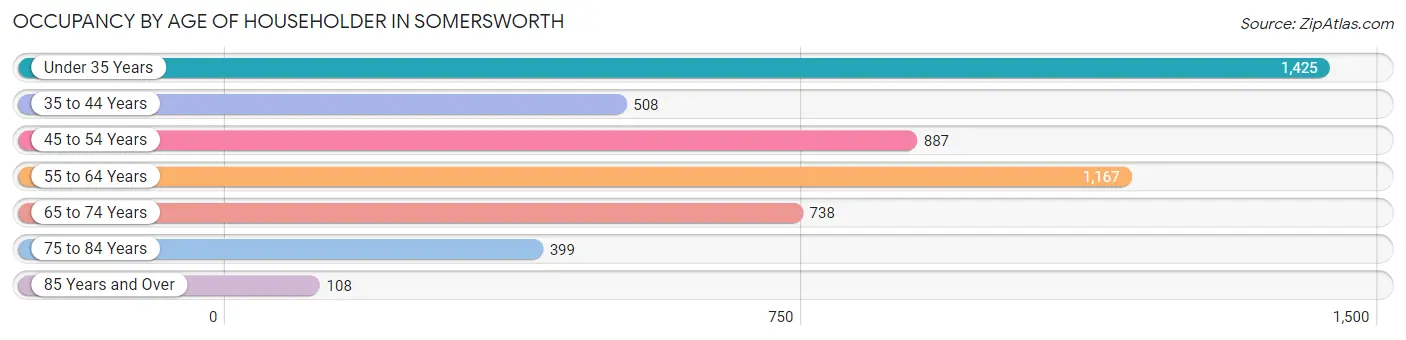
| Age Bracket | # Households | % Households |
| Under 35 Years | 1,425 | 27.2% |
| 35 to 44 Years | 508 | 9.7% |
| 45 to 54 Years | 887 | 17.0% |
| 55 to 64 Years | 1,167 | 22.3% |
| 65 to 74 Years | 738 | 14.1% |
| 75 to 84 Years | 399 | 7.6% |
| 85 Years and Over | 108 | 2.1% |
| Total | 5,232 | 100.0% |
Housing Finances in Somersworth
Median Income by Occupancy in Somersworth
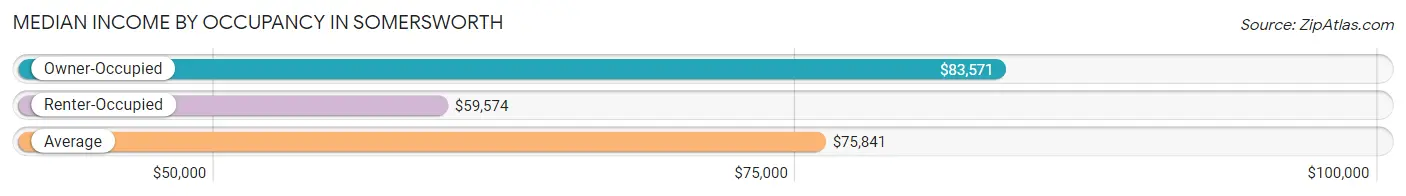
| Occupancy Type | # Households | Median Income |
| Owner-Occupied | 3,388 (64.8%) | $83,571 |
| Renter-Occupied | 1,844 (35.2%) | $59,574 |
| Average | 5,232 (100.0%) | $75,841 |
Occupancy by Householder Income Bracket in Somersworth
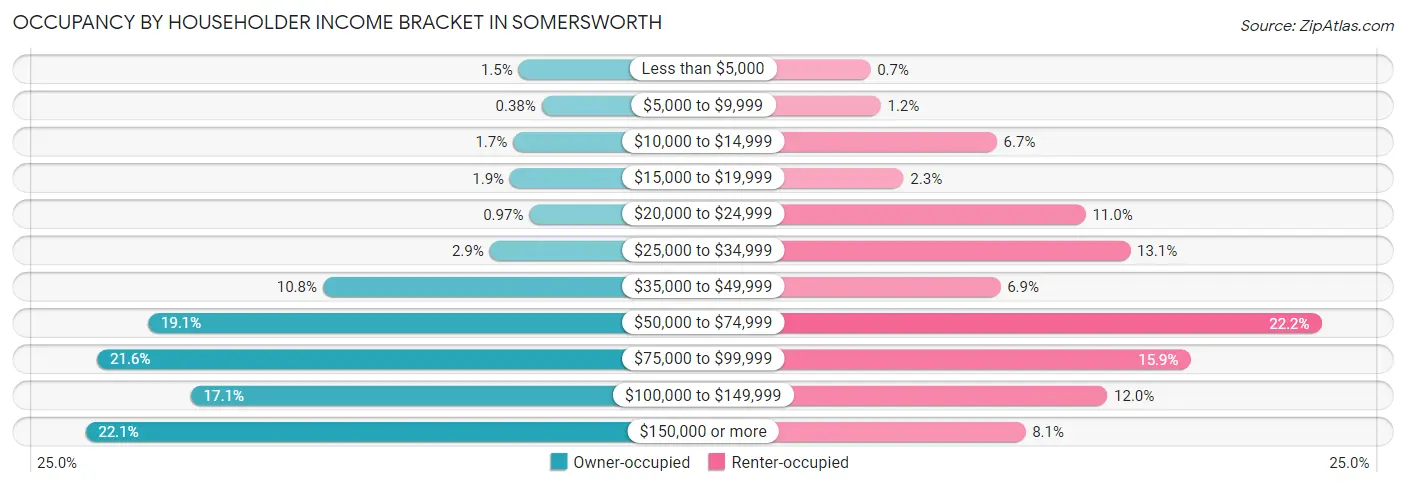
| Income Bracket | Owner-occupied | Renter-occupied |
| Less than $5,000 | 50 (1.5%) | 13 (0.7%) |
| $5,000 to $9,999 | 13 (0.4%) | 22 (1.2%) |
| $10,000 to $14,999 | 59 (1.7%) | 124 (6.7%) |
| $15,000 to $19,999 | 64 (1.9%) | 42 (2.3%) |
| $20,000 to $24,999 | 33 (1.0%) | 202 (11.0%) |
| $25,000 to $34,999 | 97 (2.9%) | 241 (13.1%) |
| $35,000 to $49,999 | 366 (10.8%) | 127 (6.9%) |
| $50,000 to $74,999 | 648 (19.1%) | 409 (22.2%) |
| $75,000 to $99,999 | 730 (21.5%) | 294 (15.9%) |
| $100,000 to $149,999 | 579 (17.1%) | 221 (12.0%) |
| $150,000 or more | 749 (22.1%) | 149 (8.1%) |
| Total | 3,388 (100.0%) | 1,844 (100.0%) |
Monthly Housing Cost Tiers in Somersworth
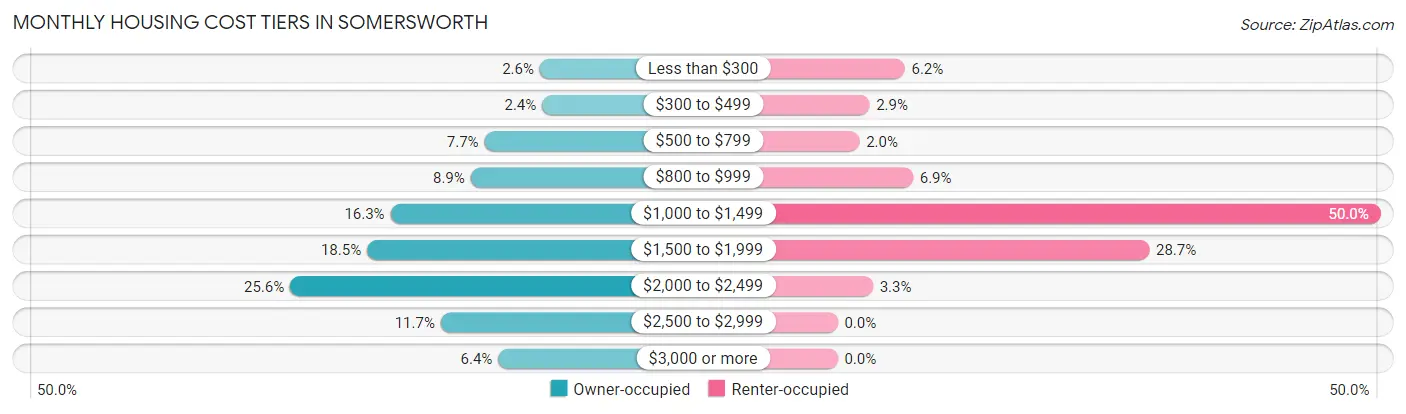
| Monthly Cost | Owner-occupied | Renter-occupied |
| Less than $300 | 87 (2.6%) | 114 (6.2%) |
| $300 to $499 | 80 (2.4%) | 54 (2.9%) |
| $500 to $799 | 260 (7.7%) | 37 (2.0%) |
| $800 to $999 | 303 (8.9%) | 128 (6.9%) |
| $1,000 to $1,499 | 553 (16.3%) | 922 (50.0%) |
| $1,500 to $1,999 | 626 (18.5%) | 529 (28.7%) |
| $2,000 to $2,499 | 866 (25.6%) | 60 (3.3%) |
| $2,500 to $2,999 | 396 (11.7%) | 0 (0.0%) |
| $3,000 or more | 217 (6.4%) | 0 (0.0%) |
| Total | 3,388 (100.0%) | 1,844 (100.0%) |
Physical Housing Characteristics in Somersworth
Housing Structures in Somersworth
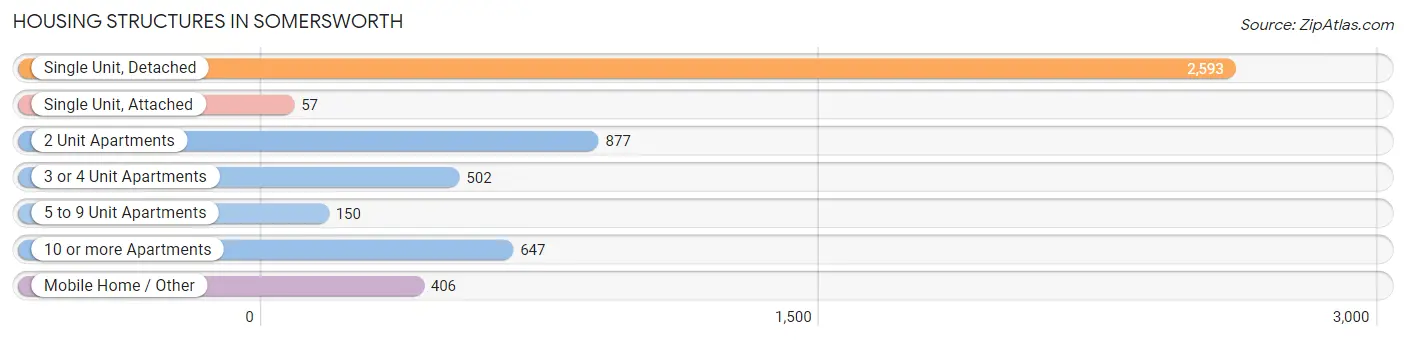
| Structure Type | # Housing Units | % Housing Units |
| Single Unit, Detached | 2,593 | 49.6% |
| Single Unit, Attached | 57 | 1.1% |
| 2 Unit Apartments | 877 | 16.8% |
| 3 or 4 Unit Apartments | 502 | 9.6% |
| 5 to 9 Unit Apartments | 150 | 2.9% |
| 10 or more Apartments | 647 | 12.4% |
| Mobile Home / Other | 406 | 7.8% |
| Total | 5,232 | 100.0% |
Housing Structures by Occupancy in Somersworth
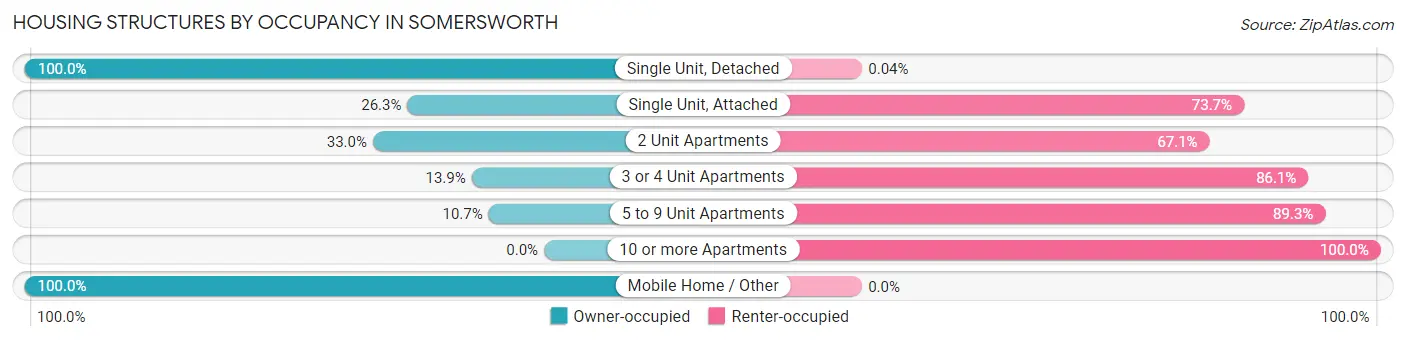
| Structure Type | Owner-occupied | Renter-occupied |
| Single Unit, Detached | 2,592 (100.0%) | 1 (0.0%) |
| Single Unit, Attached | 15 (26.3%) | 42 (73.7%) |
| 2 Unit Apartments | 289 (33.0%) | 588 (67.0%) |
| 3 or 4 Unit Apartments | 70 (13.9%) | 432 (86.1%) |
| 5 to 9 Unit Apartments | 16 (10.7%) | 134 (89.3%) |
| 10 or more Apartments | 0 (0.0%) | 647 (100.0%) |
| Mobile Home / Other | 406 (100.0%) | 0 (0.0%) |
| Total | 3,388 (64.8%) | 1,844 (35.2%) |
Housing Structures by Number of Rooms in Somersworth
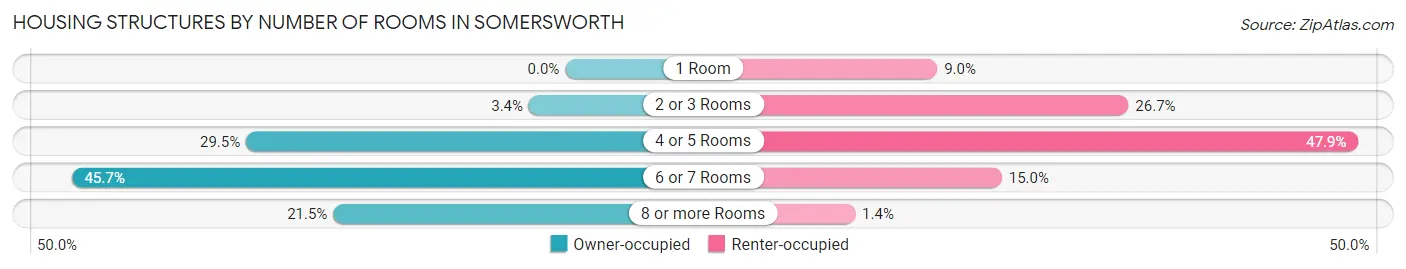
| Number of Rooms | Owner-occupied | Renter-occupied |
| 1 Room | 0 (0.0%) | 166 (9.0%) |
| 2 or 3 Rooms | 114 (3.4%) | 492 (26.7%) |
| 4 or 5 Rooms | 1,000 (29.5%) | 884 (47.9%) |
| 6 or 7 Rooms | 1,547 (45.7%) | 276 (15.0%) |
| 8 or more Rooms | 727 (21.5%) | 26 (1.4%) |
| Total | 3,388 (100.0%) | 1,844 (100.0%) |
Housing Structure by Heating Type in Somersworth
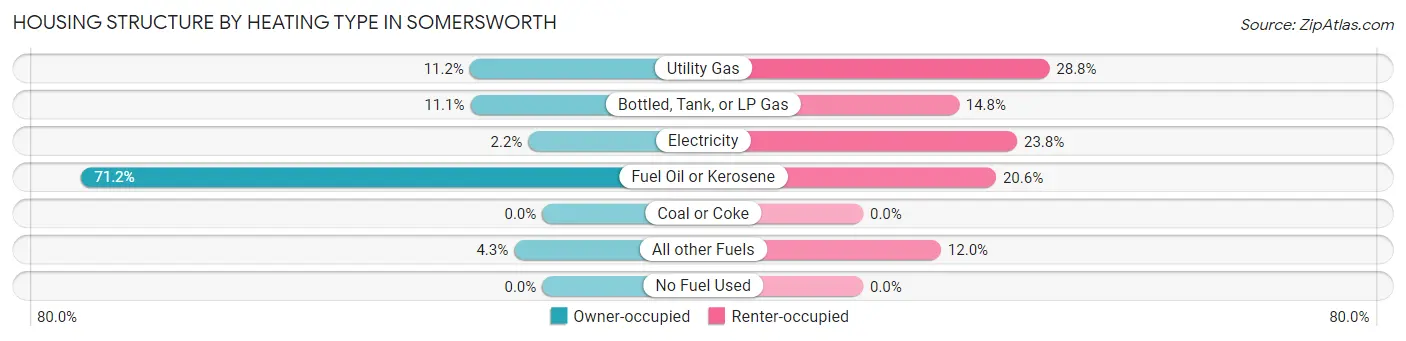
| Heating Type | Owner-occupied | Renter-occupied |
| Utility Gas | 379 (11.2%) | 531 (28.8%) |
| Bottled, Tank, or LP Gas | 376 (11.1%) | 273 (14.8%) |
| Electricity | 73 (2.1%) | 439 (23.8%) |
| Fuel Oil or Kerosene | 2,413 (71.2%) | 379 (20.5%) |
| Coal or Coke | 0 (0.0%) | 0 (0.0%) |
| All other Fuels | 147 (4.3%) | 222 (12.0%) |
| No Fuel Used | 0 (0.0%) | 0 (0.0%) |
| Total | 3,388 (100.0%) | 1,844 (100.0%) |
Household Vehicle Usage in Somersworth
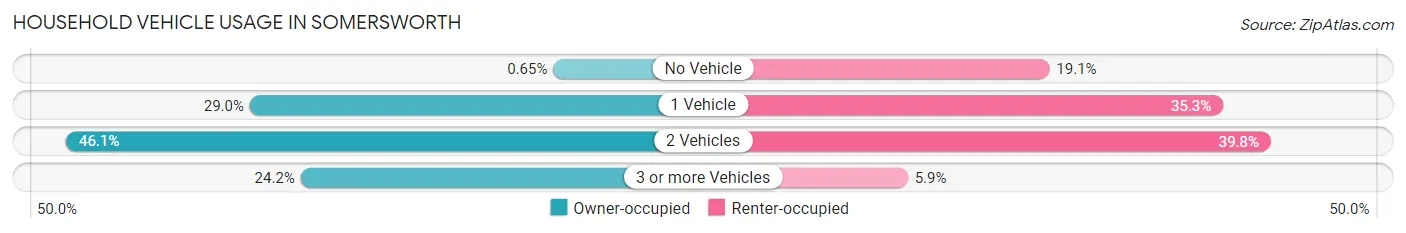
| Vehicles per Household | Owner-occupied | Renter-occupied |
| No Vehicle | 22 (0.6%) | 352 (19.1%) |
| 1 Vehicle | 982 (29.0%) | 651 (35.3%) |
| 2 Vehicles | 1,563 (46.1%) | 733 (39.8%) |
| 3 or more Vehicles | 821 (24.2%) | 108 (5.9%) |
| Total | 3,388 (100.0%) | 1,844 (100.0%) |
Real Estate & Mortgages in Somersworth
Real Estate and Mortgage Overview in Somersworth
| Characteristic | Without Mortgage | With Mortgage |
| Housing Units | 1,104 | 2,284 |
| Median Property Value | $253,000 | $272,800 |
| Median Household Income | $71,346 | $569 |
| Monthly Housing Costs | $862 | $203 |
| Real Estate Taxes | $6,325 | $0 |
Property Value by Mortgage Status in Somersworth
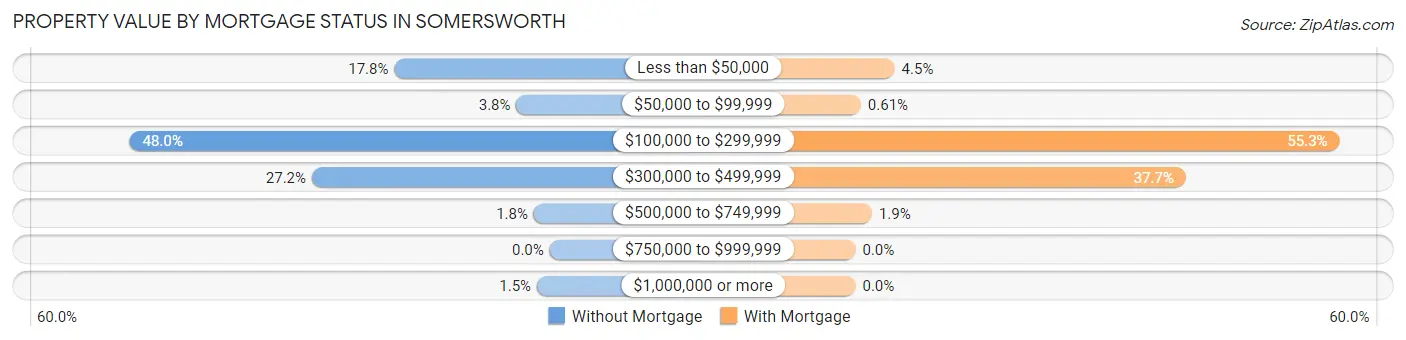
| Property Value | Without Mortgage | With Mortgage |
| Less than $50,000 | 196 (17.7%) | 102 (4.5%) |
| $50,000 to $99,999 | 42 (3.8%) | 14 (0.6%) |
| $100,000 to $299,999 | 530 (48.0%) | 1,263 (55.3%) |
| $300,000 to $499,999 | 300 (27.2%) | 862 (37.7%) |
| $500,000 to $749,999 | 20 (1.8%) | 43 (1.9%) |
| $750,000 to $999,999 | 0 (0.0%) | 0 (0.0%) |
| $1,000,000 or more | 16 (1.5%) | 0 (0.0%) |
| Total | 1,104 (100.0%) | 2,284 (100.0%) |
Household Income by Mortgage Status in Somersworth
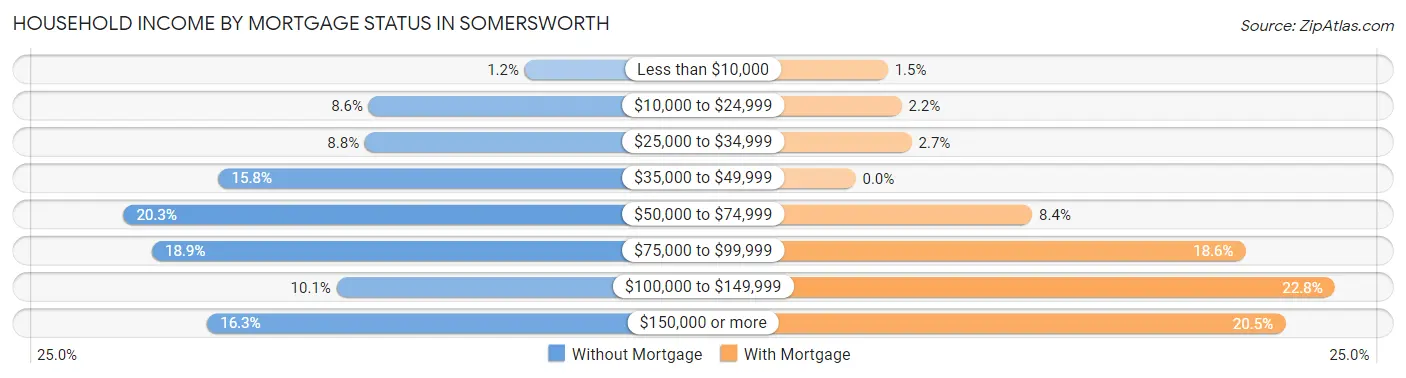
| Household Income | Without Mortgage | With Mortgage |
| Less than $10,000 | 13 (1.2%) | 35 (1.5%) |
| $10,000 to $24,999 | 95 (8.6%) | 50 (2.2%) |
| $25,000 to $34,999 | 97 (8.8%) | 61 (2.7%) |
| $35,000 to $49,999 | 174 (15.8%) | 0 (0.0%) |
| $50,000 to $74,999 | 224 (20.3%) | 192 (8.4%) |
| $75,000 to $99,999 | 209 (18.9%) | 424 (18.6%) |
| $100,000 to $149,999 | 112 (10.1%) | 521 (22.8%) |
| $150,000 or more | 180 (16.3%) | 467 (20.4%) |
| Total | 1,104 (100.0%) | 2,284 (100.0%) |
Property Value to Household Income Ratio in Somersworth
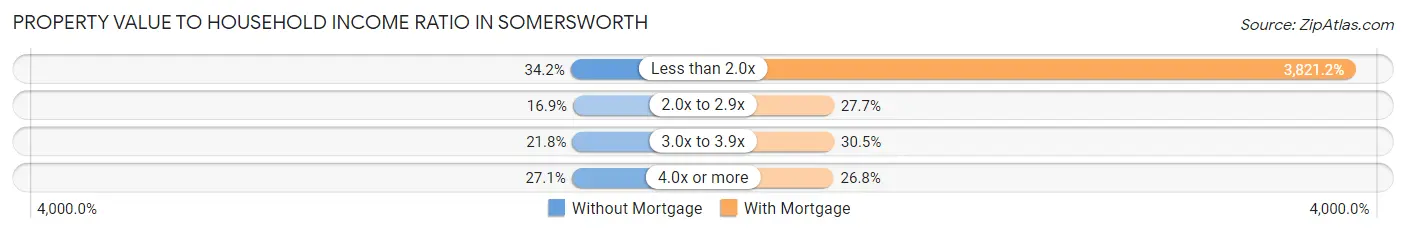
| Value-to-Income Ratio | Without Mortgage | With Mortgage |
| Less than 2.0x | 377 (34.2%) | 87,276 (3,821.2%) |
| 2.0x to 2.9x | 187 (16.9%) | 633 (27.7%) |
| 3.0x to 3.9x | 241 (21.8%) | 696 (30.5%) |
| 4.0x or more | 299 (27.1%) | 612 (26.8%) |
| Total | 1,104 (100.0%) | 2,284 (100.0%) |
Real Estate Taxes by Mortgage Status in Somersworth
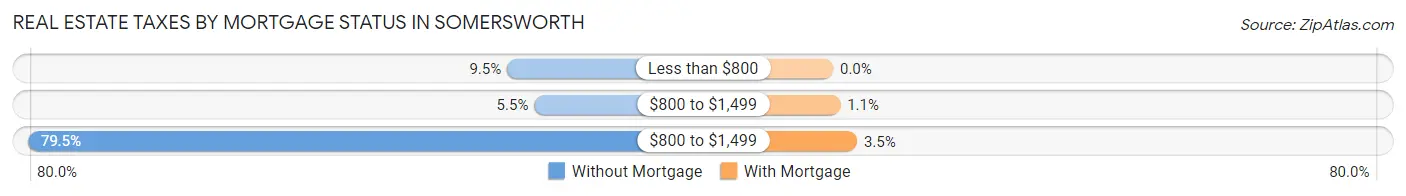
| Property Taxes | Without Mortgage | With Mortgage |
| Less than $800 | 105 (9.5%) | 0 (0.0%) |
| $800 to $1,499 | 61 (5.5%) | 24 (1.1%) |
| $800 to $1,499 | 878 (79.5%) | 80 (3.5%) |
| Total | 1,104 (100.0%) | 2,284 (100.0%) |
Health & Disability in Somersworth
Health Insurance Coverage by Age in Somersworth
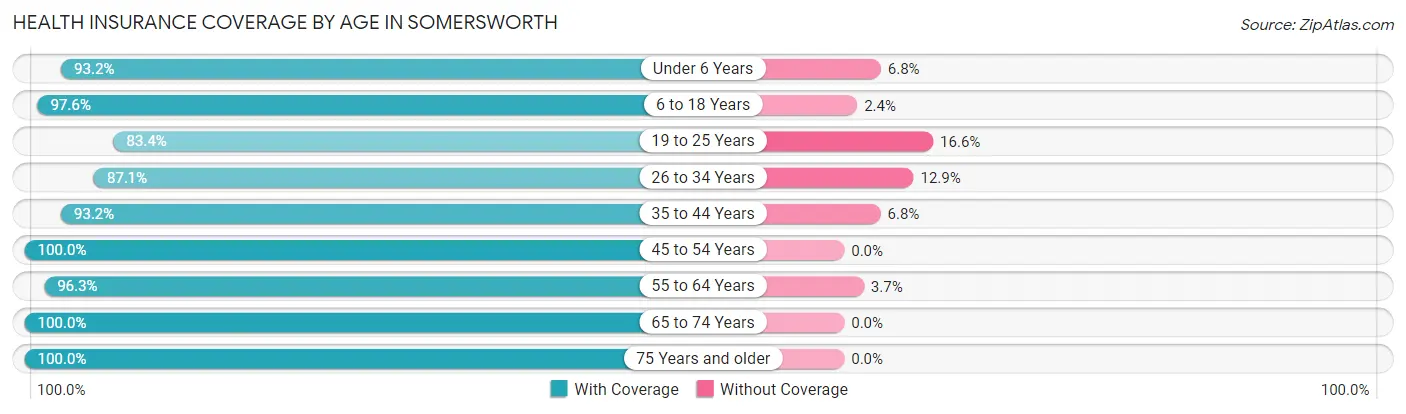
| Age Bracket | With Coverage | Without Coverage |
| Under 6 Years | 437 (93.2%) | 32 (6.8%) |
| 6 to 18 Years | 1,698 (97.6%) | 42 (2.4%) |
| 19 to 25 Years | 871 (83.4%) | 173 (16.6%) |
| 26 to 34 Years | 1,786 (87.1%) | 265 (12.9%) |
| 35 to 44 Years | 1,364 (93.2%) | 99 (6.8%) |
| 45 to 54 Years | 1,649 (100.0%) | 0 (0.0%) |
| 55 to 64 Years | 1,606 (96.3%) | 61 (3.7%) |
| 65 to 74 Years | 1,091 (100.0%) | 0 (0.0%) |
| 75 Years and older | 657 (100.0%) | 0 (0.0%) |
| Total | 11,159 (94.3%) | 672 (5.7%) |
Health Insurance Coverage by Citizenship Status in Somersworth
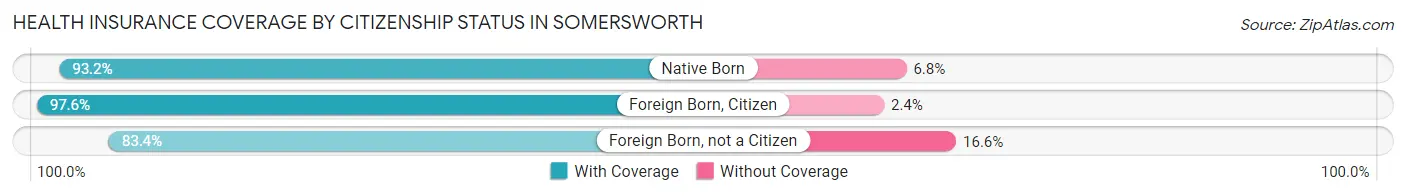
| Citizenship Status | With Coverage | Without Coverage |
| Native Born | 437 (93.2%) | 32 (6.8%) |
| Foreign Born, Citizen | 1,698 (97.6%) | 42 (2.4%) |
| Foreign Born, not a Citizen | 871 (83.4%) | 173 (16.6%) |
Health Insurance Coverage by Household Income in Somersworth
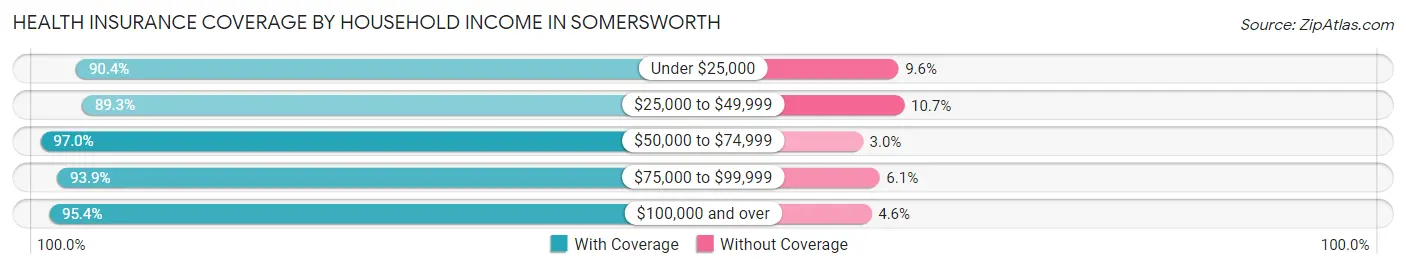
| Household Income | With Coverage | Without Coverage |
| Under $25,000 | 929 (90.4%) | 99 (9.6%) |
| $25,000 to $49,999 | 1,058 (89.3%) | 127 (10.7%) |
| $50,000 to $74,999 | 1,899 (97.0%) | 58 (3.0%) |
| $75,000 to $99,999 | 2,275 (93.9%) | 148 (6.1%) |
| $100,000 and over | 4,994 (95.4%) | 240 (4.6%) |
Public vs Private Health Insurance Coverage by Age in Somersworth
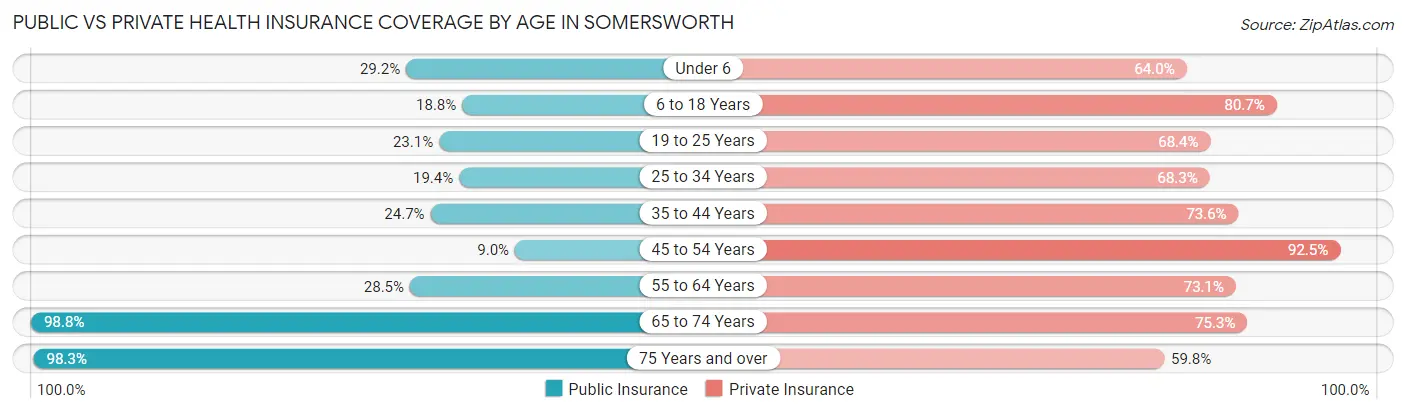
| Age Bracket | Public Insurance | Private Insurance |
| Under 6 | 137 (29.2%) | 300 (64.0%) |
| 6 to 18 Years | 327 (18.8%) | 1,404 (80.7%) |
| 19 to 25 Years | 241 (23.1%) | 714 (68.4%) |
| 25 to 34 Years | 397 (19.4%) | 1,400 (68.3%) |
| 35 to 44 Years | 361 (24.7%) | 1,077 (73.6%) |
| 45 to 54 Years | 148 (9.0%) | 1,525 (92.5%) |
| 55 to 64 Years | 475 (28.5%) | 1,219 (73.1%) |
| 65 to 74 Years | 1,078 (98.8%) | 821 (75.2%) |
| 75 Years and over | 646 (98.3%) | 393 (59.8%) |
| Total | 3,810 (32.2%) | 8,853 (74.8%) |
Disability Status by Sex by Age in Somersworth
| Age Bracket | Male | Female |
| Under 5 Years | 52 (17.9%) | 0 (0.0%) |
| 5 to 17 Years | 53 (6.1%) | 0 (0.0%) |
| 18 to 34 Years | 171 (10.9%) | 38 (2.4%) |
| 35 to 64 Years | 305 (12.9%) | 392 (16.3%) |
| 65 to 74 Years | 132 (30.1%) | 211 (32.3%) |
| 75 Years and over | 98 (25.0%) | 140 (52.8%) |
Disability Class by Sex by Age in Somersworth
Disability Class: Hearing Difficulty
| Age Bracket | Male | Female |
| Under 5 Years | 52 (17.9%) | 0 (0.0%) |
| 5 to 17 Years | 0 (0.0%) | 0 (0.0%) |
| 18 to 34 Years | 34 (2.2%) | 0 (0.0%) |
| 35 to 64 Years | 35 (1.5%) | 8 (0.3%) |
| 65 to 74 Years | 116 (26.5%) | 30 (4.6%) |
| 75 Years and over | 68 (17.3%) | 6 (2.3%) |
Disability Class: Vision Difficulty
| Age Bracket | Male | Female |
| Under 5 Years | 0 (0.0%) | 0 (0.0%) |
| 5 to 17 Years | 0 (0.0%) | 0 (0.0%) |
| 18 to 34 Years | 0 (0.0%) | 0 (0.0%) |
| 35 to 64 Years | 27 (1.1%) | 79 (3.3%) |
| 65 to 74 Years | 16 (3.6%) | 38 (5.8%) |
| 75 Years and over | 53 (13.5%) | 33 (12.4%) |
Disability Class: Cognitive Difficulty
| Age Bracket | Male | Female |
| 5 to 17 Years | 53 (6.1%) | 0 (0.0%) |
| 18 to 34 Years | 137 (8.7%) | 38 (2.4%) |
| 35 to 64 Years | 46 (1.9%) | 100 (4.2%) |
| 65 to 74 Years | 0 (0.0%) | 150 (23.0%) |
| 75 Years and over | 0 (0.0%) | 22 (8.3%) |
Disability Class: Ambulatory Difficulty
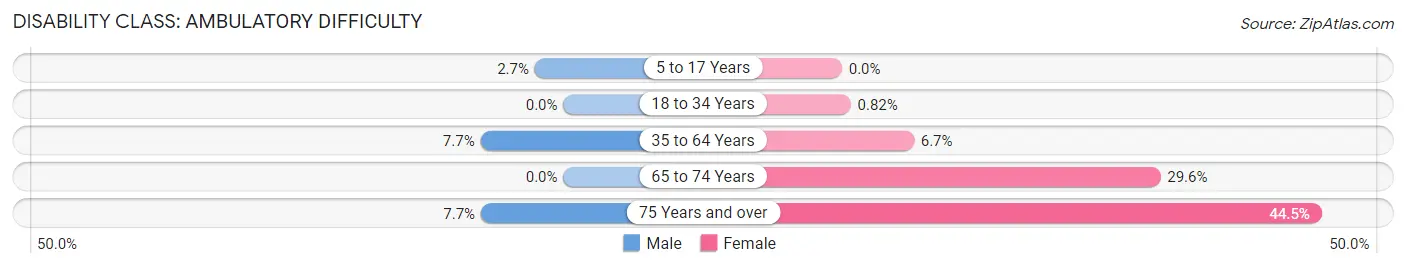
| Age Bracket | Male | Female |
| 5 to 17 Years | 23 (2.6%) | 0 (0.0%) |
| 18 to 34 Years | 0 (0.0%) | 13 (0.8%) |
| 35 to 64 Years | 182 (7.7%) | 161 (6.7%) |
| 65 to 74 Years | 0 (0.0%) | 193 (29.6%) |
| 75 Years and over | 30 (7.6%) | 118 (44.5%) |
Disability Class: Self-Care Difficulty
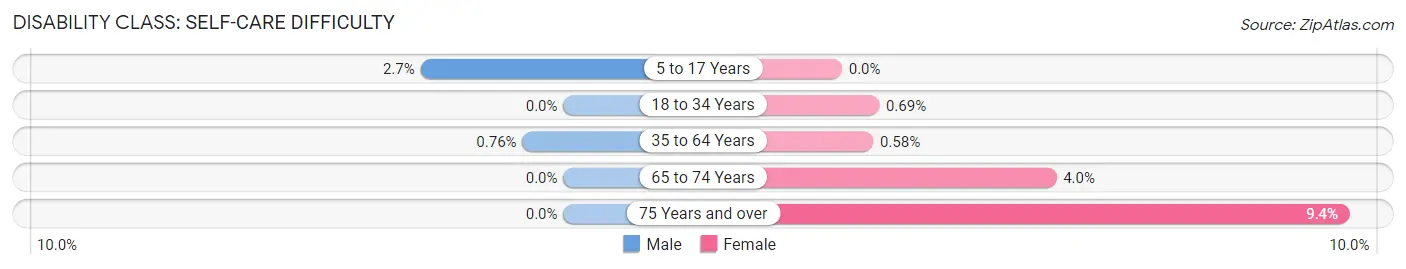
| Age Bracket | Male | Female |
| 5 to 17 Years | 23 (2.6%) | 0 (0.0%) |
| 18 to 34 Years | 0 (0.0%) | 11 (0.7%) |
| 35 to 64 Years | 18 (0.8%) | 14 (0.6%) |
| 65 to 74 Years | 0 (0.0%) | 26 (4.0%) |
| 75 Years and over | 0 (0.0%) | 25 (9.4%) |
Technology Access in Somersworth
Computing Device Access in Somersworth
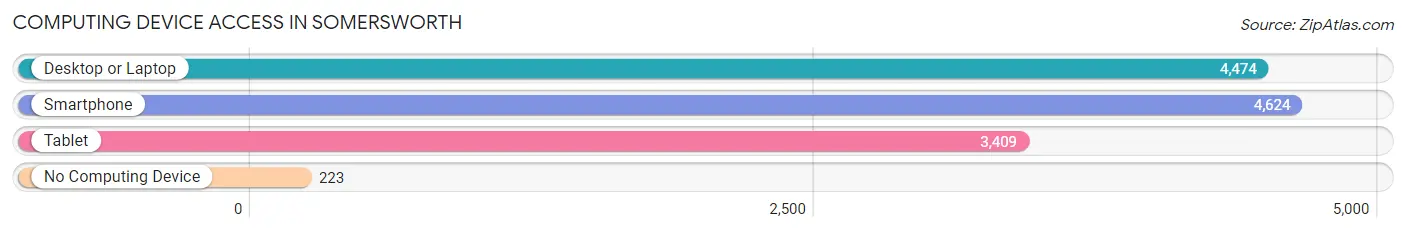
| Device Type | # Households | % Households |
| Desktop or Laptop | 4,474 | 85.5% |
| Smartphone | 4,624 | 88.4% |
| Tablet | 3,409 | 65.2% |
| No Computing Device | 223 | 4.3% |
| Total | 5,232 | 100.0% |
Internet Access in Somersworth
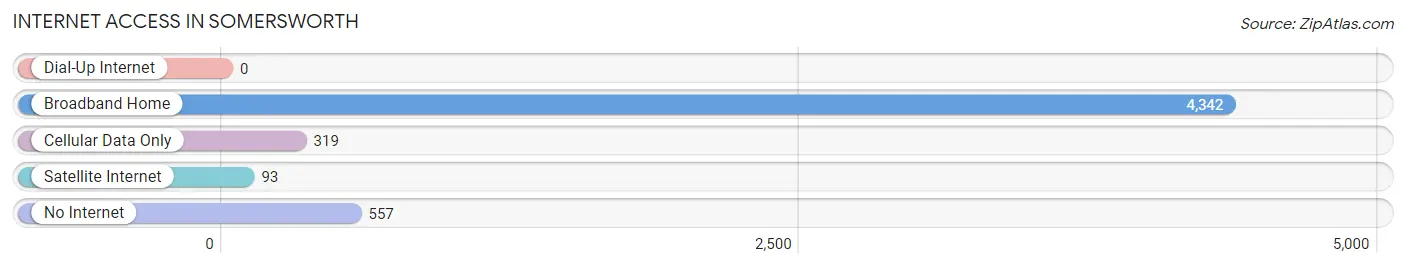
| Internet Type | # Households | % Households |
| Dial-Up Internet | 0 | 0.0% |
| Broadband Home | 4,342 | 83.0% |
| Cellular Data Only | 319 | 6.1% |
| Satellite Internet | 93 | 1.8% |
| No Internet | 557 | 10.6% |
| Total | 5,232 | 100.0% |
Somersworth Summary
Somersworth is a city located in Strafford County, New Hampshire, United States. The population was 11,766 at the 2010 census. Somersworth is home to the only hilltop view of the nearby city of Dover and the nearby towns of Rollinsford and Berwick, Maine.
History
Somersworth was first settled in 1728 by a group of Scots-Irish immigrants led by William Somerworth. The town was originally known as "Somersworth" after William Somerworth, but was later changed to "Somersworth" in 1849. The town was incorporated in 1849 and was named after William Somerworth.
The town was originally a farming community, but in the late 19th century, it became a manufacturing center. The Somersworth Manufacturing Company was established in 1872 and was the first large-scale manufacturer in the area. The company produced a variety of products, including textiles, paper, and leather goods.
In the early 20th century, Somersworth experienced a period of growth and prosperity. The town was home to several large factories, including the Somersworth Manufacturing Company, the Somersworth Shoe Company, and the Somersworth Woolen Mill. The town also had a thriving downtown area, with several stores, restaurants, and other businesses.
Geography
Somersworth is located in southeastern New Hampshire, in the Seacoast region. The city is situated on the Salmon Falls River, which forms the border between New Hampshire and Maine. The city is bordered by the towns of Rollinsford and Berwick, Maine to the east, and Dover to the west.
The city has a total area of 8.2 square miles, of which 8.1 square miles is land and 0.1 square miles is water. The highest point in Somersworth is the summit of Mount Prospect, which has an elevation of 545 feet above sea level.
Economy
Somersworth has a diverse economy, with a mix of manufacturing, retail, and service industries. The city is home to several large employers, including the Somersworth Manufacturing Company, the Somersworth Shoe Company, and the Somersworth Woolen Mill. The city also has a thriving retail sector, with several stores, restaurants, and other businesses located in the downtown area.
The city is also home to several educational institutions, including the University of New Hampshire at Somersworth, Great Bay Community College, and the Somersworth Career and Technical Center.
Demographics
As of the 2010 census, there were 11,766 people, 4,845 households, and 2,945 families residing in the city. The population density was 1,450.2 people per square mile. The racial makeup of the city was 94.2% White, 1.3% African American, 0.4% Native American, 1.2% Asian, 0.1% Pacific Islander, 1.2% from other races, and 1.6% from two or more races. Hispanic or Latino of any race were 3.2% of the population.
The median income for a household in the city was $45,945, and the median income for a family was $54,945. The per capita income for the city was $22,945. About 8.2% of families and 10.3% of the population were below the poverty line, including 14.2% of those under age 18 and 6.2% of those age 65 or over.
Common Questions
What is Per Capita Income in Somersworth?
Per Capita income in Somersworth is $39,754.
What is the Median Family Income in Somersworth?
Median Family Income in Somersworth is $82,639.
What is the Median Household income in Somersworth?
Median Household Income in Somersworth is $75,841.
What is Income or Wage Gap in Somersworth?
Income or Wage Gap in Somersworth is 21.4%.
Women in Somersworth earn 78.6 cents for every dollar earned by a man.
What is Inequality or Gini Index in Somersworth?
Inequality or Gini Index in Somersworth is 0.37.
What is the Total Population of Somersworth?
Total Population of Somersworth is 11,994.
What is the Total Male Population of Somersworth?
Total Male Population of Somersworth is 6,089.
What is the Total Female Population of Somersworth?
Total Female Population of Somersworth is 5,905.
What is the Ratio of Males per 100 Females in Somersworth?
There are 103.12 Males per 100 Females in Somersworth.
What is the Ratio of Females per 100 Males in Somersworth?
There are 96.98 Females per 100 Males in Somersworth.
What is the Median Population Age in Somersworth?
Median Population Age in Somersworth is 38.1 Years.
What is the Average Family Size in Somersworth
Average Family Size in Somersworth is 2.7 People.
What is the Average Household Size in Somersworth
Average Household Size in Somersworth is 2.3 People.
How Large is the Labor Force in Somersworth?
There are 7,341 People in the Labor Forcein in Somersworth.
What is the Percentage of People in the Labor Force in Somersworth?
72.2% of People are in the Labor Force in Somersworth.
What is the Unemployment Rate in Somersworth?
Unemployment Rate in Somersworth is 2.8%.