Hillsborough County, NH Map & Demographics
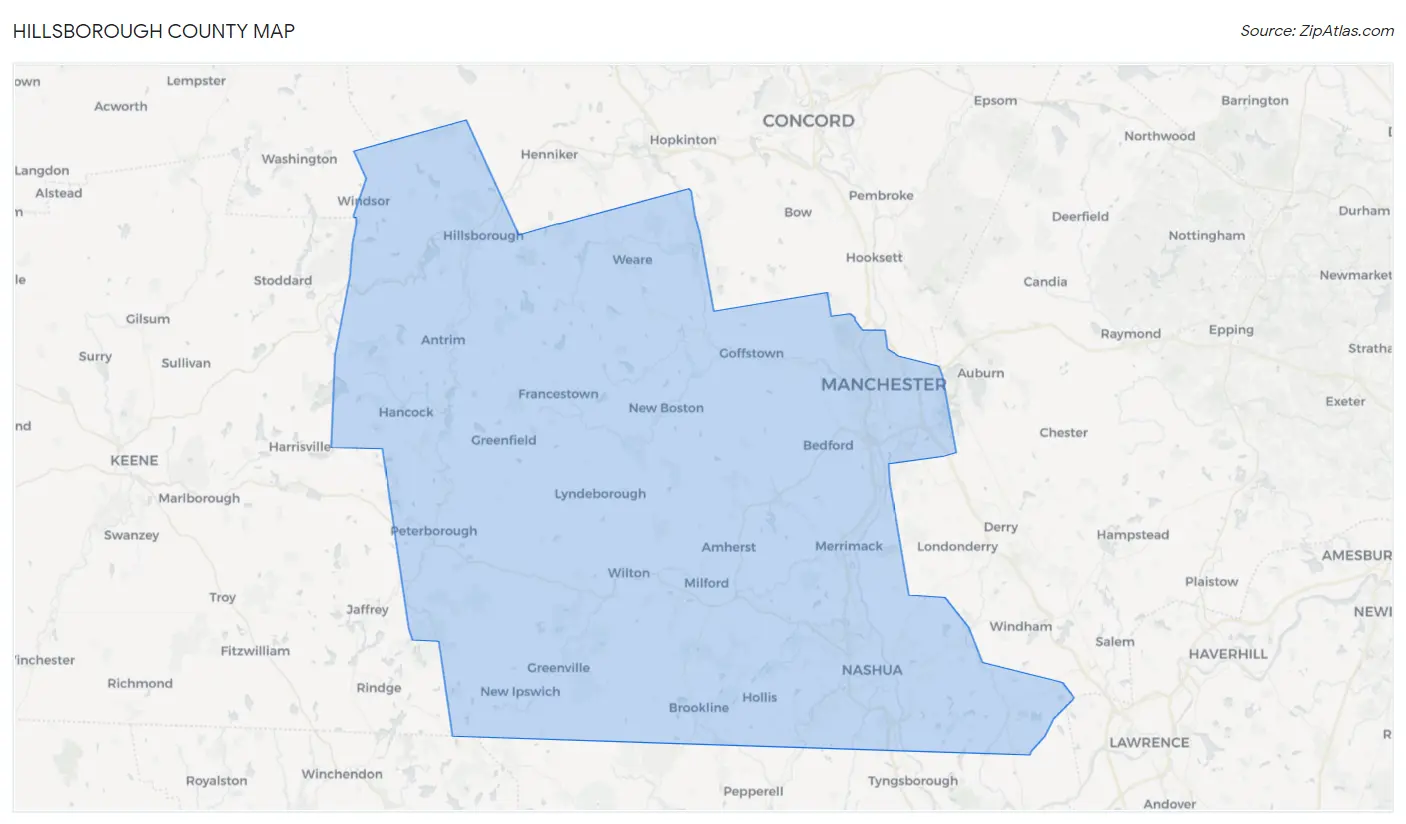
Hillsborough County Map
Hillsborough County Overview
$49,675
PER CAPITA INCOME
$118,936
AVG FAMILY INCOME
$95,112
AVG HOUSEHOLD INCOME
30.1%
WAGE / INCOME GAP [ % ]
69.9¢/ $1
WAGE / INCOME GAP [ $ ]
$10,674
FAMILY INCOME DEFICIT
0.43
INEQUALITY / GINI INDEX
422,733
TOTAL POPULATION
212,276
MALE POPULATION
210,457
FEMALE POPULATION
100.86
MALES / 100 FEMALES
99.14
FEMALES / 100 MALES
40.9
MEDIAN AGE
3.0
AVG FAMILY SIZE
2.5
AVG HOUSEHOLD SIZE
245,928
LABOR FORCE [ PEOPLE ]
70.5%
PERCENT IN LABOR FORCE
3.7%
UNEMPLOYMENT RATE
Hillsborough County Area Codes
Income in Hillsborough County
Income Overview in Hillsborough County
Per Capita Income in Hillsborough County is $49,675, while median incomes of families and households are $118,936 and $95,112 respectively.
| Characteristic | Number | Measure |
| Per Capita Income | 422,733 | $49,675 |
| Median Family Income | 107,222 | $118,936 |
| Mean Family Income | 107,222 | $145,641 |
| Median Household Income | 166,344 | $95,112 |
| Mean Household Income | 166,344 | $122,320 |
| Income Deficit | 107,222 | $10,674 |
| Wage / Income Gap (%) | 422,733 | 30.11% |
| Wage / Income Gap ($) | 422,733 | 69.89¢ per $1 |
| Gini / Inequality Index | 422,733 | 0.43 |
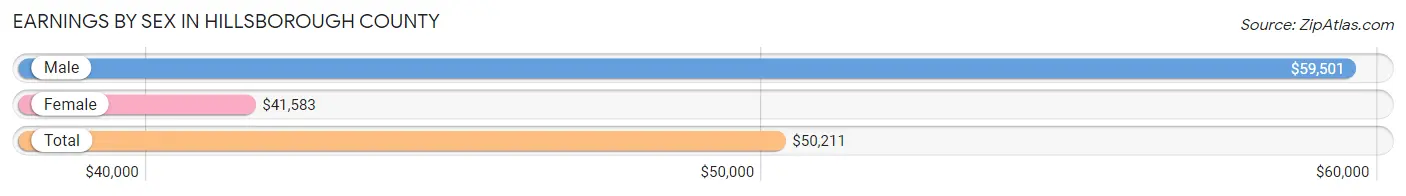
Earnings by Sex in Hillsborough County
Average Earnings in Hillsborough County are $50,211, $59,501 for men and $41,583 for women, a difference of 30.1%.
| Sex | Number | Average Earnings |
| Male | 136,499 (53.1%) | $59,501 |
| Female | 120,381 (46.9%) | $41,583 |
| Total | 256,880 (100.0%) | $50,211 |
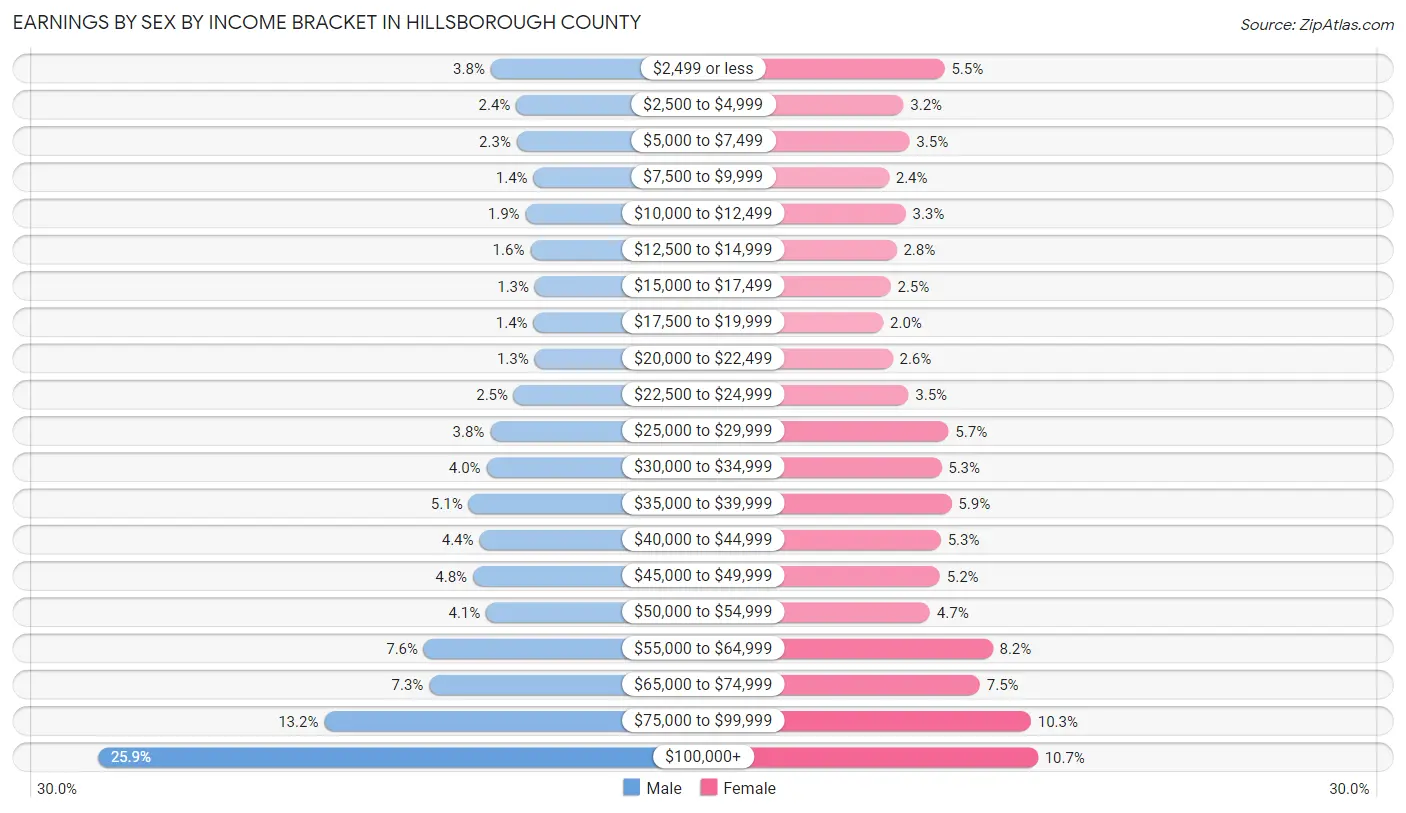
Earnings by Sex by Income Bracket in Hillsborough County
The most common earnings brackets in Hillsborough County are $100,000+ for men (35,335 | 25.9%) and $100,000+ for women (12,921 | 10.7%).
| Income | Male | Female |
| $2,499 or less | 5,193 (3.8%) | 6,606 (5.5%) |
| $2,500 to $4,999 | 3,234 (2.4%) | 3,833 (3.2%) |
| $5,000 to $7,499 | 3,198 (2.3%) | 4,234 (3.5%) |
| $7,500 to $9,999 | 1,905 (1.4%) | 2,846 (2.4%) |
| $10,000 to $12,499 | 2,525 (1.8%) | 3,971 (3.3%) |
| $12,500 to $14,999 | 2,161 (1.6%) | 3,362 (2.8%) |
| $15,000 to $17,499 | 1,807 (1.3%) | 2,962 (2.5%) |
| $17,500 to $19,999 | 1,916 (1.4%) | 2,460 (2.0%) |
| $20,000 to $22,499 | 1,833 (1.3%) | 3,095 (2.6%) |
| $22,500 to $24,999 | 3,410 (2.5%) | 4,165 (3.5%) |
| $25,000 to $29,999 | 5,224 (3.8%) | 6,869 (5.7%) |
| $30,000 to $34,999 | 5,515 (4.0%) | 6,393 (5.3%) |
| $35,000 to $39,999 | 6,888 (5.1%) | 7,078 (5.9%) |
| $40,000 to $44,999 | 6,060 (4.4%) | 6,356 (5.3%) |
| $45,000 to $49,999 | 6,552 (4.8%) | 6,290 (5.2%) |
| $50,000 to $54,999 | 5,546 (4.1%) | 5,620 (4.7%) |
| $55,000 to $64,999 | 10,323 (7.6%) | 9,860 (8.2%) |
| $65,000 to $74,999 | 9,912 (7.3%) | 9,009 (7.5%) |
| $75,000 to $99,999 | 17,962 (13.2%) | 12,451 (10.3%) |
| $100,000+ | 35,335 (25.9%) | 12,921 (10.7%) |
| Total | 136,499 (100.0%) | 120,381 (100.0%) |
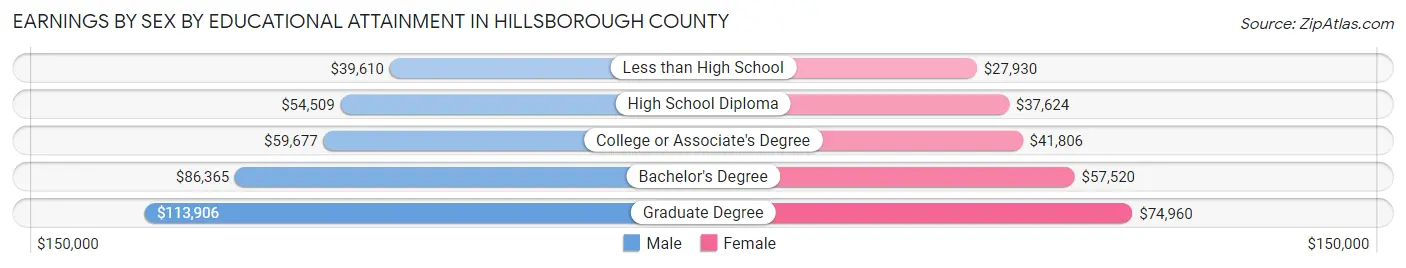
Earnings by Sex by Educational Attainment in Hillsborough County
Average earnings in Hillsborough County are $68,356 for men and $47,446 for women, a difference of 30.6%. Men with an educational attainment of graduate degree enjoy the highest average annual earnings of $113,906, while those with less than high school education earn the least with $39,610. Women with an educational attainment of graduate degree earn the most with the average annual earnings of $74,960, while those with less than high school education have the smallest earnings of $27,930.
| Educational Attainment | Male Income | Female Income |
| Less than High School | $39,610 | $27,930 |
| High School Diploma | $54,509 | $37,624 |
| College or Associate's Degree | $59,677 | $41,806 |
| Bachelor's Degree | $86,365 | $57,520 |
| Graduate Degree | $113,906 | $74,960 |
| Total | $68,356 | $47,446 |
Family Income in Hillsborough County
Family Income Brackets in Hillsborough County
According to the Hillsborough County family income data, there are 24,232 families falling into the $100,000 to $149,999 income range, which is the most common income bracket and makes up 22.6% of all families. Conversely, the $10,000 to $14,999 income bracket is the least frequent group with only 965 families (0.9%) belonging to this category.
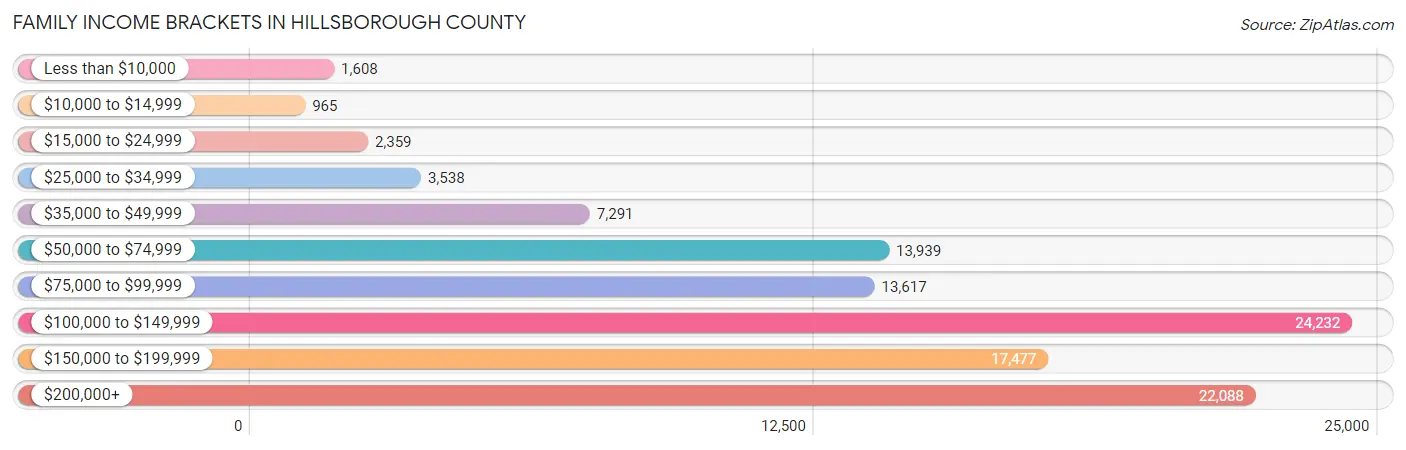
| Income Bracket | # Families | % Families |
| Less than $10,000 | 1,608 | 1.5% |
| $10,000 to $14,999 | 965 | 0.9% |
| $15,000 to $24,999 | 2,359 | 2.2% |
| $25,000 to $34,999 | 3,538 | 3.3% |
| $35,000 to $49,999 | 7,291 | 6.8% |
| $50,000 to $74,999 | 13,939 | 13.0% |
| $75,000 to $99,999 | 13,617 | 12.7% |
| $100,000 to $149,999 | 24,232 | 22.6% |
| $150,000 to $199,999 | 17,477 | 16.3% |
| $200,000+ | 22,088 | 20.6% |
Family Income by Famaliy Size in Hillsborough County
4-person families (19,892 | 18.5%) account for the highest median family income in Hillsborough County with $155,461 per family, while 2-person families (51,756 | 48.3%) have the highest median income of $50,714 per family member.
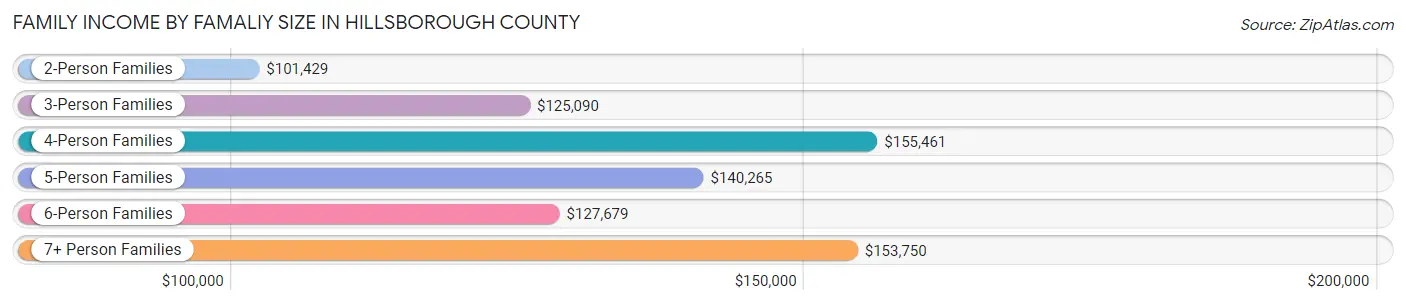
| Income Bracket | # Families | Median Income |
| 2-Person Families | 51,756 (48.3%) | $101,429 |
| 3-Person Families | 24,451 (22.8%) | $125,090 |
| 4-Person Families | 19,892 (18.5%) | $155,461 |
| 5-Person Families | 7,530 (7.0%) | $140,265 |
| 6-Person Families | 2,620 (2.4%) | $127,679 |
| 7+ Person Families | 973 (0.9%) | $153,750 |
| Total | 107,222 (100.0%) | $118,936 |
Family Income by Number of Earners in Hillsborough County
The median family income in Hillsborough County is $118,936, with families comprising 3+ earners (16,893) having the highest median family income of $181,374, while families with no earners (12,315) have the lowest median family income of $58,617, accounting for 15.8% and 11.5% of families, respectively.
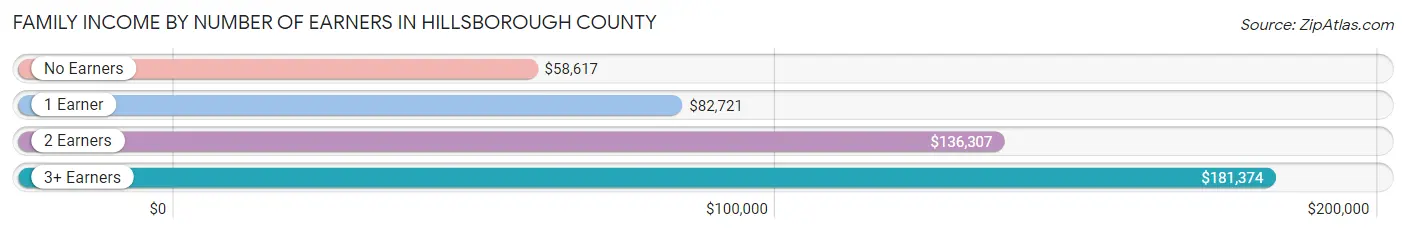
| Number of Earners | # Families | Median Income |
| No Earners | 12,315 (11.5%) | $58,617 |
| 1 Earner | 29,558 (27.6%) | $82,721 |
| 2 Earners | 48,456 (45.2%) | $136,307 |
| 3+ Earners | 16,893 (15.8%) | $181,374 |
| Total | 107,222 (100.0%) | $118,936 |
Household Income in Hillsborough County
Household Income Brackets in Hillsborough County
With 33,102 households falling in the category, the $100,000 to $149,999 income range is the most frequent in Hillsborough County, accounting for 19.9% of all households. In contrast, only 3,826 households (2.3%) fall into the $10,000 to $14,999 income bracket, making it the least populous group.
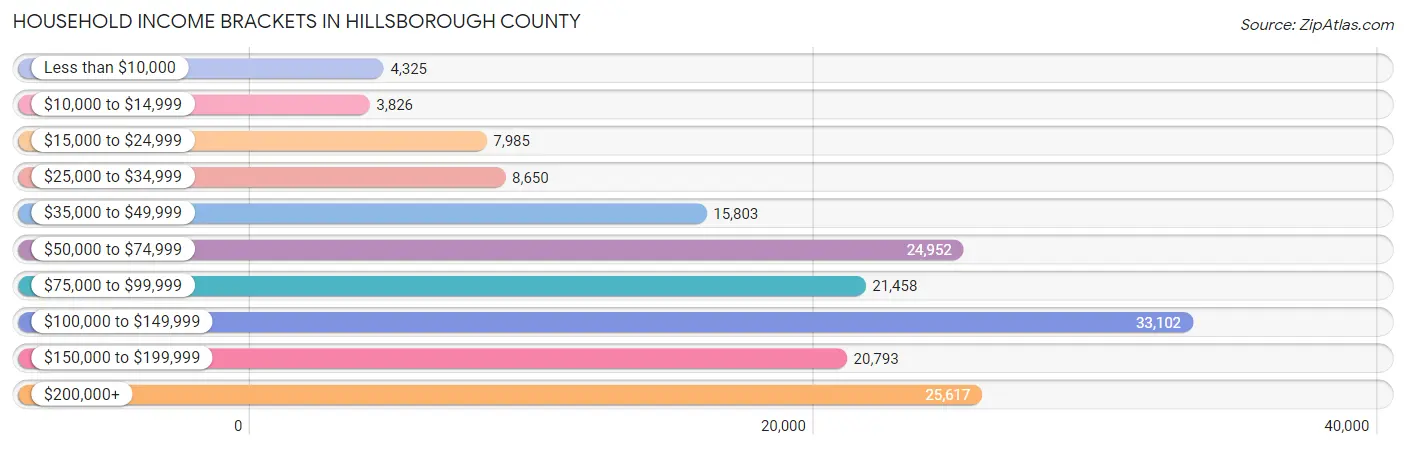
| Income Bracket | # Households | % Households |
| Less than $10,000 | 4,325 | 2.6% |
| $10,000 to $14,999 | 3,826 | 2.3% |
| $15,000 to $24,999 | 7,985 | 4.8% |
| $25,000 to $34,999 | 8,650 | 5.2% |
| $35,000 to $49,999 | 15,803 | 9.5% |
| $50,000 to $74,999 | 24,952 | 15.0% |
| $75,000 to $99,999 | 21,458 | 12.9% |
| $100,000 to $149,999 | 33,102 | 19.9% |
| $150,000 to $199,999 | 20,793 | 12.5% |
| $200,000+ | 25,617 | 15.4% |
Household Income by Householder Age in Hillsborough County
The median household income in Hillsborough County is $95,112, with the highest median household income of $116,407 found in the 45 to 64 years age bracket for the primary householder. A total of 67,977 households (40.9%) fall into this category. Meanwhile, the 65+ years age bracket for the primary householder has the lowest median household income of $62,580, with 41,369 households (24.9%) in this group.
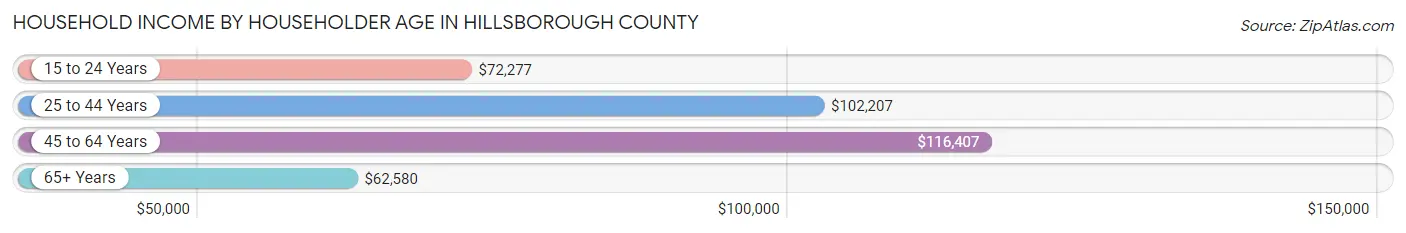
| Income Bracket | # Households | Median Income |
| 15 to 24 Years | 4,399 (2.6%) | $72,277 |
| 25 to 44 Years | 52,599 (31.6%) | $102,207 |
| 45 to 64 Years | 67,977 (40.9%) | $116,407 |
| 65+ Years | 41,369 (24.9%) | $62,580 |
| Total | 166,344 (100.0%) | $95,112 |
Poverty in Hillsborough County
Income Below Poverty by Sex and Age in Hillsborough County
With 5.9% poverty level for males and 7.8% for females among the residents of Hillsborough County, under 5 year old males and 5 year old females are the most vulnerable to poverty, with 1,097 males (10.3%) and 236 females (12.7%) in their respective age groups living below the poverty level.
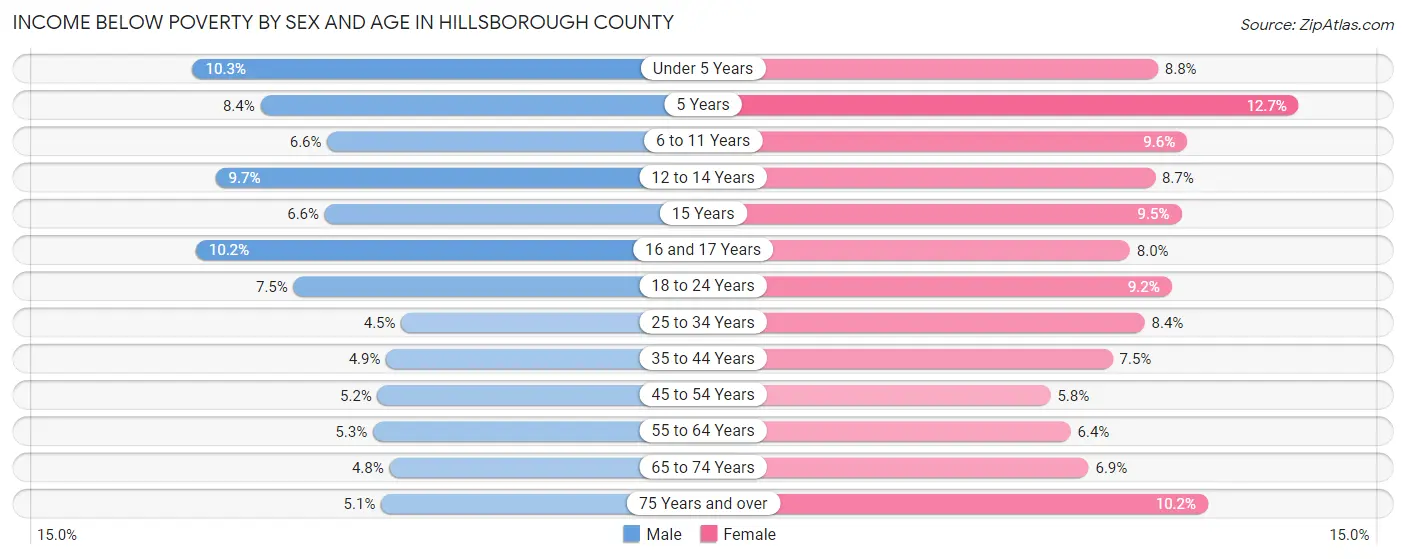
| Age Bracket | Male | Female |
| Under 5 Years | 1,097 (10.3%) | 915 (8.8%) |
| 5 Years | 183 (8.4%) | 236 (12.7%) |
| 6 to 11 Years | 955 (6.6%) | 1,320 (9.6%) |
| 12 to 14 Years | 689 (9.7%) | 595 (8.7%) |
| 15 Years | 171 (6.6%) | 255 (9.5%) |
| 16 and 17 Years | 554 (10.2%) | 399 (8.0%) |
| 18 to 24 Years | 1,322 (7.5%) | 1,456 (9.2%) |
| 25 to 34 Years | 1,380 (4.5%) | 2,383 (8.4%) |
| 35 to 44 Years | 1,339 (4.9%) | 1,961 (7.5%) |
| 45 to 54 Years | 1,501 (5.2%) | 1,648 (5.8%) |
| 55 to 64 Years | 1,684 (5.3%) | 1,997 (6.4%) |
| 65 to 74 Years | 969 (4.8%) | 1,439 (6.9%) |
| 75 Years and over | 529 (5.1%) | 1,488 (10.2%) |
| Total | 12,373 (5.9%) | 16,092 (7.8%) |
Income Above Poverty by Sex and Age in Hillsborough County
According to the poverty statistics in Hillsborough County, males aged 25 to 34 years and females aged 45 to 54 years are the age groups that are most secure financially, with 95.5% of males and 94.2% of females in these age groups living above the poverty line.
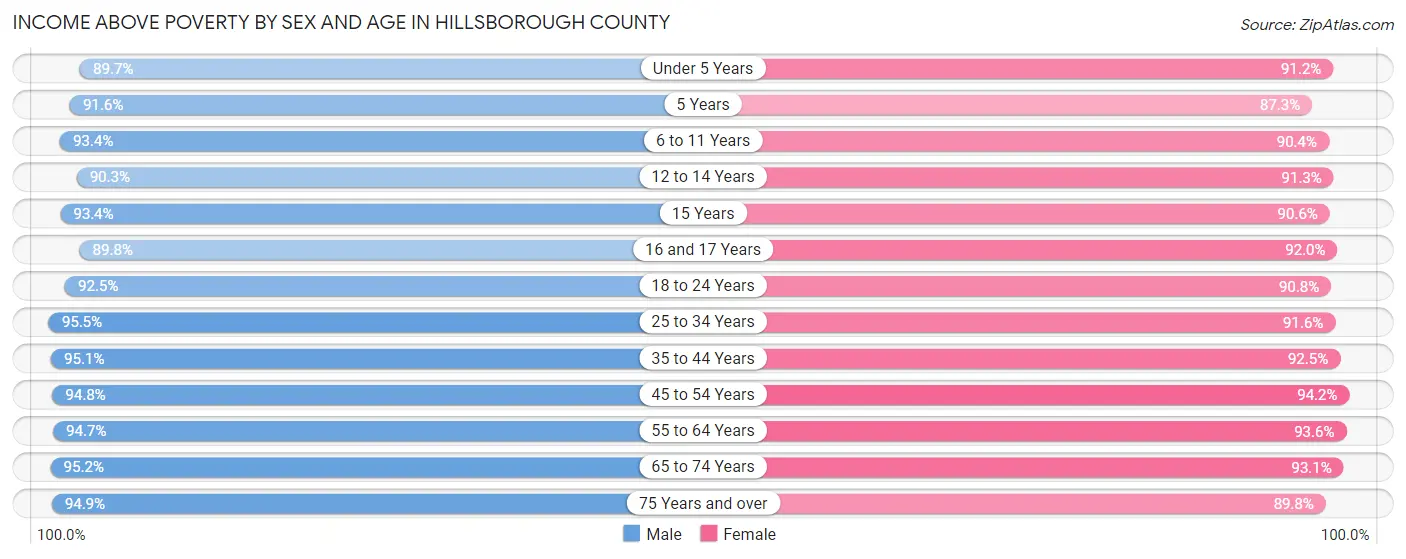
| Age Bracket | Male | Female |
| Under 5 Years | 9,536 (89.7%) | 9,483 (91.2%) |
| 5 Years | 1,988 (91.6%) | 1,620 (87.3%) |
| 6 to 11 Years | 13,591 (93.4%) | 12,417 (90.4%) |
| 12 to 14 Years | 6,427 (90.3%) | 6,227 (91.3%) |
| 15 Years | 2,403 (93.4%) | 2,444 (90.5%) |
| 16 and 17 Years | 4,864 (89.8%) | 4,579 (92.0%) |
| 18 to 24 Years | 16,276 (92.5%) | 14,407 (90.8%) |
| 25 to 34 Years | 29,208 (95.5%) | 25,877 (91.6%) |
| 35 to 44 Years | 25,848 (95.1%) | 24,033 (92.5%) |
| 45 to 54 Years | 27,551 (94.8%) | 26,724 (94.2%) |
| 55 to 64 Years | 30,060 (94.7%) | 29,373 (93.6%) |
| 65 to 74 Years | 19,068 (95.2%) | 19,519 (93.1%) |
| 75 Years and over | 9,903 (94.9%) | 13,108 (89.8%) |
| Total | 196,723 (94.1%) | 189,811 (92.2%) |
Income Below Poverty Among Married-Couple Families in Hillsborough County
The poverty statistics for married-couple families in Hillsborough County show that 1.8% or 1,475 of the total 83,960 families live below the poverty line. Families with 3 or 4 children have the highest poverty rate of 3.7%, comprising of 199 families. On the other hand, families with 5 or more children have the lowest poverty rate of 1.5%, which includes 3 families.
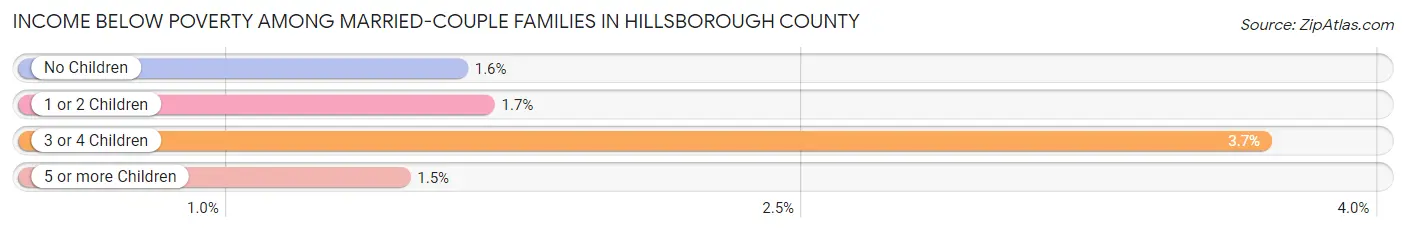
| Children | Above Poverty | Below Poverty |
| No Children | 49,998 (98.4%) | 813 (1.6%) |
| 1 or 2 Children | 27,100 (98.3%) | 460 (1.7%) |
| 3 or 4 Children | 5,183 (96.3%) | 199 (3.7%) |
| 5 or more Children | 204 (98.6%) | 3 (1.5%) |
| Total | 82,485 (98.2%) | 1,475 (1.8%) |
Income Below Poverty Among Single-Parent Households in Hillsborough County
According to the poverty data in Hillsborough County, 9.1% or 729 single-father households and 14.9% or 2,273 single-mother households are living below the poverty line. Among single-father households, those with 3 or 4 children have the highest poverty rate, with 133 households (30.3%) experiencing poverty. Likewise, among single-mother households, those with 5 or more children have the highest poverty rate, with 50 households (94.3%) falling below the poverty line.
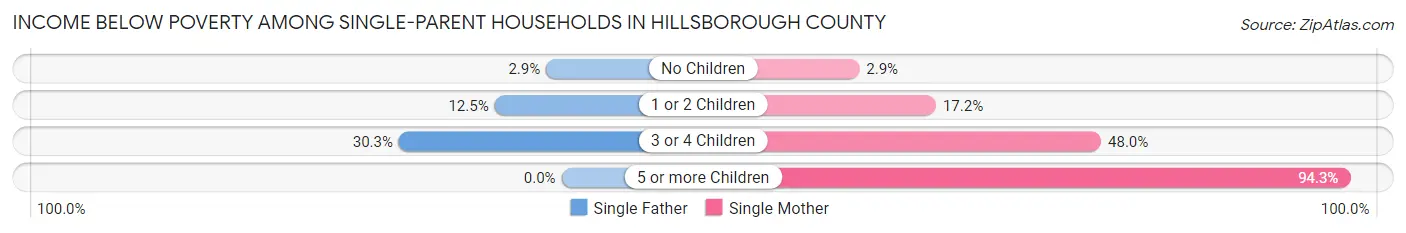
| Children | Single Father | Single Mother |
| No Children | 105 (2.9%) | 176 (2.9%) |
| 1 or 2 Children | 491 (12.5%) | 1,309 (17.2%) |
| 3 or 4 Children | 133 (30.3%) | 738 (47.9%) |
| 5 or more Children | 0 (0.0%) | 50 (94.3%) |
| Total | 729 (9.1%) | 2,273 (14.9%) |
Income Below Poverty Among Married-Couple vs Single-Parent Households in Hillsborough County
The poverty data for Hillsborough County shows that 1,475 of the married-couple family households (1.8%) and 3,002 of the single-parent households (12.9%) are living below the poverty level. Within the married-couple family households, those with 3 or 4 children have the highest poverty rate, with 199 households (3.7%) falling below the poverty line. Among the single-parent households, those with 5 or more children have the highest poverty rate, with 50 household (94.3%) living below poverty.
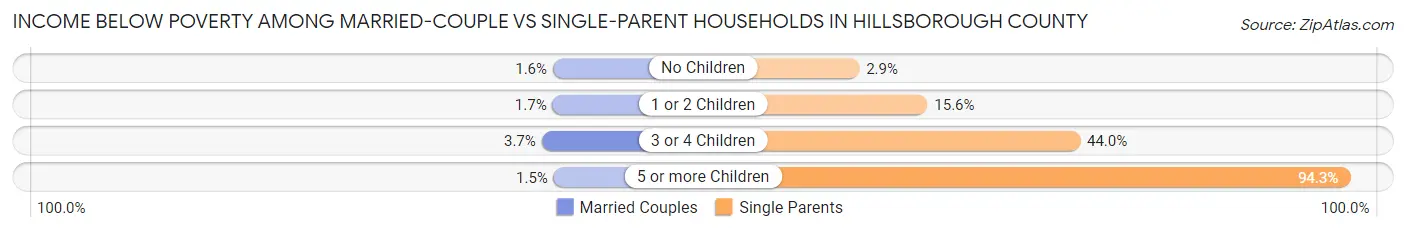
| Children | Married-Couple Families | Single-Parent Households |
| No Children | 813 (1.6%) | 281 (2.9%) |
| 1 or 2 Children | 460 (1.7%) | 1,800 (15.6%) |
| 3 or 4 Children | 199 (3.7%) | 871 (44.0%) |
| 5 or more Children | 3 (1.5%) | 50 (94.3%) |
| Total | 1,475 (1.8%) | 3,002 (12.9%) |
Race in Hillsborough County
The most populous races in Hillsborough County are White / Caucasian (358,618 | 84.8%), Hispanic or Latino (32,558 | 7.7%), and Two or more Races (27,111 | 6.4%).
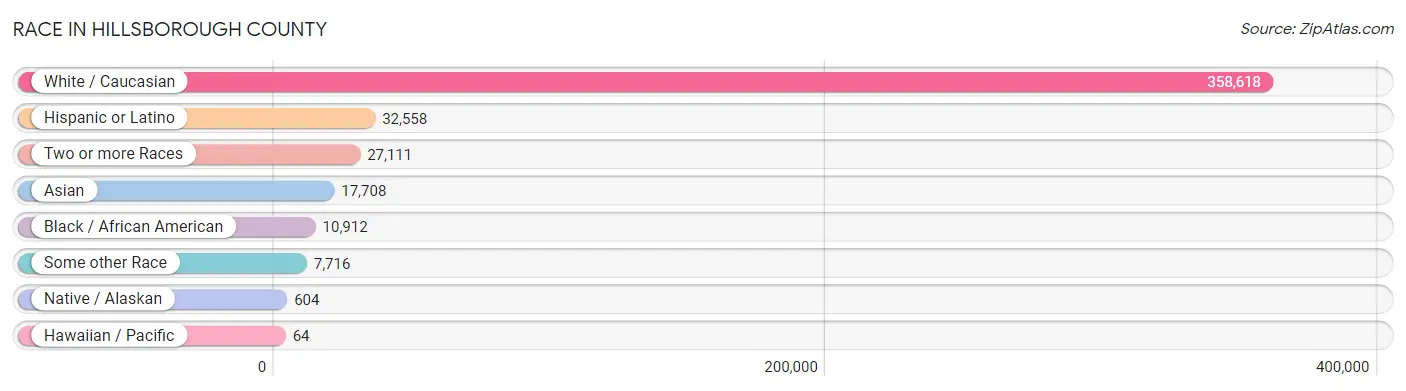
| Race | # Population | % Population |
| Asian | 17,708 | 4.2% |
| Black / African American | 10,912 | 2.6% |
| Hawaiian / Pacific | 64 | 0.0% |
| Hispanic or Latino | 32,558 | 7.7% |
| Native / Alaskan | 604 | 0.1% |
| White / Caucasian | 358,618 | 84.8% |
| Two or more Races | 27,111 | 6.4% |
| Some other Race | 7,716 | 1.8% |
| Total | 422,733 | 100.0% |
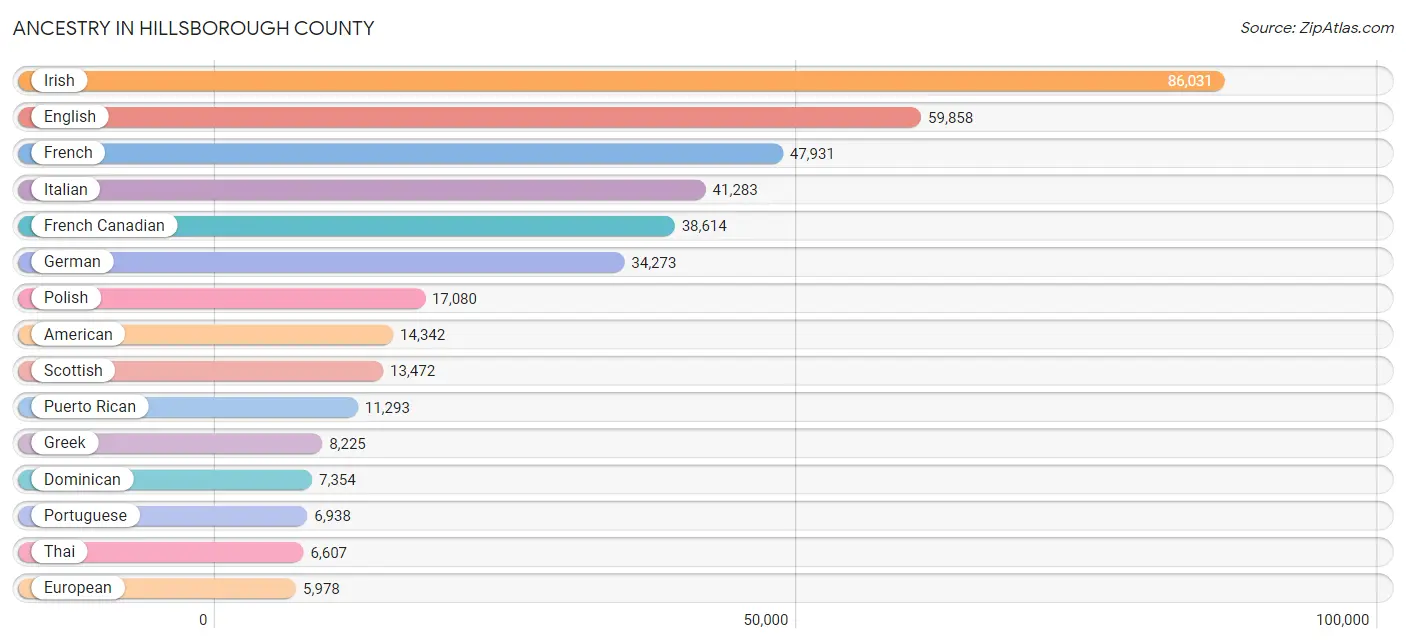
Ancestry in Hillsborough County
The most populous ancestries reported in Hillsborough County are Irish (86,031 | 20.3%), English (59,858 | 14.2%), French (47,931 | 11.3%), Italian (41,283 | 9.8%), and French Canadian (38,614 | 9.1%), together accounting for 64.7% of all Hillsborough County residents.
| Ancestry | # Population | % Population |
| Afghan | 67 | 0.0% |
| African | 1,852 | 0.4% |
| Alaskan Athabascan | 57 | 0.0% |
| Albanian | 994 | 0.2% |
| Aleut | 29 | 0.0% |
| Alsatian | 7 | 0.0% |
| American | 14,342 | 3.4% |
| Arab | 2,372 | 0.6% |
| Argentinean | 199 | 0.1% |
| Armenian | 1,183 | 0.3% |
| Assyrian / Chaldean / Syriac | 23 | 0.0% |
| Australian | 24 | 0.0% |
| Austrian | 442 | 0.1% |
| Bahamian | 3 | 0.0% |
| Bangladeshi | 20 | 0.0% |
| Barbadian | 64 | 0.0% |
| Basque | 4 | 0.0% |
| Belgian | 624 | 0.2% |
| Belizean | 47 | 0.0% |
| Bhutanese | 1,098 | 0.3% |
| Blackfeet | 211 | 0.1% |
| Bolivian | 9 | 0.0% |
| Brazilian | 2,092 | 0.5% |
| British | 1,994 | 0.5% |
| British West Indian | 63 | 0.0% |
| Bulgarian | 151 | 0.0% |
| Burmese | 1,441 | 0.3% |
| Cajun | 74 | 0.0% |
| Canadian | 4,468 | 1.1% |
| Cape Verdean | 502 | 0.1% |
| Carpatho Rusyn | 47 | 0.0% |
| Celtic | 64 | 0.0% |
| Central American | 4,407 | 1.0% |
| Central American Indian | 196 | 0.1% |
| Cherokee | 291 | 0.1% |
| Chilean | 128 | 0.0% |
| Chippewa | 125 | 0.0% |
| Choctaw | 31 | 0.0% |
| Colombian | 1,459 | 0.4% |
| Costa Rican | 45 | 0.0% |
| Cree | 26 | 0.0% |
| Creek | 8 | 0.0% |
| Croatian | 42 | 0.0% |
| Cuban | 741 | 0.2% |
| Czech | 797 | 0.2% |
| Czechoslovakian | 195 | 0.1% |
| Danish | 1,013 | 0.2% |
| Delaware | 6 | 0.0% |
| Dominican | 7,354 | 1.7% |
| Dutch | 2,627 | 0.6% |
| Dutch West Indian | 39 | 0.0% |
| Eastern European | 1,115 | 0.3% |
| Ecuadorian | 88 | 0.0% |
| Egyptian | 179 | 0.0% |
| English | 59,858 | 14.2% |
| Estonian | 52 | 0.0% |
| Ethiopian | 165 | 0.0% |
| European | 5,978 | 1.4% |
| Filipino | 42 | 0.0% |
| Finnish | 2,639 | 0.6% |
| French | 47,931 | 11.3% |
| French American Indian | 147 | 0.0% |
| French Canadian | 38,614 | 9.1% |
| German | 34,273 | 8.1% |
| German Russian | 42 | 0.0% |
| Ghanaian | 125 | 0.0% |
| Greek | 8,225 | 1.9% |
| Guamanian / Chamorro | 123 | 0.0% |
| Guatemalan | 896 | 0.2% |
| Guyanese | 84 | 0.0% |
| Haitian | 830 | 0.2% |
| Honduran | 1,678 | 0.4% |
| Hopi | 148 | 0.0% |
| Hungarian | 1,339 | 0.3% |
| Icelander | 129 | 0.0% |
| Indian (Asian) | 3,311 | 0.8% |
| Indonesian | 324 | 0.1% |
| Inupiat | 53 | 0.0% |
| Iranian | 376 | 0.1% |
| Iraqi | 214 | 0.1% |
| Irish | 86,031 | 20.3% |
| Iroquois | 301 | 0.1% |
| Israeli | 76 | 0.0% |
| Italian | 41,283 | 9.8% |
| Jamaican | 964 | 0.2% |
| Japanese | 932 | 0.2% |
| Jordanian | 174 | 0.0% |
| Kenyan | 566 | 0.1% |
| Korean | 2,668 | 0.6% |
| Laotian | 326 | 0.1% |
| Latvian | 152 | 0.0% |
| Lebanese | 997 | 0.2% |
| Liberian | 242 | 0.1% |
| Lithuanian | 2,196 | 0.5% |
| Luxembourger | 39 | 0.0% |
| Malaysian | 258 | 0.1% |
| Maltese | 24 | 0.0% |
| Mexican | 4,488 | 1.1% |
| Mexican American Indian | 127 | 0.0% |
| Mongolian | 16 | 0.0% |
| Moroccan | 384 | 0.1% |
| Native Hawaiian | 186 | 0.0% |
| Navajo | 27 | 0.0% |
| Nicaraguan | 377 | 0.1% |
| Nigerian | 42 | 0.0% |
| Northern European | 852 | 0.2% |
| Norwegian | 2,734 | 0.6% |
| Pakistani | 317 | 0.1% |
| Palestinian | 49 | 0.0% |
| Panamanian | 66 | 0.0% |
| Pennsylvania German | 104 | 0.0% |
| Peruvian | 513 | 0.1% |
| Polish | 17,080 | 4.0% |
| Portuguese | 6,938 | 1.6% |
| Potawatomi | 43 | 0.0% |
| Puerto Rican | 11,293 | 2.7% |
| Romanian | 532 | 0.1% |
| Russian | 3,102 | 0.7% |
| Salvadoran | 1,345 | 0.3% |
| Samoan | 25 | 0.0% |
| Scandinavian | 1,098 | 0.3% |
| Scotch-Irish | 3,761 | 0.9% |
| Scottish | 13,472 | 3.2% |
| Seminole | 26 | 0.0% |
| Serbian | 198 | 0.1% |
| Sioux | 22 | 0.0% |
| Slavic | 74 | 0.0% |
| Slovak | 327 | 0.1% |
| Slovene | 52 | 0.0% |
| Somali | 271 | 0.1% |
| South African | 3 | 0.0% |
| South American | 2,701 | 0.6% |
| South American Indian | 49 | 0.0% |
| Spaniard | 428 | 0.1% |
| Spanish | 693 | 0.2% |
| Sri Lankan | 2,387 | 0.6% |
| Subsaharan African | 5,217 | 1.2% |
| Sudanese | 589 | 0.1% |
| Swedish | 5,943 | 1.4% |
| Swiss | 565 | 0.1% |
| Syrian | 260 | 0.1% |
| Thai | 6,607 | 1.6% |
| Tlingit-Haida | 3 | 0.0% |
| Trinidadian and Tobagonian | 17 | 0.0% |
| Turkish | 276 | 0.1% |
| U.S. Virgin Islander | 9 | 0.0% |
| Ukrainian | 1,439 | 0.3% |
| Uruguayan | 164 | 0.0% |
| Venezuelan | 124 | 0.0% |
| Vietnamese | 99 | 0.0% |
| Welsh | 2,132 | 0.5% |
| West Indian | 408 | 0.1% |
| Yugoslavian | 1,005 | 0.2% |
| Yup'ik | 29 | 0.0% |
| Zimbabwean | 52 | 0.0% | View All 155 Rows |
Immigrants in Hillsborough County
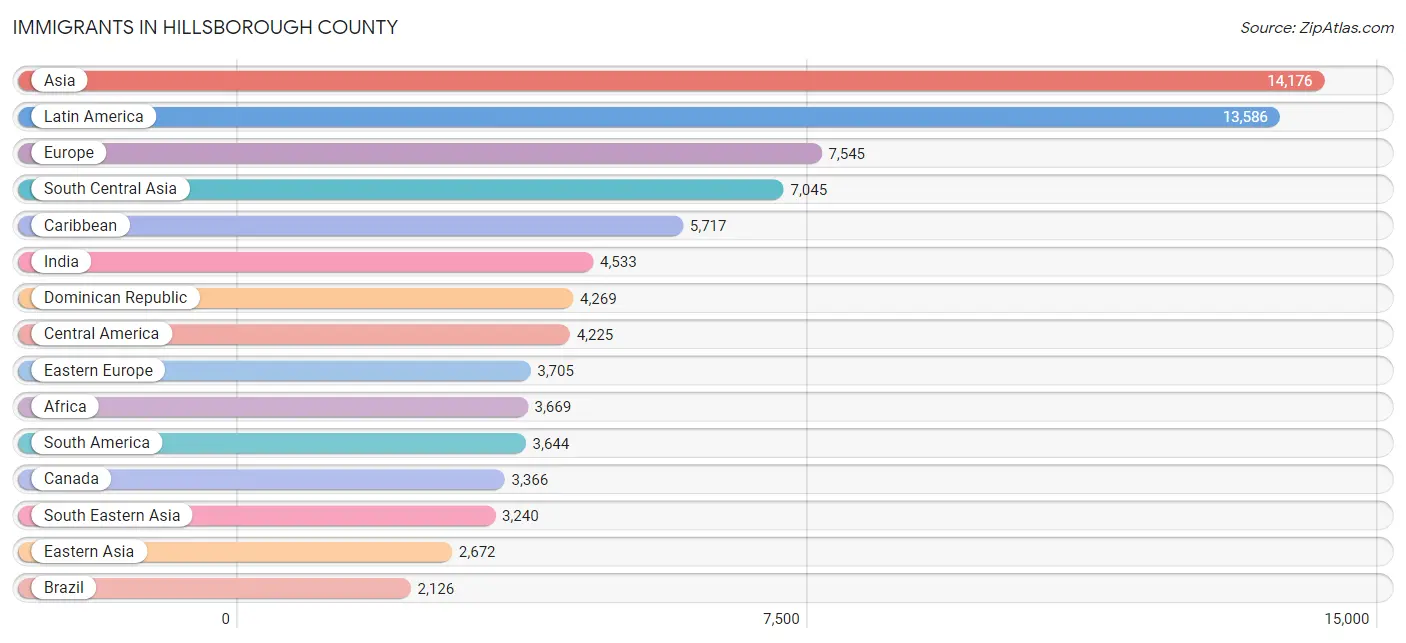
The most numerous immigrant groups reported in Hillsborough County came from Asia (14,176 | 3.4%), Latin America (13,586 | 3.2%), Europe (7,545 | 1.8%), South Central Asia (7,045 | 1.7%), and Caribbean (5,717 | 1.3%), together accounting for 11.4% of all Hillsborough County residents.
| Immigration Origin | # Population | % Population |
| Afghanistan | 51 | 0.0% |
| Africa | 3,669 | 0.9% |
| Albania | 292 | 0.1% |
| Argentina | 46 | 0.0% |
| Armenia | 67 | 0.0% |
| Asia | 14,176 | 3.4% |
| Australia | 38 | 0.0% |
| Austria | 47 | 0.0% |
| Azores | 115 | 0.0% |
| Bahamas | 1 | 0.0% |
| Bangladesh | 34 | 0.0% |
| Barbados | 20 | 0.0% |
| Belarus | 7 | 0.0% |
| Belgium | 17 | 0.0% |
| Bosnia and Herzegovina | 719 | 0.2% |
| Brazil | 2,126 | 0.5% |
| Bulgaria | 114 | 0.0% |
| Cabo Verde | 26 | 0.0% |
| Cambodia | 148 | 0.0% |
| Cameroon | 146 | 0.0% |
| Canada | 3,366 | 0.8% |
| Caribbean | 5,717 | 1.3% |
| Central America | 4,225 | 1.0% |
| Chile | 69 | 0.0% |
| China | 1,618 | 0.4% |
| Colombia | 862 | 0.2% |
| Congo | 54 | 0.0% |
| Croatia | 139 | 0.0% |
| Cuba | 276 | 0.1% |
| Czechoslovakia | 66 | 0.0% |
| Denmark | 33 | 0.0% |
| Dominica | 75 | 0.0% |
| Dominican Republic | 4,269 | 1.0% |
| Eastern Africa | 1,248 | 0.3% |
| Eastern Asia | 2,672 | 0.6% |
| Eastern Europe | 3,705 | 0.9% |
| Ecuador | 68 | 0.0% |
| Egypt | 252 | 0.1% |
| El Salvador | 735 | 0.2% |
| England | 471 | 0.1% |
| Ethiopia | 120 | 0.0% |
| Europe | 7,545 | 1.8% |
| Fiji | 2 | 0.0% |
| France | 170 | 0.0% |
| Germany | 1,076 | 0.3% |
| Ghana | 147 | 0.0% |
| Greece | 336 | 0.1% |
| Guatemala | 715 | 0.2% |
| Guyana | 73 | 0.0% |
| Haiti | 428 | 0.1% |
| Honduras | 1,190 | 0.3% |
| Hong Kong | 130 | 0.0% |
| Hungary | 165 | 0.0% |
| India | 4,533 | 1.1% |
| Indonesia | 170 | 0.0% |
| Iran | 180 | 0.0% |
| Iraq | 142 | 0.0% |
| Ireland | 209 | 0.1% |
| Israel | 86 | 0.0% |
| Italy | 164 | 0.0% |
| Jamaica | 370 | 0.1% |
| Japan | 195 | 0.1% |
| Jordan | 211 | 0.1% |
| Kazakhstan | 9 | 0.0% |
| Kenya | 350 | 0.1% |
| Korea | 859 | 0.2% |
| Laos | 98 | 0.0% |
| Latin America | 13,586 | 3.2% |
| Lebanon | 156 | 0.0% |
| Liberia | 336 | 0.1% |
| Lithuania | 18 | 0.0% |
| Malaysia | 196 | 0.1% |
| Mexico | 1,244 | 0.3% |
| Middle Africa | 630 | 0.2% |
| Moldova | 38 | 0.0% |
| Morocco | 244 | 0.1% |
| Nepal | 1,556 | 0.4% |
| Netherlands | 84 | 0.0% |
| Nicaragua | 296 | 0.1% |
| Nigeria | 95 | 0.0% |
| Northern Africa | 661 | 0.2% |
| Northern Europe | 1,411 | 0.3% |
| Norway | 43 | 0.0% |
| Oceania | 51 | 0.0% |
| Pakistan | 78 | 0.0% |
| Panama | 45 | 0.0% |
| Peru | 246 | 0.1% |
| Philippines | 905 | 0.2% |
| Poland | 333 | 0.1% |
| Portugal | 518 | 0.1% |
| Romania | 299 | 0.1% |
| Russia | 580 | 0.1% |
| Saudi Arabia | 49 | 0.0% |
| Scotland | 125 | 0.0% |
| Senegal | 12 | 0.0% |
| Serbia | 36 | 0.0% |
| Somalia | 62 | 0.0% |
| South Africa | 90 | 0.0% |
| South America | 3,644 | 0.9% |
| South Central Asia | 7,045 | 1.7% |
| South Eastern Asia | 3,240 | 0.8% |
| Southern Europe | 1,025 | 0.2% |
| Spain | 7 | 0.0% |
| Sri Lanka | 54 | 0.0% |
| Sudan | 122 | 0.0% |
| Sweden | 94 | 0.0% |
| Switzerland | 10 | 0.0% |
| Syria | 181 | 0.0% |
| Taiwan | 197 | 0.1% |
| Thailand | 137 | 0.0% |
| Trinidad and Tobago | 110 | 0.0% |
| Turkey | 131 | 0.0% |
| Uganda | 51 | 0.0% |
| Ukraine | 458 | 0.1% |
| Uruguay | 63 | 0.0% |
| Uzbekistan | 66 | 0.0% |
| Venezuela | 67 | 0.0% |
| Vietnam | 1,343 | 0.3% |
| Western Africa | 818 | 0.2% |
| Western Asia | 1,158 | 0.3% |
| Western Europe | 1,404 | 0.3% |
| Yemen | 15 | 0.0% |
| Zaire | 384 | 0.1% |
| Zimbabwe | 52 | 0.0% | View All 124 Rows |
Sex and Age in Hillsborough County
Sex and Age in Hillsborough County
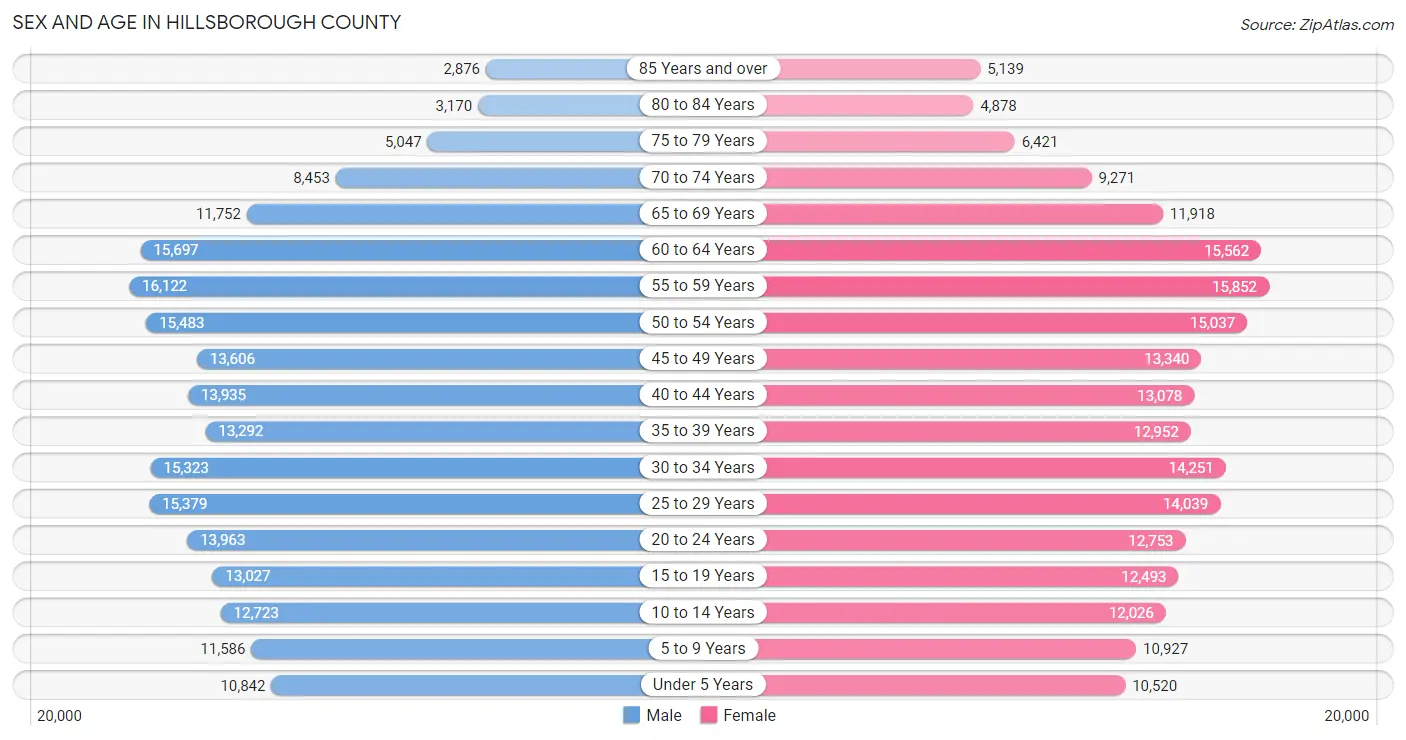
The most populous age groups in Hillsborough County are 55 to 59 Years (16,122 | 7.6%) for men and 55 to 59 Years (15,852 | 7.5%) for women.
| Age Bracket | Male | Female |
| Under 5 Years | 10,842 (5.1%) | 10,520 (5.0%) |
| 5 to 9 Years | 11,586 (5.5%) | 10,927 (5.2%) |
| 10 to 14 Years | 12,723 (6.0%) | 12,026 (5.7%) |
| 15 to 19 Years | 13,027 (6.1%) | 12,493 (5.9%) |
| 20 to 24 Years | 13,963 (6.6%) | 12,753 (6.1%) |
| 25 to 29 Years | 15,379 (7.2%) | 14,039 (6.7%) |
| 30 to 34 Years | 15,323 (7.2%) | 14,251 (6.8%) |
| 35 to 39 Years | 13,292 (6.3%) | 12,952 (6.1%) |
| 40 to 44 Years | 13,935 (6.6%) | 13,078 (6.2%) |
| 45 to 49 Years | 13,606 (6.4%) | 13,340 (6.3%) |
| 50 to 54 Years | 15,483 (7.3%) | 15,037 (7.1%) |
| 55 to 59 Years | 16,122 (7.6%) | 15,852 (7.5%) |
| 60 to 64 Years | 15,697 (7.4%) | 15,562 (7.4%) |
| 65 to 69 Years | 11,752 (5.5%) | 11,918 (5.7%) |
| 70 to 74 Years | 8,453 (4.0%) | 9,271 (4.4%) |
| 75 to 79 Years | 5,047 (2.4%) | 6,421 (3.0%) |
| 80 to 84 Years | 3,170 (1.5%) | 4,878 (2.3%) |
| 85 Years and over | 2,876 (1.3%) | 5,139 (2.4%) |
| Total | 212,276 (100.0%) | 210,457 (100.0%) |
Families and Households in Hillsborough County
Median Family Size in Hillsborough County
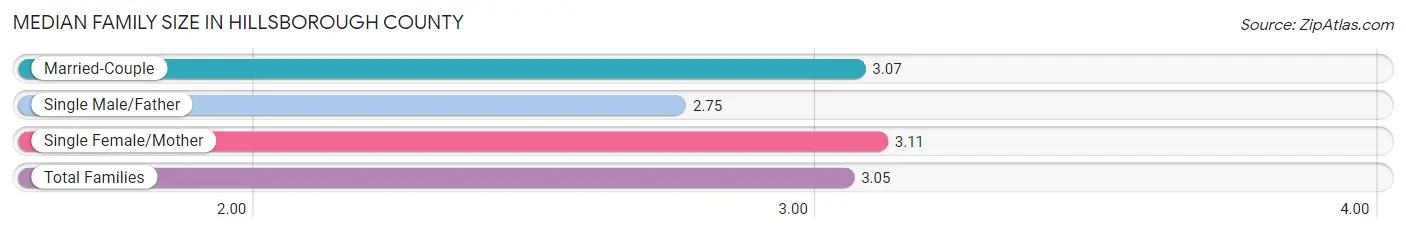
The median family size in Hillsborough County is 3.05 persons per family, with single female/mother families (15,226 | 14.2%) accounting for the largest median family size of 3.11 persons per family. On the other hand, single male/father families (8,036 | 7.5%) represent the smallest median family size with 2.75 persons per family.
| Family Type | # Families | Family Size |
| Married-Couple | 83,960 (78.3%) | 3.07 |
| Single Male/Father | 8,036 (7.5%) | 2.75 |
| Single Female/Mother | 15,226 (14.2%) | 3.11 |
| Total Families | 107,222 (100.0%) | 3.05 |
Median Household Size in Hillsborough County
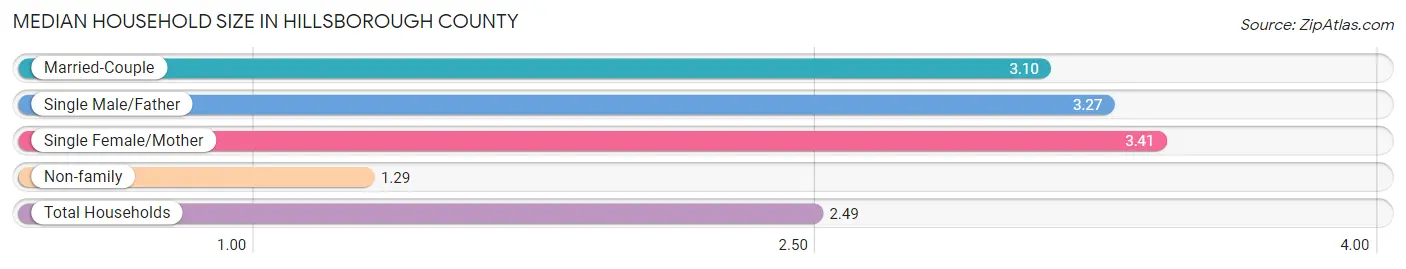
The median household size in Hillsborough County is 2.49 persons per household, with single female/mother households (15,226 | 9.1%) accounting for the largest median household size of 3.41 persons per household. non-family households (59,122 | 35.5%) represent the smallest median household size with 1.29 persons per household.
| Household Type | # Households | Household Size |
| Married-Couple | 83,960 (50.5%) | 3.10 |
| Single Male/Father | 8,036 (4.8%) | 3.27 |
| Single Female/Mother | 15,226 (9.1%) | 3.41 |
| Non-family | 59,122 (35.5%) | 1.29 |
| Total Households | 166,344 (100.0%) | 2.49 |
Household Size by Marriage Status in Hillsborough County
Out of a total of 166,344 households in Hillsborough County, 107,222 (64.5%) are family households, while 59,122 (35.5%) are nonfamily households. The most numerous type of family households are 2-person households, comprising 47,574, and the most common type of nonfamily households are 1-person households, comprising 45,283.
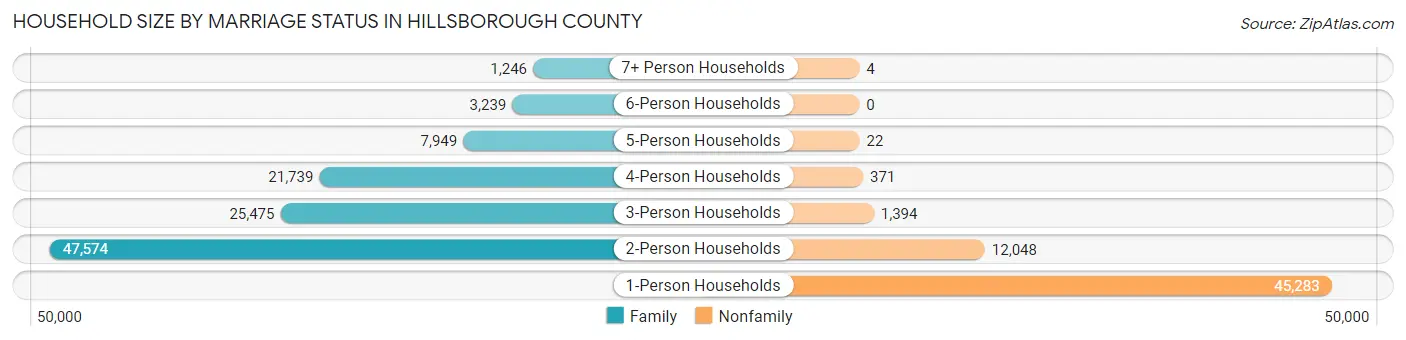
| Household Size | Family Households | Nonfamily Households |
| 1-Person Households | - | 45,283 (27.2%) |
| 2-Person Households | 47,574 (28.6%) | 12,048 (7.2%) |
| 3-Person Households | 25,475 (15.3%) | 1,394 (0.8%) |
| 4-Person Households | 21,739 (13.1%) | 371 (0.2%) |
| 5-Person Households | 7,949 (4.8%) | 22 (0.0%) |
| 6-Person Households | 3,239 (1.9%) | 0 (0.0%) |
| 7+ Person Households | 1,246 (0.7%) | 4 (0.0%) |
| Total | 107,222 (64.5%) | 59,122 (35.5%) |
Female Fertility in Hillsborough County
Fertility by Age in Hillsborough County
Average fertility rate in Hillsborough County is 47.0 births per 1,000 women. Women in the age bracket of 20 to 34 years have the highest fertility rate with 78.0 births per 1,000 women. Women in the age bracket of 20 to 34 years acount for 69.9% of all women with births.
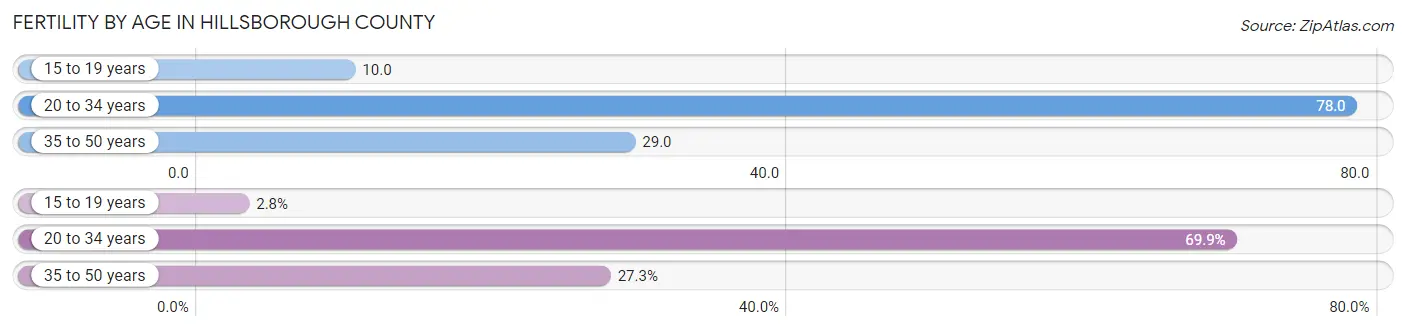
| Age Bracket | Women with Births | Births / 1,000 Women |
| 15 to 19 years | 128 (2.8%) | 10.0 |
| 20 to 34 years | 3,190 (69.9%) | 78.0 |
| 35 to 50 years | 1,248 (27.3%) | 29.0 |
| Total | 4,566 (100.0%) | 47.0 |
Fertility by Age by Marriage Status in Hillsborough County
67.4% of women with births (4,566) in Hillsborough County are married. The highest percentage of unmarried women with births falls into 15 to 19 years age bracket with 100.0% of them unmarried at the time of birth, while the lowest percentage of unmarried women with births belong to 35 to 50 years age bracket with 24.0% of them unmarried.
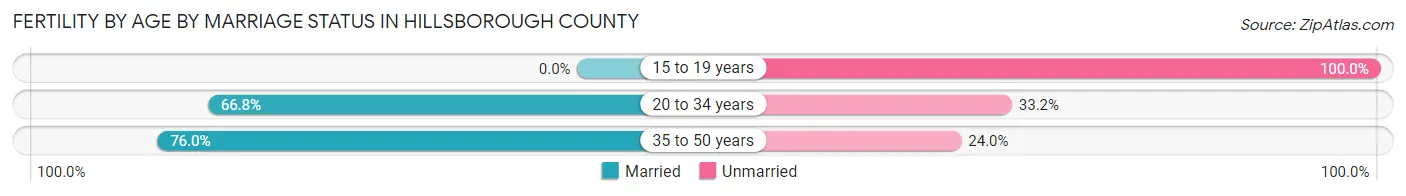
| Age Bracket | Married | Unmarried |
| 15 to 19 years | 0 (0.0%) | 128 (100.0%) |
| 20 to 34 years | 2,131 (66.8%) | 1,059 (33.2%) |
| 35 to 50 years | 948 (76.0%) | 300 (24.0%) |
| Total | 3,077 (67.4%) | 1,489 (32.6%) |
Fertility by Education in Hillsborough County
Average fertility rate in Hillsborough County is 47.0 births per 1,000 women. Women with the education attainment of graduate degree have the highest fertility rate of 62.0 births per 1,000 women, while women with the education attainment of college or associate's degree have the lowest fertility at 27.0 births per 1,000 women. Women with the education attainment of bachelor's degree represent 30.9% of all women with births.
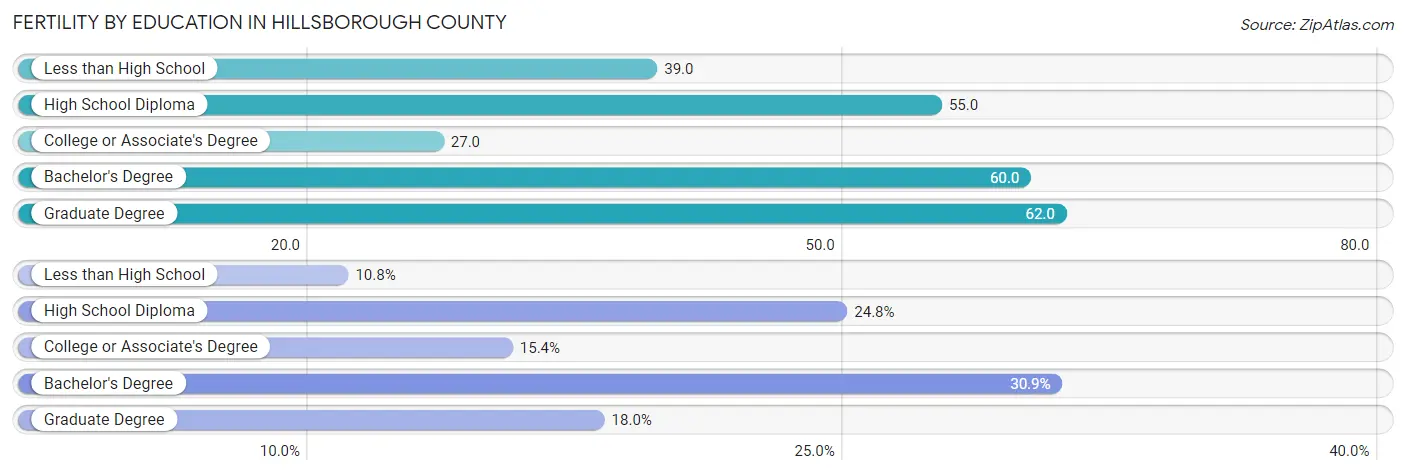
| Educational Attainment | Women with Births | Births / 1,000 Women |
| Less than High School | 494 (10.8%) | 39.0 |
| High School Diploma | 1,134 (24.8%) | 55.0 |
| College or Associate's Degree | 705 (15.4%) | 27.0 |
| Bachelor's Degree | 1,410 (30.9%) | 60.0 |
| Graduate Degree | 823 (18.0%) | 62.0 |
| Total | 4,566 (100.0%) | 47.0 |
Fertility by Education by Marriage Status in Hillsborough County
32.6% of women with births in Hillsborough County are unmarried. Women with the educational attainment of graduate degree are most likely to be married with 90.4% of them married at childbirth, while women with the educational attainment of high school diploma are least likely to be married with 62.8% of them unmarried at childbirth.
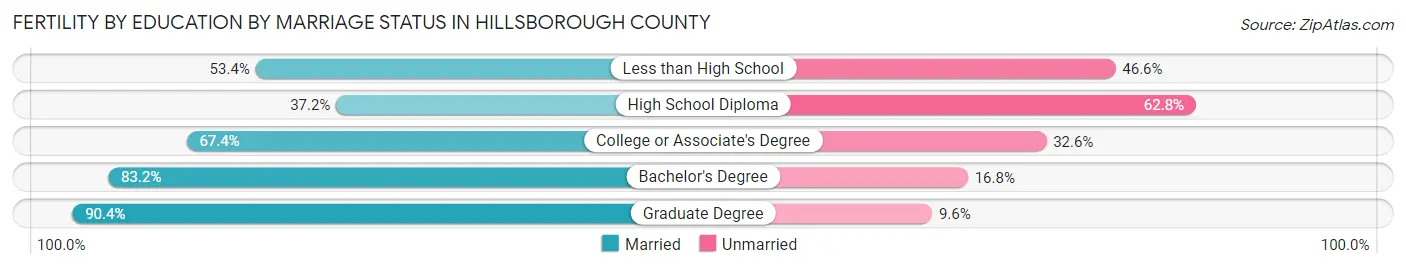
| Educational Attainment | Married | Unmarried |
| Less than High School | 264 (53.4%) | 230 (46.6%) |
| High School Diploma | 422 (37.2%) | 712 (62.8%) |
| College or Associate's Degree | 475 (67.4%) | 230 (32.6%) |
| Bachelor's Degree | 1,173 (83.2%) | 237 (16.8%) |
| Graduate Degree | 744 (90.4%) | 79 (9.6%) |
| Total | 3,077 (67.4%) | 1,489 (32.6%) |
Employment Characteristics in Hillsborough County
Employment by Class of Employer in Hillsborough County
Among the 231,932 employed individuals in Hillsborough County, private company employees (164,101 | 70.8%), not-for-profit organizations (25,373 | 10.9%), and local government employees (14,615 | 6.3%) make up the most common classes of employment.
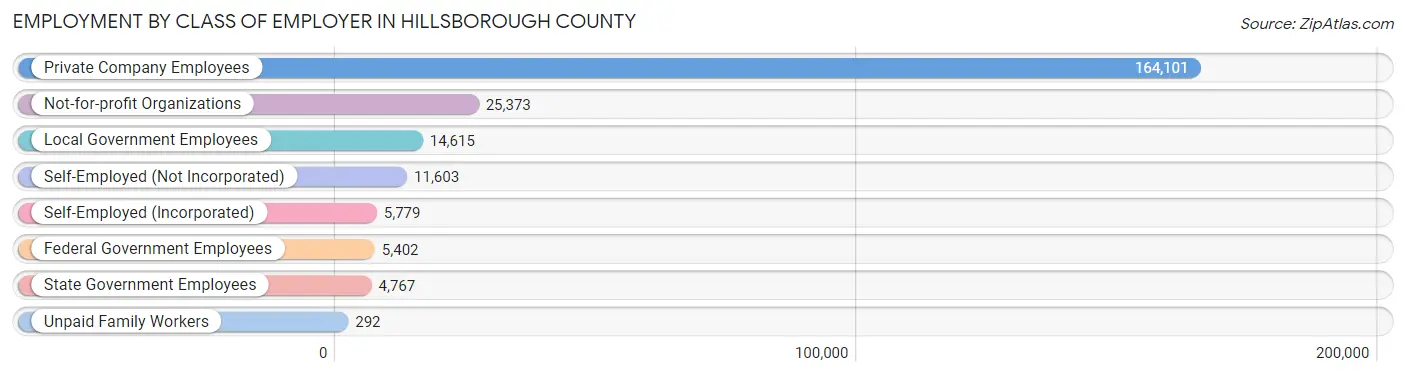
| Employer Class | # Employees | % Employees |
| Private Company Employees | 164,101 | 70.8% |
| Self-Employed (Incorporated) | 5,779 | 2.5% |
| Self-Employed (Not Incorporated) | 11,603 | 5.0% |
| Not-for-profit Organizations | 25,373 | 10.9% |
| Local Government Employees | 14,615 | 6.3% |
| State Government Employees | 4,767 | 2.1% |
| Federal Government Employees | 5,402 | 2.3% |
| Unpaid Family Workers | 292 | 0.1% |
| Total | 231,932 | 100.0% |
Employment Status by Age in Hillsborough County
According to the labor force statistics for Hillsborough County, out of the total population over 16 years of age (348,834), 70.5% or 245,928 individuals are in the labor force, with 3.7% or 9,099 of them unemployed. The age group with the highest labor force participation rate is 25 to 29 years, with 91.8% or 27,006 individuals in the labor force. Within the labor force, the 16 to 19 years age range has the highest percentage of unemployed individuals, with 11.2% or 1,206 of them being unemployed.
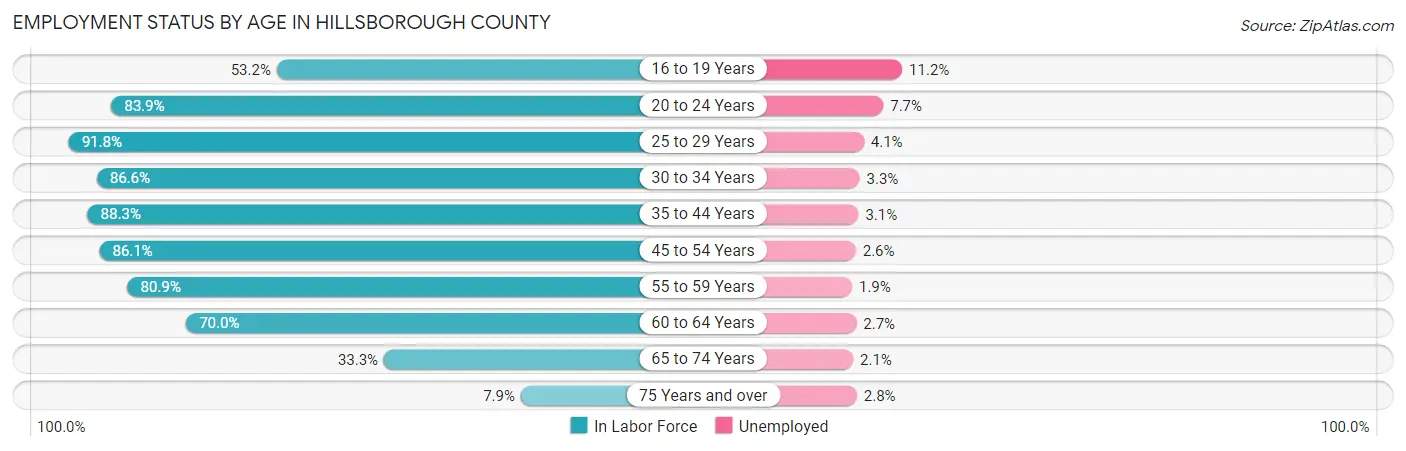
| Age Bracket | In Labor Force | Unemployed |
| 16 to 19 Years | 10,770 (53.2%) | 1,206 (11.2%) |
| 20 to 24 Years | 22,415 (83.9%) | 1,726 (7.7%) |
| 25 to 29 Years | 27,006 (91.8%) | 1,107 (4.1%) |
| 30 to 34 Years | 25,611 (86.6%) | 845 (3.3%) |
| 35 to 44 Years | 47,026 (88.3%) | 1,458 (3.1%) |
| 45 to 54 Years | 49,478 (86.1%) | 1,286 (2.6%) |
| 55 to 59 Years | 25,867 (80.9%) | 491 (1.9%) |
| 60 to 64 Years | 21,881 (70.0%) | 591 (2.7%) |
| 65 to 74 Years | 13,784 (33.3%) | 289 (2.1%) |
| 75 Years and over | 2,175 (7.9%) | 61 (2.8%) |
| Total | 245,928 (70.5%) | 9,099 (3.7%) |
Employment Status by Educational Attainment in Hillsborough County
According to labor force statistics for Hillsborough County, 84.5% of individuals (196,841) out of the total population between 25 and 64 years of age (232,948) are in the labor force, with 2.9% or 5,708 of them being unemployed. The group with the highest labor force participation rate are those with the educational attainment of bachelor's degree or higher, with 89.5% or 87,186 individuals in the labor force. Within the labor force, individuals with less than high school education have the highest percentage of unemployment, with 6.8% or 684 of them being unemployed.
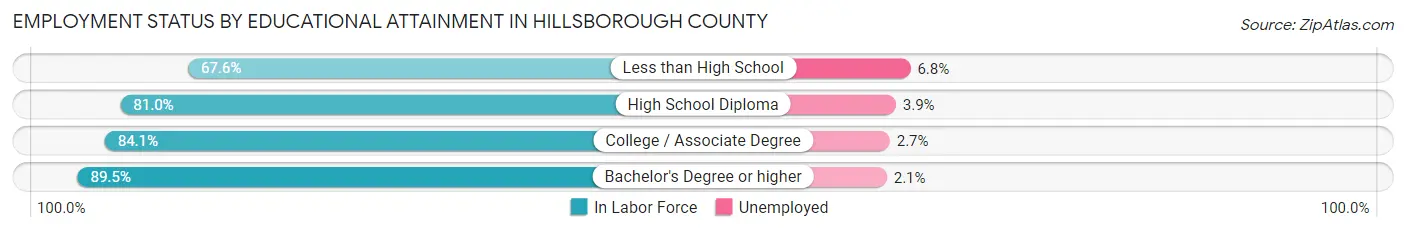
| Educational Attainment | In Labor Force | Unemployed |
| Less than High School | 10,064 (67.6%) | 1,012 (6.8%) |
| High School Diploma | 46,068 (81.0%) | 2,218 (3.9%) |
| College / Associate Degree | 53,631 (84.1%) | 1,722 (2.7%) |
| Bachelor's Degree or higher | 87,186 (89.5%) | 2,046 (2.1%) |
| Total | 196,841 (84.5%) | 6,755 (2.9%) |
Employment Occupations by Sex in Hillsborough County
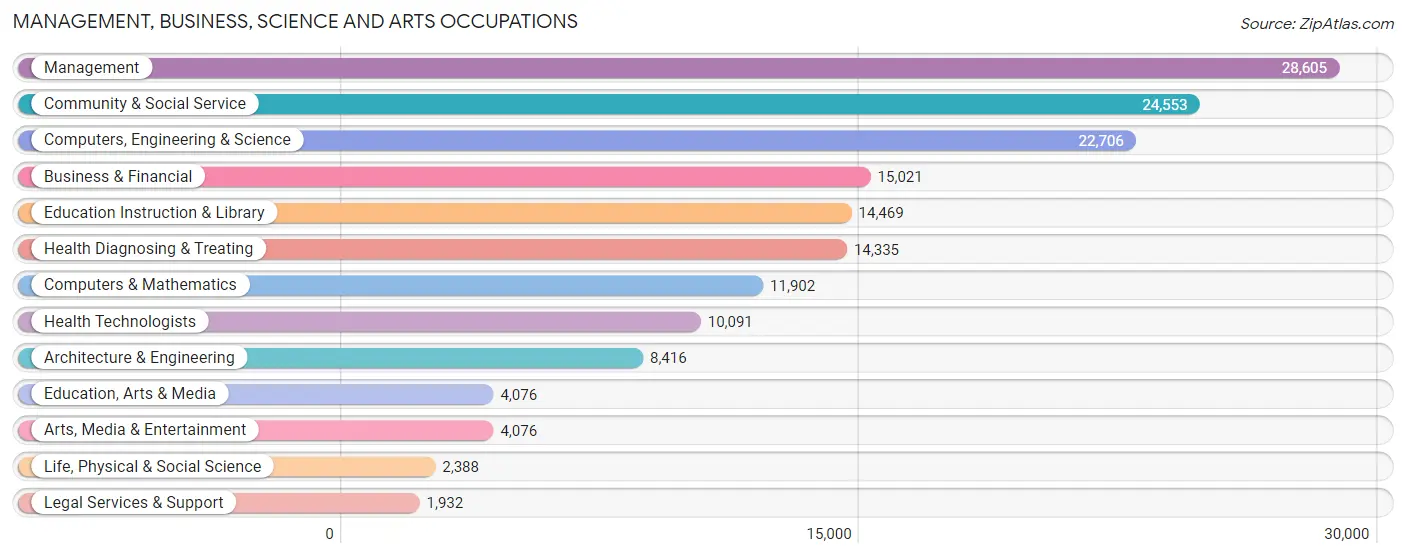
Management, Business, Science and Arts Occupations
The most common Management, Business, Science and Arts occupations in Hillsborough County are Management (28,605 | 12.1%), Community & Social Service (24,553 | 10.4%), Computers, Engineering & Science (22,706 | 9.6%), Business & Financial (15,021 | 6.4%), and Education Instruction & Library (14,469 | 6.1%).
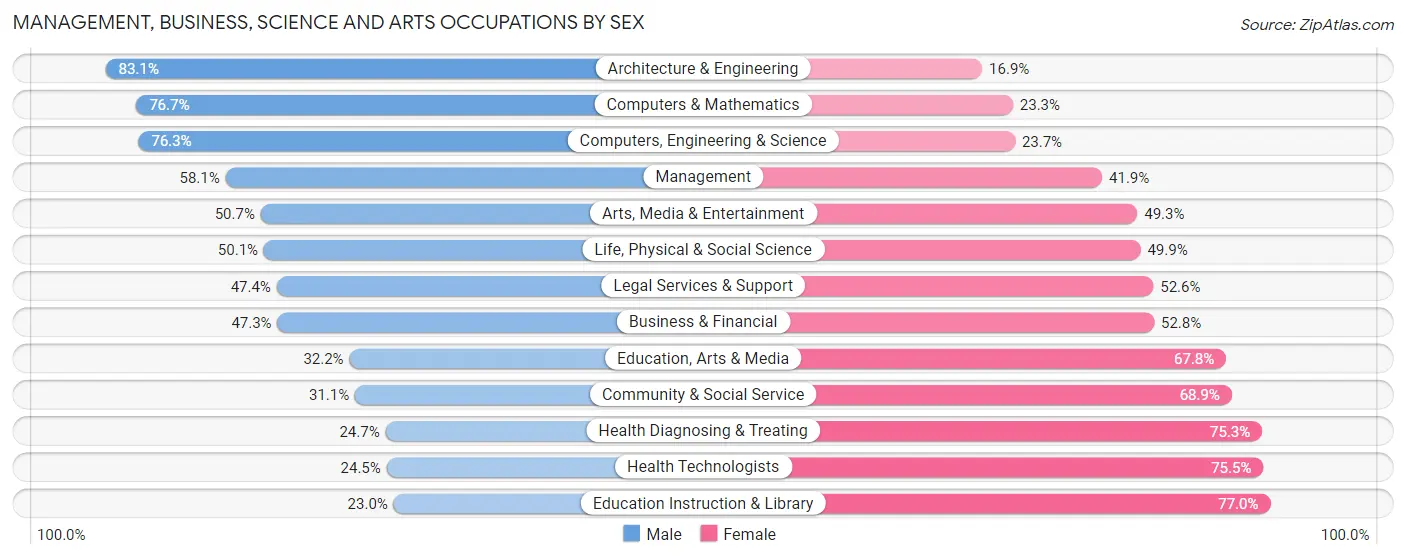
Management, Business, Science and Arts Occupations by Sex
Within the Management, Business, Science and Arts occupations in Hillsborough County, the most male-oriented occupations are Architecture & Engineering (83.1%), Computers & Mathematics (76.7%), and Computers, Engineering & Science (76.3%), while the most female-oriented occupations are Education Instruction & Library (77.0%), Health Technologists (75.5%), and Health Diagnosing & Treating (75.3%).
| Occupation | Male | Female |
| Management | 16,614 (58.1%) | 11,991 (41.9%) |
| Business & Financial | 7,098 (47.2%) | 7,923 (52.7%) |
| Computers, Engineering & Science | 17,319 (76.3%) | 5,387 (23.7%) |
| Computers & Mathematics | 9,129 (76.7%) | 2,773 (23.3%) |
| Architecture & Engineering | 6,994 (83.1%) | 1,422 (16.9%) |
| Life, Physical & Social Science | 1,196 (50.1%) | 1,192 (49.9%) |
| Community & Social Service | 7,627 (31.1%) | 16,926 (68.9%) |
| Education, Arts & Media | 1,314 (32.2%) | 2,762 (67.8%) |
| Legal Services & Support | 916 (47.4%) | 1,016 (52.6%) |
| Education Instruction & Library | 3,329 (23.0%) | 11,140 (77.0%) |
| Arts, Media & Entertainment | 2,068 (50.7%) | 2,008 (49.3%) |
| Health Diagnosing & Treating | 3,543 (24.7%) | 10,792 (75.3%) |
| Health Technologists | 2,470 (24.5%) | 7,621 (75.5%) |
| Total (Category) | 52,201 (49.6%) | 53,019 (50.4%) |
| Total (Overall) | 125,732 (53.2%) | 110,764 (46.8%) |
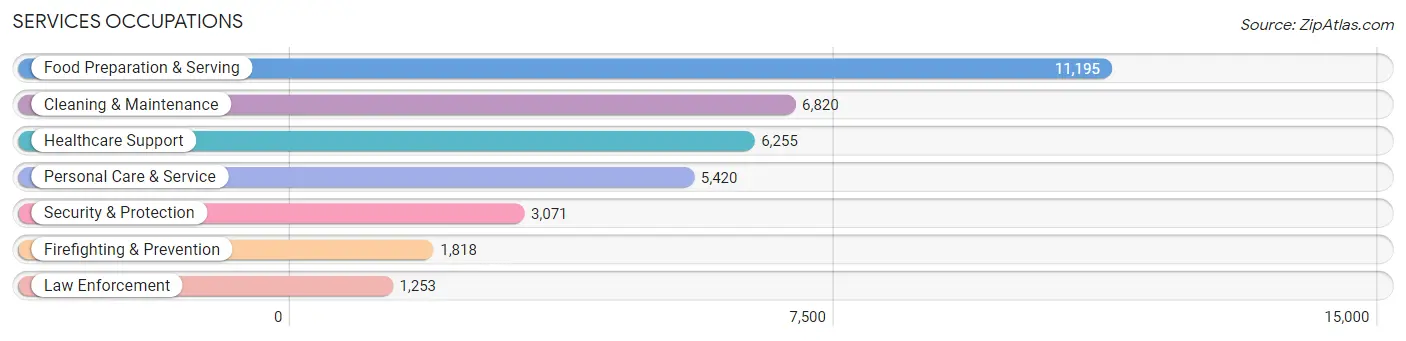
Services Occupations
The most common Services occupations in Hillsborough County are Food Preparation & Serving (11,195 | 4.7%), Cleaning & Maintenance (6,820 | 2.9%), Healthcare Support (6,255 | 2.6%), Personal Care & Service (5,420 | 2.3%), and Security & Protection (3,071 | 1.3%).
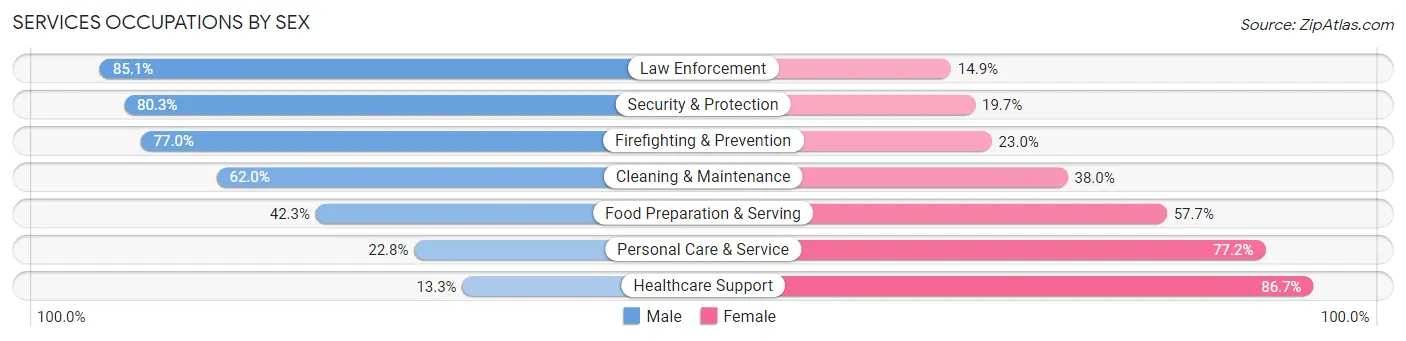
Services Occupations by Sex
Within the Services occupations in Hillsborough County, the most male-oriented occupations are Law Enforcement (85.1%), Security & Protection (80.3%), and Firefighting & Prevention (77.0%), while the most female-oriented occupations are Healthcare Support (86.7%), Personal Care & Service (77.2%), and Food Preparation & Serving (57.7%).
| Occupation | Male | Female |
| Healthcare Support | 832 (13.3%) | 5,423 (86.7%) |
| Security & Protection | 2,466 (80.3%) | 605 (19.7%) |
| Firefighting & Prevention | 1,400 (77.0%) | 418 (23.0%) |
| Law Enforcement | 1,066 (85.1%) | 187 (14.9%) |
| Food Preparation & Serving | 4,740 (42.3%) | 6,455 (57.7%) |
| Cleaning & Maintenance | 4,227 (62.0%) | 2,593 (38.0%) |
| Personal Care & Service | 1,238 (22.8%) | 4,182 (77.2%) |
| Total (Category) | 13,503 (41.2%) | 19,258 (58.8%) |
| Total (Overall) | 125,732 (53.2%) | 110,764 (46.8%) |
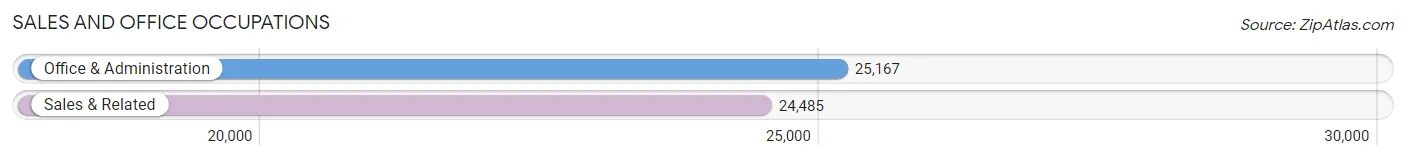
Sales and Office Occupations
The most common Sales and Office occupations in Hillsborough County are Office & Administration (25,167 | 10.6%), and Sales & Related (24,485 | 10.3%).
Sales and Office Occupations by Sex
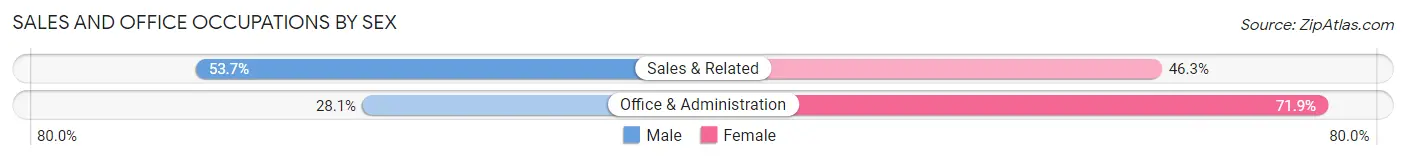
| Occupation | Male | Female |
| Sales & Related | 13,138 (53.7%) | 11,347 (46.3%) |
| Office & Administration | 7,071 (28.1%) | 18,096 (71.9%) |
| Total (Category) | 20,209 (40.7%) | 29,443 (59.3%) |
| Total (Overall) | 125,732 (53.2%) | 110,764 (46.8%) |
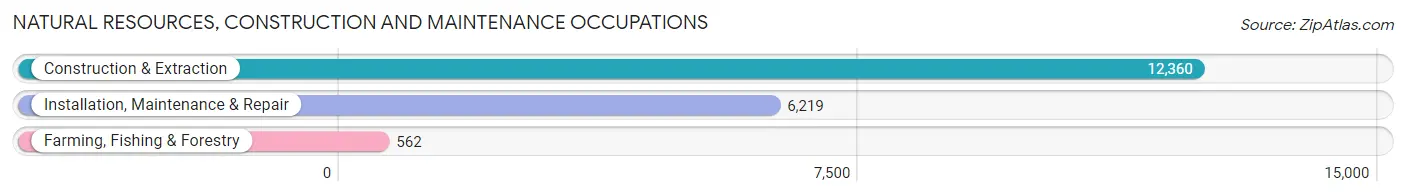
Natural Resources, Construction and Maintenance Occupations
The most common Natural Resources, Construction and Maintenance occupations in Hillsborough County are Construction & Extraction (12,360 | 5.2%), Installation, Maintenance & Repair (6,219 | 2.6%), and Farming, Fishing & Forestry (562 | 0.2%).
Natural Resources, Construction and Maintenance Occupations by Sex
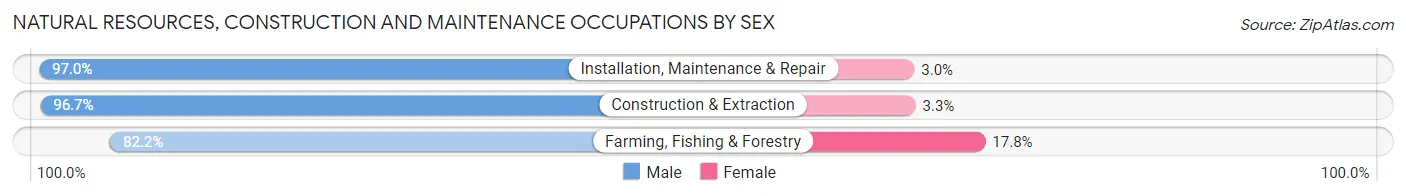
| Occupation | Male | Female |
| Farming, Fishing & Forestry | 462 (82.2%) | 100 (17.8%) |
| Construction & Extraction | 11,956 (96.7%) | 404 (3.3%) |
| Installation, Maintenance & Repair | 6,032 (97.0%) | 187 (3.0%) |
| Total (Category) | 18,450 (96.4%) | 691 (3.6%) |
| Total (Overall) | 125,732 (53.2%) | 110,764 (46.8%) |
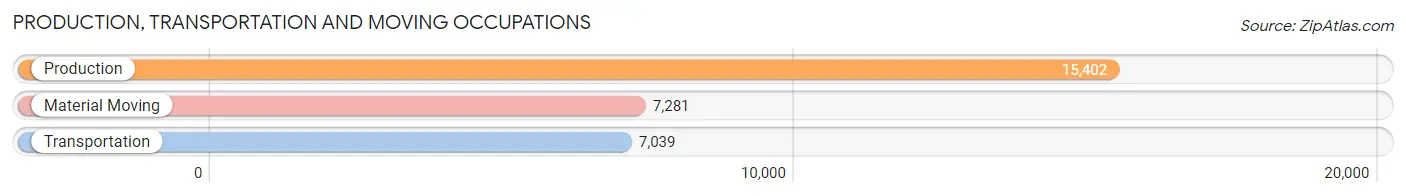
Production, Transportation and Moving Occupations
The most common Production, Transportation and Moving occupations in Hillsborough County are Production (15,402 | 6.5%), Material Moving (7,281 | 3.1%), and Transportation (7,039 | 3.0%).
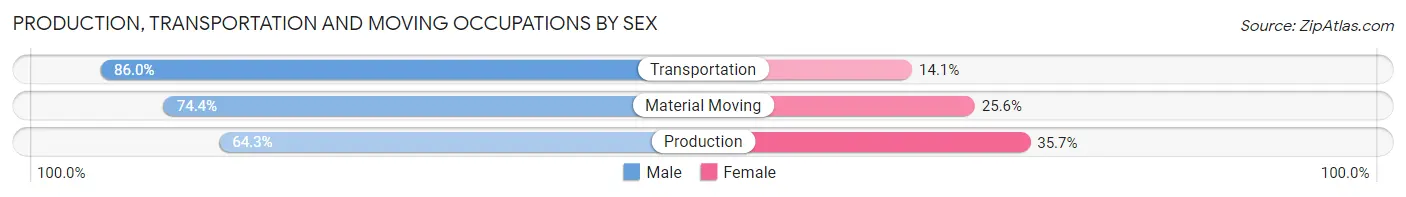
Production, Transportation and Moving Occupations by Sex
| Occupation | Male | Female |
| Production | 9,899 (64.3%) | 5,503 (35.7%) |
| Transportation | 6,050 (86.0%) | 989 (14.1%) |
| Material Moving | 5,420 (74.4%) | 1,861 (25.6%) |
| Total (Category) | 21,369 (71.9%) | 8,353 (28.1%) |
| Total (Overall) | 125,732 (53.2%) | 110,764 (46.8%) |
Employment Industries by Sex in Hillsborough County
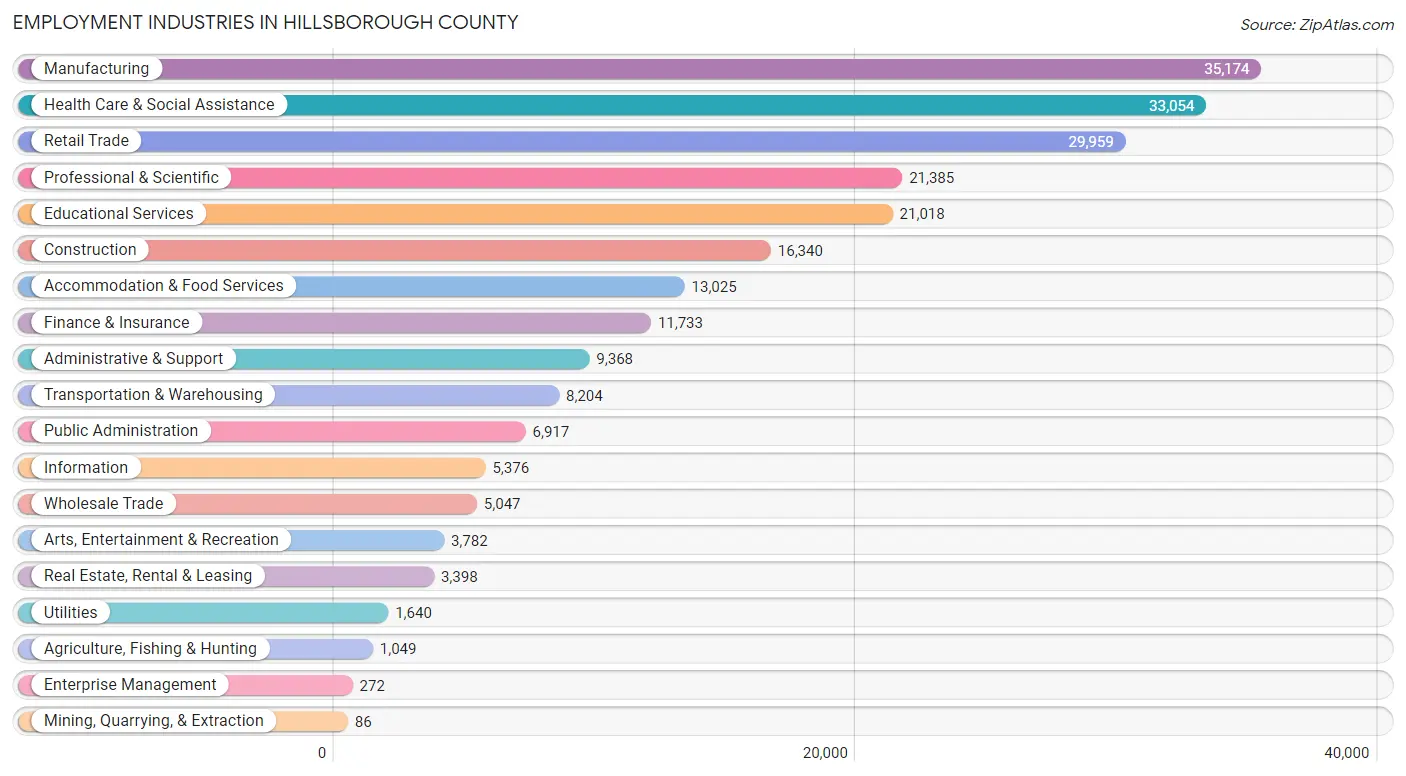
Employment Industries in Hillsborough County
The major employment industries in Hillsborough County include Manufacturing (35,174 | 14.9%), Health Care & Social Assistance (33,054 | 14.0%), Retail Trade (29,959 | 12.7%), Professional & Scientific (21,385 | 9.0%), and Educational Services (21,018 | 8.9%).
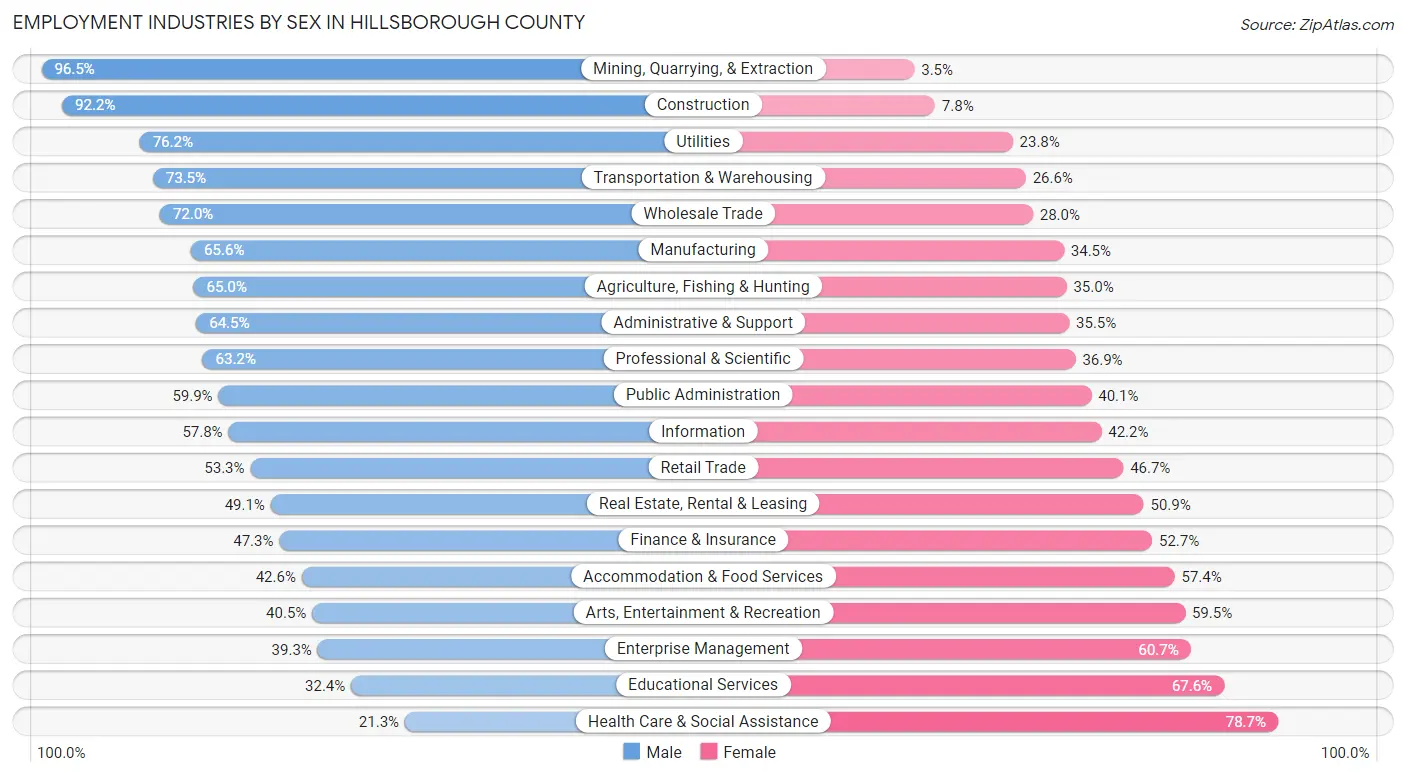
Employment Industries by Sex in Hillsborough County
The Hillsborough County industries that see more men than women are Mining, Quarrying, & Extraction (96.5%), Construction (92.2%), and Utilities (76.2%), whereas the industries that tend to have a higher number of women are Health Care & Social Assistance (78.7%), Educational Services (67.6%), and Enterprise Management (60.7%).
| Industry | Male | Female |
| Agriculture, Fishing & Hunting | 682 (65.0%) | 367 (35.0%) |
| Mining, Quarrying, & Extraction | 83 (96.5%) | 3 (3.5%) |
| Construction | 15,072 (92.2%) | 1,268 (7.8%) |
| Manufacturing | 23,058 (65.5%) | 12,116 (34.4%) |
| Wholesale Trade | 3,633 (72.0%) | 1,414 (28.0%) |
| Retail Trade | 15,958 (53.3%) | 14,001 (46.7%) |
| Transportation & Warehousing | 6,026 (73.5%) | 2,178 (26.6%) |
| Utilities | 1,249 (76.2%) | 391 (23.8%) |
| Information | 3,108 (57.8%) | 2,268 (42.2%) |
| Finance & Insurance | 5,549 (47.3%) | 6,184 (52.7%) |
| Real Estate, Rental & Leasing | 1,667 (49.1%) | 1,731 (50.9%) |
| Professional & Scientific | 13,504 (63.1%) | 7,881 (36.8%) |
| Enterprise Management | 107 (39.3%) | 165 (60.7%) |
| Administrative & Support | 6,039 (64.5%) | 3,329 (35.5%) |
| Educational Services | 6,813 (32.4%) | 14,205 (67.6%) |
| Health Care & Social Assistance | 7,035 (21.3%) | 26,019 (78.7%) |
| Arts, Entertainment & Recreation | 1,531 (40.5%) | 2,251 (59.5%) |
| Accommodation & Food Services | 5,554 (42.6%) | 7,471 (57.4%) |
| Public Administration | 4,142 (59.9%) | 2,775 (40.1%) |
| Total | 125,732 (53.2%) | 110,764 (46.8%) |
Education in Hillsborough County
School Enrollment in Hillsborough County
The most common levels of schooling among the 91,692 students in Hillsborough County are high school (20,993 | 22.9%), middle school (19,066 | 20.8%), and elementary school (18,290 | 20.0%).
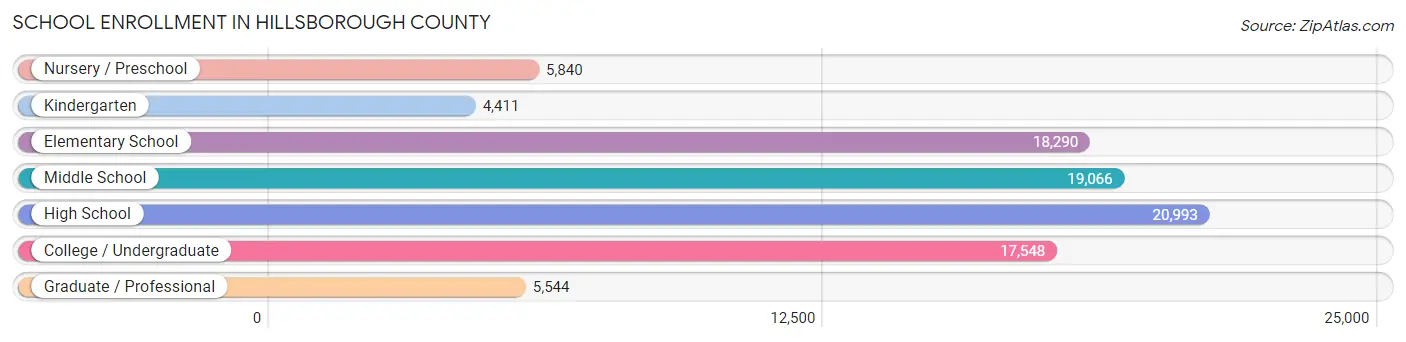
| School Level | # Students | % Students |
| Nursery / Preschool | 5,840 | 6.4% |
| Kindergarten | 4,411 | 4.8% |
| Elementary School | 18,290 | 20.0% |
| Middle School | 19,066 | 20.8% |
| High School | 20,993 | 22.9% |
| College / Undergraduate | 17,548 | 19.1% |
| Graduate / Professional | 5,544 | 6.0% |
| Total | 91,692 | 100.0% |
School Enrollment by Age by Funding Source in Hillsborough County
Out of a total of 91,692 students who are enrolled in schools in Hillsborough County, 21,914 (23.9%) attend a private institution, while the remaining 69,778 (76.1%) are enrolled in public schools. The age group of 3 to 4 year olds has the highest likelihood of being enrolled in private schools, with 2,599 (55.9% in the age bracket) enrolled. Conversely, the age group of 15 to 17 year olds has the lowest likelihood of being enrolled in a private school, with 13,728 (89.8% in the age bracket) attending a public institution.
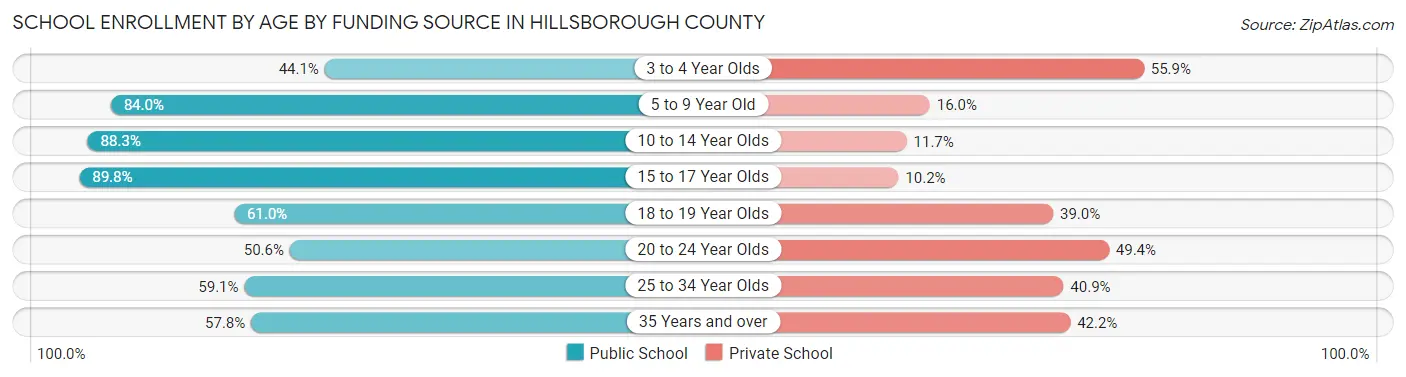
| Age Bracket | Public School | Private School |
| 3 to 4 Year Olds | 2,050 (44.1%) | 2,599 (55.9%) |
| 5 to 9 Year Old | 17,610 (84.0%) | 3,365 (16.0%) |
| 10 to 14 Year Olds | 21,448 (88.3%) | 2,847 (11.7%) |
| 15 to 17 Year Olds | 13,728 (89.8%) | 1,559 (10.2%) |
| 18 to 19 Year Olds | 4,424 (61.0%) | 2,829 (39.0%) |
| 20 to 24 Year Olds | 4,556 (50.6%) | 4,446 (49.4%) |
| 25 to 34 Year Olds | 3,193 (59.1%) | 2,212 (40.9%) |
| 35 Years and over | 2,790 (57.8%) | 2,036 (42.2%) |
| Total | 69,778 (76.1%) | 21,914 (23.9%) |
Educational Attainment by Field of Study in Hillsborough County
Business (26,797 | 20.3%), engineering (13,554 | 10.3%), education (11,989 | 9.1%), science & technology (11,052 | 8.4%), and social sciences (9,422 | 7.1%) are the most common fields of study among 131,782 individuals in Hillsborough County who have obtained a bachelor's degree or higher.
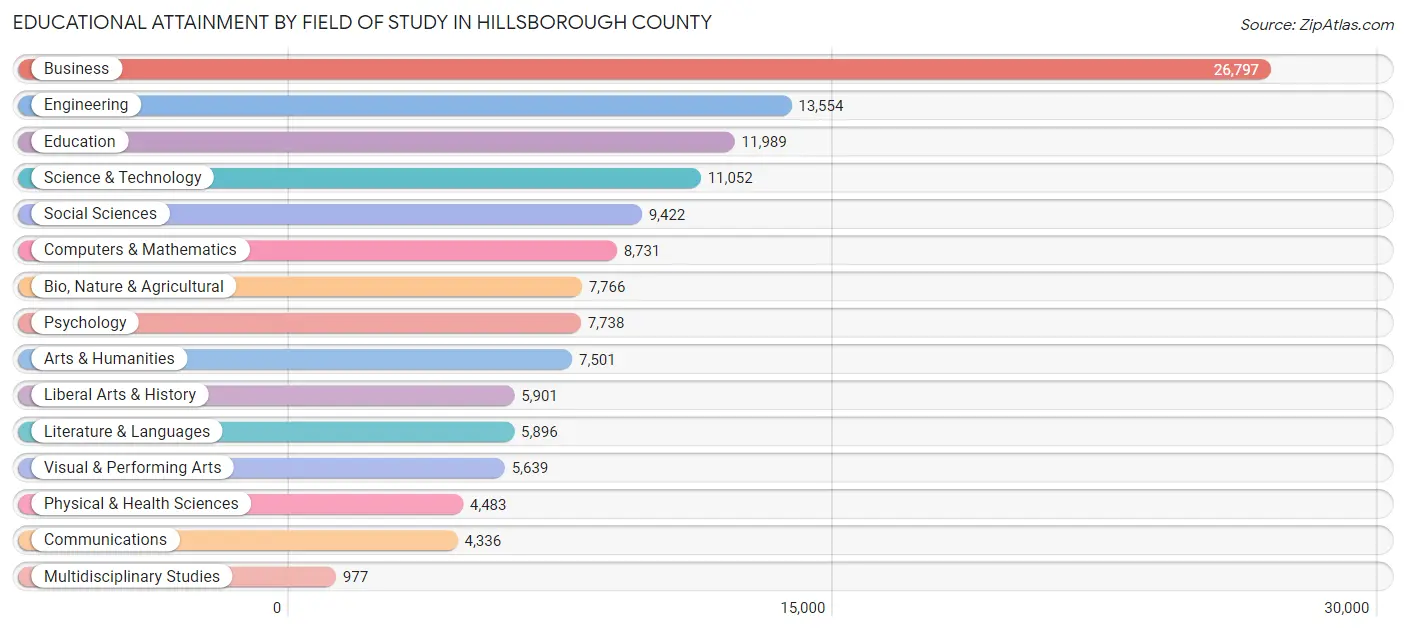
| Field of Study | # Graduates | % Graduates |
| Computers & Mathematics | 8,731 | 6.6% |
| Bio, Nature & Agricultural | 7,766 | 5.9% |
| Physical & Health Sciences | 4,483 | 3.4% |
| Psychology | 7,738 | 5.9% |
| Social Sciences | 9,422 | 7.1% |
| Engineering | 13,554 | 10.3% |
| Multidisciplinary Studies | 977 | 0.7% |
| Science & Technology | 11,052 | 8.4% |
| Business | 26,797 | 20.3% |
| Education | 11,989 | 9.1% |
| Literature & Languages | 5,896 | 4.5% |
| Liberal Arts & History | 5,901 | 4.5% |
| Visual & Performing Arts | 5,639 | 4.3% |
| Communications | 4,336 | 3.3% |
| Arts & Humanities | 7,501 | 5.7% |
| Total | 131,782 | 100.0% |
Transportation & Commute in Hillsborough County
Vehicle Availability by Sex in Hillsborough County
The most prevalent vehicle ownership categories in Hillsborough County are males with 2 vehicles (56,125, accounting for 45.4%) and females with 2 vehicles (45,954, making up 52.5%).
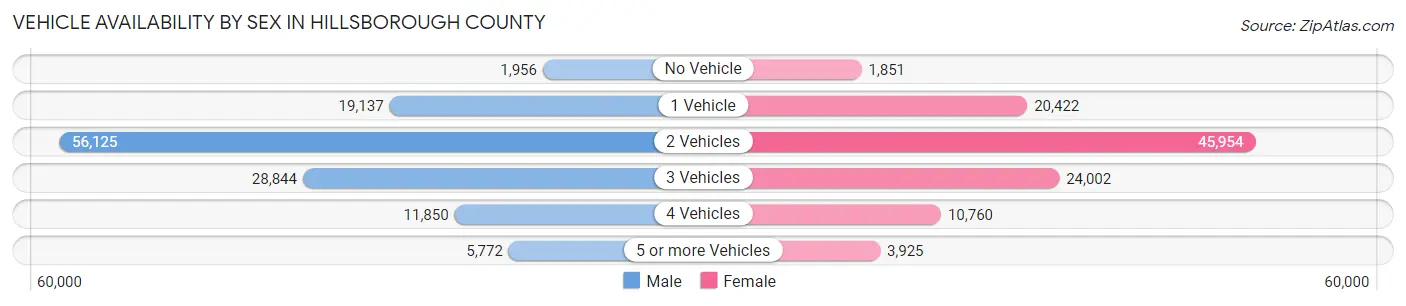
| Vehicles Available | Male | Female |
| No Vehicle | 1,956 (1.6%) | 1,851 (1.7%) |
| 1 Vehicle | 19,137 (15.5%) | 20,422 (19.1%) |
| 2 Vehicles | 56,125 (45.4%) | 45,954 (43.0%) |
| 3 Vehicles | 28,844 (23.3%) | 24,002 (22.5%) |
| 4 Vehicles | 11,850 (9.6%) | 10,760 (10.1%) |
| 5 or more Vehicles | 5,772 (4.7%) | 3,925 (3.7%) |
| Total | 123,684 (100.0%) | 106,914 (100.0%) |
Commute Time in Hillsborough County
The most frequently occuring commute durations in Hillsborough County are 15 to 19 minutes (30,002 commuters, 15.0%), 10 to 14 minutes (29,871 commuters, 14.9%), and 20 to 24 minutes (26,640 commuters, 13.3%).
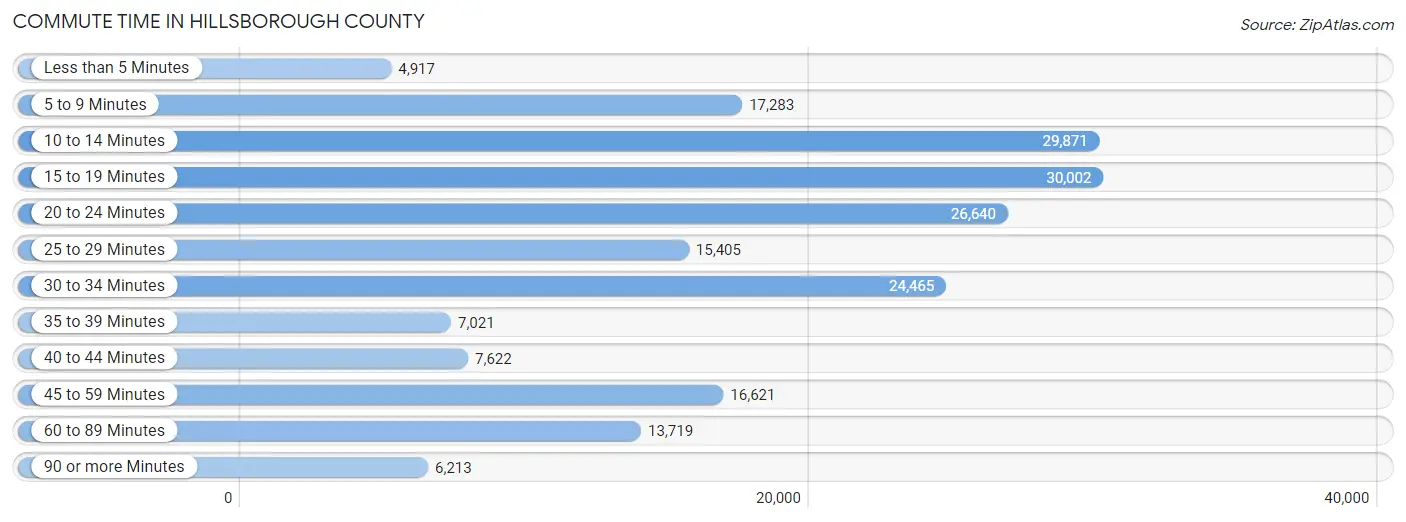
| Commute Time | # Commuters | % Commuters |
| Less than 5 Minutes | 4,917 | 2.5% |
| 5 to 9 Minutes | 17,283 | 8.6% |
| 10 to 14 Minutes | 29,871 | 14.9% |
| 15 to 19 Minutes | 30,002 | 15.0% |
| 20 to 24 Minutes | 26,640 | 13.3% |
| 25 to 29 Minutes | 15,405 | 7.7% |
| 30 to 34 Minutes | 24,465 | 12.2% |
| 35 to 39 Minutes | 7,021 | 3.5% |
| 40 to 44 Minutes | 7,622 | 3.8% |
| 45 to 59 Minutes | 16,621 | 8.3% |
| 60 to 89 Minutes | 13,719 | 6.9% |
| 90 or more Minutes | 6,213 | 3.1% |
Commute Time by Sex in Hillsborough County
The most common commute times in Hillsborough County are 10 to 14 minutes (14,262 commuters, 13.5%) for males and 15 to 19 minutes (15,866 commuters, 16.9%) for females.
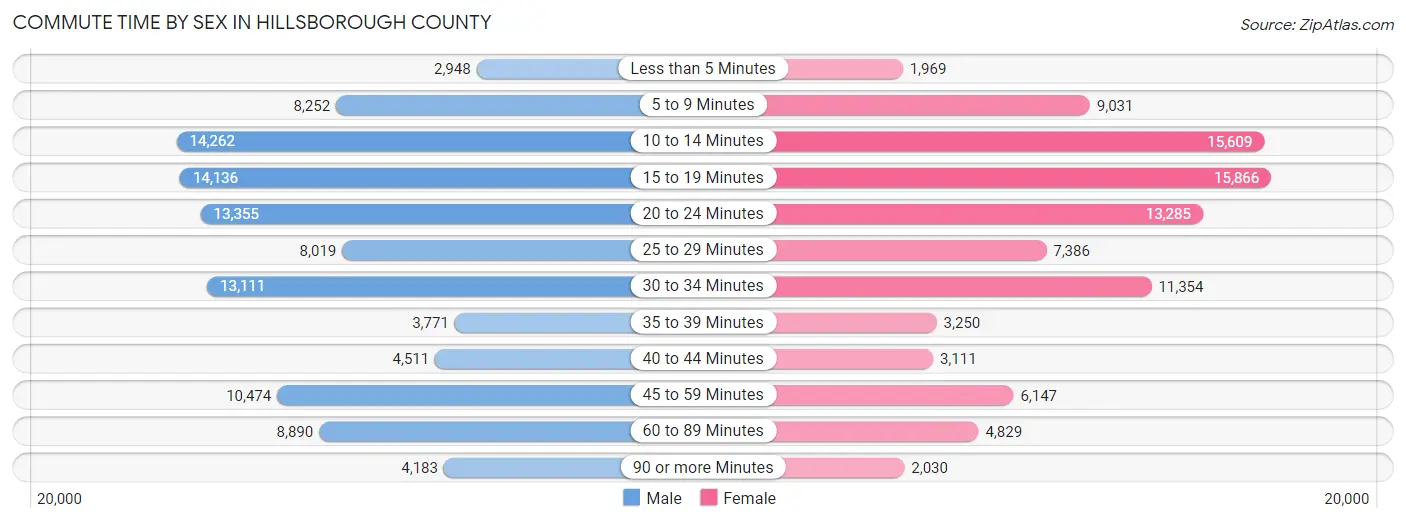
| Commute Time | Male | Female |
| Less than 5 Minutes | 2,948 (2.8%) | 1,969 (2.1%) |
| 5 to 9 Minutes | 8,252 (7.8%) | 9,031 (9.6%) |
| 10 to 14 Minutes | 14,262 (13.5%) | 15,609 (16.6%) |
| 15 to 19 Minutes | 14,136 (13.4%) | 15,866 (16.9%) |
| 20 to 24 Minutes | 13,355 (12.6%) | 13,285 (14.1%) |
| 25 to 29 Minutes | 8,019 (7.6%) | 7,386 (7.9%) |
| 30 to 34 Minutes | 13,111 (12.4%) | 11,354 (12.1%) |
| 35 to 39 Minutes | 3,771 (3.6%) | 3,250 (3.5%) |
| 40 to 44 Minutes | 4,511 (4.3%) | 3,111 (3.3%) |
| 45 to 59 Minutes | 10,474 (9.9%) | 6,147 (6.6%) |
| 60 to 89 Minutes | 8,890 (8.4%) | 4,829 (5.1%) |
| 90 or more Minutes | 4,183 (4.0%) | 2,030 (2.2%) |
Time of Departure to Work by Sex in Hillsborough County
The most frequent times of departure to work in Hillsborough County are 7:00 AM to 7:29 AM (14,598, 13.8%) for males and 7:00 AM to 7:29 AM (13,385, 14.3%) for females.
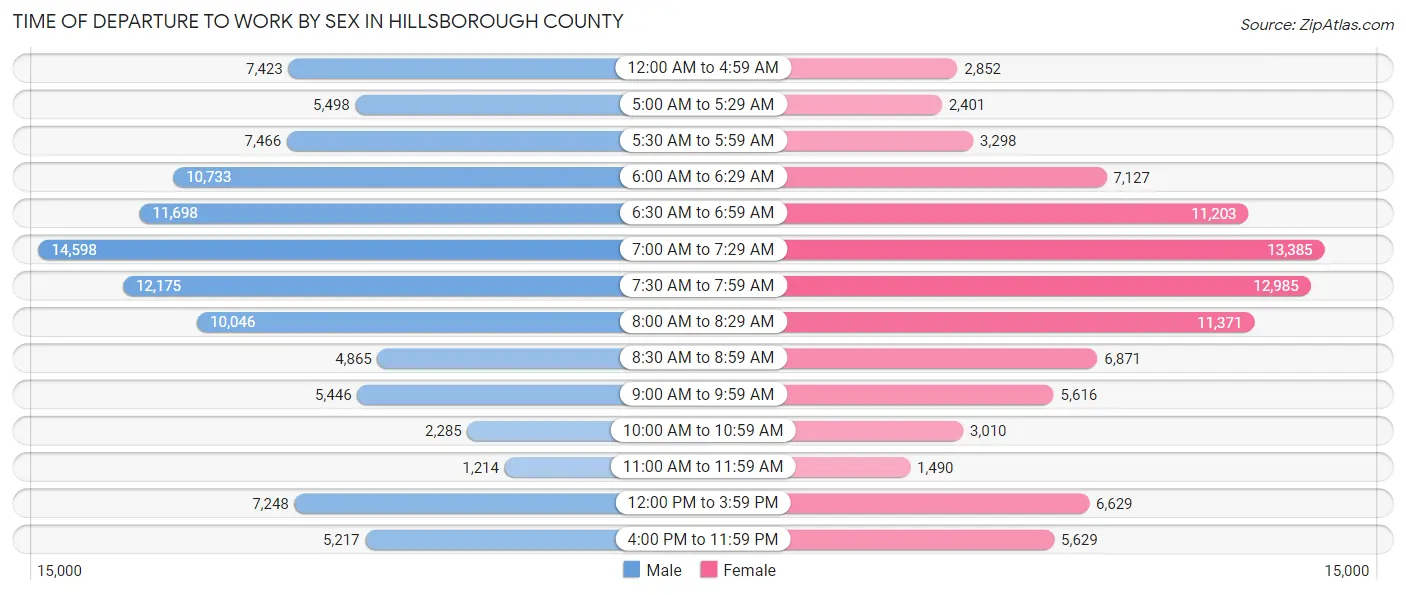
| Time of Departure | Male | Female |
| 12:00 AM to 4:59 AM | 7,423 (7.0%) | 2,852 (3.0%) |
| 5:00 AM to 5:29 AM | 5,498 (5.2%) | 2,401 (2.6%) |
| 5:30 AM to 5:59 AM | 7,466 (7.0%) | 3,298 (3.5%) |
| 6:00 AM to 6:29 AM | 10,733 (10.1%) | 7,127 (7.6%) |
| 6:30 AM to 6:59 AM | 11,698 (11.1%) | 11,203 (11.9%) |
| 7:00 AM to 7:29 AM | 14,598 (13.8%) | 13,385 (14.3%) |
| 7:30 AM to 7:59 AM | 12,175 (11.5%) | 12,985 (13.8%) |
| 8:00 AM to 8:29 AM | 10,046 (9.5%) | 11,371 (12.1%) |
| 8:30 AM to 8:59 AM | 4,865 (4.6%) | 6,871 (7.3%) |
| 9:00 AM to 9:59 AM | 5,446 (5.1%) | 5,616 (6.0%) |
| 10:00 AM to 10:59 AM | 2,285 (2.2%) | 3,010 (3.2%) |
| 11:00 AM to 11:59 AM | 1,214 (1.1%) | 1,490 (1.6%) |
| 12:00 PM to 3:59 PM | 7,248 (6.8%) | 6,629 (7.1%) |
| 4:00 PM to 11:59 PM | 5,217 (4.9%) | 5,629 (6.0%) |
| Total | 105,912 (100.0%) | 93,867 (100.0%) |
Housing Occupancy in Hillsborough County
Occupancy by Ownership in Hillsborough County
Of the total 166,344 dwellings in Hillsborough County, owner-occupied units account for 111,661 (67.1%), while renter-occupied units make up 54,683 (32.9%).
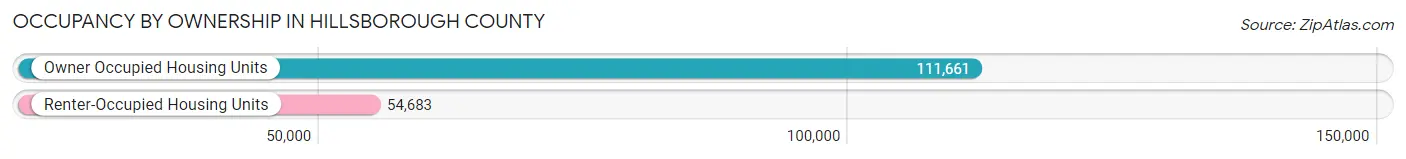
| Occupancy | # Housing Units | % Housing Units |
| Owner Occupied Housing Units | 111,661 | 67.1% |
| Renter-Occupied Housing Units | 54,683 | 32.9% |
| Total Occupied Housing Units | 166,344 | 100.0% |
Occupancy by Household Size in Hillsborough County
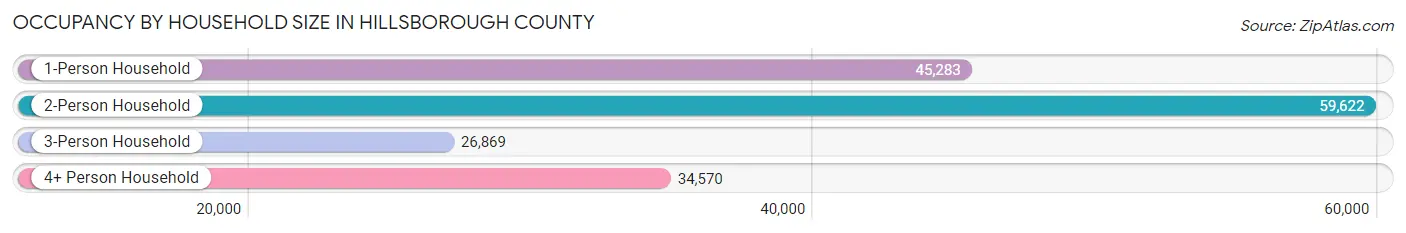
| Household Size | # Housing Units | % Housing Units |
| 1-Person Household | 45,283 | 27.2% |
| 2-Person Household | 59,622 | 35.8% |
| 3-Person Household | 26,869 | 16.2% |
| 4+ Person Household | 34,570 | 20.8% |
| Total Housing Units | 166,344 | 100.0% |
Occupancy by Ownership by Household Size in Hillsborough County
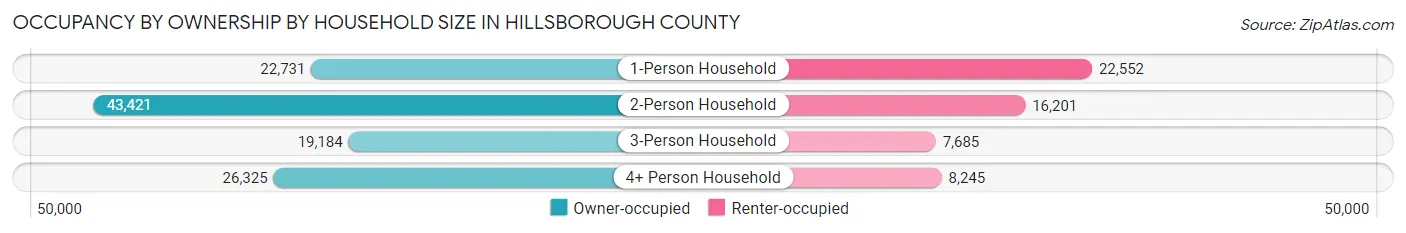
| Household Size | Owner-occupied | Renter-occupied |
| 1-Person Household | 22,731 (50.2%) | 22,552 (49.8%) |
| 2-Person Household | 43,421 (72.8%) | 16,201 (27.2%) |
| 3-Person Household | 19,184 (71.4%) | 7,685 (28.6%) |
| 4+ Person Household | 26,325 (76.1%) | 8,245 (23.8%) |
| Total Housing Units | 111,661 (67.1%) | 54,683 (32.9%) |
Occupancy by Educational Attainment in Hillsborough County
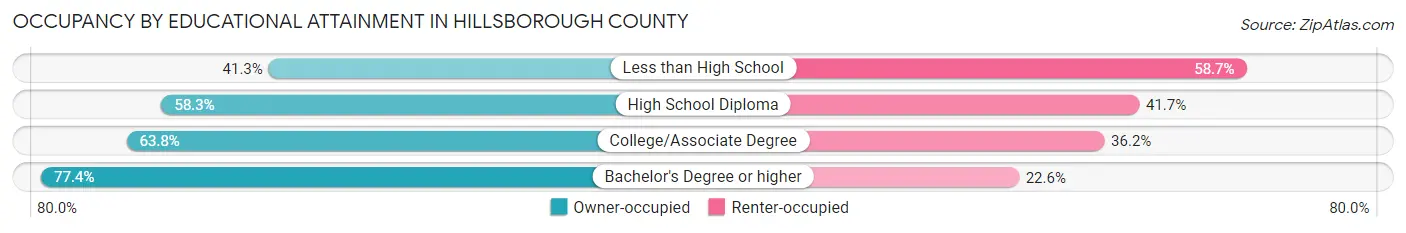
| Household Size | Owner-occupied | Renter-occupied |
| Less than High School | 3,885 (41.3%) | 5,521 (58.7%) |
| High School Diploma | 21,956 (58.3%) | 15,696 (41.7%) |
| College/Associate Degree | 30,611 (63.8%) | 17,337 (36.2%) |
| Bachelor's Degree or higher | 55,209 (77.4%) | 16,129 (22.6%) |
Occupancy by Age of Householder in Hillsborough County
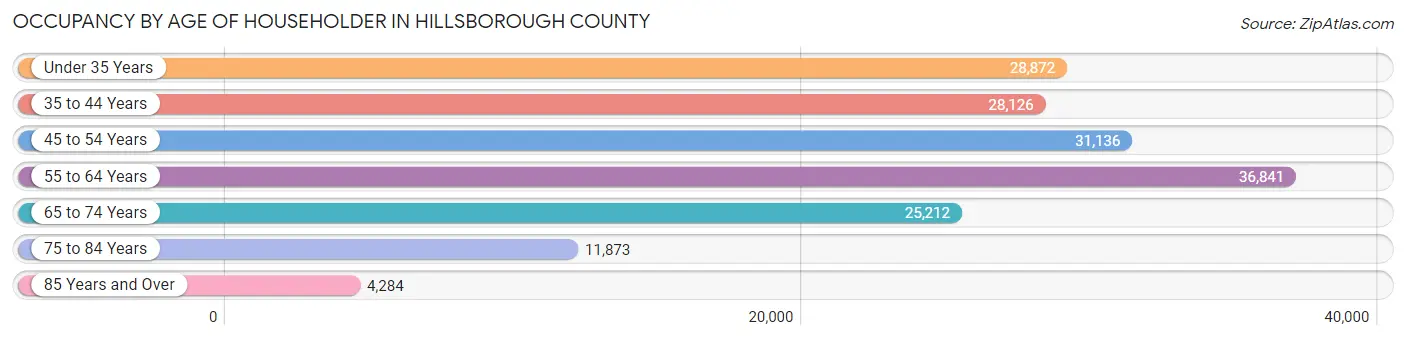
| Age Bracket | # Households | % Households |
| Under 35 Years | 28,872 | 17.4% |
| 35 to 44 Years | 28,126 | 16.9% |
| 45 to 54 Years | 31,136 | 18.7% |
| 55 to 64 Years | 36,841 | 22.2% |
| 65 to 74 Years | 25,212 | 15.2% |
| 75 to 84 Years | 11,873 | 7.1% |
| 85 Years and Over | 4,284 | 2.6% |
| Total | 166,344 | 100.0% |
Housing Finances in Hillsborough County
Median Income by Occupancy in Hillsborough County
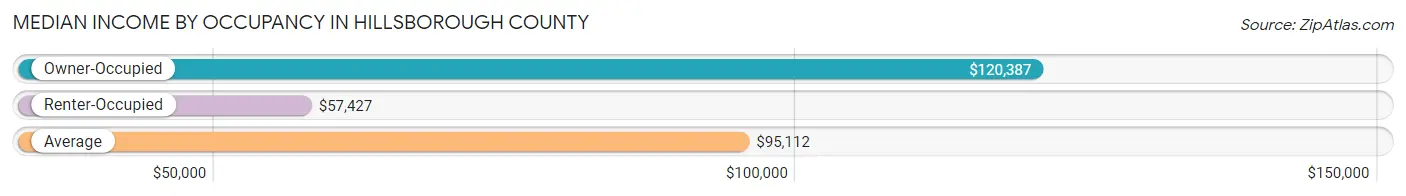
| Occupancy Type | # Households | Median Income |
| Owner-Occupied | 111,661 (67.1%) | $120,387 |
| Renter-Occupied | 54,683 (32.9%) | $57,427 |
| Average | 166,344 (100.0%) | $95,112 |
Occupancy by Householder Income Bracket in Hillsborough County
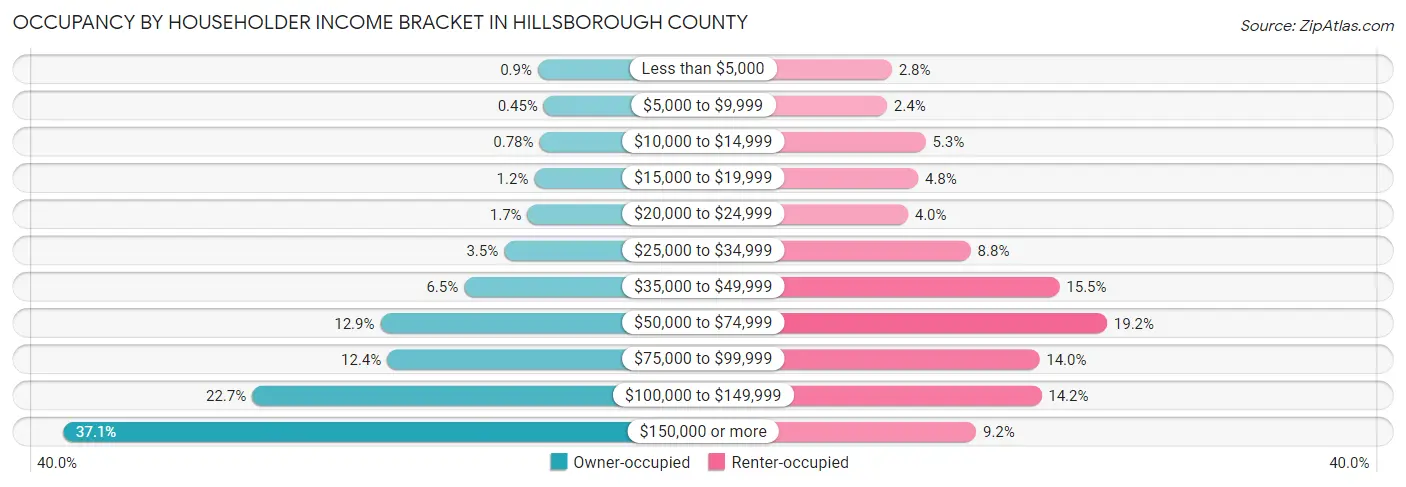
| Income Bracket | Owner-occupied | Renter-occupied |
| Less than $5,000 | 1,001 (0.9%) | 1,507 (2.8%) |
| $5,000 to $9,999 | 500 (0.4%) | 1,307 (2.4%) |
| $10,000 to $14,999 | 868 (0.8%) | 2,917 (5.3%) |
| $15,000 to $19,999 | 1,307 (1.2%) | 2,605 (4.8%) |
| $20,000 to $24,999 | 1,886 (1.7%) | 2,175 (4.0%) |
| $25,000 to $34,999 | 3,875 (3.5%) | 4,797 (8.8%) |
| $35,000 to $49,999 | 7,284 (6.5%) | 8,490 (15.5%) |
| $50,000 to $74,999 | 14,401 (12.9%) | 10,470 (19.2%) |
| $75,000 to $99,999 | 13,819 (12.4%) | 7,658 (14.0%) |
| $100,000 to $149,999 | 25,318 (22.7%) | 7,736 (14.1%) |
| $150,000 or more | 41,402 (37.1%) | 5,021 (9.2%) |
| Total | 111,661 (100.0%) | 54,683 (100.0%) |
Monthly Housing Cost Tiers in Hillsborough County
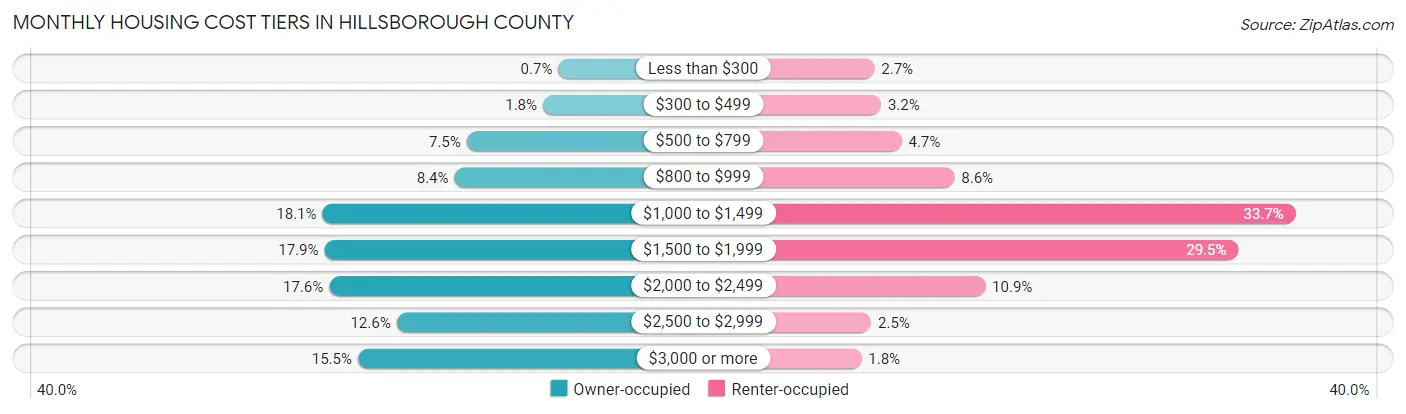
| Monthly Cost | Owner-occupied | Renter-occupied |
| Less than $300 | 778 (0.7%) | 1,487 (2.7%) |
| $300 to $499 | 2,048 (1.8%) | 1,755 (3.2%) |
| $500 to $799 | 8,322 (7.4%) | 2,579 (4.7%) |
| $800 to $999 | 9,329 (8.4%) | 4,708 (8.6%) |
| $1,000 to $1,499 | 20,179 (18.1%) | 18,452 (33.7%) |
| $1,500 to $1,999 | 20,021 (17.9%) | 16,144 (29.5%) |
| $2,000 to $2,499 | 19,635 (17.6%) | 5,947 (10.9%) |
| $2,500 to $2,999 | 14,082 (12.6%) | 1,358 (2.5%) |
| $3,000 or more | 17,267 (15.5%) | 961 (1.8%) |
| Total | 111,661 (100.0%) | 54,683 (100.0%) |
Physical Housing Characteristics in Hillsborough County
Housing Structures in Hillsborough County
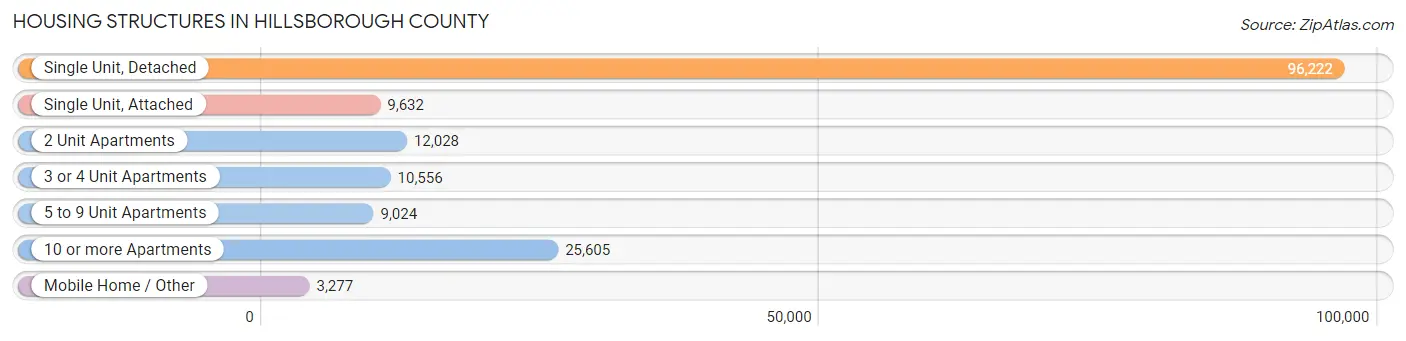
| Structure Type | # Housing Units | % Housing Units |
| Single Unit, Detached | 96,222 | 57.9% |
| Single Unit, Attached | 9,632 | 5.8% |
| 2 Unit Apartments | 12,028 | 7.2% |
| 3 or 4 Unit Apartments | 10,556 | 6.4% |
| 5 to 9 Unit Apartments | 9,024 | 5.4% |
| 10 or more Apartments | 25,605 | 15.4% |
| Mobile Home / Other | 3,277 | 2.0% |
| Total | 166,344 | 100.0% |
Housing Structures by Occupancy in Hillsborough County
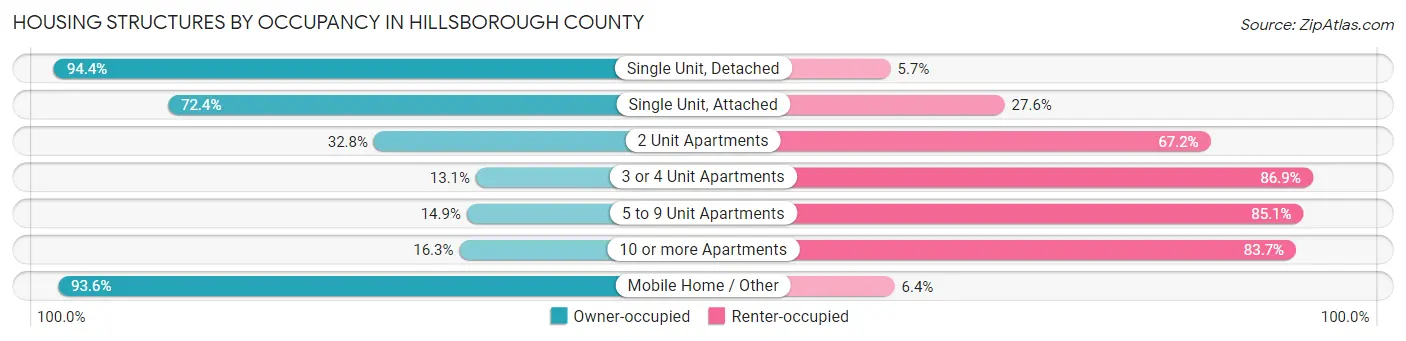
| Structure Type | Owner-occupied | Renter-occupied |
| Single Unit, Detached | 90,784 (94.4%) | 5,438 (5.7%) |
| Single Unit, Attached | 6,971 (72.4%) | 2,661 (27.6%) |
| 2 Unit Apartments | 3,940 (32.8%) | 8,088 (67.2%) |
| 3 or 4 Unit Apartments | 1,384 (13.1%) | 9,172 (86.9%) |
| 5 to 9 Unit Apartments | 1,342 (14.9%) | 7,682 (85.1%) |
| 10 or more Apartments | 4,174 (16.3%) | 21,431 (83.7%) |
| Mobile Home / Other | 3,066 (93.6%) | 211 (6.4%) |
| Total | 111,661 (67.1%) | 54,683 (32.9%) |
Housing Structures by Number of Rooms in Hillsborough County
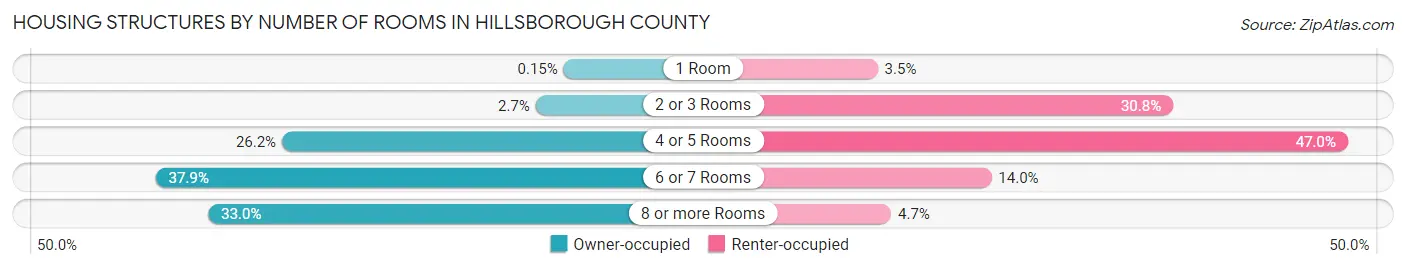
| Number of Rooms | Owner-occupied | Renter-occupied |
| 1 Room | 173 (0.2%) | 1,909 (3.5%) |
| 2 or 3 Rooms | 3,044 (2.7%) | 16,844 (30.8%) |
| 4 or 5 Rooms | 29,250 (26.2%) | 25,685 (47.0%) |
| 6 or 7 Rooms | 42,313 (37.9%) | 7,661 (14.0%) |
| 8 or more Rooms | 36,881 (33.0%) | 2,584 (4.7%) |
| Total | 111,661 (100.0%) | 54,683 (100.0%) |
Housing Structure by Heating Type in Hillsborough County
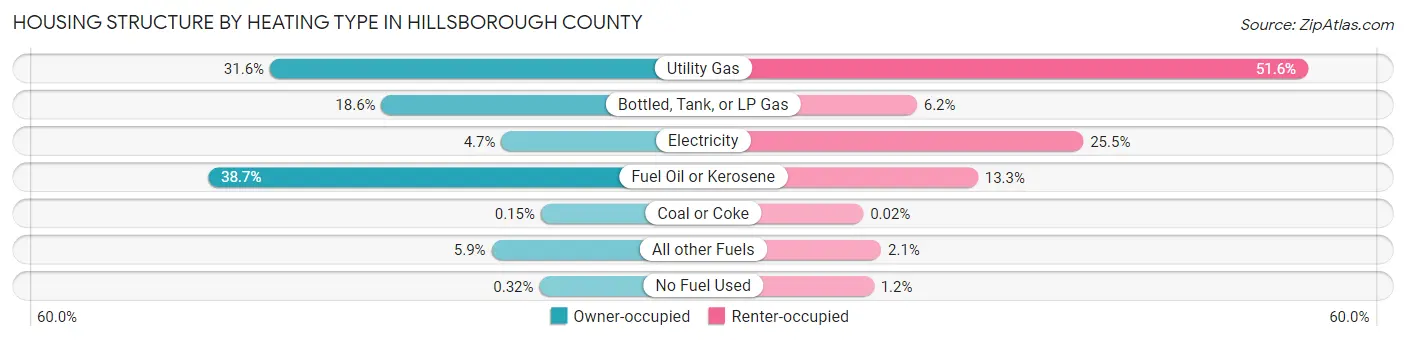
| Heating Type | Owner-occupied | Renter-occupied |
| Utility Gas | 35,243 (31.6%) | 28,208 (51.6%) |
| Bottled, Tank, or LP Gas | 20,806 (18.6%) | 3,408 (6.2%) |
| Electricity | 5,286 (4.7%) | 13,961 (25.5%) |
| Fuel Oil or Kerosene | 43,243 (38.7%) | 7,273 (13.3%) |
| Coal or Coke | 166 (0.2%) | 11 (0.0%) |
| All other Fuels | 6,556 (5.9%) | 1,143 (2.1%) |
| No Fuel Used | 361 (0.3%) | 679 (1.2%) |
| Total | 111,661 (100.0%) | 54,683 (100.0%) |
Household Vehicle Usage in Hillsborough County
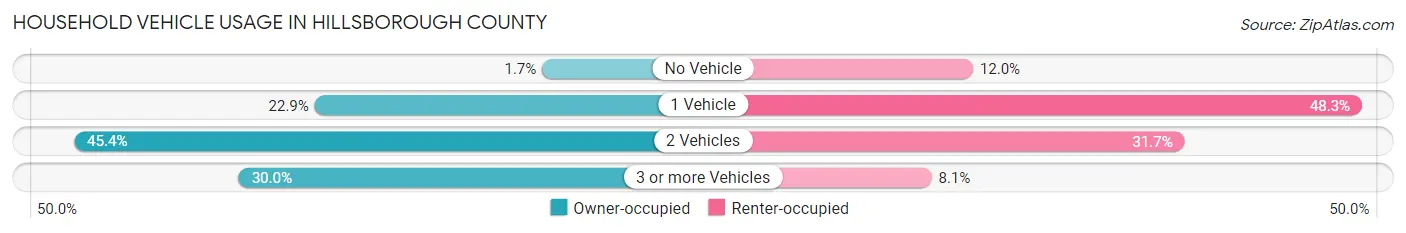
| Vehicles per Household | Owner-occupied | Renter-occupied |
| No Vehicle | 1,890 (1.7%) | 6,536 (11.9%) |
| 1 Vehicle | 25,601 (22.9%) | 26,390 (48.3%) |
| 2 Vehicles | 50,657 (45.4%) | 17,333 (31.7%) |
| 3 or more Vehicles | 33,513 (30.0%) | 4,424 (8.1%) |
| Total | 111,661 (100.0%) | 54,683 (100.0%) |
Real Estate & Mortgages in Hillsborough County
Real Estate and Mortgage Overview in Hillsborough County
| Characteristic | Without Mortgage | With Mortgage |
| Housing Units | 36,147 | 75,514 |
| Median Property Value | $339,600 | $363,000 |
| Median Household Income | $88,151 | $32,093 |
| Monthly Housing Costs | $984 | $17,188 |
| Real Estate Taxes | $6,499 | $504 |
Property Value by Mortgage Status in Hillsborough County
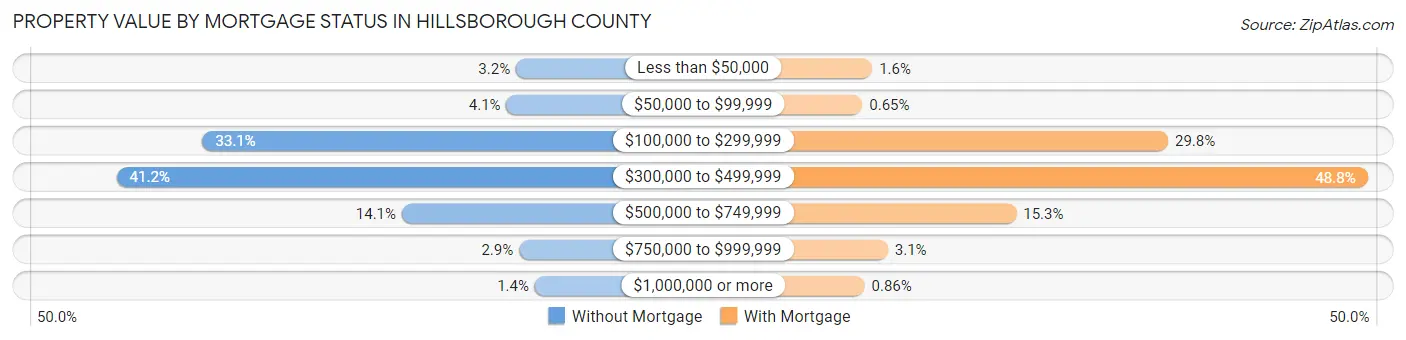
| Property Value | Without Mortgage | With Mortgage |
| Less than $50,000 | 1,158 (3.2%) | 1,198 (1.6%) |
| $50,000 to $99,999 | 1,487 (4.1%) | 489 (0.6%) |
| $100,000 to $299,999 | 11,949 (33.1%) | 22,476 (29.8%) |
| $300,000 to $499,999 | 14,905 (41.2%) | 36,811 (48.7%) |
| $500,000 to $749,999 | 5,085 (14.1%) | 11,563 (15.3%) |
| $750,000 to $999,999 | 1,053 (2.9%) | 2,324 (3.1%) |
| $1,000,000 or more | 510 (1.4%) | 653 (0.9%) |
| Total | 36,147 (100.0%) | 75,514 (100.0%) |
Household Income by Mortgage Status in Hillsborough County
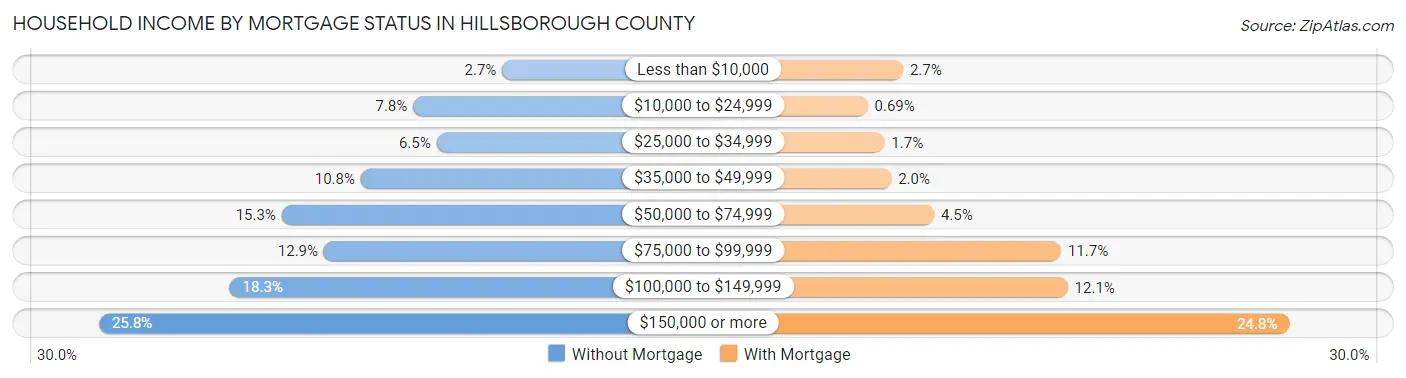
| Household Income | Without Mortgage | With Mortgage |
| Less than $10,000 | 980 (2.7%) | 2,048 (2.7%) |
| $10,000 to $24,999 | 2,818 (7.8%) | 521 (0.7%) |
| $25,000 to $34,999 | 2,335 (6.5%) | 1,243 (1.7%) |
| $35,000 to $49,999 | 3,901 (10.8%) | 1,540 (2.0%) |
| $50,000 to $74,999 | 5,534 (15.3%) | 3,383 (4.5%) |
| $75,000 to $99,999 | 4,663 (12.9%) | 8,867 (11.7%) |
| $100,000 to $149,999 | 6,607 (18.3%) | 9,156 (12.1%) |
| $150,000 or more | 9,309 (25.8%) | 18,711 (24.8%) |
| Total | 36,147 (100.0%) | 75,514 (100.0%) |
Property Value to Household Income Ratio in Hillsborough County
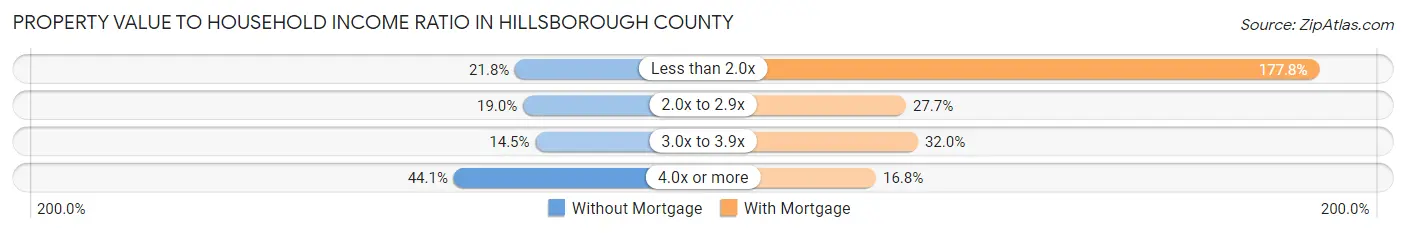
| Value-to-Income Ratio | Without Mortgage | With Mortgage |
| Less than 2.0x | 7,888 (21.8%) | 134,231 (177.8%) |
| 2.0x to 2.9x | 6,852 (19.0%) | 20,887 (27.7%) |
| 3.0x to 3.9x | 5,234 (14.5%) | 24,154 (32.0%) |
| 4.0x or more | 15,949 (44.1%) | 12,647 (16.8%) |
| Total | 36,147 (100.0%) | 75,514 (100.0%) |
Real Estate Taxes by Mortgage Status in Hillsborough County
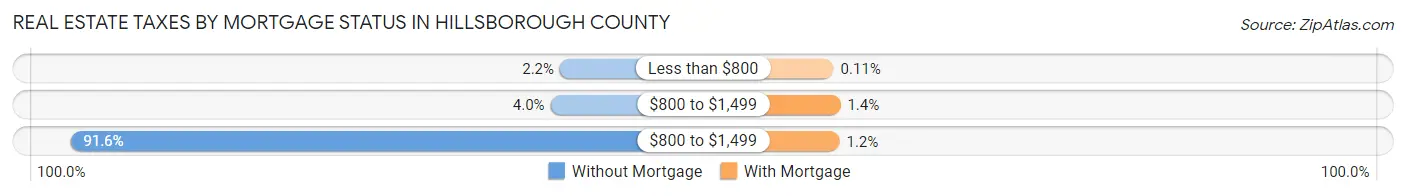
| Property Taxes | Without Mortgage | With Mortgage |
| Less than $800 | 808 (2.2%) | 80 (0.1%) |
| $800 to $1,499 | 1,430 (4.0%) | 1,026 (1.4%) |
| $800 to $1,499 | 33,125 (91.6%) | 899 (1.2%) |
| Total | 36,147 (100.0%) | 75,514 (100.0%) |
Health & Disability in Hillsborough County
Health Insurance Coverage by Age in Hillsborough County
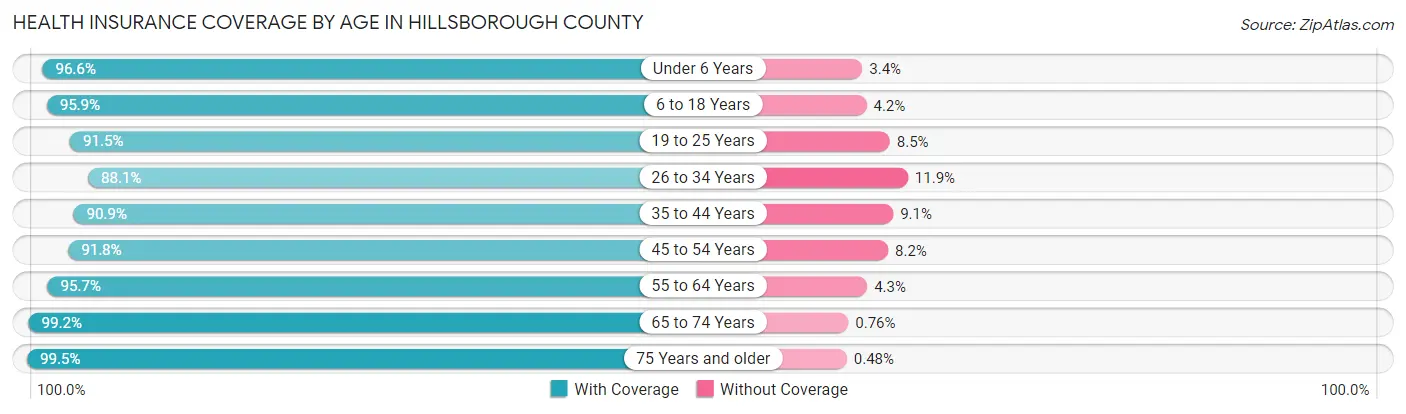
| Age Bracket | With Coverage | Without Coverage |
| Under 6 Years | 24,652 (96.6%) | 856 (3.4%) |
| 6 to 18 Years | 61,045 (95.9%) | 2,641 (4.2%) |
| 19 to 25 Years | 33,877 (91.5%) | 3,147 (8.5%) |
| 26 to 34 Years | 46,578 (88.1%) | 6,267 (11.9%) |
| 35 to 44 Years | 48,206 (90.9%) | 4,842 (9.1%) |
| 45 to 54 Years | 52,720 (91.8%) | 4,691 (8.2%) |
| 55 to 64 Years | 60,413 (95.7%) | 2,701 (4.3%) |
| 65 to 74 Years | 40,685 (99.2%) | 310 (0.8%) |
| 75 Years and older | 24,908 (99.5%) | 120 (0.5%) |
| Total | 393,084 (93.9%) | 25,575 (6.1%) |
Health Insurance Coverage by Citizenship Status in Hillsborough County
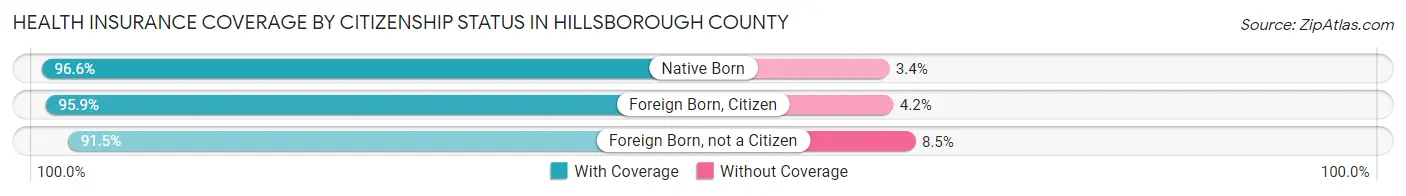
| Citizenship Status | With Coverage | Without Coverage |
| Native Born | 24,652 (96.6%) | 856 (3.4%) |
| Foreign Born, Citizen | 61,045 (95.9%) | 2,641 (4.2%) |
| Foreign Born, not a Citizen | 33,877 (91.5%) | 3,147 (8.5%) |
Health Insurance Coverage by Household Income in Hillsborough County
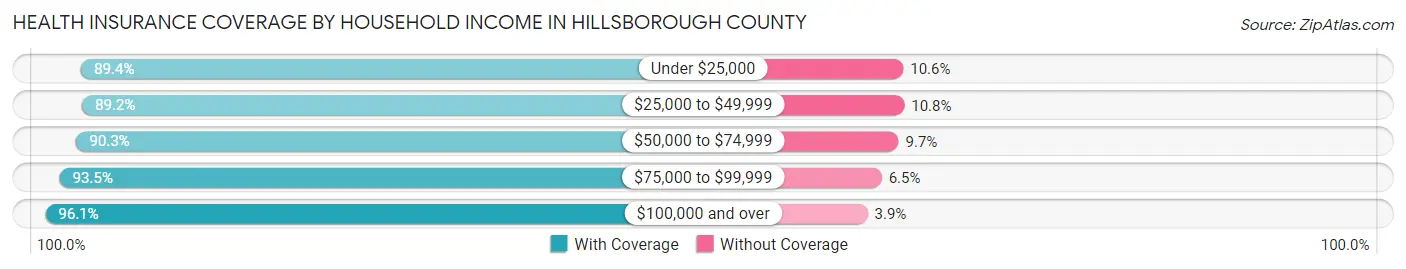
| Household Income | With Coverage | Without Coverage |
| Under $25,000 | 22,374 (89.4%) | 2,646 (10.6%) |
| $25,000 to $49,999 | 38,612 (89.2%) | 4,664 (10.8%) |
| $50,000 to $74,999 | 47,627 (90.3%) | 5,122 (9.7%) |
| $75,000 to $99,999 | 49,767 (93.5%) | 3,481 (6.5%) |
| $100,000 and over | 230,474 (96.1%) | 9,334 (3.9%) |
Public vs Private Health Insurance Coverage by Age in Hillsborough County
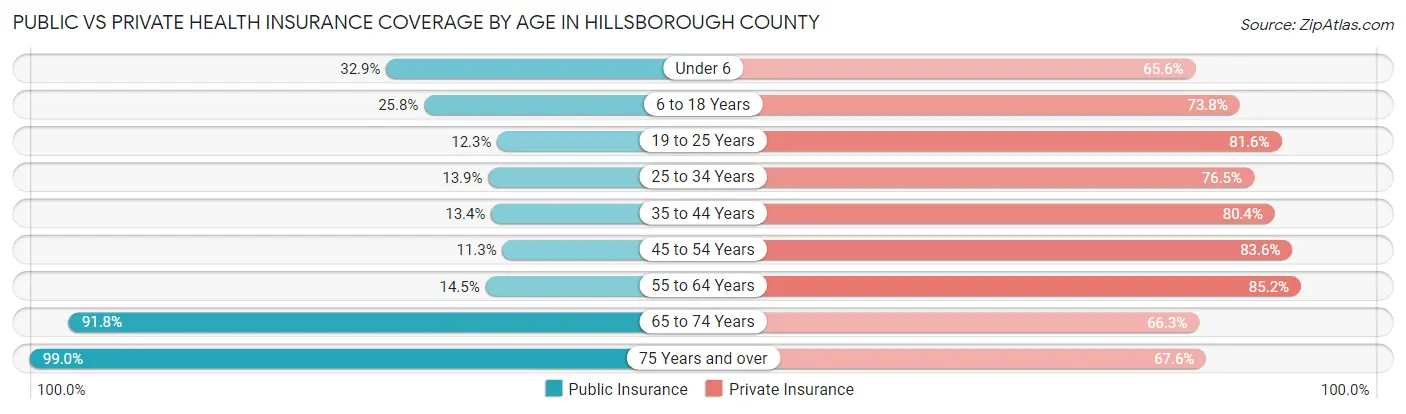
| Age Bracket | Public Insurance | Private Insurance |
| Under 6 | 8,384 (32.9%) | 16,740 (65.6%) |
| 6 to 18 Years | 16,452 (25.8%) | 47,010 (73.8%) |
| 19 to 25 Years | 4,540 (12.3%) | 30,205 (81.6%) |
| 25 to 34 Years | 7,363 (13.9%) | 40,414 (76.5%) |
| 35 to 44 Years | 7,096 (13.4%) | 42,633 (80.4%) |
| 45 to 54 Years | 6,482 (11.3%) | 47,995 (83.6%) |
| 55 to 64 Years | 9,117 (14.4%) | 53,781 (85.2%) |
| 65 to 74 Years | 37,627 (91.8%) | 27,191 (66.3%) |
| 75 Years and over | 24,783 (99.0%) | 16,927 (67.6%) |
| Total | 121,844 (29.1%) | 322,896 (77.1%) |
Disability Status by Sex by Age in Hillsborough County
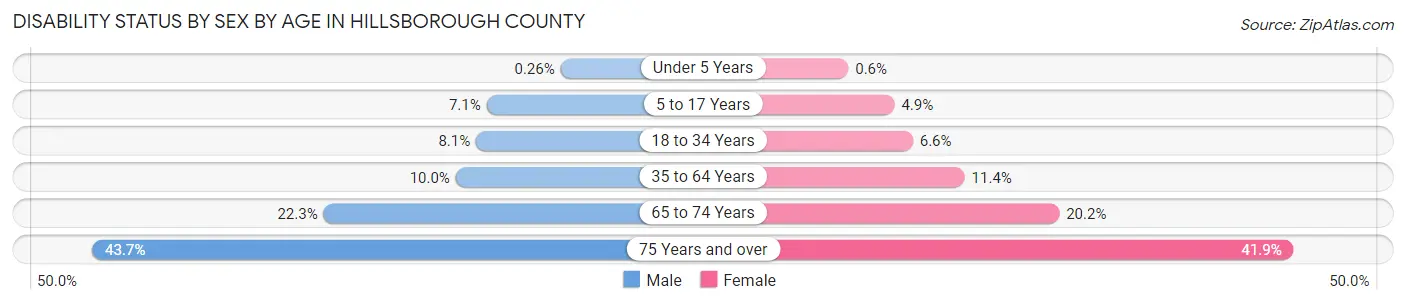
| Age Bracket | Male | Female |
| Under 5 Years | 28 (0.3%) | 63 (0.6%) |
| 5 to 17 Years | 2,298 (7.1%) | 1,498 (4.9%) |
| 18 to 34 Years | 3,986 (8.1%) | 3,010 (6.6%) |
| 35 to 64 Years | 8,782 (10.0%) | 9,773 (11.4%) |
| 65 to 74 Years | 4,461 (22.3%) | 4,229 (20.2%) |
| 75 Years and over | 4,563 (43.7%) | 6,119 (41.9%) |
Disability Class by Sex by Age in Hillsborough County
Disability Class: Hearing Difficulty
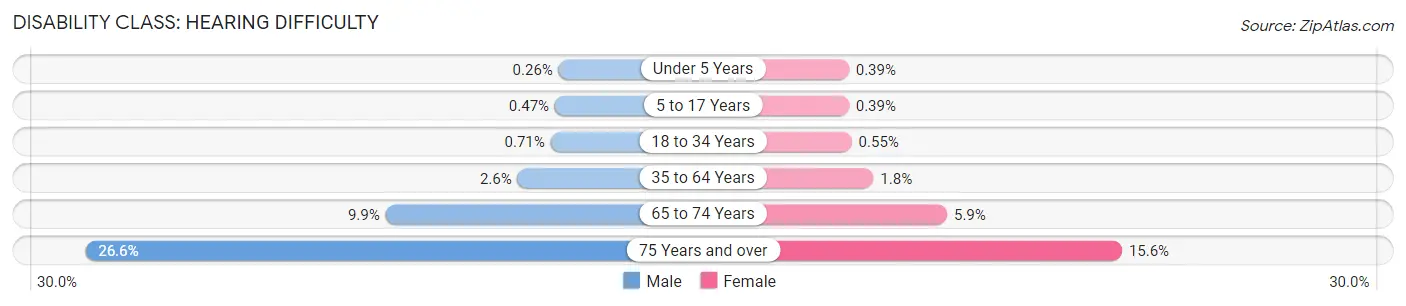
| Age Bracket | Male | Female |
| Under 5 Years | 28 (0.3%) | 41 (0.4%) |
| 5 to 17 Years | 152 (0.5%) | 120 (0.4%) |
| 18 to 34 Years | 348 (0.7%) | 249 (0.5%) |
| 35 to 64 Years | 2,243 (2.5%) | 1,504 (1.8%) |
| 65 to 74 Years | 1,984 (9.9%) | 1,228 (5.9%) |
| 75 Years and over | 2,777 (26.6%) | 2,277 (15.6%) |
Disability Class: Vision Difficulty
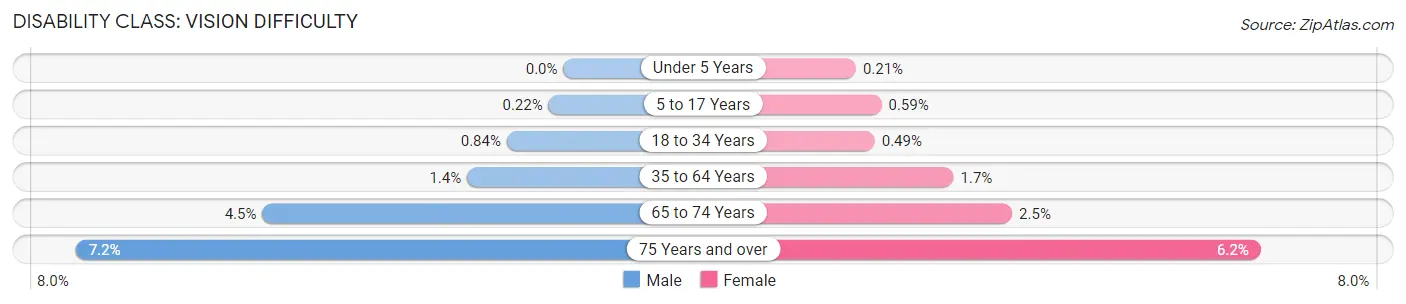
| Age Bracket | Male | Female |
| Under 5 Years | 0 (0.0%) | 22 (0.2%) |
| 5 to 17 Years | 71 (0.2%) | 181 (0.6%) |
| 18 to 34 Years | 411 (0.8%) | 222 (0.5%) |
| 35 to 64 Years | 1,261 (1.4%) | 1,421 (1.7%) |
| 65 to 74 Years | 896 (4.5%) | 530 (2.5%) |
| 75 Years and over | 755 (7.2%) | 908 (6.2%) |
Disability Class: Cognitive Difficulty
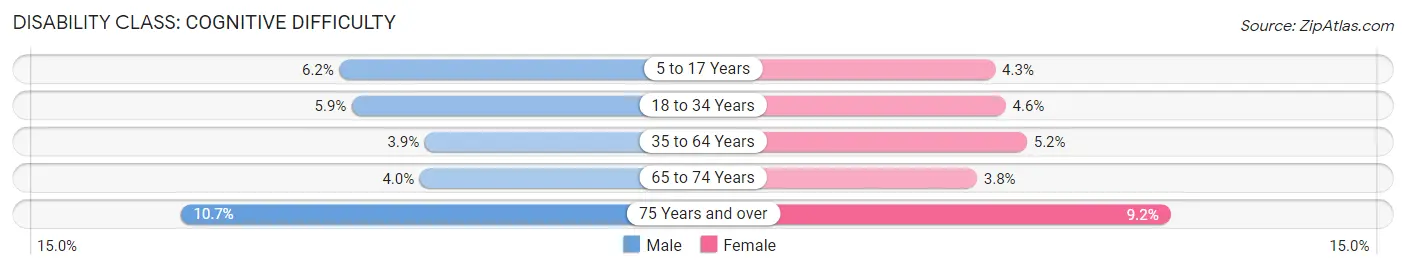
| Age Bracket | Male | Female |
| 5 to 17 Years | 2,010 (6.2%) | 1,307 (4.3%) |
| 18 to 34 Years | 2,895 (5.9%) | 2,083 (4.6%) |
| 35 to 64 Years | 3,380 (3.8%) | 4,413 (5.1%) |
| 65 to 74 Years | 800 (4.0%) | 789 (3.8%) |
| 75 Years and over | 1,112 (10.7%) | 1,335 (9.1%) |
Disability Class: Ambulatory Difficulty
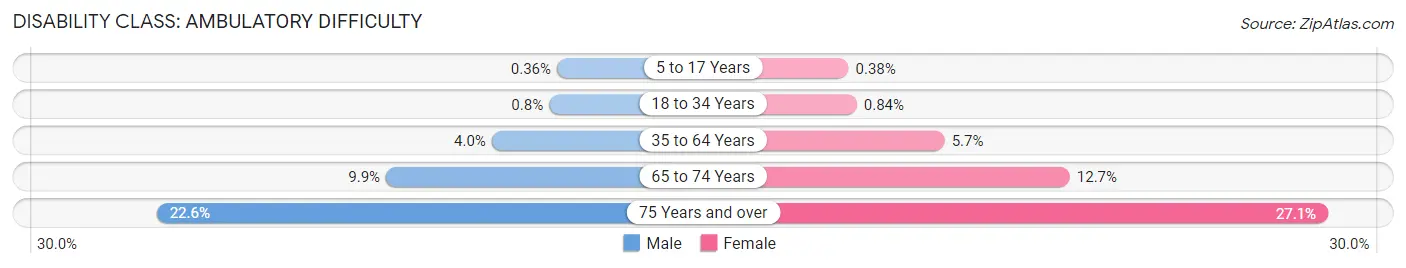
| Age Bracket | Male | Female |
| 5 to 17 Years | 117 (0.4%) | 116 (0.4%) |
| 18 to 34 Years | 395 (0.8%) | 382 (0.8%) |
| 35 to 64 Years | 3,510 (4.0%) | 4,911 (5.7%) |
| 65 to 74 Years | 1,980 (9.9%) | 2,661 (12.7%) |
| 75 Years and over | 2,362 (22.6%) | 3,951 (27.1%) |
Disability Class: Self-Care Difficulty
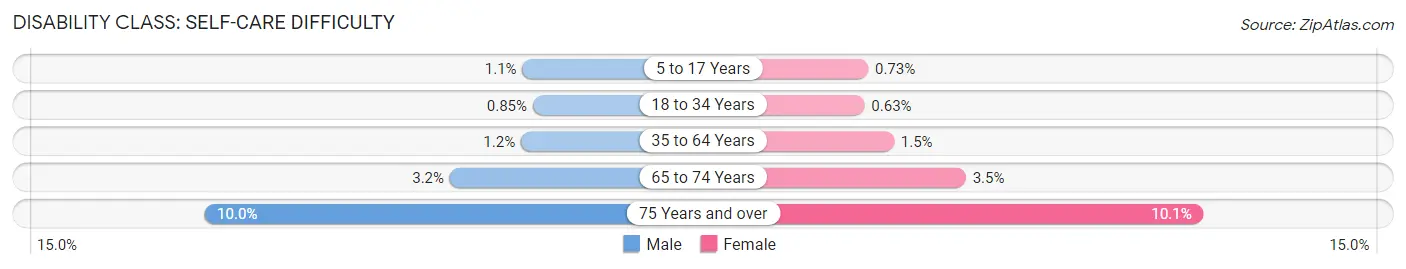
| Age Bracket | Male | Female |
| 5 to 17 Years | 366 (1.1%) | 222 (0.7%) |
| 18 to 34 Years | 416 (0.9%) | 289 (0.6%) |
| 35 to 64 Years | 1,033 (1.2%) | 1,243 (1.5%) |
| 65 to 74 Years | 633 (3.2%) | 724 (3.5%) |
| 75 Years and over | 1,043 (10.0%) | 1,470 (10.1%) |
Technology Access in Hillsborough County
Computing Device Access in Hillsborough County
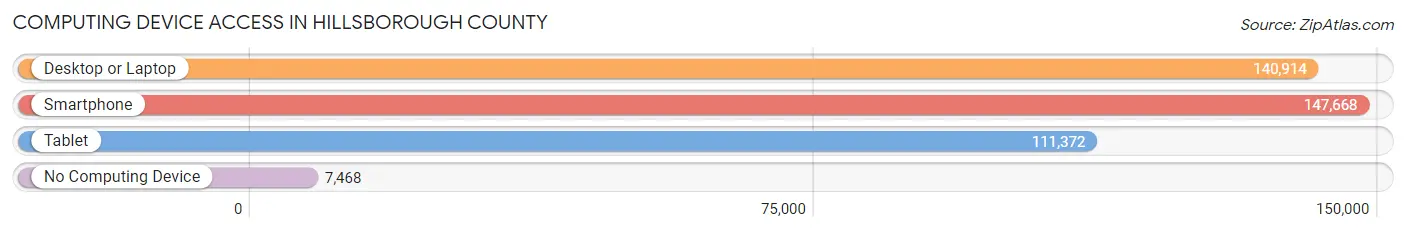
| Device Type | # Households | % Households |
| Desktop or Laptop | 140,914 | 84.7% |
| Smartphone | 147,668 | 88.8% |
| Tablet | 111,372 | 66.9% |
| No Computing Device | 7,468 | 4.5% |
| Total | 166,344 | 100.0% |
Internet Access in Hillsborough County
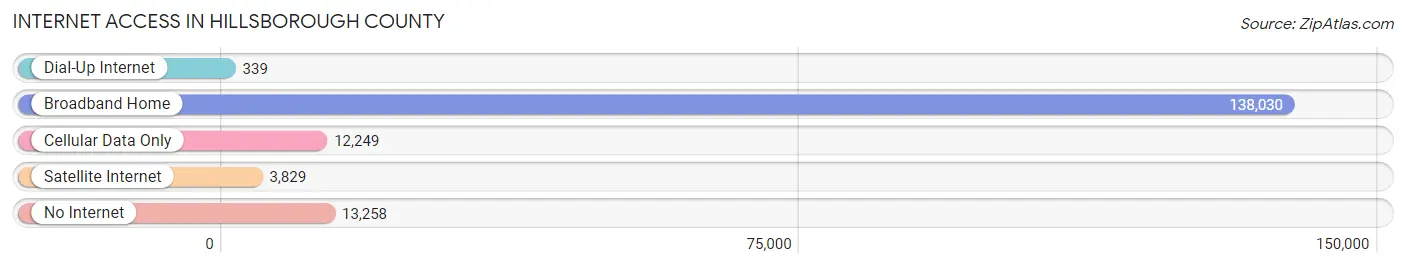
| Internet Type | # Households | % Households |
| Dial-Up Internet | 339 | 0.2% |
| Broadband Home | 138,030 | 83.0% |
| Cellular Data Only | 12,249 | 7.4% |
| Satellite Internet | 3,829 | 2.3% |
| No Internet | 13,258 | 8.0% |
| Total | 166,344 | 100.0% |
Hillsborough County Summary
Hillsborough County is located in the southern part of New Hampshire, and is the most populous county in the state. It is bordered by Merrimack County to the north, Cheshire County to the west, and Rockingham County to the east. The county seat is Manchester, the largest city in the state.
History
Hillsborough County was created in 1771, and was named after Wills Hill, the Earl of Hillsborough, who was the British Secretary of State for the Colonies at the time. The county was originally part of the Province of New Hampshire, and was one of the original five counties in the state.
The county was home to many Native American tribes, including the Abenaki, Pennacook, and Sokoki. The first European settlers arrived in the area in the 1620s, and the county was officially established in 1771.
During the American Revolution, Hillsborough County was a major center of activity. The Battle of Bunker Hill was fought in the county in 1775, and the Battle of Bennington was fought in the county in 1777.
Geography
Hillsborough County covers an area of 883 square miles, making it the largest county in New Hampshire. The county is located in the southern part of the state, and is bordered by Merrimack County to the north, Cheshire County to the west, and Rockingham County to the east.
The county is mostly rural, with rolling hills and forests. The highest point in the county is Pack Monadnock Mountain, which has an elevation of 2,290 feet. The county is home to several rivers, including the Contoocook, Merrimack, and Piscataquog.
Economy
Hillsborough County has a diverse economy, with a mix of manufacturing, technology, and service industries. The county is home to several large companies, including BAE Systems, Fidelity Investments, and St. Mary's Bank.
The county is also home to several universities and colleges, including the University of New Hampshire, Southern New Hampshire University, and Manchester Community College.
Demographics
As of the 2010 census, Hillsborough County had a population of 400,721. The population is mostly white (90.2%), with small percentages of African Americans (2.3%), Asians (2.2%), and Hispanics (2.1%). The median household income is $63,945, and the median home value is $232,400.
Conclusion
Hillsborough County is the most populous county in New Hampshire, and is home to a diverse economy and population. The county has a rich history, and is home to several large companies, universities, and colleges. The county is mostly rural, with rolling hills and forests, and is home to several rivers. The population is mostly white, with small percentages of African Americans, Asians, and Hispanics. The median household income is $63,945, and the median home value is $232,400.
Common Questions
What is Per Capita Income in Hillsborough County?
Per Capita income in Hillsborough County is $49,675.
What is the Median Family Income in Hillsborough County?
Median Family Income in Hillsborough County is $118,936.
What is the Median Household income in Hillsborough County?
Median Household Income in Hillsborough County is $95,112.
What is Income or Wage Gap in Hillsborough County?
Income or Wage Gap in Hillsborough County is 30.1%.
Women in Hillsborough County earn 69.9 cents for every dollar earned by a man.
What is Family Income Deficit in Hillsborough County?
Family Income Deficit in Hillsborough County is $10,674.
Families that are below poverty line in Hillsborough County earn $10,674 less on average than the poverty threshold level.
What is Inequality or Gini Index in Hillsborough County?
Inequality or Gini Index in Hillsborough County is 0.43.
What is the Total Population of Hillsborough County?
Total Population of Hillsborough County is 422,733.
What is the Total Male Population of Hillsborough County?
Total Male Population of Hillsborough County is 212,276.
What is the Total Female Population of Hillsborough County?
Total Female Population of Hillsborough County is 210,457.
What is the Ratio of Males per 100 Females in Hillsborough County?
There are 100.86 Males per 100 Females in Hillsborough County.
What is the Ratio of Females per 100 Males in Hillsborough County?
There are 99.14 Females per 100 Males in Hillsborough County.
What is the Median Population Age in Hillsborough County?
Median Population Age in Hillsborough County is 40.9 Years.
What is the Average Family Size in Hillsborough County
Average Family Size in Hillsborough County is 3.0 People.
What is the Average Household Size in Hillsborough County
Average Household Size in Hillsborough County is 2.5 People.
How Large is the Labor Force in Hillsborough County?
There are 245,928 People in the Labor Forcein in Hillsborough County.
What is the Percentage of People in the Labor Force in Hillsborough County?
70.5% of People are in the Labor Force in Hillsborough County.
What is the Unemployment Rate in Hillsborough County?
Unemployment Rate in Hillsborough County is 3.7%.