Sullivan County, NH Map & Demographics
Sullivan County Map
Sullivan County Overview
$39,087
PER CAPITA INCOME
$91,299
AVG FAMILY INCOME
$70,788
AVG HOUSEHOLD INCOME
14.2%
WAGE / INCOME GAP [ % ]
85.8¢/ $1
WAGE / INCOME GAP [ $ ]
$12,554
FAMILY INCOME DEFICIT
0.49
INEQUALITY / GINI INDEX
43,356
TOTAL POPULATION
21,845
MALE POPULATION
21,511
FEMALE POPULATION
101.55
MALES / 100 FEMALES
98.47
FEMALES / 100 MALES
47.0
MEDIAN AGE
3.3
AVG FAMILY SIZE
2.7
AVG HOUSEHOLD SIZE
20,829
LABOR FORCE [ PEOPLE ]
56.5%
PERCENT IN LABOR FORCE
2.9%
UNEMPLOYMENT RATE
Sullivan County Area Codes
Income in Sullivan County
Income Overview in Sullivan County
Per Capita Income in Sullivan County is $39,087, while median incomes of families and households are $91,299 and $70,788 respectively.
| Characteristic | Number | Measure |
| Per Capita Income | 43,356 | $39,087 |
| Median Family Income | 9,966 | $91,299 |
| Mean Family Income | 9,966 | $109,282 |
| Median Household Income | 15,893 | $70,788 |
| Mean Household Income | 15,893 | $96,859 |
| Income Deficit | 9,966 | $12,554 |
| Wage / Income Gap (%) | 43,356 | 14.16% |
| Wage / Income Gap ($) | 43,356 | 85.84¢ per $1 |
| Gini / Inequality Index | 43,356 | 0.49 |
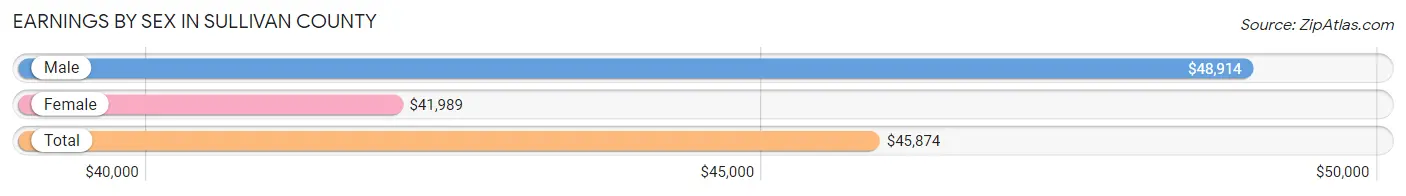
Earnings by Sex in Sullivan County
Average Earnings in Sullivan County are $45,874, $48,914 for men and $41,989 for women, a difference of 14.2%.
| Sex | Number | Average Earnings |
| Male | 11,605 (52.8%) | $48,914 |
| Female | 10,369 (47.2%) | $41,989 |
| Total | 21,974 (100.0%) | $45,874 |
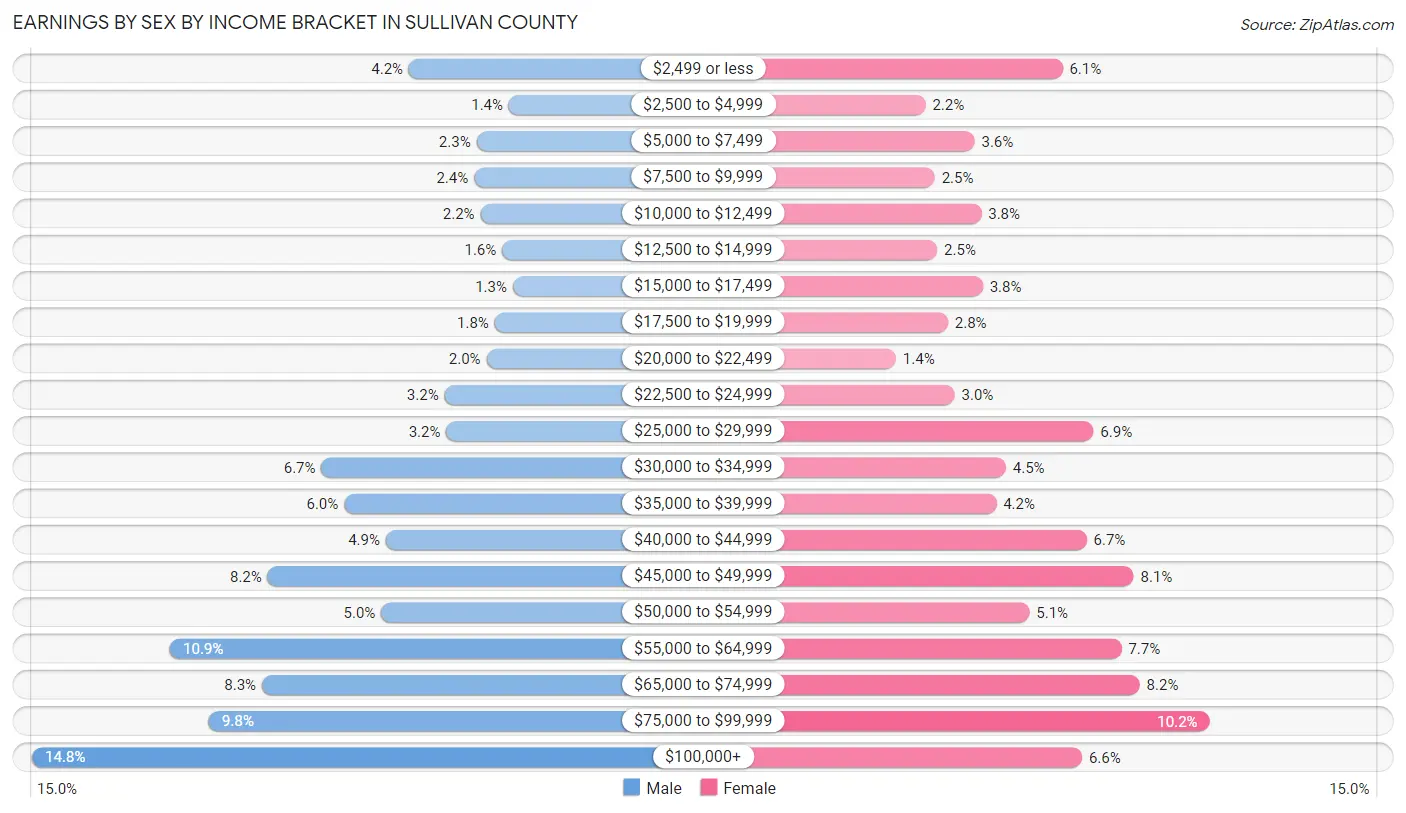
Earnings by Sex by Income Bracket in Sullivan County
The most common earnings brackets in Sullivan County are $100,000+ for men (1,716 | 14.8%) and $75,000 to $99,999 for women (1,057 | 10.2%).
| Income | Male | Female |
| $2,499 or less | 487 (4.2%) | 628 (6.1%) |
| $2,500 to $4,999 | 161 (1.4%) | 229 (2.2%) |
| $5,000 to $7,499 | 267 (2.3%) | 372 (3.6%) |
| $7,500 to $9,999 | 275 (2.4%) | 256 (2.5%) |
| $10,000 to $12,499 | 254 (2.2%) | 392 (3.8%) |
| $12,500 to $14,999 | 183 (1.6%) | 263 (2.5%) |
| $15,000 to $17,499 | 149 (1.3%) | 396 (3.8%) |
| $17,500 to $19,999 | 208 (1.8%) | 294 (2.8%) |
| $20,000 to $22,499 | 235 (2.0%) | 143 (1.4%) |
| $22,500 to $24,999 | 371 (3.2%) | 314 (3.0%) |
| $25,000 to $29,999 | 365 (3.2%) | 719 (6.9%) |
| $30,000 to $34,999 | 773 (6.7%) | 464 (4.5%) |
| $35,000 to $39,999 | 699 (6.0%) | 436 (4.2%) |
| $40,000 to $44,999 | 563 (4.9%) | 699 (6.7%) |
| $45,000 to $49,999 | 948 (8.2%) | 836 (8.1%) |
| $50,000 to $54,999 | 578 (5.0%) | 532 (5.1%) |
| $55,000 to $64,999 | 1,266 (10.9%) | 801 (7.7%) |
| $65,000 to $74,999 | 967 (8.3%) | 853 (8.2%) |
| $75,000 to $99,999 | 1,140 (9.8%) | 1,057 (10.2%) |
| $100,000+ | 1,716 (14.8%) | 685 (6.6%) |
| Total | 11,605 (100.0%) | 10,369 (100.0%) |
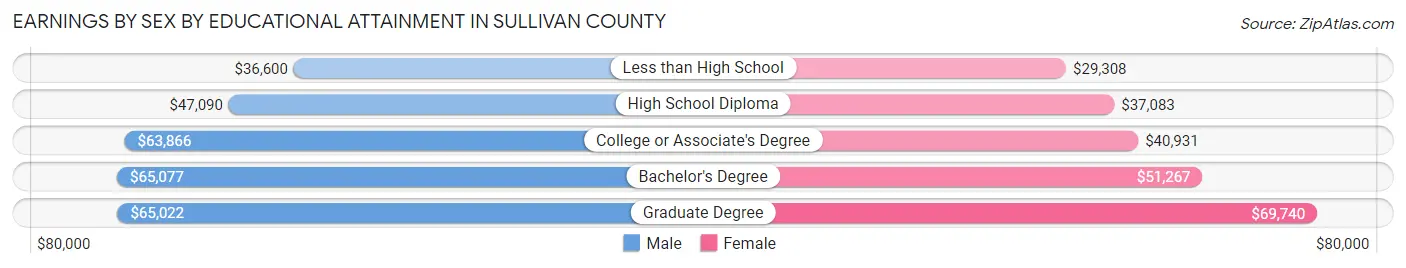
Earnings by Sex by Educational Attainment in Sullivan County
Average earnings in Sullivan County are $54,165 for men and $45,470 for women, a difference of 16.1%. Men with an educational attainment of bachelor's degree enjoy the highest average annual earnings of $65,077, while those with less than high school education earn the least with $36,600. Women with an educational attainment of graduate degree earn the most with the average annual earnings of $69,740, while those with less than high school education have the smallest earnings of $29,308.
| Educational Attainment | Male Income | Female Income |
| Less than High School | $36,600 | $29,308 |
| High School Diploma | $47,090 | $37,083 |
| College or Associate's Degree | $63,866 | $40,931 |
| Bachelor's Degree | $65,077 | $51,267 |
| Graduate Degree | $65,022 | $69,740 |
| Total | $54,165 | $45,470 |
Family Income in Sullivan County
Family Income Brackets in Sullivan County
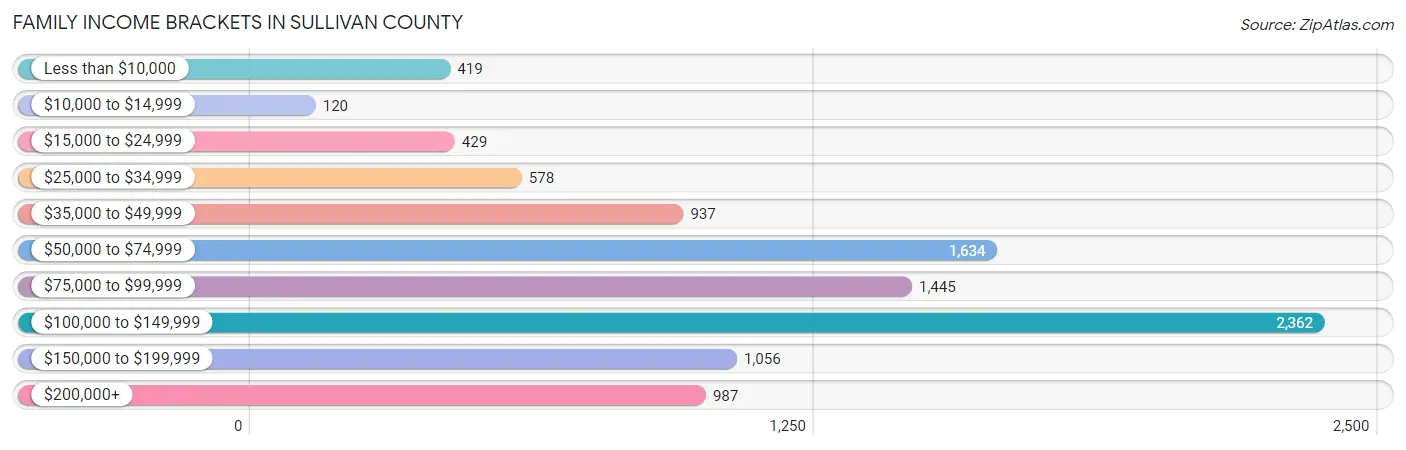
According to the Sullivan County family income data, there are 2,362 families falling into the $100,000 to $149,999 income range, which is the most common income bracket and makes up 23.7% of all families. Conversely, the $10,000 to $14,999 income bracket is the least frequent group with only 120 families (1.2%) belonging to this category.
| Income Bracket | # Families | % Families |
| Less than $10,000 | 419 | 4.2% |
| $10,000 to $14,999 | 120 | 1.2% |
| $15,000 to $24,999 | 429 | 4.3% |
| $25,000 to $34,999 | 578 | 5.8% |
| $35,000 to $49,999 | 937 | 9.4% |
| $50,000 to $74,999 | 1,634 | 16.4% |
| $75,000 to $99,999 | 1,445 | 14.5% |
| $100,000 to $149,999 | 2,362 | 23.7% |
| $150,000 to $199,999 | 1,056 | 10.6% |
| $200,000+ | 987 | 9.9% |
Family Income by Famaliy Size in Sullivan County
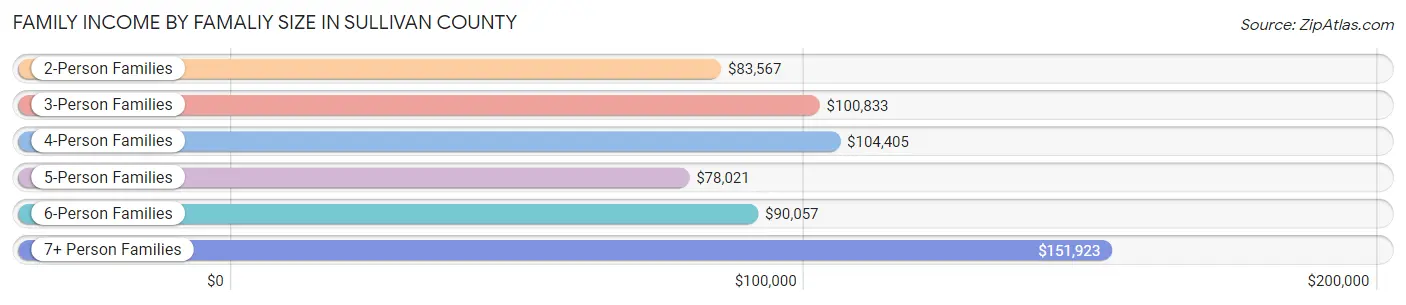
7+ person families (52 | 0.5%) account for the highest median family income in Sullivan County with $151,923 per family, while 2-person families (6,018 | 60.4%) have the highest median income of $41,784 per family member.
| Income Bracket | # Families | Median Income |
| 2-Person Families | 6,018 (60.4%) | $83,567 |
| 3-Person Families | 1,792 (18.0%) | $100,833 |
| 4-Person Families | 1,500 (15.0%) | $104,405 |
| 5-Person Families | 491 (4.9%) | $78,021 |
| 6-Person Families | 113 (1.1%) | $90,057 |
| 7+ Person Families | 52 (0.5%) | $151,923 |
| Total | 9,966 (100.0%) | $91,299 |
Family Income by Number of Earners in Sullivan County
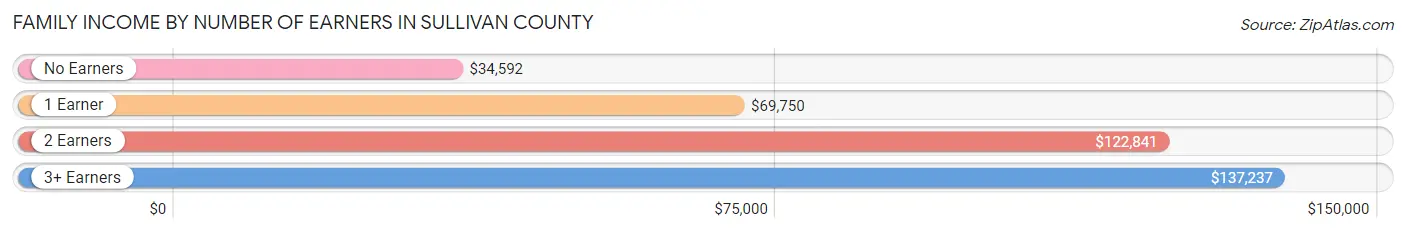
The median family income in Sullivan County is $91,299, with families comprising 3+ earners (866) having the highest median family income of $137,237, while families with no earners (2,061) have the lowest median family income of $34,592, accounting for 8.7% and 20.7% of families, respectively.
| Number of Earners | # Families | Median Income |
| No Earners | 2,061 (20.7%) | $34,592 |
| 1 Earner | 3,189 (32.0%) | $69,750 |
| 2 Earners | 3,850 (38.6%) | $122,841 |
| 3+ Earners | 866 (8.7%) | $137,237 |
| Total | 9,966 (100.0%) | $91,299 |
Household Income in Sullivan County
Household Income Brackets in Sullivan County
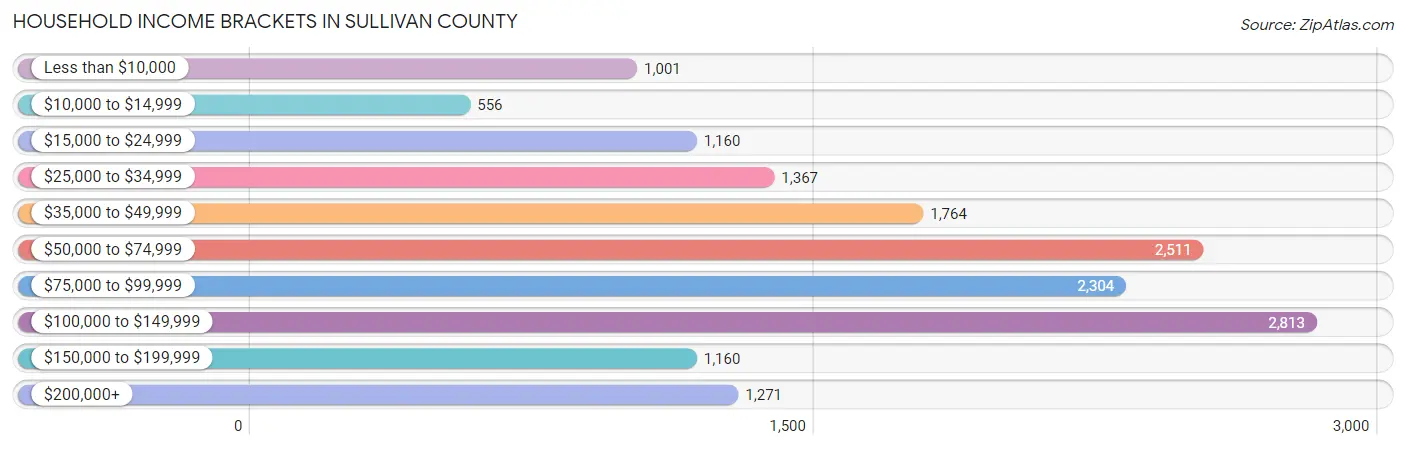
With 2,813 households falling in the category, the $100,000 to $149,999 income range is the most frequent in Sullivan County, accounting for 17.7% of all households. In contrast, only 556 households (3.5%) fall into the $10,000 to $14,999 income bracket, making it the least populous group.
| Income Bracket | # Households | % Households |
| Less than $10,000 | 1,001 | 6.3% |
| $10,000 to $14,999 | 556 | 3.5% |
| $15,000 to $24,999 | 1,160 | 7.3% |
| $25,000 to $34,999 | 1,367 | 8.6% |
| $35,000 to $49,999 | 1,764 | 11.1% |
| $50,000 to $74,999 | 2,511 | 15.8% |
| $75,000 to $99,999 | 2,304 | 14.5% |
| $100,000 to $149,999 | 2,813 | 17.7% |
| $150,000 to $199,999 | 1,160 | 7.3% |
| $200,000+ | 1,271 | 8.0% |
Household Income by Householder Age in Sullivan County
The median household income in Sullivan County is $70,788, with the highest median household income of $86,873 found in the 45 to 64 years age bracket for the primary householder. A total of 5,949 households (37.4%) fall into this category. Meanwhile, the 65+ years age bracket for the primary householder has the lowest median household income of $47,734, with 5,326 households (33.5%) in this group.
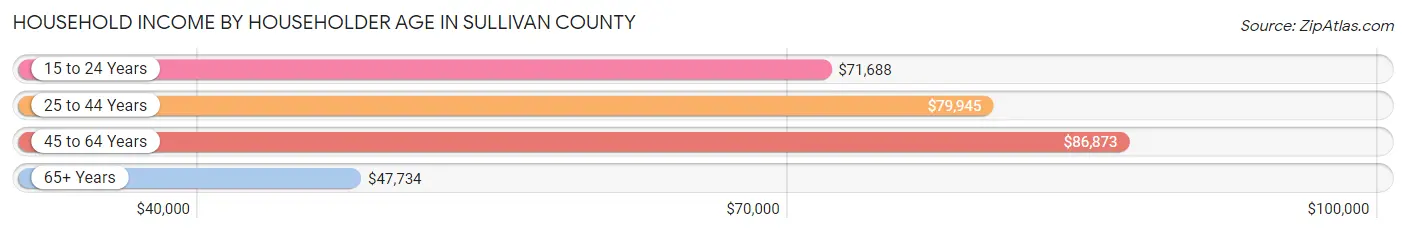
| Income Bracket | # Households | Median Income |
| 15 to 24 Years | 293 (1.8%) | $71,688 |
| 25 to 44 Years | 4,325 (27.2%) | $79,945 |
| 45 to 64 Years | 5,949 (37.4%) | $86,873 |
| 65+ Years | 5,326 (33.5%) | $47,734 |
| Total | 15,893 (100.0%) | $70,788 |
Poverty in Sullivan County
Income Below Poverty by Sex and Age in Sullivan County
With 11.9% poverty level for males and 11.5% for females among the residents of Sullivan County, under 5 year old males and 6 to 11 year old females are the most vulnerable to poverty, with 260 males (29.9%) and 216 females (20.3%) in their respective age groups living below the poverty level.
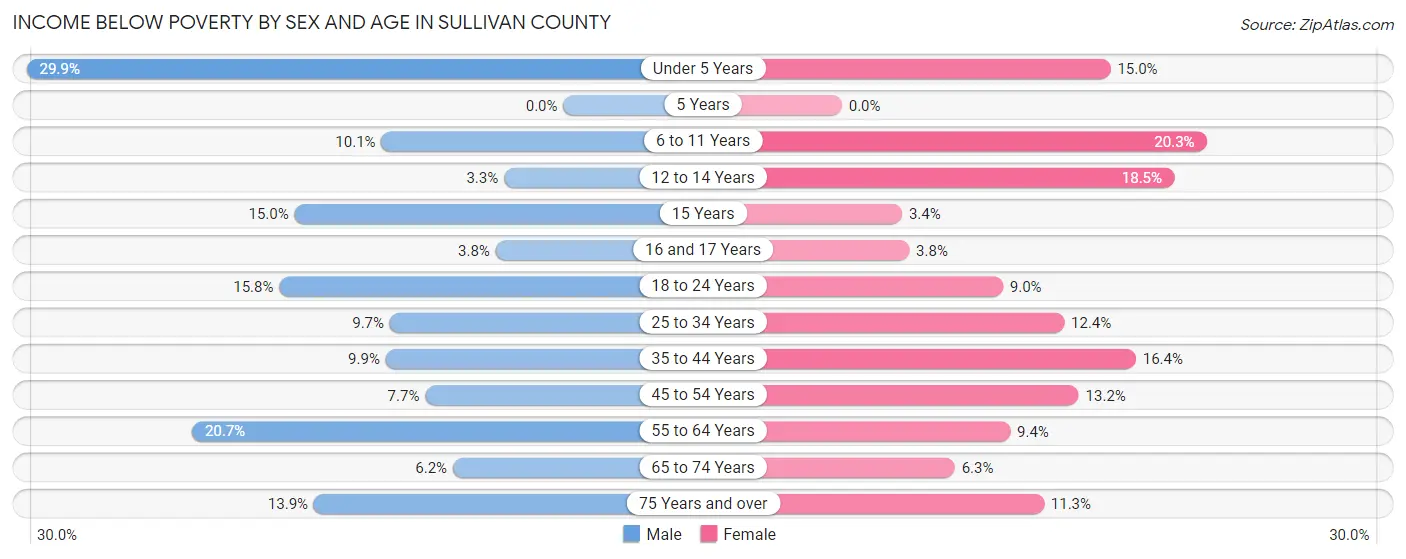
| Age Bracket | Male | Female |
| Under 5 Years | 260 (29.9%) | 148 (15.0%) |
| 5 Years | 0 (0.0%) | 0 (0.0%) |
| 6 to 11 Years | 138 (10.1%) | 216 (20.3%) |
| 12 to 14 Years | 18 (3.3%) | 120 (18.5%) |
| 15 Years | 22 (15.0%) | 6 (3.4%) |
| 16 and 17 Years | 25 (3.8%) | 20 (3.7%) |
| 18 to 24 Years | 259 (15.8%) | 112 (9.0%) |
| 25 to 34 Years | 271 (9.7%) | 294 (12.4%) |
| 35 to 44 Years | 231 (9.9%) | 387 (16.4%) |
| 45 to 54 Years | 224 (7.7%) | 366 (13.2%) |
| 55 to 64 Years | 716 (20.7%) | 341 (9.4%) |
| 65 to 74 Years | 185 (6.1%) | 191 (6.3%) |
| 75 Years and over | 218 (13.9%) | 222 (11.3%) |
| Total | 2,567 (11.9%) | 2,423 (11.5%) |
Income Above Poverty by Sex and Age in Sullivan County
According to the poverty statistics in Sullivan County, males aged 5 years and females aged 5 years are the age groups that are most secure financially, with 100.0% of males and 100.0% of females in these age groups living above the poverty line.
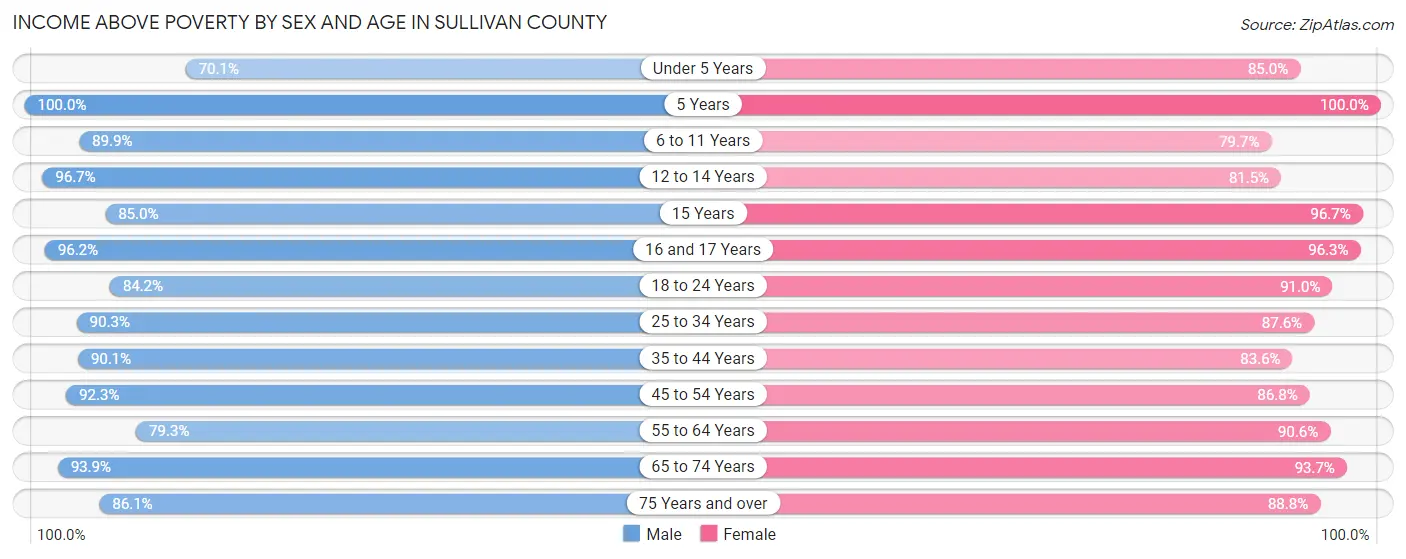
| Age Bracket | Male | Female |
| Under 5 Years | 610 (70.1%) | 841 (85.0%) |
| 5 Years | 236 (100.0%) | 269 (100.0%) |
| 6 to 11 Years | 1,224 (89.9%) | 848 (79.7%) |
| 12 to 14 Years | 528 (96.7%) | 529 (81.5%) |
| 15 Years | 125 (85.0%) | 173 (96.7%) |
| 16 and 17 Years | 638 (96.2%) | 513 (96.3%) |
| 18 to 24 Years | 1,378 (84.2%) | 1,137 (91.0%) |
| 25 to 34 Years | 2,534 (90.3%) | 2,081 (87.6%) |
| 35 to 44 Years | 2,105 (90.1%) | 1,977 (83.6%) |
| 45 to 54 Years | 2,689 (92.3%) | 2,409 (86.8%) |
| 55 to 64 Years | 2,747 (79.3%) | 3,299 (90.6%) |
| 65 to 74 Years | 2,824 (93.9%) | 2,845 (93.7%) |
| 75 Years and over | 1,351 (86.1%) | 1,752 (88.7%) |
| Total | 18,989 (88.1%) | 18,673 (88.5%) |
Income Below Poverty Among Married-Couple Families in Sullivan County
The poverty statistics for married-couple families in Sullivan County show that 4.4% or 346 of the total 7,826 families live below the poverty line. Families with 5 or more children have the highest poverty rate of 43.8%, comprising of 7 families. On the other hand, families with 3 or 4 children have the lowest poverty rate of 0.0%, which includes 0 families.
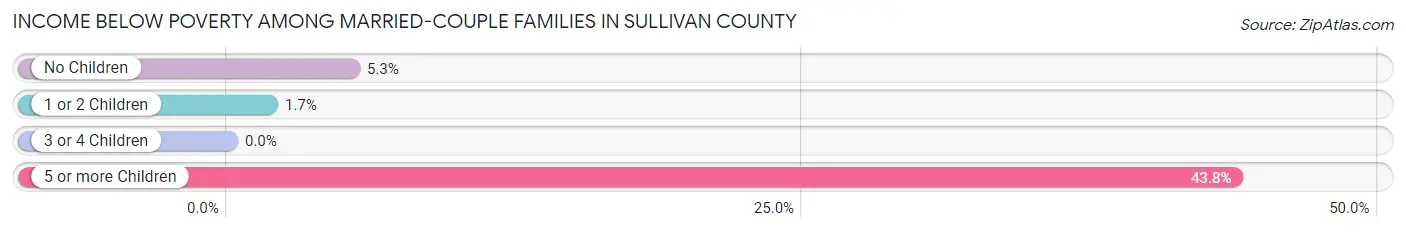
| Children | Above Poverty | Below Poverty |
| No Children | 5,492 (94.7%) | 308 (5.3%) |
| 1 or 2 Children | 1,748 (98.3%) | 31 (1.7%) |
| 3 or 4 Children | 231 (100.0%) | 0 (0.0%) |
| 5 or more Children | 9 (56.2%) | 7 (43.8%) |
| Total | 7,480 (95.6%) | 346 (4.4%) |
Income Below Poverty Among Single-Parent Households in Sullivan County
According to the poverty data in Sullivan County, 9.1% or 63 single-father households and 25.8% or 373 single-mother households are living below the poverty line. Among single-father households, those with 3 or 4 children have the highest poverty rate, with 19 households (24.7%) experiencing poverty. Likewise, among single-mother households, those with 5 or more children have the highest poverty rate, with 5 households (100.0%) falling below the poverty line.
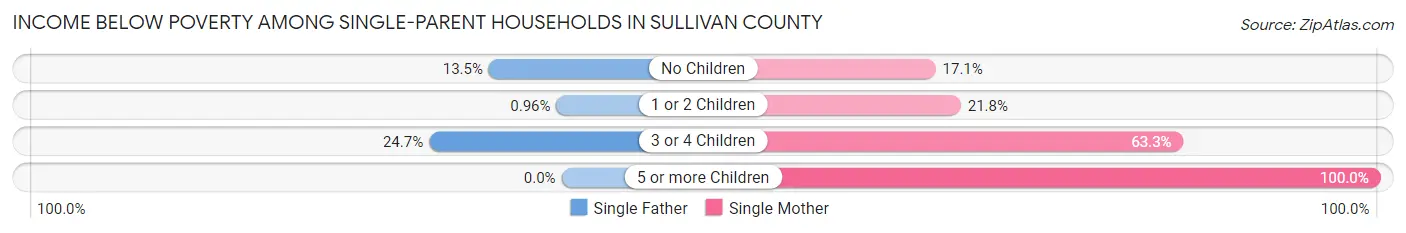
| Children | Single Father | Single Mother |
| No Children | 41 (13.5%) | 74 (17.1%) |
| 1 or 2 Children | 3 (1.0%) | 182 (21.8%) |
| 3 or 4 Children | 19 (24.7%) | 112 (63.3%) |
| 5 or more Children | 0 (0.0%) | 5 (100.0%) |
| Total | 63 (9.1%) | 373 (25.8%) |
Income Below Poverty Among Married-Couple vs Single-Parent Households in Sullivan County
The poverty data for Sullivan County shows that 346 of the married-couple family households (4.4%) and 436 of the single-parent households (20.4%) are living below the poverty level. Within the married-couple family households, those with 5 or more children have the highest poverty rate, with 7 households (43.8%) falling below the poverty line. Among the single-parent households, those with 5 or more children have the highest poverty rate, with 5 household (100.0%) living below poverty.
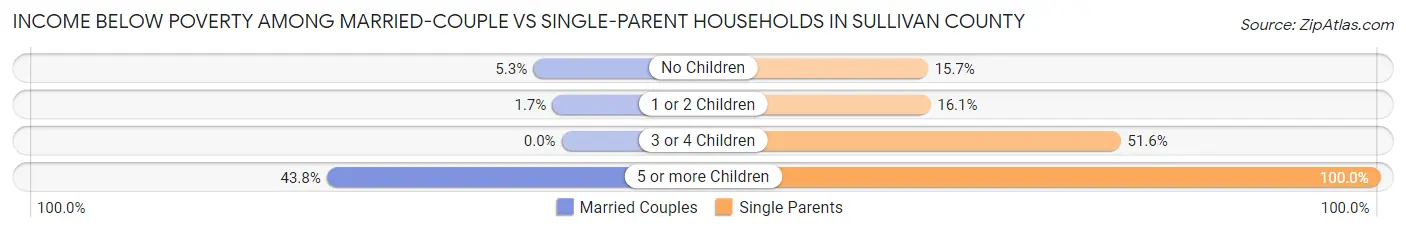
| Children | Married-Couple Families | Single-Parent Households |
| No Children | 308 (5.3%) | 115 (15.7%) |
| 1 or 2 Children | 31 (1.7%) | 185 (16.1%) |
| 3 or 4 Children | 0 (0.0%) | 131 (51.6%) |
| 5 or more Children | 7 (43.8%) | 5 (100.0%) |
| Total | 346 (4.4%) | 436 (20.4%) |
Race in Sullivan County
The most populous races in Sullivan County are White / Caucasian (41,042 | 94.7%), Two or more Races (1,410 | 3.3%), and Hispanic or Latino (810 | 1.9%).
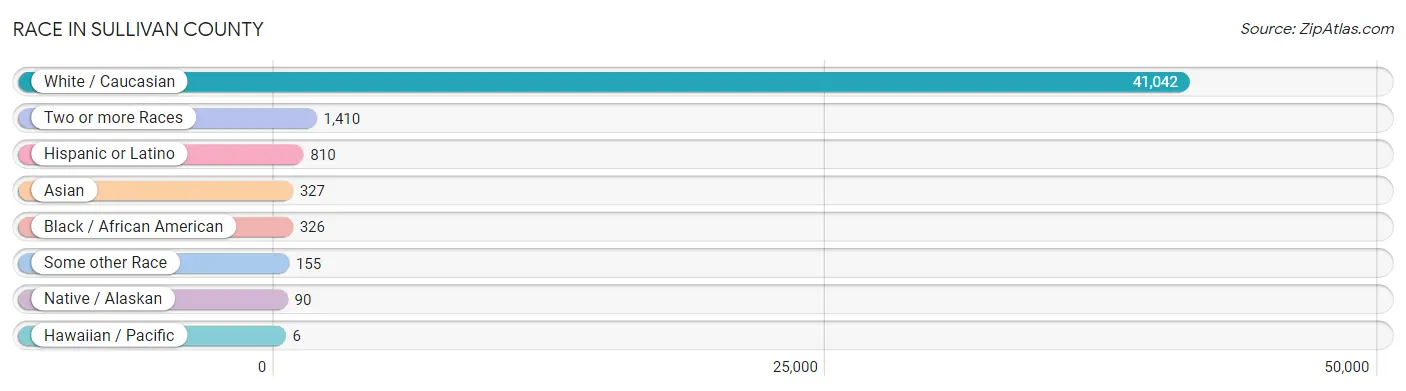
| Race | # Population | % Population |
| Asian | 327 | 0.7% |
| Black / African American | 326 | 0.7% |
| Hawaiian / Pacific | 6 | 0.0% |
| Hispanic or Latino | 810 | 1.9% |
| Native / Alaskan | 90 | 0.2% |
| White / Caucasian | 41,042 | 94.7% |
| Two or more Races | 1,410 | 3.3% |
| Some other Race | 155 | 0.4% |
| Total | 43,356 | 100.0% |
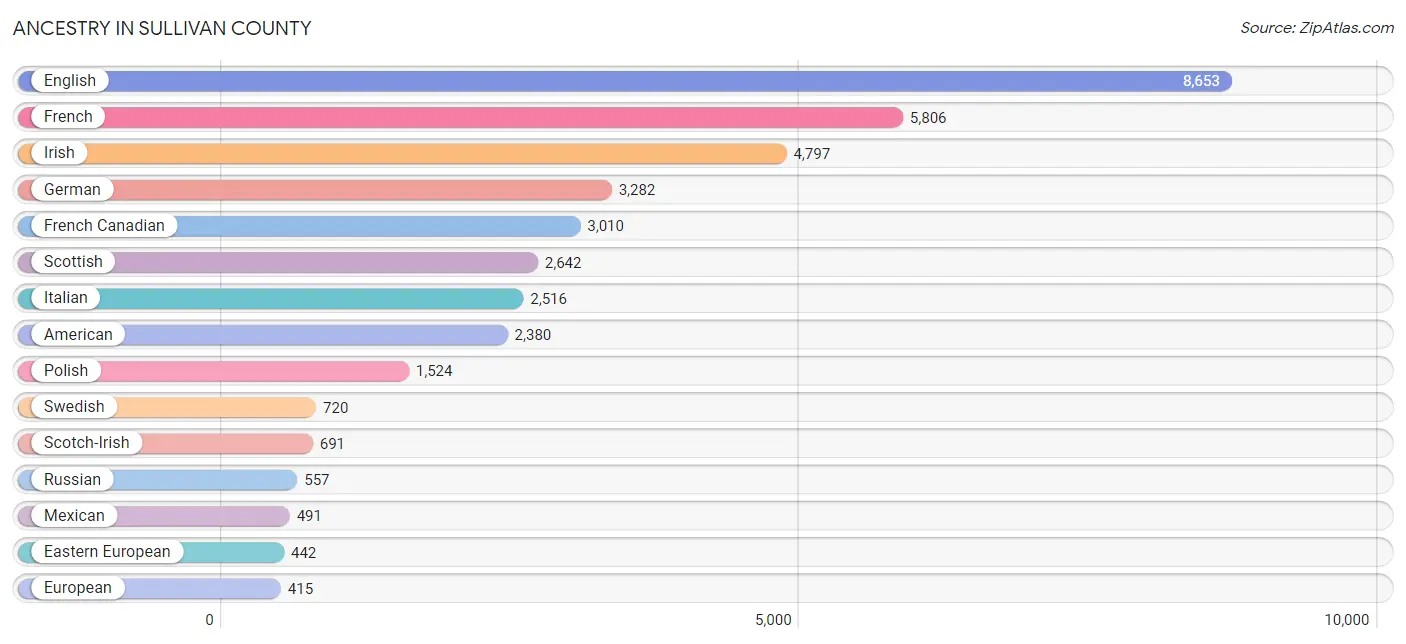
Ancestry in Sullivan County
The most populous ancestries reported in Sullivan County are English (8,653 | 20.0%), French (5,806 | 13.4%), Irish (4,797 | 11.1%), German (3,282 | 7.6%), and French Canadian (3,010 | 6.9%), together accounting for 58.9% of all Sullivan County residents.
| Ancestry | # Population | % Population |
| African | 7 | 0.0% |
| Albanian | 23 | 0.1% |
| American | 2,380 | 5.5% |
| Apache | 3 | 0.0% |
| Arab | 146 | 0.3% |
| Armenian | 21 | 0.1% |
| Austrian | 139 | 0.3% |
| Belgian | 99 | 0.2% |
| Bhutanese | 133 | 0.3% |
| Blackfeet | 40 | 0.1% |
| British | 148 | 0.3% |
| Burmese | 43 | 0.1% |
| Canadian | 172 | 0.4% |
| Celtic | 32 | 0.1% |
| Central American | 73 | 0.2% |
| Cherokee | 119 | 0.3% |
| Cree | 2 | 0.0% |
| Cuban | 57 | 0.1% |
| Czech | 123 | 0.3% |
| Czechoslovakian | 25 | 0.1% |
| Danish | 102 | 0.2% |
| Delaware | 5 | 0.0% |
| Dutch | 248 | 0.6% |
| Eastern European | 442 | 1.0% |
| Ecuadorian | 5 | 0.0% |
| Egyptian | 9 | 0.0% |
| English | 8,653 | 20.0% |
| European | 415 | 1.0% |
| Finnish | 378 | 0.9% |
| French | 5,806 | 13.4% |
| French American Indian | 7 | 0.0% |
| French Canadian | 3,010 | 6.9% |
| German | 3,282 | 7.6% |
| Greek | 210 | 0.5% |
| Guatemalan | 4 | 0.0% |
| Honduran | 10 | 0.0% |
| Hungarian | 197 | 0.4% |
| Indian (Asian) | 258 | 0.6% |
| Irish | 4,797 | 11.1% |
| Italian | 2,516 | 5.8% |
| Jamaican | 92 | 0.2% |
| Japanese | 13 | 0.0% |
| Korean | 126 | 0.3% |
| Latvian | 15 | 0.0% |
| Lebanese | 81 | 0.2% |
| Lithuanian | 65 | 0.2% |
| Luxembourger | 21 | 0.1% |
| Macedonian | 7 | 0.0% |
| Mexican | 491 | 1.1% |
| Mongolian | 7 | 0.0% |
| Moroccan | 7 | 0.0% |
| Native Hawaiian | 6 | 0.0% |
| Nicaraguan | 7 | 0.0% |
| Nigerian | 3 | 0.0% |
| Northern European | 56 | 0.1% |
| Norwegian | 360 | 0.8% |
| Panamanian | 52 | 0.1% |
| Pennsylvania German | 2 | 0.0% |
| Polish | 1,524 | 3.5% |
| Portuguese | 240 | 0.5% |
| Puerto Rican | 128 | 0.3% |
| Romanian | 11 | 0.0% |
| Russian | 557 | 1.3% |
| Scandinavian | 263 | 0.6% |
| Scotch-Irish | 691 | 1.6% |
| Scottish | 2,642 | 6.1% |
| Slavic | 18 | 0.0% |
| Slovak | 66 | 0.2% |
| Somali | 144 | 0.3% |
| South African | 35 | 0.1% |
| South American | 5 | 0.0% |
| Sri Lankan | 55 | 0.1% |
| Subsaharan African | 197 | 0.4% |
| Swedish | 720 | 1.7% |
| Swiss | 56 | 0.1% |
| Thai | 17 | 0.0% |
| Ukrainian | 105 | 0.2% |
| Welsh | 309 | 0.7% | View All 78 Rows |
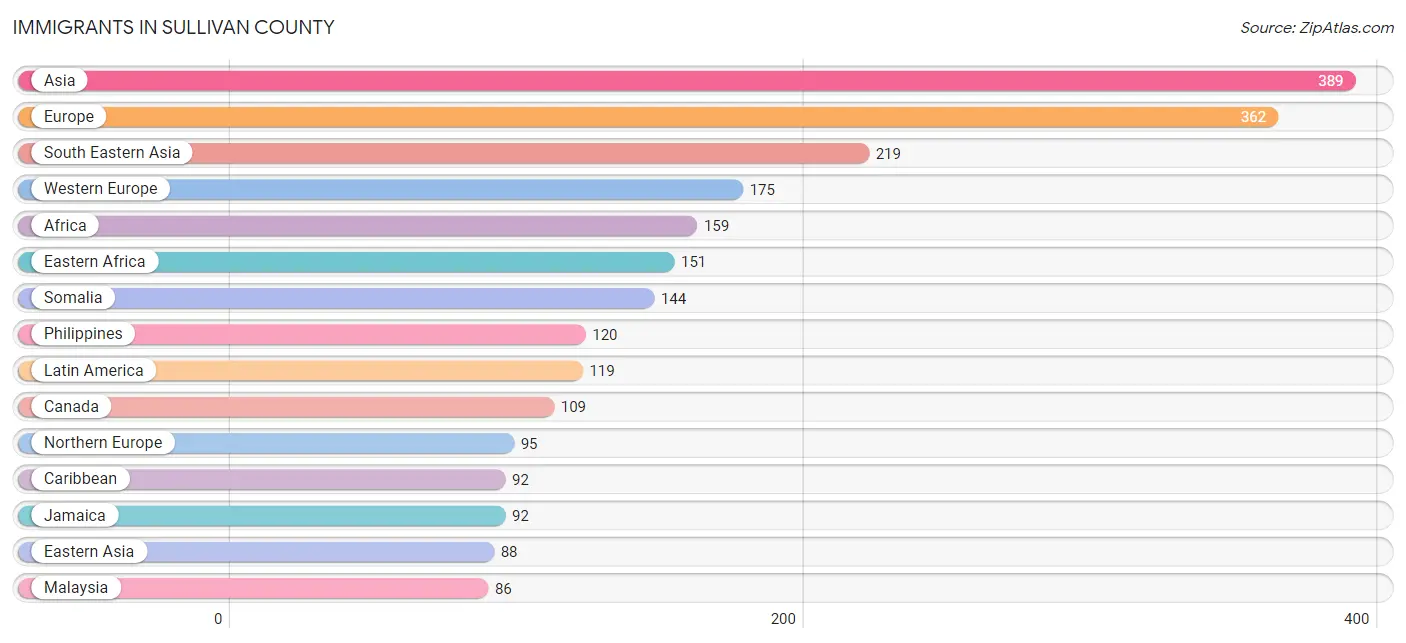
Immigrants in Sullivan County
The most numerous immigrant groups reported in Sullivan County came from Asia (389 | 0.9%), Europe (362 | 0.8%), South Eastern Asia (219 | 0.5%), Western Europe (175 | 0.4%), and Africa (159 | 0.4%), together accounting for 3.0% of all Sullivan County residents.
| Immigration Origin | # Population | % Population |
| Africa | 159 | 0.4% |
| Asia | 389 | 0.9% |
| Australia | 9 | 0.0% |
| Brazil | 6 | 0.0% |
| Cambodia | 13 | 0.0% |
| Canada | 109 | 0.3% |
| Caribbean | 92 | 0.2% |
| Central America | 21 | 0.1% |
| China | 24 | 0.1% |
| Denmark | 3 | 0.0% |
| Eastern Africa | 151 | 0.4% |
| Eastern Asia | 88 | 0.2% |
| Eastern Europe | 74 | 0.2% |
| England | 11 | 0.0% |
| Europe | 362 | 0.8% |
| France | 9 | 0.0% |
| Germany | 83 | 0.2% |
| Greece | 3 | 0.0% |
| Honduras | 10 | 0.0% |
| Hungary | 12 | 0.0% |
| Ireland | 19 | 0.0% |
| Israel | 33 | 0.1% |
| Italy | 3 | 0.0% |
| Jamaica | 92 | 0.2% |
| Japan | 24 | 0.1% |
| Korea | 40 | 0.1% |
| Latin America | 119 | 0.3% |
| Lithuania | 8 | 0.0% |
| Malaysia | 86 | 0.2% |
| Mexico | 11 | 0.0% |
| Morocco | 7 | 0.0% |
| Netherlands | 72 | 0.2% |
| Nigeria | 1 | 0.0% |
| North Macedonia | 7 | 0.0% |
| Northern Africa | 7 | 0.0% |
| Northern Europe | 95 | 0.2% |
| Oceania | 9 | 0.0% |
| Philippines | 120 | 0.3% |
| Poland | 21 | 0.1% |
| Portugal | 12 | 0.0% |
| Russia | 22 | 0.1% |
| Scotland | 7 | 0.0% |
| Somalia | 144 | 0.3% |
| South America | 6 | 0.0% |
| South Eastern Asia | 219 | 0.5% |
| Southern Europe | 18 | 0.0% |
| Sweden | 7 | 0.0% |
| Switzerland | 11 | 0.0% |
| Turkey | 38 | 0.1% |
| Ukraine | 4 | 0.0% |
| Western Africa | 1 | 0.0% |
| Western Asia | 82 | 0.2% |
| Western Europe | 175 | 0.4% | View All 53 Rows |
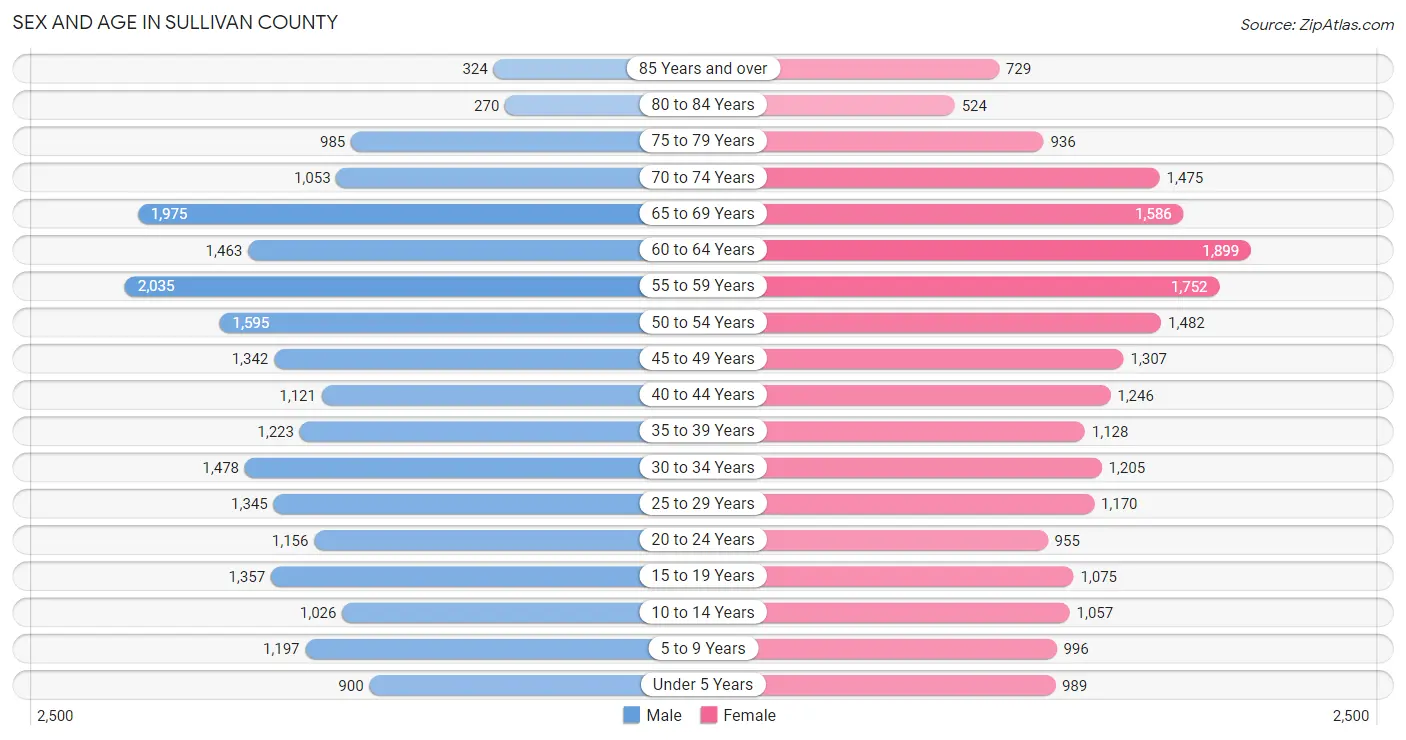
Sex and Age in Sullivan County
Sex and Age in Sullivan County
The most populous age groups in Sullivan County are 55 to 59 Years (2,035 | 9.3%) for men and 60 to 64 Years (1,899 | 8.8%) for women.
| Age Bracket | Male | Female |
| Under 5 Years | 900 (4.1%) | 989 (4.6%) |
| 5 to 9 Years | 1,197 (5.5%) | 996 (4.6%) |
| 10 to 14 Years | 1,026 (4.7%) | 1,057 (4.9%) |
| 15 to 19 Years | 1,357 (6.2%) | 1,075 (5.0%) |
| 20 to 24 Years | 1,156 (5.3%) | 955 (4.4%) |
| 25 to 29 Years | 1,345 (6.2%) | 1,170 (5.4%) |
| 30 to 34 Years | 1,478 (6.8%) | 1,205 (5.6%) |
| 35 to 39 Years | 1,223 (5.6%) | 1,128 (5.2%) |
| 40 to 44 Years | 1,121 (5.1%) | 1,246 (5.8%) |
| 45 to 49 Years | 1,342 (6.1%) | 1,307 (6.1%) |
| 50 to 54 Years | 1,595 (7.3%) | 1,482 (6.9%) |
| 55 to 59 Years | 2,035 (9.3%) | 1,752 (8.1%) |
| 60 to 64 Years | 1,463 (6.7%) | 1,899 (8.8%) |
| 65 to 69 Years | 1,975 (9.0%) | 1,586 (7.4%) |
| 70 to 74 Years | 1,053 (4.8%) | 1,475 (6.9%) |
| 75 to 79 Years | 985 (4.5%) | 936 (4.3%) |
| 80 to 84 Years | 270 (1.2%) | 524 (2.4%) |
| 85 Years and over | 324 (1.5%) | 729 (3.4%) |
| Total | 21,845 (100.0%) | 21,511 (100.0%) |
Families and Households in Sullivan County
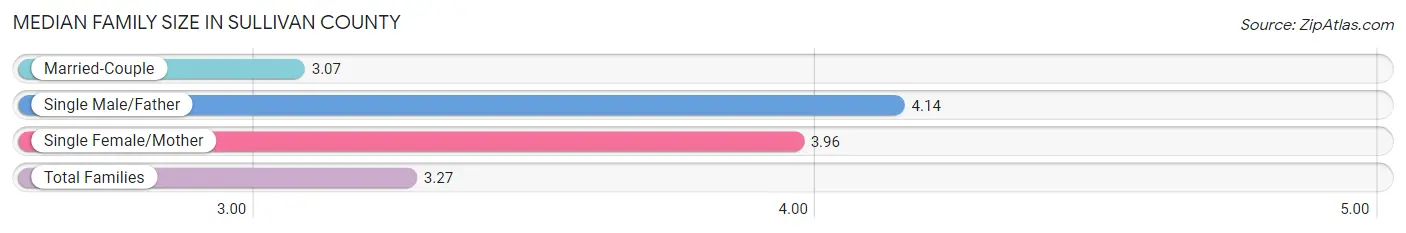
Median Family Size in Sullivan County
The median family size in Sullivan County is 3.27 persons per family, with single male/father families (692 | 6.9%) accounting for the largest median family size of 4.14 persons per family. On the other hand, married-couple families (7,826 | 78.5%) represent the smallest median family size with 3.07 persons per family.
| Family Type | # Families | Family Size |
| Married-Couple | 7,826 (78.5%) | 3.07 |
| Single Male/Father | 692 (6.9%) | 4.14 |
| Single Female/Mother | 1,448 (14.5%) | 3.96 |
| Total Families | 9,966 (100.0%) | 3.27 |
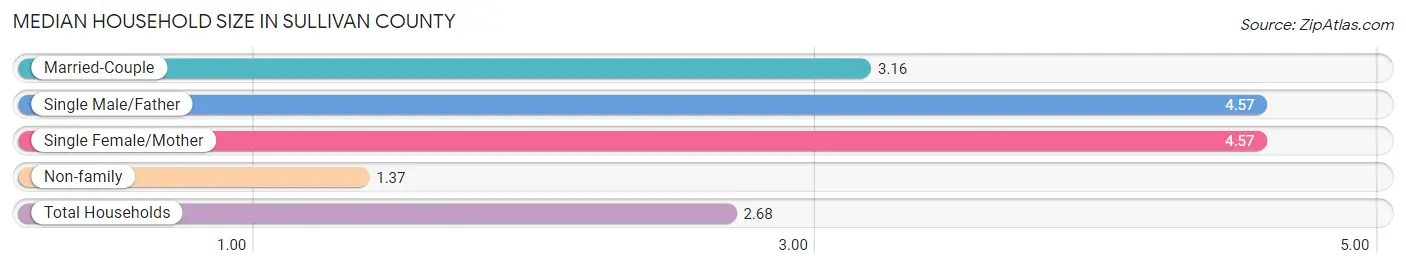
Median Household Size in Sullivan County
The median household size in Sullivan County is 2.68 persons per household, with single male/father households (692 | 4.3%) accounting for the largest median household size of 4.57 persons per household. non-family households (5,927 | 37.3%) represent the smallest median household size with 1.37 persons per household.
| Household Type | # Households | Household Size |
| Married-Couple | 7,826 (49.2%) | 3.16 |
| Single Male/Father | 692 (4.3%) | 4.57 |
| Single Female/Mother | 1,448 (9.1%) | 4.57 |
| Non-family | 5,927 (37.3%) | 1.37 |
| Total Households | 15,893 (100.0%) | 2.68 |
Household Size by Marriage Status in Sullivan County
Out of a total of 15,893 households in Sullivan County, 9,966 (62.7%) are family households, while 5,927 (37.3%) are nonfamily households. The most numerous type of family households are 2-person households, comprising 5,557, and the most common type of nonfamily households are 1-person households, comprising 4,600.
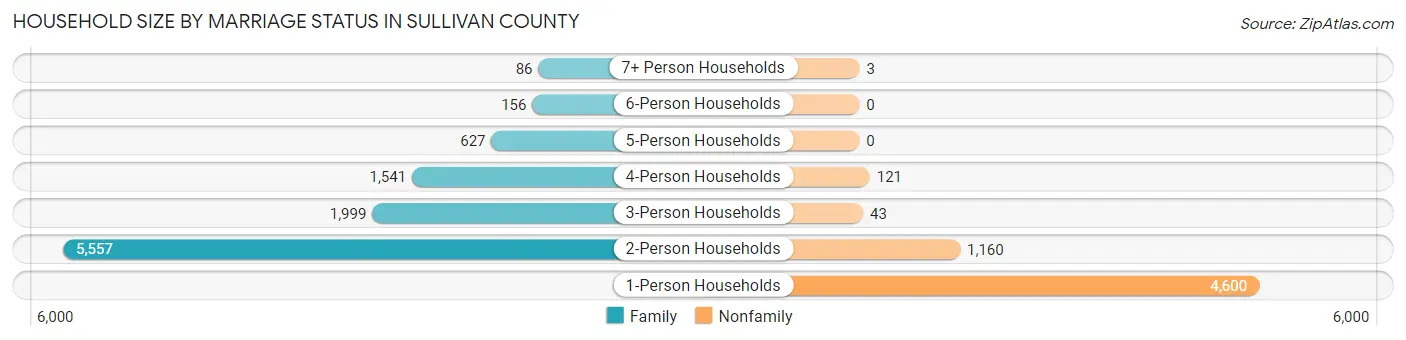
| Household Size | Family Households | Nonfamily Households |
| 1-Person Households | - | 4,600 (28.9%) |
| 2-Person Households | 5,557 (35.0%) | 1,160 (7.3%) |
| 3-Person Households | 1,999 (12.6%) | 43 (0.3%) |
| 4-Person Households | 1,541 (9.7%) | 121 (0.8%) |
| 5-Person Households | 627 (4.0%) | 0 (0.0%) |
| 6-Person Households | 156 (1.0%) | 0 (0.0%) |
| 7+ Person Households | 86 (0.5%) | 3 (0.0%) |
| Total | 9,966 (62.7%) | 5,927 (37.3%) |
Female Fertility in Sullivan County
Fertility by Age in Sullivan County
Average fertility rate in Sullivan County is 53.0 births per 1,000 women. Women in the age bracket of 20 to 34 years have the highest fertility rate with 123.0 births per 1,000 women. Women in the age bracket of 20 to 34 years acount for 91.7% of all women with births.
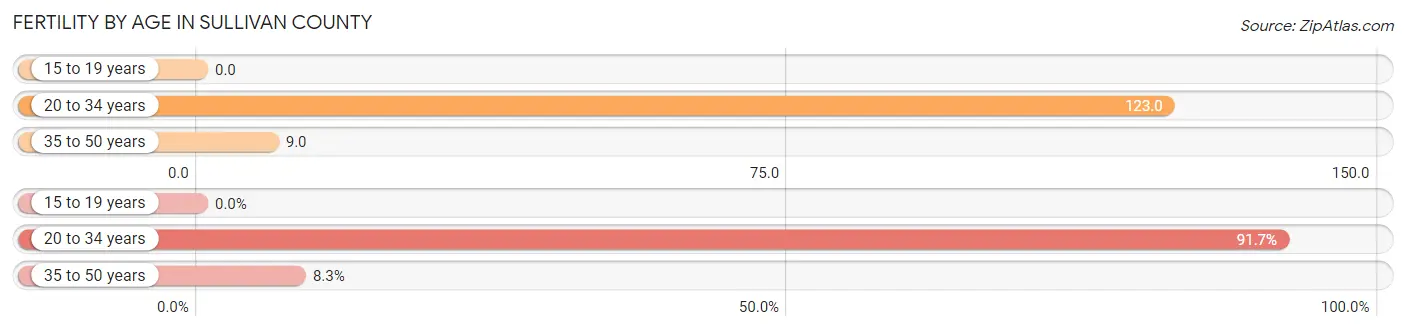
| Age Bracket | Women with Births | Births / 1,000 Women |
| 15 to 19 years | 0 (0.0%) | 0.0 |
| 20 to 34 years | 408 (91.7%) | 123.0 |
| 35 to 50 years | 37 (8.3%) | 9.0 |
| Total | 445 (100.0%) | 53.0 |
Fertility by Age by Marriage Status in Sullivan County
49.2% of women with births (445) in Sullivan County are married. The highest percentage of unmarried women with births falls into 20 to 34 years age bracket with 54.9% of them unmarried at the time of birth, while the lowest percentage of unmarried women with births belong to 35 to 50 years age bracket with 5.4% of them unmarried.
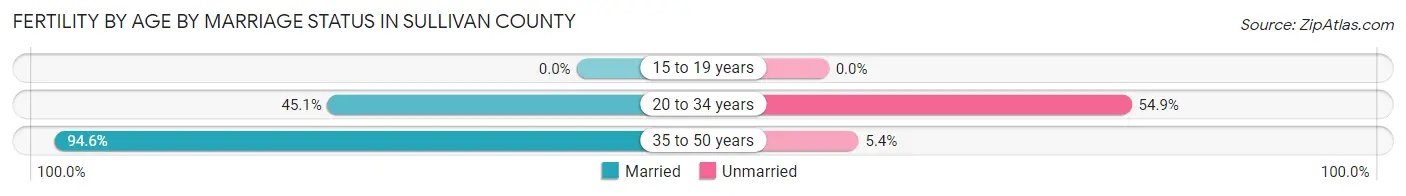
| Age Bracket | Married | Unmarried |
| 15 to 19 years | 0 (0.0%) | 0 (0.0%) |
| 20 to 34 years | 184 (45.1%) | 224 (54.9%) |
| 35 to 50 years | 35 (94.6%) | 2 (5.4%) |
| Total | 219 (49.2%) | 226 (50.8%) |
Fertility by Education in Sullivan County
Average fertility rate in Sullivan County is 53.0 births per 1,000 women. Women with the education attainment of high school diploma have the highest fertility rate of 99.0 births per 1,000 women, while women with the education attainment of less than high school have the lowest fertility at 9.0 births per 1,000 women. Women with the education attainment of high school diploma represent 47.0% of all women with births.
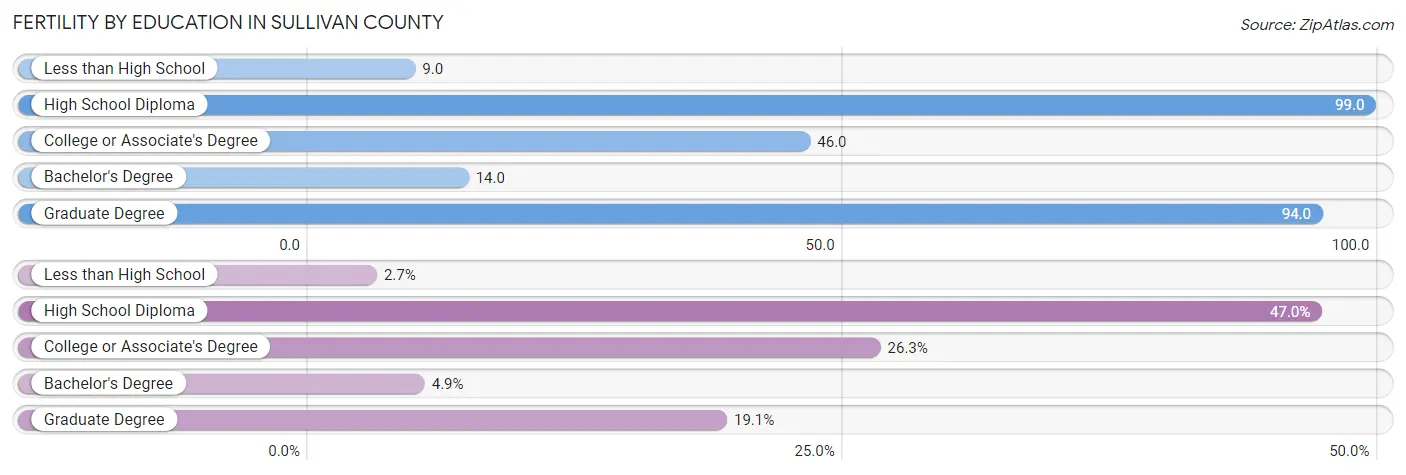
| Educational Attainment | Women with Births | Births / 1,000 Women |
| Less than High School | 12 (2.7%) | 9.0 |
| High School Diploma | 209 (47.0%) | 99.0 |
| College or Associate's Degree | 117 (26.3%) | 46.0 |
| Bachelor's Degree | 22 (4.9%) | 14.0 |
| Graduate Degree | 85 (19.1%) | 94.0 |
| Total | 445 (100.0%) | 53.0 |
Fertility by Education by Marriage Status in Sullivan County
50.8% of women with births in Sullivan County are unmarried. Women with the educational attainment of less than high school are most likely to be married with 100.0% of them married at childbirth, while women with the educational attainment of high school diploma are least likely to be married with 70.3% of them unmarried at childbirth.
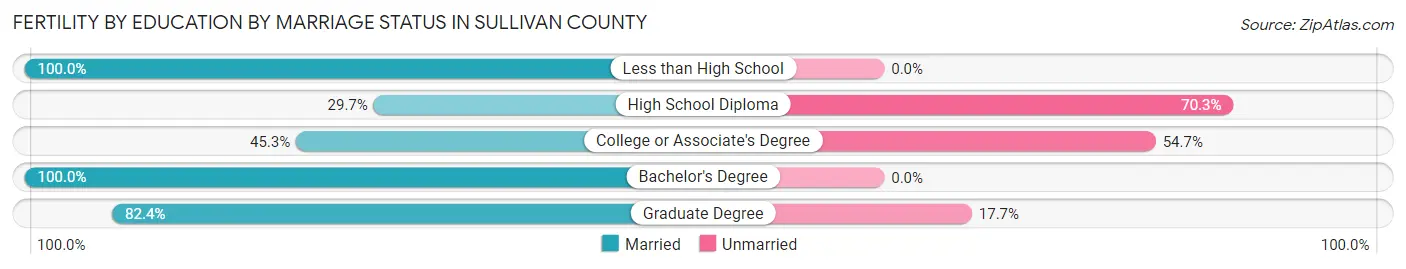
| Educational Attainment | Married | Unmarried |
| Less than High School | 12 (100.0%) | 0 (0.0%) |
| High School Diploma | 62 (29.7%) | 147 (70.3%) |
| College or Associate's Degree | 53 (45.3%) | 64 (54.7%) |
| Bachelor's Degree | 22 (100.0%) | 0 (0.0%) |
| Graduate Degree | 70 (82.4%) | 15 (17.6%) |
| Total | 219 (49.2%) | 226 (50.8%) |
Employment Characteristics in Sullivan County
Employment by Class of Employer in Sullivan County
Among the 19,817 employed individuals in Sullivan County, private company employees (12,469 | 62.9%), not-for-profit organizations (3,085 | 15.6%), and local government employees (1,522 | 7.7%) make up the most common classes of employment.
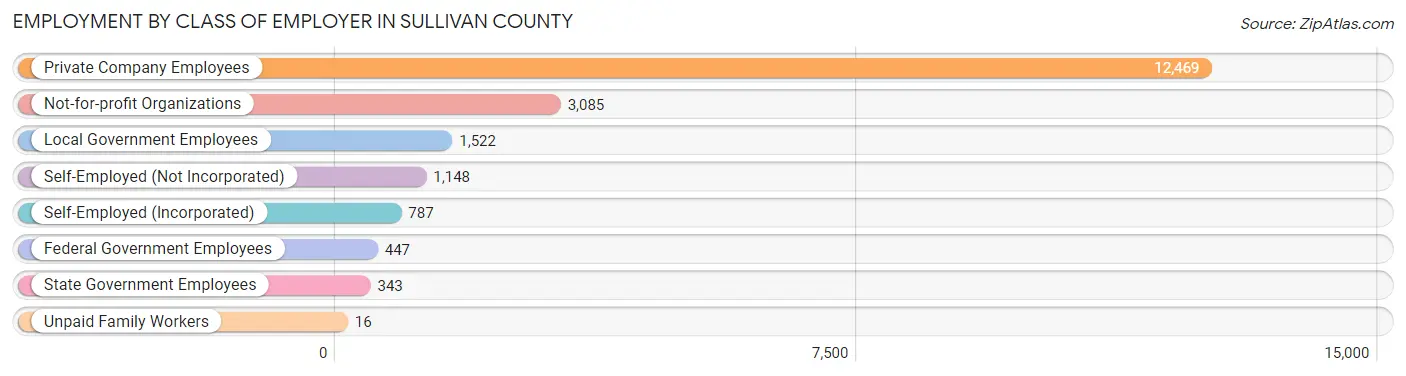
| Employer Class | # Employees | % Employees |
| Private Company Employees | 12,469 | 62.9% |
| Self-Employed (Incorporated) | 787 | 4.0% |
| Self-Employed (Not Incorporated) | 1,148 | 5.8% |
| Not-for-profit Organizations | 3,085 | 15.6% |
| Local Government Employees | 1,522 | 7.7% |
| State Government Employees | 343 | 1.7% |
| Federal Government Employees | 447 | 2.3% |
| Unpaid Family Workers | 16 | 0.1% |
| Total | 19,817 | 100.0% |
Employment Status by Age in Sullivan County
According to the labor force statistics for Sullivan County, out of the total population over 16 years of age (36,865), 56.5% or 20,829 individuals are in the labor force, with 2.9% or 604 of them unemployed. The age group with the highest labor force participation rate is 25 to 29 years, with 81.5% or 2,050 individuals in the labor force. Within the labor force, the 20 to 24 years age range has the highest percentage of unemployed individuals, with 8.2% or 130 of them being unemployed.
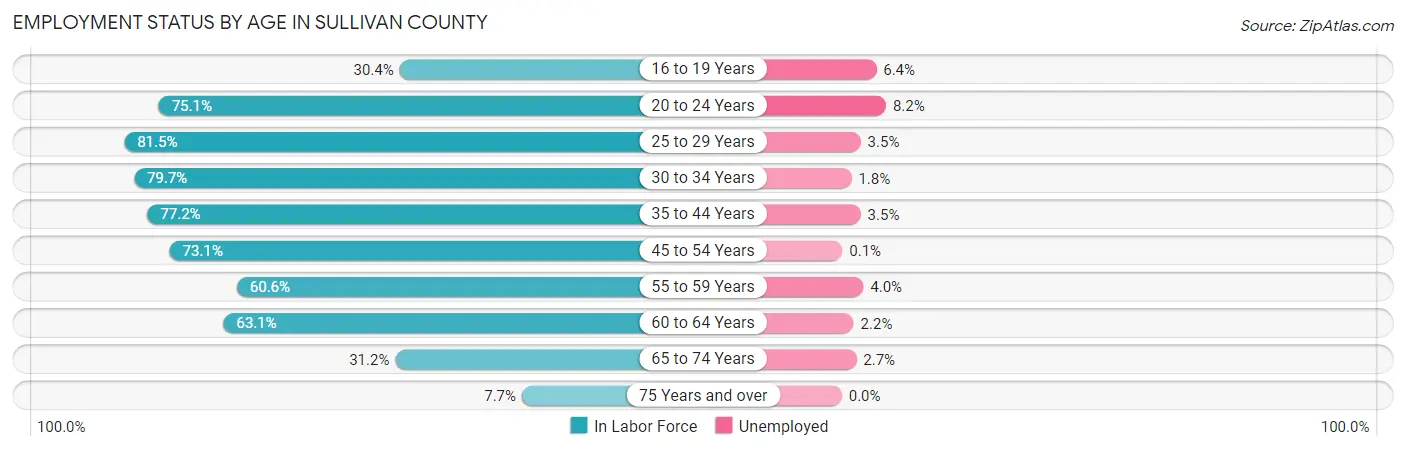
| Age Bracket | In Labor Force | Unemployed |
| 16 to 19 Years | 640 (30.4%) | 41 (6.4%) |
| 20 to 24 Years | 1,585 (75.1%) | 130 (8.2%) |
| 25 to 29 Years | 2,050 (81.5%) | 72 (3.5%) |
| 30 to 34 Years | 2,138 (79.7%) | 38 (1.8%) |
| 35 to 44 Years | 3,642 (77.2%) | 127 (3.5%) |
| 45 to 54 Years | 4,186 (73.1%) | 4 (0.1%) |
| 55 to 59 Years | 2,295 (60.6%) | 92 (4.0%) |
| 60 to 64 Years | 2,121 (63.1%) | 47 (2.2%) |
| 65 to 74 Years | 1,900 (31.2%) | 51 (2.7%) |
| 75 Years and over | 290 (7.7%) | 0 (0.0%) |
| Total | 20,829 (56.5%) | 604 (2.9%) |
Employment Status by Educational Attainment in Sullivan County
According to labor force statistics for Sullivan County, 72.1% of individuals (16,432) out of the total population between 25 and 64 years of age (22,791) are in the labor force, with 2.3% or 378 of them being unemployed. The group with the highest labor force participation rate are those with the educational attainment of bachelor's degree or higher, with 84.6% or 5,797 individuals in the labor force. Within the labor force, individuals with high school diploma education have the highest percentage of unemployment, with 3.7% or 211 of them being unemployed.
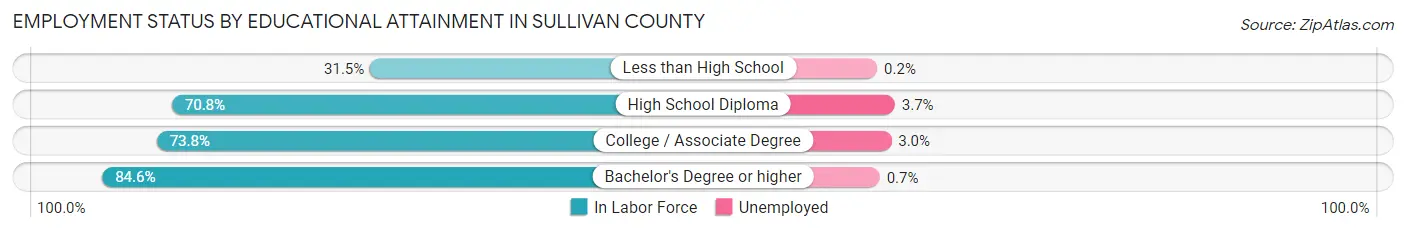
| Educational Attainment | In Labor Force | Unemployed |
| Less than High School | 661 (31.5%) | 4 (0.2%) |
| High School Diploma | 5,713 (70.8%) | 299 (3.7%) |
| College / Associate Degree | 4,260 (73.8%) | 173 (3.0%) |
| Bachelor's Degree or higher | 5,797 (84.6%) | 48 (0.7%) |
| Total | 16,432 (72.1%) | 524 (2.3%) |
Employment Occupations by Sex in Sullivan County
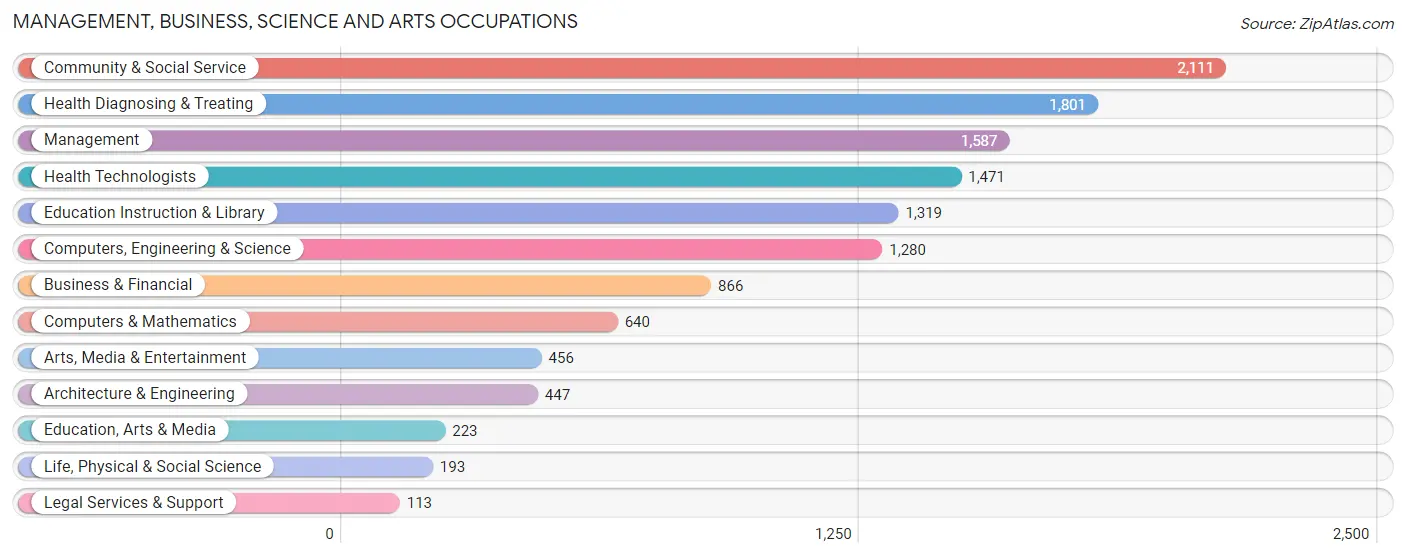
Management, Business, Science and Arts Occupations
The most common Management, Business, Science and Arts occupations in Sullivan County are Community & Social Service (2,111 | 10.5%), Health Diagnosing & Treating (1,801 | 8.9%), Management (1,587 | 7.9%), Health Technologists (1,471 | 7.3%), and Education Instruction & Library (1,319 | 6.5%).
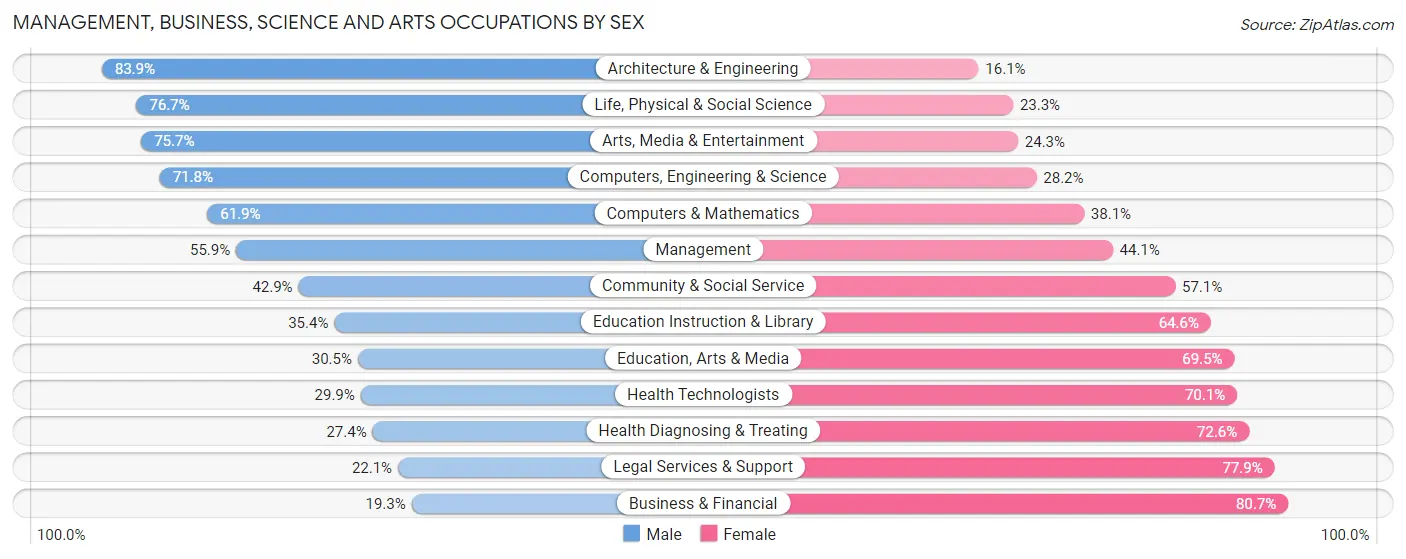
Management, Business, Science and Arts Occupations by Sex
Within the Management, Business, Science and Arts occupations in Sullivan County, the most male-oriented occupations are Architecture & Engineering (83.9%), Life, Physical & Social Science (76.7%), and Arts, Media & Entertainment (75.7%), while the most female-oriented occupations are Business & Financial (80.7%), Legal Services & Support (77.9%), and Health Diagnosing & Treating (72.6%).
| Occupation | Male | Female |
| Management | 887 (55.9%) | 700 (44.1%) |
| Business & Financial | 167 (19.3%) | 699 (80.7%) |
| Computers, Engineering & Science | 919 (71.8%) | 361 (28.2%) |
| Computers & Mathematics | 396 (61.9%) | 244 (38.1%) |
| Architecture & Engineering | 375 (83.9%) | 72 (16.1%) |
| Life, Physical & Social Science | 148 (76.7%) | 45 (23.3%) |
| Community & Social Service | 905 (42.9%) | 1,206 (57.1%) |
| Education, Arts & Media | 68 (30.5%) | 155 (69.5%) |
| Legal Services & Support | 25 (22.1%) | 88 (77.9%) |
| Education Instruction & Library | 467 (35.4%) | 852 (64.6%) |
| Arts, Media & Entertainment | 345 (75.7%) | 111 (24.3%) |
| Health Diagnosing & Treating | 494 (27.4%) | 1,307 (72.6%) |
| Health Technologists | 440 (29.9%) | 1,031 (70.1%) |
| Total (Category) | 3,372 (44.1%) | 4,273 (55.9%) |
| Total (Overall) | 10,565 (52.3%) | 9,625 (47.7%) |
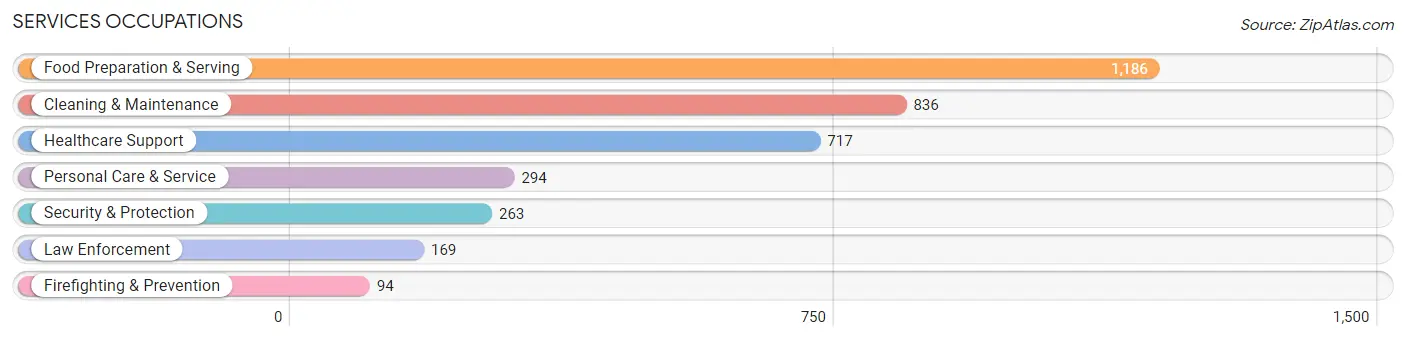
Services Occupations
The most common Services occupations in Sullivan County are Food Preparation & Serving (1,186 | 5.9%), Cleaning & Maintenance (836 | 4.1%), Healthcare Support (717 | 3.5%), Personal Care & Service (294 | 1.5%), and Security & Protection (263 | 1.3%).
Services Occupations by Sex
Within the Services occupations in Sullivan County, the most male-oriented occupations are Security & Protection (100.0%), Firefighting & Prevention (100.0%), and Law Enforcement (100.0%), while the most female-oriented occupations are Healthcare Support (92.5%), Personal Care & Service (86.1%), and Food Preparation & Serving (50.5%).

| Occupation | Male | Female |
| Healthcare Support | 54 (7.5%) | 663 (92.5%) |
| Security & Protection | 263 (100.0%) | 0 (0.0%) |
| Firefighting & Prevention | 94 (100.0%) | 0 (0.0%) |
| Law Enforcement | 169 (100.0%) | 0 (0.0%) |
| Food Preparation & Serving | 587 (49.5%) | 599 (50.5%) |
| Cleaning & Maintenance | 543 (64.9%) | 293 (35.0%) |
| Personal Care & Service | 41 (14.0%) | 253 (86.1%) |
| Total (Category) | 1,488 (45.2%) | 1,808 (54.8%) |
| Total (Overall) | 10,565 (52.3%) | 9,625 (47.7%) |
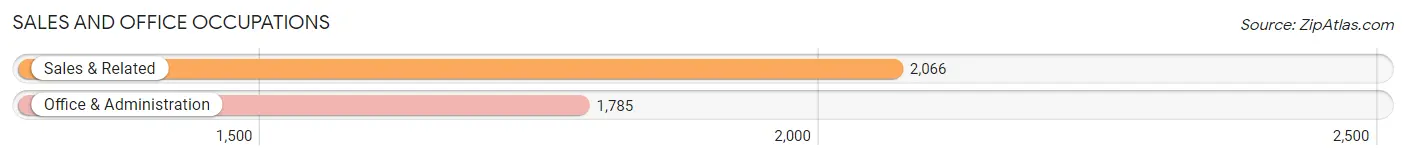
Sales and Office Occupations
The most common Sales and Office occupations in Sullivan County are Sales & Related (2,066 | 10.2%), and Office & Administration (1,785 | 8.8%).
Sales and Office Occupations by Sex

| Occupation | Male | Female |
| Sales & Related | 963 (46.6%) | 1,103 (53.4%) |
| Office & Administration | 318 (17.8%) | 1,467 (82.2%) |
| Total (Category) | 1,281 (33.3%) | 2,570 (66.7%) |
| Total (Overall) | 10,565 (52.3%) | 9,625 (47.7%) |
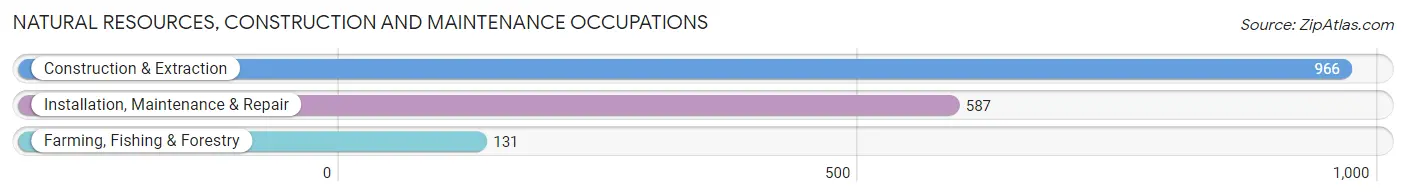
Natural Resources, Construction and Maintenance Occupations
The most common Natural Resources, Construction and Maintenance occupations in Sullivan County are Construction & Extraction (966 | 4.8%), Installation, Maintenance & Repair (587 | 2.9%), and Farming, Fishing & Forestry (131 | 0.6%).
Natural Resources, Construction and Maintenance Occupations by Sex
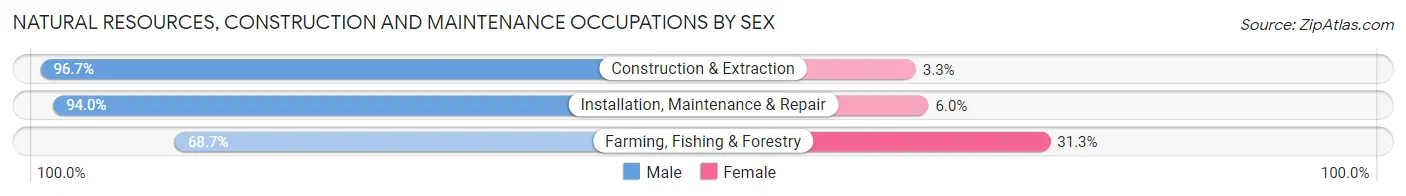
| Occupation | Male | Female |
| Farming, Fishing & Forestry | 90 (68.7%) | 41 (31.3%) |
| Construction & Extraction | 934 (96.7%) | 32 (3.3%) |
| Installation, Maintenance & Repair | 552 (94.0%) | 35 (6.0%) |
| Total (Category) | 1,576 (93.6%) | 108 (6.4%) |
| Total (Overall) | 10,565 (52.3%) | 9,625 (47.7%) |
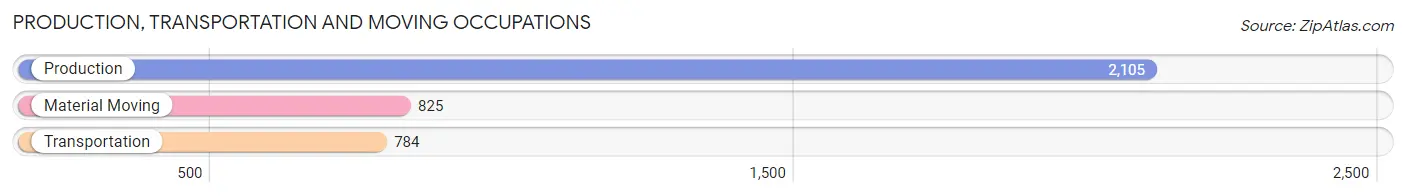
Production, Transportation and Moving Occupations
The most common Production, Transportation and Moving occupations in Sullivan County are Production (2,105 | 10.4%), Material Moving (825 | 4.1%), and Transportation (784 | 3.9%).
Production, Transportation and Moving Occupations by Sex
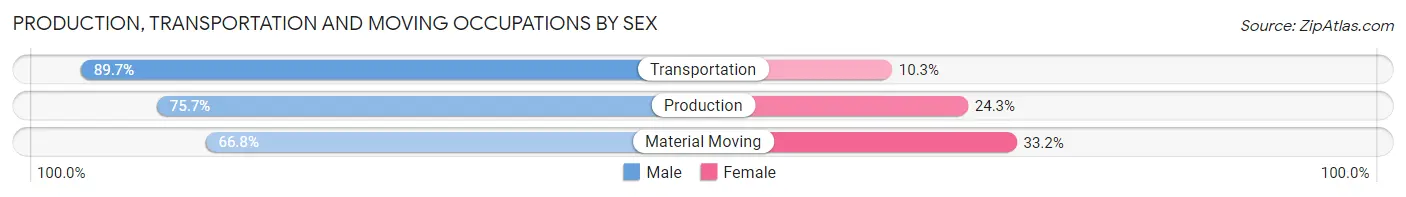
| Occupation | Male | Female |
| Production | 1,594 (75.7%) | 511 (24.3%) |
| Transportation | 703 (89.7%) | 81 (10.3%) |
| Material Moving | 551 (66.8%) | 274 (33.2%) |
| Total (Category) | 2,848 (76.7%) | 866 (23.3%) |
| Total (Overall) | 10,565 (52.3%) | 9,625 (47.7%) |
Employment Industries by Sex in Sullivan County
Employment Industries in Sullivan County
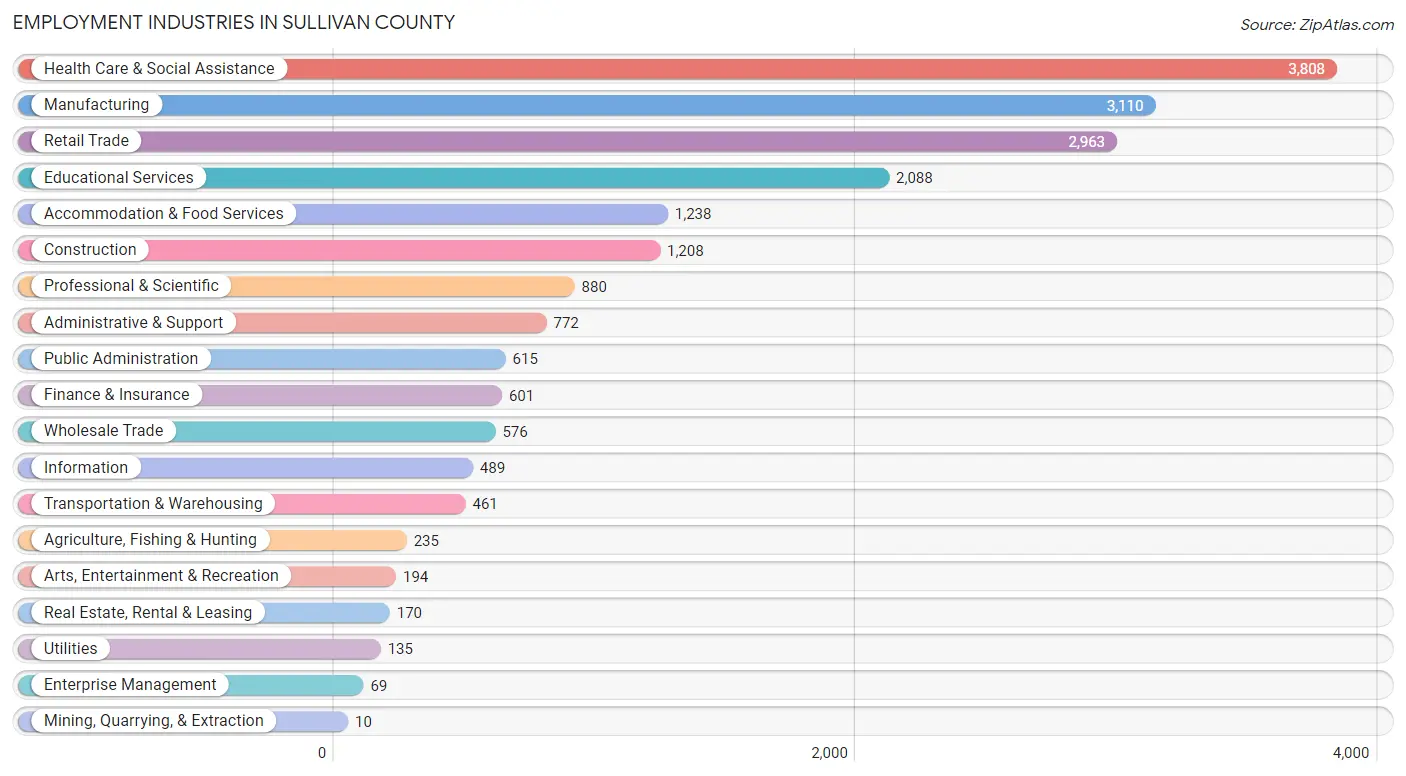
The major employment industries in Sullivan County include Health Care & Social Assistance (3,808 | 18.9%), Manufacturing (3,110 | 15.4%), Retail Trade (2,963 | 14.7%), Educational Services (2,088 | 10.3%), and Accommodation & Food Services (1,238 | 6.1%).
Employment Industries by Sex in Sullivan County
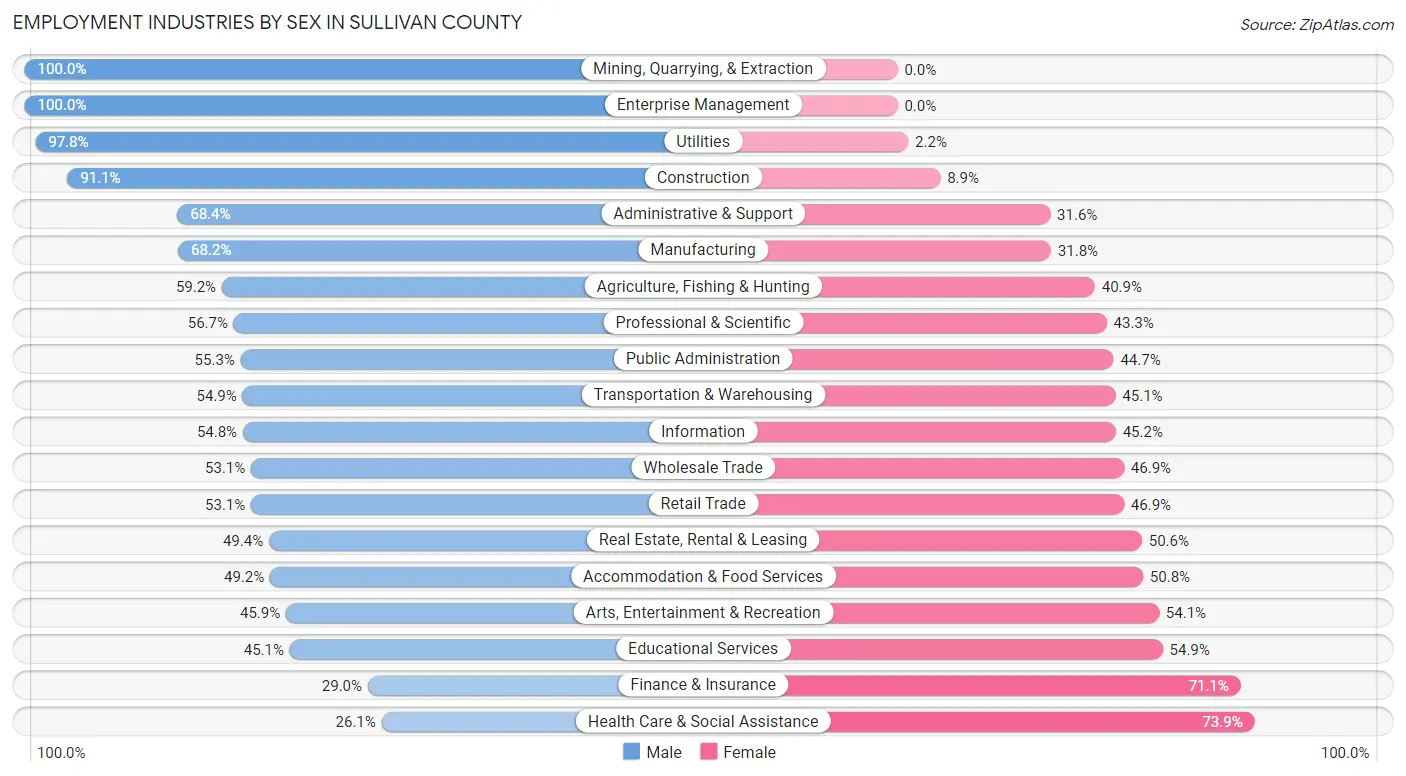
The Sullivan County industries that see more men than women are Mining, Quarrying, & Extraction (100.0%), Enterprise Management (100.0%), and Utilities (97.8%), whereas the industries that tend to have a higher number of women are Health Care & Social Assistance (73.9%), Finance & Insurance (71.1%), and Educational Services (54.9%).
| Industry | Male | Female |
| Agriculture, Fishing & Hunting | 139 (59.2%) | 96 (40.8%) |
| Mining, Quarrying, & Extraction | 10 (100.0%) | 0 (0.0%) |
| Construction | 1,101 (91.1%) | 107 (8.9%) |
| Manufacturing | 2,122 (68.2%) | 988 (31.8%) |
| Wholesale Trade | 306 (53.1%) | 270 (46.9%) |
| Retail Trade | 1,574 (53.1%) | 1,389 (46.9%) |
| Transportation & Warehousing | 253 (54.9%) | 208 (45.1%) |
| Utilities | 132 (97.8%) | 3 (2.2%) |
| Information | 268 (54.8%) | 221 (45.2%) |
| Finance & Insurance | 174 (28.9%) | 427 (71.1%) |
| Real Estate, Rental & Leasing | 84 (49.4%) | 86 (50.6%) |
| Professional & Scientific | 499 (56.7%) | 381 (43.3%) |
| Enterprise Management | 69 (100.0%) | 0 (0.0%) |
| Administrative & Support | 528 (68.4%) | 244 (31.6%) |
| Educational Services | 942 (45.1%) | 1,146 (54.9%) |
| Health Care & Social Assistance | 994 (26.1%) | 2,814 (73.9%) |
| Arts, Entertainment & Recreation | 89 (45.9%) | 105 (54.1%) |
| Accommodation & Food Services | 609 (49.2%) | 629 (50.8%) |
| Public Administration | 340 (55.3%) | 275 (44.7%) |
| Total | 10,565 (52.3%) | 9,625 (47.7%) |
Education in Sullivan County
School Enrollment in Sullivan County
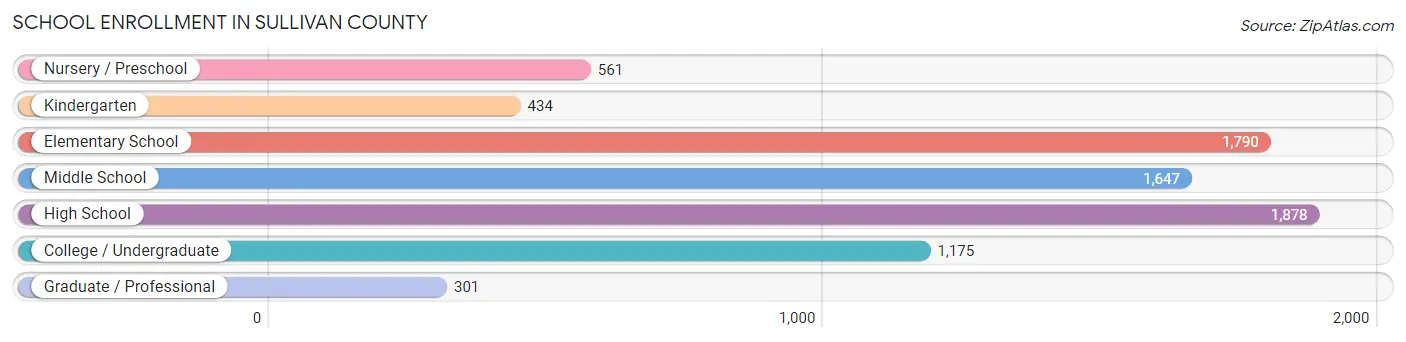
The most common levels of schooling among the 7,786 students in Sullivan County are high school (1,878 | 24.1%), elementary school (1,790 | 23.0%), and middle school (1,647 | 21.1%).
| School Level | # Students | % Students |
| Nursery / Preschool | 561 | 7.2% |
| Kindergarten | 434 | 5.6% |
| Elementary School | 1,790 | 23.0% |
| Middle School | 1,647 | 21.1% |
| High School | 1,878 | 24.1% |
| College / Undergraduate | 1,175 | 15.1% |
| Graduate / Professional | 301 | 3.9% |
| Total | 7,786 | 100.0% |
School Enrollment by Age by Funding Source in Sullivan County
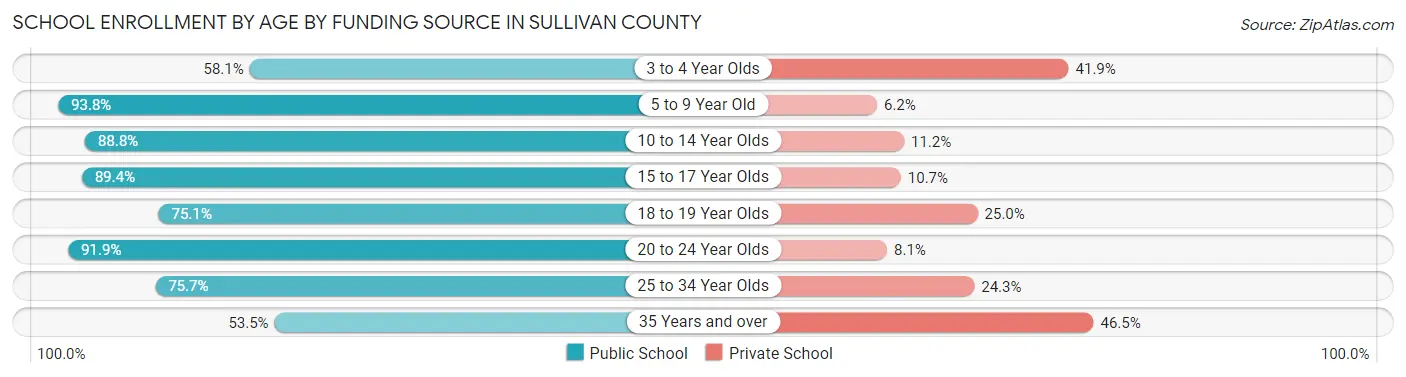
Out of a total of 7,786 students who are enrolled in schools in Sullivan County, 1,113 (14.3%) attend a private institution, while the remaining 6,673 (85.7%) are enrolled in public schools. The age group of 35 years and over has the highest likelihood of being enrolled in private schools, with 168 (46.5% in the age bracket) enrolled. Conversely, the age group of 5 to 9 year old has the lowest likelihood of being enrolled in a private school, with 1,946 (93.8% in the age bracket) attending a public institution.
| Age Bracket | Public School | Private School |
| 3 to 4 Year Olds | 233 (58.1%) | 168 (41.9%) |
| 5 to 9 Year Old | 1,946 (93.8%) | 129 (6.2%) |
| 10 to 14 Year Olds | 1,848 (88.8%) | 234 (11.2%) |
| 15 to 17 Year Olds | 1,301 (89.3%) | 155 (10.6%) |
| 18 to 19 Year Olds | 370 (75.0%) | 123 (24.9%) |
| 20 to 24 Year Olds | 500 (91.9%) | 44 (8.1%) |
| 25 to 34 Year Olds | 283 (75.7%) | 91 (24.3%) |
| 35 Years and over | 193 (53.5%) | 168 (46.5%) |
| Total | 6,673 (85.7%) | 1,113 (14.3%) |
Educational Attainment by Field of Study in Sullivan County
Business (1,689 | 15.6%), education (1,333 | 12.3%), science & technology (1,259 | 11.7%), bio, nature & agricultural (1,146 | 10.6%), and social sciences (978 | 9.0%) are the most common fields of study among 10,811 individuals in Sullivan County who have obtained a bachelor's degree or higher.
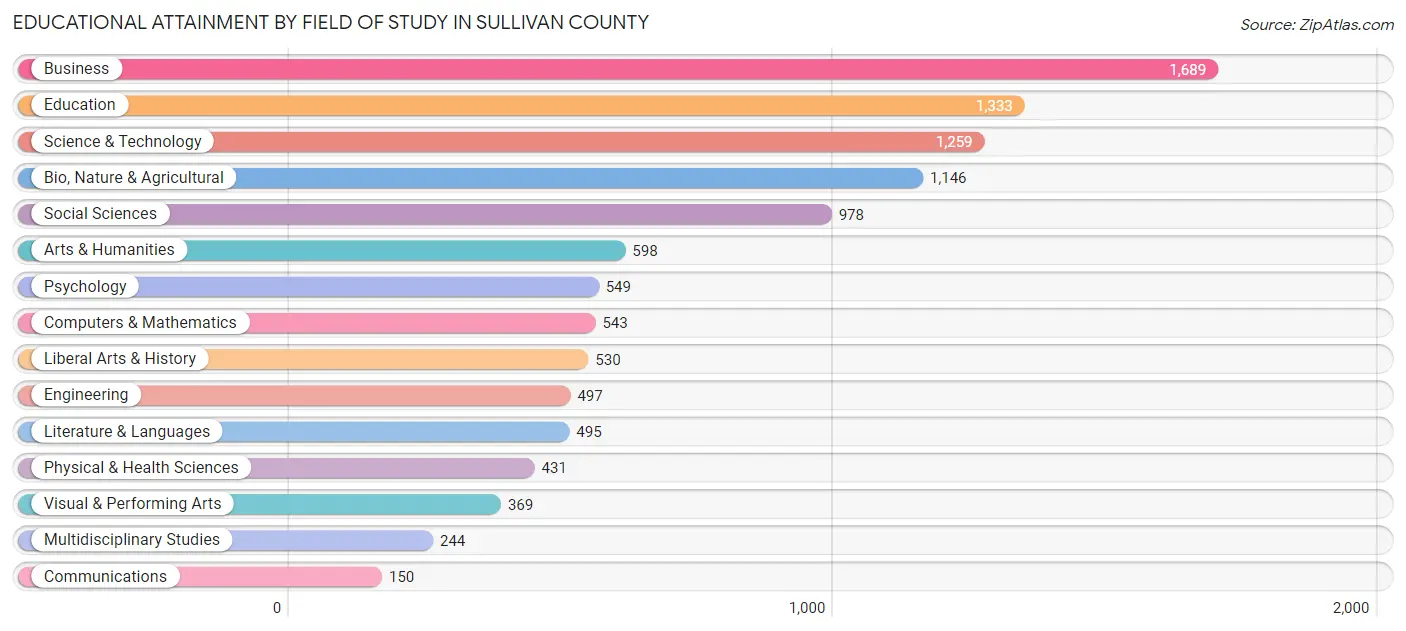
| Field of Study | # Graduates | % Graduates |
| Computers & Mathematics | 543 | 5.0% |
| Bio, Nature & Agricultural | 1,146 | 10.6% |
| Physical & Health Sciences | 431 | 4.0% |
| Psychology | 549 | 5.1% |
| Social Sciences | 978 | 9.0% |
| Engineering | 497 | 4.6% |
| Multidisciplinary Studies | 244 | 2.3% |
| Science & Technology | 1,259 | 11.7% |
| Business | 1,689 | 15.6% |
| Education | 1,333 | 12.3% |
| Literature & Languages | 495 | 4.6% |
| Liberal Arts & History | 530 | 4.9% |
| Visual & Performing Arts | 369 | 3.4% |
| Communications | 150 | 1.4% |
| Arts & Humanities | 598 | 5.5% |
| Total | 10,811 | 100.0% |
Transportation & Commute in Sullivan County
Vehicle Availability by Sex in Sullivan County
The most prevalent vehicle ownership categories in Sullivan County are males with 2 vehicles (4,494, accounting for 43.8%) and females with 2 vehicles (4,282, making up 47.4%).
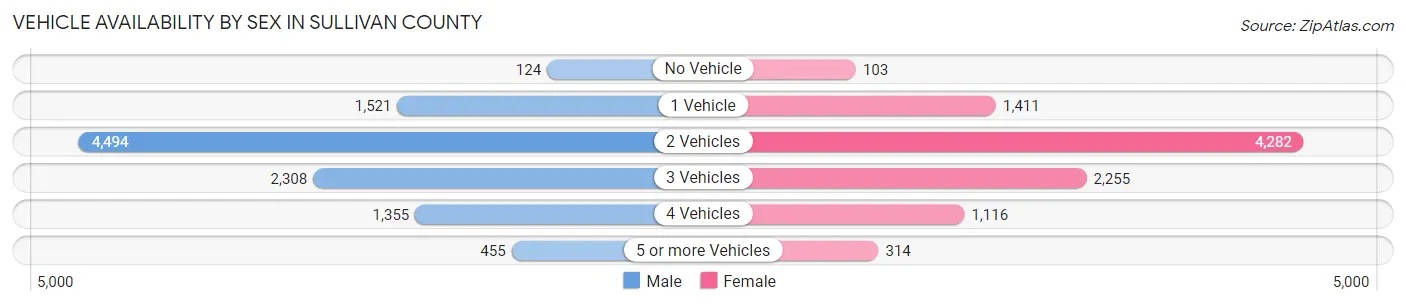
| Vehicles Available | Male | Female |
| No Vehicle | 124 (1.2%) | 103 (1.1%) |
| 1 Vehicle | 1,521 (14.8%) | 1,411 (14.9%) |
| 2 Vehicles | 4,494 (43.8%) | 4,282 (45.2%) |
| 3 Vehicles | 2,308 (22.5%) | 2,255 (23.8%) |
| 4 Vehicles | 1,355 (13.2%) | 1,116 (11.8%) |
| 5 or more Vehicles | 455 (4.4%) | 314 (3.3%) |
| Total | 10,257 (100.0%) | 9,481 (100.0%) |
Commute Time in Sullivan County
The most frequently occuring commute durations in Sullivan County are 30 to 34 minutes (2,524 commuters, 13.9%), 20 to 24 minutes (2,387 commuters, 13.1%), and 5 to 9 minutes (2,288 commuters, 12.6%).
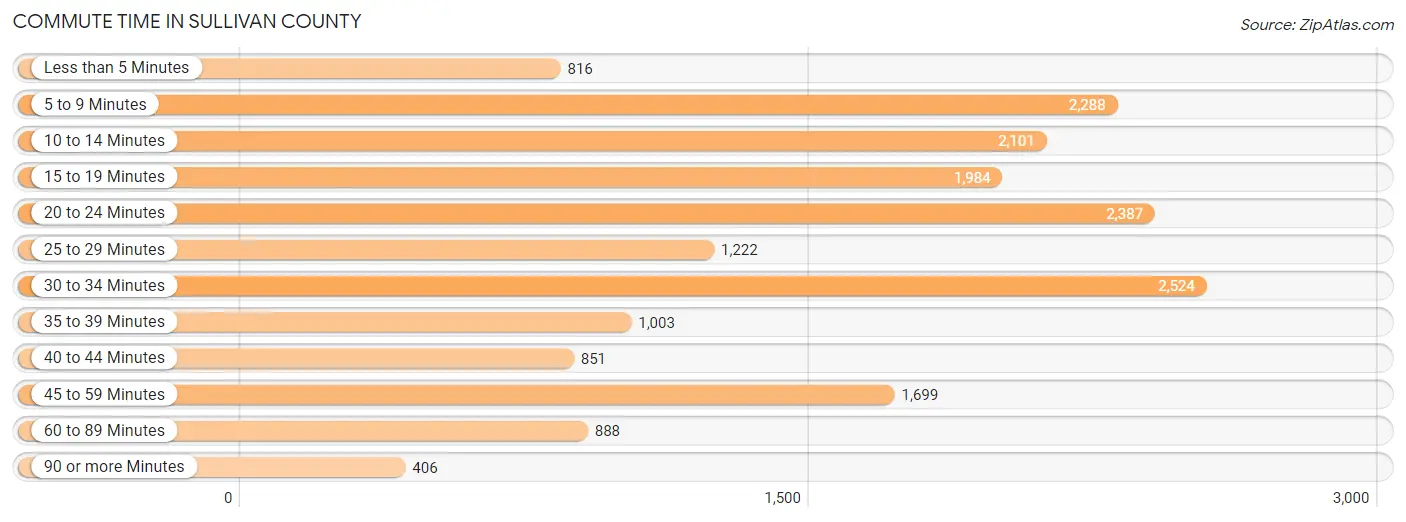
| Commute Time | # Commuters | % Commuters |
| Less than 5 Minutes | 816 | 4.5% |
| 5 to 9 Minutes | 2,288 | 12.6% |
| 10 to 14 Minutes | 2,101 | 11.6% |
| 15 to 19 Minutes | 1,984 | 10.9% |
| 20 to 24 Minutes | 2,387 | 13.1% |
| 25 to 29 Minutes | 1,222 | 6.7% |
| 30 to 34 Minutes | 2,524 | 13.9% |
| 35 to 39 Minutes | 1,003 | 5.5% |
| 40 to 44 Minutes | 851 | 4.7% |
| 45 to 59 Minutes | 1,699 | 9.3% |
| 60 to 89 Minutes | 888 | 4.9% |
| 90 or more Minutes | 406 | 2.2% |
Commute Time by Sex in Sullivan County
The most common commute times in Sullivan County are 30 to 34 minutes (1,436 commuters, 15.3%) for males and 20 to 24 minutes (1,349 commuters, 15.4%) for females.
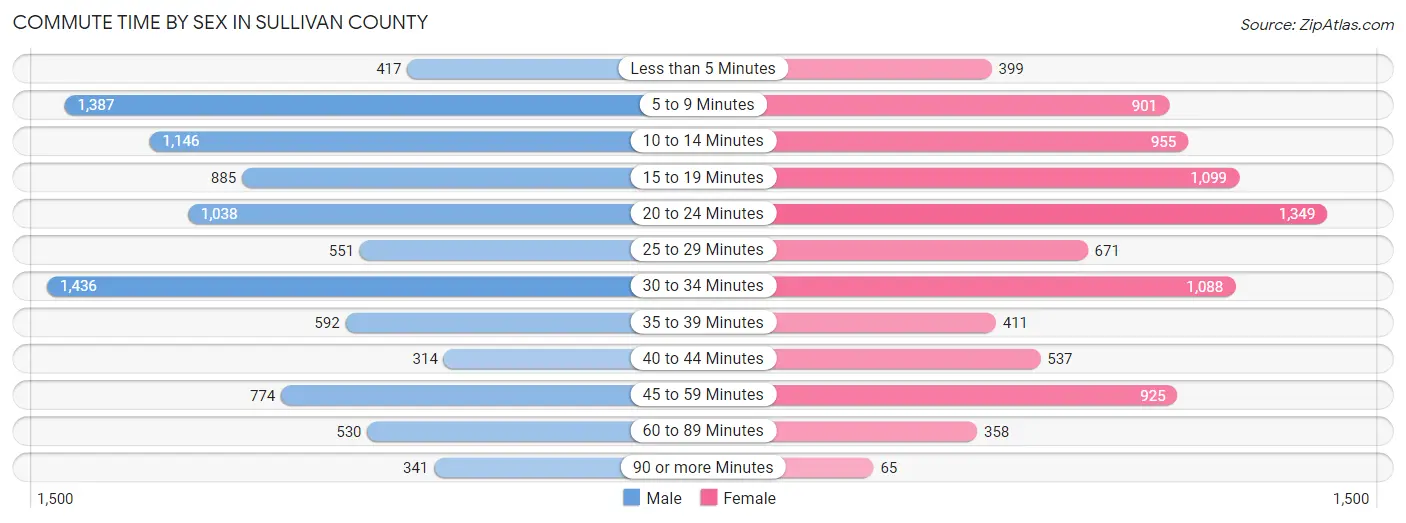
| Commute Time | Male | Female |
| Less than 5 Minutes | 417 (4.4%) | 399 (4.6%) |
| 5 to 9 Minutes | 1,387 (14.7%) | 901 (10.3%) |
| 10 to 14 Minutes | 1,146 (12.2%) | 955 (10.9%) |
| 15 to 19 Minutes | 885 (9.4%) | 1,099 (12.6%) |
| 20 to 24 Minutes | 1,038 (11.0%) | 1,349 (15.4%) |
| 25 to 29 Minutes | 551 (5.9%) | 671 (7.7%) |
| 30 to 34 Minutes | 1,436 (15.3%) | 1,088 (12.4%) |
| 35 to 39 Minutes | 592 (6.3%) | 411 (4.7%) |
| 40 to 44 Minutes | 314 (3.3%) | 537 (6.1%) |
| 45 to 59 Minutes | 774 (8.2%) | 925 (10.6%) |
| 60 to 89 Minutes | 530 (5.6%) | 358 (4.1%) |
| 90 or more Minutes | 341 (3.6%) | 65 (0.7%) |
Time of Departure to Work by Sex in Sullivan County
The most frequent times of departure to work in Sullivan County are 7:00 AM to 7:29 AM (1,585, 16.8%) for males and 7:00 AM to 7:29 AM (1,829, 20.9%) for females.
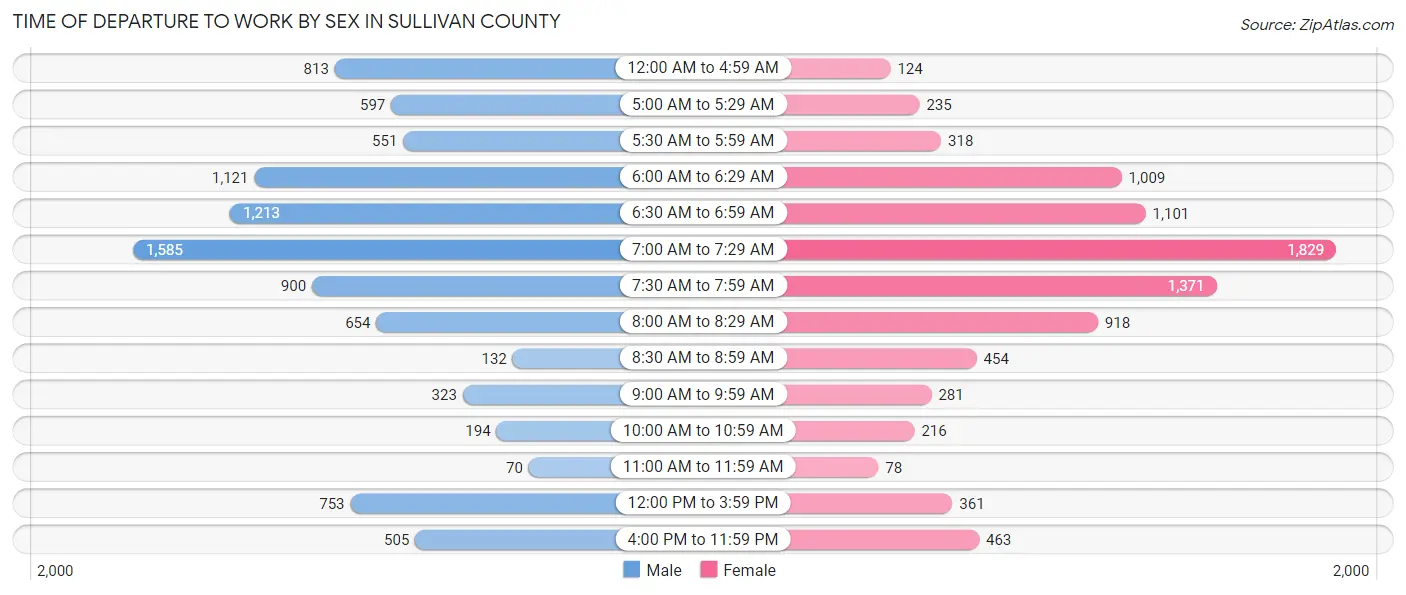
| Time of Departure | Male | Female |
| 12:00 AM to 4:59 AM | 813 (8.6%) | 124 (1.4%) |
| 5:00 AM to 5:29 AM | 597 (6.3%) | 235 (2.7%) |
| 5:30 AM to 5:59 AM | 551 (5.9%) | 318 (3.6%) |
| 6:00 AM to 6:29 AM | 1,121 (11.9%) | 1,009 (11.5%) |
| 6:30 AM to 6:59 AM | 1,213 (12.9%) | 1,101 (12.6%) |
| 7:00 AM to 7:29 AM | 1,585 (16.8%) | 1,829 (20.9%) |
| 7:30 AM to 7:59 AM | 900 (9.6%) | 1,371 (15.7%) |
| 8:00 AM to 8:29 AM | 654 (7.0%) | 918 (10.5%) |
| 8:30 AM to 8:59 AM | 132 (1.4%) | 454 (5.2%) |
| 9:00 AM to 9:59 AM | 323 (3.4%) | 281 (3.2%) |
| 10:00 AM to 10:59 AM | 194 (2.1%) | 216 (2.5%) |
| 11:00 AM to 11:59 AM | 70 (0.7%) | 78 (0.9%) |
| 12:00 PM to 3:59 PM | 753 (8.0%) | 361 (4.1%) |
| 4:00 PM to 11:59 PM | 505 (5.4%) | 463 (5.3%) |
| Total | 9,411 (100.0%) | 8,758 (100.0%) |
Housing Occupancy in Sullivan County
Occupancy by Ownership in Sullivan County
Of the total 15,893 dwellings in Sullivan County, owner-occupied units account for 11,644 (73.3%), while renter-occupied units make up 4,249 (26.7%).
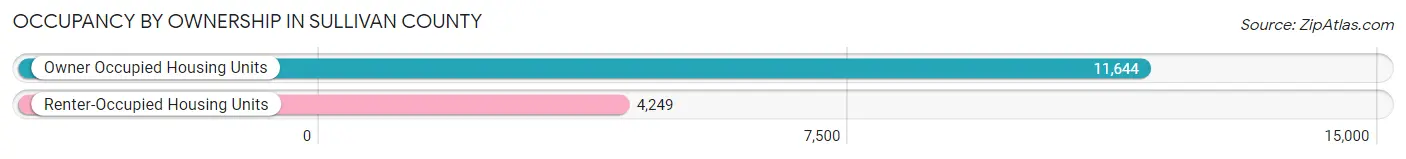
| Occupancy | # Housing Units | % Housing Units |
| Owner Occupied Housing Units | 11,644 | 73.3% |
| Renter-Occupied Housing Units | 4,249 | 26.7% |
| Total Occupied Housing Units | 15,893 | 100.0% |
Occupancy by Household Size in Sullivan County
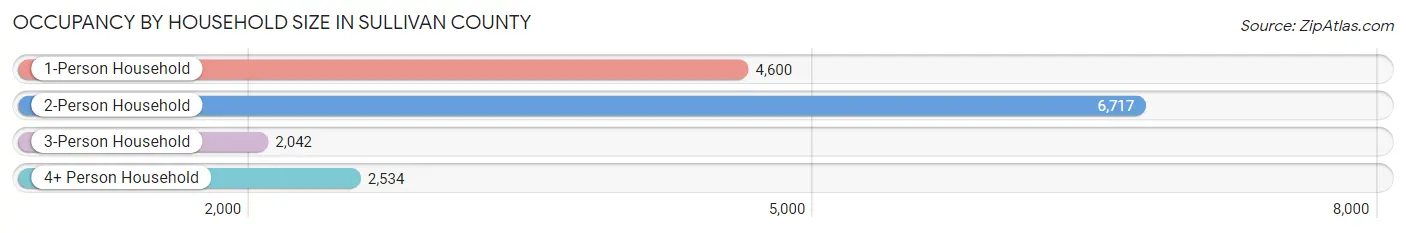
| Household Size | # Housing Units | % Housing Units |
| 1-Person Household | 4,600 | 28.9% |
| 2-Person Household | 6,717 | 42.3% |
| 3-Person Household | 2,042 | 12.9% |
| 4+ Person Household | 2,534 | 15.9% |
| Total Housing Units | 15,893 | 100.0% |
Occupancy by Ownership by Household Size in Sullivan County
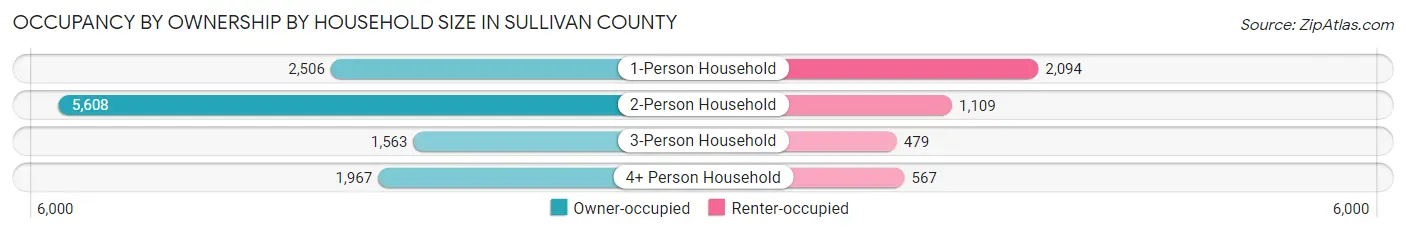
| Household Size | Owner-occupied | Renter-occupied |
| 1-Person Household | 2,506 (54.5%) | 2,094 (45.5%) |
| 2-Person Household | 5,608 (83.5%) | 1,109 (16.5%) |
| 3-Person Household | 1,563 (76.5%) | 479 (23.5%) |
| 4+ Person Household | 1,967 (77.6%) | 567 (22.4%) |
| Total Housing Units | 11,644 (73.3%) | 4,249 (26.7%) |
Occupancy by Educational Attainment in Sullivan County
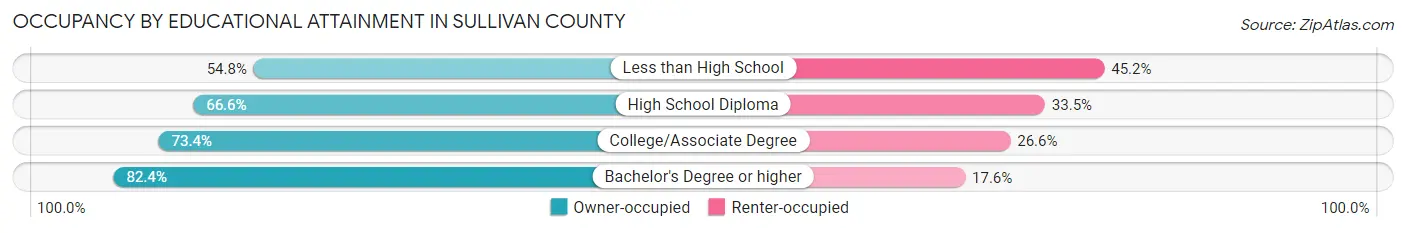
| Household Size | Owner-occupied | Renter-occupied |
| Less than High School | 471 (54.8%) | 389 (45.2%) |
| High School Diploma | 3,406 (66.5%) | 1,712 (33.5%) |
| College/Associate Degree | 3,277 (73.4%) | 1,187 (26.6%) |
| Bachelor's Degree or higher | 4,490 (82.4%) | 961 (17.6%) |
Occupancy by Age of Householder in Sullivan County
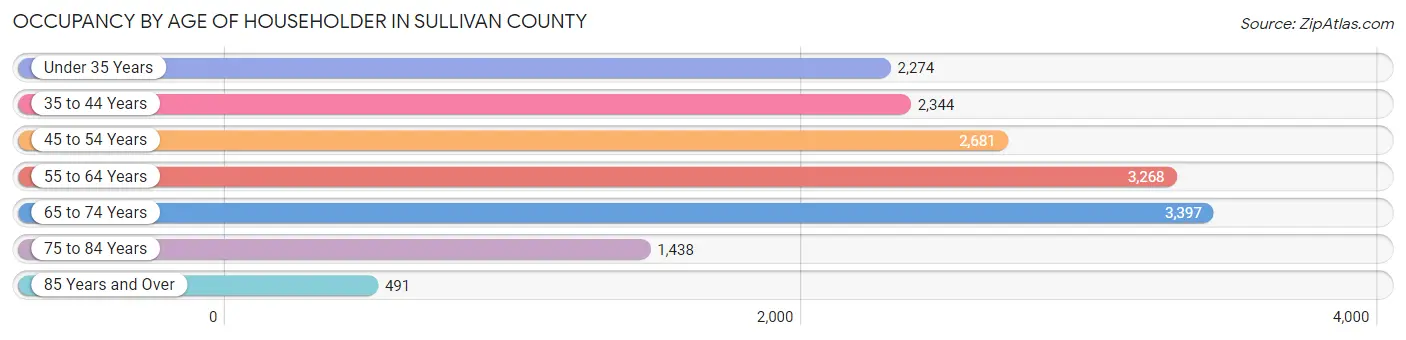
| Age Bracket | # Households | % Households |
| Under 35 Years | 2,274 | 14.3% |
| 35 to 44 Years | 2,344 | 14.7% |
| 45 to 54 Years | 2,681 | 16.9% |
| 55 to 64 Years | 3,268 | 20.6% |
| 65 to 74 Years | 3,397 | 21.4% |
| 75 to 84 Years | 1,438 | 9.0% |
| 85 Years and Over | 491 | 3.1% |
| Total | 15,893 | 100.0% |
Housing Finances in Sullivan County
Median Income by Occupancy in Sullivan County
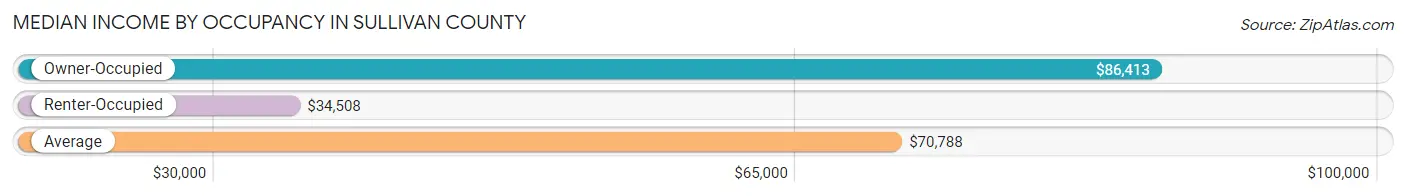
| Occupancy Type | # Households | Median Income |
| Owner-Occupied | 11,644 (73.3%) | $86,413 |
| Renter-Occupied | 4,249 (26.7%) | $34,508 |
| Average | 15,893 (100.0%) | $70,788 |
Occupancy by Householder Income Bracket in Sullivan County
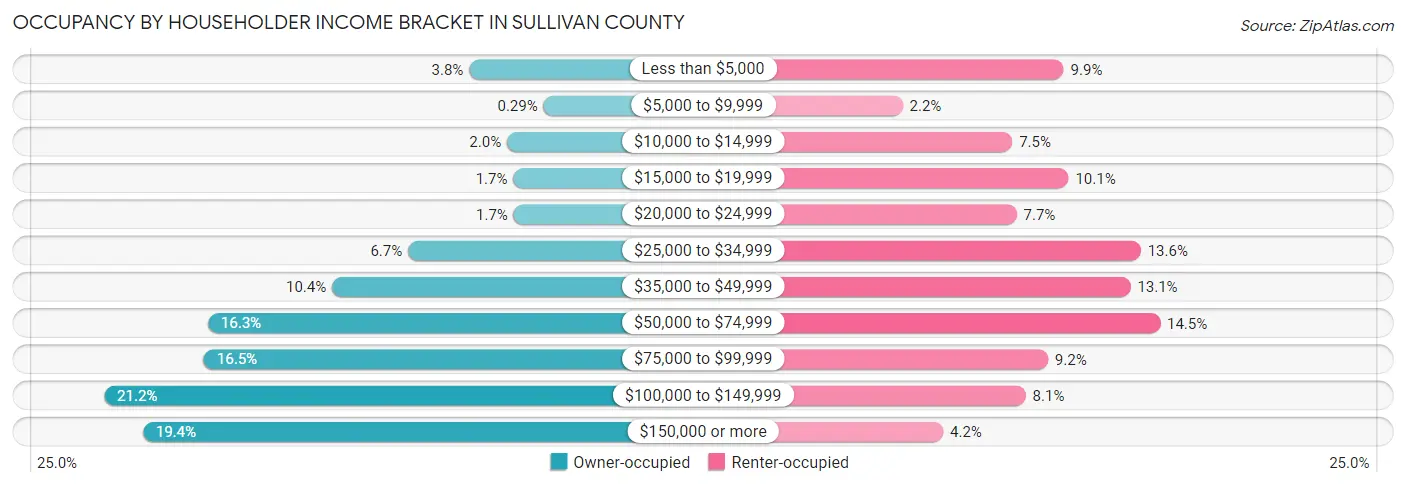
| Income Bracket | Owner-occupied | Renter-occupied |
| Less than $5,000 | 446 (3.8%) | 421 (9.9%) |
| $5,000 to $9,999 | 34 (0.3%) | 95 (2.2%) |
| $10,000 to $14,999 | 236 (2.0%) | 317 (7.5%) |
| $15,000 to $19,999 | 201 (1.7%) | 431 (10.1%) |
| $20,000 to $24,999 | 199 (1.7%) | 326 (7.7%) |
| $25,000 to $34,999 | 785 (6.7%) | 577 (13.6%) |
| $35,000 to $49,999 | 1,206 (10.4%) | 556 (13.1%) |
| $50,000 to $74,999 | 1,895 (16.3%) | 616 (14.5%) |
| $75,000 to $99,999 | 1,917 (16.5%) | 389 (9.2%) |
| $100,000 to $149,999 | 2,470 (21.2%) | 344 (8.1%) |
| $150,000 or more | 2,255 (19.4%) | 177 (4.2%) |
| Total | 11,644 (100.0%) | 4,249 (100.0%) |
Monthly Housing Cost Tiers in Sullivan County
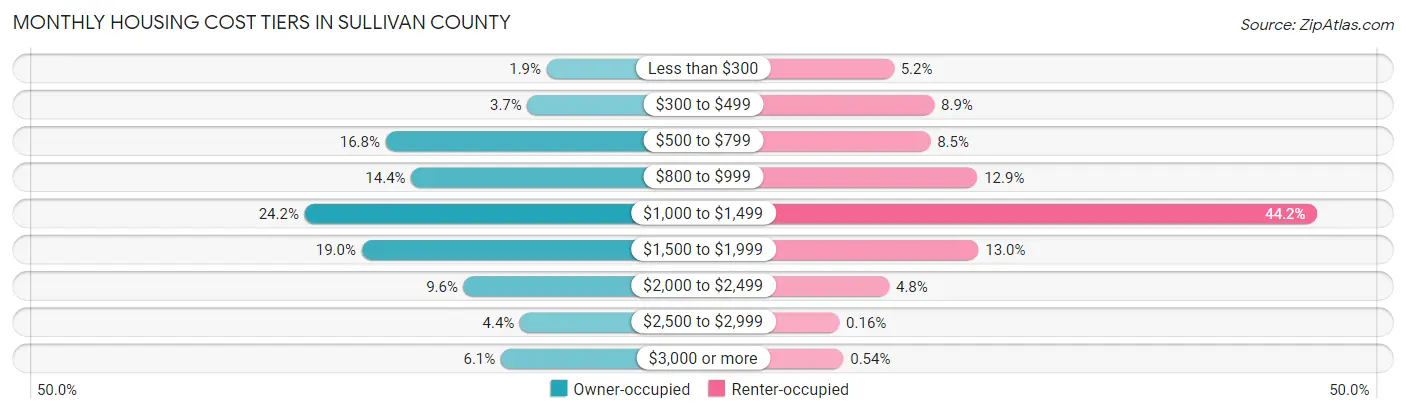
| Monthly Cost | Owner-occupied | Renter-occupied |
| Less than $300 | 223 (1.9%) | 220 (5.2%) |
| $300 to $499 | 430 (3.7%) | 378 (8.9%) |
| $500 to $799 | 1,950 (16.8%) | 363 (8.5%) |
| $800 to $999 | 1,676 (14.4%) | 547 (12.9%) |
| $1,000 to $1,499 | 2,819 (24.2%) | 1,877 (44.2%) |
| $1,500 to $1,999 | 2,208 (19.0%) | 551 (13.0%) |
| $2,000 to $2,499 | 1,114 (9.6%) | 202 (4.8%) |
| $2,500 to $2,999 | 510 (4.4%) | 7 (0.2%) |
| $3,000 or more | 714 (6.1%) | 23 (0.5%) |
| Total | 11,644 (100.0%) | 4,249 (100.0%) |
Physical Housing Characteristics in Sullivan County
Housing Structures in Sullivan County
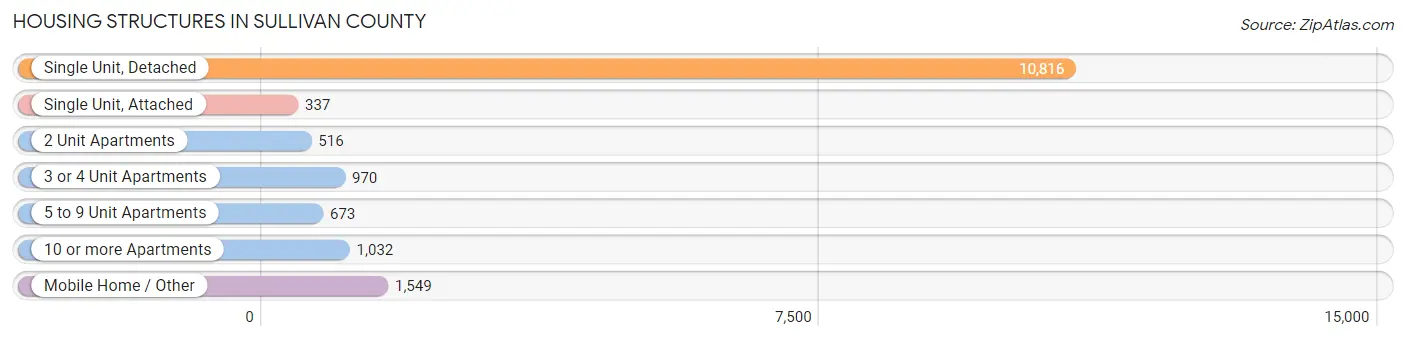
| Structure Type | # Housing Units | % Housing Units |
| Single Unit, Detached | 10,816 | 68.1% |
| Single Unit, Attached | 337 | 2.1% |
| 2 Unit Apartments | 516 | 3.3% |
| 3 or 4 Unit Apartments | 970 | 6.1% |
| 5 to 9 Unit Apartments | 673 | 4.2% |
| 10 or more Apartments | 1,032 | 6.5% |
| Mobile Home / Other | 1,549 | 9.8% |
| Total | 15,893 | 100.0% |
Housing Structures by Occupancy in Sullivan County
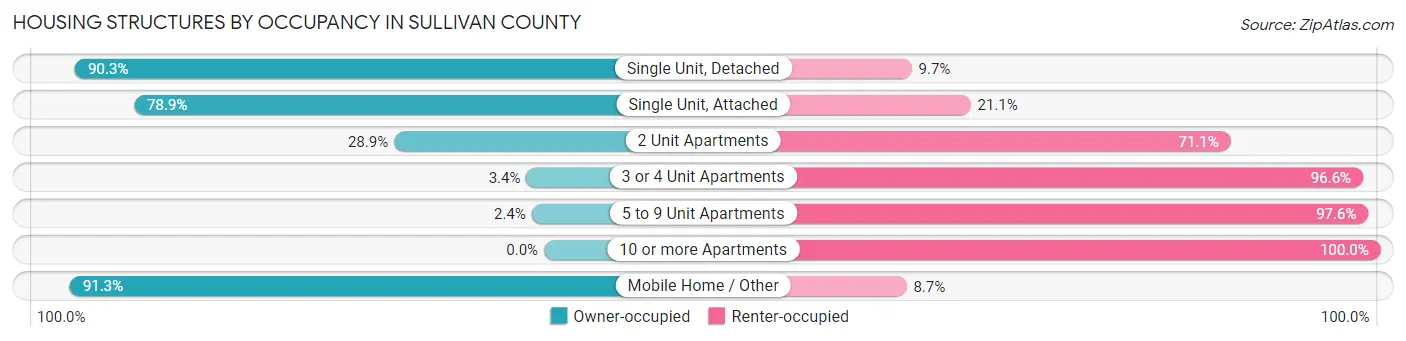
| Structure Type | Owner-occupied | Renter-occupied |
| Single Unit, Detached | 9,766 (90.3%) | 1,050 (9.7%) |
| Single Unit, Attached | 266 (78.9%) | 71 (21.1%) |
| 2 Unit Apartments | 149 (28.9%) | 367 (71.1%) |
| 3 or 4 Unit Apartments | 33 (3.4%) | 937 (96.6%) |
| 5 to 9 Unit Apartments | 16 (2.4%) | 657 (97.6%) |
| 10 or more Apartments | 0 (0.0%) | 1,032 (100.0%) |
| Mobile Home / Other | 1,414 (91.3%) | 135 (8.7%) |
| Total | 11,644 (73.3%) | 4,249 (26.7%) |
Housing Structures by Number of Rooms in Sullivan County
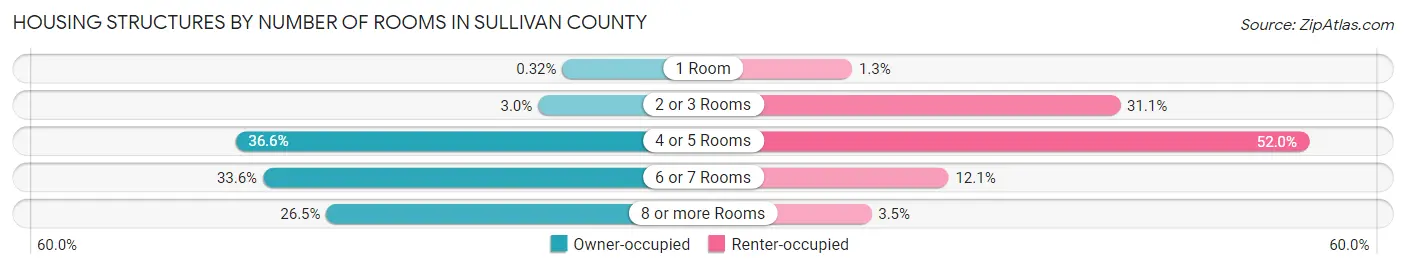
| Number of Rooms | Owner-occupied | Renter-occupied |
| 1 Room | 37 (0.3%) | 57 (1.3%) |
| 2 or 3 Rooms | 351 (3.0%) | 1,321 (31.1%) |
| 4 or 5 Rooms | 4,263 (36.6%) | 2,211 (52.0%) |
| 6 or 7 Rooms | 3,906 (33.6%) | 512 (12.0%) |
| 8 or more Rooms | 3,087 (26.5%) | 148 (3.5%) |
| Total | 11,644 (100.0%) | 4,249 (100.0%) |
Housing Structure by Heating Type in Sullivan County
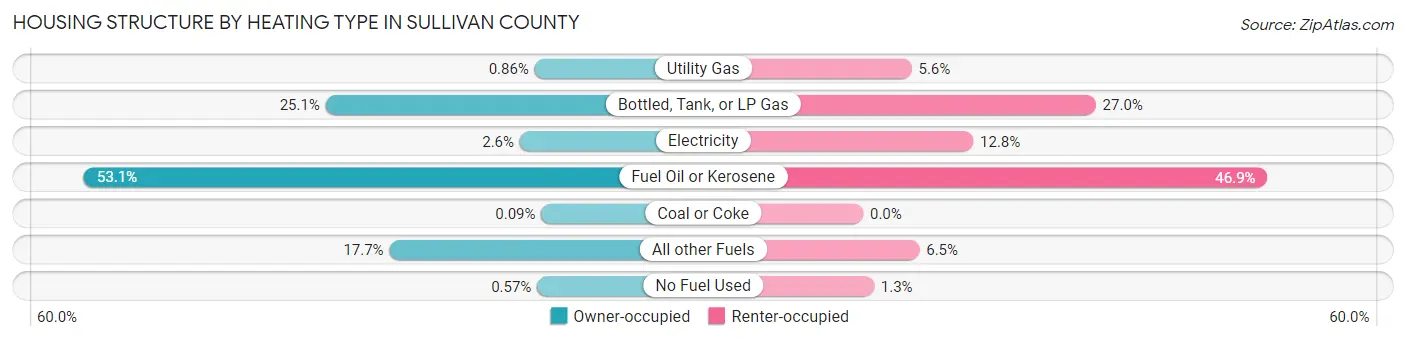
| Heating Type | Owner-occupied | Renter-occupied |
| Utility Gas | 100 (0.9%) | 239 (5.6%) |
| Bottled, Tank, or LP Gas | 2,921 (25.1%) | 1,146 (27.0%) |
| Electricity | 300 (2.6%) | 542 (12.8%) |
| Fuel Oil or Kerosene | 6,185 (53.1%) | 1,992 (46.9%) |
| Coal or Coke | 11 (0.1%) | 0 (0.0%) |
| All other Fuels | 2,061 (17.7%) | 277 (6.5%) |
| No Fuel Used | 66 (0.6%) | 53 (1.3%) |
| Total | 11,644 (100.0%) | 4,249 (100.0%) |
Household Vehicle Usage in Sullivan County
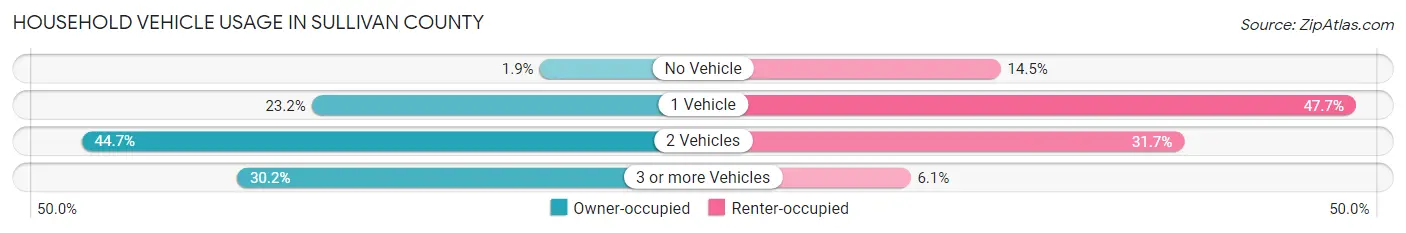
| Vehicles per Household | Owner-occupied | Renter-occupied |
| No Vehicle | 226 (1.9%) | 618 (14.5%) |
| 1 Vehicle | 2,704 (23.2%) | 2,026 (47.7%) |
| 2 Vehicles | 5,201 (44.7%) | 1,345 (31.7%) |
| 3 or more Vehicles | 3,513 (30.2%) | 260 (6.1%) |
| Total | 11,644 (100.0%) | 4,249 (100.0%) |
Real Estate & Mortgages in Sullivan County
Real Estate and Mortgage Overview in Sullivan County
| Characteristic | Without Mortgage | With Mortgage |
| Housing Units | 5,244 | 6,400 |
| Median Property Value | $205,200 | $216,000 |
| Median Household Income | $63,145 | $1,481 |
| Monthly Housing Costs | $833 | $705 |
| Real Estate Taxes | $5,427 | $142 |
Property Value by Mortgage Status in Sullivan County
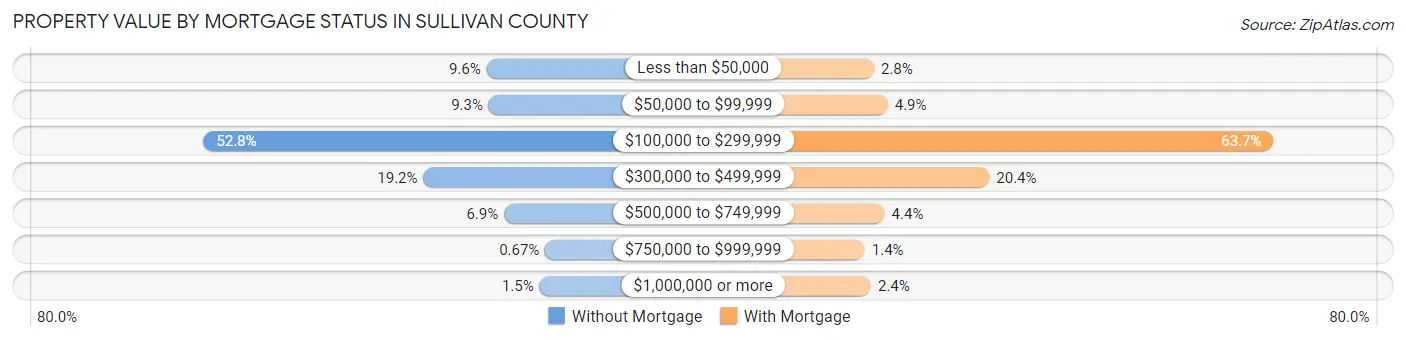
| Property Value | Without Mortgage | With Mortgage |
| Less than $50,000 | 504 (9.6%) | 180 (2.8%) |
| $50,000 to $99,999 | 486 (9.3%) | 314 (4.9%) |
| $100,000 to $299,999 | 2,766 (52.7%) | 4,075 (63.7%) |
| $300,000 to $499,999 | 1,009 (19.2%) | 1,305 (20.4%) |
| $500,000 to $749,999 | 364 (6.9%) | 284 (4.4%) |
| $750,000 to $999,999 | 35 (0.7%) | 91 (1.4%) |
| $1,000,000 or more | 80 (1.5%) | 151 (2.4%) |
| Total | 5,244 (100.0%) | 6,400 (100.0%) |
Household Income by Mortgage Status in Sullivan County
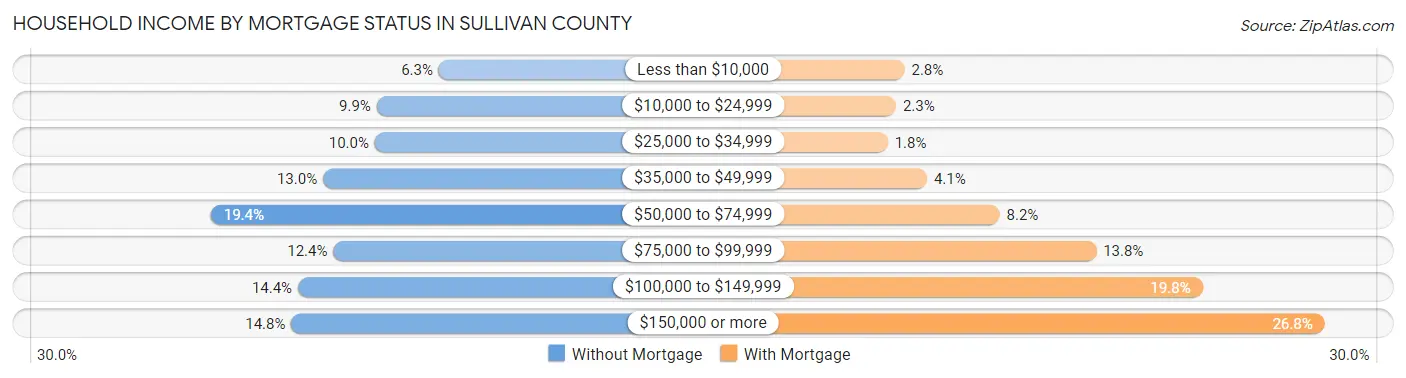
| Household Income | Without Mortgage | With Mortgage |
| Less than $10,000 | 332 (6.3%) | 179 (2.8%) |
| $10,000 to $24,999 | 518 (9.9%) | 148 (2.3%) |
| $25,000 to $34,999 | 524 (10.0%) | 118 (1.8%) |
| $35,000 to $49,999 | 679 (13.0%) | 261 (4.1%) |
| $50,000 to $74,999 | 1,015 (19.4%) | 527 (8.2%) |
| $75,000 to $99,999 | 648 (12.4%) | 880 (13.8%) |
| $100,000 to $149,999 | 754 (14.4%) | 1,269 (19.8%) |
| $150,000 or more | 774 (14.8%) | 1,716 (26.8%) |
| Total | 5,244 (100.0%) | 6,400 (100.0%) |
Property Value to Household Income Ratio in Sullivan County
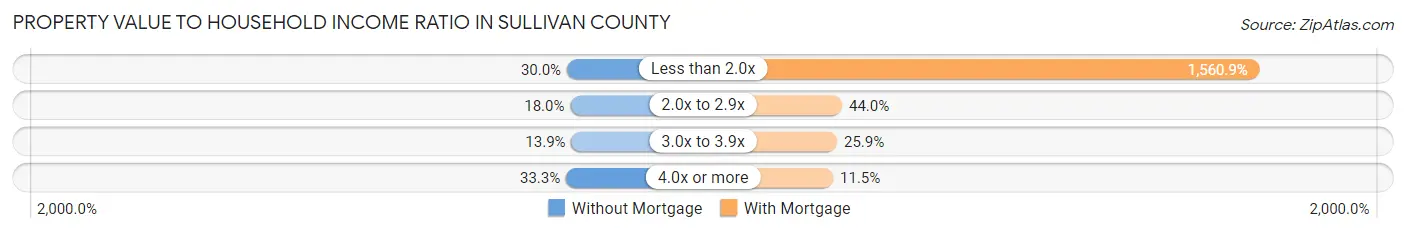
| Value-to-Income Ratio | Without Mortgage | With Mortgage |
| Less than 2.0x | 1,575 (30.0%) | 99,897 (1,560.9%) |
| 2.0x to 2.9x | 944 (18.0%) | 2,815 (44.0%) |
| 3.0x to 3.9x | 729 (13.9%) | 1,655 (25.9%) |
| 4.0x or more | 1,745 (33.3%) | 738 (11.5%) |
| Total | 5,244 (100.0%) | 6,400 (100.0%) |
Real Estate Taxes by Mortgage Status in Sullivan County
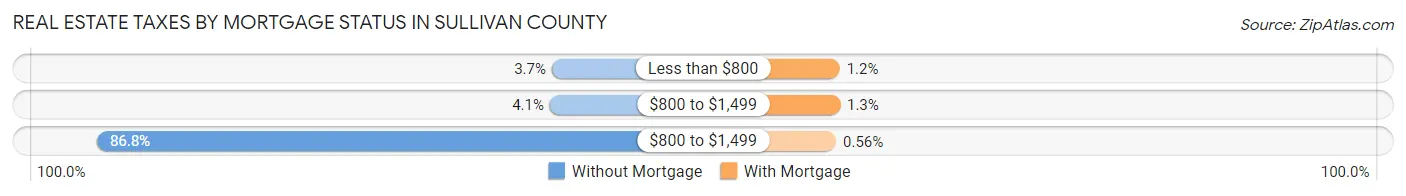
| Property Taxes | Without Mortgage | With Mortgage |
| Less than $800 | 194 (3.7%) | 78 (1.2%) |
| $800 to $1,499 | 214 (4.1%) | 82 (1.3%) |
| $800 to $1,499 | 4,551 (86.8%) | 36 (0.6%) |
| Total | 5,244 (100.0%) | 6,400 (100.0%) |
Health & Disability in Sullivan County
Health Insurance Coverage by Age in Sullivan County
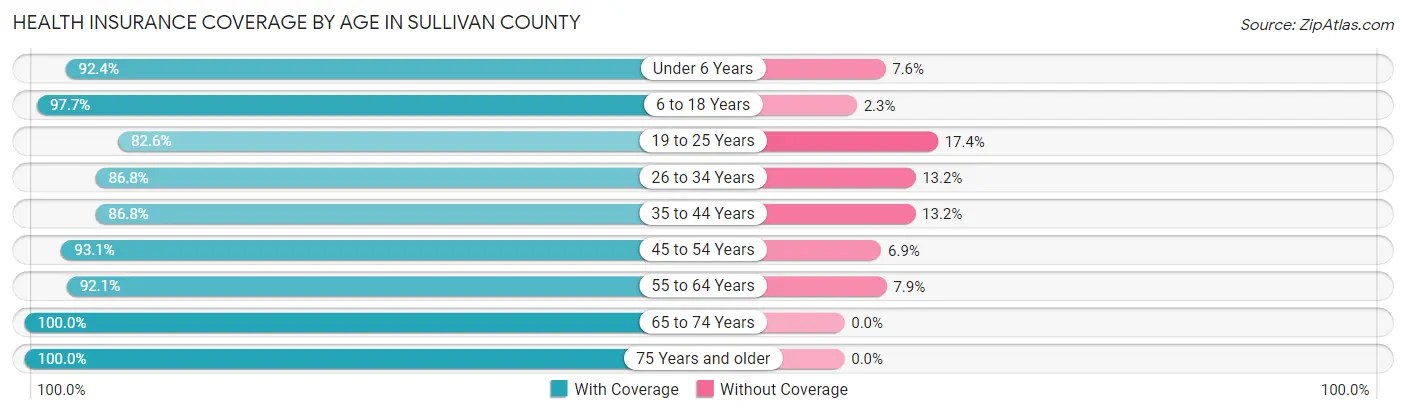
| Age Bracket | With Coverage | Without Coverage |
| Under 6 Years | 2,211 (92.4%) | 183 (7.6%) |
| 6 to 18 Years | 5,543 (97.7%) | 131 (2.3%) |
| 19 to 25 Years | 2,488 (82.6%) | 525 (17.4%) |
| 26 to 34 Years | 4,135 (86.8%) | 630 (13.2%) |
| 35 to 44 Years | 4,075 (86.8%) | 620 (13.2%) |
| 45 to 54 Years | 5,255 (93.1%) | 387 (6.9%) |
| 55 to 64 Years | 6,545 (92.1%) | 558 (7.9%) |
| 65 to 74 Years | 6,045 (100.0%) | 0 (0.0%) |
| 75 Years and older | 3,543 (100.0%) | 0 (0.0%) |
| Total | 39,840 (92.9%) | 3,034 (7.1%) |
Health Insurance Coverage by Citizenship Status in Sullivan County
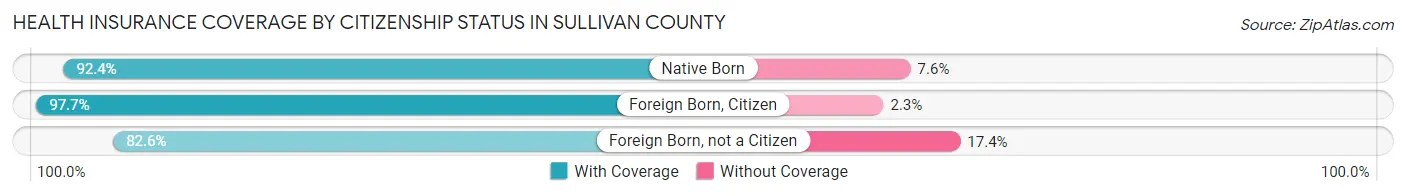
| Citizenship Status | With Coverage | Without Coverage |
| Native Born | 2,211 (92.4%) | 183 (7.6%) |
| Foreign Born, Citizen | 5,543 (97.7%) | 131 (2.3%) |
| Foreign Born, not a Citizen | 2,488 (82.6%) | 525 (17.4%) |
Health Insurance Coverage by Household Income in Sullivan County
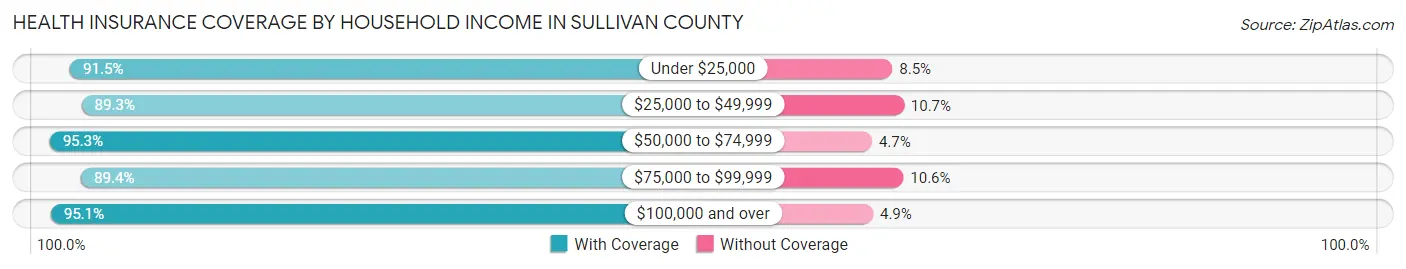
| Household Income | With Coverage | Without Coverage |
| Under $25,000 | 3,896 (91.5%) | 364 (8.5%) |
| $25,000 to $49,999 | 6,079 (89.3%) | 728 (10.7%) |
| $50,000 to $74,999 | 6,579 (95.3%) | 326 (4.7%) |
| $75,000 to $99,999 | 6,115 (89.4%) | 725 (10.6%) |
| $100,000 and over | 16,857 (95.1%) | 873 (4.9%) |
Public vs Private Health Insurance Coverage by Age in Sullivan County
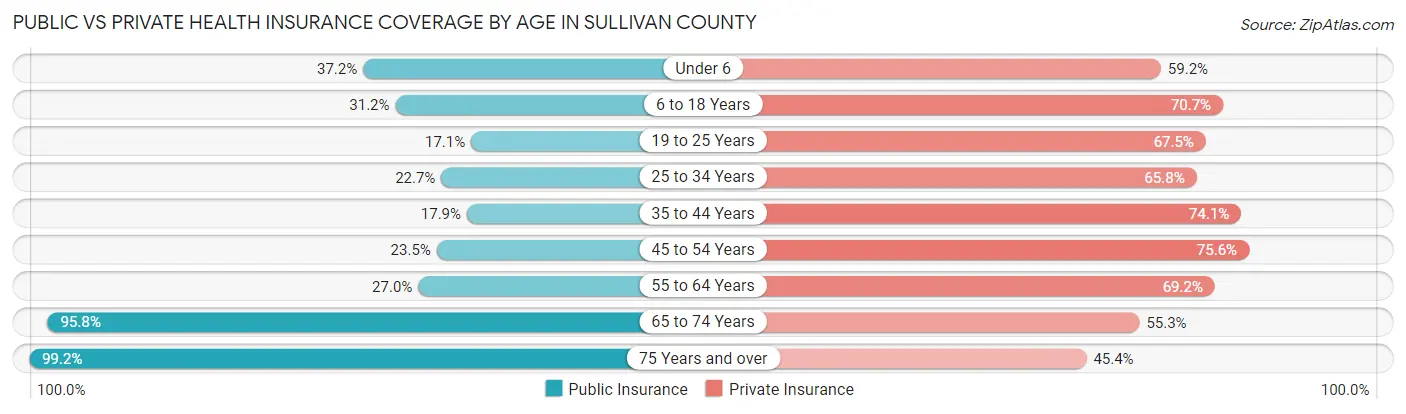
| Age Bracket | Public Insurance | Private Insurance |
| Under 6 | 890 (37.2%) | 1,418 (59.2%) |
| 6 to 18 Years | 1,769 (31.2%) | 4,014 (70.7%) |
| 19 to 25 Years | 516 (17.1%) | 2,035 (67.5%) |
| 25 to 34 Years | 1,080 (22.7%) | 3,137 (65.8%) |
| 35 to 44 Years | 841 (17.9%) | 3,480 (74.1%) |
| 45 to 54 Years | 1,327 (23.5%) | 4,263 (75.6%) |
| 55 to 64 Years | 1,914 (27.0%) | 4,917 (69.2%) |
| 65 to 74 Years | 5,788 (95.8%) | 3,340 (55.2%) |
| 75 Years and over | 3,514 (99.2%) | 1,609 (45.4%) |
| Total | 17,639 (41.1%) | 28,213 (65.8%) |
Disability Status by Sex by Age in Sullivan County
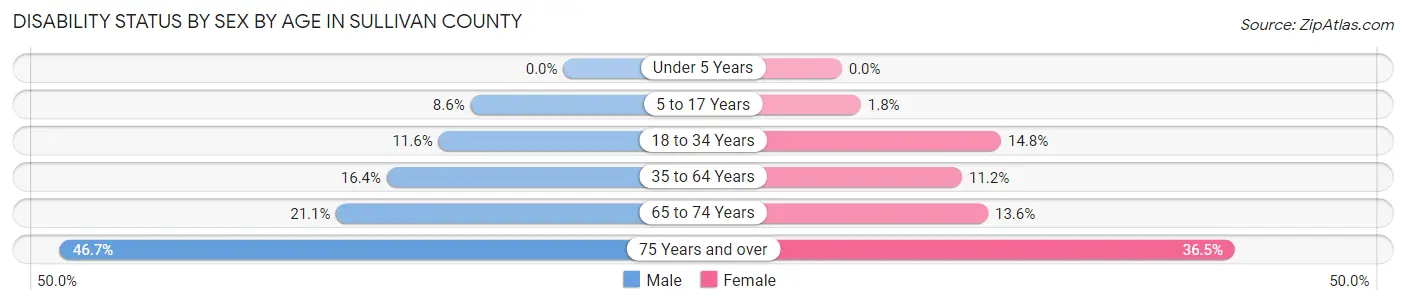
| Age Bracket | Male | Female |
| Under 5 Years | 0 (0.0%) | 0 (0.0%) |
| 5 to 17 Years | 261 (8.6%) | 49 (1.8%) |
| 18 to 34 Years | 518 (11.6%) | 546 (14.8%) |
| 35 to 64 Years | 1,419 (16.4%) | 980 (11.2%) |
| 65 to 74 Years | 634 (21.1%) | 412 (13.6%) |
| 75 Years and over | 733 (46.7%) | 720 (36.5%) |
Disability Class by Sex by Age in Sullivan County
Disability Class: Hearing Difficulty
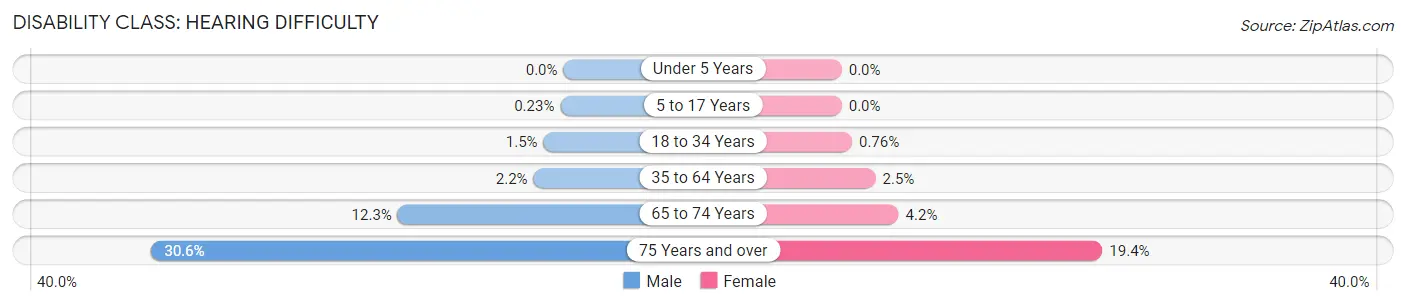
| Age Bracket | Male | Female |
| Under 5 Years | 0 (0.0%) | 0 (0.0%) |
| 5 to 17 Years | 7 (0.2%) | 0 (0.0%) |
| 18 to 34 Years | 66 (1.5%) | 28 (0.8%) |
| 35 to 64 Years | 192 (2.2%) | 220 (2.5%) |
| 65 to 74 Years | 370 (12.3%) | 128 (4.2%) |
| 75 Years and over | 480 (30.6%) | 382 (19.4%) |
Disability Class: Vision Difficulty
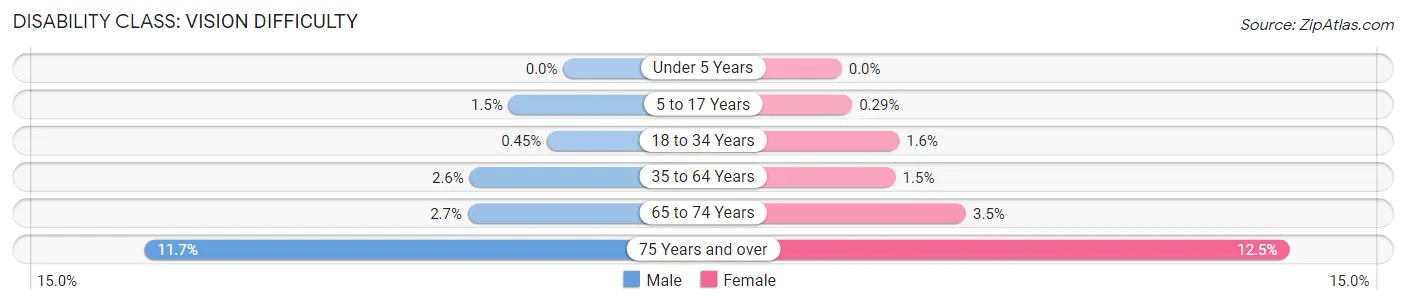
| Age Bracket | Male | Female |
| Under 5 Years | 0 (0.0%) | 0 (0.0%) |
| 5 to 17 Years | 46 (1.5%) | 8 (0.3%) |
| 18 to 34 Years | 20 (0.4%) | 59 (1.6%) |
| 35 to 64 Years | 226 (2.6%) | 132 (1.5%) |
| 65 to 74 Years | 80 (2.7%) | 105 (3.5%) |
| 75 Years and over | 183 (11.7%) | 246 (12.5%) |
Disability Class: Cognitive Difficulty
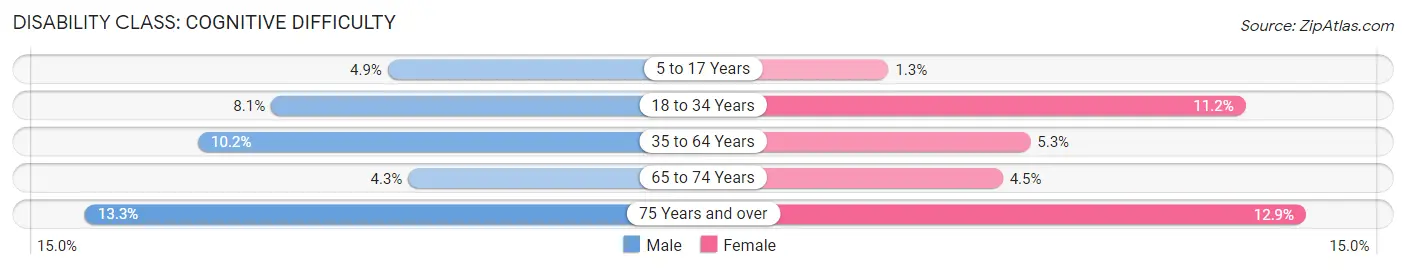
| Age Bracket | Male | Female |
| 5 to 17 Years | 148 (4.9%) | 36 (1.3%) |
| 18 to 34 Years | 364 (8.1%) | 415 (11.2%) |
| 35 to 64 Years | 881 (10.2%) | 461 (5.2%) |
| 65 to 74 Years | 130 (4.3%) | 136 (4.5%) |
| 75 Years and over | 209 (13.3%) | 255 (12.9%) |
Disability Class: Ambulatory Difficulty
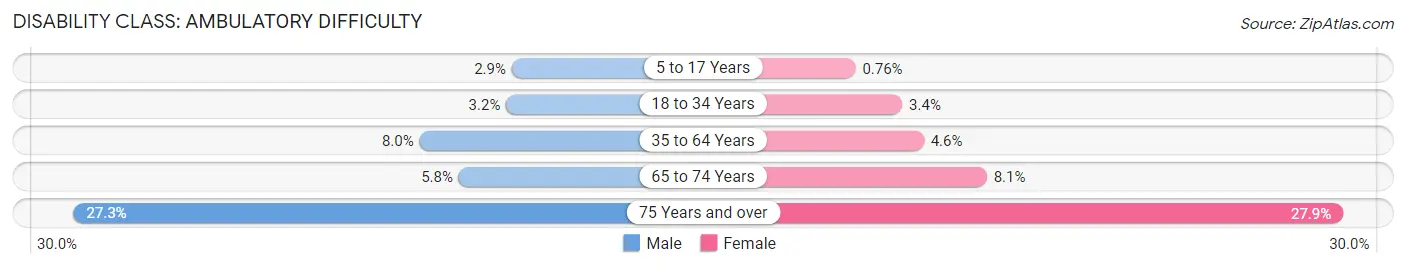
| Age Bracket | Male | Female |
| 5 to 17 Years | 87 (2.9%) | 21 (0.8%) |
| 18 to 34 Years | 142 (3.2%) | 124 (3.4%) |
| 35 to 64 Years | 694 (8.0%) | 400 (4.6%) |
| 65 to 74 Years | 175 (5.8%) | 245 (8.1%) |
| 75 Years and over | 428 (27.3%) | 551 (27.9%) |
Disability Class: Self-Care Difficulty
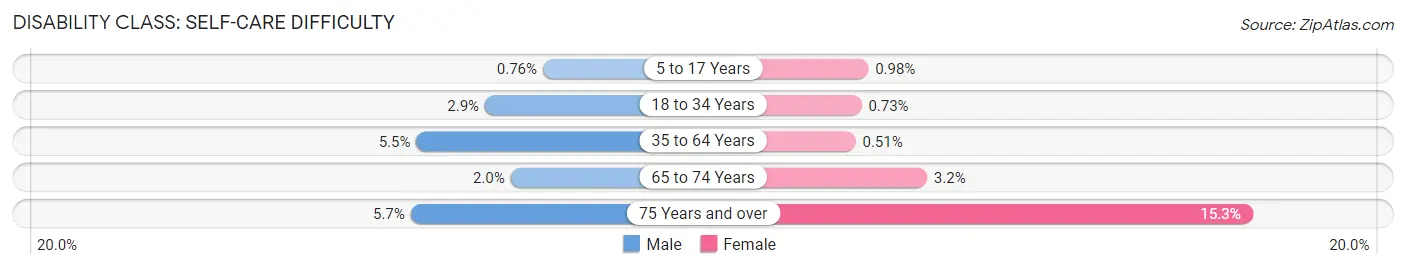
| Age Bracket | Male | Female |
| 5 to 17 Years | 23 (0.8%) | 27 (1.0%) |
| 18 to 34 Years | 130 (2.9%) | 27 (0.7%) |
| 35 to 64 Years | 473 (5.5%) | 45 (0.5%) |
| 65 to 74 Years | 59 (2.0%) | 96 (3.2%) |
| 75 Years and over | 89 (5.7%) | 301 (15.2%) |
Technology Access in Sullivan County
Computing Device Access in Sullivan County
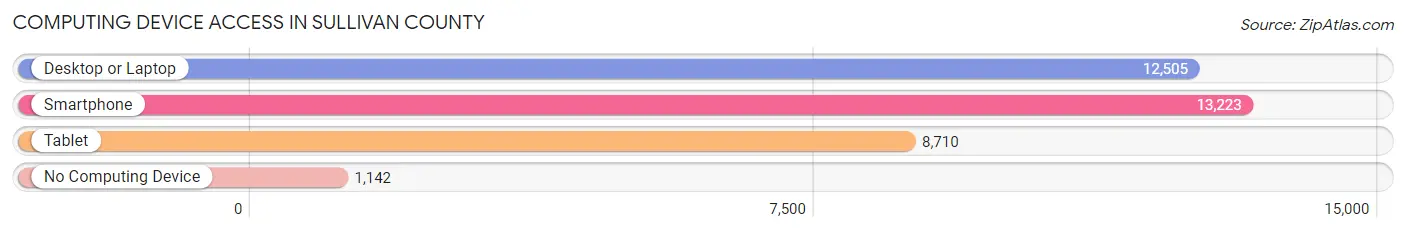
| Device Type | # Households | % Households |
| Desktop or Laptop | 12,505 | 78.7% |
| Smartphone | 13,223 | 83.2% |
| Tablet | 8,710 | 54.8% |
| No Computing Device | 1,142 | 7.2% |
| Total | 15,893 | 100.0% |
Internet Access in Sullivan County
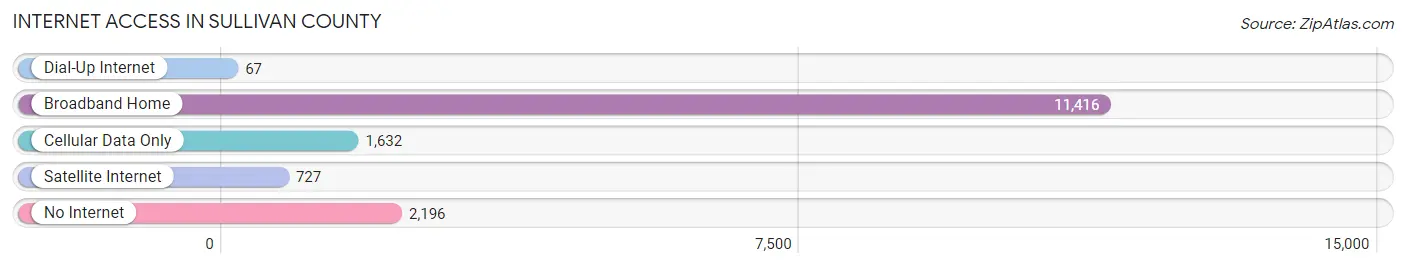
| Internet Type | # Households | % Households |
| Dial-Up Internet | 67 | 0.4% |
| Broadband Home | 11,416 | 71.8% |
| Cellular Data Only | 1,632 | 10.3% |
| Satellite Internet | 727 | 4.6% |
| No Internet | 2,196 | 13.8% |
| Total | 15,893 | 100.0% |
Sullivan County Summary
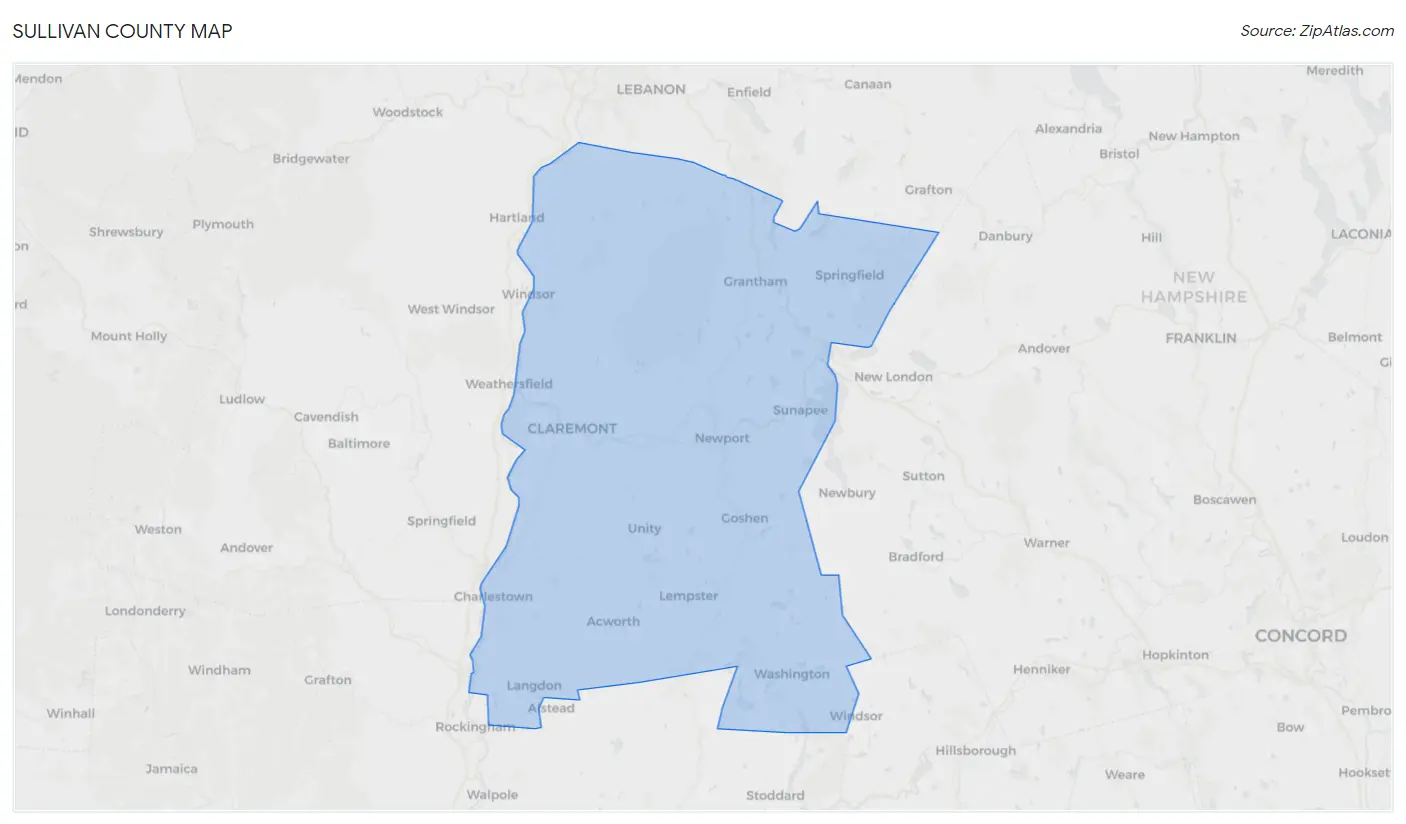
Sullivan County is located in the southwestern corner of New Hampshire, bordered by Vermont to the west and Massachusetts to the south. It is part of the larger New England region and is home to a population of approximately 43,000 people. The county is known for its rural landscape, with rolling hills, forests, and small towns. It is also home to several ski resorts, making it a popular destination for outdoor recreation.
Geography
Sullivan County is located in the southwestern corner of New Hampshire, bordered by Vermont to the west and Massachusetts to the south. It is part of the larger New England region and is home to a population of approximately 43,000 people. The county is known for its rural landscape, with rolling hills, forests, and small towns. It is also home to several ski resorts, making it a popular destination for outdoor recreation. The highest point in the county is Mount Monadnock, which stands at 3,165 feet. The county is also home to several rivers, including the Ashuelot, Contoocook, and Connecticut Rivers.
History
The area that is now Sullivan County was originally inhabited by the Abenaki people. The first European settlers arrived in the area in the late 17th century, and the county was officially established in 1827. The county was named after General John Sullivan, who served in the Revolutionary War.
In the 19th century, the county was largely agricultural, with dairy farming and sheep herding being the primary industries. The county also had several mills, which produced lumber and textiles. In the 20th century, the county began to shift towards a more tourism-based economy, with the development of ski resorts and other outdoor recreation activities.
Economy
Sullivan County has a diverse economy, with a mix of industries including manufacturing, tourism, and agriculture. The county is home to several large employers, including the Dartmouth-Hitchcock Medical Center, the University of New Hampshire, and the St. Johnsbury Trucking Company.
The county is also home to several ski resorts, which attract visitors from all over the world. The resorts provide jobs for local residents, as well as a boost to the local economy. The county is also home to several small businesses, including restaurants, shops, and galleries.
Demographics
As of the 2010 census, the population of Sullivan County was 43,742. The population is predominantly white (94.3%), with small percentages of African American (1.2%), Asian (1.2%), and Hispanic (1.7%) residents. The median household income is $60,945, and the median age is 43.
The county is home to several small towns, including Claremont, Newport, and Sunapee. The county seat is Newport, which is the largest town in the county with a population of 6,845. The county is also home to several ski resorts, including Mount Sunapee and Ragged Mountain.
Conclusion
Sullivan County is a rural county located in the southwestern corner of New Hampshire. It is known for its rolling hills, forests, and small towns, as well as its ski resorts and outdoor recreation activities. The county has a diverse economy, with a mix of industries including manufacturing, tourism, and agriculture. The population is predominantly white, with small percentages of African American, Asian, and Hispanic residents. Sullivan County is a great place to live, work, and play, and is a popular destination for outdoor recreation.
Common Questions
What is Per Capita Income in Sullivan County?
Per Capita income in Sullivan County is $39,087.
What is the Median Family Income in Sullivan County?
Median Family Income in Sullivan County is $91,299.
What is the Median Household income in Sullivan County?
Median Household Income in Sullivan County is $70,788.
What is Income or Wage Gap in Sullivan County?
Income or Wage Gap in Sullivan County is 14.2%.
Women in Sullivan County earn 85.8 cents for every dollar earned by a man.
What is Family Income Deficit in Sullivan County?
Family Income Deficit in Sullivan County is $12,554.
Families that are below poverty line in Sullivan County earn $12,554 less on average than the poverty threshold level.
What is Inequality or Gini Index in Sullivan County?
Inequality or Gini Index in Sullivan County is 0.49.
What is the Total Population of Sullivan County?
Total Population of Sullivan County is 43,356.
What is the Total Male Population of Sullivan County?
Total Male Population of Sullivan County is 21,845.
What is the Total Female Population of Sullivan County?
Total Female Population of Sullivan County is 21,511.
What is the Ratio of Males per 100 Females in Sullivan County?
There are 101.55 Males per 100 Females in Sullivan County.
What is the Ratio of Females per 100 Males in Sullivan County?
There are 98.47 Females per 100 Males in Sullivan County.
What is the Median Population Age in Sullivan County?
Median Population Age in Sullivan County is 47.0 Years.
What is the Average Family Size in Sullivan County
Average Family Size in Sullivan County is 3.3 People.
What is the Average Household Size in Sullivan County
Average Household Size in Sullivan County is 2.7 People.
How Large is the Labor Force in Sullivan County?
There are 20,829 People in the Labor Forcein in Sullivan County.
What is the Percentage of People in the Labor Force in Sullivan County?
56.5% of People are in the Labor Force in Sullivan County.
What is the Unemployment Rate in Sullivan County?
Unemployment Rate in Sullivan County is 2.9%.