Hampton, NH Map & Demographics
Hampton Map
Hampton Overview
$57,669
PER CAPITA INCOME
$113,683
AVG FAMILY INCOME
$92,907
AVG HOUSEHOLD INCOME
32.1%
WAGE / INCOME GAP [ % ]
67.9¢/ $1
WAGE / INCOME GAP [ $ ]
0.45
INEQUALITY / GINI INDEX
10,050
TOTAL POPULATION
4,944
MALE POPULATION
5,106
FEMALE POPULATION
96.83
MALES / 100 FEMALES
103.28
FEMALES / 100 MALES
49.6
MEDIAN AGE
2.9
AVG FAMILY SIZE
2.3
AVG HOUSEHOLD SIZE
5,489
LABOR FORCE [ PEOPLE ]
64.1%
PERCENT IN LABOR FORCE
2.2%
UNEMPLOYMENT RATE
Hampton Zip Codes
Hampton Area Codes
Income in Hampton
Income Overview in Hampton
Per Capita Income in Hampton is $57,669, while median incomes of families and households are $113,683 and $92,907 respectively.
| Characteristic | Number | Measure |
| Per Capita Income | 10,050 | $57,669 |
| Median Family Income | 2,702 | $113,683 |
| Mean Family Income | 2,702 | $164,305 |
| Median Household Income | 4,246 | $92,907 |
| Mean Household Income | 4,246 | $133,069 |
| Income Deficit | 2,702 | $0 |
| Wage / Income Gap (%) | 10,050 | 32.07% |
| Wage / Income Gap ($) | 10,050 | 67.93¢ per $1 |
| Gini / Inequality Index | 10,050 | 0.45 |
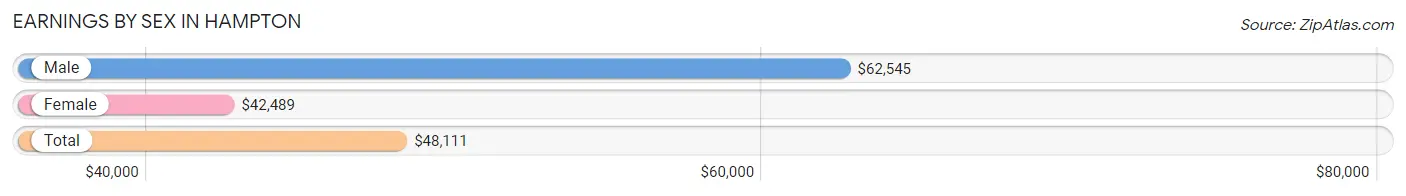
Earnings by Sex in Hampton
Average Earnings in Hampton are $48,111, $62,545 for men and $42,489 for women, a difference of 32.1%.
| Sex | Number | Average Earnings |
| Male | 3,312 (53.9%) | $62,545 |
| Female | 2,833 (46.1%) | $42,489 |
| Total | 6,145 (100.0%) | $48,111 |
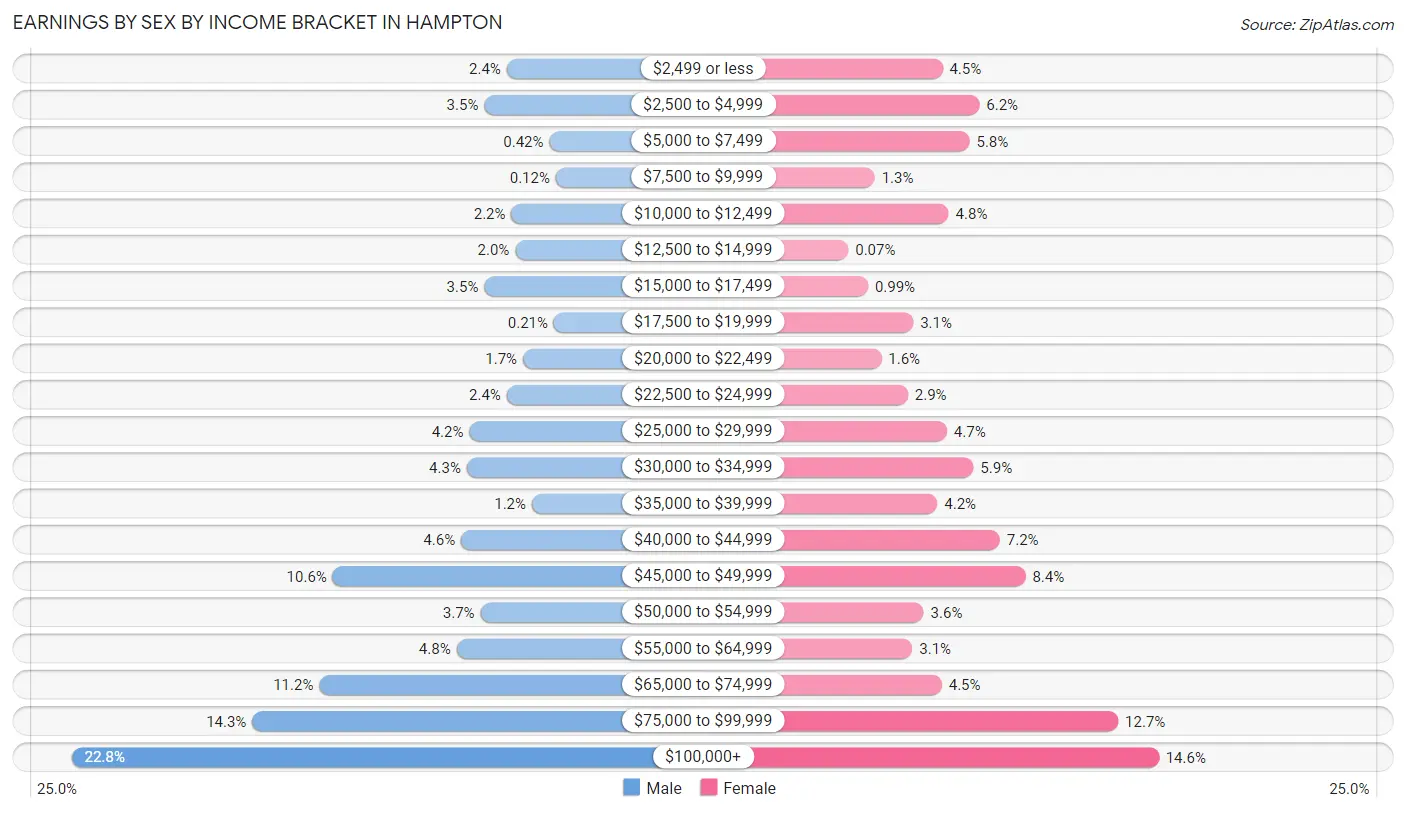
Earnings by Sex by Income Bracket in Hampton
The most common earnings brackets in Hampton are $100,000+ for men (755 | 22.8%) and $100,000+ for women (414 | 14.6%).
| Income | Male | Female |
| $2,499 or less | 80 (2.4%) | 127 (4.5%) |
| $2,500 to $4,999 | 115 (3.5%) | 176 (6.2%) |
| $5,000 to $7,499 | 14 (0.4%) | 163 (5.8%) |
| $7,500 to $9,999 | 4 (0.1%) | 37 (1.3%) |
| $10,000 to $12,499 | 73 (2.2%) | 135 (4.8%) |
| $12,500 to $14,999 | 67 (2.0%) | 2 (0.1%) |
| $15,000 to $17,499 | 115 (3.5%) | 28 (1.0%) |
| $17,500 to $19,999 | 7 (0.2%) | 88 (3.1%) |
| $20,000 to $22,499 | 55 (1.7%) | 46 (1.6%) |
| $22,500 to $24,999 | 80 (2.4%) | 81 (2.9%) |
| $25,000 to $29,999 | 138 (4.2%) | 133 (4.7%) |
| $30,000 to $34,999 | 142 (4.3%) | 168 (5.9%) |
| $35,000 to $39,999 | 41 (1.2%) | 120 (4.2%) |
| $40,000 to $44,999 | 151 (4.6%) | 203 (7.2%) |
| $45,000 to $49,999 | 350 (10.6%) | 237 (8.4%) |
| $50,000 to $54,999 | 121 (3.6%) | 102 (3.6%) |
| $55,000 to $64,999 | 158 (4.8%) | 87 (3.1%) |
| $65,000 to $74,999 | 371 (11.2%) | 126 (4.4%) |
| $75,000 to $99,999 | 475 (14.3%) | 360 (12.7%) |
| $100,000+ | 755 (22.8%) | 414 (14.6%) |
| Total | 3,312 (100.0%) | 2,833 (100.0%) |
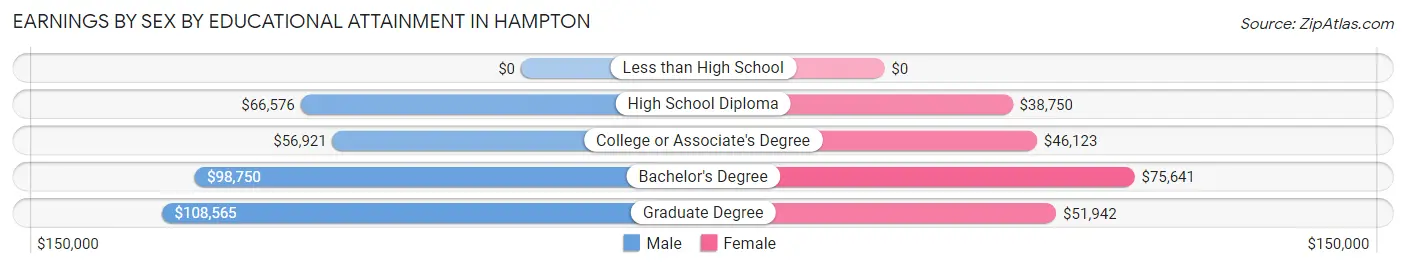
Earnings by Sex by Educational Attainment in Hampton
Average earnings in Hampton are $68,289 for men and $46,181 for women, a difference of 32.4%. Men with an educational attainment of graduate degree enjoy the highest average annual earnings of $108,565, while those with college or associate's degree education earn the least with $56,921. Women with an educational attainment of bachelor's degree earn the most with the average annual earnings of $75,641, while those with high school diploma education have the smallest earnings of $38,750.
| Educational Attainment | Male Income | Female Income |
| Less than High School | - | - |
| High School Diploma | $66,576 | $38,750 |
| College or Associate's Degree | $56,921 | $46,123 |
| Bachelor's Degree | $98,750 | $75,641 |
| Graduate Degree | $108,565 | $51,942 |
| Total | $68,289 | $46,181 |
Family Income in Hampton
Family Income Brackets in Hampton
According to the Hampton family income data, there are 621 families falling into the $200,000+ income range, which is the most common income bracket and makes up 23.0% of all families. Conversely, the $10,000 to $14,999 income bracket is the least frequent group with only 14 families (0.5%) belonging to this category.
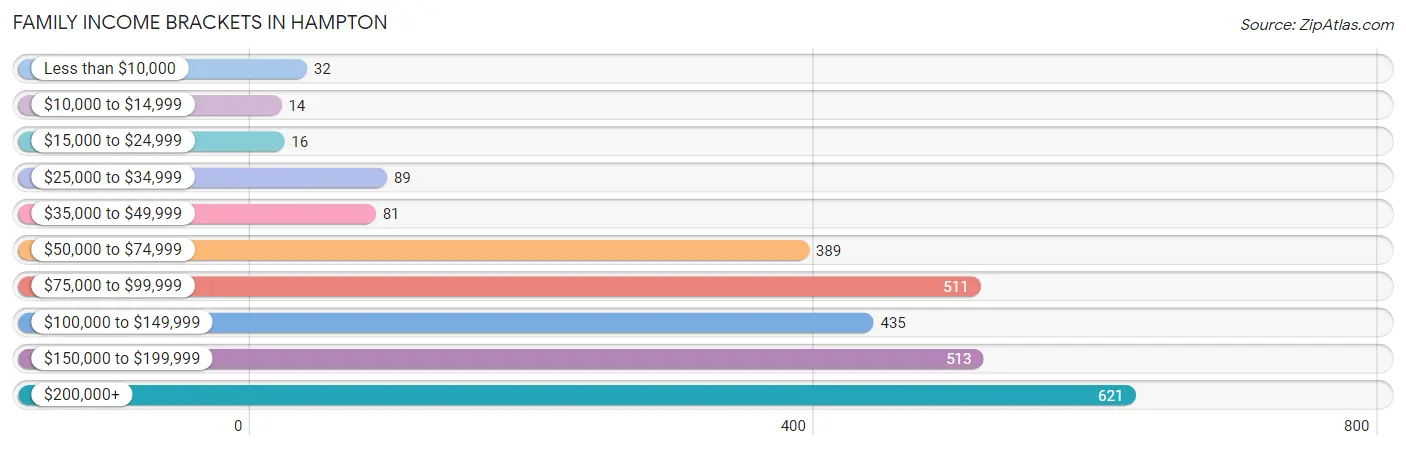
| Income Bracket | # Families | % Families |
| Less than $10,000 | 32 | 1.2% |
| $10,000 to $14,999 | 14 | 0.5% |
| $15,000 to $24,999 | 16 | 0.6% |
| $25,000 to $34,999 | 89 | 3.3% |
| $35,000 to $49,999 | 81 | 3.0% |
| $50,000 to $74,999 | 389 | 14.4% |
| $75,000 to $99,999 | 511 | 18.9% |
| $100,000 to $149,999 | 435 | 16.1% |
| $150,000 to $199,999 | 513 | 19.0% |
| $200,000+ | 621 | 23.0% |
Family Income by Famaliy Size in Hampton
5-person families (85 | 3.2%) account for the highest median family income in Hampton with $185,521 per family, while 2-person families (1,341 | 49.6%) have the highest median income of $51,032 per family member.
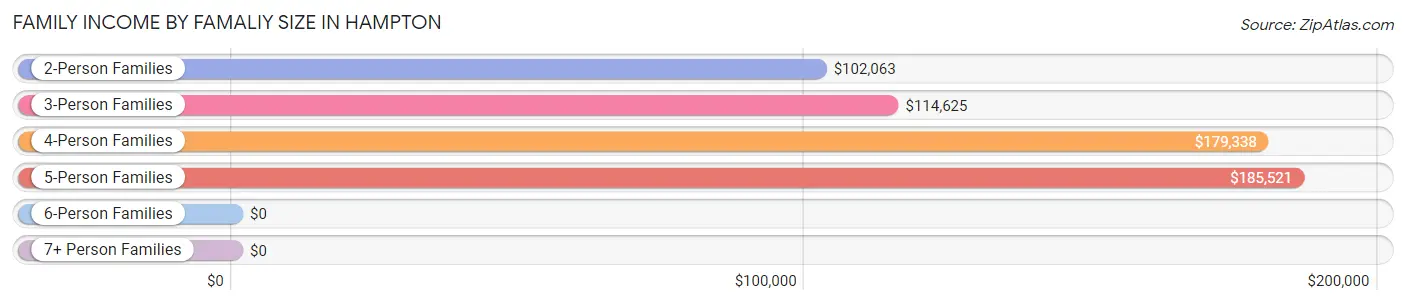
| Income Bracket | # Families | Median Income |
| 2-Person Families | 1,341 (49.6%) | $102,063 |
| 3-Person Families | 570 (21.1%) | $114,625 |
| 4-Person Families | 706 (26.1%) | $179,338 |
| 5-Person Families | 85 (3.2%) | $185,521 |
| 6-Person Families | 0 (0.0%) | $0 |
| 7+ Person Families | 0 (0.0%) | $0 |
| Total | 2,702 (100.0%) | $113,683 |
Family Income by Number of Earners in Hampton
The median family income in Hampton is $113,683, with families comprising 3+ earners (321) having the highest median family income of $178,935, while families with no earners (314) have the lowest median family income of $64,647, accounting for 11.9% and 11.6% of families, respectively.
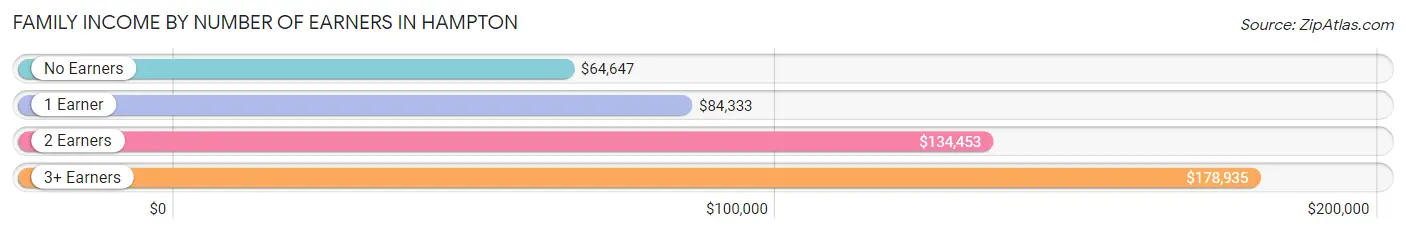
| Number of Earners | # Families | Median Income |
| No Earners | 314 (11.6%) | $64,647 |
| 1 Earner | 714 (26.4%) | $84,333 |
| 2 Earners | 1,353 (50.1%) | $134,453 |
| 3+ Earners | 321 (11.9%) | $178,935 |
| Total | 2,702 (100.0%) | $113,683 |
Household Income in Hampton
Household Income Brackets in Hampton
With 781 households falling in the category, the $75,000 to $99,999 income range is the most frequent in Hampton, accounting for 18.4% of all households. In contrast, only 72 households (1.7%) fall into the $10,000 to $14,999 income bracket, making it the least populous group.
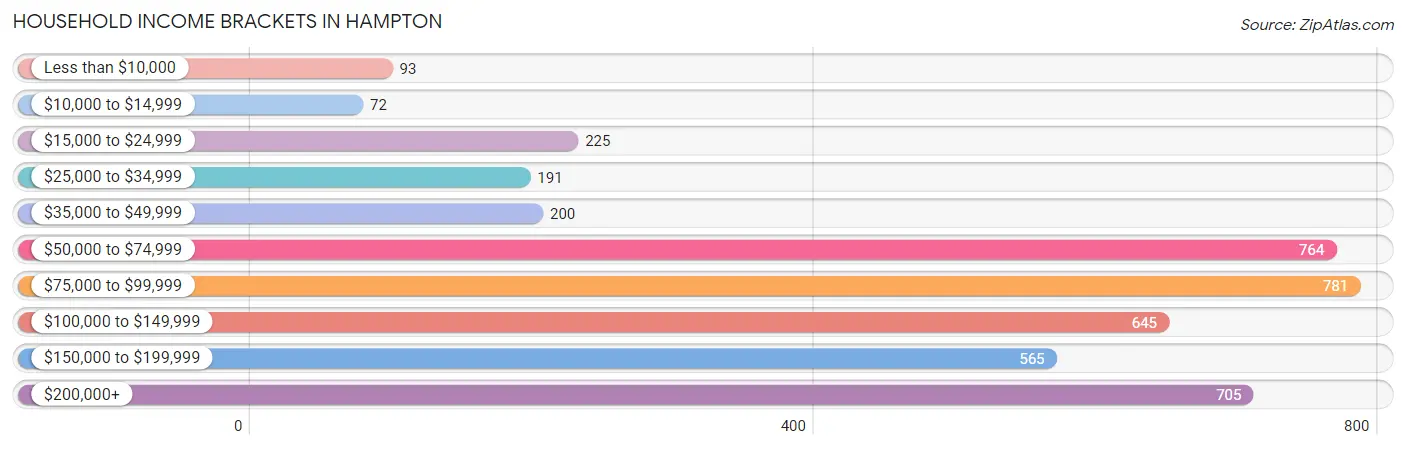
| Income Bracket | # Households | % Households |
| Less than $10,000 | 93 | 2.2% |
| $10,000 to $14,999 | 72 | 1.7% |
| $15,000 to $24,999 | 225 | 5.3% |
| $25,000 to $34,999 | 191 | 4.5% |
| $35,000 to $49,999 | 200 | 4.7% |
| $50,000 to $74,999 | 764 | 18.0% |
| $75,000 to $99,999 | 781 | 18.4% |
| $100,000 to $149,999 | 645 | 15.2% |
| $150,000 to $199,999 | 565 | 13.3% |
| $200,000+ | 705 | 16.6% |
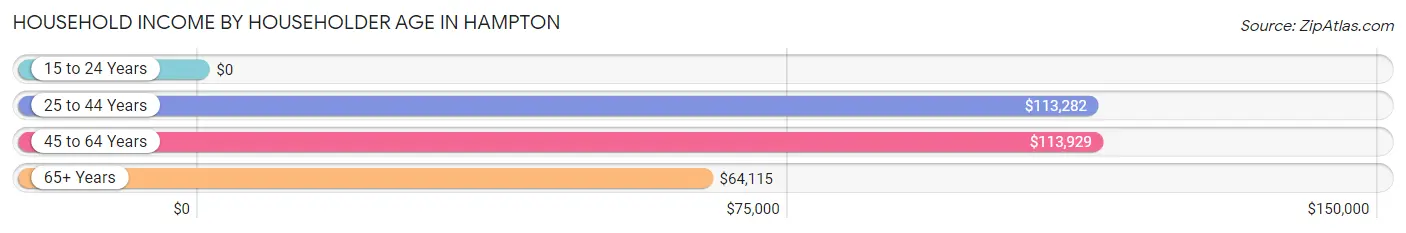
Household Income by Householder Age in Hampton
The median household income in Hampton is $92,907, with the highest median household income of $113,929 found in the 45 to 64 years age bracket for the primary householder. A total of 1,752 households (41.3%) fall into this category. Meanwhile, the 15 to 24 years age bracket for the primary householder has the lowest median household income of $0, with 15 households (0.4%) in this group.
| Income Bracket | # Households | Median Income |
| 15 to 24 Years | 15 (0.4%) | $0 |
| 25 to 44 Years | 1,036 (24.4%) | $113,282 |
| 45 to 64 Years | 1,752 (41.3%) | $113,929 |
| 65+ Years | 1,443 (34.0%) | $64,115 |
| Total | 4,246 (100.0%) | $92,907 |
Poverty in Hampton
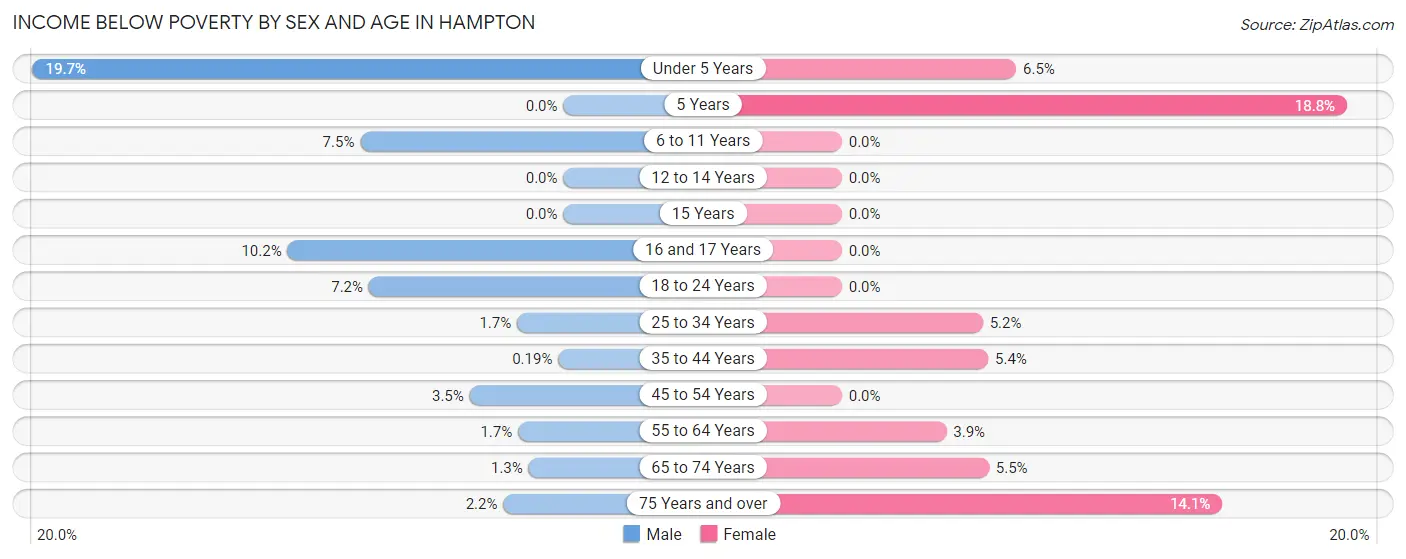
Income Below Poverty by Sex and Age in Hampton
With 3.4% poverty level for males and 4.2% for females among the residents of Hampton, under 5 year old males and 5 year old females are the most vulnerable to poverty, with 39 males (19.7%) and 6 females (18.8%) in their respective age groups living below the poverty level.
| Age Bracket | Male | Female |
| Under 5 Years | 39 (19.7%) | 9 (6.5%) |
| 5 Years | 0 (0.0%) | 6 (18.8%) |
| 6 to 11 Years | 27 (7.5%) | 0 (0.0%) |
| 12 to 14 Years | 0 (0.0%) | 0 (0.0%) |
| 15 Years | 0 (0.0%) | 0 (0.0%) |
| 16 and 17 Years | 13 (10.2%) | 0 (0.0%) |
| 18 to 24 Years | 14 (7.2%) | 0 (0.0%) |
| 25 to 34 Years | 9 (1.7%) | 30 (5.2%) |
| 35 to 44 Years | 1 (0.2%) | 34 (5.4%) |
| 45 to 54 Years | 30 (3.5%) | 0 (0.0%) |
| 55 to 64 Years | 16 (1.7%) | 34 (3.9%) |
| 65 to 74 Years | 7 (1.3%) | 39 (5.5%) |
| 75 Years and over | 9 (2.2%) | 60 (14.1%) |
| Total | 165 (3.4%) | 212 (4.2%) |
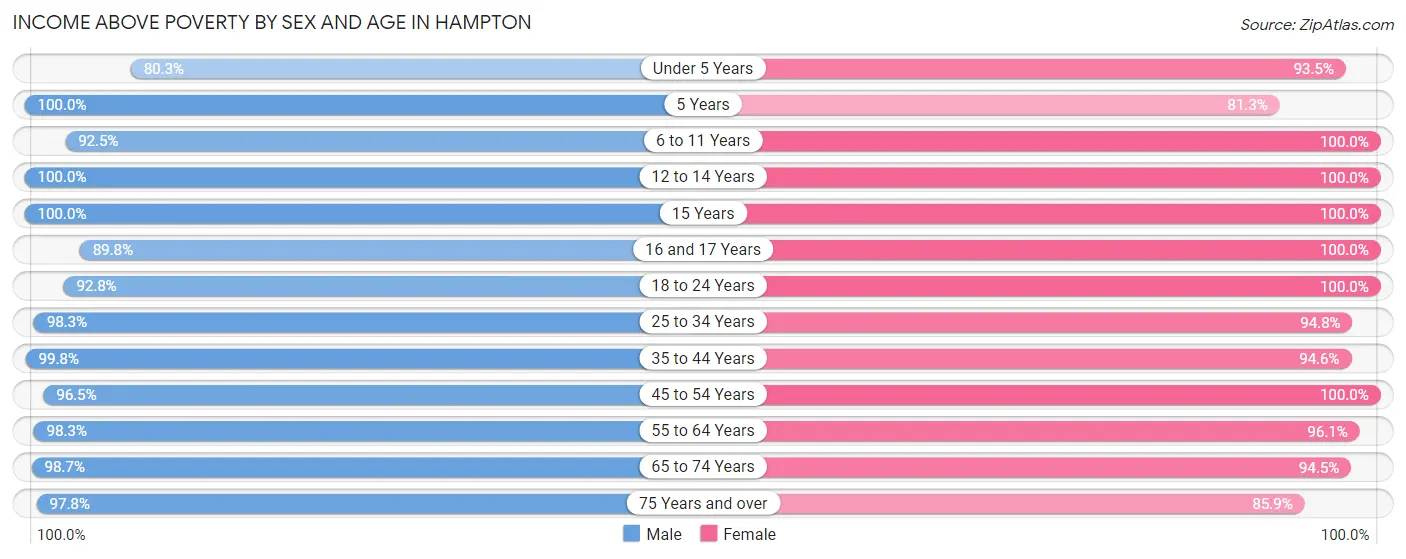
Income Above Poverty by Sex and Age in Hampton
According to the poverty statistics in Hampton, males aged 5 years and females aged 6 to 11 years are the age groups that are most secure financially, with 100.0% of males and 100.0% of females in these age groups living above the poverty line.
| Age Bracket | Male | Female |
| Under 5 Years | 159 (80.3%) | 130 (93.5%) |
| 5 Years | 19 (100.0%) | 26 (81.2%) |
| 6 to 11 Years | 331 (92.5%) | 374 (100.0%) |
| 12 to 14 Years | 135 (100.0%) | 143 (100.0%) |
| 15 Years | 28 (100.0%) | 60 (100.0%) |
| 16 and 17 Years | 114 (89.8%) | 101 (100.0%) |
| 18 to 24 Years | 180 (92.8%) | 279 (100.0%) |
| 25 to 34 Years | 514 (98.3%) | 544 (94.8%) |
| 35 to 44 Years | 526 (99.8%) | 592 (94.6%) |
| 45 to 54 Years | 832 (96.5%) | 659 (100.0%) |
| 55 to 64 Years | 935 (98.3%) | 842 (96.1%) |
| 65 to 74 Years | 537 (98.7%) | 675 (94.5%) |
| 75 Years and over | 394 (97.8%) | 365 (85.9%) |
| Total | 4,704 (96.6%) | 4,790 (95.8%) |
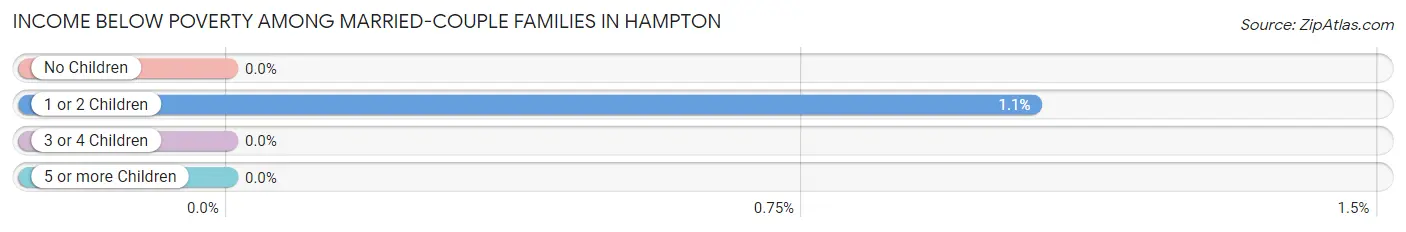
Income Below Poverty Among Married-Couple Families in Hampton
The poverty statistics for married-couple families in Hampton show that 0.4% or 9 of the total 2,253 families live below the poverty line. Families with 1 or 2 children have the highest poverty rate of 1.1%, comprising of 9 families. On the other hand, families with no children have the lowest poverty rate of 0.0%, which includes 0 families.
| Children | Above Poverty | Below Poverty |
| No Children | 1,355 (100.0%) | 0 (0.0%) |
| 1 or 2 Children | 851 (99.0%) | 9 (1.1%) |
| 3 or 4 Children | 38 (100.0%) | 0 (0.0%) |
| 5 or more Children | 0 (0.0%) | 0 (0.0%) |
| Total | 2,244 (99.6%) | 9 (0.4%) |
Income Below Poverty Among Single-Parent Households in Hampton
According to the poverty data in Hampton, 9.7% or 11 single-father households and 15.5% or 52 single-mother households are living below the poverty line. Among single-father households, those with 1 or 2 children have the highest poverty rate, with 11 households (26.2%) experiencing poverty. Likewise, among single-mother households, those with 3 or 4 children have the highest poverty rate, with 7 households (58.3%) falling below the poverty line.
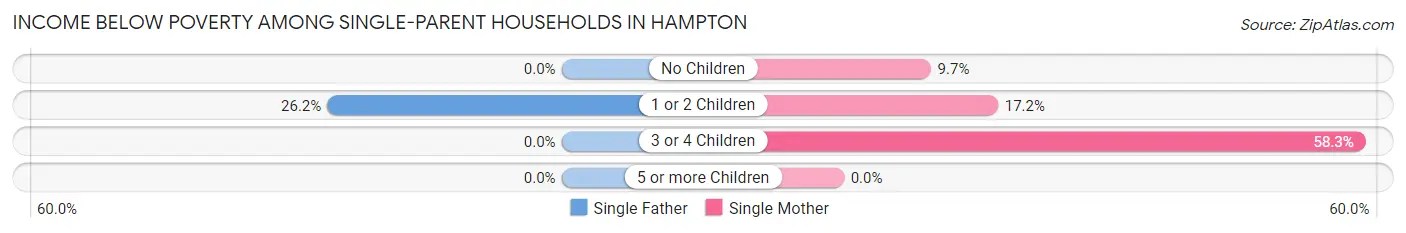
| Children | Single Father | Single Mother |
| No Children | 0 (0.0%) | 14 (9.7%) |
| 1 or 2 Children | 11 (26.2%) | 31 (17.2%) |
| 3 or 4 Children | 0 (0.0%) | 7 (58.3%) |
| 5 or more Children | 0 (0.0%) | 0 (0.0%) |
| Total | 11 (9.7%) | 52 (15.5%) |
Income Below Poverty Among Married-Couple vs Single-Parent Households in Hampton
The poverty data for Hampton shows that 9 of the married-couple family households (0.4%) and 63 of the single-parent households (14.0%) are living below the poverty level. Within the married-couple family households, those with 1 or 2 children have the highest poverty rate, with 9 households (1.1%) falling below the poverty line. Among the single-parent households, those with 3 or 4 children have the highest poverty rate, with 7 household (25.9%) living below poverty.
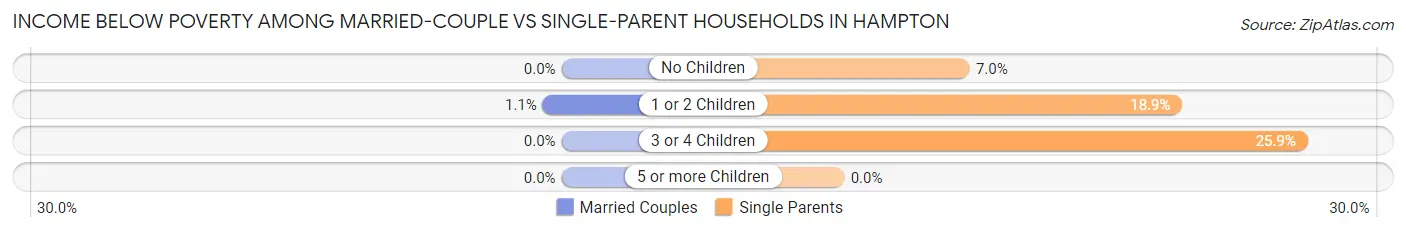
| Children | Married-Couple Families | Single-Parent Households |
| No Children | 0 (0.0%) | 14 (7.0%) |
| 1 or 2 Children | 9 (1.1%) | 42 (18.9%) |
| 3 or 4 Children | 0 (0.0%) | 7 (25.9%) |
| 5 or more Children | 0 (0.0%) | 0 (0.0%) |
| Total | 9 (0.4%) | 63 (14.0%) |
Race in Hampton
The most populous races in Hampton are White / Caucasian (9,616 | 95.7%), Two or more Races (248 | 2.5%), and Asian (114 | 1.1%).
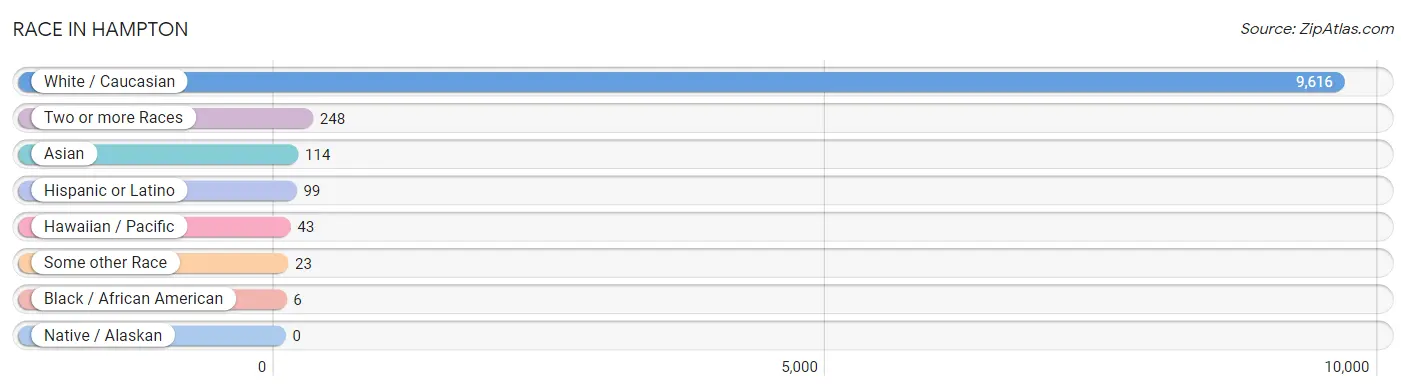
| Race | # Population | % Population |
| Asian | 114 | 1.1% |
| Black / African American | 6 | 0.1% |
| Hawaiian / Pacific | 43 | 0.4% |
| Hispanic or Latino | 99 | 1.0% |
| Native / Alaskan | 0 | 0.0% |
| White / Caucasian | 9,616 | 95.7% |
| Two or more Races | 248 | 2.5% |
| Some other Race | 23 | 0.2% |
| Total | 10,050 | 100.0% |
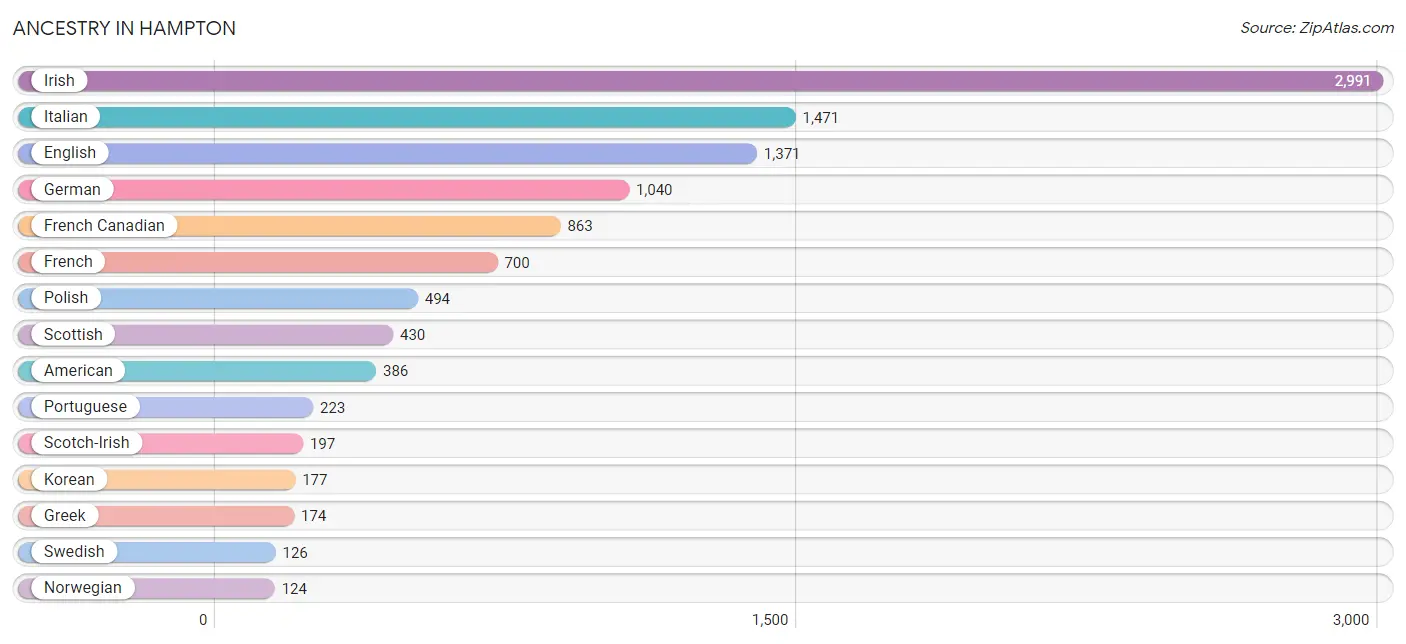
Ancestry in Hampton
The most populous ancestries reported in Hampton are Irish (2,991 | 29.8%), Italian (1,471 | 14.6%), English (1,371 | 13.6%), German (1,040 | 10.3%), and French Canadian (863 | 8.6%), together accounting for 77.0% of all Hampton residents.
| Ancestry | # Population | % Population |
| Albanian | 45 | 0.4% |
| American | 386 | 3.8% |
| Arab | 18 | 0.2% |
| Armenian | 35 | 0.4% |
| Australian | 22 | 0.2% |
| Austrian | 4 | 0.0% |
| Belgian | 14 | 0.1% |
| British | 21 | 0.2% |
| Burmese | 34 | 0.3% |
| Canadian | 81 | 0.8% |
| Central American | 11 | 0.1% |
| Czech | 7 | 0.1% |
| Danish | 4 | 0.0% |
| Dutch | 57 | 0.6% |
| Eastern European | 45 | 0.4% |
| Ecuadorian | 12 | 0.1% |
| English | 1,371 | 13.6% |
| European | 56 | 0.6% |
| Finnish | 90 | 0.9% |
| French | 700 | 7.0% |
| French Canadian | 863 | 8.6% |
| German | 1,040 | 10.3% |
| Greek | 174 | 1.7% |
| Hungarian | 29 | 0.3% |
| Indian (Asian) | 39 | 0.4% |
| Irish | 2,991 | 29.8% |
| Italian | 1,471 | 14.6% |
| Korean | 177 | 1.8% |
| Laotian | 1 | 0.0% |
| Lebanese | 18 | 0.2% |
| Mexican | 43 | 0.4% |
| Native Hawaiian | 43 | 0.4% |
| Nigerian | 1 | 0.0% |
| Norwegian | 124 | 1.2% |
| Pakistani | 11 | 0.1% |
| Polish | 494 | 4.9% |
| Portuguese | 223 | 2.2% |
| Puerto Rican | 24 | 0.2% |
| Russian | 30 | 0.3% |
| Salvadoran | 11 | 0.1% |
| Scotch-Irish | 197 | 2.0% |
| Scottish | 430 | 4.3% |
| Slovak | 12 | 0.1% |
| South American | 12 | 0.1% |
| Spanish | 9 | 0.1% |
| Subsaharan African | 1 | 0.0% |
| Swedish | 126 | 1.3% |
| Swiss | 53 | 0.5% |
| Ukrainian | 10 | 0.1% |
| Welsh | 78 | 0.8% | View All 50 Rows |
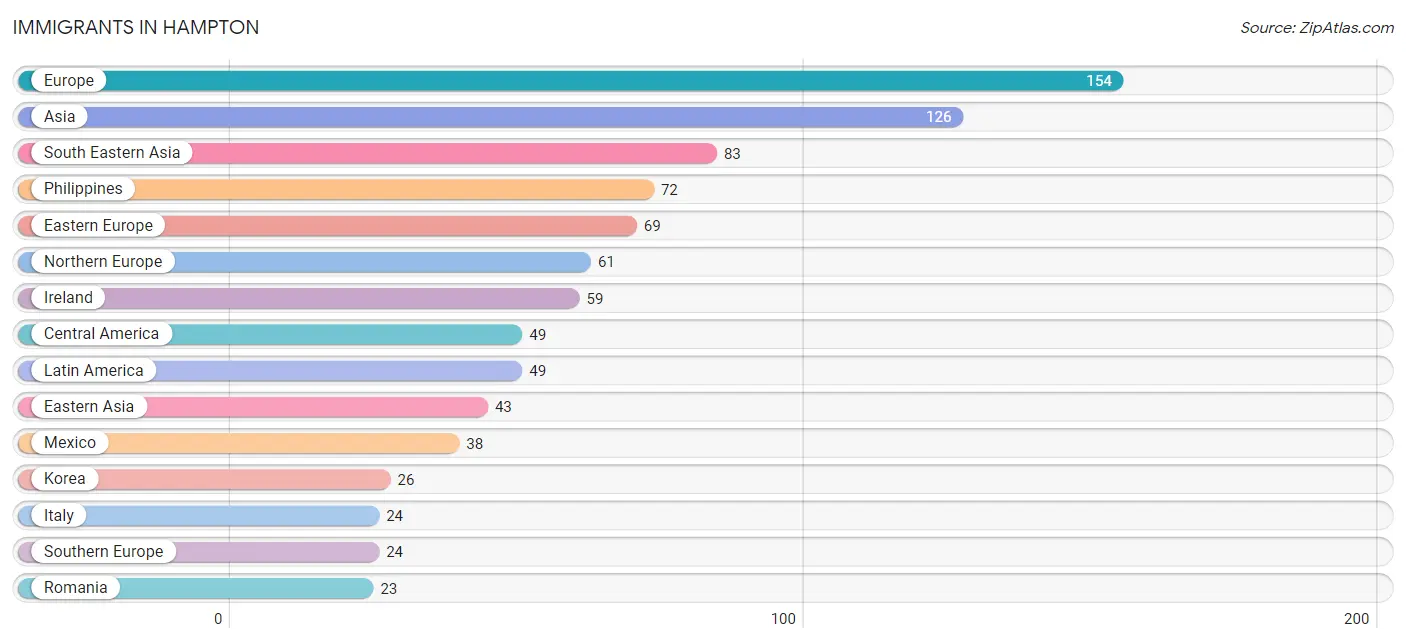
Immigrants in Hampton
The most numerous immigrant groups reported in Hampton came from Europe (154 | 1.5%), Asia (126 | 1.3%), South Eastern Asia (83 | 0.8%), Philippines (72 | 0.7%), and Eastern Europe (69 | 0.7%), together accounting for 5.0% of all Hampton residents.
| Immigration Origin | # Population | % Population |
| Africa | 1 | 0.0% |
| Asia | 126 | 1.3% |
| Australia | 7 | 0.1% |
| Bulgaria | 6 | 0.1% |
| Canada | 5 | 0.1% |
| Central America | 49 | 0.5% |
| China | 5 | 0.1% |
| Czechoslovakia | 7 | 0.1% |
| Eastern Asia | 43 | 0.4% |
| Eastern Europe | 69 | 0.7% |
| El Salvador | 11 | 0.1% |
| Europe | 154 | 1.5% |
| Hungary | 22 | 0.2% |
| Ireland | 59 | 0.6% |
| Italy | 24 | 0.2% |
| Japan | 12 | 0.1% |
| Korea | 26 | 0.3% |
| Latin America | 49 | 0.5% |
| Mexico | 38 | 0.4% |
| Nigeria | 1 | 0.0% |
| Northern Europe | 61 | 0.6% |
| Oceania | 7 | 0.1% |
| Philippines | 72 | 0.7% |
| Poland | 11 | 0.1% |
| Romania | 23 | 0.2% |
| Scotland | 2 | 0.0% |
| South Eastern Asia | 83 | 0.8% |
| Southern Europe | 24 | 0.2% |
| Taiwan | 5 | 0.1% |
| Thailand | 11 | 0.1% |
| Western Africa | 1 | 0.0% | View All 31 Rows |
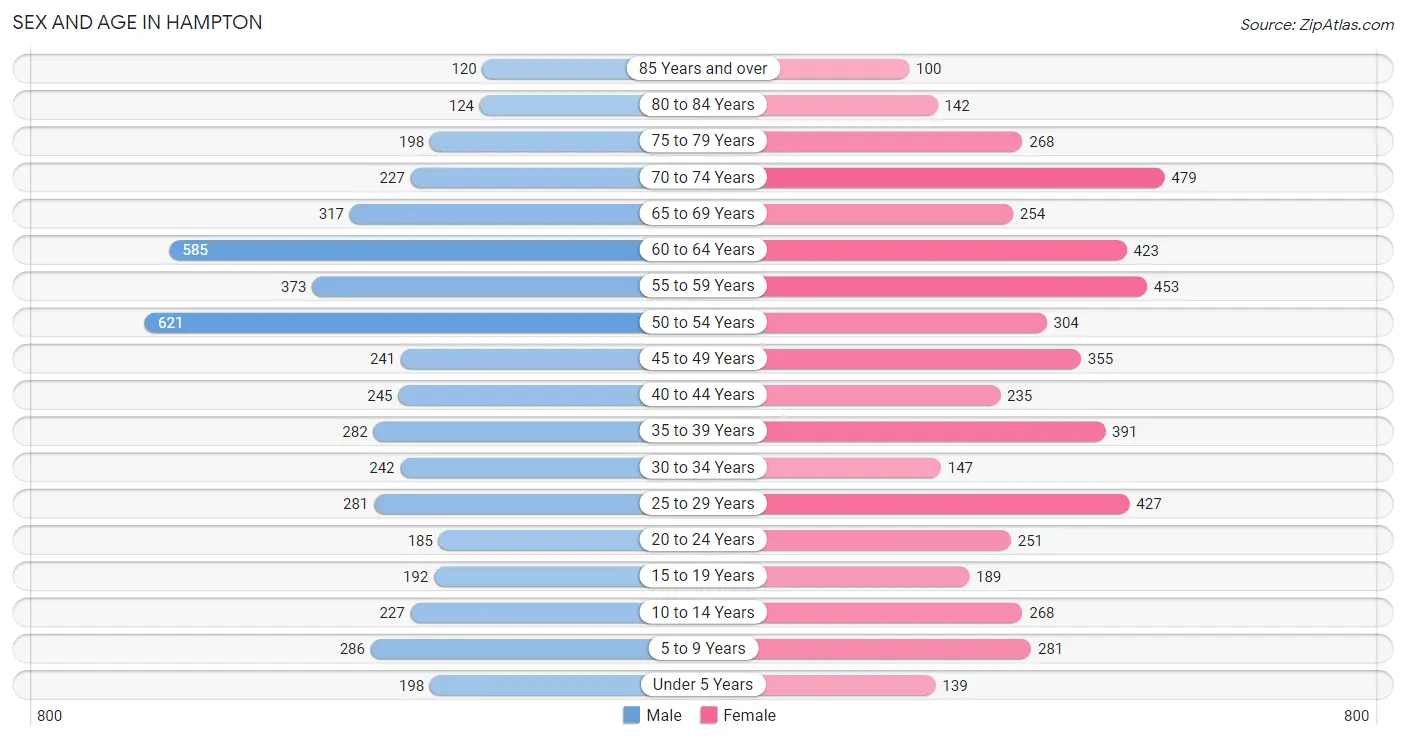
Sex and Age in Hampton
Sex and Age in Hampton
The most populous age groups in Hampton are 50 to 54 Years (621 | 12.6%) for men and 70 to 74 Years (479 | 9.4%) for women.
| Age Bracket | Male | Female |
| Under 5 Years | 198 (4.0%) | 139 (2.7%) |
| 5 to 9 Years | 286 (5.8%) | 281 (5.5%) |
| 10 to 14 Years | 227 (4.6%) | 268 (5.2%) |
| 15 to 19 Years | 192 (3.9%) | 189 (3.7%) |
| 20 to 24 Years | 185 (3.7%) | 251 (4.9%) |
| 25 to 29 Years | 281 (5.7%) | 427 (8.4%) |
| 30 to 34 Years | 242 (4.9%) | 147 (2.9%) |
| 35 to 39 Years | 282 (5.7%) | 391 (7.7%) |
| 40 to 44 Years | 245 (5.0%) | 235 (4.6%) |
| 45 to 49 Years | 241 (4.9%) | 355 (7.0%) |
| 50 to 54 Years | 621 (12.6%) | 304 (5.9%) |
| 55 to 59 Years | 373 (7.5%) | 453 (8.9%) |
| 60 to 64 Years | 585 (11.8%) | 423 (8.3%) |
| 65 to 69 Years | 317 (6.4%) | 254 (5.0%) |
| 70 to 74 Years | 227 (4.6%) | 479 (9.4%) |
| 75 to 79 Years | 198 (4.0%) | 268 (5.2%) |
| 80 to 84 Years | 124 (2.5%) | 142 (2.8%) |
| 85 Years and over | 120 (2.4%) | 100 (2.0%) |
| Total | 4,944 (100.0%) | 5,106 (100.0%) |
Families and Households in Hampton
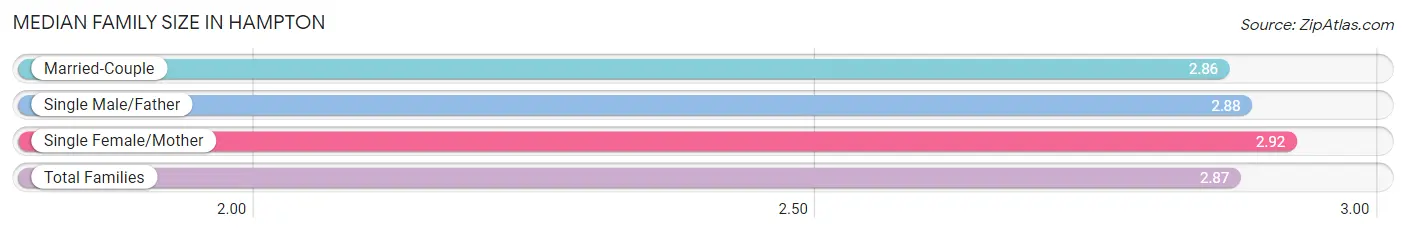
Median Family Size in Hampton
The median family size in Hampton is 2.87 persons per family, with single female/mother families (336 | 12.4%) accounting for the largest median family size of 2.92 persons per family. On the other hand, married-couple families (2,253 | 83.4%) represent the smallest median family size with 2.86 persons per family.
| Family Type | # Families | Family Size |
| Married-Couple | 2,253 (83.4%) | 2.86 |
| Single Male/Father | 113 (4.2%) | 2.88 |
| Single Female/Mother | 336 (12.4%) | 2.92 |
| Total Families | 2,702 (100.0%) | 2.87 |
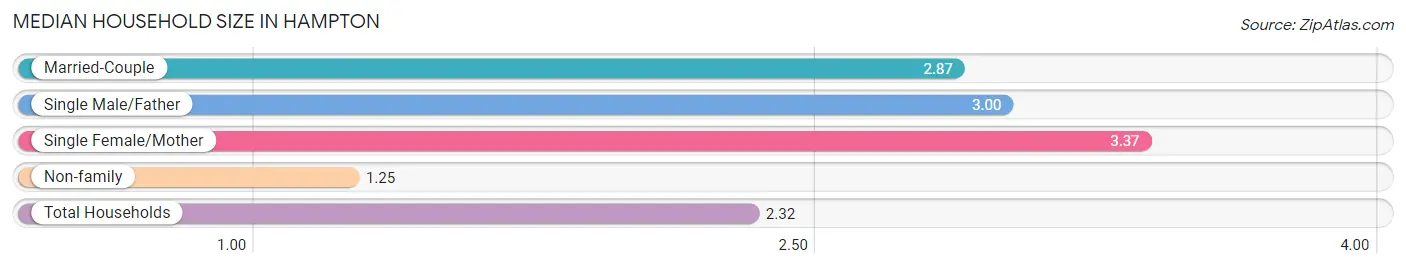
Median Household Size in Hampton
The median household size in Hampton is 2.32 persons per household, with single female/mother households (336 | 7.9%) accounting for the largest median household size of 3.37 persons per household. non-family households (1,544 | 36.4%) represent the smallest median household size with 1.25 persons per household.
| Household Type | # Households | Household Size |
| Married-Couple | 2,253 (53.1%) | 2.87 |
| Single Male/Father | 113 (2.7%) | 3.00 |
| Single Female/Mother | 336 (7.9%) | 3.37 |
| Non-family | 1,544 (36.4%) | 1.25 |
| Total Households | 4,246 (100.0%) | 2.32 |
Household Size by Marriage Status in Hampton
Out of a total of 4,246 households in Hampton, 2,702 (63.6%) are family households, while 1,544 (36.4%) are nonfamily households. The most numerous type of family households are 2-person households, comprising 1,296, and the most common type of nonfamily households are 1-person households, comprising 1,193.
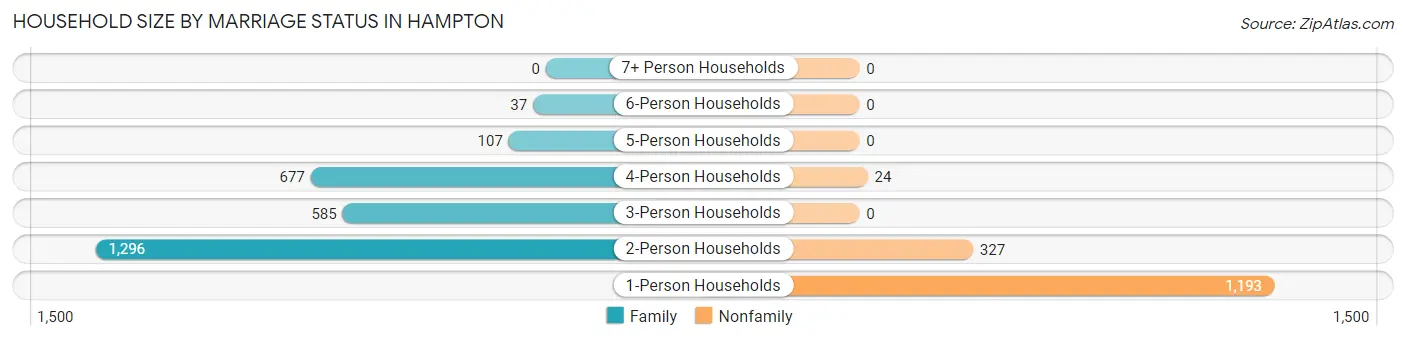
| Household Size | Family Households | Nonfamily Households |
| 1-Person Households | - | 1,193 (28.1%) |
| 2-Person Households | 1,296 (30.5%) | 327 (7.7%) |
| 3-Person Households | 585 (13.8%) | 0 (0.0%) |
| 4-Person Households | 677 (15.9%) | 24 (0.6%) |
| 5-Person Households | 107 (2.5%) | 0 (0.0%) |
| 6-Person Households | 37 (0.9%) | 0 (0.0%) |
| 7+ Person Households | 0 (0.0%) | 0 (0.0%) |
| Total | 2,702 (63.6%) | 1,544 (36.4%) |
Female Fertility in Hampton
Fertility by Age in Hampton
Average fertility rate in Hampton is 15.0 births per 1,000 women. Women in the age bracket of 20 to 34 years have the highest fertility rate with 25.0 births per 1,000 women. Women in the age bracket of 20 to 34 years acount for 67.7% of all women with births.
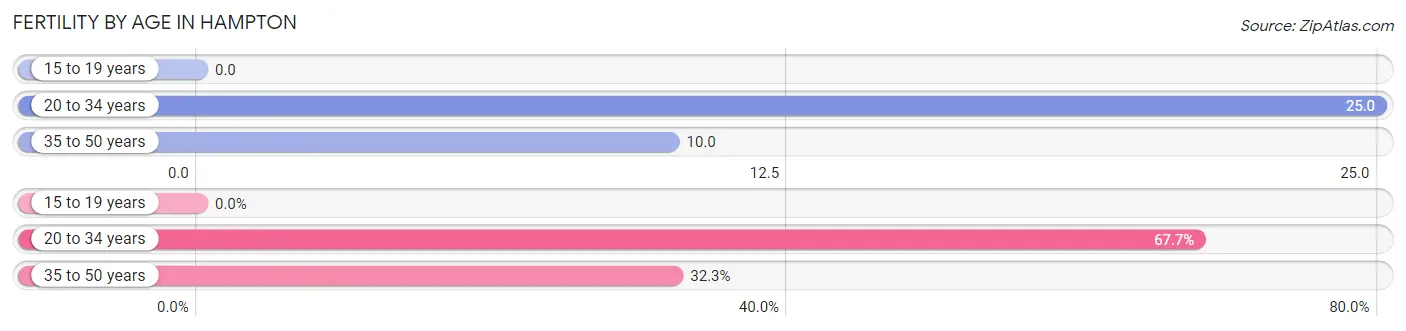
| Age Bracket | Women with Births | Births / 1,000 Women |
| 15 to 19 years | 0 (0.0%) | 0.0 |
| 20 to 34 years | 21 (67.7%) | 25.0 |
| 35 to 50 years | 10 (32.3%) | 10.0 |
| Total | 31 (100.0%) | 15.0 |
Fertility by Age by Marriage Status in Hampton
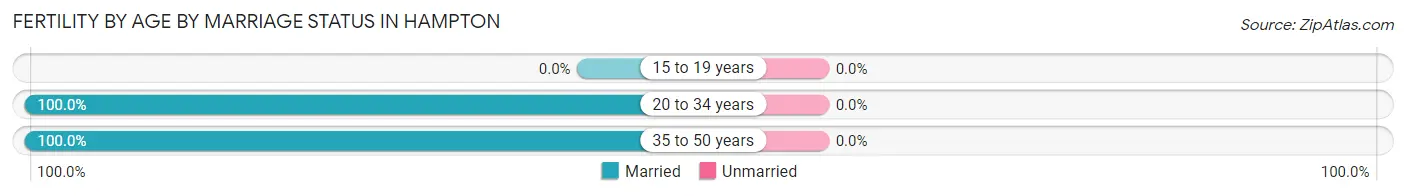
| Age Bracket | Married | Unmarried |
| 15 to 19 years | 0 (0.0%) | 0 (0.0%) |
| 20 to 34 years | 21 (100.0%) | 0 (0.0%) |
| 35 to 50 years | 10 (100.0%) | 0 (0.0%) |
| Total | 31 (100.0%) | 0 (0.0%) |
Fertility by Education in Hampton
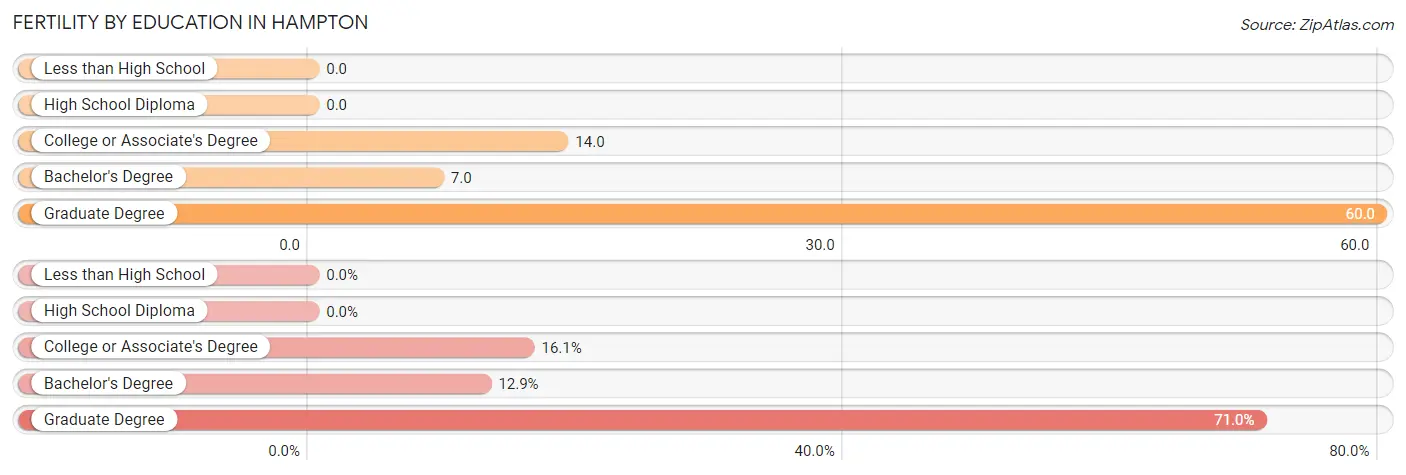
| Educational Attainment | Women with Births | Births / 1,000 Women |
| Less than High School | 0 (0.0%) | 0.0 |
| High School Diploma | 0 (0.0%) | 0.0 |
| College or Associate's Degree | 5 (16.1%) | 14.0 |
| Bachelor's Degree | 4 (12.9%) | 7.0 |
| Graduate Degree | 22 (71.0%) | 60.0 |
| Total | 31 (100.0%) | 15.0 |
Fertility by Education by Marriage Status in Hampton
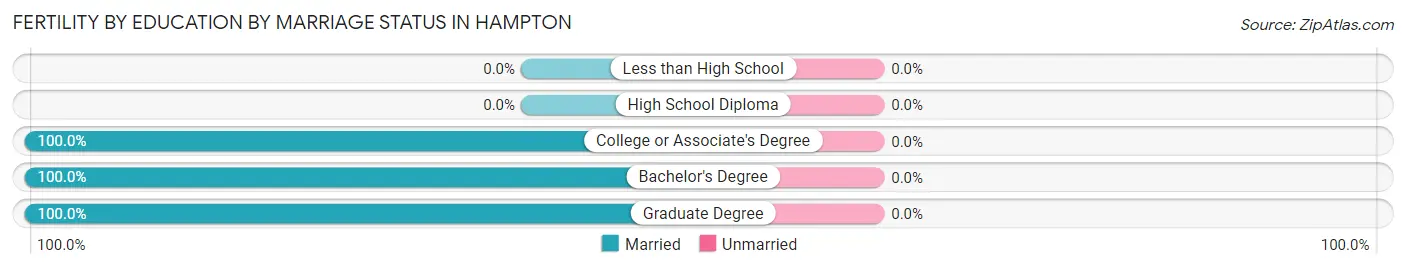
| Educational Attainment | Married | Unmarried |
| Less than High School | 0 (0.0%) | 0 (0.0%) |
| High School Diploma | 0 (0.0%) | 0 (0.0%) |
| College or Associate's Degree | 5 (100.0%) | 0 (0.0%) |
| Bachelor's Degree | 4 (100.0%) | 0 (0.0%) |
| Graduate Degree | 22 (100.0%) | 0 (0.0%) |
| Total | 31 (100.0%) | 0 (0.0%) |
Employment Characteristics in Hampton
Employment by Class of Employer in Hampton
Among the 5,291 employed individuals in Hampton, private company employees (3,447 | 65.1%), not-for-profit organizations (465 | 8.8%), and local government employees (375 | 7.1%) make up the most common classes of employment.
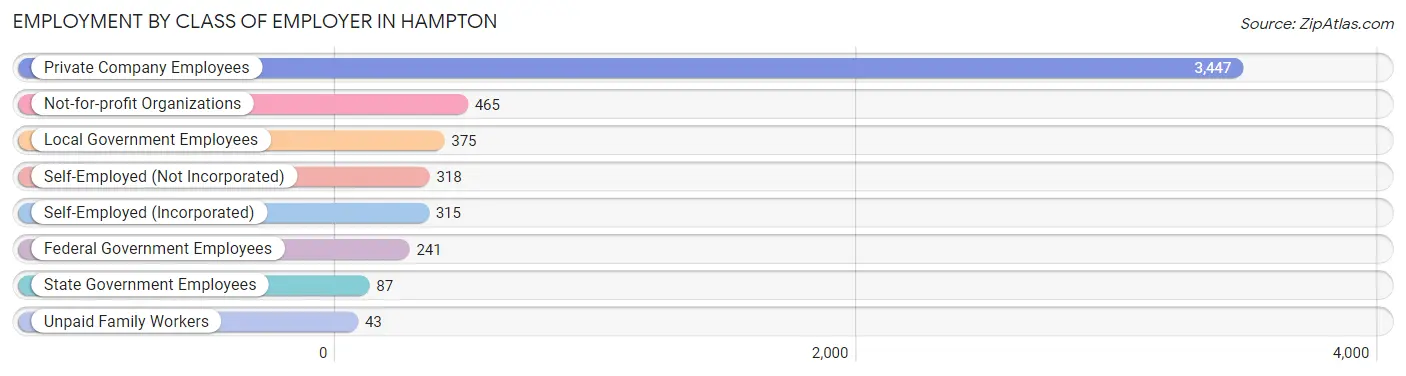
| Employer Class | # Employees | % Employees |
| Private Company Employees | 3,447 | 65.1% |
| Self-Employed (Incorporated) | 315 | 5.9% |
| Self-Employed (Not Incorporated) | 318 | 6.0% |
| Not-for-profit Organizations | 465 | 8.8% |
| Local Government Employees | 375 | 7.1% |
| State Government Employees | 87 | 1.6% |
| Federal Government Employees | 241 | 4.5% |
| Unpaid Family Workers | 43 | 0.8% |
| Total | 5,291 | 100.0% |
Employment Status by Age in Hampton
According to the labor force statistics for Hampton, out of the total population over 16 years of age (8,563), 64.1% or 5,489 individuals are in the labor force, with 2.2% or 121 of them unemployed. The age group with the highest labor force participation rate is 30 to 34 years, with 98.2% or 382 individuals in the labor force. Within the labor force, the 55 to 59 years age range has the highest percentage of unemployed individuals, with 7.1% or 48 of them being unemployed.
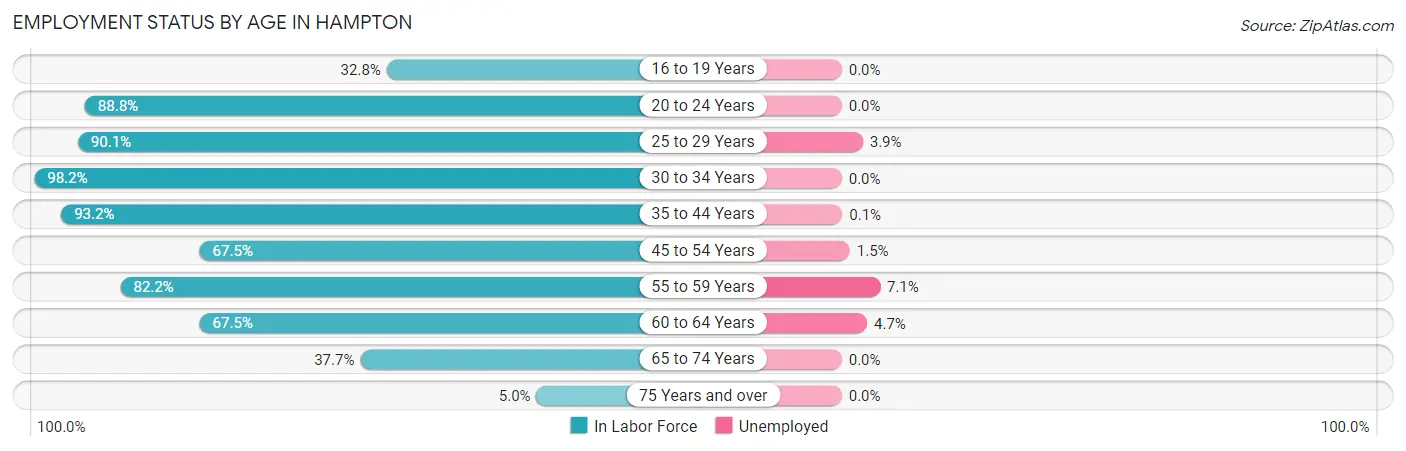
| Age Bracket | In Labor Force | Unemployed |
| 16 to 19 Years | 96 (32.8%) | 0 (0.0%) |
| 20 to 24 Years | 387 (88.8%) | 0 (0.0%) |
| 25 to 29 Years | 638 (90.1%) | 25 (3.9%) |
| 30 to 34 Years | 382 (98.2%) | 0 (0.0%) |
| 35 to 44 Years | 1,075 (93.2%) | 1 (0.1%) |
| 45 to 54 Years | 1,027 (67.5%) | 15 (1.5%) |
| 55 to 59 Years | 679 (82.2%) | 48 (7.1%) |
| 60 to 64 Years | 680 (67.5%) | 32 (4.7%) |
| 65 to 74 Years | 481 (37.7%) | 0 (0.0%) |
| 75 Years and over | 48 (5.0%) | 0 (0.0%) |
| Total | 5,489 (64.1%) | 121 (2.2%) |
Employment Status by Educational Attainment in Hampton
According to labor force statistics for Hampton, 79.9% of individuals (4,478) out of the total population between 25 and 64 years of age (5,605) are in the labor force, with 2.7% or 121 of them being unemployed. The group with the highest labor force participation rate are those with the educational attainment of college / associate degree, with 87.1% or 1,426 individuals in the labor force. Within the labor force, individuals with high school diploma education have the highest percentage of unemployment, with 4.0% or 41 of them being unemployed.
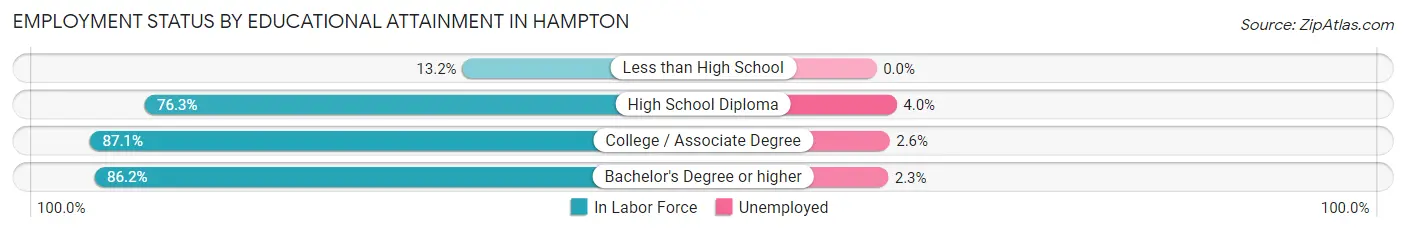
| Educational Attainment | In Labor Force | Unemployed |
| Less than High School | 42 (13.2%) | 0 (0.0%) |
| High School Diploma | 1,033 (76.3%) | 54 (4.0%) |
| College / Associate Degree | 1,426 (87.1%) | 43 (2.6%) |
| Bachelor's Degree or higher | 1,980 (86.2%) | 53 (2.3%) |
| Total | 4,478 (79.9%) | 151 (2.7%) |
Employment Occupations by Sex in Hampton
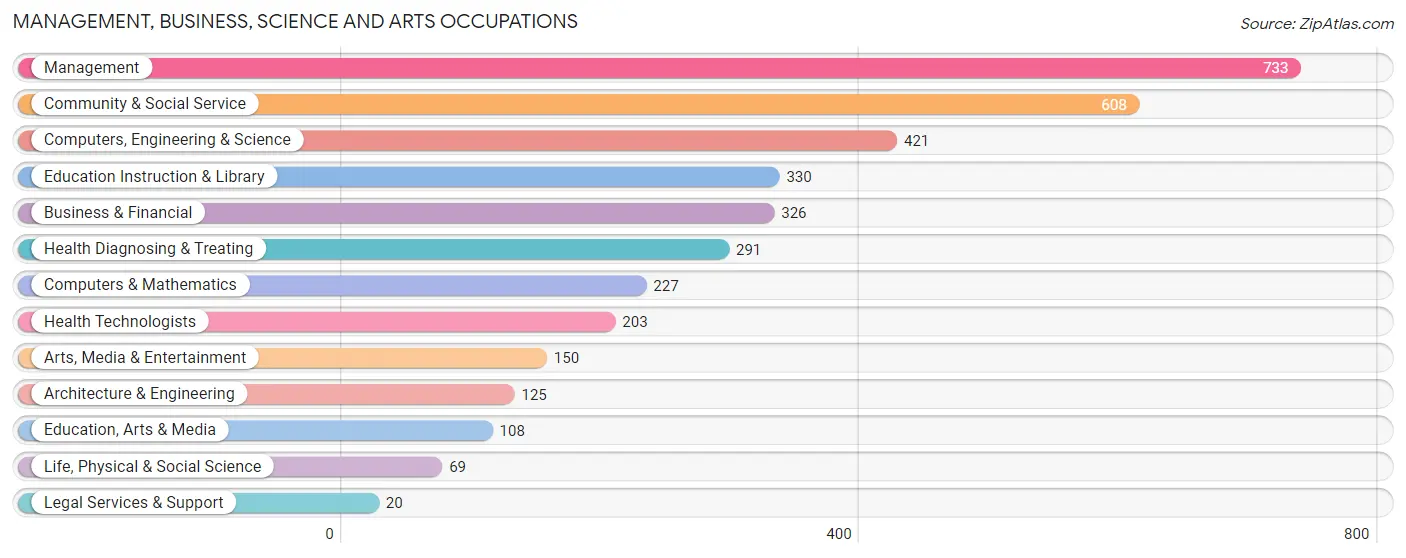
Management, Business, Science and Arts Occupations
The most common Management, Business, Science and Arts occupations in Hampton are Management (733 | 13.9%), Community & Social Service (608 | 11.6%), Computers, Engineering & Science (421 | 8.0%), Education Instruction & Library (330 | 6.3%), and Business & Financial (326 | 6.2%).
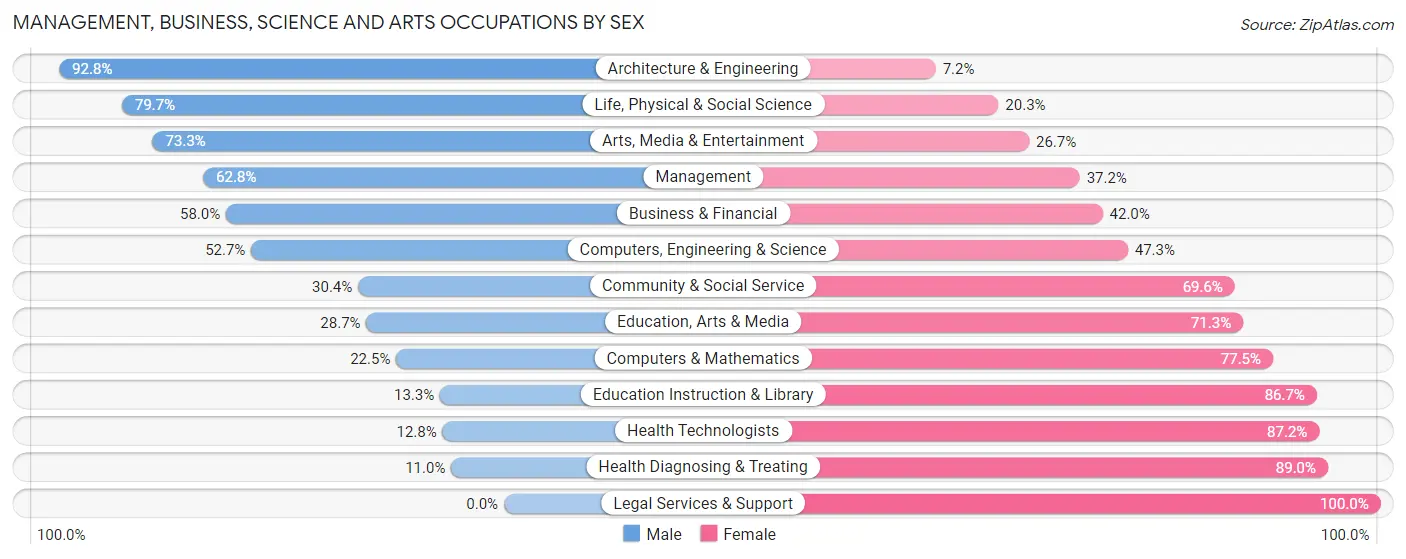
Management, Business, Science and Arts Occupations by Sex
Within the Management, Business, Science and Arts occupations in Hampton, the most male-oriented occupations are Architecture & Engineering (92.8%), Life, Physical & Social Science (79.7%), and Arts, Media & Entertainment (73.3%), while the most female-oriented occupations are Legal Services & Support (100.0%), Health Diagnosing & Treating (89.0%), and Health Technologists (87.2%).
| Occupation | Male | Female |
| Management | 460 (62.8%) | 273 (37.2%) |
| Business & Financial | 189 (58.0%) | 137 (42.0%) |
| Computers, Engineering & Science | 222 (52.7%) | 199 (47.3%) |
| Computers & Mathematics | 51 (22.5%) | 176 (77.5%) |
| Architecture & Engineering | 116 (92.8%) | 9 (7.2%) |
| Life, Physical & Social Science | 55 (79.7%) | 14 (20.3%) |
| Community & Social Service | 185 (30.4%) | 423 (69.6%) |
| Education, Arts & Media | 31 (28.7%) | 77 (71.3%) |
| Legal Services & Support | 0 (0.0%) | 20 (100.0%) |
| Education Instruction & Library | 44 (13.3%) | 286 (86.7%) |
| Arts, Media & Entertainment | 110 (73.3%) | 40 (26.7%) |
| Health Diagnosing & Treating | 32 (11.0%) | 259 (89.0%) |
| Health Technologists | 26 (12.8%) | 177 (87.2%) |
| Total (Category) | 1,088 (45.7%) | 1,291 (54.3%) |
| Total (Overall) | 2,777 (52.8%) | 2,484 (47.2%) |
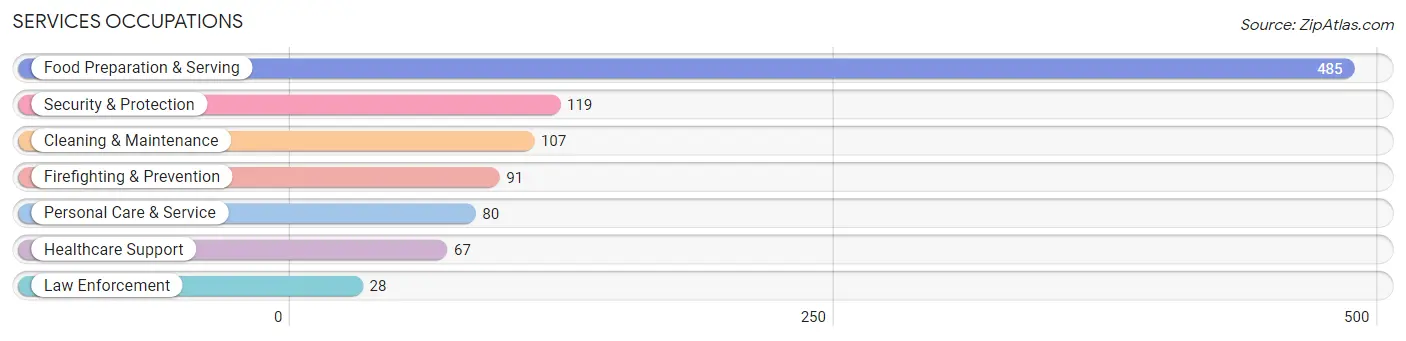
Services Occupations
The most common Services occupations in Hampton are Food Preparation & Serving (485 | 9.2%), Security & Protection (119 | 2.3%), Cleaning & Maintenance (107 | 2.0%), Firefighting & Prevention (91 | 1.7%), and Personal Care & Service (80 | 1.5%).
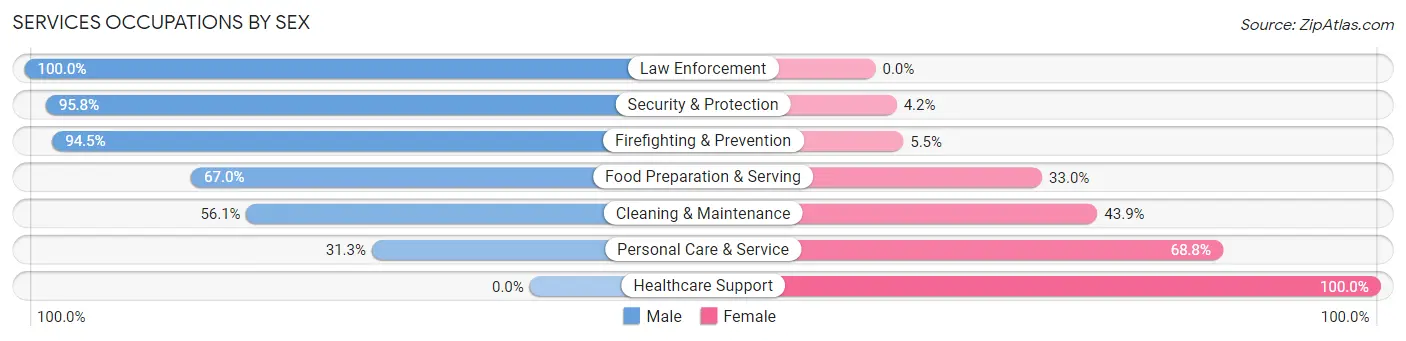
Services Occupations by Sex
Within the Services occupations in Hampton, the most male-oriented occupations are Law Enforcement (100.0%), Security & Protection (95.8%), and Firefighting & Prevention (94.5%), while the most female-oriented occupations are Healthcare Support (100.0%), Personal Care & Service (68.8%), and Cleaning & Maintenance (43.9%).
| Occupation | Male | Female |
| Healthcare Support | 0 (0.0%) | 67 (100.0%) |
| Security & Protection | 114 (95.8%) | 5 (4.2%) |
| Firefighting & Prevention | 86 (94.5%) | 5 (5.5%) |
| Law Enforcement | 28 (100.0%) | 0 (0.0%) |
| Food Preparation & Serving | 325 (67.0%) | 160 (33.0%) |
| Cleaning & Maintenance | 60 (56.1%) | 47 (43.9%) |
| Personal Care & Service | 25 (31.2%) | 55 (68.8%) |
| Total (Category) | 524 (61.1%) | 334 (38.9%) |
| Total (Overall) | 2,777 (52.8%) | 2,484 (47.2%) |
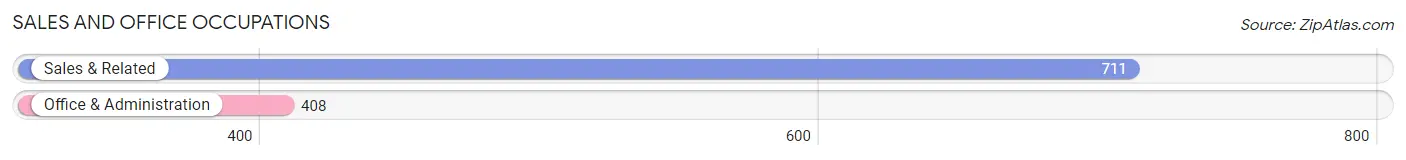
Sales and Office Occupations
The most common Sales and Office occupations in Hampton are Sales & Related (711 | 13.5%), and Office & Administration (408 | 7.8%).
Sales and Office Occupations by Sex
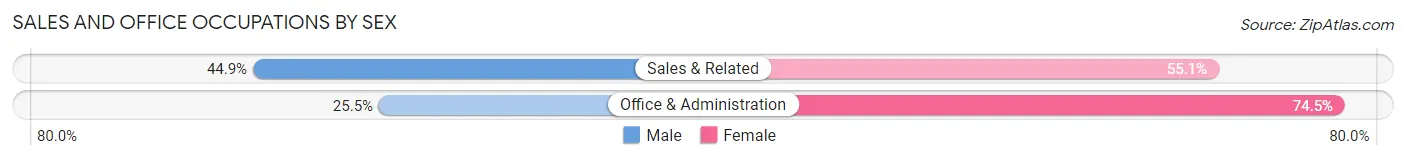
| Occupation | Male | Female |
| Sales & Related | 319 (44.9%) | 392 (55.1%) |
| Office & Administration | 104 (25.5%) | 304 (74.5%) |
| Total (Category) | 423 (37.8%) | 696 (62.2%) |
| Total (Overall) | 2,777 (52.8%) | 2,484 (47.2%) |
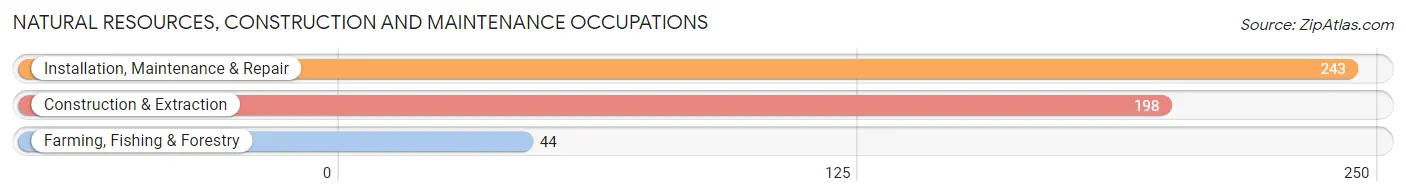
Natural Resources, Construction and Maintenance Occupations
The most common Natural Resources, Construction and Maintenance occupations in Hampton are Installation, Maintenance & Repair (243 | 4.6%), Construction & Extraction (198 | 3.8%), and Farming, Fishing & Forestry (44 | 0.8%).
Natural Resources, Construction and Maintenance Occupations by Sex
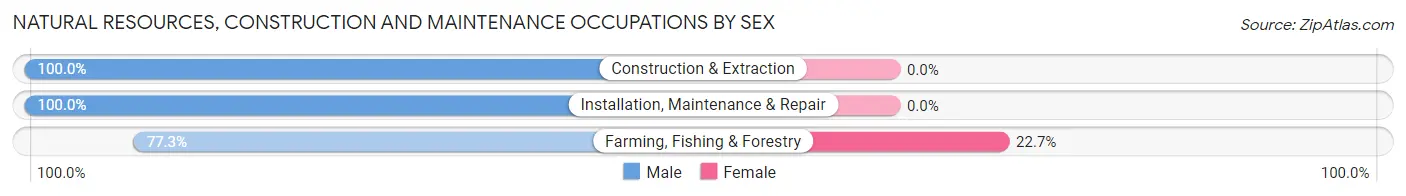
| Occupation | Male | Female |
| Farming, Fishing & Forestry | 34 (77.3%) | 10 (22.7%) |
| Construction & Extraction | 198 (100.0%) | 0 (0.0%) |
| Installation, Maintenance & Repair | 243 (100.0%) | 0 (0.0%) |
| Total (Category) | 475 (97.9%) | 10 (2.1%) |
| Total (Overall) | 2,777 (52.8%) | 2,484 (47.2%) |
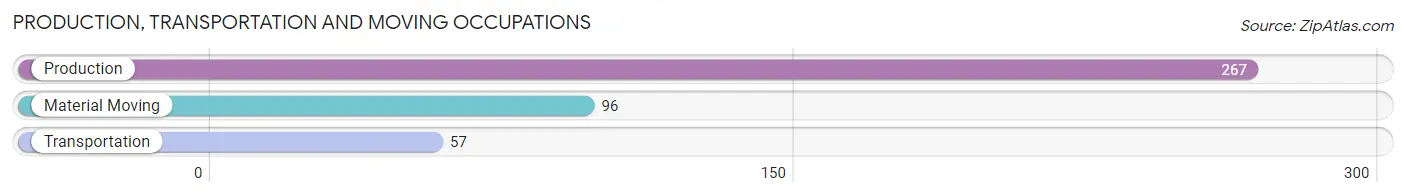
Production, Transportation and Moving Occupations
The most common Production, Transportation and Moving occupations in Hampton are Production (267 | 5.1%), Material Moving (96 | 1.8%), and Transportation (57 | 1.1%).
Production, Transportation and Moving Occupations by Sex
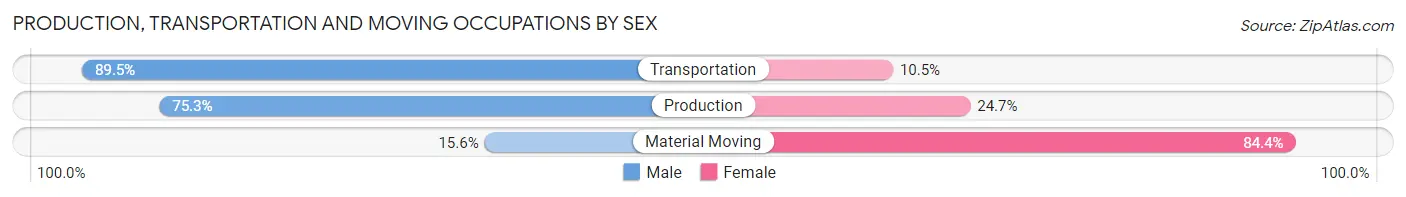
| Occupation | Male | Female |
| Production | 201 (75.3%) | 66 (24.7%) |
| Transportation | 51 (89.5%) | 6 (10.5%) |
| Material Moving | 15 (15.6%) | 81 (84.4%) |
| Total (Category) | 267 (63.6%) | 153 (36.4%) |
| Total (Overall) | 2,777 (52.8%) | 2,484 (47.2%) |
Employment Industries by Sex in Hampton
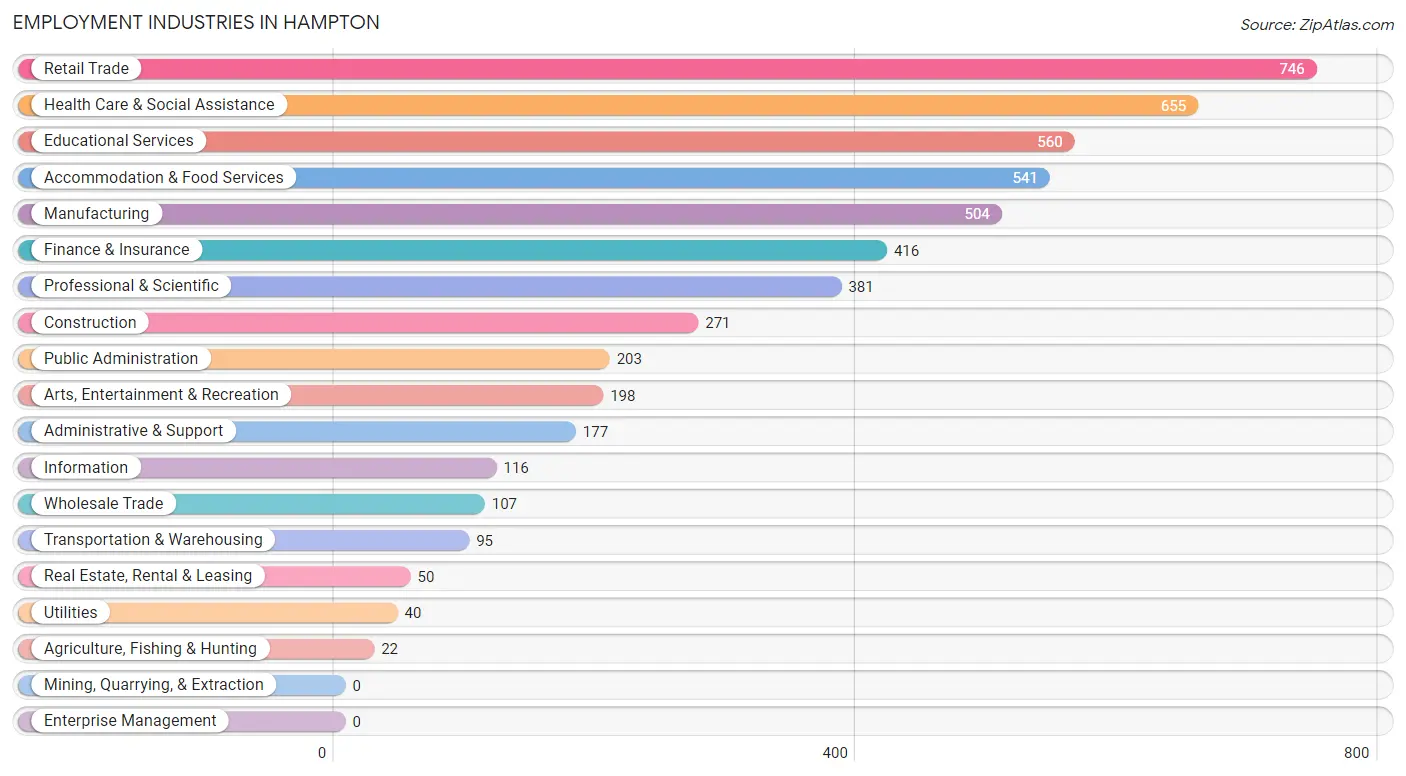
Employment Industries in Hampton
The major employment industries in Hampton include Retail Trade (746 | 14.2%), Health Care & Social Assistance (655 | 12.4%), Educational Services (560 | 10.6%), Accommodation & Food Services (541 | 10.3%), and Manufacturing (504 | 9.6%).
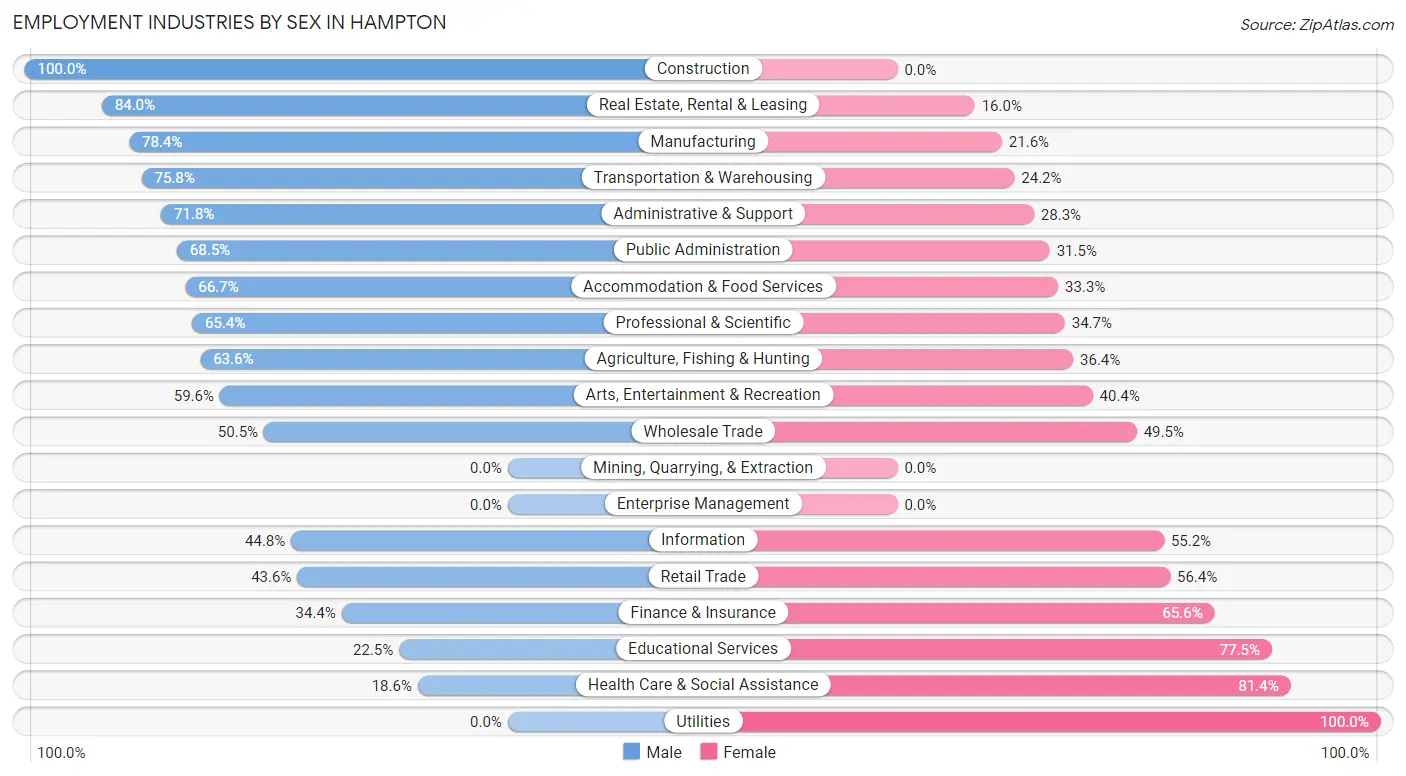
Employment Industries by Sex in Hampton
The Hampton industries that see more men than women are Construction (100.0%), Real Estate, Rental & Leasing (84.0%), and Manufacturing (78.4%), whereas the industries that tend to have a higher number of women are Utilities (100.0%), Health Care & Social Assistance (81.4%), and Educational Services (77.5%).
| Industry | Male | Female |
| Agriculture, Fishing & Hunting | 14 (63.6%) | 8 (36.4%) |
| Mining, Quarrying, & Extraction | 0 (0.0%) | 0 (0.0%) |
| Construction | 271 (100.0%) | 0 (0.0%) |
| Manufacturing | 395 (78.4%) | 109 (21.6%) |
| Wholesale Trade | 54 (50.5%) | 53 (49.5%) |
| Retail Trade | 325 (43.6%) | 421 (56.4%) |
| Transportation & Warehousing | 72 (75.8%) | 23 (24.2%) |
| Utilities | 0 (0.0%) | 40 (100.0%) |
| Information | 52 (44.8%) | 64 (55.2%) |
| Finance & Insurance | 143 (34.4%) | 273 (65.6%) |
| Real Estate, Rental & Leasing | 42 (84.0%) | 8 (16.0%) |
| Professional & Scientific | 249 (65.3%) | 132 (34.6%) |
| Enterprise Management | 0 (0.0%) | 0 (0.0%) |
| Administrative & Support | 127 (71.8%) | 50 (28.2%) |
| Educational Services | 126 (22.5%) | 434 (77.5%) |
| Health Care & Social Assistance | 122 (18.6%) | 533 (81.4%) |
| Arts, Entertainment & Recreation | 118 (59.6%) | 80 (40.4%) |
| Accommodation & Food Services | 361 (66.7%) | 180 (33.3%) |
| Public Administration | 139 (68.5%) | 64 (31.5%) |
| Total | 2,777 (52.8%) | 2,484 (47.2%) |
Education in Hampton
School Enrollment in Hampton
The most common levels of schooling among the 1,749 students in Hampton are elementary school (527 | 30.1%), high school (393 | 22.5%), and middle school (376 | 21.5%).
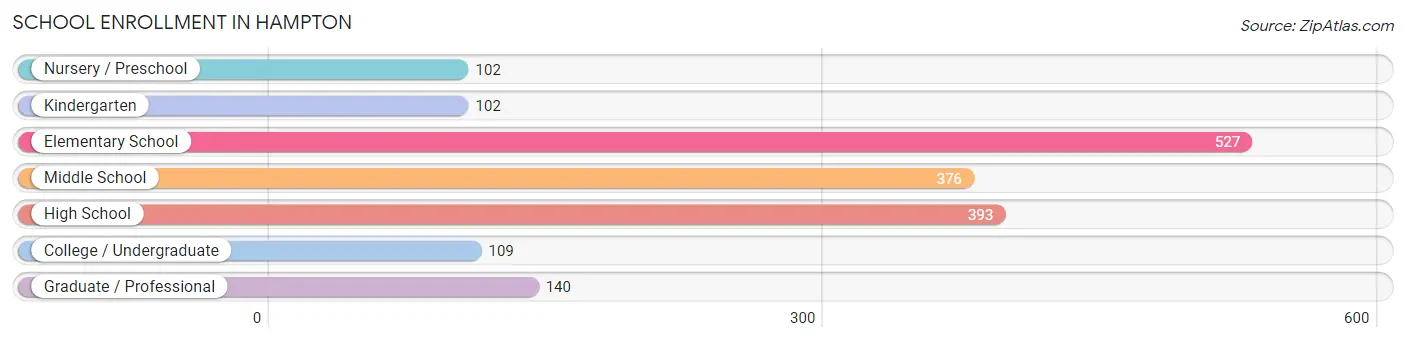
| School Level | # Students | % Students |
| Nursery / Preschool | 102 | 5.8% |
| Kindergarten | 102 | 5.8% |
| Elementary School | 527 | 30.1% |
| Middle School | 376 | 21.5% |
| High School | 393 | 22.5% |
| College / Undergraduate | 109 | 6.2% |
| Graduate / Professional | 140 | 8.0% |
| Total | 1,749 | 100.0% |
School Enrollment by Age by Funding Source in Hampton
Out of a total of 1,749 students who are enrolled in schools in Hampton, 203 (11.6%) attend a private institution, while the remaining 1,546 (88.4%) are enrolled in public schools. The age group of 20 to 24 year olds has the highest likelihood of being enrolled in private schools, with 79 (58.5% in the age bracket) enrolled. Conversely, the age group of 15 to 17 year olds has the lowest likelihood of being enrolled in a private school, with 316 (100.0% in the age bracket) attending a public institution.
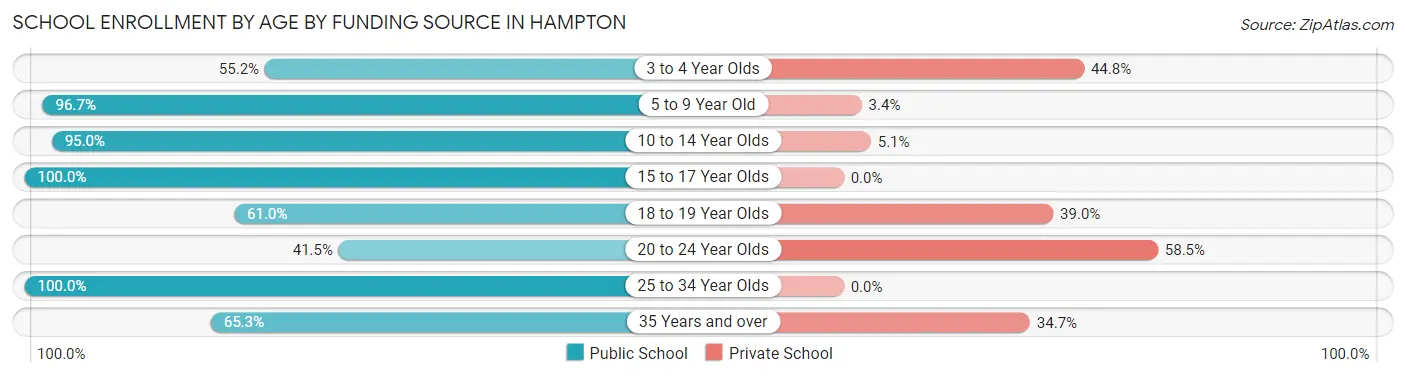
| Age Bracket | Public School | Private School |
| 3 to 4 Year Olds | 58 (55.2%) | 47 (44.8%) |
| 5 to 9 Year Old | 548 (96.7%) | 19 (3.4%) |
| 10 to 14 Year Olds | 470 (95.0%) | 25 (5.1%) |
| 15 to 17 Year Olds | 316 (100.0%) | 0 (0.0%) |
| 18 to 19 Year Olds | 25 (61.0%) | 16 (39.0%) |
| 20 to 24 Year Olds | 56 (41.5%) | 79 (58.5%) |
| 25 to 34 Year Olds | 41 (100.0%) | 0 (0.0%) |
| 35 Years and over | 32 (65.3%) | 17 (34.7%) |
| Total | 1,546 (88.4%) | 203 (11.6%) |
Educational Attainment by Field of Study in Hampton
Business (859 | 24.2%), education (467 | 13.2%), arts & humanities (361 | 10.2%), science & technology (296 | 8.4%), and bio, nature & agricultural (259 | 7.3%) are the most common fields of study among 3,544 individuals in Hampton who have obtained a bachelor's degree or higher.
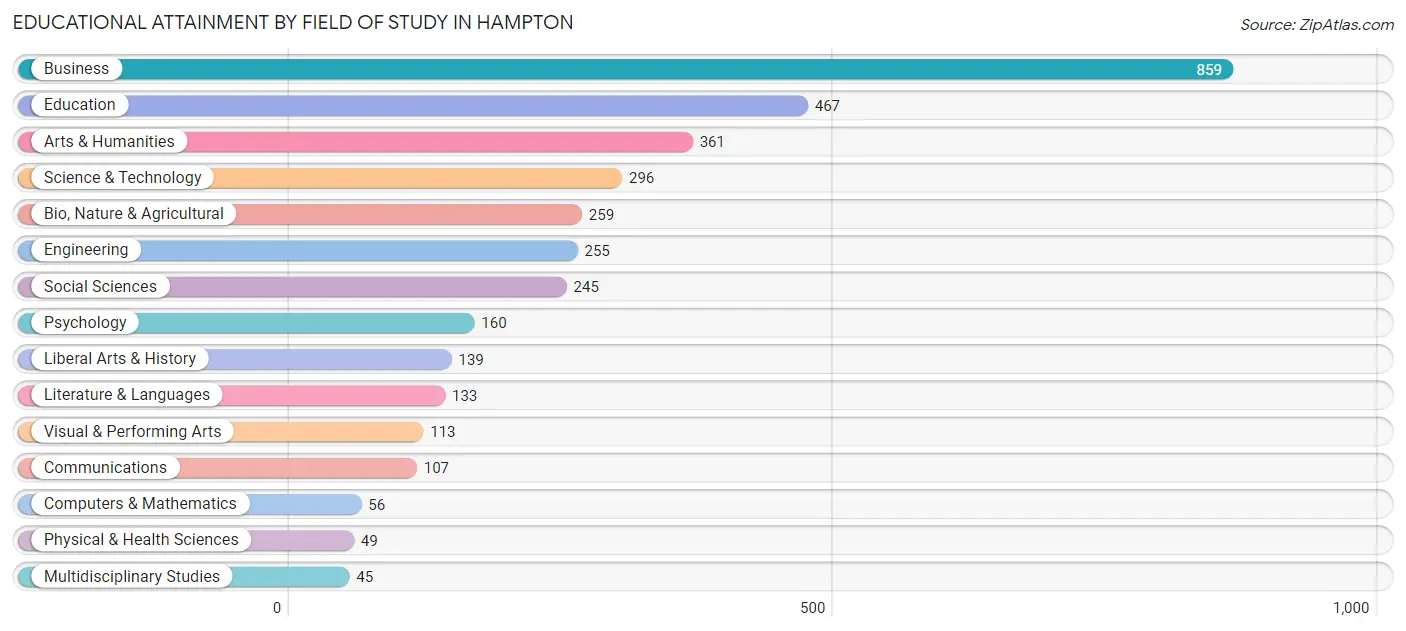
| Field of Study | # Graduates | % Graduates |
| Computers & Mathematics | 56 | 1.6% |
| Bio, Nature & Agricultural | 259 | 7.3% |
| Physical & Health Sciences | 49 | 1.4% |
| Psychology | 160 | 4.5% |
| Social Sciences | 245 | 6.9% |
| Engineering | 255 | 7.2% |
| Multidisciplinary Studies | 45 | 1.3% |
| Science & Technology | 296 | 8.4% |
| Business | 859 | 24.2% |
| Education | 467 | 13.2% |
| Literature & Languages | 133 | 3.7% |
| Liberal Arts & History | 139 | 3.9% |
| Visual & Performing Arts | 113 | 3.2% |
| Communications | 107 | 3.0% |
| Arts & Humanities | 361 | 10.2% |
| Total | 3,544 | 100.0% |
Transportation & Commute in Hampton
Vehicle Availability by Sex in Hampton
The most prevalent vehicle ownership categories in Hampton are males with 2 vehicles (1,490, accounting for 53.8%) and females with 2 vehicles (1,221, making up 59.9%).
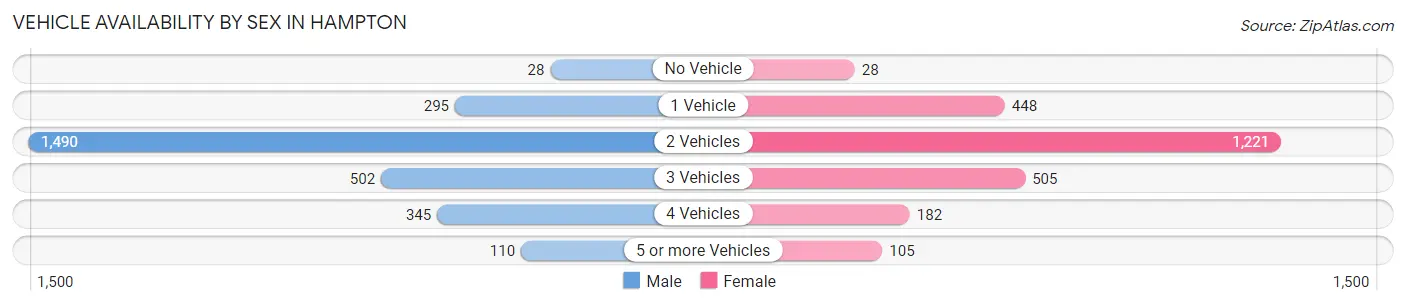
| Vehicles Available | Male | Female |
| No Vehicle | 28 (1.0%) | 28 (1.1%) |
| 1 Vehicle | 295 (10.6%) | 448 (18.0%) |
| 2 Vehicles | 1,490 (53.8%) | 1,221 (49.1%) |
| 3 Vehicles | 502 (18.1%) | 505 (20.3%) |
| 4 Vehicles | 345 (12.4%) | 182 (7.3%) |
| 5 or more Vehicles | 110 (4.0%) | 105 (4.2%) |
| Total | 2,770 (100.0%) | 2,489 (100.0%) |
Commute Time in Hampton
The most frequently occuring commute durations in Hampton are 20 to 24 minutes (674 commuters, 15.5%), 15 to 19 minutes (617 commuters, 14.2%), and 5 to 9 minutes (575 commuters, 13.3%).
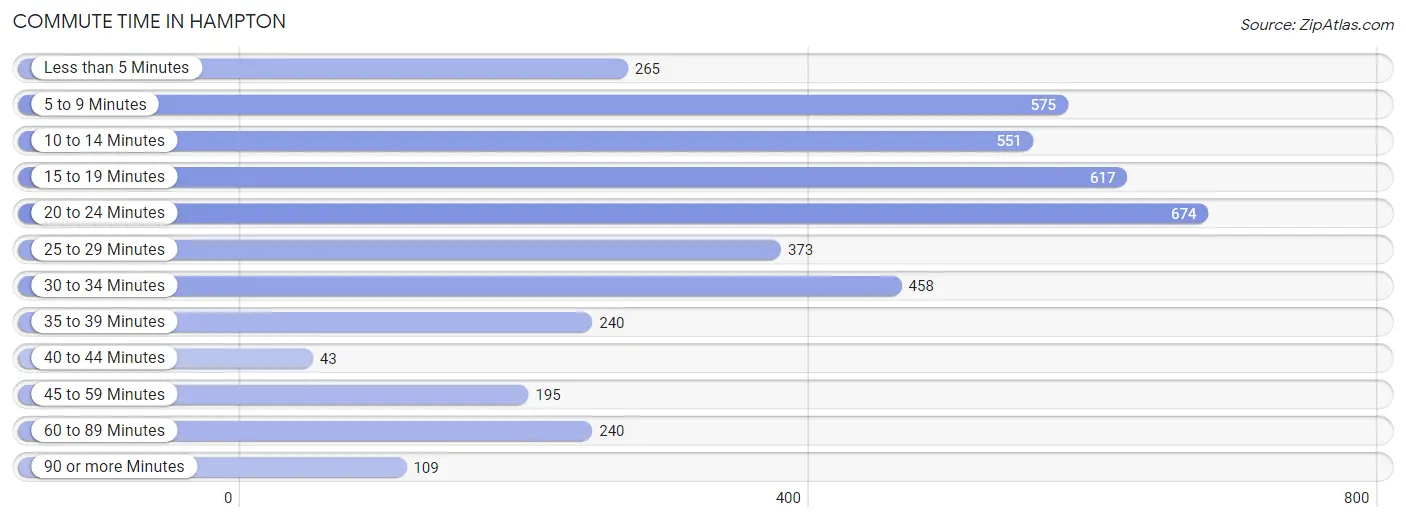
| Commute Time | # Commuters | % Commuters |
| Less than 5 Minutes | 265 | 6.1% |
| 5 to 9 Minutes | 575 | 13.3% |
| 10 to 14 Minutes | 551 | 12.7% |
| 15 to 19 Minutes | 617 | 14.2% |
| 20 to 24 Minutes | 674 | 15.5% |
| 25 to 29 Minutes | 373 | 8.6% |
| 30 to 34 Minutes | 458 | 10.5% |
| 35 to 39 Minutes | 240 | 5.5% |
| 40 to 44 Minutes | 43 | 1.0% |
| 45 to 59 Minutes | 195 | 4.5% |
| 60 to 89 Minutes | 240 | 5.5% |
| 90 or more Minutes | 109 | 2.5% |
Commute Time by Sex in Hampton
The most common commute times in Hampton are 20 to 24 minutes (367 commuters, 16.1%) for males and 5 to 9 minutes (372 commuters, 18.1%) for females.
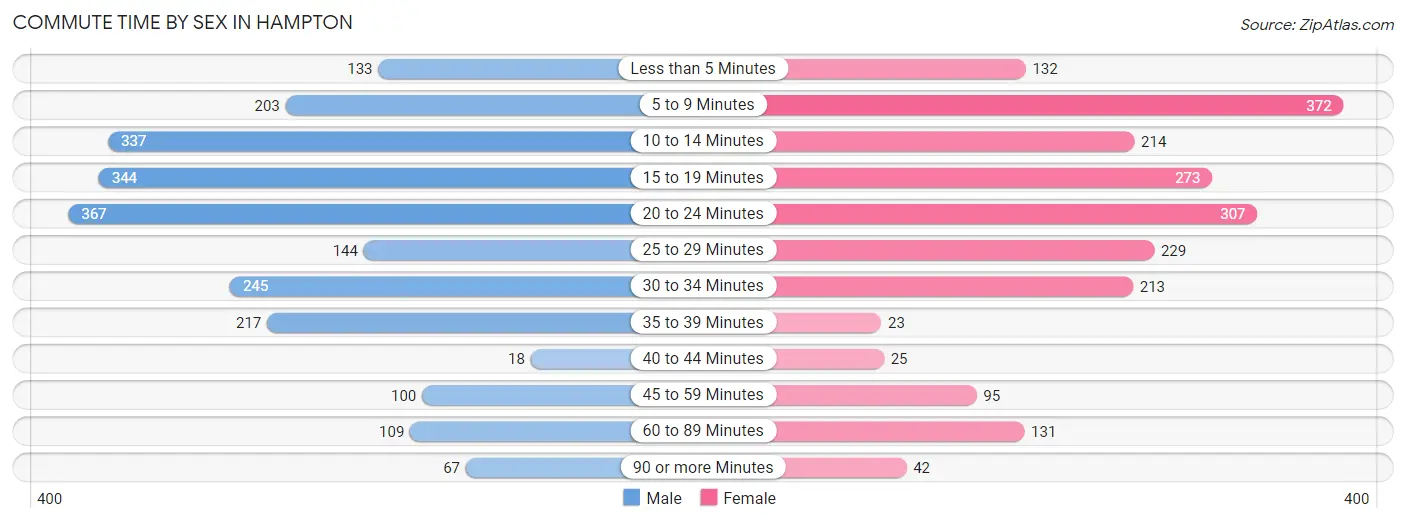
| Commute Time | Male | Female |
| Less than 5 Minutes | 133 (5.8%) | 132 (6.4%) |
| 5 to 9 Minutes | 203 (8.9%) | 372 (18.1%) |
| 10 to 14 Minutes | 337 (14.7%) | 214 (10.4%) |
| 15 to 19 Minutes | 344 (15.1%) | 273 (13.3%) |
| 20 to 24 Minutes | 367 (16.1%) | 307 (14.9%) |
| 25 to 29 Minutes | 144 (6.3%) | 229 (11.1%) |
| 30 to 34 Minutes | 245 (10.7%) | 213 (10.4%) |
| 35 to 39 Minutes | 217 (9.5%) | 23 (1.1%) |
| 40 to 44 Minutes | 18 (0.8%) | 25 (1.2%) |
| 45 to 59 Minutes | 100 (4.4%) | 95 (4.6%) |
| 60 to 89 Minutes | 109 (4.8%) | 131 (6.4%) |
| 90 or more Minutes | 67 (2.9%) | 42 (2.0%) |
Time of Departure to Work by Sex in Hampton
The most frequent times of departure to work in Hampton are 7:30 AM to 7:59 AM (389, 17.0%) for males and 7:30 AM to 7:59 AM (462, 22.5%) for females.
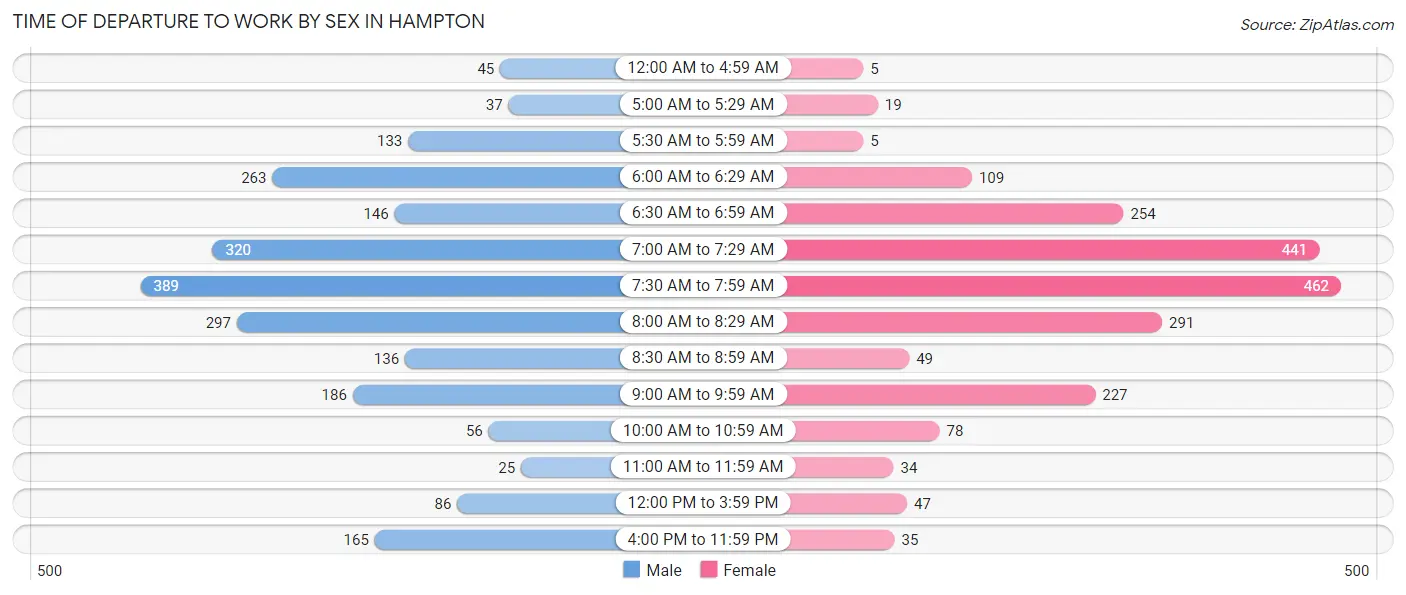
| Time of Departure | Male | Female |
| 12:00 AM to 4:59 AM | 45 (2.0%) | 5 (0.2%) |
| 5:00 AM to 5:29 AM | 37 (1.6%) | 19 (0.9%) |
| 5:30 AM to 5:59 AM | 133 (5.8%) | 5 (0.2%) |
| 6:00 AM to 6:29 AM | 263 (11.5%) | 109 (5.3%) |
| 6:30 AM to 6:59 AM | 146 (6.4%) | 254 (12.3%) |
| 7:00 AM to 7:29 AM | 320 (14.0%) | 441 (21.4%) |
| 7:30 AM to 7:59 AM | 389 (17.0%) | 462 (22.5%) |
| 8:00 AM to 8:29 AM | 297 (13.0%) | 291 (14.1%) |
| 8:30 AM to 8:59 AM | 136 (5.9%) | 49 (2.4%) |
| 9:00 AM to 9:59 AM | 186 (8.1%) | 227 (11.0%) |
| 10:00 AM to 10:59 AM | 56 (2.5%) | 78 (3.8%) |
| 11:00 AM to 11:59 AM | 25 (1.1%) | 34 (1.7%) |
| 12:00 PM to 3:59 PM | 86 (3.8%) | 47 (2.3%) |
| 4:00 PM to 11:59 PM | 165 (7.2%) | 35 (1.7%) |
| Total | 2,284 (100.0%) | 2,056 (100.0%) |
Housing Occupancy in Hampton
Occupancy by Ownership in Hampton
Of the total 4,246 dwellings in Hampton, owner-occupied units account for 3,276 (77.1%), while renter-occupied units make up 970 (22.9%).
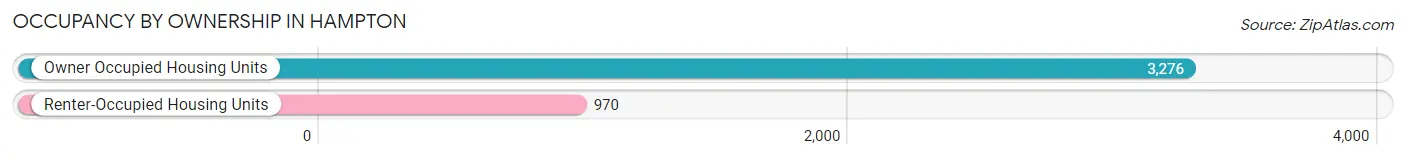
| Occupancy | # Housing Units | % Housing Units |
| Owner Occupied Housing Units | 3,276 | 77.1% |
| Renter-Occupied Housing Units | 970 | 22.9% |
| Total Occupied Housing Units | 4,246 | 100.0% |
Occupancy by Household Size in Hampton
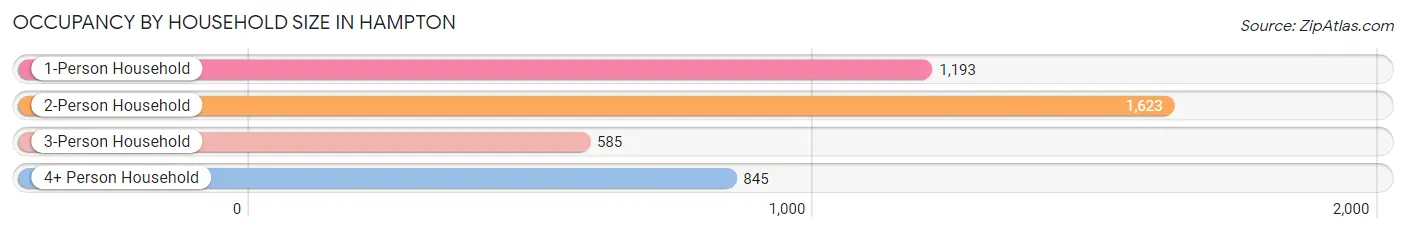
| Household Size | # Housing Units | % Housing Units |
| 1-Person Household | 1,193 | 28.1% |
| 2-Person Household | 1,623 | 38.2% |
| 3-Person Household | 585 | 13.8% |
| 4+ Person Household | 845 | 19.9% |
| Total Housing Units | 4,246 | 100.0% |
Occupancy by Ownership by Household Size in Hampton
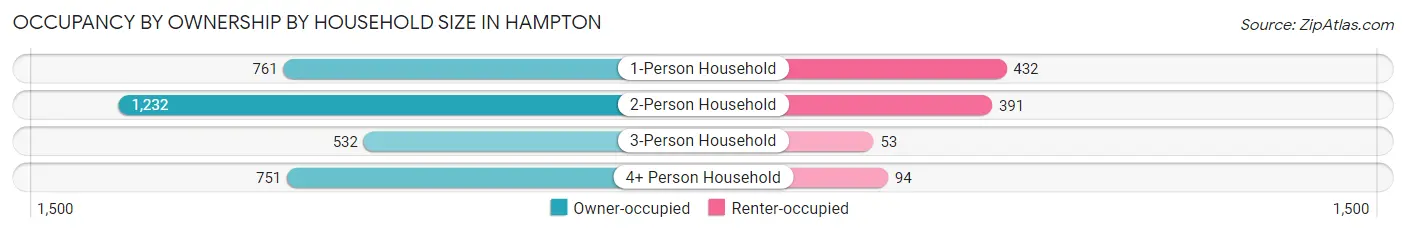
| Household Size | Owner-occupied | Renter-occupied |
| 1-Person Household | 761 (63.8%) | 432 (36.2%) |
| 2-Person Household | 1,232 (75.9%) | 391 (24.1%) |
| 3-Person Household | 532 (90.9%) | 53 (9.1%) |
| 4+ Person Household | 751 (88.9%) | 94 (11.1%) |
| Total Housing Units | 3,276 (77.1%) | 970 (22.9%) |
Occupancy by Educational Attainment in Hampton
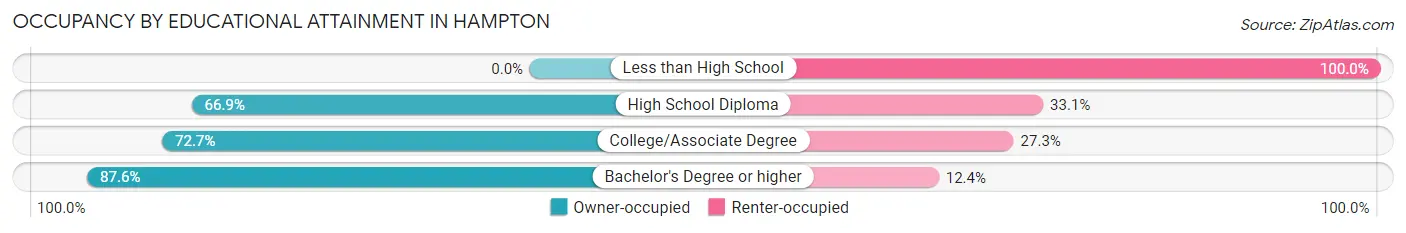
| Household Size | Owner-occupied | Renter-occupied |
| Less than High School | 0 (0.0%) | 65 (100.0%) |
| High School Diploma | 600 (66.9%) | 297 (33.1%) |
| College/Associate Degree | 982 (72.7%) | 368 (27.3%) |
| Bachelor's Degree or higher | 1,694 (87.6%) | 240 (12.4%) |
Occupancy by Age of Householder in Hampton
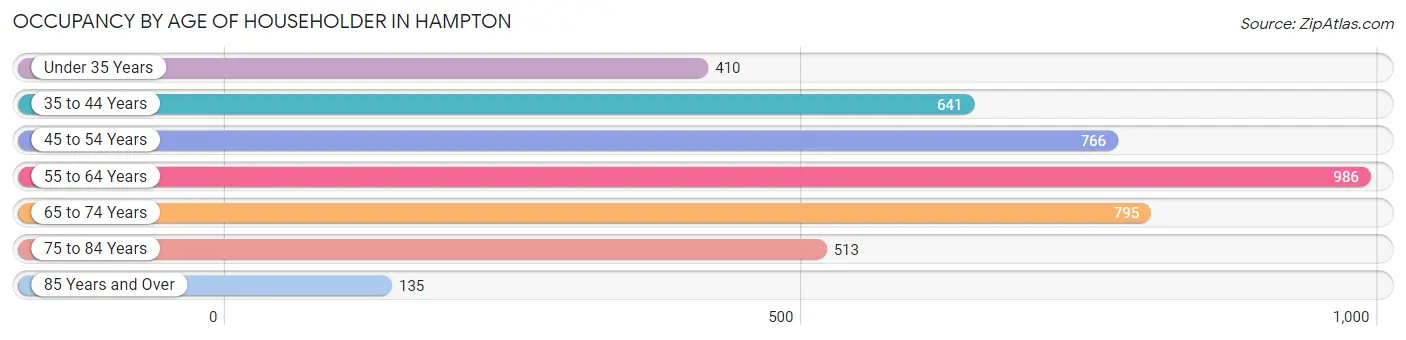
| Age Bracket | # Households | % Households |
| Under 35 Years | 410 | 9.7% |
| 35 to 44 Years | 641 | 15.1% |
| 45 to 54 Years | 766 | 18.0% |
| 55 to 64 Years | 986 | 23.2% |
| 65 to 74 Years | 795 | 18.7% |
| 75 to 84 Years | 513 | 12.1% |
| 85 Years and Over | 135 | 3.2% |
| Total | 4,246 | 100.0% |
Housing Finances in Hampton
Median Income by Occupancy in Hampton
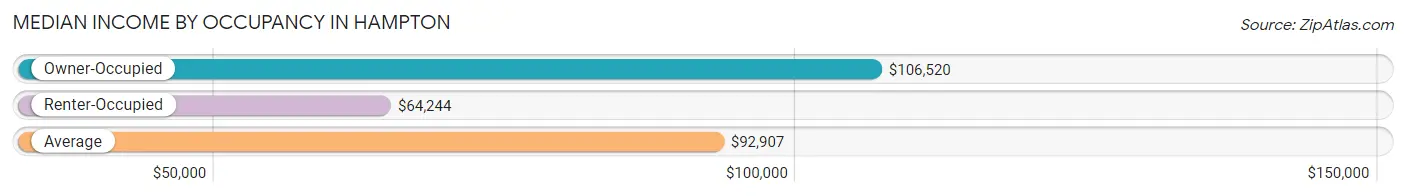
| Occupancy Type | # Households | Median Income |
| Owner-Occupied | 3,276 (77.1%) | $106,520 |
| Renter-Occupied | 970 (22.9%) | $64,244 |
| Average | 4,246 (100.0%) | $92,907 |
Occupancy by Householder Income Bracket in Hampton
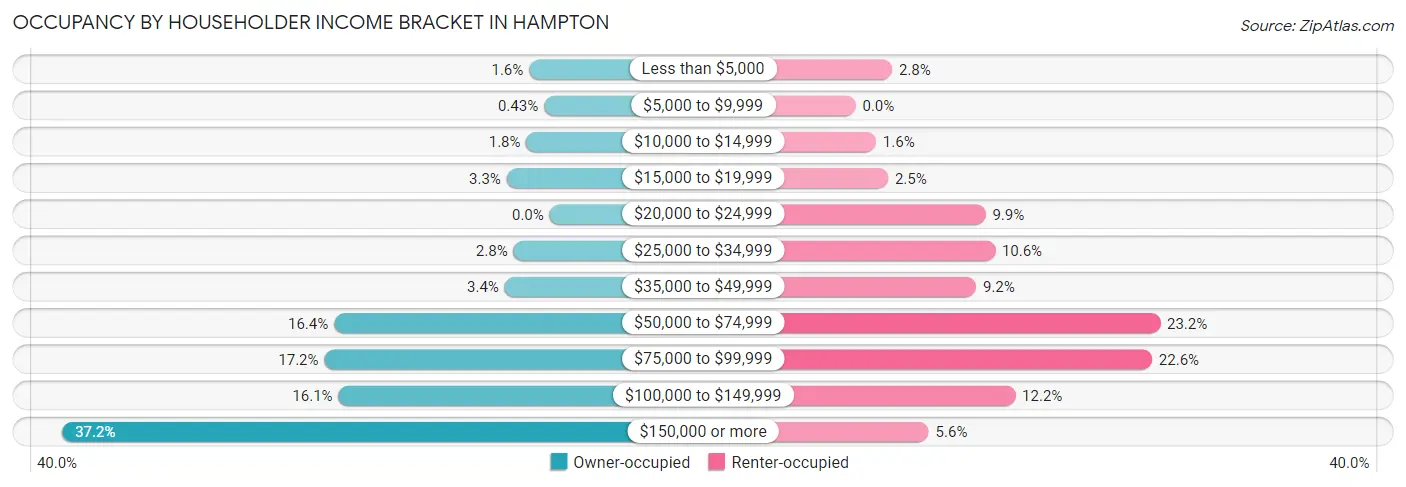
| Income Bracket | Owner-occupied | Renter-occupied |
| Less than $5,000 | 51 (1.6%) | 27 (2.8%) |
| $5,000 to $9,999 | 14 (0.4%) | 0 (0.0%) |
| $10,000 to $14,999 | 58 (1.8%) | 15 (1.5%) |
| $15,000 to $19,999 | 107 (3.3%) | 24 (2.5%) |
| $20,000 to $24,999 | 0 (0.0%) | 96 (9.9%) |
| $25,000 to $34,999 | 90 (2.8%) | 103 (10.6%) |
| $35,000 to $49,999 | 112 (3.4%) | 89 (9.2%) |
| $50,000 to $74,999 | 538 (16.4%) | 225 (23.2%) |
| $75,000 to $99,999 | 562 (17.2%) | 219 (22.6%) |
| $100,000 to $149,999 | 527 (16.1%) | 118 (12.2%) |
| $150,000 or more | 1,217 (37.1%) | 54 (5.6%) |
| Total | 3,276 (100.0%) | 970 (100.0%) |
Monthly Housing Cost Tiers in Hampton
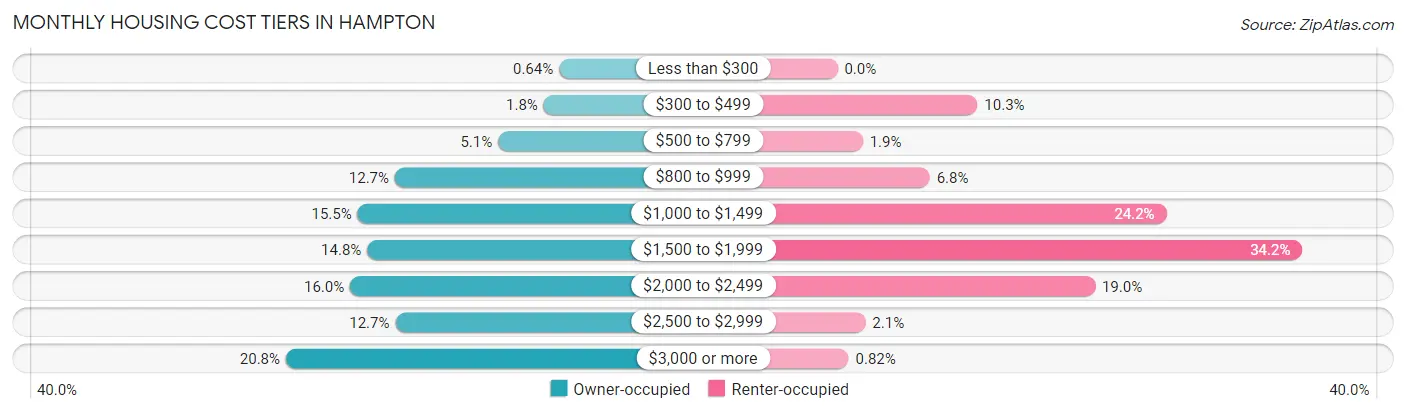
| Monthly Cost | Owner-occupied | Renter-occupied |
| Less than $300 | 21 (0.6%) | 0 (0.0%) |
| $300 to $499 | 58 (1.8%) | 100 (10.3%) |
| $500 to $799 | 168 (5.1%) | 18 (1.9%) |
| $800 to $999 | 417 (12.7%) | 66 (6.8%) |
| $1,000 to $1,499 | 507 (15.5%) | 235 (24.2%) |
| $1,500 to $1,999 | 484 (14.8%) | 332 (34.2%) |
| $2,000 to $2,499 | 525 (16.0%) | 184 (19.0%) |
| $2,500 to $2,999 | 416 (12.7%) | 20 (2.1%) |
| $3,000 or more | 680 (20.8%) | 8 (0.8%) |
| Total | 3,276 (100.0%) | 970 (100.0%) |
Physical Housing Characteristics in Hampton
Housing Structures in Hampton
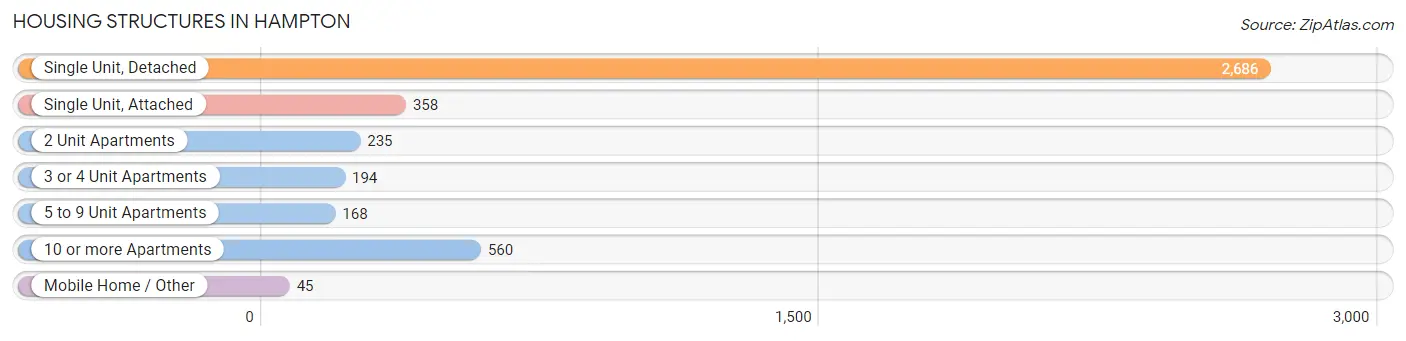
| Structure Type | # Housing Units | % Housing Units |
| Single Unit, Detached | 2,686 | 63.3% |
| Single Unit, Attached | 358 | 8.4% |
| 2 Unit Apartments | 235 | 5.5% |
| 3 or 4 Unit Apartments | 194 | 4.6% |
| 5 to 9 Unit Apartments | 168 | 4.0% |
| 10 or more Apartments | 560 | 13.2% |
| Mobile Home / Other | 45 | 1.1% |
| Total | 4,246 | 100.0% |
Housing Structures by Occupancy in Hampton
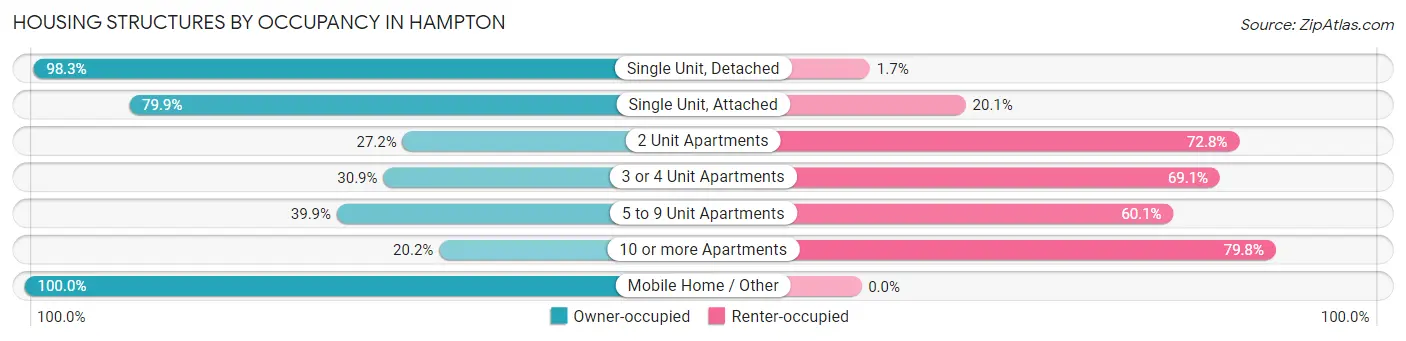
| Structure Type | Owner-occupied | Renter-occupied |
| Single Unit, Detached | 2,641 (98.3%) | 45 (1.7%) |
| Single Unit, Attached | 286 (79.9%) | 72 (20.1%) |
| 2 Unit Apartments | 64 (27.2%) | 171 (72.8%) |
| 3 or 4 Unit Apartments | 60 (30.9%) | 134 (69.1%) |
| 5 to 9 Unit Apartments | 67 (39.9%) | 101 (60.1%) |
| 10 or more Apartments | 113 (20.2%) | 447 (79.8%) |
| Mobile Home / Other | 45 (100.0%) | 0 (0.0%) |
| Total | 3,276 (77.1%) | 970 (22.9%) |
Housing Structures by Number of Rooms in Hampton
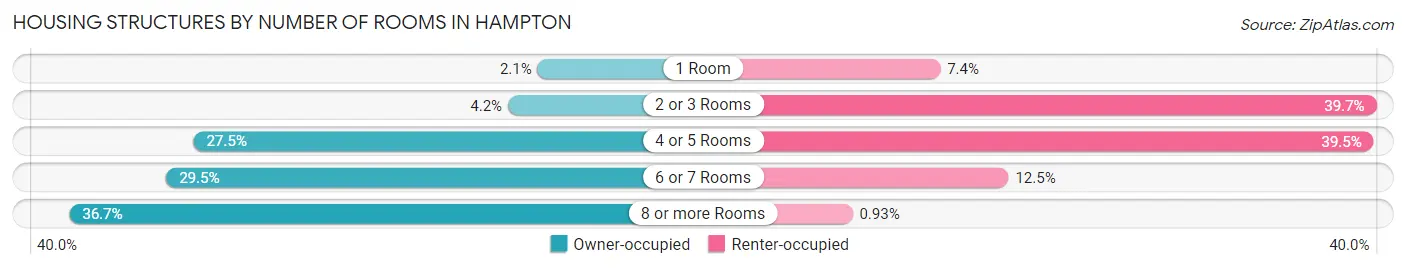
| Number of Rooms | Owner-occupied | Renter-occupied |
| 1 Room | 67 (2.1%) | 72 (7.4%) |
| 2 or 3 Rooms | 139 (4.2%) | 385 (39.7%) |
| 4 or 5 Rooms | 901 (27.5%) | 383 (39.5%) |
| 6 or 7 Rooms | 967 (29.5%) | 121 (12.5%) |
| 8 or more Rooms | 1,202 (36.7%) | 9 (0.9%) |
| Total | 3,276 (100.0%) | 970 (100.0%) |
Housing Structure by Heating Type in Hampton
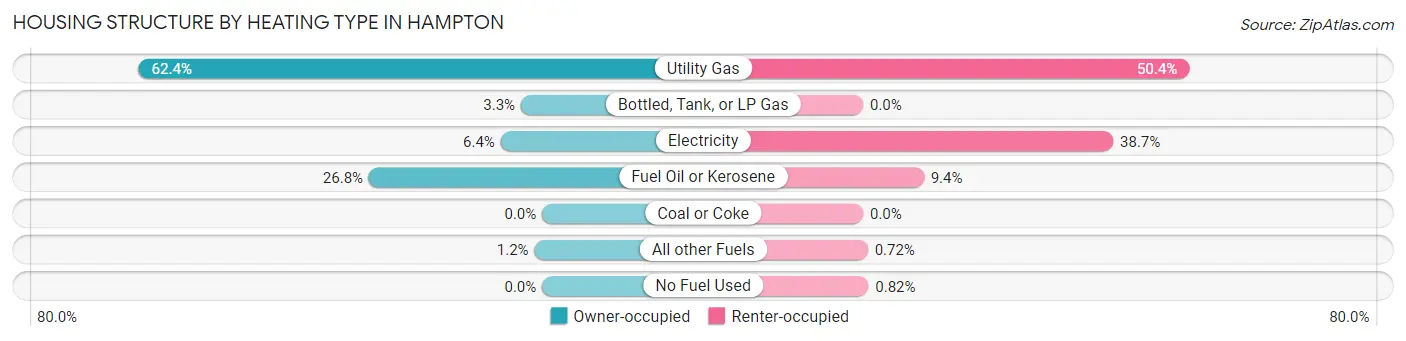
| Heating Type | Owner-occupied | Renter-occupied |
| Utility Gas | 2,043 (62.4%) | 489 (50.4%) |
| Bottled, Tank, or LP Gas | 107 (3.3%) | 0 (0.0%) |
| Electricity | 210 (6.4%) | 375 (38.7%) |
| Fuel Oil or Kerosene | 877 (26.8%) | 91 (9.4%) |
| Coal or Coke | 0 (0.0%) | 0 (0.0%) |
| All other Fuels | 39 (1.2%) | 7 (0.7%) |
| No Fuel Used | 0 (0.0%) | 8 (0.8%) |
| Total | 3,276 (100.0%) | 970 (100.0%) |
Household Vehicle Usage in Hampton
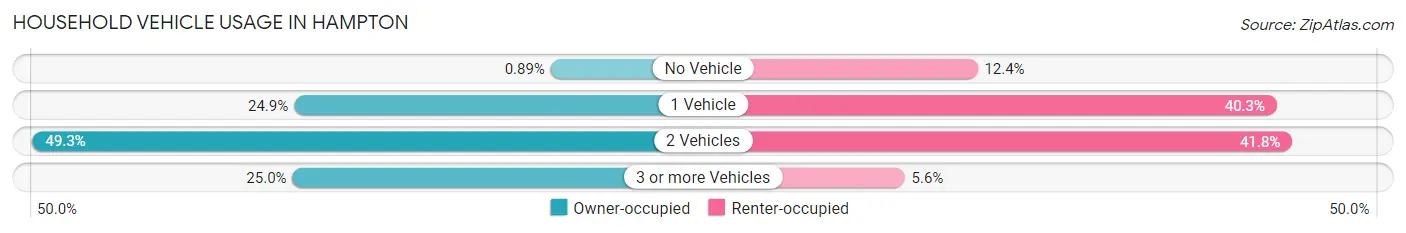
| Vehicles per Household | Owner-occupied | Renter-occupied |
| No Vehicle | 29 (0.9%) | 120 (12.4%) |
| 1 Vehicle | 814 (24.8%) | 391 (40.3%) |
| 2 Vehicles | 1,614 (49.3%) | 405 (41.7%) |
| 3 or more Vehicles | 819 (25.0%) | 54 (5.6%) |
| Total | 3,276 (100.0%) | 970 (100.0%) |
Real Estate & Mortgages in Hampton
Real Estate and Mortgage Overview in Hampton
| Characteristic | Without Mortgage | With Mortgage |
| Housing Units | 968 | 2,308 |
| Median Property Value | $418,400 | $465,000 |
| Median Household Income | $87,500 | $961 |
| Monthly Housing Costs | $944 | $680 |
| Real Estate Taxes | $6,311 | $70 |
Property Value by Mortgage Status in Hampton
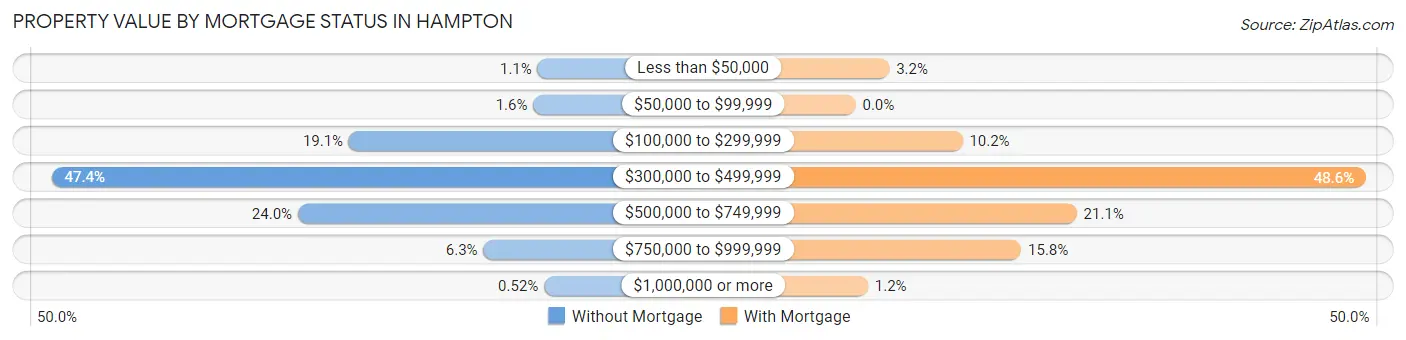
| Property Value | Without Mortgage | With Mortgage |
| Less than $50,000 | 11 (1.1%) | 74 (3.2%) |
| $50,000 to $99,999 | 15 (1.5%) | 0 (0.0%) |
| $100,000 to $299,999 | 185 (19.1%) | 235 (10.2%) |
| $300,000 to $499,999 | 459 (47.4%) | 1,122 (48.6%) |
| $500,000 to $749,999 | 232 (24.0%) | 486 (21.1%) |
| $750,000 to $999,999 | 61 (6.3%) | 364 (15.8%) |
| $1,000,000 or more | 5 (0.5%) | 27 (1.2%) |
| Total | 968 (100.0%) | 2,308 (100.0%) |
Household Income by Mortgage Status in Hampton
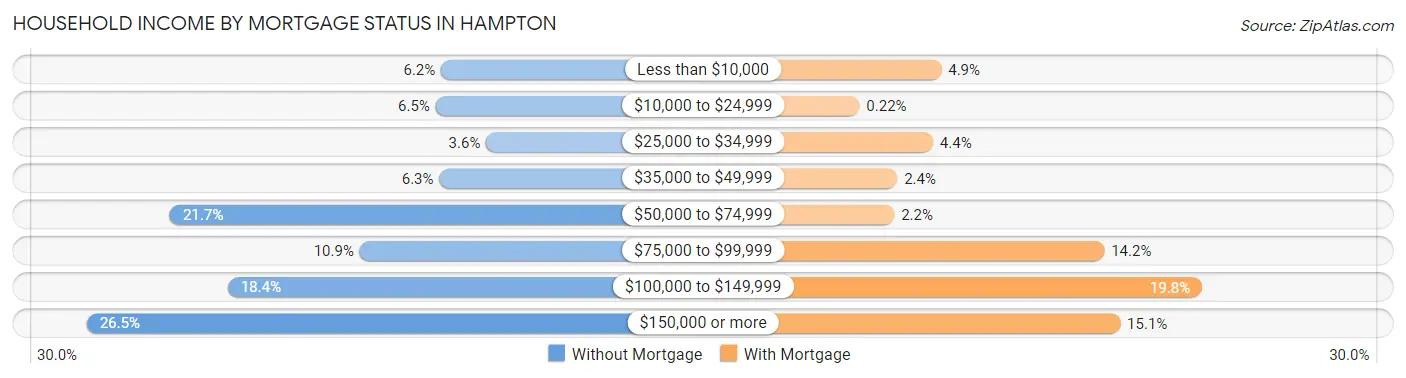
| Household Income | Without Mortgage | With Mortgage |
| Less than $10,000 | 60 (6.2%) | 113 (4.9%) |
| $10,000 to $24,999 | 63 (6.5%) | 5 (0.2%) |
| $25,000 to $34,999 | 35 (3.6%) | 102 (4.4%) |
| $35,000 to $49,999 | 61 (6.3%) | 55 (2.4%) |
| $50,000 to $74,999 | 210 (21.7%) | 51 (2.2%) |
| $75,000 to $99,999 | 105 (10.8%) | 328 (14.2%) |
| $100,000 to $149,999 | 178 (18.4%) | 457 (19.8%) |
| $150,000 or more | 256 (26.5%) | 349 (15.1%) |
| Total | 968 (100.0%) | 2,308 (100.0%) |
Property Value to Household Income Ratio in Hampton
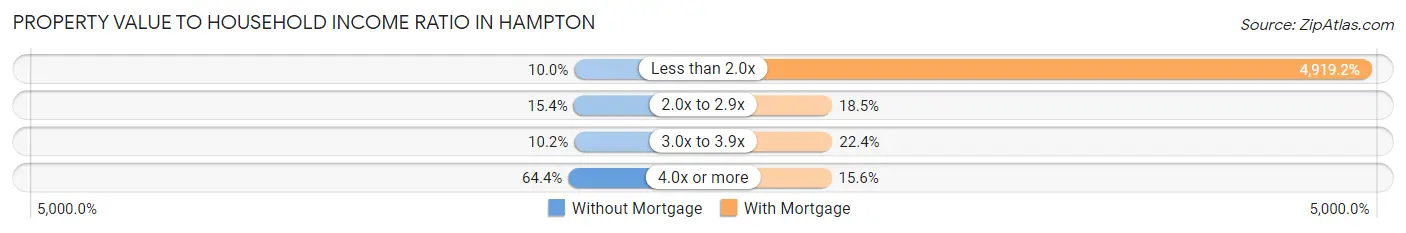
| Value-to-Income Ratio | Without Mortgage | With Mortgage |
| Less than 2.0x | 97 (10.0%) | 113,534 (4,919.1%) |
| 2.0x to 2.9x | 149 (15.4%) | 426 (18.5%) |
| 3.0x to 3.9x | 99 (10.2%) | 518 (22.4%) |
| 4.0x or more | 623 (64.4%) | 359 (15.5%) |
| Total | 968 (100.0%) | 2,308 (100.0%) |
Real Estate Taxes by Mortgage Status in Hampton
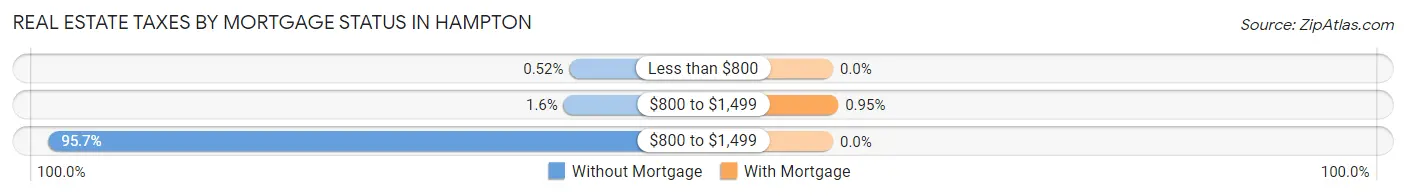
| Property Taxes | Without Mortgage | With Mortgage |
| Less than $800 | 5 (0.5%) | 0 (0.0%) |
| $800 to $1,499 | 15 (1.5%) | 22 (0.9%) |
| $800 to $1,499 | 926 (95.7%) | 0 (0.0%) |
| Total | 968 (100.0%) | 2,308 (100.0%) |
Health & Disability in Hampton
Health Insurance Coverage by Age in Hampton
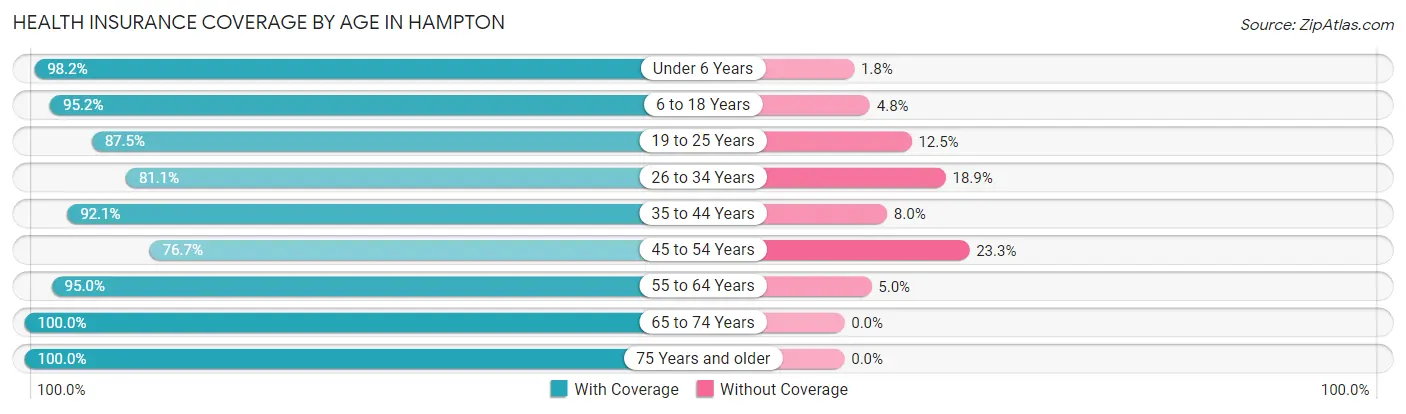
| Age Bracket | With Coverage | Without Coverage |
| Under 6 Years | 381 (98.2%) | 7 (1.8%) |
| 6 to 18 Years | 1,280 (95.2%) | 64 (4.8%) |
| 19 to 25 Years | 517 (87.5%) | 74 (12.5%) |
| 26 to 34 Years | 756 (81.1%) | 176 (18.9%) |
| 35 to 44 Years | 1,030 (92.0%) | 89 (8.0%) |
| 45 to 54 Years | 1,142 (76.7%) | 347 (23.3%) |
| 55 to 64 Years | 1,735 (95.0%) | 92 (5.0%) |
| 65 to 74 Years | 1,258 (100.0%) | 0 (0.0%) |
| 75 Years and older | 828 (100.0%) | 0 (0.0%) |
| Total | 8,927 (91.3%) | 849 (8.7%) |
Health Insurance Coverage by Citizenship Status in Hampton
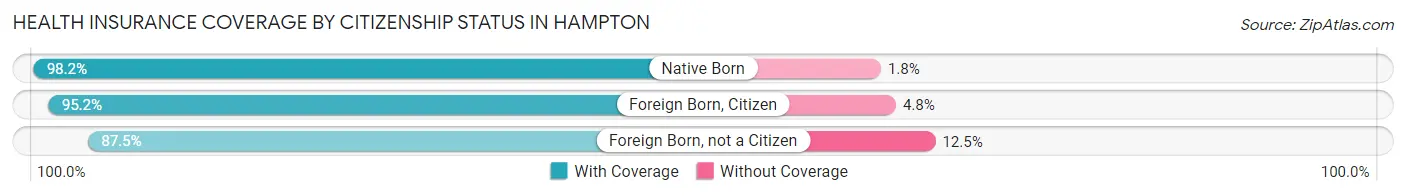
| Citizenship Status | With Coverage | Without Coverage |
| Native Born | 381 (98.2%) | 7 (1.8%) |
| Foreign Born, Citizen | 1,280 (95.2%) | 64 (4.8%) |
| Foreign Born, not a Citizen | 517 (87.5%) | 74 (12.5%) |
Health Insurance Coverage by Household Income in Hampton
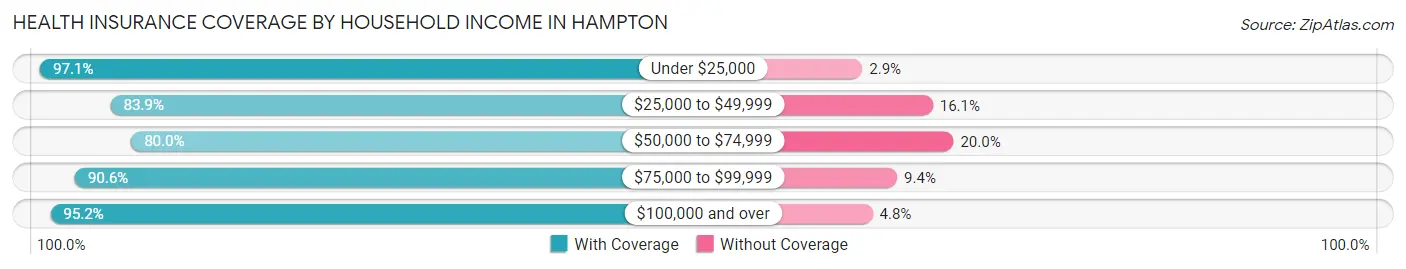
| Household Income | With Coverage | Without Coverage |
| Under $25,000 | 501 (97.1%) | 15 (2.9%) |
| $25,000 to $49,999 | 479 (83.9%) | 92 (16.1%) |
| $50,000 to $74,999 | 1,285 (80.0%) | 321 (20.0%) |
| $75,000 to $99,999 | 1,508 (90.6%) | 157 (9.4%) |
| $100,000 and over | 5,149 (95.2%) | 262 (4.8%) |
Public vs Private Health Insurance Coverage by Age in Hampton
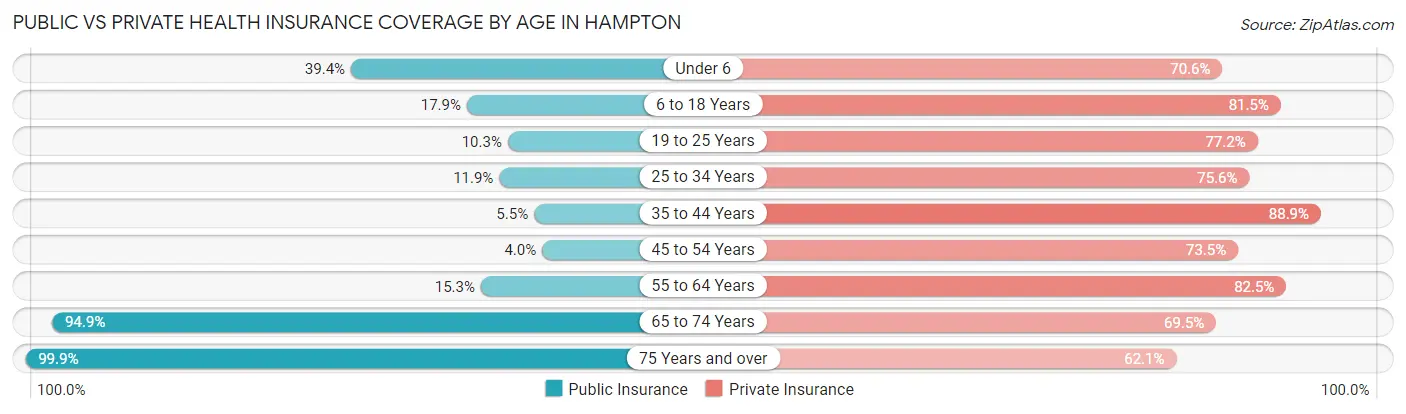
| Age Bracket | Public Insurance | Private Insurance |
| Under 6 | 153 (39.4%) | 274 (70.6%) |
| 6 to 18 Years | 241 (17.9%) | 1,095 (81.5%) |
| 19 to 25 Years | 61 (10.3%) | 456 (77.2%) |
| 25 to 34 Years | 111 (11.9%) | 705 (75.6%) |
| 35 to 44 Years | 61 (5.4%) | 995 (88.9%) |
| 45 to 54 Years | 59 (4.0%) | 1,095 (73.5%) |
| 55 to 64 Years | 280 (15.3%) | 1,507 (82.5%) |
| 65 to 74 Years | 1,194 (94.9%) | 874 (69.5%) |
| 75 Years and over | 827 (99.9%) | 514 (62.1%) |
| Total | 2,987 (30.5%) | 7,515 (76.9%) |
Disability Status by Sex by Age in Hampton
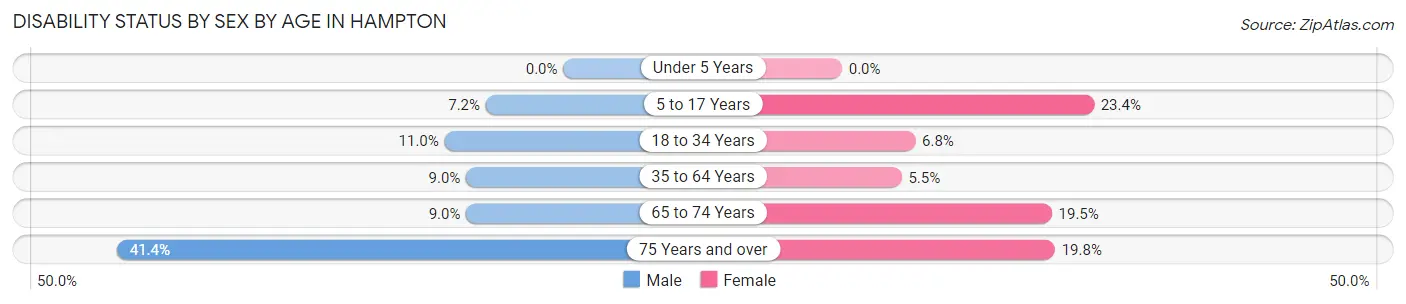
| Age Bracket | Male | Female |
| Under 5 Years | 0 (0.0%) | 0 (0.0%) |
| 5 to 17 Years | 48 (7.2%) | 166 (23.4%) |
| 18 to 34 Years | 79 (11.0%) | 56 (6.8%) |
| 35 to 64 Years | 208 (9.0%) | 118 (5.5%) |
| 65 to 74 Years | 49 (9.0%) | 139 (19.5%) |
| 75 Years and over | 167 (41.4%) | 84 (19.8%) |
Disability Class by Sex by Age in Hampton
Disability Class: Hearing Difficulty
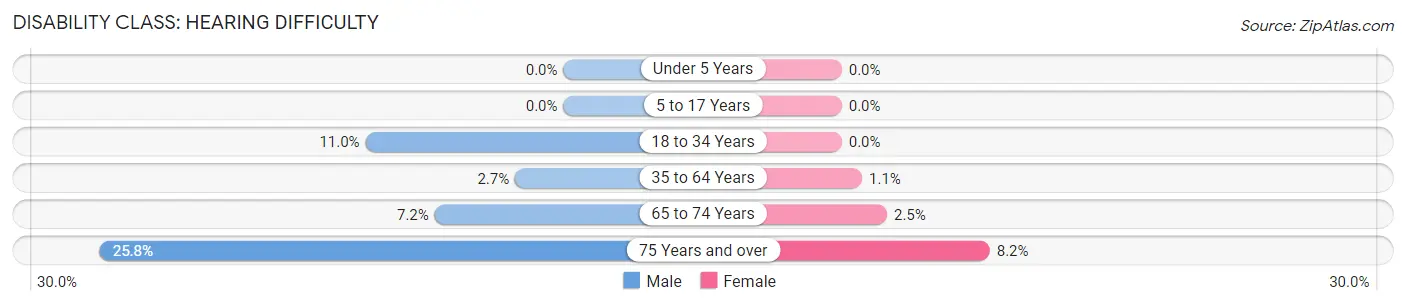
| Age Bracket | Male | Female |
| Under 5 Years | 0 (0.0%) | 0 (0.0%) |
| 5 to 17 Years | 0 (0.0%) | 0 (0.0%) |
| 18 to 34 Years | 79 (11.0%) | 0 (0.0%) |
| 35 to 64 Years | 62 (2.7%) | 24 (1.1%) |
| 65 to 74 Years | 39 (7.2%) | 18 (2.5%) |
| 75 Years and over | 104 (25.8%) | 35 (8.2%) |
Disability Class: Vision Difficulty
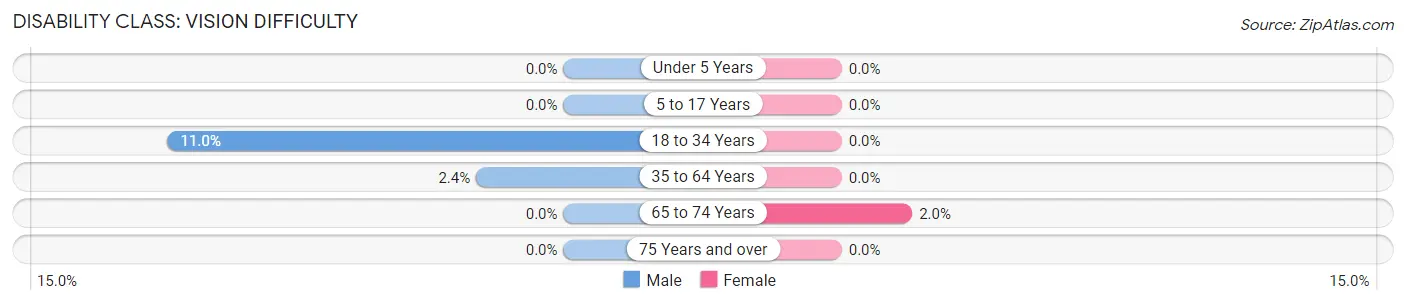
| Age Bracket | Male | Female |
| Under 5 Years | 0 (0.0%) | 0 (0.0%) |
| 5 to 17 Years | 0 (0.0%) | 0 (0.0%) |
| 18 to 34 Years | 79 (11.0%) | 0 (0.0%) |
| 35 to 64 Years | 56 (2.4%) | 0 (0.0%) |
| 65 to 74 Years | 0 (0.0%) | 14 (2.0%) |
| 75 Years and over | 0 (0.0%) | 0 (0.0%) |
Disability Class: Cognitive Difficulty
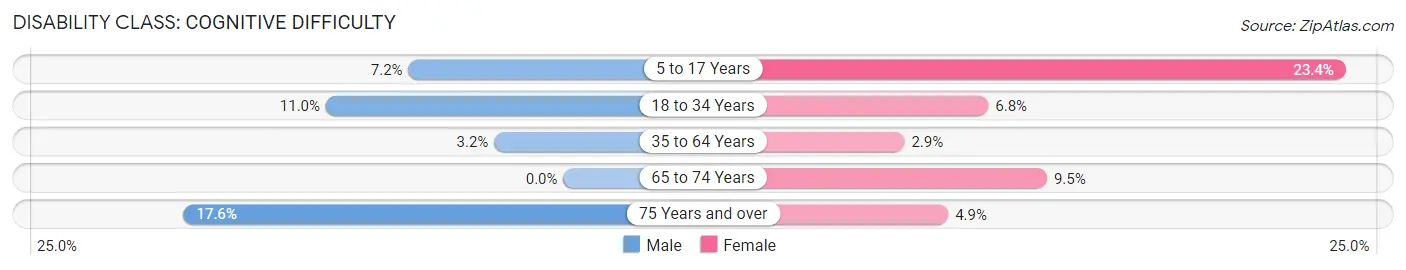
| Age Bracket | Male | Female |
| 5 to 17 Years | 48 (7.2%) | 166 (23.4%) |
| 18 to 34 Years | 79 (11.0%) | 56 (6.8%) |
| 35 to 64 Years | 74 (3.2%) | 62 (2.9%) |
| 65 to 74 Years | 0 (0.0%) | 68 (9.5%) |
| 75 Years and over | 71 (17.6%) | 21 (4.9%) |
Disability Class: Ambulatory Difficulty
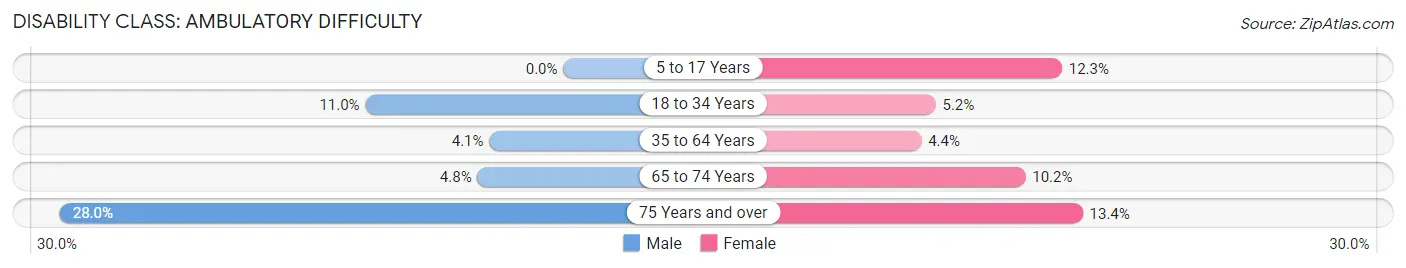
| Age Bracket | Male | Female |
| 5 to 17 Years | 0 (0.0%) | 87 (12.2%) |
| 18 to 34 Years | 79 (11.0%) | 43 (5.2%) |
| 35 to 64 Years | 95 (4.1%) | 94 (4.4%) |
| 65 to 74 Years | 26 (4.8%) | 73 (10.2%) |
| 75 Years and over | 113 (28.0%) | 57 (13.4%) |
Disability Class: Self-Care Difficulty
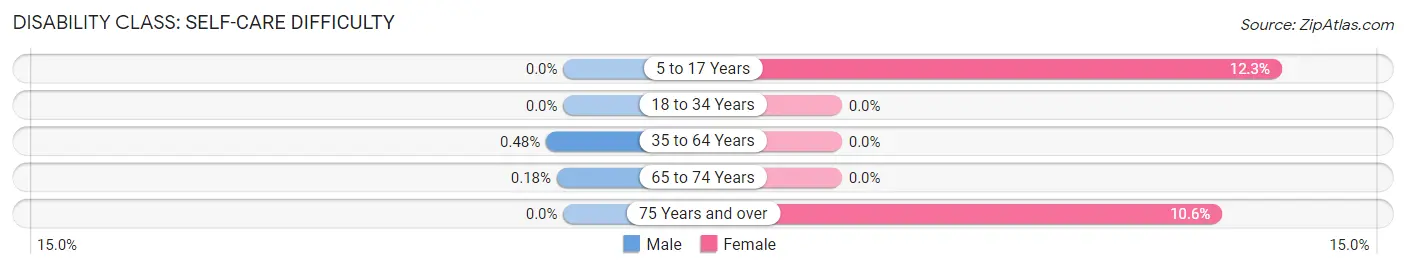
| Age Bracket | Male | Female |
| 5 to 17 Years | 0 (0.0%) | 87 (12.2%) |
| 18 to 34 Years | 0 (0.0%) | 0 (0.0%) |
| 35 to 64 Years | 11 (0.5%) | 0 (0.0%) |
| 65 to 74 Years | 1 (0.2%) | 0 (0.0%) |
| 75 Years and over | 0 (0.0%) | 45 (10.6%) |
Technology Access in Hampton
Computing Device Access in Hampton
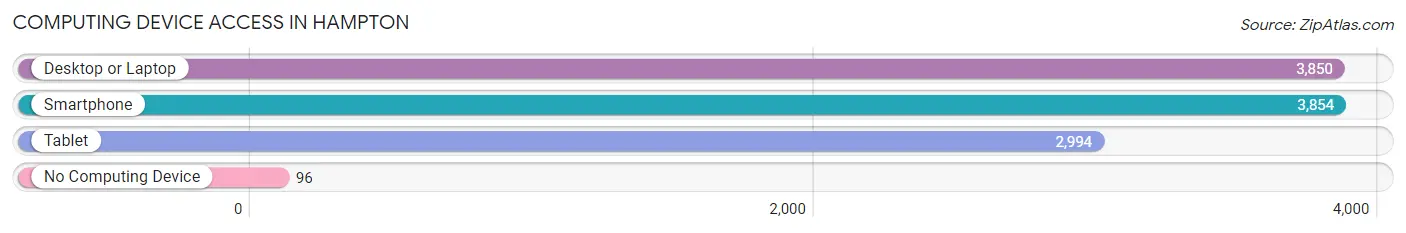
| Device Type | # Households | % Households |
| Desktop or Laptop | 3,850 | 90.7% |
| Smartphone | 3,854 | 90.8% |
| Tablet | 2,994 | 70.5% |
| No Computing Device | 96 | 2.3% |
| Total | 4,246 | 100.0% |
Internet Access in Hampton
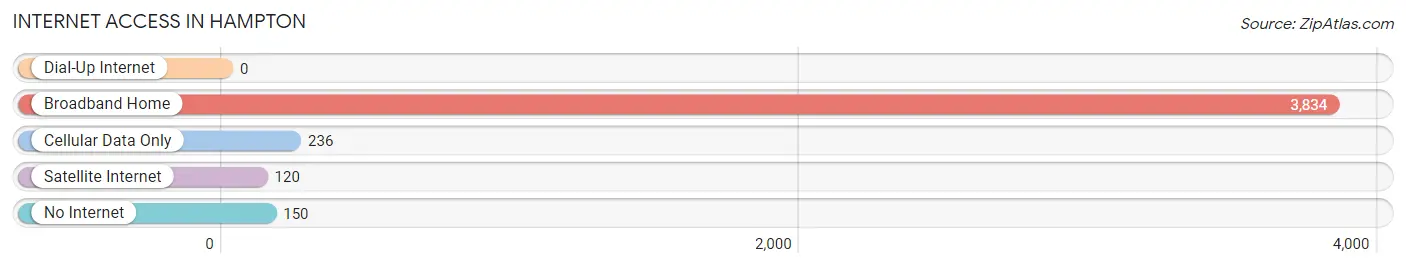
| Internet Type | # Households | % Households |
| Dial-Up Internet | 0 | 0.0% |
| Broadband Home | 3,834 | 90.3% |
| Cellular Data Only | 236 | 5.6% |
| Satellite Internet | 120 | 2.8% |
| No Internet | 150 | 3.5% |
| Total | 4,246 | 100.0% |
Hampton Summary
Hampton, New Hampshire is a small town located in the southeastern corner of the state, along the Atlantic coast. It is part of the Seacoast region of New Hampshire, and is bordered by the towns of North Hampton, Seabrook, and Rye. The town has a population of approximately 14,000 people, and is a popular summer destination for tourists.
Geography
Hampton is located in Rockingham County, and is situated on the Atlantic Ocean. The town is bordered by the towns of North Hampton, Seabrook, and Rye. The town is approximately 10 miles from the Massachusetts border, and is about an hour’s drive from Boston. The town is located on a peninsula, and is surrounded by the Hampton River, Hampton Harbor, and the Atlantic Ocean. The town is home to several beaches, including North Beach, Hampton Beach, and Wallis Sands Beach.
Economy
The economy of Hampton is largely based on tourism. The town is home to several popular beaches, and is a popular summer destination for tourists. The town is also home to several restaurants, hotels, and other businesses that cater to tourists. Additionally, the town is home to several manufacturing companies, including a paper mill and a plastics factory.
Demographics
As of the 2010 census, the population of Hampton was 14,000. The racial makeup of the town was 94.3% White, 1.7% African American, 0.3% Native American, 1.2% Asian, 0.1% Pacific Islander, 1.2% from other races, and 1.4% from two or more races. The median household income was $60,000, and the median family income was $68,000.
History
Hampton was first settled in 1638 by English colonists. The town was originally part of the Massachusetts Bay Colony, and was known as Hampton Village. The town was incorporated in 1639, and was named after the English town of Hampton. The town was a popular summer destination for wealthy Bostonians, and was home to several large estates. The town was also home to several shipbuilding yards, and was a major port of entry for immigrants. In the late 19th century, the town became a popular summer destination for tourists, and the town’s economy shifted to focus on tourism. The town is still a popular summer destination, and is home to several popular beaches.
Common Questions
What is Per Capita Income in Hampton?
Per Capita income in Hampton is $57,669.
What is the Median Family Income in Hampton?
Median Family Income in Hampton is $113,683.
What is the Median Household income in Hampton?
Median Household Income in Hampton is $92,907.
What is Income or Wage Gap in Hampton?
Income or Wage Gap in Hampton is 32.1%.
Women in Hampton earn 67.9 cents for every dollar earned by a man.
What is Inequality or Gini Index in Hampton?
Inequality or Gini Index in Hampton is 0.45.
What is the Total Population of Hampton?
Total Population of Hampton is 10,050.
What is the Total Male Population of Hampton?
Total Male Population of Hampton is 4,944.
What is the Total Female Population of Hampton?
Total Female Population of Hampton is 5,106.
What is the Ratio of Males per 100 Females in Hampton?
There are 96.83 Males per 100 Females in Hampton.
What is the Ratio of Females per 100 Males in Hampton?
There are 103.28 Females per 100 Males in Hampton.
What is the Median Population Age in Hampton?
Median Population Age in Hampton is 49.6 Years.
What is the Average Family Size in Hampton
Average Family Size in Hampton is 2.9 People.
What is the Average Household Size in Hampton
Average Household Size in Hampton is 2.3 People.
How Large is the Labor Force in Hampton?
There are 5,489 People in the Labor Forcein in Hampton.
What is the Percentage of People in the Labor Force in Hampton?
64.1% of People are in the Labor Force in Hampton.
What is the Unemployment Rate in Hampton?
Unemployment Rate in Hampton is 2.2%.