Rockingham County, NH Map & Demographics
Rockingham County Map
Rockingham County Overview
$56,321
PER CAPITA INCOME
$131,600
AVG FAMILY INCOME
$110,225
AVG HOUSEHOLD INCOME
34.7%
WAGE / INCOME GAP [ % ]
65.3¢/ $1
WAGE / INCOME GAP [ $ ]
$12,138
FAMILY INCOME DEFICIT
0.42
INEQUALITY / GINI INDEX
315,169
TOTAL POPULATION
157,222
MALE POPULATION
157,947
FEMALE POPULATION
99.54
MALES / 100 FEMALES
100.46
FEMALES / 100 MALES
44.7
MEDIAN AGE
3.0
AVG FAMILY SIZE
2.5
AVG HOUSEHOLD SIZE
181,325
LABOR FORCE [ PEOPLE ]
68.9%
PERCENT IN LABOR FORCE
3.4%
UNEMPLOYMENT RATE
Rockingham County Area Codes
Income in Rockingham County
Income Overview in Rockingham County
Per Capita Income in Rockingham County is $56,321, while median incomes of families and households are $131,600 and $110,225 respectively.
| Characteristic | Number | Measure |
| Per Capita Income | 315,169 | $56,321 |
| Median Family Income | 86,122 | $131,600 |
| Mean Family Income | 86,122 | $159,022 |
| Median Household Income | 125,464 | $110,225 |
| Mean Household Income | 125,464 | $138,374 |
| Income Deficit | 86,122 | $12,138 |
| Wage / Income Gap (%) | 315,169 | 34.68% |
| Wage / Income Gap ($) | 315,169 | 65.32¢ per $1 |
| Gini / Inequality Index | 315,169 | 0.42 |
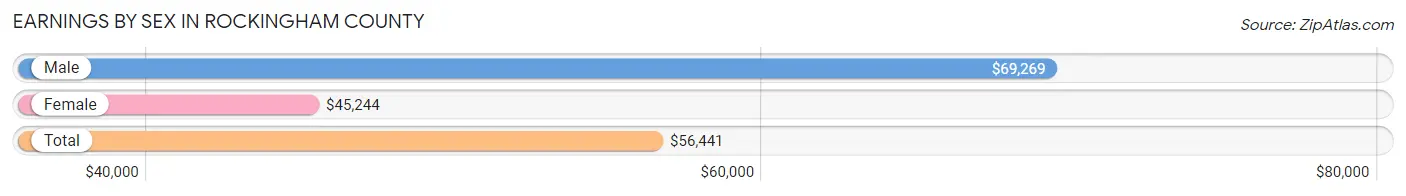
Earnings by Sex in Rockingham County
Average Earnings in Rockingham County are $56,441, $69,269 for men and $45,244 for women, a difference of 34.7%.
| Sex | Number | Average Earnings |
| Male | 101,453 (53.3%) | $69,269 |
| Female | 88,718 (46.7%) | $45,244 |
| Total | 190,171 (100.0%) | $56,441 |
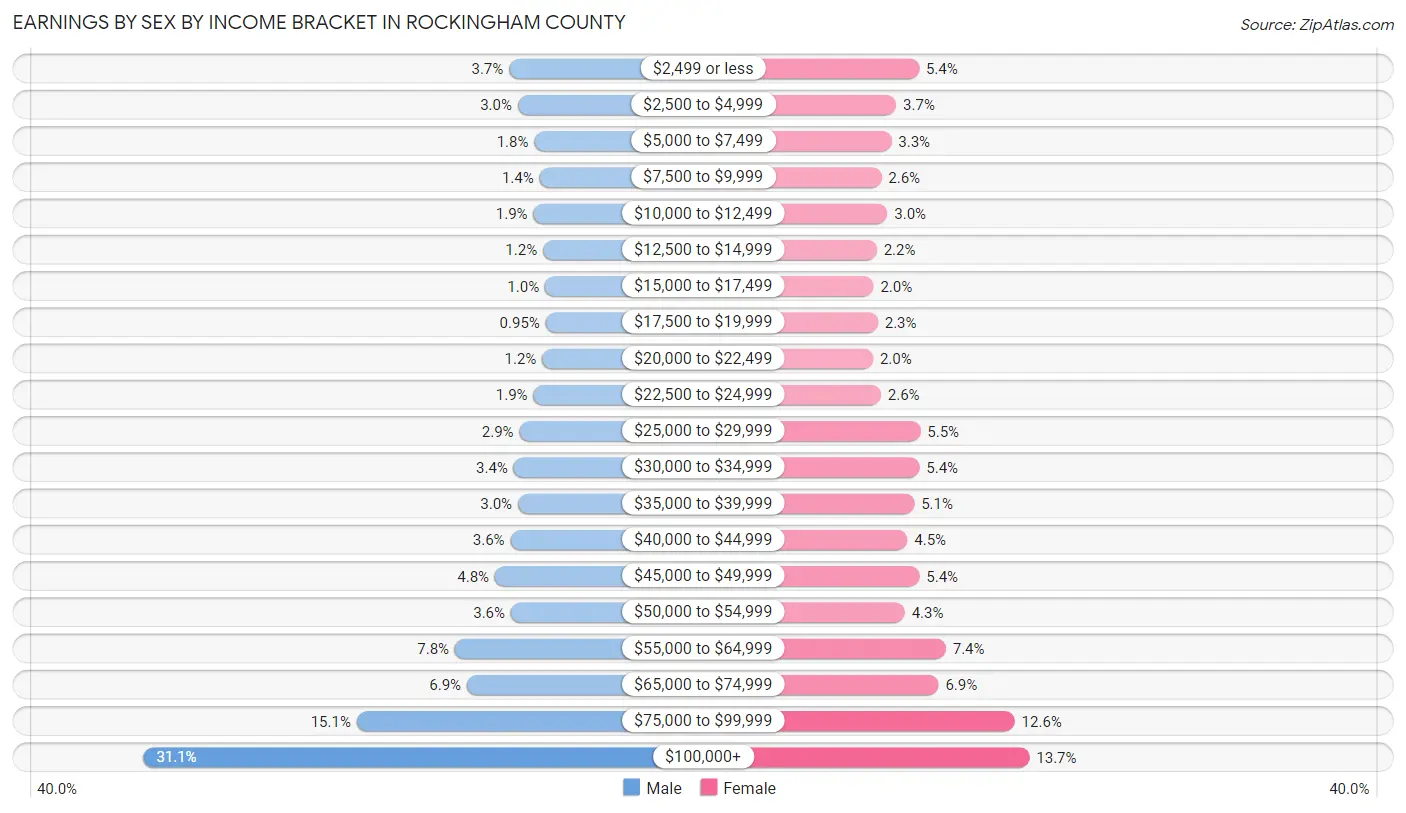
Earnings by Sex by Income Bracket in Rockingham County
The most common earnings brackets in Rockingham County are $100,000+ for men (31,541 | 31.1%) and $100,000+ for women (12,134 | 13.7%).
| Income | Male | Female |
| $2,499 or less | 3,746 (3.7%) | 4,797 (5.4%) |
| $2,500 to $4,999 | 3,084 (3.0%) | 3,282 (3.7%) |
| $5,000 to $7,499 | 1,829 (1.8%) | 2,960 (3.3%) |
| $7,500 to $9,999 | 1,433 (1.4%) | 2,301 (2.6%) |
| $10,000 to $12,499 | 1,896 (1.9%) | 2,697 (3.0%) |
| $12,500 to $14,999 | 1,171 (1.1%) | 1,986 (2.2%) |
| $15,000 to $17,499 | 1,010 (1.0%) | 1,778 (2.0%) |
| $17,500 to $19,999 | 960 (0.9%) | 2,057 (2.3%) |
| $20,000 to $22,499 | 1,231 (1.2%) | 1,735 (2.0%) |
| $22,500 to $24,999 | 1,897 (1.9%) | 2,261 (2.5%) |
| $25,000 to $29,999 | 2,967 (2.9%) | 4,885 (5.5%) |
| $30,000 to $34,999 | 3,399 (3.4%) | 4,828 (5.4%) |
| $35,000 to $39,999 | 3,078 (3.0%) | 4,477 (5.1%) |
| $40,000 to $44,999 | 3,644 (3.6%) | 4,028 (4.5%) |
| $45,000 to $49,999 | 4,817 (4.8%) | 4,822 (5.4%) |
| $50,000 to $54,999 | 3,609 (3.6%) | 3,853 (4.3%) |
| $55,000 to $64,999 | 7,865 (7.7%) | 6,582 (7.4%) |
| $65,000 to $74,999 | 6,948 (6.9%) | 6,093 (6.9%) |
| $75,000 to $99,999 | 15,328 (15.1%) | 11,162 (12.6%) |
| $100,000+ | 31,541 (31.1%) | 12,134 (13.7%) |
| Total | 101,453 (100.0%) | 88,718 (100.0%) |
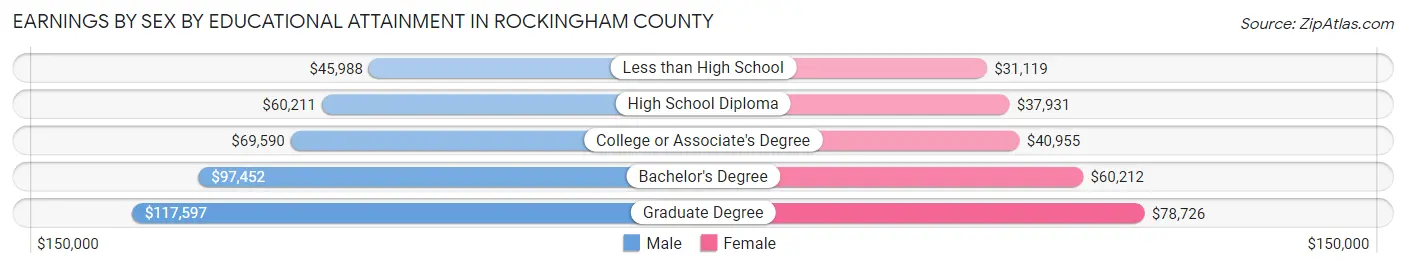
Earnings by Sex by Educational Attainment in Rockingham County
Average earnings in Rockingham County are $79,116 for men and $50,923 for women, a difference of 35.6%. Men with an educational attainment of graduate degree enjoy the highest average annual earnings of $117,597, while those with less than high school education earn the least with $45,988. Women with an educational attainment of graduate degree earn the most with the average annual earnings of $78,726, while those with less than high school education have the smallest earnings of $31,119.
| Educational Attainment | Male Income | Female Income |
| Less than High School | $45,988 | $31,119 |
| High School Diploma | $60,211 | $37,931 |
| College or Associate's Degree | $69,590 | $40,955 |
| Bachelor's Degree | $97,452 | $60,212 |
| Graduate Degree | $117,597 | $78,726 |
| Total | $79,116 | $50,923 |
Family Income in Rockingham County
Family Income Brackets in Rockingham County
According to the Rockingham County family income data, there are 20,842 families falling into the $100,000 to $149,999 income range, which is the most common income bracket and makes up 24.2% of all families. Conversely, the $10,000 to $14,999 income bracket is the least frequent group with only 861 families (1.0%) belonging to this category.
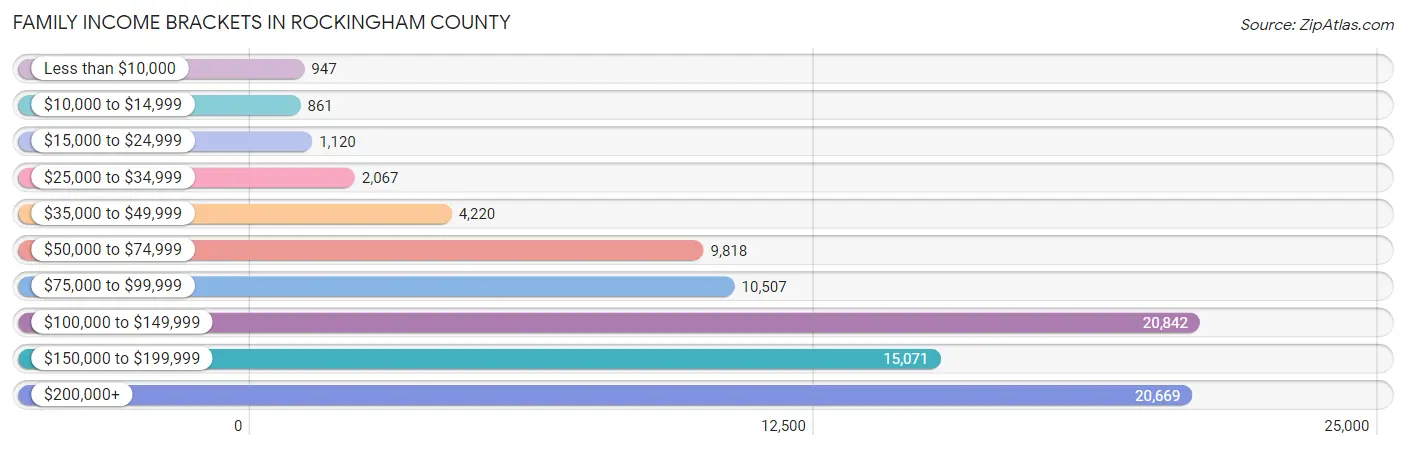
| Income Bracket | # Families | % Families |
| Less than $10,000 | 947 | 1.1% |
| $10,000 to $14,999 | 861 | 1.0% |
| $15,000 to $24,999 | 1,120 | 1.3% |
| $25,000 to $34,999 | 2,067 | 2.4% |
| $35,000 to $49,999 | 4,220 | 4.9% |
| $50,000 to $74,999 | 9,818 | 11.4% |
| $75,000 to $99,999 | 10,507 | 12.2% |
| $100,000 to $149,999 | 20,842 | 24.2% |
| $150,000 to $199,999 | 15,071 | 17.5% |
| $200,000+ | 20,669 | 24.0% |
Family Income by Famaliy Size in Rockingham County
5-person families (6,015 | 7.0%) account for the highest median family income in Rockingham County with $181,809 per family, while 2-person families (42,152 | 48.9%) have the highest median income of $52,930 per family member.
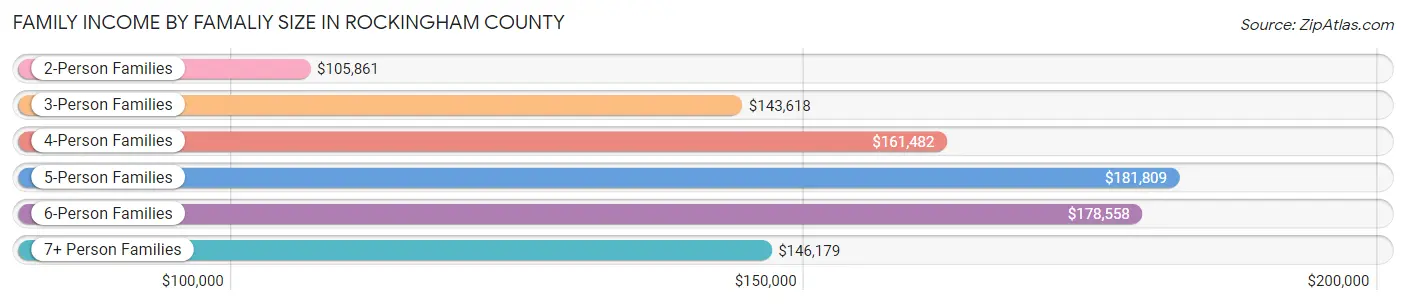
| Income Bracket | # Families | Median Income |
| 2-Person Families | 42,152 (48.9%) | $105,861 |
| 3-Person Families | 19,257 (22.4%) | $143,618 |
| 4-Person Families | 16,495 (19.2%) | $161,482 |
| 5-Person Families | 6,015 (7.0%) | $181,809 |
| 6-Person Families | 1,505 (1.8%) | $178,558 |
| 7+ Person Families | 698 (0.8%) | $146,179 |
| Total | 86,122 (100.0%) | $131,600 |
Family Income by Number of Earners in Rockingham County
The median family income in Rockingham County is $131,600, with families comprising 3+ earners (13,294) having the highest median family income of $191,889, while families with no earners (10,987) have the lowest median family income of $65,750, accounting for 15.4% and 12.8% of families, respectively.
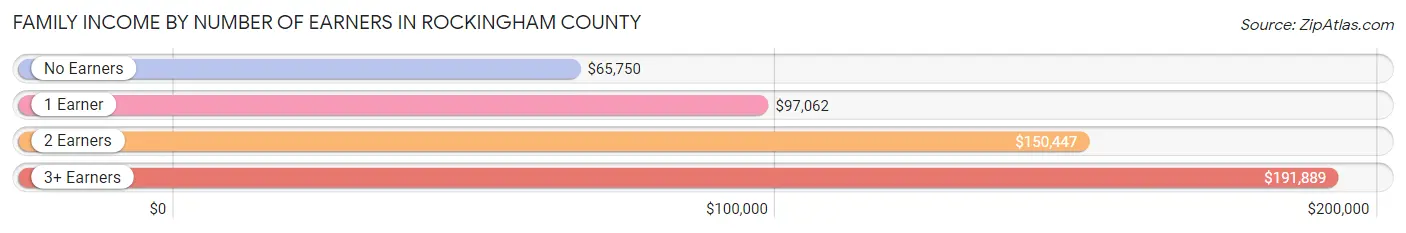
| Number of Earners | # Families | Median Income |
| No Earners | 10,987 (12.8%) | $65,750 |
| 1 Earner | 22,651 (26.3%) | $97,062 |
| 2 Earners | 39,190 (45.5%) | $150,447 |
| 3+ Earners | 13,294 (15.4%) | $191,889 |
| Total | 86,122 (100.0%) | $131,600 |
Household Income in Rockingham County
Household Income Brackets in Rockingham County
With 26,347 households falling in the category, the $100,000 to $149,999 income range is the most frequent in Rockingham County, accounting for 21.0% of all households. In contrast, only 2,384 households (1.9%) fall into the $10,000 to $14,999 income bracket, making it the least populous group.
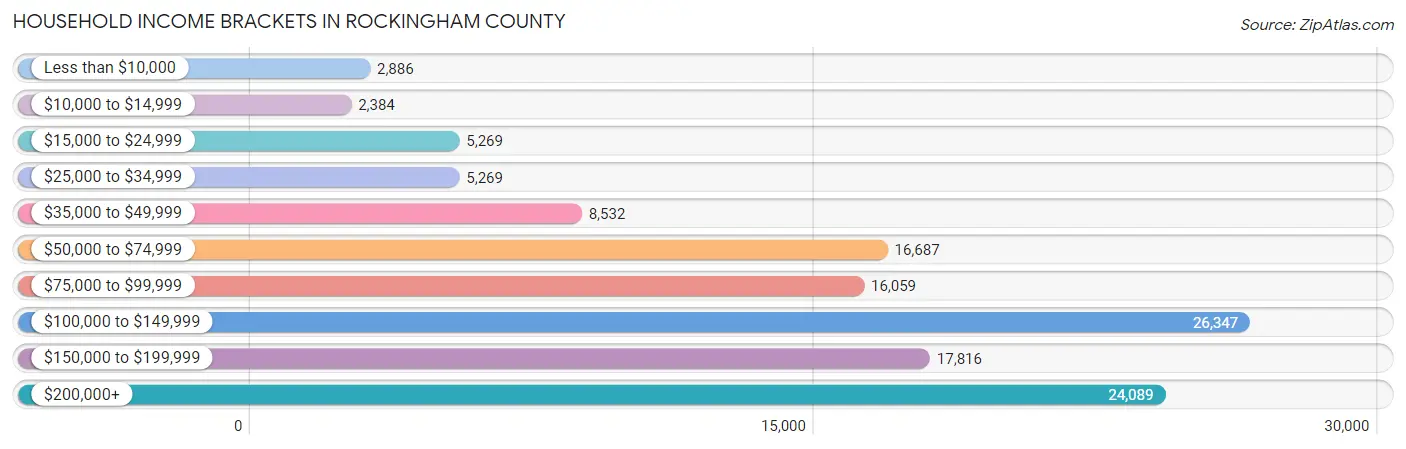
| Income Bracket | # Households | % Households |
| Less than $10,000 | 2,886 | 2.3% |
| $10,000 to $14,999 | 2,384 | 1.9% |
| $15,000 to $24,999 | 5,269 | 4.2% |
| $25,000 to $34,999 | 5,269 | 4.2% |
| $35,000 to $49,999 | 8,532 | 6.8% |
| $50,000 to $74,999 | 16,687 | 13.3% |
| $75,000 to $99,999 | 16,059 | 12.8% |
| $100,000 to $149,999 | 26,347 | 21.0% |
| $150,000 to $199,999 | 17,816 | 14.2% |
| $200,000+ | 24,089 | 19.2% |
Household Income by Householder Age in Rockingham County
The median household income in Rockingham County is $110,225, with the highest median household income of $131,440 found in the 45 to 64 years age bracket for the primary householder. A total of 54,609 households (43.5%) fall into this category. Meanwhile, the 65+ years age bracket for the primary householder has the lowest median household income of $69,565, with 35,432 households (28.2%) in this group.
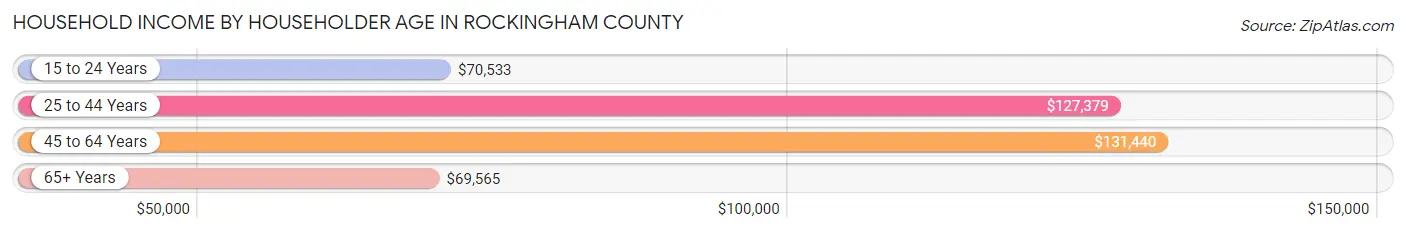
| Income Bracket | # Households | Median Income |
| 15 to 24 Years | 2,130 (1.7%) | $70,533 |
| 25 to 44 Years | 33,293 (26.5%) | $127,379 |
| 45 to 64 Years | 54,609 (43.5%) | $131,440 |
| 65+ Years | 35,432 (28.2%) | $69,565 |
| Total | 125,464 (100.0%) | $110,225 |
Poverty in Rockingham County
Income Below Poverty by Sex and Age in Rockingham County
With 3.7% poverty level for males and 5.9% for females among the residents of Rockingham County, 18 to 24 year old males and 75 year old and over females are the most vulnerable to poverty, with 888 males (7.2%) and 1,182 females (9.6%) in their respective age groups living below the poverty level.
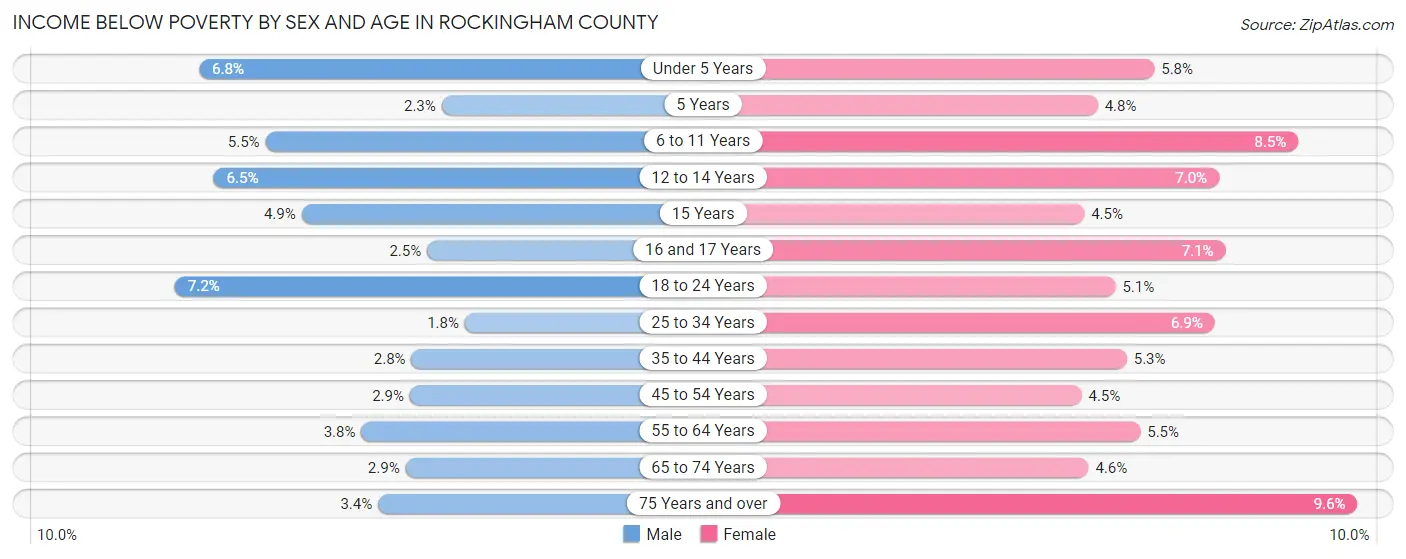
| Age Bracket | Male | Female |
| Under 5 Years | 488 (6.8%) | 394 (5.8%) |
| 5 Years | 36 (2.3%) | 61 (4.8%) |
| 6 to 11 Years | 577 (5.5%) | 825 (8.5%) |
| 12 to 14 Years | 316 (6.5%) | 345 (7.0%) |
| 15 Years | 104 (4.9%) | 96 (4.5%) |
| 16 and 17 Years | 99 (2.5%) | 260 (7.1%) |
| 18 to 24 Years | 888 (7.2%) | 569 (5.1%) |
| 25 to 34 Years | 352 (1.8%) | 1,267 (6.9%) |
| 35 to 44 Years | 542 (2.8%) | 984 (5.3%) |
| 45 to 54 Years | 633 (2.9%) | 992 (4.4%) |
| 55 to 64 Years | 979 (3.7%) | 1,458 (5.5%) |
| 65 to 74 Years | 518 (2.9%) | 857 (4.6%) |
| 75 Years and over | 327 (3.4%) | 1,182 (9.6%) |
| Total | 5,859 (3.7%) | 9,290 (5.9%) |
Income Above Poverty by Sex and Age in Rockingham County
According to the poverty statistics in Rockingham County, males aged 25 to 34 years and females aged 45 to 54 years are the age groups that are most secure financially, with 98.2% of males and 95.6% of females in these age groups living above the poverty line.
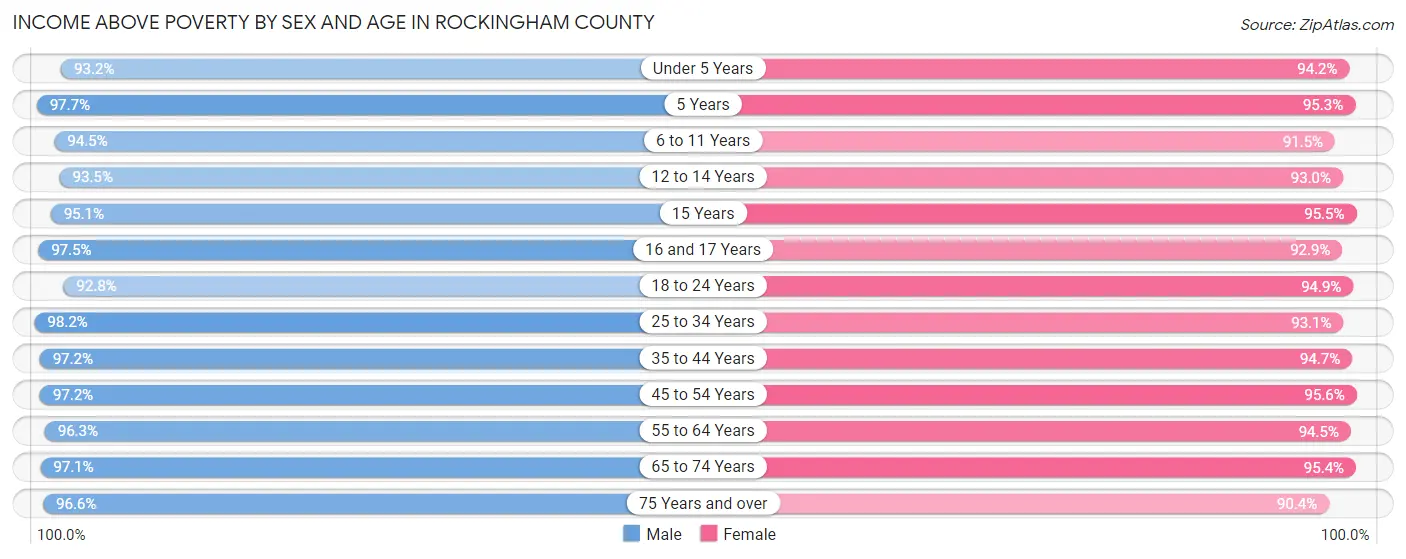
| Age Bracket | Male | Female |
| Under 5 Years | 6,727 (93.2%) | 6,396 (94.2%) |
| 5 Years | 1,555 (97.7%) | 1,222 (95.3%) |
| 6 to 11 Years | 9,861 (94.5%) | 8,917 (91.5%) |
| 12 to 14 Years | 4,556 (93.5%) | 4,582 (93.0%) |
| 15 Years | 2,037 (95.1%) | 2,038 (95.5%) |
| 16 and 17 Years | 3,811 (97.5%) | 3,391 (92.9%) |
| 18 to 24 Years | 11,422 (92.8%) | 10,638 (94.9%) |
| 25 to 34 Years | 18,848 (98.2%) | 17,042 (93.1%) |
| 35 to 44 Years | 18,652 (97.2%) | 17,629 (94.7%) |
| 45 to 54 Years | 21,578 (97.2%) | 21,311 (95.6%) |
| 55 to 64 Years | 25,095 (96.3%) | 24,840 (94.5%) |
| 65 to 74 Years | 17,190 (97.1%) | 17,836 (95.4%) |
| 75 Years and over | 9,182 (96.6%) | 11,172 (90.4%) |
| Total | 150,514 (96.3%) | 147,014 (94.1%) |
Income Below Poverty Among Married-Couple Families in Rockingham County
The poverty statistics for married-couple families in Rockingham County show that 1.1% or 761 of the total 71,104 families live below the poverty line. Families with 5 or more children have the highest poverty rate of 38.8%, comprising of 59 families. On the other hand, families with 3 or 4 children have the lowest poverty rate of 0.4%, which includes 21 families.
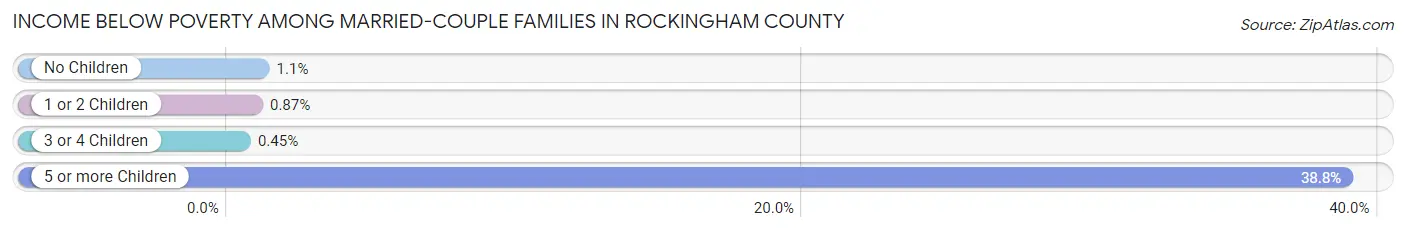
| Children | Above Poverty | Below Poverty |
| No Children | 44,220 (98.9%) | 494 (1.1%) |
| 1 or 2 Children | 21,421 (99.1%) | 187 (0.9%) |
| 3 or 4 Children | 4,609 (99.6%) | 21 (0.4%) |
| 5 or more Children | 93 (61.2%) | 59 (38.8%) |
| Total | 70,343 (98.9%) | 761 (1.1%) |
Income Below Poverty Among Single-Parent Households in Rockingham County
According to the poverty data in Rockingham County, 3.6% or 178 single-father households and 16.4% or 1,661 single-mother households are living below the poverty line. Among single-father households, those with 3 or 4 children have the highest poverty rate, with 13 households (4.8%) experiencing poverty. Likewise, among single-mother households, those with 5 or more children have the highest poverty rate, with 17 households (100.0%) falling below the poverty line.
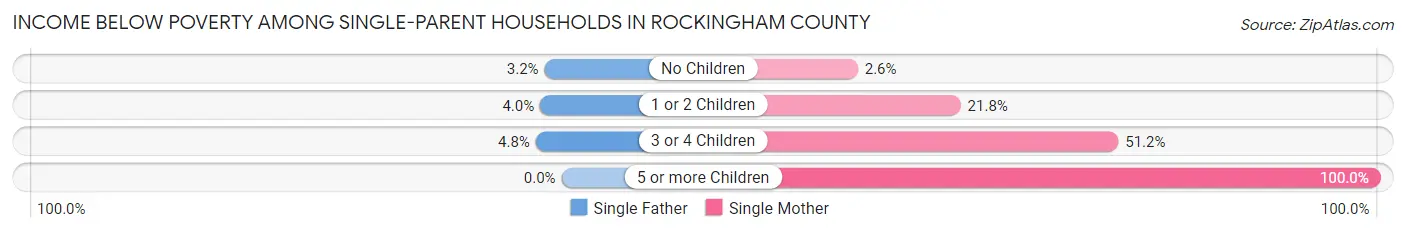
| Children | Single Father | Single Mother |
| No Children | 75 (3.2%) | 103 (2.6%) |
| 1 or 2 Children | 90 (4.0%) | 1,208 (21.8%) |
| 3 or 4 Children | 13 (4.8%) | 333 (51.1%) |
| 5 or more Children | 0 (0.0%) | 17 (100.0%) |
| Total | 178 (3.6%) | 1,661 (16.4%) |
Income Below Poverty Among Married-Couple vs Single-Parent Households in Rockingham County
The poverty data for Rockingham County shows that 761 of the married-couple family households (1.1%) and 1,839 of the single-parent households (12.2%) are living below the poverty level. Within the married-couple family households, those with 5 or more children have the highest poverty rate, with 59 households (38.8%) falling below the poverty line. Among the single-parent households, those with 5 or more children have the highest poverty rate, with 17 household (100.0%) living below poverty.
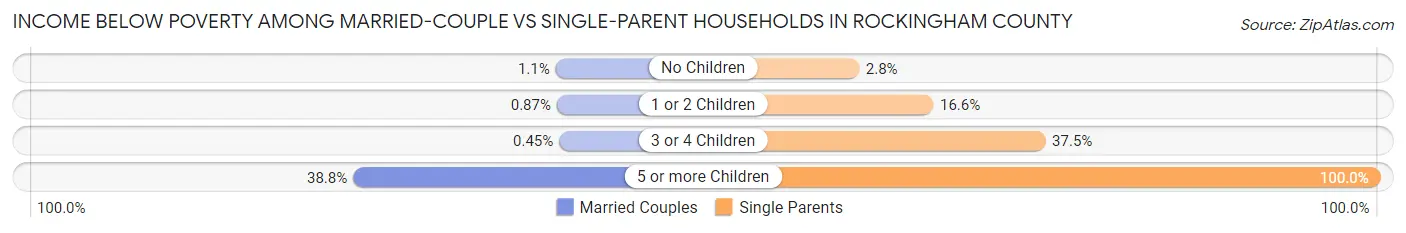
| Children | Married-Couple Families | Single-Parent Households |
| No Children | 494 (1.1%) | 178 (2.8%) |
| 1 or 2 Children | 187 (0.9%) | 1,298 (16.6%) |
| 3 or 4 Children | 21 (0.4%) | 346 (37.5%) |
| 5 or more Children | 59 (38.8%) | 17 (100.0%) |
| Total | 761 (1.1%) | 1,839 (12.2%) |
Race in Rockingham County
The most populous races in Rockingham County are White / Caucasian (290,277 | 92.1%), Two or more Races (12,027 | 3.8%), and Hispanic or Latino (10,933 | 3.5%).
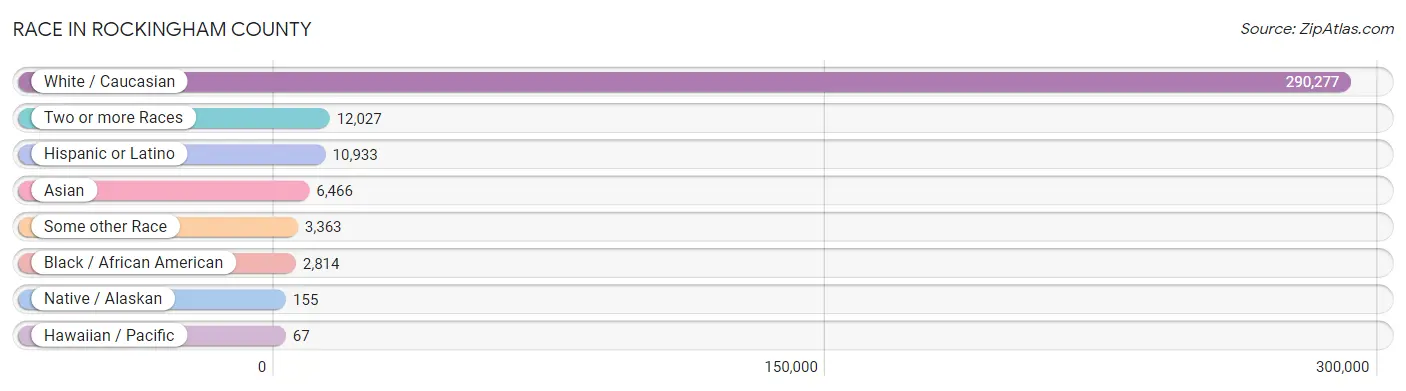
| Race | # Population | % Population |
| Asian | 6,466 | 2.1% |
| Black / African American | 2,814 | 0.9% |
| Hawaiian / Pacific | 67 | 0.0% |
| Hispanic or Latino | 10,933 | 3.5% |
| Native / Alaskan | 155 | 0.1% |
| White / Caucasian | 290,277 | 92.1% |
| Two or more Races | 12,027 | 3.8% |
| Some other Race | 3,363 | 1.1% |
| Total | 315,169 | 100.0% |
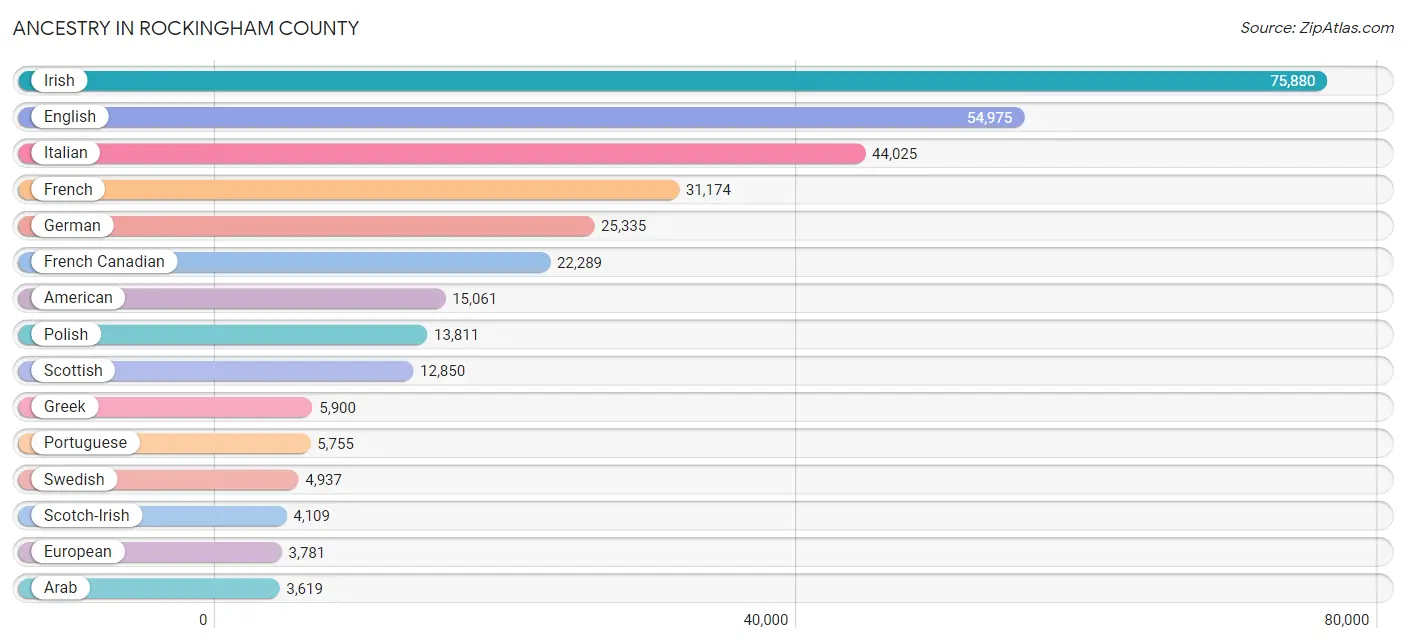
Ancestry in Rockingham County
The most populous ancestries reported in Rockingham County are Irish (75,880 | 24.1%), English (54,975 | 17.4%), Italian (44,025 | 14.0%), French (31,174 | 9.9%), and German (25,335 | 8.0%), together accounting for 73.4% of all Rockingham County residents.
| Ancestry | # Population | % Population |
| African | 27 | 0.0% |
| Albanian | 321 | 0.1% |
| Alsatian | 25 | 0.0% |
| American | 15,061 | 4.8% |
| Arab | 3,619 | 1.1% |
| Argentinean | 85 | 0.0% |
| Armenian | 1,567 | 0.5% |
| Australian | 102 | 0.0% |
| Austrian | 588 | 0.2% |
| Basque | 3 | 0.0% |
| Belgian | 319 | 0.1% |
| Bermudan | 5 | 0.0% |
| Bhutanese | 741 | 0.2% |
| Blackfeet | 191 | 0.1% |
| Brazilian | 447 | 0.1% |
| British | 2,620 | 0.8% |
| British West Indian | 13 | 0.0% |
| Bulgarian | 359 | 0.1% |
| Burmese | 916 | 0.3% |
| Cajun | 13 | 0.0% |
| Canadian | 2,735 | 0.9% |
| Cape Verdean | 52 | 0.0% |
| Celtic | 161 | 0.1% |
| Central American | 703 | 0.2% |
| Central American Indian | 119 | 0.0% |
| Cherokee | 157 | 0.1% |
| Chickasaw | 3 | 0.0% |
| Chilean | 60 | 0.0% |
| Choctaw | 22 | 0.0% |
| Colombian | 424 | 0.1% |
| Costa Rican | 141 | 0.0% |
| Creek | 6 | 0.0% |
| Croatian | 58 | 0.0% |
| Cuban | 558 | 0.2% |
| Czech | 419 | 0.1% |
| Czechoslovakian | 134 | 0.0% |
| Danish | 843 | 0.3% |
| Delaware | 27 | 0.0% |
| Dominican | 2,244 | 0.7% |
| Dutch | 2,220 | 0.7% |
| Dutch West Indian | 15 | 0.0% |
| Eastern European | 1,063 | 0.3% |
| Ecuadorian | 115 | 0.0% |
| Egyptian | 68 | 0.0% |
| English | 54,975 | 17.4% |
| Estonian | 131 | 0.0% |
| Ethiopian | 19 | 0.0% |
| European | 3,781 | 1.2% |
| Finnish | 913 | 0.3% |
| French | 31,174 | 9.9% |
| French American Indian | 114 | 0.0% |
| French Canadian | 22,289 | 7.1% |
| German | 25,335 | 8.0% |
| German Russian | 17 | 0.0% |
| Ghanaian | 12 | 0.0% |
| Greek | 5,900 | 1.9% |
| Guamanian / Chamorro | 31 | 0.0% |
| Guatemalan | 111 | 0.0% |
| Haitian | 688 | 0.2% |
| Honduran | 77 | 0.0% |
| Hungarian | 858 | 0.3% |
| Icelander | 32 | 0.0% |
| Indian (Asian) | 2,357 | 0.7% |
| Indonesian | 8 | 0.0% |
| Inupiat | 9 | 0.0% |
| Iranian | 62 | 0.0% |
| Iraqi | 40 | 0.0% |
| Irish | 75,880 | 24.1% |
| Iroquois | 89 | 0.0% |
| Israeli | 79 | 0.0% |
| Italian | 44,025 | 14.0% |
| Jamaican | 283 | 0.1% |
| Japanese | 343 | 0.1% |
| Jordanian | 54 | 0.0% |
| Kenyan | 19 | 0.0% |
| Korean | 1,418 | 0.4% |
| Laotian | 60 | 0.0% |
| Latvian | 82 | 0.0% |
| Lebanese | 2,579 | 0.8% |
| Lithuanian | 1,909 | 0.6% |
| Malaysian | 251 | 0.1% |
| Mexican | 1,886 | 0.6% |
| Moroccan | 192 | 0.1% |
| Native Hawaiian | 122 | 0.0% |
| Navajo | 6 | 0.0% |
| New Zealander | 8 | 0.0% |
| Nicaraguan | 5 | 0.0% |
| Nigerian | 137 | 0.0% |
| Northern European | 763 | 0.2% |
| Norwegian | 2,710 | 0.9% |
| Osage | 14 | 0.0% |
| Pakistani | 116 | 0.0% |
| Palestinian | 53 | 0.0% |
| Panamanian | 117 | 0.0% |
| Pennsylvania German | 44 | 0.0% |
| Peruvian | 338 | 0.1% |
| Polish | 13,811 | 4.4% |
| Portuguese | 5,755 | 1.8% |
| Puerto Rican | 3,001 | 0.9% |
| Romanian | 333 | 0.1% |
| Russian | 2,997 | 0.9% |
| Salvadoran | 252 | 0.1% |
| Scandinavian | 1,100 | 0.4% |
| Scotch-Irish | 4,109 | 1.3% |
| Scottish | 12,850 | 4.1% |
| Serbian | 62 | 0.0% |
| Slavic | 56 | 0.0% |
| Slovak | 173 | 0.1% |
| Slovene | 16 | 0.0% |
| South African | 3 | 0.0% |
| South American | 1,158 | 0.4% |
| South American Indian | 12 | 0.0% |
| Spaniard | 415 | 0.1% |
| Spanish | 230 | 0.1% |
| Spanish American | 35 | 0.0% |
| Sri Lankan | 507 | 0.2% |
| Subsaharan African | 320 | 0.1% |
| Swedish | 4,937 | 1.6% |
| Swiss | 737 | 0.2% |
| Syrian | 408 | 0.1% |
| Thai | 2,077 | 0.7% |
| Turkish | 311 | 0.1% |
| Ukrainian | 1,043 | 0.3% |
| Uruguayan | 48 | 0.0% |
| Venezuelan | 88 | 0.0% |
| Vietnamese | 11 | 0.0% |
| Welsh | 1,987 | 0.6% |
| West Indian | 22 | 0.0% |
| Yugoslavian | 14 | 0.0% |
| Zimbabwean | 4 | 0.0% | View All 130 Rows |
Immigrants in Rockingham County
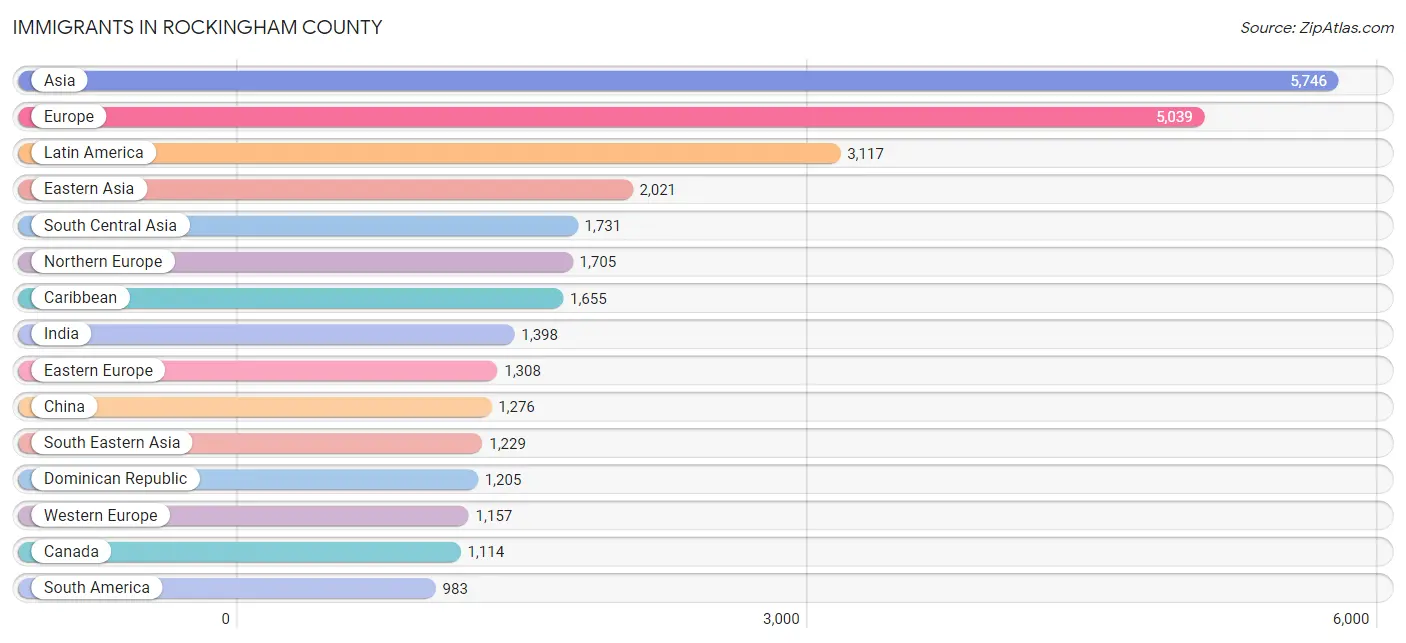
The most numerous immigrant groups reported in Rockingham County came from Asia (5,746 | 1.8%), Europe (5,039 | 1.6%), Latin America (3,117 | 1.0%), Eastern Asia (2,021 | 0.6%), and South Central Asia (1,731 | 0.5%), together accounting for 5.6% of all Rockingham County residents.
| Immigration Origin | # Population | % Population |
| Africa | 447 | 0.1% |
| Albania | 99 | 0.0% |
| Argentina | 73 | 0.0% |
| Asia | 5,746 | 1.8% |
| Australia | 51 | 0.0% |
| Austria | 43 | 0.0% |
| Azores | 64 | 0.0% |
| Bangladesh | 21 | 0.0% |
| Belgium | 31 | 0.0% |
| Belize | 14 | 0.0% |
| Brazil | 506 | 0.2% |
| Bulgaria | 21 | 0.0% |
| Cambodia | 82 | 0.0% |
| Canada | 1,114 | 0.4% |
| Caribbean | 1,655 | 0.5% |
| Central America | 479 | 0.2% |
| China | 1,276 | 0.4% |
| Colombia | 166 | 0.1% |
| Costa Rica | 39 | 0.0% |
| Croatia | 9 | 0.0% |
| Cuba | 96 | 0.0% |
| Czechoslovakia | 43 | 0.0% |
| Denmark | 52 | 0.0% |
| Dominican Republic | 1,205 | 0.4% |
| Eastern Africa | 61 | 0.0% |
| Eastern Asia | 2,021 | 0.6% |
| Eastern Europe | 1,308 | 0.4% |
| Ecuador | 5 | 0.0% |
| Egypt | 19 | 0.0% |
| El Salvador | 158 | 0.1% |
| England | 584 | 0.2% |
| Ethiopia | 19 | 0.0% |
| Europe | 5,039 | 1.6% |
| France | 156 | 0.1% |
| Germany | 588 | 0.2% |
| Greece | 117 | 0.0% |
| Guatemala | 69 | 0.0% |
| Haiti | 161 | 0.1% |
| Honduras | 1 | 0.0% |
| Hong Kong | 111 | 0.0% |
| Hungary | 22 | 0.0% |
| India | 1,398 | 0.4% |
| Indonesia | 33 | 0.0% |
| Iran | 61 | 0.0% |
| Iraq | 38 | 0.0% |
| Ireland | 235 | 0.1% |
| Israel | 133 | 0.0% |
| Italy | 306 | 0.1% |
| Jamaica | 193 | 0.1% |
| Japan | 144 | 0.1% |
| Jordan | 15 | 0.0% |
| Kazakhstan | 40 | 0.0% |
| Kenya | 9 | 0.0% |
| Korea | 601 | 0.2% |
| Laos | 70 | 0.0% |
| Latin America | 3,117 | 1.0% |
| Latvia | 21 | 0.0% |
| Lebanon | 330 | 0.1% |
| Mexico | 190 | 0.1% |
| Moldova | 29 | 0.0% |
| Morocco | 102 | 0.0% |
| Nepal | 148 | 0.1% |
| Netherlands | 105 | 0.0% |
| Nicaragua | 5 | 0.0% |
| Nigeria | 48 | 0.0% |
| Northern Africa | 137 | 0.0% |
| Northern Europe | 1,705 | 0.5% |
| Norway | 2 | 0.0% |
| Oceania | 80 | 0.0% |
| Pakistan | 12 | 0.0% |
| Panama | 3 | 0.0% |
| Peru | 190 | 0.1% |
| Philippines | 682 | 0.2% |
| Poland | 121 | 0.0% |
| Portugal | 369 | 0.1% |
| Romania | 295 | 0.1% |
| Russia | 307 | 0.1% |
| Saudi Arabia | 54 | 0.0% |
| Scotland | 369 | 0.1% |
| South Africa | 13 | 0.0% |
| South America | 983 | 0.3% |
| South Central Asia | 1,731 | 0.5% |
| South Eastern Asia | 1,229 | 0.4% |
| Southern Europe | 869 | 0.3% |
| Spain | 71 | 0.0% |
| Sri Lanka | 21 | 0.0% |
| Sweden | 74 | 0.0% |
| Switzerland | 234 | 0.1% |
| Syria | 11 | 0.0% |
| Taiwan | 221 | 0.1% |
| Thailand | 122 | 0.0% |
| Turkey | 168 | 0.1% |
| Ukraine | 196 | 0.1% |
| Uzbekistan | 30 | 0.0% |
| Venezuela | 38 | 0.0% |
| Vietnam | 218 | 0.1% |
| Western Africa | 83 | 0.0% |
| Western Asia | 749 | 0.2% |
| Western Europe | 1,157 | 0.4% |
| Zimbabwe | 4 | 0.0% | View All 100 Rows |
Sex and Age in Rockingham County
Sex and Age in Rockingham County
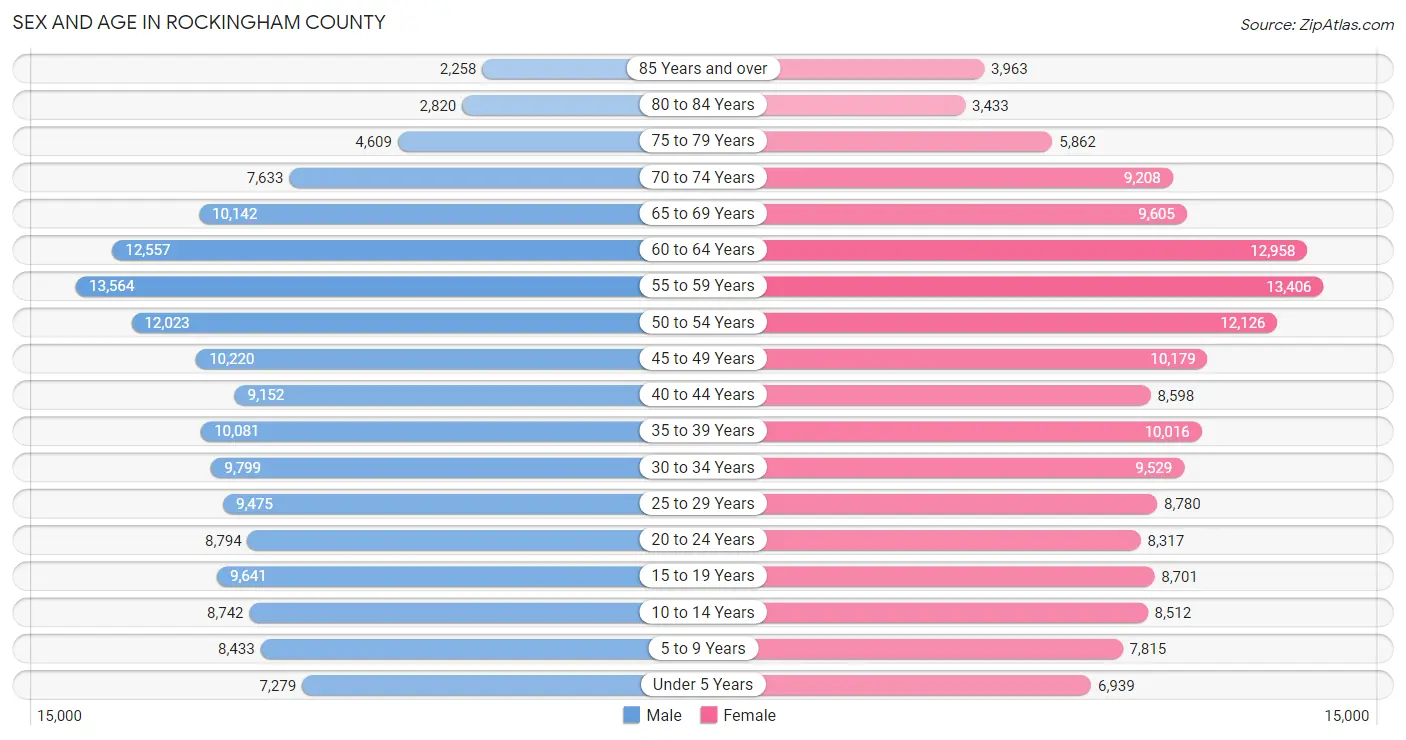
The most populous age groups in Rockingham County are 55 to 59 Years (13,564 | 8.6%) for men and 55 to 59 Years (13,406 | 8.5%) for women.
| Age Bracket | Male | Female |
| Under 5 Years | 7,279 (4.6%) | 6,939 (4.4%) |
| 5 to 9 Years | 8,433 (5.4%) | 7,815 (5.0%) |
| 10 to 14 Years | 8,742 (5.6%) | 8,512 (5.4%) |
| 15 to 19 Years | 9,641 (6.1%) | 8,701 (5.5%) |
| 20 to 24 Years | 8,794 (5.6%) | 8,317 (5.3%) |
| 25 to 29 Years | 9,475 (6.0%) | 8,780 (5.6%) |
| 30 to 34 Years | 9,799 (6.2%) | 9,529 (6.0%) |
| 35 to 39 Years | 10,081 (6.4%) | 10,016 (6.3%) |
| 40 to 44 Years | 9,152 (5.8%) | 8,598 (5.4%) |
| 45 to 49 Years | 10,220 (6.5%) | 10,179 (6.4%) |
| 50 to 54 Years | 12,023 (7.6%) | 12,126 (7.7%) |
| 55 to 59 Years | 13,564 (8.6%) | 13,406 (8.5%) |
| 60 to 64 Years | 12,557 (8.0%) | 12,958 (8.2%) |
| 65 to 69 Years | 10,142 (6.5%) | 9,605 (6.1%) |
| 70 to 74 Years | 7,633 (4.9%) | 9,208 (5.8%) |
| 75 to 79 Years | 4,609 (2.9%) | 5,862 (3.7%) |
| 80 to 84 Years | 2,820 (1.8%) | 3,433 (2.2%) |
| 85 Years and over | 2,258 (1.4%) | 3,963 (2.5%) |
| Total | 157,222 (100.0%) | 157,947 (100.0%) |
Families and Households in Rockingham County
Median Family Size in Rockingham County
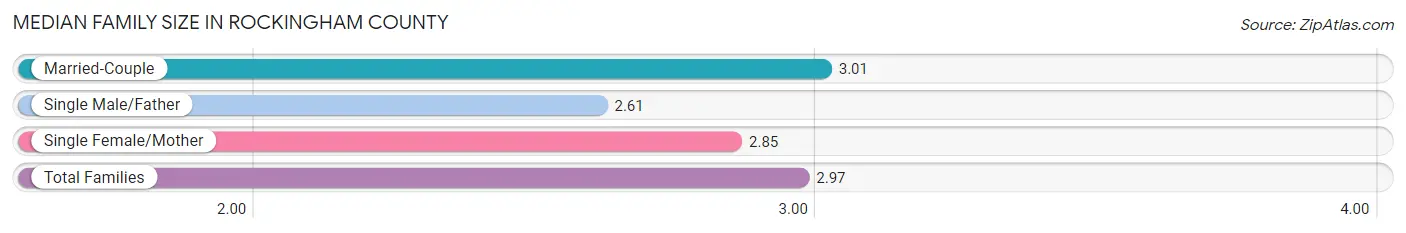
The median family size in Rockingham County is 2.97 persons per family, with married-couple families (71,104 | 82.6%) accounting for the largest median family size of 3.01 persons per family. On the other hand, single male/father families (4,897 | 5.7%) represent the smallest median family size with 2.61 persons per family.
| Family Type | # Families | Family Size |
| Married-Couple | 71,104 (82.6%) | 3.01 |
| Single Male/Father | 4,897 (5.7%) | 2.61 |
| Single Female/Mother | 10,121 (11.7%) | 2.85 |
| Total Families | 86,122 (100.0%) | 2.97 |
Median Household Size in Rockingham County
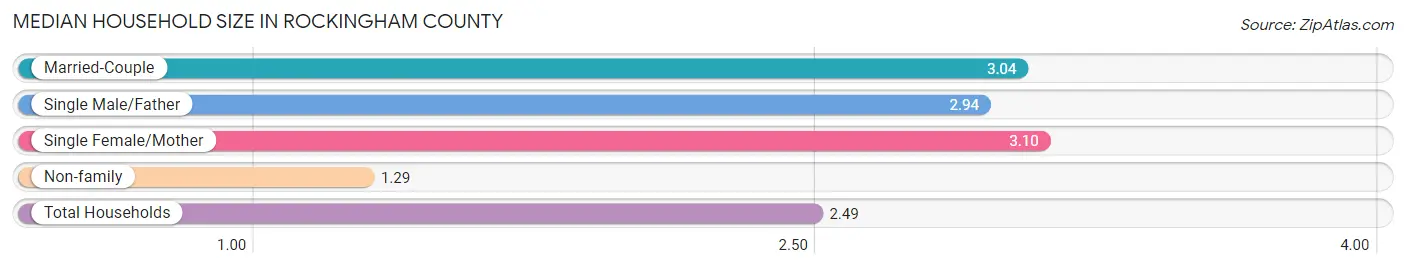
The median household size in Rockingham County is 2.49 persons per household, with single female/mother households (10,121 | 8.1%) accounting for the largest median household size of 3.1 persons per household. non-family households (39,342 | 31.4%) represent the smallest median household size with 1.29 persons per household.
| Household Type | # Households | Household Size |
| Married-Couple | 71,104 (56.7%) | 3.04 |
| Single Male/Father | 4,897 (3.9%) | 2.94 |
| Single Female/Mother | 10,121 (8.1%) | 3.10 |
| Non-family | 39,342 (31.4%) | 1.29 |
| Total Households | 125,464 (100.0%) | 2.49 |
Household Size by Marriage Status in Rockingham County
Out of a total of 125,464 households in Rockingham County, 86,122 (68.6%) are family households, while 39,342 (31.4%) are nonfamily households. The most numerous type of family households are 2-person households, comprising 39,714, and the most common type of nonfamily households are 1-person households, comprising 29,747.
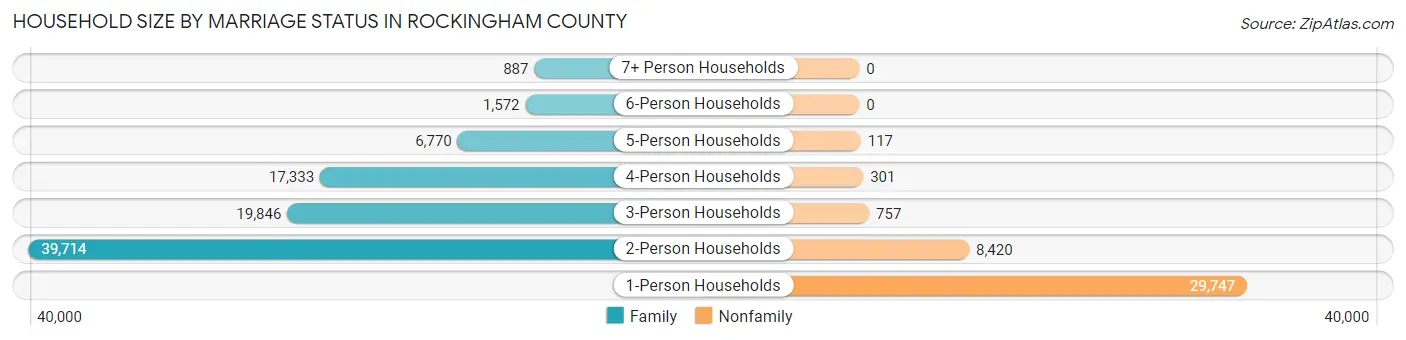
| Household Size | Family Households | Nonfamily Households |
| 1-Person Households | - | 29,747 (23.7%) |
| 2-Person Households | 39,714 (31.7%) | 8,420 (6.7%) |
| 3-Person Households | 19,846 (15.8%) | 757 (0.6%) |
| 4-Person Households | 17,333 (13.8%) | 301 (0.2%) |
| 5-Person Households | 6,770 (5.4%) | 117 (0.1%) |
| 6-Person Households | 1,572 (1.3%) | 0 (0.0%) |
| 7+ Person Households | 887 (0.7%) | 0 (0.0%) |
| Total | 86,122 (68.6%) | 39,342 (31.4%) |
Female Fertility in Rockingham County
Fertility by Age in Rockingham County
Average fertility rate in Rockingham County is 48.0 births per 1,000 women. Women in the age bracket of 20 to 34 years have the highest fertility rate with 70.0 births per 1,000 women. Women in the age bracket of 20 to 34 years acount for 58.9% of all women with births.
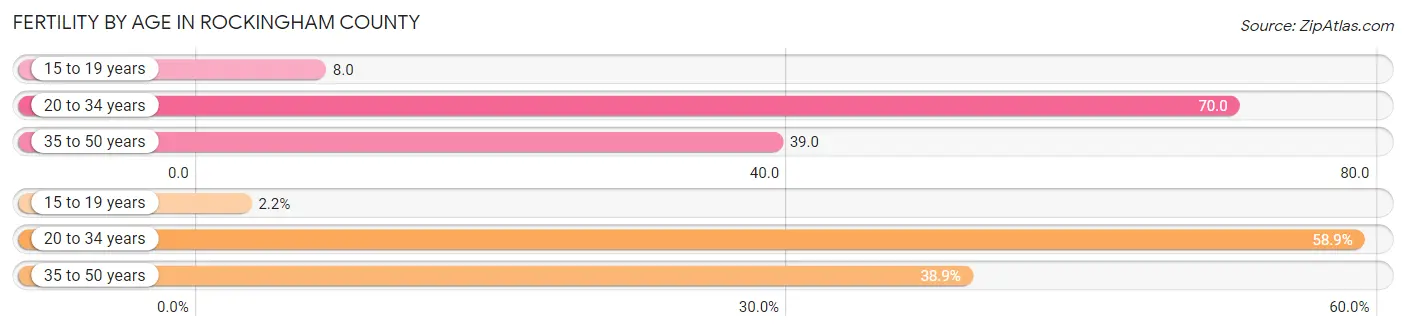
| Age Bracket | Women with Births | Births / 1,000 Women |
| 15 to 19 years | 70 (2.2%) | 8.0 |
| 20 to 34 years | 1,868 (58.9%) | 70.0 |
| 35 to 50 years | 1,235 (38.9%) | 39.0 |
| Total | 3,173 (100.0%) | 48.0 |
Fertility by Age by Marriage Status in Rockingham County
86.0% of women with births (3,173) in Rockingham County are married. The highest percentage of unmarried women with births falls into 15 to 19 years age bracket with 100.0% of them unmarried at the time of birth, while the lowest percentage of unmarried women with births belong to 35 to 50 years age bracket with 1.5% of them unmarried.
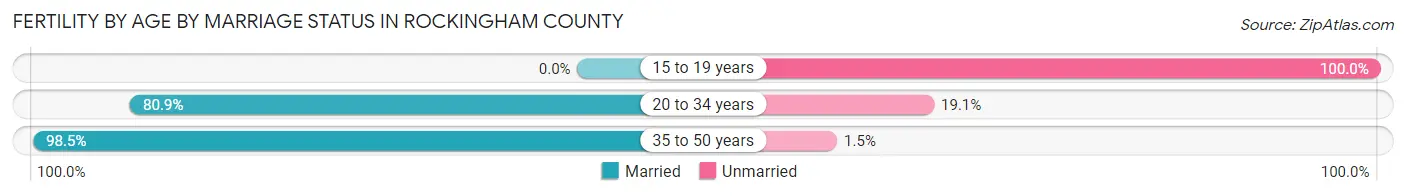
| Age Bracket | Married | Unmarried |
| 15 to 19 years | 0 (0.0%) | 70 (100.0%) |
| 20 to 34 years | 1,511 (80.9%) | 357 (19.1%) |
| 35 to 50 years | 1,216 (98.5%) | 19 (1.5%) |
| Total | 2,729 (86.0%) | 444 (14.0%) |
Fertility by Education in Rockingham County
Average fertility rate in Rockingham County is 48.0 births per 1,000 women. Women with the education attainment of graduate degree have the highest fertility rate of 73.0 births per 1,000 women, while women with the education attainment of less than high school have the lowest fertility at 13.0 births per 1,000 women. Women with the education attainment of bachelor's degree represent 27.8% of all women with births.
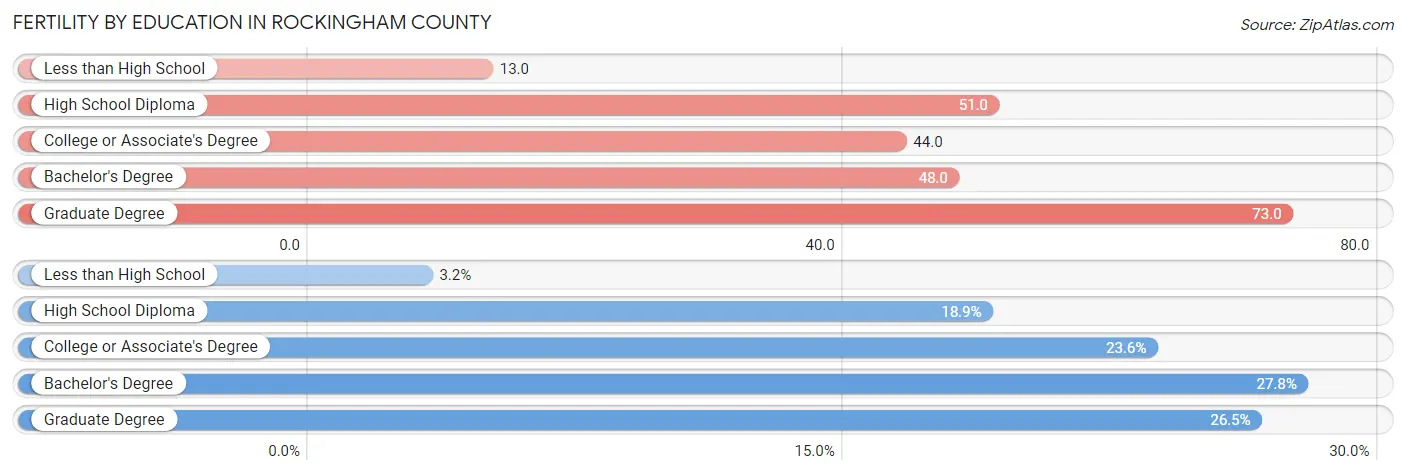
| Educational Attainment | Women with Births | Births / 1,000 Women |
| Less than High School | 101 (3.2%) | 13.0 |
| High School Diploma | 601 (18.9%) | 51.0 |
| College or Associate's Degree | 748 (23.6%) | 44.0 |
| Bachelor's Degree | 882 (27.8%) | 48.0 |
| Graduate Degree | 841 (26.5%) | 73.0 |
| Total | 3,173 (100.0%) | 48.0 |
Fertility by Education by Marriage Status in Rockingham County
14.0% of women with births in Rockingham County are unmarried. Women with the educational attainment of bachelor's degree are most likely to be married with 97.1% of them married at childbirth, while women with the educational attainment of college or associate's degree are least likely to be married with 31.7% of them unmarried at childbirth.
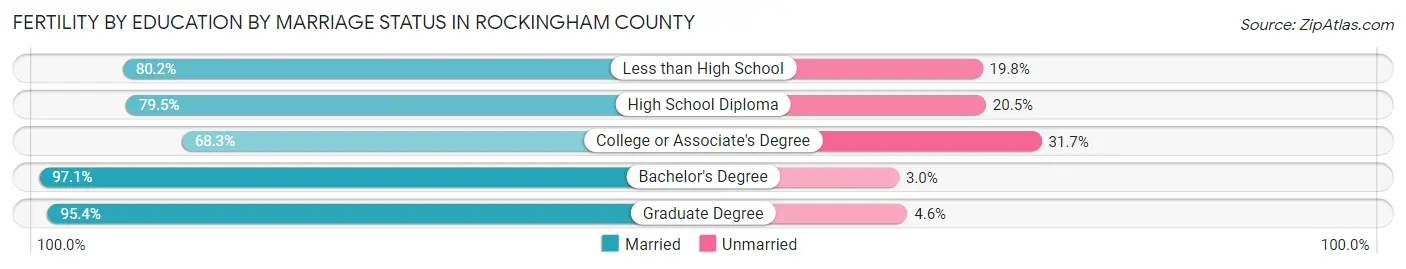
| Educational Attainment | Married | Unmarried |
| Less than High School | 81 (80.2%) | 20 (19.8%) |
| High School Diploma | 478 (79.5%) | 123 (20.5%) |
| College or Associate's Degree | 511 (68.3%) | 237 (31.7%) |
| Bachelor's Degree | 856 (97.1%) | 26 (2.9%) |
| Graduate Degree | 802 (95.4%) | 39 (4.6%) |
| Total | 2,729 (86.0%) | 444 (14.0%) |
Employment Characteristics in Rockingham County
Employment by Class of Employer in Rockingham County
Among the 171,850 employed individuals in Rockingham County, private company employees (115,887 | 67.4%), not-for-profit organizations (17,044 | 9.9%), and local government employees (12,575 | 7.3%) make up the most common classes of employment.
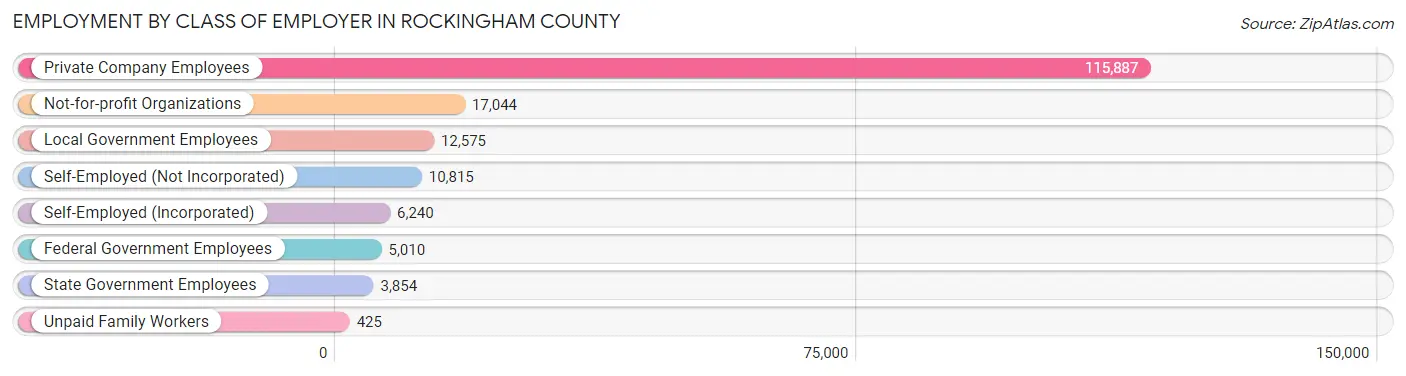
| Employer Class | # Employees | % Employees |
| Private Company Employees | 115,887 | 67.4% |
| Self-Employed (Incorporated) | 6,240 | 3.6% |
| Self-Employed (Not Incorporated) | 10,815 | 6.3% |
| Not-for-profit Organizations | 17,044 | 9.9% |
| Local Government Employees | 12,575 | 7.3% |
| State Government Employees | 3,854 | 2.2% |
| Federal Government Employees | 5,010 | 2.9% |
| Unpaid Family Workers | 425 | 0.3% |
| Total | 171,850 | 100.0% |
Employment Status by Age in Rockingham County
According to the labor force statistics for Rockingham County, out of the total population over 16 years of age (263,171), 68.9% or 181,325 individuals are in the labor force, with 3.4% or 6,165 of them unemployed. The age group with the highest labor force participation rate is 25 to 29 years, with 90.4% or 16,503 individuals in the labor force. Within the labor force, the 75 years and over age range has the highest percentage of unemployed individuals, with 7.7% or 161 of them being unemployed.
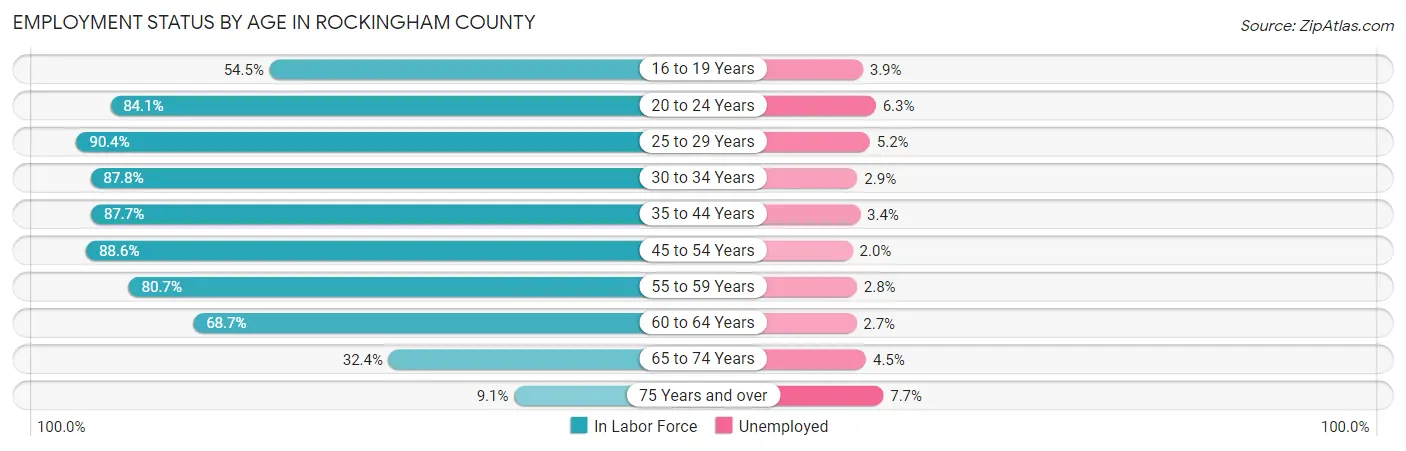
| Age Bracket | In Labor Force | Unemployed |
| 16 to 19 Years | 7,665 (54.5%) | 299 (3.9%) |
| 20 to 24 Years | 14,390 (84.1%) | 907 (6.3%) |
| 25 to 29 Years | 16,503 (90.4%) | 858 (5.2%) |
| 30 to 34 Years | 16,970 (87.8%) | 492 (2.9%) |
| 35 to 44 Years | 33,192 (87.7%) | 1,129 (3.4%) |
| 45 to 54 Years | 39,470 (88.6%) | 789 (2.0%) |
| 55 to 59 Years | 21,765 (80.7%) | 609 (2.8%) |
| 60 to 64 Years | 17,529 (68.7%) | 473 (2.7%) |
| 65 to 74 Years | 11,855 (32.4%) | 533 (4.5%) |
| 75 Years and over | 2,088 (9.1%) | 161 (7.7%) |
| Total | 181,325 (68.9%) | 6,165 (3.4%) |
Employment Status by Educational Attainment in Rockingham County
According to labor force statistics for Rockingham County, 84.3% of individuals (145,386) out of the total population between 25 and 64 years of age (172,463) are in the labor force, with 3.0% or 4,362 of them being unemployed. The group with the highest labor force participation rate are those with the educational attainment of bachelor's degree or higher, with 89.5% or 70,547 individuals in the labor force. Within the labor force, individuals with less than high school education have the highest percentage of unemployment, with 7.9% or 303 of them being unemployed.
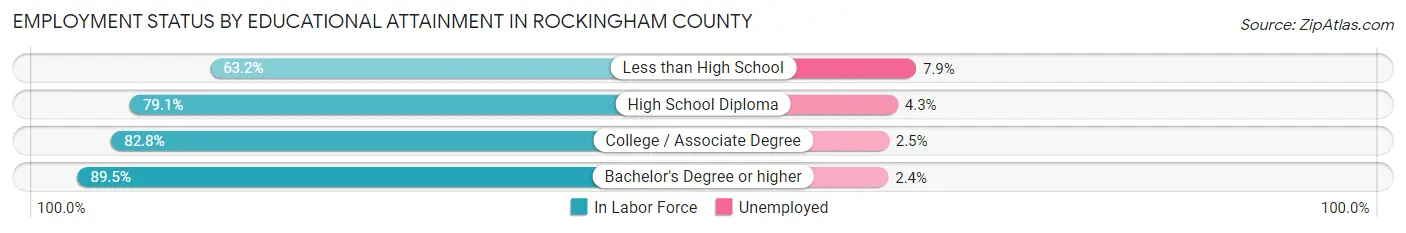
| Educational Attainment | In Labor Force | Unemployed |
| Less than High School | 3,836 (63.2%) | 480 (7.9%) |
| High School Diploma | 32,242 (79.1%) | 1,753 (4.3%) |
| College / Associate Degree | 38,758 (82.8%) | 1,170 (2.5%) |
| Bachelor's Degree or higher | 70,547 (89.5%) | 1,892 (2.4%) |
| Total | 145,386 (84.3%) | 5,174 (3.0%) |
Employment Occupations by Sex in Rockingham County
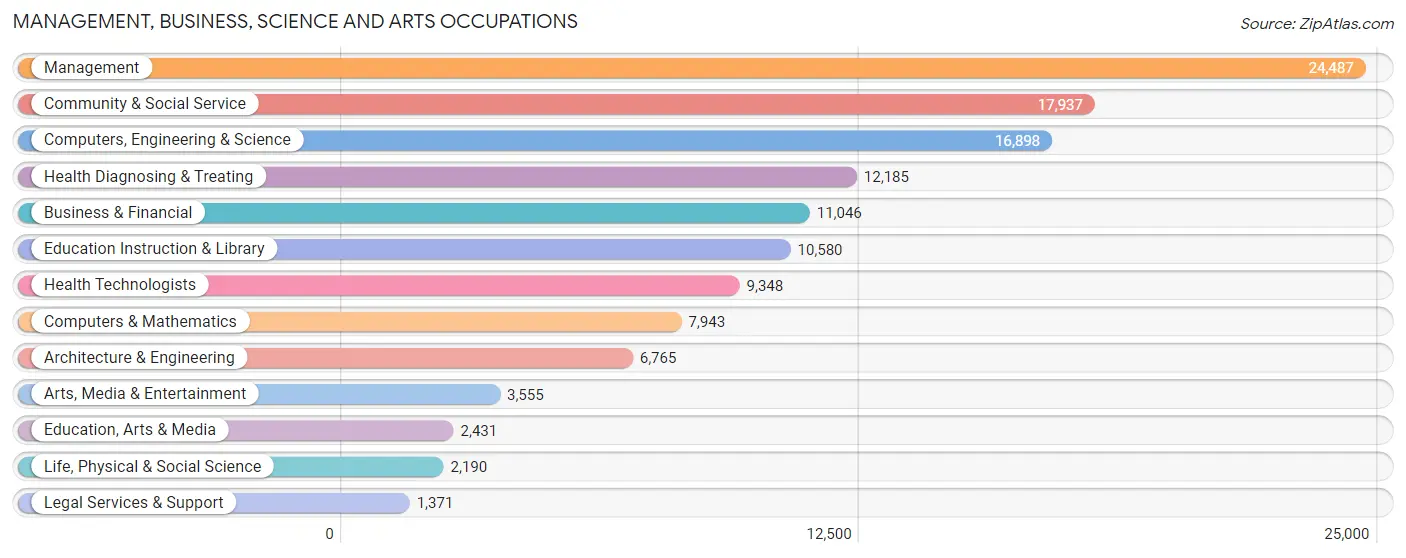
Management, Business, Science and Arts Occupations
The most common Management, Business, Science and Arts occupations in Rockingham County are Management (24,487 | 14.0%), Community & Social Service (17,937 | 10.3%), Computers, Engineering & Science (16,898 | 9.7%), Health Diagnosing & Treating (12,185 | 7.0%), and Business & Financial (11,046 | 6.3%).
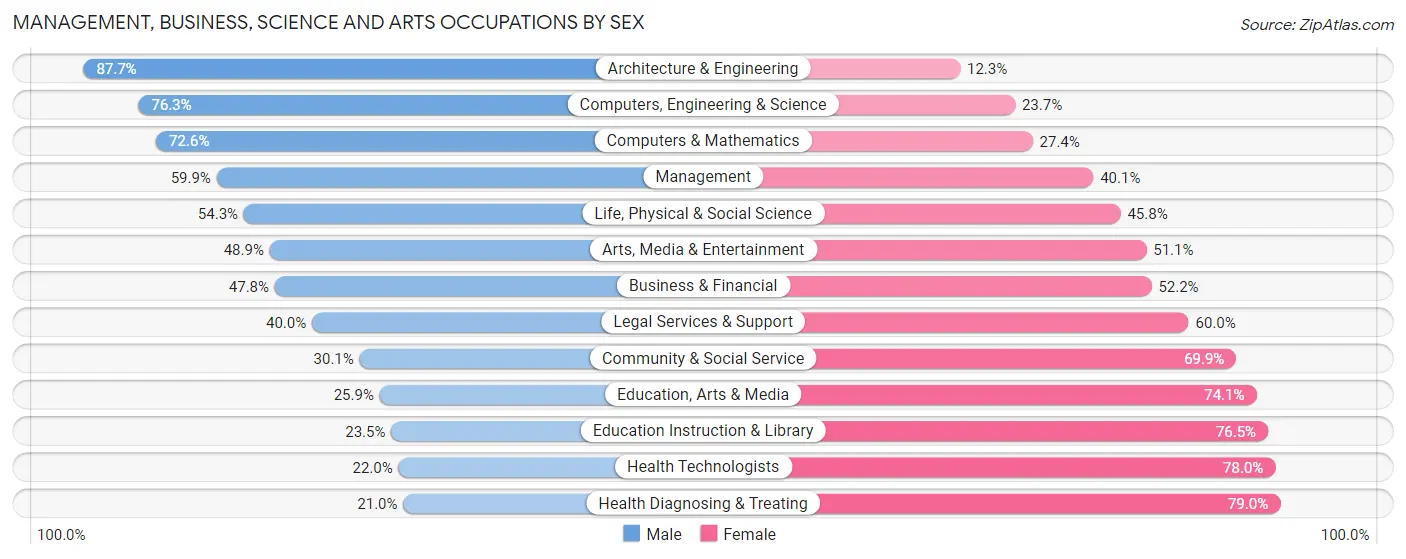
Management, Business, Science and Arts Occupations by Sex
Within the Management, Business, Science and Arts occupations in Rockingham County, the most male-oriented occupations are Architecture & Engineering (87.7%), Computers, Engineering & Science (76.3%), and Computers & Mathematics (72.6%), while the most female-oriented occupations are Health Diagnosing & Treating (79.0%), Health Technologists (78.0%), and Education Instruction & Library (76.5%).
| Occupation | Male | Female |
| Management | 14,674 (59.9%) | 9,813 (40.1%) |
| Business & Financial | 5,279 (47.8%) | 5,767 (52.2%) |
| Computers, Engineering & Science | 12,887 (76.3%) | 4,011 (23.7%) |
| Computers & Mathematics | 5,765 (72.6%) | 2,178 (27.4%) |
| Architecture & Engineering | 5,934 (87.7%) | 831 (12.3%) |
| Life, Physical & Social Science | 1,188 (54.2%) | 1,002 (45.8%) |
| Community & Social Service | 5,402 (30.1%) | 12,535 (69.9%) |
| Education, Arts & Media | 630 (25.9%) | 1,801 (74.1%) |
| Legal Services & Support | 549 (40.0%) | 822 (60.0%) |
| Education Instruction & Library | 2,486 (23.5%) | 8,094 (76.5%) |
| Arts, Media & Entertainment | 1,737 (48.9%) | 1,818 (51.1%) |
| Health Diagnosing & Treating | 2,558 (21.0%) | 9,627 (79.0%) |
| Health Technologists | 2,056 (22.0%) | 7,292 (78.0%) |
| Total (Category) | 40,800 (49.4%) | 41,753 (50.6%) |
| Total (Overall) | 93,472 (53.5%) | 81,196 (46.5%) |
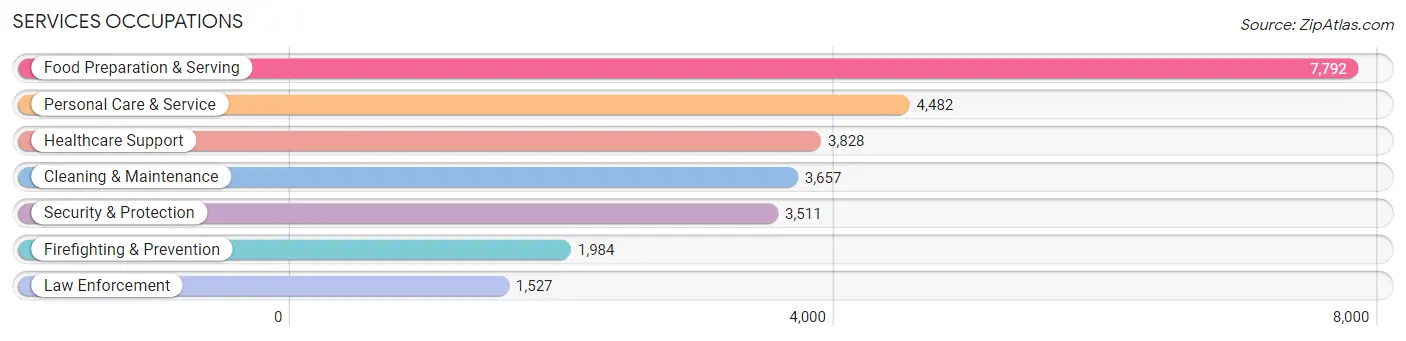
Services Occupations
The most common Services occupations in Rockingham County are Food Preparation & Serving (7,792 | 4.5%), Personal Care & Service (4,482 | 2.6%), Healthcare Support (3,828 | 2.2%), Cleaning & Maintenance (3,657 | 2.1%), and Security & Protection (3,511 | 2.0%).
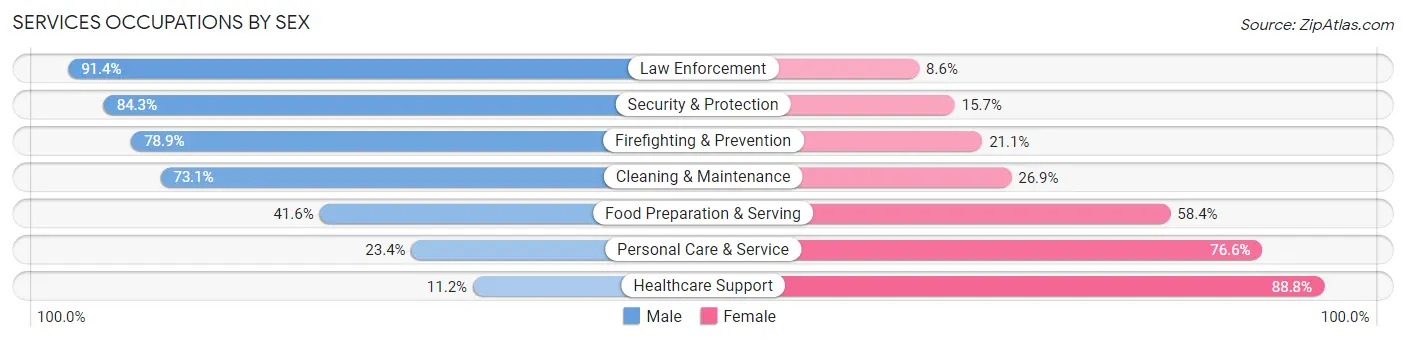
Services Occupations by Sex
Within the Services occupations in Rockingham County, the most male-oriented occupations are Law Enforcement (91.4%), Security & Protection (84.3%), and Firefighting & Prevention (78.9%), while the most female-oriented occupations are Healthcare Support (88.8%), Personal Care & Service (76.6%), and Food Preparation & Serving (58.4%).
| Occupation | Male | Female |
| Healthcare Support | 430 (11.2%) | 3,398 (88.8%) |
| Security & Protection | 2,960 (84.3%) | 551 (15.7%) |
| Firefighting & Prevention | 1,565 (78.9%) | 419 (21.1%) |
| Law Enforcement | 1,395 (91.4%) | 132 (8.6%) |
| Food Preparation & Serving | 3,242 (41.6%) | 4,550 (58.4%) |
| Cleaning & Maintenance | 2,674 (73.1%) | 983 (26.9%) |
| Personal Care & Service | 1,049 (23.4%) | 3,433 (76.6%) |
| Total (Category) | 10,355 (44.5%) | 12,915 (55.5%) |
| Total (Overall) | 93,472 (53.5%) | 81,196 (46.5%) |
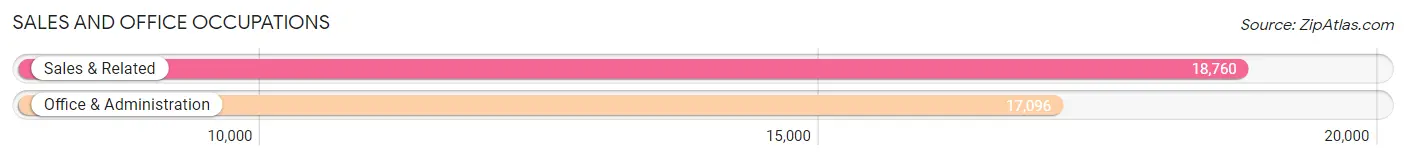
Sales and Office Occupations
The most common Sales and Office occupations in Rockingham County are Sales & Related (18,760 | 10.7%), and Office & Administration (17,096 | 9.8%).
Sales and Office Occupations by Sex
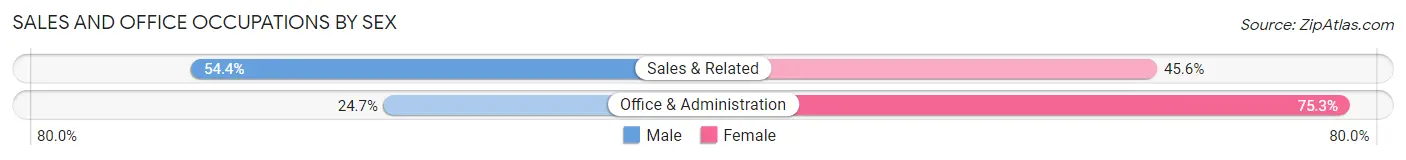
| Occupation | Male | Female |
| Sales & Related | 10,202 (54.4%) | 8,558 (45.6%) |
| Office & Administration | 4,230 (24.7%) | 12,866 (75.3%) |
| Total (Category) | 14,432 (40.3%) | 21,424 (59.8%) |
| Total (Overall) | 93,472 (53.5%) | 81,196 (46.5%) |
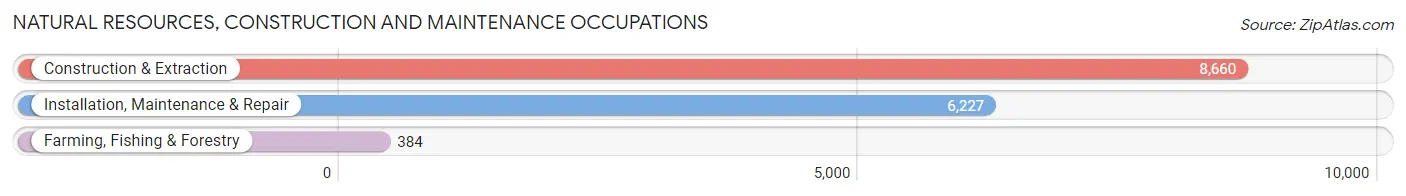
Natural Resources, Construction and Maintenance Occupations
The most common Natural Resources, Construction and Maintenance occupations in Rockingham County are Construction & Extraction (8,660 | 5.0%), Installation, Maintenance & Repair (6,227 | 3.6%), and Farming, Fishing & Forestry (384 | 0.2%).
Natural Resources, Construction and Maintenance Occupations by Sex
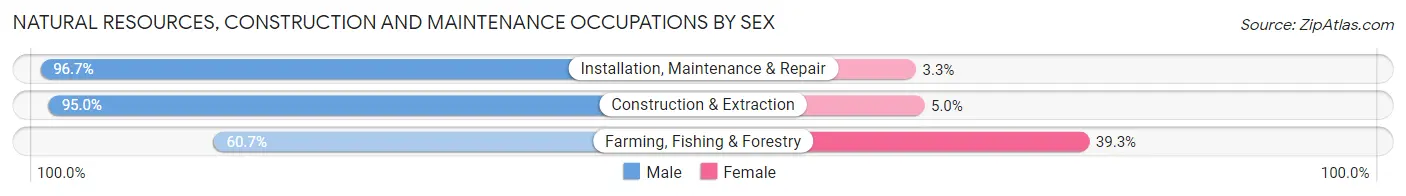
| Occupation | Male | Female |
| Farming, Fishing & Forestry | 233 (60.7%) | 151 (39.3%) |
| Construction & Extraction | 8,225 (95.0%) | 435 (5.0%) |
| Installation, Maintenance & Repair | 6,024 (96.7%) | 203 (3.3%) |
| Total (Category) | 14,482 (94.8%) | 789 (5.2%) |
| Total (Overall) | 93,472 (53.5%) | 81,196 (46.5%) |
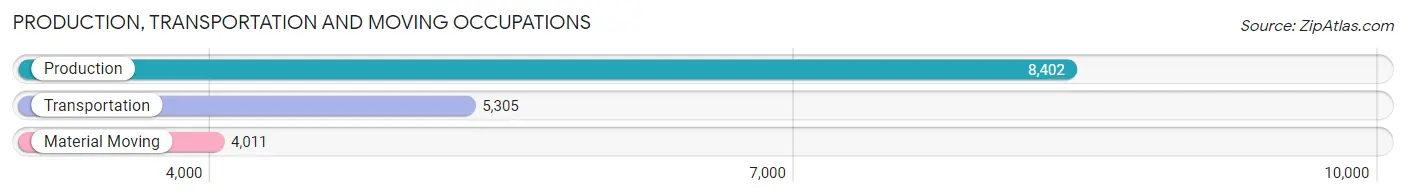
Production, Transportation and Moving Occupations
The most common Production, Transportation and Moving occupations in Rockingham County are Production (8,402 | 4.8%), Transportation (5,305 | 3.0%), and Material Moving (4,011 | 2.3%).
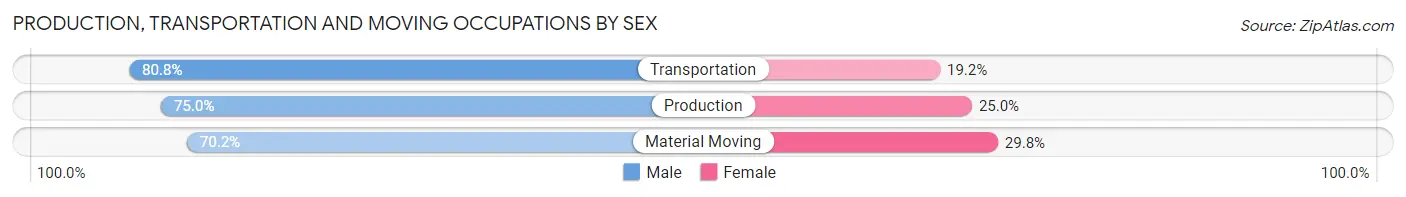
Production, Transportation and Moving Occupations by Sex
| Occupation | Male | Female |
| Production | 6,299 (75.0%) | 2,103 (25.0%) |
| Transportation | 4,288 (80.8%) | 1,017 (19.2%) |
| Material Moving | 2,816 (70.2%) | 1,195 (29.8%) |
| Total (Category) | 13,403 (75.6%) | 4,315 (24.3%) |
| Total (Overall) | 93,472 (53.5%) | 81,196 (46.5%) |
Employment Industries by Sex in Rockingham County
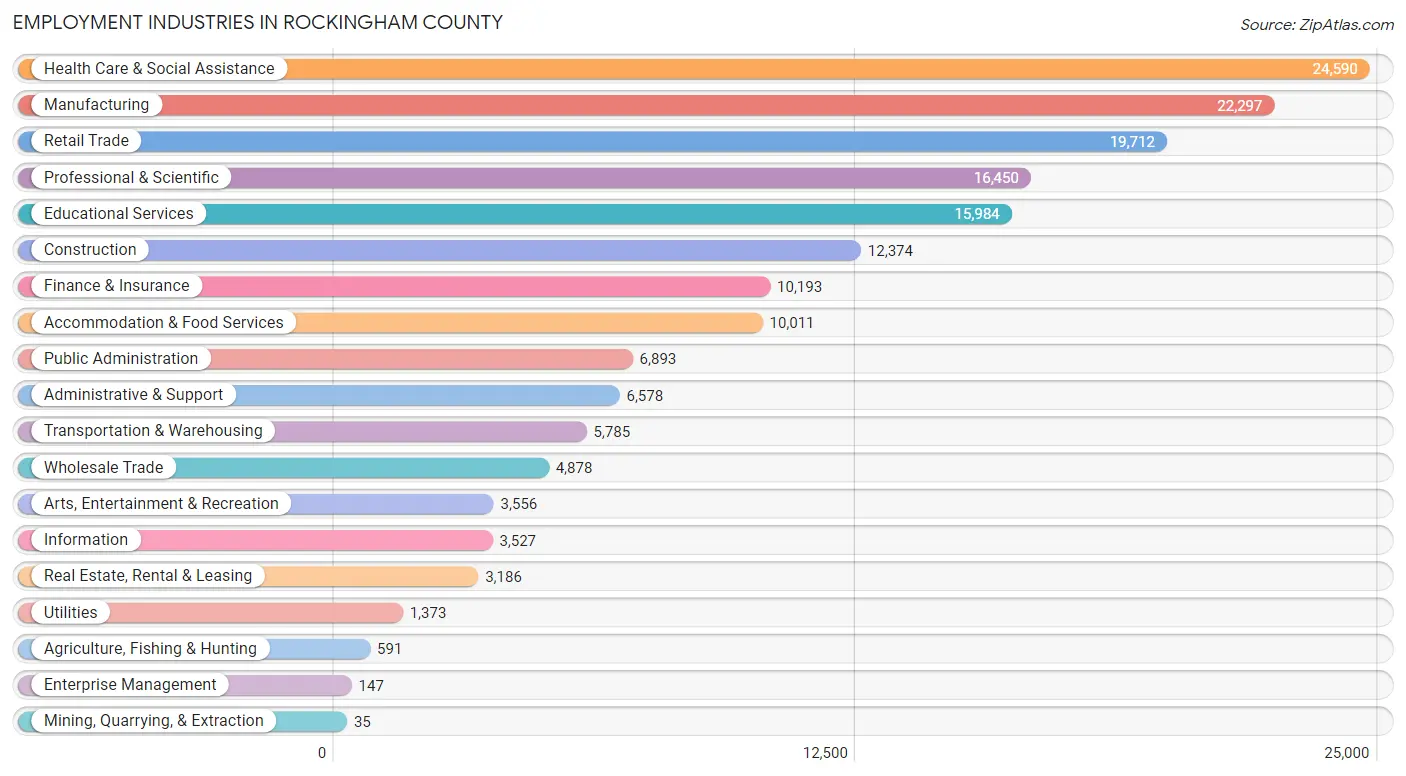
Employment Industries in Rockingham County
The major employment industries in Rockingham County include Health Care & Social Assistance (24,590 | 14.1%), Manufacturing (22,297 | 12.8%), Retail Trade (19,712 | 11.3%), Professional & Scientific (16,450 | 9.4%), and Educational Services (15,984 | 9.1%).
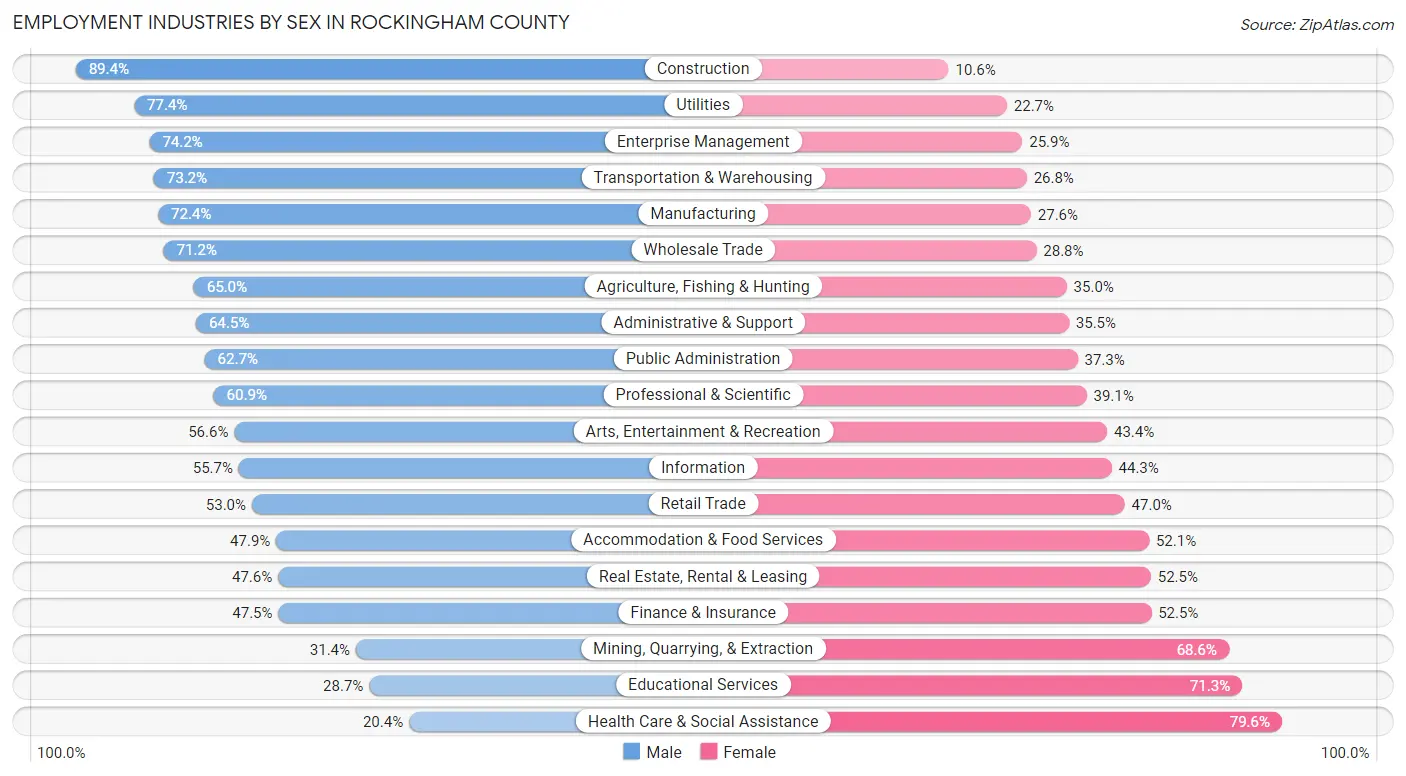
Employment Industries by Sex in Rockingham County
The Rockingham County industries that see more men than women are Construction (89.4%), Utilities (77.3%), and Enterprise Management (74.2%), whereas the industries that tend to have a higher number of women are Health Care & Social Assistance (79.6%), Educational Services (71.3%), and Mining, Quarrying, & Extraction (68.6%).
| Industry | Male | Female |
| Agriculture, Fishing & Hunting | 384 (65.0%) | 207 (35.0%) |
| Mining, Quarrying, & Extraction | 11 (31.4%) | 24 (68.6%) |
| Construction | 11,064 (89.4%) | 1,310 (10.6%) |
| Manufacturing | 16,139 (72.4%) | 6,158 (27.6%) |
| Wholesale Trade | 3,475 (71.2%) | 1,403 (28.8%) |
| Retail Trade | 10,439 (53.0%) | 9,273 (47.0%) |
| Transportation & Warehousing | 4,237 (73.2%) | 1,548 (26.8%) |
| Utilities | 1,062 (77.3%) | 311 (22.7%) |
| Information | 1,963 (55.7%) | 1,564 (44.3%) |
| Finance & Insurance | 4,839 (47.5%) | 5,354 (52.5%) |
| Real Estate, Rental & Leasing | 1,515 (47.5%) | 1,671 (52.4%) |
| Professional & Scientific | 10,011 (60.9%) | 6,439 (39.1%) |
| Enterprise Management | 109 (74.2%) | 38 (25.9%) |
| Administrative & Support | 4,244 (64.5%) | 2,334 (35.5%) |
| Educational Services | 4,585 (28.7%) | 11,399 (71.3%) |
| Health Care & Social Assistance | 5,025 (20.4%) | 19,565 (79.6%) |
| Arts, Entertainment & Recreation | 2,013 (56.6%) | 1,543 (43.4%) |
| Accommodation & Food Services | 4,798 (47.9%) | 5,213 (52.1%) |
| Public Administration | 4,323 (62.7%) | 2,570 (37.3%) |
| Total | 93,472 (53.5%) | 81,196 (46.5%) |
Education in Rockingham County
School Enrollment in Rockingham County
The most common levels of schooling among the 64,955 students in Rockingham County are high school (16,085 | 24.8%), elementary school (13,404 | 20.6%), and middle school (13,080 | 20.1%).
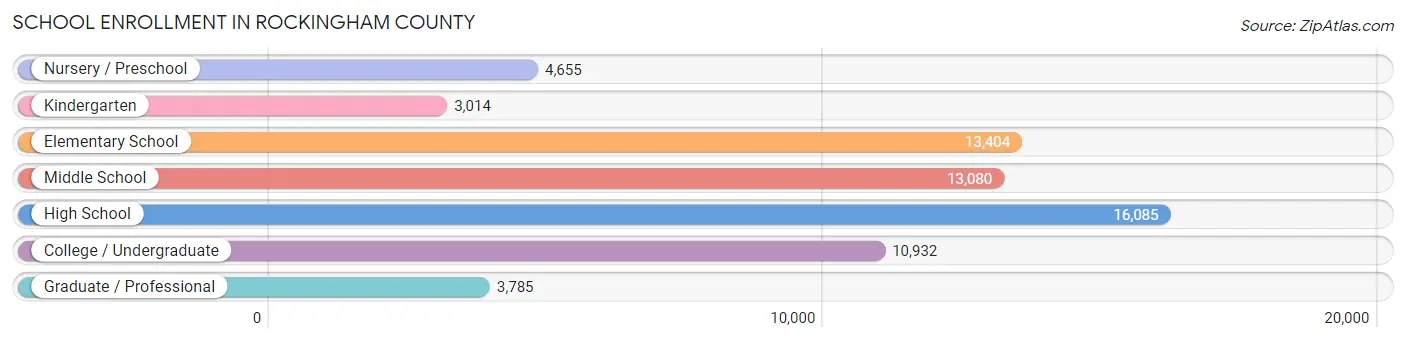
| School Level | # Students | % Students |
| Nursery / Preschool | 4,655 | 7.2% |
| Kindergarten | 3,014 | 4.6% |
| Elementary School | 13,404 | 20.6% |
| Middle School | 13,080 | 20.1% |
| High School | 16,085 | 24.8% |
| College / Undergraduate | 10,932 | 16.8% |
| Graduate / Professional | 3,785 | 5.8% |
| Total | 64,955 | 100.0% |
School Enrollment by Age by Funding Source in Rockingham County
Out of a total of 64,955 students who are enrolled in schools in Rockingham County, 13,835 (21.3%) attend a private institution, while the remaining 51,120 (78.7%) are enrolled in public schools. The age group of 3 to 4 year olds has the highest likelihood of being enrolled in private schools, with 2,613 (70.3% in the age bracket) enrolled. Conversely, the age group of 10 to 14 year olds has the lowest likelihood of being enrolled in a private school, with 15,356 (91.0% in the age bracket) attending a public institution.
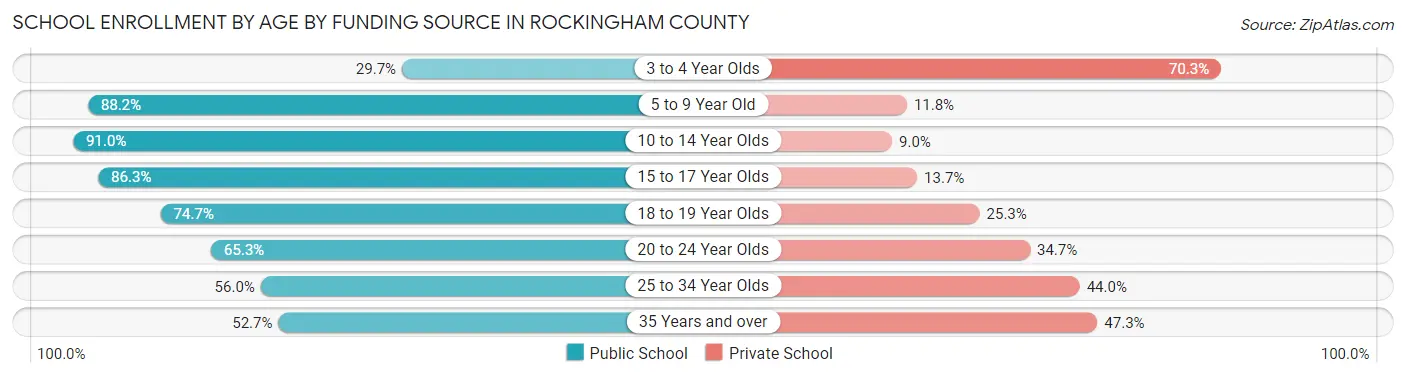
| Age Bracket | Public School | Private School |
| 3 to 4 Year Olds | 1,105 (29.7%) | 2,613 (70.3%) |
| 5 to 9 Year Old | 13,743 (88.2%) | 1,836 (11.8%) |
| 10 to 14 Year Olds | 15,356 (91.0%) | 1,523 (9.0%) |
| 15 to 17 Year Olds | 10,041 (86.3%) | 1,592 (13.7%) |
| 18 to 19 Year Olds | 3,309 (74.7%) | 1,122 (25.3%) |
| 20 to 24 Year Olds | 3,881 (65.3%) | 2,063 (34.7%) |
| 25 to 34 Year Olds | 1,788 (56.0%) | 1,403 (44.0%) |
| 35 Years and over | 1,888 (52.7%) | 1,692 (47.3%) |
| Total | 51,120 (78.7%) | 13,835 (21.3%) |
Educational Attainment by Field of Study in Rockingham County
Business (22,084 | 20.2%), science & technology (11,001 | 10.1%), education (10,532 | 9.6%), engineering (10,007 | 9.1%), and social sciences (8,344 | 7.6%) are the most common fields of study among 109,418 individuals in Rockingham County who have obtained a bachelor's degree or higher.
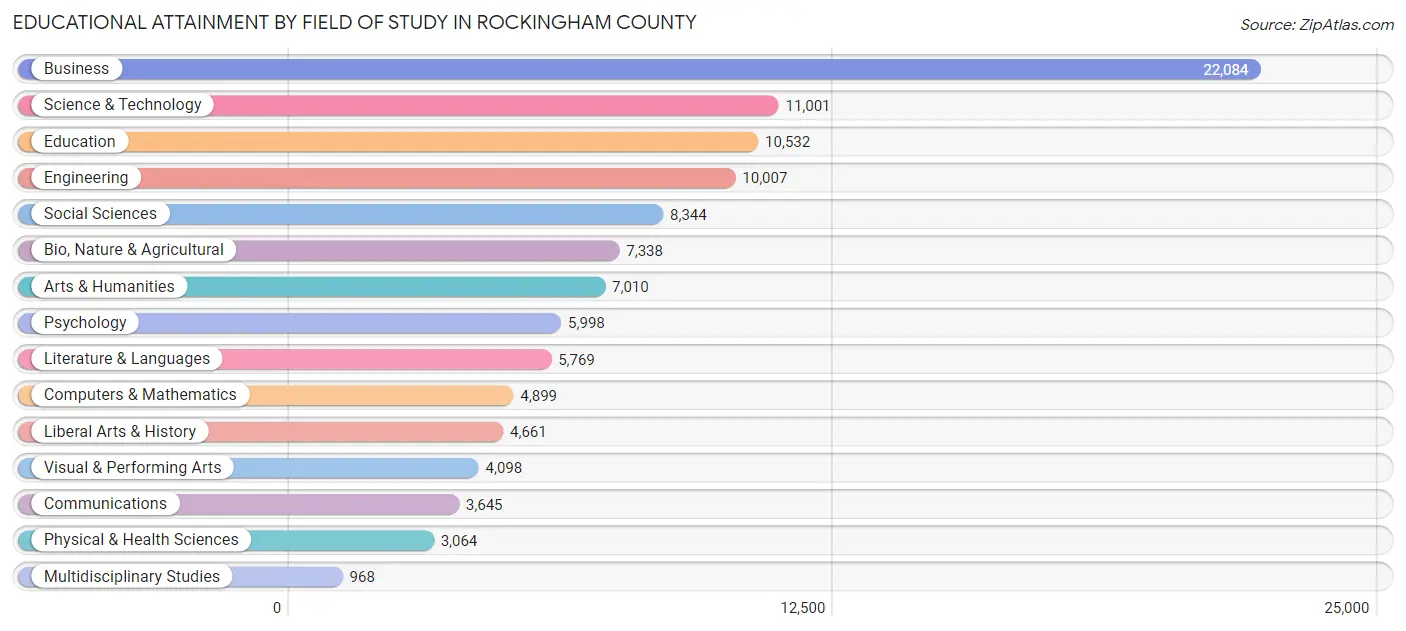
| Field of Study | # Graduates | % Graduates |
| Computers & Mathematics | 4,899 | 4.5% |
| Bio, Nature & Agricultural | 7,338 | 6.7% |
| Physical & Health Sciences | 3,064 | 2.8% |
| Psychology | 5,998 | 5.5% |
| Social Sciences | 8,344 | 7.6% |
| Engineering | 10,007 | 9.1% |
| Multidisciplinary Studies | 968 | 0.9% |
| Science & Technology | 11,001 | 10.1% |
| Business | 22,084 | 20.2% |
| Education | 10,532 | 9.6% |
| Literature & Languages | 5,769 | 5.3% |
| Liberal Arts & History | 4,661 | 4.3% |
| Visual & Performing Arts | 4,098 | 3.7% |
| Communications | 3,645 | 3.3% |
| Arts & Humanities | 7,010 | 6.4% |
| Total | 109,418 | 100.0% |
Transportation & Commute in Rockingham County
Vehicle Availability by Sex in Rockingham County
The most prevalent vehicle ownership categories in Rockingham County are males with 2 vehicles (42,103, accounting for 45.5%) and females with 2 vehicles (34,563, making up 53.2%).
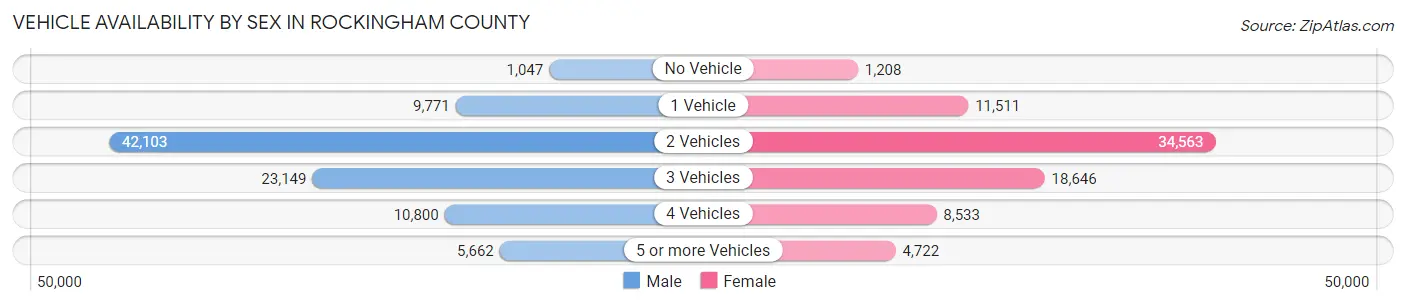
| Vehicles Available | Male | Female |
| No Vehicle | 1,047 (1.1%) | 1,208 (1.5%) |
| 1 Vehicle | 9,771 (10.6%) | 11,511 (14.5%) |
| 2 Vehicles | 42,103 (45.5%) | 34,563 (43.6%) |
| 3 Vehicles | 23,149 (25.0%) | 18,646 (23.5%) |
| 4 Vehicles | 10,800 (11.7%) | 8,533 (10.8%) |
| 5 or more Vehicles | 5,662 (6.1%) | 4,722 (6.0%) |
| Total | 92,532 (100.0%) | 79,183 (100.0%) |
Commute Time in Rockingham County
The most frequently occuring commute durations in Rockingham County are 20 to 24 minutes (19,407 commuters, 13.3%), 30 to 34 minutes (18,811 commuters, 12.9%), and 15 to 19 minutes (17,546 commuters, 12.0%).
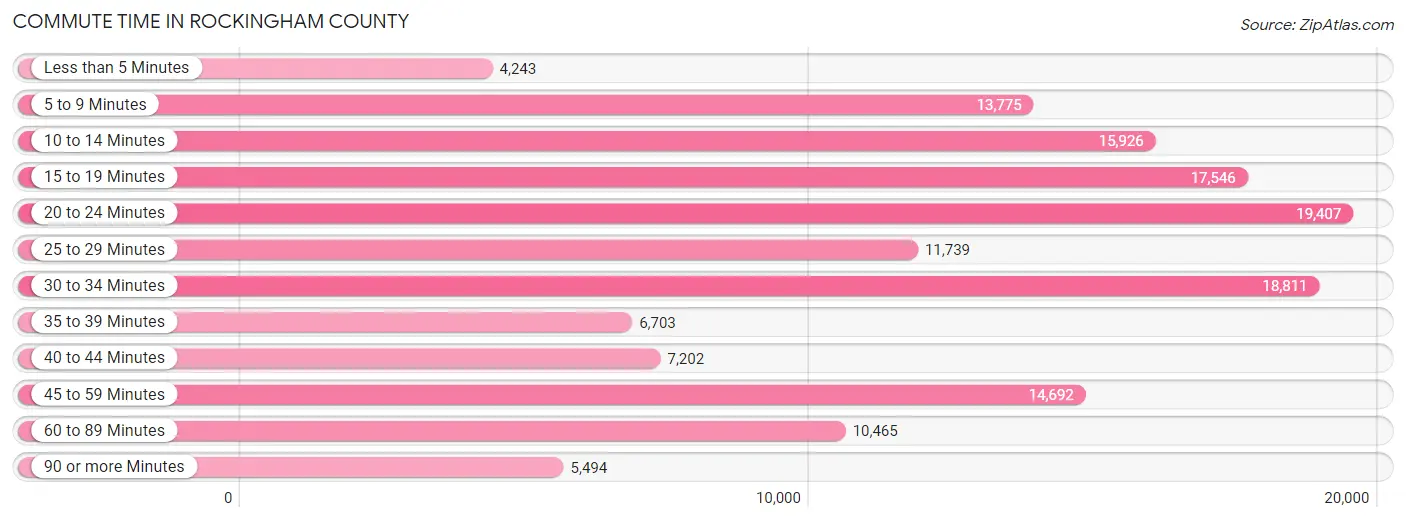
| Commute Time | # Commuters | % Commuters |
| Less than 5 Minutes | 4,243 | 2.9% |
| 5 to 9 Minutes | 13,775 | 9.4% |
| 10 to 14 Minutes | 15,926 | 10.9% |
| 15 to 19 Minutes | 17,546 | 12.0% |
| 20 to 24 Minutes | 19,407 | 13.3% |
| 25 to 29 Minutes | 11,739 | 8.0% |
| 30 to 34 Minutes | 18,811 | 12.9% |
| 35 to 39 Minutes | 6,703 | 4.6% |
| 40 to 44 Minutes | 7,202 | 4.9% |
| 45 to 59 Minutes | 14,692 | 10.1% |
| 60 to 89 Minutes | 10,465 | 7.2% |
| 90 or more Minutes | 5,494 | 3.8% |
Commute Time by Sex in Rockingham County
The most common commute times in Rockingham County are 30 to 34 minutes (10,709 commuters, 13.7%) for males and 20 to 24 minutes (9,353 commuters, 13.8%) for females.
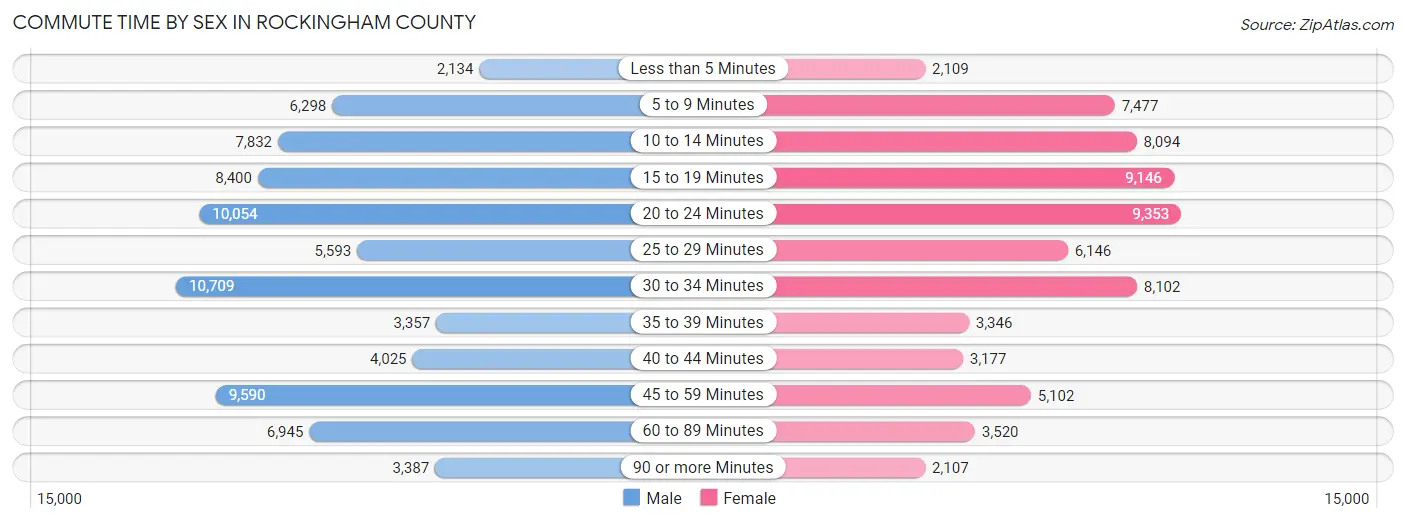
| Commute Time | Male | Female |
| Less than 5 Minutes | 2,134 (2.7%) | 2,109 (3.1%) |
| 5 to 9 Minutes | 6,298 (8.0%) | 7,477 (11.1%) |
| 10 to 14 Minutes | 7,832 (10.0%) | 8,094 (12.0%) |
| 15 to 19 Minutes | 8,400 (10.7%) | 9,146 (13.5%) |
| 20 to 24 Minutes | 10,054 (12.8%) | 9,353 (13.8%) |
| 25 to 29 Minutes | 5,593 (7.1%) | 6,146 (9.1%) |
| 30 to 34 Minutes | 10,709 (13.7%) | 8,102 (12.0%) |
| 35 to 39 Minutes | 3,357 (4.3%) | 3,346 (4.9%) |
| 40 to 44 Minutes | 4,025 (5.1%) | 3,177 (4.7%) |
| 45 to 59 Minutes | 9,590 (12.2%) | 5,102 (7.5%) |
| 60 to 89 Minutes | 6,945 (8.9%) | 3,520 (5.2%) |
| 90 or more Minutes | 3,387 (4.3%) | 2,107 (3.1%) |
Time of Departure to Work by Sex in Rockingham County
The most frequent times of departure to work in Rockingham County are 7:00 AM to 7:29 AM (10,693, 13.7%) for males and 7:00 AM to 7:29 AM (10,848, 16.0%) for females.
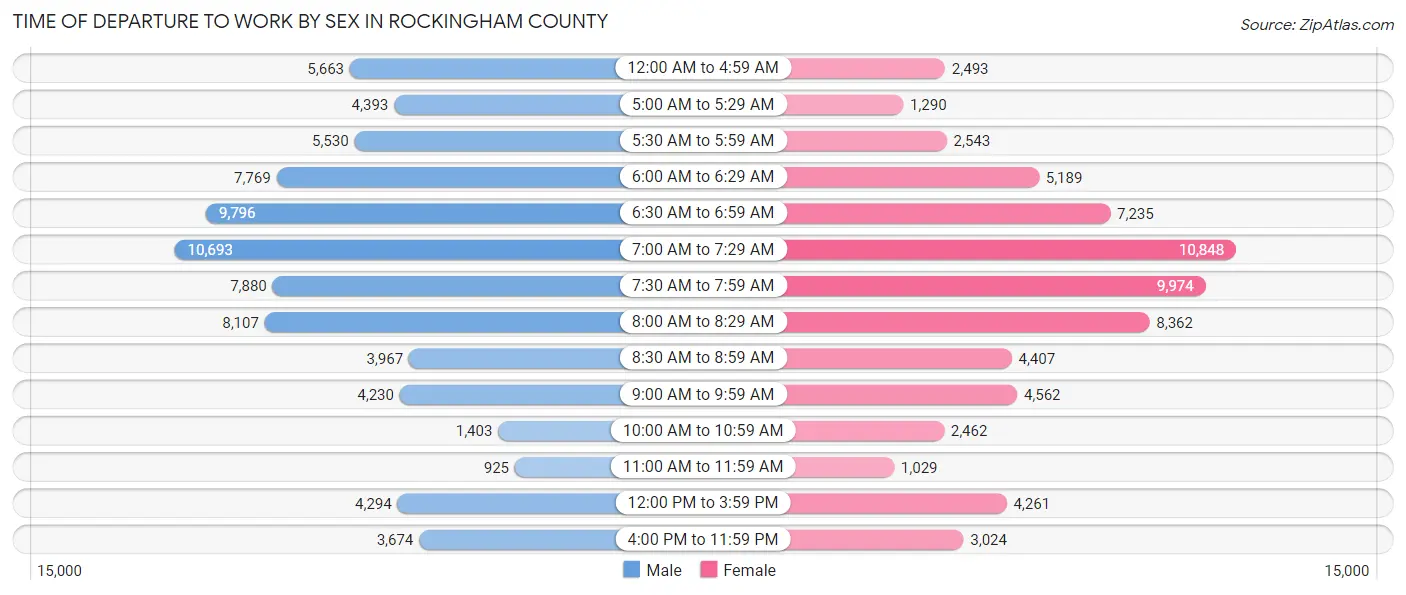
| Time of Departure | Male | Female |
| 12:00 AM to 4:59 AM | 5,663 (7.2%) | 2,493 (3.7%) |
| 5:00 AM to 5:29 AM | 4,393 (5.6%) | 1,290 (1.9%) |
| 5:30 AM to 5:59 AM | 5,530 (7.1%) | 2,543 (3.8%) |
| 6:00 AM to 6:29 AM | 7,769 (9.9%) | 5,189 (7.7%) |
| 6:30 AM to 6:59 AM | 9,796 (12.5%) | 7,235 (10.7%) |
| 7:00 AM to 7:29 AM | 10,693 (13.7%) | 10,848 (16.0%) |
| 7:30 AM to 7:59 AM | 7,880 (10.1%) | 9,974 (14.7%) |
| 8:00 AM to 8:29 AM | 8,107 (10.3%) | 8,362 (12.4%) |
| 8:30 AM to 8:59 AM | 3,967 (5.1%) | 4,407 (6.5%) |
| 9:00 AM to 9:59 AM | 4,230 (5.4%) | 4,562 (6.7%) |
| 10:00 AM to 10:59 AM | 1,403 (1.8%) | 2,462 (3.6%) |
| 11:00 AM to 11:59 AM | 925 (1.2%) | 1,029 (1.5%) |
| 12:00 PM to 3:59 PM | 4,294 (5.5%) | 4,261 (6.3%) |
| 4:00 PM to 11:59 PM | 3,674 (4.7%) | 3,024 (4.5%) |
| Total | 78,324 (100.0%) | 67,679 (100.0%) |
Housing Occupancy in Rockingham County
Occupancy by Ownership in Rockingham County
Of the total 125,464 dwellings in Rockingham County, owner-occupied units account for 98,479 (78.5%), while renter-occupied units make up 26,985 (21.5%).
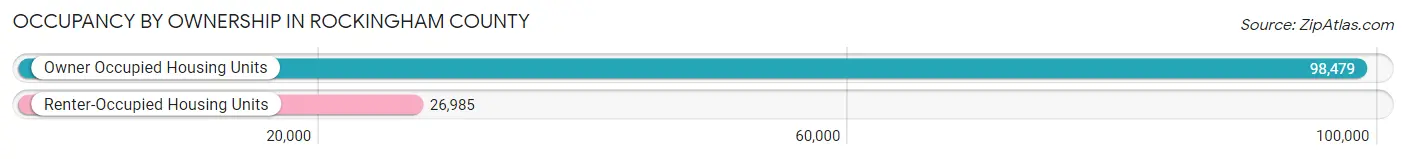
| Occupancy | # Housing Units | % Housing Units |
| Owner Occupied Housing Units | 98,479 | 78.5% |
| Renter-Occupied Housing Units | 26,985 | 21.5% |
| Total Occupied Housing Units | 125,464 | 100.0% |
Occupancy by Household Size in Rockingham County
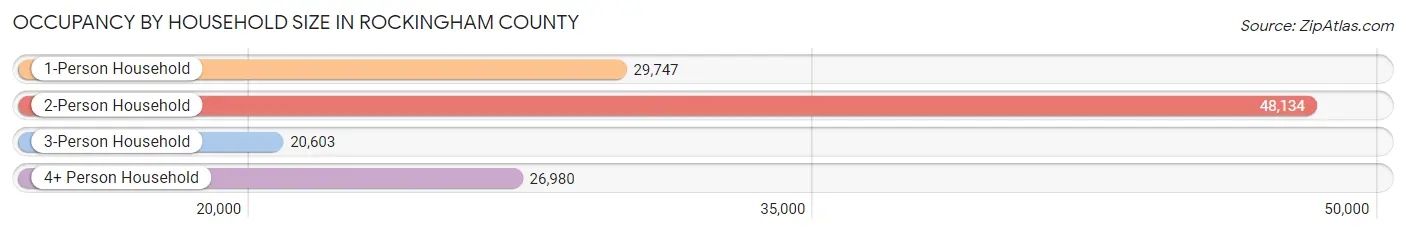
| Household Size | # Housing Units | % Housing Units |
| 1-Person Household | 29,747 | 23.7% |
| 2-Person Household | 48,134 | 38.4% |
| 3-Person Household | 20,603 | 16.4% |
| 4+ Person Household | 26,980 | 21.5% |
| Total Housing Units | 125,464 | 100.0% |
Occupancy by Ownership by Household Size in Rockingham County
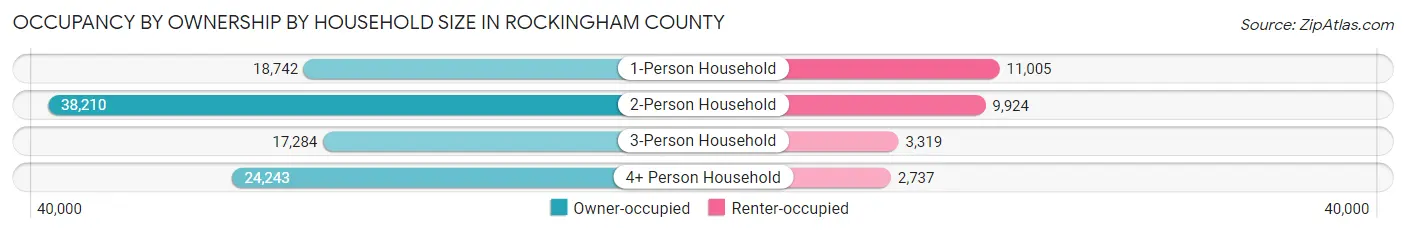
| Household Size | Owner-occupied | Renter-occupied |
| 1-Person Household | 18,742 (63.0%) | 11,005 (37.0%) |
| 2-Person Household | 38,210 (79.4%) | 9,924 (20.6%) |
| 3-Person Household | 17,284 (83.9%) | 3,319 (16.1%) |
| 4+ Person Household | 24,243 (89.9%) | 2,737 (10.1%) |
| Total Housing Units | 98,479 (78.5%) | 26,985 (21.5%) |
Occupancy by Educational Attainment in Rockingham County
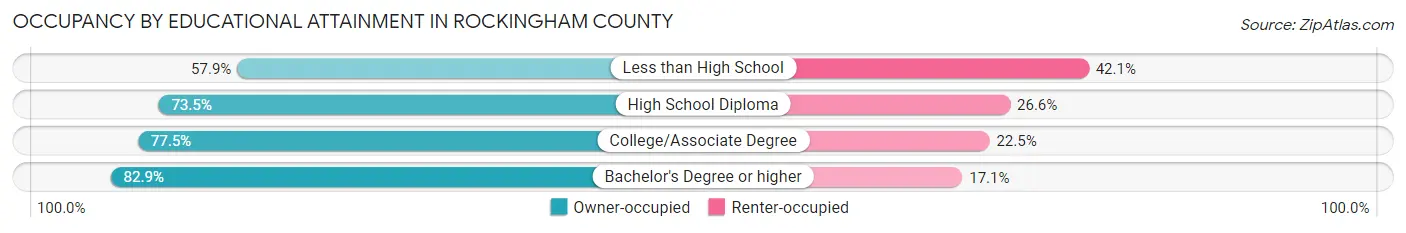
| Household Size | Owner-occupied | Renter-occupied |
| Less than High School | 2,469 (57.9%) | 1,798 (42.1%) |
| High School Diploma | 19,602 (73.5%) | 7,086 (26.6%) |
| College/Associate Degree | 28,240 (77.5%) | 8,183 (22.5%) |
| Bachelor's Degree or higher | 48,168 (82.9%) | 9,918 (17.1%) |
Occupancy by Age of Householder in Rockingham County
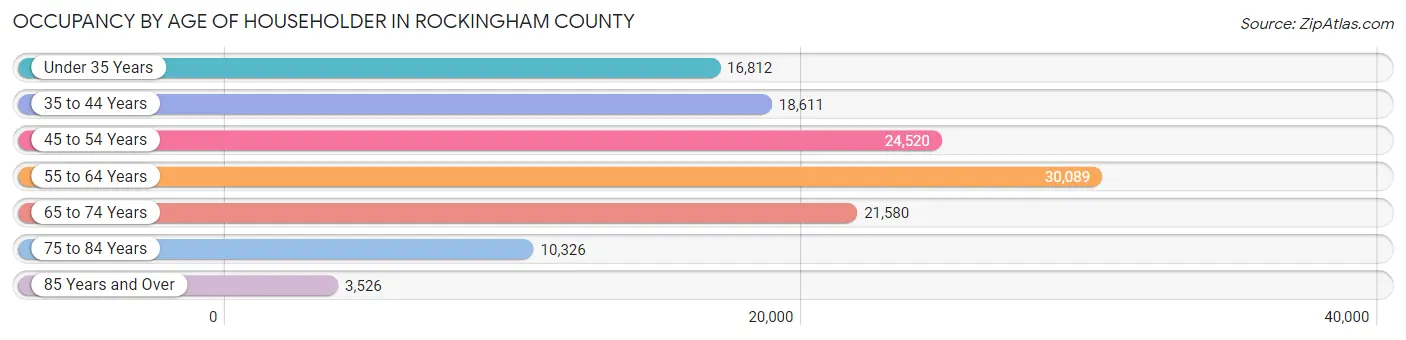
| Age Bracket | # Households | % Households |
| Under 35 Years | 16,812 | 13.4% |
| 35 to 44 Years | 18,611 | 14.8% |
| 45 to 54 Years | 24,520 | 19.5% |
| 55 to 64 Years | 30,089 | 24.0% |
| 65 to 74 Years | 21,580 | 17.2% |
| 75 to 84 Years | 10,326 | 8.2% |
| 85 Years and Over | 3,526 | 2.8% |
| Total | 125,464 | 100.0% |
Housing Finances in Rockingham County
Median Income by Occupancy in Rockingham County
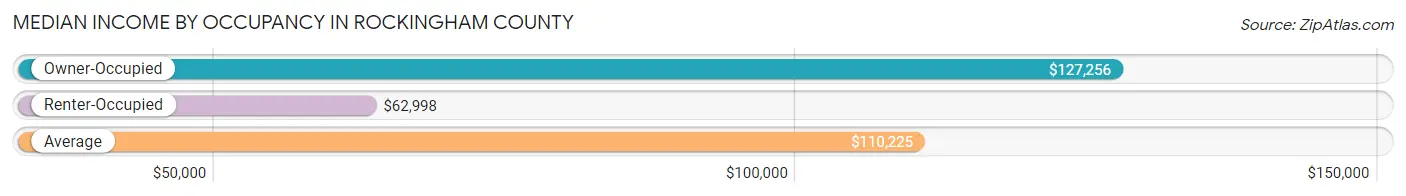
| Occupancy Type | # Households | Median Income |
| Owner-Occupied | 98,479 (78.5%) | $127,256 |
| Renter-Occupied | 26,985 (21.5%) | $62,998 |
| Average | 125,464 (100.0%) | $110,225 |
Occupancy by Householder Income Bracket in Rockingham County
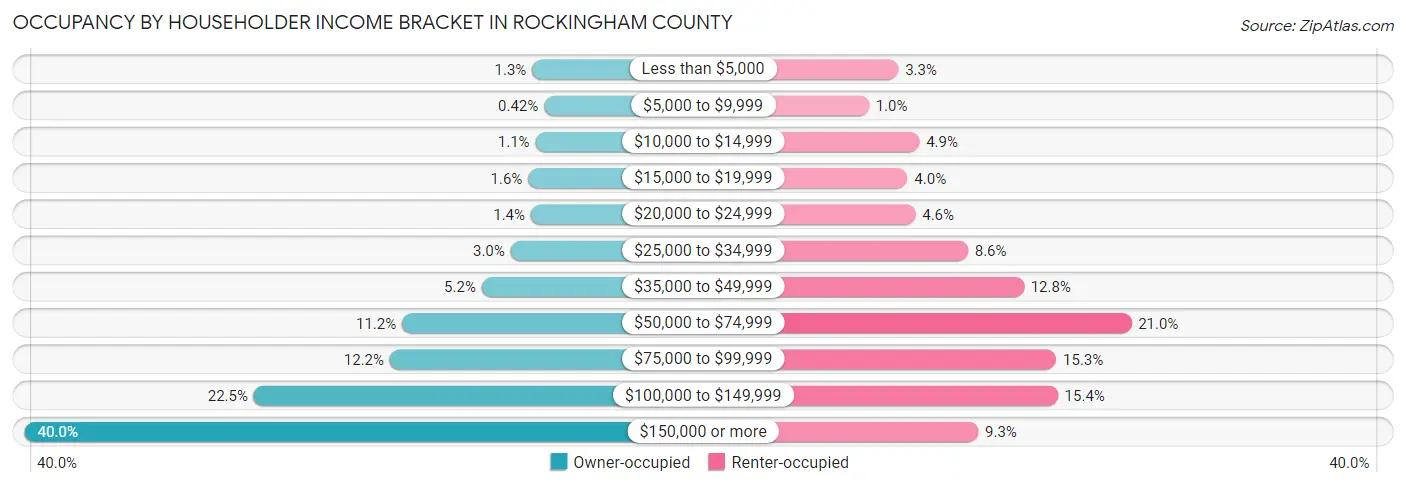
| Income Bracket | Owner-occupied | Renter-occupied |
| Less than $5,000 | 1,314 (1.3%) | 877 (3.3%) |
| $5,000 to $9,999 | 416 (0.4%) | 271 (1.0%) |
| $10,000 to $14,999 | 1,063 (1.1%) | 1,308 (4.9%) |
| $15,000 to $19,999 | 1,608 (1.6%) | 1,067 (4.0%) |
| $20,000 to $24,999 | 1,413 (1.4%) | 1,229 (4.5%) |
| $25,000 to $34,999 | 2,928 (3.0%) | 2,308 (8.6%) |
| $35,000 to $49,999 | 5,094 (5.2%) | 3,457 (12.8%) |
| $50,000 to $74,999 | 11,068 (11.2%) | 5,668 (21.0%) |
| $75,000 to $99,999 | 11,988 (12.2%) | 4,124 (15.3%) |
| $100,000 to $149,999 | 22,193 (22.5%) | 4,155 (15.4%) |
| $150,000 or more | 39,394 (40.0%) | 2,521 (9.3%) |
| Total | 98,479 (100.0%) | 26,985 (100.0%) |
Monthly Housing Cost Tiers in Rockingham County
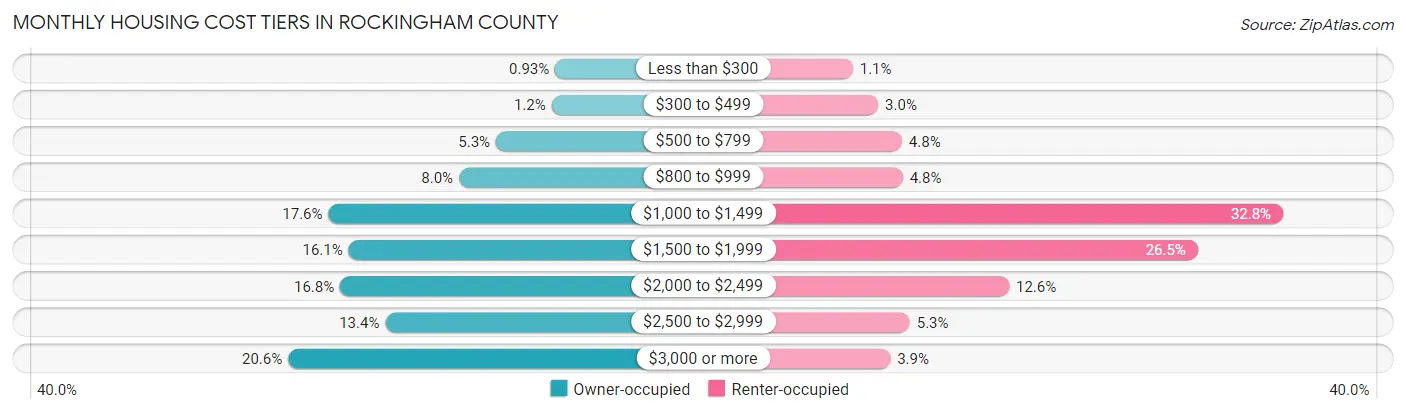
| Monthly Cost | Owner-occupied | Renter-occupied |
| Less than $300 | 918 (0.9%) | 306 (1.1%) |
| $300 to $499 | 1,171 (1.2%) | 809 (3.0%) |
| $500 to $799 | 5,206 (5.3%) | 1,283 (4.8%) |
| $800 to $999 | 7,889 (8.0%) | 1,299 (4.8%) |
| $1,000 to $1,499 | 17,358 (17.6%) | 8,855 (32.8%) |
| $1,500 to $1,999 | 15,895 (16.1%) | 7,158 (26.5%) |
| $2,000 to $2,499 | 16,519 (16.8%) | 3,412 (12.6%) |
| $2,500 to $2,999 | 13,237 (13.4%) | 1,438 (5.3%) |
| $3,000 or more | 20,286 (20.6%) | 1,051 (3.9%) |
| Total | 98,479 (100.0%) | 26,985 (100.0%) |
Physical Housing Characteristics in Rockingham County
Housing Structures in Rockingham County
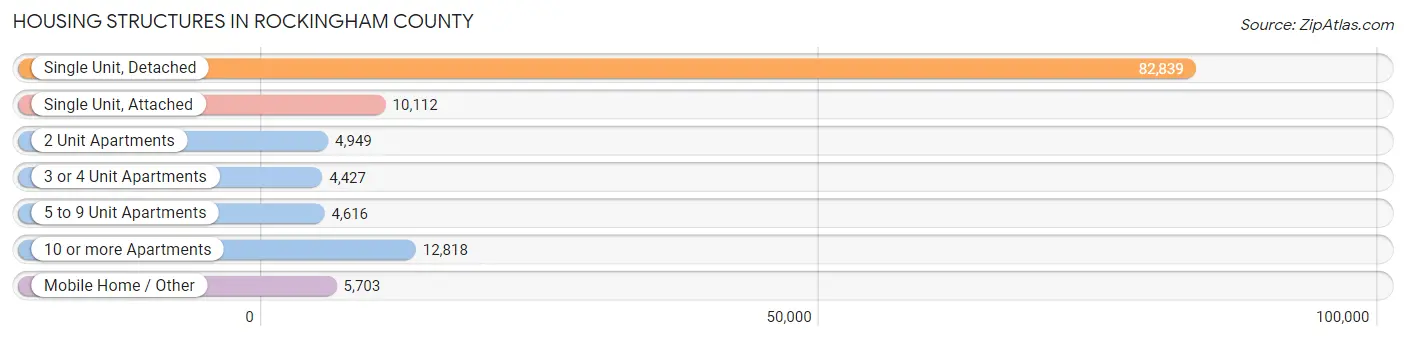
| Structure Type | # Housing Units | % Housing Units |
| Single Unit, Detached | 82,839 | 66.0% |
| Single Unit, Attached | 10,112 | 8.1% |
| 2 Unit Apartments | 4,949 | 3.9% |
| 3 or 4 Unit Apartments | 4,427 | 3.5% |
| 5 to 9 Unit Apartments | 4,616 | 3.7% |
| 10 or more Apartments | 12,818 | 10.2% |
| Mobile Home / Other | 5,703 | 4.5% |
| Total | 125,464 | 100.0% |
Housing Structures by Occupancy in Rockingham County
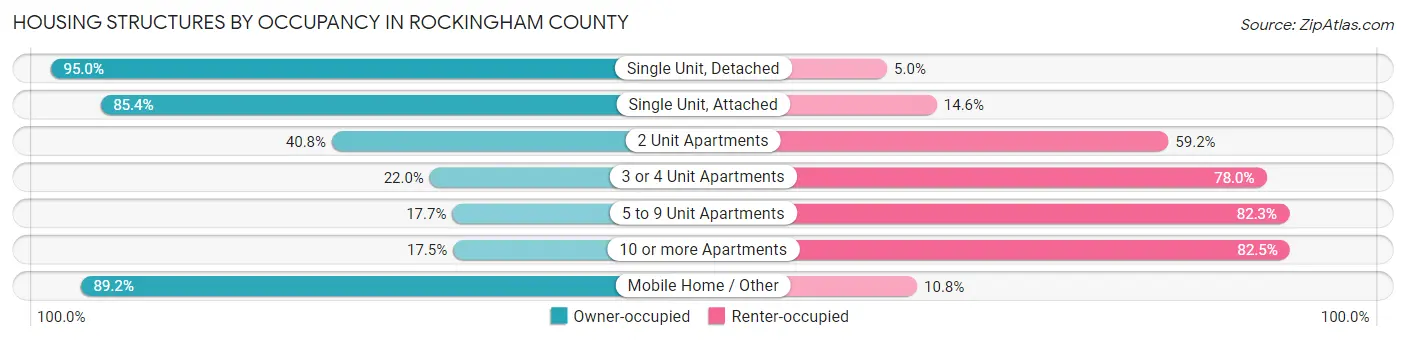
| Structure Type | Owner-occupied | Renter-occupied |
| Single Unit, Detached | 78,697 (95.0%) | 4,142 (5.0%) |
| Single Unit, Attached | 8,639 (85.4%) | 1,473 (14.6%) |
| 2 Unit Apartments | 2,021 (40.8%) | 2,928 (59.2%) |
| 3 or 4 Unit Apartments | 974 (22.0%) | 3,453 (78.0%) |
| 5 to 9 Unit Apartments | 815 (17.7%) | 3,801 (82.3%) |
| 10 or more Apartments | 2,244 (17.5%) | 10,574 (82.5%) |
| Mobile Home / Other | 5,089 (89.2%) | 614 (10.8%) |
| Total | 98,479 (78.5%) | 26,985 (21.5%) |
Housing Structures by Number of Rooms in Rockingham County
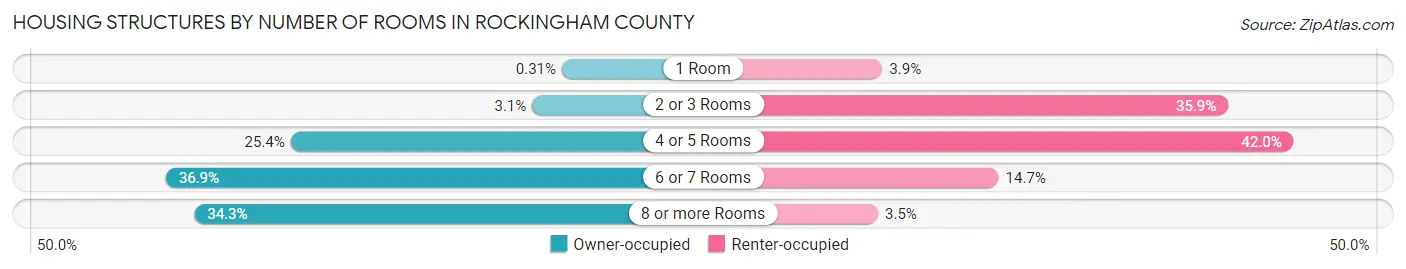
| Number of Rooms | Owner-occupied | Renter-occupied |
| 1 Room | 302 (0.3%) | 1,061 (3.9%) |
| 2 or 3 Rooms | 3,014 (3.1%) | 9,687 (35.9%) |
| 4 or 5 Rooms | 25,011 (25.4%) | 11,324 (42.0%) |
| 6 or 7 Rooms | 36,377 (36.9%) | 3,961 (14.7%) |
| 8 or more Rooms | 33,775 (34.3%) | 952 (3.5%) |
| Total | 98,479 (100.0%) | 26,985 (100.0%) |
Housing Structure by Heating Type in Rockingham County
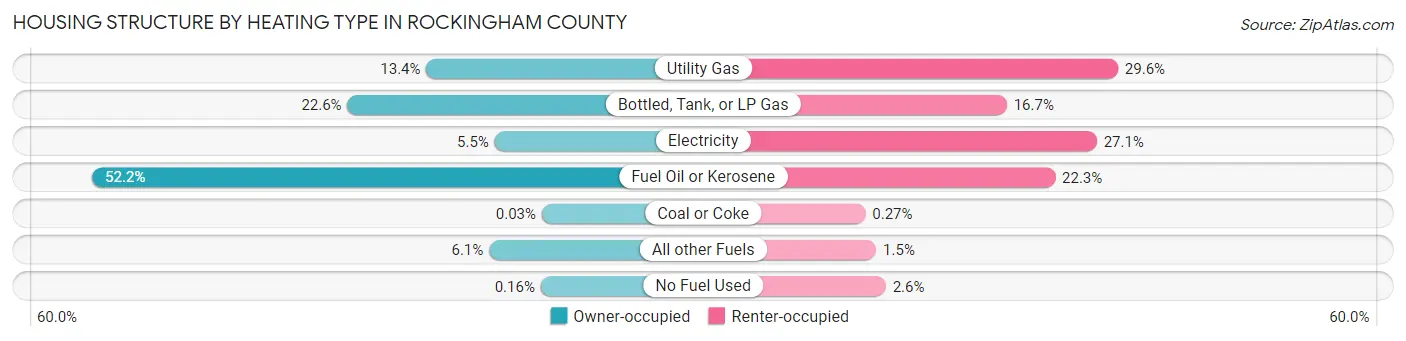
| Heating Type | Owner-occupied | Renter-occupied |
| Utility Gas | 13,220 (13.4%) | 7,975 (29.5%) |
| Bottled, Tank, or LP Gas | 22,226 (22.6%) | 4,495 (16.7%) |
| Electricity | 5,418 (5.5%) | 7,310 (27.1%) |
| Fuel Oil or Kerosene | 51,376 (52.2%) | 6,010 (22.3%) |
| Coal or Coke | 30 (0.0%) | 74 (0.3%) |
| All other Fuels | 6,047 (6.1%) | 410 (1.5%) |
| No Fuel Used | 162 (0.2%) | 711 (2.6%) |
| Total | 98,479 (100.0%) | 26,985 (100.0%) |
Household Vehicle Usage in Rockingham County
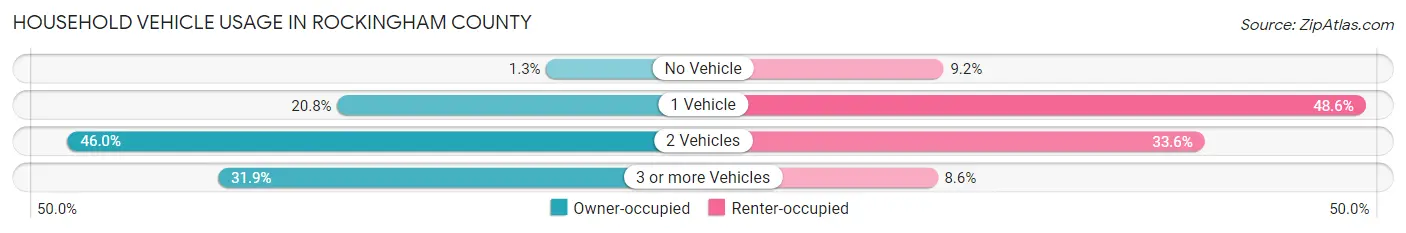
| Vehicles per Household | Owner-occupied | Renter-occupied |
| No Vehicle | 1,270 (1.3%) | 2,483 (9.2%) |
| 1 Vehicle | 20,484 (20.8%) | 13,111 (48.6%) |
| 2 Vehicles | 45,285 (46.0%) | 9,060 (33.6%) |
| 3 or more Vehicles | 31,440 (31.9%) | 2,331 (8.6%) |
| Total | 98,479 (100.0%) | 26,985 (100.0%) |
Real Estate & Mortgages in Rockingham County
Real Estate and Mortgage Overview in Rockingham County
| Characteristic | Without Mortgage | With Mortgage |
| Housing Units | 31,783 | 66,696 |
| Median Property Value | $395,200 | $434,700 |
| Median Household Income | $86,983 | $31,592 |
| Monthly Housing Costs | $1,049 | $20,019 |
| Real Estate Taxes | $6,890 | $501 |
Property Value by Mortgage Status in Rockingham County
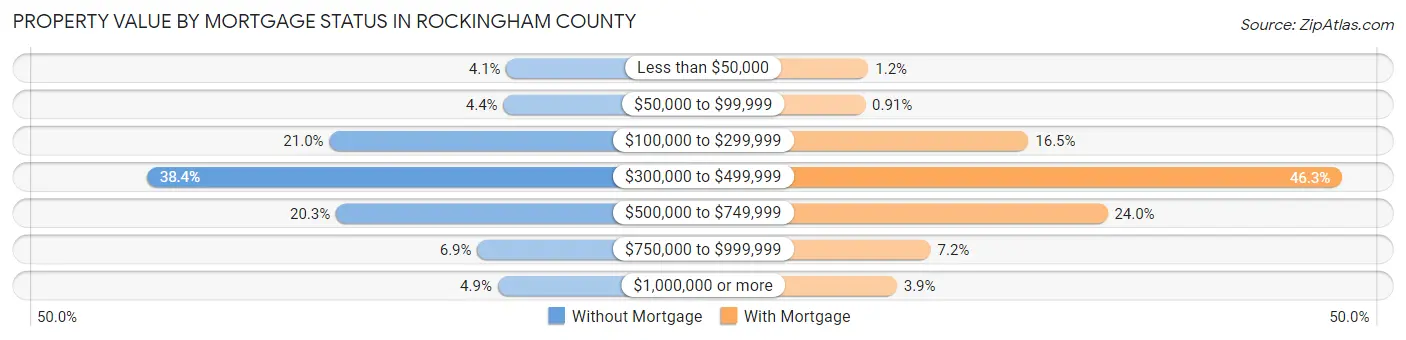
| Property Value | Without Mortgage | With Mortgage |
| Less than $50,000 | 1,307 (4.1%) | 816 (1.2%) |
| $50,000 to $99,999 | 1,399 (4.4%) | 606 (0.9%) |
| $100,000 to $299,999 | 6,665 (21.0%) | 10,976 (16.5%) |
| $300,000 to $499,999 | 12,192 (38.4%) | 30,906 (46.3%) |
| $500,000 to $749,999 | 6,464 (20.3%) | 16,001 (24.0%) |
| $750,000 to $999,999 | 2,186 (6.9%) | 4,771 (7.1%) |
| $1,000,000 or more | 1,570 (4.9%) | 2,620 (3.9%) |
| Total | 31,783 (100.0%) | 66,696 (100.0%) |
Household Income by Mortgage Status in Rockingham County
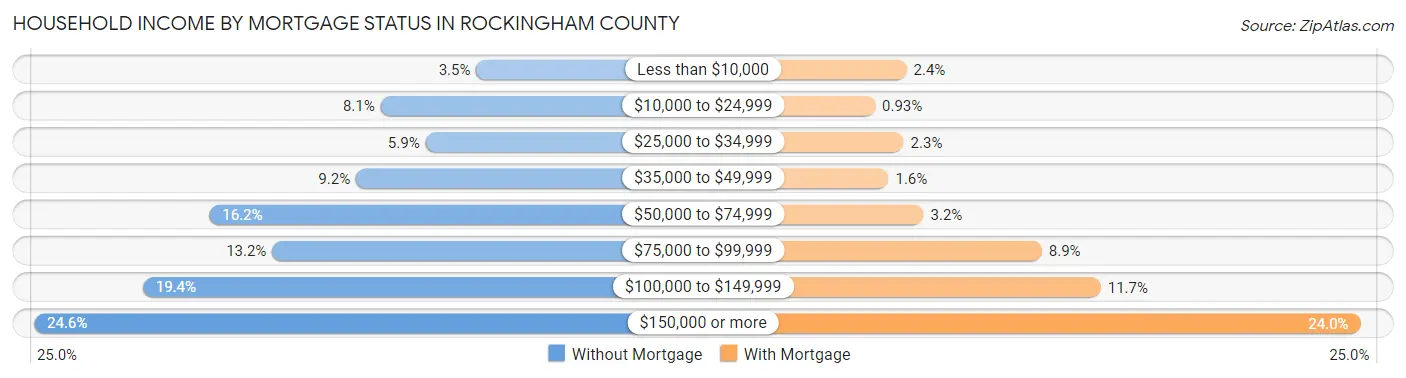
| Household Income | Without Mortgage | With Mortgage |
| Less than $10,000 | 1,110 (3.5%) | 1,618 (2.4%) |
| $10,000 to $24,999 | 2,559 (8.1%) | 620 (0.9%) |
| $25,000 to $34,999 | 1,878 (5.9%) | 1,525 (2.3%) |
| $35,000 to $49,999 | 2,931 (9.2%) | 1,050 (1.6%) |
| $50,000 to $74,999 | 5,150 (16.2%) | 2,163 (3.2%) |
| $75,000 to $99,999 | 4,197 (13.2%) | 5,918 (8.9%) |
| $100,000 to $149,999 | 6,156 (19.4%) | 7,791 (11.7%) |
| $150,000 or more | 7,802 (24.5%) | 16,037 (24.0%) |
| Total | 31,783 (100.0%) | 66,696 (100.0%) |
Property Value to Household Income Ratio in Rockingham County
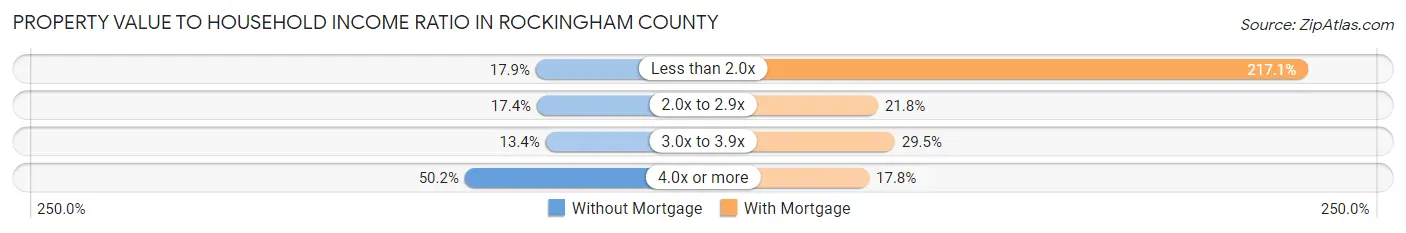
| Value-to-Income Ratio | Without Mortgage | With Mortgage |
| Less than 2.0x | 5,693 (17.9%) | 144,763 (217.1%) |
| 2.0x to 2.9x | 5,529 (17.4%) | 14,562 (21.8%) |
| 3.0x to 3.9x | 4,271 (13.4%) | 19,650 (29.5%) |
| 4.0x or more | 15,946 (50.2%) | 11,873 (17.8%) |
| Total | 31,783 (100.0%) | 66,696 (100.0%) |
Real Estate Taxes by Mortgage Status in Rockingham County
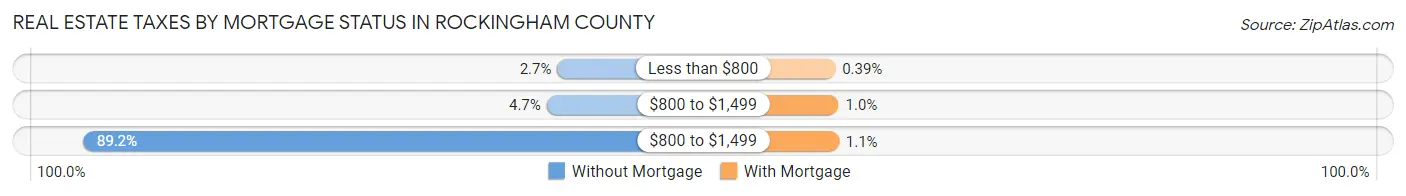
| Property Taxes | Without Mortgage | With Mortgage |
| Less than $800 | 862 (2.7%) | 263 (0.4%) |
| $800 to $1,499 | 1,478 (4.6%) | 680 (1.0%) |
| $800 to $1,499 | 28,342 (89.2%) | 704 (1.1%) |
| Total | 31,783 (100.0%) | 66,696 (100.0%) |
Health & Disability in Rockingham County
Health Insurance Coverage by Age in Rockingham County
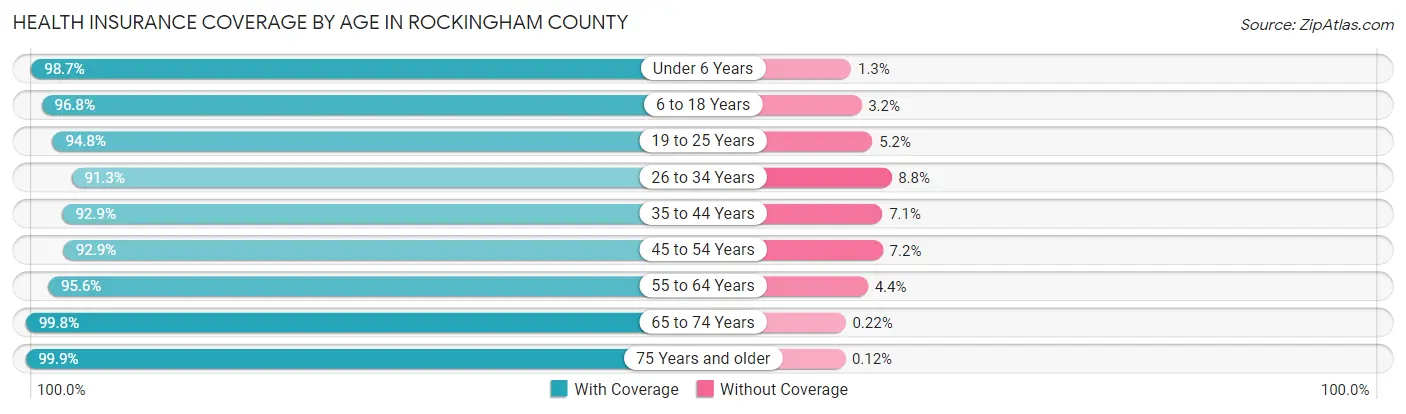
| Age Bracket | With Coverage | Without Coverage |
| Under 6 Years | 16,995 (98.7%) | 216 (1.3%) |
| 6 to 18 Years | 44,290 (96.8%) | 1,445 (3.2%) |
| 19 to 25 Years | 22,206 (94.8%) | 1,222 (5.2%) |
| 26 to 34 Years | 30,882 (91.2%) | 2,961 (8.7%) |
| 35 to 44 Years | 35,095 (92.9%) | 2,668 (7.1%) |
| 45 to 54 Years | 41,259 (92.8%) | 3,176 (7.1%) |
| 55 to 64 Years | 50,090 (95.6%) | 2,282 (4.4%) |
| 65 to 74 Years | 36,321 (99.8%) | 80 (0.2%) |
| 75 Years and older | 21,837 (99.9%) | 26 (0.1%) |
| Total | 298,975 (95.5%) | 14,076 (4.5%) |
Health Insurance Coverage by Citizenship Status in Rockingham County
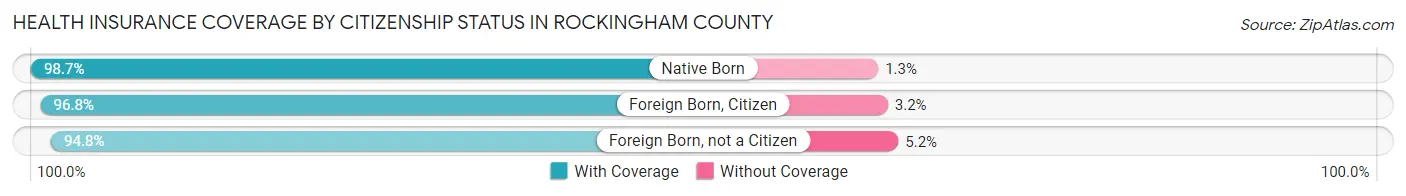
| Citizenship Status | With Coverage | Without Coverage |
| Native Born | 16,995 (98.7%) | 216 (1.3%) |
| Foreign Born, Citizen | 44,290 (96.8%) | 1,445 (3.2%) |
| Foreign Born, not a Citizen | 22,206 (94.8%) | 1,222 (5.2%) |
Health Insurance Coverage by Household Income in Rockingham County
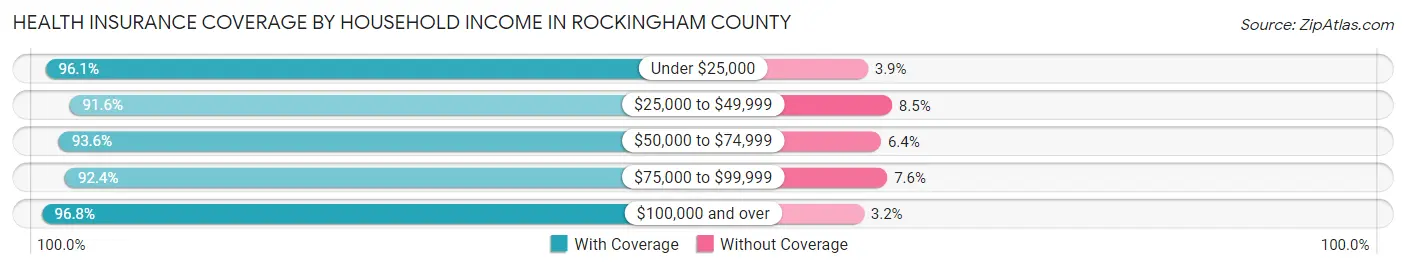
| Household Income | With Coverage | Without Coverage |
| Under $25,000 | 14,745 (96.1%) | 603 (3.9%) |
| $25,000 to $49,999 | 21,859 (91.5%) | 2,018 (8.5%) |
| $50,000 to $74,999 | 31,073 (93.6%) | 2,129 (6.4%) |
| $75,000 to $99,999 | 33,513 (92.4%) | 2,748 (7.6%) |
| $100,000 and over | 196,976 (96.8%) | 6,482 (3.2%) |
Public vs Private Health Insurance Coverage by Age in Rockingham County
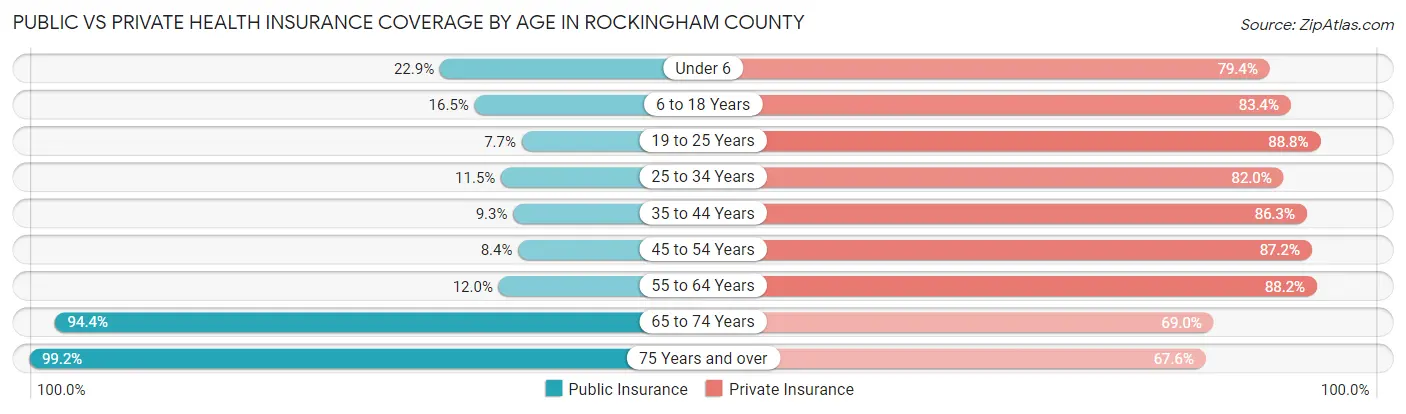
| Age Bracket | Public Insurance | Private Insurance |
| Under 6 | 3,942 (22.9%) | 13,670 (79.4%) |
| 6 to 18 Years | 7,530 (16.5%) | 38,120 (83.4%) |
| 19 to 25 Years | 1,806 (7.7%) | 20,808 (88.8%) |
| 25 to 34 Years | 3,905 (11.5%) | 27,750 (82.0%) |
| 35 to 44 Years | 3,509 (9.3%) | 32,593 (86.3%) |
| 45 to 54 Years | 3,714 (8.4%) | 38,756 (87.2%) |
| 55 to 64 Years | 6,282 (12.0%) | 46,187 (88.2%) |
| 65 to 74 Years | 34,366 (94.4%) | 25,124 (69.0%) |
| 75 Years and over | 21,686 (99.2%) | 14,769 (67.5%) |
| Total | 86,740 (27.7%) | 257,777 (82.3%) |
Disability Status by Sex by Age in Rockingham County
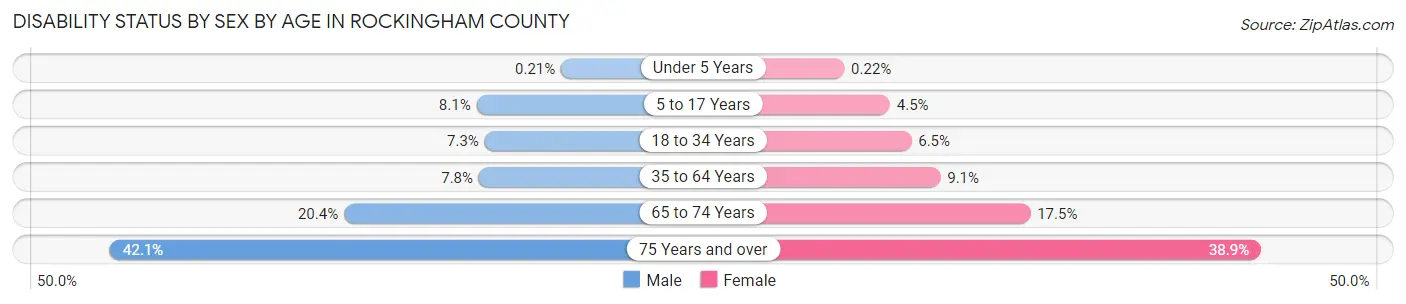
| Age Bracket | Male | Female |
| Under 5 Years | 15 (0.2%) | 15 (0.2%) |
| 5 to 17 Years | 1,872 (8.1%) | 986 (4.5%) |
| 18 to 34 Years | 2,277 (7.3%) | 1,902 (6.5%) |
| 35 to 64 Years | 5,282 (7.8%) | 6,140 (9.1%) |
| 65 to 74 Years | 3,606 (20.4%) | 3,269 (17.5%) |
| 75 Years and over | 4,001 (42.1%) | 4,806 (38.9%) |
Disability Class by Sex by Age in Rockingham County
Disability Class: Hearing Difficulty
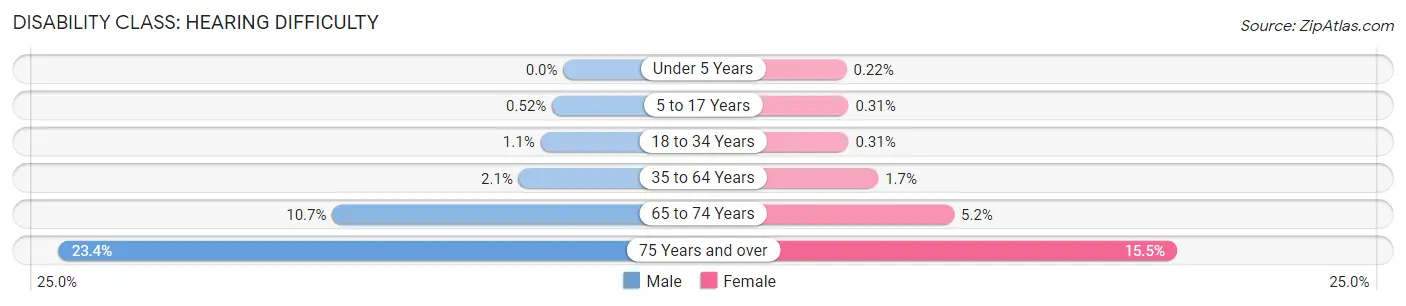
| Age Bracket | Male | Female |
| Under 5 Years | 0 (0.0%) | 15 (0.2%) |
| 5 to 17 Years | 121 (0.5%) | 68 (0.3%) |
| 18 to 34 Years | 332 (1.1%) | 90 (0.3%) |
| 35 to 64 Years | 1,396 (2.1%) | 1,136 (1.7%) |
| 65 to 74 Years | 1,899 (10.7%) | 974 (5.2%) |
| 75 Years and over | 2,226 (23.4%) | 1,920 (15.5%) |
Disability Class: Vision Difficulty
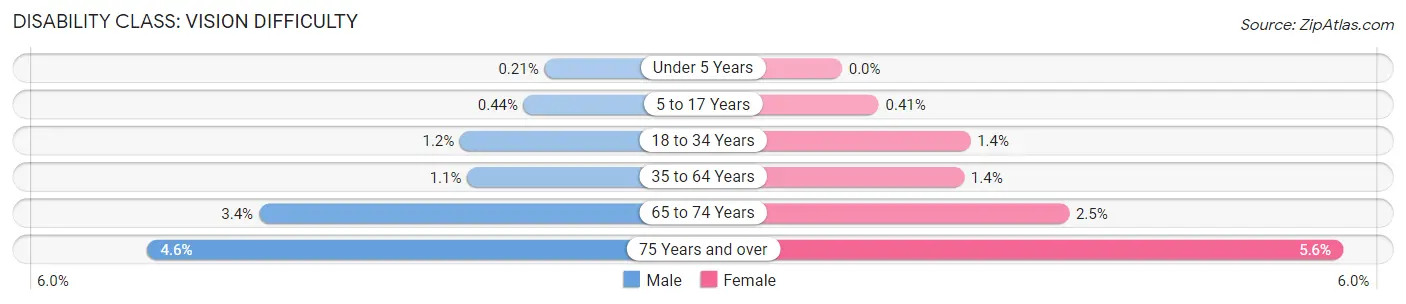
| Age Bracket | Male | Female |
| Under 5 Years | 15 (0.2%) | 0 (0.0%) |
| 5 to 17 Years | 102 (0.4%) | 91 (0.4%) |
| 18 to 34 Years | 360 (1.1%) | 421 (1.4%) |
| 35 to 64 Years | 718 (1.1%) | 916 (1.4%) |
| 65 to 74 Years | 600 (3.4%) | 472 (2.5%) |
| 75 Years and over | 440 (4.6%) | 689 (5.6%) |
Disability Class: Cognitive Difficulty
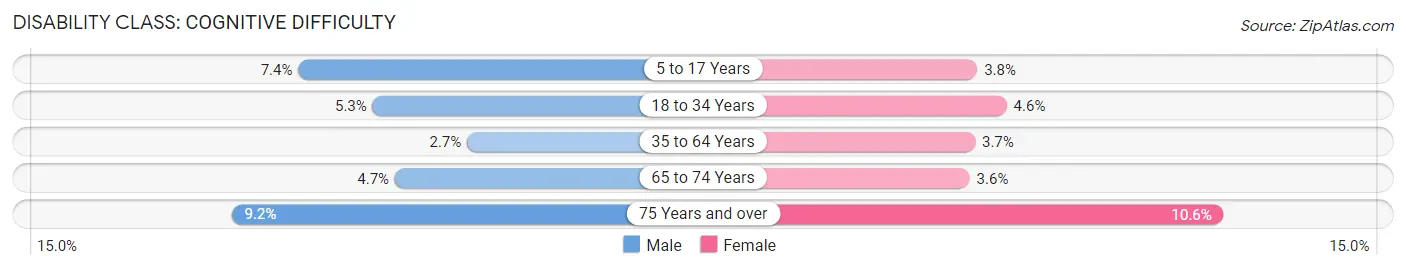
| Age Bracket | Male | Female |
| 5 to 17 Years | 1,715 (7.4%) | 834 (3.8%) |
| 18 to 34 Years | 1,656 (5.3%) | 1,355 (4.6%) |
| 35 to 64 Years | 1,808 (2.7%) | 2,493 (3.7%) |
| 65 to 74 Years | 831 (4.7%) | 665 (3.6%) |
| 75 Years and over | 879 (9.2%) | 1,313 (10.6%) |
Disability Class: Ambulatory Difficulty
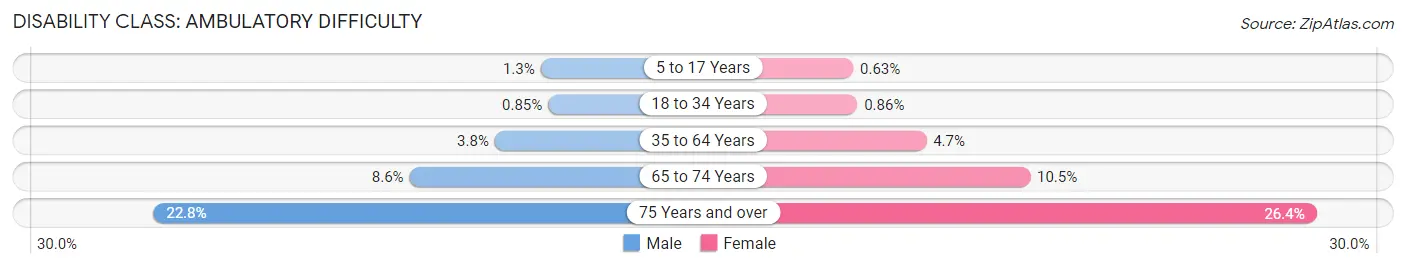
| Age Bracket | Male | Female |
| 5 to 17 Years | 295 (1.3%) | 139 (0.6%) |
| 18 to 34 Years | 266 (0.9%) | 255 (0.9%) |
| 35 to 64 Years | 2,576 (3.8%) | 3,160 (4.7%) |
| 65 to 74 Years | 1,518 (8.6%) | 1,959 (10.5%) |
| 75 Years and over | 2,171 (22.8%) | 3,265 (26.4%) |
Disability Class: Self-Care Difficulty
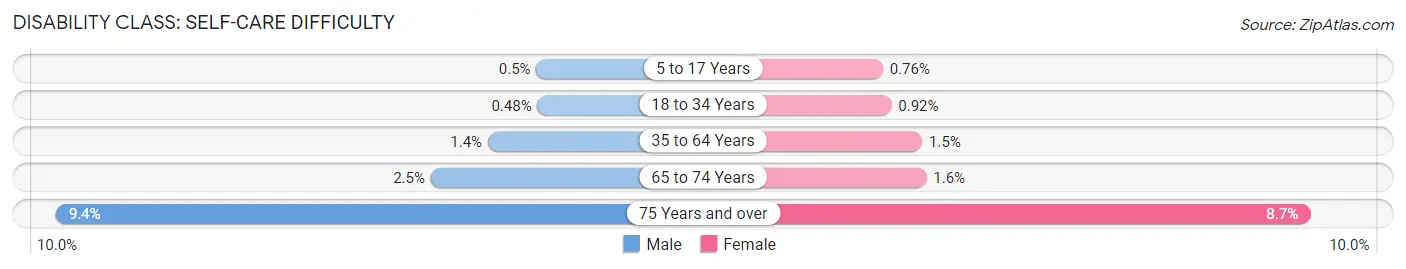
| Age Bracket | Male | Female |
| 5 to 17 Years | 116 (0.5%) | 168 (0.8%) |
| 18 to 34 Years | 150 (0.5%) | 270 (0.9%) |
| 35 to 64 Years | 946 (1.4%) | 1,002 (1.5%) |
| 65 to 74 Years | 435 (2.5%) | 293 (1.6%) |
| 75 Years and over | 896 (9.4%) | 1,073 (8.7%) |
Technology Access in Rockingham County
Computing Device Access in Rockingham County
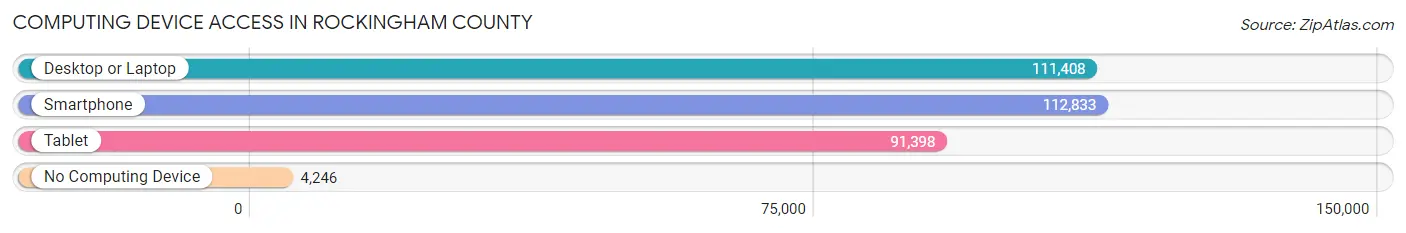
| Device Type | # Households | % Households |
| Desktop or Laptop | 111,408 | 88.8% |
| Smartphone | 112,833 | 89.9% |
| Tablet | 91,398 | 72.9% |
| No Computing Device | 4,246 | 3.4% |
| Total | 125,464 | 100.0% |
Internet Access in Rockingham County
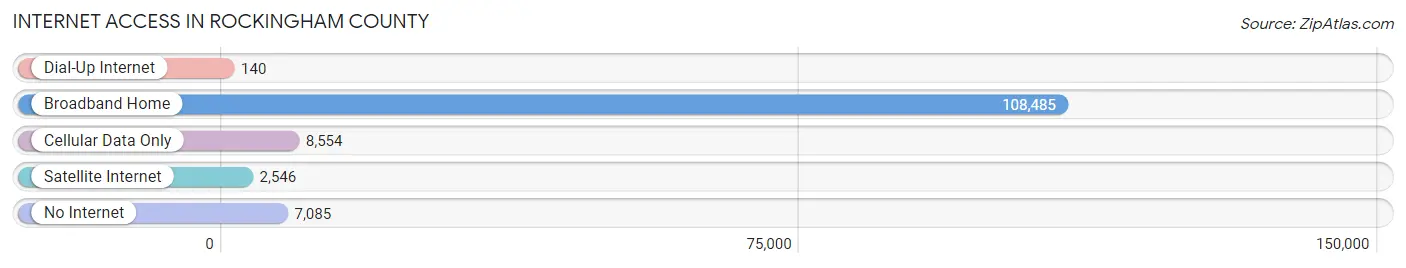
| Internet Type | # Households | % Households |
| Dial-Up Internet | 140 | 0.1% |
| Broadband Home | 108,485 | 86.5% |
| Cellular Data Only | 8,554 | 6.8% |
| Satellite Internet | 2,546 | 2.0% |
| No Internet | 7,085 | 5.7% |
| Total | 125,464 | 100.0% |
Rockingham County Summary
Rockingham County is a county located in the U.S. state of New Hampshire. As of the 2010 census, the population was 295,223, making it the second-most populous county in New Hampshire. The county seat is Brentwood. The county was created in 1769 and was named for Charles Watson-Wentworth, 2nd Marquess of Rockingham, a British Prime Minister.
History
Rockingham County was one of the five original counties in New Hampshire, created in 1769. It was named for Charles Watson-Wentworth, 2nd Marquess of Rockingham, a British Prime Minister. The county was originally part of the Province of Massachusetts Bay and was later annexed to New Hampshire in 1741.
The county was home to many Native American tribes, including the Abenaki, Pennacook, and Sokokis. The first European settlers arrived in the area in the 1620s, and the county was officially established in 1769.
During the American Revolution, Rockingham County was a major center of activity. The Battle of Bennington, a major victory for the American forces, was fought in the county in 1777.
Geography
Rockingham County is located in southeastern New Hampshire, bordered by the Atlantic Ocean to the east, Massachusetts to the south, and the Merrimack River to the west. The county covers an area of 845 square miles, making it the second-largest county in the state.
The terrain of the county is mostly hilly, with the highest point being Mount Kearsarge at 2,937 feet. The county is home to several rivers, including the Lamprey, Piscataqua, and Merrimack.
Economy
Rockingham County has a diverse economy, with a mix of manufacturing, retail, and service industries. The county is home to several large employers, including the Portsmouth Naval Shipyard, the Pease International Tradeport, and the University of New Hampshire.
The county is also home to several tourist attractions, including the Seacoast Science Center, the Strawbery Banke Museum, and the Isles of Shoals.
Demographics
As of the 2010 census, there were 295,223 people, 116,845 households, and 79,945 families living in the county. The population density was 348.3 people per square mile. The racial makeup of the county was 94.2% White, 2.3% African American, 0.7% Native American, 1.3% Asian, 0.1% Pacific Islander, 0.7% from other races, and 1.1% from two or more races.
The median income for a household in the county was $63,945, and the median income for a family was $76,945. The per capita income for the county was $30,945.
Conclusion
Rockingham County is a county located in the U.S. state of New Hampshire. It was created in 1769 and was named for Charles Watson-Wentworth, 2nd Marquess of Rockingham, a British Prime Minister. The county covers an area of 845 square miles and has a population of 295,223. The county has a diverse economy, with a mix of manufacturing, retail, and service industries. The median income for a household in the county is $63,945, and the median income for a family is $76,945.
Common Questions
What is Per Capita Income in Rockingham County?
Per Capita income in Rockingham County is $56,321.
What is the Median Family Income in Rockingham County?
Median Family Income in Rockingham County is $131,600.
What is the Median Household income in Rockingham County?
Median Household Income in Rockingham County is $110,225.
What is Income or Wage Gap in Rockingham County?
Income or Wage Gap in Rockingham County is 34.7%.
Women in Rockingham County earn 65.3 cents for every dollar earned by a man.
What is Family Income Deficit in Rockingham County?
Family Income Deficit in Rockingham County is $12,138.
Families that are below poverty line in Rockingham County earn $12,138 less on average than the poverty threshold level.
What is Inequality or Gini Index in Rockingham County?
Inequality or Gini Index in Rockingham County is 0.42.
What is the Total Population of Rockingham County?
Total Population of Rockingham County is 315,169.
What is the Total Male Population of Rockingham County?
Total Male Population of Rockingham County is 157,222.
What is the Total Female Population of Rockingham County?
Total Female Population of Rockingham County is 157,947.
What is the Ratio of Males per 100 Females in Rockingham County?
There are 99.54 Males per 100 Females in Rockingham County.
What is the Ratio of Females per 100 Males in Rockingham County?
There are 100.46 Females per 100 Males in Rockingham County.
What is the Median Population Age in Rockingham County?
Median Population Age in Rockingham County is 44.7 Years.
What is the Average Family Size in Rockingham County
Average Family Size in Rockingham County is 3.0 People.
What is the Average Household Size in Rockingham County
Average Household Size in Rockingham County is 2.5 People.
How Large is the Labor Force in Rockingham County?
There are 181,325 People in the Labor Forcein in Rockingham County.
What is the Percentage of People in the Labor Force in Rockingham County?
68.9% of People are in the Labor Force in Rockingham County.
What is the Unemployment Rate in Rockingham County?
Unemployment Rate in Rockingham County is 3.4%.