Grafton County, NH Map & Demographics
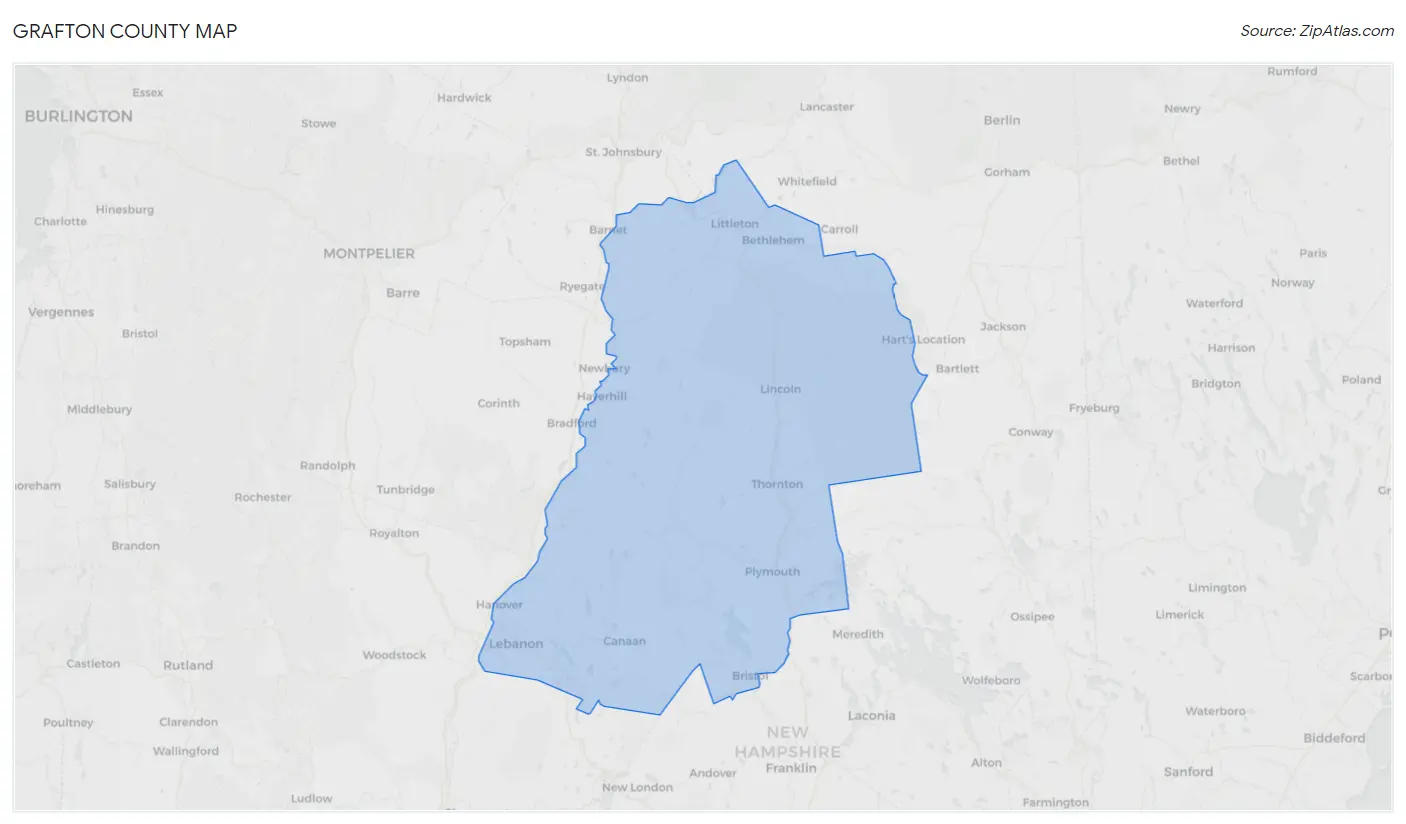
Grafton County Map
Grafton County Overview
$47,080
PER CAPITA INCOME
$99,902
AVG FAMILY INCOME
$79,949
AVG HOUSEHOLD INCOME
24.0%
WAGE / INCOME GAP [ % ]
76.0¢/ $1
WAGE / INCOME GAP [ $ ]
$10,242
FAMILY INCOME DEFICIT
0.49
INEQUALITY / GINI INDEX
90,836
TOTAL POPULATION
45,104
MALE POPULATION
45,732
FEMALE POPULATION
98.63
MALES / 100 FEMALES
101.39
FEMALES / 100 MALES
44.1
MEDIAN AGE
3.0
AVG FAMILY SIZE
2.4
AVG HOUSEHOLD SIZE
47,690
LABOR FORCE [ PEOPLE ]
60.9%
PERCENT IN LABOR FORCE
2.8%
UNEMPLOYMENT RATE
Grafton County Area Codes
Income in Grafton County
Income Overview in Grafton County
Per Capita Income in Grafton County is $47,080, while median incomes of families and households are $99,902 and $79,949 respectively.
| Characteristic | Number | Measure |
| Per Capita Income | 90,836 | $47,080 |
| Median Family Income | 21,419 | $99,902 |
| Mean Family Income | 21,419 | $136,635 |
| Median Household Income | 35,084 | $79,949 |
| Mean Household Income | 35,084 | $112,431 |
| Income Deficit | 21,419 | $10,242 |
| Wage / Income Gap (%) | 90,836 | 23.99% |
| Wage / Income Gap ($) | 90,836 | 76.01¢ per $1 |
| Gini / Inequality Index | 90,836 | 0.49 |
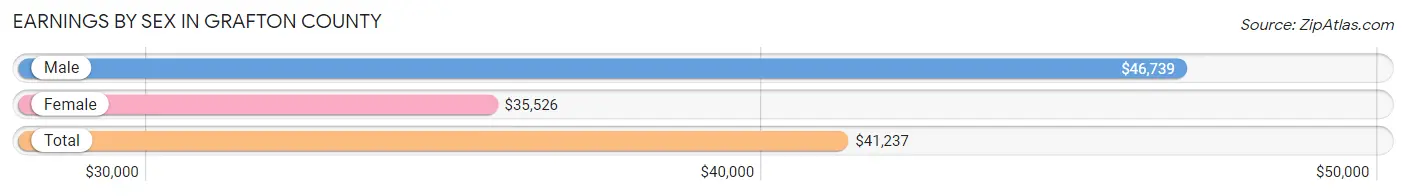
Earnings by Sex in Grafton County
Average Earnings in Grafton County are $41,237, $46,739 for men and $35,526 for women, a difference of 24.0%.
| Sex | Number | Average Earnings |
| Male | 26,701 (51.5%) | $46,739 |
| Female | 25,160 (48.5%) | $35,526 |
| Total | 51,861 (100.0%) | $41,237 |
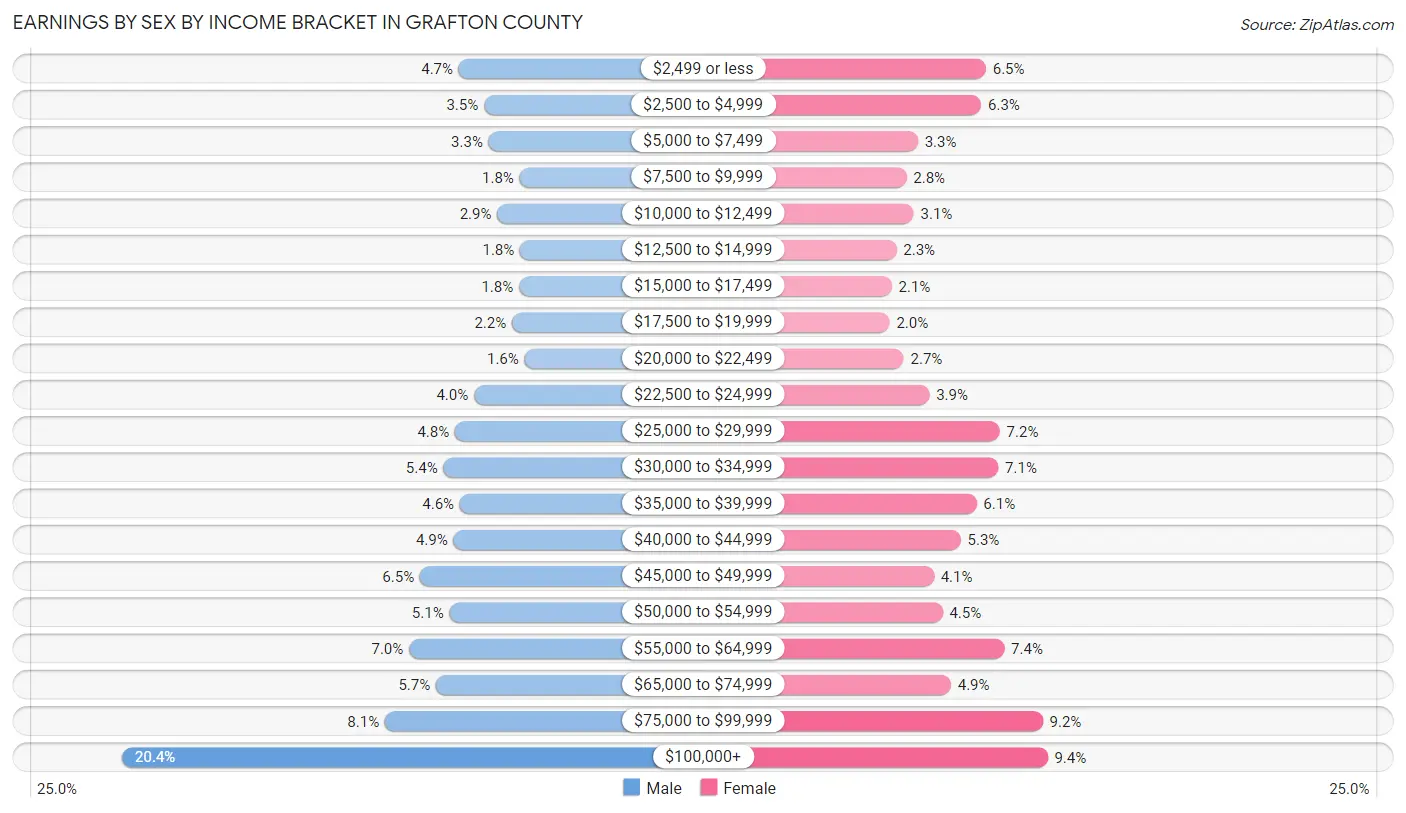
Earnings by Sex by Income Bracket in Grafton County
The most common earnings brackets in Grafton County are $100,000+ for men (5,458 | 20.4%) and $100,000+ for women (2,366 | 9.4%).
| Income | Male | Female |
| $2,499 or less | 1,245 (4.7%) | 1,639 (6.5%) |
| $2,500 to $4,999 | 929 (3.5%) | 1,583 (6.3%) |
| $5,000 to $7,499 | 870 (3.3%) | 835 (3.3%) |
| $7,500 to $9,999 | 484 (1.8%) | 702 (2.8%) |
| $10,000 to $12,499 | 763 (2.9%) | 787 (3.1%) |
| $12,500 to $14,999 | 478 (1.8%) | 584 (2.3%) |
| $15,000 to $17,499 | 492 (1.8%) | 528 (2.1%) |
| $17,500 to $19,999 | 579 (2.2%) | 502 (2.0%) |
| $20,000 to $22,499 | 421 (1.6%) | 669 (2.7%) |
| $22,500 to $24,999 | 1,056 (4.0%) | 972 (3.9%) |
| $25,000 to $29,999 | 1,293 (4.8%) | 1,802 (7.2%) |
| $30,000 to $34,999 | 1,436 (5.4%) | 1,785 (7.1%) |
| $35,000 to $39,999 | 1,230 (4.6%) | 1,526 (6.1%) |
| $40,000 to $44,999 | 1,310 (4.9%) | 1,342 (5.3%) |
| $45,000 to $49,999 | 1,731 (6.5%) | 1,023 (4.1%) |
| $50,000 to $54,999 | 1,361 (5.1%) | 1,127 (4.5%) |
| $55,000 to $64,999 | 1,866 (7.0%) | 1,855 (7.4%) |
| $65,000 to $74,999 | 1,530 (5.7%) | 1,226 (4.9%) |
| $75,000 to $99,999 | 2,169 (8.1%) | 2,307 (9.2%) |
| $100,000+ | 5,458 (20.4%) | 2,366 (9.4%) |
| Total | 26,701 (100.0%) | 25,160 (100.0%) |
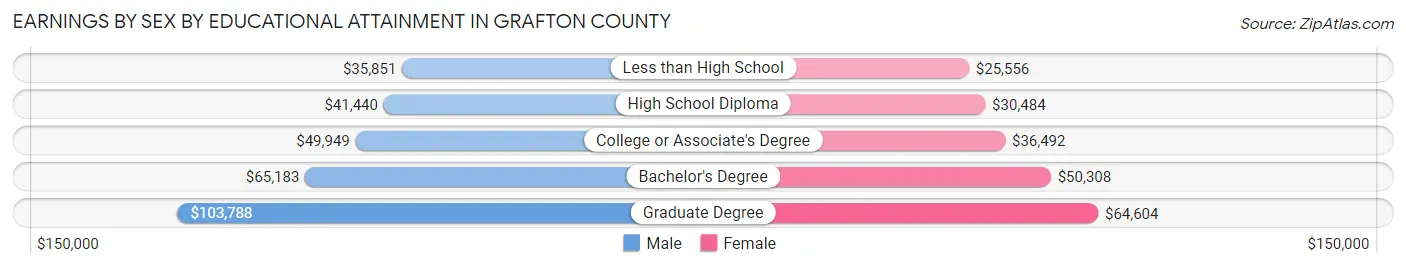
Earnings by Sex by Educational Attainment in Grafton County
Average earnings in Grafton County are $52,956 for men and $41,595 for women, a difference of 21.4%. Men with an educational attainment of graduate degree enjoy the highest average annual earnings of $103,788, while those with less than high school education earn the least with $35,851. Women with an educational attainment of graduate degree earn the most with the average annual earnings of $64,604, while those with less than high school education have the smallest earnings of $25,556.
| Educational Attainment | Male Income | Female Income |
| Less than High School | $35,851 | $25,556 |
| High School Diploma | $41,440 | $30,484 |
| College or Associate's Degree | $49,949 | $36,492 |
| Bachelor's Degree | $65,183 | $50,308 |
| Graduate Degree | $103,788 | $64,604 |
| Total | $52,956 | $41,595 |
Family Income in Grafton County
Family Income Brackets in Grafton County
According to the Grafton County family income data, there are 4,948 families falling into the $100,000 to $149,999 income range, which is the most common income bracket and makes up 23.1% of all families. Conversely, the $10,000 to $14,999 income bracket is the least frequent group with only 386 families (1.8%) belonging to this category.
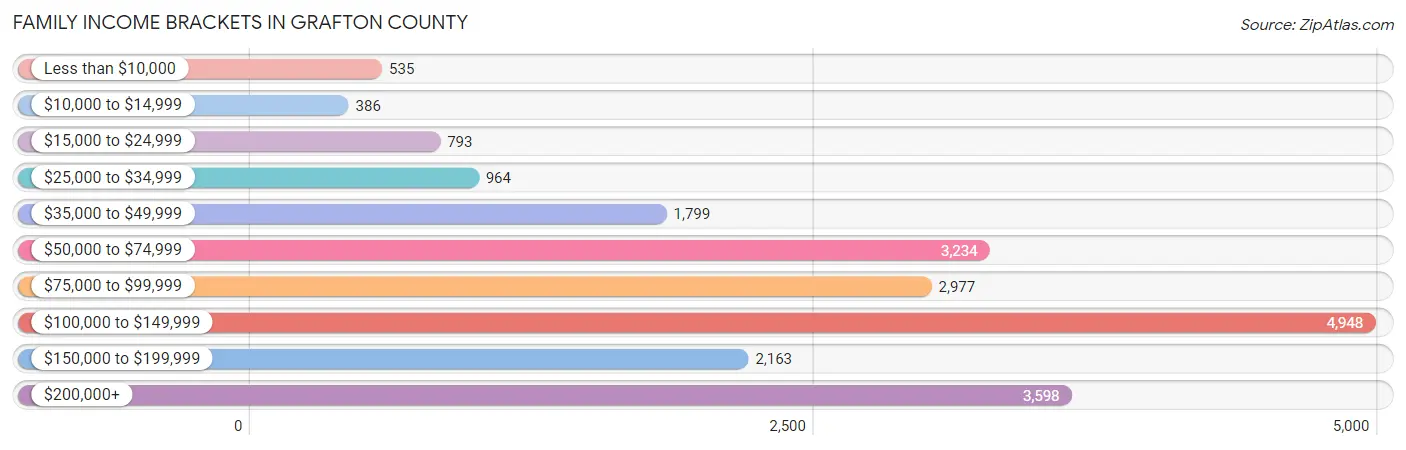
| Income Bracket | # Families | % Families |
| Less than $10,000 | 535 | 2.5% |
| $10,000 to $14,999 | 386 | 1.8% |
| $15,000 to $24,999 | 793 | 3.7% |
| $25,000 to $34,999 | 964 | 4.5% |
| $35,000 to $49,999 | 1,799 | 8.4% |
| $50,000 to $74,999 | 3,234 | 15.1% |
| $75,000 to $99,999 | 2,977 | 13.9% |
| $100,000 to $149,999 | 4,948 | 23.1% |
| $150,000 to $199,999 | 2,163 | 10.1% |
| $200,000+ | 3,598 | 16.8% |
Family Income by Famaliy Size in Grafton County
5-person families (977 | 4.6%) account for the highest median family income in Grafton County with $129,094 per family, while 2-person families (12,659 | 59.1%) have the highest median income of $46,798 per family member.
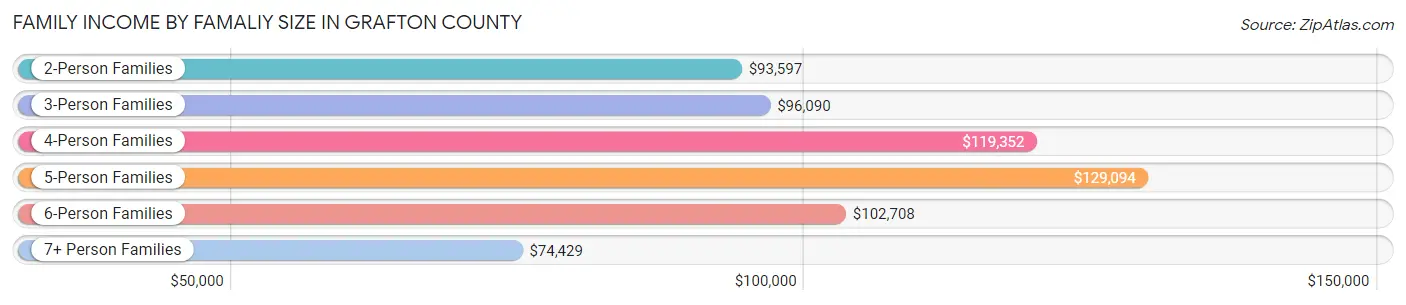
| Income Bracket | # Families | Median Income |
| 2-Person Families | 12,659 (59.1%) | $93,597 |
| 3-Person Families | 4,160 (19.4%) | $96,090 |
| 4-Person Families | 3,226 (15.1%) | $119,352 |
| 5-Person Families | 977 (4.6%) | $129,094 |
| 6-Person Families | 215 (1.0%) | $102,708 |
| 7+ Person Families | 182 (0.9%) | $74,429 |
| Total | 21,419 (100.0%) | $99,902 |
Family Income by Number of Earners in Grafton County
The median family income in Grafton County is $99,902, with families comprising 3+ earners (2,354) having the highest median family income of $140,392, while families with no earners (3,746) have the lowest median family income of $53,039, accounting for 11.0% and 17.5% of families, respectively.
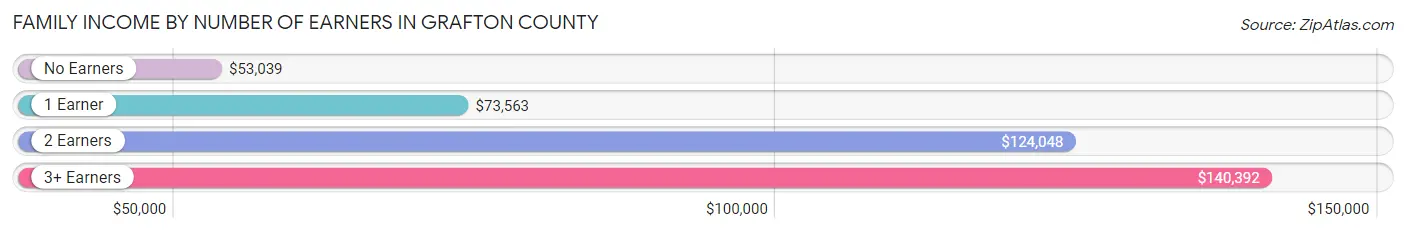
| Number of Earners | # Families | Median Income |
| No Earners | 3,746 (17.5%) | $53,039 |
| 1 Earner | 6,156 (28.7%) | $73,563 |
| 2 Earners | 9,163 (42.8%) | $124,048 |
| 3+ Earners | 2,354 (11.0%) | $140,392 |
| Total | 21,419 (100.0%) | $99,902 |
Household Income in Grafton County
Household Income Brackets in Grafton County
With 6,631 households falling in the category, the $100,000 to $149,999 income range is the most frequent in Grafton County, accounting for 18.9% of all households. In contrast, only 1,368 households (3.9%) fall into the $10,000 to $14,999 income bracket, making it the least populous group.
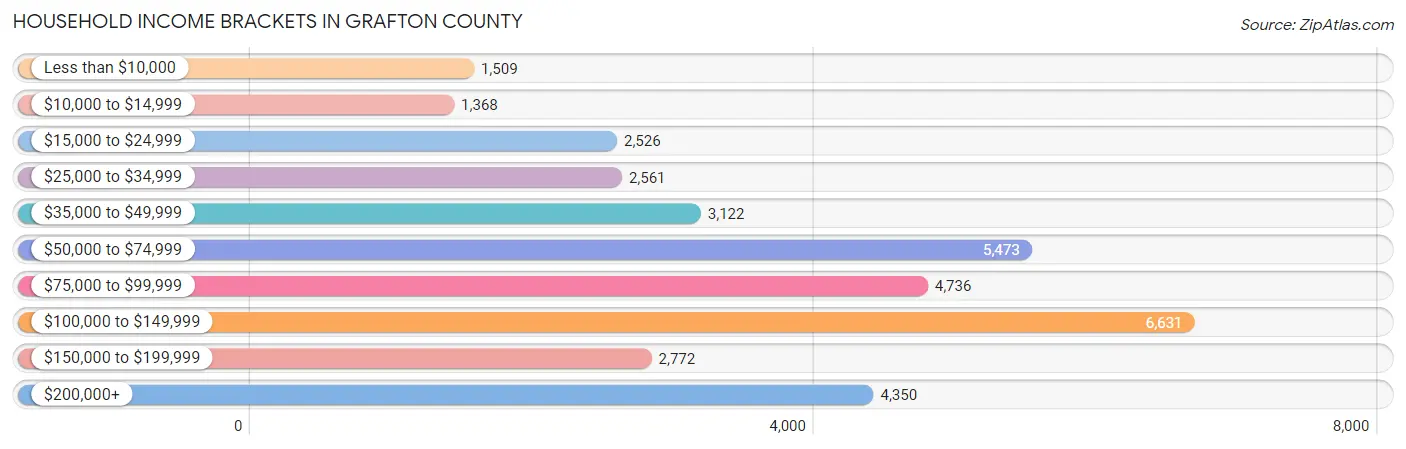
| Income Bracket | # Households | % Households |
| Less than $10,000 | 1,509 | 4.3% |
| $10,000 to $14,999 | 1,368 | 3.9% |
| $15,000 to $24,999 | 2,526 | 7.2% |
| $25,000 to $34,999 | 2,561 | 7.3% |
| $35,000 to $49,999 | 3,122 | 8.9% |
| $50,000 to $74,999 | 5,473 | 15.6% |
| $75,000 to $99,999 | 4,736 | 13.5% |
| $100,000 to $149,999 | 6,631 | 18.9% |
| $150,000 to $199,999 | 2,772 | 7.9% |
| $200,000+ | 4,350 | 12.4% |
Household Income by Householder Age in Grafton County
The median household income in Grafton County is $79,949, with the highest median household income of $97,793 found in the 45 to 64 years age bracket for the primary householder. A total of 13,334 households (38.0%) fall into this category. Meanwhile, the 15 to 24 years age bracket for the primary householder has the lowest median household income of $51,250, with 1,089 households (3.1%) in this group.
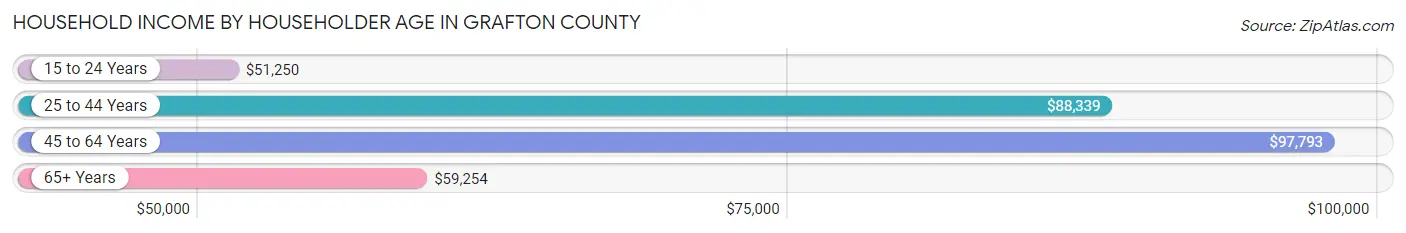
| Income Bracket | # Households | Median Income |
| 15 to 24 Years | 1,089 (3.1%) | $51,250 |
| 25 to 44 Years | 8,513 (24.3%) | $88,339 |
| 45 to 64 Years | 13,334 (38.0%) | $97,793 |
| 65+ Years | 12,148 (34.6%) | $59,254 |
| Total | 35,084 (100.0%) | $79,949 |
Poverty in Grafton County
Income Below Poverty by Sex and Age in Grafton County
With 9.0% poverty level for males and 10.7% for females among the residents of Grafton County, 5 year old males and 18 to 24 year old females are the most vulnerable to poverty, with 95 males (23.7%) and 589 females (18.6%) in their respective age groups living below the poverty level.
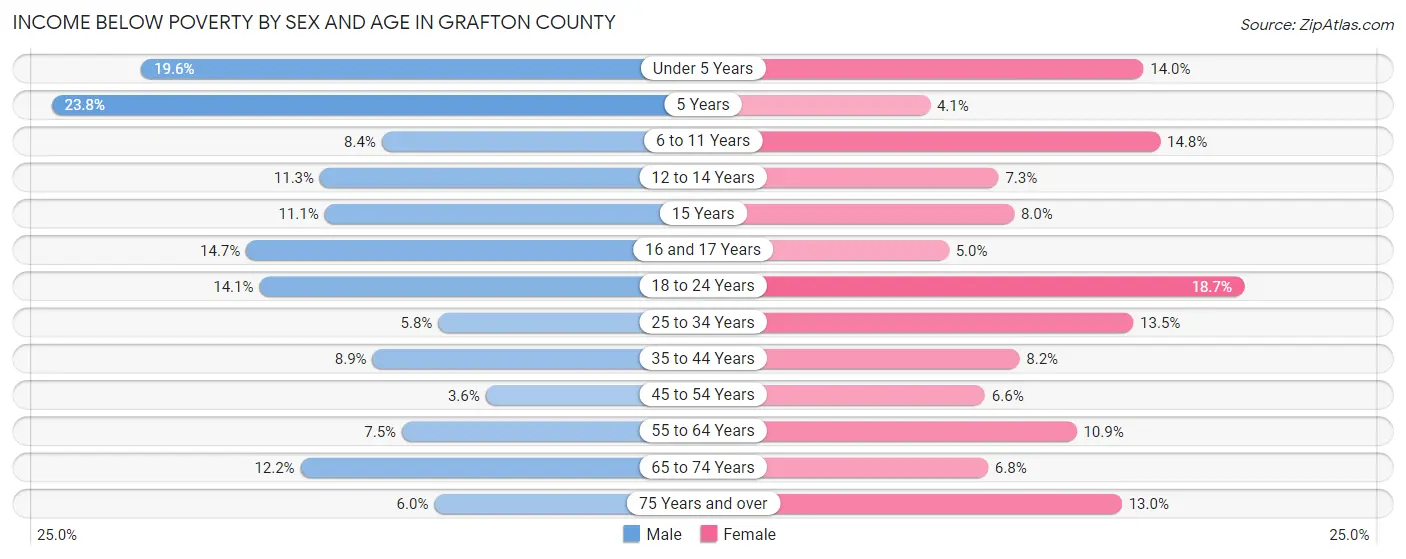
| Age Bracket | Male | Female |
| Under 5 Years | 334 (19.6%) | 257 (14.0%) |
| 5 Years | 95 (23.7%) | 11 (4.1%) |
| 6 to 11 Years | 210 (8.4%) | 347 (14.8%) |
| 12 to 14 Years | 144 (11.3%) | 93 (7.3%) |
| 15 Years | 45 (11.1%) | 23 (8.0%) |
| 16 and 17 Years | 140 (14.7%) | 47 (5.0%) |
| 18 to 24 Years | 471 (14.1%) | 589 (18.6%) |
| 25 to 34 Years | 316 (5.8%) | 726 (13.5%) |
| 35 to 44 Years | 434 (8.9%) | 393 (8.2%) |
| 45 to 54 Years | 185 (3.6%) | 343 (6.6%) |
| 55 to 64 Years | 515 (7.5%) | 773 (10.9%) |
| 65 to 74 Years | 700 (12.2%) | 394 (6.8%) |
| 75 Years and over | 208 (6.0%) | 568 (13.0%) |
| Total | 3,797 (9.0%) | 4,564 (10.7%) |
Income Above Poverty by Sex and Age in Grafton County
According to the poverty statistics in Grafton County, males aged 45 to 54 years and females aged 5 years are the age groups that are most secure financially, with 96.4% of males and 95.9% of females in these age groups living above the poverty line.
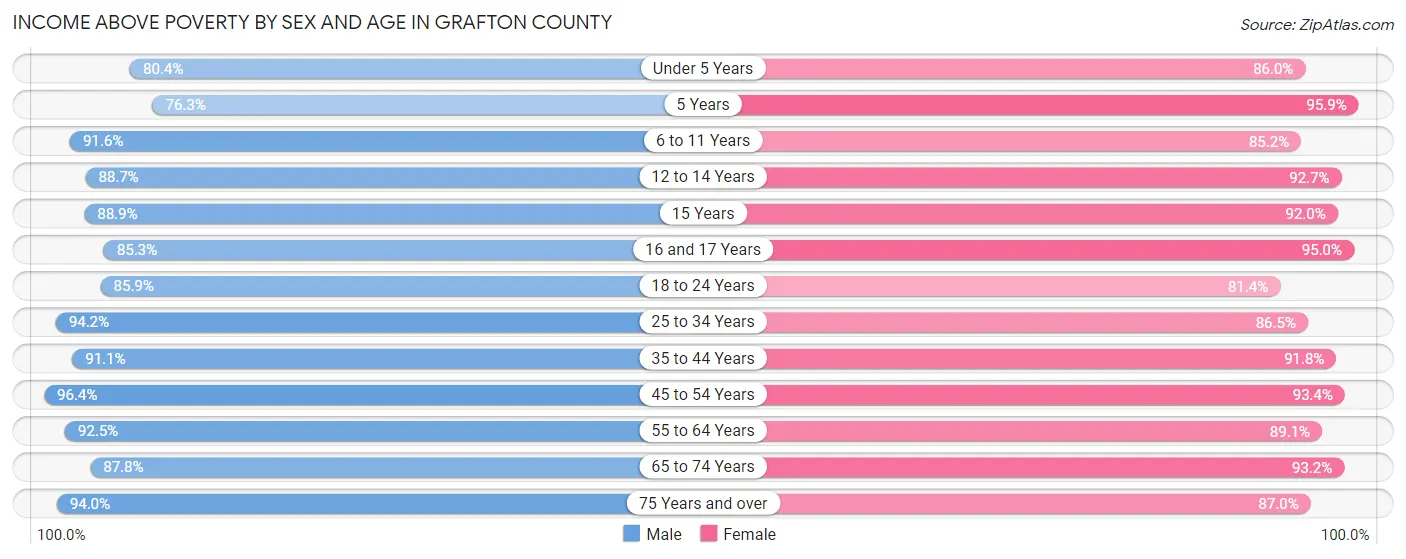
| Age Bracket | Male | Female |
| Under 5 Years | 1,371 (80.4%) | 1,580 (86.0%) |
| 5 Years | 305 (76.2%) | 258 (95.9%) |
| 6 to 11 Years | 2,282 (91.6%) | 2,002 (85.2%) |
| 12 to 14 Years | 1,130 (88.7%) | 1,187 (92.7%) |
| 15 Years | 361 (88.9%) | 265 (92.0%) |
| 16 and 17 Years | 811 (85.3%) | 900 (95.0%) |
| 18 to 24 Years | 2,868 (85.9%) | 2,570 (81.4%) |
| 25 to 34 Years | 5,127 (94.2%) | 4,643 (86.5%) |
| 35 to 44 Years | 4,466 (91.1%) | 4,378 (91.8%) |
| 45 to 54 Years | 4,935 (96.4%) | 4,820 (93.4%) |
| 55 to 64 Years | 6,359 (92.5%) | 6,326 (89.1%) |
| 65 to 74 Years | 5,036 (87.8%) | 5,414 (93.2%) |
| 75 Years and over | 3,263 (94.0%) | 3,806 (87.0%) |
| Total | 38,314 (91.0%) | 38,149 (89.3%) |
Income Below Poverty Among Married-Couple Families in Grafton County
The poverty statistics for married-couple families in Grafton County show that 4.2% or 705 of the total 16,961 families live below the poverty line. Families with 5 or more children have the highest poverty rate of 45.8%, comprising of 27 families. On the other hand, families with 1 or 2 children have the lowest poverty rate of 2.7%, which includes 116 families.
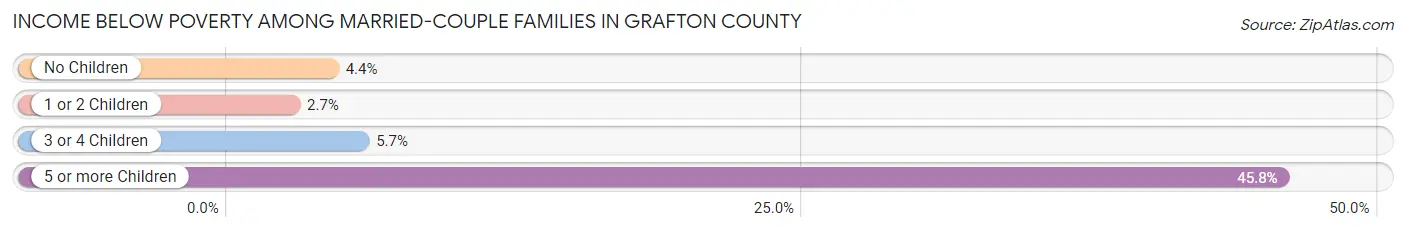
| Children | Above Poverty | Below Poverty |
| No Children | 11,370 (95.6%) | 521 (4.4%) |
| 1 or 2 Children | 4,177 (97.3%) | 116 (2.7%) |
| 3 or 4 Children | 677 (94.3%) | 41 (5.7%) |
| 5 or more Children | 32 (54.2%) | 27 (45.8%) |
| Total | 16,256 (95.8%) | 705 (4.2%) |
Income Below Poverty Among Single-Parent Households in Grafton County
According to the poverty data in Grafton County, 8.5% or 114 single-father households and 17.2% or 535 single-mother households are living below the poverty line. Among single-father households, those with 3 or 4 children have the highest poverty rate, with 14 households (38.9%) experiencing poverty. Likewise, among single-mother households, those with 5 or more children have the highest poverty rate, with 4 households (100.0%) falling below the poverty line.
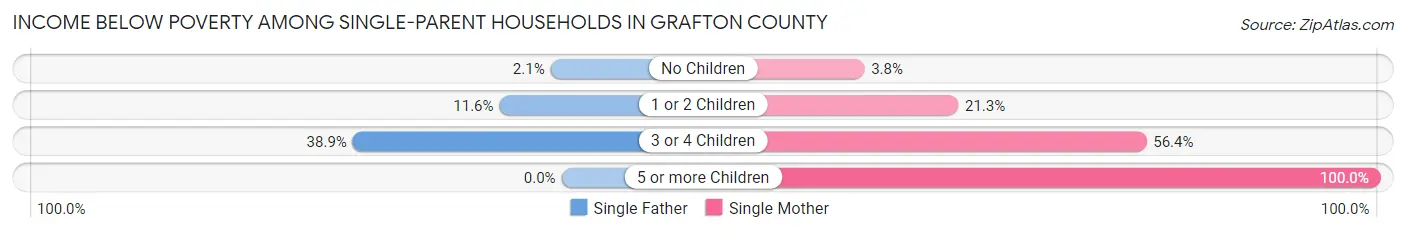
| Children | Single Father | Single Mother |
| No Children | 11 (2.1%) | 47 (3.8%) |
| 1 or 2 Children | 89 (11.6%) | 351 (21.3%) |
| 3 or 4 Children | 14 (38.9%) | 133 (56.4%) |
| 5 or more Children | 0 (0.0%) | 4 (100.0%) |
| Total | 114 (8.5%) | 535 (17.2%) |
Income Below Poverty Among Married-Couple vs Single-Parent Households in Grafton County
The poverty data for Grafton County shows that 705 of the married-couple family households (4.2%) and 649 of the single-parent households (14.6%) are living below the poverty level. Within the married-couple family households, those with 5 or more children have the highest poverty rate, with 27 households (45.8%) falling below the poverty line. Among the single-parent households, those with 5 or more children have the highest poverty rate, with 4 household (100.0%) living below poverty.
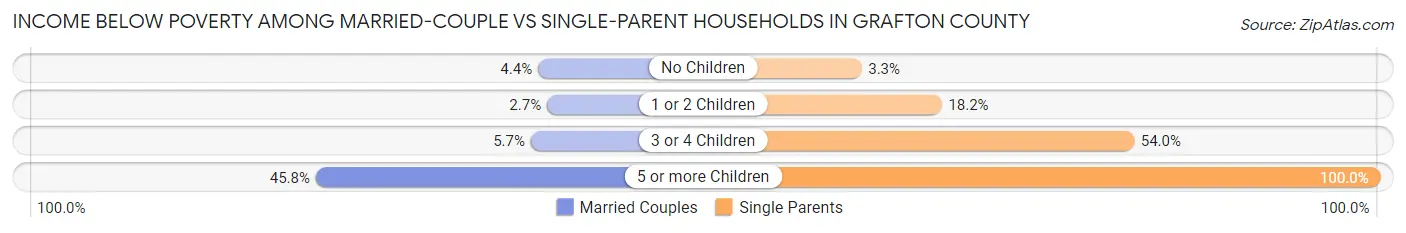
| Children | Married-Couple Families | Single-Parent Households |
| No Children | 521 (4.4%) | 58 (3.3%) |
| 1 or 2 Children | 116 (2.7%) | 440 (18.2%) |
| 3 or 4 Children | 41 (5.7%) | 147 (54.0%) |
| 5 or more Children | 27 (45.8%) | 4 (100.0%) |
| Total | 705 (4.2%) | 649 (14.6%) |
Race in Grafton County
The most populous races in Grafton County are White / Caucasian (81,662 | 89.9%), Two or more Races (4,078 | 4.5%), and Asian (3,082 | 3.4%).
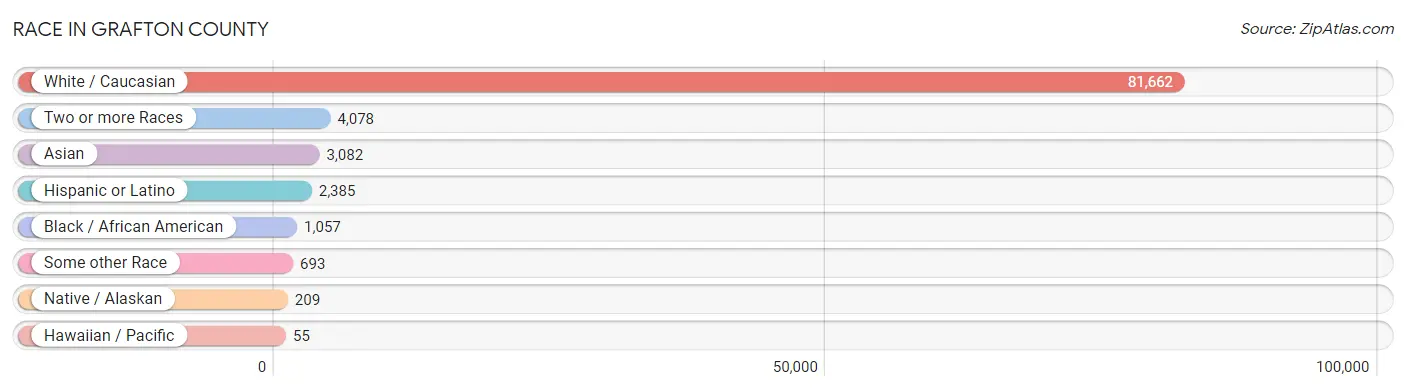
| Race | # Population | % Population |
| Asian | 3,082 | 3.4% |
| Black / African American | 1,057 | 1.2% |
| Hawaiian / Pacific | 55 | 0.1% |
| Hispanic or Latino | 2,385 | 2.6% |
| Native / Alaskan | 209 | 0.2% |
| White / Caucasian | 81,662 | 89.9% |
| Two or more Races | 4,078 | 4.5% |
| Some other Race | 693 | 0.8% |
| Total | 90,836 | 100.0% |
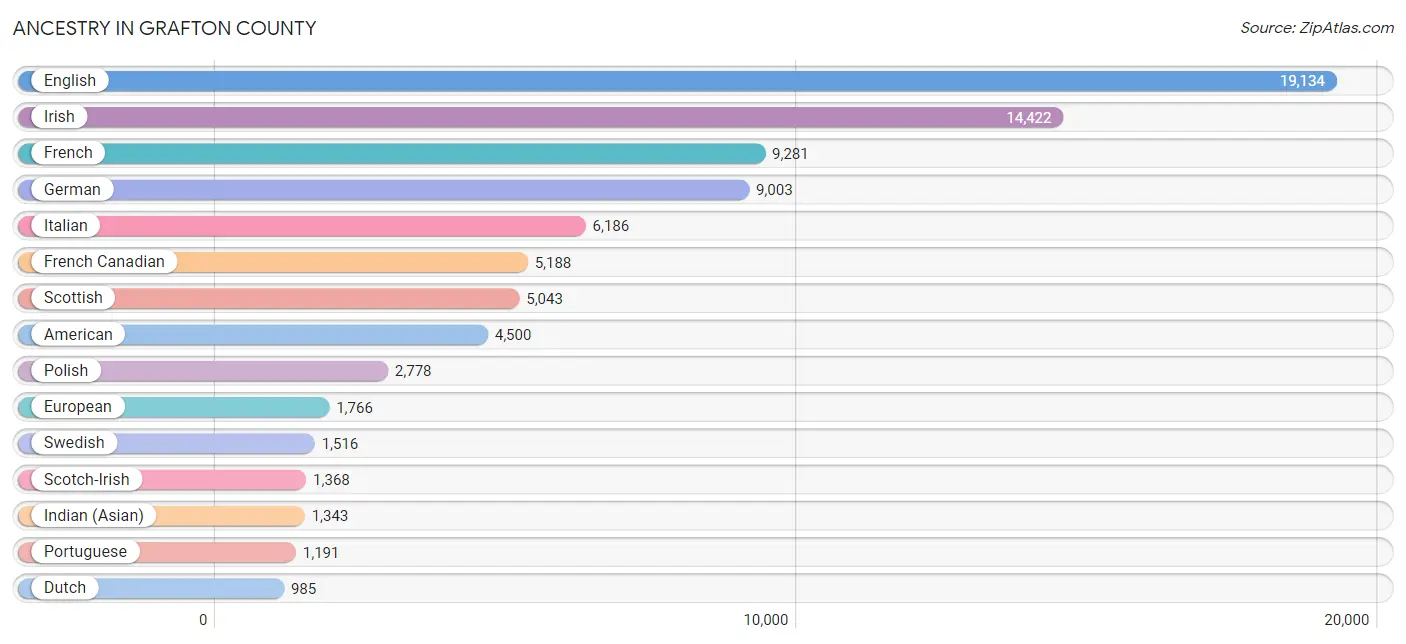
Ancestry in Grafton County
The most populous ancestries reported in Grafton County are English (19,134 | 21.1%), Irish (14,422 | 15.9%), French (9,281 | 10.2%), German (9,003 | 9.9%), and Italian (6,186 | 6.8%), together accounting for 63.9% of all Grafton County residents.
| Ancestry | # Population | % Population |
| African | 65 | 0.1% |
| Alaskan Athabascan | 4 | 0.0% |
| Albanian | 37 | 0.0% |
| Alsatian | 10 | 0.0% |
| American | 4,500 | 5.0% |
| Arab | 396 | 0.4% |
| Argentinean | 2 | 0.0% |
| Armenian | 252 | 0.3% |
| Australian | 64 | 0.1% |
| Austrian | 421 | 0.5% |
| Barbadian | 61 | 0.1% |
| Belgian | 122 | 0.1% |
| Bhutanese | 314 | 0.4% |
| Blackfeet | 35 | 0.0% |
| Bolivian | 21 | 0.0% |
| Brazilian | 52 | 0.1% |
| British | 936 | 1.0% |
| British West Indian | 9 | 0.0% |
| Bulgarian | 21 | 0.0% |
| Burmese | 537 | 0.6% |
| Canadian | 850 | 0.9% |
| Cape Verdean | 4 | 0.0% |
| Carpatho Rusyn | 3 | 0.0% |
| Celtic | 64 | 0.1% |
| Central American | 272 | 0.3% |
| Central American Indian | 24 | 0.0% |
| Cherokee | 41 | 0.1% |
| Chickasaw | 2 | 0.0% |
| Chilean | 1 | 0.0% |
| Chippewa | 48 | 0.1% |
| Choctaw | 7 | 0.0% |
| Colombian | 61 | 0.1% |
| Costa Rican | 24 | 0.0% |
| Cree | 18 | 0.0% |
| Croatian | 70 | 0.1% |
| Crow | 3 | 0.0% |
| Cuban | 95 | 0.1% |
| Czech | 263 | 0.3% |
| Czechoslovakian | 73 | 0.1% |
| Danish | 450 | 0.5% |
| Dominican | 59 | 0.1% |
| Dutch | 985 | 1.1% |
| Eastern European | 312 | 0.3% |
| Egyptian | 10 | 0.0% |
| English | 19,134 | 21.1% |
| Estonian | 6 | 0.0% |
| Ethiopian | 3 | 0.0% |
| European | 1,766 | 1.9% |
| Filipino | 102 | 0.1% |
| Finnish | 66 | 0.1% |
| French | 9,281 | 10.2% |
| French American Indian | 51 | 0.1% |
| French Canadian | 5,188 | 5.7% |
| German | 9,003 | 9.9% |
| Ghanaian | 8 | 0.0% |
| Greek | 613 | 0.7% |
| Guamanian / Chamorro | 10 | 0.0% |
| Guatemalan | 48 | 0.1% |
| Guyanese | 6 | 0.0% |
| Haitian | 87 | 0.1% |
| Honduran | 46 | 0.1% |
| Hungarian | 463 | 0.5% |
| Icelander | 22 | 0.0% |
| Indian (Asian) | 1,343 | 1.5% |
| Inupiat | 2 | 0.0% |
| Iranian | 30 | 0.0% |
| Iraqi | 42 | 0.1% |
| Irish | 14,422 | 15.9% |
| Iroquois | 46 | 0.1% |
| Israeli | 3 | 0.0% |
| Italian | 6,186 | 6.8% |
| Jamaican | 39 | 0.0% |
| Japanese | 30 | 0.0% |
| Kenyan | 32 | 0.0% |
| Korean | 330 | 0.4% |
| Laotian | 106 | 0.1% |
| Latvian | 63 | 0.1% |
| Lebanese | 245 | 0.3% |
| Lithuanian | 328 | 0.4% |
| Malaysian | 152 | 0.2% |
| Maltese | 26 | 0.0% |
| Mexican | 558 | 0.6% |
| Native Hawaiian | 48 | 0.1% |
| Navajo | 9 | 0.0% |
| New Zealander | 20 | 0.0% |
| Nicaraguan | 95 | 0.1% |
| Nigerian | 37 | 0.0% |
| Northern European | 271 | 0.3% |
| Norwegian | 956 | 1.1% |
| Osage | 2 | 0.0% |
| Pakistani | 155 | 0.2% |
| Palestinian | 24 | 0.0% |
| Pennsylvania German | 2 | 0.0% |
| Peruvian | 66 | 0.1% |
| Polish | 2,778 | 3.1% |
| Portuguese | 1,191 | 1.3% |
| Puerto Rican | 848 | 0.9% |
| Romanian | 64 | 0.1% |
| Russian | 864 | 0.9% |
| Salvadoran | 59 | 0.1% |
| Samoan | 7 | 0.0% |
| Scandinavian | 271 | 0.3% |
| Scotch-Irish | 1,368 | 1.5% |
| Scottish | 5,043 | 5.6% |
| Senegalese | 4 | 0.0% |
| Serbian | 21 | 0.0% |
| Sioux | 15 | 0.0% |
| Slavic | 9 | 0.0% |
| Slovak | 83 | 0.1% |
| Slovene | 83 | 0.1% |
| South American | 151 | 0.2% |
| South American Indian | 3 | 0.0% |
| Spaniard | 96 | 0.1% |
| Spanish | 181 | 0.2% |
| Spanish American | 50 | 0.1% |
| Sri Lankan | 213 | 0.2% |
| Subsaharan African | 223 | 0.3% |
| Swedish | 1,516 | 1.7% |
| Swiss | 374 | 0.4% |
| Syrian | 16 | 0.0% |
| Thai | 647 | 0.7% |
| Trinidadian and Tobagonian | 7 | 0.0% |
| Turkish | 27 | 0.0% |
| Ugandan | 60 | 0.1% |
| Ukrainian | 406 | 0.4% |
| Vietnamese | 73 | 0.1% |
| Welsh | 640 | 0.7% |
| Yakama | 3 | 0.0% |
| Yaqui | 29 | 0.0% |
| Yugoslavian | 8 | 0.0% | View All 130 Rows |
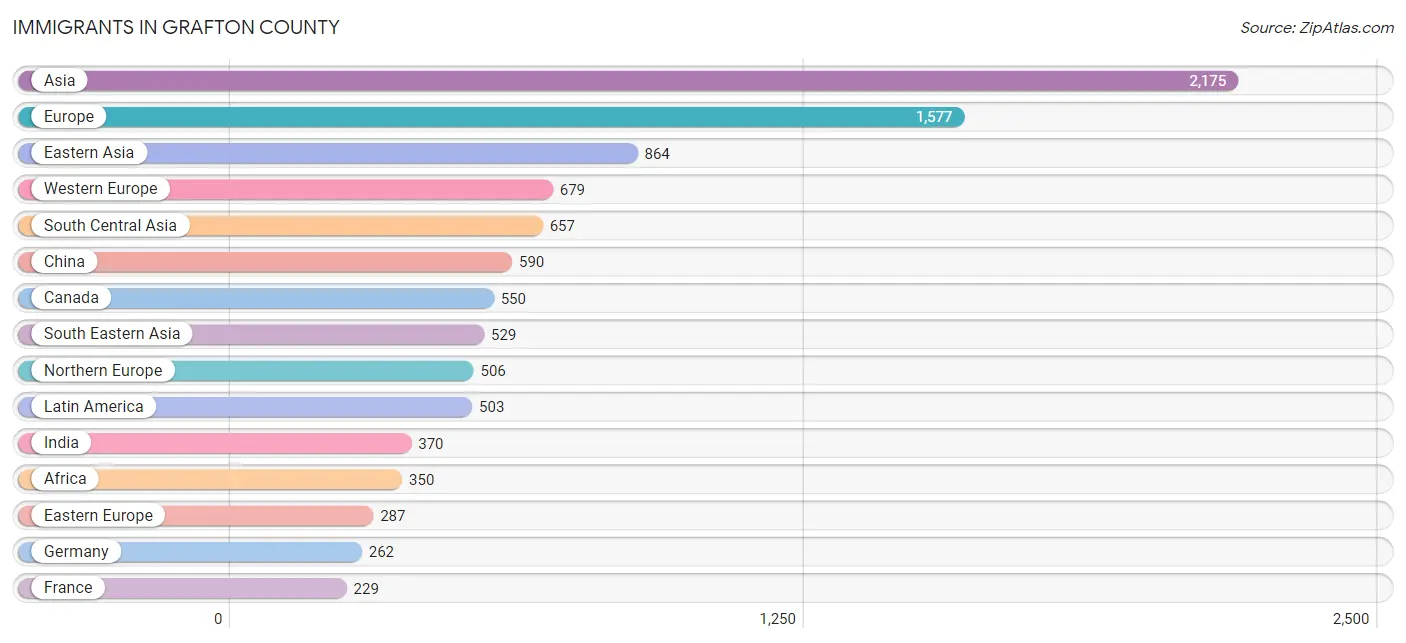
Immigrants in Grafton County
The most numerous immigrant groups reported in Grafton County came from Asia (2,175 | 2.4%), Europe (1,577 | 1.7%), Eastern Asia (864 | 0.9%), Western Europe (679 | 0.7%), and South Central Asia (657 | 0.7%), together accounting for 6.6% of all Grafton County residents.
| Immigration Origin | # Population | % Population |
| Africa | 350 | 0.4% |
| Albania | 18 | 0.0% |
| Argentina | 4 | 0.0% |
| Asia | 2,175 | 2.4% |
| Australia | 94 | 0.1% |
| Austria | 82 | 0.1% |
| Azores | 3 | 0.0% |
| Bahamas | 2 | 0.0% |
| Bangladesh | 17 | 0.0% |
| Belgium | 8 | 0.0% |
| Brazil | 96 | 0.1% |
| Bulgaria | 9 | 0.0% |
| Cambodia | 30 | 0.0% |
| Cameroon | 22 | 0.0% |
| Canada | 550 | 0.6% |
| Caribbean | 136 | 0.2% |
| Central America | 228 | 0.3% |
| Chile | 1 | 0.0% |
| China | 590 | 0.6% |
| Colombia | 1 | 0.0% |
| Costa Rica | 15 | 0.0% |
| Cuba | 7 | 0.0% |
| Denmark | 26 | 0.0% |
| Dominican Republic | 14 | 0.0% |
| Eastern Africa | 143 | 0.2% |
| Eastern Asia | 864 | 0.9% |
| Eastern Europe | 287 | 0.3% |
| El Salvador | 26 | 0.0% |
| England | 178 | 0.2% |
| Ethiopia | 35 | 0.0% |
| Europe | 1,577 | 1.7% |
| France | 229 | 0.3% |
| Germany | 262 | 0.3% |
| Ghana | 17 | 0.0% |
| Greece | 6 | 0.0% |
| Guatemala | 39 | 0.0% |
| Haiti | 72 | 0.1% |
| Honduras | 4 | 0.0% |
| Hong Kong | 52 | 0.1% |
| India | 370 | 0.4% |
| Indonesia | 15 | 0.0% |
| Iran | 31 | 0.0% |
| Iraq | 9 | 0.0% |
| Ireland | 59 | 0.1% |
| Israel | 47 | 0.1% |
| Italy | 23 | 0.0% |
| Jamaica | 34 | 0.0% |
| Japan | 97 | 0.1% |
| Kazakhstan | 20 | 0.0% |
| Kenya | 45 | 0.1% |
| Korea | 177 | 0.2% |
| Kuwait | 10 | 0.0% |
| Laos | 115 | 0.1% |
| Latin America | 503 | 0.5% |
| Lebanon | 31 | 0.0% |
| Liberia | 38 | 0.0% |
| Lithuania | 18 | 0.0% |
| Malaysia | 49 | 0.1% |
| Mexico | 102 | 0.1% |
| Middle Africa | 22 | 0.0% |
| Moldova | 4 | 0.0% |
| Nepal | 64 | 0.1% |
| Netherlands | 67 | 0.1% |
| Nicaragua | 42 | 0.1% |
| Nigeria | 27 | 0.0% |
| Northern Africa | 3 | 0.0% |
| Northern Europe | 506 | 0.6% |
| Oceania | 119 | 0.1% |
| Pakistan | 38 | 0.0% |
| Peru | 37 | 0.0% |
| Philippines | 188 | 0.2% |
| Poland | 78 | 0.1% |
| Portugal | 63 | 0.1% |
| Romania | 23 | 0.0% |
| Russia | 81 | 0.1% |
| Scotland | 32 | 0.0% |
| Singapore | 9 | 0.0% |
| South Africa | 84 | 0.1% |
| South America | 139 | 0.2% |
| South Central Asia | 657 | 0.7% |
| South Eastern Asia | 529 | 0.6% |
| Southern Europe | 105 | 0.1% |
| Spain | 13 | 0.0% |
| Sri Lanka | 96 | 0.1% |
| Sweden | 17 | 0.0% |
| Switzerland | 31 | 0.0% |
| Taiwan | 64 | 0.1% |
| Thailand | 93 | 0.1% |
| Trinidad and Tobago | 7 | 0.0% |
| Turkey | 14 | 0.0% |
| Uganda | 55 | 0.1% |
| Ukraine | 10 | 0.0% |
| Uzbekistan | 17 | 0.0% |
| Vietnam | 30 | 0.0% |
| Western Africa | 82 | 0.1% |
| Western Asia | 125 | 0.1% |
| Western Europe | 679 | 0.7% |
| Zimbabwe | 4 | 0.0% | View All 98 Rows |
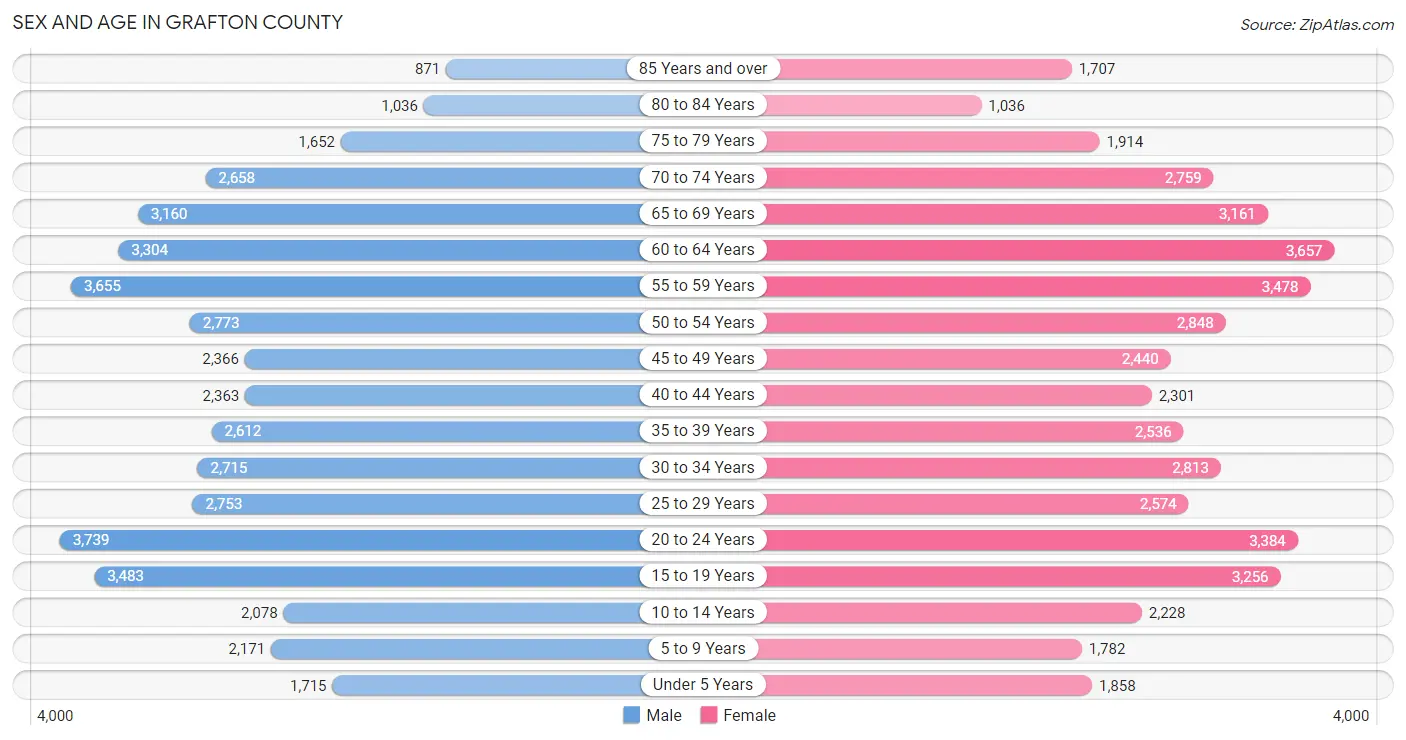
Sex and Age in Grafton County
Sex and Age in Grafton County
The most populous age groups in Grafton County are 20 to 24 Years (3,739 | 8.3%) for men and 60 to 64 Years (3,657 | 8.0%) for women.
| Age Bracket | Male | Female |
| Under 5 Years | 1,715 (3.8%) | 1,858 (4.1%) |
| 5 to 9 Years | 2,171 (4.8%) | 1,782 (3.9%) |
| 10 to 14 Years | 2,078 (4.6%) | 2,228 (4.9%) |
| 15 to 19 Years | 3,483 (7.7%) | 3,256 (7.1%) |
| 20 to 24 Years | 3,739 (8.3%) | 3,384 (7.4%) |
| 25 to 29 Years | 2,753 (6.1%) | 2,574 (5.6%) |
| 30 to 34 Years | 2,715 (6.0%) | 2,813 (6.1%) |
| 35 to 39 Years | 2,612 (5.8%) | 2,536 (5.6%) |
| 40 to 44 Years | 2,363 (5.2%) | 2,301 (5.0%) |
| 45 to 49 Years | 2,366 (5.2%) | 2,440 (5.3%) |
| 50 to 54 Years | 2,773 (6.1%) | 2,848 (6.2%) |
| 55 to 59 Years | 3,655 (8.1%) | 3,478 (7.6%) |
| 60 to 64 Years | 3,304 (7.3%) | 3,657 (8.0%) |
| 65 to 69 Years | 3,160 (7.0%) | 3,161 (6.9%) |
| 70 to 74 Years | 2,658 (5.9%) | 2,759 (6.0%) |
| 75 to 79 Years | 1,652 (3.7%) | 1,914 (4.2%) |
| 80 to 84 Years | 1,036 (2.3%) | 1,036 (2.3%) |
| 85 Years and over | 871 (1.9%) | 1,707 (3.7%) |
| Total | 45,104 (100.0%) | 45,732 (100.0%) |
Families and Households in Grafton County
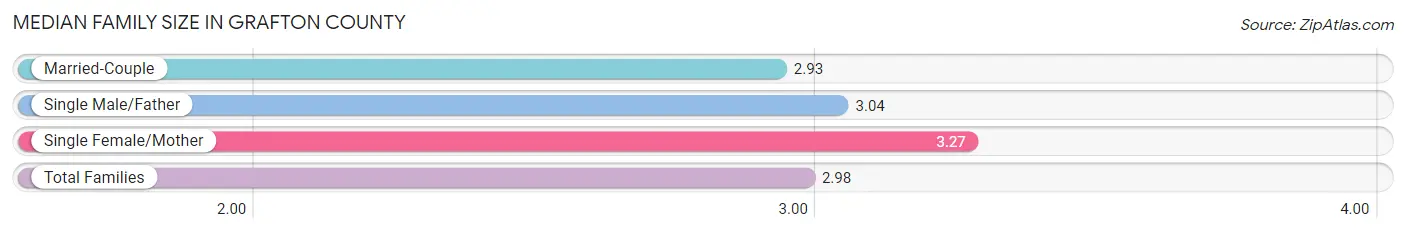
Median Family Size in Grafton County
The median family size in Grafton County is 2.98 persons per family, with single female/mother families (3,116 | 14.5%) accounting for the largest median family size of 3.27 persons per family. On the other hand, married-couple families (16,961 | 79.2%) represent the smallest median family size with 2.93 persons per family.
| Family Type | # Families | Family Size |
| Married-Couple | 16,961 (79.2%) | 2.93 |
| Single Male/Father | 1,342 (6.3%) | 3.04 |
| Single Female/Mother | 3,116 (14.5%) | 3.27 |
| Total Families | 21,419 (100.0%) | 2.98 |
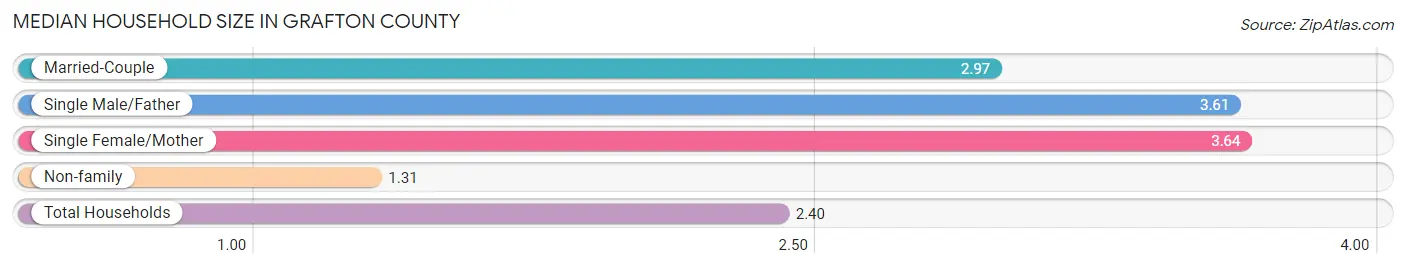
Median Household Size in Grafton County
The median household size in Grafton County is 2.40 persons per household, with single female/mother households (3,116 | 8.9%) accounting for the largest median household size of 3.64 persons per household. non-family households (13,665 | 39.0%) represent the smallest median household size with 1.31 persons per household.
| Household Type | # Households | Household Size |
| Married-Couple | 16,961 (48.3%) | 2.97 |
| Single Male/Father | 1,342 (3.8%) | 3.61 |
| Single Female/Mother | 3,116 (8.9%) | 3.64 |
| Non-family | 13,665 (39.0%) | 1.31 |
| Total Households | 35,084 (100.0%) | 2.40 |
Household Size by Marriage Status in Grafton County
Out of a total of 35,084 households in Grafton County, 21,419 (61.1%) are family households, while 13,665 (39.0%) are nonfamily households. The most numerous type of family households are 2-person households, comprising 11,874, and the most common type of nonfamily households are 1-person households, comprising 10,750.
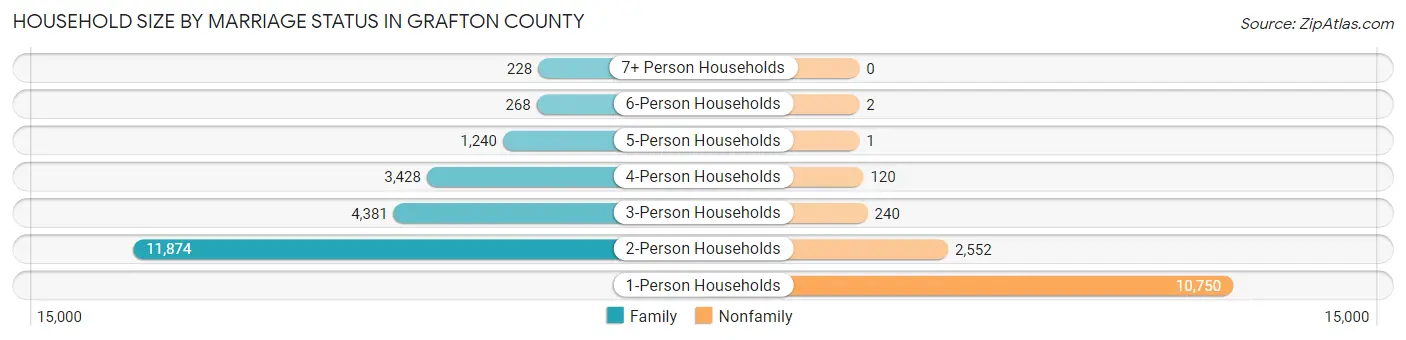
| Household Size | Family Households | Nonfamily Households |
| 1-Person Households | - | 10,750 (30.6%) |
| 2-Person Households | 11,874 (33.8%) | 2,552 (7.3%) |
| 3-Person Households | 4,381 (12.5%) | 240 (0.7%) |
| 4-Person Households | 3,428 (9.8%) | 120 (0.3%) |
| 5-Person Households | 1,240 (3.5%) | 1 (0.0%) |
| 6-Person Households | 268 (0.8%) | 2 (0.0%) |
| 7+ Person Households | 228 (0.6%) | 0 (0.0%) |
| Total | 21,419 (61.1%) | 13,665 (39.0%) |
Female Fertility in Grafton County
Fertility by Age in Grafton County
Average fertility rate in Grafton County is 45.0 births per 1,000 women. Women in the age bracket of 20 to 34 years have the highest fertility rate with 87.0 births per 1,000 women. Women in the age bracket of 20 to 34 years acount for 84.4% of all women with births.
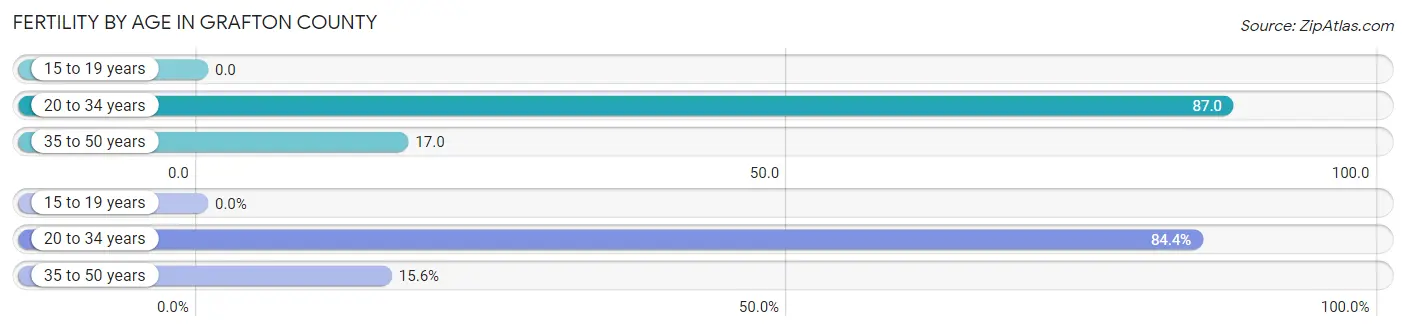
| Age Bracket | Women with Births | Births / 1,000 Women |
| 15 to 19 years | 0 (0.0%) | 0.0 |
| 20 to 34 years | 763 (84.4%) | 87.0 |
| 35 to 50 years | 141 (15.6%) | 17.0 |
| Total | 904 (100.0%) | 45.0 |
Fertility by Age by Marriage Status in Grafton County
51.9% of women with births (904) in Grafton County are married. The highest percentage of unmarried women with births falls into 20 to 34 years age bracket with 48.9% of them unmarried at the time of birth, while the lowest percentage of unmarried women with births belong to 35 to 50 years age bracket with 44.0% of them unmarried.
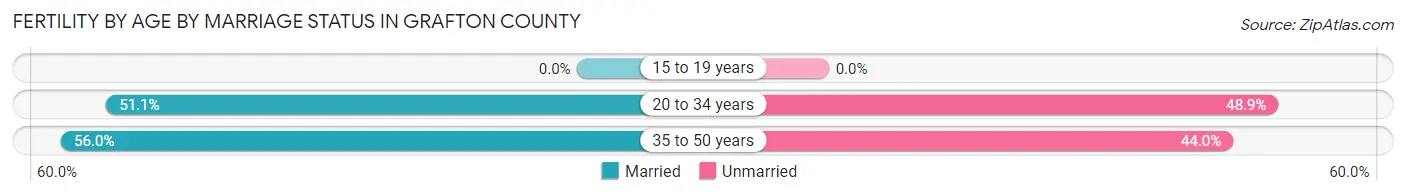
| Age Bracket | Married | Unmarried |
| 15 to 19 years | 0 (0.0%) | 0 (0.0%) |
| 20 to 34 years | 390 (51.1%) | 373 (48.9%) |
| 35 to 50 years | 79 (56.0%) | 62 (44.0%) |
| Total | 469 (51.9%) | 435 (48.1%) |
Fertility by Education in Grafton County
Average fertility rate in Grafton County is 45.0 births per 1,000 women. Women with the education attainment of high school diploma have the highest fertility rate of 132.0 births per 1,000 women, while women with the education attainment of bachelor's degree have the lowest fertility at 16.0 births per 1,000 women. Women with the education attainment of high school diploma represent 56.4% of all women with births.
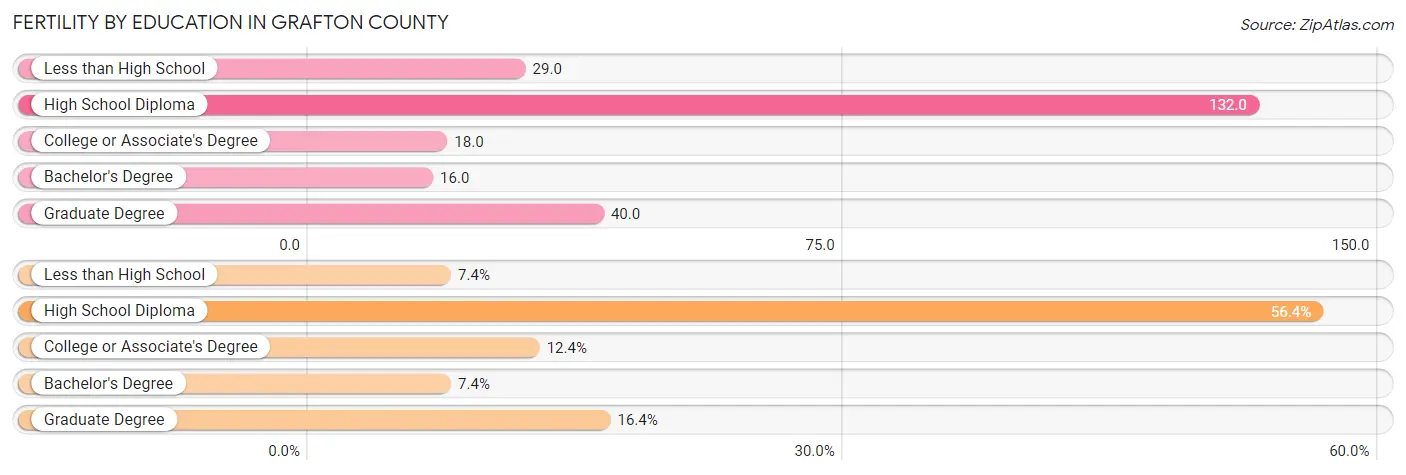
| Educational Attainment | Women with Births | Births / 1,000 Women |
| Less than High School | 67 (7.4%) | 29.0 |
| High School Diploma | 510 (56.4%) | 132.0 |
| College or Associate's Degree | 112 (12.4%) | 18.0 |
| Bachelor's Degree | 67 (7.4%) | 16.0 |
| Graduate Degree | 148 (16.4%) | 40.0 |
| Total | 904 (100.0%) | 45.0 |
Fertility by Education by Marriage Status in Grafton County
48.1% of women with births in Grafton County are unmarried. Women with the educational attainment of graduate degree are most likely to be married with 100.0% of them married at childbirth, while women with the educational attainment of less than high school are least likely to be married with 95.5% of them unmarried at childbirth.
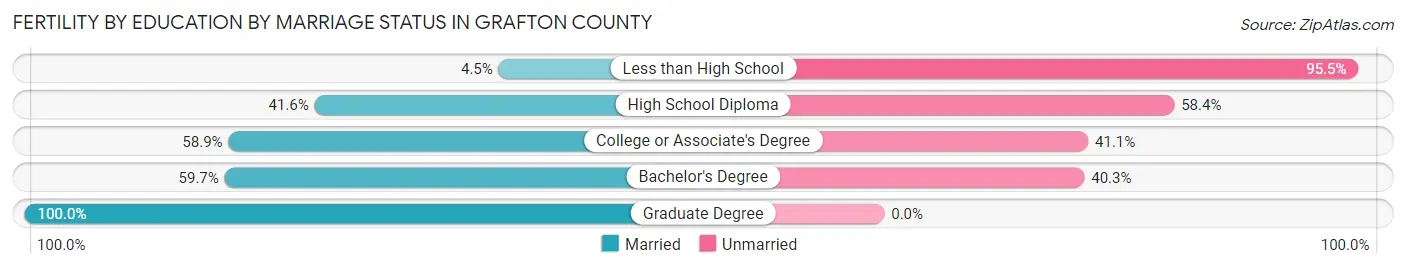
| Educational Attainment | Married | Unmarried |
| Less than High School | 3 (4.5%) | 64 (95.5%) |
| High School Diploma | 212 (41.6%) | 298 (58.4%) |
| College or Associate's Degree | 66 (58.9%) | 46 (41.1%) |
| Bachelor's Degree | 40 (59.7%) | 27 (40.3%) |
| Graduate Degree | 148 (100.0%) | 0 (0.0%) |
| Total | 469 (51.9%) | 435 (48.1%) |
Employment Characteristics in Grafton County
Employment by Class of Employer in Grafton County
Among the 45,358 employed individuals in Grafton County, private company employees (25,025 | 55.2%), not-for-profit organizations (9,394 | 20.7%), and self-employed (not incorporated) (3,503 | 7.7%) make up the most common classes of employment.
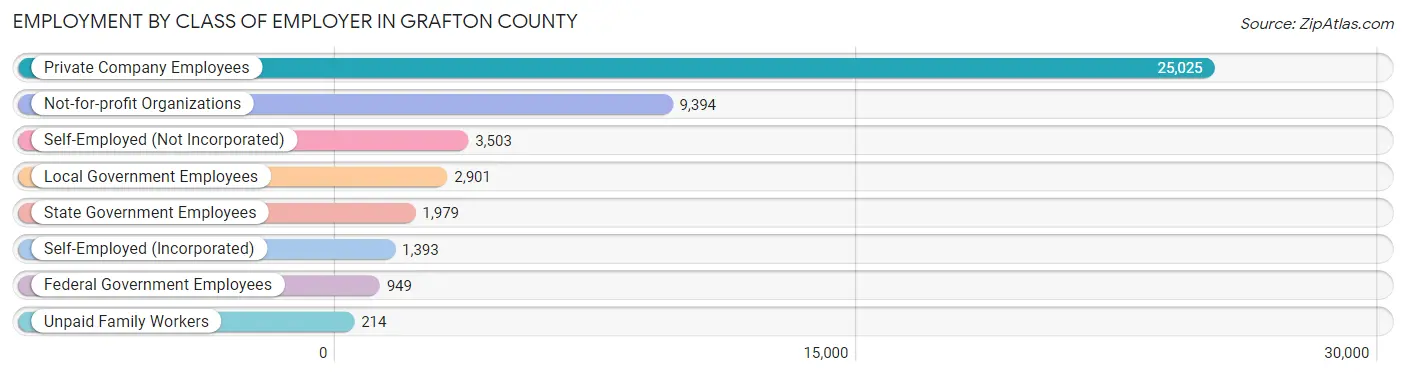
| Employer Class | # Employees | % Employees |
| Private Company Employees | 25,025 | 55.2% |
| Self-Employed (Incorporated) | 1,393 | 3.1% |
| Self-Employed (Not Incorporated) | 3,503 | 7.7% |
| Not-for-profit Organizations | 9,394 | 20.7% |
| Local Government Employees | 2,901 | 6.4% |
| State Government Employees | 1,979 | 4.4% |
| Federal Government Employees | 949 | 2.1% |
| Unpaid Family Workers | 214 | 0.5% |
| Total | 45,358 | 100.0% |
Employment Status by Age in Grafton County
According to the labor force statistics for Grafton County, out of the total population over 16 years of age (78,308), 60.9% or 47,690 individuals are in the labor force, with 2.8% or 1,335 of them unemployed. The age group with the highest labor force participation rate is 30 to 34 years, with 86.3% or 4,771 individuals in the labor force. Within the labor force, the 16 to 19 years age range has the highest percentage of unemployed individuals, with 14.8% or 314 of them being unemployed.
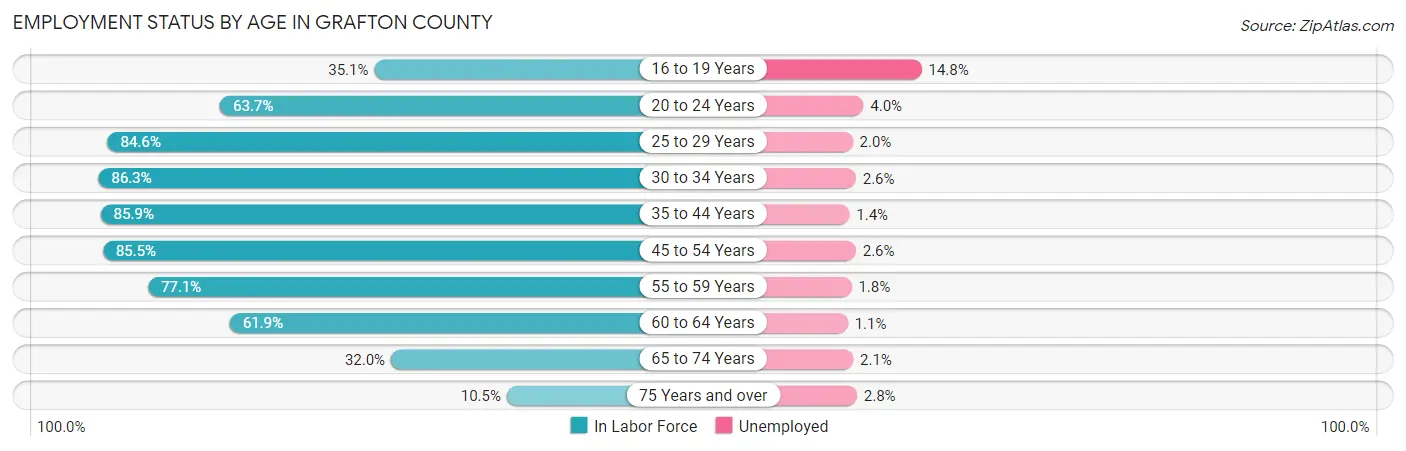
| Age Bracket | In Labor Force | Unemployed |
| 16 to 19 Years | 2,121 (35.1%) | 314 (14.8%) |
| 20 to 24 Years | 4,537 (63.7%) | 181 (4.0%) |
| 25 to 29 Years | 4,507 (84.6%) | 90 (2.0%) |
| 30 to 34 Years | 4,771 (86.3%) | 124 (2.6%) |
| 35 to 44 Years | 8,429 (85.9%) | 118 (1.4%) |
| 45 to 54 Years | 8,915 (85.5%) | 232 (2.6%) |
| 55 to 59 Years | 5,500 (77.1%) | 99 (1.8%) |
| 60 to 64 Years | 4,309 (61.9%) | 47 (1.1%) |
| 65 to 74 Years | 3,756 (32.0%) | 79 (2.1%) |
| 75 Years and over | 863 (10.5%) | 24 (2.8%) |
| Total | 47,690 (60.9%) | 1,335 (2.8%) |
Employment Status by Educational Attainment in Grafton County
According to labor force statistics for Grafton County, 80.6% of individuals (36,422) out of the total population between 25 and 64 years of age (45,188) are in the labor force, with 2.0% or 728 of them being unemployed. The group with the highest labor force participation rate are those with the educational attainment of bachelor's degree or higher, with 87.2% or 17,683 individuals in the labor force. Within the labor force, individuals with high school diploma education have the highest percentage of unemployment, with 3.4% or 302 of them being unemployed.
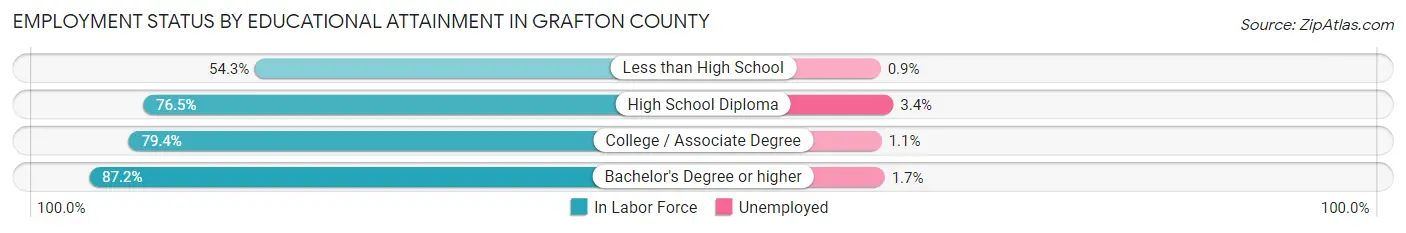
| Educational Attainment | In Labor Force | Unemployed |
| Less than High School | 1,543 (54.3%) | 26 (0.9%) |
| High School Diploma | 8,872 (76.5%) | 394 (3.4%) |
| College / Associate Degree | 8,314 (79.4%) | 115 (1.1%) |
| Bachelor's Degree or higher | 17,683 (87.2%) | 345 (1.7%) |
| Total | 36,422 (80.6%) | 904 (2.0%) |
Employment Occupations by Sex in Grafton County
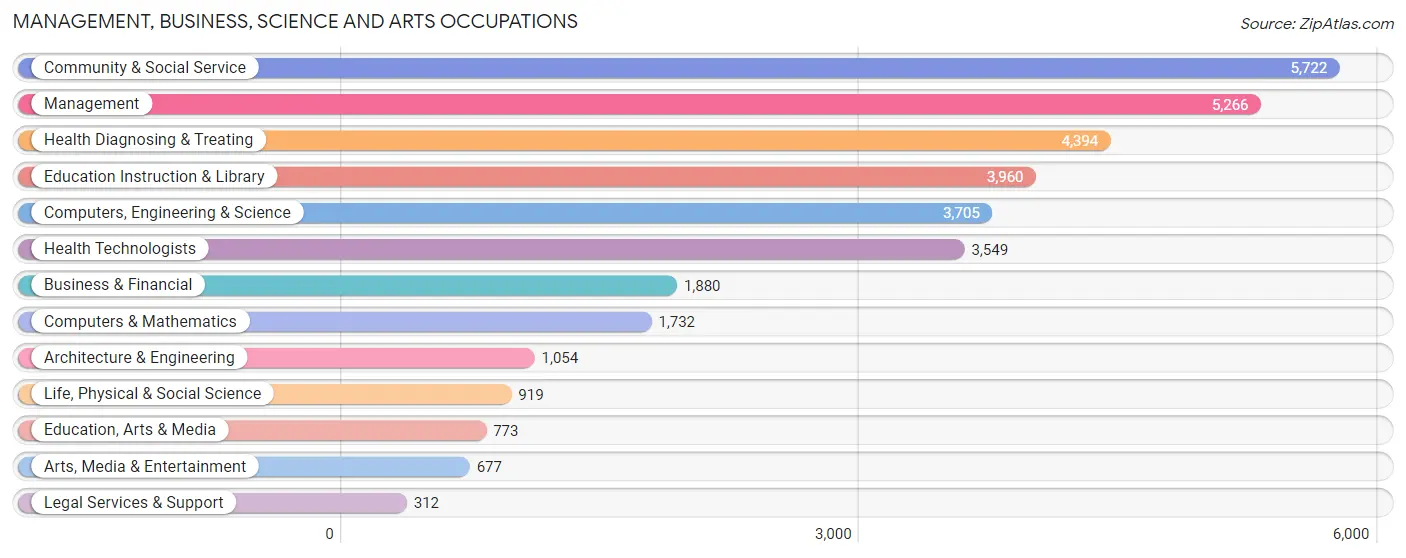
Management, Business, Science and Arts Occupations
The most common Management, Business, Science and Arts occupations in Grafton County are Community & Social Service (5,722 | 12.3%), Management (5,266 | 11.4%), Health Diagnosing & Treating (4,394 | 9.5%), Education Instruction & Library (3,960 | 8.5%), and Computers, Engineering & Science (3,705 | 8.0%).
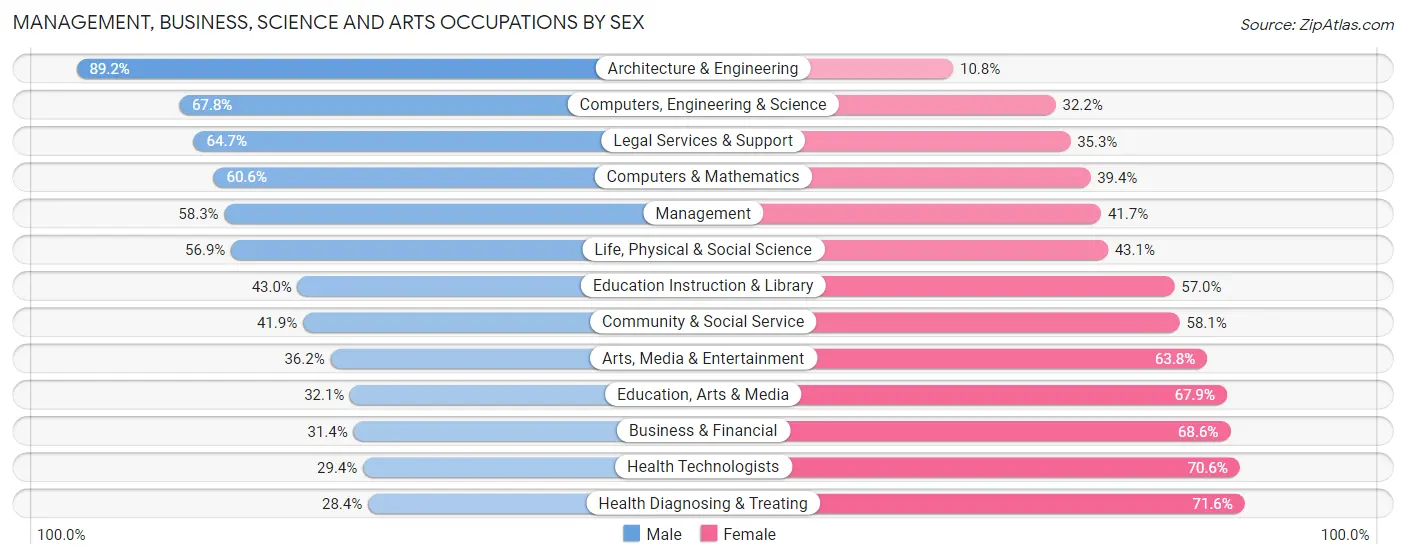
Management, Business, Science and Arts Occupations by Sex
Within the Management, Business, Science and Arts occupations in Grafton County, the most male-oriented occupations are Architecture & Engineering (89.2%), Computers, Engineering & Science (67.8%), and Legal Services & Support (64.7%), while the most female-oriented occupations are Health Diagnosing & Treating (71.6%), Health Technologists (70.6%), and Business & Financial (68.6%).
| Occupation | Male | Female |
| Management | 3,071 (58.3%) | 2,195 (41.7%) |
| Business & Financial | 590 (31.4%) | 1,290 (68.6%) |
| Computers, Engineering & Science | 2,512 (67.8%) | 1,193 (32.2%) |
| Computers & Mathematics | 1,049 (60.6%) | 683 (39.4%) |
| Architecture & Engineering | 940 (89.2%) | 114 (10.8%) |
| Life, Physical & Social Science | 523 (56.9%) | 396 (43.1%) |
| Community & Social Service | 2,399 (41.9%) | 3,323 (58.1%) |
| Education, Arts & Media | 248 (32.1%) | 525 (67.9%) |
| Legal Services & Support | 202 (64.7%) | 110 (35.3%) |
| Education Instruction & Library | 1,704 (43.0%) | 2,256 (57.0%) |
| Arts, Media & Entertainment | 245 (36.2%) | 432 (63.8%) |
| Health Diagnosing & Treating | 1,246 (28.4%) | 3,148 (71.6%) |
| Health Technologists | 1,043 (29.4%) | 2,506 (70.6%) |
| Total (Category) | 9,818 (46.8%) | 11,149 (53.2%) |
| Total (Overall) | 23,676 (51.1%) | 22,678 (48.9%) |
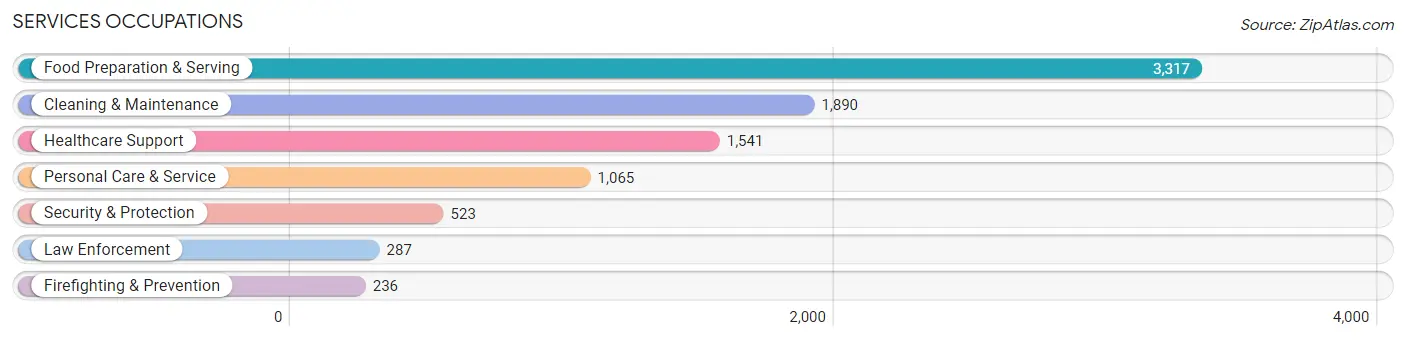
Services Occupations
The most common Services occupations in Grafton County are Food Preparation & Serving (3,317 | 7.2%), Cleaning & Maintenance (1,890 | 4.1%), Healthcare Support (1,541 | 3.3%), Personal Care & Service (1,065 | 2.3%), and Security & Protection (523 | 1.1%).
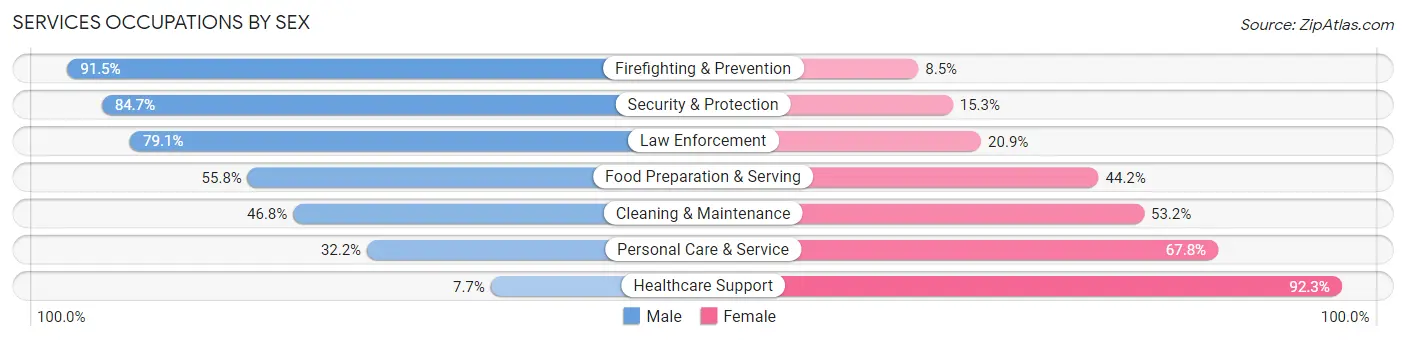
Services Occupations by Sex
Within the Services occupations in Grafton County, the most male-oriented occupations are Firefighting & Prevention (91.5%), Security & Protection (84.7%), and Law Enforcement (79.1%), while the most female-oriented occupations are Healthcare Support (92.3%), Personal Care & Service (67.8%), and Cleaning & Maintenance (53.2%).
| Occupation | Male | Female |
| Healthcare Support | 119 (7.7%) | 1,422 (92.3%) |
| Security & Protection | 443 (84.7%) | 80 (15.3%) |
| Firefighting & Prevention | 216 (91.5%) | 20 (8.5%) |
| Law Enforcement | 227 (79.1%) | 60 (20.9%) |
| Food Preparation & Serving | 1,852 (55.8%) | 1,465 (44.2%) |
| Cleaning & Maintenance | 885 (46.8%) | 1,005 (53.2%) |
| Personal Care & Service | 343 (32.2%) | 722 (67.8%) |
| Total (Category) | 3,642 (43.7%) | 4,694 (56.3%) |
| Total (Overall) | 23,676 (51.1%) | 22,678 (48.9%) |
Sales and Office Occupations
The most common Sales and Office occupations in Grafton County are Office & Administration (4,939 | 10.6%), and Sales & Related (3,558 | 7.7%).
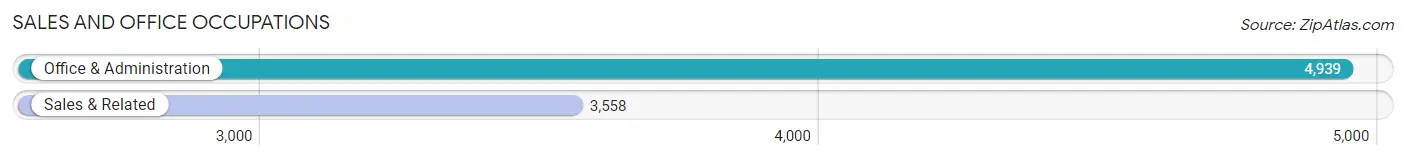
Sales and Office Occupations by Sex
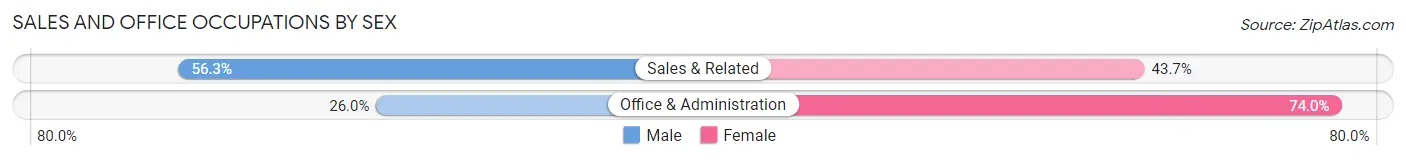
| Occupation | Male | Female |
| Sales & Related | 2,003 (56.3%) | 1,555 (43.7%) |
| Office & Administration | 1,286 (26.0%) | 3,653 (74.0%) |
| Total (Category) | 3,289 (38.7%) | 5,208 (61.3%) |
| Total (Overall) | 23,676 (51.1%) | 22,678 (48.9%) |
Natural Resources, Construction and Maintenance Occupations
The most common Natural Resources, Construction and Maintenance occupations in Grafton County are Construction & Extraction (1,932 | 4.2%), Installation, Maintenance & Repair (1,303 | 2.8%), and Farming, Fishing & Forestry (333 | 0.7%).
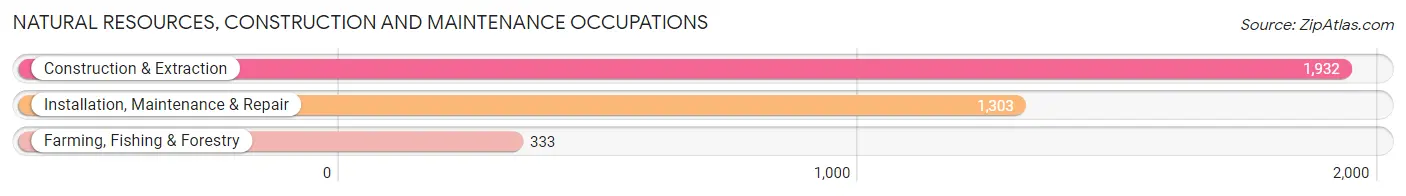
Natural Resources, Construction and Maintenance Occupations by Sex
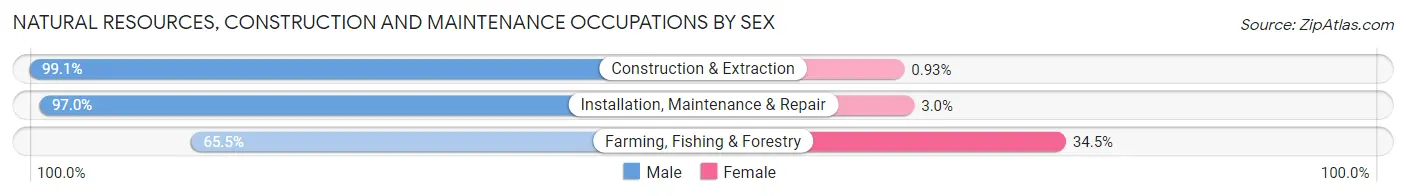
| Occupation | Male | Female |
| Farming, Fishing & Forestry | 218 (65.5%) | 115 (34.5%) |
| Construction & Extraction | 1,914 (99.1%) | 18 (0.9%) |
| Installation, Maintenance & Repair | 1,264 (97.0%) | 39 (3.0%) |
| Total (Category) | 3,396 (95.2%) | 172 (4.8%) |
| Total (Overall) | 23,676 (51.1%) | 22,678 (48.9%) |
Production, Transportation and Moving Occupations
The most common Production, Transportation and Moving occupations in Grafton County are Production (2,838 | 6.1%), Transportation (1,183 | 2.5%), and Material Moving (965 | 2.1%).
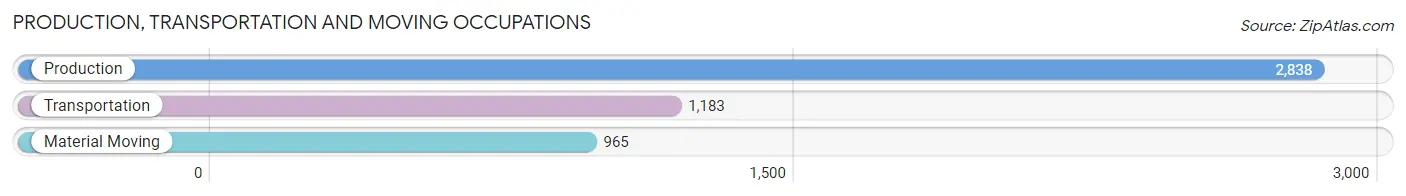
Production, Transportation and Moving Occupations by Sex
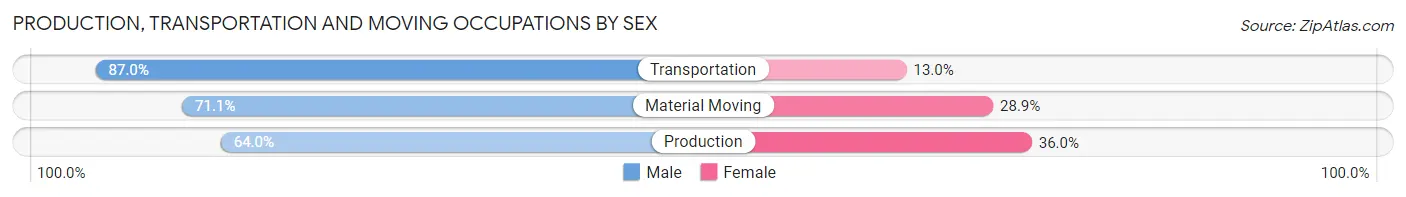
| Occupation | Male | Female |
| Production | 1,816 (64.0%) | 1,022 (36.0%) |
| Transportation | 1,029 (87.0%) | 154 (13.0%) |
| Material Moving | 686 (71.1%) | 279 (28.9%) |
| Total (Category) | 3,531 (70.8%) | 1,455 (29.2%) |
| Total (Overall) | 23,676 (51.1%) | 22,678 (48.9%) |
Employment Industries by Sex in Grafton County
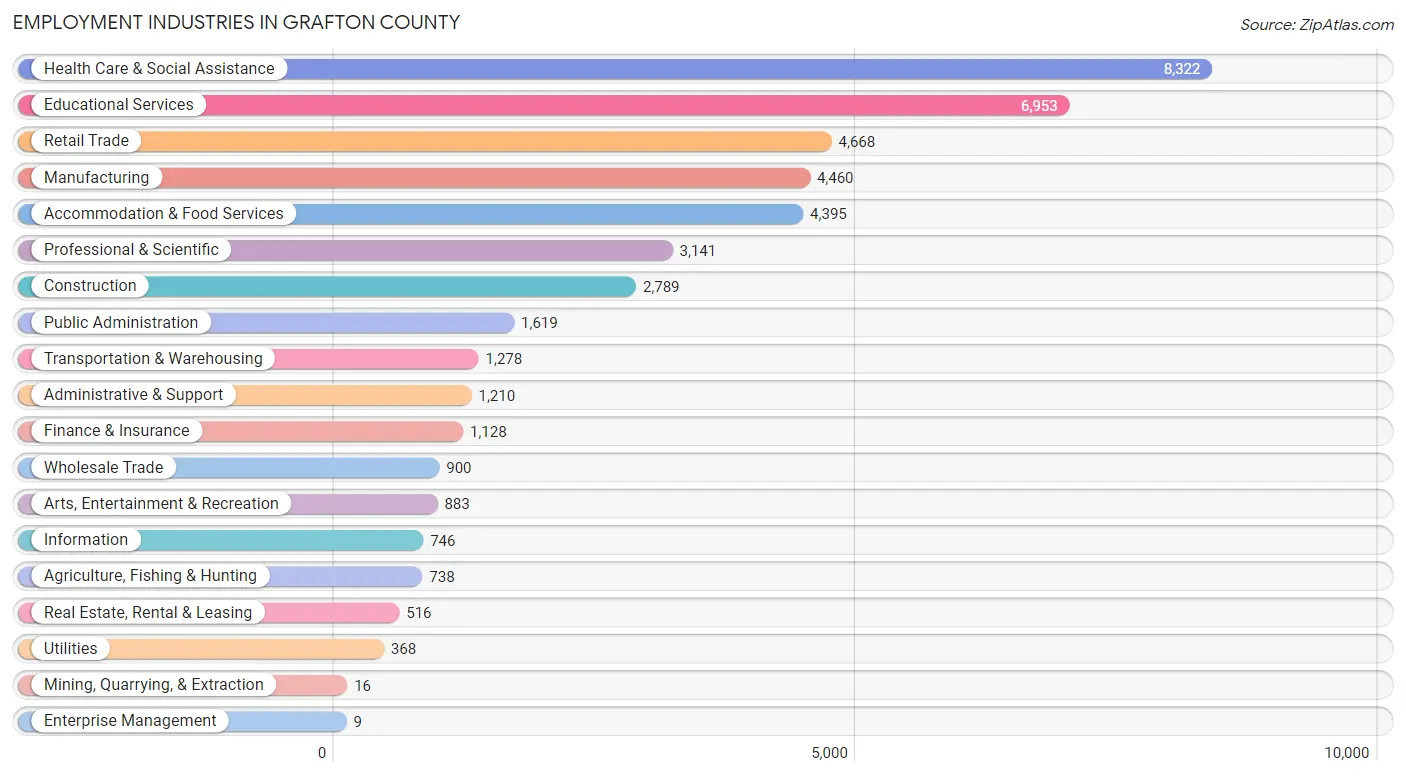
Employment Industries in Grafton County
The major employment industries in Grafton County include Health Care & Social Assistance (8,322 | 17.9%), Educational Services (6,953 | 15.0%), Retail Trade (4,668 | 10.1%), Manufacturing (4,460 | 9.6%), and Accommodation & Food Services (4,395 | 9.5%).
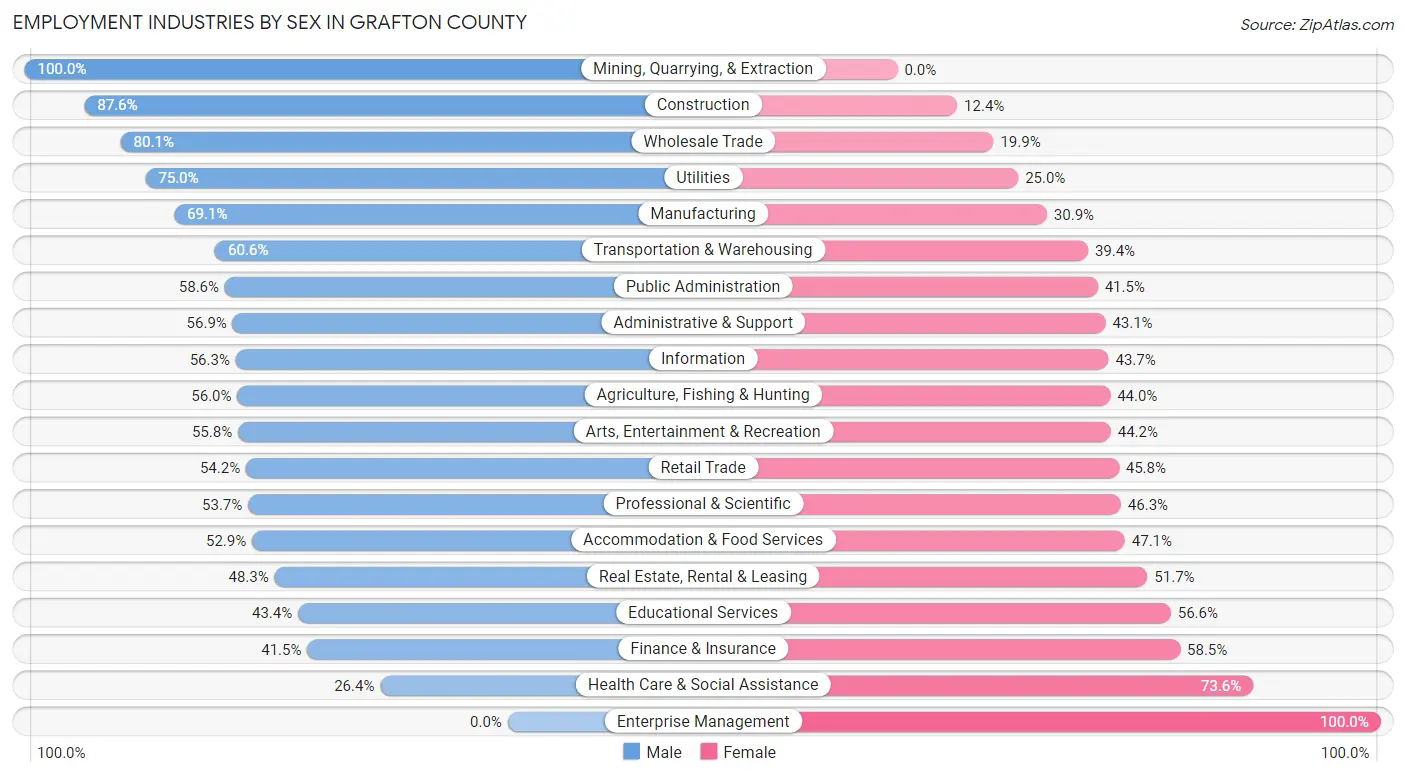
Employment Industries by Sex in Grafton County
The Grafton County industries that see more men than women are Mining, Quarrying, & Extraction (100.0%), Construction (87.6%), and Wholesale Trade (80.1%), whereas the industries that tend to have a higher number of women are Enterprise Management (100.0%), Health Care & Social Assistance (73.6%), and Finance & Insurance (58.5%).
| Industry | Male | Female |
| Agriculture, Fishing & Hunting | 413 (56.0%) | 325 (44.0%) |
| Mining, Quarrying, & Extraction | 16 (100.0%) | 0 (0.0%) |
| Construction | 2,444 (87.6%) | 345 (12.4%) |
| Manufacturing | 3,080 (69.1%) | 1,380 (30.9%) |
| Wholesale Trade | 721 (80.1%) | 179 (19.9%) |
| Retail Trade | 2,529 (54.2%) | 2,139 (45.8%) |
| Transportation & Warehousing | 774 (60.6%) | 504 (39.4%) |
| Utilities | 276 (75.0%) | 92 (25.0%) |
| Information | 420 (56.3%) | 326 (43.7%) |
| Finance & Insurance | 468 (41.5%) | 660 (58.5%) |
| Real Estate, Rental & Leasing | 249 (48.3%) | 267 (51.7%) |
| Professional & Scientific | 1,688 (53.7%) | 1,453 (46.3%) |
| Enterprise Management | 0 (0.0%) | 9 (100.0%) |
| Administrative & Support | 689 (56.9%) | 521 (43.1%) |
| Educational Services | 3,018 (43.4%) | 3,935 (56.6%) |
| Health Care & Social Assistance | 2,196 (26.4%) | 6,126 (73.6%) |
| Arts, Entertainment & Recreation | 493 (55.8%) | 390 (44.2%) |
| Accommodation & Food Services | 2,326 (52.9%) | 2,069 (47.1%) |
| Public Administration | 948 (58.6%) | 671 (41.4%) |
| Total | 23,676 (51.1%) | 22,678 (48.9%) |
Education in Grafton County
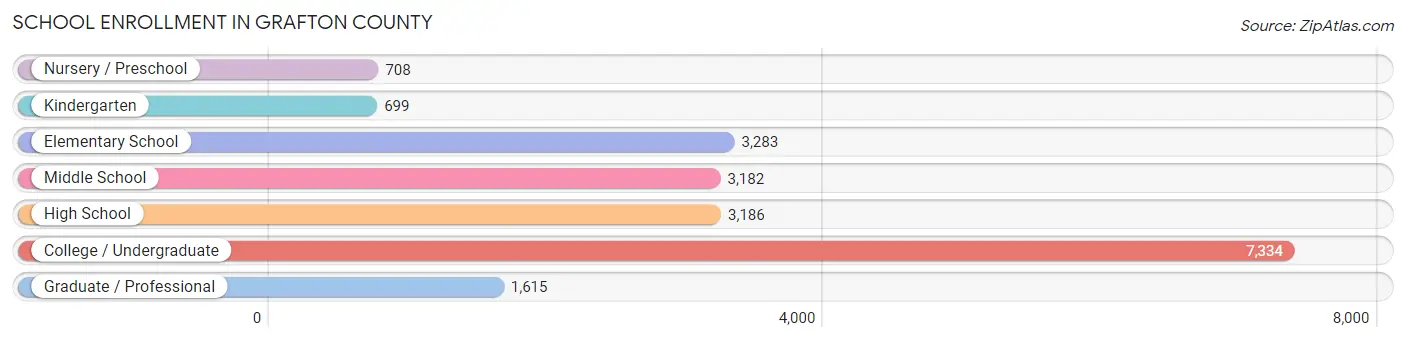
School Enrollment in Grafton County
The most common levels of schooling among the 20,007 students in Grafton County are college / undergraduate (7,334 | 36.7%), elementary school (3,283 | 16.4%), and high school (3,186 | 15.9%).
| School Level | # Students | % Students |
| Nursery / Preschool | 708 | 3.5% |
| Kindergarten | 699 | 3.5% |
| Elementary School | 3,283 | 16.4% |
| Middle School | 3,182 | 15.9% |
| High School | 3,186 | 15.9% |
| College / Undergraduate | 7,334 | 36.7% |
| Graduate / Professional | 1,615 | 8.1% |
| Total | 20,007 | 100.0% |
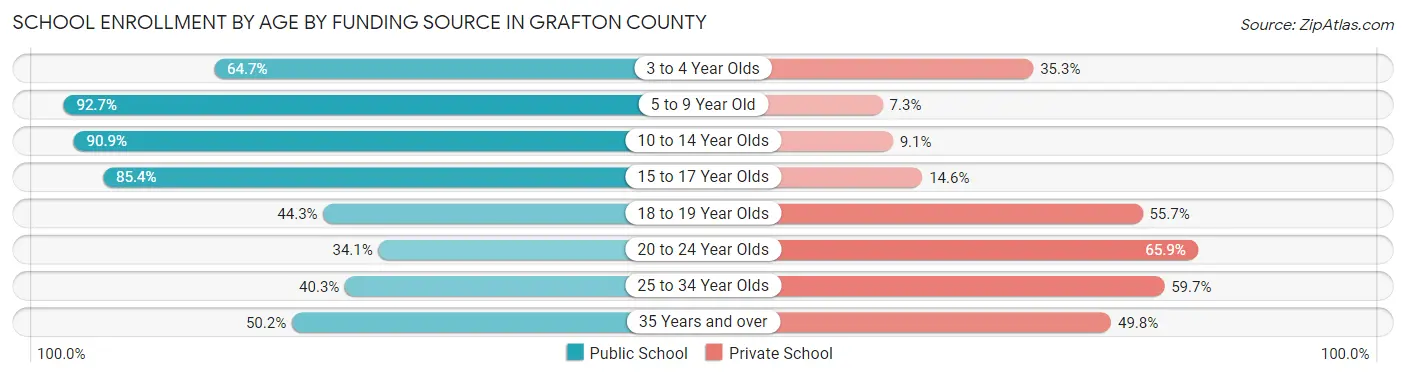
School Enrollment by Age by Funding Source in Grafton County
Out of a total of 20,007 students who are enrolled in schools in Grafton County, 6,622 (33.1%) attend a private institution, while the remaining 13,385 (66.9%) are enrolled in public schools. The age group of 20 to 24 year olds has the highest likelihood of being enrolled in private schools, with 2,204 (65.9% in the age bracket) enrolled. Conversely, the age group of 5 to 9 year old has the lowest likelihood of being enrolled in a private school, with 3,399 (92.7% in the age bracket) attending a public institution.
| Age Bracket | Public School | Private School |
| 3 to 4 Year Olds | 370 (64.7%) | 202 (35.3%) |
| 5 to 9 Year Old | 3,399 (92.7%) | 266 (7.3%) |
| 10 to 14 Year Olds | 3,727 (90.9%) | 375 (9.1%) |
| 15 to 17 Year Olds | 2,182 (85.4%) | 374 (14.6%) |
| 18 to 19 Year Olds | 1,594 (44.3%) | 2,001 (55.7%) |
| 20 to 24 Year Olds | 1,139 (34.1%) | 2,204 (65.9%) |
| 25 to 34 Year Olds | 465 (40.3%) | 689 (59.7%) |
| 35 Years and over | 512 (50.2%) | 508 (49.8%) |
| Total | 13,385 (66.9%) | 6,622 (33.1%) |
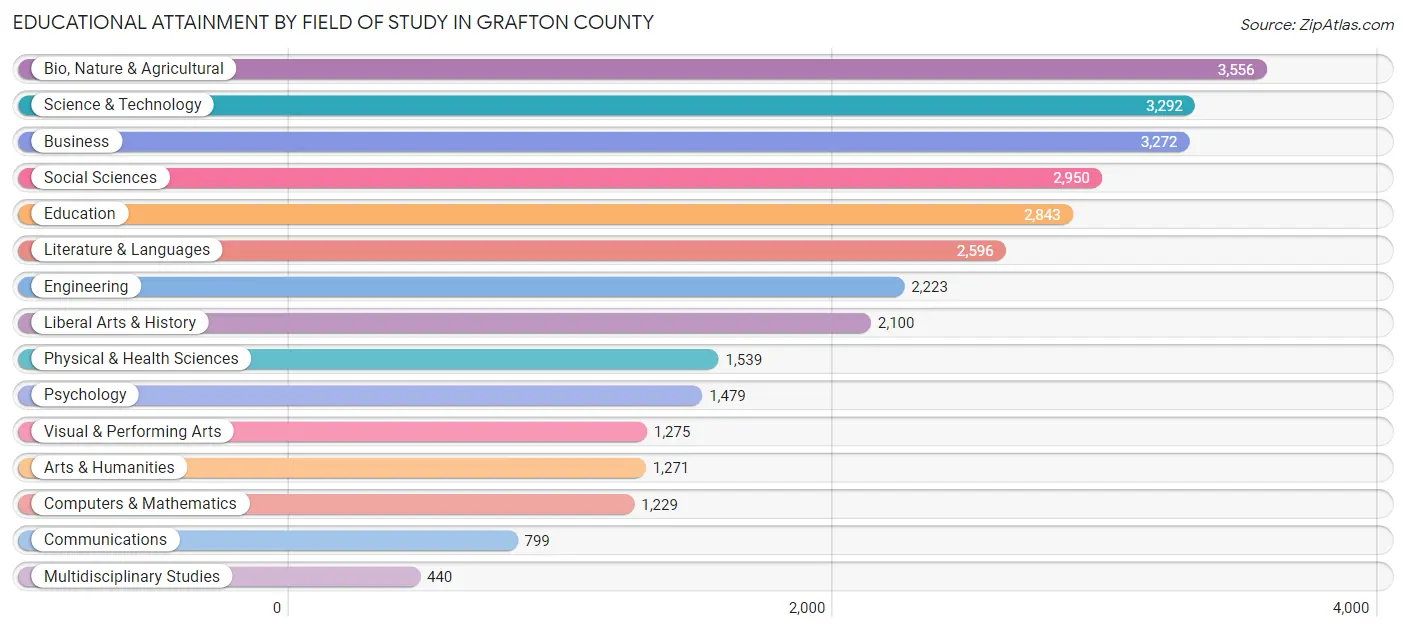
Educational Attainment by Field of Study in Grafton County
Bio, nature & agricultural (3,556 | 11.5%), science & technology (3,292 | 10.7%), business (3,272 | 10.6%), social sciences (2,950 | 9.6%), and education (2,843 | 9.2%) are the most common fields of study among 30,864 individuals in Grafton County who have obtained a bachelor's degree or higher.
| Field of Study | # Graduates | % Graduates |
| Computers & Mathematics | 1,229 | 4.0% |
| Bio, Nature & Agricultural | 3,556 | 11.5% |
| Physical & Health Sciences | 1,539 | 5.0% |
| Psychology | 1,479 | 4.8% |
| Social Sciences | 2,950 | 9.6% |
| Engineering | 2,223 | 7.2% |
| Multidisciplinary Studies | 440 | 1.4% |
| Science & Technology | 3,292 | 10.7% |
| Business | 3,272 | 10.6% |
| Education | 2,843 | 9.2% |
| Literature & Languages | 2,596 | 8.4% |
| Liberal Arts & History | 2,100 | 6.8% |
| Visual & Performing Arts | 1,275 | 4.1% |
| Communications | 799 | 2.6% |
| Arts & Humanities | 1,271 | 4.1% |
| Total | 30,864 | 100.0% |
Transportation & Commute in Grafton County
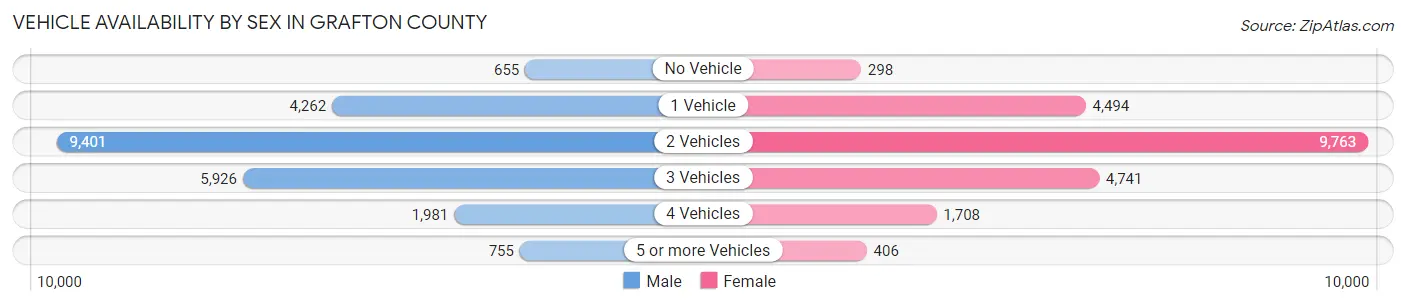
Vehicle Availability by Sex in Grafton County
The most prevalent vehicle ownership categories in Grafton County are males with 2 vehicles (9,401, accounting for 40.9%) and females with 2 vehicles (9,763, making up 43.9%).
| Vehicles Available | Male | Female |
| No Vehicle | 655 (2.9%) | 298 (1.4%) |
| 1 Vehicle | 4,262 (18.5%) | 4,494 (21.0%) |
| 2 Vehicles | 9,401 (40.9%) | 9,763 (45.6%) |
| 3 Vehicles | 5,926 (25.8%) | 4,741 (22.1%) |
| 4 Vehicles | 1,981 (8.6%) | 1,708 (8.0%) |
| 5 or more Vehicles | 755 (3.3%) | 406 (1.9%) |
| Total | 22,980 (100.0%) | 21,410 (100.0%) |
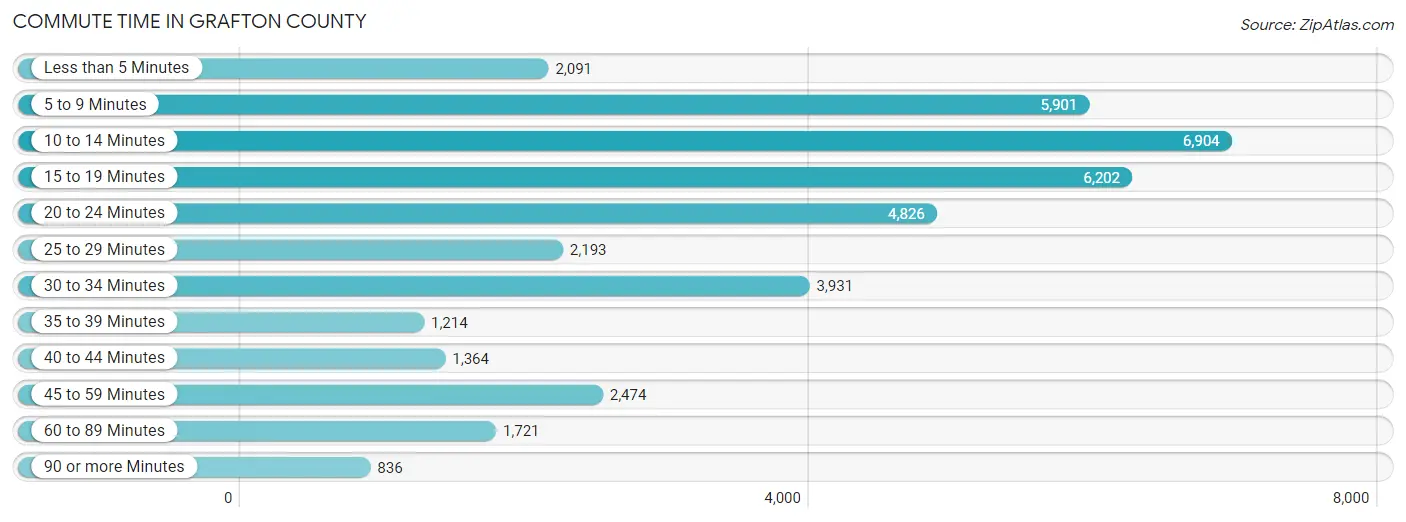
Commute Time in Grafton County
The most frequently occuring commute durations in Grafton County are 10 to 14 minutes (6,904 commuters, 17.4%), 15 to 19 minutes (6,202 commuters, 15.6%), and 5 to 9 minutes (5,901 commuters, 14.9%).
| Commute Time | # Commuters | % Commuters |
| Less than 5 Minutes | 2,091 | 5.3% |
| 5 to 9 Minutes | 5,901 | 14.9% |
| 10 to 14 Minutes | 6,904 | 17.4% |
| 15 to 19 Minutes | 6,202 | 15.6% |
| 20 to 24 Minutes | 4,826 | 12.2% |
| 25 to 29 Minutes | 2,193 | 5.5% |
| 30 to 34 Minutes | 3,931 | 9.9% |
| 35 to 39 Minutes | 1,214 | 3.1% |
| 40 to 44 Minutes | 1,364 | 3.4% |
| 45 to 59 Minutes | 2,474 | 6.2% |
| 60 to 89 Minutes | 1,721 | 4.3% |
| 90 or more Minutes | 836 | 2.1% |
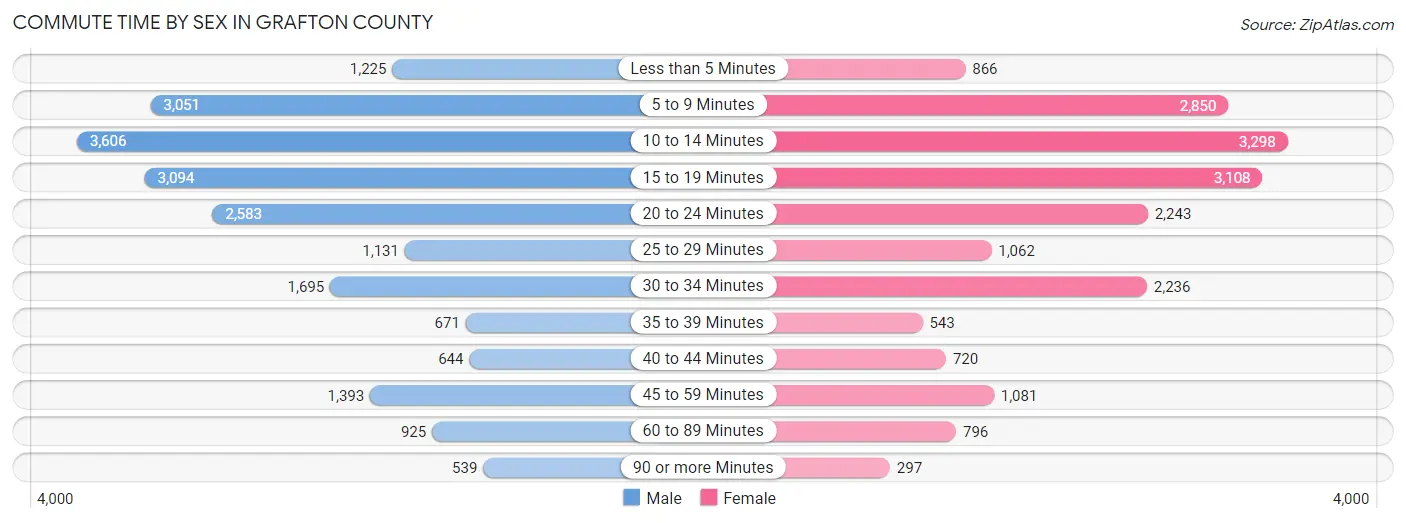
Commute Time by Sex in Grafton County
The most common commute times in Grafton County are 10 to 14 minutes (3,606 commuters, 17.5%) for males and 10 to 14 minutes (3,298 commuters, 17.3%) for females.
| Commute Time | Male | Female |
| Less than 5 Minutes | 1,225 (6.0%) | 866 (4.5%) |
| 5 to 9 Minutes | 3,051 (14.8%) | 2,850 (14.9%) |
| 10 to 14 Minutes | 3,606 (17.5%) | 3,298 (17.3%) |
| 15 to 19 Minutes | 3,094 (15.0%) | 3,108 (16.3%) |
| 20 to 24 Minutes | 2,583 (12.6%) | 2,243 (11.7%) |
| 25 to 29 Minutes | 1,131 (5.5%) | 1,062 (5.6%) |
| 30 to 34 Minutes | 1,695 (8.3%) | 2,236 (11.7%) |
| 35 to 39 Minutes | 671 (3.3%) | 543 (2.8%) |
| 40 to 44 Minutes | 644 (3.1%) | 720 (3.8%) |
| 45 to 59 Minutes | 1,393 (6.8%) | 1,081 (5.7%) |
| 60 to 89 Minutes | 925 (4.5%) | 796 (4.2%) |
| 90 or more Minutes | 539 (2.6%) | 297 (1.5%) |
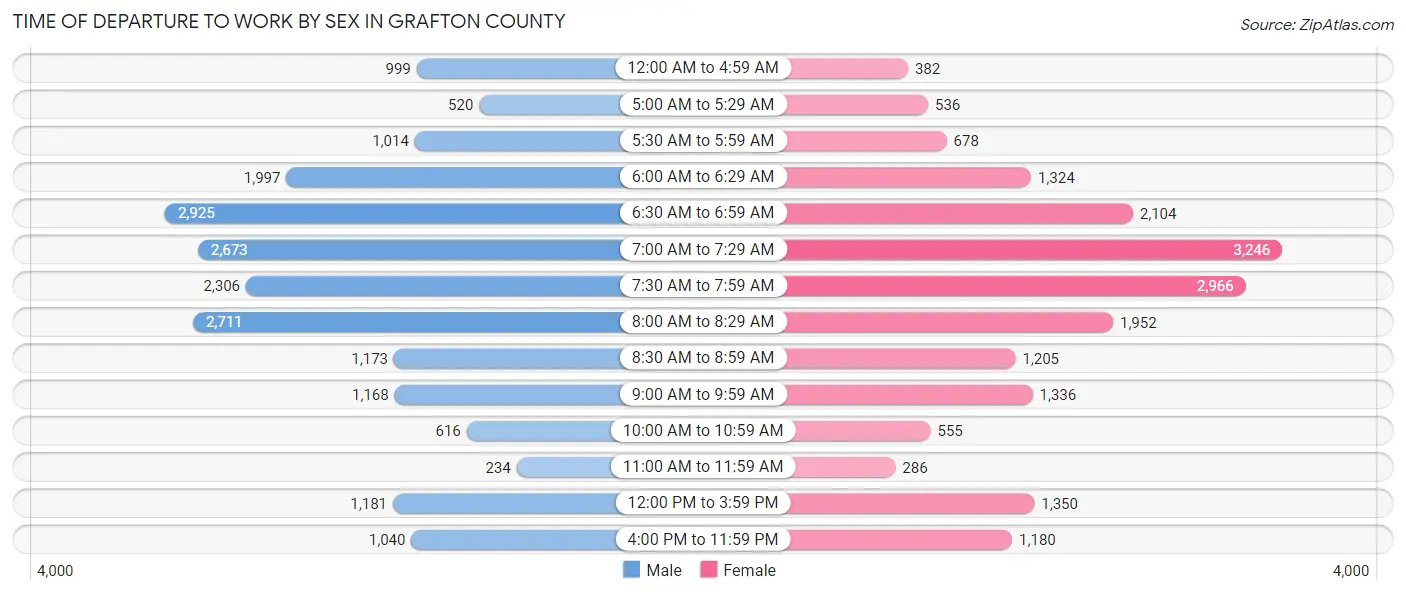
Time of Departure to Work by Sex in Grafton County
The most frequent times of departure to work in Grafton County are 6:30 AM to 6:59 AM (2,925, 14.2%) for males and 7:00 AM to 7:29 AM (3,246, 17.0%) for females.
| Time of Departure | Male | Female |
| 12:00 AM to 4:59 AM | 999 (4.9%) | 382 (2.0%) |
| 5:00 AM to 5:29 AM | 520 (2.5%) | 536 (2.8%) |
| 5:30 AM to 5:59 AM | 1,014 (4.9%) | 678 (3.5%) |
| 6:00 AM to 6:29 AM | 1,997 (9.7%) | 1,324 (6.9%) |
| 6:30 AM to 6:59 AM | 2,925 (14.2%) | 2,104 (11.0%) |
| 7:00 AM to 7:29 AM | 2,673 (13.0%) | 3,246 (17.0%) |
| 7:30 AM to 7:59 AM | 2,306 (11.2%) | 2,966 (15.5%) |
| 8:00 AM to 8:29 AM | 2,711 (13.2%) | 1,952 (10.2%) |
| 8:30 AM to 8:59 AM | 1,173 (5.7%) | 1,205 (6.3%) |
| 9:00 AM to 9:59 AM | 1,168 (5.7%) | 1,336 (7.0%) |
| 10:00 AM to 10:59 AM | 616 (3.0%) | 555 (2.9%) |
| 11:00 AM to 11:59 AM | 234 (1.1%) | 286 (1.5%) |
| 12:00 PM to 3:59 PM | 1,181 (5.8%) | 1,350 (7.1%) |
| 4:00 PM to 11:59 PM | 1,040 (5.1%) | 1,180 (6.2%) |
| Total | 20,557 (100.0%) | 19,100 (100.0%) |
Housing Occupancy in Grafton County
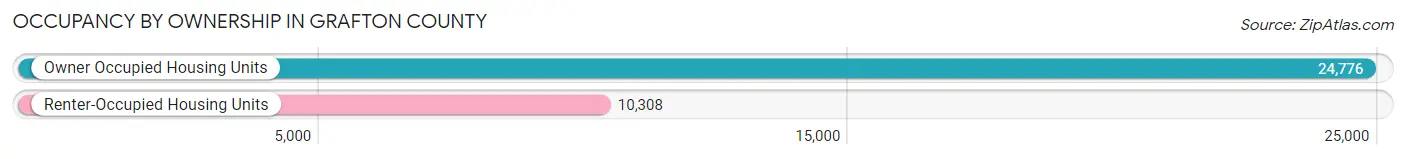
Occupancy by Ownership in Grafton County
Of the total 35,084 dwellings in Grafton County, owner-occupied units account for 24,776 (70.6%), while renter-occupied units make up 10,308 (29.4%).
| Occupancy | # Housing Units | % Housing Units |
| Owner Occupied Housing Units | 24,776 | 70.6% |
| Renter-Occupied Housing Units | 10,308 | 29.4% |
| Total Occupied Housing Units | 35,084 | 100.0% |
Occupancy by Household Size in Grafton County
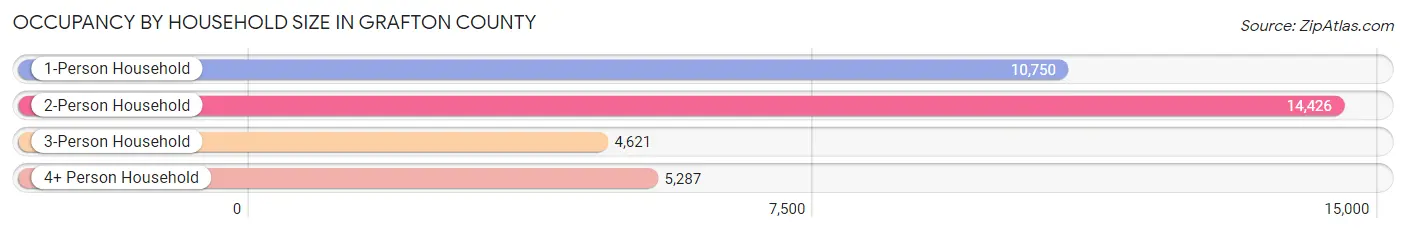
| Household Size | # Housing Units | % Housing Units |
| 1-Person Household | 10,750 | 30.6% |
| 2-Person Household | 14,426 | 41.1% |
| 3-Person Household | 4,621 | 13.2% |
| 4+ Person Household | 5,287 | 15.1% |
| Total Housing Units | 35,084 | 100.0% |
Occupancy by Ownership by Household Size in Grafton County
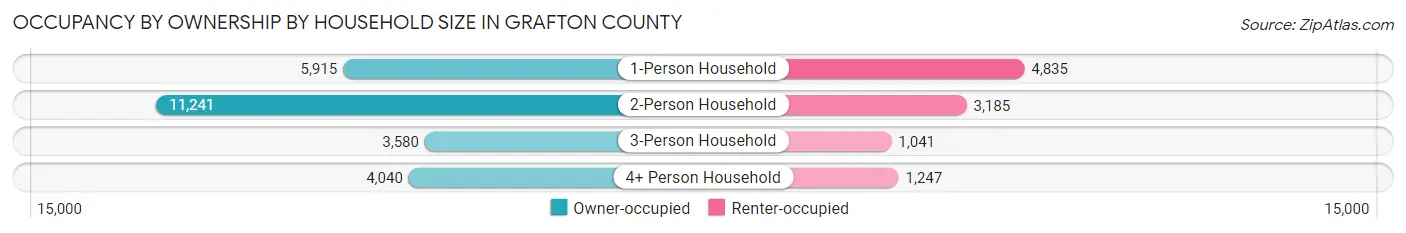
| Household Size | Owner-occupied | Renter-occupied |
| 1-Person Household | 5,915 (55.0%) | 4,835 (45.0%) |
| 2-Person Household | 11,241 (77.9%) | 3,185 (22.1%) |
| 3-Person Household | 3,580 (77.5%) | 1,041 (22.5%) |
| 4+ Person Household | 4,040 (76.4%) | 1,247 (23.6%) |
| Total Housing Units | 24,776 (70.6%) | 10,308 (29.4%) |
Occupancy by Educational Attainment in Grafton County
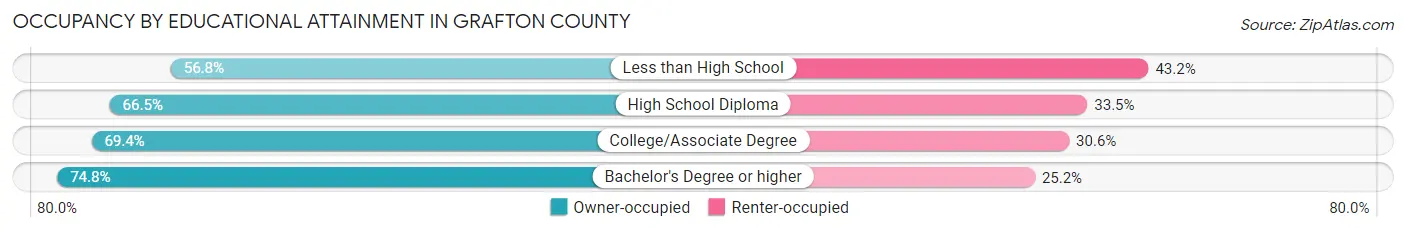
| Household Size | Owner-occupied | Renter-occupied |
| Less than High School | 976 (56.8%) | 742 (43.2%) |
| High School Diploma | 5,550 (66.5%) | 2,796 (33.5%) |
| College/Associate Degree | 5,993 (69.4%) | 2,644 (30.6%) |
| Bachelor's Degree or higher | 12,257 (74.8%) | 4,126 (25.2%) |
Occupancy by Age of Householder in Grafton County
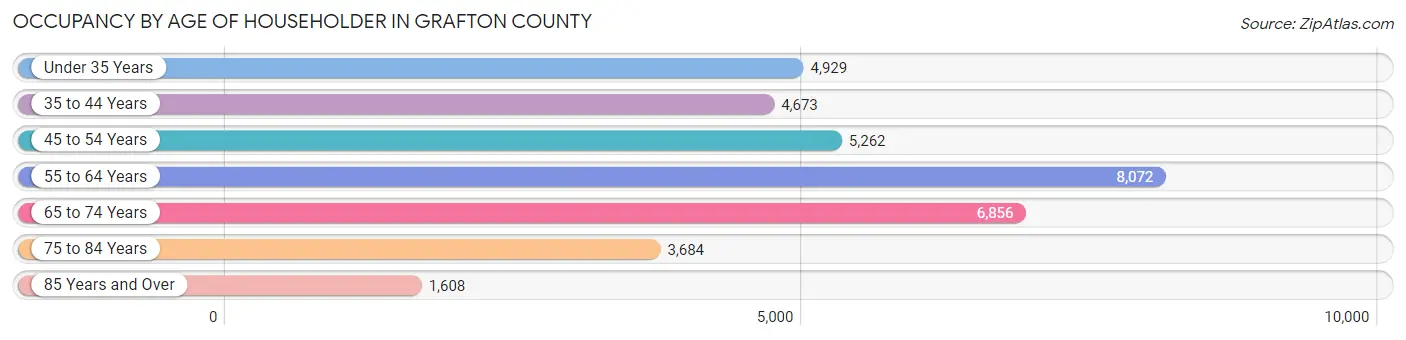
| Age Bracket | # Households | % Households |
| Under 35 Years | 4,929 | 14.1% |
| 35 to 44 Years | 4,673 | 13.3% |
| 45 to 54 Years | 5,262 | 15.0% |
| 55 to 64 Years | 8,072 | 23.0% |
| 65 to 74 Years | 6,856 | 19.5% |
| 75 to 84 Years | 3,684 | 10.5% |
| 85 Years and Over | 1,608 | 4.6% |
| Total | 35,084 | 100.0% |
Housing Finances in Grafton County
Median Income by Occupancy in Grafton County
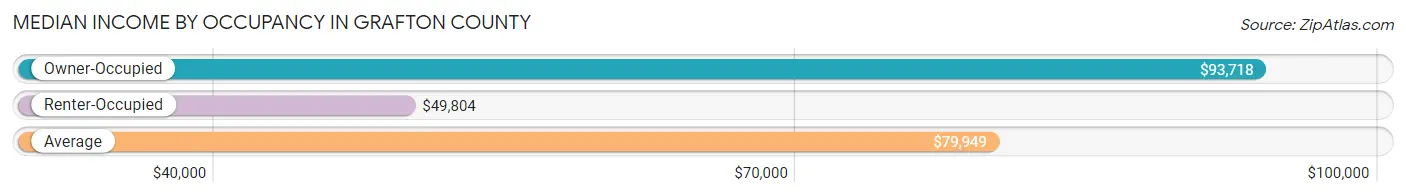
| Occupancy Type | # Households | Median Income |
| Owner-Occupied | 24,776 (70.6%) | $93,718 |
| Renter-Occupied | 10,308 (29.4%) | $49,804 |
| Average | 35,084 (100.0%) | $79,949 |
Occupancy by Householder Income Bracket in Grafton County
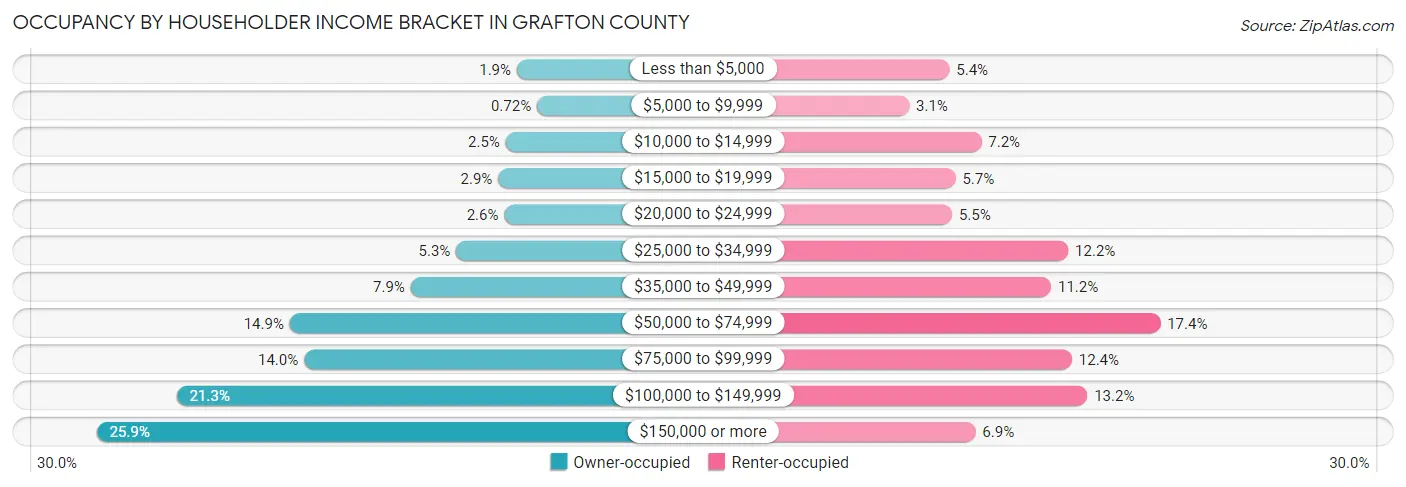
| Income Bracket | Owner-occupied | Renter-occupied |
| Less than $5,000 | 464 (1.9%) | 552 (5.4%) |
| $5,000 to $9,999 | 179 (0.7%) | 315 (3.1%) |
| $10,000 to $14,999 | 622 (2.5%) | 741 (7.2%) |
| $15,000 to $19,999 | 729 (2.9%) | 589 (5.7%) |
| $20,000 to $24,999 | 642 (2.6%) | 568 (5.5%) |
| $25,000 to $34,999 | 1,322 (5.3%) | 1,252 (12.1%) |
| $35,000 to $49,999 | 1,966 (7.9%) | 1,151 (11.2%) |
| $50,000 to $74,999 | 3,680 (14.8%) | 1,795 (17.4%) |
| $75,000 to $99,999 | 3,476 (14.0%) | 1,274 (12.4%) |
| $100,000 to $149,999 | 5,282 (21.3%) | 1,365 (13.2%) |
| $150,000 or more | 6,414 (25.9%) | 706 (6.9%) |
| Total | 24,776 (100.0%) | 10,308 (100.0%) |
Monthly Housing Cost Tiers in Grafton County
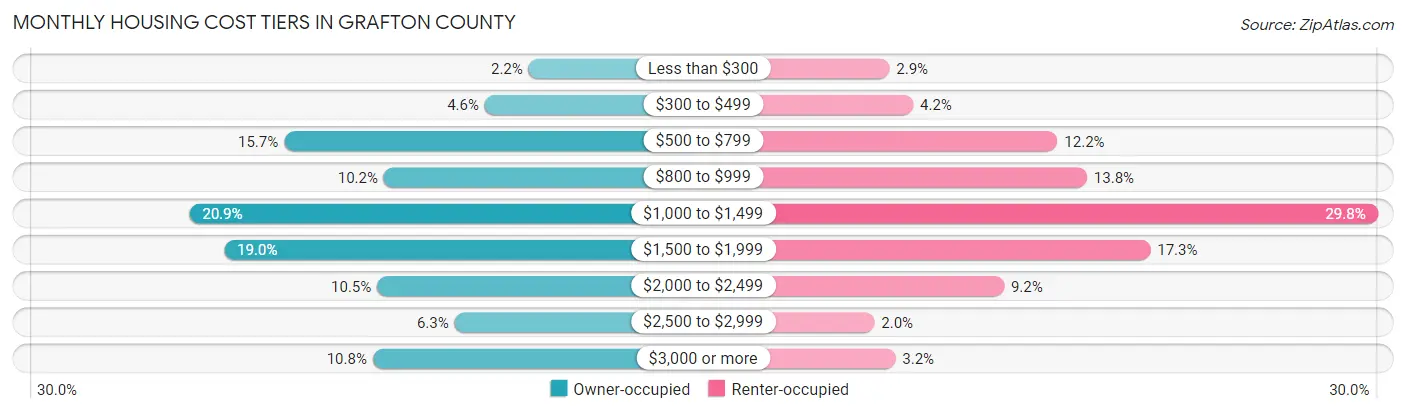
| Monthly Cost | Owner-occupied | Renter-occupied |
| Less than $300 | 534 (2.2%) | 296 (2.9%) |
| $300 to $499 | 1,135 (4.6%) | 431 (4.2%) |
| $500 to $799 | 3,882 (15.7%) | 1,252 (12.1%) |
| $800 to $999 | 2,517 (10.2%) | 1,420 (13.8%) |
| $1,000 to $1,499 | 5,178 (20.9%) | 3,075 (29.8%) |
| $1,500 to $1,999 | 4,702 (19.0%) | 1,781 (17.3%) |
| $2,000 to $2,499 | 2,610 (10.5%) | 948 (9.2%) |
| $2,500 to $2,999 | 1,549 (6.2%) | 210 (2.0%) |
| $3,000 or more | 2,669 (10.8%) | 330 (3.2%) |
| Total | 24,776 (100.0%) | 10,308 (100.0%) |
Physical Housing Characteristics in Grafton County
Housing Structures in Grafton County
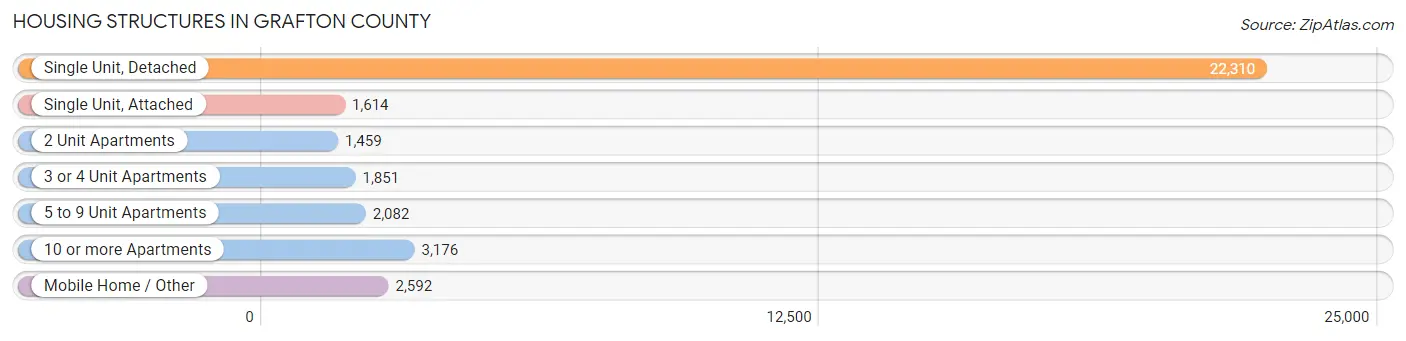
| Structure Type | # Housing Units | % Housing Units |
| Single Unit, Detached | 22,310 | 63.6% |
| Single Unit, Attached | 1,614 | 4.6% |
| 2 Unit Apartments | 1,459 | 4.2% |
| 3 or 4 Unit Apartments | 1,851 | 5.3% |
| 5 to 9 Unit Apartments | 2,082 | 5.9% |
| 10 or more Apartments | 3,176 | 9.0% |
| Mobile Home / Other | 2,592 | 7.4% |
| Total | 35,084 | 100.0% |
Housing Structures by Occupancy in Grafton County
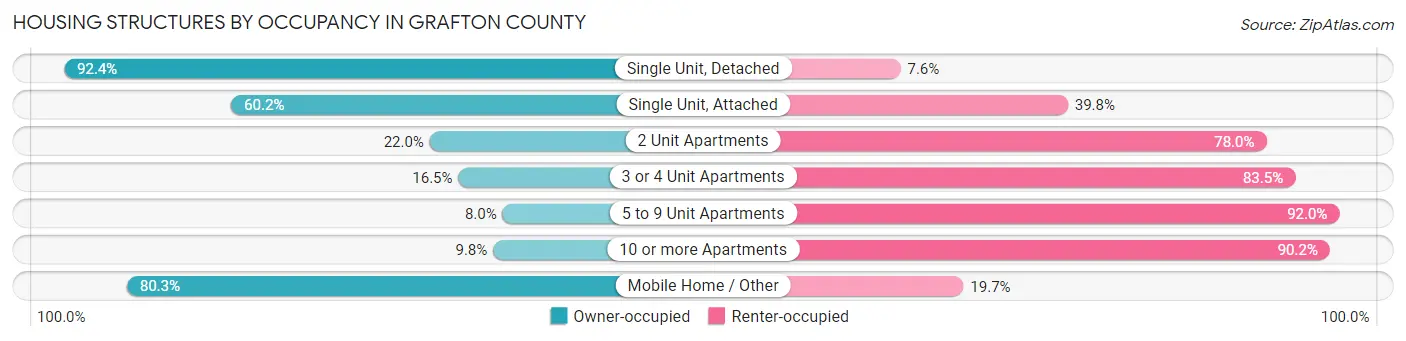
| Structure Type | Owner-occupied | Renter-occupied |
| Single Unit, Detached | 20,619 (92.4%) | 1,691 (7.6%) |
| Single Unit, Attached | 972 (60.2%) | 642 (39.8%) |
| 2 Unit Apartments | 321 (22.0%) | 1,138 (78.0%) |
| 3 or 4 Unit Apartments | 305 (16.5%) | 1,546 (83.5%) |
| 5 to 9 Unit Apartments | 166 (8.0%) | 1,916 (92.0%) |
| 10 or more Apartments | 311 (9.8%) | 2,865 (90.2%) |
| Mobile Home / Other | 2,082 (80.3%) | 510 (19.7%) |
| Total | 24,776 (70.6%) | 10,308 (29.4%) |
Housing Structures by Number of Rooms in Grafton County
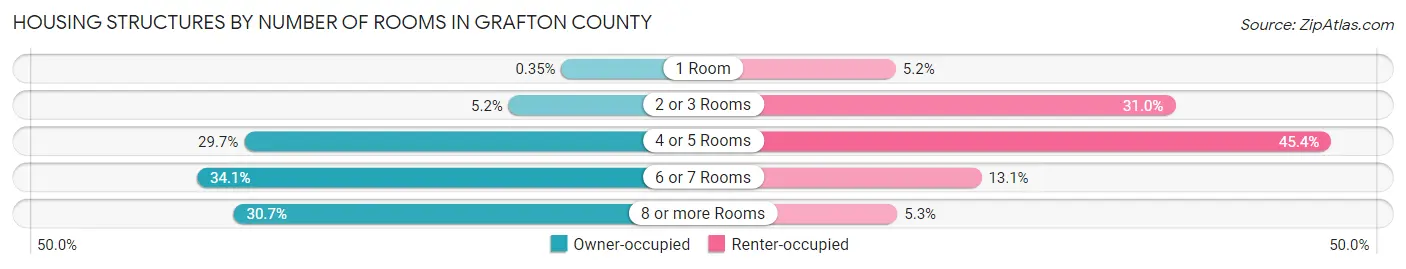
| Number of Rooms | Owner-occupied | Renter-occupied |
| 1 Room | 86 (0.4%) | 534 (5.2%) |
| 2 or 3 Rooms | 1,296 (5.2%) | 3,195 (31.0%) |
| 4 or 5 Rooms | 7,359 (29.7%) | 4,683 (45.4%) |
| 6 or 7 Rooms | 8,436 (34.1%) | 1,349 (13.1%) |
| 8 or more Rooms | 7,599 (30.7%) | 547 (5.3%) |
| Total | 24,776 (100.0%) | 10,308 (100.0%) |
Housing Structure by Heating Type in Grafton County
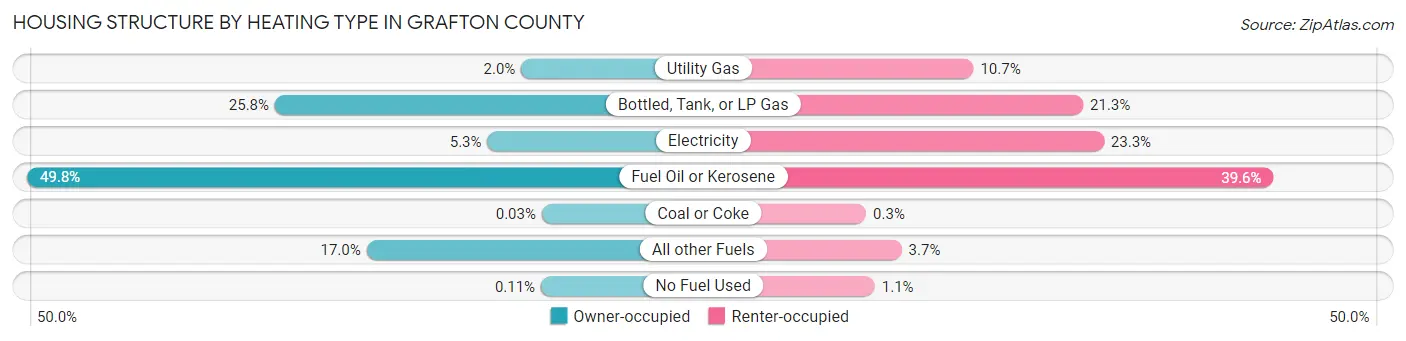
| Heating Type | Owner-occupied | Renter-occupied |
| Utility Gas | 500 (2.0%) | 1,100 (10.7%) |
| Bottled, Tank, or LP Gas | 6,398 (25.8%) | 2,191 (21.3%) |
| Electricity | 1,311 (5.3%) | 2,399 (23.3%) |
| Fuel Oil or Kerosene | 12,331 (49.8%) | 4,086 (39.6%) |
| Coal or Coke | 7 (0.0%) | 31 (0.3%) |
| All other Fuels | 4,202 (17.0%) | 384 (3.7%) |
| No Fuel Used | 27 (0.1%) | 117 (1.1%) |
| Total | 24,776 (100.0%) | 10,308 (100.0%) |
Household Vehicle Usage in Grafton County
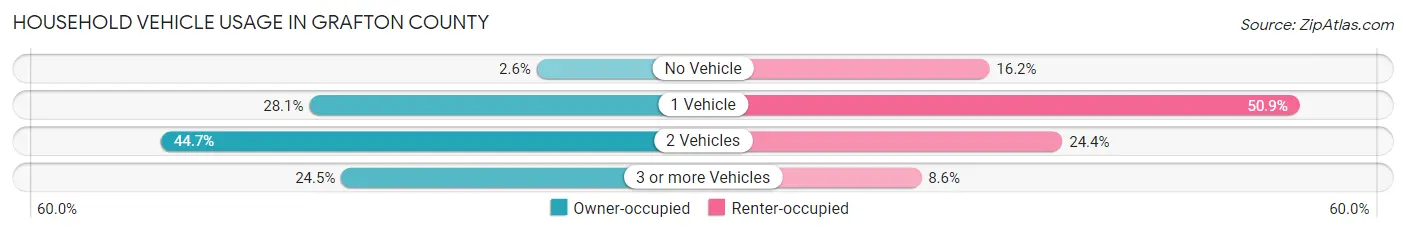
| Vehicles per Household | Owner-occupied | Renter-occupied |
| No Vehicle | 653 (2.6%) | 1,668 (16.2%) |
| 1 Vehicle | 6,964 (28.1%) | 5,249 (50.9%) |
| 2 Vehicles | 11,081 (44.7%) | 2,510 (24.3%) |
| 3 or more Vehicles | 6,078 (24.5%) | 881 (8.6%) |
| Total | 24,776 (100.0%) | 10,308 (100.0%) |
Real Estate & Mortgages in Grafton County
Real Estate and Mortgage Overview in Grafton County
| Characteristic | Without Mortgage | With Mortgage |
| Housing Units | 11,405 | 13,371 |
| Median Property Value | $264,200 | $279,100 |
| Median Household Income | $74,058 | $4,146 |
| Monthly Housing Costs | $847 | $2,481 |
| Real Estate Taxes | $4,983 | $180 |
Property Value by Mortgage Status in Grafton County
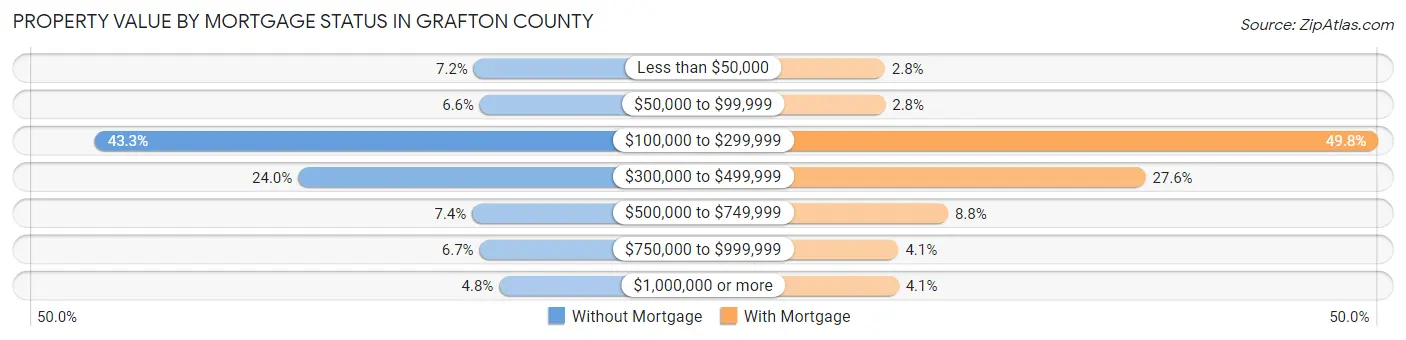
| Property Value | Without Mortgage | With Mortgage |
| Less than $50,000 | 825 (7.2%) | 373 (2.8%) |
| $50,000 to $99,999 | 757 (6.6%) | 378 (2.8%) |
| $100,000 to $299,999 | 4,940 (43.3%) | 6,655 (49.8%) |
| $300,000 to $499,999 | 2,732 (23.9%) | 3,692 (27.6%) |
| $500,000 to $749,999 | 842 (7.4%) | 1,176 (8.8%) |
| $750,000 to $999,999 | 762 (6.7%) | 547 (4.1%) |
| $1,000,000 or more | 547 (4.8%) | 550 (4.1%) |
| Total | 11,405 (100.0%) | 13,371 (100.0%) |
Household Income by Mortgage Status in Grafton County
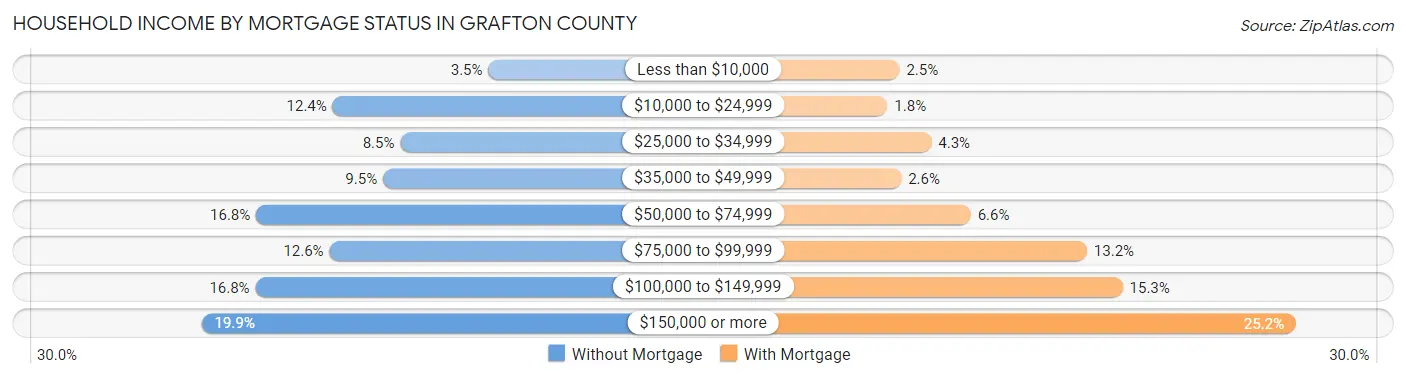
| Household Income | Without Mortgage | With Mortgage |
| Less than $10,000 | 399 (3.5%) | 336 (2.5%) |
| $10,000 to $24,999 | 1,414 (12.4%) | 244 (1.8%) |
| $25,000 to $34,999 | 973 (8.5%) | 579 (4.3%) |
| $35,000 to $49,999 | 1,086 (9.5%) | 349 (2.6%) |
| $50,000 to $74,999 | 1,913 (16.8%) | 880 (6.6%) |
| $75,000 to $99,999 | 1,435 (12.6%) | 1,767 (13.2%) |
| $100,000 to $149,999 | 1,917 (16.8%) | 2,041 (15.3%) |
| $150,000 or more | 2,268 (19.9%) | 3,365 (25.2%) |
| Total | 11,405 (100.0%) | 13,371 (100.0%) |
Property Value to Household Income Ratio in Grafton County
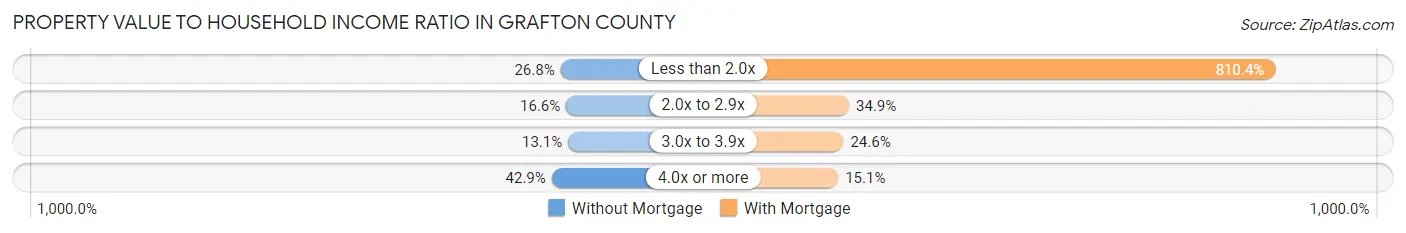
| Value-to-Income Ratio | Without Mortgage | With Mortgage |
| Less than 2.0x | 3,058 (26.8%) | 108,354 (810.4%) |
| 2.0x to 2.9x | 1,890 (16.6%) | 4,666 (34.9%) |
| 3.0x to 3.9x | 1,495 (13.1%) | 3,289 (24.6%) |
| 4.0x or more | 4,892 (42.9%) | 2,021 (15.1%) |
| Total | 11,405 (100.0%) | 13,371 (100.0%) |
Real Estate Taxes by Mortgage Status in Grafton County
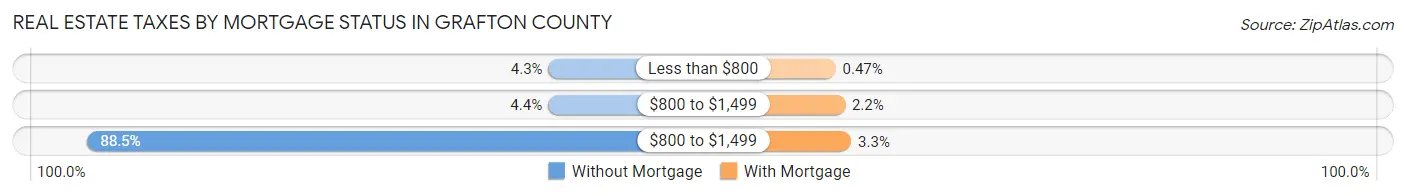
| Property Taxes | Without Mortgage | With Mortgage |
| Less than $800 | 493 (4.3%) | 63 (0.5%) |
| $800 to $1,499 | 502 (4.4%) | 292 (2.2%) |
| $800 to $1,499 | 10,097 (88.5%) | 443 (3.3%) |
| Total | 11,405 (100.0%) | 13,371 (100.0%) |
Health & Disability in Grafton County
Health Insurance Coverage by Age in Grafton County
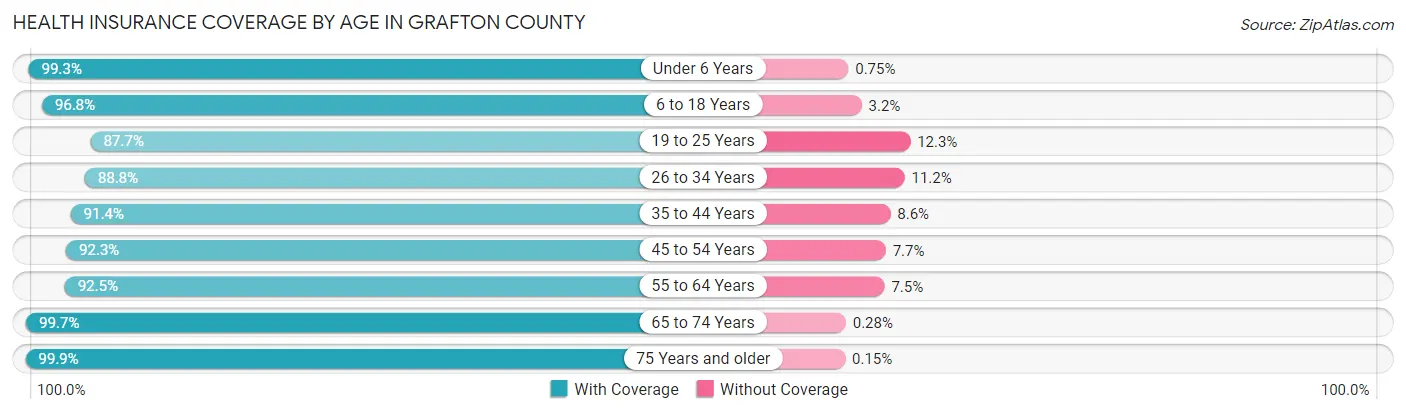
| Age Bracket | With Coverage | Without Coverage |
| Under 6 Years | 4,217 (99.3%) | 32 (0.7%) |
| 6 to 18 Years | 11,854 (96.8%) | 394 (3.2%) |
| 19 to 25 Years | 9,006 (87.7%) | 1,262 (12.3%) |
| 26 to 34 Years | 8,559 (88.8%) | 1,084 (11.2%) |
| 35 to 44 Years | 8,936 (91.4%) | 840 (8.6%) |
| 45 to 54 Years | 9,599 (92.3%) | 803 (7.7%) |
| 55 to 64 Years | 12,926 (92.5%) | 1,047 (7.5%) |
| 65 to 74 Years | 11,512 (99.7%) | 32 (0.3%) |
| 75 Years and older | 7,833 (99.9%) | 12 (0.2%) |
| Total | 84,442 (93.9%) | 5,506 (6.1%) |
Health Insurance Coverage by Citizenship Status in Grafton County
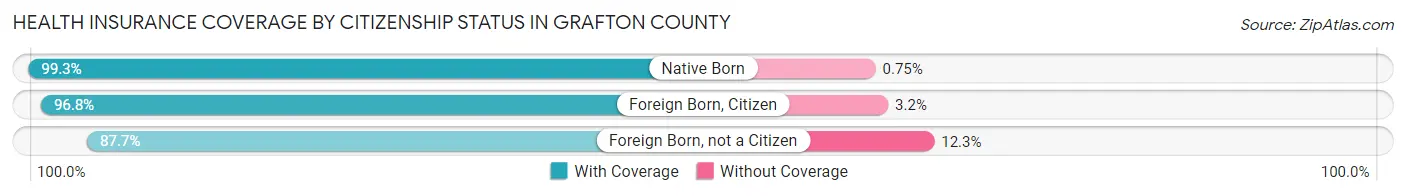
| Citizenship Status | With Coverage | Without Coverage |
| Native Born | 4,217 (99.3%) | 32 (0.7%) |
| Foreign Born, Citizen | 11,854 (96.8%) | 394 (3.2%) |
| Foreign Born, not a Citizen | 9,006 (87.7%) | 1,262 (12.3%) |
Health Insurance Coverage by Household Income in Grafton County
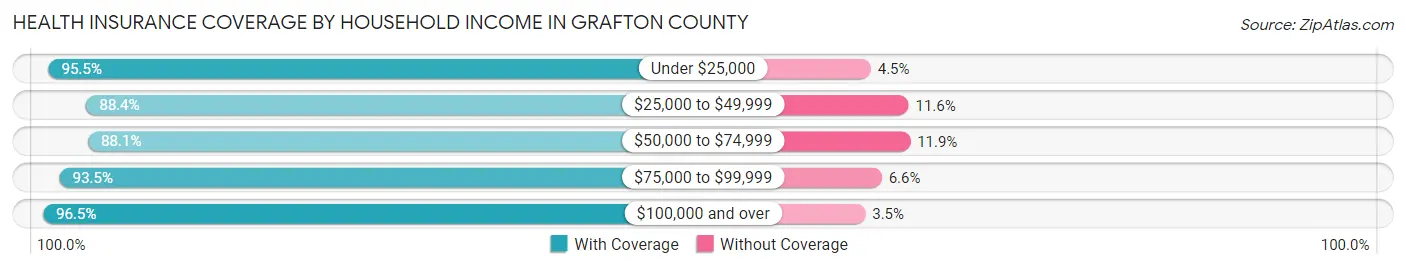
| Household Income | With Coverage | Without Coverage |
| Under $25,000 | 7,762 (95.5%) | 366 (4.5%) |
| $25,000 to $49,999 | 9,620 (88.4%) | 1,259 (11.6%) |
| $50,000 to $74,999 | 11,560 (88.1%) | 1,559 (11.9%) |
| $75,000 to $99,999 | 11,734 (93.4%) | 822 (6.6%) |
| $100,000 and over | 38,285 (96.5%) | 1,372 (3.5%) |
Public vs Private Health Insurance Coverage by Age in Grafton County
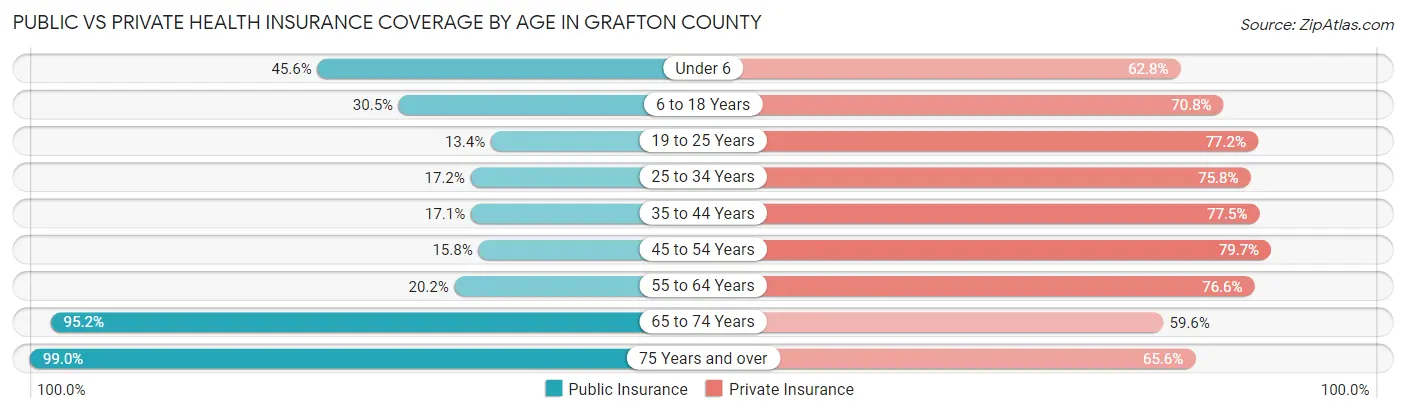
| Age Bracket | Public Insurance | Private Insurance |
| Under 6 | 1,939 (45.6%) | 2,669 (62.8%) |
| 6 to 18 Years | 3,738 (30.5%) | 8,675 (70.8%) |
| 19 to 25 Years | 1,379 (13.4%) | 7,927 (77.2%) |
| 25 to 34 Years | 1,661 (17.2%) | 7,310 (75.8%) |
| 35 to 44 Years | 1,675 (17.1%) | 7,574 (77.5%) |
| 45 to 54 Years | 1,638 (15.8%) | 8,285 (79.6%) |
| 55 to 64 Years | 2,822 (20.2%) | 10,698 (76.6%) |
| 65 to 74 Years | 10,985 (95.2%) | 6,874 (59.6%) |
| 75 Years and over | 7,767 (99.0%) | 5,143 (65.6%) |
| Total | 33,604 (37.4%) | 65,155 (72.4%) |
Disability Status by Sex by Age in Grafton County
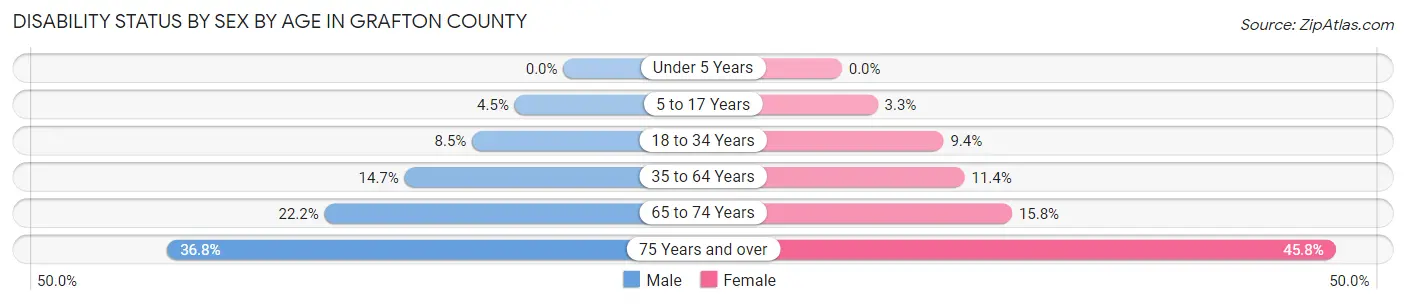
| Age Bracket | Male | Female |
| Under 5 Years | 0 (0.0%) | 0 (0.0%) |
| 5 to 17 Years | 253 (4.5%) | 176 (3.3%) |
| 18 to 34 Years | 949 (8.5%) | 1,009 (9.4%) |
| 35 to 64 Years | 2,495 (14.7%) | 1,960 (11.4%) |
| 65 to 74 Years | 1,271 (22.2%) | 917 (15.8%) |
| 75 Years and over | 1,276 (36.8%) | 2,004 (45.8%) |
Disability Class by Sex by Age in Grafton County
Disability Class: Hearing Difficulty
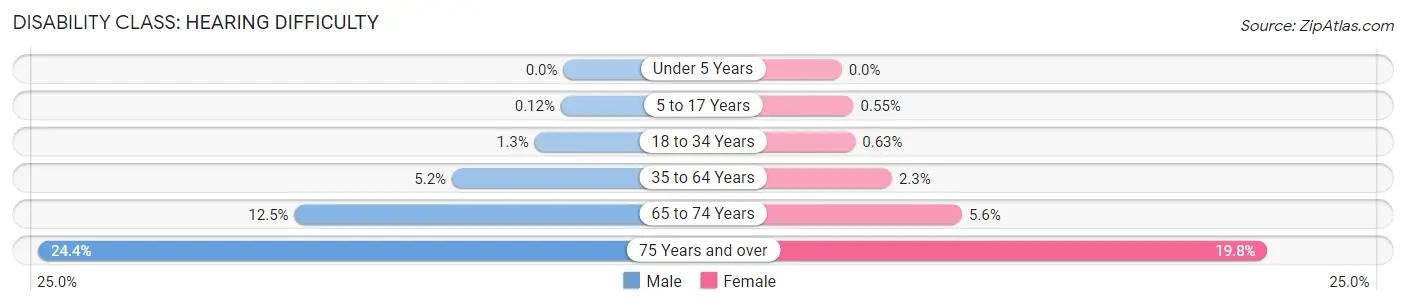
| Age Bracket | Male | Female |
| Under 5 Years | 0 (0.0%) | 0 (0.0%) |
| 5 to 17 Years | 7 (0.1%) | 29 (0.5%) |
| 18 to 34 Years | 150 (1.3%) | 67 (0.6%) |
| 35 to 64 Years | 876 (5.2%) | 401 (2.3%) |
| 65 to 74 Years | 716 (12.5%) | 324 (5.6%) |
| 75 Years and over | 846 (24.4%) | 864 (19.8%) |
Disability Class: Vision Difficulty
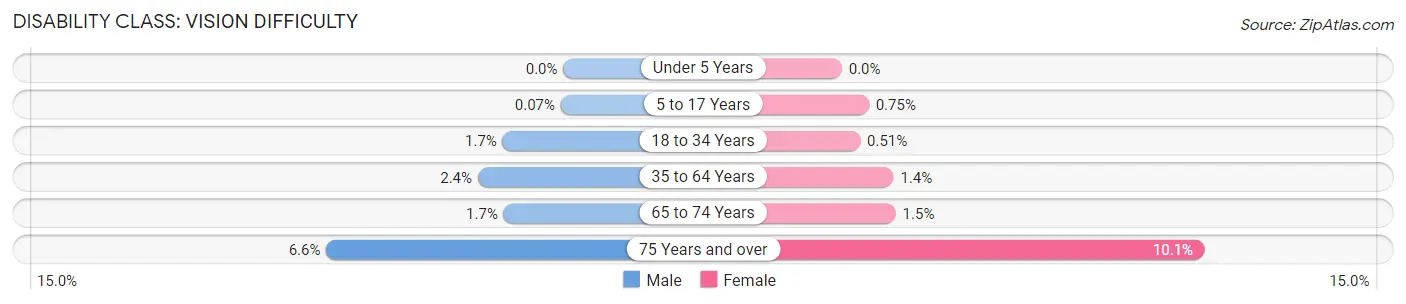
| Age Bracket | Male | Female |
| Under 5 Years | 0 (0.0%) | 0 (0.0%) |
| 5 to 17 Years | 4 (0.1%) | 40 (0.7%) |
| 18 to 34 Years | 190 (1.7%) | 55 (0.5%) |
| 35 to 64 Years | 404 (2.4%) | 247 (1.4%) |
| 65 to 74 Years | 95 (1.7%) | 87 (1.5%) |
| 75 Years and over | 229 (6.6%) | 442 (10.1%) |
Disability Class: Cognitive Difficulty
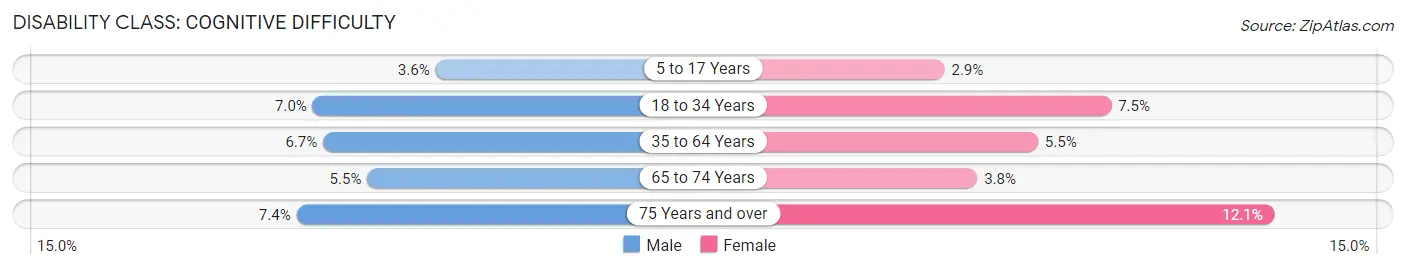
| Age Bracket | Male | Female |
| 5 to 17 Years | 200 (3.6%) | 152 (2.9%) |
| 18 to 34 Years | 783 (7.0%) | 802 (7.5%) |
| 35 to 64 Years | 1,134 (6.7%) | 939 (5.5%) |
| 65 to 74 Years | 313 (5.5%) | 219 (3.8%) |
| 75 Years and over | 258 (7.4%) | 527 (12.0%) |
Disability Class: Ambulatory Difficulty
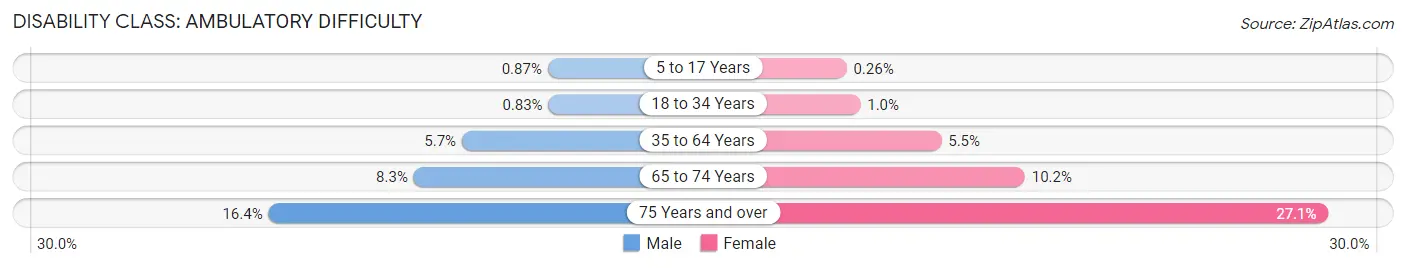
| Age Bracket | Male | Female |
| 5 to 17 Years | 49 (0.9%) | 14 (0.3%) |
| 18 to 34 Years | 93 (0.8%) | 110 (1.0%) |
| 35 to 64 Years | 958 (5.7%) | 953 (5.5%) |
| 65 to 74 Years | 478 (8.3%) | 592 (10.2%) |
| 75 Years and over | 570 (16.4%) | 1,185 (27.1%) |
Disability Class: Self-Care Difficulty
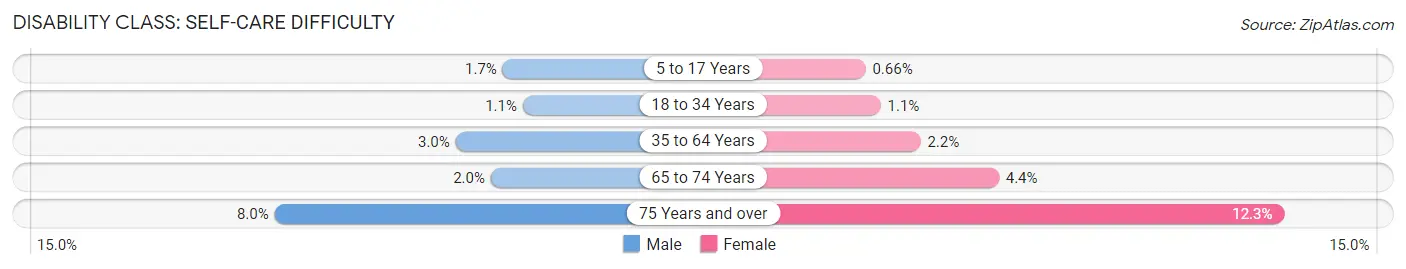
| Age Bracket | Male | Female |
| 5 to 17 Years | 95 (1.7%) | 35 (0.7%) |
| 18 to 34 Years | 127 (1.1%) | 115 (1.1%) |
| 35 to 64 Years | 508 (3.0%) | 377 (2.2%) |
| 65 to 74 Years | 116 (2.0%) | 254 (4.4%) |
| 75 Years and over | 279 (8.0%) | 539 (12.3%) |
Technology Access in Grafton County
Computing Device Access in Grafton County
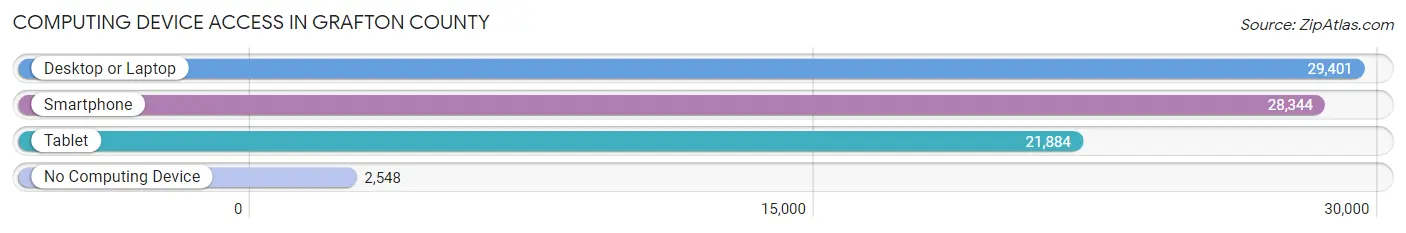
| Device Type | # Households | % Households |
| Desktop or Laptop | 29,401 | 83.8% |
| Smartphone | 28,344 | 80.8% |
| Tablet | 21,884 | 62.4% |
| No Computing Device | 2,548 | 7.3% |
| Total | 35,084 | 100.0% |
Internet Access in Grafton County
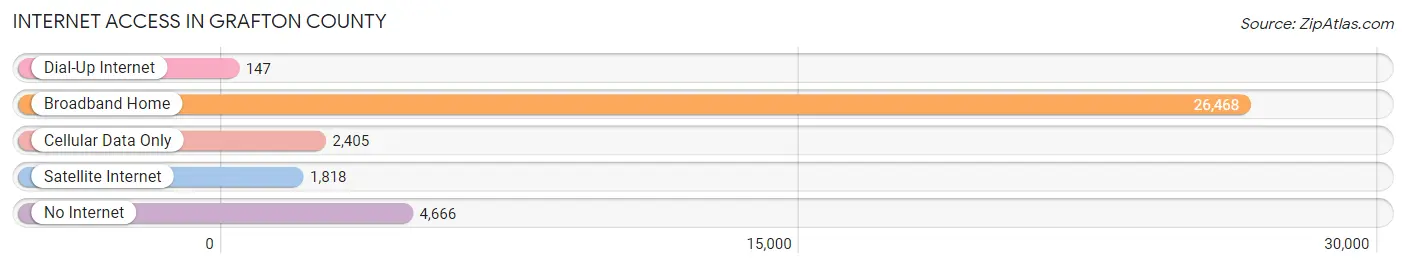
| Internet Type | # Households | % Households |
| Dial-Up Internet | 147 | 0.4% |
| Broadband Home | 26,468 | 75.4% |
| Cellular Data Only | 2,405 | 6.9% |
| Satellite Internet | 1,818 | 5.2% |
| No Internet | 4,666 | 13.3% |
| Total | 35,084 | 100.0% |
Grafton County Summary
Grafton County is located in the northern part of New Hampshire, and is the fifth largest county in the state. It is bordered by the Connecticut River to the west, the White Mountains to the north, and the Merrimack River to the east. The county seat is the city of Haverhill, and the largest city is Lebanon.
Grafton County was established in 1769, and was named after Augustus Henry Fitzroy, 3rd Duke of Grafton. The county was originally part of the Province of New Hampshire, and was one of the original counties of the state.
Geography
Grafton County covers an area of 1,750 square miles, and is the fifth largest county in New Hampshire. The terrain is mostly mountainous, with the White Mountains to the north and the Green Mountains to the south. The highest point in the county is Mount Moosilauke, which has an elevation of 4,802 feet. The county is also home to several rivers, including the Connecticut, Ammonoosuc, and Pemigewasset.
The climate of Grafton County is generally temperate, with cold winters and warm summers. The average annual temperature is around 40 degrees Fahrenheit, and the average annual precipitation is around 40 inches.
Economy
Grafton County has a diverse economy, with a mix of manufacturing, agriculture, and tourism. The county is home to several large companies, including Dartmouth-Hitchcock Medical Center, Mascoma Bank, and the New Hampshire Motor Speedway.
Agriculture is an important part of the economy, with dairy farming being the primary activity. Other agricultural products include apples, potatoes, and hay.
Tourism is also an important part of the economy, with the White Mountains and the Appalachian Trail being popular destinations. The county is also home to several ski resorts, including Loon Mountain and Cannon Mountain.
Demographics
As of the 2010 census, Grafton County had a population of 89,181. The population is mostly white (94.2%), with small percentages of African Americans (1.2%), Asians (1.2%), and Native Americans (0.4%). The median household income is $60,945, and the median age is 42.
Conclusion
Grafton County is a large county in northern New Hampshire, with a diverse economy and a population of 89,181. The county is home to several large companies, and is a popular destination for tourists. Agriculture and tourism are important parts of the economy, and the county is home to several ski resorts and the White Mountains. The population is mostly white, with small percentages of African Americans, Asians, and Native Americans.
Common Questions
What is Per Capita Income in Grafton County?
Per Capita income in Grafton County is $47,080.
What is the Median Family Income in Grafton County?
Median Family Income in Grafton County is $99,902.
What is the Median Household income in Grafton County?
Median Household Income in Grafton County is $79,949.
What is Income or Wage Gap in Grafton County?
Income or Wage Gap in Grafton County is 24.0%.
Women in Grafton County earn 76.0 cents for every dollar earned by a man.
What is Family Income Deficit in Grafton County?
Family Income Deficit in Grafton County is $10,242.
Families that are below poverty line in Grafton County earn $10,242 less on average than the poverty threshold level.
What is Inequality or Gini Index in Grafton County?
Inequality or Gini Index in Grafton County is 0.49.
What is the Total Population of Grafton County?
Total Population of Grafton County is 90,836.
What is the Total Male Population of Grafton County?
Total Male Population of Grafton County is 45,104.
What is the Total Female Population of Grafton County?
Total Female Population of Grafton County is 45,732.
What is the Ratio of Males per 100 Females in Grafton County?
There are 98.63 Males per 100 Females in Grafton County.
What is the Ratio of Females per 100 Males in Grafton County?
There are 101.39 Females per 100 Males in Grafton County.
What is the Median Population Age in Grafton County?
Median Population Age in Grafton County is 44.1 Years.
What is the Average Family Size in Grafton County
Average Family Size in Grafton County is 3.0 People.
What is the Average Household Size in Grafton County
Average Household Size in Grafton County is 2.4 People.
How Large is the Labor Force in Grafton County?
There are 47,690 People in the Labor Forcein in Grafton County.
What is the Percentage of People in the Labor Force in Grafton County?
60.9% of People are in the Labor Force in Grafton County.
What is the Unemployment Rate in Grafton County?
Unemployment Rate in Grafton County is 2.8%.