Lebanon, NH Map & Demographics
Lebanon Map
Lebanon Overview
$51,134
PER CAPITA INCOME
$110,303
AVG FAMILY INCOME
$90,911
AVG HOUSEHOLD INCOME
10.2%
WAGE / INCOME GAP [ % ]
89.8¢/ $1
WAGE / INCOME GAP [ $ ]
0.44
INEQUALITY / GINI INDEX
14,515
TOTAL POPULATION
6,992
MALE POPULATION
7,523
FEMALE POPULATION
92.94
MALES / 100 FEMALES
107.59
FEMALES / 100 MALES
38.5
MEDIAN AGE
3.1
AVG FAMILY SIZE
2.3
AVG HOUSEHOLD SIZE
8,922
LABOR FORCE [ PEOPLE ]
71.1%
PERCENT IN LABOR FORCE
0.7%
UNEMPLOYMENT RATE
Lebanon Zip Codes
Lebanon Area Codes
Income in Lebanon
Income Overview in Lebanon
Per Capita Income in Lebanon is $51,134, while median incomes of families and households are $110,303 and $90,911 respectively.
| Characteristic | Number | Measure |
| Per Capita Income | 14,515 | $51,134 |
| Median Family Income | 3,322 | $110,303 |
| Mean Family Income | 3,322 | $134,934 |
| Median Household Income | 6,099 | $90,911 |
| Mean Household Income | 6,099 | $113,425 |
| Income Deficit | 3,322 | $0 |
| Wage / Income Gap (%) | 14,515 | 10.24% |
| Wage / Income Gap ($) | 14,515 | 89.76¢ per $1 |
| Gini / Inequality Index | 14,515 | 0.44 |
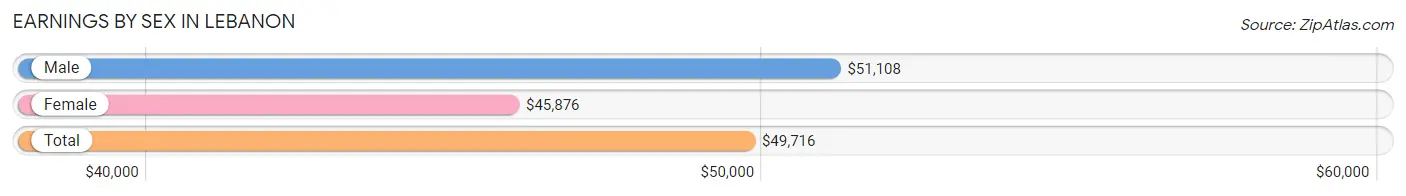
Earnings by Sex in Lebanon
Average Earnings in Lebanon are $49,716, $51,108 for men and $45,876 for women, a difference of 10.2%.
| Sex | Number | Average Earnings |
| Male | 4,440 (48.0%) | $51,108 |
| Female | 4,812 (52.0%) | $45,876 |
| Total | 9,252 (100.0%) | $49,716 |
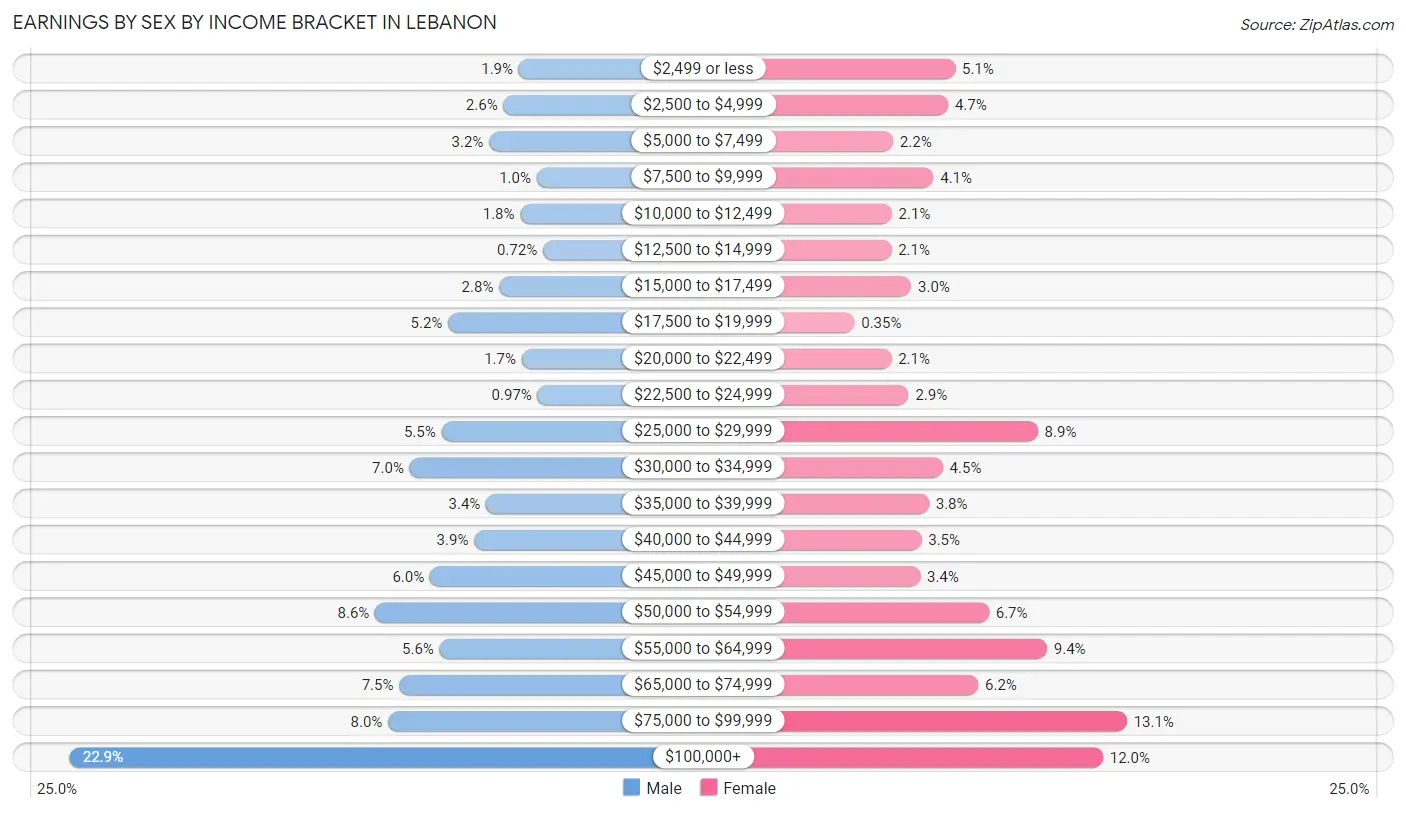
Earnings by Sex by Income Bracket in Lebanon
The most common earnings brackets in Lebanon are $100,000+ for men (1,016 | 22.9%) and $75,000 to $99,999 for women (631 | 13.1%).
| Income | Male | Female |
| $2,499 or less | 82 (1.8%) | 244 (5.1%) |
| $2,500 to $4,999 | 114 (2.6%) | 228 (4.7%) |
| $5,000 to $7,499 | 144 (3.2%) | 104 (2.2%) |
| $7,500 to $9,999 | 45 (1.0%) | 195 (4.1%) |
| $10,000 to $12,499 | 79 (1.8%) | 101 (2.1%) |
| $12,500 to $14,999 | 32 (0.7%) | 100 (2.1%) |
| $15,000 to $17,499 | 123 (2.8%) | 145 (3.0%) |
| $17,500 to $19,999 | 229 (5.2%) | 17 (0.4%) |
| $20,000 to $22,499 | 76 (1.7%) | 100 (2.1%) |
| $22,500 to $24,999 | 43 (1.0%) | 139 (2.9%) |
| $25,000 to $29,999 | 243 (5.5%) | 430 (8.9%) |
| $30,000 to $34,999 | 309 (7.0%) | 216 (4.5%) |
| $35,000 to $39,999 | 150 (3.4%) | 185 (3.8%) |
| $40,000 to $44,999 | 175 (3.9%) | 168 (3.5%) |
| $45,000 to $49,999 | 267 (6.0%) | 165 (3.4%) |
| $50,000 to $54,999 | 381 (8.6%) | 320 (6.7%) |
| $55,000 to $64,999 | 247 (5.6%) | 451 (9.4%) |
| $65,000 to $74,999 | 331 (7.4%) | 296 (6.1%) |
| $75,000 to $99,999 | 354 (8.0%) | 631 (13.1%) |
| $100,000+ | 1,016 (22.9%) | 577 (12.0%) |
| Total | 4,440 (100.0%) | 4,812 (100.0%) |
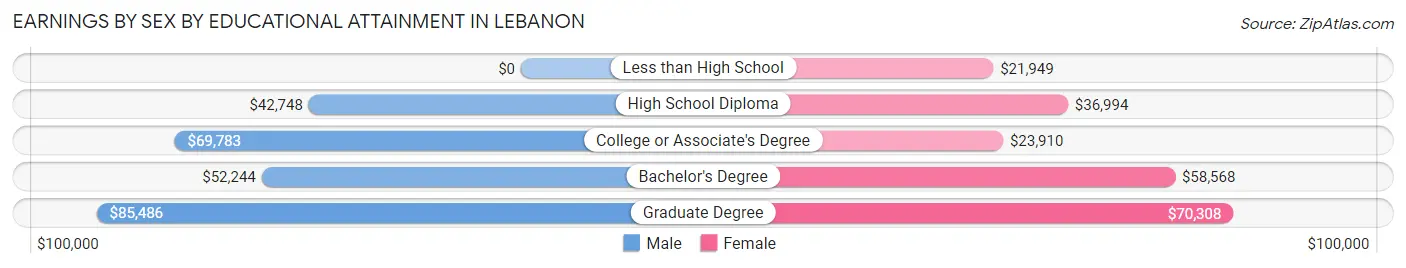
Earnings by Sex by Educational Attainment in Lebanon
Average earnings in Lebanon are $53,602 for men and $52,145 for women, a difference of 2.7%. Men with an educational attainment of graduate degree enjoy the highest average annual earnings of $85,486, while those with high school diploma education earn the least with $42,748. Women with an educational attainment of graduate degree earn the most with the average annual earnings of $70,308, while those with less than high school education have the smallest earnings of $21,949.
| Educational Attainment | Male Income | Female Income |
| Less than High School | - | - |
| High School Diploma | $42,748 | $36,994 |
| College or Associate's Degree | $69,783 | $23,910 |
| Bachelor's Degree | $52,244 | $58,568 |
| Graduate Degree | $85,486 | $70,308 |
| Total | $53,602 | $52,145 |
Family Income in Lebanon
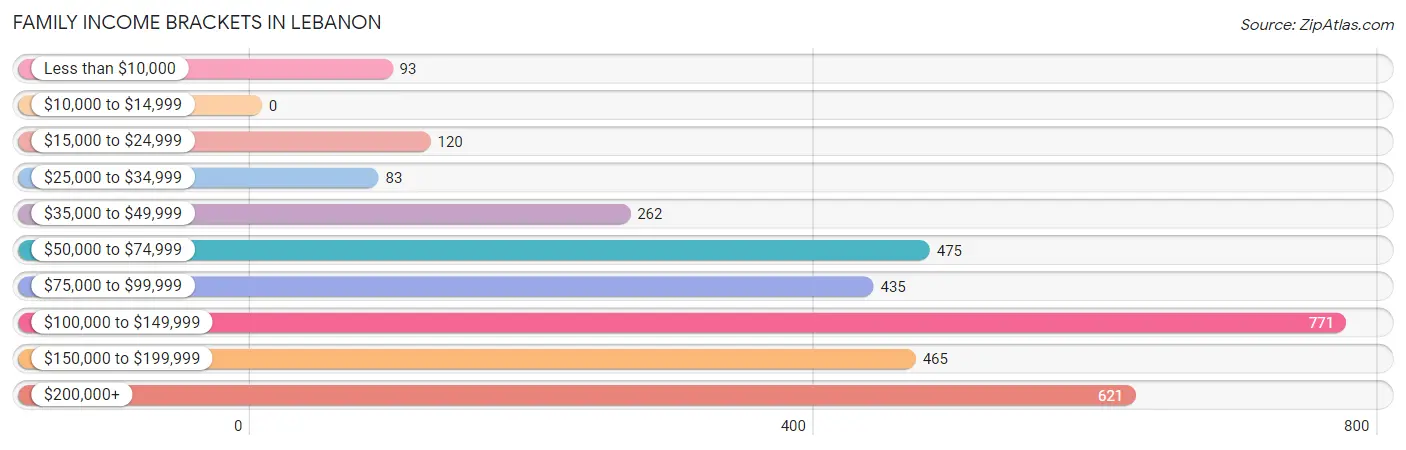
Family Income Brackets in Lebanon
According to the Lebanon family income data, there are 771 families falling into the $100,000 to $149,999 income range, which is the most common income bracket and makes up 23.2% of all families.
| Income Bracket | # Families | % Families |
| Less than $10,000 | 93 | 2.8% |
| $10,000 to $14,999 | 0 | 0.0% |
| $15,000 to $24,999 | 120 | 3.6% |
| $25,000 to $34,999 | 83 | 2.5% |
| $35,000 to $49,999 | 262 | 7.9% |
| $50,000 to $74,999 | 475 | 14.3% |
| $75,000 to $99,999 | 435 | 13.1% |
| $100,000 to $149,999 | 771 | 23.2% |
| $150,000 to $199,999 | 465 | 14.0% |
| $200,000+ | 621 | 18.7% |
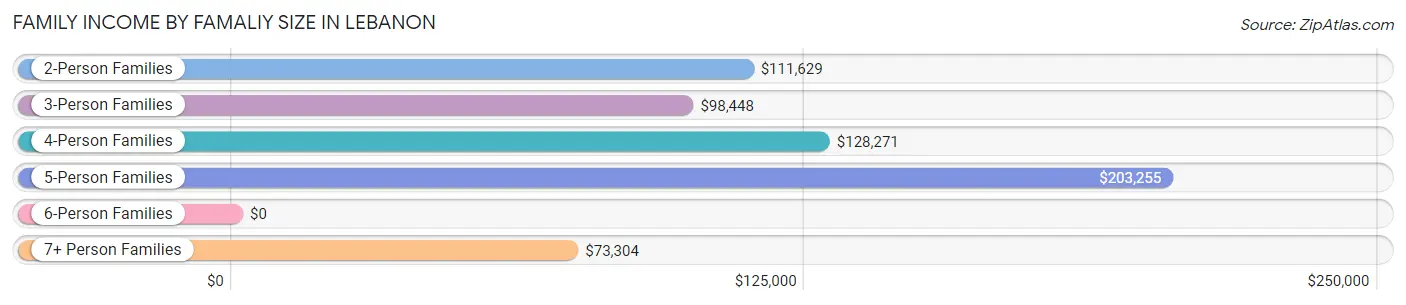
Family Income by Famaliy Size in Lebanon
5-person families (153 | 4.6%) account for the highest median family income in Lebanon with $203,255 per family, while 2-person families (2,007 | 60.4%) have the highest median income of $55,814 per family member.
| Income Bracket | # Families | Median Income |
| 2-Person Families | 2,007 (60.4%) | $111,629 |
| 3-Person Families | 658 (19.8%) | $98,448 |
| 4-Person Families | 405 (12.2%) | $128,271 |
| 5-Person Families | 153 (4.6%) | $203,255 |
| 6-Person Families | 0 (0.0%) | $0 |
| 7+ Person Families | 99 (3.0%) | $73,304 |
| Total | 3,322 (100.0%) | $110,303 |
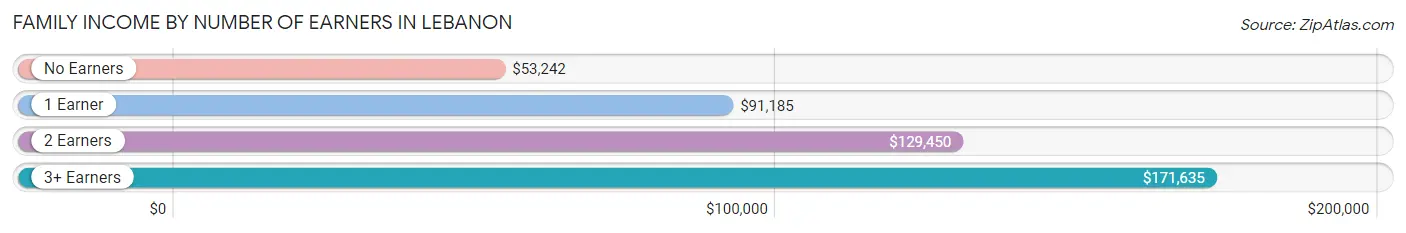
Family Income by Number of Earners in Lebanon
The median family income in Lebanon is $110,303, with families comprising 3+ earners (455) having the highest median family income of $171,635, while families with no earners (501) have the lowest median family income of $53,242, accounting for 13.7% and 15.1% of families, respectively.
| Number of Earners | # Families | Median Income |
| No Earners | 501 (15.1%) | $53,242 |
| 1 Earner | 863 (26.0%) | $91,185 |
| 2 Earners | 1,503 (45.2%) | $129,450 |
| 3+ Earners | 455 (13.7%) | $171,635 |
| Total | 3,322 (100.0%) | $110,303 |
Household Income in Lebanon
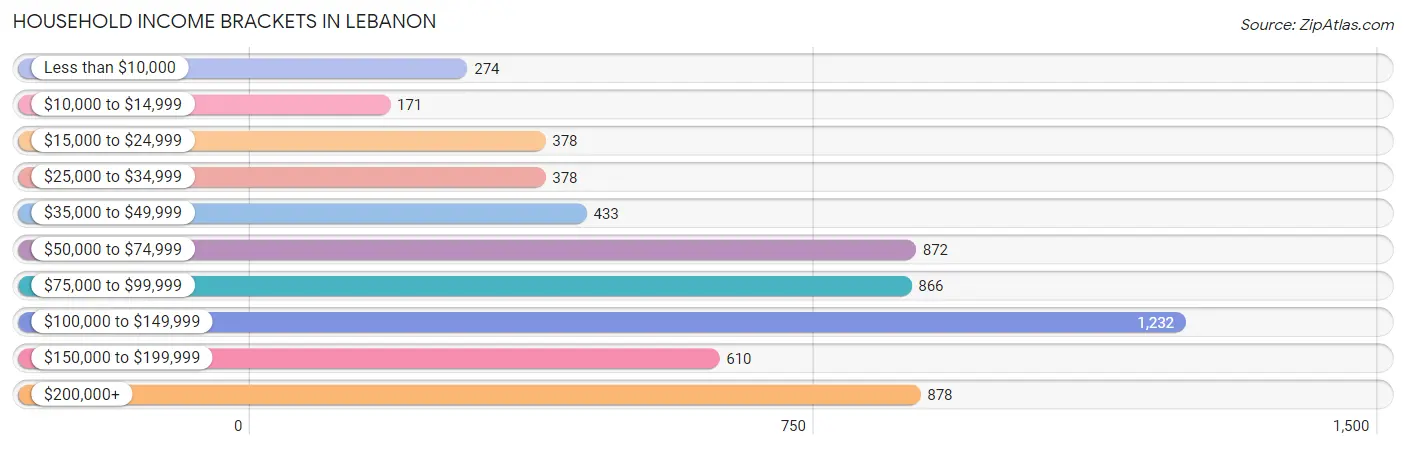
Household Income Brackets in Lebanon
With 1,232 households falling in the category, the $100,000 to $149,999 income range is the most frequent in Lebanon, accounting for 20.2% of all households. In contrast, only 171 households (2.8%) fall into the $10,000 to $14,999 income bracket, making it the least populous group.
| Income Bracket | # Households | % Households |
| Less than $10,000 | 274 | 4.5% |
| $10,000 to $14,999 | 171 | 2.8% |
| $15,000 to $24,999 | 378 | 6.2% |
| $25,000 to $34,999 | 378 | 6.2% |
| $35,000 to $49,999 | 433 | 7.1% |
| $50,000 to $74,999 | 872 | 14.3% |
| $75,000 to $99,999 | 866 | 14.2% |
| $100,000 to $149,999 | 1,232 | 20.2% |
| $150,000 to $199,999 | 610 | 10.0% |
| $200,000+ | 878 | 14.4% |
Household Income by Householder Age in Lebanon
The median household income in Lebanon is $90,911, with the highest median household income of $108,327 found in the 45 to 64 years age bracket for the primary householder. A total of 1,887 households (30.9%) fall into this category. Meanwhile, the 15 to 24 years age bracket for the primary householder has the lowest median household income of $0, with 195 households (3.2%) in this group.

| Income Bracket | # Households | Median Income |
| 15 to 24 Years | 195 (3.2%) | $0 |
| 25 to 44 Years | 2,075 (34.0%) | $98,027 |
| 45 to 64 Years | 1,887 (30.9%) | $108,327 |
| 65+ Years | 1,942 (31.8%) | $62,838 |
| Total | 6,099 (100.0%) | $90,911 |
Poverty in Lebanon
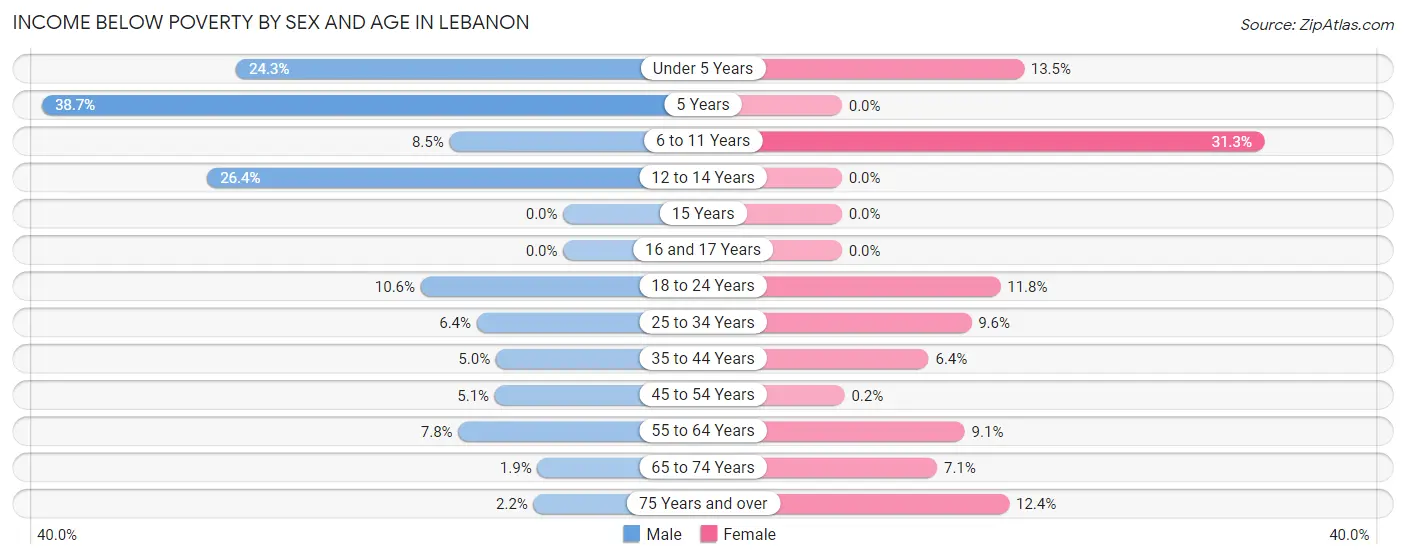
Income Below Poverty by Sex and Age in Lebanon
With 7.6% poverty level for males and 9.2% for females among the residents of Lebanon, 5 year old males and 6 to 11 year old females are the most vulnerable to poverty, with 48 males (38.7%) and 78 females (31.3%) in their respective age groups living below the poverty level.
| Age Bracket | Male | Female |
| Under 5 Years | 69 (24.3%) | 55 (13.5%) |
| 5 Years | 48 (38.7%) | 0 (0.0%) |
| 6 to 11 Years | 37 (8.5%) | 78 (31.3%) |
| 12 to 14 Years | 46 (26.4%) | 0 (0.0%) |
| 15 Years | 0 (0.0%) | 0 (0.0%) |
| 16 and 17 Years | 0 (0.0%) | 0 (0.0%) |
| 18 to 24 Years | 64 (10.6%) | 79 (11.8%) |
| 25 to 34 Years | 81 (6.4%) | 154 (9.6%) |
| 35 to 44 Years | 50 (5.0%) | 58 (6.4%) |
| 45 to 54 Years | 27 (5.1%) | 1 (0.2%) |
| 55 to 64 Years | 82 (7.8%) | 96 (9.1%) |
| 65 to 74 Years | 13 (1.9%) | 66 (7.1%) |
| 75 Years and over | 14 (2.2%) | 94 (12.4%) |
| Total | 531 (7.6%) | 681 (9.2%) |
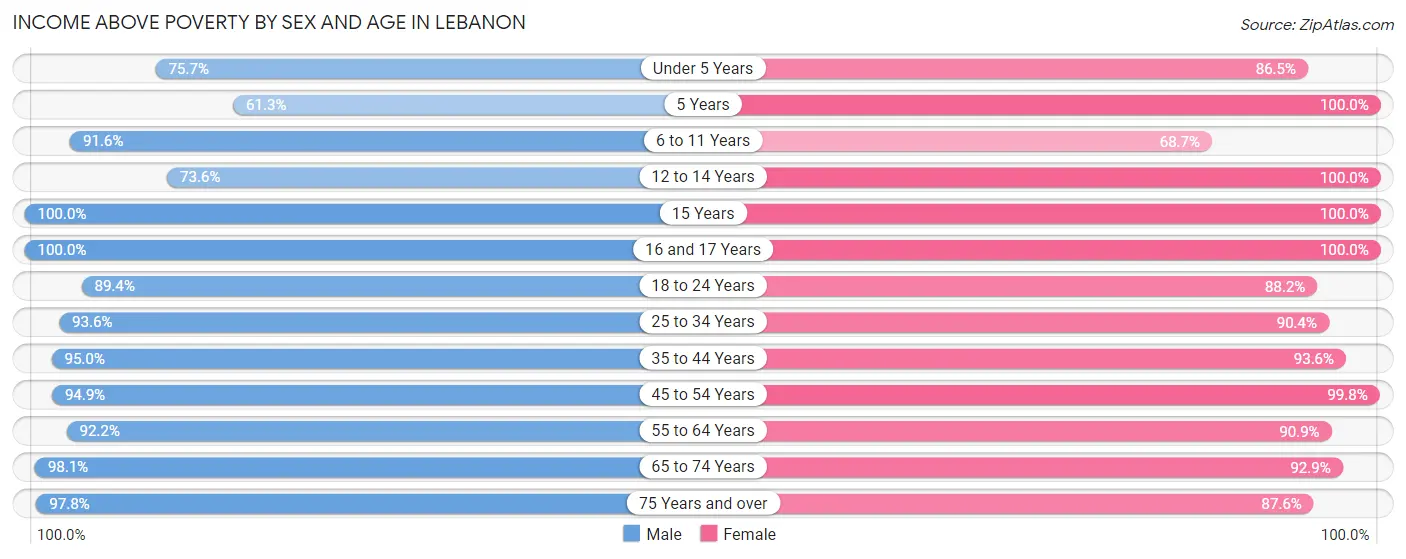
Income Above Poverty by Sex and Age in Lebanon
According to the poverty statistics in Lebanon, males aged 15 years and females aged 5 years are the age groups that are most secure financially, with 100.0% of males and 100.0% of females in these age groups living above the poverty line.
| Age Bracket | Male | Female |
| Under 5 Years | 215 (75.7%) | 352 (86.5%) |
| 5 Years | 76 (61.3%) | 12 (100.0%) |
| 6 to 11 Years | 401 (91.5%) | 171 (68.7%) |
| 12 to 14 Years | 128 (73.6%) | 195 (100.0%) |
| 15 Years | 46 (100.0%) | 34 (100.0%) |
| 16 and 17 Years | 110 (100.0%) | 106 (100.0%) |
| 18 to 24 Years | 541 (89.4%) | 592 (88.2%) |
| 25 to 34 Years | 1,180 (93.6%) | 1,448 (90.4%) |
| 35 to 44 Years | 950 (95.0%) | 842 (93.6%) |
| 45 to 54 Years | 505 (94.9%) | 496 (99.8%) |
| 55 to 64 Years | 970 (92.2%) | 957 (90.9%) |
| 65 to 74 Years | 665 (98.1%) | 868 (92.9%) |
| 75 Years and over | 622 (97.8%) | 663 (87.6%) |
| Total | 6,409 (92.3%) | 6,736 (90.8%) |
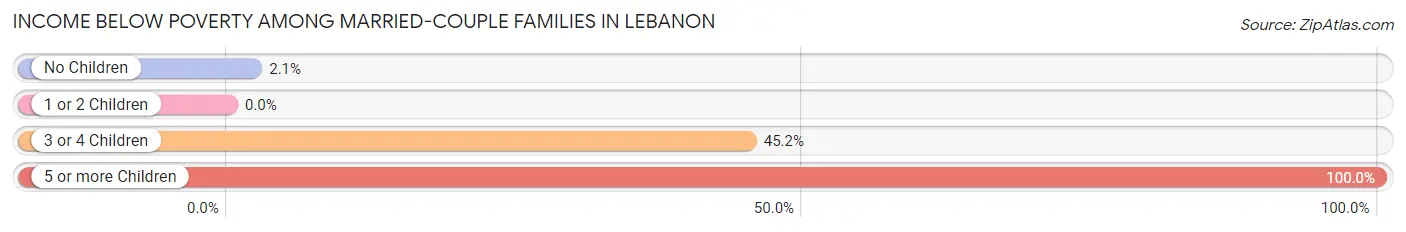
Income Below Poverty Among Married-Couple Families in Lebanon
The poverty statistics for married-couple families in Lebanon show that 3.6% or 95 of the total 2,665 families live below the poverty line. Families with 5 or more children have the highest poverty rate of 100.0%, comprising of 27 families. On the other hand, families with 1 or 2 children have the lowest poverty rate of 0.0%, which includes 0 families.
| Children | Above Poverty | Below Poverty |
| No Children | 1,857 (97.9%) | 40 (2.1%) |
| 1 or 2 Children | 679 (100.0%) | 0 (0.0%) |
| 3 or 4 Children | 34 (54.8%) | 28 (45.2%) |
| 5 or more Children | 0 (0.0%) | 27 (100.0%) |
| Total | 2,570 (96.4%) | 95 (3.6%) |
Income Below Poverty Among Single-Parent Households in Lebanon
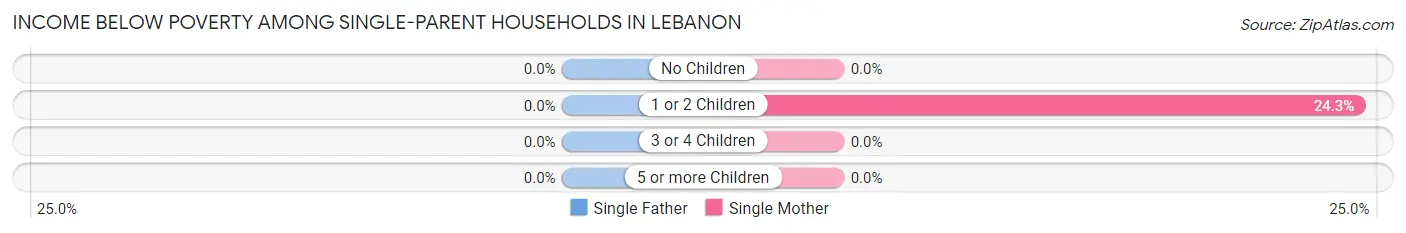
| Children | Single Father | Single Mother |
| No Children | 0 (0.0%) | 0 (0.0%) |
| 1 or 2 Children | 0 (0.0%) | 54 (24.3%) |
| 3 or 4 Children | 0 (0.0%) | 0 (0.0%) |
| 5 or more Children | 0 (0.0%) | 0 (0.0%) |
| Total | 0 (0.0%) | 54 (10.8%) |
Income Below Poverty Among Married-Couple vs Single-Parent Households in Lebanon
The poverty data for Lebanon shows that 95 of the married-couple family households (3.6%) and 54 of the single-parent households (8.2%) are living below the poverty level. Within the married-couple family households, those with 5 or more children have the highest poverty rate, with 27 households (100.0%) falling below the poverty line. Among the single-parent households, those with 1 or 2 children have the highest poverty rate, with 54 household (20.2%) living below poverty.
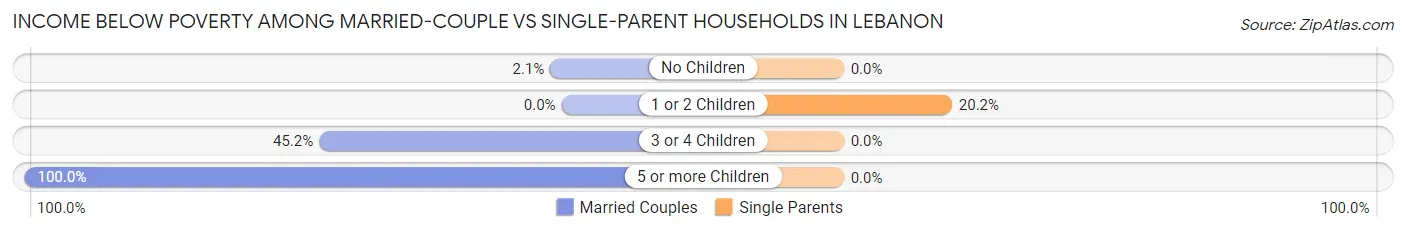
| Children | Married-Couple Families | Single-Parent Households |
| No Children | 40 (2.1%) | 0 (0.0%) |
| 1 or 2 Children | 0 (0.0%) | 54 (20.2%) |
| 3 or 4 Children | 28 (45.2%) | 0 (0.0%) |
| 5 or more Children | 27 (100.0%) | 0 (0.0%) |
| Total | 95 (3.6%) | 54 (8.2%) |
Race in Lebanon
The most populous races in Lebanon are White / Caucasian (12,489 | 86.0%), Asian (1,042 | 7.2%), and Two or more Races (670 | 4.6%).
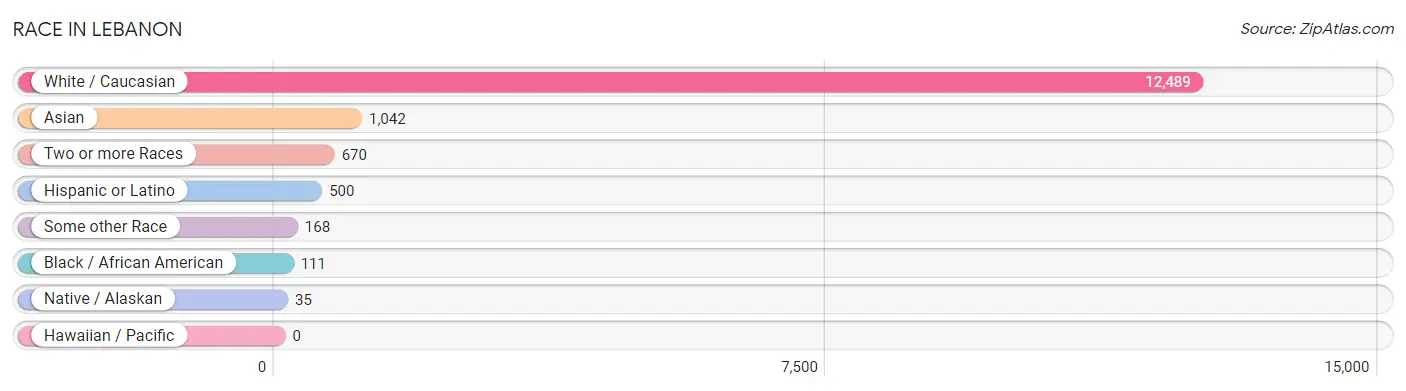
| Race | # Population | % Population |
| Asian | 1,042 | 7.2% |
| Black / African American | 111 | 0.8% |
| Hawaiian / Pacific | 0 | 0.0% |
| Hispanic or Latino | 500 | 3.4% |
| Native / Alaskan | 35 | 0.2% |
| White / Caucasian | 12,489 | 86.0% |
| Two or more Races | 670 | 4.6% |
| Some other Race | 168 | 1.2% |
| Total | 14,515 | 100.0% |
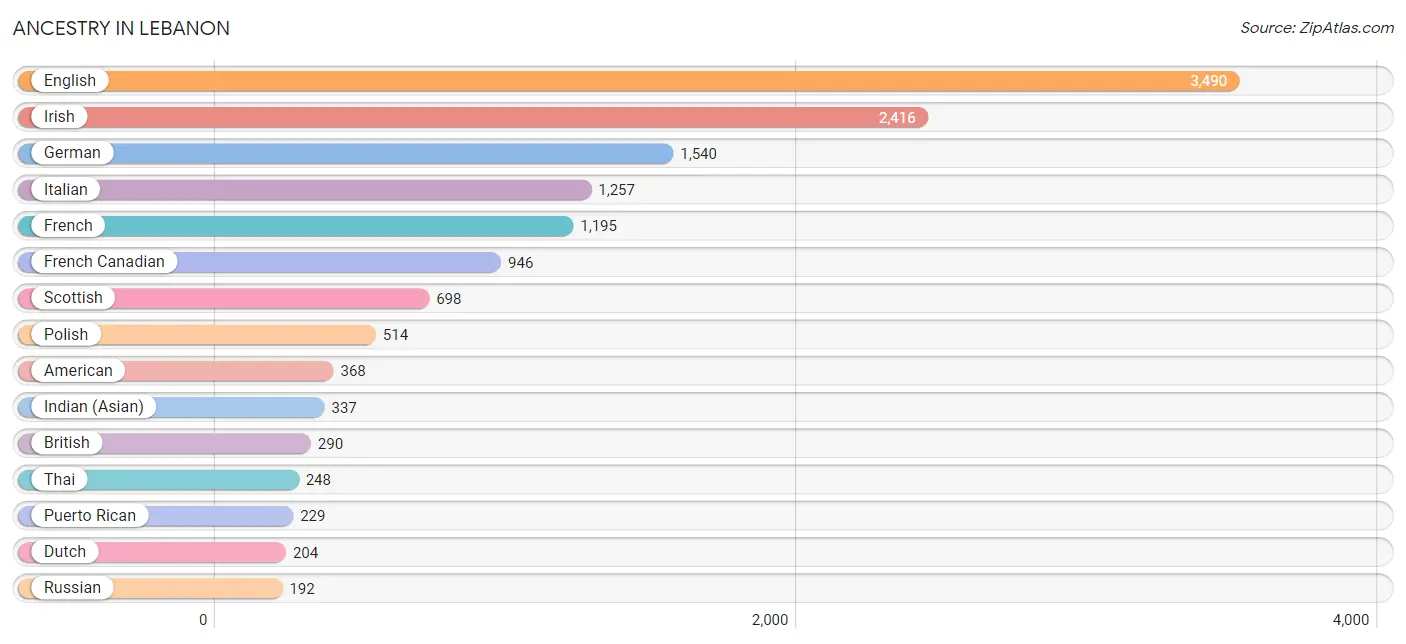
Ancestry in Lebanon
The most populous ancestries reported in Lebanon are English (3,490 | 24.0%), Irish (2,416 | 16.6%), German (1,540 | 10.6%), Italian (1,257 | 8.7%), and French (1,195 | 8.2%), together accounting for 68.2% of all Lebanon residents.
| Ancestry | # Population | % Population |
| African | 12 | 0.1% |
| Albanian | 19 | 0.1% |
| American | 368 | 2.5% |
| Arab | 62 | 0.4% |
| Austrian | 98 | 0.7% |
| Bhutanese | 63 | 0.4% |
| Bolivian | 21 | 0.1% |
| Brazilian | 25 | 0.2% |
| British | 290 | 2.0% |
| Burmese | 81 | 0.6% |
| Canadian | 61 | 0.4% |
| Central American | 12 | 0.1% |
| Chippewa | 48 | 0.3% |
| Choctaw | 7 | 0.1% |
| Colombian | 23 | 0.2% |
| Costa Rican | 12 | 0.1% |
| Czech | 46 | 0.3% |
| Czechoslovakian | 16 | 0.1% |
| Danish | 119 | 0.8% |
| Dutch | 204 | 1.4% |
| Eastern European | 31 | 0.2% |
| Egyptian | 10 | 0.1% |
| English | 3,490 | 24.0% |
| European | 175 | 1.2% |
| Filipino | 59 | 0.4% |
| French | 1,195 | 8.2% |
| French Canadian | 946 | 6.5% |
| German | 1,540 | 10.6% |
| Greek | 56 | 0.4% |
| Guyanese | 6 | 0.0% |
| Haitian | 10 | 0.1% |
| Hungarian | 47 | 0.3% |
| Indian (Asian) | 337 | 2.3% |
| Iranian | 17 | 0.1% |
| Iraqi | 42 | 0.3% |
| Irish | 2,416 | 16.6% |
| Iroquois | 5 | 0.0% |
| Italian | 1,257 | 8.7% |
| Korean | 187 | 1.3% |
| Lebanese | 10 | 0.1% |
| Lithuanian | 17 | 0.1% |
| Malaysian | 6 | 0.0% |
| Mexican | 127 | 0.9% |
| New Zealander | 15 | 0.1% |
| Northern European | 75 | 0.5% |
| Norwegian | 117 | 0.8% |
| Pakistani | 1 | 0.0% |
| Peruvian | 66 | 0.4% |
| Polish | 514 | 3.5% |
| Portuguese | 138 | 0.9% |
| Puerto Rican | 229 | 1.6% |
| Romanian | 6 | 0.0% |
| Russian | 192 | 1.3% |
| Scandinavian | 15 | 0.1% |
| Scotch-Irish | 177 | 1.2% |
| Scottish | 698 | 4.8% |
| Slovak | 15 | 0.1% |
| Slovene | 44 | 0.3% |
| South American | 110 | 0.8% |
| Spaniard | 6 | 0.0% |
| Spanish | 16 | 0.1% |
| Sri Lankan | 7 | 0.1% |
| Subsaharan African | 87 | 0.6% |
| Swedish | 188 | 1.3% |
| Swiss | 66 | 0.4% |
| Thai | 248 | 1.7% |
| Ugandan | 60 | 0.4% |
| Ukrainian | 88 | 0.6% |
| Vietnamese | 73 | 0.5% |
| Welsh | 115 | 0.8% |
| Yaqui | 29 | 0.2% | View All 71 Rows |
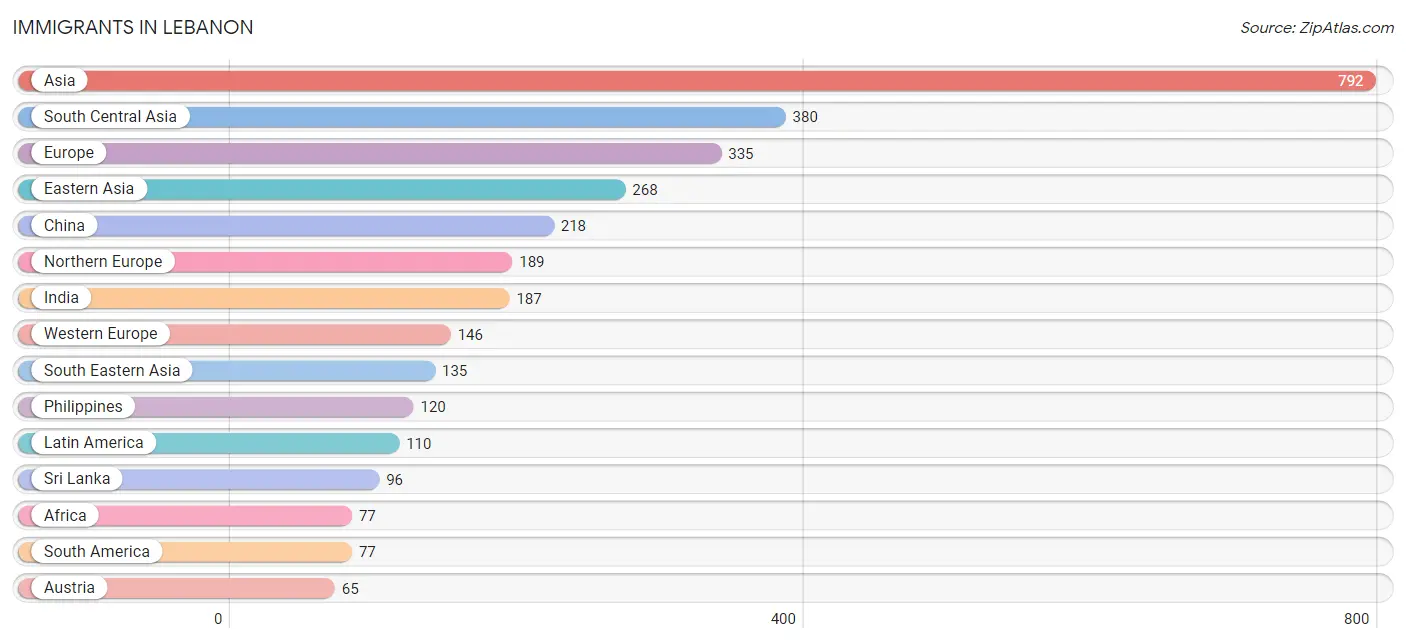
Immigrants in Lebanon
The most numerous immigrant groups reported in Lebanon came from Asia (792 | 5.5%), South Central Asia (380 | 2.6%), Europe (335 | 2.3%), Eastern Asia (268 | 1.8%), and China (218 | 1.5%), together accounting for 13.7% of all Lebanon residents.
| Immigration Origin | # Population | % Population |
| Africa | 77 | 0.5% |
| Asia | 792 | 5.5% |
| Austria | 65 | 0.4% |
| Bangladesh | 17 | 0.1% |
| Brazil | 40 | 0.3% |
| Cameroon | 22 | 0.2% |
| Canada | 35 | 0.2% |
| Caribbean | 10 | 0.1% |
| Central America | 23 | 0.2% |
| China | 218 | 1.5% |
| Denmark | 17 | 0.1% |
| Eastern Africa | 55 | 0.4% |
| Eastern Asia | 268 | 1.8% |
| England | 33 | 0.2% |
| Europe | 335 | 2.3% |
| France | 24 | 0.2% |
| Germany | 19 | 0.1% |
| Haiti | 10 | 0.1% |
| Hong Kong | 31 | 0.2% |
| India | 187 | 1.3% |
| Iran | 17 | 0.1% |
| Iraq | 9 | 0.1% |
| Ireland | 21 | 0.1% |
| Japan | 27 | 0.2% |
| Korea | 23 | 0.2% |
| Latin America | 110 | 0.8% |
| Malaysia | 14 | 0.1% |
| Mexico | 23 | 0.2% |
| Middle Africa | 22 | 0.2% |
| Nepal | 52 | 0.4% |
| Netherlands | 38 | 0.3% |
| Northern Europe | 189 | 1.3% |
| Oceania | 15 | 0.1% |
| Pakistan | 11 | 0.1% |
| Peru | 37 | 0.3% |
| Philippines | 120 | 0.8% |
| South America | 77 | 0.5% |
| South Central Asia | 380 | 2.6% |
| South Eastern Asia | 135 | 0.9% |
| Sri Lanka | 96 | 0.7% |
| Taiwan | 57 | 0.4% |
| Thailand | 1 | 0.0% |
| Uganda | 55 | 0.4% |
| Western Asia | 9 | 0.1% |
| Western Europe | 146 | 1.0% | View All 45 Rows |
Sex and Age in Lebanon
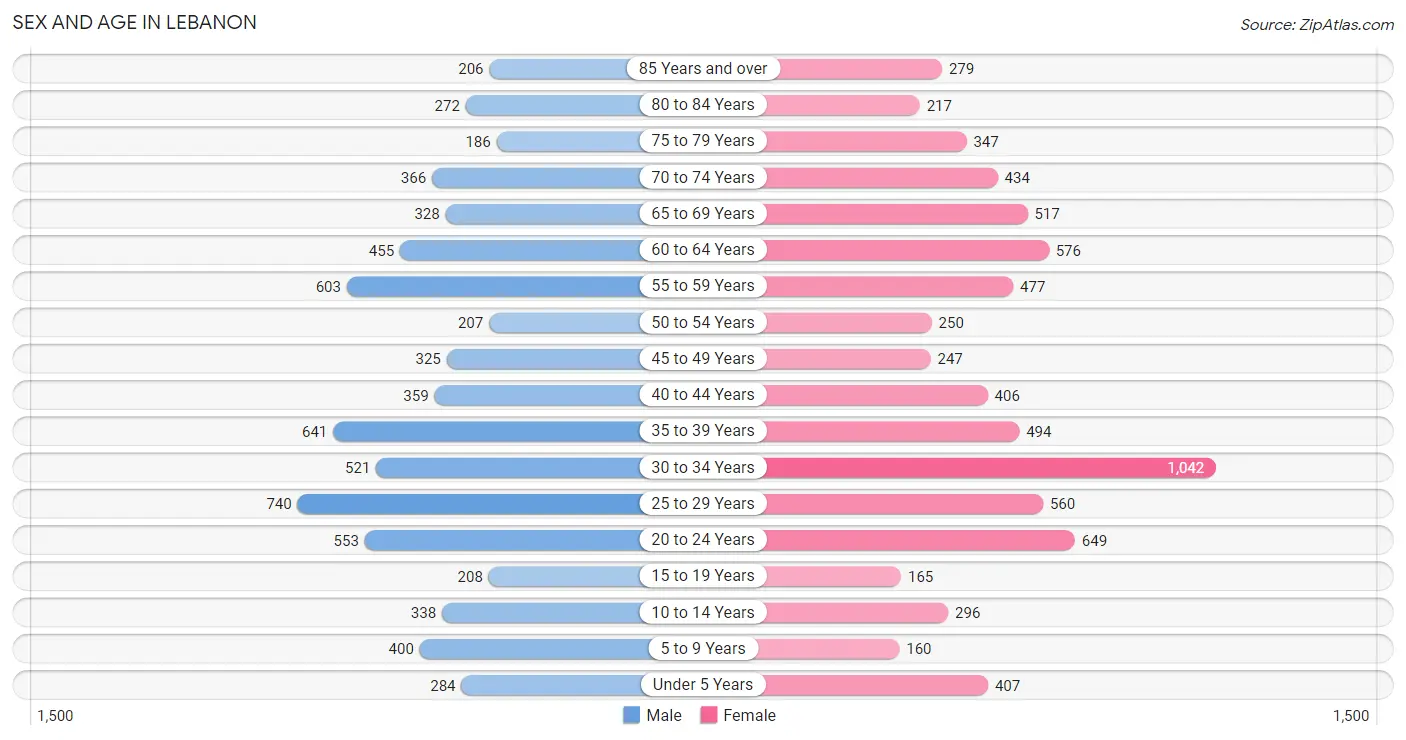
Sex and Age in Lebanon
The most populous age groups in Lebanon are 25 to 29 Years (740 | 10.6%) for men and 30 to 34 Years (1,042 | 13.9%) for women.
| Age Bracket | Male | Female |
| Under 5 Years | 284 (4.1%) | 407 (5.4%) |
| 5 to 9 Years | 400 (5.7%) | 160 (2.1%) |
| 10 to 14 Years | 338 (4.8%) | 296 (3.9%) |
| 15 to 19 Years | 208 (3.0%) | 165 (2.2%) |
| 20 to 24 Years | 553 (7.9%) | 649 (8.6%) |
| 25 to 29 Years | 740 (10.6%) | 560 (7.4%) |
| 30 to 34 Years | 521 (7.4%) | 1,042 (13.9%) |
| 35 to 39 Years | 641 (9.2%) | 494 (6.6%) |
| 40 to 44 Years | 359 (5.1%) | 406 (5.4%) |
| 45 to 49 Years | 325 (4.6%) | 247 (3.3%) |
| 50 to 54 Years | 207 (3.0%) | 250 (3.3%) |
| 55 to 59 Years | 603 (8.6%) | 477 (6.3%) |
| 60 to 64 Years | 455 (6.5%) | 576 (7.7%) |
| 65 to 69 Years | 328 (4.7%) | 517 (6.9%) |
| 70 to 74 Years | 366 (5.2%) | 434 (5.8%) |
| 75 to 79 Years | 186 (2.7%) | 347 (4.6%) |
| 80 to 84 Years | 272 (3.9%) | 217 (2.9%) |
| 85 Years and over | 206 (2.9%) | 279 (3.7%) |
| Total | 6,992 (100.0%) | 7,523 (100.0%) |
Families and Households in Lebanon
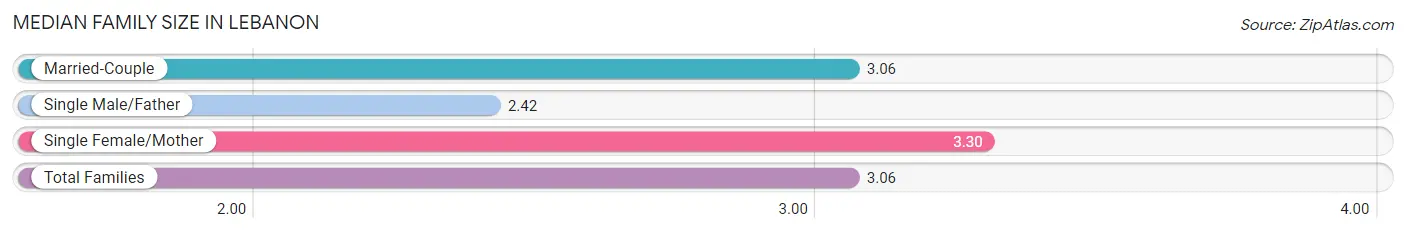
Median Family Size in Lebanon
The median family size in Lebanon is 3.06 persons per family, with single female/mother families (500 | 15.0%) accounting for the largest median family size of 3.3 persons per family. On the other hand, single male/father families (157 | 4.7%) represent the smallest median family size with 2.42 persons per family.
| Family Type | # Families | Family Size |
| Married-Couple | 2,665 (80.2%) | 3.06 |
| Single Male/Father | 157 (4.7%) | 2.42 |
| Single Female/Mother | 500 (15.0%) | 3.30 |
| Total Families | 3,322 (100.0%) | 3.06 |
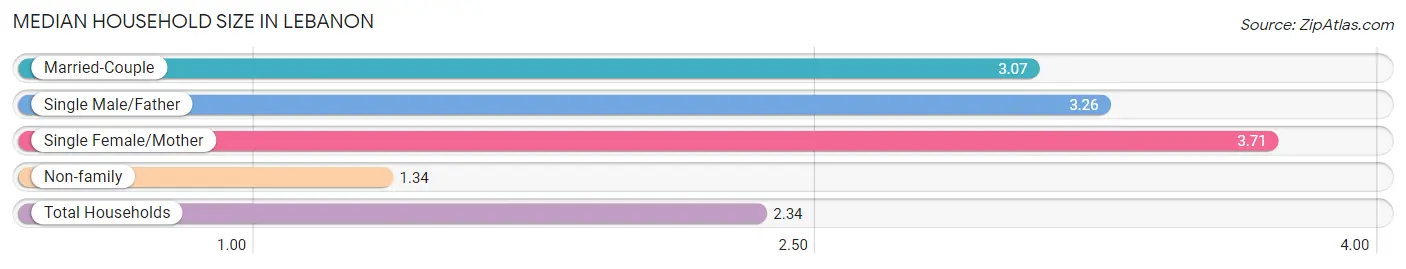
Median Household Size in Lebanon
The median household size in Lebanon is 2.34 persons per household, with single female/mother households (500 | 8.2%) accounting for the largest median household size of 3.71 persons per household. non-family households (2,777 | 45.5%) represent the smallest median household size with 1.34 persons per household.
| Household Type | # Households | Household Size |
| Married-Couple | 2,665 (43.7%) | 3.07 |
| Single Male/Father | 157 (2.6%) | 3.26 |
| Single Female/Mother | 500 (8.2%) | 3.71 |
| Non-family | 2,777 (45.5%) | 1.34 |
| Total Households | 6,099 (100.0%) | 2.34 |
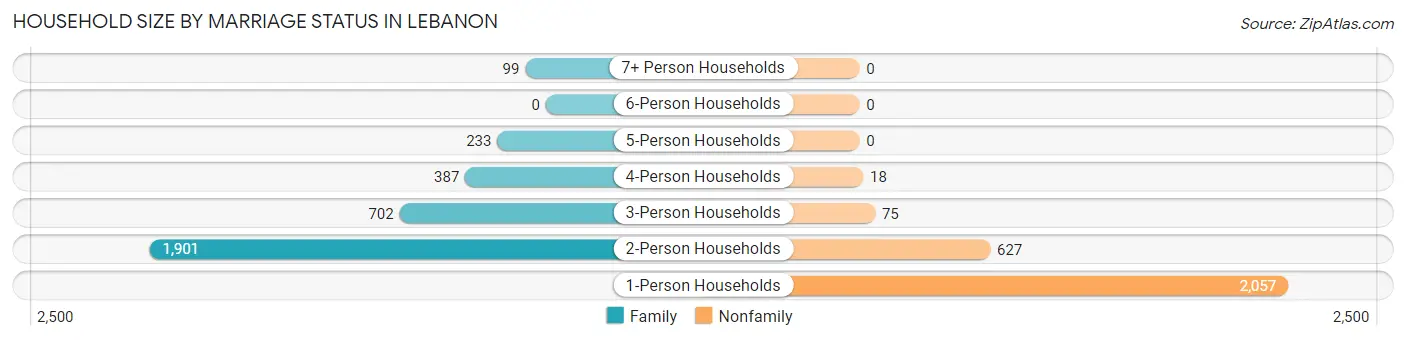
Household Size by Marriage Status in Lebanon
Out of a total of 6,099 households in Lebanon, 3,322 (54.5%) are family households, while 2,777 (45.5%) are nonfamily households. The most numerous type of family households are 2-person households, comprising 1,901, and the most common type of nonfamily households are 1-person households, comprising 2,057.
| Household Size | Family Households | Nonfamily Households |
| 1-Person Households | - | 2,057 (33.7%) |
| 2-Person Households | 1,901 (31.2%) | 627 (10.3%) |
| 3-Person Households | 702 (11.5%) | 75 (1.2%) |
| 4-Person Households | 387 (6.4%) | 18 (0.3%) |
| 5-Person Households | 233 (3.8%) | 0 (0.0%) |
| 6-Person Households | 0 (0.0%) | 0 (0.0%) |
| 7+ Person Households | 99 (1.6%) | 0 (0.0%) |
| Total | 3,322 (54.5%) | 2,777 (45.5%) |
Female Fertility in Lebanon
Fertility by Age in Lebanon
Average fertility rate in Lebanon is 79.0 births per 1,000 women. Women in the age bracket of 20 to 34 years have the highest fertility rate with 107.0 births per 1,000 women. Women in the age bracket of 20 to 34 years acount for 83.6% of all women with births.
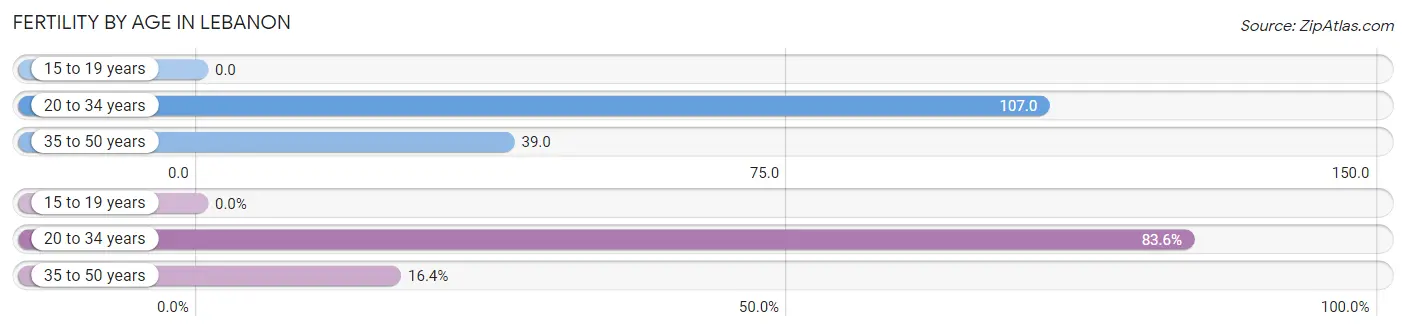
| Age Bracket | Women with Births | Births / 1,000 Women |
| 15 to 19 years | 0 (0.0%) | 0.0 |
| 20 to 34 years | 240 (83.6%) | 107.0 |
| 35 to 50 years | 47 (16.4%) | 39.0 |
| Total | 287 (100.0%) | 79.0 |
Fertility by Age by Marriage Status in Lebanon
71.8% of women with births (287) in Lebanon are married. The highest percentage of unmarried women with births falls into 35 to 50 years age bracket with 89.4% of them unmarried at the time of birth, while the lowest percentage of unmarried women with births belong to 20 to 34 years age bracket with 16.2% of them unmarried.
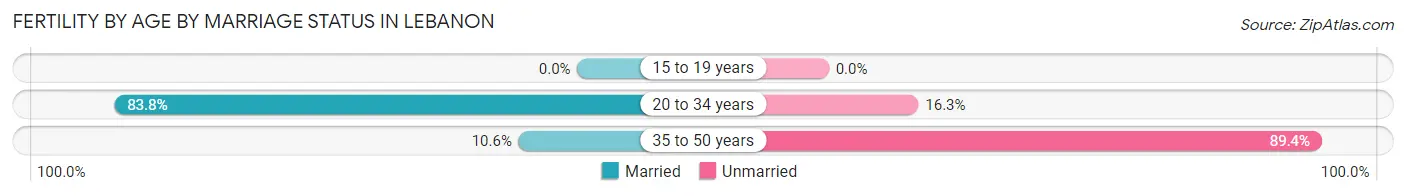
| Age Bracket | Married | Unmarried |
| 15 to 19 years | 0 (0.0%) | 0 (0.0%) |
| 20 to 34 years | 201 (83.8%) | 39 (16.3%) |
| 35 to 50 years | 5 (10.6%) | 42 (89.4%) |
| Total | 206 (71.8%) | 81 (28.2%) |
Fertility by Education in Lebanon
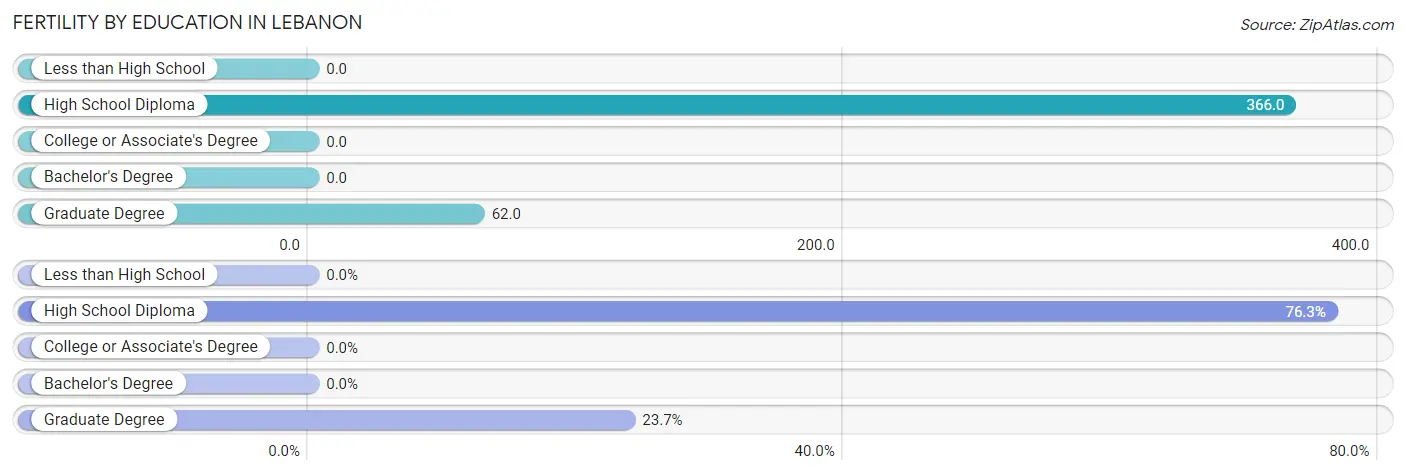
| Educational Attainment | Women with Births | Births / 1,000 Women |
| Less than High School | 0 (0.0%) | 0.0 |
| High School Diploma | 219 (76.3%) | 366.0 |
| College or Associate's Degree | 0 (0.0%) | 0.0 |
| Bachelor's Degree | 0 (0.0%) | 0.0 |
| Graduate Degree | 68 (23.7%) | 62.0 |
| Total | 287 (100.0%) | 79.0 |
Fertility by Education by Marriage Status in Lebanon
28.2% of women with births in Lebanon are unmarried. Women with the educational attainment of graduate degree are most likely to be married with 100.0% of them married at childbirth, while women with the educational attainment of high school diploma are least likely to be married with 37.0% of them unmarried at childbirth.
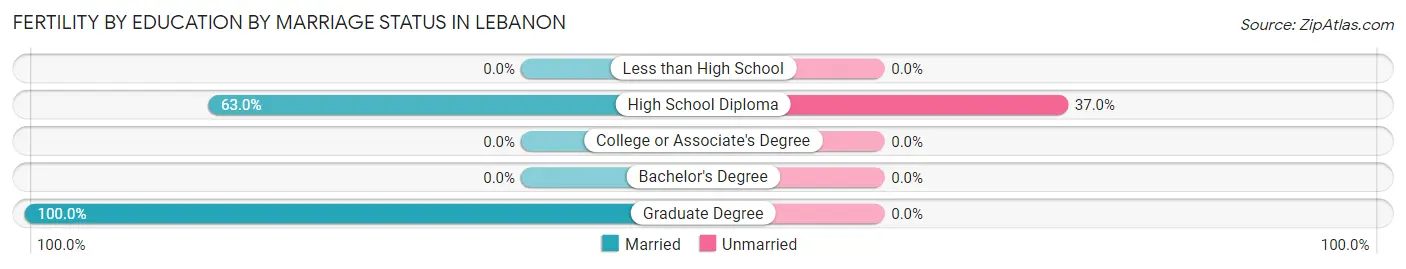
| Educational Attainment | Married | Unmarried |
| Less than High School | 0 (0.0%) | 0 (0.0%) |
| High School Diploma | 138 (63.0%) | 81 (37.0%) |
| College or Associate's Degree | 0 (0.0%) | 0 (0.0%) |
| Bachelor's Degree | 0 (0.0%) | 0 (0.0%) |
| Graduate Degree | 68 (100.0%) | 0 (0.0%) |
| Total | 206 (71.8%) | 81 (28.2%) |
Employment Characteristics in Lebanon
Employment by Class of Employer in Lebanon
Among the 8,626 employed individuals in Lebanon, private company employees (4,530 | 52.5%), not-for-profit organizations (2,532 | 29.3%), and self-employed (not incorporated) (539 | 6.2%) make up the most common classes of employment.
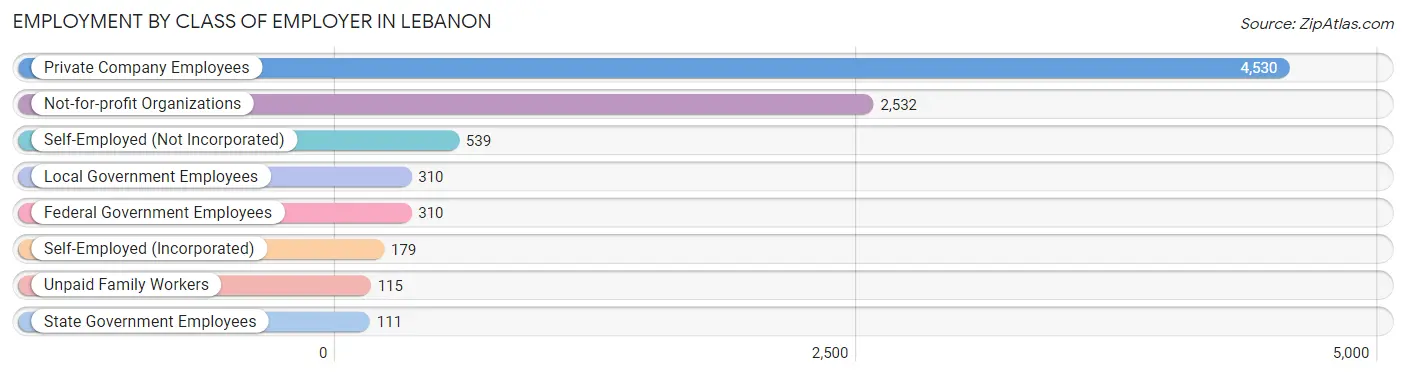
| Employer Class | # Employees | % Employees |
| Private Company Employees | 4,530 | 52.5% |
| Self-Employed (Incorporated) | 179 | 2.1% |
| Self-Employed (Not Incorporated) | 539 | 6.2% |
| Not-for-profit Organizations | 2,532 | 29.3% |
| Local Government Employees | 310 | 3.6% |
| State Government Employees | 111 | 1.3% |
| Federal Government Employees | 310 | 3.6% |
| Unpaid Family Workers | 115 | 1.3% |
| Total | 8,626 | 100.0% |
Employment Status by Age in Lebanon
According to the labor force statistics for Lebanon, out of the total population over 16 years of age (12,548), 71.1% or 8,922 individuals are in the labor force, with 0.7% or 62 of them unemployed. The age group with the highest labor force participation rate is 45 to 54 years, with 96.7% or 995 individuals in the labor force. Within the labor force, the 55 to 59 years age range has the highest percentage of unemployed individuals, with 5.1% or 52 of them being unemployed.
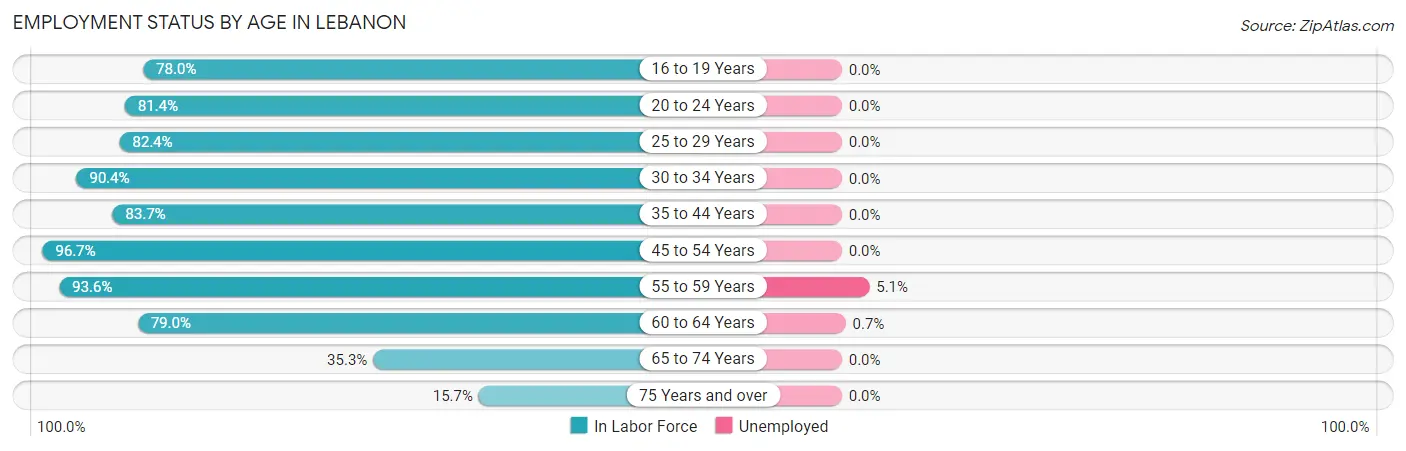
| Age Bracket | In Labor Force | Unemployed |
| 16 to 19 Years | 227 (78.0%) | 0 (0.0%) |
| 20 to 24 Years | 978 (81.4%) | 0 (0.0%) |
| 25 to 29 Years | 1,071 (82.4%) | 0 (0.0%) |
| 30 to 34 Years | 1,413 (90.4%) | 0 (0.0%) |
| 35 to 44 Years | 1,590 (83.7%) | 0 (0.0%) |
| 45 to 54 Years | 995 (96.7%) | 0 (0.0%) |
| 55 to 59 Years | 1,011 (93.6%) | 52 (5.1%) |
| 60 to 64 Years | 814 (79.0%) | 6 (0.7%) |
| 65 to 74 Years | 581 (35.3%) | 0 (0.0%) |
| 75 Years and over | 237 (15.7%) | 0 (0.0%) |
| Total | 8,922 (71.1%) | 62 (0.7%) |
Employment Status by Educational Attainment in Lebanon
According to labor force statistics for Lebanon, 87.2% of individuals (6,891) out of the total population between 25 and 64 years of age (7,903) are in the labor force, with 0.8% or 55 of them being unemployed. The group with the highest labor force participation rate are those with the educational attainment of bachelor's degree or higher, with 89.2% or 4,235 individuals in the labor force. Within the labor force, individuals with high school diploma education have the highest percentage of unemployment, with 2.4% or 31 of them being unemployed.
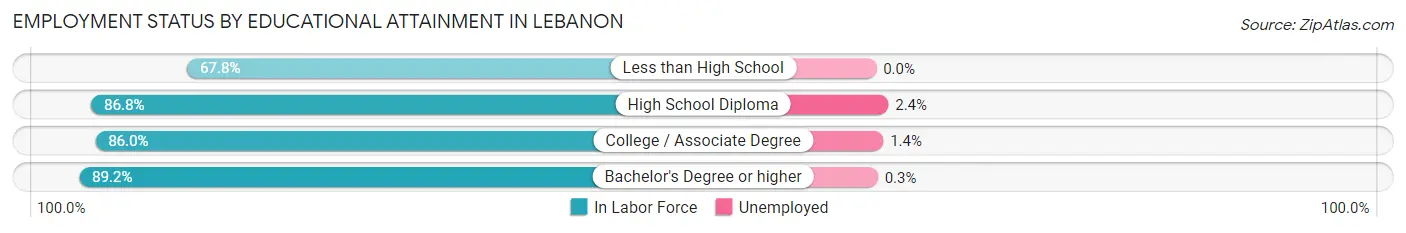
| Educational Attainment | In Labor Force | Unemployed |
| Less than High School | 248 (67.8%) | 0 (0.0%) |
| High School Diploma | 1,279 (86.8%) | 35 (2.4%) |
| College / Associate Degree | 1,132 (86.0%) | 18 (1.4%) |
| Bachelor's Degree or higher | 4,235 (89.2%) | 14 (0.3%) |
| Total | 6,891 (87.2%) | 63 (0.8%) |
Employment Occupations by Sex in Lebanon
Management, Business, Science and Arts Occupations
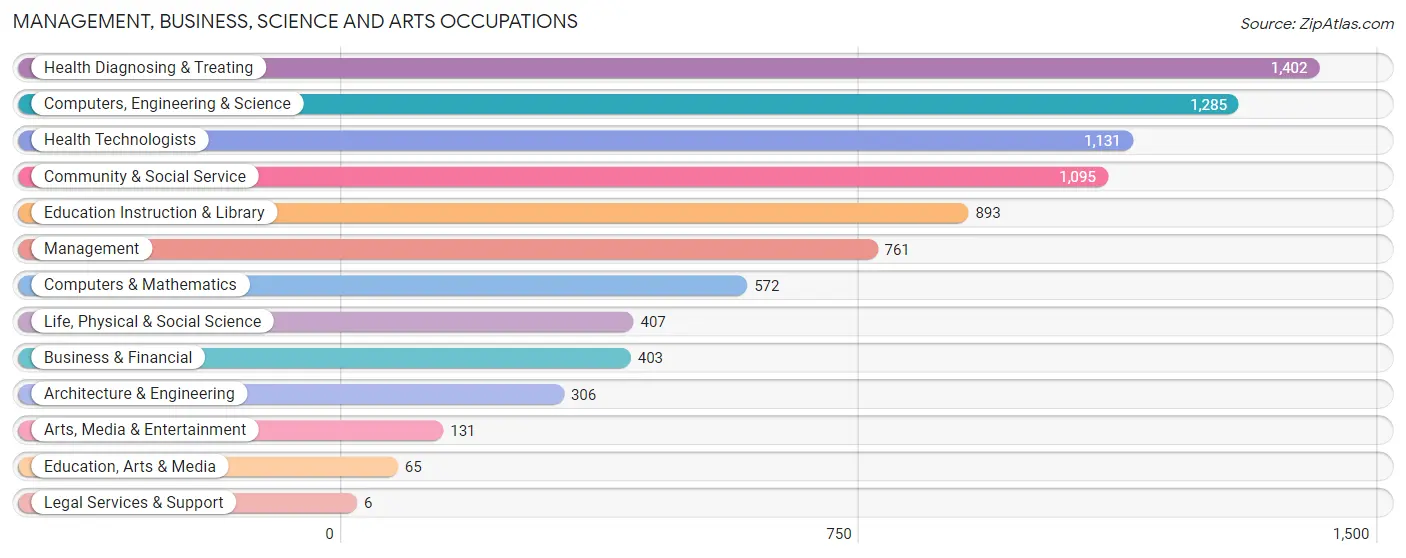
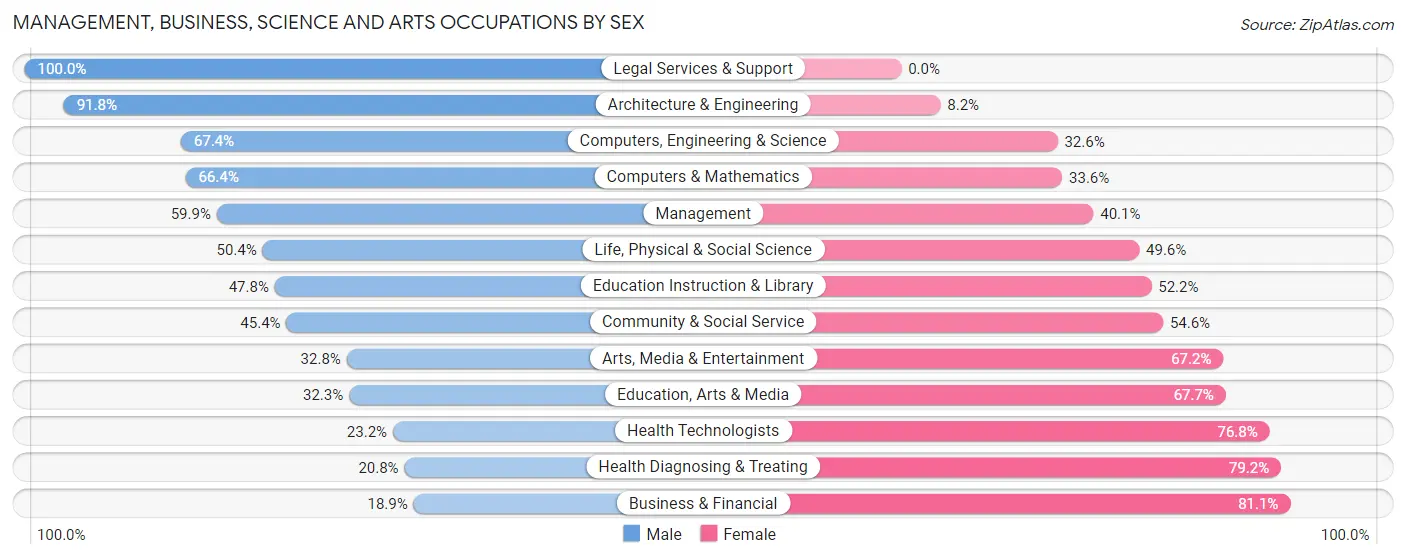
The most common Management, Business, Science and Arts occupations in Lebanon are Health Diagnosing & Treating (1,402 | 15.9%), Computers, Engineering & Science (1,285 | 14.5%), Health Technologists (1,131 | 12.8%), Community & Social Service (1,095 | 12.4%), and Education Instruction & Library (893 | 10.1%).
Management, Business, Science and Arts Occupations by Sex
Within the Management, Business, Science and Arts occupations in Lebanon, the most male-oriented occupations are Legal Services & Support (100.0%), Architecture & Engineering (91.8%), and Computers, Engineering & Science (67.4%), while the most female-oriented occupations are Business & Financial (81.1%), Health Diagnosing & Treating (79.2%), and Health Technologists (76.8%).
| Occupation | Male | Female |
| Management | 456 (59.9%) | 305 (40.1%) |
| Business & Financial | 76 (18.9%) | 327 (81.1%) |
| Computers, Engineering & Science | 866 (67.4%) | 419 (32.6%) |
| Computers & Mathematics | 380 (66.4%) | 192 (33.6%) |
| Architecture & Engineering | 281 (91.8%) | 25 (8.2%) |
| Life, Physical & Social Science | 205 (50.4%) | 202 (49.6%) |
| Community & Social Service | 497 (45.4%) | 598 (54.6%) |
| Education, Arts & Media | 21 (32.3%) | 44 (67.7%) |
| Legal Services & Support | 6 (100.0%) | 0 (0.0%) |
| Education Instruction & Library | 427 (47.8%) | 466 (52.2%) |
| Arts, Media & Entertainment | 43 (32.8%) | 88 (67.2%) |
| Health Diagnosing & Treating | 291 (20.8%) | 1,111 (79.2%) |
| Health Technologists | 262 (23.2%) | 869 (76.8%) |
| Total (Category) | 2,186 (44.2%) | 2,760 (55.8%) |
| Total (Overall) | 4,253 (48.1%) | 4,594 (51.9%) |
Services Occupations
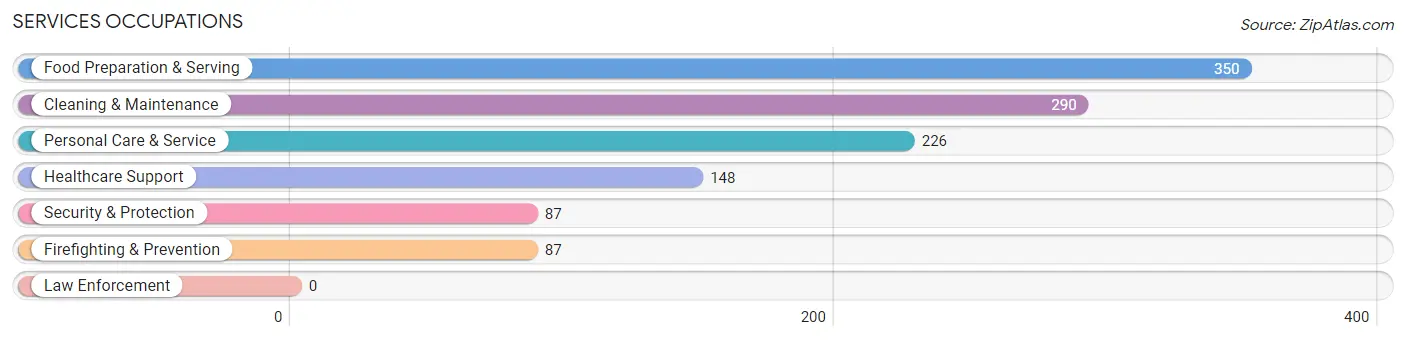
The most common Services occupations in Lebanon are Food Preparation & Serving (350 | 4.0%), Cleaning & Maintenance (290 | 3.3%), Personal Care & Service (226 | 2.5%), Healthcare Support (148 | 1.7%), and Security & Protection (87 | 1.0%).
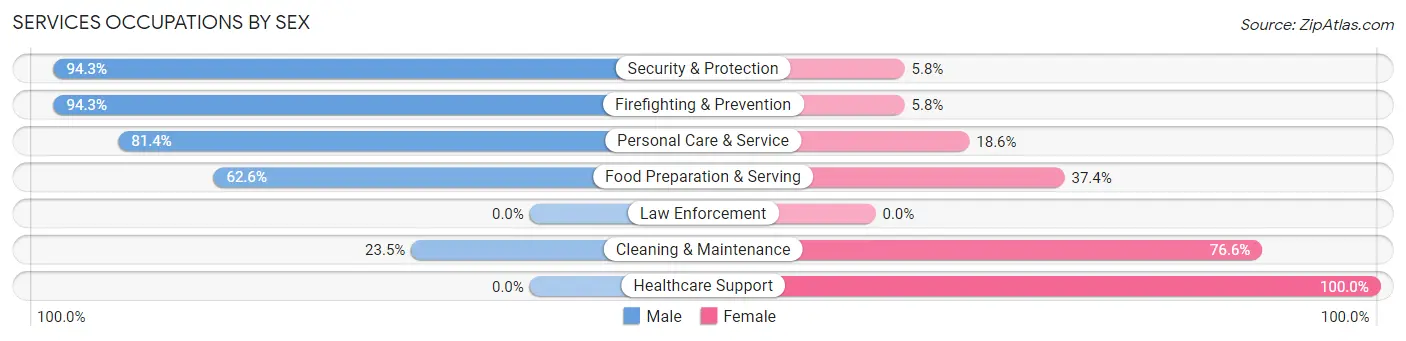
Services Occupations by Sex
Within the Services occupations in Lebanon, the most male-oriented occupations are Security & Protection (94.3%), Firefighting & Prevention (94.3%), and Personal Care & Service (81.4%), while the most female-oriented occupations are Healthcare Support (100.0%), Cleaning & Maintenance (76.5%), and Food Preparation & Serving (37.4%).
| Occupation | Male | Female |
| Healthcare Support | 0 (0.0%) | 148 (100.0%) |
| Security & Protection | 82 (94.3%) | 5 (5.8%) |
| Firefighting & Prevention | 82 (94.3%) | 5 (5.8%) |
| Law Enforcement | 0 (0.0%) | 0 (0.0%) |
| Food Preparation & Serving | 219 (62.6%) | 131 (37.4%) |
| Cleaning & Maintenance | 68 (23.4%) | 222 (76.5%) |
| Personal Care & Service | 184 (81.4%) | 42 (18.6%) |
| Total (Category) | 553 (50.2%) | 548 (49.8%) |
| Total (Overall) | 4,253 (48.1%) | 4,594 (51.9%) |
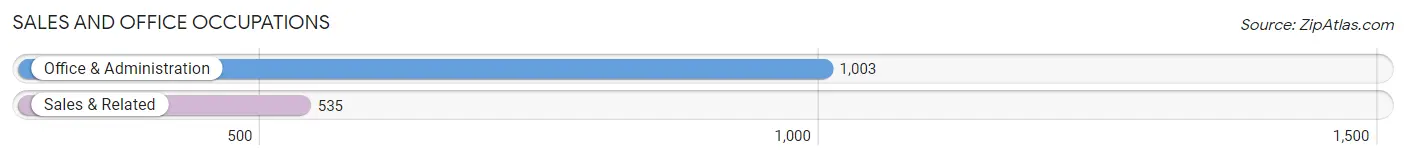
Sales and Office Occupations
The most common Sales and Office occupations in Lebanon are Office & Administration (1,003 | 11.3%), and Sales & Related (535 | 6.0%).
Sales and Office Occupations by Sex
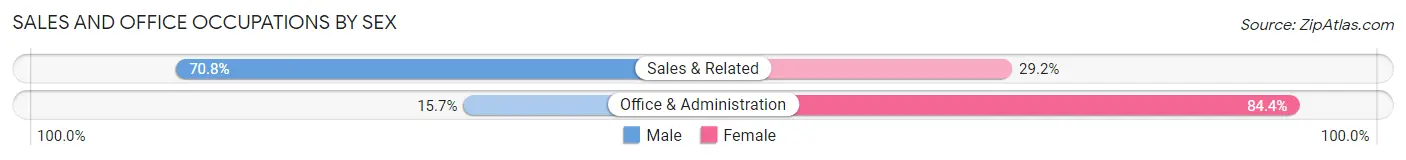
| Occupation | Male | Female |
| Sales & Related | 379 (70.8%) | 156 (29.2%) |
| Office & Administration | 157 (15.7%) | 846 (84.4%) |
| Total (Category) | 536 (34.8%) | 1,002 (65.1%) |
| Total (Overall) | 4,253 (48.1%) | 4,594 (51.9%) |
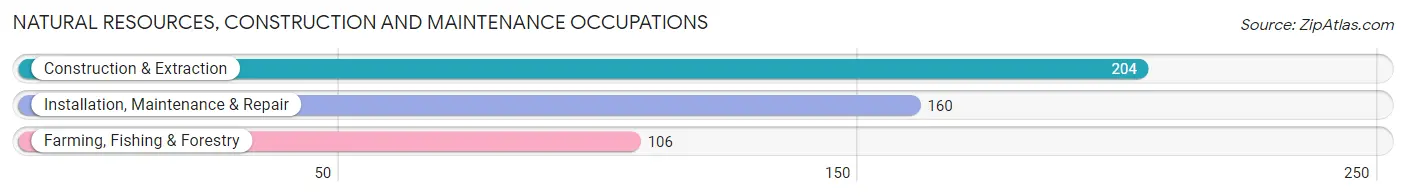
Natural Resources, Construction and Maintenance Occupations
The most common Natural Resources, Construction and Maintenance occupations in Lebanon are Construction & Extraction (204 | 2.3%), Installation, Maintenance & Repair (160 | 1.8%), and Farming, Fishing & Forestry (106 | 1.2%).
Natural Resources, Construction and Maintenance Occupations by Sex
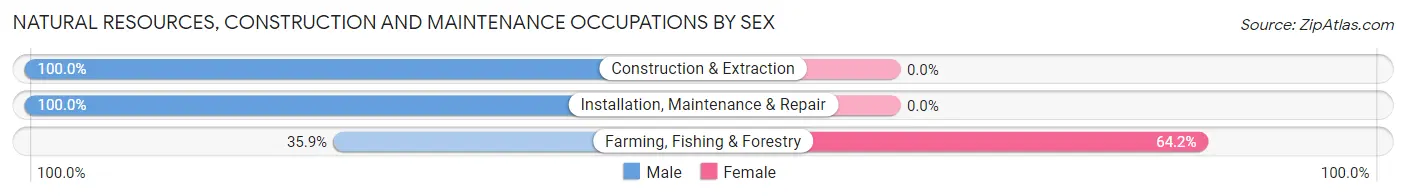
| Occupation | Male | Female |
| Farming, Fishing & Forestry | 38 (35.8%) | 68 (64.1%) |
| Construction & Extraction | 204 (100.0%) | 0 (0.0%) |
| Installation, Maintenance & Repair | 160 (100.0%) | 0 (0.0%) |
| Total (Category) | 402 (85.5%) | 68 (14.5%) |
| Total (Overall) | 4,253 (48.1%) | 4,594 (51.9%) |
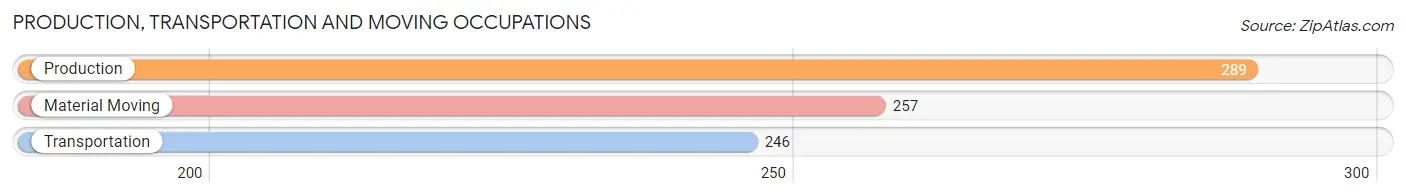
Production, Transportation and Moving Occupations
The most common Production, Transportation and Moving occupations in Lebanon are Production (289 | 3.3%), Material Moving (257 | 2.9%), and Transportation (246 | 2.8%).
Production, Transportation and Moving Occupations by Sex
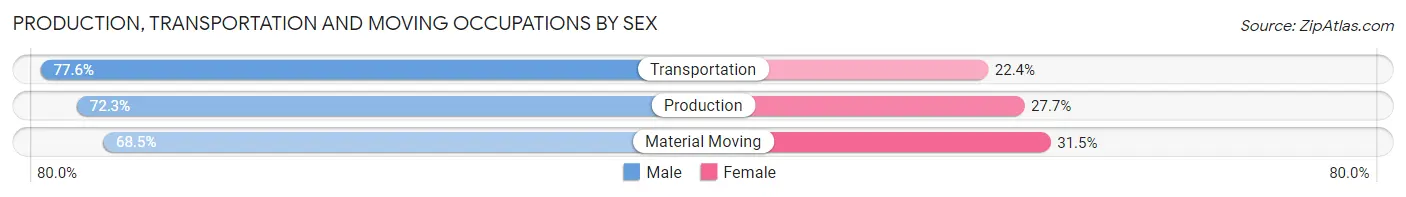
| Occupation | Male | Female |
| Production | 209 (72.3%) | 80 (27.7%) |
| Transportation | 191 (77.6%) | 55 (22.4%) |
| Material Moving | 176 (68.5%) | 81 (31.5%) |
| Total (Category) | 576 (72.7%) | 216 (27.3%) |
| Total (Overall) | 4,253 (48.1%) | 4,594 (51.9%) |
Employment Industries by Sex in Lebanon
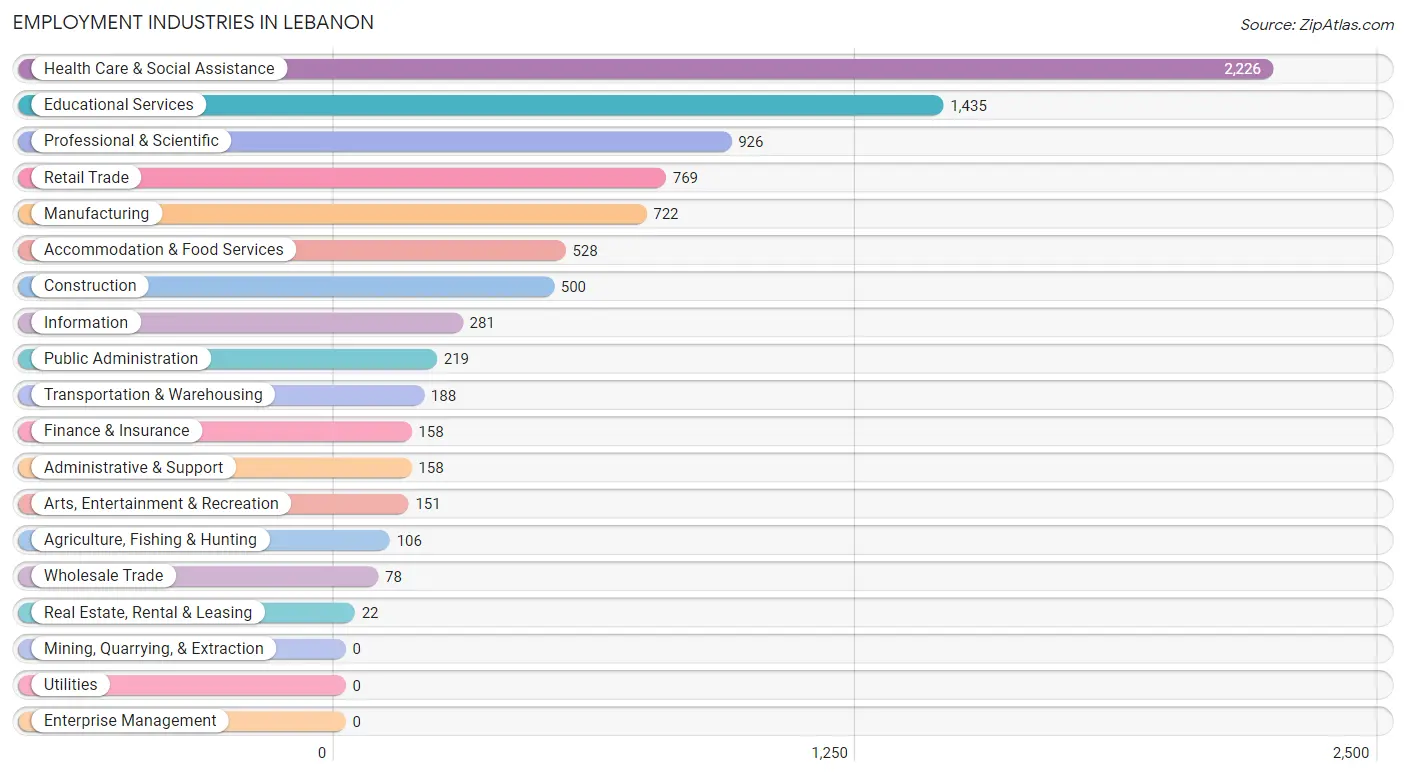
Employment Industries in Lebanon
The major employment industries in Lebanon include Health Care & Social Assistance (2,226 | 25.2%), Educational Services (1,435 | 16.2%), Professional & Scientific (926 | 10.5%), Retail Trade (769 | 8.7%), and Manufacturing (722 | 8.2%).
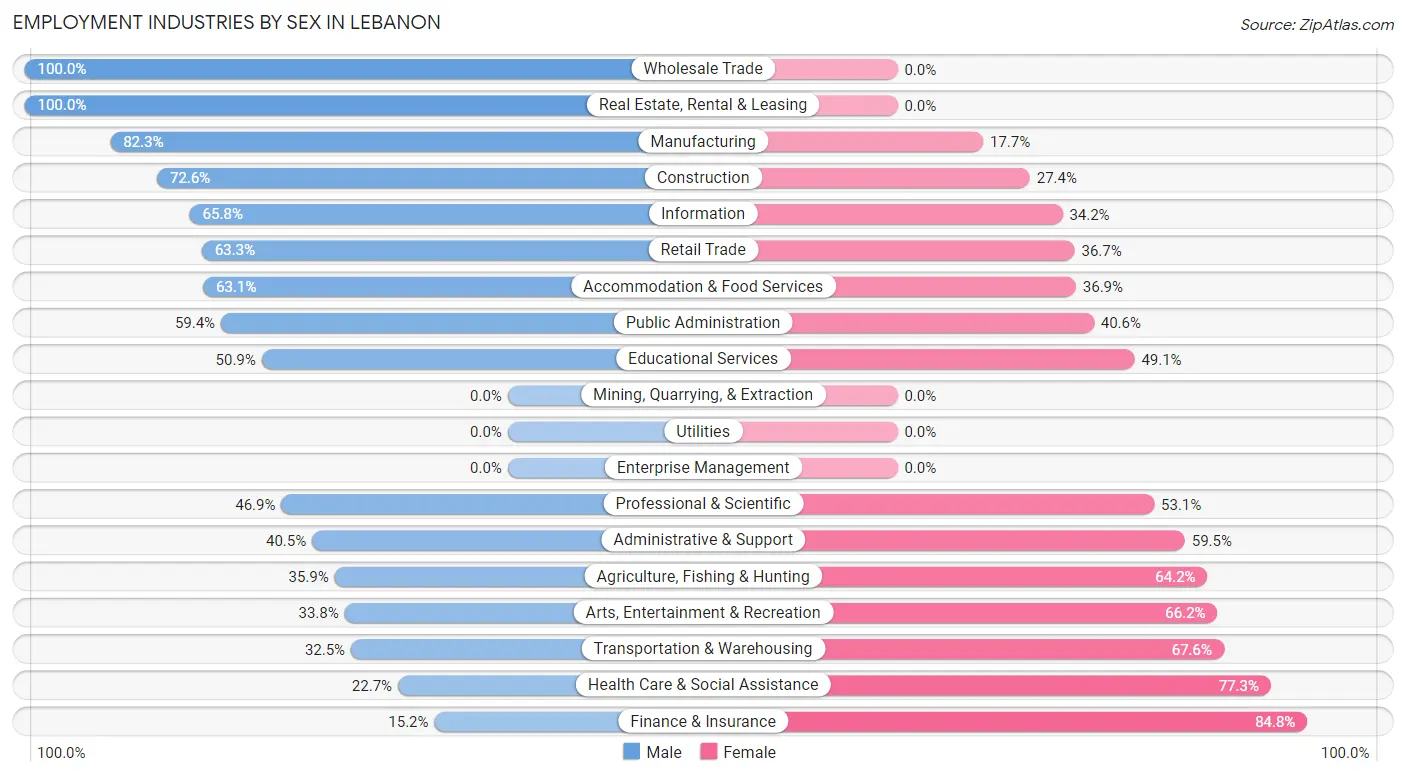
Employment Industries by Sex in Lebanon
The Lebanon industries that see more men than women are Wholesale Trade (100.0%), Real Estate, Rental & Leasing (100.0%), and Manufacturing (82.3%), whereas the industries that tend to have a higher number of women are Finance & Insurance (84.8%), Health Care & Social Assistance (77.3%), and Transportation & Warehousing (67.5%).
| Industry | Male | Female |
| Agriculture, Fishing & Hunting | 38 (35.8%) | 68 (64.1%) |
| Mining, Quarrying, & Extraction | 0 (0.0%) | 0 (0.0%) |
| Construction | 363 (72.6%) | 137 (27.4%) |
| Manufacturing | 594 (82.3%) | 128 (17.7%) |
| Wholesale Trade | 78 (100.0%) | 0 (0.0%) |
| Retail Trade | 487 (63.3%) | 282 (36.7%) |
| Transportation & Warehousing | 61 (32.5%) | 127 (67.5%) |
| Utilities | 0 (0.0%) | 0 (0.0%) |
| Information | 185 (65.8%) | 96 (34.2%) |
| Finance & Insurance | 24 (15.2%) | 134 (84.8%) |
| Real Estate, Rental & Leasing | 22 (100.0%) | 0 (0.0%) |
| Professional & Scientific | 434 (46.9%) | 492 (53.1%) |
| Enterprise Management | 0 (0.0%) | 0 (0.0%) |
| Administrative & Support | 64 (40.5%) | 94 (59.5%) |
| Educational Services | 731 (50.9%) | 704 (49.1%) |
| Health Care & Social Assistance | 506 (22.7%) | 1,720 (77.3%) |
| Arts, Entertainment & Recreation | 51 (33.8%) | 100 (66.2%) |
| Accommodation & Food Services | 333 (63.1%) | 195 (36.9%) |
| Public Administration | 130 (59.4%) | 89 (40.6%) |
| Total | 4,253 (48.1%) | 4,594 (51.9%) |
Education in Lebanon
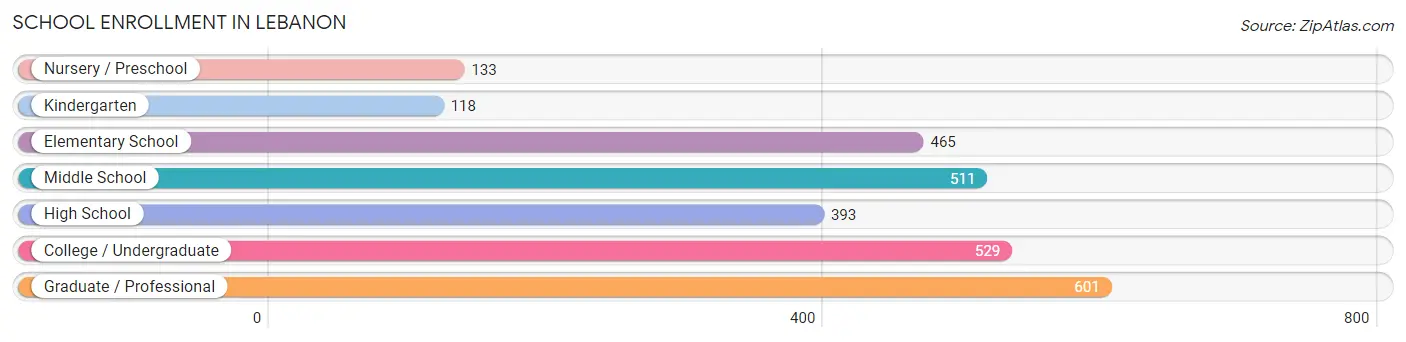
School Enrollment in Lebanon
The most common levels of schooling among the 2,750 students in Lebanon are graduate / professional (601 | 21.8%), college / undergraduate (529 | 19.2%), and middle school (511 | 18.6%).
| School Level | # Students | % Students |
| Nursery / Preschool | 133 | 4.8% |
| Kindergarten | 118 | 4.3% |
| Elementary School | 465 | 16.9% |
| Middle School | 511 | 18.6% |
| High School | 393 | 14.3% |
| College / Undergraduate | 529 | 19.2% |
| Graduate / Professional | 601 | 21.8% |
| Total | 2,750 | 100.0% |
School Enrollment by Age by Funding Source in Lebanon
Out of a total of 2,750 students who are enrolled in schools in Lebanon, 1,001 (36.4%) attend a private institution, while the remaining 1,749 (63.6%) are enrolled in public schools. The age group of 25 to 34 year olds has the highest likelihood of being enrolled in private schools, with 328 (76.3% in the age bracket) enrolled. Conversely, the age group of 15 to 17 year olds has the lowest likelihood of being enrolled in a private school, with 299 (100.0% in the age bracket) attending a public institution.
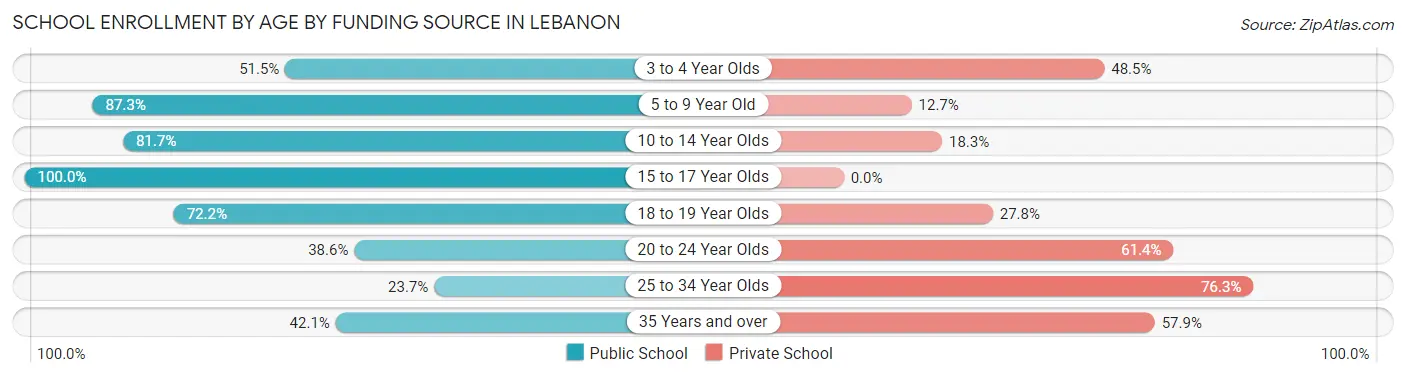
| Age Bracket | Public School | Private School |
| 3 to 4 Year Olds | 53 (51.5%) | 50 (48.5%) |
| 5 to 9 Year Old | 483 (87.3%) | 70 (12.7%) |
| 10 to 14 Year Olds | 517 (81.7%) | 116 (18.3%) |
| 15 to 17 Year Olds | 299 (100.0%) | 0 (0.0%) |
| 18 to 19 Year Olds | 13 (72.2%) | 5 (27.8%) |
| 20 to 24 Year Olds | 193 (38.6%) | 307 (61.4%) |
| 25 to 34 Year Olds | 102 (23.7%) | 328 (76.3%) |
| 35 Years and over | 90 (42.1%) | 124 (57.9%) |
| Total | 1,749 (63.6%) | 1,001 (36.4%) |
Educational Attainment by Field of Study in Lebanon
Science & technology (1,012 | 14.8%), bio, nature & agricultural (932 | 13.6%), social sciences (819 | 12.0%), engineering (611 | 8.9%), and liberal arts & history (550 | 8.0%) are the most common fields of study among 6,840 individuals in Lebanon who have obtained a bachelor's degree or higher.
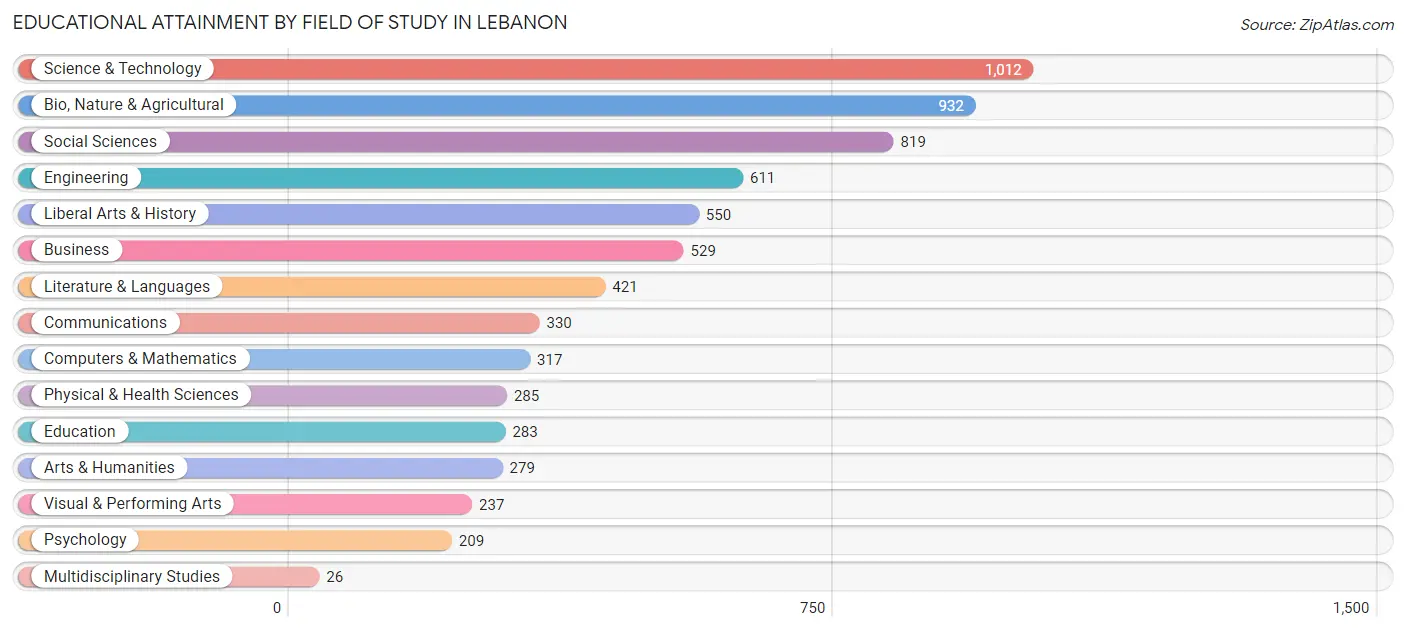
| Field of Study | # Graduates | % Graduates |
| Computers & Mathematics | 317 | 4.6% |
| Bio, Nature & Agricultural | 932 | 13.6% |
| Physical & Health Sciences | 285 | 4.2% |
| Psychology | 209 | 3.1% |
| Social Sciences | 819 | 12.0% |
| Engineering | 611 | 8.9% |
| Multidisciplinary Studies | 26 | 0.4% |
| Science & Technology | 1,012 | 14.8% |
| Business | 529 | 7.7% |
| Education | 283 | 4.1% |
| Literature & Languages | 421 | 6.1% |
| Liberal Arts & History | 550 | 8.0% |
| Visual & Performing Arts | 237 | 3.5% |
| Communications | 330 | 4.8% |
| Arts & Humanities | 279 | 4.1% |
| Total | 6,840 | 100.0% |
Transportation & Commute in Lebanon
Vehicle Availability by Sex in Lebanon
The most prevalent vehicle ownership categories in Lebanon are males with 2 vehicles (1,900, accounting for 45.4%) and females with 2 vehicles (2,520, making up 43.0%).
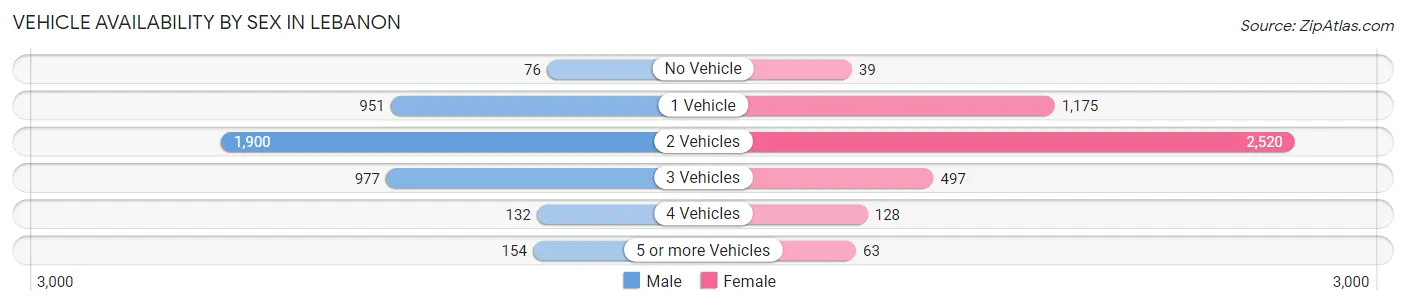
| Vehicles Available | Male | Female |
| No Vehicle | 76 (1.8%) | 39 (0.9%) |
| 1 Vehicle | 951 (22.7%) | 1,175 (26.6%) |
| 2 Vehicles | 1,900 (45.4%) | 2,520 (57.0%) |
| 3 Vehicles | 977 (23.3%) | 497 (11.2%) |
| 4 Vehicles | 132 (3.2%) | 128 (2.9%) |
| 5 or more Vehicles | 154 (3.7%) | 63 (1.4%) |
| Total | 4,190 (100.0%) | 4,422 (100.0%) |
Commute Time in Lebanon
The most frequently occuring commute durations in Lebanon are 10 to 14 minutes (2,210 commuters, 31.2%), 15 to 19 minutes (1,772 commuters, 25.0%), and 5 to 9 minutes (1,189 commuters, 16.8%).
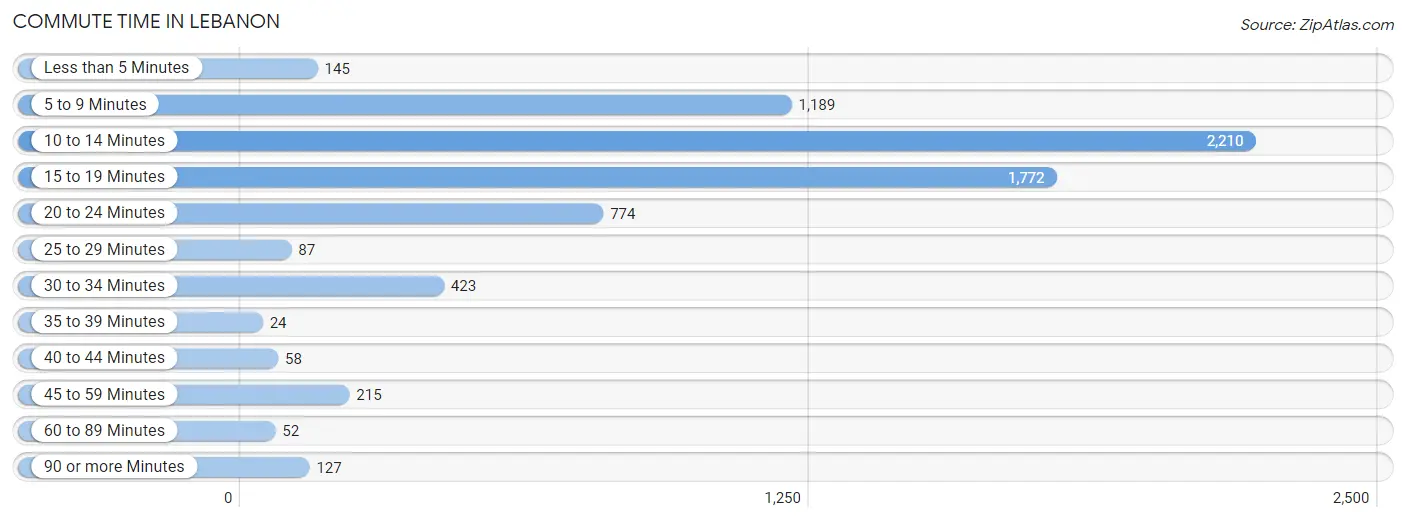
| Commute Time | # Commuters | % Commuters |
| Less than 5 Minutes | 145 | 2.1% |
| 5 to 9 Minutes | 1,189 | 16.8% |
| 10 to 14 Minutes | 2,210 | 31.2% |
| 15 to 19 Minutes | 1,772 | 25.0% |
| 20 to 24 Minutes | 774 | 10.9% |
| 25 to 29 Minutes | 87 | 1.2% |
| 30 to 34 Minutes | 423 | 6.0% |
| 35 to 39 Minutes | 24 | 0.3% |
| 40 to 44 Minutes | 58 | 0.8% |
| 45 to 59 Minutes | 215 | 3.0% |
| 60 to 89 Minutes | 52 | 0.7% |
| 90 or more Minutes | 127 | 1.8% |
Commute Time by Sex in Lebanon
The most common commute times in Lebanon are 10 to 14 minutes (1,243 commuters, 36.3%) for males and 10 to 14 minutes (967 commuters, 26.5%) for females.
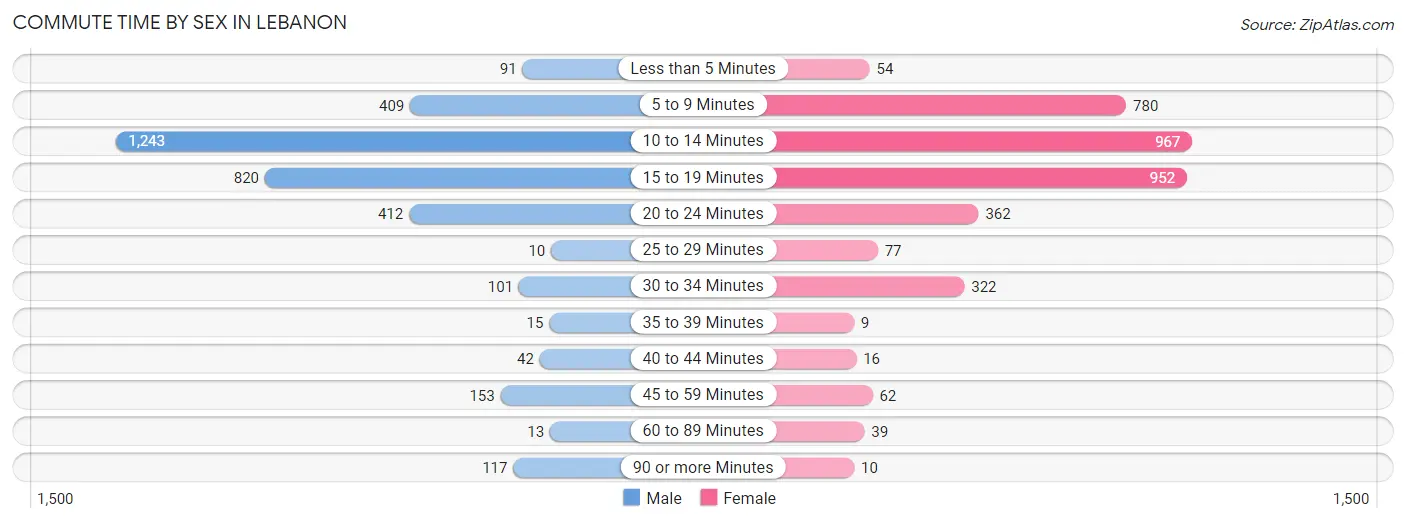
| Commute Time | Male | Female |
| Less than 5 Minutes | 91 (2.7%) | 54 (1.5%) |
| 5 to 9 Minutes | 409 (11.9%) | 780 (21.4%) |
| 10 to 14 Minutes | 1,243 (36.3%) | 967 (26.5%) |
| 15 to 19 Minutes | 820 (23.9%) | 952 (26.1%) |
| 20 to 24 Minutes | 412 (12.0%) | 362 (9.9%) |
| 25 to 29 Minutes | 10 (0.3%) | 77 (2.1%) |
| 30 to 34 Minutes | 101 (2.9%) | 322 (8.8%) |
| 35 to 39 Minutes | 15 (0.4%) | 9 (0.3%) |
| 40 to 44 Minutes | 42 (1.2%) | 16 (0.4%) |
| 45 to 59 Minutes | 153 (4.5%) | 62 (1.7%) |
| 60 to 89 Minutes | 13 (0.4%) | 39 (1.1%) |
| 90 or more Minutes | 117 (3.4%) | 10 (0.3%) |
Time of Departure to Work by Sex in Lebanon
The most frequent times of departure to work in Lebanon are 6:30 AM to 6:59 AM (563, 16.4%) for males and 7:00 AM to 7:29 AM (648, 17.7%) for females.
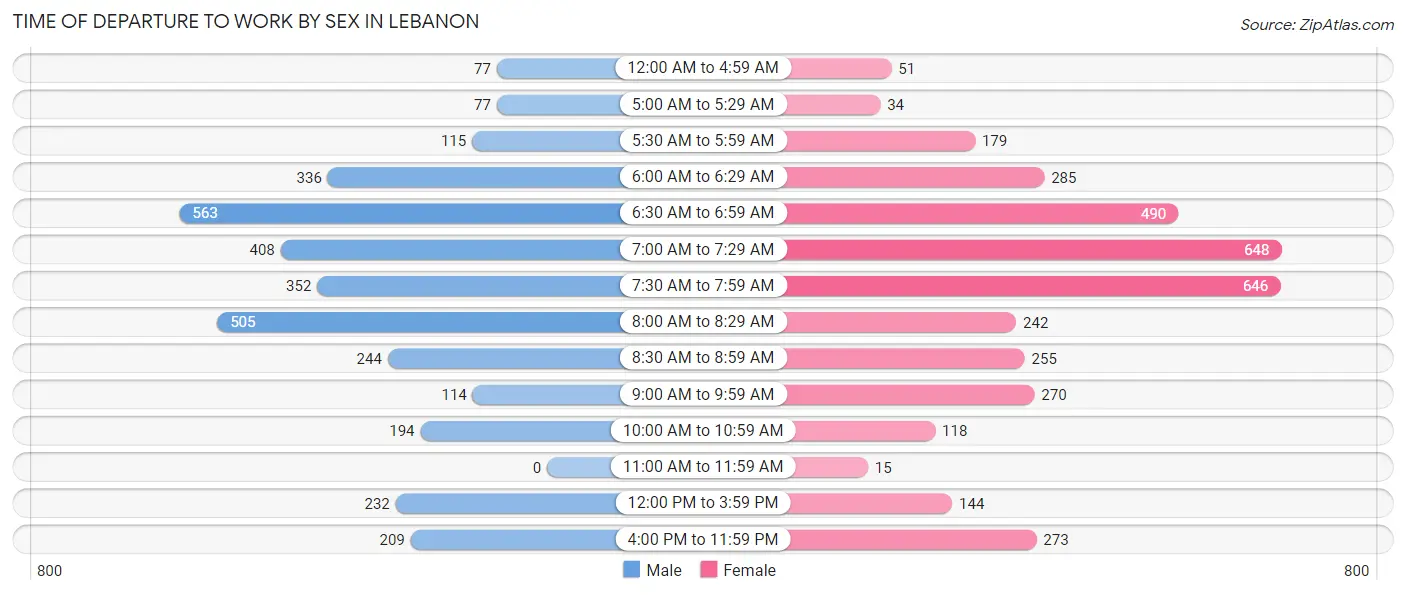
| Time of Departure | Male | Female |
| 12:00 AM to 4:59 AM | 77 (2.2%) | 51 (1.4%) |
| 5:00 AM to 5:29 AM | 77 (2.2%) | 34 (0.9%) |
| 5:30 AM to 5:59 AM | 115 (3.4%) | 179 (4.9%) |
| 6:00 AM to 6:29 AM | 336 (9.8%) | 285 (7.8%) |
| 6:30 AM to 6:59 AM | 563 (16.4%) | 490 (13.4%) |
| 7:00 AM to 7:29 AM | 408 (11.9%) | 648 (17.7%) |
| 7:30 AM to 7:59 AM | 352 (10.3%) | 646 (17.7%) |
| 8:00 AM to 8:29 AM | 505 (14.7%) | 242 (6.6%) |
| 8:30 AM to 8:59 AM | 244 (7.1%) | 255 (7.0%) |
| 9:00 AM to 9:59 AM | 114 (3.3%) | 270 (7.4%) |
| 10:00 AM to 10:59 AM | 194 (5.7%) | 118 (3.2%) |
| 11:00 AM to 11:59 AM | 0 (0.0%) | 15 (0.4%) |
| 12:00 PM to 3:59 PM | 232 (6.8%) | 144 (4.0%) |
| 4:00 PM to 11:59 PM | 209 (6.1%) | 273 (7.5%) |
| Total | 3,426 (100.0%) | 3,650 (100.0%) |
Housing Occupancy in Lebanon
Occupancy by Ownership in Lebanon
Of the total 6,099 dwellings in Lebanon, owner-occupied units account for 3,190 (52.3%), while renter-occupied units make up 2,909 (47.7%).
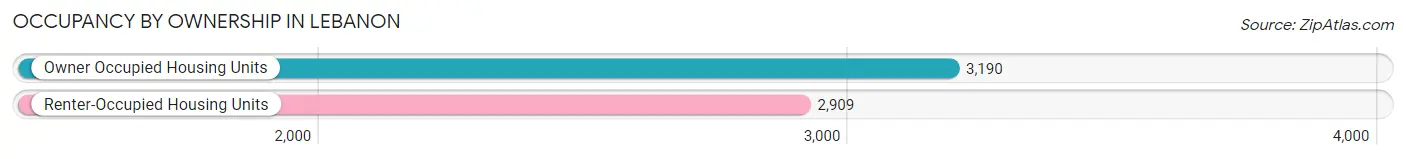
| Occupancy | # Housing Units | % Housing Units |
| Owner Occupied Housing Units | 3,190 | 52.3% |
| Renter-Occupied Housing Units | 2,909 | 47.7% |
| Total Occupied Housing Units | 6,099 | 100.0% |
Occupancy by Household Size in Lebanon
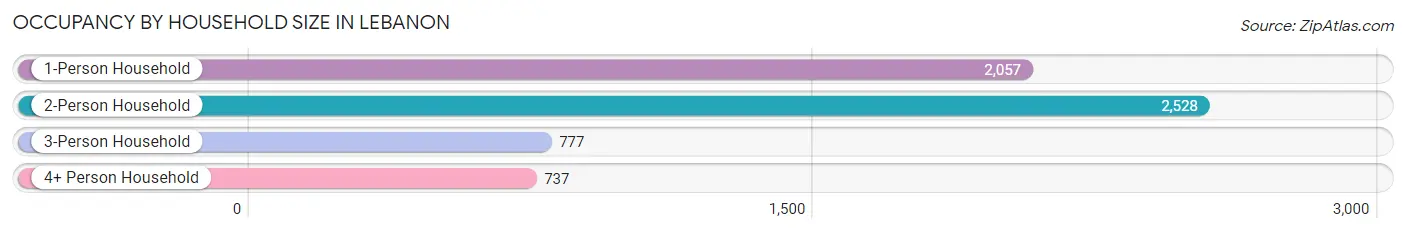
| Household Size | # Housing Units | % Housing Units |
| 1-Person Household | 2,057 | 33.7% |
| 2-Person Household | 2,528 | 41.4% |
| 3-Person Household | 777 | 12.7% |
| 4+ Person Household | 737 | 12.1% |
| Total Housing Units | 6,099 | 100.0% |
Occupancy by Ownership by Household Size in Lebanon
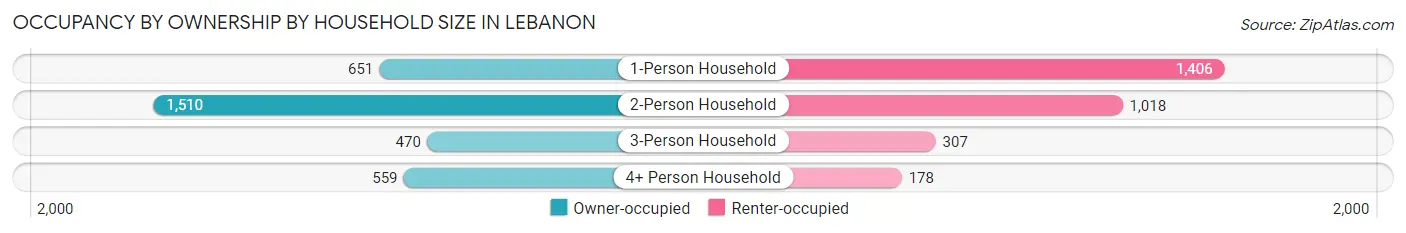
| Household Size | Owner-occupied | Renter-occupied |
| 1-Person Household | 651 (31.7%) | 1,406 (68.3%) |
| 2-Person Household | 1,510 (59.7%) | 1,018 (40.3%) |
| 3-Person Household | 470 (60.5%) | 307 (39.5%) |
| 4+ Person Household | 559 (75.8%) | 178 (24.1%) |
| Total Housing Units | 3,190 (52.3%) | 2,909 (47.7%) |
Occupancy by Educational Attainment in Lebanon
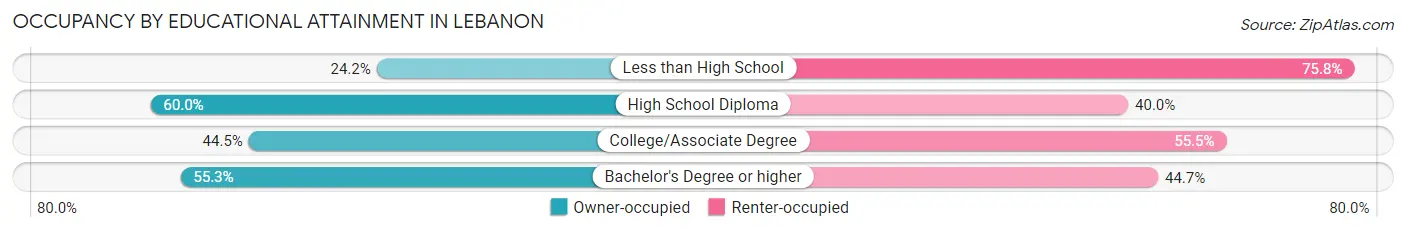
| Household Size | Owner-occupied | Renter-occupied |
| Less than High School | 96 (24.2%) | 301 (75.8%) |
| High School Diploma | 667 (60.0%) | 444 (40.0%) |
| College/Associate Degree | 457 (44.5%) | 571 (55.5%) |
| Bachelor's Degree or higher | 1,970 (55.3%) | 1,593 (44.7%) |
Occupancy by Age of Householder in Lebanon
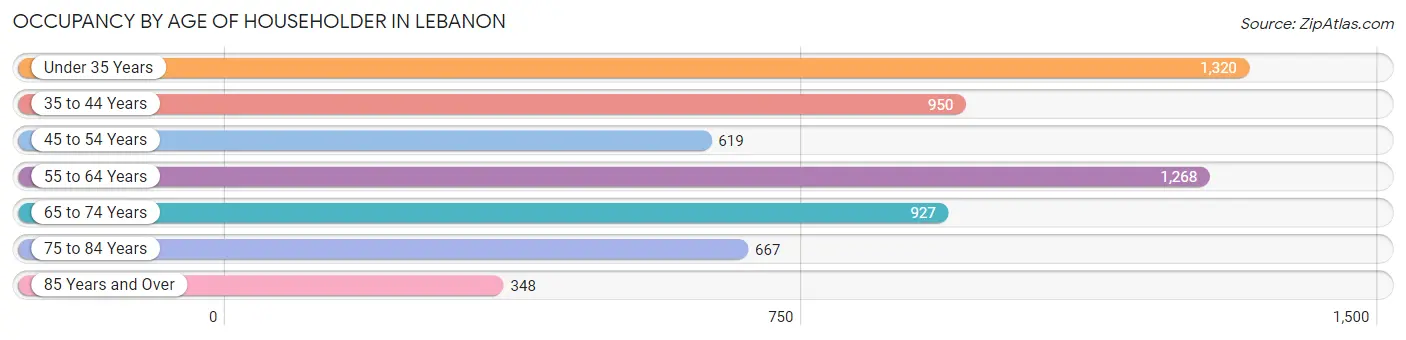
| Age Bracket | # Households | % Households |
| Under 35 Years | 1,320 | 21.6% |
| 35 to 44 Years | 950 | 15.6% |
| 45 to 54 Years | 619 | 10.2% |
| 55 to 64 Years | 1,268 | 20.8% |
| 65 to 74 Years | 927 | 15.2% |
| 75 to 84 Years | 667 | 10.9% |
| 85 Years and Over | 348 | 5.7% |
| Total | 6,099 | 100.0% |
Housing Finances in Lebanon
Median Income by Occupancy in Lebanon
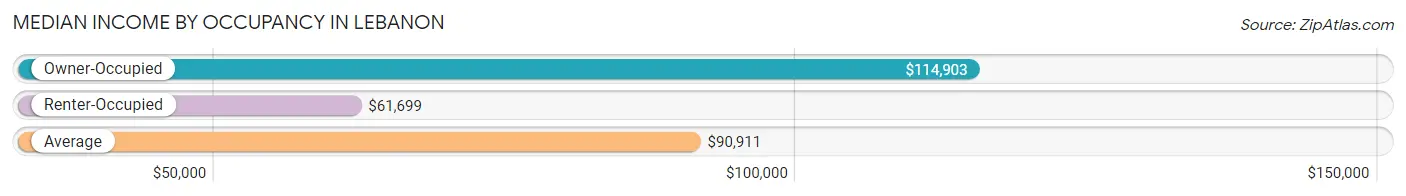
| Occupancy Type | # Households | Median Income |
| Owner-Occupied | 3,190 (52.3%) | $114,903 |
| Renter-Occupied | 2,909 (47.7%) | $61,699 |
| Average | 6,099 (100.0%) | $90,911 |
Occupancy by Householder Income Bracket in Lebanon
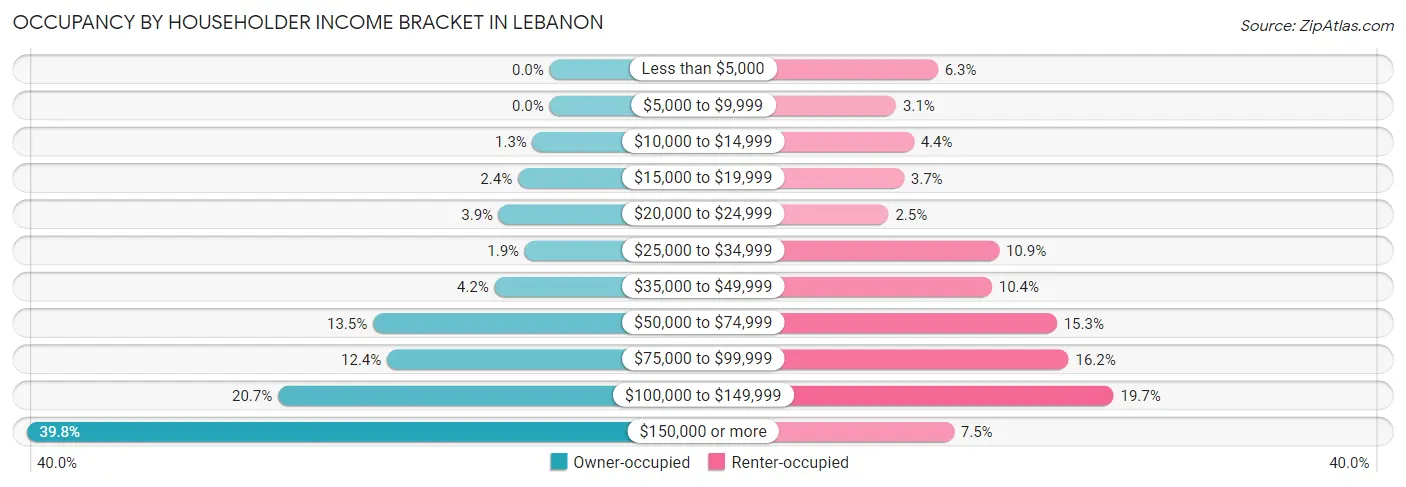
| Income Bracket | Owner-occupied | Renter-occupied |
| Less than $5,000 | 0 (0.0%) | 182 (6.3%) |
| $5,000 to $9,999 | 0 (0.0%) | 90 (3.1%) |
| $10,000 to $14,999 | 41 (1.3%) | 129 (4.4%) |
| $15,000 to $19,999 | 77 (2.4%) | 107 (3.7%) |
| $20,000 to $24,999 | 123 (3.9%) | 73 (2.5%) |
| $25,000 to $34,999 | 60 (1.9%) | 318 (10.9%) |
| $35,000 to $49,999 | 134 (4.2%) | 302 (10.4%) |
| $50,000 to $74,999 | 429 (13.5%) | 446 (15.3%) |
| $75,000 to $99,999 | 395 (12.4%) | 472 (16.2%) |
| $100,000 to $149,999 | 660 (20.7%) | 572 (19.7%) |
| $150,000 or more | 1,271 (39.8%) | 218 (7.5%) |
| Total | 3,190 (100.0%) | 2,909 (100.0%) |
Monthly Housing Cost Tiers in Lebanon
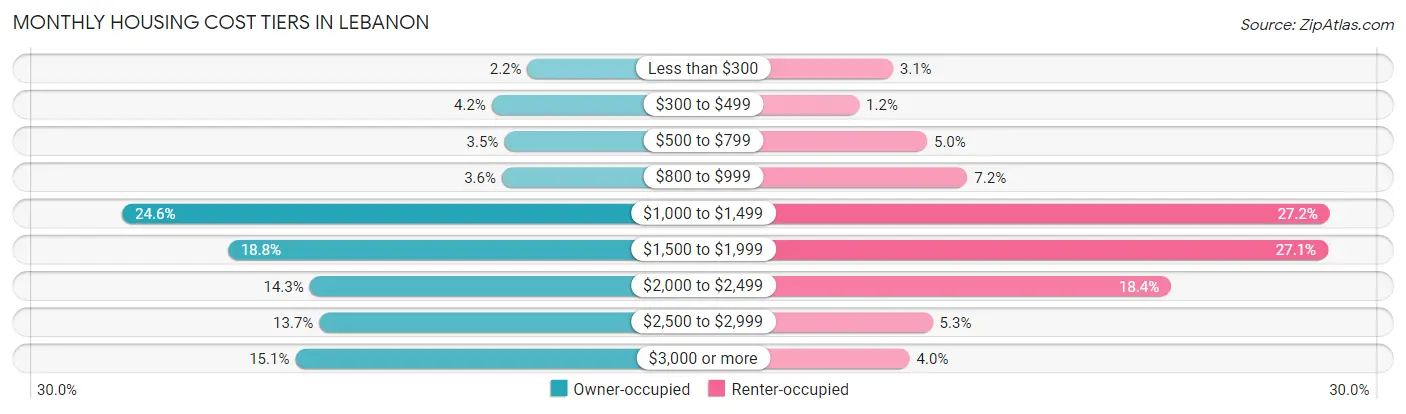
| Monthly Cost | Owner-occupied | Renter-occupied |
| Less than $300 | 71 (2.2%) | 89 (3.1%) |
| $300 to $499 | 134 (4.2%) | 35 (1.2%) |
| $500 to $799 | 112 (3.5%) | 144 (5.0%) |
| $800 to $999 | 116 (3.6%) | 209 (7.2%) |
| $1,000 to $1,499 | 785 (24.6%) | 791 (27.2%) |
| $1,500 to $1,999 | 599 (18.8%) | 788 (27.1%) |
| $2,000 to $2,499 | 455 (14.3%) | 536 (18.4%) |
| $2,500 to $2,999 | 438 (13.7%) | 153 (5.3%) |
| $3,000 or more | 480 (15.0%) | 116 (4.0%) |
| Total | 3,190 (100.0%) | 2,909 (100.0%) |
Physical Housing Characteristics in Lebanon
Housing Structures in Lebanon
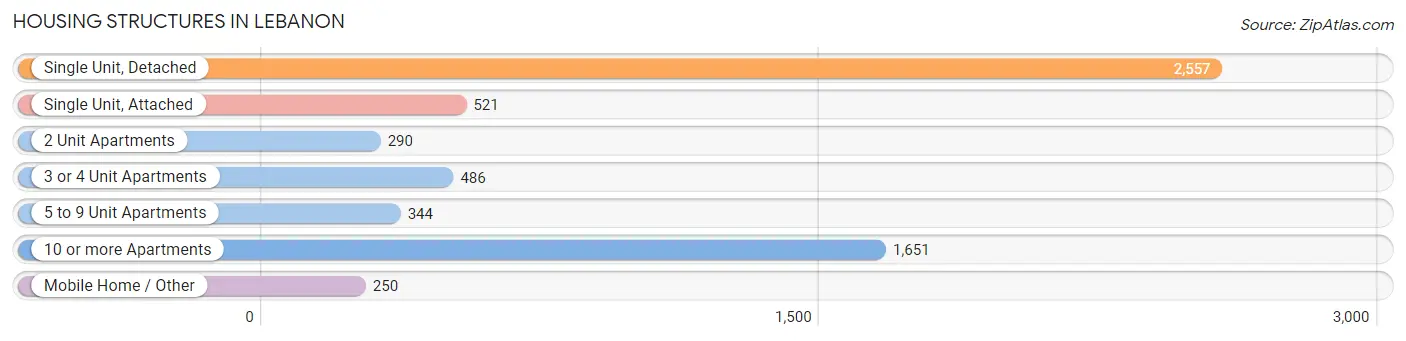
| Structure Type | # Housing Units | % Housing Units |
| Single Unit, Detached | 2,557 | 41.9% |
| Single Unit, Attached | 521 | 8.5% |
| 2 Unit Apartments | 290 | 4.8% |
| 3 or 4 Unit Apartments | 486 | 8.0% |
| 5 to 9 Unit Apartments | 344 | 5.6% |
| 10 or more Apartments | 1,651 | 27.1% |
| Mobile Home / Other | 250 | 4.1% |
| Total | 6,099 | 100.0% |
Housing Structures by Occupancy in Lebanon
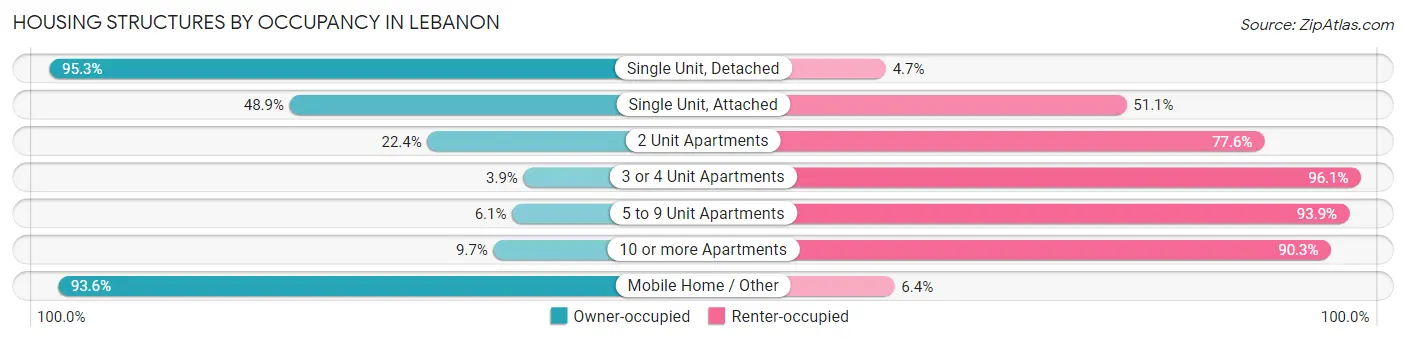
| Structure Type | Owner-occupied | Renter-occupied |
| Single Unit, Detached | 2,436 (95.3%) | 121 (4.7%) |
| Single Unit, Attached | 255 (48.9%) | 266 (51.1%) |
| 2 Unit Apartments | 65 (22.4%) | 225 (77.6%) |
| 3 or 4 Unit Apartments | 19 (3.9%) | 467 (96.1%) |
| 5 to 9 Unit Apartments | 21 (6.1%) | 323 (93.9%) |
| 10 or more Apartments | 160 (9.7%) | 1,491 (90.3%) |
| Mobile Home / Other | 234 (93.6%) | 16 (6.4%) |
| Total | 3,190 (52.3%) | 2,909 (47.7%) |
Housing Structures by Number of Rooms in Lebanon
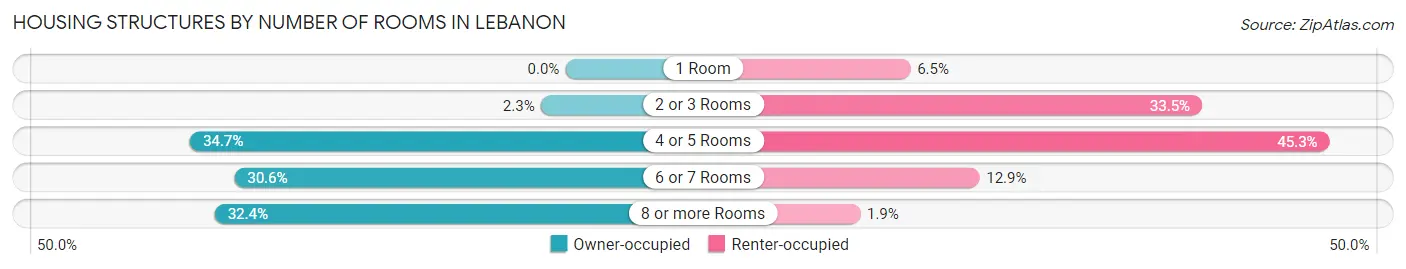
| Number of Rooms | Owner-occupied | Renter-occupied |
| 1 Room | 0 (0.0%) | 189 (6.5%) |
| 2 or 3 Rooms | 73 (2.3%) | 974 (33.5%) |
| 4 or 5 Rooms | 1,107 (34.7%) | 1,317 (45.3%) |
| 6 or 7 Rooms | 976 (30.6%) | 375 (12.9%) |
| 8 or more Rooms | 1,034 (32.4%) | 54 (1.9%) |
| Total | 3,190 (100.0%) | 2,909 (100.0%) |
Housing Structure by Heating Type in Lebanon
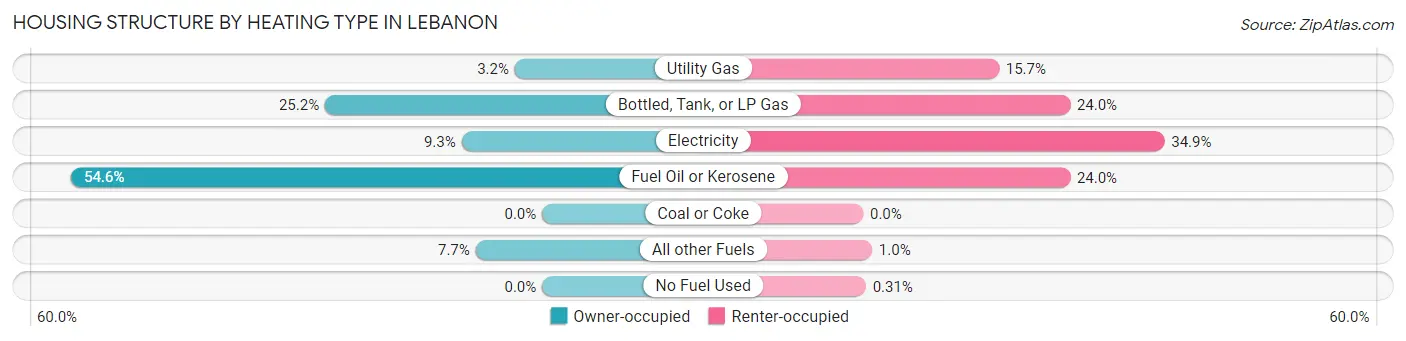
| Heating Type | Owner-occupied | Renter-occupied |
| Utility Gas | 101 (3.2%) | 458 (15.7%) |
| Bottled, Tank, or LP Gas | 803 (25.2%) | 698 (24.0%) |
| Electricity | 298 (9.3%) | 1,016 (34.9%) |
| Fuel Oil or Kerosene | 1,742 (54.6%) | 698 (24.0%) |
| Coal or Coke | 0 (0.0%) | 0 (0.0%) |
| All other Fuels | 246 (7.7%) | 30 (1.0%) |
| No Fuel Used | 0 (0.0%) | 9 (0.3%) |
| Total | 3,190 (100.0%) | 2,909 (100.0%) |
Household Vehicle Usage in Lebanon
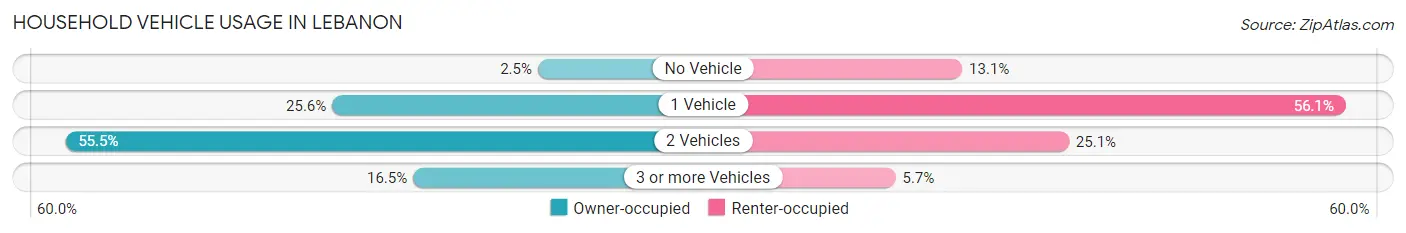
| Vehicles per Household | Owner-occupied | Renter-occupied |
| No Vehicle | 80 (2.5%) | 382 (13.1%) |
| 1 Vehicle | 815 (25.6%) | 1,632 (56.1%) |
| 2 Vehicles | 1,769 (55.4%) | 730 (25.1%) |
| 3 or more Vehicles | 526 (16.5%) | 165 (5.7%) |
| Total | 3,190 (100.0%) | 2,909 (100.0%) |
Real Estate & Mortgages in Lebanon
Real Estate and Mortgage Overview in Lebanon
| Characteristic | Without Mortgage | With Mortgage |
| Housing Units | 1,179 | 2,011 |
| Median Property Value | $286,000 | $329,300 |
| Median Household Income | $79,899 | $996 |
| Monthly Housing Costs | $1,101 | $480 |
| Real Estate Taxes | $7,833 | $70 |
Property Value by Mortgage Status in Lebanon
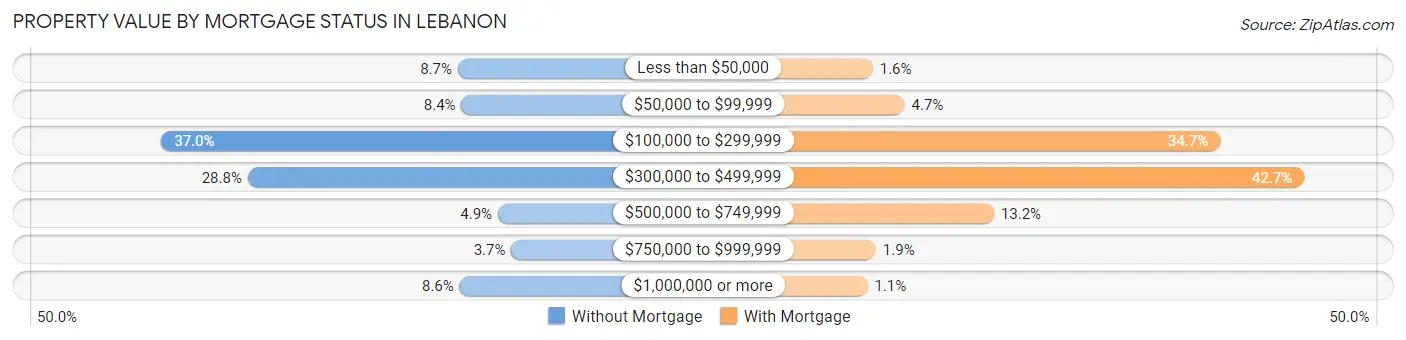
| Property Value | Without Mortgage | With Mortgage |
| Less than $50,000 | 103 (8.7%) | 33 (1.6%) |
| $50,000 to $99,999 | 99 (8.4%) | 94 (4.7%) |
| $100,000 to $299,999 | 436 (37.0%) | 698 (34.7%) |
| $300,000 to $499,999 | 339 (28.7%) | 859 (42.7%) |
| $500,000 to $749,999 | 58 (4.9%) | 265 (13.2%) |
| $750,000 to $999,999 | 43 (3.6%) | 39 (1.9%) |
| $1,000,000 or more | 101 (8.6%) | 23 (1.1%) |
| Total | 1,179 (100.0%) | 2,011 (100.0%) |
Household Income by Mortgage Status in Lebanon
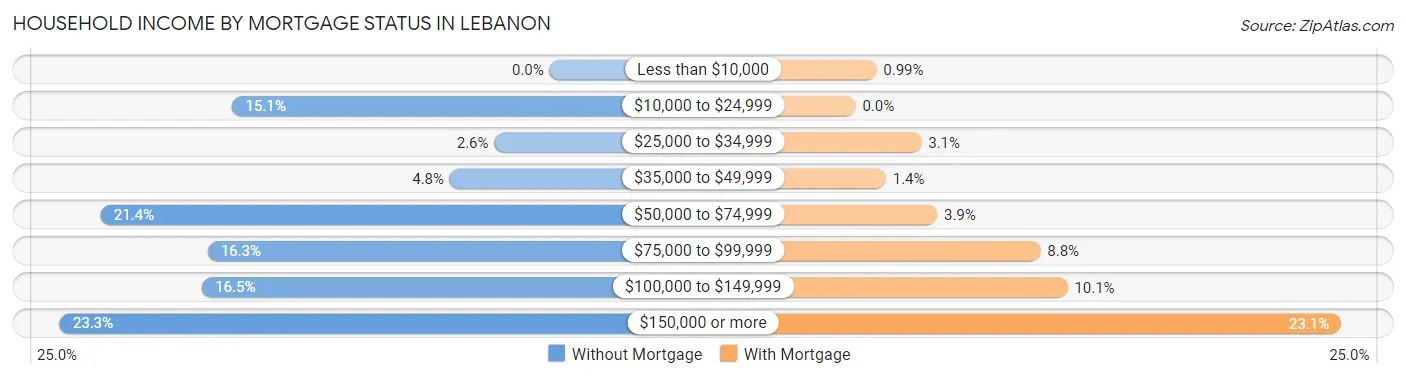
| Household Income | Without Mortgage | With Mortgage |
| Less than $10,000 | 0 (0.0%) | 20 (1.0%) |
| $10,000 to $24,999 | 178 (15.1%) | 0 (0.0%) |
| $25,000 to $34,999 | 31 (2.6%) | 63 (3.1%) |
| $35,000 to $49,999 | 56 (4.8%) | 29 (1.4%) |
| $50,000 to $74,999 | 252 (21.4%) | 78 (3.9%) |
| $75,000 to $99,999 | 192 (16.3%) | 177 (8.8%) |
| $100,000 to $149,999 | 195 (16.5%) | 203 (10.1%) |
| $150,000 or more | 275 (23.3%) | 465 (23.1%) |
| Total | 1,179 (100.0%) | 2,011 (100.0%) |
Property Value to Household Income Ratio in Lebanon
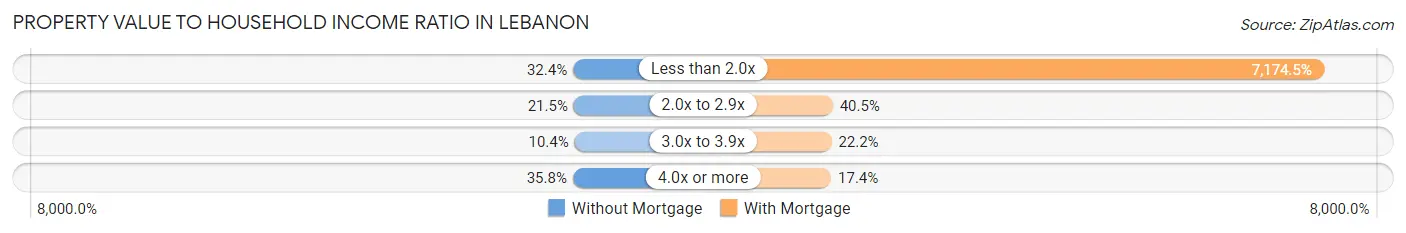
| Value-to-Income Ratio | Without Mortgage | With Mortgage |
| Less than 2.0x | 382 (32.4%) | 144,280 (7,174.5%) |
| 2.0x to 2.9x | 253 (21.5%) | 814 (40.5%) |
| 3.0x to 3.9x | 122 (10.3%) | 446 (22.2%) |
| 4.0x or more | 422 (35.8%) | 349 (17.3%) |
| Total | 1,179 (100.0%) | 2,011 (100.0%) |
Real Estate Taxes by Mortgage Status in Lebanon
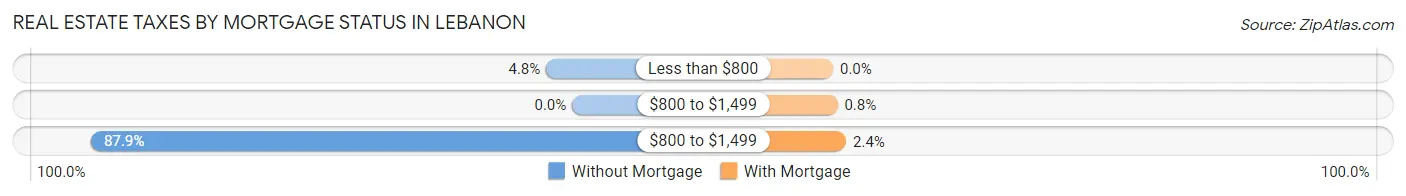
| Property Taxes | Without Mortgage | With Mortgage |
| Less than $800 | 56 (4.8%) | 0 (0.0%) |
| $800 to $1,499 | 0 (0.0%) | 16 (0.8%) |
| $800 to $1,499 | 1,036 (87.9%) | 48 (2.4%) |
| Total | 1,179 (100.0%) | 2,011 (100.0%) |
Health & Disability in Lebanon
Health Insurance Coverage by Age in Lebanon
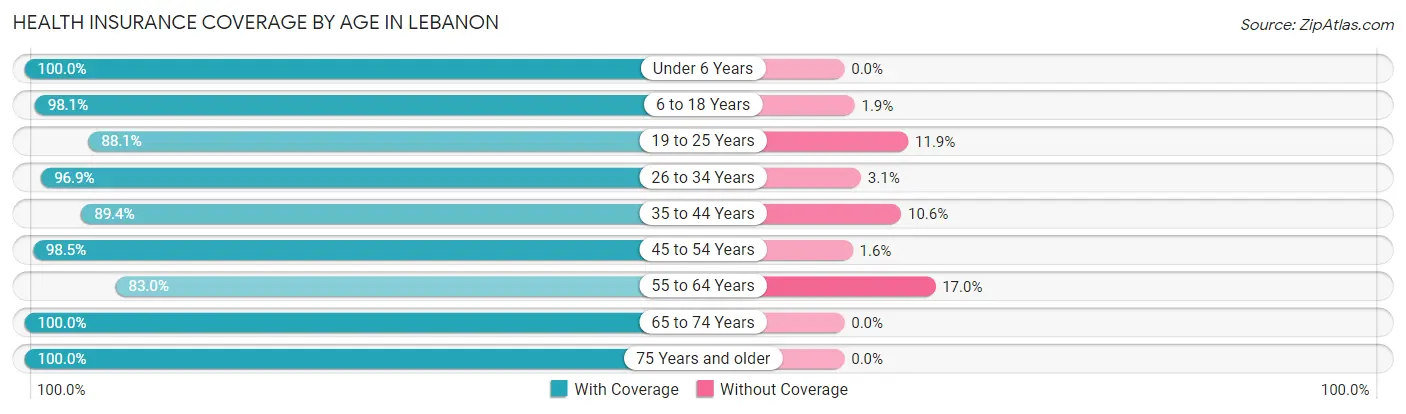
| Age Bracket | With Coverage | Without Coverage |
| Under 6 Years | 827 (100.0%) | 0 (0.0%) |
| 6 to 18 Years | 1,383 (98.1%) | 27 (1.9%) |
| 19 to 25 Years | 1,370 (88.1%) | 185 (11.9%) |
| 26 to 34 Years | 2,435 (96.9%) | 78 (3.1%) |
| 35 to 44 Years | 1,699 (89.4%) | 201 (10.6%) |
| 45 to 54 Years | 1,013 (98.5%) | 16 (1.5%) |
| 55 to 64 Years | 1,748 (83.0%) | 357 (17.0%) |
| 65 to 74 Years | 1,612 (100.0%) | 0 (0.0%) |
| 75 Years and older | 1,393 (100.0%) | 0 (0.0%) |
| Total | 13,480 (94.0%) | 864 (6.0%) |
Health Insurance Coverage by Citizenship Status in Lebanon
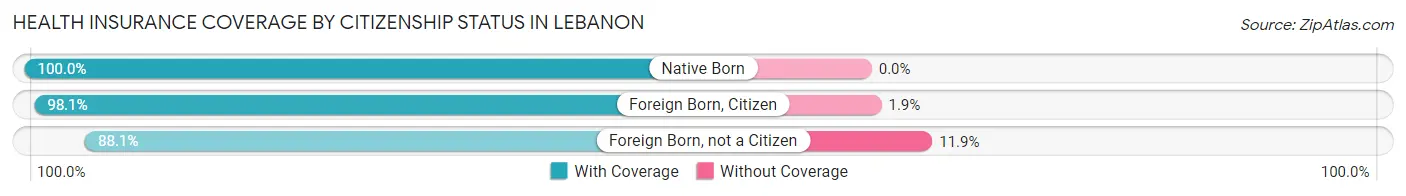
| Citizenship Status | With Coverage | Without Coverage |
| Native Born | 827 (100.0%) | 0 (0.0%) |
| Foreign Born, Citizen | 1,383 (98.1%) | 27 (1.9%) |
| Foreign Born, not a Citizen | 1,370 (88.1%) | 185 (11.9%) |
Health Insurance Coverage by Household Income in Lebanon
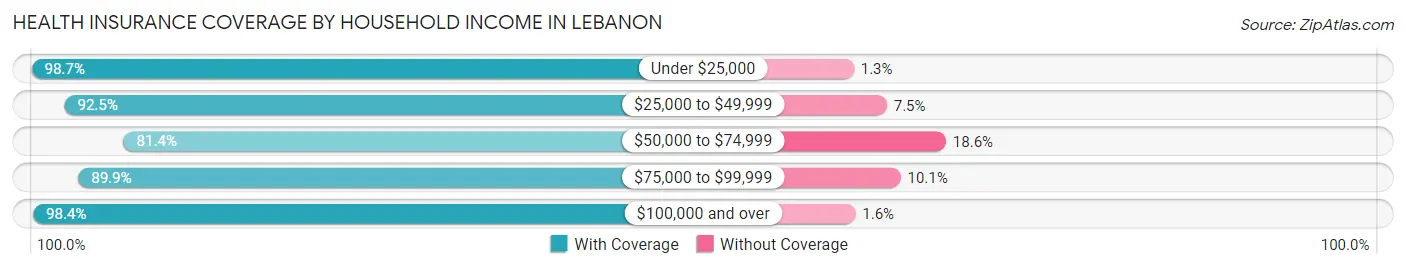
| Household Income | With Coverage | Without Coverage |
| Under $25,000 | 1,209 (98.7%) | 16 (1.3%) |
| $25,000 to $49,999 | 1,185 (92.5%) | 96 (7.5%) |
| $50,000 to $74,999 | 1,754 (81.4%) | 400 (18.6%) |
| $75,000 to $99,999 | 2,071 (89.9%) | 232 (10.1%) |
| $100,000 and over | 7,189 (98.4%) | 118 (1.6%) |
Public vs Private Health Insurance Coverage by Age in Lebanon
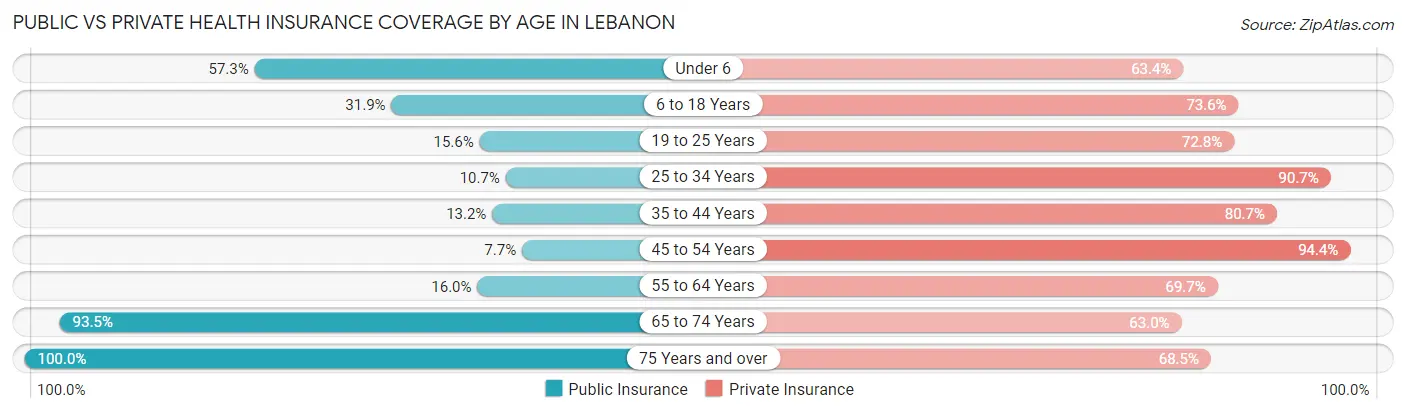
| Age Bracket | Public Insurance | Private Insurance |
| Under 6 | 474 (57.3%) | 524 (63.4%) |
| 6 to 18 Years | 450 (31.9%) | 1,038 (73.6%) |
| 19 to 25 Years | 242 (15.6%) | 1,132 (72.8%) |
| 25 to 34 Years | 269 (10.7%) | 2,280 (90.7%) |
| 35 to 44 Years | 251 (13.2%) | 1,534 (80.7%) |
| 45 to 54 Years | 79 (7.7%) | 971 (94.4%) |
| 55 to 64 Years | 336 (16.0%) | 1,468 (69.7%) |
| 65 to 74 Years | 1,507 (93.5%) | 1,016 (63.0%) |
| 75 Years and over | 1,393 (100.0%) | 954 (68.5%) |
| Total | 5,001 (34.9%) | 10,917 (76.1%) |
Disability Status by Sex by Age in Lebanon
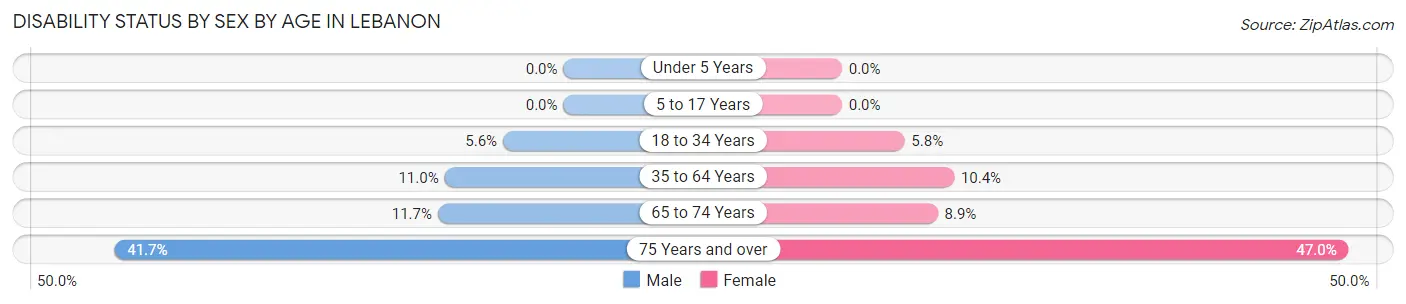
| Age Bracket | Male | Female |
| Under 5 Years | 0 (0.0%) | 0 (0.0%) |
| 5 to 17 Years | 0 (0.0%) | 0 (0.0%) |
| 18 to 34 Years | 104 (5.6%) | 132 (5.8%) |
| 35 to 64 Years | 285 (11.0%) | 255 (10.4%) |
| 65 to 74 Years | 79 (11.7%) | 83 (8.9%) |
| 75 Years and over | 265 (41.7%) | 356 (47.0%) |
Disability Class by Sex by Age in Lebanon
Disability Class: Hearing Difficulty
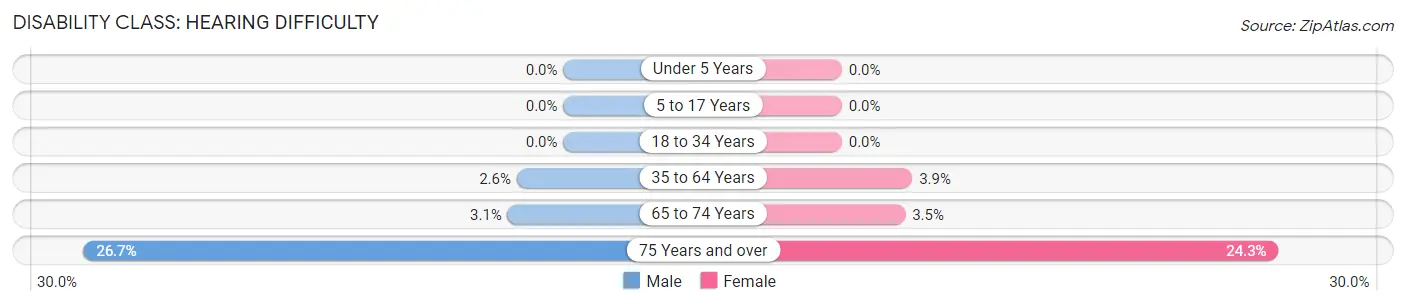
| Age Bracket | Male | Female |
| Under 5 Years | 0 (0.0%) | 0 (0.0%) |
| 5 to 17 Years | 0 (0.0%) | 0 (0.0%) |
| 18 to 34 Years | 0 (0.0%) | 0 (0.0%) |
| 35 to 64 Years | 67 (2.6%) | 96 (3.9%) |
| 65 to 74 Years | 21 (3.1%) | 33 (3.5%) |
| 75 Years and over | 170 (26.7%) | 184 (24.3%) |
Disability Class: Vision Difficulty
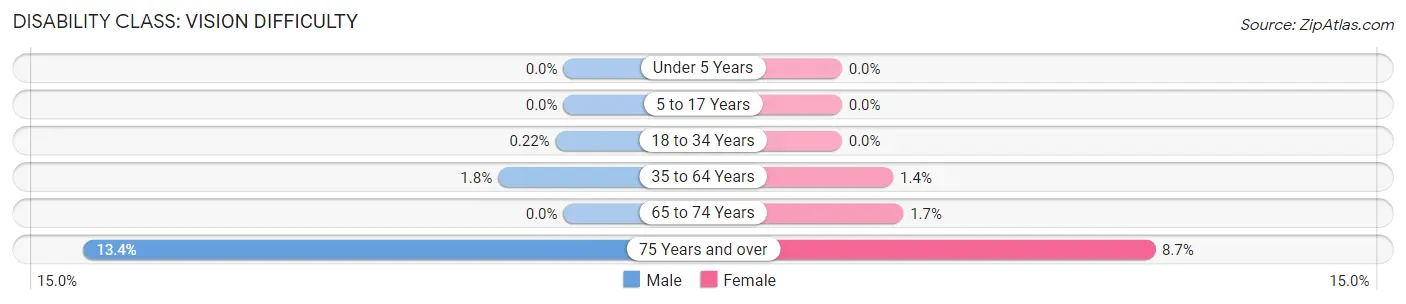
| Age Bracket | Male | Female |
| Under 5 Years | 0 (0.0%) | 0 (0.0%) |
| 5 to 17 Years | 0 (0.0%) | 0 (0.0%) |
| 18 to 34 Years | 4 (0.2%) | 0 (0.0%) |
| 35 to 64 Years | 47 (1.8%) | 35 (1.4%) |
| 65 to 74 Years | 0 (0.0%) | 16 (1.7%) |
| 75 Years and over | 85 (13.4%) | 66 (8.7%) |
Disability Class: Cognitive Difficulty
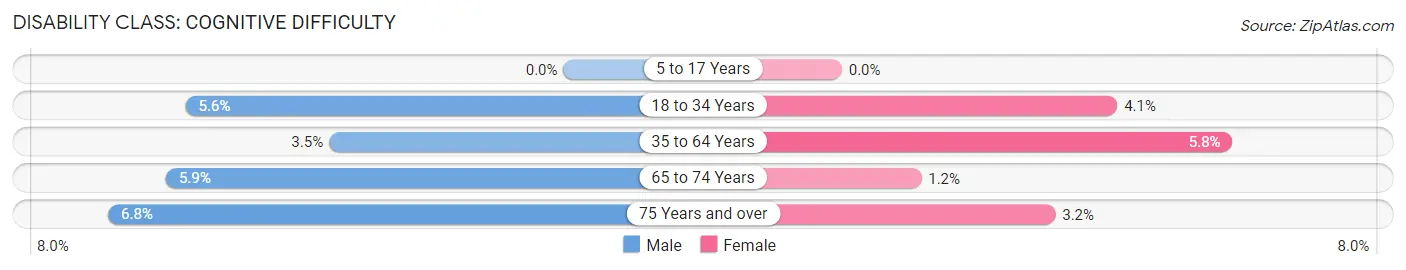
| Age Bracket | Male | Female |
| 5 to 17 Years | 0 (0.0%) | 0 (0.0%) |
| 18 to 34 Years | 104 (5.6%) | 93 (4.1%) |
| 35 to 64 Years | 90 (3.5%) | 142 (5.8%) |
| 65 to 74 Years | 40 (5.9%) | 11 (1.2%) |
| 75 Years and over | 43 (6.8%) | 24 (3.2%) |
Disability Class: Ambulatory Difficulty
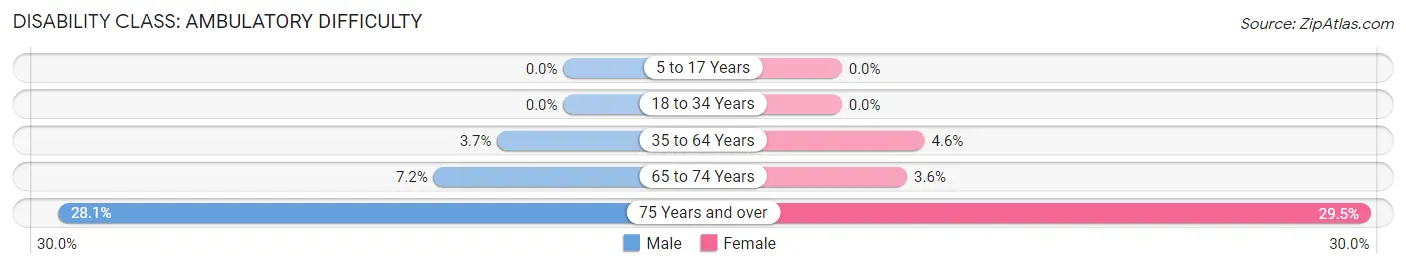
| Age Bracket | Male | Female |
| 5 to 17 Years | 0 (0.0%) | 0 (0.0%) |
| 18 to 34 Years | 0 (0.0%) | 0 (0.0%) |
| 35 to 64 Years | 95 (3.7%) | 113 (4.6%) |
| 65 to 74 Years | 49 (7.2%) | 34 (3.6%) |
| 75 Years and over | 179 (28.1%) | 223 (29.5%) |
Disability Class: Self-Care Difficulty
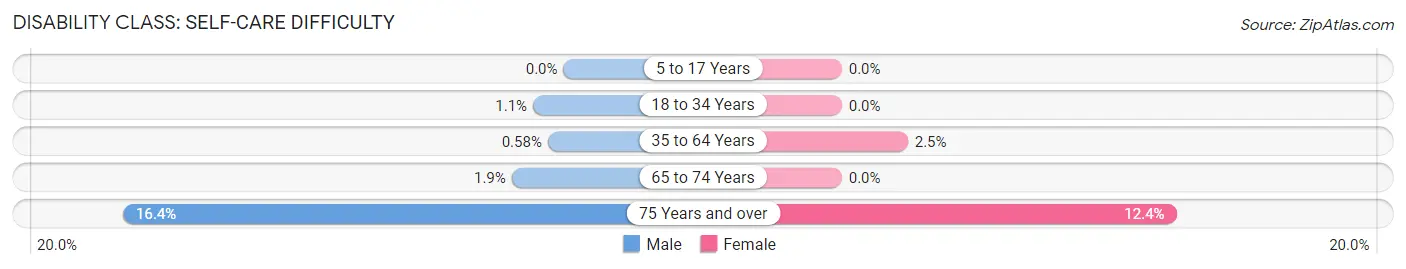
| Age Bracket | Male | Female |
| 5 to 17 Years | 0 (0.0%) | 0 (0.0%) |
| 18 to 34 Years | 21 (1.1%) | 0 (0.0%) |
| 35 to 64 Years | 15 (0.6%) | 60 (2.5%) |
| 65 to 74 Years | 13 (1.9%) | 0 (0.0%) |
| 75 Years and over | 104 (16.4%) | 94 (12.4%) |
Technology Access in Lebanon
Computing Device Access in Lebanon
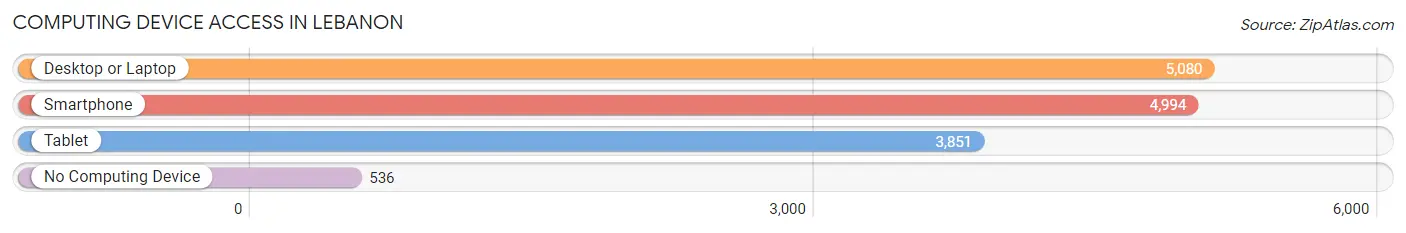
| Device Type | # Households | % Households |
| Desktop or Laptop | 5,080 | 83.3% |
| Smartphone | 4,994 | 81.9% |
| Tablet | 3,851 | 63.1% |
| No Computing Device | 536 | 8.8% |
| Total | 6,099 | 100.0% |
Internet Access in Lebanon
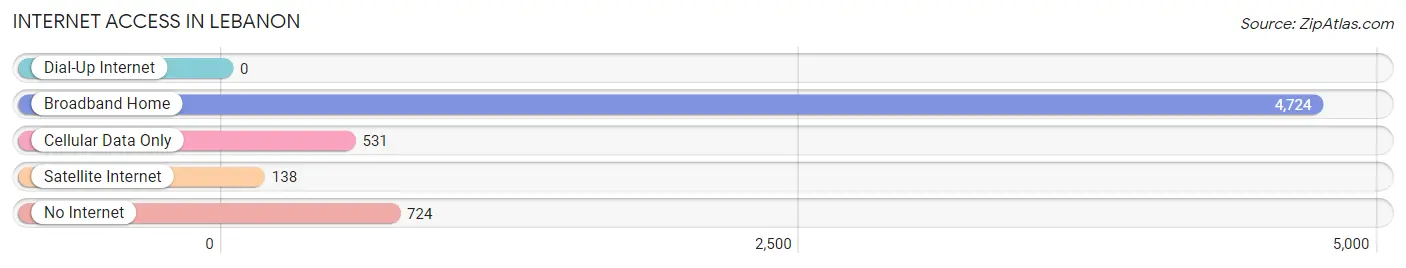
| Internet Type | # Households | % Households |
| Dial-Up Internet | 0 | 0.0% |
| Broadband Home | 4,724 | 77.5% |
| Cellular Data Only | 531 | 8.7% |
| Satellite Internet | 138 | 2.3% |
| No Internet | 724 | 11.9% |
| Total | 6,099 | 100.0% |
Lebanon Summary
Lebanon, New Hampshire is a small city located in the western part of the state, in Grafton County. It is situated in the Upper Connecticut River Valley, and is bordered by the towns of Hanover, Plainfield, and Enfield. The city is home to approximately 13,000 people, and is the largest city in the Upper Valley region.
History
Lebanon was first settled in 1761 by a group of settlers from Connecticut. The town was originally called Lebanon, after the biblical city of the same name. The town was incorporated in 1761, and was named after the biblical city of Lebanon. The town was originally a farming community, and the first industry in the area was a sawmill.
In the early 19th century, the town began to grow and develop. The first railroad line was built in 1848, connecting Lebanon to the nearby towns of Hanover and White River Junction. This allowed for the transportation of goods and people, and helped to spur the growth of the town.
In the late 19th century, the town began to industrialize. The first paper mill was built in 1872, and the first woolen mill was built in 1876. These industries helped to bring more people to the area, and the population of the town began to grow.
In the early 20th century, the town continued to grow and develop. The first hospital was built in 1910, and the first public library was built in 1912. The town also began to attract tourists, and the first hotel was built in 1915.
Geography
Lebanon is located in the Upper Connecticut River Valley, and is bordered by the towns of Hanover, Plainfield, and Enfield. The city is situated on the banks of the Connecticut River, and is surrounded by rolling hills and forests. The city is located at an elevation of 890 feet above sea level.
The climate in Lebanon is generally mild, with warm summers and cold winters. The average temperature in the summer is around 70 degrees Fahrenheit, and the average temperature in the winter is around 20 degrees Fahrenheit. The average annual precipitation is around 40 inches.
Economy
Lebanon’s economy is largely based on tourism and manufacturing. The city is home to several large manufacturing companies, including a paper mill, a woolen mill, and a plastics factory. The city also has a thriving tourism industry, with many visitors coming to the area to enjoy the natural beauty of the Upper Connecticut River Valley.
The city is also home to several educational institutions, including Dartmouth College, the University of New Hampshire, and the New England Culinary Institute. These institutions provide a large number of jobs to the local economy.
Demographics
As of the 2010 census, the population of Lebanon was 13,151. The racial makeup of the city was 94.3% White, 1.3% African American, 0.4% Native American, 1.2% Asian, 0.1% Pacific Islander, 1.2% from other races, and 1.5% from two or more races. Hispanic or Latino of any race were 3.2% of the population.
The median household income in Lebanon was $50,945, and the median family income was $63,945. The per capita income in the city was $27,945. About 8.3% of the population was below the poverty line.
Lebanon is a small city with a rich history and a vibrant economy. The city is home to several educational institutions, and is a popular tourist destination. The city has a diverse population, and is a great place to live and work.
Common Questions
What is Per Capita Income in Lebanon?
Per Capita income in Lebanon is $51,134.
What is the Median Family Income in Lebanon?
Median Family Income in Lebanon is $110,303.
What is the Median Household income in Lebanon?
Median Household Income in Lebanon is $90,911.
What is Income or Wage Gap in Lebanon?
Income or Wage Gap in Lebanon is 10.2%.
Women in Lebanon earn 89.8 cents for every dollar earned by a man.
What is Inequality or Gini Index in Lebanon?
Inequality or Gini Index in Lebanon is 0.44.
What is the Total Population of Lebanon?
Total Population of Lebanon is 14,515.
What is the Total Male Population of Lebanon?
Total Male Population of Lebanon is 6,992.
What is the Total Female Population of Lebanon?
Total Female Population of Lebanon is 7,523.
What is the Ratio of Males per 100 Females in Lebanon?
There are 92.94 Males per 100 Females in Lebanon.
What is the Ratio of Females per 100 Males in Lebanon?
There are 107.59 Females per 100 Males in Lebanon.
What is the Median Population Age in Lebanon?
Median Population Age in Lebanon is 38.5 Years.
What is the Average Family Size in Lebanon
Average Family Size in Lebanon is 3.1 People.
What is the Average Household Size in Lebanon
Average Household Size in Lebanon is 2.3 People.
How Large is the Labor Force in Lebanon?
There are 8,922 People in the Labor Forcein in Lebanon.
What is the Percentage of People in the Labor Force in Lebanon?
71.1% of People are in the Labor Force in Lebanon.
What is the Unemployment Rate in Lebanon?
Unemployment Rate in Lebanon is 0.7%.