Rochester, NH Map & Demographics
Rochester Map
Rochester Overview
$39,139
PER CAPITA INCOME
$91,295
AVG FAMILY INCOME
$74,882
AVG HOUSEHOLD INCOME
16.7%
WAGE / INCOME GAP [ % ]
83.3¢/ $1
WAGE / INCOME GAP [ $ ]
$11,057
FAMILY INCOME DEFICIT
0.43
INEQUALITY / GINI INDEX
32,573
TOTAL POPULATION
16,451
MALE POPULATION
16,122
FEMALE POPULATION
102.04
MALES / 100 FEMALES
98.00
FEMALES / 100 MALES
43.3
MEDIAN AGE
2.9
AVG FAMILY SIZE
2.4
AVG HOUSEHOLD SIZE
17,889
LABOR FORCE [ PEOPLE ]
66.4%
PERCENT IN LABOR FORCE
3.8%
UNEMPLOYMENT RATE
Rochester Area Codes
Income in Rochester
Income Overview in Rochester
Per Capita Income in Rochester is $39,139, while median incomes of families and households are $91,295 and $74,882 respectively.
| Characteristic | Number | Measure |
| Per Capita Income | 32,573 | $39,139 |
| Median Family Income | 8,270 | $91,295 |
| Mean Family Income | 8,270 | $111,010 |
| Median Household Income | 13,542 | $74,882 |
| Mean Household Income | 13,542 | $91,992 |
| Income Deficit | 8,270 | $11,057 |
| Wage / Income Gap (%) | 32,573 | 16.73% |
| Wage / Income Gap ($) | 32,573 | 83.27¢ per $1 |
| Gini / Inequality Index | 32,573 | 0.43 |
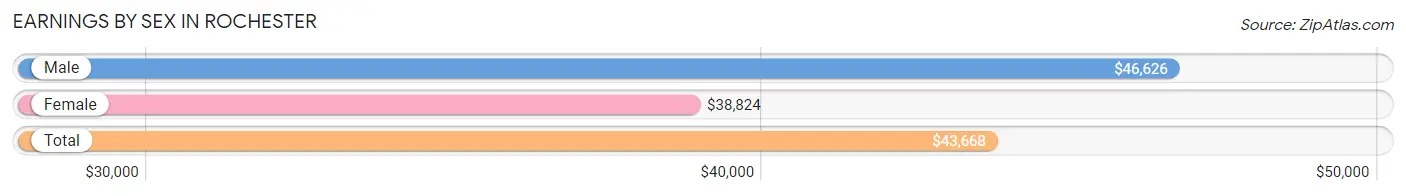
Earnings by Sex in Rochester
Average Earnings in Rochester are $43,668, $46,626 for men and $38,824 for women, a difference of 16.7%.
| Sex | Number | Average Earnings |
| Male | 9,785 (51.9%) | $46,626 |
| Female | 9,075 (48.1%) | $38,824 |
| Total | 18,860 (100.0%) | $43,668 |
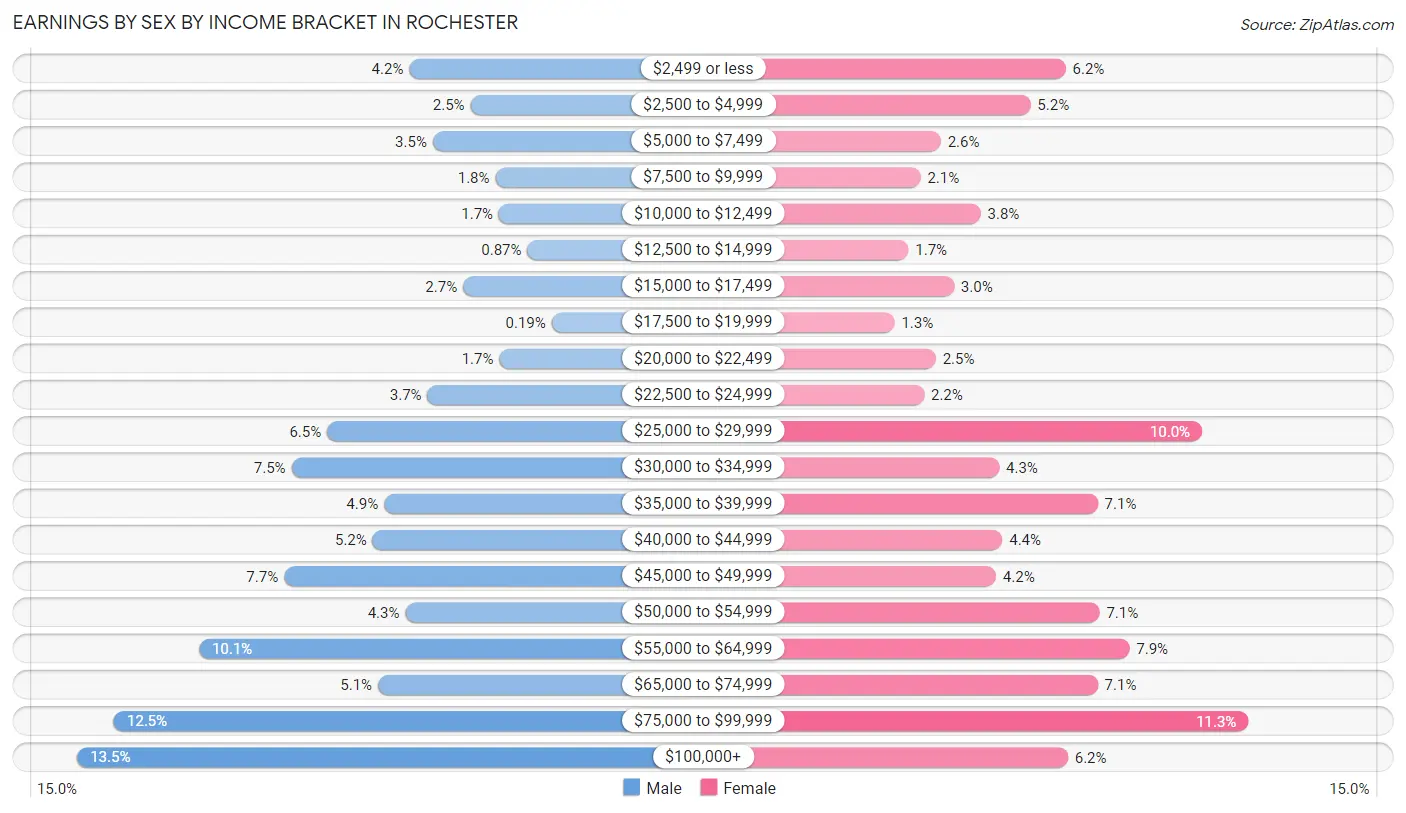
Earnings by Sex by Income Bracket in Rochester
The most common earnings brackets in Rochester are $100,000+ for men (1,323 | 13.5%) and $75,000 to $99,999 for women (1,024 | 11.3%).
| Income | Male | Female |
| $2,499 or less | 410 (4.2%) | 558 (6.1%) |
| $2,500 to $4,999 | 242 (2.5%) | 468 (5.2%) |
| $5,000 to $7,499 | 345 (3.5%) | 240 (2.6%) |
| $7,500 to $9,999 | 173 (1.8%) | 188 (2.1%) |
| $10,000 to $12,499 | 163 (1.7%) | 341 (3.8%) |
| $12,500 to $14,999 | 85 (0.9%) | 157 (1.7%) |
| $15,000 to $17,499 | 262 (2.7%) | 273 (3.0%) |
| $17,500 to $19,999 | 19 (0.2%) | 122 (1.3%) |
| $20,000 to $22,499 | 162 (1.7%) | 227 (2.5%) |
| $22,500 to $24,999 | 360 (3.7%) | 197 (2.2%) |
| $25,000 to $29,999 | 636 (6.5%) | 906 (10.0%) |
| $30,000 to $34,999 | 734 (7.5%) | 388 (4.3%) |
| $35,000 to $39,999 | 479 (4.9%) | 640 (7.0%) |
| $40,000 to $44,999 | 511 (5.2%) | 397 (4.4%) |
| $45,000 to $49,999 | 754 (7.7%) | 380 (4.2%) |
| $50,000 to $54,999 | 421 (4.3%) | 644 (7.1%) |
| $55,000 to $64,999 | 988 (10.1%) | 721 (7.9%) |
| $65,000 to $74,999 | 496 (5.1%) | 640 (7.0%) |
| $75,000 to $99,999 | 1,222 (12.5%) | 1,024 (11.3%) |
| $100,000+ | 1,323 (13.5%) | 564 (6.2%) |
| Total | 9,785 (100.0%) | 9,075 (100.0%) |
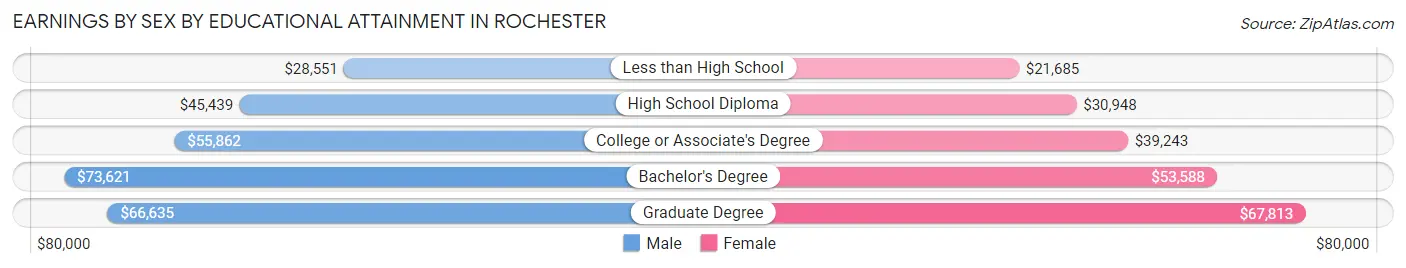
Earnings by Sex by Educational Attainment in Rochester
Average earnings in Rochester are $52,193 for men and $42,861 for women, a difference of 17.9%. Men with an educational attainment of bachelor's degree enjoy the highest average annual earnings of $73,621, while those with less than high school education earn the least with $28,551. Women with an educational attainment of graduate degree earn the most with the average annual earnings of $67,813, while those with less than high school education have the smallest earnings of $21,685.
| Educational Attainment | Male Income | Female Income |
| Less than High School | $28,551 | $21,685 |
| High School Diploma | $45,439 | $30,948 |
| College or Associate's Degree | $55,862 | $39,243 |
| Bachelor's Degree | $73,621 | $53,588 |
| Graduate Degree | $66,635 | $67,813 |
| Total | $52,193 | $42,861 |
Family Income in Rochester
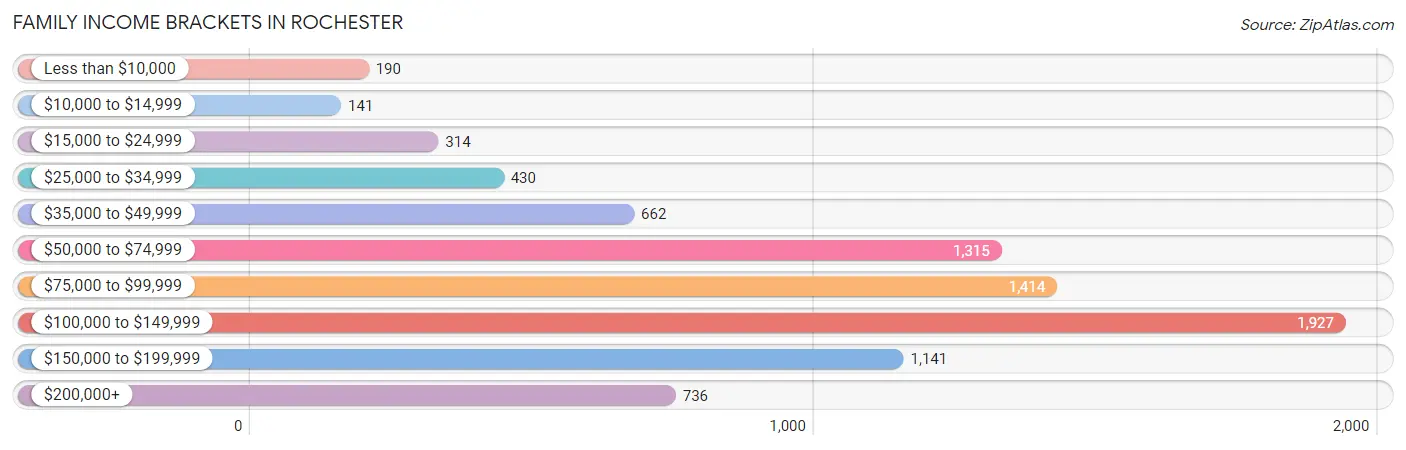
Family Income Brackets in Rochester
According to the Rochester family income data, there are 1,927 families falling into the $100,000 to $149,999 income range, which is the most common income bracket and makes up 23.3% of all families. Conversely, the $10,000 to $14,999 income bracket is the least frequent group with only 141 families (1.7%) belonging to this category.
| Income Bracket | # Families | % Families |
| Less than $10,000 | 190 | 2.3% |
| $10,000 to $14,999 | 141 | 1.7% |
| $15,000 to $24,999 | 314 | 3.8% |
| $25,000 to $34,999 | 430 | 5.2% |
| $35,000 to $49,999 | 662 | 8.0% |
| $50,000 to $74,999 | 1,315 | 15.9% |
| $75,000 to $99,999 | 1,414 | 17.1% |
| $100,000 to $149,999 | 1,927 | 23.3% |
| $150,000 to $199,999 | 1,141 | 13.8% |
| $200,000+ | 736 | 8.9% |
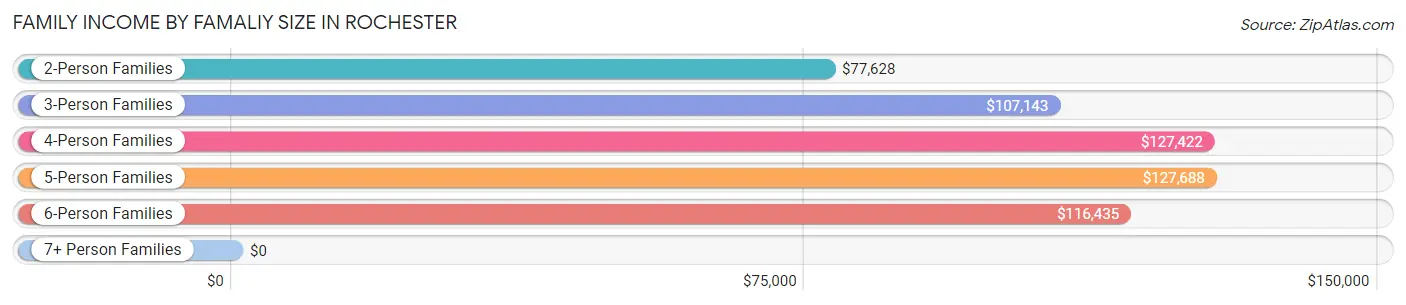
Family Income by Famaliy Size in Rochester
5-person families (575 | 7.0%) account for the highest median family income in Rochester with $127,688 per family, while 2-person families (4,580 | 55.4%) have the highest median income of $38,814 per family member.
| Income Bracket | # Families | Median Income |
| 2-Person Families | 4,580 (55.4%) | $77,628 |
| 3-Person Families | 1,676 (20.3%) | $107,143 |
| 4-Person Families | 1,195 (14.4%) | $127,422 |
| 5-Person Families | 575 (7.0%) | $127,688 |
| 6-Person Families | 171 (2.1%) | $116,435 |
| 7+ Person Families | 73 (0.9%) | $0 |
| Total | 8,270 (100.0%) | $91,295 |
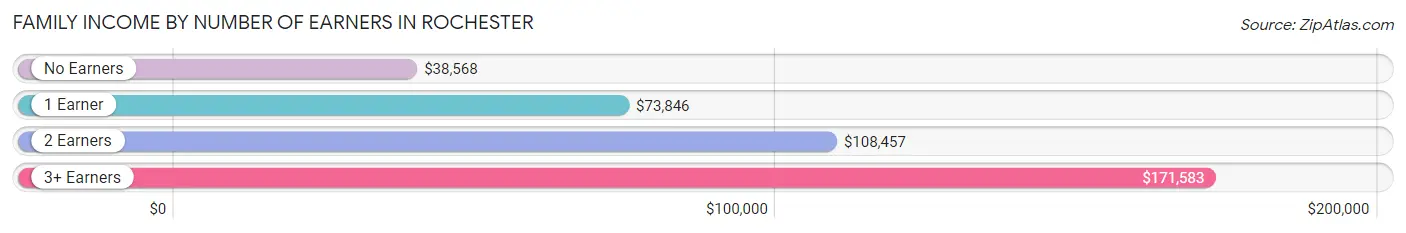
Family Income by Number of Earners in Rochester
The median family income in Rochester is $91,295, with families comprising 3+ earners (946) having the highest median family income of $171,583, while families with no earners (1,201) have the lowest median family income of $38,568, accounting for 11.4% and 14.5% of families, respectively.
| Number of Earners | # Families | Median Income |
| No Earners | 1,201 (14.5%) | $38,568 |
| 1 Earner | 2,182 (26.4%) | $73,846 |
| 2 Earners | 3,941 (47.6%) | $108,457 |
| 3+ Earners | 946 (11.4%) | $171,583 |
| Total | 8,270 (100.0%) | $91,295 |
Household Income in Rochester
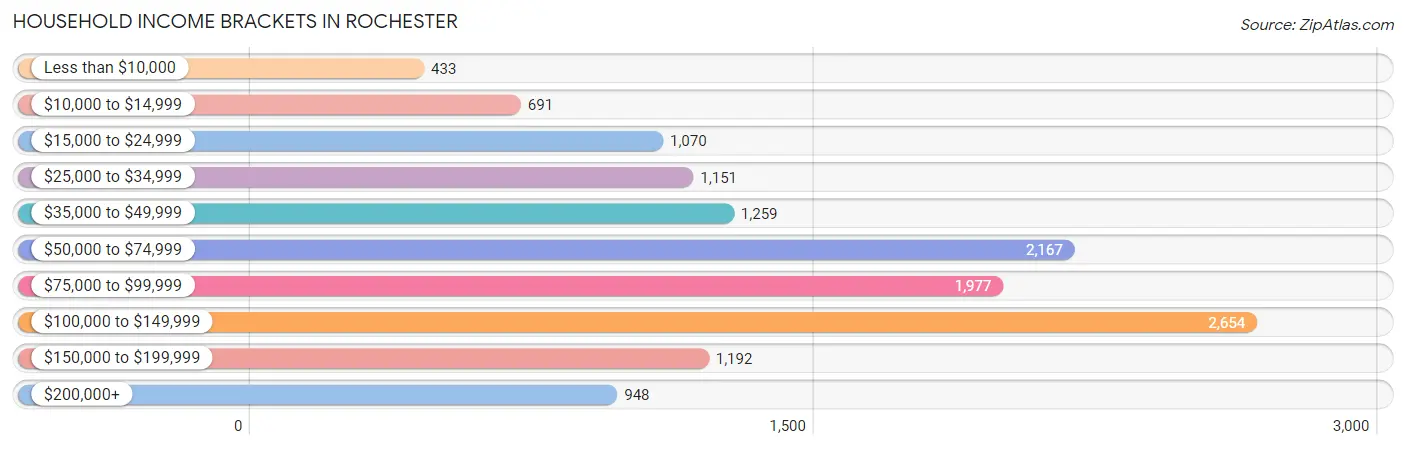
Household Income Brackets in Rochester
With 2,654 households falling in the category, the $100,000 to $149,999 income range is the most frequent in Rochester, accounting for 19.6% of all households. In contrast, only 433 households (3.2%) fall into the less than $10,000 income bracket, making it the least populous group.
| Income Bracket | # Households | % Households |
| Less than $10,000 | 433 | 3.2% |
| $10,000 to $14,999 | 691 | 5.1% |
| $15,000 to $24,999 | 1,070 | 7.9% |
| $25,000 to $34,999 | 1,151 | 8.5% |
| $35,000 to $49,999 | 1,259 | 9.3% |
| $50,000 to $74,999 | 2,167 | 16.0% |
| $75,000 to $99,999 | 1,977 | 14.6% |
| $100,000 to $149,999 | 2,654 | 19.6% |
| $150,000 to $199,999 | 1,192 | 8.8% |
| $200,000+ | 948 | 7.0% |
Household Income by Householder Age in Rochester
The median household income in Rochester is $74,882, with the highest median household income of $98,139 found in the 45 to 64 years age bracket for the primary householder. A total of 5,273 households (38.9%) fall into this category. Meanwhile, the 65+ years age bracket for the primary householder has the lowest median household income of $41,316, with 4,025 households (29.7%) in this group.
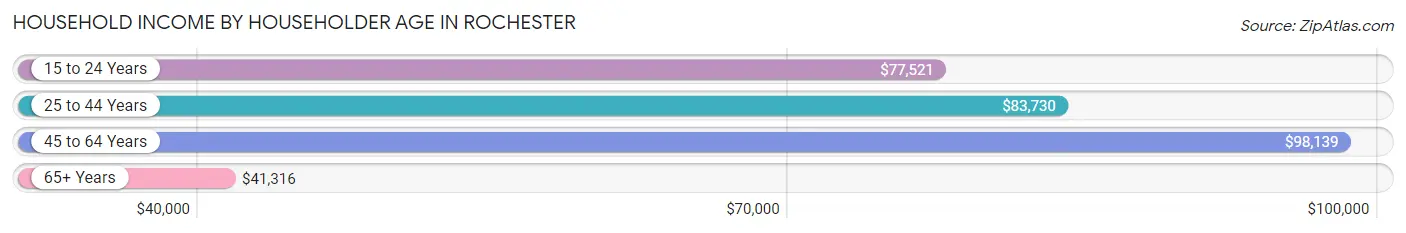
| Income Bracket | # Households | Median Income |
| 15 to 24 Years | 523 (3.9%) | $77,521 |
| 25 to 44 Years | 3,721 (27.5%) | $83,730 |
| 45 to 64 Years | 5,273 (38.9%) | $98,139 |
| 65+ Years | 4,025 (29.7%) | $41,316 |
| Total | 13,542 (100.0%) | $74,882 |
Poverty in Rochester
Income Below Poverty by Sex and Age in Rochester
With 8.4% poverty level for males and 11.3% for females among the residents of Rochester, 16 and 17 year old males and 65 to 74 year old females are the most vulnerable to poverty, with 98 males (19.4%) and 335 females (17.8%) in their respective age groups living below the poverty level.
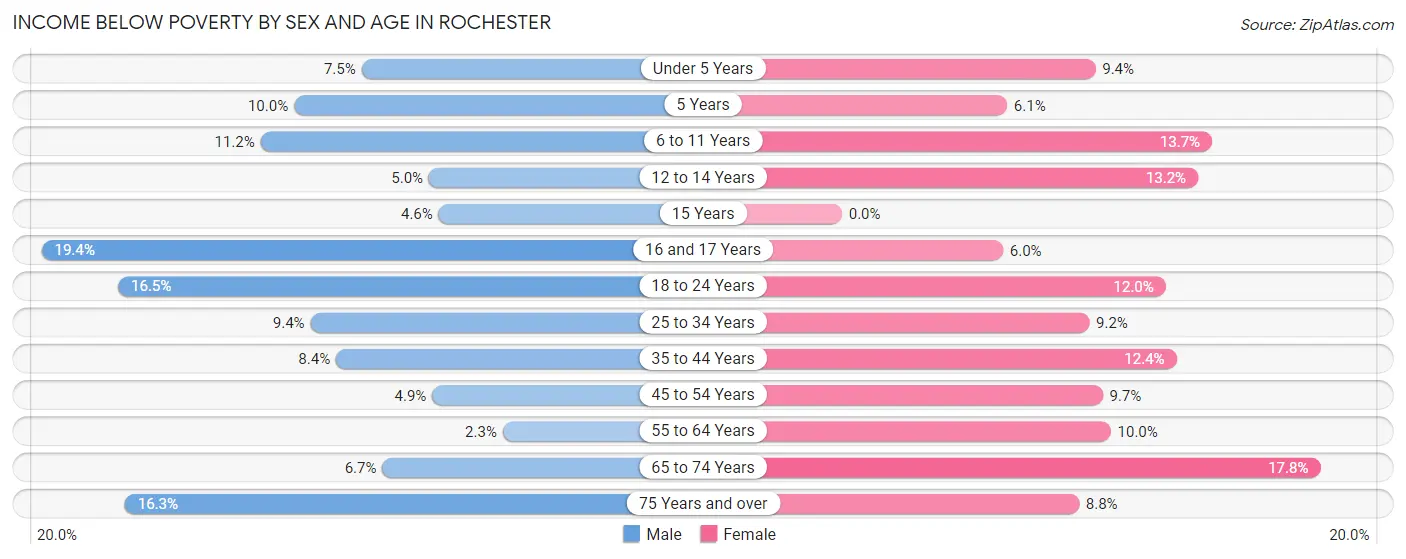
| Age Bracket | Male | Female |
| Under 5 Years | 51 (7.5%) | 61 (9.4%) |
| 5 Years | 20 (10.0%) | 10 (6.1%) |
| 6 to 11 Years | 114 (11.2%) | 98 (13.7%) |
| 12 to 14 Years | 40 (5.0%) | 69 (13.2%) |
| 15 Years | 15 (4.6%) | 0 (0.0%) |
| 16 and 17 Years | 98 (19.4%) | 14 (6.0%) |
| 18 to 24 Years | 227 (16.5%) | 170 (12.0%) |
| 25 to 34 Years | 194 (9.4%) | 157 (9.2%) |
| 35 to 44 Years | 165 (8.4%) | 274 (12.4%) |
| 45 to 54 Years | 107 (4.9%) | 196 (9.7%) |
| 55 to 64 Years | 54 (2.2%) | 277 (10.0%) |
| 65 to 74 Years | 115 (6.7%) | 335 (17.8%) |
| 75 Years and over | 147 (16.3%) | 121 (8.8%) |
| Total | 1,347 (8.4%) | 1,782 (11.3%) |
Income Above Poverty by Sex and Age in Rochester
According to the poverty statistics in Rochester, males aged 55 to 64 years and females aged 15 years are the age groups that are most secure financially, with 97.8% of males and 100.0% of females in these age groups living above the poverty line.
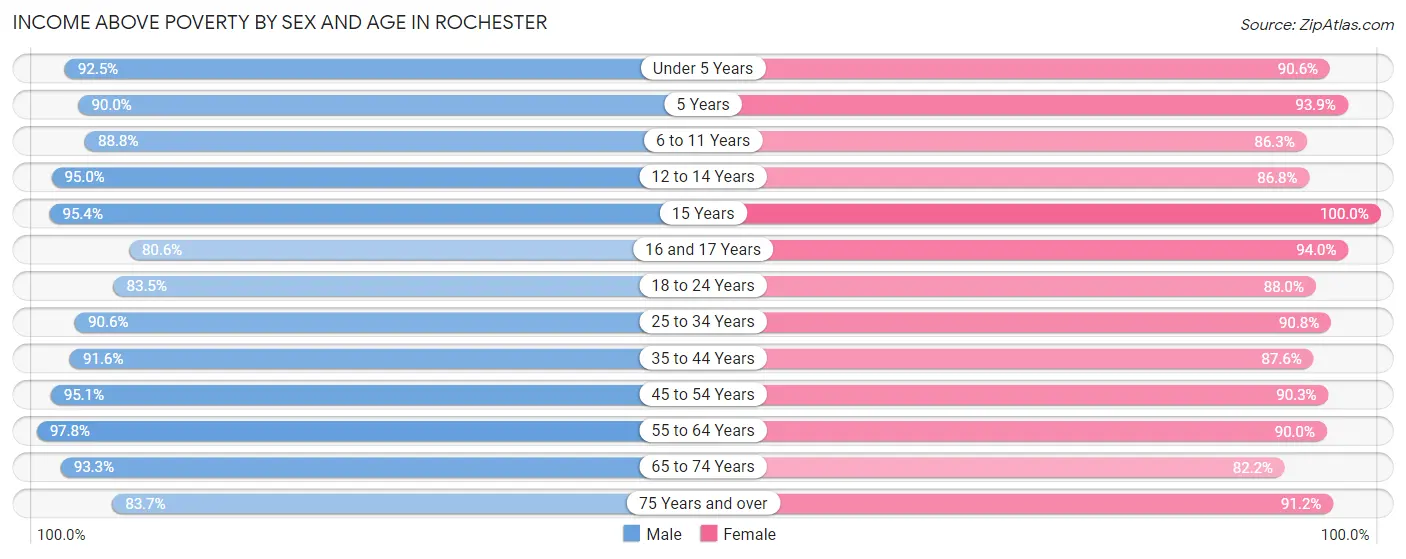
| Age Bracket | Male | Female |
| Under 5 Years | 630 (92.5%) | 587 (90.6%) |
| 5 Years | 180 (90.0%) | 153 (93.9%) |
| 6 to 11 Years | 900 (88.8%) | 615 (86.3%) |
| 12 to 14 Years | 761 (95.0%) | 453 (86.8%) |
| 15 Years | 309 (95.4%) | 96 (100.0%) |
| 16 and 17 Years | 408 (80.6%) | 220 (94.0%) |
| 18 to 24 Years | 1,146 (83.5%) | 1,244 (88.0%) |
| 25 to 34 Years | 1,871 (90.6%) | 1,553 (90.8%) |
| 35 to 44 Years | 1,789 (91.6%) | 1,933 (87.6%) |
| 45 to 54 Years | 2,088 (95.1%) | 1,828 (90.3%) |
| 55 to 64 Years | 2,350 (97.8%) | 2,498 (90.0%) |
| 65 to 74 Years | 1,597 (93.3%) | 1,551 (82.2%) |
| 75 Years and over | 756 (83.7%) | 1,254 (91.2%) |
| Total | 14,785 (91.6%) | 13,985 (88.7%) |
Income Below Poverty Among Married-Couple Families in Rochester
The poverty statistics for married-couple families in Rochester show that 3.0% or 188 of the total 6,259 families live below the poverty line. Families with 5 or more children have the highest poverty rate of 16.4%, comprising of 12 families. On the other hand, families with 3 or 4 children have the lowest poverty rate of 0.0%, which includes 0 families.
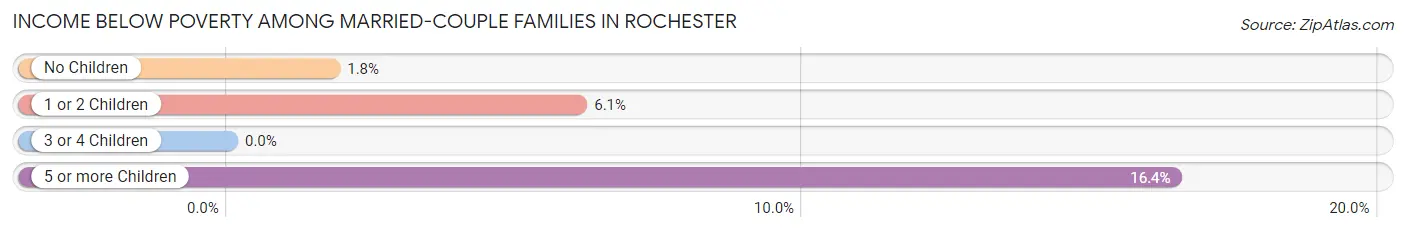
| Children | Above Poverty | Below Poverty |
| No Children | 4,075 (98.2%) | 74 (1.8%) |
| 1 or 2 Children | 1,576 (93.9%) | 102 (6.1%) |
| 3 or 4 Children | 359 (100.0%) | 0 (0.0%) |
| 5 or more Children | 61 (83.6%) | 12 (16.4%) |
| Total | 6,071 (97.0%) | 188 (3.0%) |
Income Below Poverty Among Single-Parent Households in Rochester
According to the poverty data in Rochester, 14.7% or 94 single-father households and 14.1% or 194 single-mother households are living below the poverty line. Among single-father households, those with 1 or 2 children have the highest poverty rate, with 65 households (24.9%) experiencing poverty. Likewise, among single-mother households, those with 3 or 4 children have the highest poverty rate, with 55 households (39.0%) falling below the poverty line.
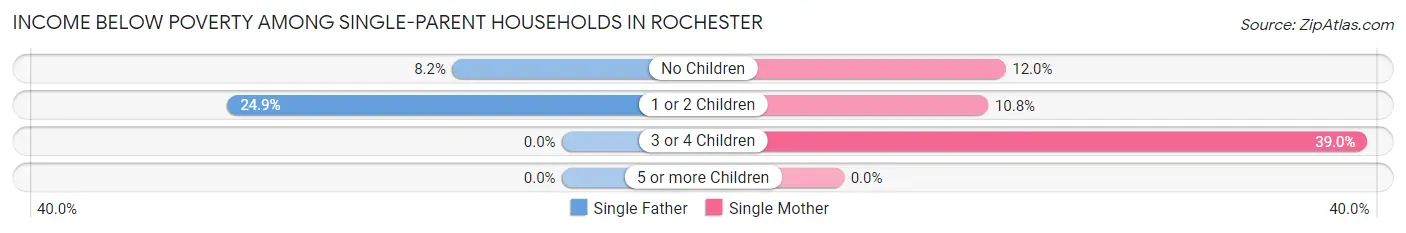
| Children | Single Father | Single Mother |
| No Children | 29 (8.2%) | 62 (12.0%) |
| 1 or 2 Children | 65 (24.9%) | 77 (10.7%) |
| 3 or 4 Children | 0 (0.0%) | 55 (39.0%) |
| 5 or more Children | 0 (0.0%) | 0 (0.0%) |
| Total | 94 (14.7%) | 194 (14.1%) |
Income Below Poverty Among Married-Couple vs Single-Parent Households in Rochester
The poverty data for Rochester shows that 188 of the married-couple family households (3.0%) and 288 of the single-parent households (14.3%) are living below the poverty level. Within the married-couple family households, those with 5 or more children have the highest poverty rate, with 12 households (16.4%) falling below the poverty line. Among the single-parent households, those with 3 or 4 children have the highest poverty rate, with 55 household (35.7%) living below poverty.
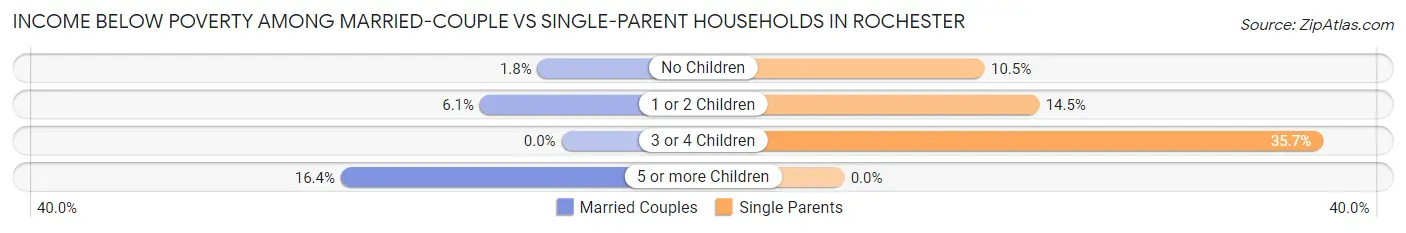
| Children | Married-Couple Families | Single-Parent Households |
| No Children | 74 (1.8%) | 91 (10.5%) |
| 1 or 2 Children | 102 (6.1%) | 142 (14.5%) |
| 3 or 4 Children | 0 (0.0%) | 55 (35.7%) |
| 5 or more Children | 12 (16.4%) | 0 (0.0%) |
| Total | 188 (3.0%) | 288 (14.3%) |
Race in Rochester
The most populous races in Rochester are White / Caucasian (30,168 | 92.6%), Two or more Races (1,403 | 4.3%), and Hispanic or Latino (636 | 1.9%).
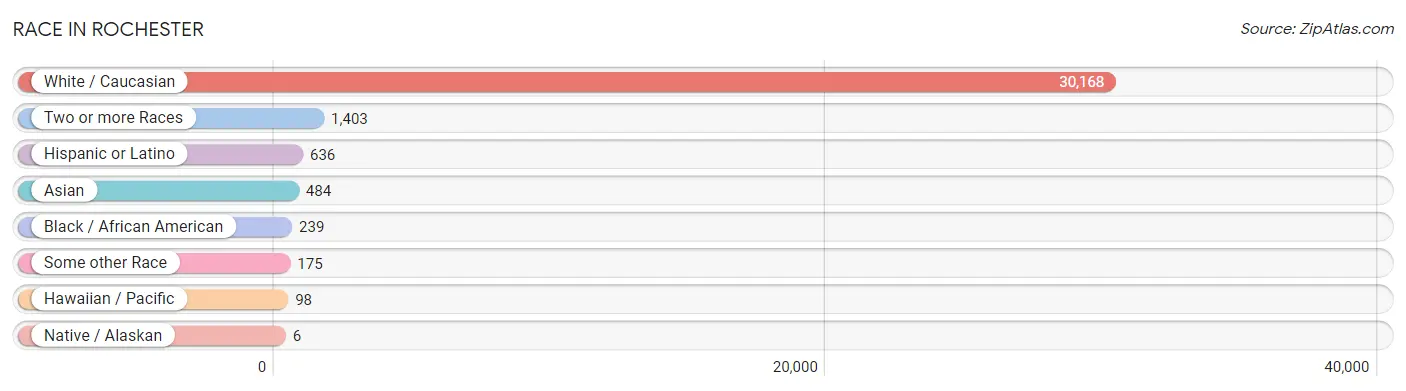
| Race | # Population | % Population |
| Asian | 484 | 1.5% |
| Black / African American | 239 | 0.7% |
| Hawaiian / Pacific | 98 | 0.3% |
| Hispanic or Latino | 636 | 1.9% |
| Native / Alaskan | 6 | 0.0% |
| White / Caucasian | 30,168 | 92.6% |
| Two or more Races | 1,403 | 4.3% |
| Some other Race | 175 | 0.5% |
| Total | 32,573 | 100.0% |
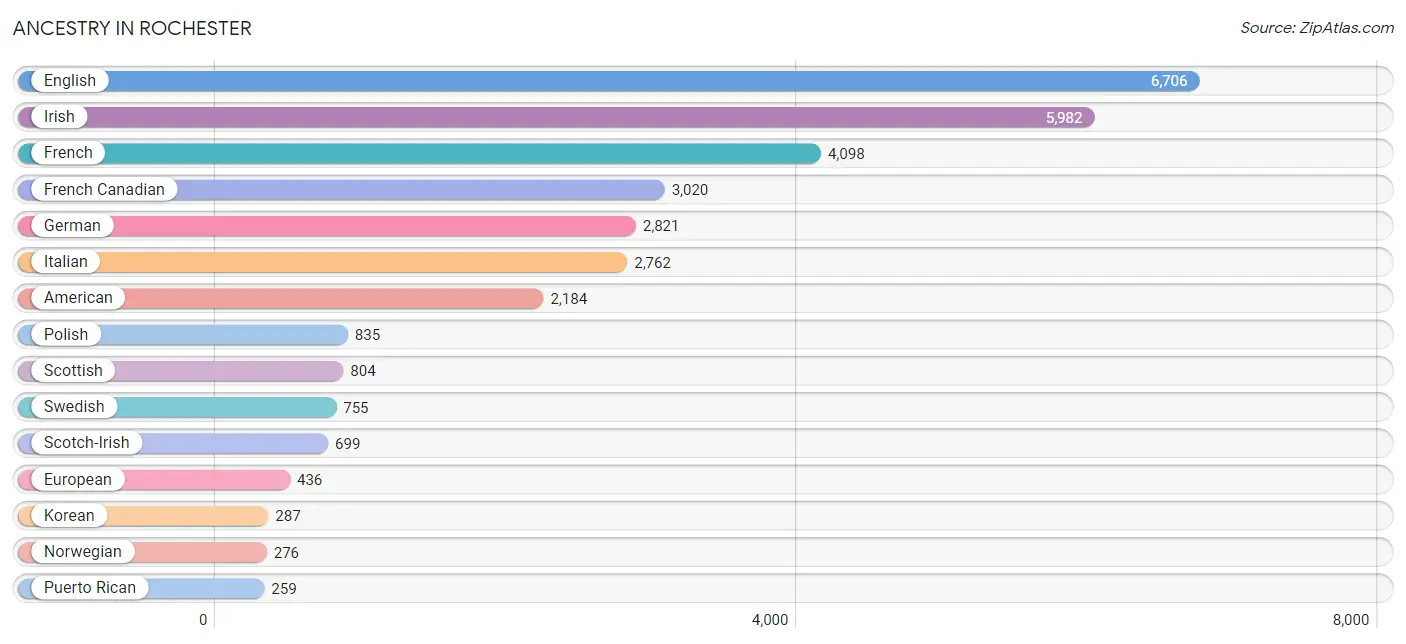
Ancestry in Rochester
The most populous ancestries reported in Rochester are English (6,706 | 20.6%), Irish (5,982 | 18.4%), French (4,098 | 12.6%), French Canadian (3,020 | 9.3%), and German (2,821 | 8.7%), together accounting for 69.5% of all Rochester residents.
| Ancestry | # Population | % Population |
| American | 2,184 | 6.7% |
| Arab | 51 | 0.2% |
| Armenian | 39 | 0.1% |
| Austrian | 13 | 0.0% |
| Bhutanese | 20 | 0.1% |
| Blackfeet | 25 | 0.1% |
| British | 135 | 0.4% |
| Burmese | 156 | 0.5% |
| Cajun | 15 | 0.1% |
| Canadian | 185 | 0.6% |
| Cape Verdean | 52 | 0.2% |
| Celtic | 22 | 0.1% |
| Central American | 69 | 0.2% |
| Cherokee | 47 | 0.1% |
| Chickasaw | 45 | 0.1% |
| Choctaw | 3 | 0.0% |
| Costa Rican | 51 | 0.2% |
| Cuban | 64 | 0.2% |
| Czech | 115 | 0.4% |
| Czechoslovakian | 14 | 0.0% |
| Danish | 167 | 0.5% |
| Dominican | 92 | 0.3% |
| Dutch | 169 | 0.5% |
| Eastern European | 24 | 0.1% |
| Ecuadorian | 4 | 0.0% |
| English | 6,706 | 20.6% |
| Estonian | 14 | 0.0% |
| European | 436 | 1.3% |
| Finnish | 111 | 0.3% |
| French | 4,098 | 12.6% |
| French American Indian | 8 | 0.0% |
| French Canadian | 3,020 | 9.3% |
| German | 2,821 | 8.7% |
| Greek | 230 | 0.7% |
| Guamanian / Chamorro | 98 | 0.3% |
| Guatemalan | 18 | 0.1% |
| Haitian | 120 | 0.4% |
| Hungarian | 141 | 0.4% |
| Indian (Asian) | 182 | 0.6% |
| Irish | 5,982 | 18.4% |
| Italian | 2,762 | 8.5% |
| Japanese | 128 | 0.4% |
| Korean | 287 | 0.9% |
| Laotian | 15 | 0.1% |
| Latvian | 32 | 0.1% |
| Lebanese | 10 | 0.0% |
| Lithuanian | 91 | 0.3% |
| Luxembourger | 26 | 0.1% |
| Malaysian | 27 | 0.1% |
| Mexican | 87 | 0.3% |
| Moroccan | 25 | 0.1% |
| Native Hawaiian | 25 | 0.1% |
| Northern European | 100 | 0.3% |
| Norwegian | 276 | 0.9% |
| Pennsylvania German | 19 | 0.1% |
| Peruvian | 9 | 0.0% |
| Polish | 835 | 2.6% |
| Portuguese | 180 | 0.5% |
| Puerto Rican | 259 | 0.8% |
| Russian | 27 | 0.1% |
| Scandinavian | 59 | 0.2% |
| Scotch-Irish | 699 | 2.1% |
| Scottish | 804 | 2.5% |
| Slovak | 32 | 0.1% |
| South American | 43 | 0.1% |
| Spaniard | 20 | 0.1% |
| Subsaharan African | 52 | 0.2% |
| Swedish | 755 | 2.3% |
| Swiss | 36 | 0.1% |
| Thai | 156 | 0.5% |
| Ukrainian | 102 | 0.3% |
| Venezuelan | 30 | 0.1% |
| Welsh | 227 | 0.7% |
| Yugoslavian | 13 | 0.0% | View All 74 Rows |
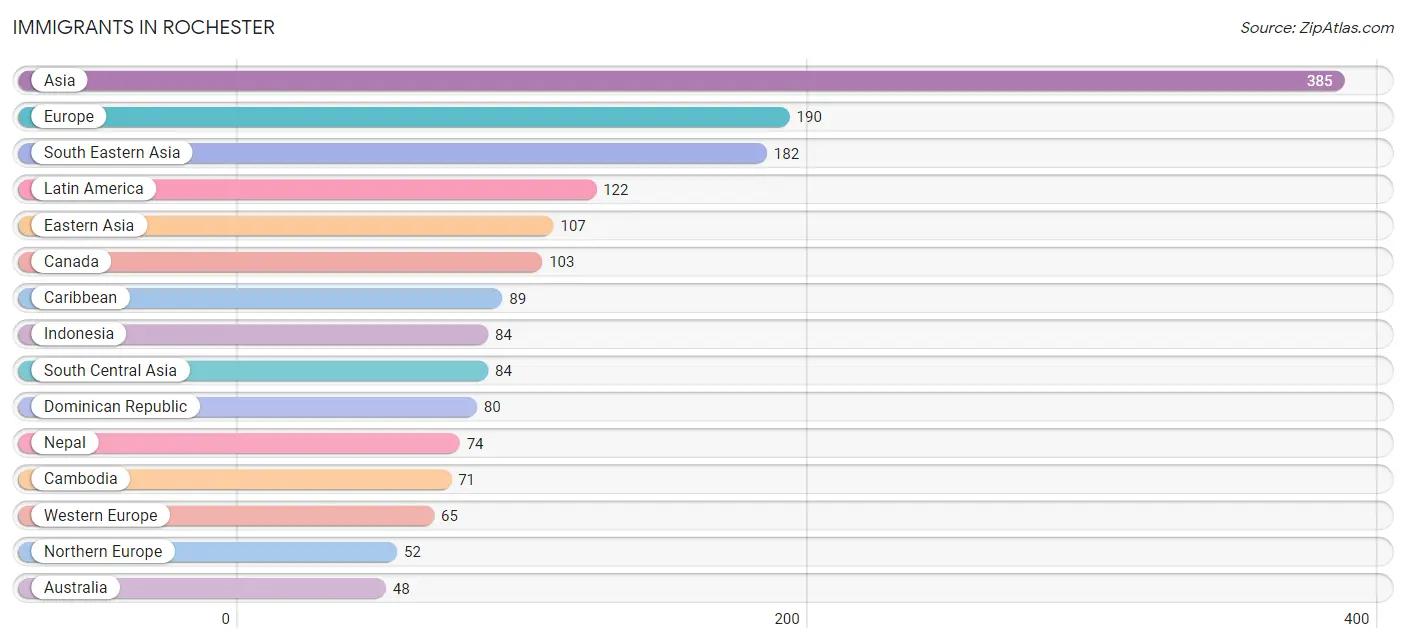
Immigrants in Rochester
The most numerous immigrant groups reported in Rochester came from Asia (385 | 1.2%), Europe (190 | 0.6%), South Eastern Asia (182 | 0.6%), Latin America (122 | 0.4%), and Eastern Asia (107 | 0.3%), together accounting for 3.0% of all Rochester residents.
| Immigration Origin | # Population | % Population |
| Africa | 25 | 0.1% |
| Asia | 385 | 1.2% |
| Australia | 48 | 0.2% |
| Brazil | 8 | 0.0% |
| Cambodia | 71 | 0.2% |
| Canada | 103 | 0.3% |
| Caribbean | 89 | 0.3% |
| Central America | 23 | 0.1% |
| China | 46 | 0.1% |
| Costa Rica | 16 | 0.1% |
| Cuba | 9 | 0.0% |
| Dominican Republic | 80 | 0.3% |
| Eastern Asia | 107 | 0.3% |
| Eastern Europe | 48 | 0.2% |
| Ecuador | 2 | 0.0% |
| Europe | 190 | 0.6% |
| France | 45 | 0.1% |
| Germany | 20 | 0.1% |
| Greece | 22 | 0.1% |
| Guatemala | 7 | 0.0% |
| India | 10 | 0.0% |
| Indonesia | 84 | 0.3% |
| Ireland | 28 | 0.1% |
| Israel | 12 | 0.0% |
| Japan | 20 | 0.1% |
| Korea | 41 | 0.1% |
| Laos | 27 | 0.1% |
| Latin America | 122 | 0.4% |
| Morocco | 25 | 0.1% |
| Nepal | 74 | 0.2% |
| Northern Africa | 25 | 0.1% |
| Northern Europe | 52 | 0.2% |
| Norway | 15 | 0.1% |
| Oceania | 48 | 0.2% |
| Poland | 7 | 0.0% |
| Russia | 41 | 0.1% |
| South America | 10 | 0.0% |
| South Central Asia | 84 | 0.3% |
| South Eastern Asia | 182 | 0.6% |
| Southern Europe | 25 | 0.1% |
| Spain | 3 | 0.0% |
| Western Asia | 12 | 0.0% |
| Western Europe | 65 | 0.2% | View All 43 Rows |
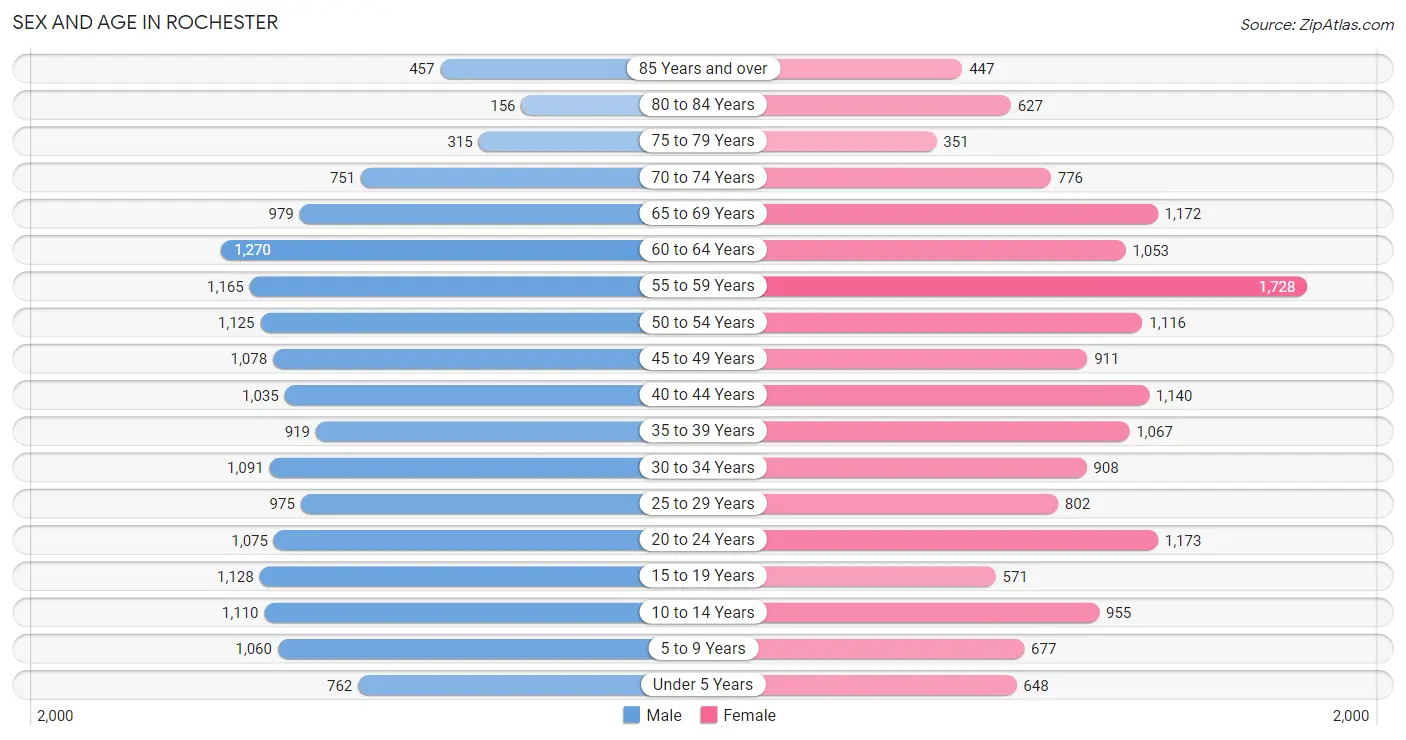
Sex and Age in Rochester
Sex and Age in Rochester
The most populous age groups in Rochester are 60 to 64 Years (1,270 | 7.7%) for men and 55 to 59 Years (1,728 | 10.7%) for women.
| Age Bracket | Male | Female |
| Under 5 Years | 762 (4.6%) | 648 (4.0%) |
| 5 to 9 Years | 1,060 (6.4%) | 677 (4.2%) |
| 10 to 14 Years | 1,110 (6.8%) | 955 (5.9%) |
| 15 to 19 Years | 1,128 (6.9%) | 571 (3.5%) |
| 20 to 24 Years | 1,075 (6.5%) | 1,173 (7.3%) |
| 25 to 29 Years | 975 (5.9%) | 802 (5.0%) |
| 30 to 34 Years | 1,091 (6.6%) | 908 (5.6%) |
| 35 to 39 Years | 919 (5.6%) | 1,067 (6.6%) |
| 40 to 44 Years | 1,035 (6.3%) | 1,140 (7.1%) |
| 45 to 49 Years | 1,078 (6.6%) | 911 (5.7%) |
| 50 to 54 Years | 1,125 (6.8%) | 1,116 (6.9%) |
| 55 to 59 Years | 1,165 (7.1%) | 1,728 (10.7%) |
| 60 to 64 Years | 1,270 (7.7%) | 1,053 (6.5%) |
| 65 to 69 Years | 979 (5.9%) | 1,172 (7.3%) |
| 70 to 74 Years | 751 (4.6%) | 776 (4.8%) |
| 75 to 79 Years | 315 (1.9%) | 351 (2.2%) |
| 80 to 84 Years | 156 (0.9%) | 627 (3.9%) |
| 85 Years and over | 457 (2.8%) | 447 (2.8%) |
| Total | 16,451 (100.0%) | 16,122 (100.0%) |
Families and Households in Rochester
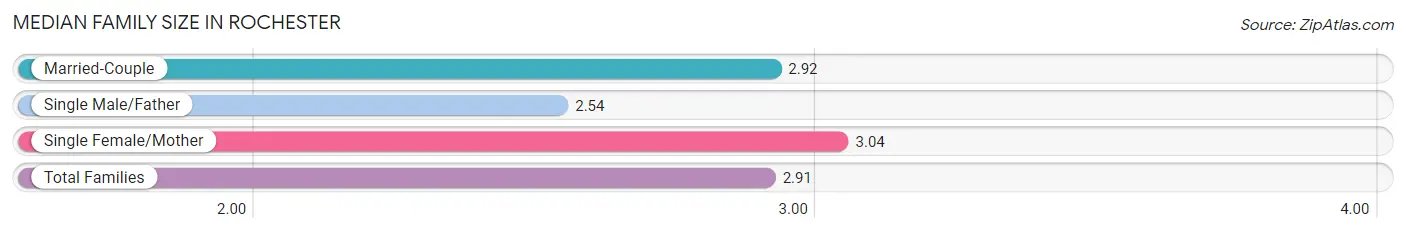
Median Family Size in Rochester
The median family size in Rochester is 2.91 persons per family, with single female/mother families (1,372 | 16.6%) accounting for the largest median family size of 3.04 persons per family. On the other hand, single male/father families (639 | 7.7%) represent the smallest median family size with 2.54 persons per family.
| Family Type | # Families | Family Size |
| Married-Couple | 6,259 (75.7%) | 2.92 |
| Single Male/Father | 639 (7.7%) | 2.54 |
| Single Female/Mother | 1,372 (16.6%) | 3.04 |
| Total Families | 8,270 (100.0%) | 2.91 |
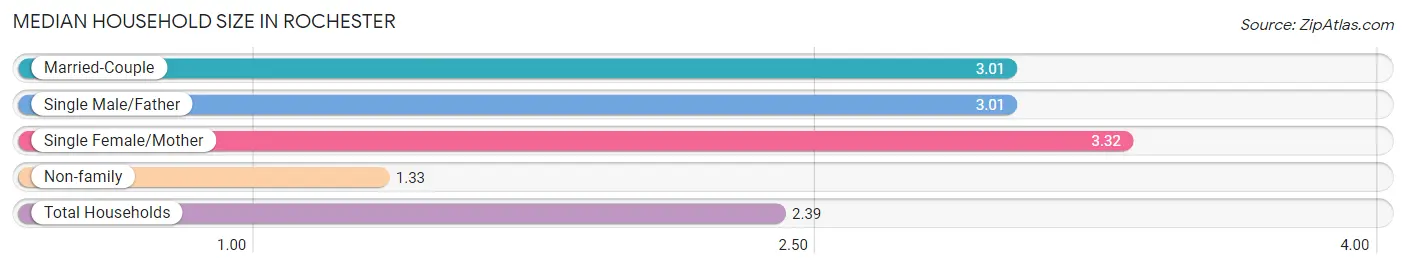
Median Household Size in Rochester
The median household size in Rochester is 2.39 persons per household, with single female/mother households (1,372 | 10.1%) accounting for the largest median household size of 3.32 persons per household. non-family households (5,272 | 38.9%) represent the smallest median household size with 1.33 persons per household.
| Household Type | # Households | Household Size |
| Married-Couple | 6,259 (46.2%) | 3.01 |
| Single Male/Father | 639 (4.7%) | 3.01 |
| Single Female/Mother | 1,372 (10.1%) | 3.32 |
| Non-family | 5,272 (38.9%) | 1.33 |
| Total Households | 13,542 (100.0%) | 2.39 |
Household Size by Marriage Status in Rochester
Out of a total of 13,542 households in Rochester, 8,270 (61.1%) are family households, while 5,272 (38.9%) are nonfamily households. The most numerous type of family households are 2-person households, comprising 4,202, and the most common type of nonfamily households are 1-person households, comprising 4,062.
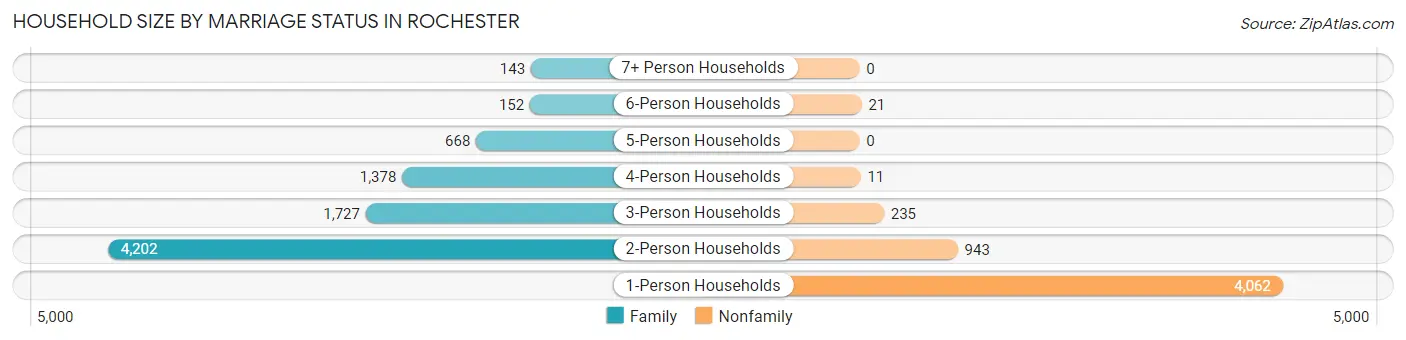
| Household Size | Family Households | Nonfamily Households |
| 1-Person Households | - | 4,062 (30.0%) |
| 2-Person Households | 4,202 (31.0%) | 943 (7.0%) |
| 3-Person Households | 1,727 (12.8%) | 235 (1.7%) |
| 4-Person Households | 1,378 (10.2%) | 11 (0.1%) |
| 5-Person Households | 668 (4.9%) | 0 (0.0%) |
| 6-Person Households | 152 (1.1%) | 21 (0.2%) |
| 7+ Person Households | 143 (1.1%) | 0 (0.0%) |
| Total | 8,270 (61.1%) | 5,272 (38.9%) |
Female Fertility in Rochester
Fertility by Age in Rochester
Average fertility rate in Rochester is 49.0 births per 1,000 women. Women in the age bracket of 20 to 34 years have the highest fertility rate with 100.0 births per 1,000 women. Women in the age bracket of 20 to 34 years acount for 86.3% of all women with births.
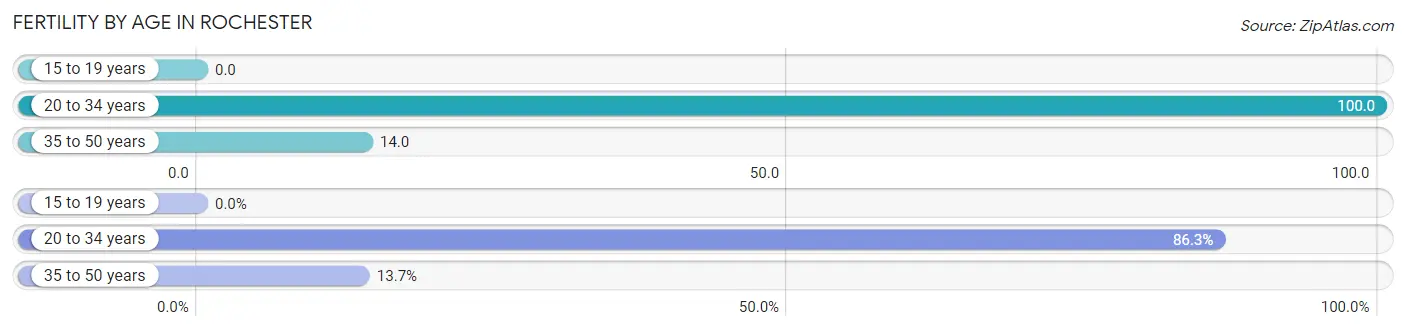
| Age Bracket | Women with Births | Births / 1,000 Women |
| 15 to 19 years | 0 (0.0%) | 0.0 |
| 20 to 34 years | 289 (86.3%) | 100.0 |
| 35 to 50 years | 46 (13.7%) | 14.0 |
| Total | 335 (100.0%) | 49.0 |
Fertility by Age by Marriage Status in Rochester
92.5% of women with births (335) in Rochester are married. The highest percentage of unmarried women with births falls into 20 to 34 years age bracket with 8.6% of them unmarried at the time of birth, while the lowest percentage of unmarried women with births belong to 35 to 50 years age bracket with 0.0% of them unmarried.
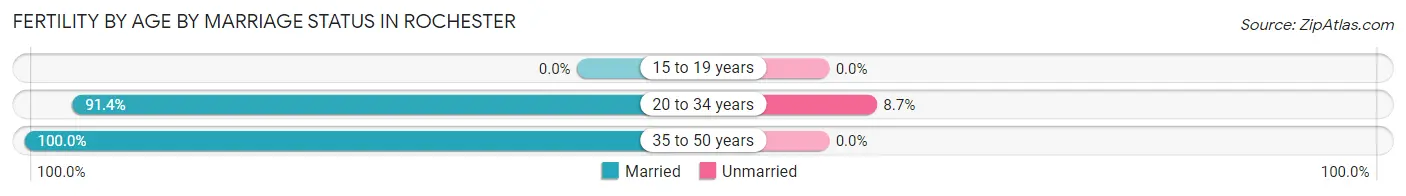
| Age Bracket | Married | Unmarried |
| 15 to 19 years | 0 (0.0%) | 0 (0.0%) |
| 20 to 34 years | 264 (91.3%) | 25 (8.6%) |
| 35 to 50 years | 46 (100.0%) | 0 (0.0%) |
| Total | 310 (92.5%) | 25 (7.5%) |
Fertility by Education in Rochester
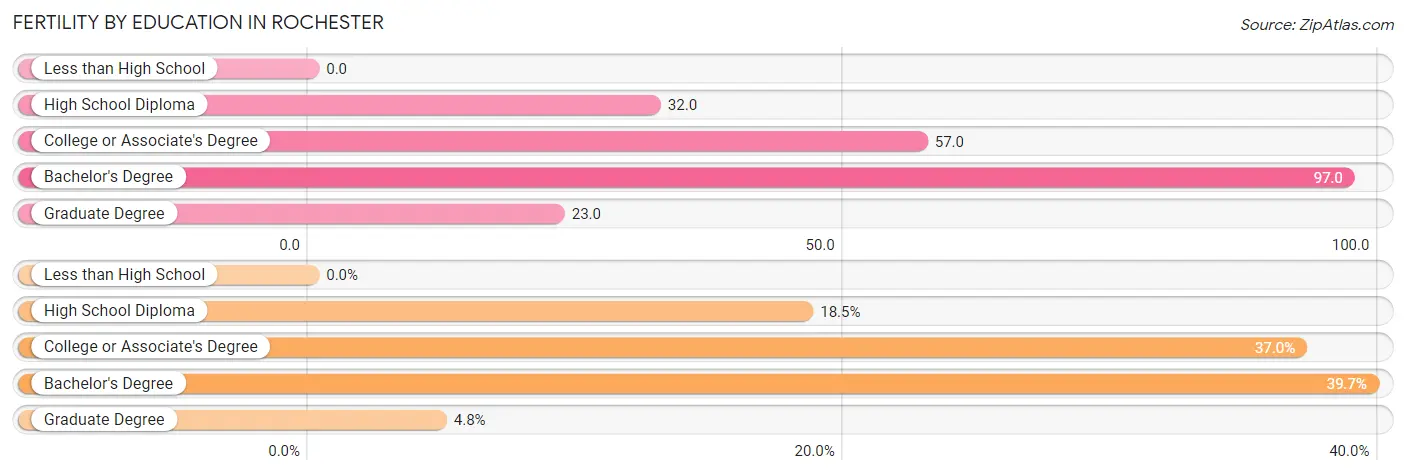
| Educational Attainment | Women with Births | Births / 1,000 Women |
| Less than High School | 0 (0.0%) | 0.0 |
| High School Diploma | 62 (18.5%) | 32.0 |
| College or Associate's Degree | 124 (37.0%) | 57.0 |
| Bachelor's Degree | 133 (39.7%) | 97.0 |
| Graduate Degree | 16 (4.8%) | 23.0 |
| Total | 335 (100.0%) | 49.0 |
Fertility by Education by Marriage Status in Rochester
7.5% of women with births in Rochester are unmarried. Women with the educational attainment of high school diploma are most likely to be married with 100.0% of them married at childbirth, while women with the educational attainment of college or associate's degree are least likely to be married with 20.2% of them unmarried at childbirth.
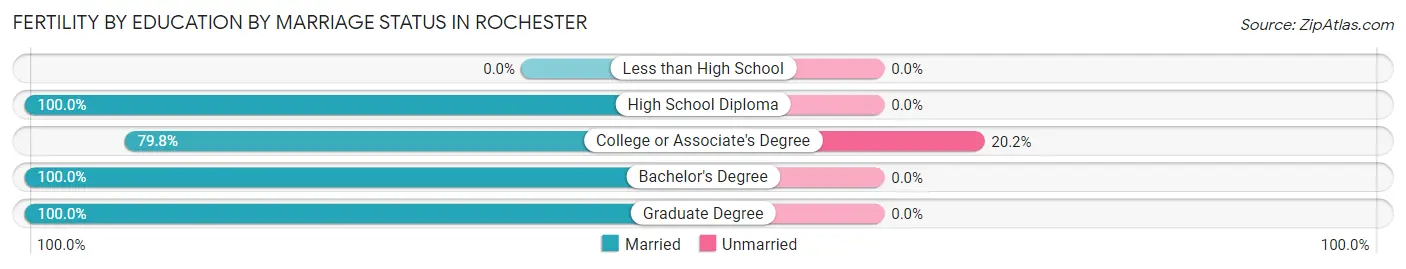
| Educational Attainment | Married | Unmarried |
| Less than High School | 0 (0.0%) | 0 (0.0%) |
| High School Diploma | 62 (100.0%) | 0 (0.0%) |
| College or Associate's Degree | 99 (79.8%) | 25 (20.2%) |
| Bachelor's Degree | 133 (100.0%) | 0 (0.0%) |
| Graduate Degree | 16 (100.0%) | 0 (0.0%) |
| Total | 310 (92.5%) | 25 (7.5%) |
Employment Characteristics in Rochester
Employment by Class of Employer in Rochester
Among the 16,943 employed individuals in Rochester, private company employees (11,333 | 66.9%), not-for-profit organizations (1,499 | 8.8%), and local government employees (1,484 | 8.8%) make up the most common classes of employment.
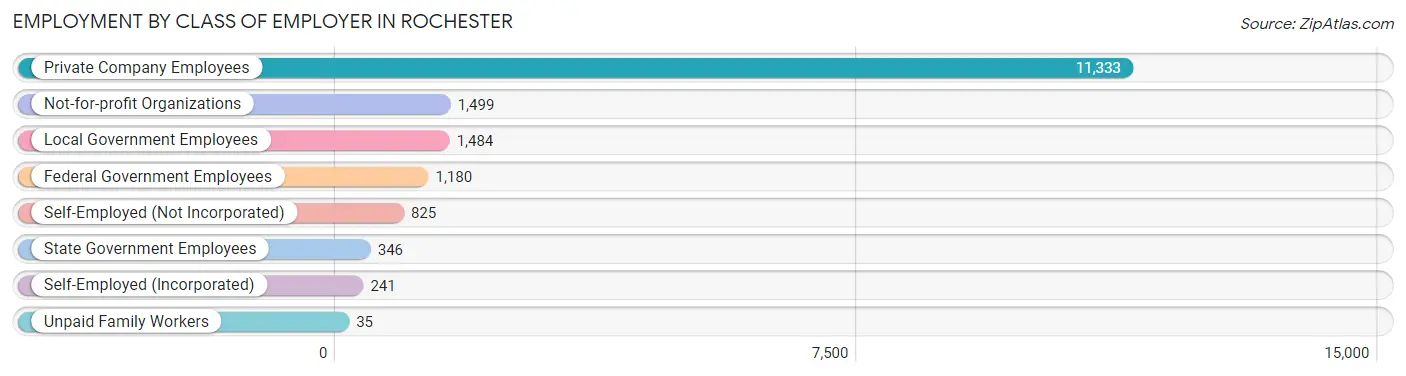
| Employer Class | # Employees | % Employees |
| Private Company Employees | 11,333 | 66.9% |
| Self-Employed (Incorporated) | 241 | 1.4% |
| Self-Employed (Not Incorporated) | 825 | 4.9% |
| Not-for-profit Organizations | 1,499 | 8.8% |
| Local Government Employees | 1,484 | 8.8% |
| State Government Employees | 346 | 2.0% |
| Federal Government Employees | 1,180 | 7.0% |
| Unpaid Family Workers | 35 | 0.2% |
| Total | 16,943 | 100.0% |
Employment Status by Age in Rochester
According to the labor force statistics for Rochester, out of the total population over 16 years of age (26,941), 66.4% or 17,889 individuals are in the labor force, with 3.8% or 680 of them unemployed. The age group with the highest labor force participation rate is 25 to 29 years, with 91.6% or 1,628 individuals in the labor force. Within the labor force, the 20 to 24 years age range has the highest percentage of unemployed individuals, with 13.8% or 282 of them being unemployed.
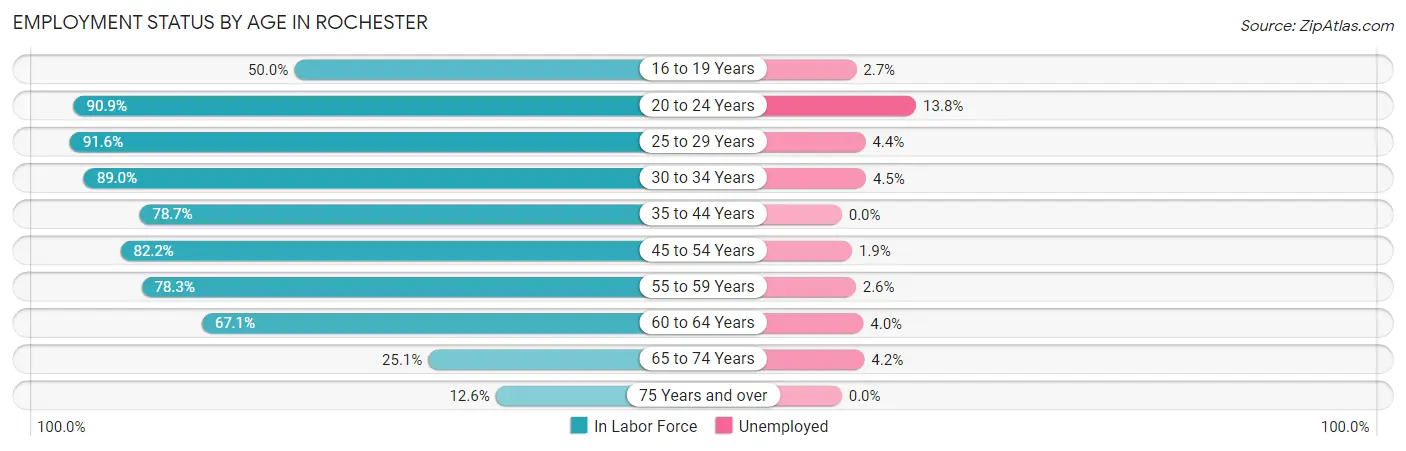
| Age Bracket | In Labor Force | Unemployed |
| 16 to 19 Years | 640 (50.0%) | 17 (2.7%) |
| 20 to 24 Years | 2,043 (90.9%) | 282 (13.8%) |
| 25 to 29 Years | 1,628 (91.6%) | 72 (4.4%) |
| 30 to 34 Years | 1,779 (89.0%) | 80 (4.5%) |
| 35 to 44 Years | 3,275 (78.7%) | 0 (0.0%) |
| 45 to 54 Years | 3,477 (82.2%) | 66 (1.9%) |
| 55 to 59 Years | 2,265 (78.3%) | 59 (2.6%) |
| 60 to 64 Years | 1,559 (67.1%) | 62 (4.0%) |
| 65 to 74 Years | 923 (25.1%) | 39 (4.2%) |
| 75 Years and over | 296 (12.6%) | 0 (0.0%) |
| Total | 17,889 (66.4%) | 680 (3.8%) |
Employment Status by Educational Attainment in Rochester
According to labor force statistics for Rochester, 80.4% of individuals (13,976) out of the total population between 25 and 64 years of age (17,383) are in the labor force, with 2.4% or 335 of them being unemployed. The group with the highest labor force participation rate are those with the educational attainment of bachelor's degree or higher, with 89.0% or 4,145 individuals in the labor force. Within the labor force, individuals with less than high school education have the highest percentage of unemployment, with 10.5% or 55 of them being unemployed.
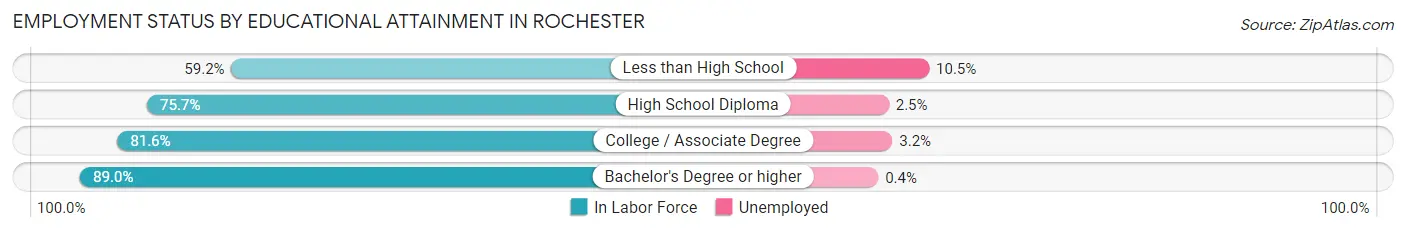
| Educational Attainment | In Labor Force | Unemployed |
| Less than High School | 522 (59.2%) | 93 (10.5%) |
| High School Diploma | 4,422 (75.7%) | 146 (2.5%) |
| College / Associate Degree | 4,898 (81.6%) | 192 (3.2%) |
| Bachelor's Degree or higher | 4,145 (89.0%) | 19 (0.4%) |
| Total | 13,976 (80.4%) | 417 (2.4%) |
Employment Occupations by Sex in Rochester
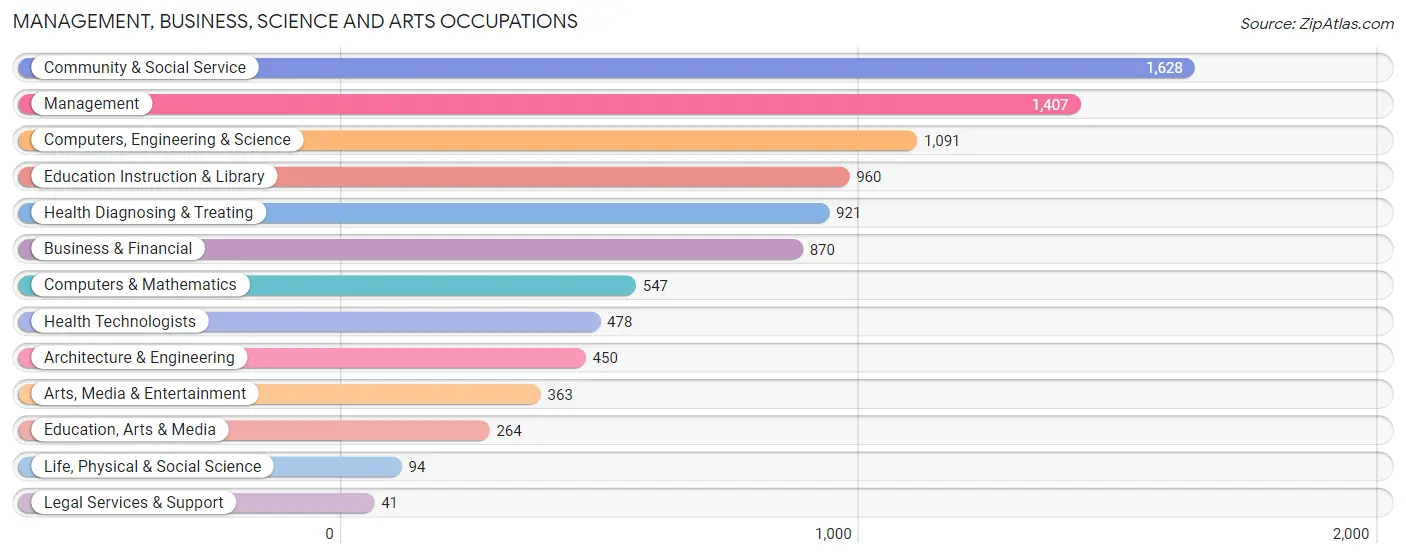
Management, Business, Science and Arts Occupations
The most common Management, Business, Science and Arts occupations in Rochester are Community & Social Service (1,628 | 9.6%), Management (1,407 | 8.3%), Computers, Engineering & Science (1,091 | 6.4%), Education Instruction & Library (960 | 5.6%), and Health Diagnosing & Treating (921 | 5.4%).
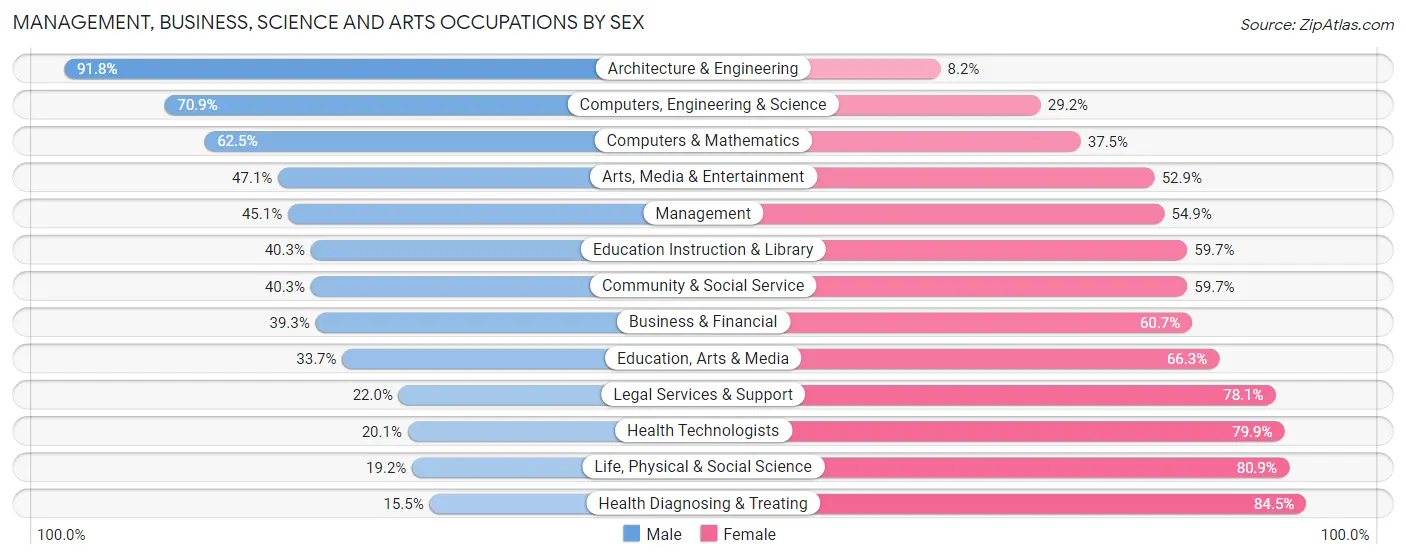
Management, Business, Science and Arts Occupations by Sex
Within the Management, Business, Science and Arts occupations in Rochester, the most male-oriented occupations are Architecture & Engineering (91.8%), Computers, Engineering & Science (70.9%), and Computers & Mathematics (62.5%), while the most female-oriented occupations are Health Diagnosing & Treating (84.5%), Life, Physical & Social Science (80.8%), and Health Technologists (79.9%).
| Occupation | Male | Female |
| Management | 634 (45.1%) | 773 (54.9%) |
| Business & Financial | 342 (39.3%) | 528 (60.7%) |
| Computers, Engineering & Science | 773 (70.9%) | 318 (29.1%) |
| Computers & Mathematics | 342 (62.5%) | 205 (37.5%) |
| Architecture & Engineering | 413 (91.8%) | 37 (8.2%) |
| Life, Physical & Social Science | 18 (19.2%) | 76 (80.8%) |
| Community & Social Service | 656 (40.3%) | 972 (59.7%) |
| Education, Arts & Media | 89 (33.7%) | 175 (66.3%) |
| Legal Services & Support | 9 (22.0%) | 32 (78.0%) |
| Education Instruction & Library | 387 (40.3%) | 573 (59.7%) |
| Arts, Media & Entertainment | 171 (47.1%) | 192 (52.9%) |
| Health Diagnosing & Treating | 143 (15.5%) | 778 (84.5%) |
| Health Technologists | 96 (20.1%) | 382 (79.9%) |
| Total (Category) | 2,548 (43.1%) | 3,369 (56.9%) |
| Total (Overall) | 8,813 (51.7%) | 8,219 (48.3%) |
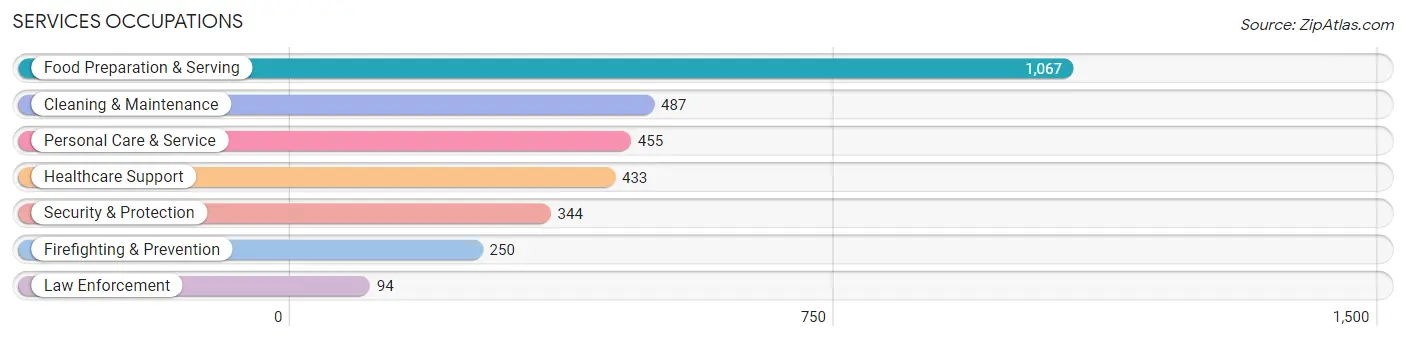
Services Occupations
The most common Services occupations in Rochester are Food Preparation & Serving (1,067 | 6.3%), Cleaning & Maintenance (487 | 2.9%), Personal Care & Service (455 | 2.7%), Healthcare Support (433 | 2.5%), and Security & Protection (344 | 2.0%).
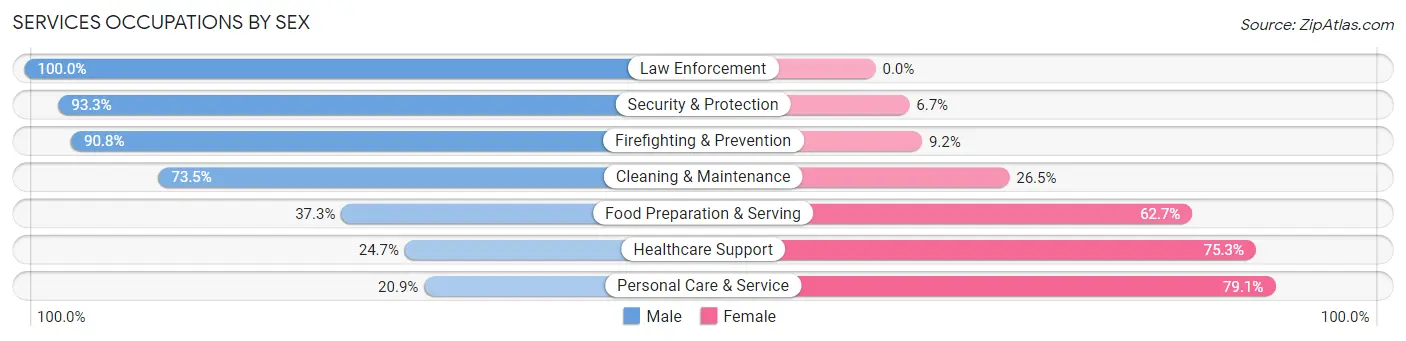
Services Occupations by Sex
Within the Services occupations in Rochester, the most male-oriented occupations are Law Enforcement (100.0%), Security & Protection (93.3%), and Firefighting & Prevention (90.8%), while the most female-oriented occupations are Personal Care & Service (79.1%), Healthcare Support (75.3%), and Food Preparation & Serving (62.7%).
| Occupation | Male | Female |
| Healthcare Support | 107 (24.7%) | 326 (75.3%) |
| Security & Protection | 321 (93.3%) | 23 (6.7%) |
| Firefighting & Prevention | 227 (90.8%) | 23 (9.2%) |
| Law Enforcement | 94 (100.0%) | 0 (0.0%) |
| Food Preparation & Serving | 398 (37.3%) | 669 (62.7%) |
| Cleaning & Maintenance | 358 (73.5%) | 129 (26.5%) |
| Personal Care & Service | 95 (20.9%) | 360 (79.1%) |
| Total (Category) | 1,279 (45.9%) | 1,507 (54.1%) |
| Total (Overall) | 8,813 (51.7%) | 8,219 (48.3%) |
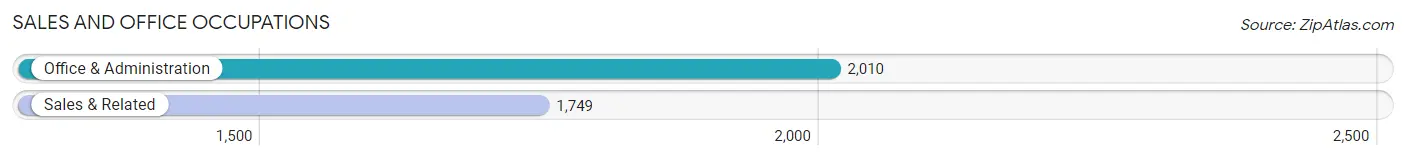
Sales and Office Occupations
The most common Sales and Office occupations in Rochester are Office & Administration (2,010 | 11.8%), and Sales & Related (1,749 | 10.3%).
Sales and Office Occupations by Sex
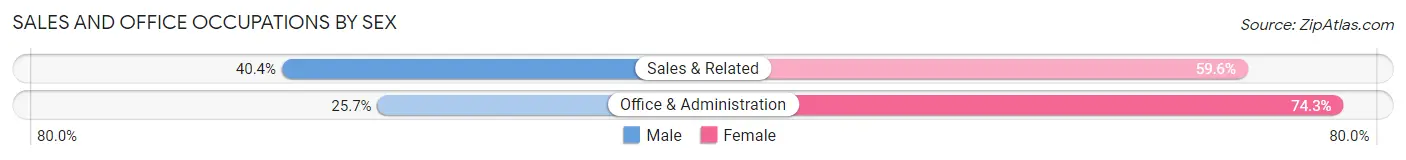
| Occupation | Male | Female |
| Sales & Related | 707 (40.4%) | 1,042 (59.6%) |
| Office & Administration | 517 (25.7%) | 1,493 (74.3%) |
| Total (Category) | 1,224 (32.6%) | 2,535 (67.4%) |
| Total (Overall) | 8,813 (51.7%) | 8,219 (48.3%) |
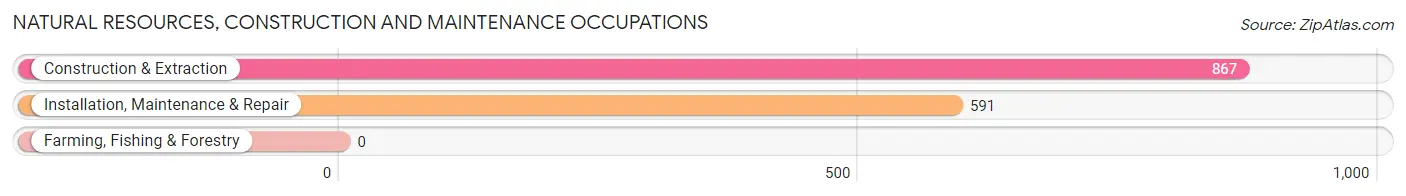
Natural Resources, Construction and Maintenance Occupations
The most common Natural Resources, Construction and Maintenance occupations in Rochester are Construction & Extraction (867 | 5.1%), and Installation, Maintenance & Repair (591 | 3.5%).
Natural Resources, Construction and Maintenance Occupations by Sex
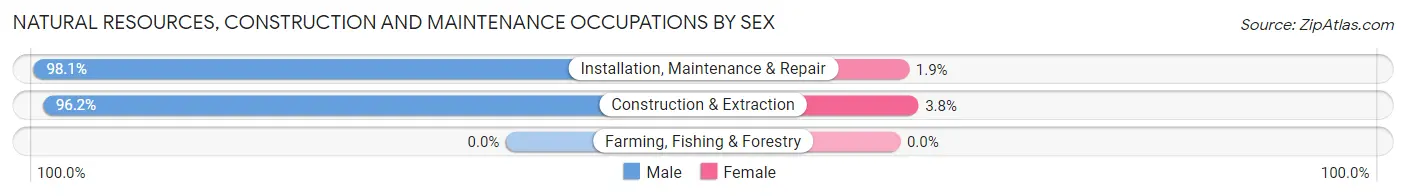
| Occupation | Male | Female |
| Farming, Fishing & Forestry | 0 (0.0%) | 0 (0.0%) |
| Construction & Extraction | 834 (96.2%) | 33 (3.8%) |
| Installation, Maintenance & Repair | 580 (98.1%) | 11 (1.9%) |
| Total (Category) | 1,414 (97.0%) | 44 (3.0%) |
| Total (Overall) | 8,813 (51.7%) | 8,219 (48.3%) |
Production, Transportation and Moving Occupations
The most common Production, Transportation and Moving occupations in Rochester are Production (1,778 | 10.4%), Material Moving (775 | 4.5%), and Transportation (559 | 3.3%).
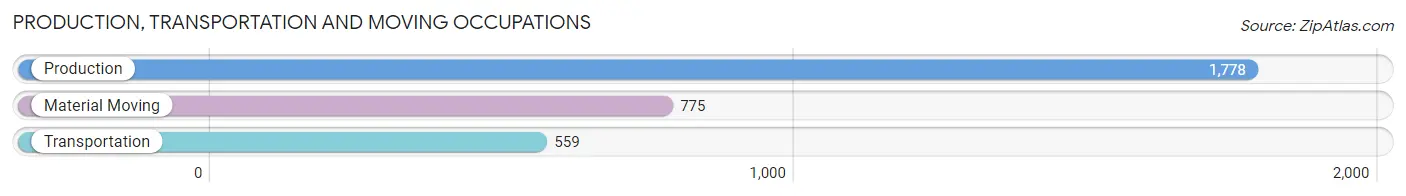
Production, Transportation and Moving Occupations by Sex
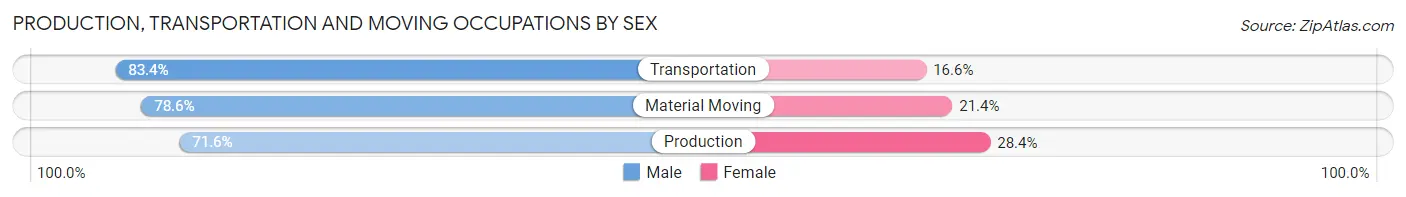
| Occupation | Male | Female |
| Production | 1,273 (71.6%) | 505 (28.4%) |
| Transportation | 466 (83.4%) | 93 (16.6%) |
| Material Moving | 609 (78.6%) | 166 (21.4%) |
| Total (Category) | 2,348 (75.4%) | 764 (24.5%) |
| Total (Overall) | 8,813 (51.7%) | 8,219 (48.3%) |
Employment Industries by Sex in Rochester
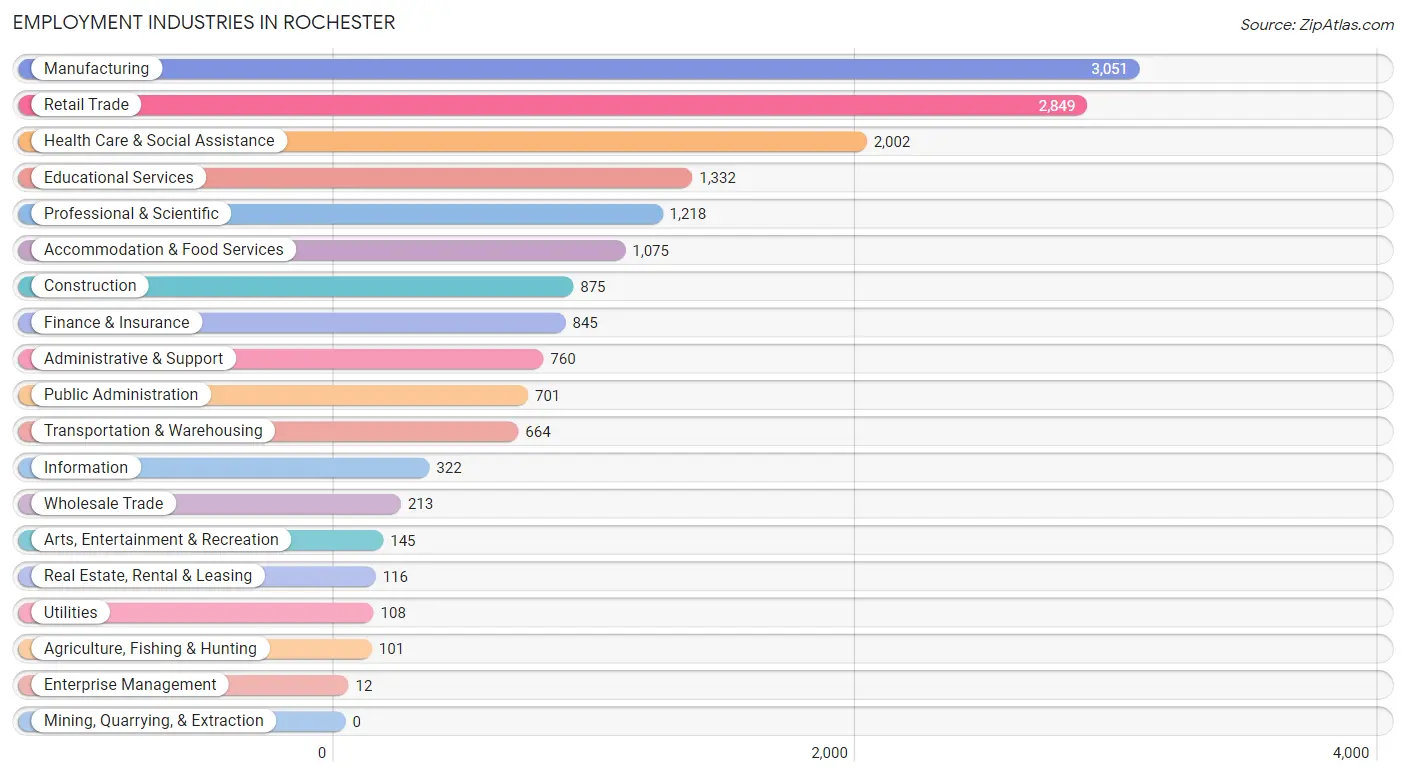
Employment Industries in Rochester
The major employment industries in Rochester include Manufacturing (3,051 | 17.9%), Retail Trade (2,849 | 16.7%), Health Care & Social Assistance (2,002 | 11.7%), Educational Services (1,332 | 7.8%), and Professional & Scientific (1,218 | 7.1%).
Employment Industries by Sex in Rochester
The Rochester industries that see more men than women are Construction (97.5%), Transportation & Warehousing (81.0%), and Manufacturing (79.4%), whereas the industries that tend to have a higher number of women are Agriculture, Fishing & Hunting (100.0%), Enterprise Management (100.0%), and Real Estate, Rental & Leasing (91.4%).
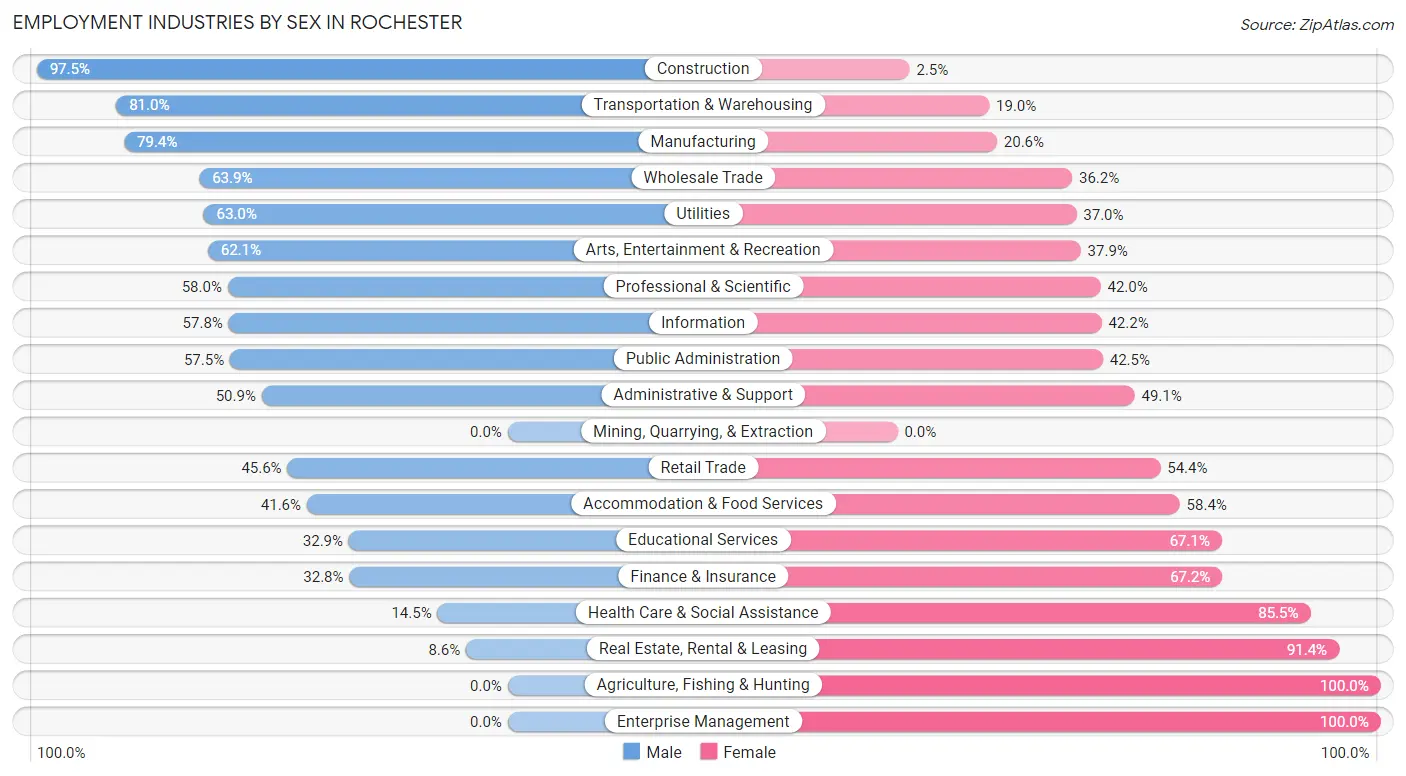
| Industry | Male | Female |
| Agriculture, Fishing & Hunting | 0 (0.0%) | 101 (100.0%) |
| Mining, Quarrying, & Extraction | 0 (0.0%) | 0 (0.0%) |
| Construction | 853 (97.5%) | 22 (2.5%) |
| Manufacturing | 2,423 (79.4%) | 628 (20.6%) |
| Wholesale Trade | 136 (63.8%) | 77 (36.1%) |
| Retail Trade | 1,299 (45.6%) | 1,550 (54.4%) |
| Transportation & Warehousing | 538 (81.0%) | 126 (19.0%) |
| Utilities | 68 (63.0%) | 40 (37.0%) |
| Information | 186 (57.8%) | 136 (42.2%) |
| Finance & Insurance | 277 (32.8%) | 568 (67.2%) |
| Real Estate, Rental & Leasing | 10 (8.6%) | 106 (91.4%) |
| Professional & Scientific | 706 (58.0%) | 512 (42.0%) |
| Enterprise Management | 0 (0.0%) | 12 (100.0%) |
| Administrative & Support | 387 (50.9%) | 373 (49.1%) |
| Educational Services | 438 (32.9%) | 894 (67.1%) |
| Health Care & Social Assistance | 291 (14.5%) | 1,711 (85.5%) |
| Arts, Entertainment & Recreation | 90 (62.1%) | 55 (37.9%) |
| Accommodation & Food Services | 447 (41.6%) | 628 (58.4%) |
| Public Administration | 403 (57.5%) | 298 (42.5%) |
| Total | 8,813 (51.7%) | 8,219 (48.3%) |
Education in Rochester
School Enrollment in Rochester
The most common levels of schooling among the 6,955 students in Rochester are middle school (1,860 | 26.7%), high school (1,413 | 20.3%), and college / undergraduate (1,314 | 18.9%).
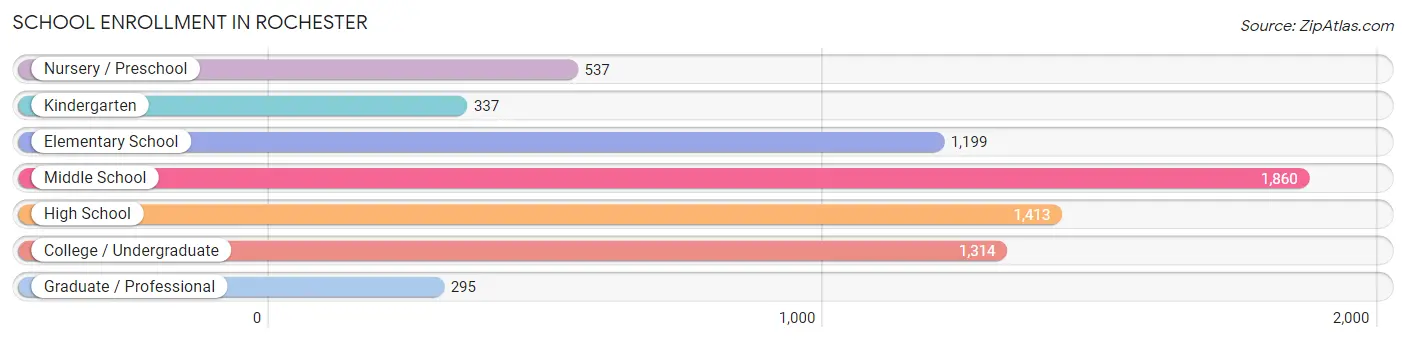
| School Level | # Students | % Students |
| Nursery / Preschool | 537 | 7.7% |
| Kindergarten | 337 | 4.9% |
| Elementary School | 1,199 | 17.2% |
| Middle School | 1,860 | 26.7% |
| High School | 1,413 | 20.3% |
| College / Undergraduate | 1,314 | 18.9% |
| Graduate / Professional | 295 | 4.2% |
| Total | 6,955 | 100.0% |
School Enrollment by Age by Funding Source in Rochester
Out of a total of 6,955 students who are enrolled in schools in Rochester, 1,168 (16.8%) attend a private institution, while the remaining 5,787 (83.2%) are enrolled in public schools. The age group of 3 to 4 year olds has the highest likelihood of being enrolled in private schools, with 267 (61.0% in the age bracket) enrolled. Conversely, the age group of 20 to 24 year olds has the lowest likelihood of being enrolled in a private school, with 537 (94.1% in the age bracket) attending a public institution.
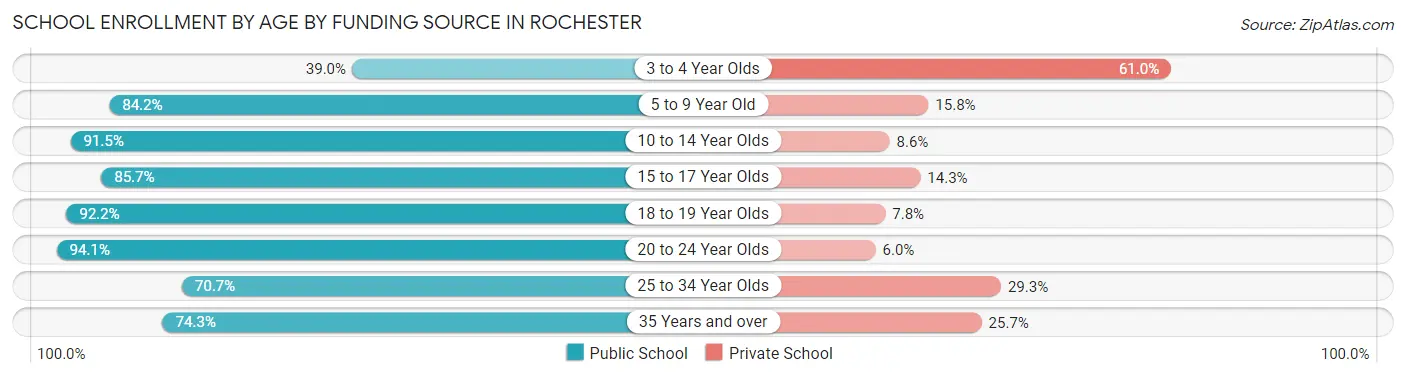
| Age Bracket | Public School | Private School |
| 3 to 4 Year Olds | 171 (39.0%) | 267 (61.0%) |
| 5 to 9 Year Old | 1,302 (84.2%) | 244 (15.8%) |
| 10 to 14 Year Olds | 1,818 (91.4%) | 170 (8.6%) |
| 15 to 17 Year Olds | 978 (85.7%) | 163 (14.3%) |
| 18 to 19 Year Olds | 273 (92.2%) | 23 (7.8%) |
| 20 to 24 Year Olds | 537 (94.1%) | 34 (5.9%) |
| 25 to 34 Year Olds | 362 (70.7%) | 150 (29.3%) |
| 35 Years and over | 344 (74.3%) | 119 (25.7%) |
| Total | 5,787 (83.2%) | 1,168 (16.8%) |
Educational Attainment by Field of Study in Rochester
Business (1,243 | 18.6%), science & technology (750 | 11.2%), education (746 | 11.2%), engineering (612 | 9.2%), and social sciences (484 | 7.3%) are the most common fields of study among 6,671 individuals in Rochester who have obtained a bachelor's degree or higher.
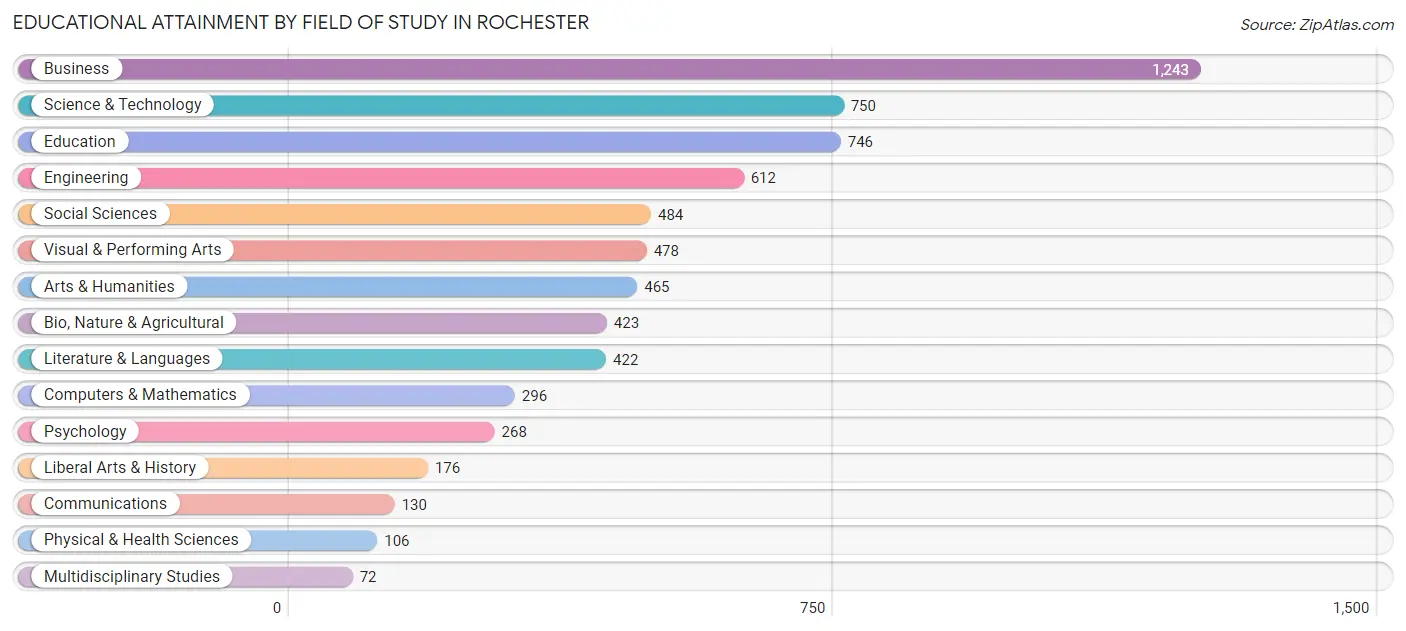
| Field of Study | # Graduates | % Graduates |
| Computers & Mathematics | 296 | 4.4% |
| Bio, Nature & Agricultural | 423 | 6.3% |
| Physical & Health Sciences | 106 | 1.6% |
| Psychology | 268 | 4.0% |
| Social Sciences | 484 | 7.3% |
| Engineering | 612 | 9.2% |
| Multidisciplinary Studies | 72 | 1.1% |
| Science & Technology | 750 | 11.2% |
| Business | 1,243 | 18.6% |
| Education | 746 | 11.2% |
| Literature & Languages | 422 | 6.3% |
| Liberal Arts & History | 176 | 2.6% |
| Visual & Performing Arts | 478 | 7.2% |
| Communications | 130 | 1.9% |
| Arts & Humanities | 465 | 7.0% |
| Total | 6,671 | 100.0% |
Transportation & Commute in Rochester
Vehicle Availability by Sex in Rochester
The most prevalent vehicle ownership categories in Rochester are males with 2 vehicles (4,239, accounting for 48.4%) and females with 2 vehicles (3,614, making up 51.8%).
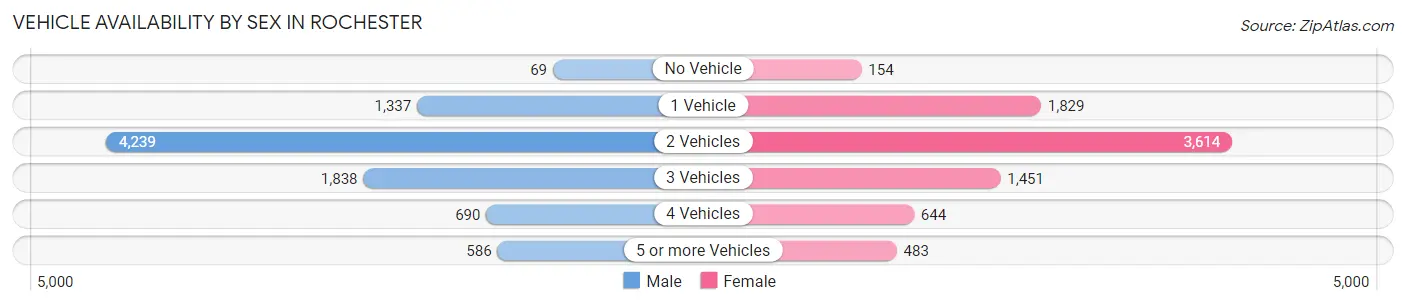
| Vehicles Available | Male | Female |
| No Vehicle | 69 (0.8%) | 154 (1.9%) |
| 1 Vehicle | 1,337 (15.3%) | 1,829 (22.4%) |
| 2 Vehicles | 4,239 (48.4%) | 3,614 (44.2%) |
| 3 Vehicles | 1,838 (21.0%) | 1,451 (17.7%) |
| 4 Vehicles | 690 (7.9%) | 644 (7.9%) |
| 5 or more Vehicles | 586 (6.7%) | 483 (5.9%) |
| Total | 8,759 (100.0%) | 8,175 (100.0%) |
Commute Time in Rochester
The most frequently occuring commute durations in Rochester are 30 to 34 minutes (2,324 commuters, 15.4%), 15 to 19 minutes (2,210 commuters, 14.6%), and 10 to 14 minutes (1,843 commuters, 12.2%).
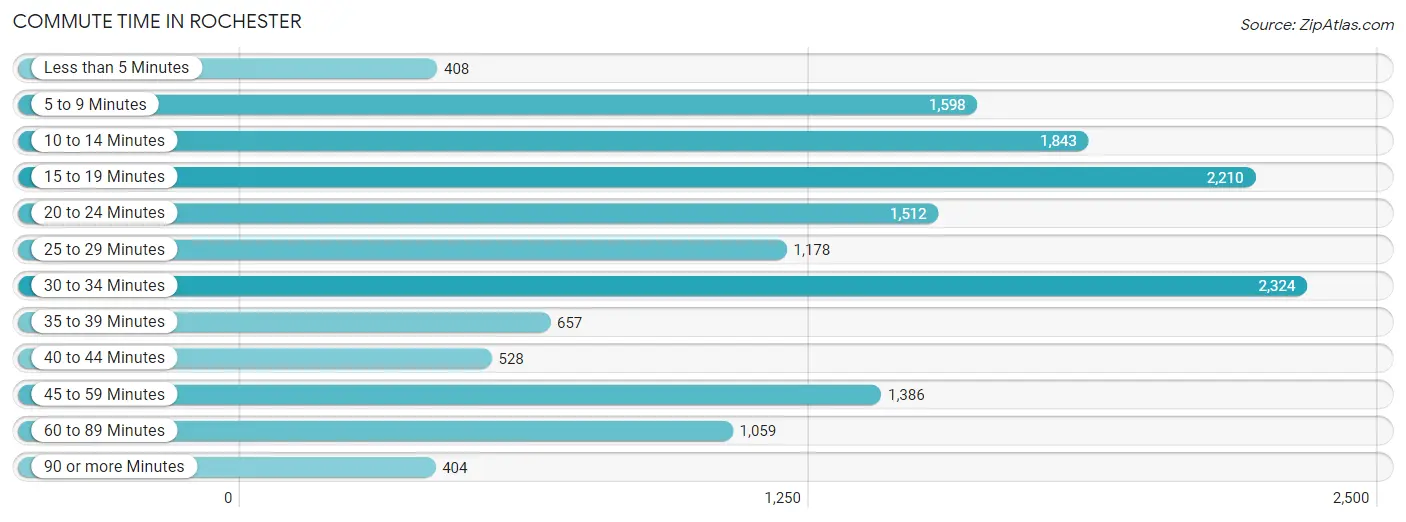
| Commute Time | # Commuters | % Commuters |
| Less than 5 Minutes | 408 | 2.7% |
| 5 to 9 Minutes | 1,598 | 10.6% |
| 10 to 14 Minutes | 1,843 | 12.2% |
| 15 to 19 Minutes | 2,210 | 14.6% |
| 20 to 24 Minutes | 1,512 | 10.0% |
| 25 to 29 Minutes | 1,178 | 7.8% |
| 30 to 34 Minutes | 2,324 | 15.4% |
| 35 to 39 Minutes | 657 | 4.3% |
| 40 to 44 Minutes | 528 | 3.5% |
| 45 to 59 Minutes | 1,386 | 9.2% |
| 60 to 89 Minutes | 1,059 | 7.0% |
| 90 or more Minutes | 404 | 2.7% |
Commute Time by Sex in Rochester
The most common commute times in Rochester are 30 to 34 minutes (1,038 commuters, 13.1%) for males and 30 to 34 minutes (1,286 commuters, 17.9%) for females.
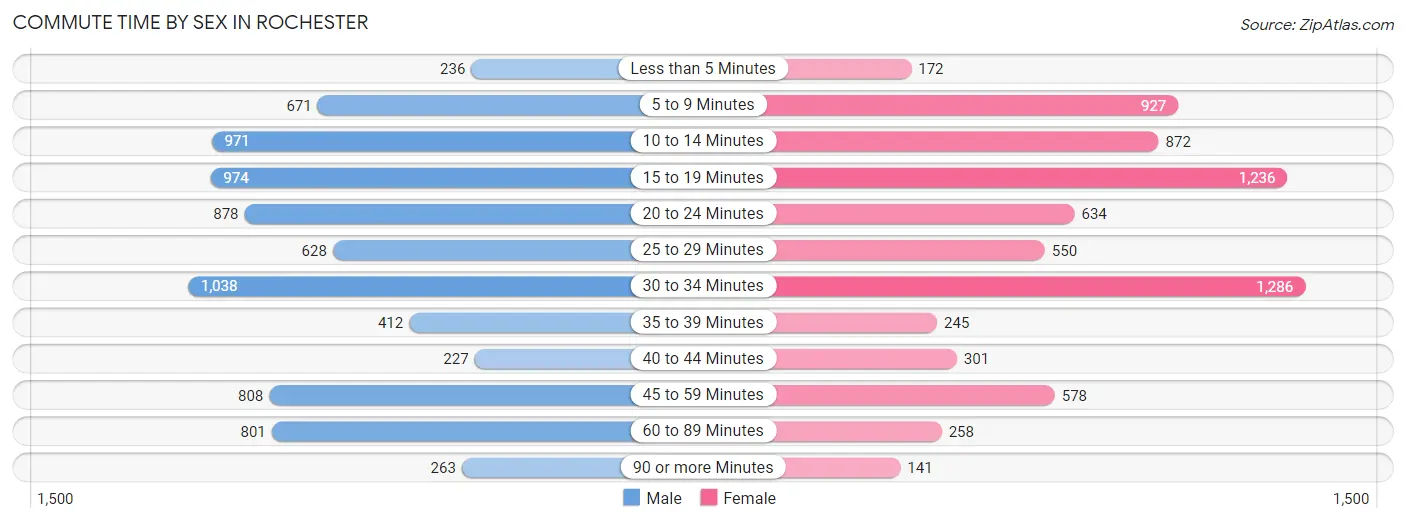
| Commute Time | Male | Female |
| Less than 5 Minutes | 236 (3.0%) | 172 (2.4%) |
| 5 to 9 Minutes | 671 (8.5%) | 927 (12.9%) |
| 10 to 14 Minutes | 971 (12.3%) | 872 (12.1%) |
| 15 to 19 Minutes | 974 (12.3%) | 1,236 (17.2%) |
| 20 to 24 Minutes | 878 (11.1%) | 634 (8.8%) |
| 25 to 29 Minutes | 628 (7.9%) | 550 (7.6%) |
| 30 to 34 Minutes | 1,038 (13.1%) | 1,286 (17.9%) |
| 35 to 39 Minutes | 412 (5.2%) | 245 (3.4%) |
| 40 to 44 Minutes | 227 (2.9%) | 301 (4.2%) |
| 45 to 59 Minutes | 808 (10.2%) | 578 (8.0%) |
| 60 to 89 Minutes | 801 (10.1%) | 258 (3.6%) |
| 90 or more Minutes | 263 (3.3%) | 141 (2.0%) |
Time of Departure to Work by Sex in Rochester
The most frequent times of departure to work in Rochester are 6:30 AM to 6:59 AM (1,123, 14.2%) for males and 7:30 AM to 7:59 AM (1,192, 16.6%) for females.
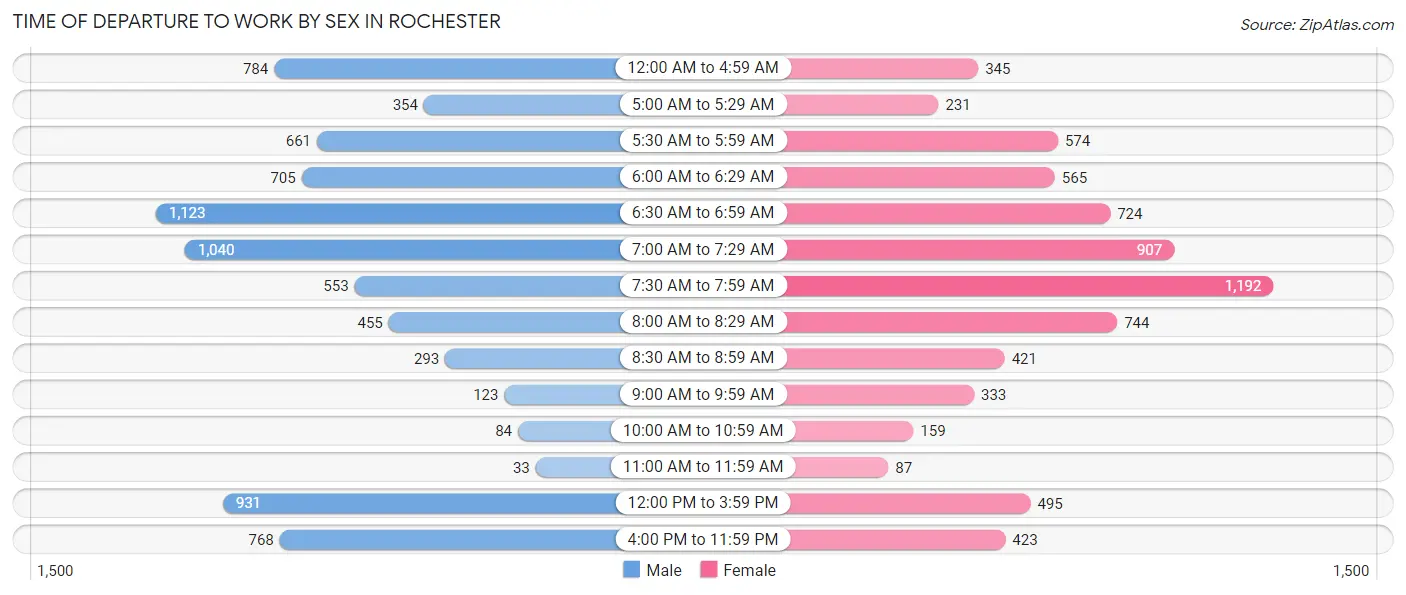
| Time of Departure | Male | Female |
| 12:00 AM to 4:59 AM | 784 (9.9%) | 345 (4.8%) |
| 5:00 AM to 5:29 AM | 354 (4.5%) | 231 (3.2%) |
| 5:30 AM to 5:59 AM | 661 (8.4%) | 574 (8.0%) |
| 6:00 AM to 6:29 AM | 705 (8.9%) | 565 (7.9%) |
| 6:30 AM to 6:59 AM | 1,123 (14.2%) | 724 (10.1%) |
| 7:00 AM to 7:29 AM | 1,040 (13.2%) | 907 (12.6%) |
| 7:30 AM to 7:59 AM | 553 (7.0%) | 1,192 (16.6%) |
| 8:00 AM to 8:29 AM | 455 (5.8%) | 744 (10.3%) |
| 8:30 AM to 8:59 AM | 293 (3.7%) | 421 (5.9%) |
| 9:00 AM to 9:59 AM | 123 (1.6%) | 333 (4.6%) |
| 10:00 AM to 10:59 AM | 84 (1.1%) | 159 (2.2%) |
| 11:00 AM to 11:59 AM | 33 (0.4%) | 87 (1.2%) |
| 12:00 PM to 3:59 PM | 931 (11.8%) | 495 (6.9%) |
| 4:00 PM to 11:59 PM | 768 (9.7%) | 423 (5.9%) |
| Total | 7,907 (100.0%) | 7,200 (100.0%) |
Housing Occupancy in Rochester
Occupancy by Ownership in Rochester
Of the total 13,542 dwellings in Rochester, owner-occupied units account for 8,933 (66.0%), while renter-occupied units make up 4,609 (34.0%).
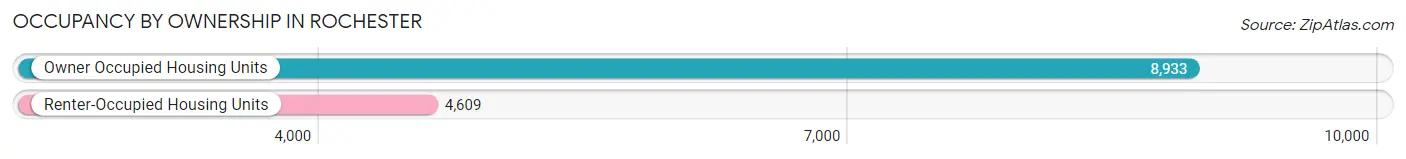
| Occupancy | # Housing Units | % Housing Units |
| Owner Occupied Housing Units | 8,933 | 66.0% |
| Renter-Occupied Housing Units | 4,609 | 34.0% |
| Total Occupied Housing Units | 13,542 | 100.0% |
Occupancy by Household Size in Rochester
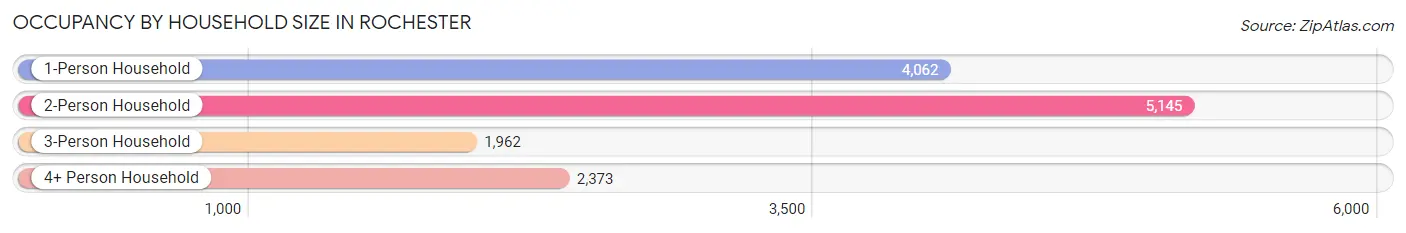
| Household Size | # Housing Units | % Housing Units |
| 1-Person Household | 4,062 | 30.0% |
| 2-Person Household | 5,145 | 38.0% |
| 3-Person Household | 1,962 | 14.5% |
| 4+ Person Household | 2,373 | 17.5% |
| Total Housing Units | 13,542 | 100.0% |
Occupancy by Ownership by Household Size in Rochester
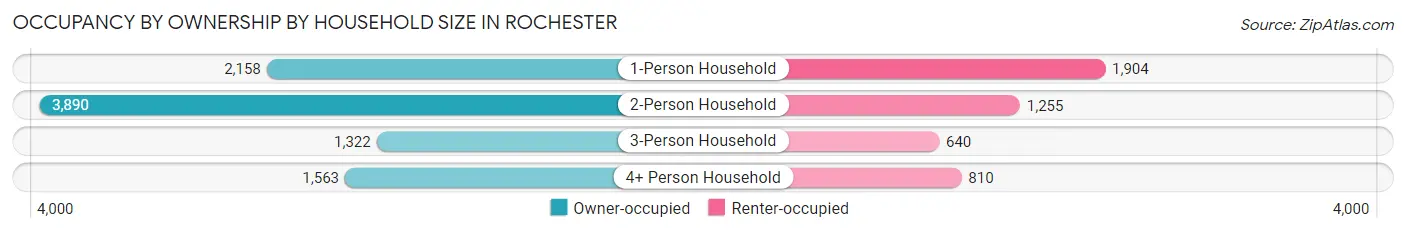
| Household Size | Owner-occupied | Renter-occupied |
| 1-Person Household | 2,158 (53.1%) | 1,904 (46.9%) |
| 2-Person Household | 3,890 (75.6%) | 1,255 (24.4%) |
| 3-Person Household | 1,322 (67.4%) | 640 (32.6%) |
| 4+ Person Household | 1,563 (65.9%) | 810 (34.1%) |
| Total Housing Units | 8,933 (66.0%) | 4,609 (34.0%) |
Occupancy by Educational Attainment in Rochester
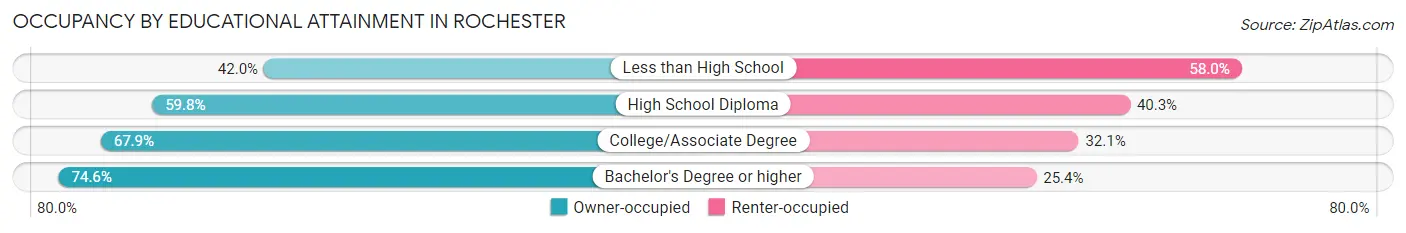
| Household Size | Owner-occupied | Renter-occupied |
| Less than High School | 322 (42.0%) | 444 (58.0%) |
| High School Diploma | 2,408 (59.8%) | 1,622 (40.3%) |
| College/Associate Degree | 3,263 (67.9%) | 1,542 (32.1%) |
| Bachelor's Degree or higher | 2,940 (74.6%) | 1,001 (25.4%) |
Occupancy by Age of Householder in Rochester
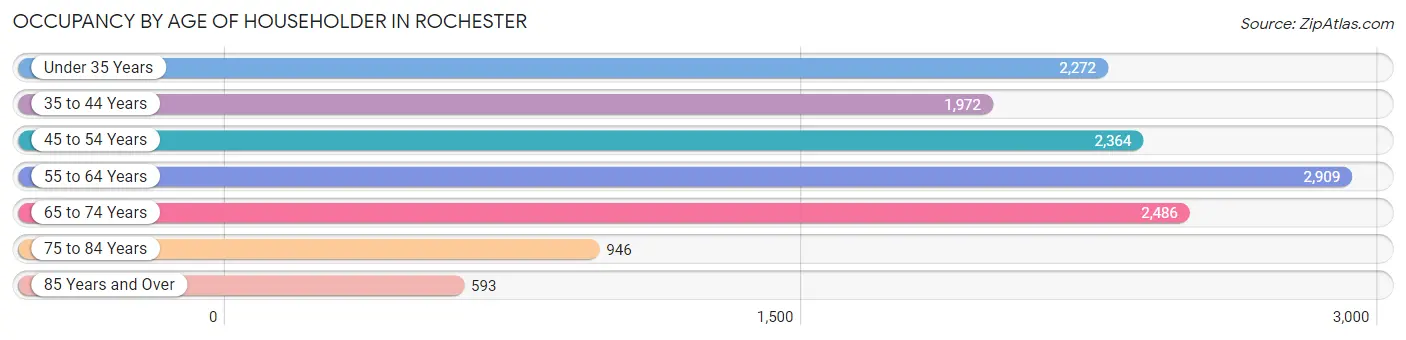
| Age Bracket | # Households | % Households |
| Under 35 Years | 2,272 | 16.8% |
| 35 to 44 Years | 1,972 | 14.6% |
| 45 to 54 Years | 2,364 | 17.5% |
| 55 to 64 Years | 2,909 | 21.5% |
| 65 to 74 Years | 2,486 | 18.4% |
| 75 to 84 Years | 946 | 7.0% |
| 85 Years and Over | 593 | 4.4% |
| Total | 13,542 | 100.0% |
Housing Finances in Rochester
Median Income by Occupancy in Rochester
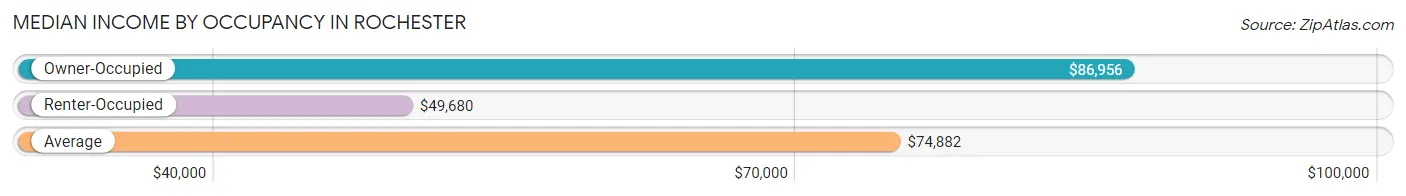
| Occupancy Type | # Households | Median Income |
| Owner-Occupied | 8,933 (66.0%) | $86,956 |
| Renter-Occupied | 4,609 (34.0%) | $49,680 |
| Average | 13,542 (100.0%) | $74,882 |
Occupancy by Householder Income Bracket in Rochester
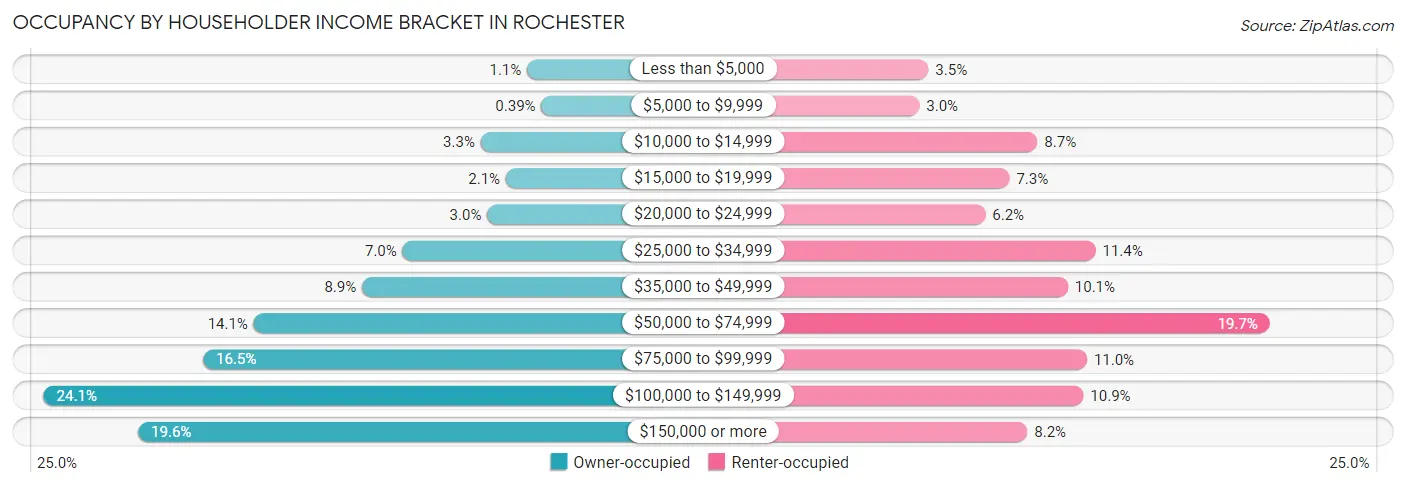
| Income Bracket | Owner-occupied | Renter-occupied |
| Less than $5,000 | 96 (1.1%) | 160 (3.5%) |
| $5,000 to $9,999 | 35 (0.4%) | 140 (3.0%) |
| $10,000 to $14,999 | 293 (3.3%) | 399 (8.7%) |
| $15,000 to $19,999 | 186 (2.1%) | 338 (7.3%) |
| $20,000 to $24,999 | 265 (3.0%) | 285 (6.2%) |
| $25,000 to $34,999 | 625 (7.0%) | 527 (11.4%) |
| $35,000 to $49,999 | 798 (8.9%) | 466 (10.1%) |
| $50,000 to $74,999 | 1,259 (14.1%) | 909 (19.7%) |
| $75,000 to $99,999 | 1,474 (16.5%) | 508 (11.0%) |
| $100,000 to $149,999 | 2,152 (24.1%) | 500 (10.8%) |
| $150,000 or more | 1,750 (19.6%) | 377 (8.2%) |
| Total | 8,933 (100.0%) | 4,609 (100.0%) |
Monthly Housing Cost Tiers in Rochester
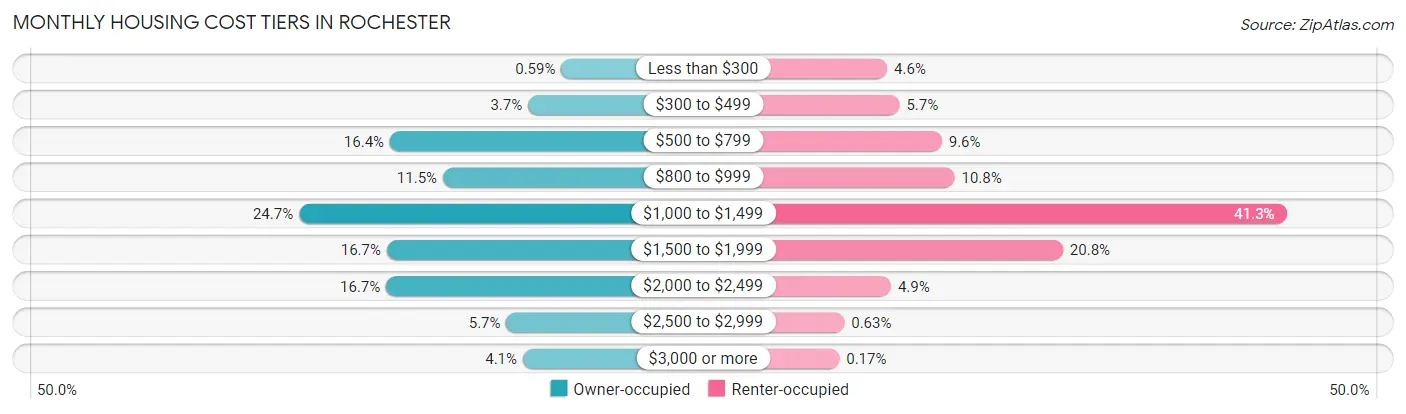
| Monthly Cost | Owner-occupied | Renter-occupied |
| Less than $300 | 53 (0.6%) | 211 (4.6%) |
| $300 to $499 | 326 (3.6%) | 263 (5.7%) |
| $500 to $799 | 1,462 (16.4%) | 443 (9.6%) |
| $800 to $999 | 1,026 (11.5%) | 497 (10.8%) |
| $1,000 to $1,499 | 2,210 (24.7%) | 1,905 (41.3%) |
| $1,500 to $1,999 | 1,488 (16.7%) | 957 (20.8%) |
| $2,000 to $2,499 | 1,494 (16.7%) | 227 (4.9%) |
| $2,500 to $2,999 | 505 (5.7%) | 29 (0.6%) |
| $3,000 or more | 369 (4.1%) | 8 (0.2%) |
| Total | 8,933 (100.0%) | 4,609 (100.0%) |
Physical Housing Characteristics in Rochester
Housing Structures in Rochester
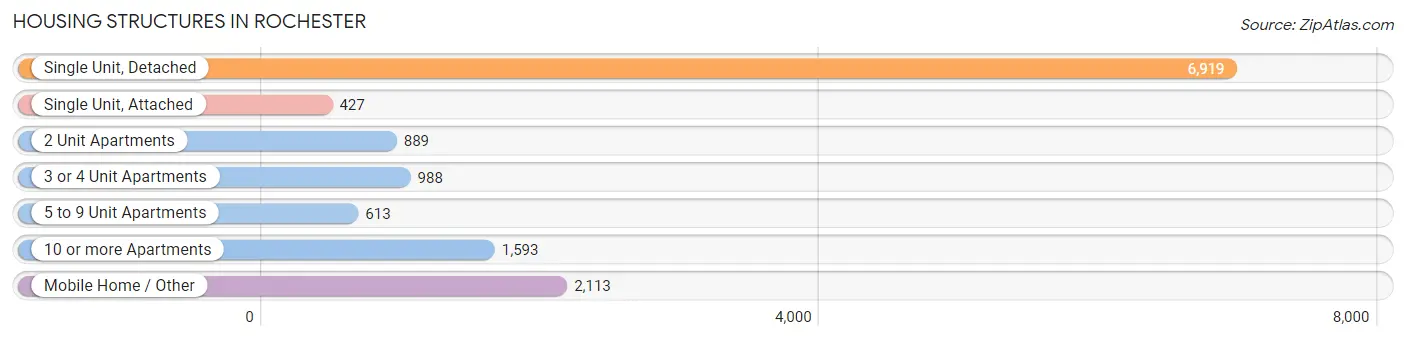
| Structure Type | # Housing Units | % Housing Units |
| Single Unit, Detached | 6,919 | 51.1% |
| Single Unit, Attached | 427 | 3.2% |
| 2 Unit Apartments | 889 | 6.6% |
| 3 or 4 Unit Apartments | 988 | 7.3% |
| 5 to 9 Unit Apartments | 613 | 4.5% |
| 10 or more Apartments | 1,593 | 11.8% |
| Mobile Home / Other | 2,113 | 15.6% |
| Total | 13,542 | 100.0% |
Housing Structures by Occupancy in Rochester
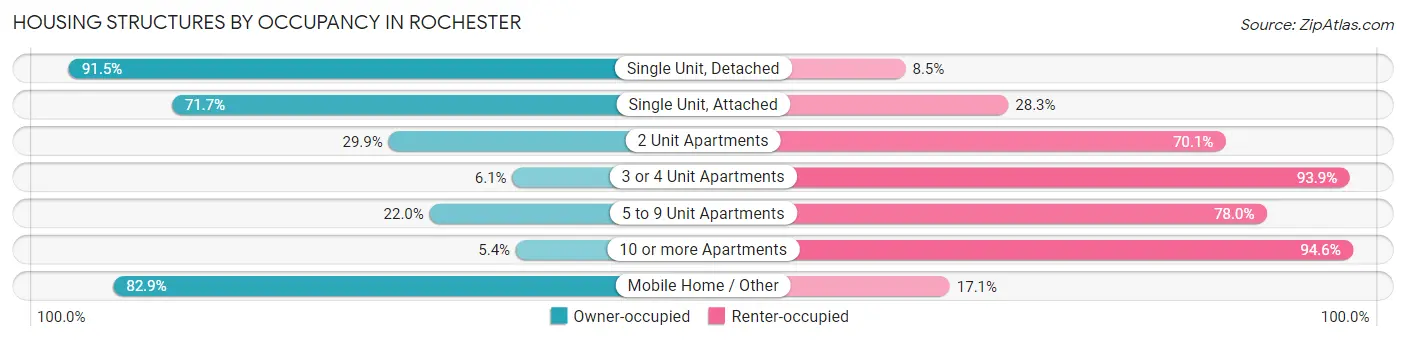
| Structure Type | Owner-occupied | Renter-occupied |
| Single Unit, Detached | 6,328 (91.5%) | 591 (8.5%) |
| Single Unit, Attached | 306 (71.7%) | 121 (28.3%) |
| 2 Unit Apartments | 266 (29.9%) | 623 (70.1%) |
| 3 or 4 Unit Apartments | 60 (6.1%) | 928 (93.9%) |
| 5 to 9 Unit Apartments | 135 (22.0%) | 478 (78.0%) |
| 10 or more Apartments | 86 (5.4%) | 1,507 (94.6%) |
| Mobile Home / Other | 1,752 (82.9%) | 361 (17.1%) |
| Total | 8,933 (66.0%) | 4,609 (34.0%) |
Housing Structures by Number of Rooms in Rochester
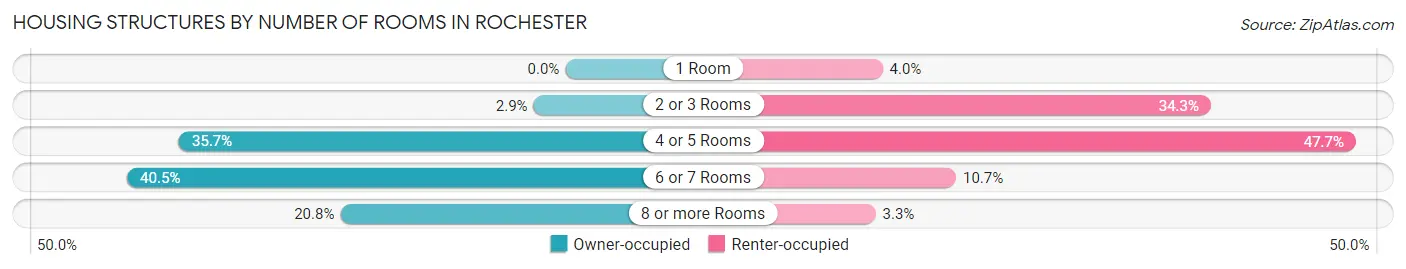
| Number of Rooms | Owner-occupied | Renter-occupied |
| 1 Room | 0 (0.0%) | 182 (4.0%) |
| 2 or 3 Rooms | 263 (2.9%) | 1,581 (34.3%) |
| 4 or 5 Rooms | 3,192 (35.7%) | 2,199 (47.7%) |
| 6 or 7 Rooms | 3,619 (40.5%) | 495 (10.7%) |
| 8 or more Rooms | 1,859 (20.8%) | 152 (3.3%) |
| Total | 8,933 (100.0%) | 4,609 (100.0%) |
Housing Structure by Heating Type in Rochester
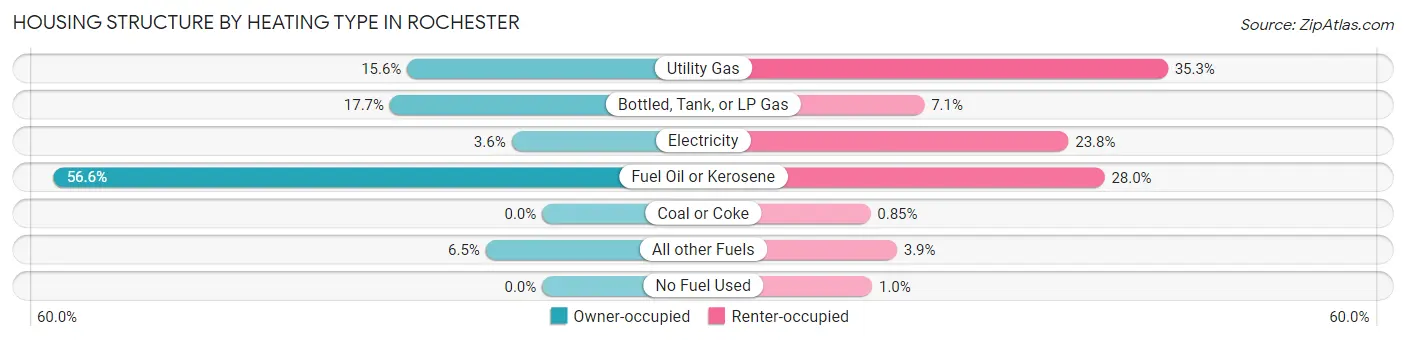
| Heating Type | Owner-occupied | Renter-occupied |
| Utility Gas | 1,397 (15.6%) | 1,628 (35.3%) |
| Bottled, Tank, or LP Gas | 1,577 (17.6%) | 327 (7.1%) |
| Electricity | 317 (3.5%) | 1,097 (23.8%) |
| Fuel Oil or Kerosene | 5,058 (56.6%) | 1,290 (28.0%) |
| Coal or Coke | 0 (0.0%) | 39 (0.9%) |
| All other Fuels | 584 (6.5%) | 180 (3.9%) |
| No Fuel Used | 0 (0.0%) | 48 (1.0%) |
| Total | 8,933 (100.0%) | 4,609 (100.0%) |
Household Vehicle Usage in Rochester
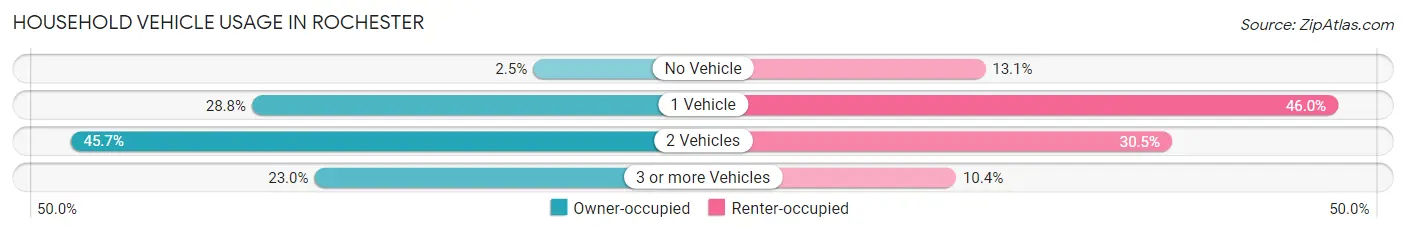
| Vehicles per Household | Owner-occupied | Renter-occupied |
| No Vehicle | 227 (2.5%) | 604 (13.1%) |
| 1 Vehicle | 2,572 (28.8%) | 2,121 (46.0%) |
| 2 Vehicles | 4,083 (45.7%) | 1,406 (30.5%) |
| 3 or more Vehicles | 2,051 (23.0%) | 478 (10.4%) |
| Total | 8,933 (100.0%) | 4,609 (100.0%) |
Real Estate & Mortgages in Rochester
Real Estate and Mortgage Overview in Rochester
| Characteristic | Without Mortgage | With Mortgage |
| Housing Units | 3,760 | 5,173 |
| Median Property Value | $203,200 | $259,700 |
| Median Household Income | $62,089 | $1,295 |
| Monthly Housing Costs | $868 | $361 |
| Real Estate Taxes | $4,035 | $40 |
Property Value by Mortgage Status in Rochester
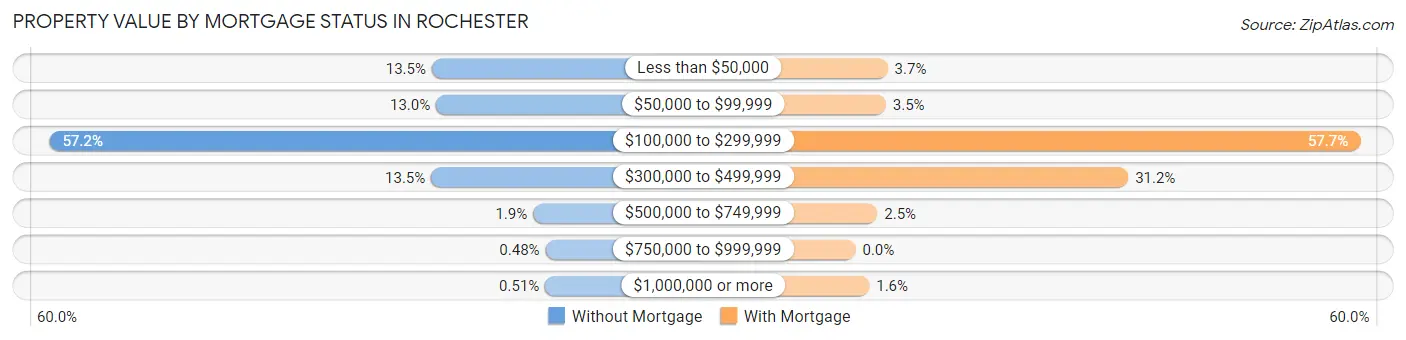
| Property Value | Without Mortgage | With Mortgage |
| Less than $50,000 | 506 (13.5%) | 190 (3.7%) |
| $50,000 to $99,999 | 488 (13.0%) | 179 (3.5%) |
| $100,000 to $299,999 | 2,149 (57.2%) | 2,982 (57.7%) |
| $300,000 to $499,999 | 509 (13.5%) | 1,612 (31.2%) |
| $500,000 to $749,999 | 71 (1.9%) | 129 (2.5%) |
| $750,000 to $999,999 | 18 (0.5%) | 0 (0.0%) |
| $1,000,000 or more | 19 (0.5%) | 81 (1.6%) |
| Total | 3,760 (100.0%) | 5,173 (100.0%) |
Household Income by Mortgage Status in Rochester
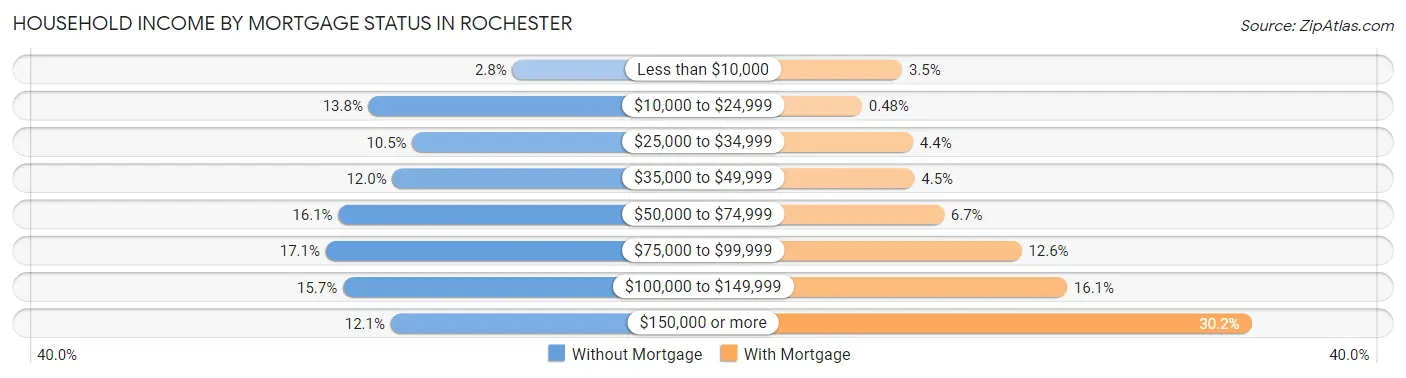
| Household Income | Without Mortgage | With Mortgage |
| Less than $10,000 | 106 (2.8%) | 183 (3.5%) |
| $10,000 to $24,999 | 518 (13.8%) | 25 (0.5%) |
| $25,000 to $34,999 | 393 (10.4%) | 226 (4.4%) |
| $35,000 to $49,999 | 450 (12.0%) | 232 (4.5%) |
| $50,000 to $74,999 | 605 (16.1%) | 348 (6.7%) |
| $75,000 to $99,999 | 641 (17.1%) | 654 (12.6%) |
| $100,000 to $149,999 | 592 (15.7%) | 833 (16.1%) |
| $150,000 or more | 455 (12.1%) | 1,560 (30.2%) |
| Total | 3,760 (100.0%) | 5,173 (100.0%) |
Property Value to Household Income Ratio in Rochester
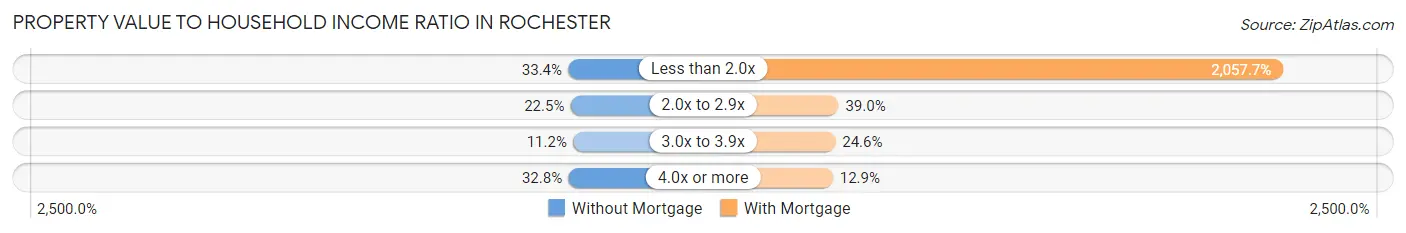
| Value-to-Income Ratio | Without Mortgage | With Mortgage |
| Less than 2.0x | 1,257 (33.4%) | 106,443 (2,057.7%) |
| 2.0x to 2.9x | 847 (22.5%) | 2,017 (39.0%) |
| 3.0x to 3.9x | 422 (11.2%) | 1,270 (24.5%) |
| 4.0x or more | 1,234 (32.8%) | 666 (12.9%) |
| Total | 3,760 (100.0%) | 5,173 (100.0%) |
Real Estate Taxes by Mortgage Status in Rochester
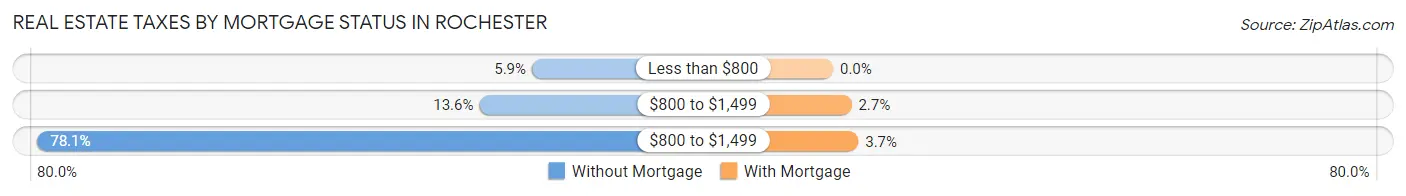
| Property Taxes | Without Mortgage | With Mortgage |
| Less than $800 | 221 (5.9%) | 0 (0.0%) |
| $800 to $1,499 | 510 (13.6%) | 139 (2.7%) |
| $800 to $1,499 | 2,938 (78.1%) | 191 (3.7%) |
| Total | 3,760 (100.0%) | 5,173 (100.0%) |
Health & Disability in Rochester
Health Insurance Coverage by Age in Rochester
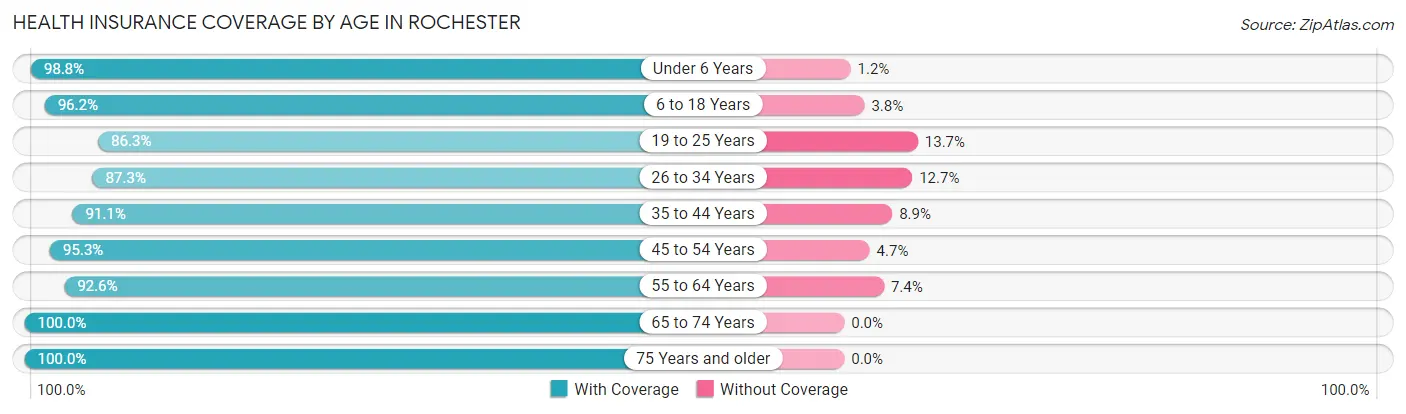
| Age Bracket | With Coverage | Without Coverage |
| Under 6 Years | 1,752 (98.8%) | 21 (1.2%) |
| 6 to 18 Years | 4,678 (96.2%) | 183 (3.8%) |
| 19 to 25 Years | 2,439 (86.3%) | 388 (13.7%) |
| 26 to 34 Years | 2,887 (87.3%) | 419 (12.7%) |
| 35 to 44 Years | 3,789 (91.1%) | 372 (8.9%) |
| 45 to 54 Years | 4,004 (95.3%) | 199 (4.7%) |
| 55 to 64 Years | 4,796 (92.6%) | 383 (7.4%) |
| 65 to 74 Years | 3,598 (100.0%) | 0 (0.0%) |
| 75 Years and older | 2,278 (100.0%) | 0 (0.0%) |
| Total | 30,221 (93.9%) | 1,965 (6.1%) |
Health Insurance Coverage by Citizenship Status in Rochester
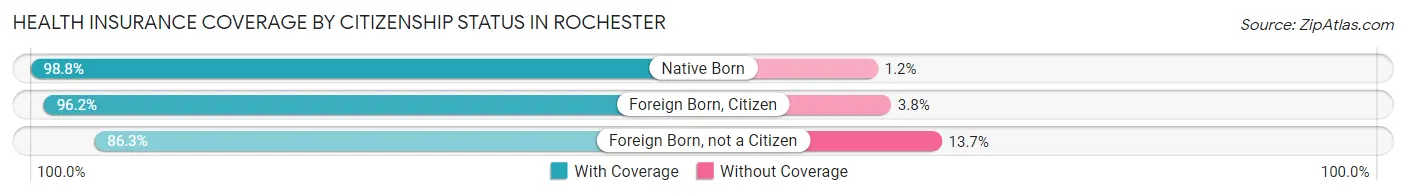
| Citizenship Status | With Coverage | Without Coverage |
| Native Born | 1,752 (98.8%) | 21 (1.2%) |
| Foreign Born, Citizen | 4,678 (96.2%) | 183 (3.8%) |
| Foreign Born, not a Citizen | 2,439 (86.3%) | 388 (13.7%) |
Health Insurance Coverage by Household Income in Rochester
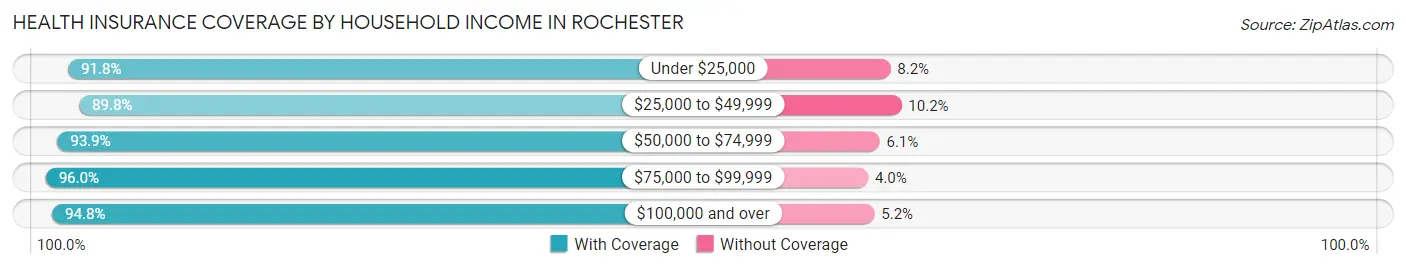
| Household Income | With Coverage | Without Coverage |
| Under $25,000 | 2,992 (91.8%) | 266 (8.2%) |
| $25,000 to $49,999 | 3,485 (89.8%) | 397 (10.2%) |
| $50,000 to $74,999 | 5,146 (93.9%) | 336 (6.1%) |
| $75,000 to $99,999 | 4,853 (96.0%) | 200 (4.0%) |
| $100,000 and over | 13,732 (94.8%) | 748 (5.2%) |
Public vs Private Health Insurance Coverage by Age in Rochester
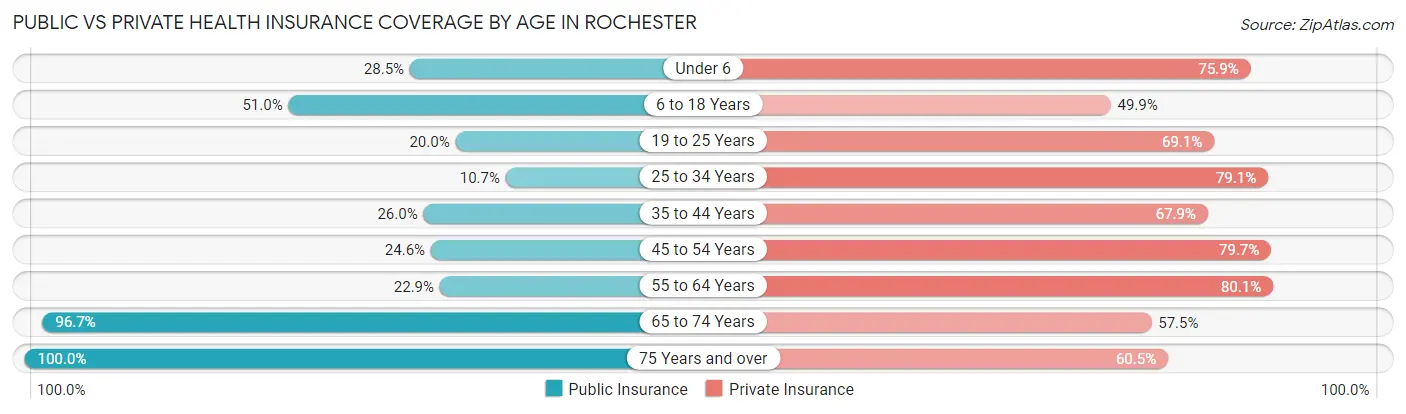
| Age Bracket | Public Insurance | Private Insurance |
| Under 6 | 505 (28.5%) | 1,345 (75.9%) |
| 6 to 18 Years | 2,480 (51.0%) | 2,425 (49.9%) |
| 19 to 25 Years | 566 (20.0%) | 1,953 (69.1%) |
| 25 to 34 Years | 353 (10.7%) | 2,615 (79.1%) |
| 35 to 44 Years | 1,080 (26.0%) | 2,826 (67.9%) |
| 45 to 54 Years | 1,033 (24.6%) | 3,349 (79.7%) |
| 55 to 64 Years | 1,187 (22.9%) | 4,146 (80.0%) |
| 65 to 74 Years | 3,479 (96.7%) | 2,067 (57.5%) |
| 75 Years and over | 2,278 (100.0%) | 1,379 (60.5%) |
| Total | 12,961 (40.3%) | 22,105 (68.7%) |
Disability Status by Sex by Age in Rochester
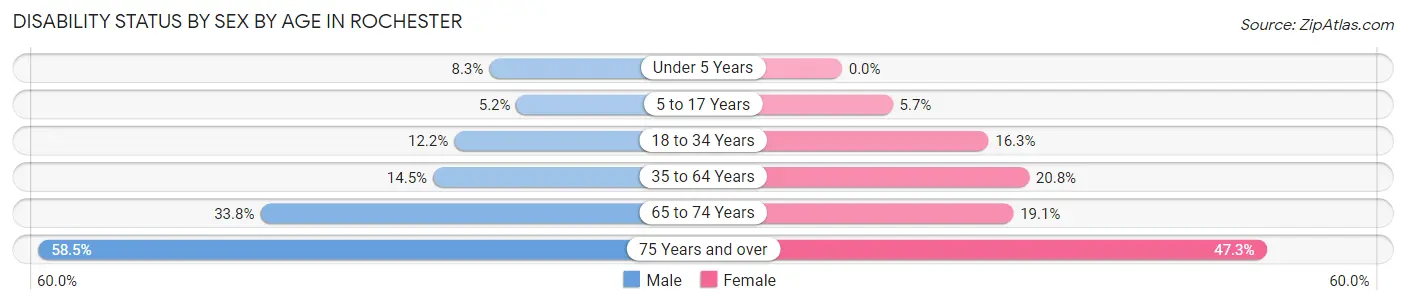
| Age Bracket | Male | Female |
| Under 5 Years | 63 (8.3%) | 0 (0.0%) |
| 5 to 17 Years | 157 (5.2%) | 111 (5.7%) |
| 18 to 34 Years | 403 (12.2%) | 503 (16.3%) |
| 35 to 64 Years | 950 (14.5%) | 1,460 (20.8%) |
| 65 to 74 Years | 578 (33.8%) | 360 (19.1%) |
| 75 Years and over | 528 (58.5%) | 650 (47.3%) |
Disability Class by Sex by Age in Rochester
Disability Class: Hearing Difficulty
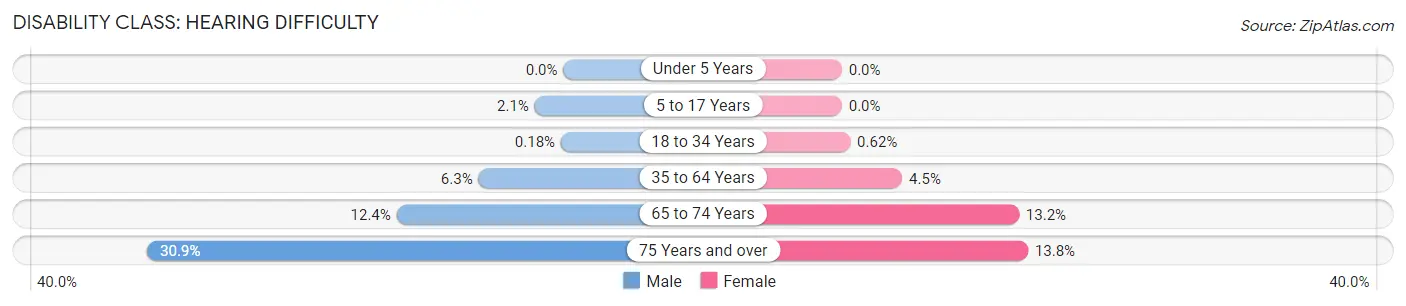
| Age Bracket | Male | Female |
| Under 5 Years | 0 (0.0%) | 0 (0.0%) |
| 5 to 17 Years | 64 (2.1%) | 0 (0.0%) |
| 18 to 34 Years | 6 (0.2%) | 19 (0.6%) |
| 35 to 64 Years | 412 (6.3%) | 314 (4.5%) |
| 65 to 74 Years | 212 (12.4%) | 248 (13.2%) |
| 75 Years and over | 279 (30.9%) | 190 (13.8%) |
Disability Class: Vision Difficulty
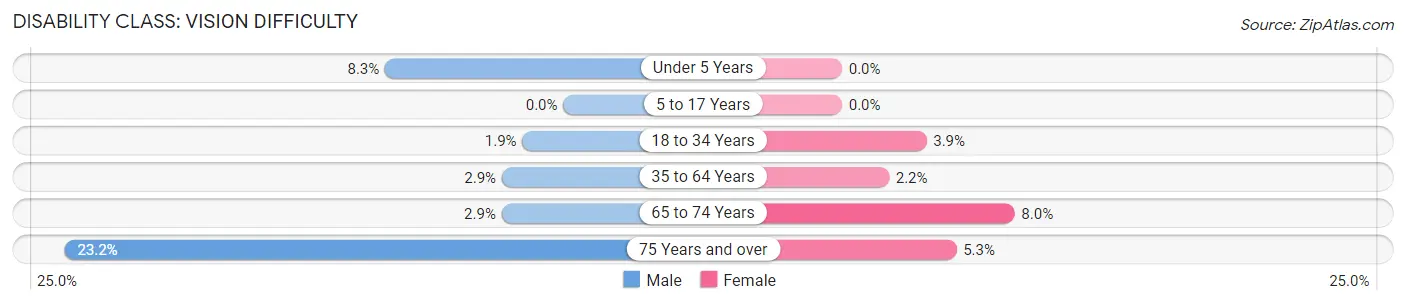
| Age Bracket | Male | Female |
| Under 5 Years | 63 (8.3%) | 0 (0.0%) |
| 5 to 17 Years | 0 (0.0%) | 0 (0.0%) |
| 18 to 34 Years | 63 (1.9%) | 121 (3.9%) |
| 35 to 64 Years | 186 (2.9%) | 153 (2.2%) |
| 65 to 74 Years | 49 (2.9%) | 151 (8.0%) |
| 75 Years and over | 209 (23.2%) | 73 (5.3%) |
Disability Class: Cognitive Difficulty
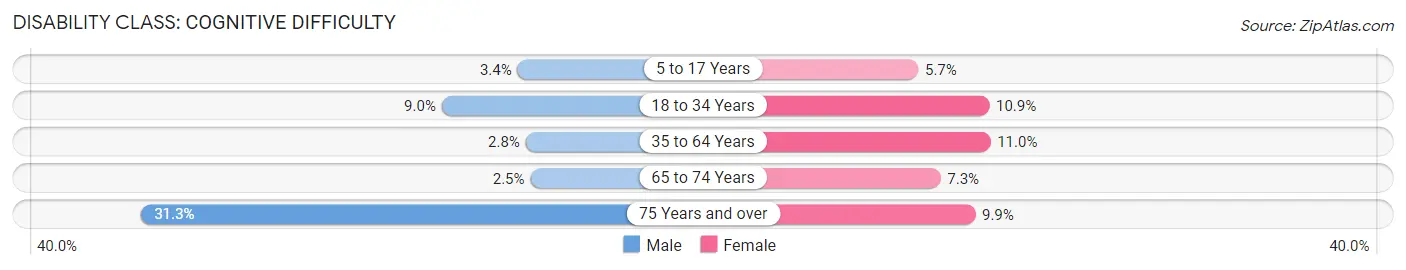
| Age Bracket | Male | Female |
| 5 to 17 Years | 102 (3.4%) | 111 (5.7%) |
| 18 to 34 Years | 299 (9.0%) | 337 (10.9%) |
| 35 to 64 Years | 183 (2.8%) | 772 (11.0%) |
| 65 to 74 Years | 42 (2.5%) | 138 (7.3%) |
| 75 Years and over | 283 (31.3%) | 136 (9.9%) |
Disability Class: Ambulatory Difficulty
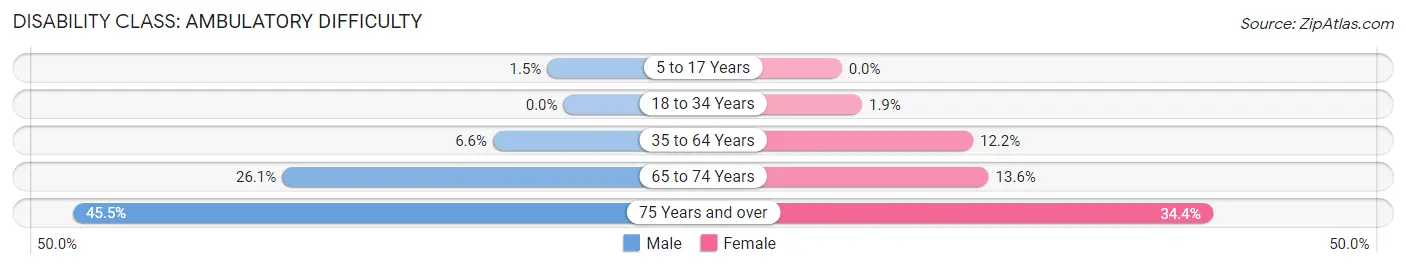
| Age Bracket | Male | Female |
| 5 to 17 Years | 45 (1.5%) | 0 (0.0%) |
| 18 to 34 Years | 0 (0.0%) | 58 (1.9%) |
| 35 to 64 Years | 428 (6.6%) | 853 (12.2%) |
| 65 to 74 Years | 447 (26.1%) | 257 (13.6%) |
| 75 Years and over | 411 (45.5%) | 473 (34.4%) |
Disability Class: Self-Care Difficulty
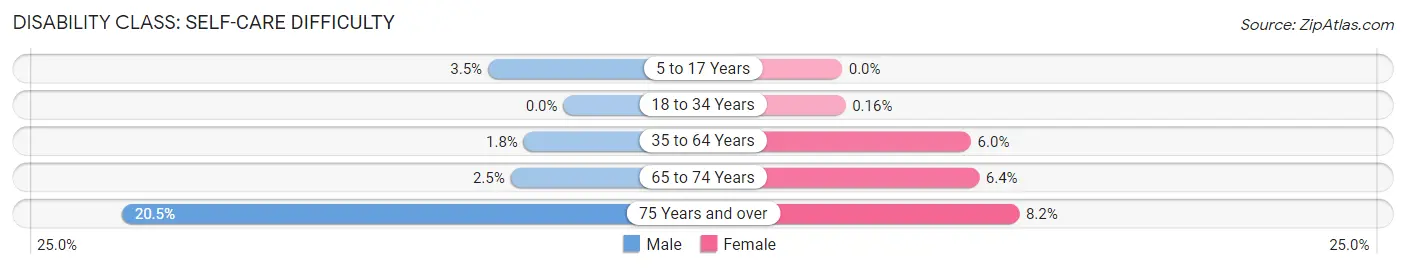
| Age Bracket | Male | Female |
| 5 to 17 Years | 105 (3.5%) | 0 (0.0%) |
| 18 to 34 Years | 0 (0.0%) | 5 (0.2%) |
| 35 to 64 Years | 120 (1.8%) | 419 (6.0%) |
| 65 to 74 Years | 42 (2.5%) | 120 (6.4%) |
| 75 Years and over | 185 (20.5%) | 113 (8.2%) |
Technology Access in Rochester
Computing Device Access in Rochester
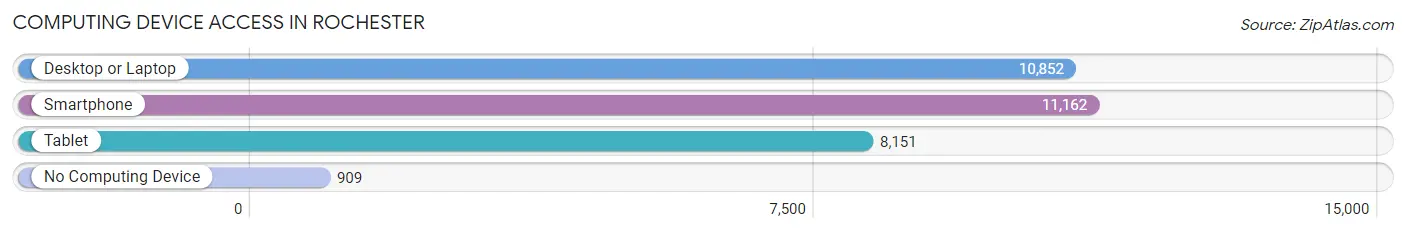
| Device Type | # Households | % Households |
| Desktop or Laptop | 10,852 | 80.1% |
| Smartphone | 11,162 | 82.4% |
| Tablet | 8,151 | 60.2% |
| No Computing Device | 909 | 6.7% |
| Total | 13,542 | 100.0% |
Internet Access in Rochester
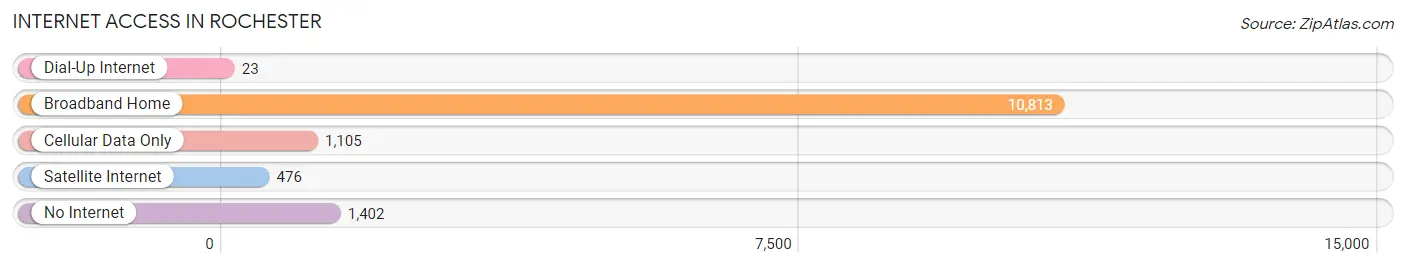
| Internet Type | # Households | % Households |
| Dial-Up Internet | 23 | 0.2% |
| Broadband Home | 10,813 | 79.8% |
| Cellular Data Only | 1,105 | 8.2% |
| Satellite Internet | 476 | 3.5% |
| No Internet | 1,402 | 10.3% |
| Total | 13,542 | 100.0% |
Rochester Summary
Rochester, New Hampshire is a city located in Strafford County in the southeastern part of the state. It is the largest city in the county and the fourth largest in the state. The city is situated on the Salmon Falls River, which is a tributary of the Piscataqua River. Rochester is bordered by the towns of Farmington, Milton, and Strafford.
History
Rochester was first settled in 1722 by a group of settlers from Dover, New Hampshire. The town was originally called "Ossipee" after the Ossipee Indians who lived in the area. The town was renamed "Rochester" in 1722 after the English city of Rochester. The town was incorporated in 1722 and was the first town in the state to be incorporated.
In the early 19th century, Rochester was a major center for the lumber industry. The town was also home to several mills, including a paper mill, a woolen mill, and a cotton mill. The town was also home to several shoe factories.
In the late 19th century, Rochester became a major center for the textile industry. The town was home to several large textile mills, including the Rochester Woolen Mills, the Rochester Cotton Mills, and the Rochester Textile Mills.
Geography
Rochester is located in the southeastern part of the state, in Strafford County. The city is situated on the Salmon Falls River, which is a tributary of the Piscataqua River. The city is bordered by the towns of Farmington, Milton, and Strafford.
The city has a total area of 16.2 square miles, of which 15.9 square miles is land and 0.3 square miles is water. The city is located in the White Mountains region of New Hampshire and is surrounded by several mountains, including Mount Washington, Mount Adams, and Mount Jefferson.
Economy
Rochester has a diverse economy, with a variety of industries represented. The city is home to several large employers, including Frisbie Memorial Hospital, Liberty Mutual Insurance, and the Rochester School District. The city is also home to several small businesses, including restaurants, retail stores, and professional services.
The city is also home to several manufacturing companies, including Rochester Manufacturing, which produces medical equipment, and Rochester Textiles, which produces textiles. The city is also home to several technology companies, including Rochester Software Solutions, which produces software for the healthcare industry.
Demographics
As of the 2010 census, the city had a population of 29,752. The racial makeup of the city was 94.2% White, 1.7% African American, 0.4% Native American, 1.2% Asian, 0.1% Pacific Islander, 0.7% from other races, and 1.7% from two or more races. Hispanic or Latino of any race were 2.3% of the population.
The median income for a household in the city was $45,945, and the median income for a family was $54,945. The per capita income for the city was $22,945. About 8.3% of families and 11.2% of the population were below the poverty line, including 15.2% of those under age 18 and 8.2% of those age 65 or over.
Common Questions
What is Per Capita Income in Rochester?
Per Capita income in Rochester is $39,139.
What is the Median Family Income in Rochester?
Median Family Income in Rochester is $91,295.
What is the Median Household income in Rochester?
Median Household Income in Rochester is $74,882.
What is Income or Wage Gap in Rochester?
Income or Wage Gap in Rochester is 16.7%.
Women in Rochester earn 83.3 cents for every dollar earned by a man.
What is Family Income Deficit in Rochester?
Family Income Deficit in Rochester is $11,057.
Families that are below poverty line in Rochester earn $11,057 less on average than the poverty threshold level.
What is Inequality or Gini Index in Rochester?
Inequality or Gini Index in Rochester is 0.43.
What is the Total Population of Rochester?
Total Population of Rochester is 32,573.
What is the Total Male Population of Rochester?
Total Male Population of Rochester is 16,451.
What is the Total Female Population of Rochester?
Total Female Population of Rochester is 16,122.
What is the Ratio of Males per 100 Females in Rochester?
There are 102.04 Males per 100 Females in Rochester.
What is the Ratio of Females per 100 Males in Rochester?
There are 98.00 Females per 100 Males in Rochester.
What is the Median Population Age in Rochester?
Median Population Age in Rochester is 43.3 Years.
What is the Average Family Size in Rochester
Average Family Size in Rochester is 2.9 People.
What is the Average Household Size in Rochester
Average Household Size in Rochester is 2.4 People.
How Large is the Labor Force in Rochester?
There are 17,889 People in the Labor Forcein in Rochester.
What is the Percentage of People in the Labor Force in Rochester?
66.4% of People are in the Labor Force in Rochester.
What is the Unemployment Rate in Rochester?
Unemployment Rate in Rochester is 3.8%.