Hanover, NH Map & Demographics
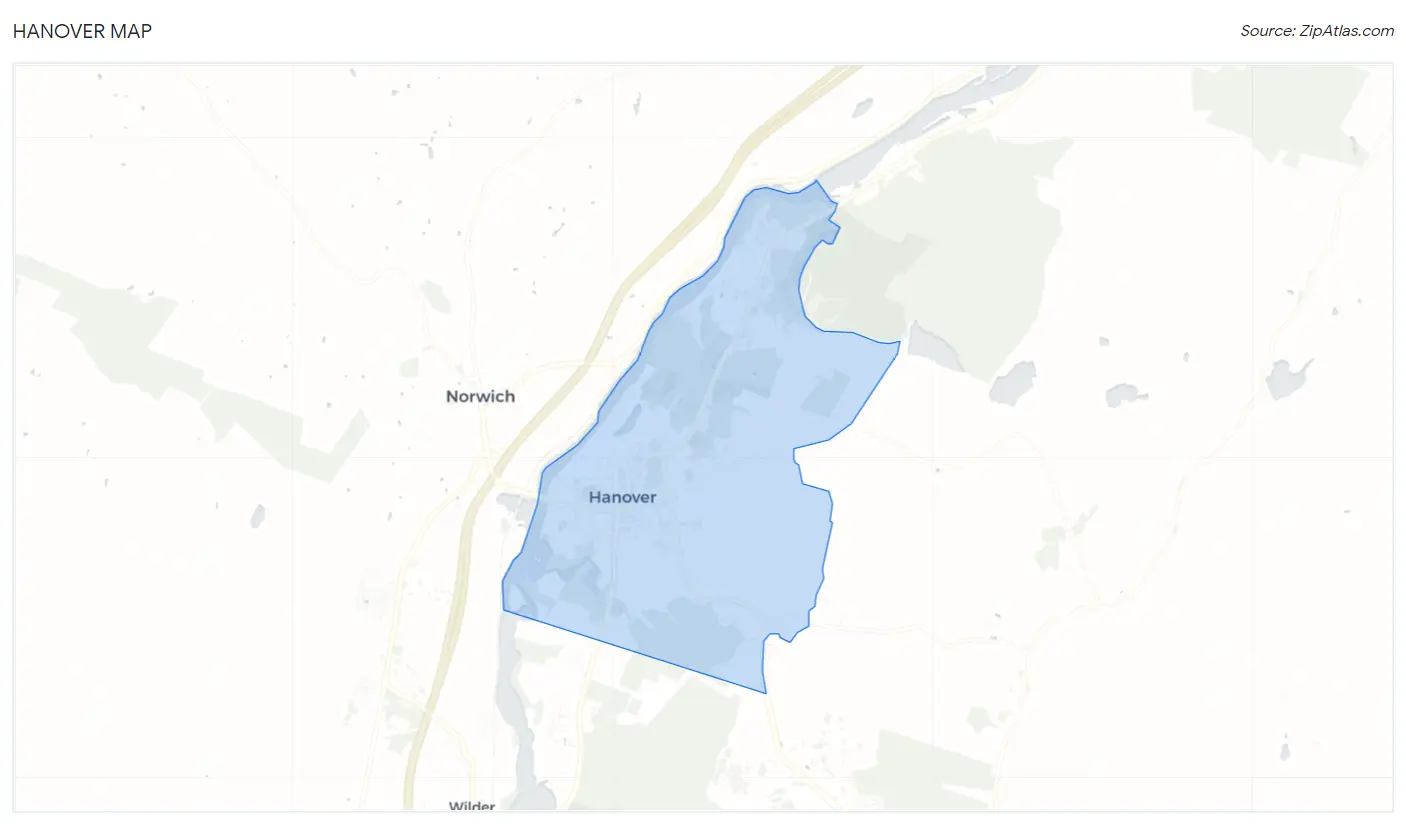
Hanover Map
Hanover Overview
$51,400
PER CAPITA INCOME
$239,479
AVG FAMILY INCOME
$111,958
AVG HOUSEHOLD INCOME
33.6%
WAGE / INCOME GAP [ % ]
66.4¢/ $1
WAGE / INCOME GAP [ $ ]
0.53
INEQUALITY / GINI INDEX
8,234
TOTAL POPULATION
4,039
MALE POPULATION
4,195
FEMALE POPULATION
96.28
MALES / 100 FEMALES
103.86
FEMALES / 100 MALES
22.0
MEDIAN AGE
3.0
AVG FAMILY SIZE
2.2
AVG HOUSEHOLD SIZE
3,097
LABOR FORCE [ PEOPLE ]
40.7%
PERCENT IN LABOR FORCE
4.5%
UNEMPLOYMENT RATE
Hanover Zip Codes
Hanover Area Codes
Income in Hanover
Income Overview in Hanover
Per Capita Income in Hanover is $51,400, while median incomes of families and households are $239,479 and $111,958 respectively.
| Characteristic | Number | Measure |
| Per Capita Income | 8,234 | $51,400 |
| Median Family Income | 969 | $239,479 |
| Mean Family Income | 969 | $297,653 |
| Median Household Income | 1,971 | $111,958 |
| Mean Household Income | 1,971 | $193,451 |
| Income Deficit | 969 | $0 |
| Wage / Income Gap (%) | 8,234 | 33.56% |
| Wage / Income Gap ($) | 8,234 | 66.44¢ per $1 |
| Gini / Inequality Index | 8,234 | 0.53 |
Earnings by Sex in Hanover
Average Earnings in Hanover are $40,508, $46,704 for men and $31,029 for women, a difference of 33.6%.
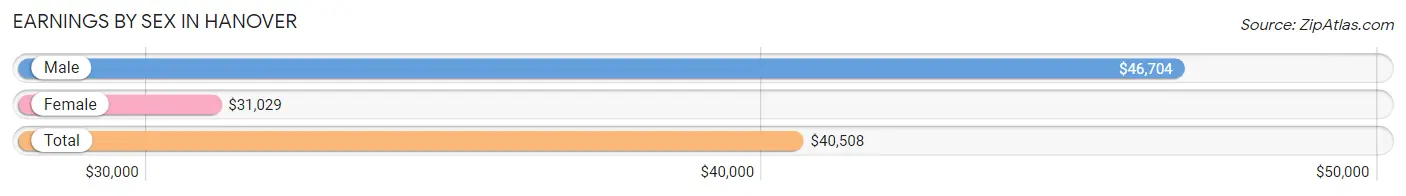
| Sex | Number | Average Earnings |
| Male | 1,996 (52.0%) | $46,704 |
| Female | 1,845 (48.0%) | $31,029 |
| Total | 3,841 (100.0%) | $40,508 |
Earnings by Sex by Income Bracket in Hanover
The most common earnings brackets in Hanover are $100,000+ for men (720 | 36.1%) and $100,000+ for women (283 | 15.3%).
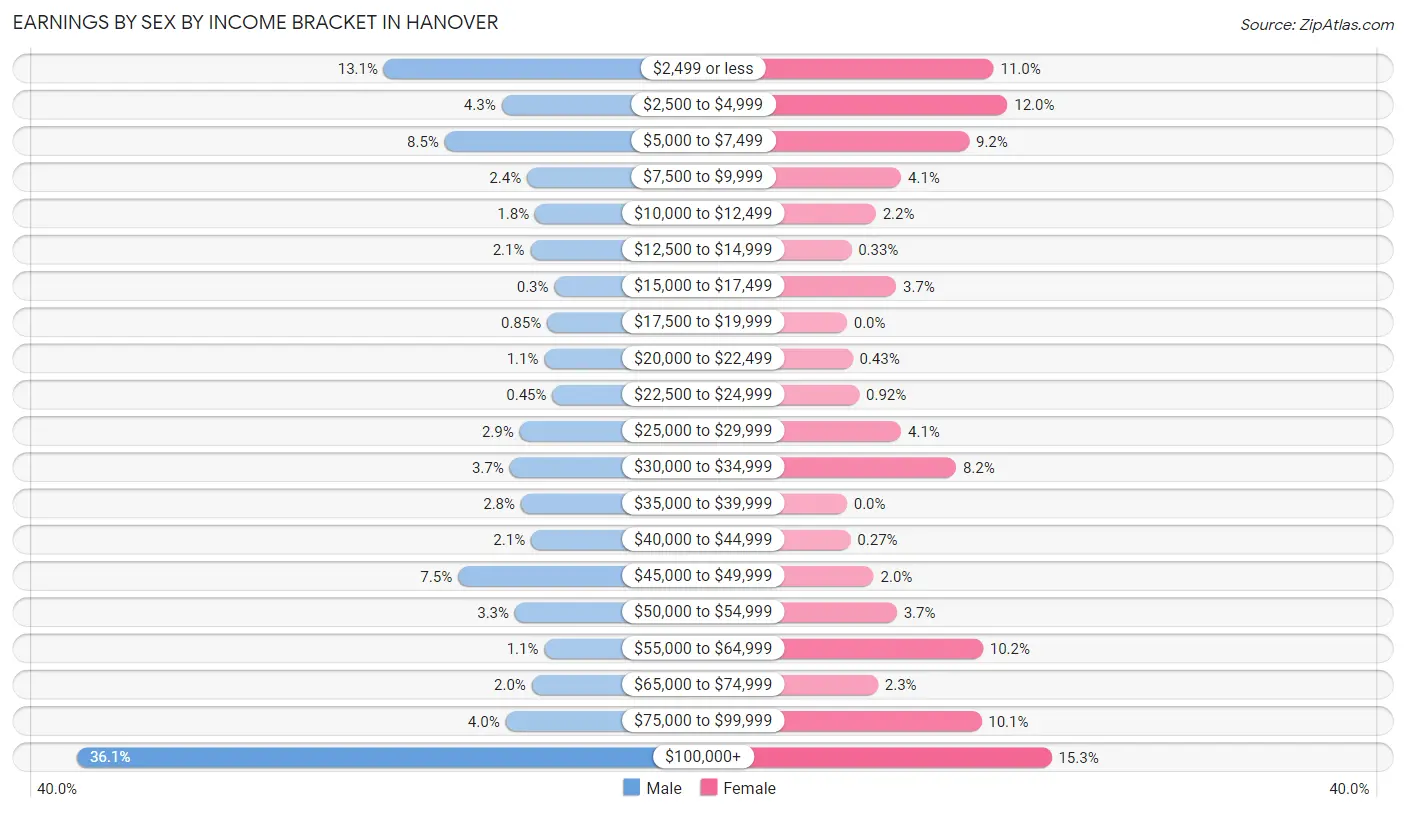
| Income | Male | Female |
| $2,499 or less | 261 (13.1%) | 203 (11.0%) |
| $2,500 to $4,999 | 85 (4.3%) | 222 (12.0%) |
| $5,000 to $7,499 | 170 (8.5%) | 169 (9.2%) |
| $7,500 to $9,999 | 47 (2.4%) | 75 (4.1%) |
| $10,000 to $12,499 | 35 (1.8%) | 40 (2.2%) |
| $12,500 to $14,999 | 42 (2.1%) | 6 (0.3%) |
| $15,000 to $17,499 | 6 (0.3%) | 68 (3.7%) |
| $17,500 to $19,999 | 17 (0.9%) | 0 (0.0%) |
| $20,000 to $22,499 | 21 (1.1%) | 8 (0.4%) |
| $22,500 to $24,999 | 9 (0.4%) | 17 (0.9%) |
| $25,000 to $29,999 | 58 (2.9%) | 75 (4.1%) |
| $30,000 to $34,999 | 73 (3.7%) | 151 (8.2%) |
| $35,000 to $39,999 | 56 (2.8%) | 0 (0.0%) |
| $40,000 to $44,999 | 41 (2.1%) | 5 (0.3%) |
| $45,000 to $49,999 | 150 (7.5%) | 37 (2.0%) |
| $50,000 to $54,999 | 65 (3.3%) | 69 (3.7%) |
| $55,000 to $64,999 | 21 (1.1%) | 188 (10.2%) |
| $65,000 to $74,999 | 40 (2.0%) | 43 (2.3%) |
| $75,000 to $99,999 | 79 (4.0%) | 186 (10.1%) |
| $100,000+ | 720 (36.1%) | 283 (15.3%) |
| Total | 1,996 (100.0%) | 1,845 (100.0%) |
Earnings by Sex by Educational Attainment in Hanover
Average earnings in Hanover are $112,222 for men and $63,586 for women, a difference of 43.3%. Men with an educational attainment of graduate degree enjoy the highest average annual earnings of $175,144, while those with bachelor's degree education earn the least with $56,012. Women with an educational attainment of graduate degree earn the most with the average annual earnings of $64,940, while those with college or associate's degree education have the smallest earnings of $46,985.
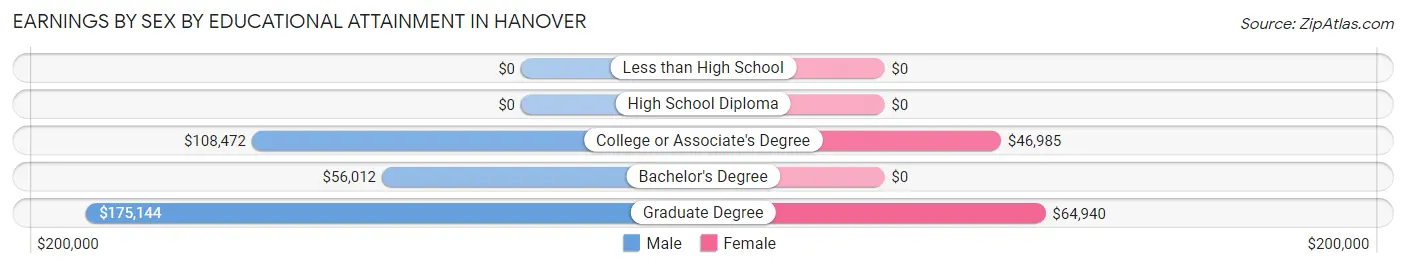
| Educational Attainment | Male Income | Female Income |
| Less than High School | - | - |
| High School Diploma | - | - |
| College or Associate's Degree | $108,472 | $46,985 |
| Bachelor's Degree | $56,012 | $0 |
| Graduate Degree | $175,144 | $64,940 |
| Total | $112,222 | $63,586 |
Family Income in Hanover
Family Income Brackets in Hanover
According to the Hanover family income data, there are 629 families falling into the $200,000+ income range, which is the most common income bracket and makes up 64.9% of all families.
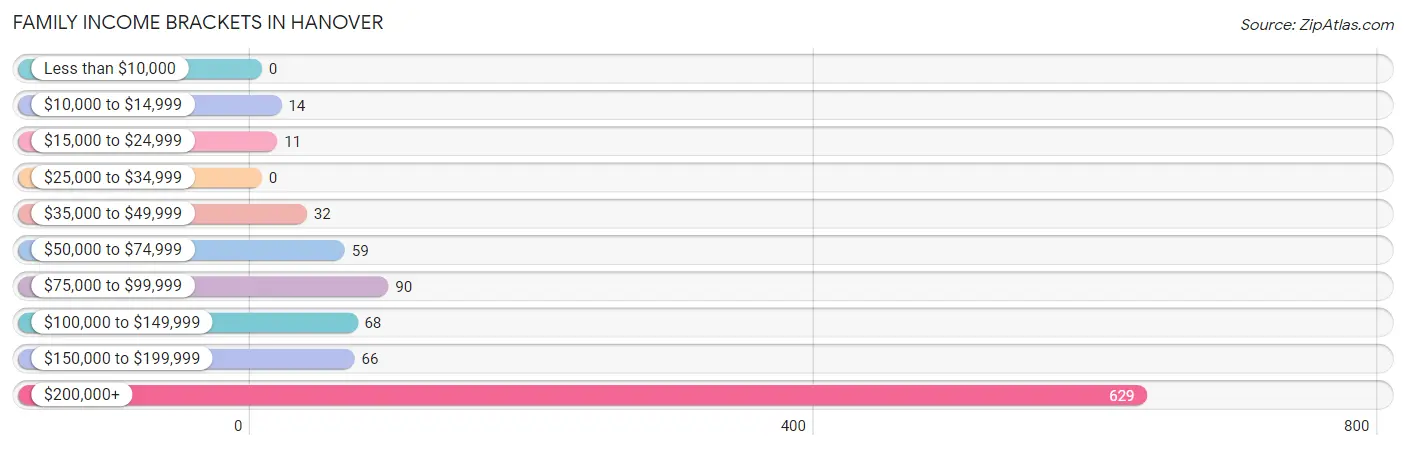
| Income Bracket | # Families | % Families |
| Less than $10,000 | 0 | 0.0% |
| $10,000 to $14,999 | 14 | 1.4% |
| $15,000 to $24,999 | 11 | 1.1% |
| $25,000 to $34,999 | 0 | 0.0% |
| $35,000 to $49,999 | 32 | 3.3% |
| $50,000 to $74,999 | 59 | 6.1% |
| $75,000 to $99,999 | 90 | 9.3% |
| $100,000 to $149,999 | 68 | 7.0% |
| $150,000 to $199,999 | 66 | 6.8% |
| $200,000+ | 629 | 64.9% |
Family Income by Famaliy Size in Hanover
3-person families (148 | 15.3%) account for the highest median family income in Hanover with $250,001 per family, while 2-person families (494 | 51.0%) have the highest median income of $103,750 per family member.
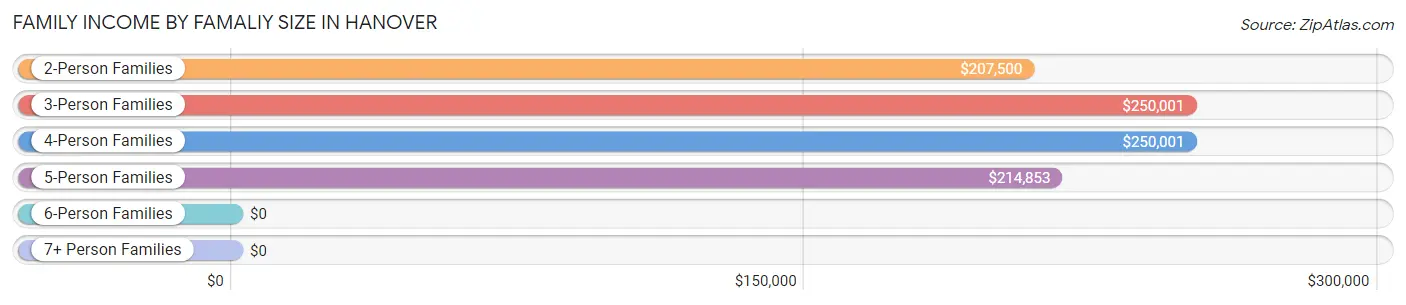
| Income Bracket | # Families | Median Income |
| 2-Person Families | 494 (51.0%) | $207,500 |
| 3-Person Families | 148 (15.3%) | $250,001 |
| 4-Person Families | 242 (25.0%) | $250,001 |
| 5-Person Families | 78 (8.1%) | $214,853 |
| 6-Person Families | 7 (0.7%) | $0 |
| 7+ Person Families | 0 (0.0%) | $0 |
| Total | 969 (100.0%) | $239,479 |
Family Income by Number of Earners in Hanover
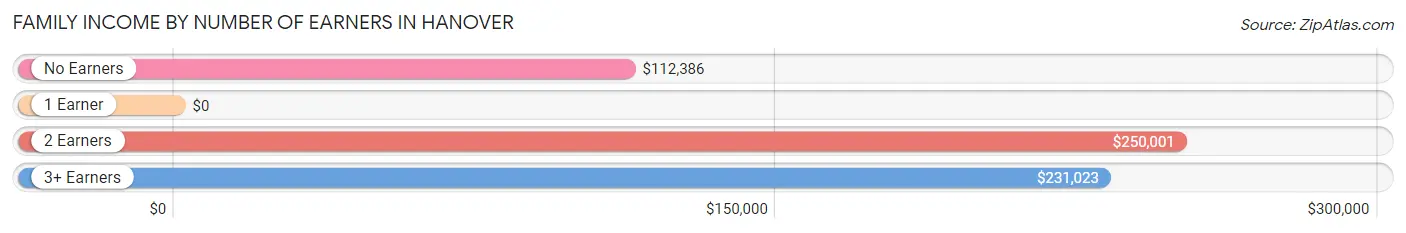
| Number of Earners | # Families | Median Income |
| No Earners | 169 (17.4%) | $112,386 |
| 1 Earner | 229 (23.6%) | $0 |
| 2 Earners | 462 (47.7%) | $250,001 |
| 3+ Earners | 109 (11.3%) | $231,023 |
| Total | 969 (100.0%) | $239,479 |
Household Income in Hanover
Household Income Brackets in Hanover
With 749 households falling in the category, the $200,000+ income range is the most frequent in Hanover, accounting for 38.0% of all households. In contrast, only 71 households (3.6%) fall into the $15,000 to $24,999 income bracket, making it the least populous group.
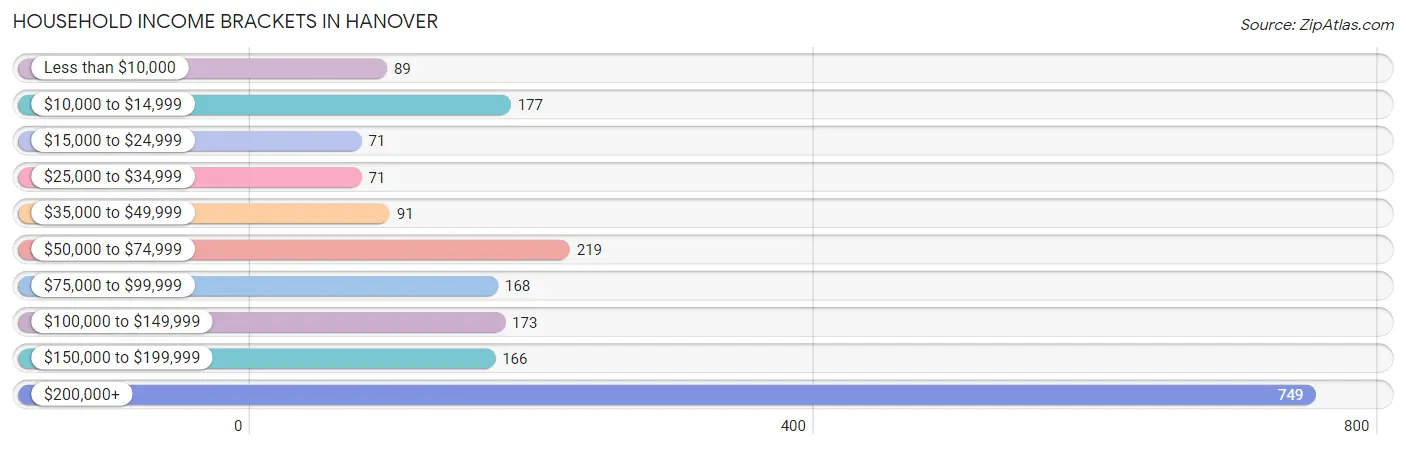
| Income Bracket | # Households | % Households |
| Less than $10,000 | 89 | 4.5% |
| $10,000 to $14,999 | 177 | 9.0% |
| $15,000 to $24,999 | 71 | 3.6% |
| $25,000 to $34,999 | 71 | 3.6% |
| $35,000 to $49,999 | 91 | 4.6% |
| $50,000 to $74,999 | 219 | 11.1% |
| $75,000 to $99,999 | 168 | 8.5% |
| $100,000 to $149,999 | 173 | 8.8% |
| $150,000 to $199,999 | 166 | 8.4% |
| $200,000+ | 749 | 38.0% |
Household Income by Householder Age in Hanover
The median household income in Hanover is $111,958, with the highest median household income of $231,019 found in the 45 to 64 years age bracket for the primary householder. A total of 542 households (27.5%) fall into this category. Meanwhile, the 15 to 24 years age bracket for the primary householder has the lowest median household income of $0, with 113 households (5.7%) in this group.
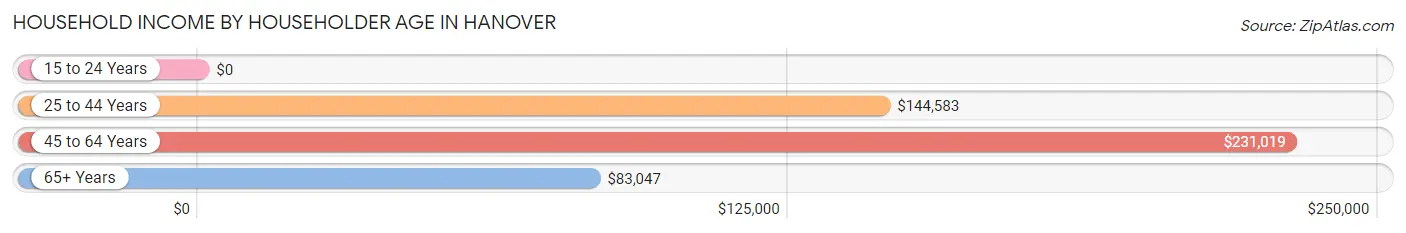
| Income Bracket | # Households | Median Income |
| 15 to 24 Years | 113 (5.7%) | $0 |
| 25 to 44 Years | 485 (24.6%) | $144,583 |
| 45 to 64 Years | 542 (27.5%) | $231,019 |
| 65+ Years | 831 (42.2%) | $83,047 |
| Total | 1,971 (100.0%) | $111,958 |
Poverty in Hanover
Income Below Poverty by Sex and Age in Hanover
With 7.5% poverty level for males and 13.1% for females among the residents of Hanover, 18 to 24 year old males and 18 to 24 year old females are the most vulnerable to poverty, with 83 males (50.6%) and 94 females (42.9%) in their respective age groups living below the poverty level.
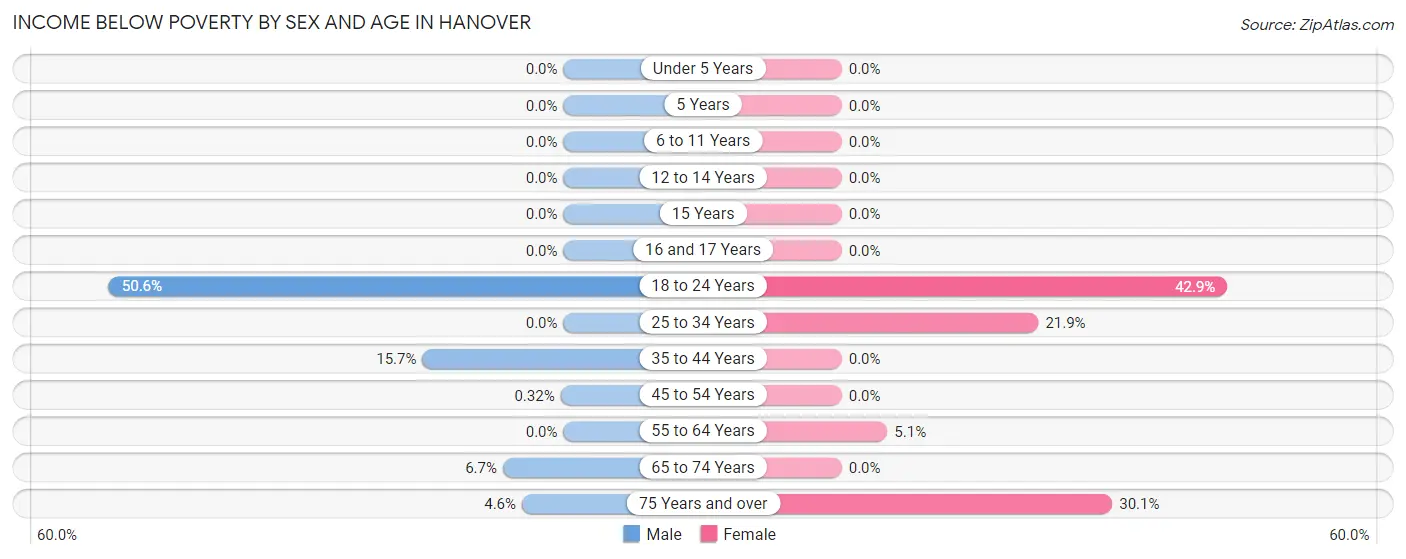
| Age Bracket | Male | Female |
| Under 5 Years | 0 (0.0%) | 0 (0.0%) |
| 5 Years | 0 (0.0%) | 0 (0.0%) |
| 6 to 11 Years | 0 (0.0%) | 0 (0.0%) |
| 12 to 14 Years | 0 (0.0%) | 0 (0.0%) |
| 15 Years | 0 (0.0%) | 0 (0.0%) |
| 16 and 17 Years | 0 (0.0%) | 0 (0.0%) |
| 18 to 24 Years | 83 (50.6%) | 94 (42.9%) |
| 25 to 34 Years | 0 (0.0%) | 67 (21.9%) |
| 35 to 44 Years | 49 (15.7%) | 0 (0.0%) |
| 45 to 54 Years | 1 (0.3%) | 0 (0.0%) |
| 55 to 64 Years | 0 (0.0%) | 10 (5.1%) |
| 65 to 74 Years | 12 (6.7%) | 0 (0.0%) |
| 75 Years and over | 14 (4.6%) | 135 (30.1%) |
| Total | 159 (7.5%) | 306 (13.1%) |
Income Above Poverty by Sex and Age in Hanover
According to the poverty statistics in Hanover, males aged under 5 years and females aged under 5 years are the age groups that are most secure financially, with 100.0% of males and 100.0% of females in these age groups living above the poverty line.
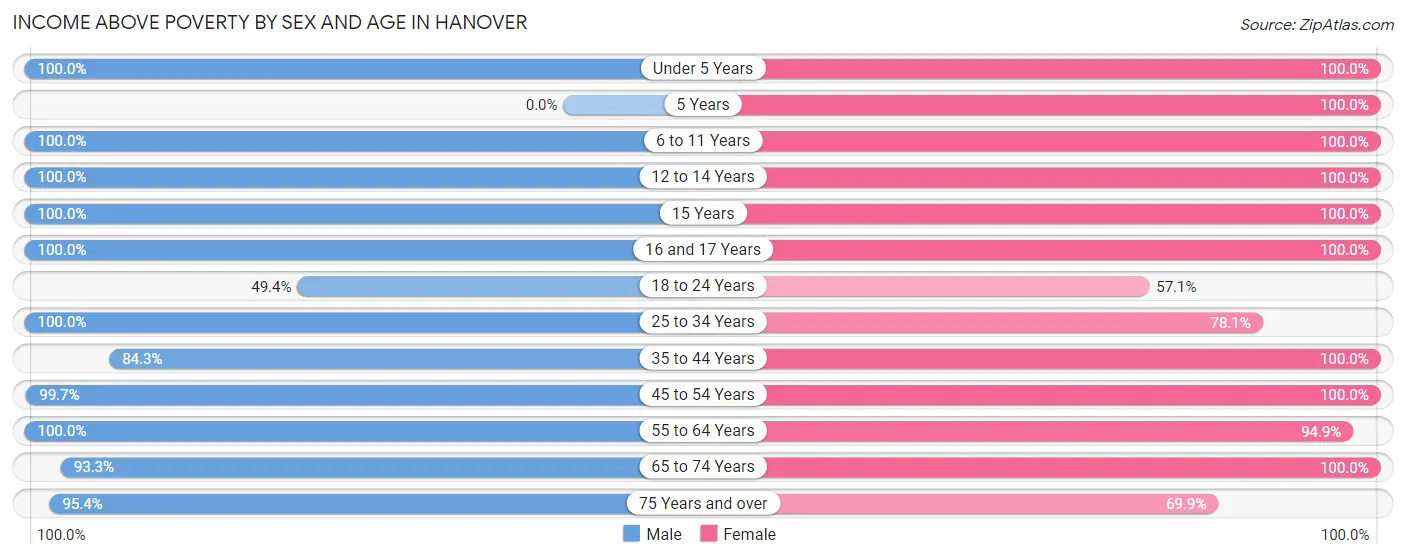
| Age Bracket | Male | Female |
| Under 5 Years | 104 (100.0%) | 81 (100.0%) |
| 5 Years | 0 (0.0%) | 34 (100.0%) |
| 6 to 11 Years | 129 (100.0%) | 91 (100.0%) |
| 12 to 14 Years | 61 (100.0%) | 85 (100.0%) |
| 15 Years | 12 (100.0%) | 28 (100.0%) |
| 16 and 17 Years | 25 (100.0%) | 77 (100.0%) |
| 18 to 24 Years | 81 (49.4%) | 125 (57.1%) |
| 25 to 34 Years | 296 (100.0%) | 239 (78.1%) |
| 35 to 44 Years | 263 (84.3%) | 259 (100.0%) |
| 45 to 54 Years | 309 (99.7%) | 259 (100.0%) |
| 55 to 64 Years | 219 (100.0%) | 187 (94.9%) |
| 65 to 74 Years | 166 (93.3%) | 248 (100.0%) |
| 75 Years and over | 289 (95.4%) | 313 (69.9%) |
| Total | 1,954 (92.5%) | 2,026 (86.9%) |
Income Below Poverty Among Married-Couple Families in Hanover
The poverty statistics for married-couple families in Hanover show that 1.5% or 14 of the total 912 families live below the poverty line. Families with no children have the highest poverty rate of 2.7%, comprising of 14 families. On the other hand, families with 1 or 2 children have the lowest poverty rate of 0.0%, which includes 0 families.
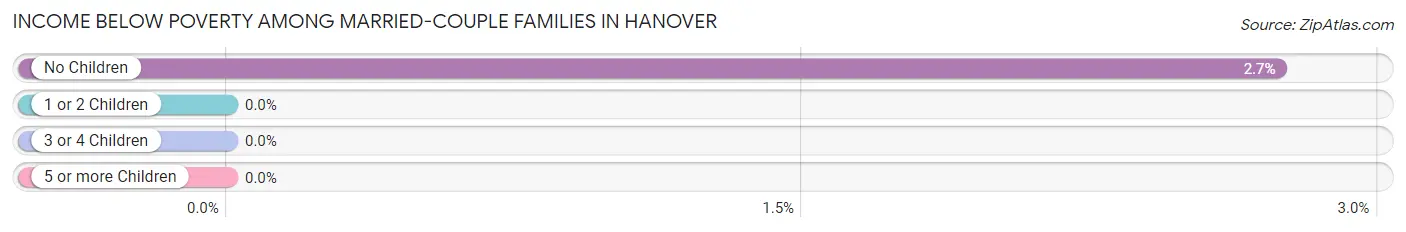
| Children | Above Poverty | Below Poverty |
| No Children | 497 (97.3%) | 14 (2.7%) |
| 1 or 2 Children | 367 (100.0%) | 0 (0.0%) |
| 3 or 4 Children | 34 (100.0%) | 0 (0.0%) |
| 5 or more Children | 0 (0.0%) | 0 (0.0%) |
| Total | 898 (98.5%) | 14 (1.5%) |
Income Below Poverty Among Single-Parent Households in Hanover
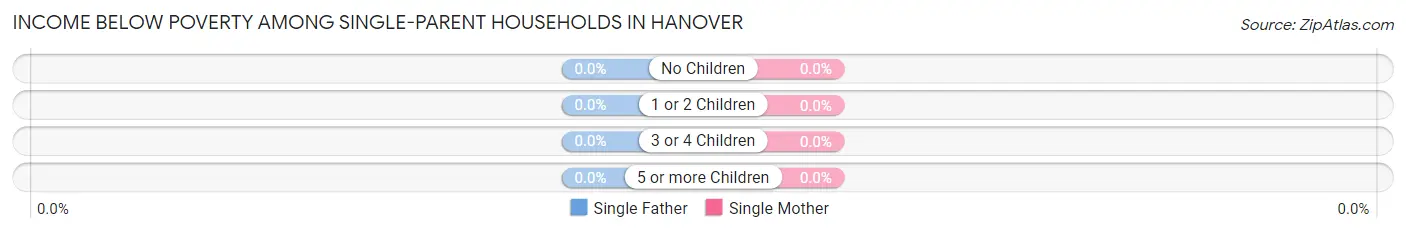
| Children | Single Father | Single Mother |
| No Children | 0 (0.0%) | 0 (0.0%) |
| 1 or 2 Children | 0 (0.0%) | 0 (0.0%) |
| 3 or 4 Children | 0 (0.0%) | 0 (0.0%) |
| 5 or more Children | 0 (0.0%) | 0 (0.0%) |
| Total | 0 (0.0%) | 0 (0.0%) |
Income Below Poverty Among Married-Couple vs Single-Parent Households in Hanover
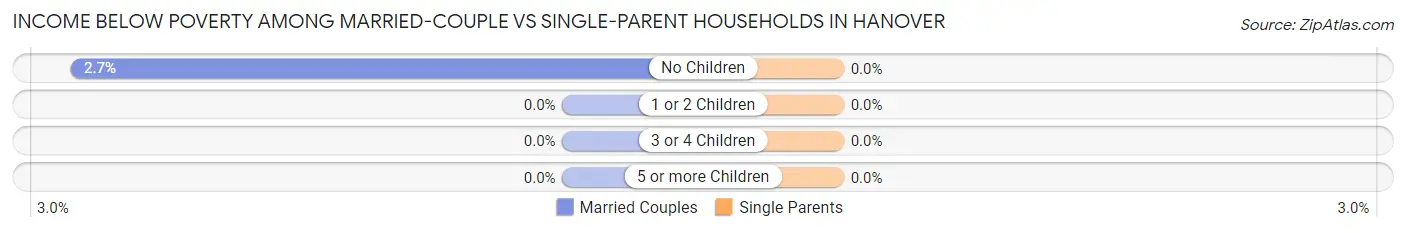
| Children | Married-Couple Families | Single-Parent Households |
| No Children | 14 (2.7%) | 0 (0.0%) |
| 1 or 2 Children | 0 (0.0%) | 0 (0.0%) |
| 3 or 4 Children | 0 (0.0%) | 0 (0.0%) |
| 5 or more Children | 0 (0.0%) | 0 (0.0%) |
| Total | 14 (1.5%) | 0 (0.0%) |
Race in Hanover
The most populous races in Hanover are White / Caucasian (5,901 | 71.7%), Asian (879 | 10.7%), and Two or more Races (852 | 10.3%).
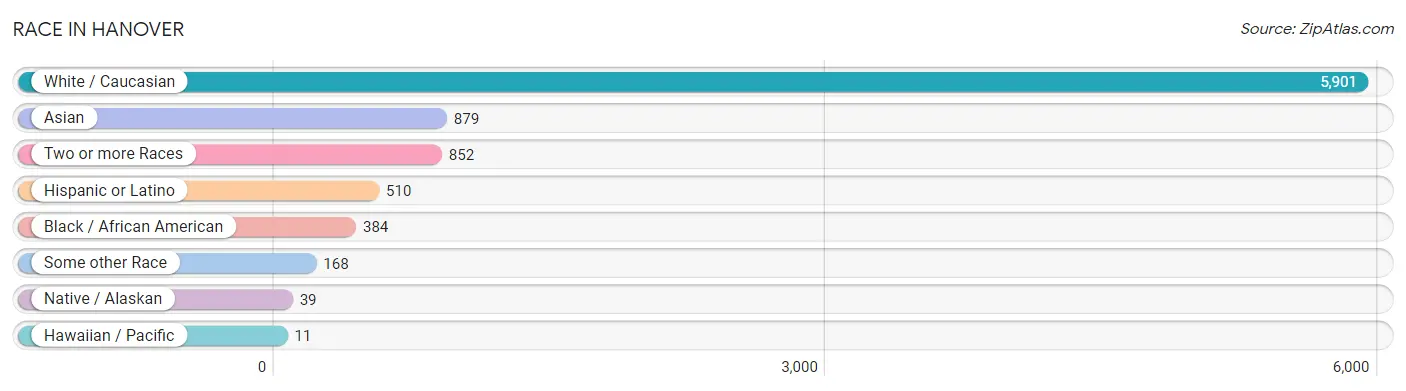
| Race | # Population | % Population |
| Asian | 879 | 10.7% |
| Black / African American | 384 | 4.7% |
| Hawaiian / Pacific | 11 | 0.1% |
| Hispanic or Latino | 510 | 6.2% |
| Native / Alaskan | 39 | 0.5% |
| White / Caucasian | 5,901 | 71.7% |
| Two or more Races | 852 | 10.3% |
| Some other Race | 168 | 2.0% |
| Total | 8,234 | 100.0% |
Ancestry in Hanover
The most populous ancestries reported in Hanover are English (1,359 | 16.5%), German (1,034 | 12.6%), Irish (1,025 | 12.4%), Italian (629 | 7.6%), and Indian (Asian) (495 | 6.0%), together accounting for 55.2% of all Hanover residents.
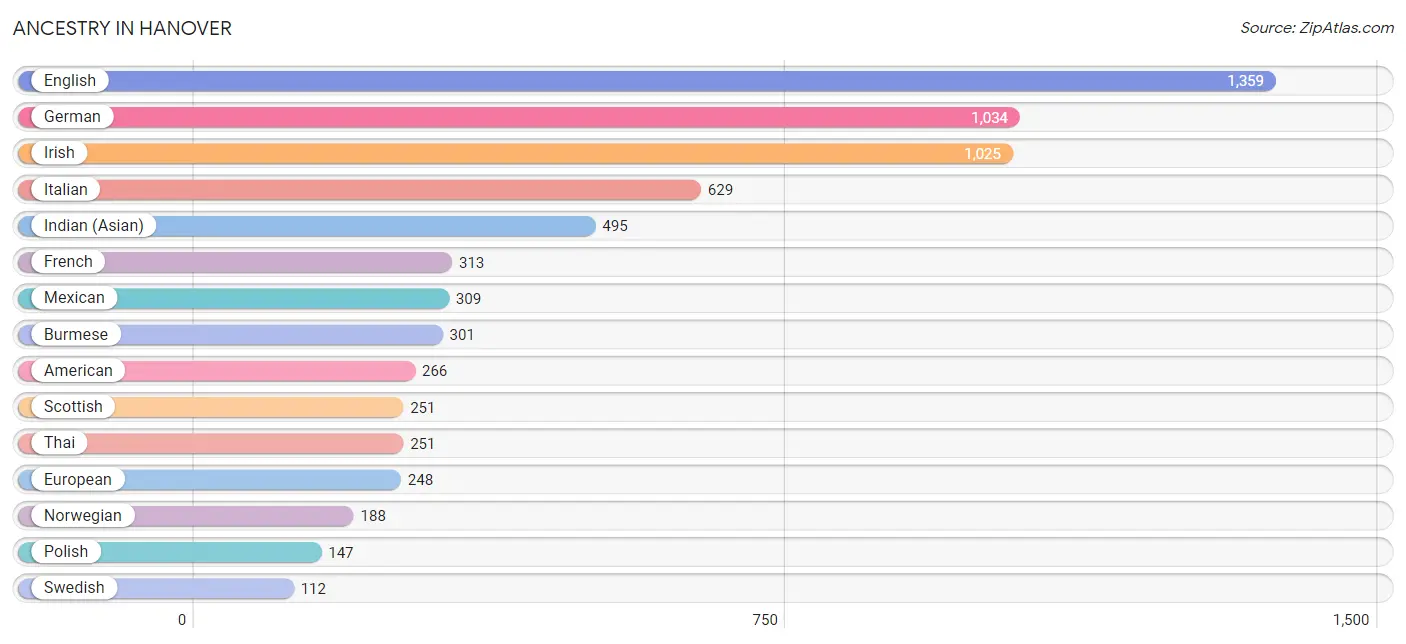
| Ancestry | # Population | % Population |
| African | 34 | 0.4% |
| Albanian | 9 | 0.1% |
| American | 266 | 3.2% |
| Arab | 108 | 1.3% |
| Armenian | 92 | 1.1% |
| Austrian | 14 | 0.2% |
| Belgian | 35 | 0.4% |
| Bhutanese | 94 | 1.1% |
| Brazilian | 3 | 0.0% |
| British | 109 | 1.3% |
| Bulgarian | 15 | 0.2% |
| Burmese | 301 | 3.7% |
| Canadian | 20 | 0.2% |
| Central American | 53 | 0.6% |
| Cherokee | 2 | 0.0% |
| Chilean | 1 | 0.0% |
| Colombian | 24 | 0.3% |
| Croatian | 8 | 0.1% |
| Cuban | 27 | 0.3% |
| Czech | 42 | 0.5% |
| Danish | 3 | 0.0% |
| Dominican | 2 | 0.0% |
| Dutch | 65 | 0.8% |
| Eastern European | 60 | 0.7% |
| English | 1,359 | 16.5% |
| Ethiopian | 3 | 0.0% |
| European | 248 | 3.0% |
| Filipino | 32 | 0.4% |
| Finnish | 1 | 0.0% |
| French | 313 | 3.8% |
| French American Indian | 11 | 0.1% |
| French Canadian | 98 | 1.2% |
| German | 1,034 | 12.6% |
| Ghanaian | 8 | 0.1% |
| Greek | 31 | 0.4% |
| Haitian | 19 | 0.2% |
| Honduran | 36 | 0.4% |
| Hungarian | 36 | 0.4% |
| Indian (Asian) | 495 | 6.0% |
| Irish | 1,025 | 12.4% |
| Italian | 629 | 7.6% |
| Jamaican | 8 | 0.1% |
| Kenyan | 22 | 0.3% |
| Korean | 35 | 0.4% |
| Laotian | 77 | 0.9% |
| Lebanese | 69 | 0.8% |
| Lithuanian | 15 | 0.2% |
| Mexican | 309 | 3.7% |
| Navajo | 2 | 0.0% |
| Nigerian | 22 | 0.3% |
| Northern European | 23 | 0.3% |
| Norwegian | 188 | 2.3% |
| Pakistani | 62 | 0.7% |
| Polish | 147 | 1.8% |
| Portuguese | 77 | 0.9% |
| Puerto Rican | 16 | 0.2% |
| Romanian | 27 | 0.3% |
| Russian | 42 | 0.5% |
| Salvadoran | 17 | 0.2% |
| Samoan | 7 | 0.1% |
| Scandinavian | 8 | 0.1% |
| Scotch-Irish | 59 | 0.7% |
| Scottish | 251 | 3.0% |
| Senegalese | 1 | 0.0% |
| Sioux | 3 | 0.0% |
| Slovene | 29 | 0.4% |
| South American | 25 | 0.3% |
| Spaniard | 3 | 0.0% |
| Spanish | 68 | 0.8% |
| Sri Lankan | 92 | 1.1% |
| Subsaharan African | 85 | 1.0% |
| Swedish | 112 | 1.4% |
| Swiss | 52 | 0.6% |
| Thai | 251 | 3.0% |
| Turkish | 19 | 0.2% |
| Ukrainian | 12 | 0.2% |
| Welsh | 98 | 1.2% | View All 77 Rows |
Immigrants in Hanover
The most numerous immigrant groups reported in Hanover came from Asia (513 | 6.2%), Europe (412 | 5.0%), Western Europe (221 | 2.7%), Eastern Asia (208 | 2.5%), and Africa (166 | 2.0%), together accounting for 18.5% of all Hanover residents.
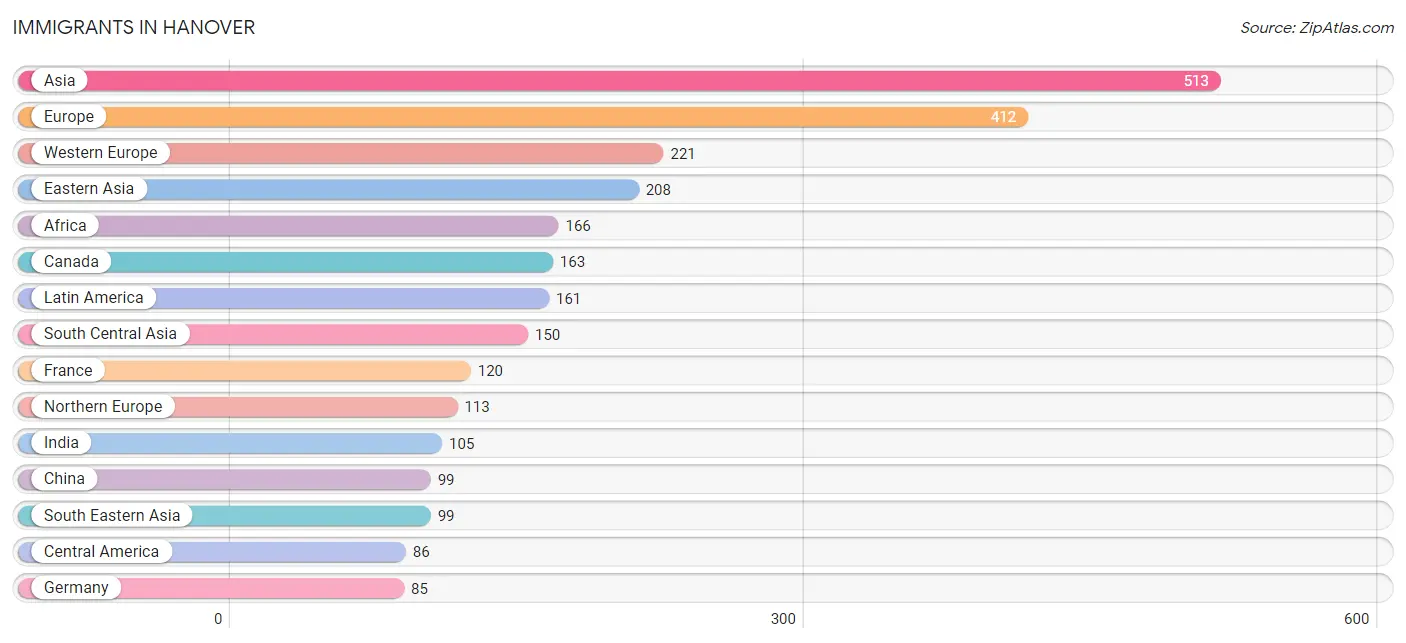
| Immigration Origin | # Population | % Population |
| Africa | 166 | 2.0% |
| Asia | 513 | 6.2% |
| Belgium | 8 | 0.1% |
| Brazil | 55 | 0.7% |
| Bulgaria | 3 | 0.0% |
| Canada | 163 | 2.0% |
| Caribbean | 19 | 0.2% |
| Central America | 86 | 1.0% |
| Chile | 1 | 0.0% |
| China | 99 | 1.2% |
| Eastern Africa | 39 | 0.5% |
| Eastern Asia | 208 | 2.5% |
| Eastern Europe | 51 | 0.6% |
| El Salvador | 7 | 0.1% |
| England | 56 | 0.7% |
| Ethiopia | 3 | 0.0% |
| Europe | 412 | 5.0% |
| France | 120 | 1.5% |
| Germany | 85 | 1.0% |
| Ghana | 8 | 0.1% |
| Greece | 6 | 0.1% |
| Haiti | 11 | 0.1% |
| Hong Kong | 21 | 0.3% |
| India | 105 | 1.3% |
| Indonesia | 15 | 0.2% |
| Ireland | 23 | 0.3% |
| Israel | 44 | 0.5% |
| Jamaica | 8 | 0.1% |
| Japan | 46 | 0.6% |
| Kazakhstan | 12 | 0.2% |
| Kenya | 32 | 0.4% |
| Korea | 63 | 0.8% |
| Latin America | 161 | 2.0% |
| Liberia | 38 | 0.5% |
| Malaysia | 35 | 0.4% |
| Mexico | 79 | 1.0% |
| Nepal | 10 | 0.1% |
| Nigeria | 12 | 0.2% |
| Northern Africa | 3 | 0.0% |
| Northern Europe | 113 | 1.4% |
| Oceania | 5 | 0.1% |
| Pakistan | 23 | 0.3% |
| Philippines | 30 | 0.4% |
| Poland | 14 | 0.2% |
| Portugal | 8 | 0.1% |
| Romania | 20 | 0.2% |
| Scotland | 16 | 0.2% |
| Singapore | 9 | 0.1% |
| South Africa | 50 | 0.6% |
| South America | 56 | 0.7% |
| South Central Asia | 150 | 1.8% |
| South Eastern Asia | 99 | 1.2% |
| Southern Europe | 27 | 0.3% |
| Spain | 13 | 0.2% |
| Sweden | 7 | 0.1% |
| Switzerland | 8 | 0.1% |
| Turkey | 12 | 0.2% |
| Vietnam | 10 | 0.1% |
| Western Africa | 58 | 0.7% |
| Western Asia | 56 | 0.7% |
| Western Europe | 221 | 2.7% | View All 61 Rows |
Sex and Age in Hanover
Sex and Age in Hanover
The most populous age groups in Hanover are 15 to 19 Years (1,281 | 31.7%) for men and 15 to 19 Years (1,082 | 25.8%) for women.
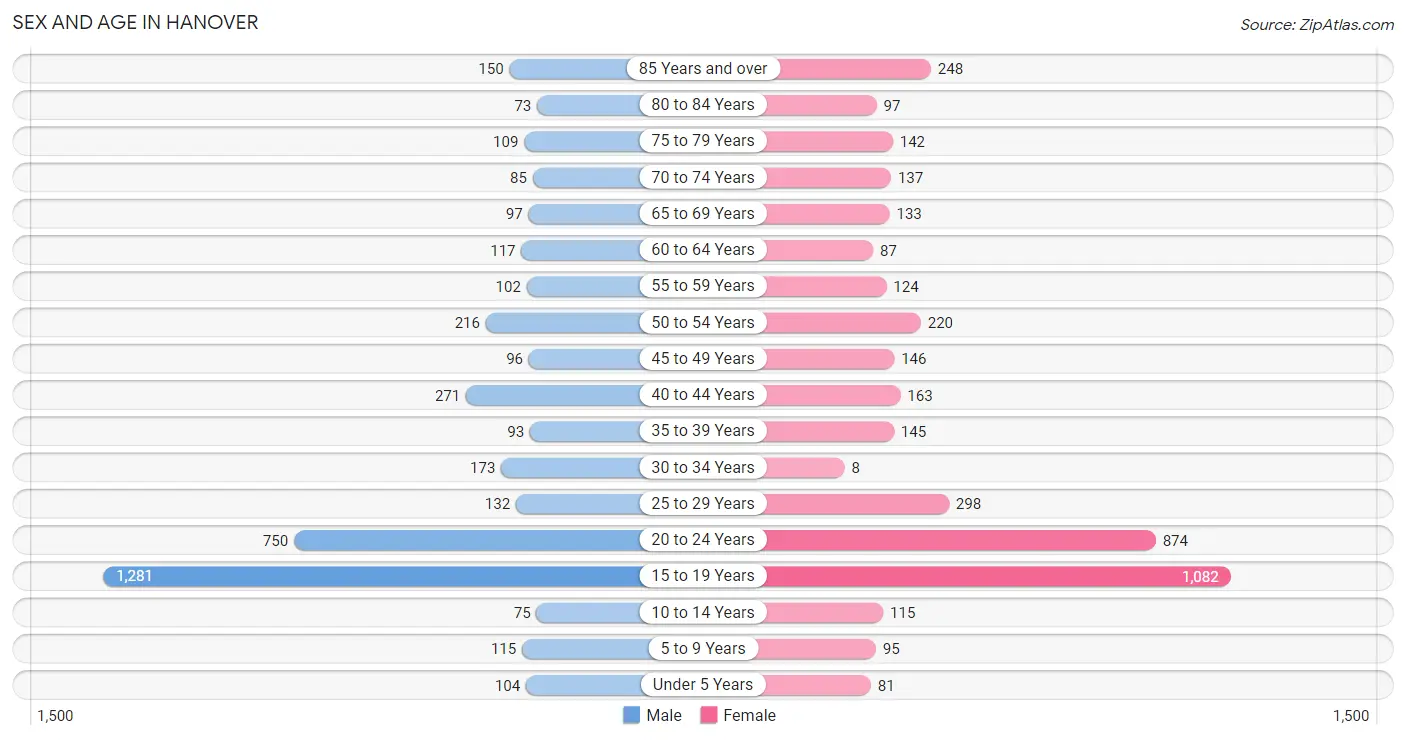
| Age Bracket | Male | Female |
| Under 5 Years | 104 (2.6%) | 81 (1.9%) |
| 5 to 9 Years | 115 (2.9%) | 95 (2.3%) |
| 10 to 14 Years | 75 (1.9%) | 115 (2.7%) |
| 15 to 19 Years | 1,281 (31.7%) | 1,082 (25.8%) |
| 20 to 24 Years | 750 (18.6%) | 874 (20.8%) |
| 25 to 29 Years | 132 (3.3%) | 298 (7.1%) |
| 30 to 34 Years | 173 (4.3%) | 8 (0.2%) |
| 35 to 39 Years | 93 (2.3%) | 145 (3.5%) |
| 40 to 44 Years | 271 (6.7%) | 163 (3.9%) |
| 45 to 49 Years | 96 (2.4%) | 146 (3.5%) |
| 50 to 54 Years | 216 (5.3%) | 220 (5.2%) |
| 55 to 59 Years | 102 (2.5%) | 124 (3.0%) |
| 60 to 64 Years | 117 (2.9%) | 87 (2.1%) |
| 65 to 69 Years | 97 (2.4%) | 133 (3.2%) |
| 70 to 74 Years | 85 (2.1%) | 137 (3.3%) |
| 75 to 79 Years | 109 (2.7%) | 142 (3.4%) |
| 80 to 84 Years | 73 (1.8%) | 97 (2.3%) |
| 85 Years and over | 150 (3.7%) | 248 (5.9%) |
| Total | 4,039 (100.0%) | 4,195 (100.0%) |
Families and Households in Hanover
Median Family Size in Hanover
The median family size in Hanover is 3.02 persons per family, with single male/father families (12 | 1.2%) accounting for the largest median family size of 3.58 persons per family. On the other hand, married-couple families (912 | 94.1%) represent the smallest median family size with 3.01 persons per family.
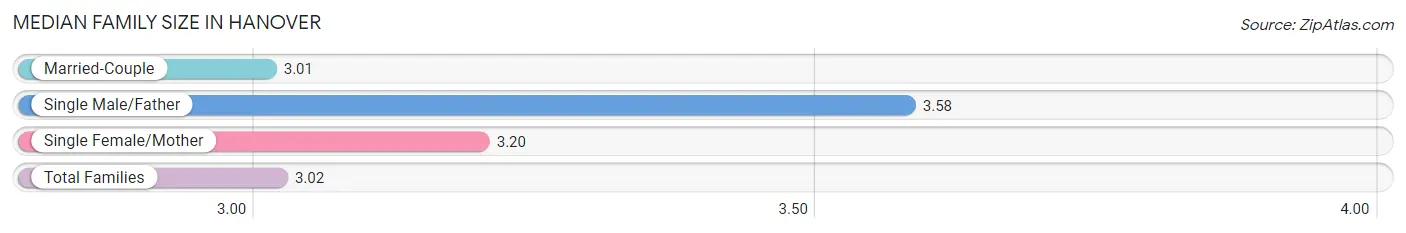
| Family Type | # Families | Family Size |
| Married-Couple | 912 (94.1%) | 3.01 |
| Single Male/Father | 12 (1.2%) | 3.58 |
| Single Female/Mother | 45 (4.6%) | 3.20 |
| Total Families | 969 (100.0%) | 3.02 |
Median Household Size in Hanover
The median household size in Hanover is 2.25 persons per household, with single male/father households (12 | 0.6%) accounting for the largest median household size of 4.67 persons per household. non-family households (1,002 | 50.8%) represent the smallest median household size with 1.50 persons per household.
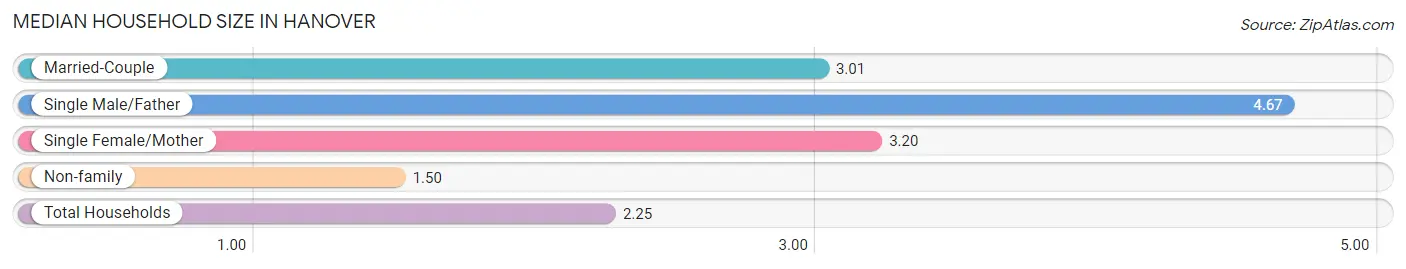
| Household Type | # Households | Household Size |
| Married-Couple | 912 (46.3%) | 3.01 |
| Single Male/Father | 12 (0.6%) | 4.67 |
| Single Female/Mother | 45 (2.3%) | 3.20 |
| Non-family | 1,002 (50.8%) | 1.50 |
| Total Households | 1,971 (100.0%) | 2.25 |
Household Size by Marriage Status in Hanover
Out of a total of 1,971 households in Hanover, 969 (49.2%) are family households, while 1,002 (50.8%) are nonfamily households. The most numerous type of family households are 2-person households, comprising 494, and the most common type of nonfamily households are 1-person households, comprising 767.
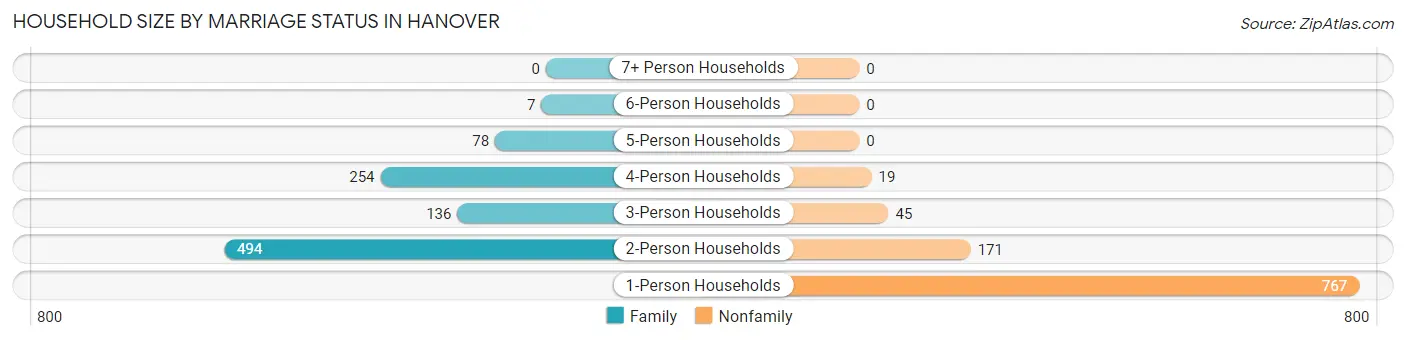
| Household Size | Family Households | Nonfamily Households |
| 1-Person Households | - | 767 (38.9%) |
| 2-Person Households | 494 (25.1%) | 171 (8.7%) |
| 3-Person Households | 136 (6.9%) | 45 (2.3%) |
| 4-Person Households | 254 (12.9%) | 19 (1.0%) |
| 5-Person Households | 78 (4.0%) | 0 (0.0%) |
| 6-Person Households | 7 (0.4%) | 0 (0.0%) |
| 7+ Person Households | 0 (0.0%) | 0 (0.0%) |
| Total | 969 (49.2%) | 1,002 (50.8%) |
Female Fertility in Hanover
Fertility by Age in Hanover
Average fertility rate in Hanover is 6.0 births per 1,000 women. Women in the age bracket of 35 to 50 years have the highest fertility rate with 14.0 births per 1,000 women. Women in the age bracket of 35 to 50 years acount for 52.9% of all women with births.
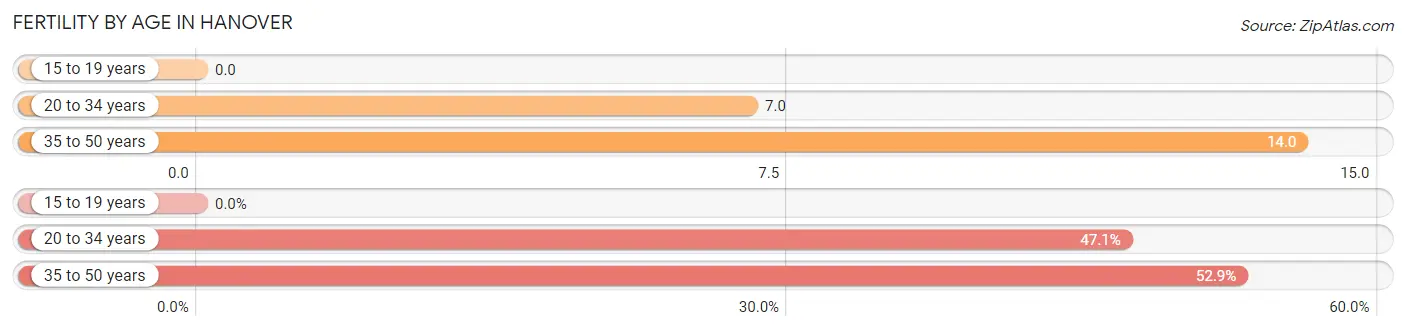
| Age Bracket | Women with Births | Births / 1,000 Women |
| 15 to 19 years | 0 (0.0%) | 0.0 |
| 20 to 34 years | 8 (47.1%) | 7.0 |
| 35 to 50 years | 9 (52.9%) | 14.0 |
| Total | 17 (100.0%) | 6.0 |
Fertility by Age by Marriage Status in Hanover
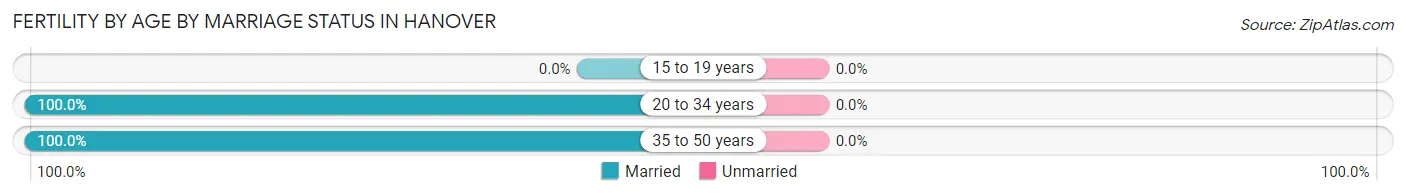
| Age Bracket | Married | Unmarried |
| 15 to 19 years | 0 (0.0%) | 0 (0.0%) |
| 20 to 34 years | 8 (100.0%) | 0 (0.0%) |
| 35 to 50 years | 9 (100.0%) | 0 (0.0%) |
| Total | 17 (100.0%) | 0 (0.0%) |
Fertility by Education in Hanover
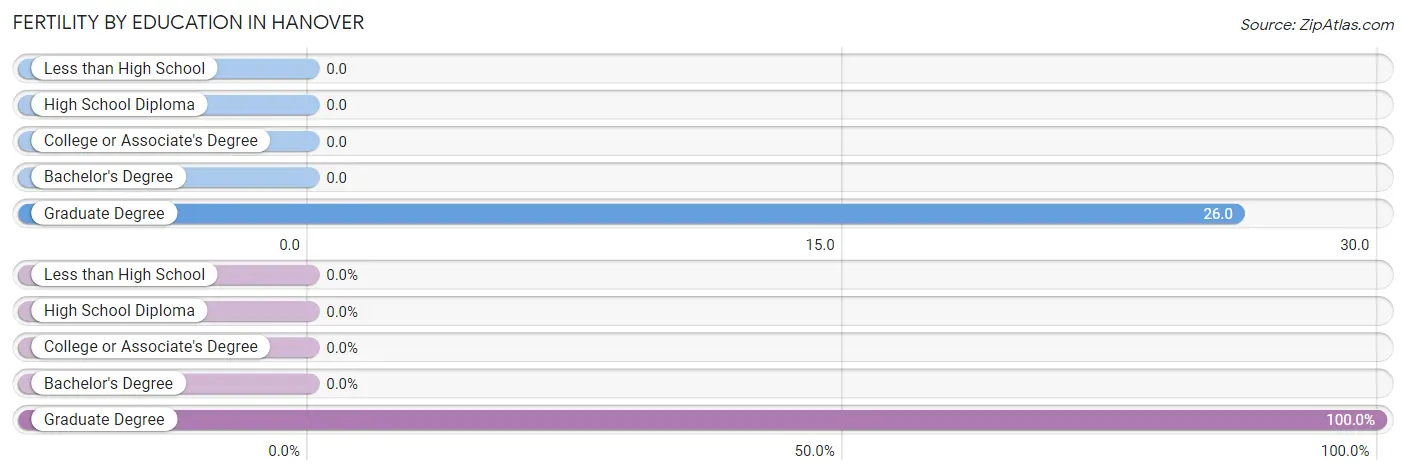
| Educational Attainment | Women with Births | Births / 1,000 Women |
| Less than High School | 0 (0.0%) | 0.0 |
| High School Diploma | 0 (0.0%) | 0.0 |
| College or Associate's Degree | 0 (0.0%) | 0.0 |
| Bachelor's Degree | 0 (0.0%) | 0.0 |
| Graduate Degree | 17 (100.0%) | 26.0 |
| Total | 17 (100.0%) | 6.0 |
Fertility by Education by Marriage Status in Hanover
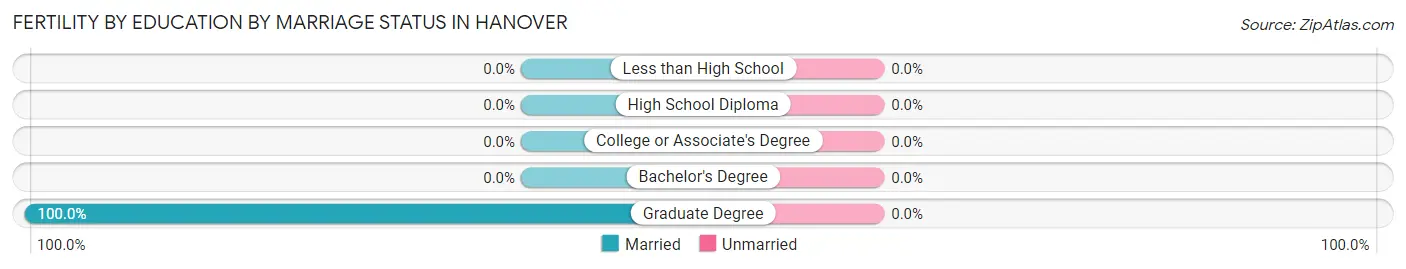
| Educational Attainment | Married | Unmarried |
| Less than High School | 0 (0.0%) | 0 (0.0%) |
| High School Diploma | 0 (0.0%) | 0 (0.0%) |
| College or Associate's Degree | 0 (0.0%) | 0 (0.0%) |
| Bachelor's Degree | 0 (0.0%) | 0 (0.0%) |
| Graduate Degree | 17 (100.0%) | 0 (0.0%) |
| Total | 17 (100.0%) | 0 (0.0%) |
Employment Characteristics in Hanover
Employment by Class of Employer in Hanover
Among the 2,871 employed individuals in Hanover, not-for-profit organizations (1,129 | 39.3%), private company employees (1,091 | 38.0%), and self-employed (not incorporated) (279 | 9.7%) make up the most common classes of employment.
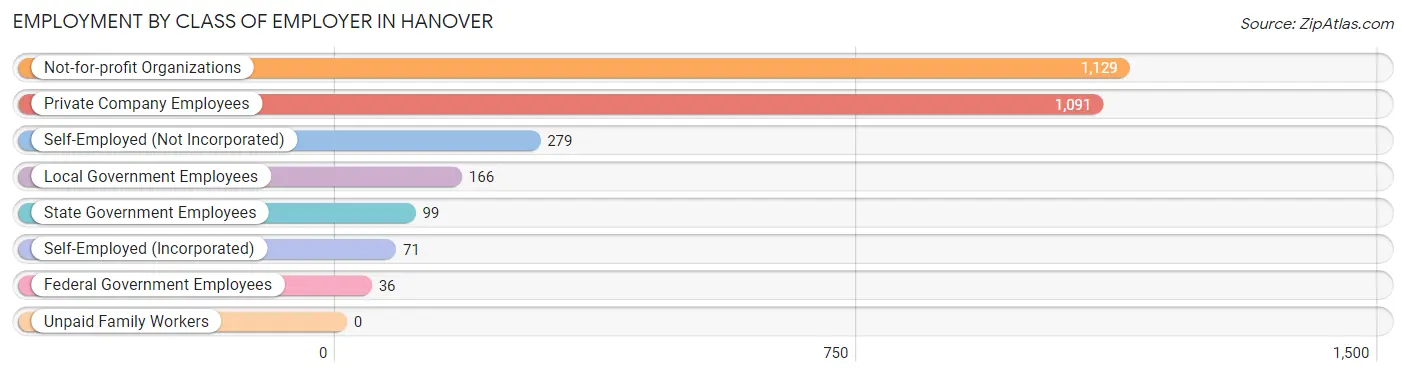
| Employer Class | # Employees | % Employees |
| Private Company Employees | 1,091 | 38.0% |
| Self-Employed (Incorporated) | 71 | 2.5% |
| Self-Employed (Not Incorporated) | 279 | 9.7% |
| Not-for-profit Organizations | 1,129 | 39.3% |
| Local Government Employees | 166 | 5.8% |
| State Government Employees | 99 | 3.5% |
| Federal Government Employees | 36 | 1.3% |
| Unpaid Family Workers | 0 | 0.0% |
| Total | 2,871 | 100.0% |
Employment Status by Age in Hanover
According to the labor force statistics for Hanover, out of the total population over 16 years of age (7,609), 40.7% or 3,097 individuals are in the labor force, with 4.5% or 139 of them unemployed. The age group with the highest labor force participation rate is 30 to 34 years, with 100.0% or 181 individuals in the labor force. Within the labor force, the 16 to 19 years age range has the highest percentage of unemployed individuals, with 24.5% or 123 of them being unemployed.
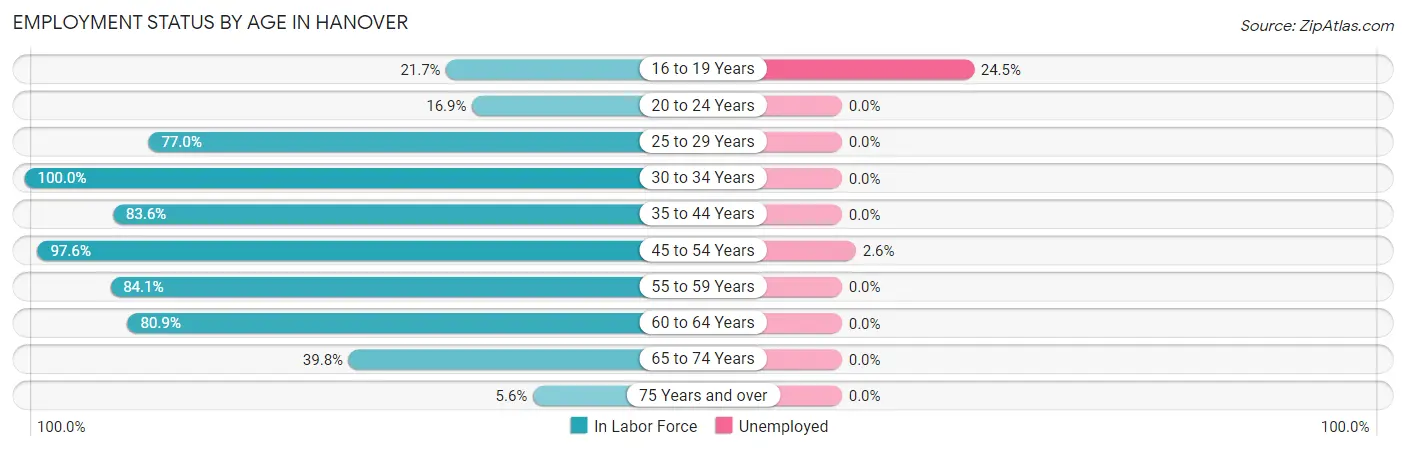
| Age Bracket | In Labor Force | Unemployed |
| 16 to 19 Years | 504 (21.7%) | 123 (24.5%) |
| 20 to 24 Years | 274 (16.9%) | 0 (0.0%) |
| 25 to 29 Years | 331 (77.0%) | 0 (0.0%) |
| 30 to 34 Years | 181 (100.0%) | 0 (0.0%) |
| 35 to 44 Years | 562 (83.6%) | 0 (0.0%) |
| 45 to 54 Years | 662 (97.6%) | 17 (2.6%) |
| 55 to 59 Years | 190 (84.1%) | 0 (0.0%) |
| 60 to 64 Years | 165 (80.9%) | 0 (0.0%) |
| 65 to 74 Years | 180 (39.8%) | 0 (0.0%) |
| 75 Years and over | 46 (5.6%) | 0 (0.0%) |
| Total | 3,097 (40.7%) | 139 (4.5%) |
Employment Status by Educational Attainment in Hanover
According to labor force statistics for Hanover, 87.5% of individuals (2,092) out of the total population between 25 and 64 years of age (2,391) are in the labor force, with 0.8% or 17 of them being unemployed. The group with the highest labor force participation rate are those with the educational attainment of bachelor's degree or higher, with 89.8% or 1,975 individuals in the labor force. Within the labor force, individuals with bachelor's degree or higher education have the highest percentage of unemployment, with 0.9% or 18 of them being unemployed.
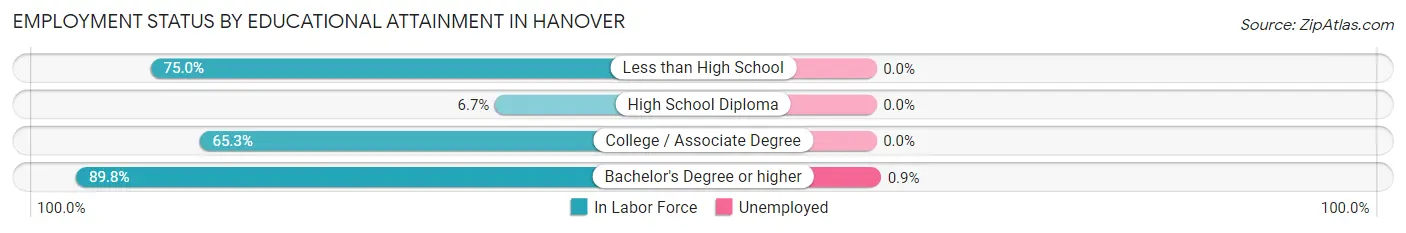
| Educational Attainment | In Labor Force | Unemployed |
| Less than High School | 3 (75.0%) | 0 (0.0%) |
| High School Diploma | 1 (6.7%) | 0 (0.0%) |
| College / Associate Degree | 113 (65.3%) | 0 (0.0%) |
| Bachelor's Degree or higher | 1,975 (89.8%) | 20 (0.9%) |
| Total | 2,092 (87.5%) | 19 (0.8%) |
Employment Occupations by Sex in Hanover
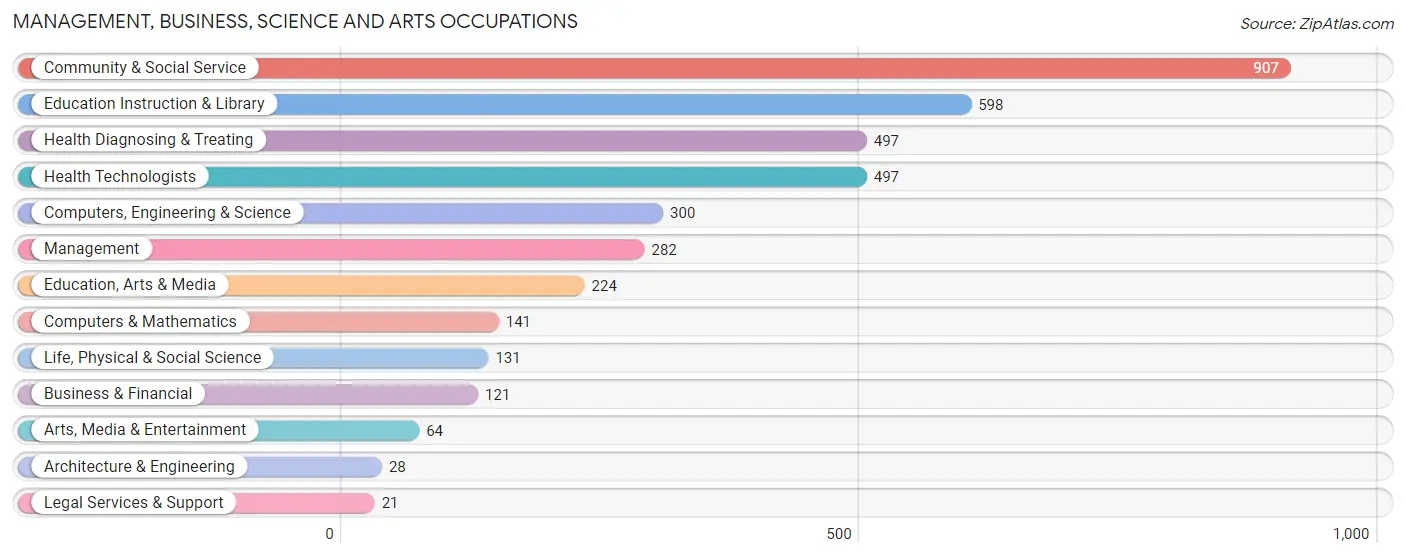
Management, Business, Science and Arts Occupations
The most common Management, Business, Science and Arts occupations in Hanover are Community & Social Service (907 | 30.7%), Education Instruction & Library (598 | 20.2%), Health Diagnosing & Treating (497 | 16.8%), Health Technologists (497 | 16.8%), and Computers, Engineering & Science (300 | 10.2%).
Management, Business, Science and Arts Occupations by Sex
Within the Management, Business, Science and Arts occupations in Hanover, the most male-oriented occupations are Architecture & Engineering (100.0%), Computers & Mathematics (92.2%), and Computers, Engineering & Science (84.7%), while the most female-oriented occupations are Business & Financial (76.9%), Education, Arts & Media (67.0%), and Legal Services & Support (57.1%).
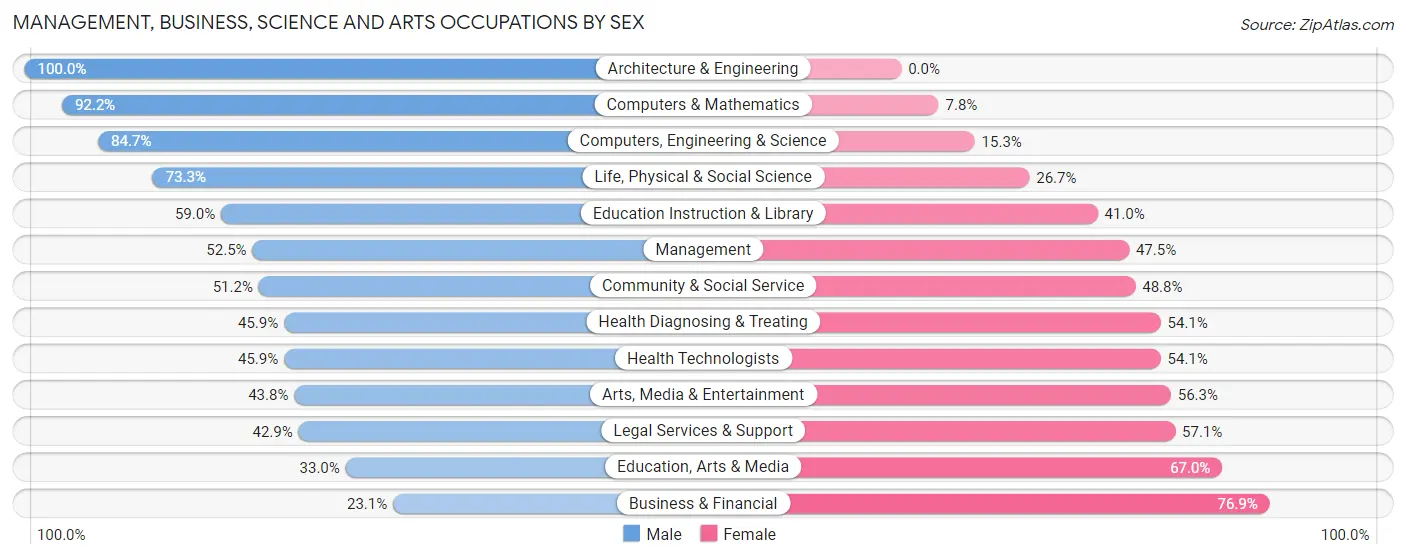
| Occupation | Male | Female |
| Management | 148 (52.5%) | 134 (47.5%) |
| Business & Financial | 28 (23.1%) | 93 (76.9%) |
| Computers, Engineering & Science | 254 (84.7%) | 46 (15.3%) |
| Computers & Mathematics | 130 (92.2%) | 11 (7.8%) |
| Architecture & Engineering | 28 (100.0%) | 0 (0.0%) |
| Life, Physical & Social Science | 96 (73.3%) | 35 (26.7%) |
| Community & Social Service | 464 (51.2%) | 443 (48.8%) |
| Education, Arts & Media | 74 (33.0%) | 150 (67.0%) |
| Legal Services & Support | 9 (42.9%) | 12 (57.1%) |
| Education Instruction & Library | 353 (59.0%) | 245 (41.0%) |
| Arts, Media & Entertainment | 28 (43.8%) | 36 (56.2%) |
| Health Diagnosing & Treating | 228 (45.9%) | 269 (54.1%) |
| Health Technologists | 228 (45.9%) | 269 (54.1%) |
| Total (Category) | 1,122 (53.2%) | 985 (46.8%) |
| Total (Overall) | 1,511 (51.1%) | 1,444 (48.9%) |
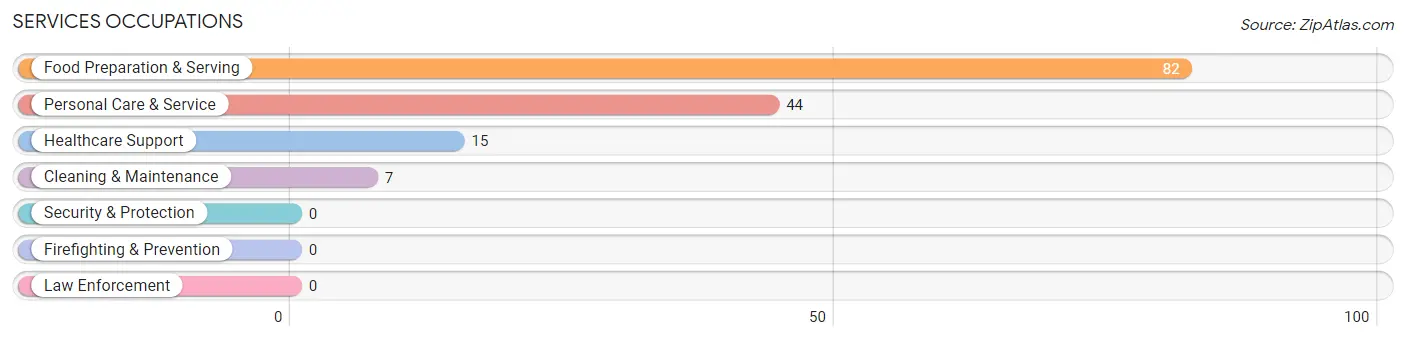
Services Occupations
The most common Services occupations in Hanover are Food Preparation & Serving (82 | 2.8%), Personal Care & Service (44 | 1.5%), Healthcare Support (15 | 0.5%), and Cleaning & Maintenance (7 | 0.2%).
Services Occupations by Sex
Within the Services occupations in Hanover, the most male-oriented occupations are Cleaning & Maintenance (100.0%), Food Preparation & Serving (29.3%), and Personal Care & Service (27.3%), while the most female-oriented occupations are Healthcare Support (100.0%), Personal Care & Service (72.7%), and Food Preparation & Serving (70.7%).
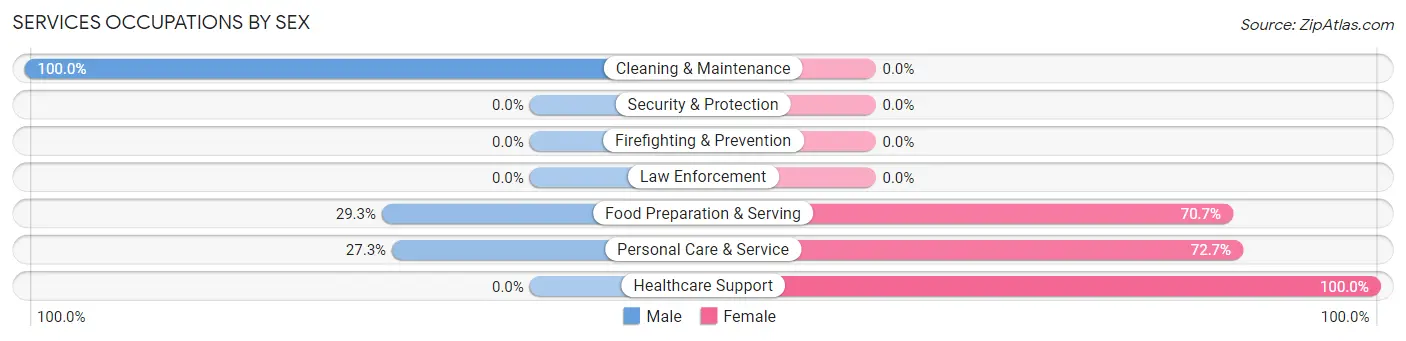
| Occupation | Male | Female |
| Healthcare Support | 0 (0.0%) | 15 (100.0%) |
| Security & Protection | 0 (0.0%) | 0 (0.0%) |
| Firefighting & Prevention | 0 (0.0%) | 0 (0.0%) |
| Law Enforcement | 0 (0.0%) | 0 (0.0%) |
| Food Preparation & Serving | 24 (29.3%) | 58 (70.7%) |
| Cleaning & Maintenance | 7 (100.0%) | 0 (0.0%) |
| Personal Care & Service | 12 (27.3%) | 32 (72.7%) |
| Total (Category) | 43 (29.0%) | 105 (71.0%) |
| Total (Overall) | 1,511 (51.1%) | 1,444 (48.9%) |
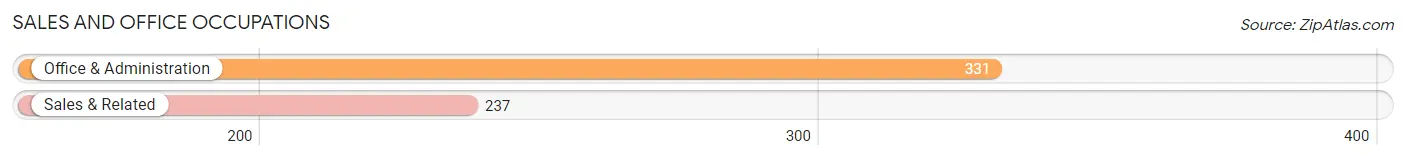
Sales and Office Occupations
The most common Sales and Office occupations in Hanover are Office & Administration (331 | 11.2%), and Sales & Related (237 | 8.0%).
Sales and Office Occupations by Sex
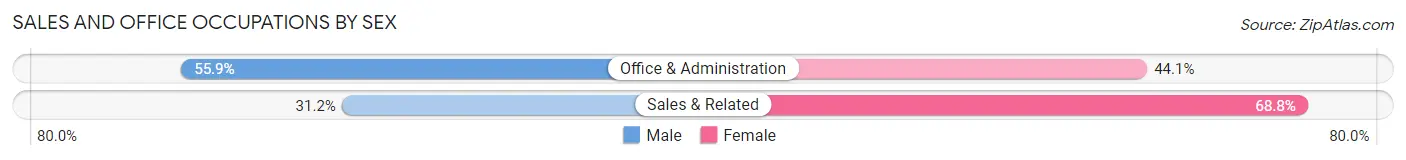
| Occupation | Male | Female |
| Sales & Related | 74 (31.2%) | 163 (68.8%) |
| Office & Administration | 185 (55.9%) | 146 (44.1%) |
| Total (Category) | 259 (45.6%) | 309 (54.4%) |
| Total (Overall) | 1,511 (51.1%) | 1,444 (48.9%) |
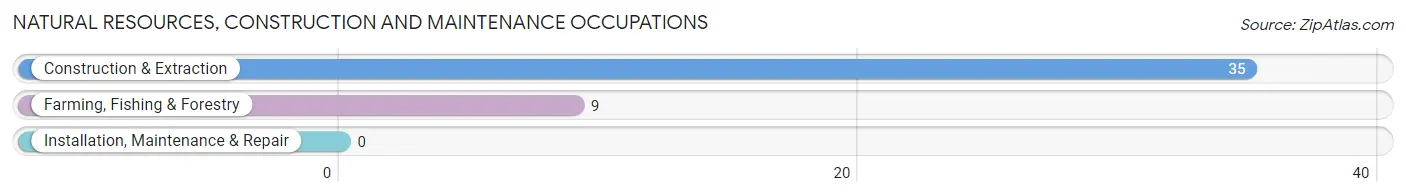
Natural Resources, Construction and Maintenance Occupations
The most common Natural Resources, Construction and Maintenance occupations in Hanover are Construction & Extraction (35 | 1.2%), and Farming, Fishing & Forestry (9 | 0.3%).
Natural Resources, Construction and Maintenance Occupations by Sex
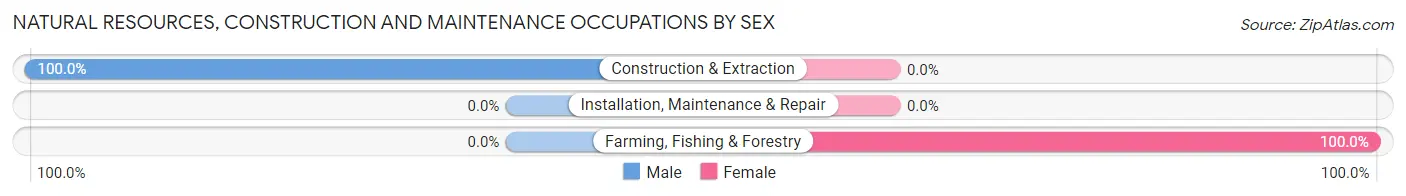
| Occupation | Male | Female |
| Farming, Fishing & Forestry | 0 (0.0%) | 9 (100.0%) |
| Construction & Extraction | 35 (100.0%) | 0 (0.0%) |
| Installation, Maintenance & Repair | 0 (0.0%) | 0 (0.0%) |
| Total (Category) | 35 (79.5%) | 9 (20.4%) |
| Total (Overall) | 1,511 (51.1%) | 1,444 (48.9%) |
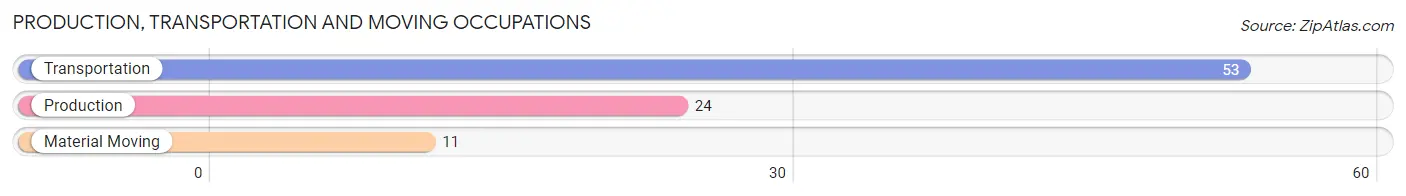
Production, Transportation and Moving Occupations
The most common Production, Transportation and Moving occupations in Hanover are Transportation (53 | 1.8%), Production (24 | 0.8%), and Material Moving (11 | 0.4%).
Production, Transportation and Moving Occupations by Sex
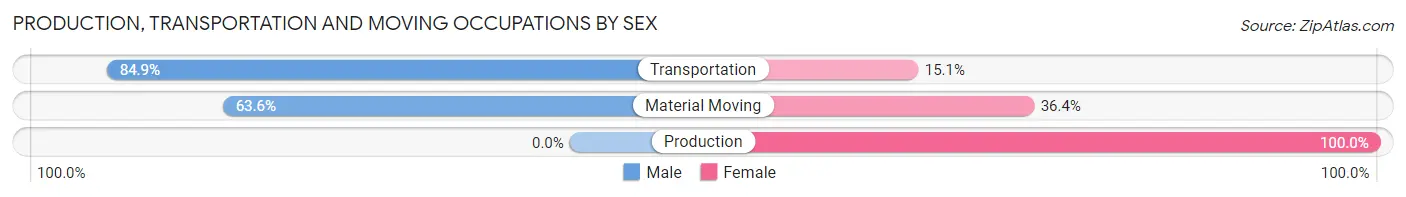
| Occupation | Male | Female |
| Production | 0 (0.0%) | 24 (100.0%) |
| Transportation | 45 (84.9%) | 8 (15.1%) |
| Material Moving | 7 (63.6%) | 4 (36.4%) |
| Total (Category) | 52 (59.1%) | 36 (40.9%) |
| Total (Overall) | 1,511 (51.1%) | 1,444 (48.9%) |
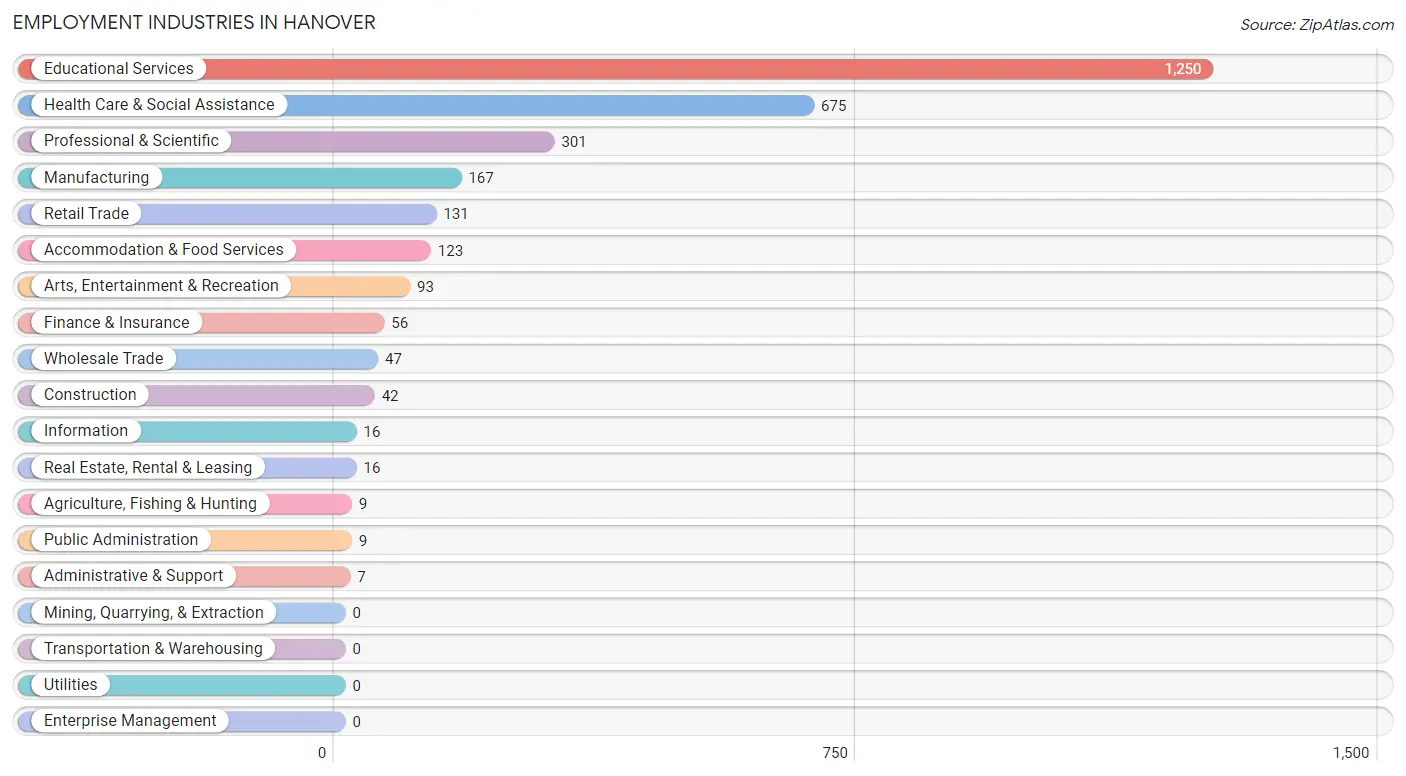
Employment Industries by Sex in Hanover
Employment Industries in Hanover
The major employment industries in Hanover include Educational Services (1,250 | 42.3%), Health Care & Social Assistance (675 | 22.8%), Professional & Scientific (301 | 10.2%), Manufacturing (167 | 5.7%), and Retail Trade (131 | 4.4%).
Employment Industries by Sex in Hanover
The Hanover industries that see more men than women are Construction (100.0%), Finance & Insurance (100.0%), and Real Estate, Rental & Leasing (100.0%), whereas the industries that tend to have a higher number of women are Agriculture, Fishing & Hunting (100.0%), Wholesale Trade (100.0%), and Information (100.0%).
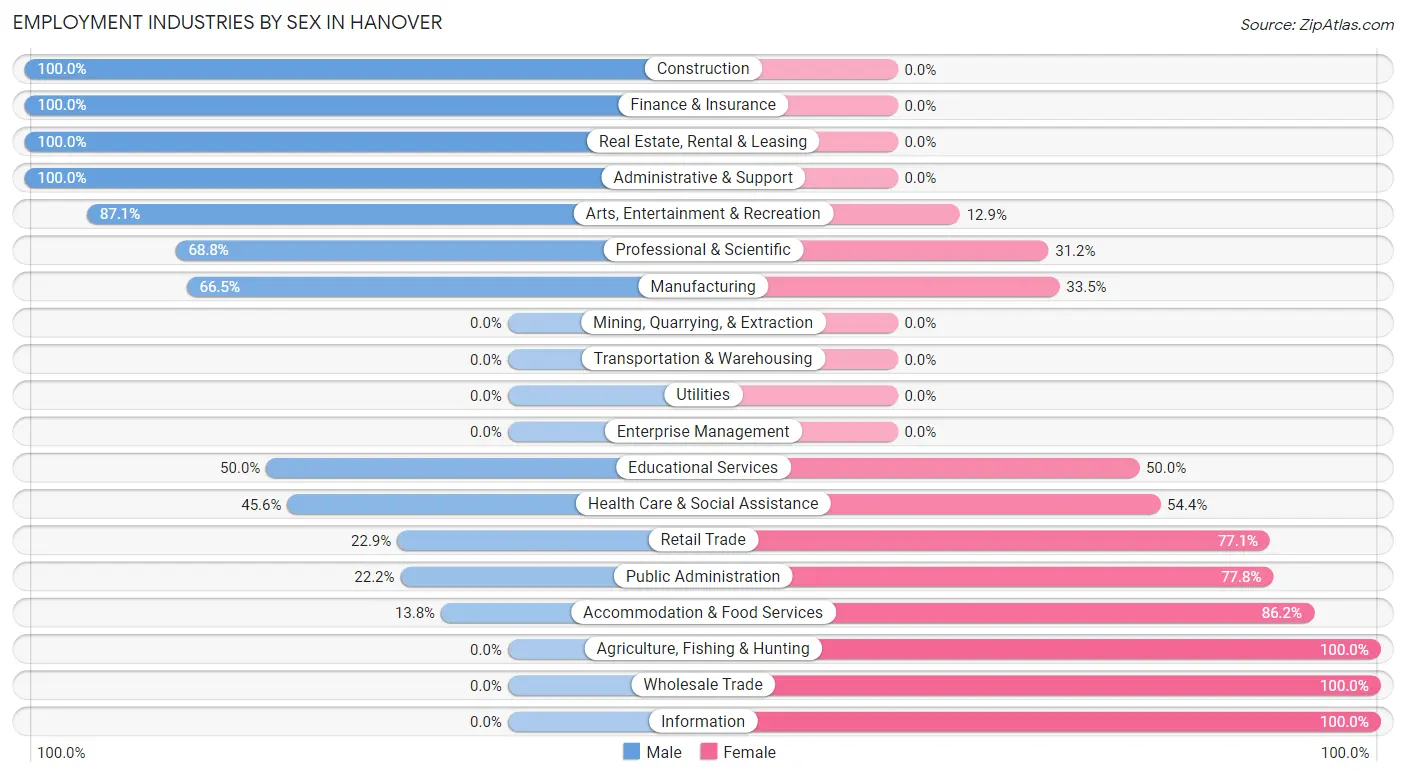
| Industry | Male | Female |
| Agriculture, Fishing & Hunting | 0 (0.0%) | 9 (100.0%) |
| Mining, Quarrying, & Extraction | 0 (0.0%) | 0 (0.0%) |
| Construction | 42 (100.0%) | 0 (0.0%) |
| Manufacturing | 111 (66.5%) | 56 (33.5%) |
| Wholesale Trade | 0 (0.0%) | 47 (100.0%) |
| Retail Trade | 30 (22.9%) | 101 (77.1%) |
| Transportation & Warehousing | 0 (0.0%) | 0 (0.0%) |
| Utilities | 0 (0.0%) | 0 (0.0%) |
| Information | 0 (0.0%) | 16 (100.0%) |
| Finance & Insurance | 56 (100.0%) | 0 (0.0%) |
| Real Estate, Rental & Leasing | 16 (100.0%) | 0 (0.0%) |
| Professional & Scientific | 207 (68.8%) | 94 (31.2%) |
| Enterprise Management | 0 (0.0%) | 0 (0.0%) |
| Administrative & Support | 7 (100.0%) | 0 (0.0%) |
| Educational Services | 625 (50.0%) | 625 (50.0%) |
| Health Care & Social Assistance | 308 (45.6%) | 367 (54.4%) |
| Arts, Entertainment & Recreation | 81 (87.1%) | 12 (12.9%) |
| Accommodation & Food Services | 17 (13.8%) | 106 (86.2%) |
| Public Administration | 2 (22.2%) | 7 (77.8%) |
| Total | 1,511 (51.1%) | 1,444 (48.9%) |
Education in Hanover
School Enrollment in Hanover
The most common levels of schooling among the 4,698 students in Hanover are college / undergraduate (3,774 | 80.3%), graduate / professional (307 | 6.5%), and elementary school (198 | 4.2%).
| School Level | # Students | % Students |
| Nursery / Preschool | 60 | 1.3% |
| Kindergarten | 42 | 0.9% |
| Elementary School | 198 | 4.2% |
| Middle School | 138 | 2.9% |
| High School | 179 | 3.8% |
| College / Undergraduate | 3,774 | 80.3% |
| Graduate / Professional | 307 | 6.5% |
| Total | 4,698 | 100.0% |
School Enrollment by Age by Funding Source in Hanover
Out of a total of 4,698 students who are enrolled in schools in Hanover, 3,364 (71.6%) attend a private institution, while the remaining 1,334 (28.4%) are enrolled in public schools. The age group of 20 to 24 year olds has the highest likelihood of being enrolled in private schools, with 1,349 (88.0% in the age bracket) enrolled. Conversely, the age group of 5 to 9 year old has the lowest likelihood of being enrolled in a private school, with 210 (100.0% in the age bracket) attending a public institution.
| Age Bracket | Public School | Private School |
| 3 to 4 Year Olds | 10 (16.7%) | 50 (83.3%) |
| 5 to 9 Year Old | 210 (100.0%) | 0 (0.0%) |
| 10 to 14 Year Olds | 190 (100.0%) | 0 (0.0%) |
| 15 to 17 Year Olds | 144 (62.3%) | 87 (37.7%) |
| 18 to 19 Year Olds | 464 (22.2%) | 1,626 (77.8%) |
| 20 to 24 Year Olds | 184 (12.0%) | 1,349 (88.0%) |
| 25 to 34 Year Olds | 122 (38.9%) | 192 (61.2%) |
| 35 Years and over | 9 (12.9%) | 61 (87.1%) |
| Total | 1,334 (28.4%) | 3,364 (71.6%) |
Educational Attainment by Field of Study in Hanover
Bio, nature & agricultural (525 | 14.7%), literature & languages (496 | 13.9%), social sciences (444 | 12.4%), business (407 | 11.4%), and physical & health sciences (380 | 10.6%) are the most common fields of study among 3,582 individuals in Hanover who have obtained a bachelor's degree or higher.
| Field of Study | # Graduates | % Graduates |
| Computers & Mathematics | 254 | 7.1% |
| Bio, Nature & Agricultural | 525 | 14.7% |
| Physical & Health Sciences | 380 | 10.6% |
| Psychology | 198 | 5.5% |
| Social Sciences | 444 | 12.4% |
| Engineering | 96 | 2.7% |
| Multidisciplinary Studies | 38 | 1.1% |
| Science & Technology | 236 | 6.6% |
| Business | 407 | 11.4% |
| Education | 88 | 2.5% |
| Literature & Languages | 496 | 13.9% |
| Liberal Arts & History | 179 | 5.0% |
| Visual & Performing Arts | 145 | 4.1% |
| Communications | 67 | 1.9% |
| Arts & Humanities | 29 | 0.8% |
| Total | 3,582 | 100.0% |
Transportation & Commute in Hanover
Vehicle Availability by Sex in Hanover
The most prevalent vehicle ownership categories in Hanover are males with 2 vehicles (554, accounting for 44.5%) and females with 2 vehicles (413, making up 53.1%).
| Vehicles Available | Male | Female |
| No Vehicle | 35 (2.8%) | 0 (0.0%) |
| 1 Vehicle | 299 (24.0%) | 317 (30.4%) |
| 2 Vehicles | 554 (44.5%) | 413 (39.6%) |
| 3 Vehicles | 227 (18.2%) | 206 (19.7%) |
| 4 Vehicles | 131 (10.5%) | 108 (10.3%) |
| 5 or more Vehicles | 0 (0.0%) | 0 (0.0%) |
| Total | 1,246 (100.0%) | 1,044 (100.0%) |
Commute Time in Hanover
The most frequently occuring commute durations in Hanover are 10 to 14 minutes (607 commuters, 27.6%), 5 to 9 minutes (597 commuters, 27.2%), and 15 to 19 minutes (532 commuters, 24.2%).
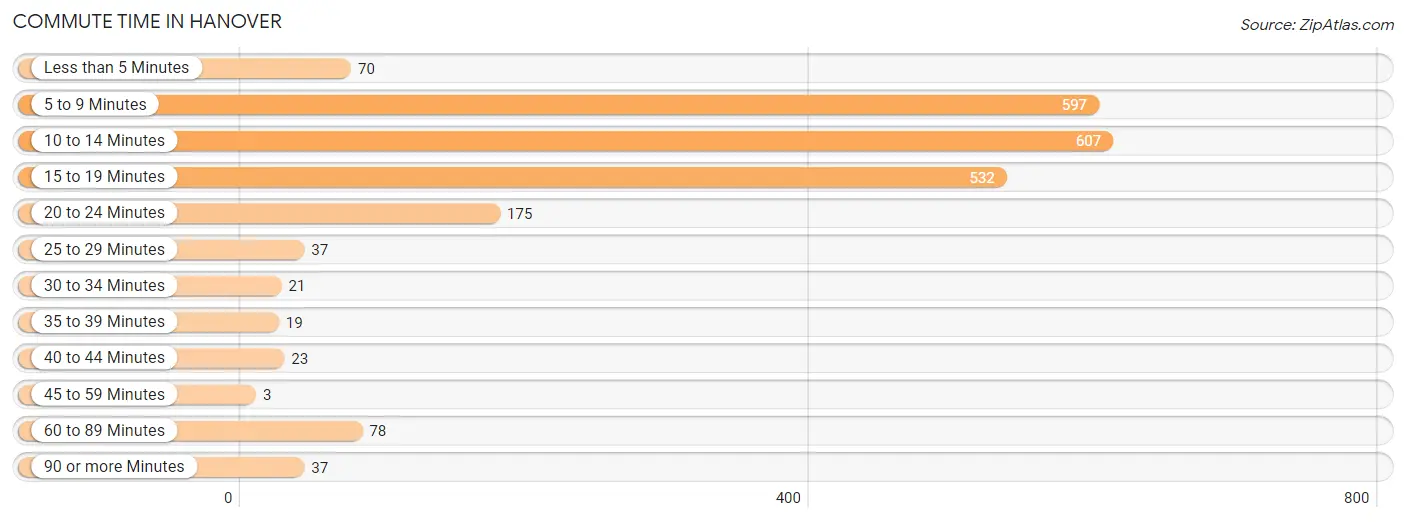
| Commute Time | # Commuters | % Commuters |
| Less than 5 Minutes | 70 | 3.2% |
| 5 to 9 Minutes | 597 | 27.2% |
| 10 to 14 Minutes | 607 | 27.6% |
| 15 to 19 Minutes | 532 | 24.2% |
| 20 to 24 Minutes | 175 | 8.0% |
| 25 to 29 Minutes | 37 | 1.7% |
| 30 to 34 Minutes | 21 | 0.9% |
| 35 to 39 Minutes | 19 | 0.9% |
| 40 to 44 Minutes | 23 | 1.1% |
| 45 to 59 Minutes | 3 | 0.1% |
| 60 to 89 Minutes | 78 | 3.5% |
| 90 or more Minutes | 37 | 1.7% |
Commute Time by Sex in Hanover
The most common commute times in Hanover are 10 to 14 minutes (339 commuters, 28.5%) for males and 5 to 9 minutes (272 commuters, 27.0%) for females.
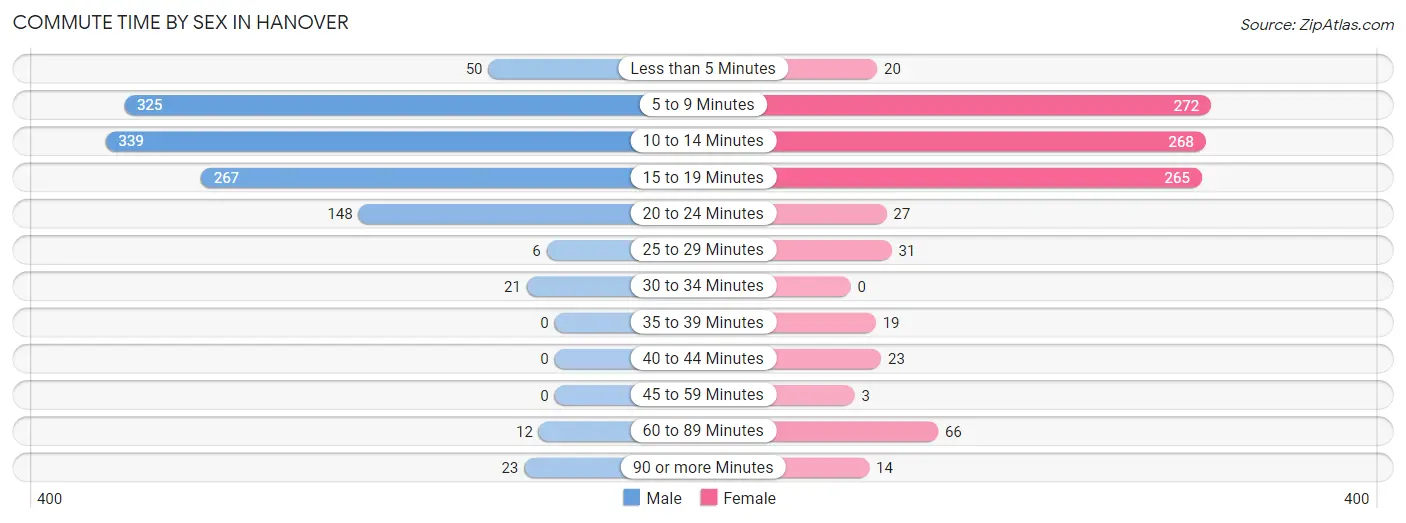
| Commute Time | Male | Female |
| Less than 5 Minutes | 50 (4.2%) | 20 (2.0%) |
| 5 to 9 Minutes | 325 (27.3%) | 272 (27.0%) |
| 10 to 14 Minutes | 339 (28.5%) | 268 (26.6%) |
| 15 to 19 Minutes | 267 (22.4%) | 265 (26.3%) |
| 20 to 24 Minutes | 148 (12.4%) | 27 (2.7%) |
| 25 to 29 Minutes | 6 (0.5%) | 31 (3.1%) |
| 30 to 34 Minutes | 21 (1.8%) | 0 (0.0%) |
| 35 to 39 Minutes | 0 (0.0%) | 19 (1.9%) |
| 40 to 44 Minutes | 0 (0.0%) | 23 (2.3%) |
| 45 to 59 Minutes | 0 (0.0%) | 3 (0.3%) |
| 60 to 89 Minutes | 12 (1.0%) | 66 (6.6%) |
| 90 or more Minutes | 23 (1.9%) | 14 (1.4%) |
Time of Departure to Work by Sex in Hanover
The most frequent times of departure to work in Hanover are 7:30 AM to 7:59 AM (297, 24.9%) for males and 7:00 AM to 7:29 AM (183, 18.1%) for females.
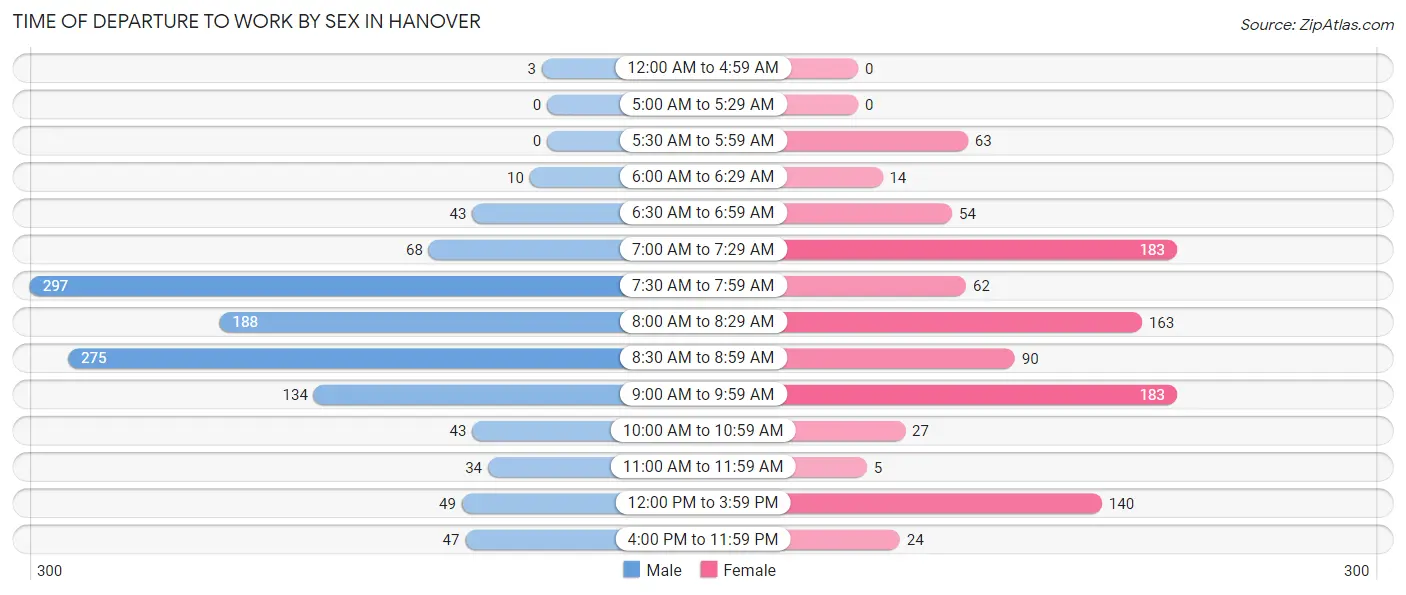
| Time of Departure | Male | Female |
| 12:00 AM to 4:59 AM | 3 (0.3%) | 0 (0.0%) |
| 5:00 AM to 5:29 AM | 0 (0.0%) | 0 (0.0%) |
| 5:30 AM to 5:59 AM | 0 (0.0%) | 63 (6.2%) |
| 6:00 AM to 6:29 AM | 10 (0.8%) | 14 (1.4%) |
| 6:30 AM to 6:59 AM | 43 (3.6%) | 54 (5.4%) |
| 7:00 AM to 7:29 AM | 68 (5.7%) | 183 (18.1%) |
| 7:30 AM to 7:59 AM | 297 (24.9%) | 62 (6.1%) |
| 8:00 AM to 8:29 AM | 188 (15.8%) | 163 (16.2%) |
| 8:30 AM to 8:59 AM | 275 (23.1%) | 90 (8.9%) |
| 9:00 AM to 9:59 AM | 134 (11.3%) | 183 (18.1%) |
| 10:00 AM to 10:59 AM | 43 (3.6%) | 27 (2.7%) |
| 11:00 AM to 11:59 AM | 34 (2.9%) | 5 (0.5%) |
| 12:00 PM to 3:59 PM | 49 (4.1%) | 140 (13.9%) |
| 4:00 PM to 11:59 PM | 47 (4.0%) | 24 (2.4%) |
| Total | 1,191 (100.0%) | 1,008 (100.0%) |
Housing Occupancy in Hanover
Occupancy by Ownership in Hanover
Of the total 1,971 dwellings in Hanover, owner-occupied units account for 1,110 (56.3%), while renter-occupied units make up 861 (43.7%).
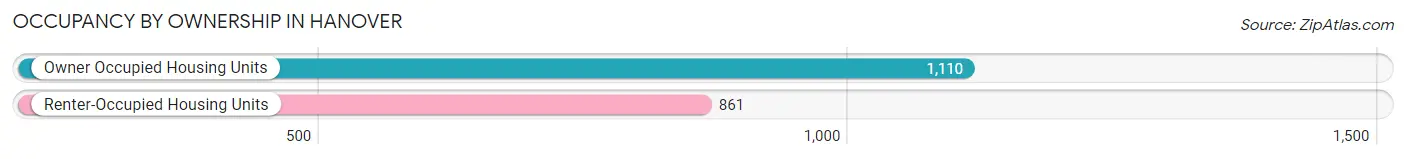
| Occupancy | # Housing Units | % Housing Units |
| Owner Occupied Housing Units | 1,110 | 56.3% |
| Renter-Occupied Housing Units | 861 | 43.7% |
| Total Occupied Housing Units | 1,971 | 100.0% |
Occupancy by Household Size in Hanover
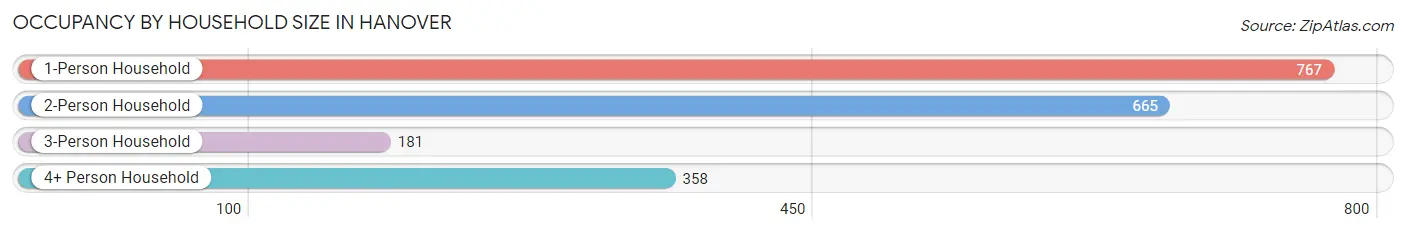
| Household Size | # Housing Units | % Housing Units |
| 1-Person Household | 767 | 38.9% |
| 2-Person Household | 665 | 33.7% |
| 3-Person Household | 181 | 9.2% |
| 4+ Person Household | 358 | 18.2% |
| Total Housing Units | 1,971 | 100.0% |
Occupancy by Ownership by Household Size in Hanover
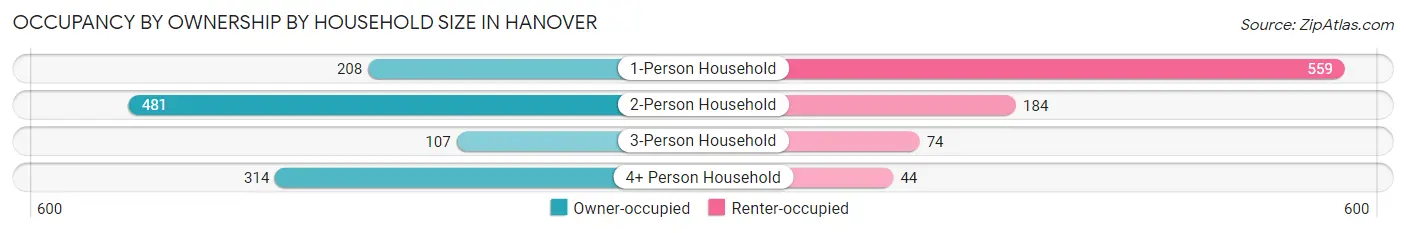
| Household Size | Owner-occupied | Renter-occupied |
| 1-Person Household | 208 (27.1%) | 559 (72.9%) |
| 2-Person Household | 481 (72.3%) | 184 (27.7%) |
| 3-Person Household | 107 (59.1%) | 74 (40.9%) |
| 4+ Person Household | 314 (87.7%) | 44 (12.3%) |
| Total Housing Units | 1,110 (56.3%) | 861 (43.7%) |
Occupancy by Educational Attainment in Hanover
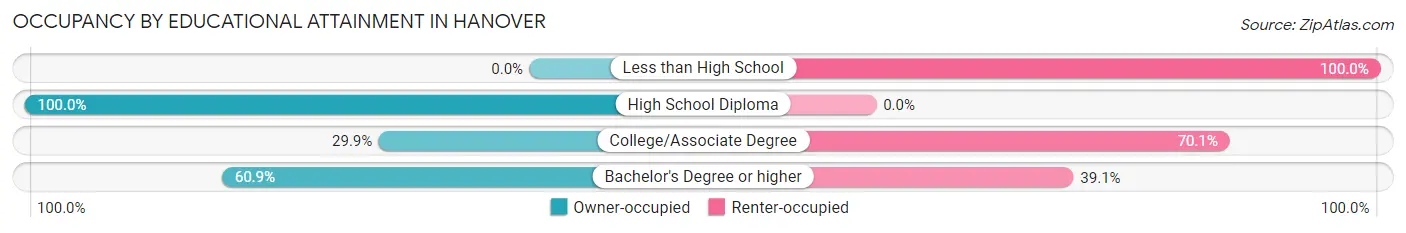
| Household Size | Owner-occupied | Renter-occupied |
| Less than High School | 0 (0.0%) | 44 (100.0%) |
| High School Diploma | 15 (100.0%) | 0 (0.0%) |
| College/Associate Degree | 67 (29.9%) | 157 (70.1%) |
| Bachelor's Degree or higher | 1,028 (60.9%) | 660 (39.1%) |
Occupancy by Age of Householder in Hanover
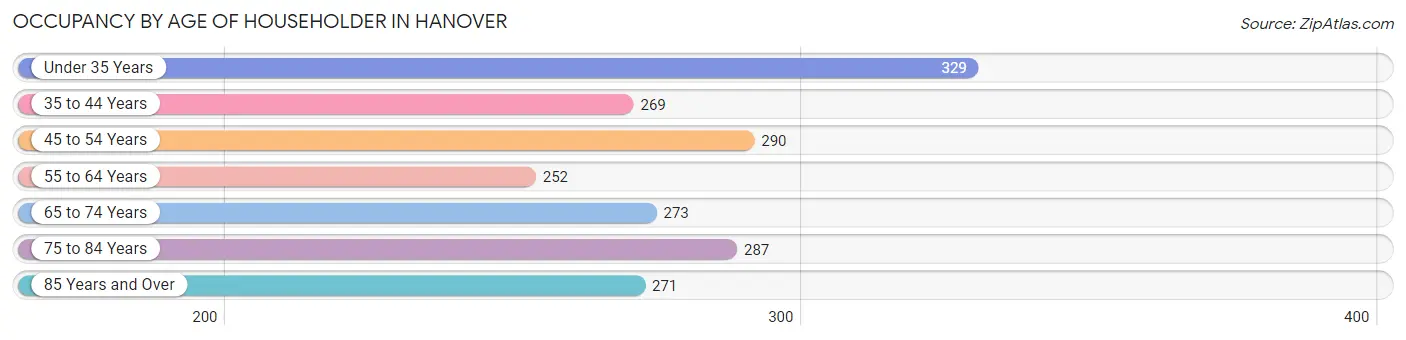
| Age Bracket | # Households | % Households |
| Under 35 Years | 329 | 16.7% |
| 35 to 44 Years | 269 | 13.7% |
| 45 to 54 Years | 290 | 14.7% |
| 55 to 64 Years | 252 | 12.8% |
| 65 to 74 Years | 273 | 13.9% |
| 75 to 84 Years | 287 | 14.6% |
| 85 Years and Over | 271 | 13.8% |
| Total | 1,971 | 100.0% |
Housing Finances in Hanover
Median Income by Occupancy in Hanover
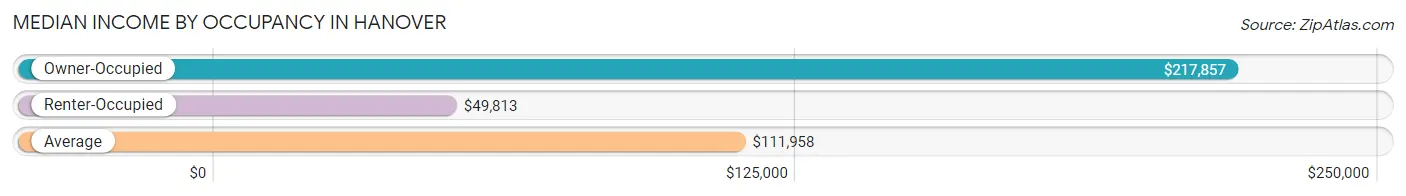
| Occupancy Type | # Households | Median Income |
| Owner-Occupied | 1,110 (56.3%) | $217,857 |
| Renter-Occupied | 861 (43.7%) | $49,813 |
| Average | 1,971 (100.0%) | $111,958 |
Occupancy by Householder Income Bracket in Hanover
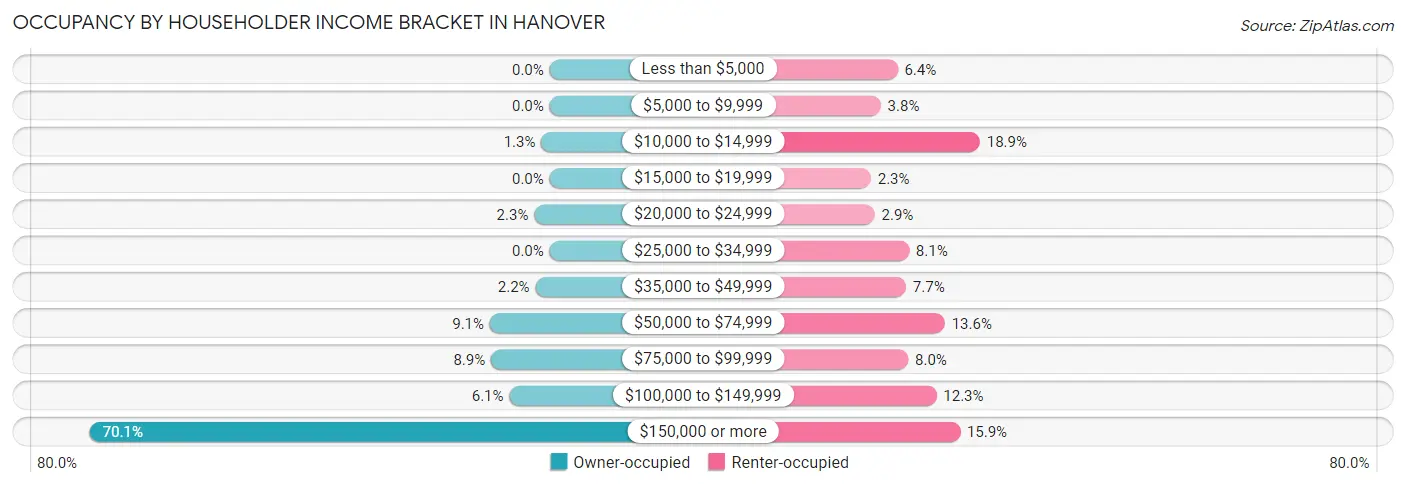
| Income Bracket | Owner-occupied | Renter-occupied |
| Less than $5,000 | 0 (0.0%) | 55 (6.4%) |
| $5,000 to $9,999 | 0 (0.0%) | 33 (3.8%) |
| $10,000 to $14,999 | 14 (1.3%) | 163 (18.9%) |
| $15,000 to $19,999 | 0 (0.0%) | 20 (2.3%) |
| $20,000 to $24,999 | 26 (2.3%) | 25 (2.9%) |
| $25,000 to $34,999 | 0 (0.0%) | 70 (8.1%) |
| $35,000 to $49,999 | 24 (2.2%) | 66 (7.7%) |
| $50,000 to $74,999 | 101 (9.1%) | 117 (13.6%) |
| $75,000 to $99,999 | 99 (8.9%) | 69 (8.0%) |
| $100,000 to $149,999 | 68 (6.1%) | 106 (12.3%) |
| $150,000 or more | 778 (70.1%) | 137 (15.9%) |
| Total | 1,110 (100.0%) | 861 (100.0%) |
Monthly Housing Cost Tiers in Hanover
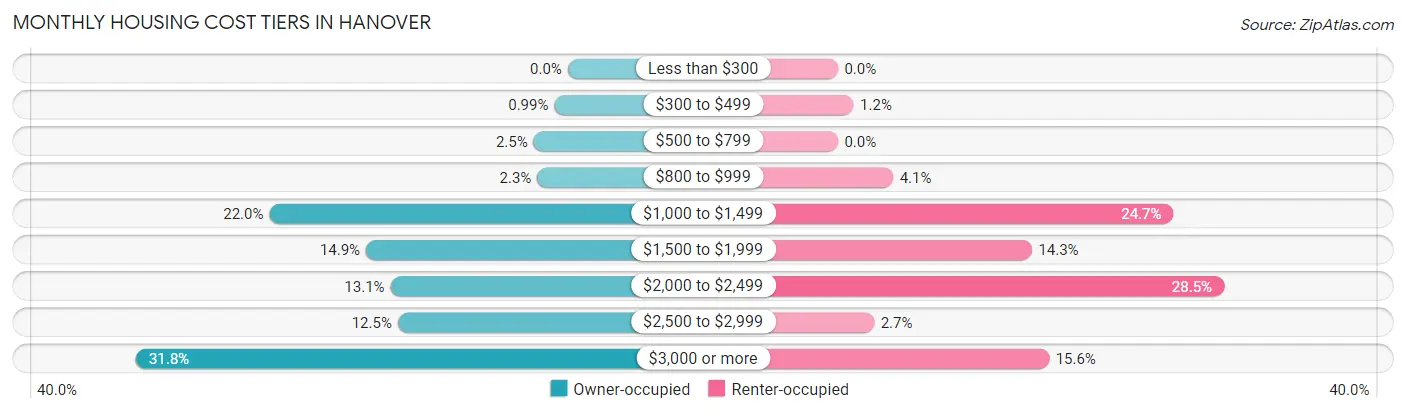
| Monthly Cost | Owner-occupied | Renter-occupied |
| Less than $300 | 0 (0.0%) | 0 (0.0%) |
| $300 to $499 | 11 (1.0%) | 10 (1.2%) |
| $500 to $799 | 28 (2.5%) | 0 (0.0%) |
| $800 to $999 | 25 (2.2%) | 35 (4.1%) |
| $1,000 to $1,499 | 244 (22.0%) | 213 (24.7%) |
| $1,500 to $1,999 | 165 (14.9%) | 123 (14.3%) |
| $2,000 to $2,499 | 145 (13.1%) | 245 (28.5%) |
| $2,500 to $2,999 | 139 (12.5%) | 23 (2.7%) |
| $3,000 or more | 353 (31.8%) | 134 (15.6%) |
| Total | 1,110 (100.0%) | 861 (100.0%) |
Physical Housing Characteristics in Hanover
Housing Structures in Hanover
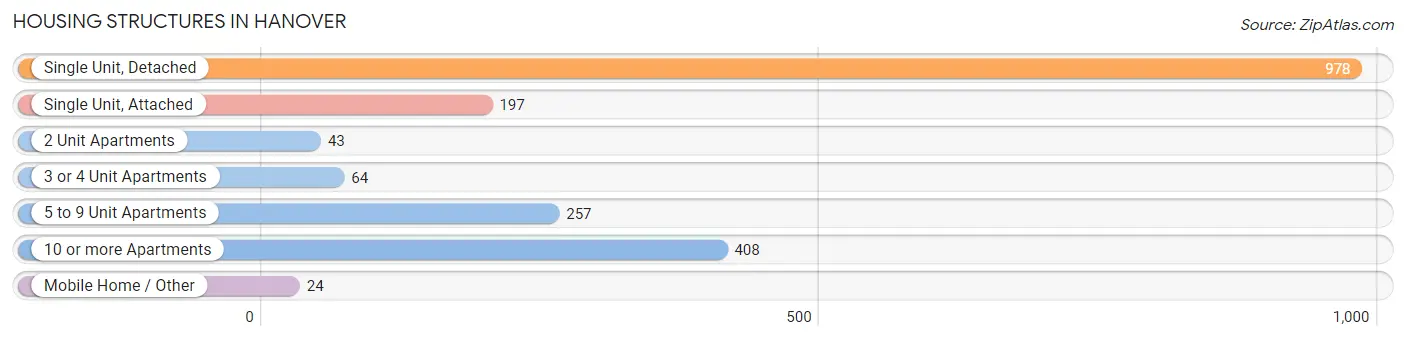
| Structure Type | # Housing Units | % Housing Units |
| Single Unit, Detached | 978 | 49.6% |
| Single Unit, Attached | 197 | 10.0% |
| 2 Unit Apartments | 43 | 2.2% |
| 3 or 4 Unit Apartments | 64 | 3.3% |
| 5 to 9 Unit Apartments | 257 | 13.0% |
| 10 or more Apartments | 408 | 20.7% |
| Mobile Home / Other | 24 | 1.2% |
| Total | 1,971 | 100.0% |
Housing Structures by Occupancy in Hanover
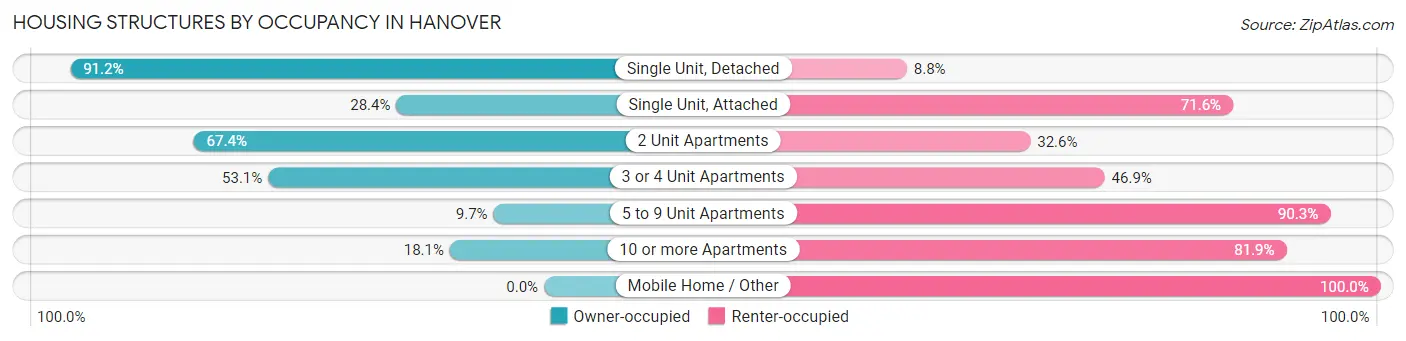
| Structure Type | Owner-occupied | Renter-occupied |
| Single Unit, Detached | 892 (91.2%) | 86 (8.8%) |
| Single Unit, Attached | 56 (28.4%) | 141 (71.6%) |
| 2 Unit Apartments | 29 (67.4%) | 14 (32.6%) |
| 3 or 4 Unit Apartments | 34 (53.1%) | 30 (46.9%) |
| 5 to 9 Unit Apartments | 25 (9.7%) | 232 (90.3%) |
| 10 or more Apartments | 74 (18.1%) | 334 (81.9%) |
| Mobile Home / Other | 0 (0.0%) | 24 (100.0%) |
| Total | 1,110 (56.3%) | 861 (43.7%) |
Housing Structures by Number of Rooms in Hanover
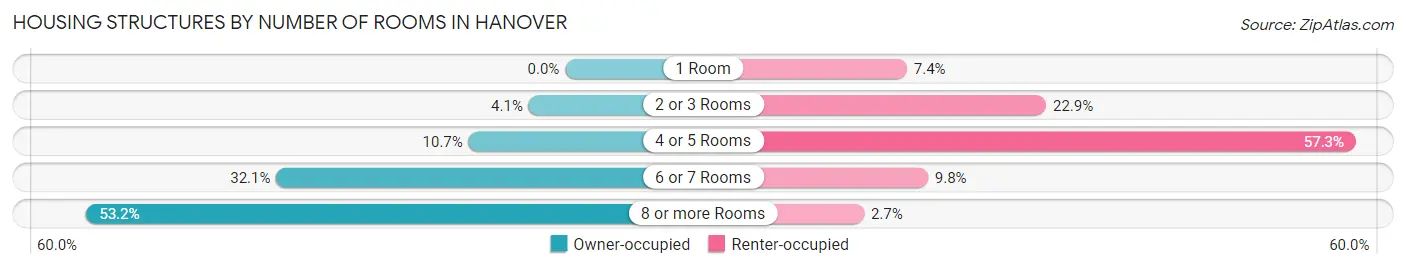
| Number of Rooms | Owner-occupied | Renter-occupied |
| 1 Room | 0 (0.0%) | 64 (7.4%) |
| 2 or 3 Rooms | 45 (4.1%) | 197 (22.9%) |
| 4 or 5 Rooms | 119 (10.7%) | 493 (57.3%) |
| 6 or 7 Rooms | 356 (32.1%) | 84 (9.8%) |
| 8 or more Rooms | 590 (53.1%) | 23 (2.7%) |
| Total | 1,110 (100.0%) | 861 (100.0%) |
Housing Structure by Heating Type in Hanover
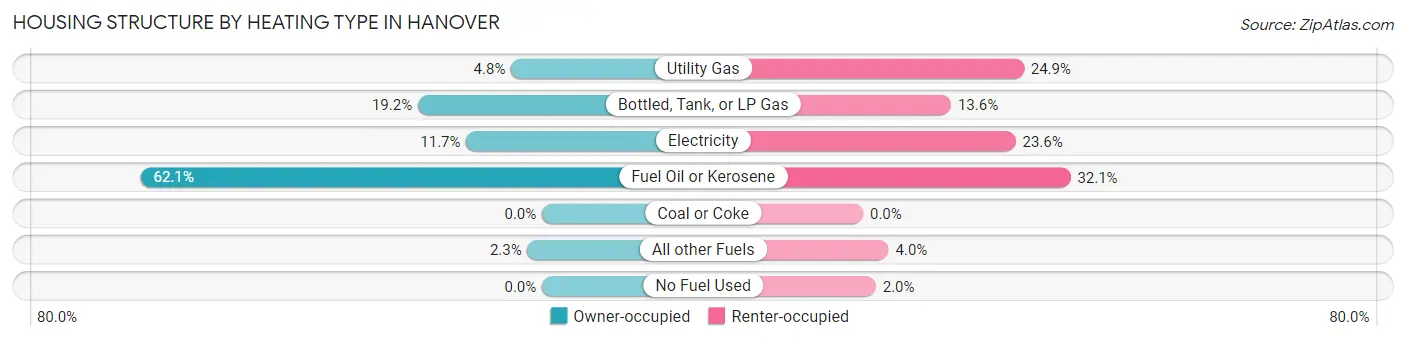
| Heating Type | Owner-occupied | Renter-occupied |
| Utility Gas | 53 (4.8%) | 214 (24.8%) |
| Bottled, Tank, or LP Gas | 213 (19.2%) | 117 (13.6%) |
| Electricity | 130 (11.7%) | 203 (23.6%) |
| Fuel Oil or Kerosene | 689 (62.1%) | 276 (32.1%) |
| Coal or Coke | 0 (0.0%) | 0 (0.0%) |
| All other Fuels | 25 (2.2%) | 34 (4.0%) |
| No Fuel Used | 0 (0.0%) | 17 (2.0%) |
| Total | 1,110 (100.0%) | 861 (100.0%) |
Household Vehicle Usage in Hanover
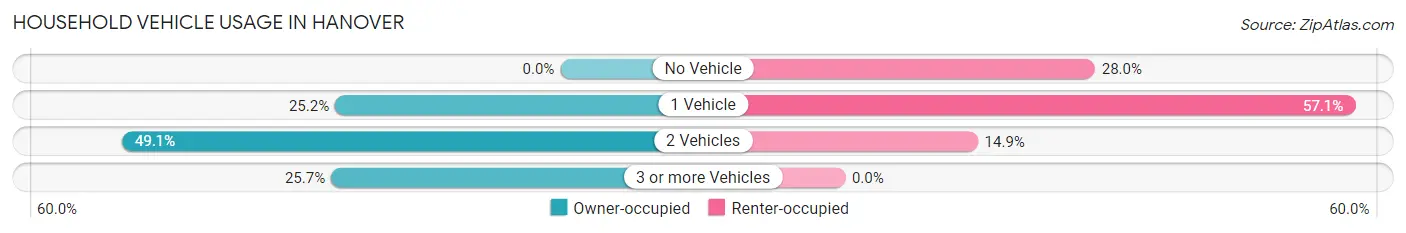
| Vehicles per Household | Owner-occupied | Renter-occupied |
| No Vehicle | 0 (0.0%) | 241 (28.0%) |
| 1 Vehicle | 280 (25.2%) | 492 (57.1%) |
| 2 Vehicles | 545 (49.1%) | 128 (14.9%) |
| 3 or more Vehicles | 285 (25.7%) | 0 (0.0%) |
| Total | 1,110 (100.0%) | 861 (100.0%) |
Real Estate & Mortgages in Hanover
Real Estate and Mortgage Overview in Hanover
| Characteristic | Without Mortgage | With Mortgage |
| Housing Units | 498 | 612 |
| Median Property Value | $620,700 | $698,000 |
| Median Household Income | $213,088 | $477 |
| Monthly Housing Costs | $1,346 | $345 |
| Real Estate Taxes | $10,001 | $0 |
Property Value by Mortgage Status in Hanover
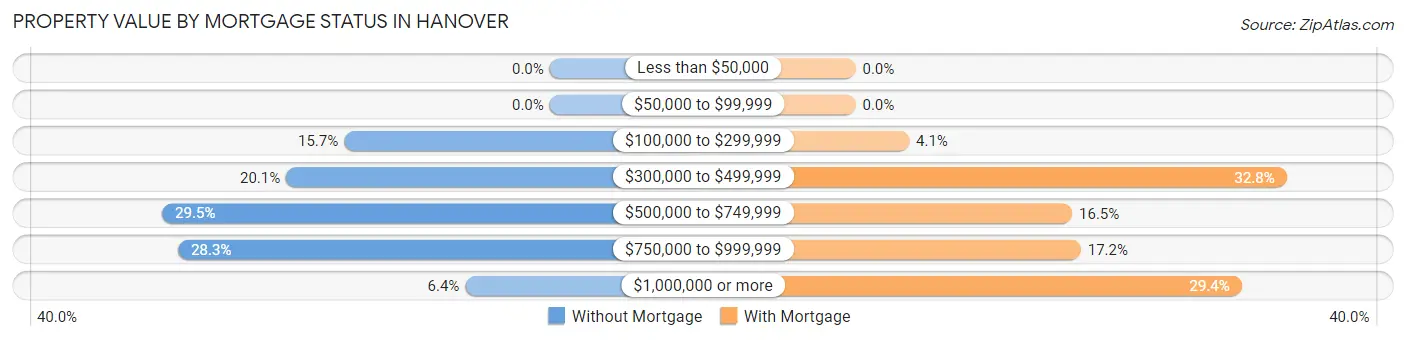
| Property Value | Without Mortgage | With Mortgage |
| Less than $50,000 | 0 (0.0%) | 0 (0.0%) |
| $50,000 to $99,999 | 0 (0.0%) | 0 (0.0%) |
| $100,000 to $299,999 | 78 (15.7%) | 25 (4.1%) |
| $300,000 to $499,999 | 100 (20.1%) | 201 (32.8%) |
| $500,000 to $749,999 | 147 (29.5%) | 101 (16.5%) |
| $750,000 to $999,999 | 141 (28.3%) | 105 (17.2%) |
| $1,000,000 or more | 32 (6.4%) | 180 (29.4%) |
| Total | 498 (100.0%) | 612 (100.0%) |
Household Income by Mortgage Status in Hanover
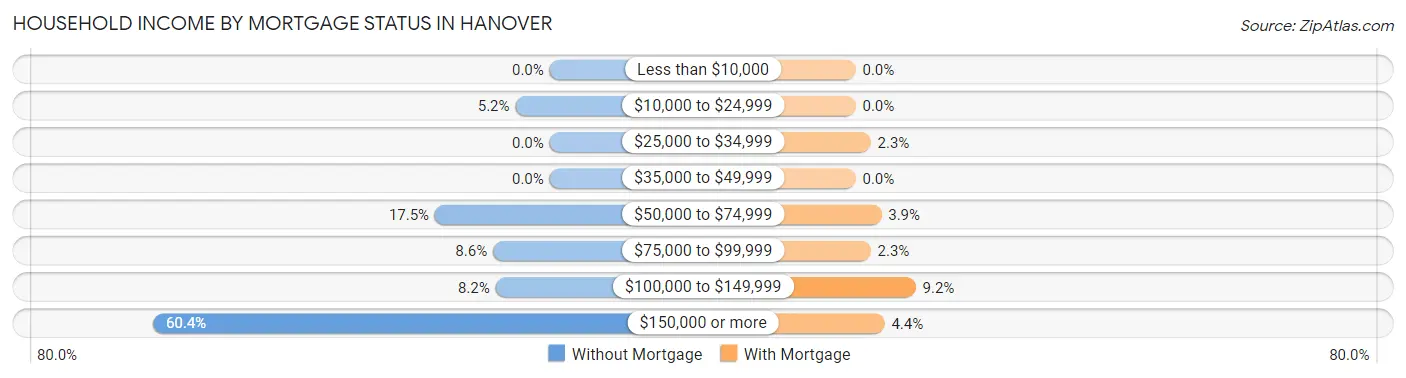
| Household Income | Without Mortgage | With Mortgage |
| Less than $10,000 | 0 (0.0%) | 0 (0.0%) |
| $10,000 to $24,999 | 26 (5.2%) | 0 (0.0%) |
| $25,000 to $34,999 | 0 (0.0%) | 14 (2.3%) |
| $35,000 to $49,999 | 0 (0.0%) | 0 (0.0%) |
| $50,000 to $74,999 | 87 (17.5%) | 24 (3.9%) |
| $75,000 to $99,999 | 43 (8.6%) | 14 (2.3%) |
| $100,000 to $149,999 | 41 (8.2%) | 56 (9.1%) |
| $150,000 or more | 301 (60.4%) | 27 (4.4%) |
| Total | 498 (100.0%) | 612 (100.0%) |
Property Value to Household Income Ratio in Hanover
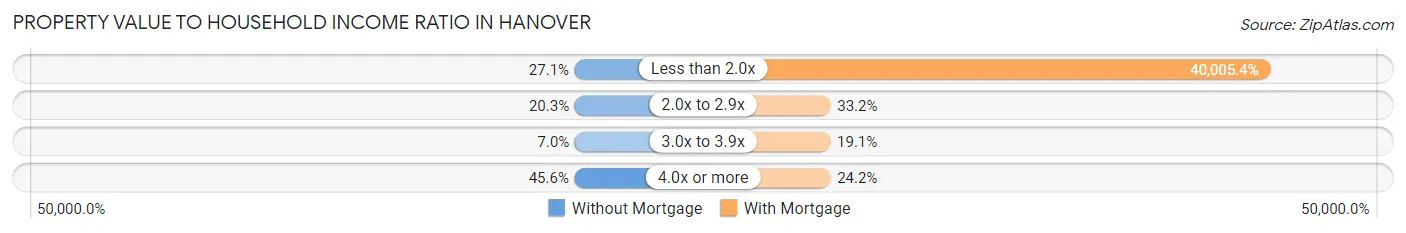
| Value-to-Income Ratio | Without Mortgage | With Mortgage |
| Less than 2.0x | 135 (27.1%) | 244,833 (40,005.4%) |
| 2.0x to 2.9x | 101 (20.3%) | 203 (33.2%) |
| 3.0x to 3.9x | 35 (7.0%) | 117 (19.1%) |
| 4.0x or more | 227 (45.6%) | 148 (24.2%) |
| Total | 498 (100.0%) | 612 (100.0%) |
Real Estate Taxes by Mortgage Status in Hanover
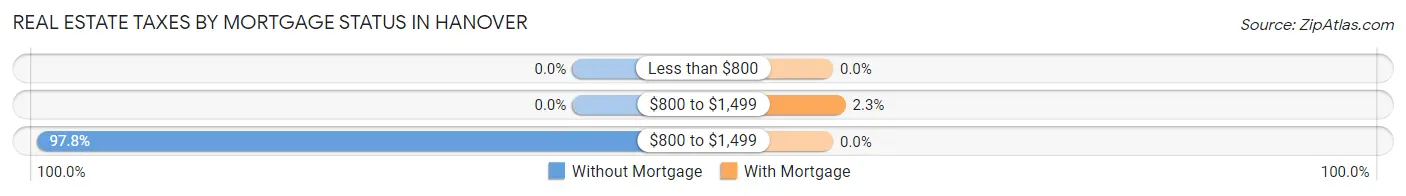
| Property Taxes | Without Mortgage | With Mortgage |
| Less than $800 | 0 (0.0%) | 0 (0.0%) |
| $800 to $1,499 | 0 (0.0%) | 14 (2.3%) |
| $800 to $1,499 | 487 (97.8%) | 0 (0.0%) |
| Total | 498 (100.0%) | 612 (100.0%) |
Health & Disability in Hanover
Health Insurance Coverage by Age in Hanover
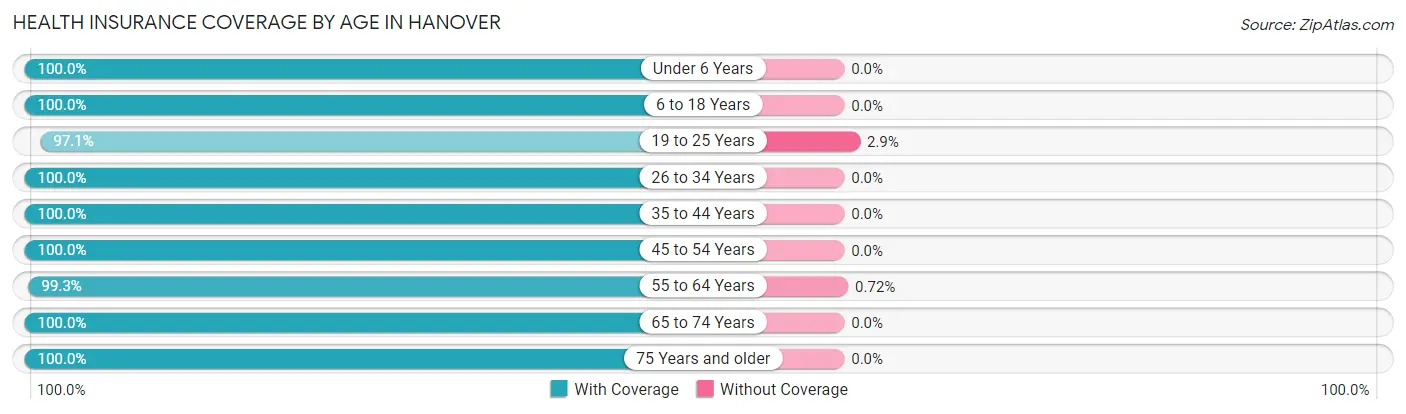
| Age Bracket | With Coverage | Without Coverage |
| Under 6 Years | 219 (100.0%) | 0 (0.0%) |
| 6 to 18 Years | 1,575 (100.0%) | 0 (0.0%) |
| 19 to 25 Years | 2,715 (97.1%) | 82 (2.9%) |
| 26 to 34 Years | 592 (100.0%) | 0 (0.0%) |
| 35 to 44 Years | 672 (100.0%) | 0 (0.0%) |
| 45 to 54 Years | 678 (100.0%) | 0 (0.0%) |
| 55 to 64 Years | 413 (99.3%) | 3 (0.7%) |
| 65 to 74 Years | 426 (100.0%) | 0 (0.0%) |
| 75 Years and older | 751 (100.0%) | 0 (0.0%) |
| Total | 8,041 (99.0%) | 85 (1.1%) |
Health Insurance Coverage by Citizenship Status in Hanover
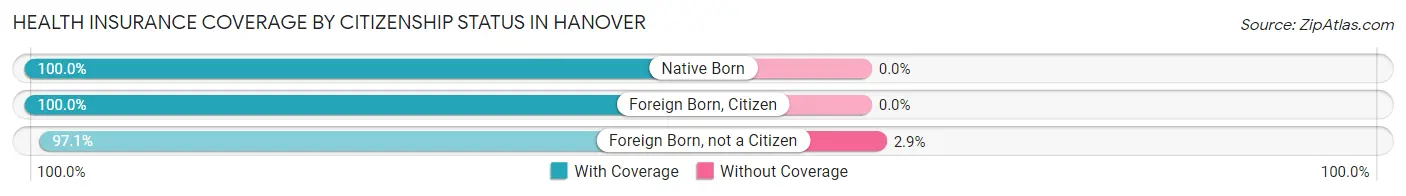
| Citizenship Status | With Coverage | Without Coverage |
| Native Born | 219 (100.0%) | 0 (0.0%) |
| Foreign Born, Citizen | 1,575 (100.0%) | 0 (0.0%) |
| Foreign Born, not a Citizen | 2,715 (97.1%) | 82 (2.9%) |
Health Insurance Coverage by Household Income in Hanover
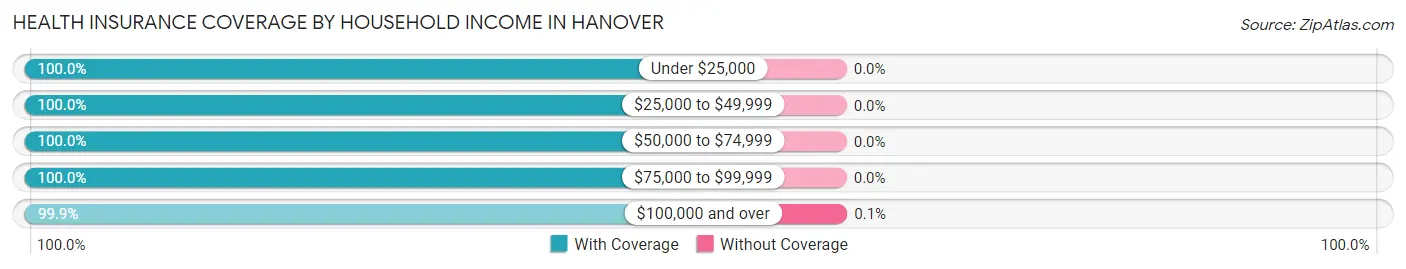
| Household Income | With Coverage | Without Coverage |
| Under $25,000 | 412 (100.0%) | 0 (0.0%) |
| $25,000 to $49,999 | 221 (100.0%) | 0 (0.0%) |
| $50,000 to $74,999 | 405 (100.0%) | 0 (0.0%) |
| $75,000 to $99,999 | 267 (100.0%) | 0 (0.0%) |
| $100,000 and over | 3,132 (99.9%) | 3 (0.1%) |
Public vs Private Health Insurance Coverage by Age in Hanover
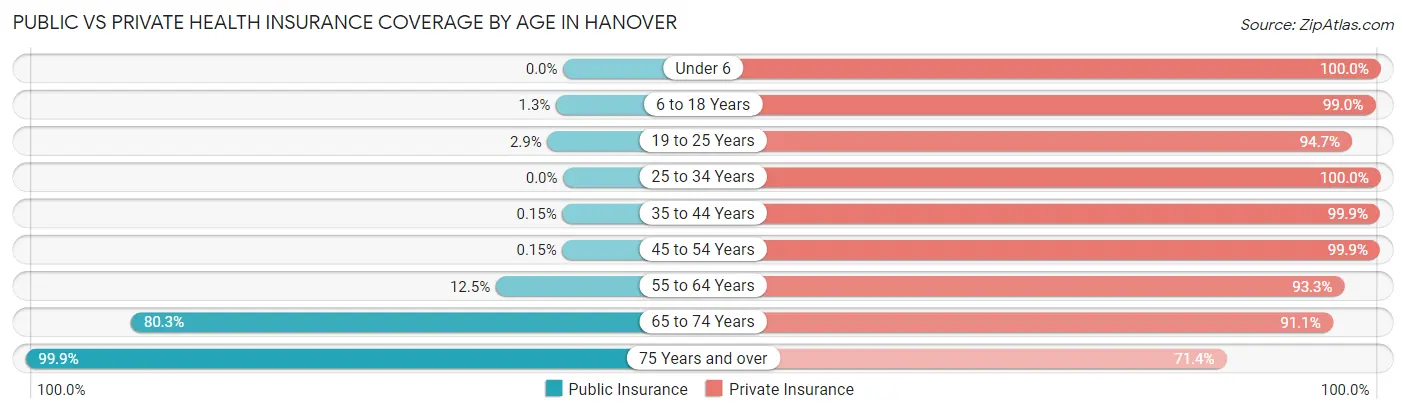
| Age Bracket | Public Insurance | Private Insurance |
| Under 6 | 0 (0.0%) | 219 (100.0%) |
| 6 to 18 Years | 21 (1.3%) | 1,559 (99.0%) |
| 19 to 25 Years | 82 (2.9%) | 2,648 (94.7%) |
| 25 to 34 Years | 0 (0.0%) | 592 (100.0%) |
| 35 to 44 Years | 1 (0.2%) | 671 (99.9%) |
| 45 to 54 Years | 1 (0.2%) | 677 (99.9%) |
| 55 to 64 Years | 52 (12.5%) | 388 (93.3%) |
| 65 to 74 Years | 342 (80.3%) | 388 (91.1%) |
| 75 Years and over | 750 (99.9%) | 536 (71.4%) |
| Total | 1,249 (15.4%) | 7,678 (94.5%) |
Disability Status by Sex by Age in Hanover
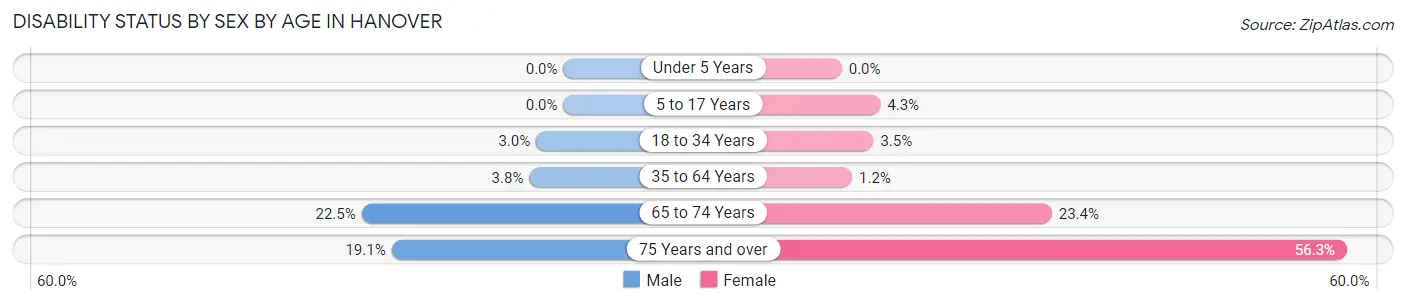
| Age Bracket | Male | Female |
| Under 5 Years | 0 (0.0%) | 0 (0.0%) |
| 5 to 17 Years | 0 (0.0%) | 16 (4.3%) |
| 18 to 34 Years | 69 (3.0%) | 74 (3.5%) |
| 35 to 64 Years | 34 (3.8%) | 10 (1.1%) |
| 65 to 74 Years | 40 (22.5%) | 58 (23.4%) |
| 75 Years and over | 58 (19.1%) | 252 (56.2%) |
Disability Class by Sex by Age in Hanover
Disability Class: Hearing Difficulty
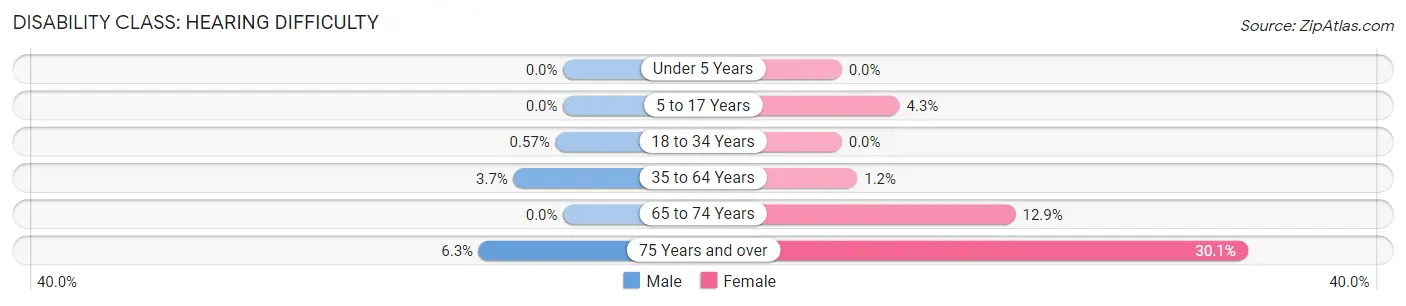
| Age Bracket | Male | Female |
| Under 5 Years | 0 (0.0%) | 0 (0.0%) |
| 5 to 17 Years | 0 (0.0%) | 16 (4.3%) |
| 18 to 34 Years | 13 (0.6%) | 0 (0.0%) |
| 35 to 64 Years | 33 (3.7%) | 10 (1.1%) |
| 65 to 74 Years | 0 (0.0%) | 32 (12.9%) |
| 75 Years and over | 19 (6.3%) | 135 (30.1%) |
Disability Class: Vision Difficulty
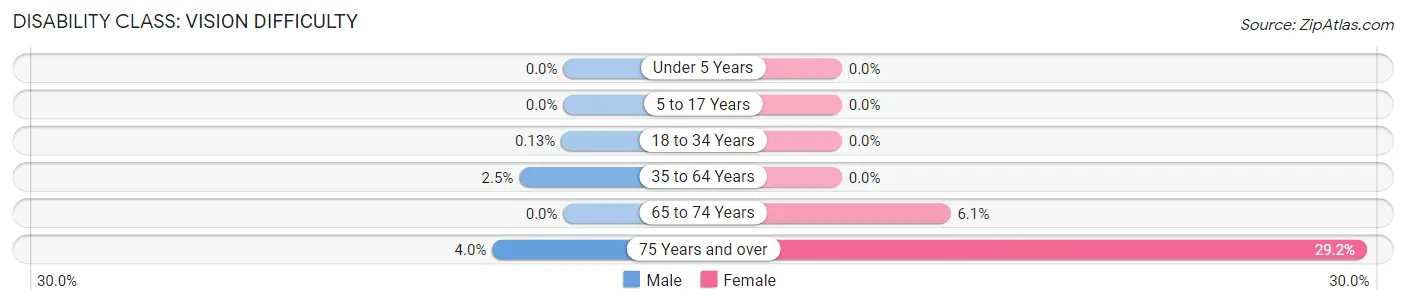
| Age Bracket | Male | Female |
| Under 5 Years | 0 (0.0%) | 0 (0.0%) |
| 5 to 17 Years | 0 (0.0%) | 0 (0.0%) |
| 18 to 34 Years | 3 (0.1%) | 0 (0.0%) |
| 35 to 64 Years | 22 (2.5%) | 0 (0.0%) |
| 65 to 74 Years | 0 (0.0%) | 15 (6.0%) |
| 75 Years and over | 12 (4.0%) | 131 (29.2%) |
Disability Class: Cognitive Difficulty
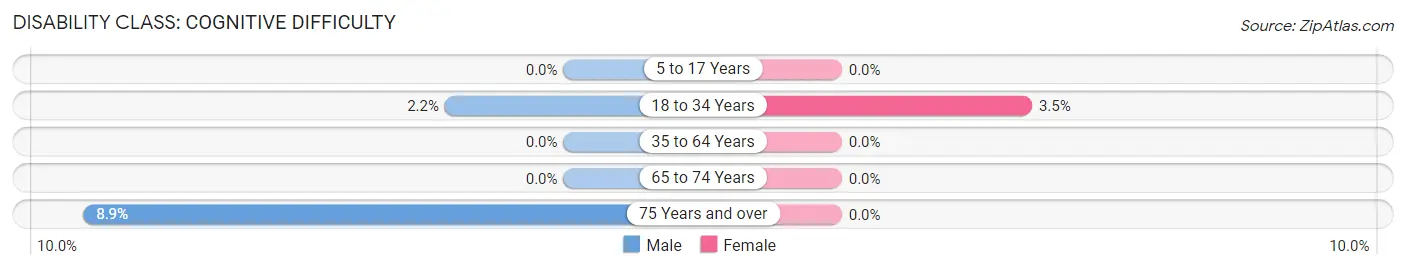
| Age Bracket | Male | Female |
| 5 to 17 Years | 0 (0.0%) | 0 (0.0%) |
| 18 to 34 Years | 50 (2.2%) | 74 (3.5%) |
| 35 to 64 Years | 0 (0.0%) | 0 (0.0%) |
| 65 to 74 Years | 0 (0.0%) | 0 (0.0%) |
| 75 Years and over | 27 (8.9%) | 0 (0.0%) |
Disability Class: Ambulatory Difficulty
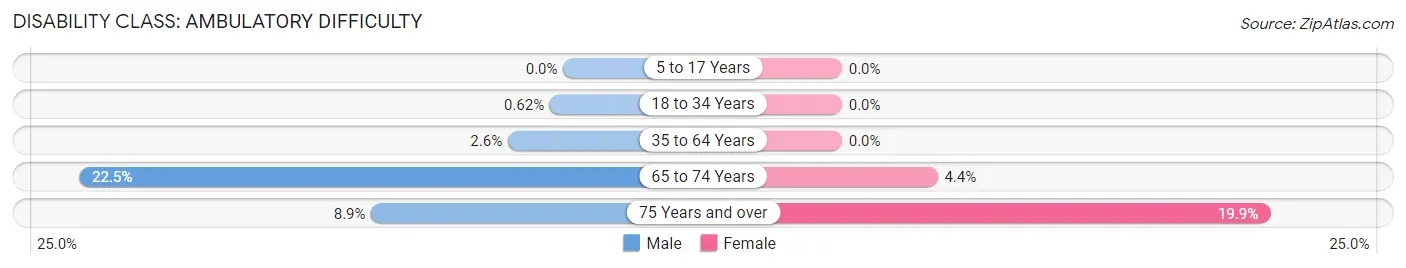
| Age Bracket | Male | Female |
| 5 to 17 Years | 0 (0.0%) | 0 (0.0%) |
| 18 to 34 Years | 14 (0.6%) | 0 (0.0%) |
| 35 to 64 Years | 23 (2.6%) | 0 (0.0%) |
| 65 to 74 Years | 40 (22.5%) | 11 (4.4%) |
| 75 Years and over | 27 (8.9%) | 89 (19.9%) |
Disability Class: Self-Care Difficulty
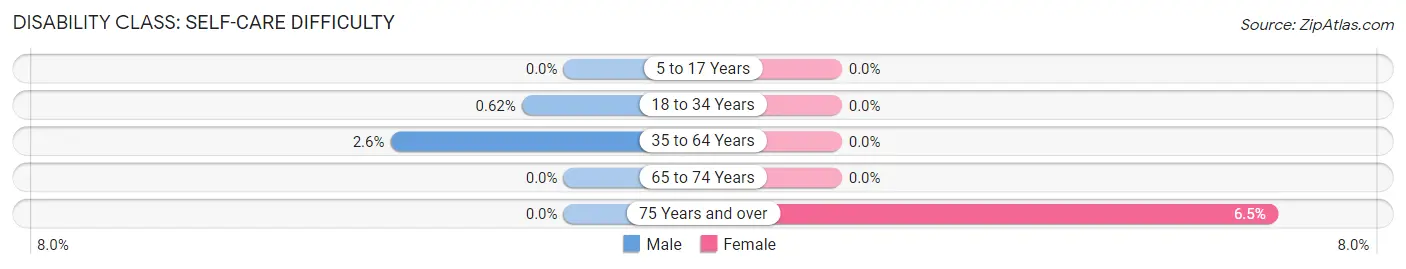
| Age Bracket | Male | Female |
| 5 to 17 Years | 0 (0.0%) | 0 (0.0%) |
| 18 to 34 Years | 14 (0.6%) | 0 (0.0%) |
| 35 to 64 Years | 23 (2.6%) | 0 (0.0%) |
| 65 to 74 Years | 0 (0.0%) | 0 (0.0%) |
| 75 Years and over | 0 (0.0%) | 29 (6.5%) |
Technology Access in Hanover
Computing Device Access in Hanover
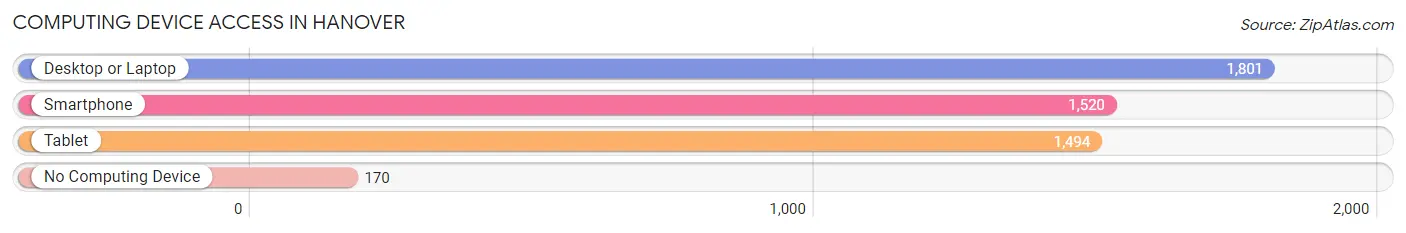
| Device Type | # Households | % Households |
| Desktop or Laptop | 1,801 | 91.4% |
| Smartphone | 1,520 | 77.1% |
| Tablet | 1,494 | 75.8% |
| No Computing Device | 170 | 8.6% |
| Total | 1,971 | 100.0% |
Internet Access in Hanover
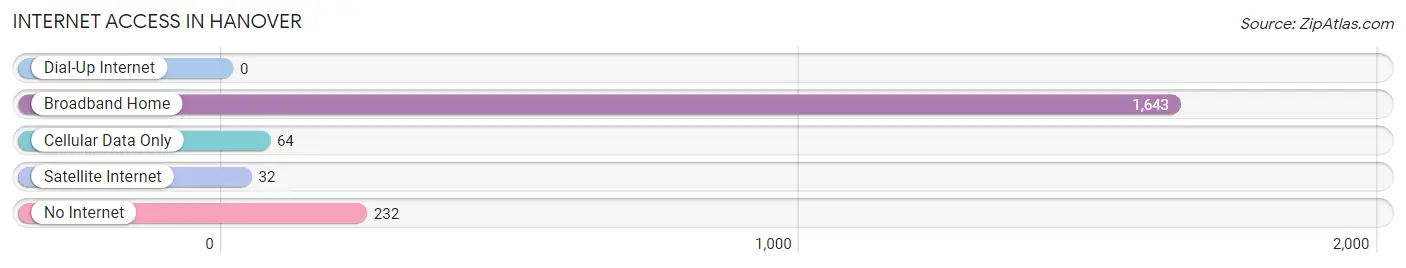
| Internet Type | # Households | % Households |
| Dial-Up Internet | 0 | 0.0% |
| Broadband Home | 1,643 | 83.4% |
| Cellular Data Only | 64 | 3.3% |
| Satellite Internet | 32 | 1.6% |
| No Internet | 232 | 11.8% |
| Total | 1,971 | 100.0% |
Hanover Summary
Hanover, New Hampshire is a small town located in the Upper Connecticut River Valley in the state of New Hampshire. It is situated in the western part of the state, just south of the White Mountains and the Appalachian Trail. The town is home to Dartmouth College, a private Ivy League university, and is part of the larger Hanover-Lebanon-Rutland metropolitan area.
Geography
Hanover is located in the Upper Connecticut River Valley, in the western part of New Hampshire. It is bordered by the towns of Lebanon to the north, Lyme to the east, and Enfield to the south. The town is situated on the east bank of the Connecticut River, and is surrounded by the White Mountains and the Appalachian Trail. The town has a total area of 11.2 square miles, of which 10.9 square miles is land and 0.3 square miles is water.
Climate
Hanover has a humid continental climate, with cold, snowy winters and warm, humid summers. The average annual temperature is 41°F, with an average high of 57°F in July and an average low of 24°F in January. The average annual precipitation is 40 inches, with an average of 60 inches of snowfall per year.
Demographics
As of the 2010 census, Hanover had a population of 11,260. The racial makeup of the town was 94.2% White, 1.3% African American, 0.3% Native American, 2.7% Asian, 0.1% Pacific Islander, 0.5% from other races, and 1.0% from two or more races. Hispanic or Latino of any race were 2.2% of the population.
Economy
Hanover’s economy is largely driven by Dartmouth College, which is the town’s largest employer. Other major employers include Dartmouth-Hitchcock Medical Center, the Hanover Co-op, and the Hanover Street Department. The town also has a thriving tourism industry, with many visitors coming to explore the White Mountains and the Appalachian Trail.
History
Hanover was first settled in 1761 by a group of settlers from Connecticut. The town was named after the House of Hanover, the ruling dynasty of Great Britain at the time. In 1769, the town was granted a charter by King George III, and in 1770, Dartmouth College was founded. The college quickly became the town’s main economic driver, and the town grew rapidly in the 19th century. In the 20th century, the town’s economy diversified, and it became a popular tourist destination.
Today, Hanover is a vibrant and thriving community, with a strong economy and a rich cultural heritage. The town is home to Dartmouth College, which is one of the most prestigious universities in the world, and is a popular destination for tourists and outdoor enthusiasts. Hanover is a great place to live, work, and play, and is a wonderful example of small-town New England charm.
Common Questions
What is Per Capita Income in Hanover?
Per Capita income in Hanover is $51,400.
What is the Median Family Income in Hanover?
Median Family Income in Hanover is $239,479.
What is the Median Household income in Hanover?
Median Household Income in Hanover is $111,958.
What is Income or Wage Gap in Hanover?
Income or Wage Gap in Hanover is 33.6%.
Women in Hanover earn 66.4 cents for every dollar earned by a man.
What is Inequality or Gini Index in Hanover?
Inequality or Gini Index in Hanover is 0.53.
What is the Total Population of Hanover?
Total Population of Hanover is 8,234.
What is the Total Male Population of Hanover?
Total Male Population of Hanover is 4,039.
What is the Total Female Population of Hanover?
Total Female Population of Hanover is 4,195.
What is the Ratio of Males per 100 Females in Hanover?
There are 96.28 Males per 100 Females in Hanover.
What is the Ratio of Females per 100 Males in Hanover?
There are 103.86 Females per 100 Males in Hanover.
What is the Median Population Age in Hanover?
Median Population Age in Hanover is 22.0 Years.
What is the Average Family Size in Hanover
Average Family Size in Hanover is 3.0 People.
What is the Average Household Size in Hanover
Average Household Size in Hanover is 2.2 People.
How Large is the Labor Force in Hanover?
There are 3,097 People in the Labor Forcein in Hanover.
What is the Percentage of People in the Labor Force in Hanover?
40.7% of People are in the Labor Force in Hanover.
What is the Unemployment Rate in Hanover?
Unemployment Rate in Hanover is 4.5%.