Keene, NH Map & Demographics
Keene Map
Keene Overview
$37,968
PER CAPITA INCOME
$93,196
AVG FAMILY INCOME
$69,381
AVG HOUSEHOLD INCOME
17.7%
WAGE / INCOME GAP [ % ]
82.3¢/ $1
WAGE / INCOME GAP [ $ ]
0.44
INEQUALITY / GINI INDEX
22,907
TOTAL POPULATION
11,235
MALE POPULATION
11,672
FEMALE POPULATION
96.26
MALES / 100 FEMALES
103.89
FEMALES / 100 MALES
36.1
MEDIAN AGE
2.9
AVG FAMILY SIZE
2.2
AVG HOUSEHOLD SIZE
12,282
LABOR FORCE [ PEOPLE ]
61.2%
PERCENT IN LABOR FORCE
2.6%
UNEMPLOYMENT RATE
Keene Zip Codes
Keene Area Codes
Income in Keene
Income Overview in Keene
Per Capita Income in Keene is $37,968, while median incomes of families and households are $93,196 and $69,381 respectively.
| Characteristic | Number | Measure |
| Per Capita Income | 22,907 | $37,968 |
| Median Family Income | 4,541 | $93,196 |
| Mean Family Income | 4,541 | $112,918 |
| Median Household Income | 9,259 | $69,381 |
| Mean Household Income | 9,259 | $89,121 |
| Income Deficit | 4,541 | $0 |
| Wage / Income Gap (%) | 22,907 | 17.71% |
| Wage / Income Gap ($) | 22,907 | 82.29¢ per $1 |
| Gini / Inequality Index | 22,907 | 0.44 |
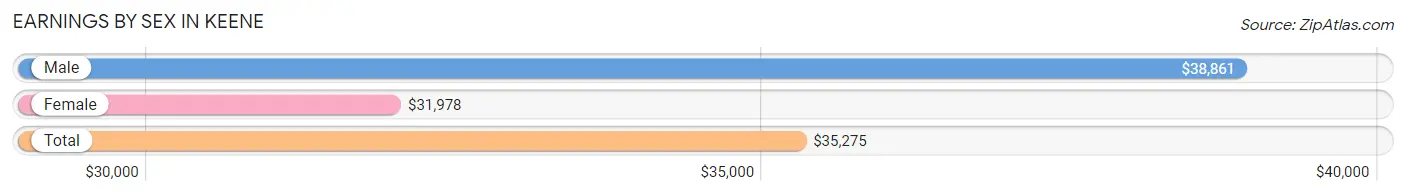
Earnings by Sex in Keene
Average Earnings in Keene are $35,275, $38,861 for men and $31,978 for women, a difference of 17.7%.
| Sex | Number | Average Earnings |
| Male | 7,388 (51.2%) | $38,861 |
| Female | 7,029 (48.7%) | $31,978 |
| Total | 14,417 (100.0%) | $35,275 |
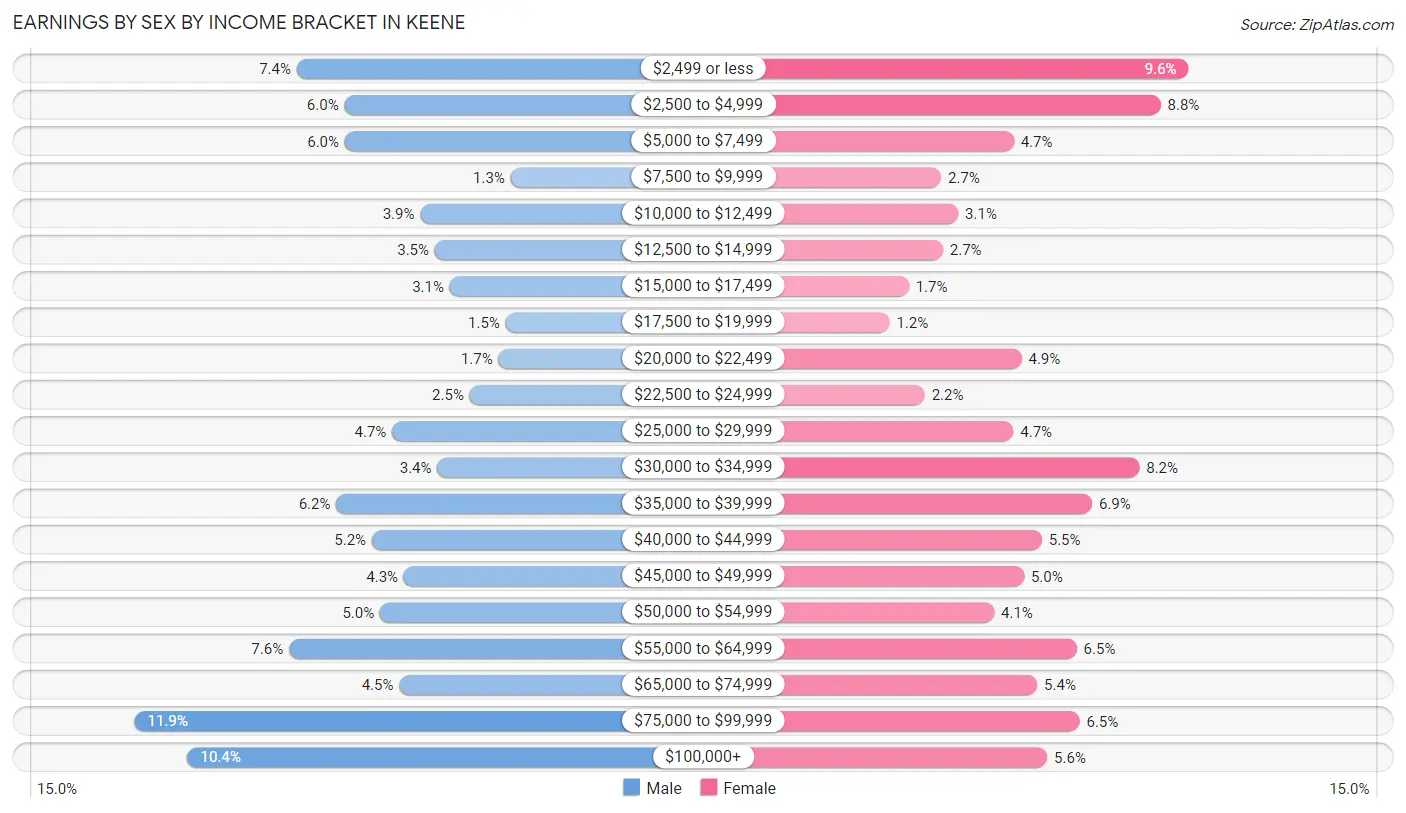
Earnings by Sex by Income Bracket in Keene
The most common earnings brackets in Keene are $75,000 to $99,999 for men (880 | 11.9%) and $2,499 or less for women (675 | 9.6%).
| Income | Male | Female |
| $2,499 or less | 543 (7.3%) | 675 (9.6%) |
| $2,500 to $4,999 | 444 (6.0%) | 620 (8.8%) |
| $5,000 to $7,499 | 443 (6.0%) | 330 (4.7%) |
| $7,500 to $9,999 | 99 (1.3%) | 186 (2.6%) |
| $10,000 to $12,499 | 287 (3.9%) | 220 (3.1%) |
| $12,500 to $14,999 | 256 (3.5%) | 190 (2.7%) |
| $15,000 to $17,499 | 225 (3.0%) | 122 (1.7%) |
| $17,500 to $19,999 | 109 (1.5%) | 84 (1.2%) |
| $20,000 to $22,499 | 124 (1.7%) | 345 (4.9%) |
| $22,500 to $24,999 | 184 (2.5%) | 154 (2.2%) |
| $25,000 to $29,999 | 345 (4.7%) | 329 (4.7%) |
| $30,000 to $34,999 | 251 (3.4%) | 578 (8.2%) |
| $35,000 to $39,999 | 461 (6.2%) | 484 (6.9%) |
| $40,000 to $44,999 | 387 (5.2%) | 385 (5.5%) |
| $45,000 to $49,999 | 321 (4.3%) | 350 (5.0%) |
| $50,000 to $54,999 | 370 (5.0%) | 291 (4.1%) |
| $55,000 to $64,999 | 559 (7.6%) | 454 (6.5%) |
| $65,000 to $74,999 | 330 (4.5%) | 376 (5.3%) |
| $75,000 to $99,999 | 880 (11.9%) | 460 (6.5%) |
| $100,000+ | 770 (10.4%) | 396 (5.6%) |
| Total | 7,388 (100.0%) | 7,029 (100.0%) |
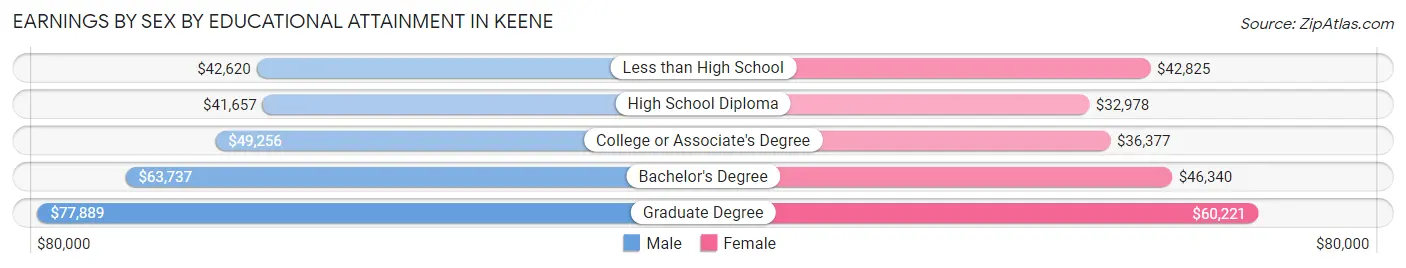
Earnings by Sex by Educational Attainment in Keene
Average earnings in Keene are $51,452 for men and $42,063 for women, a difference of 18.2%. Men with an educational attainment of graduate degree enjoy the highest average annual earnings of $77,889, while those with high school diploma education earn the least with $41,657. Women with an educational attainment of graduate degree earn the most with the average annual earnings of $60,221, while those with high school diploma education have the smallest earnings of $32,978.
| Educational Attainment | Male Income | Female Income |
| Less than High School | $42,620 | $42,825 |
| High School Diploma | $41,657 | $32,978 |
| College or Associate's Degree | $49,256 | $36,377 |
| Bachelor's Degree | $63,737 | $46,340 |
| Graduate Degree | $77,889 | $60,221 |
| Total | $51,452 | $42,063 |
Family Income in Keene
Family Income Brackets in Keene
According to the Keene family income data, there are 1,040 families falling into the $100,000 to $149,999 income range, which is the most common income bracket and makes up 22.9% of all families. Conversely, the $10,000 to $14,999 income bracket is the least frequent group with only 41 families (0.9%) belonging to this category.
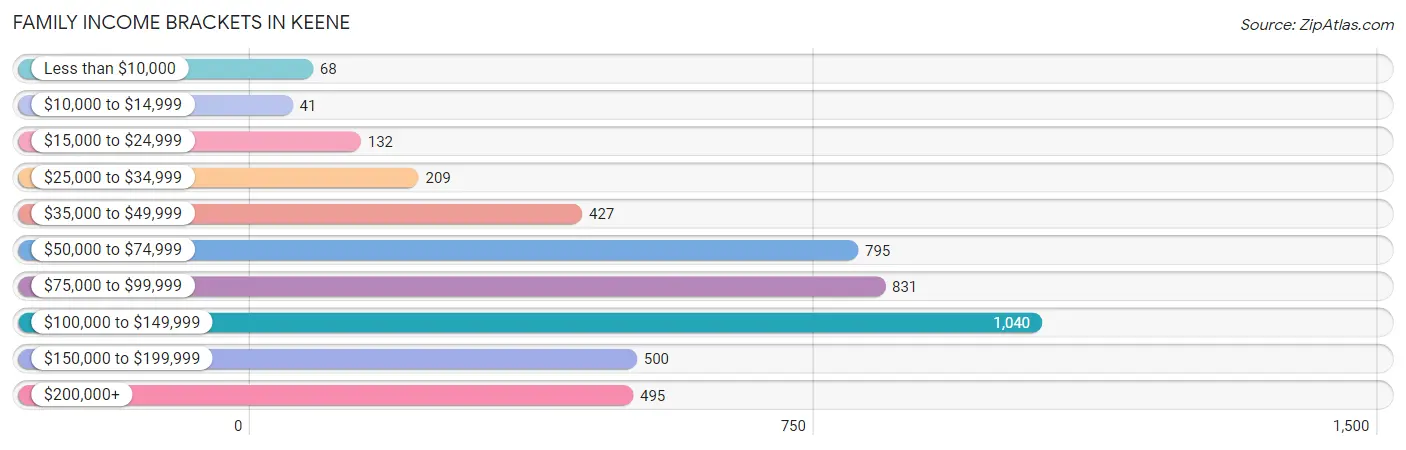
| Income Bracket | # Families | % Families |
| Less than $10,000 | 68 | 1.5% |
| $10,000 to $14,999 | 41 | 0.9% |
| $15,000 to $24,999 | 132 | 2.9% |
| $25,000 to $34,999 | 209 | 4.6% |
| $35,000 to $49,999 | 427 | 9.4% |
| $50,000 to $74,999 | 795 | 17.5% |
| $75,000 to $99,999 | 831 | 18.3% |
| $100,000 to $149,999 | 1,040 | 22.9% |
| $150,000 to $199,999 | 500 | 11.0% |
| $200,000+ | 495 | 10.9% |
Family Income by Famaliy Size in Keene
4-person families (611 | 13.5%) account for the highest median family income in Keene with $136,629 per family, while 2-person families (2,778 | 61.2%) have the highest median income of $40,897 per family member.
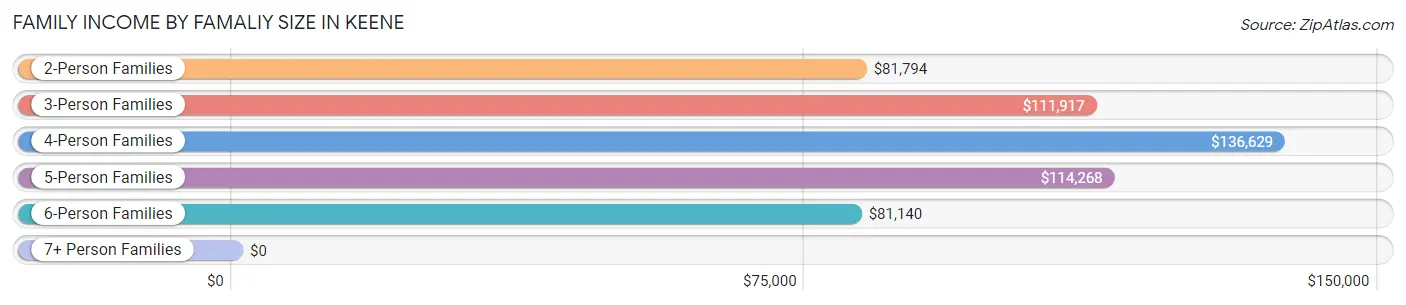
| Income Bracket | # Families | Median Income |
| 2-Person Families | 2,778 (61.2%) | $81,794 |
| 3-Person Families | 871 (19.2%) | $111,917 |
| 4-Person Families | 611 (13.5%) | $136,629 |
| 5-Person Families | 168 (3.7%) | $114,268 |
| 6-Person Families | 106 (2.3%) | $81,140 |
| 7+ Person Families | 7 (0.2%) | $0 |
| Total | 4,541 (100.0%) | $93,196 |
Family Income by Number of Earners in Keene
The median family income in Keene is $93,196, with families comprising 3+ earners (417) having the highest median family income of $136,375, while families with no earners (601) have the lowest median family income of $45,516, accounting for 9.2% and 13.2% of families, respectively.
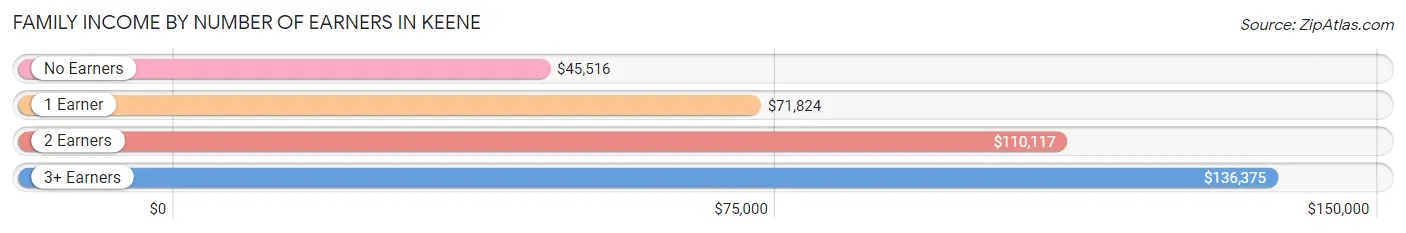
| Number of Earners | # Families | Median Income |
| No Earners | 601 (13.2%) | $45,516 |
| 1 Earner | 1,414 (31.1%) | $71,824 |
| 2 Earners | 2,109 (46.4%) | $110,117 |
| 3+ Earners | 417 (9.2%) | $136,375 |
| Total | 4,541 (100.0%) | $93,196 |
Household Income in Keene
Household Income Brackets in Keene
With 1,685 households falling in the category, the $100,000 to $149,999 income range is the most frequent in Keene, accounting for 18.2% of all households. In contrast, only 222 households (2.4%) fall into the less than $10,000 income bracket, making it the least populous group.
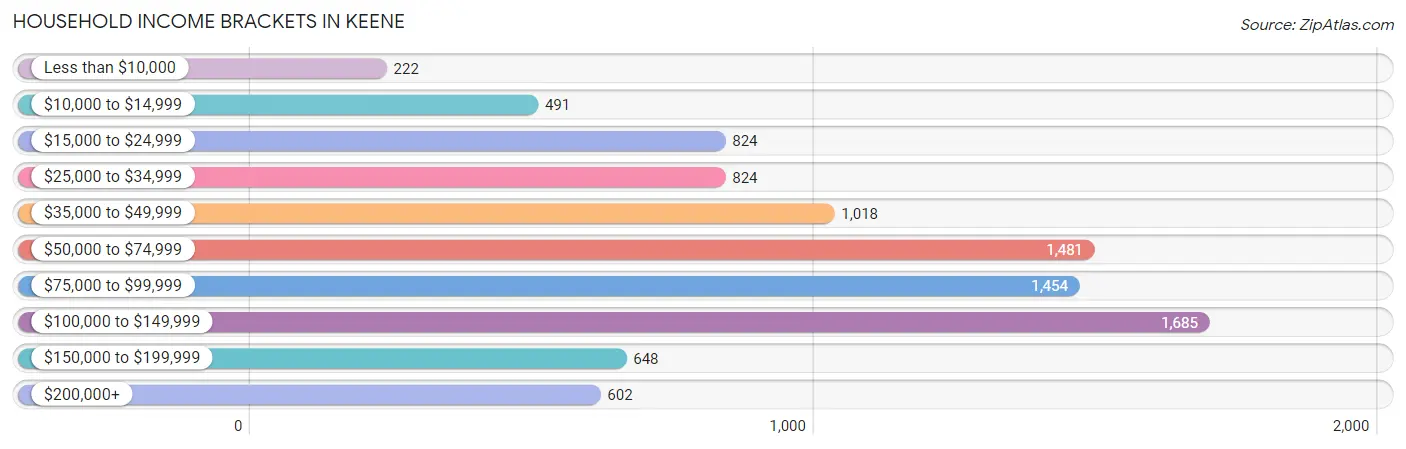
| Income Bracket | # Households | % Households |
| Less than $10,000 | 222 | 2.4% |
| $10,000 to $14,999 | 491 | 5.3% |
| $15,000 to $24,999 | 824 | 8.9% |
| $25,000 to $34,999 | 824 | 8.9% |
| $35,000 to $49,999 | 1,018 | 11.0% |
| $50,000 to $74,999 | 1,481 | 16.0% |
| $75,000 to $99,999 | 1,454 | 15.7% |
| $100,000 to $149,999 | 1,685 | 18.2% |
| $150,000 to $199,999 | 648 | 7.0% |
| $200,000+ | 602 | 6.5% |
Household Income by Householder Age in Keene
The median household income in Keene is $69,381, with the highest median household income of $87,798 found in the 45 to 64 years age bracket for the primary householder. A total of 3,036 households (32.8%) fall into this category. Meanwhile, the 15 to 24 years age bracket for the primary householder has the lowest median household income of $38,571, with 642 households (6.9%) in this group.
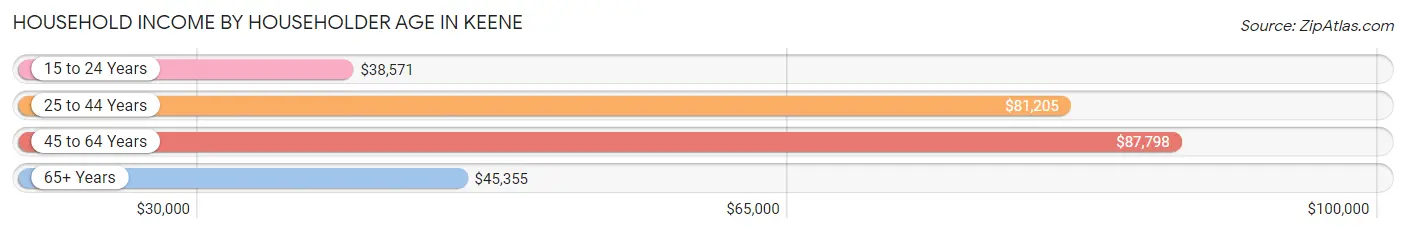
| Income Bracket | # Households | Median Income |
| 15 to 24 Years | 642 (6.9%) | $38,571 |
| 25 to 44 Years | 2,976 (32.1%) | $81,205 |
| 45 to 64 Years | 3,036 (32.8%) | $87,798 |
| 65+ Years | 2,605 (28.1%) | $45,355 |
| Total | 9,259 (100.0%) | $69,381 |
Poverty in Keene
Income Below Poverty by Sex and Age in Keene
With 10.5% poverty level for males and 11.8% for females among the residents of Keene, 18 to 24 year old males and 18 to 24 year old females are the most vulnerable to poverty, with 342 males (25.6%) and 367 females (34.7%) in their respective age groups living below the poverty level.
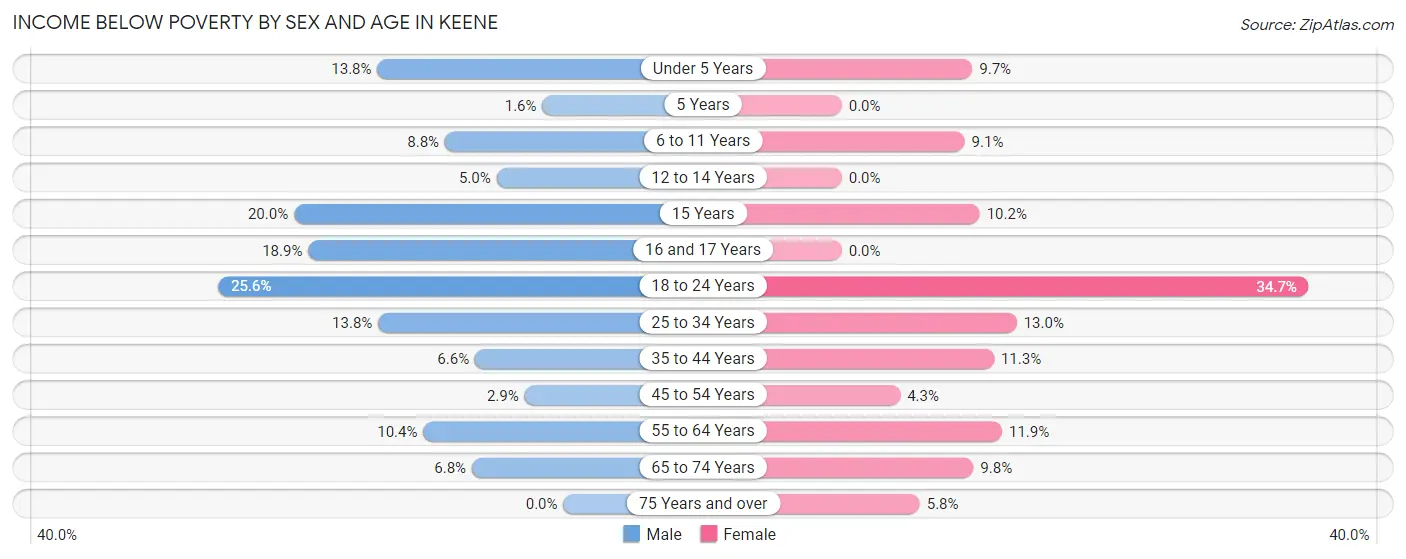
| Age Bracket | Male | Female |
| Under 5 Years | 67 (13.8%) | 37 (9.7%) |
| 5 Years | 1 (1.6%) | 0 (0.0%) |
| 6 to 11 Years | 62 (8.8%) | 29 (9.1%) |
| 12 to 14 Years | 12 (5.0%) | 0 (0.0%) |
| 15 Years | 14 (20.0%) | 13 (10.2%) |
| 16 and 17 Years | 50 (18.9%) | 0 (0.0%) |
| 18 to 24 Years | 342 (25.6%) | 367 (34.7%) |
| 25 to 34 Years | 208 (13.8%) | 229 (13.0%) |
| 35 to 44 Years | 87 (6.6%) | 124 (11.3%) |
| 45 to 54 Years | 38 (2.9%) | 53 (4.3%) |
| 55 to 64 Years | 119 (10.4%) | 163 (11.9%) |
| 65 to 74 Years | 61 (6.8%) | 127 (9.8%) |
| 75 Years and over | 0 (0.0%) | 60 (5.8%) |
| Total | 1,061 (10.5%) | 1,202 (11.8%) |
Income Above Poverty by Sex and Age in Keene
According to the poverty statistics in Keene, males aged 75 years and over and females aged 5 years are the age groups that are most secure financially, with 100.0% of males and 100.0% of females in these age groups living above the poverty line.
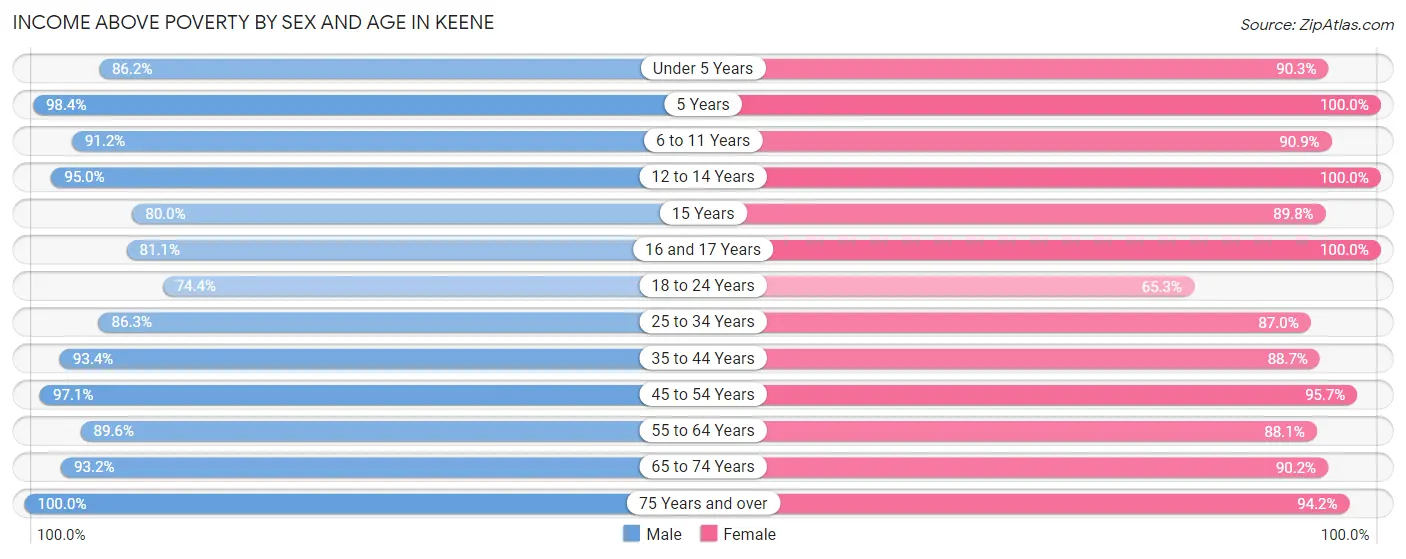
| Age Bracket | Male | Female |
| Under 5 Years | 418 (86.2%) | 345 (90.3%) |
| 5 Years | 63 (98.4%) | 48 (100.0%) |
| 6 to 11 Years | 643 (91.2%) | 289 (90.9%) |
| 12 to 14 Years | 230 (95.0%) | 288 (100.0%) |
| 15 Years | 56 (80.0%) | 114 (89.8%) |
| 16 and 17 Years | 214 (81.1%) | 189 (100.0%) |
| 18 to 24 Years | 992 (74.4%) | 692 (65.3%) |
| 25 to 34 Years | 1,305 (86.3%) | 1,534 (87.0%) |
| 35 to 44 Years | 1,240 (93.4%) | 973 (88.7%) |
| 45 to 54 Years | 1,281 (97.1%) | 1,168 (95.7%) |
| 55 to 64 Years | 1,025 (89.6%) | 1,207 (88.1%) |
| 65 to 74 Years | 838 (93.2%) | 1,173 (90.2%) |
| 75 Years and over | 730 (100.0%) | 977 (94.2%) |
| Total | 9,035 (89.5%) | 8,997 (88.2%) |
Income Below Poverty Among Married-Couple Families in Keene
The poverty statistics for married-couple families in Keene show that 1.4% or 48 of the total 3,393 families live below the poverty line. Families with 1 or 2 children have the highest poverty rate of 3.6%, comprising of 28 families. On the other hand, families with 3 or 4 children have the lowest poverty rate of 0.0%, which includes 0 families.
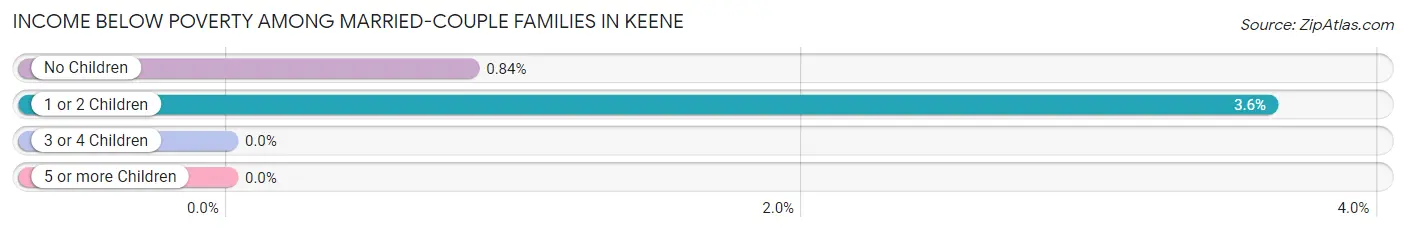
| Children | Above Poverty | Below Poverty |
| No Children | 2,373 (99.2%) | 20 (0.8%) |
| 1 or 2 Children | 746 (96.4%) | 28 (3.6%) |
| 3 or 4 Children | 226 (100.0%) | 0 (0.0%) |
| 5 or more Children | 0 (0.0%) | 0 (0.0%) |
| Total | 3,345 (98.6%) | 48 (1.4%) |
Income Below Poverty Among Single-Parent Households in Keene
According to the poverty data in Keene, 7.8% or 26 single-father households and 12.3% or 100 single-mother households are living below the poverty line. Among single-father households, those with 1 or 2 children have the highest poverty rate, with 26 households (9.7%) experiencing poverty. Likewise, among single-mother households, those with 3 or 4 children have the highest poverty rate, with 27 households (42.2%) falling below the poverty line.
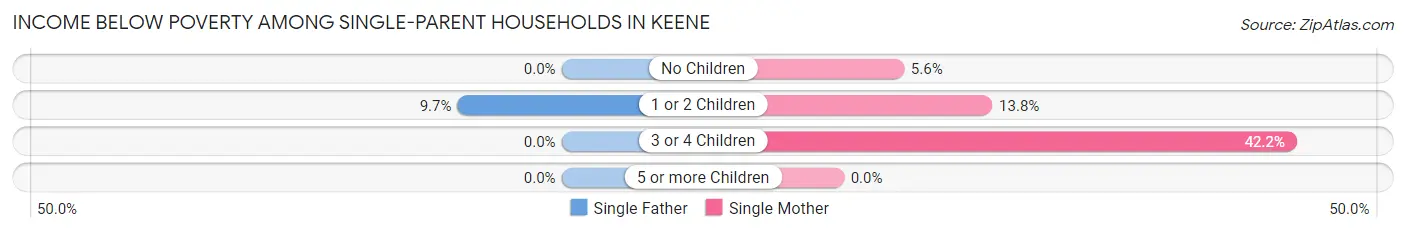
| Children | Single Father | Single Mother |
| No Children | 0 (0.0%) | 21 (5.6%) |
| 1 or 2 Children | 26 (9.7%) | 52 (13.8%) |
| 3 or 4 Children | 0 (0.0%) | 27 (42.2%) |
| 5 or more Children | 0 (0.0%) | 0 (0.0%) |
| Total | 26 (7.8%) | 100 (12.3%) |
Income Below Poverty Among Married-Couple vs Single-Parent Households in Keene
The poverty data for Keene shows that 48 of the married-couple family households (1.4%) and 126 of the single-parent households (11.0%) are living below the poverty level. Within the married-couple family households, those with 1 or 2 children have the highest poverty rate, with 28 households (3.6%) falling below the poverty line. Among the single-parent households, those with 3 or 4 children have the highest poverty rate, with 27 household (42.2%) living below poverty.
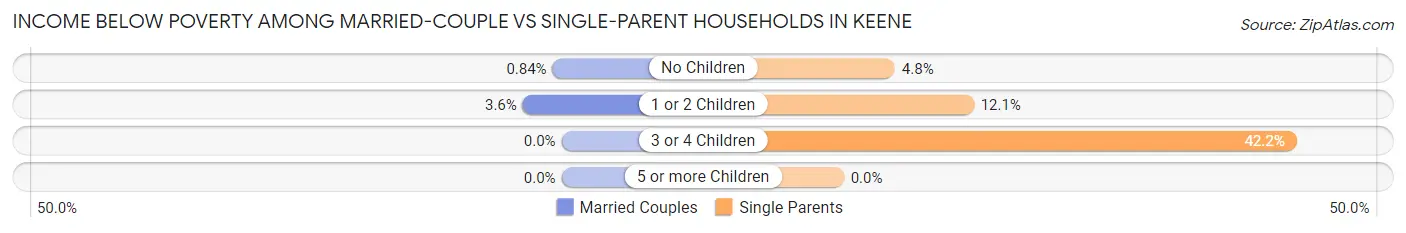
| Children | Married-Couple Families | Single-Parent Households |
| No Children | 20 (0.8%) | 21 (4.8%) |
| 1 or 2 Children | 28 (3.6%) | 78 (12.1%) |
| 3 or 4 Children | 0 (0.0%) | 27 (42.2%) |
| 5 or more Children | 0 (0.0%) | 0 (0.0%) |
| Total | 48 (1.4%) | 126 (11.0%) |
Race in Keene
The most populous races in Keene are White / Caucasian (21,280 | 92.9%), Two or more Races (1,079 | 4.7%), and Hispanic or Latino (524 | 2.3%).
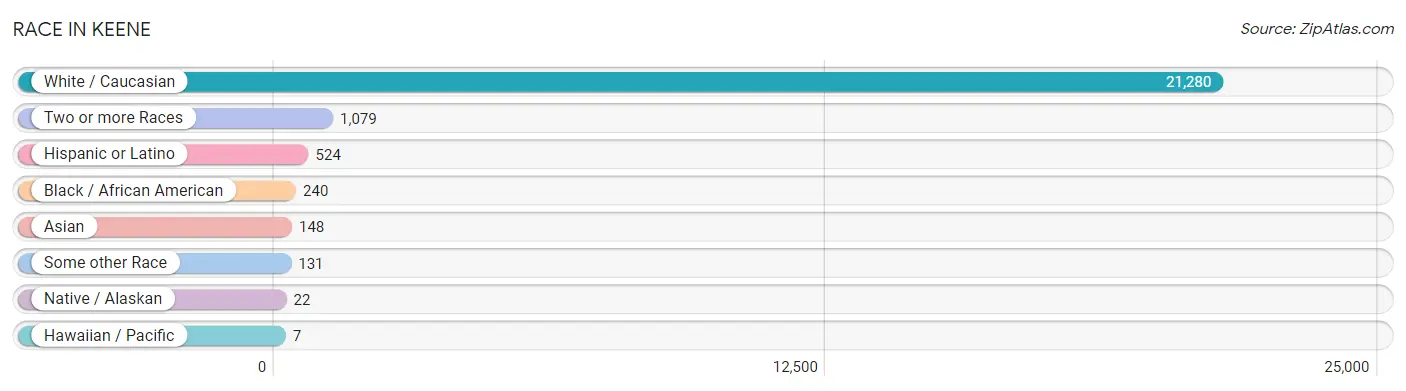
| Race | # Population | % Population |
| Asian | 148 | 0.6% |
| Black / African American | 240 | 1.1% |
| Hawaiian / Pacific | 7 | 0.0% |
| Hispanic or Latino | 524 | 2.3% |
| Native / Alaskan | 22 | 0.1% |
| White / Caucasian | 21,280 | 92.9% |
| Two or more Races | 1,079 | 4.7% |
| Some other Race | 131 | 0.6% |
| Total | 22,907 | 100.0% |
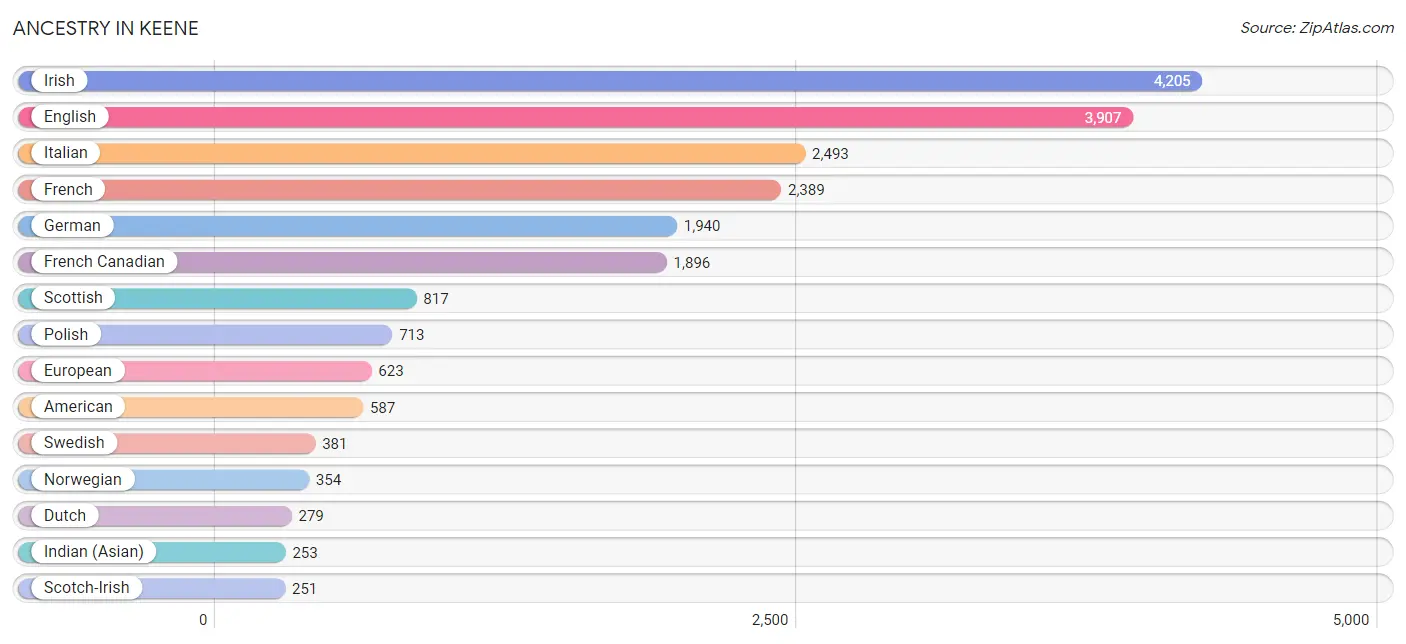
Ancestry in Keene
The most populous ancestries reported in Keene are Irish (4,205 | 18.4%), English (3,907 | 17.1%), Italian (2,493 | 10.9%), French (2,389 | 10.4%), and German (1,940 | 8.5%), together accounting for 65.2% of all Keene residents.
| Ancestry | # Population | % Population |
| African | 167 | 0.7% |
| Alaska Native | 33 | 0.1% |
| Albanian | 23 | 0.1% |
| American | 587 | 2.6% |
| Apache | 7 | 0.0% |
| Arab | 113 | 0.5% |
| Armenian | 82 | 0.4% |
| Austrian | 78 | 0.3% |
| Belgian | 25 | 0.1% |
| Bhutanese | 13 | 0.1% |
| Blackfeet | 3 | 0.0% |
| British | 152 | 0.7% |
| Bulgarian | 9 | 0.0% |
| Burmese | 56 | 0.2% |
| Canadian | 124 | 0.5% |
| Celtic | 5 | 0.0% |
| Central American | 20 | 0.1% |
| Cherokee | 38 | 0.2% |
| Choctaw | 22 | 0.1% |
| Colombian | 7 | 0.0% |
| Costa Rican | 15 | 0.1% |
| Creek | 6 | 0.0% |
| Croatian | 56 | 0.2% |
| Czech | 64 | 0.3% |
| Danish | 70 | 0.3% |
| Dominican | 51 | 0.2% |
| Dutch | 279 | 1.2% |
| Eastern European | 80 | 0.4% |
| Ecuadorian | 16 | 0.1% |
| English | 3,907 | 17.1% |
| Ethiopian | 30 | 0.1% |
| European | 623 | 2.7% |
| Finnish | 132 | 0.6% |
| French | 2,389 | 10.4% |
| French Canadian | 1,896 | 8.3% |
| German | 1,940 | 8.5% |
| Greek | 59 | 0.3% |
| Honduran | 5 | 0.0% |
| Hungarian | 95 | 0.4% |
| Indian (Asian) | 253 | 1.1% |
| Irish | 4,205 | 18.4% |
| Italian | 2,493 | 10.9% |
| Kenyan | 29 | 0.1% |
| Korean | 45 | 0.2% |
| Lebanese | 113 | 0.5% |
| Lithuanian | 95 | 0.4% |
| Malaysian | 10 | 0.0% |
| Mexican | 16 | 0.1% |
| Native Hawaiian | 23 | 0.1% |
| Nigerian | 38 | 0.2% |
| Norwegian | 354 | 1.5% |
| Pennsylvania German | 5 | 0.0% |
| Peruvian | 88 | 0.4% |
| Polish | 713 | 3.1% |
| Portuguese | 170 | 0.7% |
| Puerto Rican | 250 | 1.1% |
| Romanian | 10 | 0.0% |
| Russian | 219 | 1.0% |
| Scandinavian | 30 | 0.1% |
| Scotch-Irish | 251 | 1.1% |
| Scottish | 817 | 3.6% |
| Slavic | 14 | 0.1% |
| Slovak | 31 | 0.1% |
| South American | 115 | 0.5% |
| Spaniard | 57 | 0.3% |
| Spanish | 9 | 0.0% |
| Subsaharan African | 227 | 1.0% |
| Swedish | 381 | 1.7% |
| Swiss | 30 | 0.1% |
| Thai | 50 | 0.2% |
| Turkish | 6 | 0.0% |
| Ukrainian | 52 | 0.2% |
| Uruguayan | 4 | 0.0% |
| Welsh | 59 | 0.3% |
| West Indian | 19 | 0.1% |
| Yuman | 32 | 0.1% | View All 76 Rows |
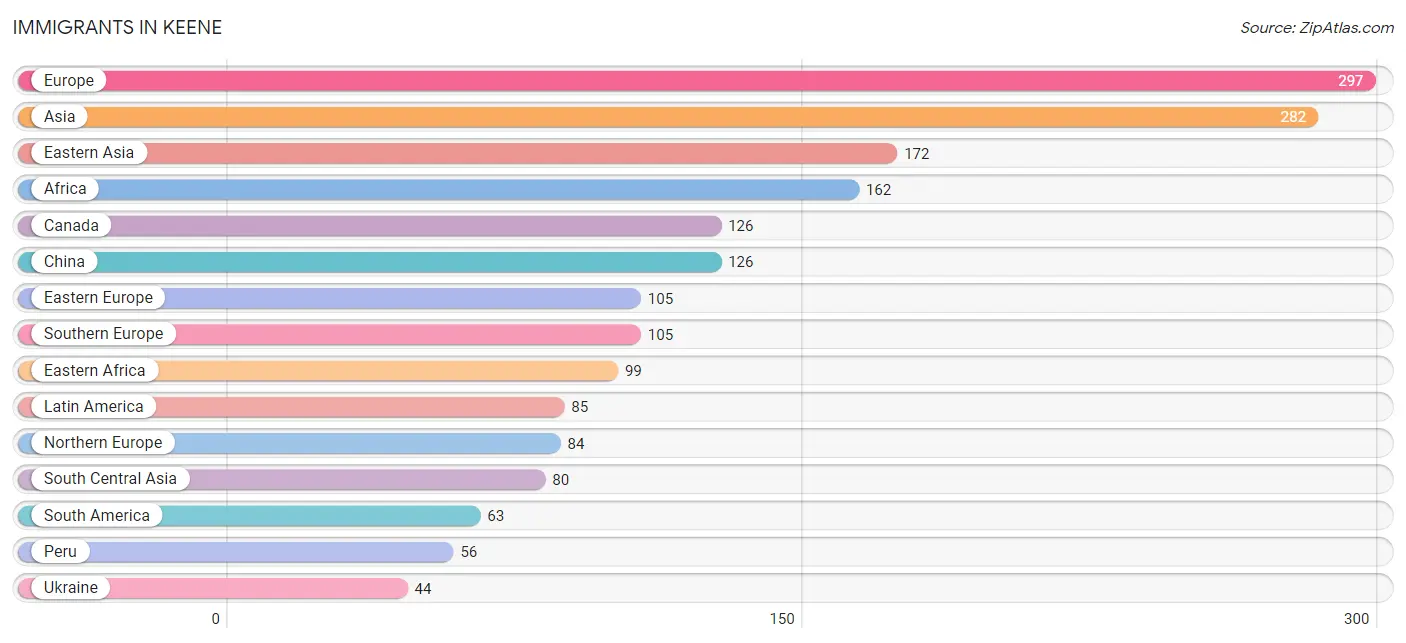
Immigrants in Keene
The most numerous immigrant groups reported in Keene came from Europe (297 | 1.3%), Asia (282 | 1.2%), Eastern Asia (172 | 0.7%), Africa (162 | 0.7%), and Canada (126 | 0.5%), together accounting for 4.5% of all Keene residents.
| Immigration Origin | # Population | % Population |
| Africa | 162 | 0.7% |
| Asia | 282 | 1.2% |
| Bulgaria | 9 | 0.0% |
| Canada | 126 | 0.5% |
| Caribbean | 6 | 0.0% |
| Central America | 16 | 0.1% |
| China | 126 | 0.5% |
| Colombia | 7 | 0.0% |
| Dominican Republic | 6 | 0.0% |
| Eastern Africa | 99 | 0.4% |
| Eastern Asia | 172 | 0.7% |
| Eastern Europe | 105 | 0.5% |
| England | 38 | 0.2% |
| Ethiopia | 30 | 0.1% |
| Europe | 297 | 1.3% |
| Germany | 3 | 0.0% |
| Greece | 32 | 0.1% |
| Hungary | 34 | 0.2% |
| India | 40 | 0.2% |
| Italy | 42 | 0.2% |
| Japan | 18 | 0.1% |
| Kenya | 29 | 0.1% |
| Korea | 28 | 0.1% |
| Latin America | 85 | 0.4% |
| Mexico | 16 | 0.1% |
| Middle Africa | 25 | 0.1% |
| Nigeria | 38 | 0.2% |
| Northern Europe | 84 | 0.4% |
| Peru | 56 | 0.2% |
| Philippines | 30 | 0.1% |
| Romania | 10 | 0.0% |
| Russia | 8 | 0.0% |
| Scotland | 21 | 0.1% |
| South America | 63 | 0.3% |
| South Central Asia | 80 | 0.4% |
| South Eastern Asia | 30 | 0.1% |
| Southern Europe | 105 | 0.5% |
| Spain | 31 | 0.1% |
| Taiwan | 14 | 0.1% |
| Ukraine | 44 | 0.2% |
| Western Africa | 38 | 0.2% |
| Western Europe | 3 | 0.0% |
| Zaire | 25 | 0.1% |
| Zimbabwe | 40 | 0.2% | View All 44 Rows |
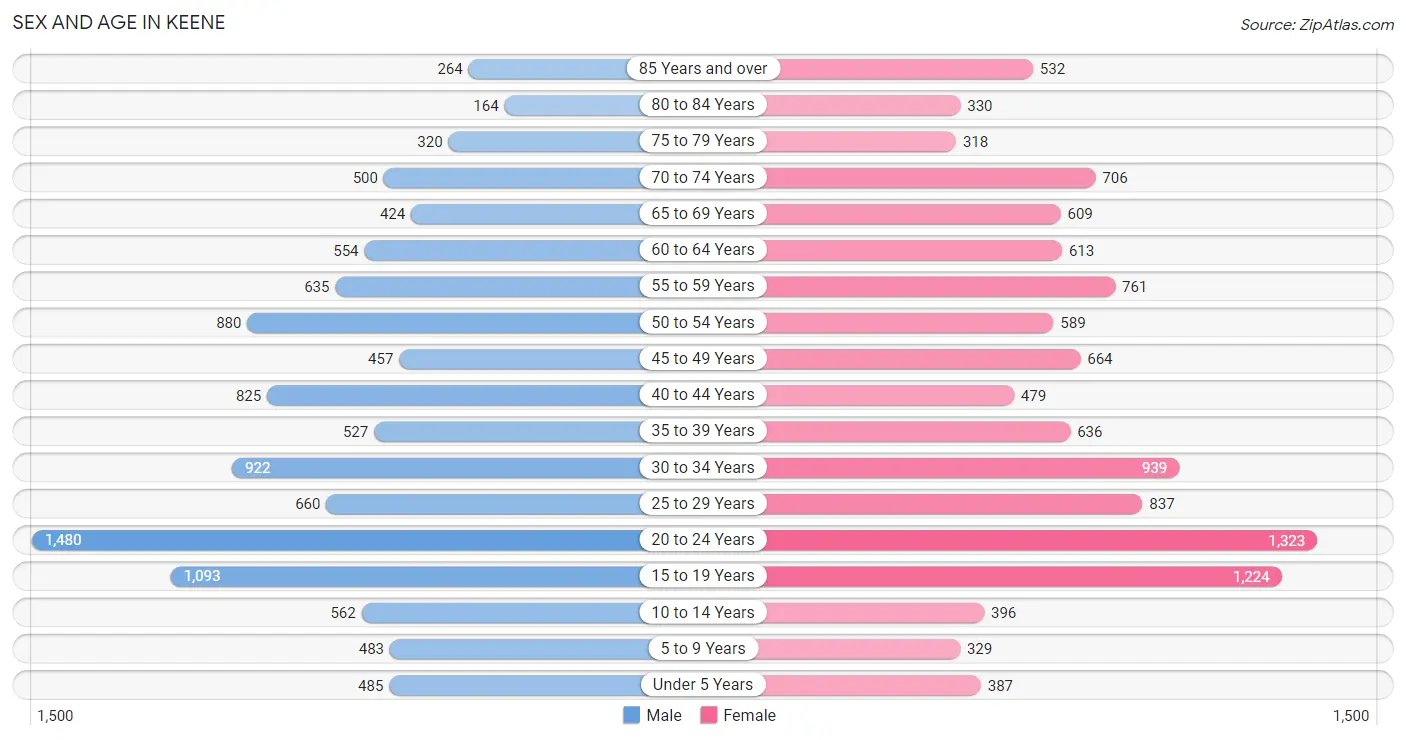
Sex and Age in Keene
Sex and Age in Keene
The most populous age groups in Keene are 20 to 24 Years (1,480 | 13.2%) for men and 20 to 24 Years (1,323 | 11.3%) for women.
| Age Bracket | Male | Female |
| Under 5 Years | 485 (4.3%) | 387 (3.3%) |
| 5 to 9 Years | 483 (4.3%) | 329 (2.8%) |
| 10 to 14 Years | 562 (5.0%) | 396 (3.4%) |
| 15 to 19 Years | 1,093 (9.7%) | 1,224 (10.5%) |
| 20 to 24 Years | 1,480 (13.2%) | 1,323 (11.3%) |
| 25 to 29 Years | 660 (5.9%) | 837 (7.2%) |
| 30 to 34 Years | 922 (8.2%) | 939 (8.0%) |
| 35 to 39 Years | 527 (4.7%) | 636 (5.4%) |
| 40 to 44 Years | 825 (7.3%) | 479 (4.1%) |
| 45 to 49 Years | 457 (4.1%) | 664 (5.7%) |
| 50 to 54 Years | 880 (7.8%) | 589 (5.1%) |
| 55 to 59 Years | 635 (5.7%) | 761 (6.5%) |
| 60 to 64 Years | 554 (4.9%) | 613 (5.2%) |
| 65 to 69 Years | 424 (3.8%) | 609 (5.2%) |
| 70 to 74 Years | 500 (4.4%) | 706 (6.0%) |
| 75 to 79 Years | 320 (2.9%) | 318 (2.7%) |
| 80 to 84 Years | 164 (1.5%) | 330 (2.8%) |
| 85 Years and over | 264 (2.4%) | 532 (4.6%) |
| Total | 11,235 (100.0%) | 11,672 (100.0%) |
Families and Households in Keene
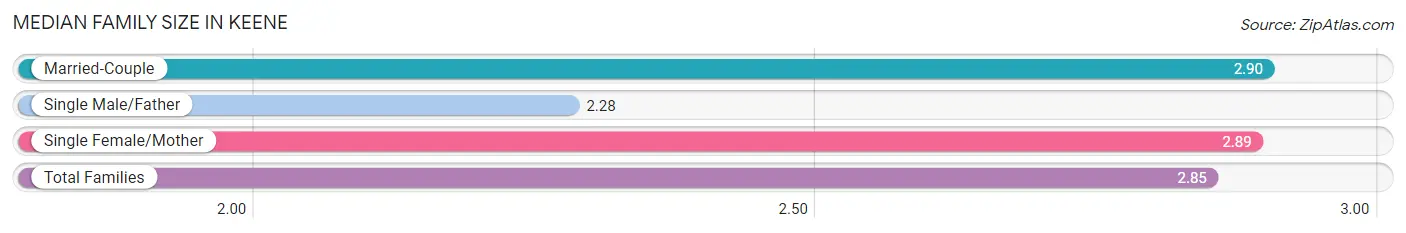
Median Family Size in Keene
The median family size in Keene is 2.85 persons per family, with married-couple families (3,393 | 74.7%) accounting for the largest median family size of 2.9 persons per family. On the other hand, single male/father families (334 | 7.4%) represent the smallest median family size with 2.28 persons per family.
| Family Type | # Families | Family Size |
| Married-Couple | 3,393 (74.7%) | 2.90 |
| Single Male/Father | 334 (7.4%) | 2.28 |
| Single Female/Mother | 814 (17.9%) | 2.89 |
| Total Families | 4,541 (100.0%) | 2.85 |
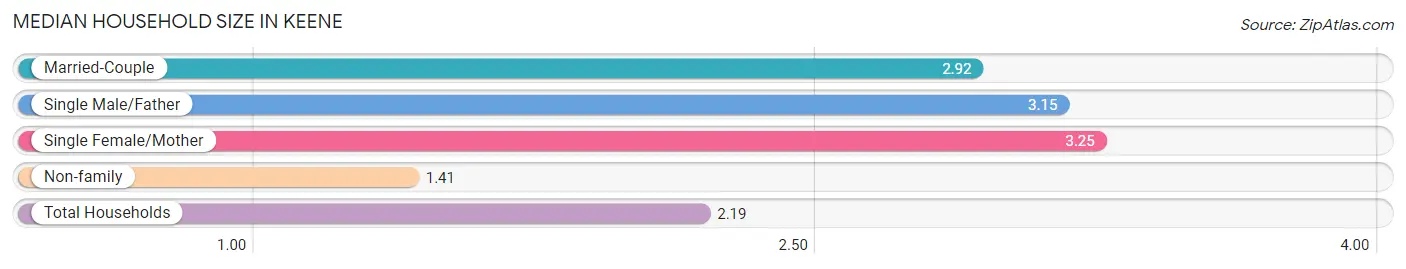
Median Household Size in Keene
The median household size in Keene is 2.19 persons per household, with single female/mother households (814 | 8.8%) accounting for the largest median household size of 3.25 persons per household. non-family households (4,718 | 51.0%) represent the smallest median household size with 1.41 persons per household.
| Household Type | # Households | Household Size |
| Married-Couple | 3,393 (36.6%) | 2.92 |
| Single Male/Father | 334 (3.6%) | 3.15 |
| Single Female/Mother | 814 (8.8%) | 3.25 |
| Non-family | 4,718 (51.0%) | 1.41 |
| Total Households | 9,259 (100.0%) | 2.19 |
Household Size by Marriage Status in Keene
Out of a total of 9,259 households in Keene, 4,541 (49.0%) are family households, while 4,718 (51.0%) are nonfamily households. The most numerous type of family households are 2-person households, comprising 2,493, and the most common type of nonfamily households are 1-person households, comprising 3,651.
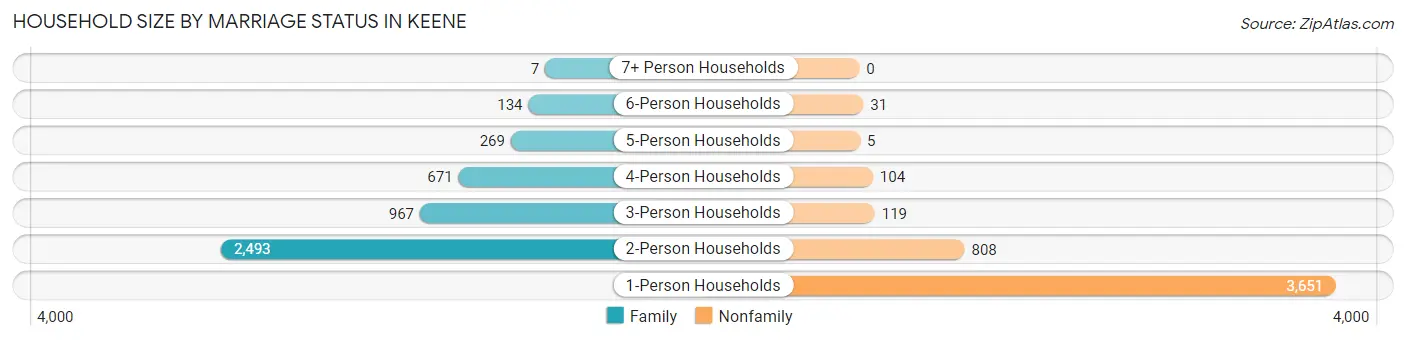
| Household Size | Family Households | Nonfamily Households |
| 1-Person Households | - | 3,651 (39.4%) |
| 2-Person Households | 2,493 (26.9%) | 808 (8.7%) |
| 3-Person Households | 967 (10.4%) | 119 (1.3%) |
| 4-Person Households | 671 (7.2%) | 104 (1.1%) |
| 5-Person Households | 269 (2.9%) | 5 (0.1%) |
| 6-Person Households | 134 (1.5%) | 31 (0.3%) |
| 7+ Person Households | 7 (0.1%) | 0 (0.0%) |
| Total | 4,541 (49.0%) | 4,718 (51.0%) |
Female Fertility in Keene
Fertility by Age in Keene
Average fertility rate in Keene is 25.0 births per 1,000 women. Women in the age bracket of 35 to 50 years have the highest fertility rate with 40.0 births per 1,000 women. Women in the age bracket of 20 to 34 years acount for 52.2% of all women with births.
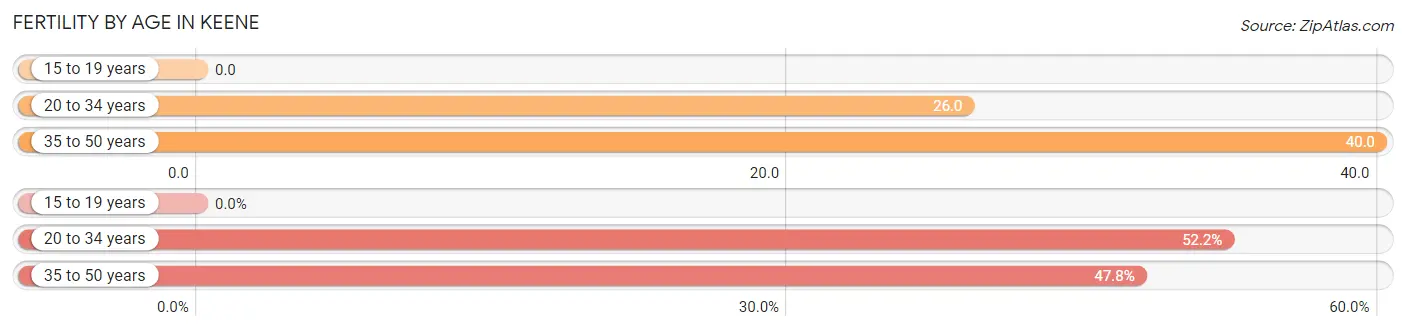
| Age Bracket | Women with Births | Births / 1,000 Women |
| 15 to 19 years | 0 (0.0%) | 0.0 |
| 20 to 34 years | 82 (52.2%) | 26.0 |
| 35 to 50 years | 75 (47.8%) | 40.0 |
| Total | 157 (100.0%) | 25.0 |
Fertility by Age by Marriage Status in Keene
84.7% of women with births (157) in Keene are married. The highest percentage of unmarried women with births falls into 20 to 34 years age bracket with 29.3% of them unmarried at the time of birth, while the lowest percentage of unmarried women with births belong to 35 to 50 years age bracket with 0.0% of them unmarried.
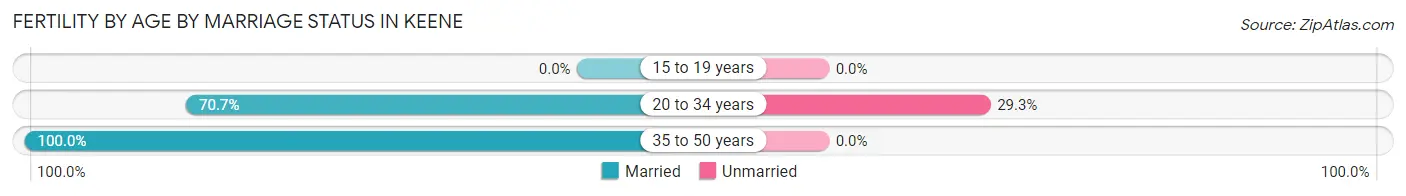
| Age Bracket | Married | Unmarried |
| 15 to 19 years | 0 (0.0%) | 0 (0.0%) |
| 20 to 34 years | 58 (70.7%) | 24 (29.3%) |
| 35 to 50 years | 75 (100.0%) | 0 (0.0%) |
| Total | 133 (84.7%) | 24 (15.3%) |
Fertility by Education in Keene
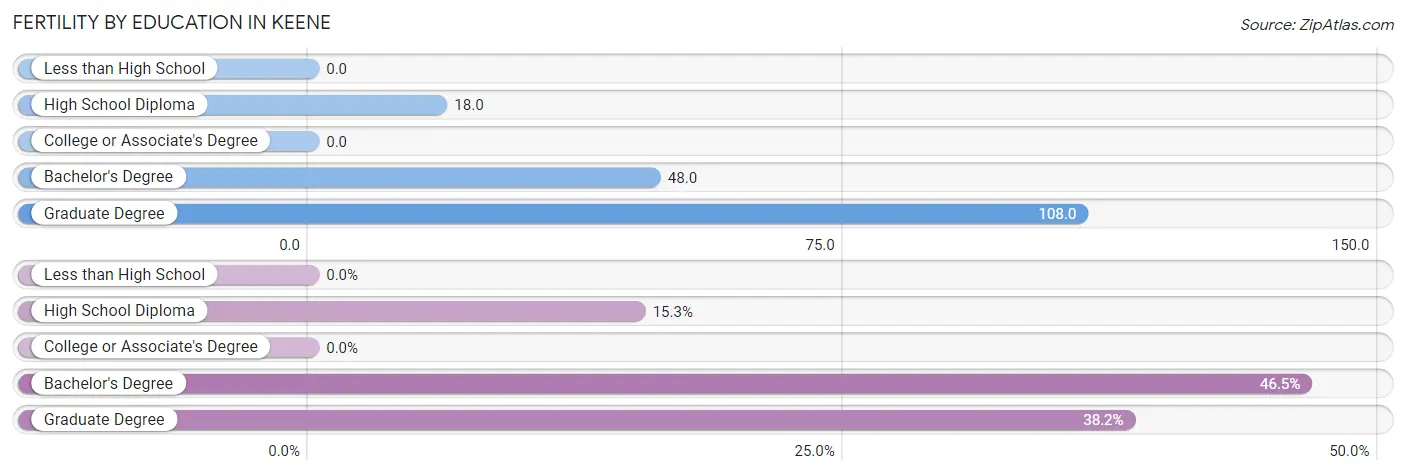
| Educational Attainment | Women with Births | Births / 1,000 Women |
| Less than High School | 0 (0.0%) | 0.0 |
| High School Diploma | 24 (15.3%) | 18.0 |
| College or Associate's Degree | 0 (0.0%) | 0.0 |
| Bachelor's Degree | 73 (46.5%) | 48.0 |
| Graduate Degree | 60 (38.2%) | 108.0 |
| Total | 157 (100.0%) | 25.0 |
Fertility by Education by Marriage Status in Keene
15.3% of women with births in Keene are unmarried. Women with the educational attainment of graduate degree are most likely to be married with 100.0% of them married at childbirth, while women with the educational attainment of high school diploma are least likely to be married with 29.2% of them unmarried at childbirth.
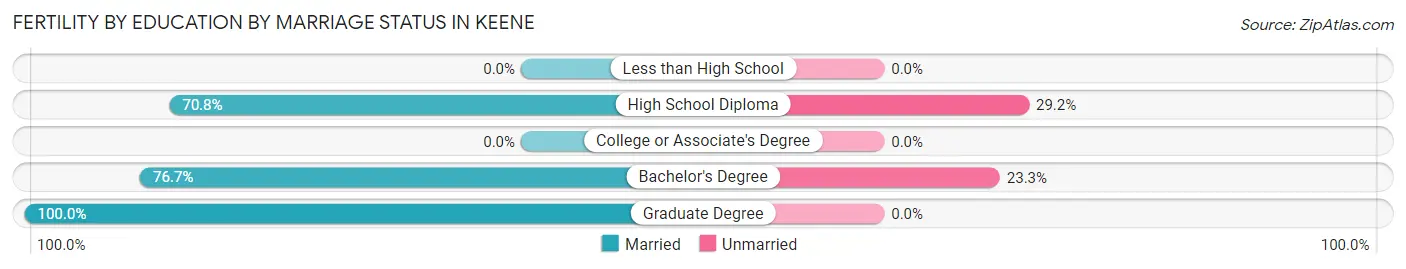
| Educational Attainment | Married | Unmarried |
| Less than High School | 0 (0.0%) | 0 (0.0%) |
| High School Diploma | 17 (70.8%) | 7 (29.2%) |
| College or Associate's Degree | 0 (0.0%) | 0 (0.0%) |
| Bachelor's Degree | 56 (76.7%) | 17 (23.3%) |
| Graduate Degree | 60 (100.0%) | 0 (0.0%) |
| Total | 133 (84.7%) | 24 (15.3%) |
Employment Characteristics in Keene
Employment by Class of Employer in Keene
Among the 11,667 employed individuals in Keene, private company employees (7,255 | 62.2%), not-for-profit organizations (1,374 | 11.8%), and local government employees (1,077 | 9.2%) make up the most common classes of employment.
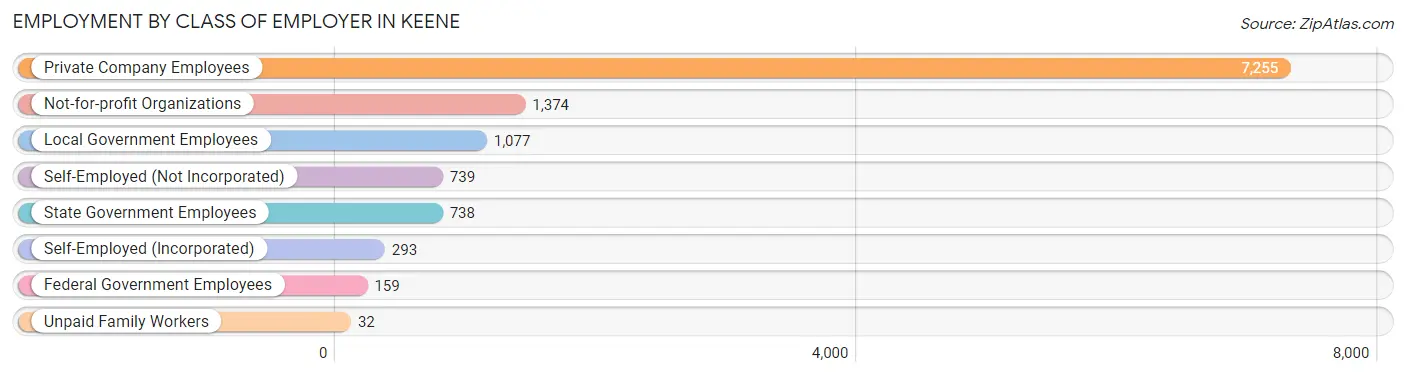
| Employer Class | # Employees | % Employees |
| Private Company Employees | 7,255 | 62.2% |
| Self-Employed (Incorporated) | 293 | 2.5% |
| Self-Employed (Not Incorporated) | 739 | 6.3% |
| Not-for-profit Organizations | 1,374 | 11.8% |
| Local Government Employees | 1,077 | 9.2% |
| State Government Employees | 738 | 6.3% |
| Federal Government Employees | 159 | 1.4% |
| Unpaid Family Workers | 32 | 0.3% |
| Total | 11,667 | 100.0% |
Employment Status by Age in Keene
According to the labor force statistics for Keene, out of the total population over 16 years of age (20,068), 61.2% or 12,282 individuals are in the labor force, with 2.6% or 319 of them unemployed. The age group with the highest labor force participation rate is 25 to 29 years, with 90.2% or 1,350 individuals in the labor force. Within the labor force, the 25 to 29 years age range has the highest percentage of unemployed individuals, with 6.1% or 82 of them being unemployed.
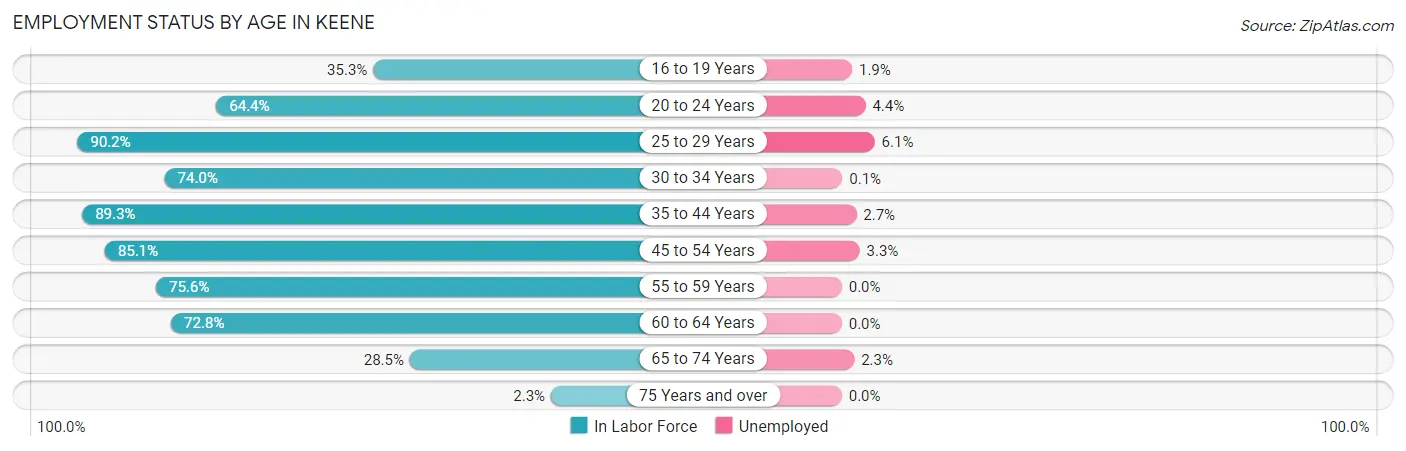
| Age Bracket | In Labor Force | Unemployed |
| 16 to 19 Years | 748 (35.3%) | 14 (1.9%) |
| 20 to 24 Years | 1,805 (64.4%) | 79 (4.4%) |
| 25 to 29 Years | 1,350 (90.2%) | 82 (6.1%) |
| 30 to 34 Years | 1,377 (74.0%) | 1 (0.1%) |
| 35 to 44 Years | 2,203 (89.3%) | 59 (2.7%) |
| 45 to 54 Years | 2,204 (85.1%) | 73 (3.3%) |
| 55 to 59 Years | 1,055 (75.6%) | 0 (0.0%) |
| 60 to 64 Years | 850 (72.8%) | 0 (0.0%) |
| 65 to 74 Years | 638 (28.5%) | 15 (2.3%) |
| 75 Years and over | 44 (2.3%) | 0 (0.0%) |
| Total | 12,282 (61.2%) | 319 (2.6%) |
Employment Status by Educational Attainment in Keene
According to labor force statistics for Keene, 82.4% of individuals (9,046) out of the total population between 25 and 64 years of age (10,978) are in the labor force, with 2.4% or 217 of them being unemployed. The group with the highest labor force participation rate are those with the educational attainment of bachelor's degree or higher, with 91.0% or 4,449 individuals in the labor force. Within the labor force, individuals with high school diploma education have the highest percentage of unemployment, with 7.5% or 145 of them being unemployed.
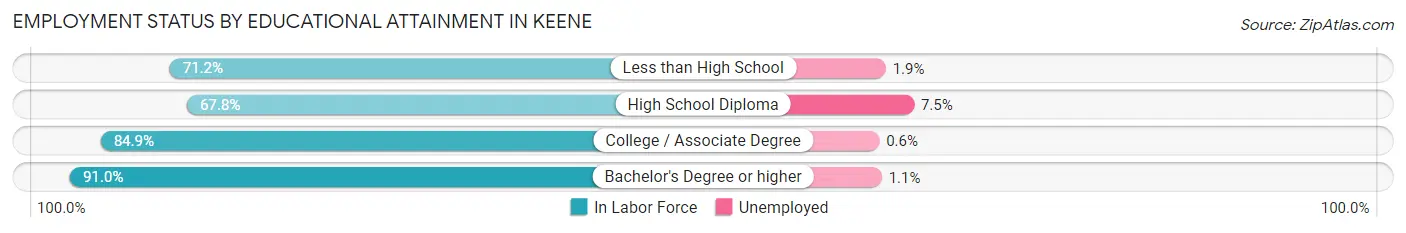
| Educational Attainment | In Labor Force | Unemployed |
| Less than High School | 464 (71.2%) | 12 (1.9%) |
| High School Diploma | 1,934 (67.8%) | 214 (7.5%) |
| College / Associate Degree | 2,194 (84.9%) | 16 (0.6%) |
| Bachelor's Degree or higher | 4,449 (91.0%) | 54 (1.1%) |
| Total | 9,046 (82.4%) | 263 (2.4%) |
Employment Occupations by Sex in Keene
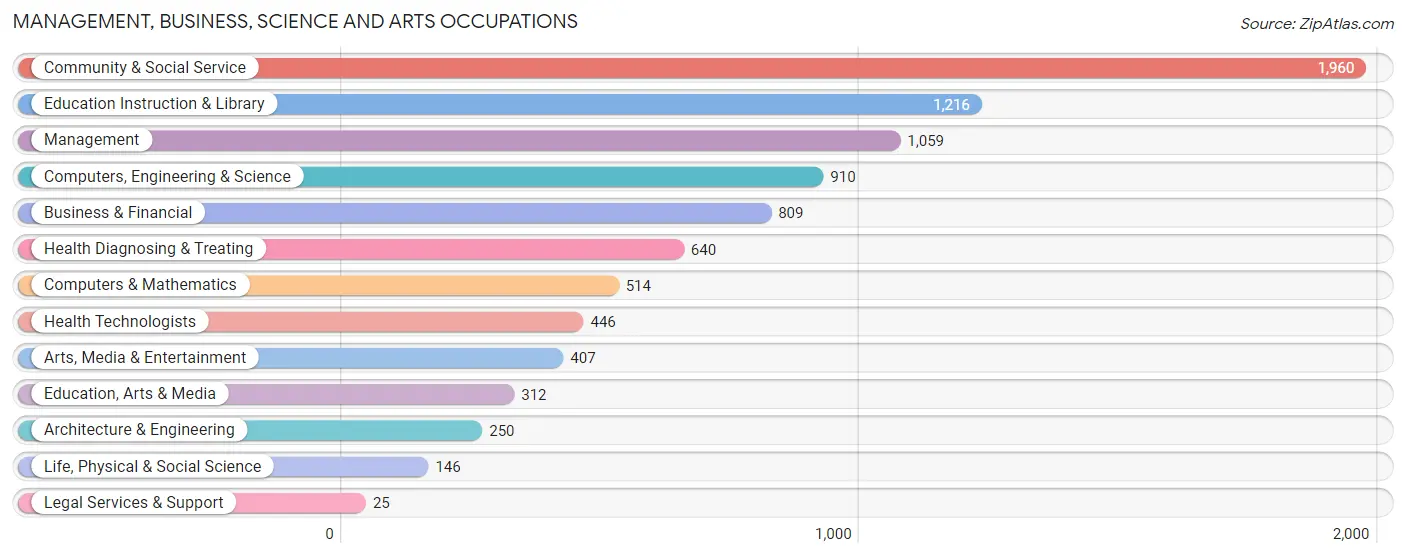
Management, Business, Science and Arts Occupations
The most common Management, Business, Science and Arts occupations in Keene are Community & Social Service (1,960 | 16.4%), Education Instruction & Library (1,216 | 10.2%), Management (1,059 | 8.9%), Computers, Engineering & Science (910 | 7.6%), and Business & Financial (809 | 6.8%).
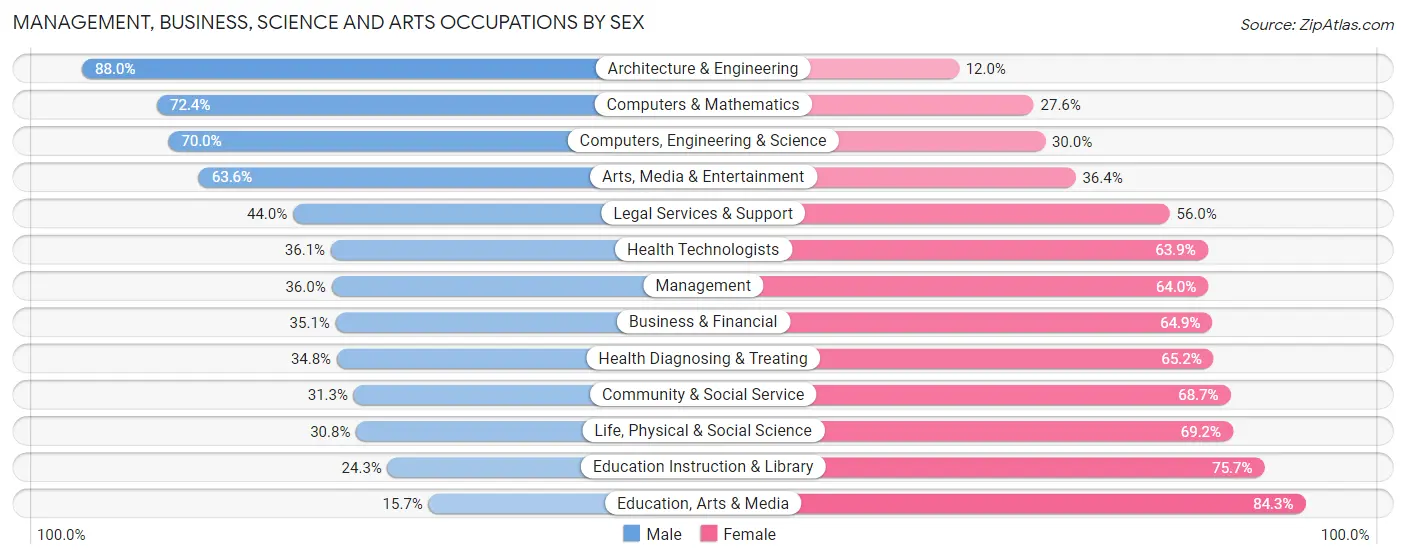
Management, Business, Science and Arts Occupations by Sex
Within the Management, Business, Science and Arts occupations in Keene, the most male-oriented occupations are Architecture & Engineering (88.0%), Computers & Mathematics (72.4%), and Computers, Engineering & Science (70.0%), while the most female-oriented occupations are Education, Arts & Media (84.3%), Education Instruction & Library (75.7%), and Life, Physical & Social Science (69.2%).
| Occupation | Male | Female |
| Management | 381 (36.0%) | 678 (64.0%) |
| Business & Financial | 284 (35.1%) | 525 (64.9%) |
| Computers, Engineering & Science | 637 (70.0%) | 273 (30.0%) |
| Computers & Mathematics | 372 (72.4%) | 142 (27.6%) |
| Architecture & Engineering | 220 (88.0%) | 30 (12.0%) |
| Life, Physical & Social Science | 45 (30.8%) | 101 (69.2%) |
| Community & Social Service | 614 (31.3%) | 1,346 (68.7%) |
| Education, Arts & Media | 49 (15.7%) | 263 (84.3%) |
| Legal Services & Support | 11 (44.0%) | 14 (56.0%) |
| Education Instruction & Library | 295 (24.3%) | 921 (75.7%) |
| Arts, Media & Entertainment | 259 (63.6%) | 148 (36.4%) |
| Health Diagnosing & Treating | 223 (34.8%) | 417 (65.2%) |
| Health Technologists | 161 (36.1%) | 285 (63.9%) |
| Total (Category) | 2,139 (39.8%) | 3,239 (60.2%) |
| Total (Overall) | 5,989 (50.2%) | 5,934 (49.8%) |
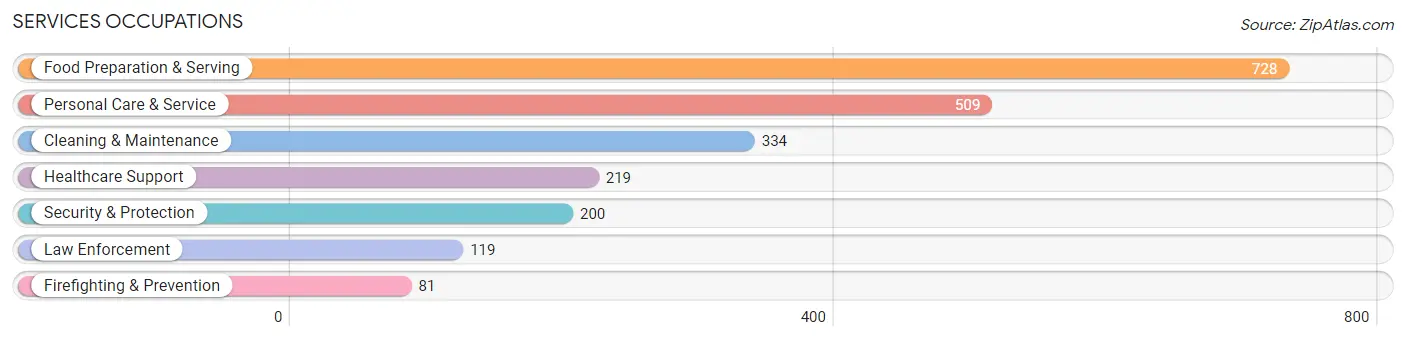
Services Occupations
The most common Services occupations in Keene are Food Preparation & Serving (728 | 6.1%), Personal Care & Service (509 | 4.3%), Cleaning & Maintenance (334 | 2.8%), Healthcare Support (219 | 1.8%), and Security & Protection (200 | 1.7%).
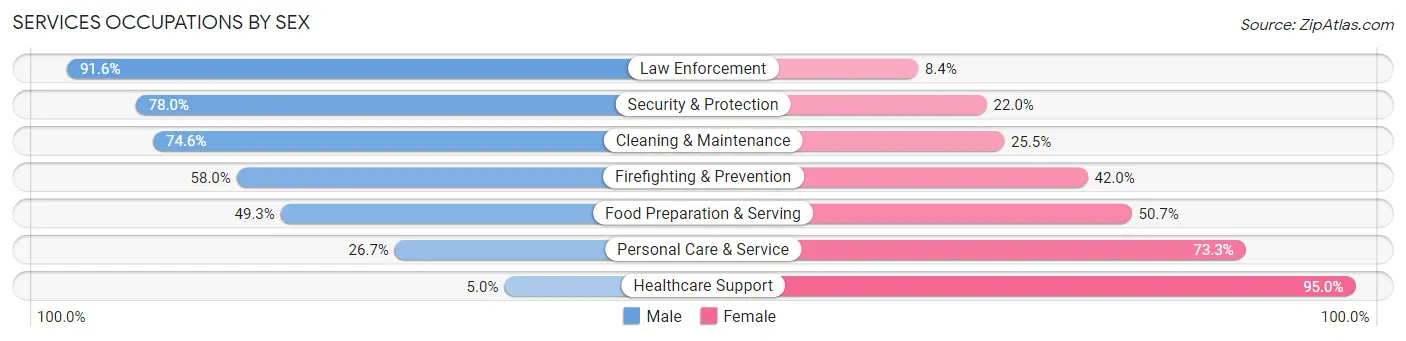
Services Occupations by Sex
Within the Services occupations in Keene, the most male-oriented occupations are Law Enforcement (91.6%), Security & Protection (78.0%), and Cleaning & Maintenance (74.6%), while the most female-oriented occupations are Healthcare Support (95.0%), Personal Care & Service (73.3%), and Food Preparation & Serving (50.7%).
| Occupation | Male | Female |
| Healthcare Support | 11 (5.0%) | 208 (95.0%) |
| Security & Protection | 156 (78.0%) | 44 (22.0%) |
| Firefighting & Prevention | 47 (58.0%) | 34 (42.0%) |
| Law Enforcement | 109 (91.6%) | 10 (8.4%) |
| Food Preparation & Serving | 359 (49.3%) | 369 (50.7%) |
| Cleaning & Maintenance | 249 (74.6%) | 85 (25.5%) |
| Personal Care & Service | 136 (26.7%) | 373 (73.3%) |
| Total (Category) | 911 (45.8%) | 1,079 (54.2%) |
| Total (Overall) | 5,989 (50.2%) | 5,934 (49.8%) |
Sales and Office Occupations
The most common Sales and Office occupations in Keene are Sales & Related (1,238 | 10.4%), and Office & Administration (1,155 | 9.7%).
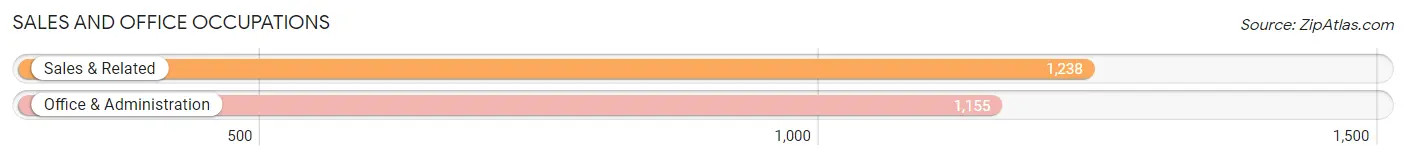
Sales and Office Occupations by Sex
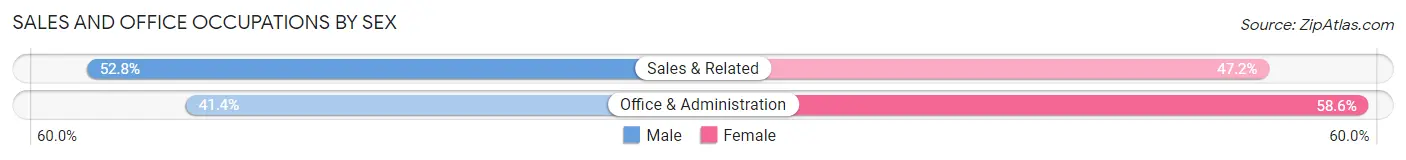
| Occupation | Male | Female |
| Sales & Related | 654 (52.8%) | 584 (47.2%) |
| Office & Administration | 478 (41.4%) | 677 (58.6%) |
| Total (Category) | 1,132 (47.3%) | 1,261 (52.7%) |
| Total (Overall) | 5,989 (50.2%) | 5,934 (49.8%) |
Natural Resources, Construction and Maintenance Occupations
The most common Natural Resources, Construction and Maintenance occupations in Keene are Construction & Extraction (550 | 4.6%), and Installation, Maintenance & Repair (157 | 1.3%).
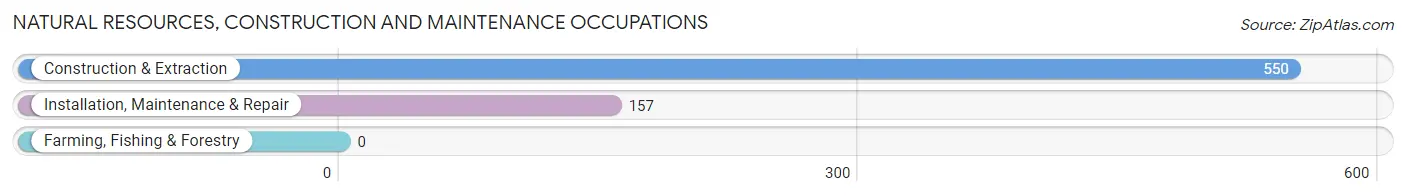
Natural Resources, Construction and Maintenance Occupations by Sex
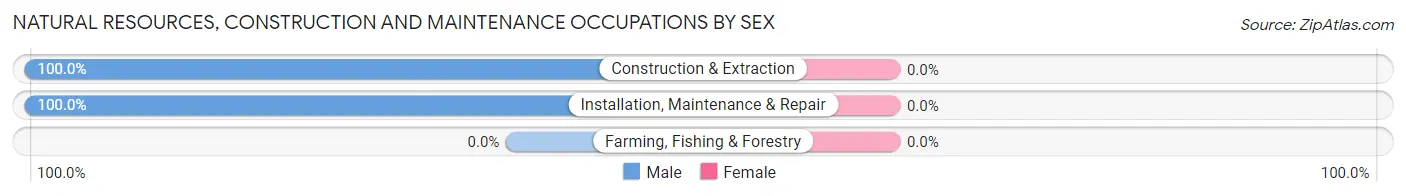
| Occupation | Male | Female |
| Farming, Fishing & Forestry | 0 (0.0%) | 0 (0.0%) |
| Construction & Extraction | 550 (100.0%) | 0 (0.0%) |
| Installation, Maintenance & Repair | 157 (100.0%) | 0 (0.0%) |
| Total (Category) | 707 (100.0%) | 0 (0.0%) |
| Total (Overall) | 5,989 (50.2%) | 5,934 (49.8%) |
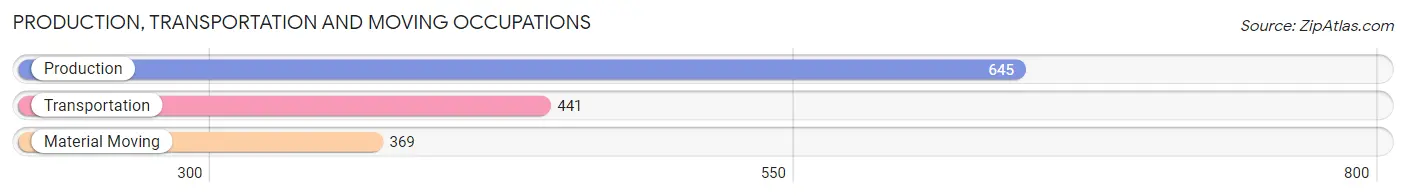
Production, Transportation and Moving Occupations
The most common Production, Transportation and Moving occupations in Keene are Production (645 | 5.4%), Transportation (441 | 3.7%), and Material Moving (369 | 3.1%).
Production, Transportation and Moving Occupations by Sex
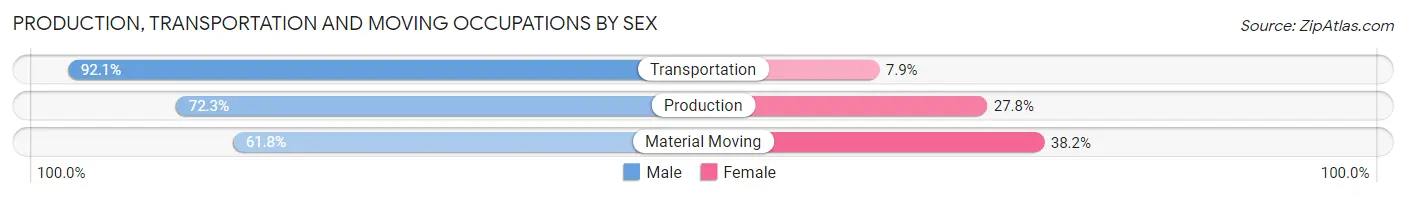
| Occupation | Male | Female |
| Production | 466 (72.3%) | 179 (27.8%) |
| Transportation | 406 (92.1%) | 35 (7.9%) |
| Material Moving | 228 (61.8%) | 141 (38.2%) |
| Total (Category) | 1,100 (75.6%) | 355 (24.4%) |
| Total (Overall) | 5,989 (50.2%) | 5,934 (49.8%) |
Employment Industries by Sex in Keene
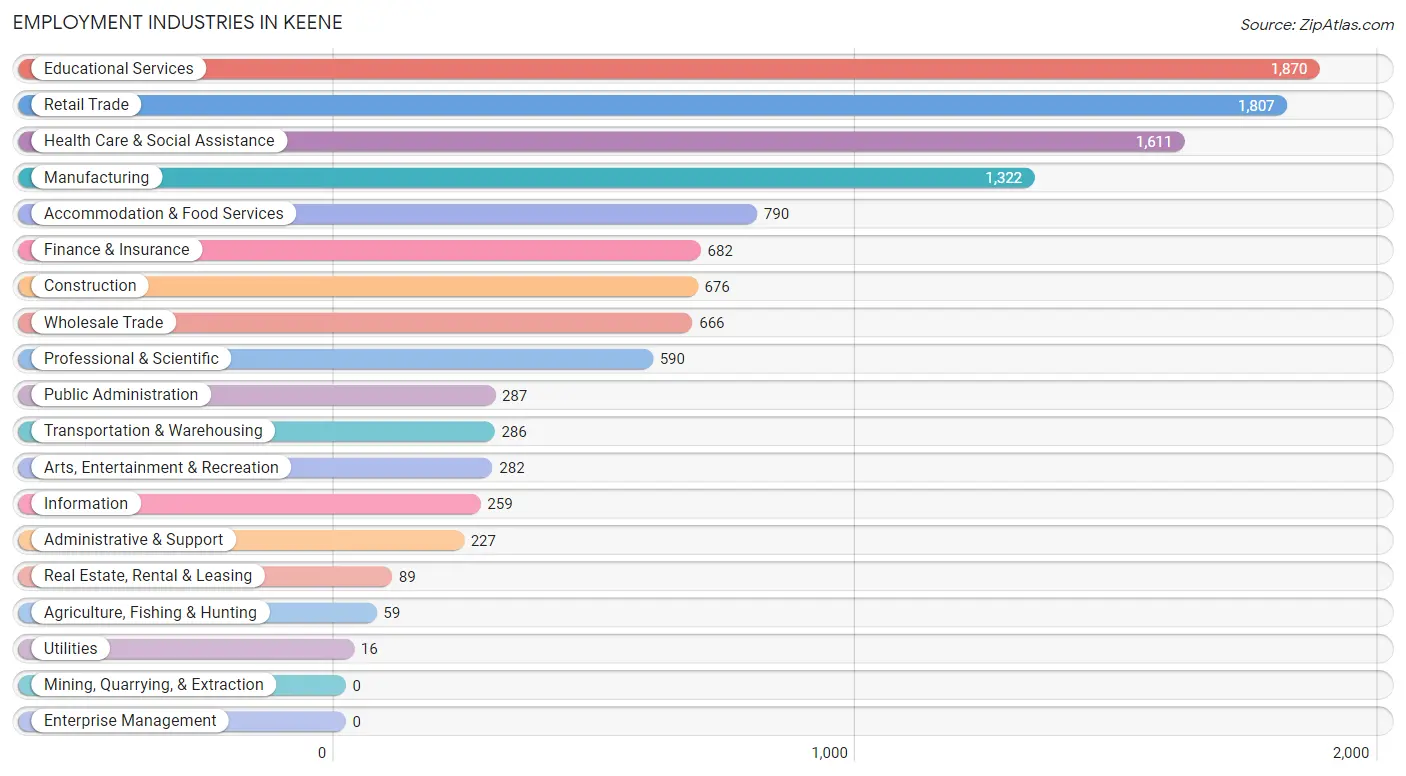
Employment Industries in Keene
The major employment industries in Keene include Educational Services (1,870 | 15.7%), Retail Trade (1,807 | 15.2%), Health Care & Social Assistance (1,611 | 13.5%), Manufacturing (1,322 | 11.1%), and Accommodation & Food Services (790 | 6.6%).
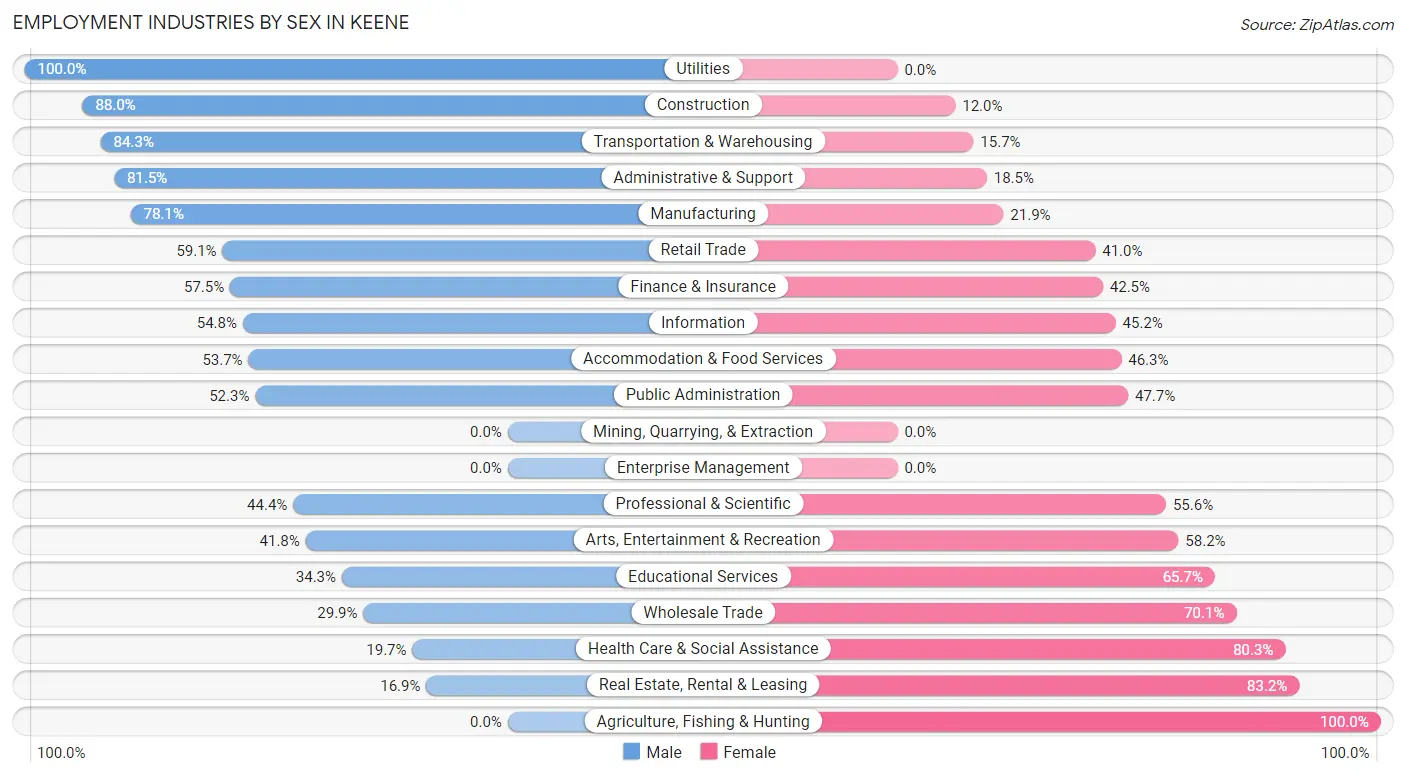
Employment Industries by Sex in Keene
The Keene industries that see more men than women are Utilities (100.0%), Construction (88.0%), and Transportation & Warehousing (84.3%), whereas the industries that tend to have a higher number of women are Agriculture, Fishing & Hunting (100.0%), Real Estate, Rental & Leasing (83.2%), and Health Care & Social Assistance (80.3%).
| Industry | Male | Female |
| Agriculture, Fishing & Hunting | 0 (0.0%) | 59 (100.0%) |
| Mining, Quarrying, & Extraction | 0 (0.0%) | 0 (0.0%) |
| Construction | 595 (88.0%) | 81 (12.0%) |
| Manufacturing | 1,032 (78.1%) | 290 (21.9%) |
| Wholesale Trade | 199 (29.9%) | 467 (70.1%) |
| Retail Trade | 1,067 (59.1%) | 740 (40.9%) |
| Transportation & Warehousing | 241 (84.3%) | 45 (15.7%) |
| Utilities | 16 (100.0%) | 0 (0.0%) |
| Information | 142 (54.8%) | 117 (45.2%) |
| Finance & Insurance | 392 (57.5%) | 290 (42.5%) |
| Real Estate, Rental & Leasing | 15 (16.9%) | 74 (83.2%) |
| Professional & Scientific | 262 (44.4%) | 328 (55.6%) |
| Enterprise Management | 0 (0.0%) | 0 (0.0%) |
| Administrative & Support | 185 (81.5%) | 42 (18.5%) |
| Educational Services | 642 (34.3%) | 1,228 (65.7%) |
| Health Care & Social Assistance | 318 (19.7%) | 1,293 (80.3%) |
| Arts, Entertainment & Recreation | 118 (41.8%) | 164 (58.2%) |
| Accommodation & Food Services | 424 (53.7%) | 366 (46.3%) |
| Public Administration | 150 (52.3%) | 137 (47.7%) |
| Total | 5,989 (50.2%) | 5,934 (49.8%) |
Education in Keene
School Enrollment in Keene
The most common levels of schooling among the 6,535 students in Keene are college / undergraduate (3,322 | 50.8%), high school (833 | 12.8%), and middle school (744 | 11.4%).
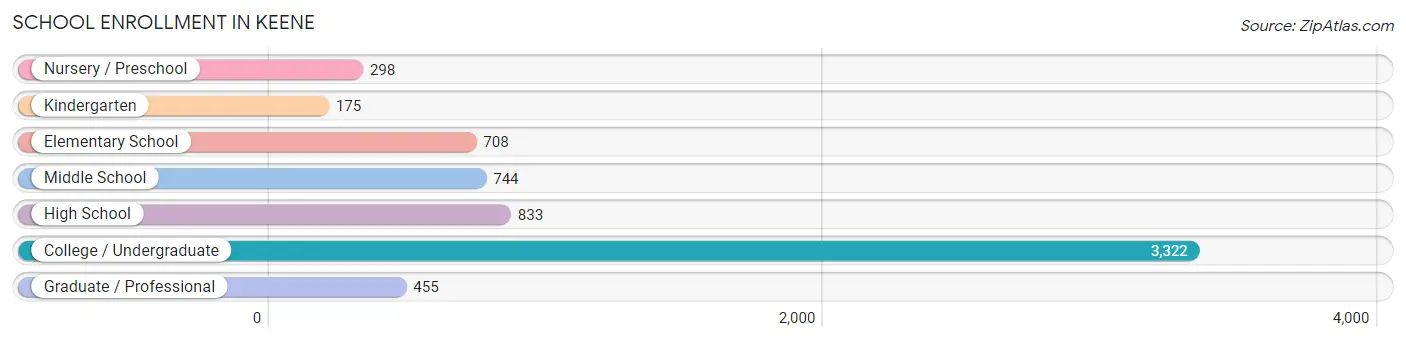
| School Level | # Students | % Students |
| Nursery / Preschool | 298 | 4.6% |
| Kindergarten | 175 | 2.7% |
| Elementary School | 708 | 10.8% |
| Middle School | 744 | 11.4% |
| High School | 833 | 12.8% |
| College / Undergraduate | 3,322 | 50.8% |
| Graduate / Professional | 455 | 7.0% |
| Total | 6,535 | 100.0% |
School Enrollment by Age by Funding Source in Keene
Out of a total of 6,535 students who are enrolled in schools in Keene, 1,340 (20.5%) attend a private institution, while the remaining 5,195 (79.5%) are enrolled in public schools. The age group of 3 to 4 year olds has the highest likelihood of being enrolled in private schools, with 202 (70.9% in the age bracket) enrolled. Conversely, the age group of 10 to 14 year olds has the lowest likelihood of being enrolled in a private school, with 939 (98.0% in the age bracket) attending a public institution.
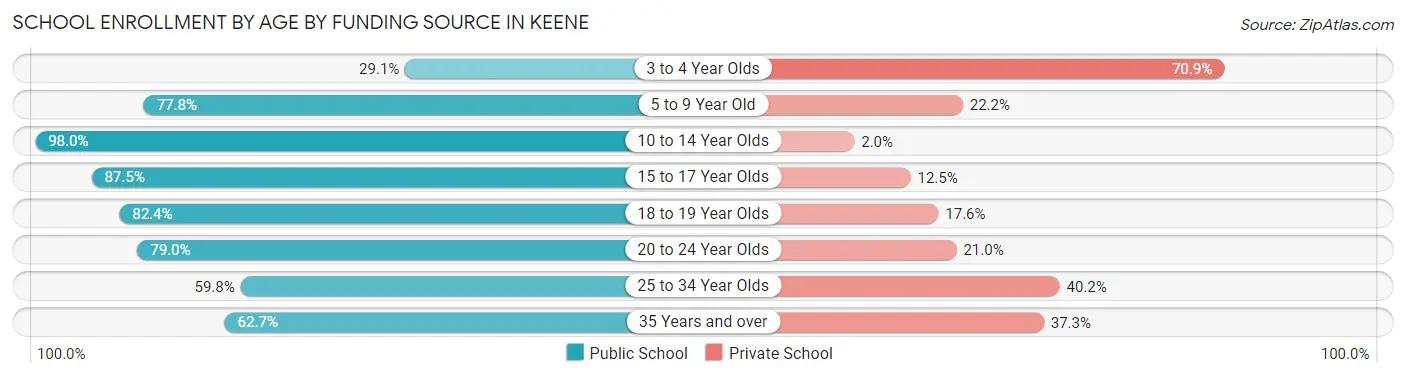
| Age Bracket | Public School | Private School |
| 3 to 4 Year Olds | 83 (29.1%) | 202 (70.9%) |
| 5 to 9 Year Old | 610 (77.8%) | 174 (22.2%) |
| 10 to 14 Year Olds | 939 (98.0%) | 19 (2.0%) |
| 15 to 17 Year Olds | 569 (87.5%) | 81 (12.5%) |
| 18 to 19 Year Olds | 1,219 (82.4%) | 261 (17.6%) |
| 20 to 24 Year Olds | 1,410 (79.0%) | 375 (21.0%) |
| 25 to 34 Year Olds | 162 (59.8%) | 109 (40.2%) |
| 35 Years and over | 202 (62.7%) | 120 (37.3%) |
| Total | 5,195 (79.5%) | 1,340 (20.5%) |
Educational Attainment by Field of Study in Keene
Business (1,074 | 14.6%), education (1,004 | 13.7%), psychology (687 | 9.3%), social sciences (575 | 7.8%), and bio, nature & agricultural (507 | 6.9%) are the most common fields of study among 7,355 individuals in Keene who have obtained a bachelor's degree or higher.
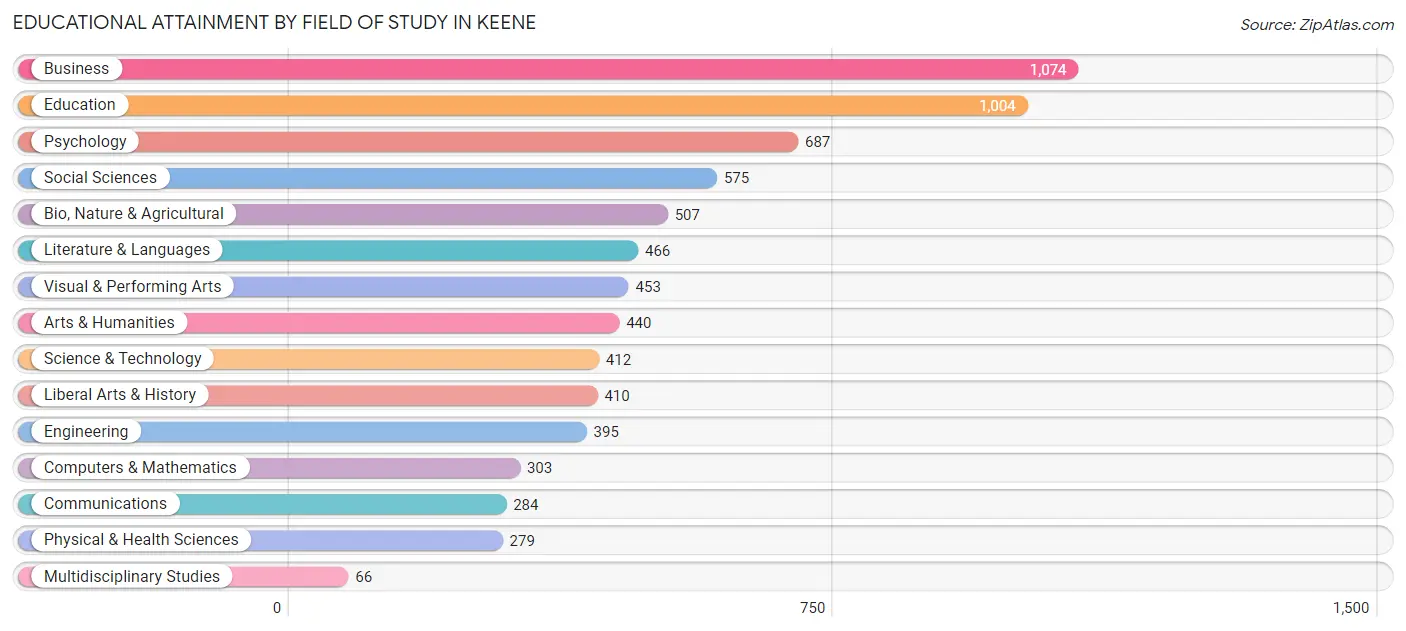
| Field of Study | # Graduates | % Graduates |
| Computers & Mathematics | 303 | 4.1% |
| Bio, Nature & Agricultural | 507 | 6.9% |
| Physical & Health Sciences | 279 | 3.8% |
| Psychology | 687 | 9.3% |
| Social Sciences | 575 | 7.8% |
| Engineering | 395 | 5.4% |
| Multidisciplinary Studies | 66 | 0.9% |
| Science & Technology | 412 | 5.6% |
| Business | 1,074 | 14.6% |
| Education | 1,004 | 13.7% |
| Literature & Languages | 466 | 6.3% |
| Liberal Arts & History | 410 | 5.6% |
| Visual & Performing Arts | 453 | 6.2% |
| Communications | 284 | 3.9% |
| Arts & Humanities | 440 | 6.0% |
| Total | 7,355 | 100.0% |
Transportation & Commute in Keene
Vehicle Availability by Sex in Keene
The most prevalent vehicle ownership categories in Keene are males with 2 vehicles (2,734, accounting for 48.6%) and females with 2 vehicles (2,417, making up 52.3%).
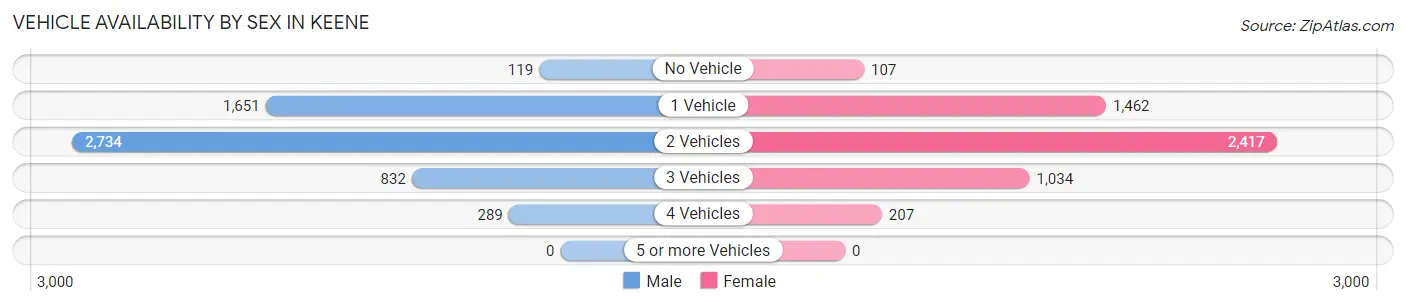
| Vehicles Available | Male | Female |
| No Vehicle | 119 (2.1%) | 107 (2.1%) |
| 1 Vehicle | 1,651 (29.3%) | 1,462 (28.0%) |
| 2 Vehicles | 2,734 (48.6%) | 2,417 (46.2%) |
| 3 Vehicles | 832 (14.8%) | 1,034 (19.8%) |
| 4 Vehicles | 289 (5.1%) | 207 (4.0%) |
| 5 or more Vehicles | 0 (0.0%) | 0 (0.0%) |
| Total | 5,625 (100.0%) | 5,227 (100.0%) |
Commute Time in Keene
The most frequently occuring commute durations in Keene are 5 to 9 minutes (2,988 commuters, 29.8%), 10 to 14 minutes (2,478 commuters, 24.7%), and 15 to 19 minutes (1,021 commuters, 10.2%).
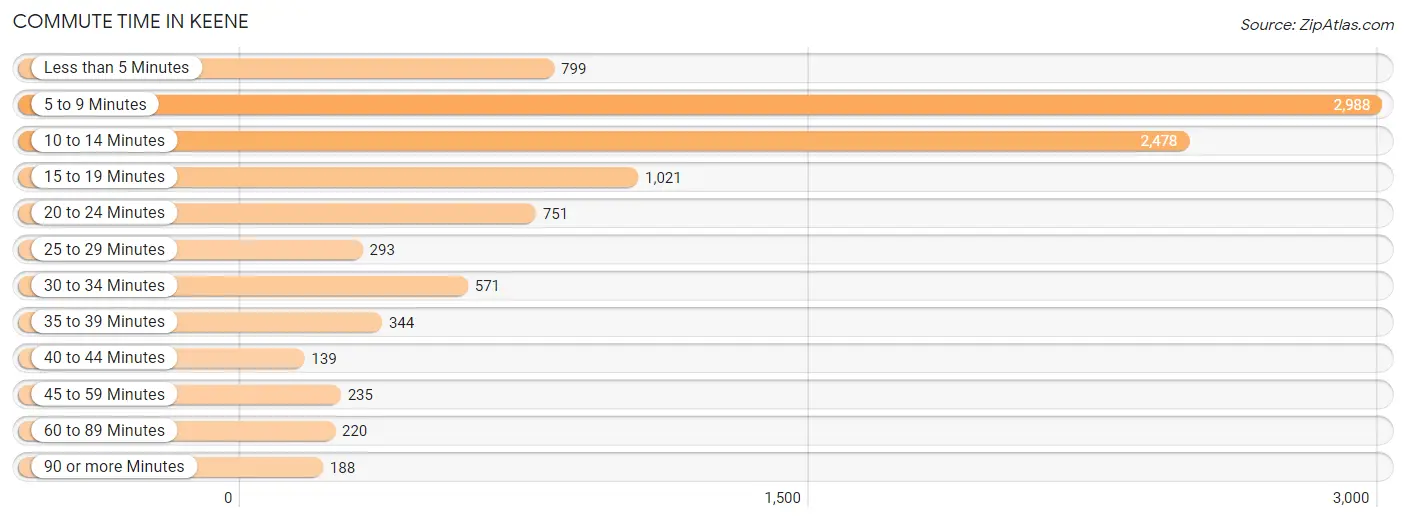
| Commute Time | # Commuters | % Commuters |
| Less than 5 Minutes | 799 | 8.0% |
| 5 to 9 Minutes | 2,988 | 29.8% |
| 10 to 14 Minutes | 2,478 | 24.7% |
| 15 to 19 Minutes | 1,021 | 10.2% |
| 20 to 24 Minutes | 751 | 7.5% |
| 25 to 29 Minutes | 293 | 2.9% |
| 30 to 34 Minutes | 571 | 5.7% |
| 35 to 39 Minutes | 344 | 3.4% |
| 40 to 44 Minutes | 139 | 1.4% |
| 45 to 59 Minutes | 235 | 2.3% |
| 60 to 89 Minutes | 220 | 2.2% |
| 90 or more Minutes | 188 | 1.9% |
Commute Time by Sex in Keene
The most common commute times in Keene are 5 to 9 minutes (1,480 commuters, 28.1%) for males and 5 to 9 minutes (1,508 commuters, 31.7%) for females.
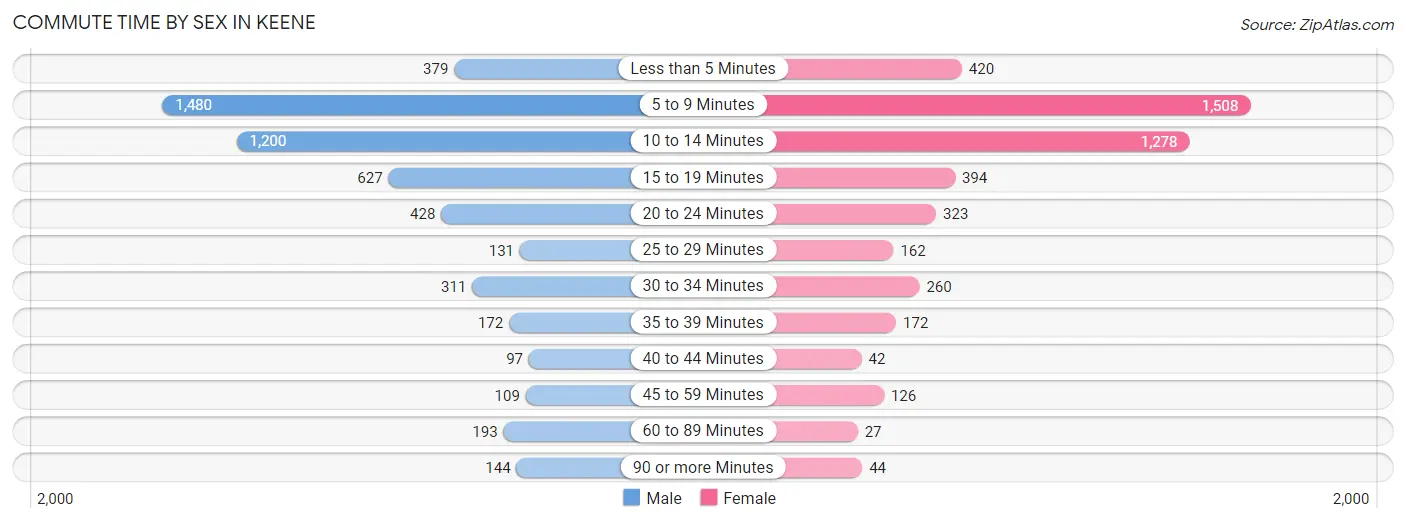
| Commute Time | Male | Female |
| Less than 5 Minutes | 379 (7.2%) | 420 (8.8%) |
| 5 to 9 Minutes | 1,480 (28.1%) | 1,508 (31.7%) |
| 10 to 14 Minutes | 1,200 (22.8%) | 1,278 (26.9%) |
| 15 to 19 Minutes | 627 (11.9%) | 394 (8.3%) |
| 20 to 24 Minutes | 428 (8.1%) | 323 (6.8%) |
| 25 to 29 Minutes | 131 (2.5%) | 162 (3.4%) |
| 30 to 34 Minutes | 311 (5.9%) | 260 (5.5%) |
| 35 to 39 Minutes | 172 (3.3%) | 172 (3.6%) |
| 40 to 44 Minutes | 97 (1.8%) | 42 (0.9%) |
| 45 to 59 Minutes | 109 (2.1%) | 126 (2.6%) |
| 60 to 89 Minutes | 193 (3.7%) | 27 (0.6%) |
| 90 or more Minutes | 144 (2.7%) | 44 (0.9%) |
Time of Departure to Work by Sex in Keene
The most frequent times of departure to work in Keene are 6:30 AM to 6:59 AM (676, 12.8%) for males and 7:30 AM to 7:59 AM (846, 17.8%) for females.
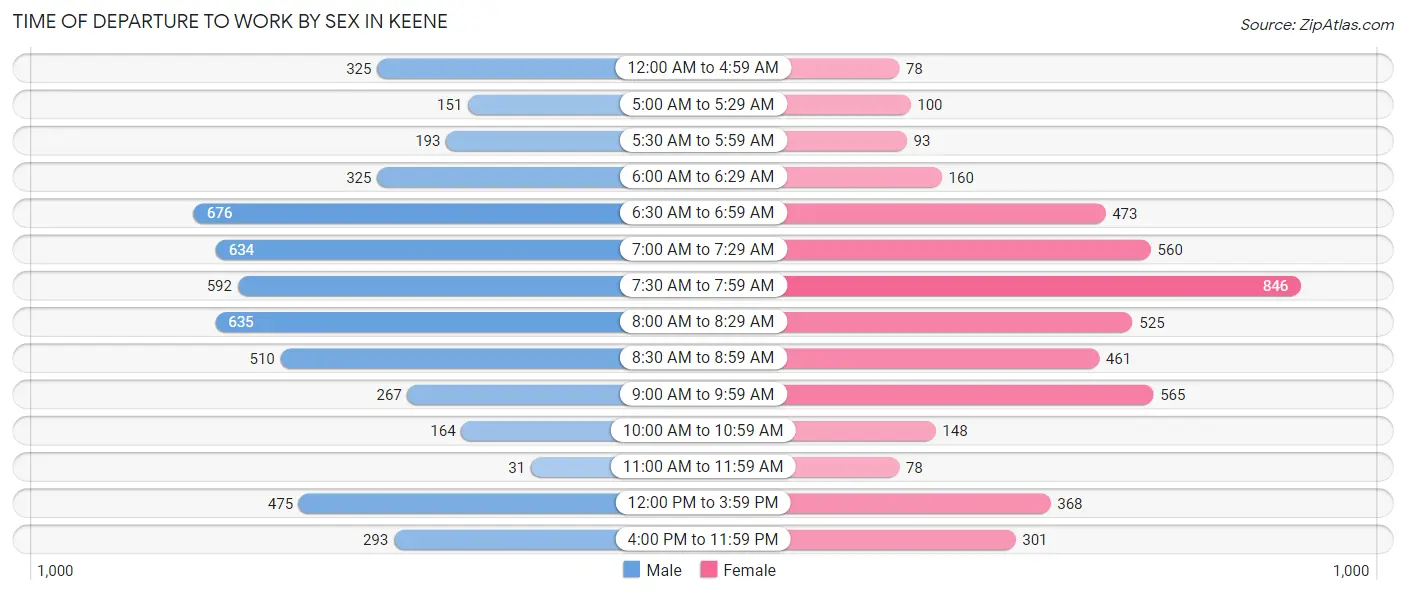
| Time of Departure | Male | Female |
| 12:00 AM to 4:59 AM | 325 (6.2%) | 78 (1.6%) |
| 5:00 AM to 5:29 AM | 151 (2.9%) | 100 (2.1%) |
| 5:30 AM to 5:59 AM | 193 (3.7%) | 93 (2.0%) |
| 6:00 AM to 6:29 AM | 325 (6.2%) | 160 (3.4%) |
| 6:30 AM to 6:59 AM | 676 (12.8%) | 473 (10.0%) |
| 7:00 AM to 7:29 AM | 634 (12.0%) | 560 (11.8%) |
| 7:30 AM to 7:59 AM | 592 (11.2%) | 846 (17.8%) |
| 8:00 AM to 8:29 AM | 635 (12.0%) | 525 (11.0%) |
| 8:30 AM to 8:59 AM | 510 (9.7%) | 461 (9.7%) |
| 9:00 AM to 9:59 AM | 267 (5.1%) | 565 (11.9%) |
| 10:00 AM to 10:59 AM | 164 (3.1%) | 148 (3.1%) |
| 11:00 AM to 11:59 AM | 31 (0.6%) | 78 (1.6%) |
| 12:00 PM to 3:59 PM | 475 (9.0%) | 368 (7.7%) |
| 4:00 PM to 11:59 PM | 293 (5.6%) | 301 (6.3%) |
| Total | 5,271 (100.0%) | 4,756 (100.0%) |
Housing Occupancy in Keene
Occupancy by Ownership in Keene
Of the total 9,259 dwellings in Keene, owner-occupied units account for 4,762 (51.4%), while renter-occupied units make up 4,497 (48.6%).
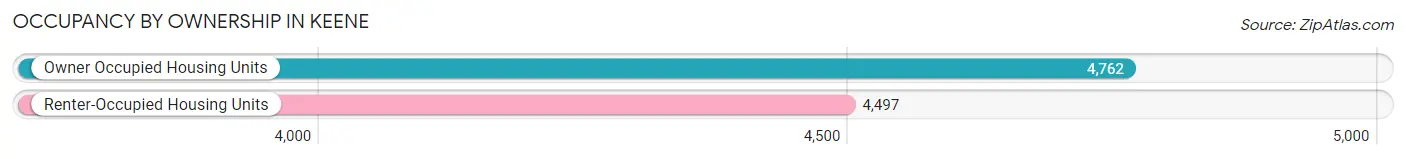
| Occupancy | # Housing Units | % Housing Units |
| Owner Occupied Housing Units | 4,762 | 51.4% |
| Renter-Occupied Housing Units | 4,497 | 48.6% |
| Total Occupied Housing Units | 9,259 | 100.0% |
Occupancy by Household Size in Keene
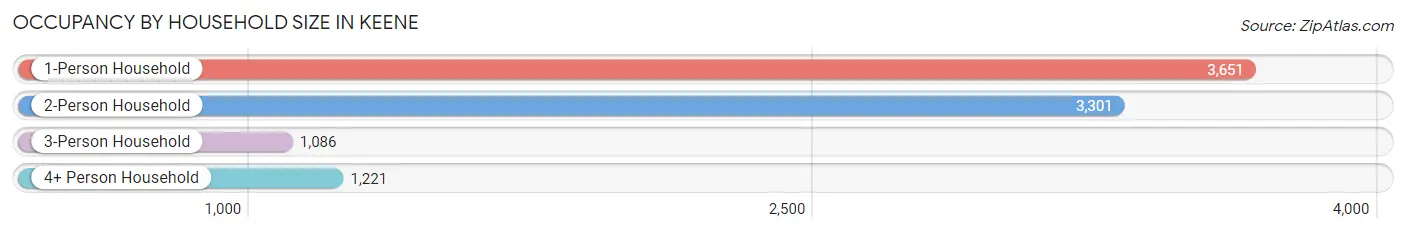
| Household Size | # Housing Units | % Housing Units |
| 1-Person Household | 3,651 | 39.4% |
| 2-Person Household | 3,301 | 35.6% |
| 3-Person Household | 1,086 | 11.7% |
| 4+ Person Household | 1,221 | 13.2% |
| Total Housing Units | 9,259 | 100.0% |
Occupancy by Ownership by Household Size in Keene
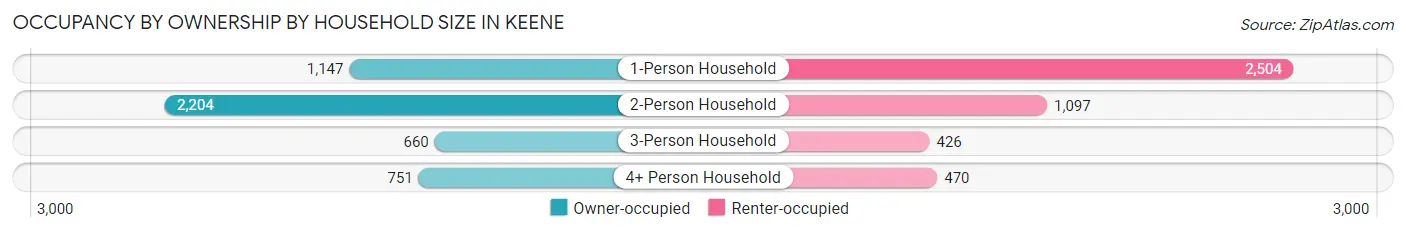
| Household Size | Owner-occupied | Renter-occupied |
| 1-Person Household | 1,147 (31.4%) | 2,504 (68.6%) |
| 2-Person Household | 2,204 (66.8%) | 1,097 (33.2%) |
| 3-Person Household | 660 (60.8%) | 426 (39.2%) |
| 4+ Person Household | 751 (61.5%) | 470 (38.5%) |
| Total Housing Units | 4,762 (51.4%) | 4,497 (48.6%) |
Occupancy by Educational Attainment in Keene
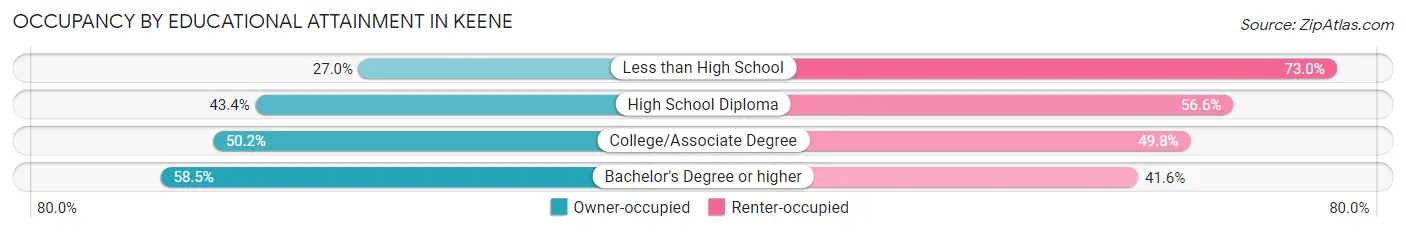
| Household Size | Owner-occupied | Renter-occupied |
| Less than High School | 126 (27.0%) | 341 (73.0%) |
| High School Diploma | 852 (43.4%) | 1,112 (56.6%) |
| College/Associate Degree | 1,253 (50.2%) | 1,245 (49.8%) |
| Bachelor's Degree or higher | 2,531 (58.5%) | 1,799 (41.5%) |
Occupancy by Age of Householder in Keene
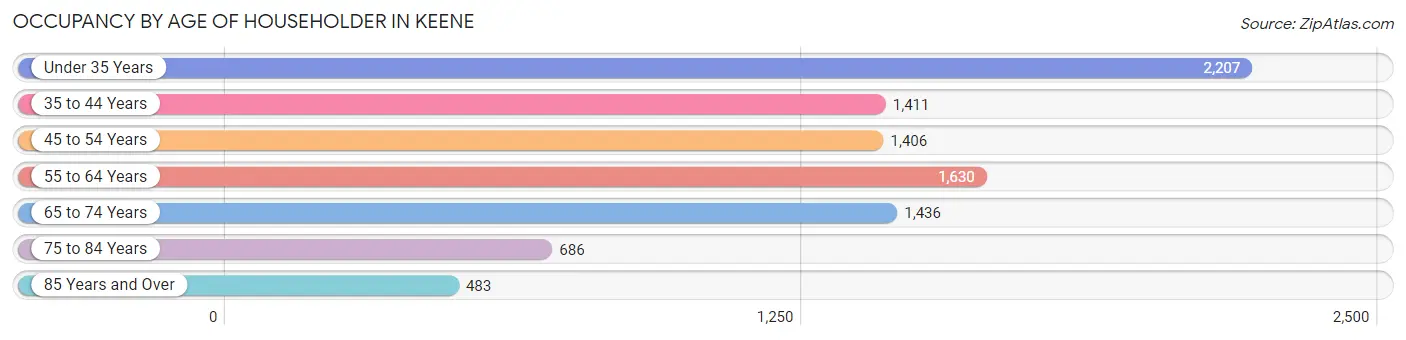
| Age Bracket | # Households | % Households |
| Under 35 Years | 2,207 | 23.8% |
| 35 to 44 Years | 1,411 | 15.2% |
| 45 to 54 Years | 1,406 | 15.2% |
| 55 to 64 Years | 1,630 | 17.6% |
| 65 to 74 Years | 1,436 | 15.5% |
| 75 to 84 Years | 686 | 7.4% |
| 85 Years and Over | 483 | 5.2% |
| Total | 9,259 | 100.0% |
Housing Finances in Keene
Median Income by Occupancy in Keene
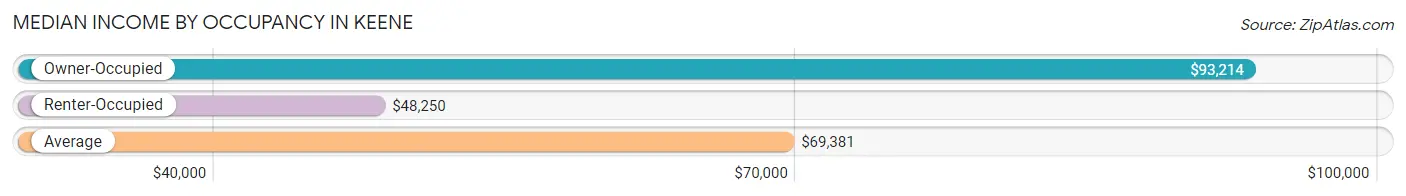
| Occupancy Type | # Households | Median Income |
| Owner-Occupied | 4,762 (51.4%) | $93,214 |
| Renter-Occupied | 4,497 (48.6%) | $48,250 |
| Average | 9,259 (100.0%) | $69,381 |
Occupancy by Householder Income Bracket in Keene
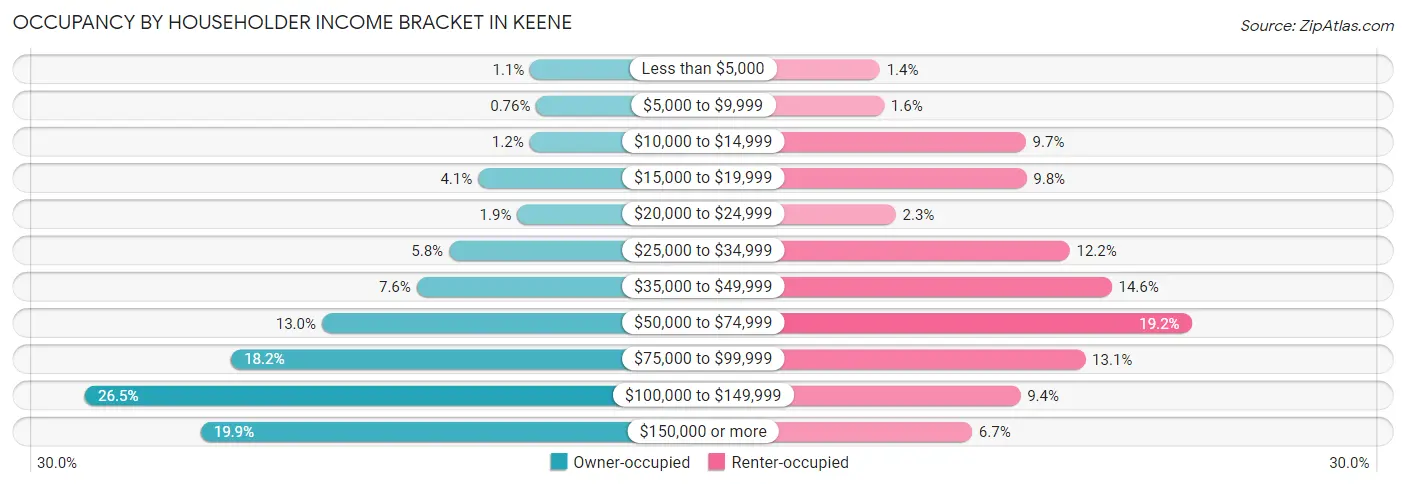
| Income Bracket | Owner-occupied | Renter-occupied |
| Less than $5,000 | 53 (1.1%) | 62 (1.4%) |
| $5,000 to $9,999 | 36 (0.8%) | 73 (1.6%) |
| $10,000 to $14,999 | 55 (1.1%) | 437 (9.7%) |
| $15,000 to $19,999 | 195 (4.1%) | 439 (9.8%) |
| $20,000 to $24,999 | 88 (1.8%) | 103 (2.3%) |
| $25,000 to $34,999 | 274 (5.8%) | 550 (12.2%) |
| $35,000 to $49,999 | 362 (7.6%) | 658 (14.6%) |
| $50,000 to $74,999 | 620 (13.0%) | 863 (19.2%) |
| $75,000 to $99,999 | 866 (18.2%) | 590 (13.1%) |
| $100,000 to $149,999 | 1,264 (26.5%) | 423 (9.4%) |
| $150,000 or more | 949 (19.9%) | 299 (6.7%) |
| Total | 4,762 (100.0%) | 4,497 (100.0%) |
Monthly Housing Cost Tiers in Keene
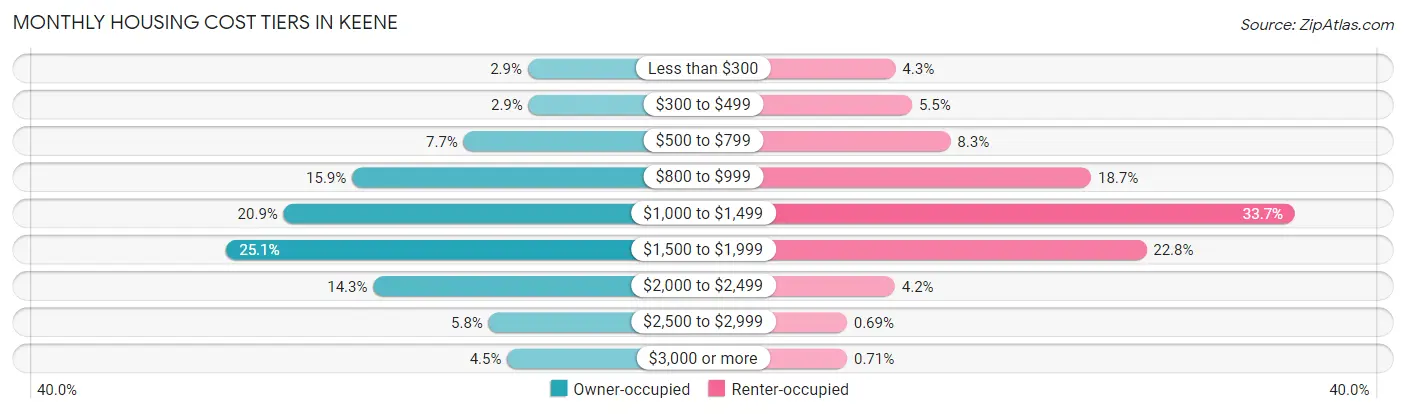
| Monthly Cost | Owner-occupied | Renter-occupied |
| Less than $300 | 140 (2.9%) | 192 (4.3%) |
| $300 to $499 | 137 (2.9%) | 247 (5.5%) |
| $500 to $799 | 365 (7.7%) | 374 (8.3%) |
| $800 to $999 | 756 (15.9%) | 840 (18.7%) |
| $1,000 to $1,499 | 996 (20.9%) | 1,515 (33.7%) |
| $1,500 to $1,999 | 1,197 (25.1%) | 1,023 (22.8%) |
| $2,000 to $2,499 | 682 (14.3%) | 190 (4.2%) |
| $2,500 to $2,999 | 277 (5.8%) | 31 (0.7%) |
| $3,000 or more | 212 (4.4%) | 32 (0.7%) |
| Total | 4,762 (100.0%) | 4,497 (100.0%) |
Physical Housing Characteristics in Keene
Housing Structures in Keene
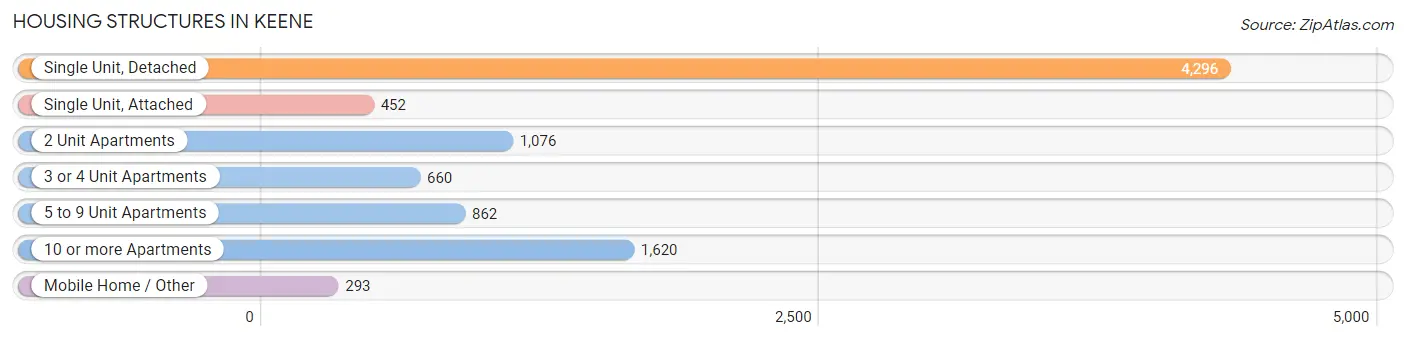
| Structure Type | # Housing Units | % Housing Units |
| Single Unit, Detached | 4,296 | 46.4% |
| Single Unit, Attached | 452 | 4.9% |
| 2 Unit Apartments | 1,076 | 11.6% |
| 3 or 4 Unit Apartments | 660 | 7.1% |
| 5 to 9 Unit Apartments | 862 | 9.3% |
| 10 or more Apartments | 1,620 | 17.5% |
| Mobile Home / Other | 293 | 3.2% |
| Total | 9,259 | 100.0% |
Housing Structures by Occupancy in Keene
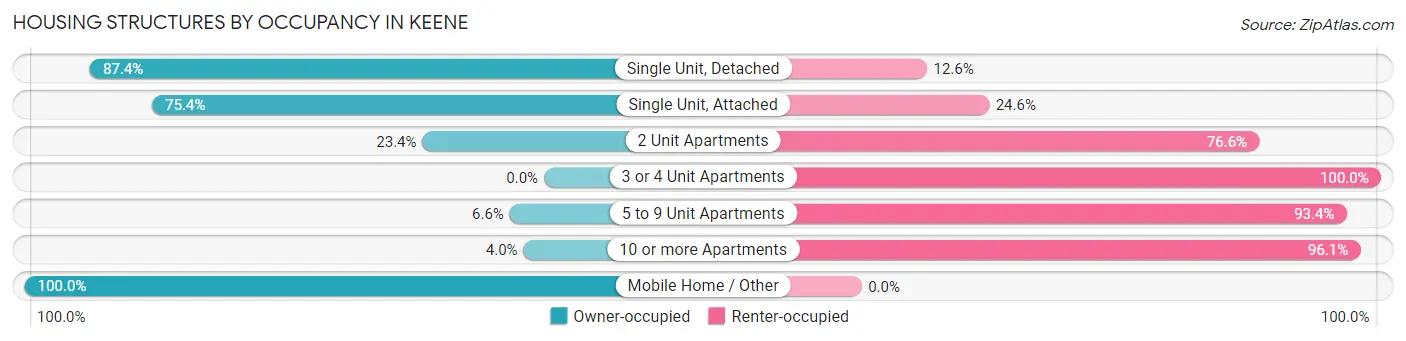
| Structure Type | Owner-occupied | Renter-occupied |
| Single Unit, Detached | 3,755 (87.4%) | 541 (12.6%) |
| Single Unit, Attached | 341 (75.4%) | 111 (24.6%) |
| 2 Unit Apartments | 252 (23.4%) | 824 (76.6%) |
| 3 or 4 Unit Apartments | 0 (0.0%) | 660 (100.0%) |
| 5 to 9 Unit Apartments | 57 (6.6%) | 805 (93.4%) |
| 10 or more Apartments | 64 (4.0%) | 1,556 (96.1%) |
| Mobile Home / Other | 293 (100.0%) | 0 (0.0%) |
| Total | 4,762 (51.4%) | 4,497 (48.6%) |
Housing Structures by Number of Rooms in Keene
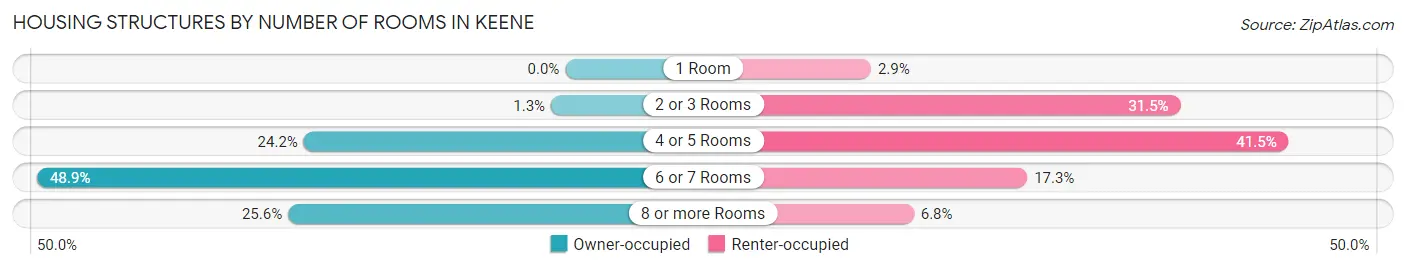
| Number of Rooms | Owner-occupied | Renter-occupied |
| 1 Room | 0 (0.0%) | 129 (2.9%) |
| 2 or 3 Rooms | 63 (1.3%) | 1,416 (31.5%) |
| 4 or 5 Rooms | 1,152 (24.2%) | 1,866 (41.5%) |
| 6 or 7 Rooms | 2,326 (48.8%) | 779 (17.3%) |
| 8 or more Rooms | 1,221 (25.6%) | 307 (6.8%) |
| Total | 4,762 (100.0%) | 4,497 (100.0%) |
Housing Structure by Heating Type in Keene
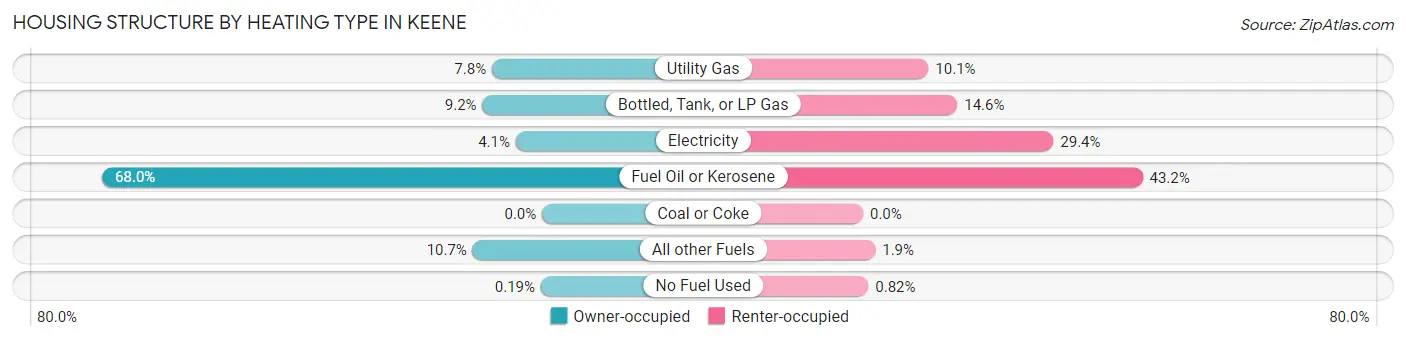
| Heating Type | Owner-occupied | Renter-occupied |
| Utility Gas | 369 (7.7%) | 454 (10.1%) |
| Bottled, Tank, or LP Gas | 439 (9.2%) | 655 (14.6%) |
| Electricity | 194 (4.1%) | 1,323 (29.4%) |
| Fuel Oil or Kerosene | 3,240 (68.0%) | 1,943 (43.2%) |
| Coal or Coke | 0 (0.0%) | 0 (0.0%) |
| All other Fuels | 511 (10.7%) | 85 (1.9%) |
| No Fuel Used | 9 (0.2%) | 37 (0.8%) |
| Total | 4,762 (100.0%) | 4,497 (100.0%) |
Household Vehicle Usage in Keene
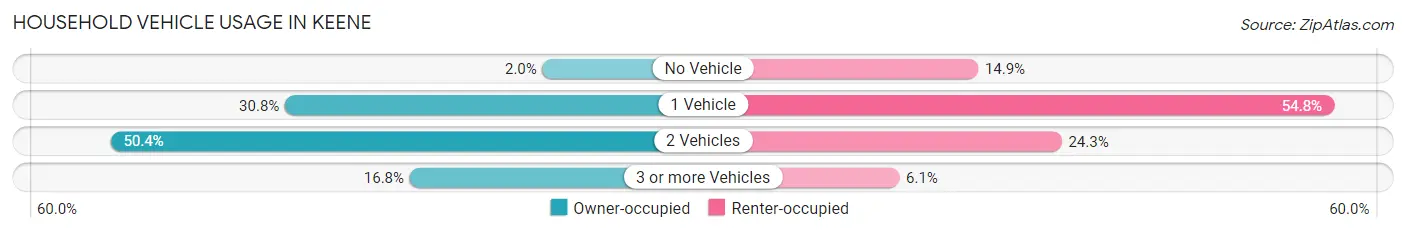
| Vehicles per Household | Owner-occupied | Renter-occupied |
| No Vehicle | 94 (2.0%) | 670 (14.9%) |
| 1 Vehicle | 1,467 (30.8%) | 2,463 (54.8%) |
| 2 Vehicles | 2,399 (50.4%) | 1,091 (24.3%) |
| 3 or more Vehicles | 802 (16.8%) | 273 (6.1%) |
| Total | 4,762 (100.0%) | 4,497 (100.0%) |
Real Estate & Mortgages in Keene
Real Estate and Mortgage Overview in Keene
| Characteristic | Without Mortgage | With Mortgage |
| Housing Units | 2,258 | 2,504 |
| Median Property Value | $210,700 | $227,900 |
| Median Household Income | $75,938 | $577 |
| Monthly Housing Costs | $929 | $204 |
| Real Estate Taxes | $6,436 | $0 |
Property Value by Mortgage Status in Keene
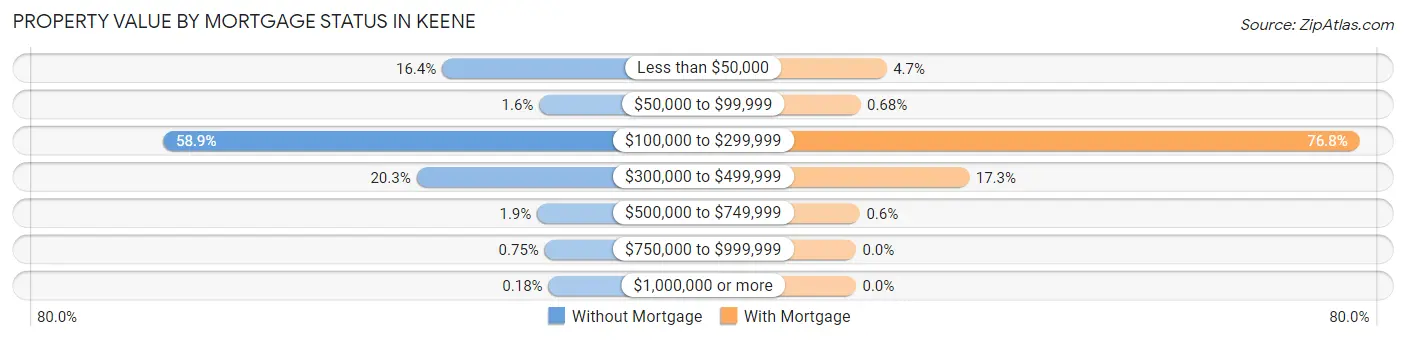
| Property Value | Without Mortgage | With Mortgage |
| Less than $50,000 | 370 (16.4%) | 117 (4.7%) |
| $50,000 to $99,999 | 36 (1.6%) | 17 (0.7%) |
| $100,000 to $299,999 | 1,330 (58.9%) | 1,923 (76.8%) |
| $300,000 to $499,999 | 458 (20.3%) | 432 (17.2%) |
| $500,000 to $749,999 | 43 (1.9%) | 15 (0.6%) |
| $750,000 to $999,999 | 17 (0.7%) | 0 (0.0%) |
| $1,000,000 or more | 4 (0.2%) | 0 (0.0%) |
| Total | 2,258 (100.0%) | 2,504 (100.0%) |
Household Income by Mortgage Status in Keene
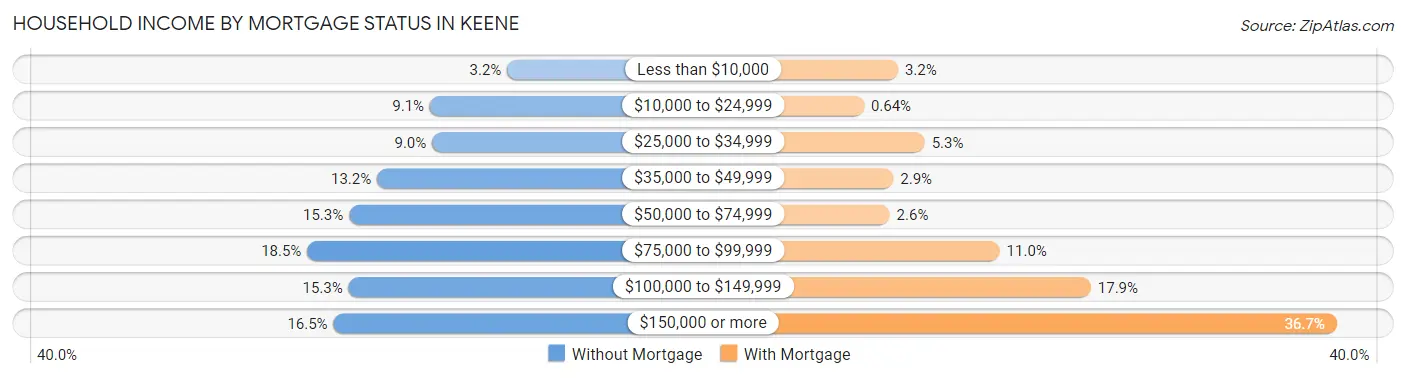
| Household Income | Without Mortgage | With Mortgage |
| Less than $10,000 | 73 (3.2%) | 81 (3.2%) |
| $10,000 to $24,999 | 206 (9.1%) | 16 (0.6%) |
| $25,000 to $34,999 | 202 (8.9%) | 132 (5.3%) |
| $35,000 to $49,999 | 297 (13.2%) | 72 (2.9%) |
| $50,000 to $74,999 | 345 (15.3%) | 65 (2.6%) |
| $75,000 to $99,999 | 417 (18.5%) | 275 (11.0%) |
| $100,000 to $149,999 | 346 (15.3%) | 449 (17.9%) |
| $150,000 or more | 372 (16.5%) | 918 (36.7%) |
| Total | 2,258 (100.0%) | 2,504 (100.0%) |
Property Value to Household Income Ratio in Keene
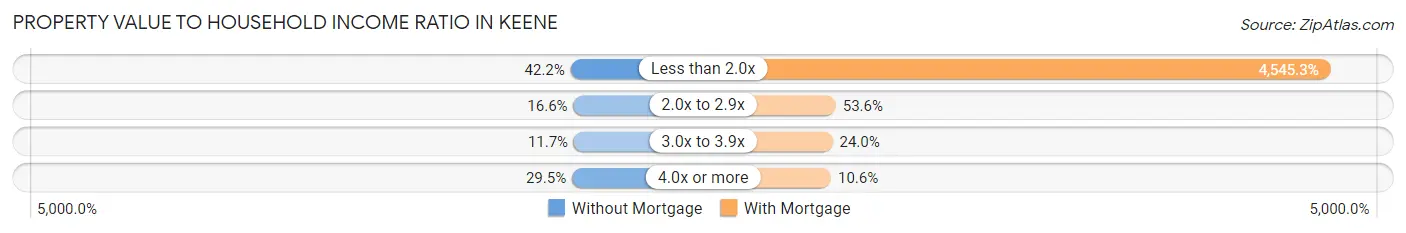
| Value-to-Income Ratio | Without Mortgage | With Mortgage |
| Less than 2.0x | 953 (42.2%) | 113,813 (4,545.3%) |
| 2.0x to 2.9x | 375 (16.6%) | 1,341 (53.5%) |
| 3.0x to 3.9x | 264 (11.7%) | 600 (24.0%) |
| 4.0x or more | 666 (29.5%) | 266 (10.6%) |
| Total | 2,258 (100.0%) | 2,504 (100.0%) |
Real Estate Taxes by Mortgage Status in Keene
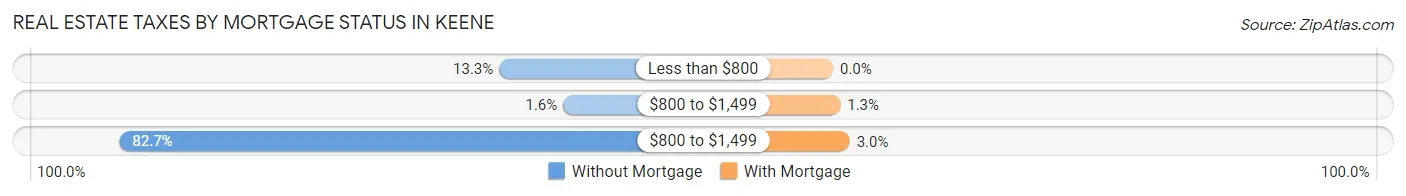
| Property Taxes | Without Mortgage | With Mortgage |
| Less than $800 | 301 (13.3%) | 0 (0.0%) |
| $800 to $1,499 | 37 (1.6%) | 33 (1.3%) |
| $800 to $1,499 | 1,867 (82.7%) | 76 (3.0%) |
| Total | 2,258 (100.0%) | 2,504 (100.0%) |
Health & Disability in Keene
Health Insurance Coverage by Age in Keene
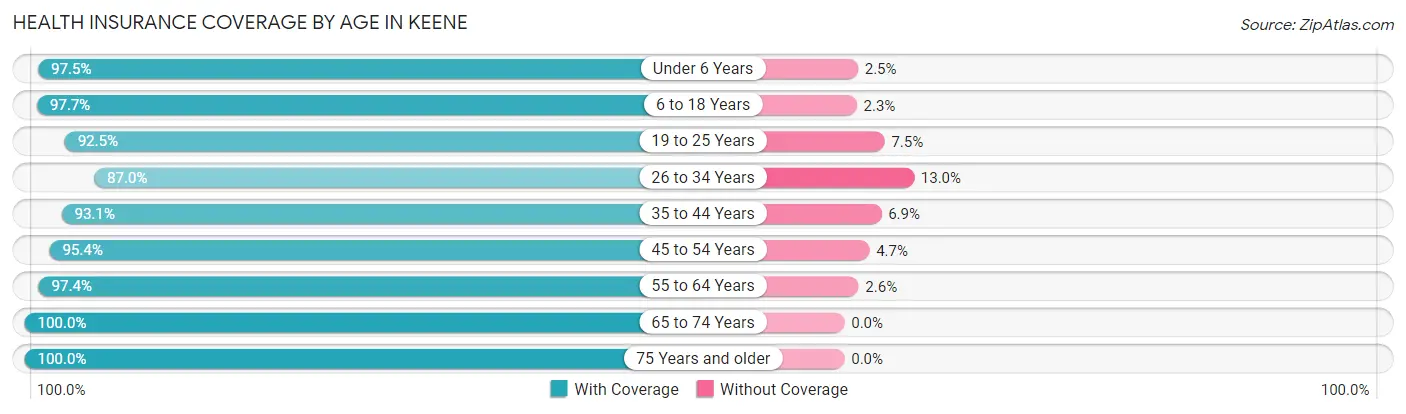
| Age Bracket | With Coverage | Without Coverage |
| Under 6 Years | 966 (97.5%) | 25 (2.5%) |
| 6 to 18 Years | 2,720 (97.7%) | 64 (2.3%) |
| 19 to 25 Years | 3,938 (92.5%) | 319 (7.5%) |
| 26 to 34 Years | 2,570 (87.0%) | 383 (13.0%) |
| 35 to 44 Years | 2,257 (93.1%) | 167 (6.9%) |
| 45 to 54 Years | 2,422 (95.4%) | 118 (4.6%) |
| 55 to 64 Years | 2,448 (97.4%) | 66 (2.6%) |
| 65 to 74 Years | 2,199 (100.0%) | 0 (0.0%) |
| 75 Years and older | 1,767 (100.0%) | 0 (0.0%) |
| Total | 21,287 (94.9%) | 1,142 (5.1%) |
Health Insurance Coverage by Citizenship Status in Keene
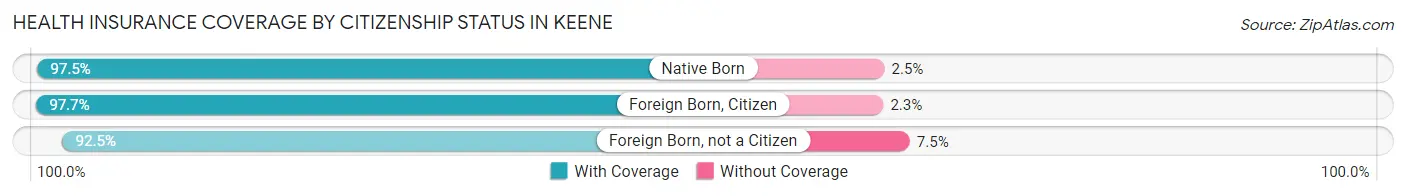
| Citizenship Status | With Coverage | Without Coverage |
| Native Born | 966 (97.5%) | 25 (2.5%) |
| Foreign Born, Citizen | 2,720 (97.7%) | 64 (2.3%) |
| Foreign Born, not a Citizen | 3,938 (92.5%) | 319 (7.5%) |
Health Insurance Coverage by Household Income in Keene
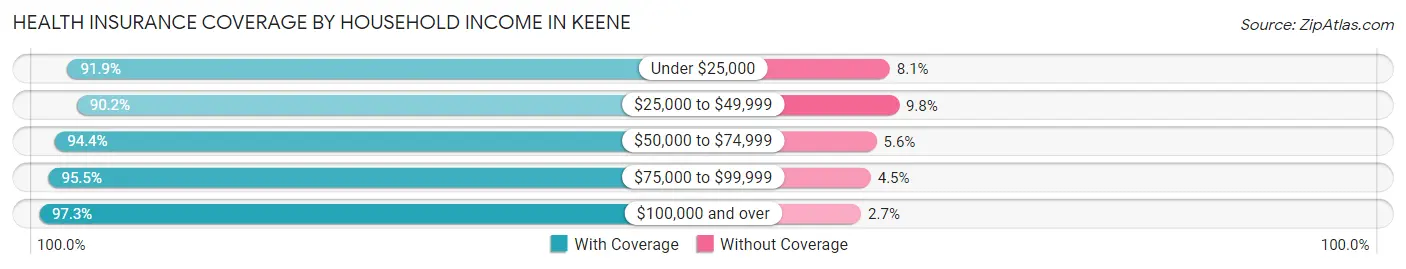
| Household Income | With Coverage | Without Coverage |
| Under $25,000 | 1,859 (91.9%) | 163 (8.1%) |
| $25,000 to $49,999 | 2,628 (90.2%) | 285 (9.8%) |
| $50,000 to $74,999 | 2,997 (94.4%) | 177 (5.6%) |
| $75,000 to $99,999 | 3,393 (95.5%) | 160 (4.5%) |
| $100,000 and over | 8,317 (97.3%) | 230 (2.7%) |
Public vs Private Health Insurance Coverage by Age in Keene
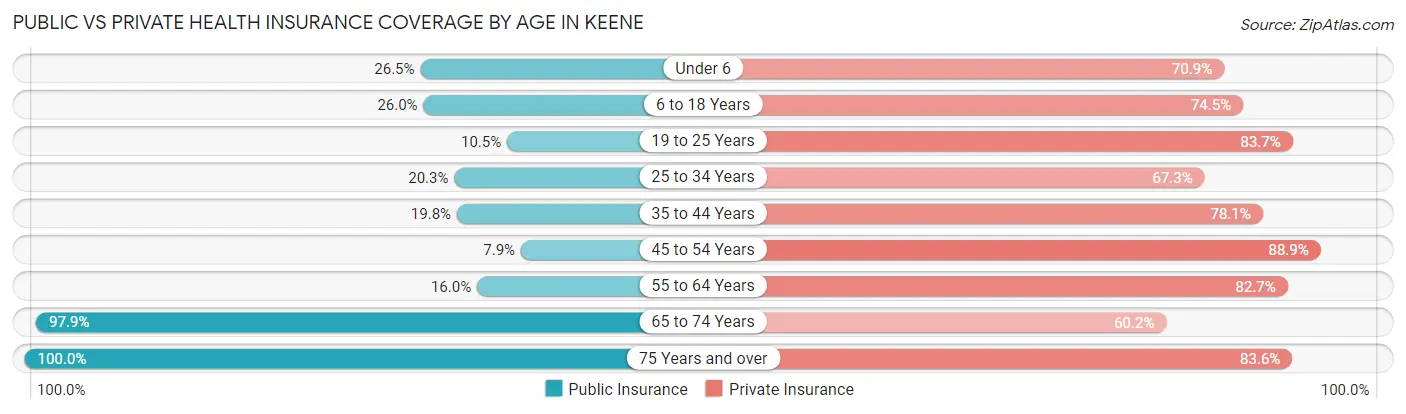
| Age Bracket | Public Insurance | Private Insurance |
| Under 6 | 263 (26.5%) | 703 (70.9%) |
| 6 to 18 Years | 723 (26.0%) | 2,073 (74.5%) |
| 19 to 25 Years | 445 (10.4%) | 3,562 (83.7%) |
| 25 to 34 Years | 598 (20.3%) | 1,988 (67.3%) |
| 35 to 44 Years | 479 (19.8%) | 1,893 (78.1%) |
| 45 to 54 Years | 200 (7.9%) | 2,257 (88.9%) |
| 55 to 64 Years | 403 (16.0%) | 2,080 (82.7%) |
| 65 to 74 Years | 2,152 (97.9%) | 1,324 (60.2%) |
| 75 Years and over | 1,767 (100.0%) | 1,477 (83.6%) |
| Total | 7,030 (31.3%) | 17,357 (77.4%) |
Disability Status by Sex by Age in Keene
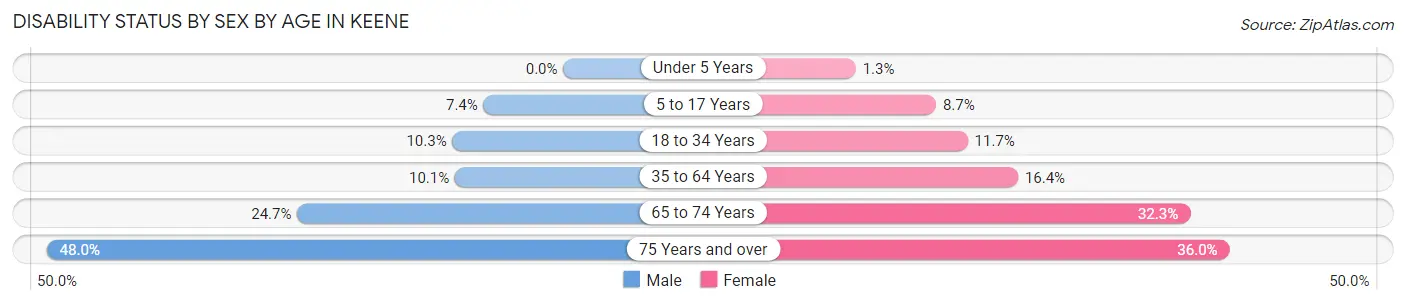
| Age Bracket | Male | Female |
| Under 5 Years | 0 (0.0%) | 5 (1.3%) |
| 5 to 17 Years | 102 (7.4%) | 91 (8.7%) |
| 18 to 34 Years | 381 (10.3%) | 466 (11.7%) |
| 35 to 64 Years | 381 (10.1%) | 603 (16.4%) |
| 65 to 74 Years | 222 (24.7%) | 420 (32.3%) |
| 75 Years and over | 350 (47.9%) | 373 (36.0%) |
Disability Class by Sex by Age in Keene
Disability Class: Hearing Difficulty
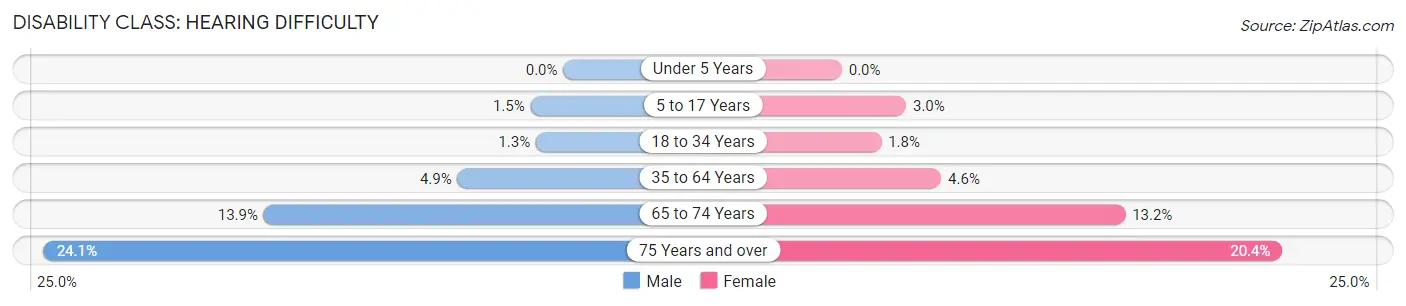
| Age Bracket | Male | Female |
| Under 5 Years | 0 (0.0%) | 0 (0.0%) |
| 5 to 17 Years | 21 (1.5%) | 31 (3.0%) |
| 18 to 34 Years | 47 (1.3%) | 73 (1.8%) |
| 35 to 64 Years | 186 (4.9%) | 170 (4.6%) |
| 65 to 74 Years | 125 (13.9%) | 171 (13.2%) |
| 75 Years and over | 176 (24.1%) | 212 (20.4%) |
Disability Class: Vision Difficulty
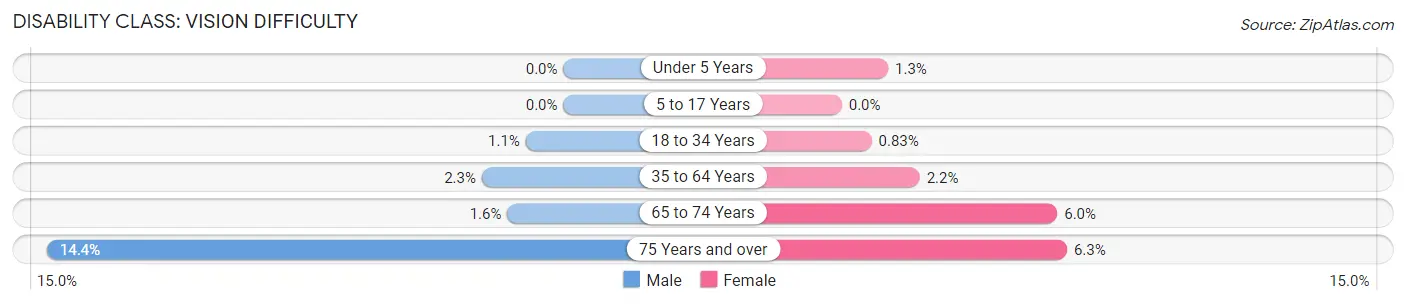
| Age Bracket | Male | Female |
| Under 5 Years | 0 (0.0%) | 5 (1.3%) |
| 5 to 17 Years | 0 (0.0%) | 0 (0.0%) |
| 18 to 34 Years | 39 (1.1%) | 33 (0.8%) |
| 35 to 64 Years | 86 (2.3%) | 80 (2.2%) |
| 65 to 74 Years | 14 (1.6%) | 78 (6.0%) |
| 75 Years and over | 105 (14.4%) | 65 (6.3%) |
Disability Class: Cognitive Difficulty
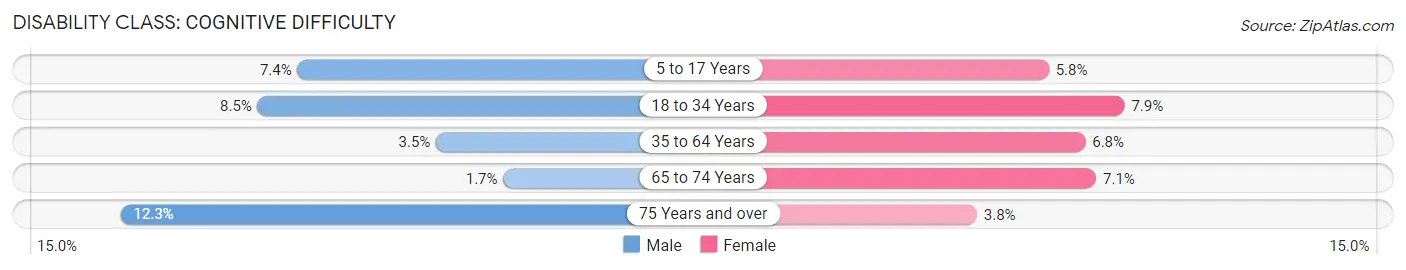
| Age Bracket | Male | Female |
| 5 to 17 Years | 102 (7.4%) | 60 (5.8%) |
| 18 to 34 Years | 315 (8.5%) | 314 (7.9%) |
| 35 to 64 Years | 134 (3.5%) | 250 (6.8%) |
| 65 to 74 Years | 15 (1.7%) | 92 (7.1%) |
| 75 Years and over | 90 (12.3%) | 39 (3.8%) |
Disability Class: Ambulatory Difficulty
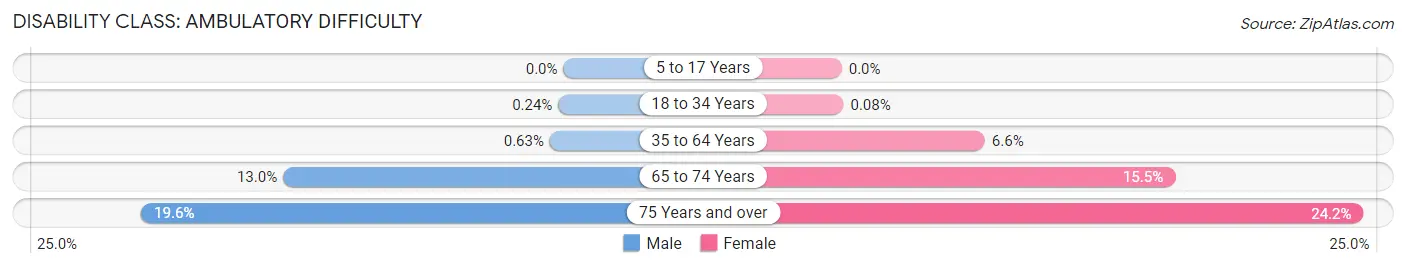
| Age Bracket | Male | Female |
| 5 to 17 Years | 0 (0.0%) | 0 (0.0%) |
| 18 to 34 Years | 9 (0.2%) | 3 (0.1%) |
| 35 to 64 Years | 24 (0.6%) | 245 (6.6%) |
| 65 to 74 Years | 117 (13.0%) | 201 (15.5%) |
| 75 Years and over | 143 (19.6%) | 251 (24.2%) |
Disability Class: Self-Care Difficulty
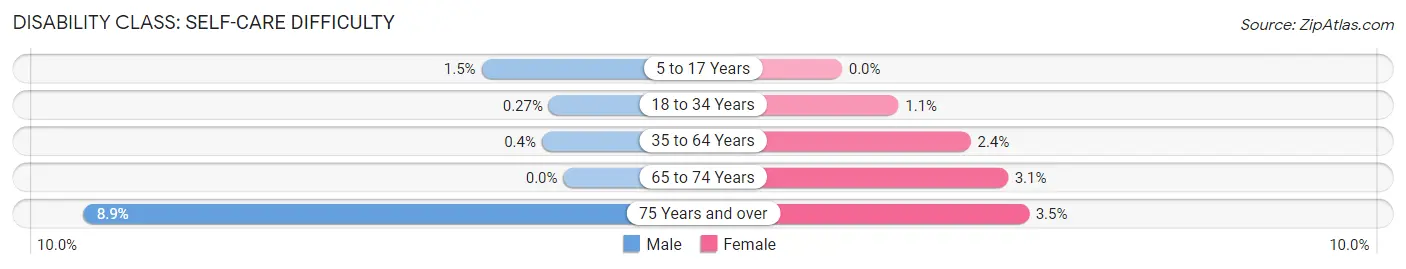
| Age Bracket | Male | Female |
| 5 to 17 Years | 21 (1.5%) | 0 (0.0%) |
| 18 to 34 Years | 10 (0.3%) | 42 (1.1%) |
| 35 to 64 Years | 15 (0.4%) | 88 (2.4%) |
| 65 to 74 Years | 0 (0.0%) | 40 (3.1%) |
| 75 Years and over | 65 (8.9%) | 36 (3.5%) |
Technology Access in Keene
Computing Device Access in Keene
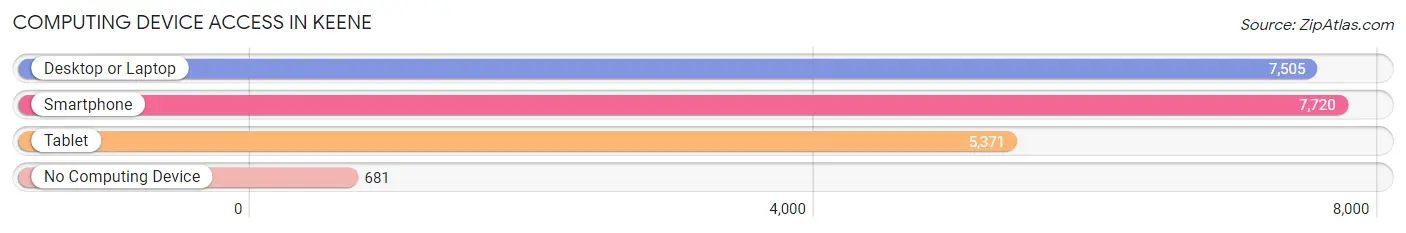
| Device Type | # Households | % Households |
| Desktop or Laptop | 7,505 | 81.1% |
| Smartphone | 7,720 | 83.4% |
| Tablet | 5,371 | 58.0% |
| No Computing Device | 681 | 7.4% |
| Total | 9,259 | 100.0% |
Internet Access in Keene
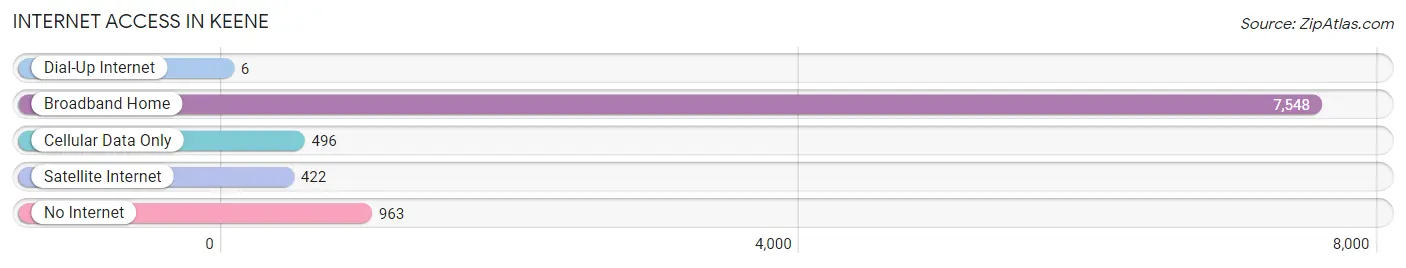
| Internet Type | # Households | % Households |
| Dial-Up Internet | 6 | 0.1% |
| Broadband Home | 7,548 | 81.5% |
| Cellular Data Only | 496 | 5.4% |
| Satellite Internet | 422 | 4.6% |
| No Internet | 963 | 10.4% |
| Total | 9,259 | 100.0% |
Keene Summary
Keene, New Hampshire is a small city located in the southwestern corner of the state. It is the county seat of Cheshire County and is home to a population of approximately 23,000 people. The city is situated in the Monadnock Region of the state, which is known for its rolling hills and picturesque landscapes.
Geography
Keene is located in the southwestern corner of New Hampshire, approximately 60 miles west of Concord, the state capital. The city is situated in the Monadnock Region of the state, which is known for its rolling hills and picturesque landscapes. The city is bordered by the towns of Swanzey, Westmoreland, Marlborough, and Sullivan. The city is located at the confluence of the Ashuelot and Contoocook Rivers, which form the Ashuelot River. The city is situated at an elevation of 890 feet above sea level.
History
Keene was first settled in 1736 by settlers from Massachusetts. The town was originally known as Upper Ashuelot and was incorporated in 1753. The town was renamed Keene in 1768, after Sir Benjamin Keene, a British diplomat. During the Revolutionary War, the town was the site of a major battle between the British and American forces.
In the 19th century, Keene became an important industrial center, with several mills and factories located in the city. The city was also home to several prominent educational institutions, including Keene State College and Franklin Pierce University.
Economy
Keene is home to a diverse economy, with a variety of industries represented in the city. The largest employers in the city are the Keene State College, the Cheshire Medical Center, and the Franklin Pierce University. Other major employers in the city include the Keene Sentinel newspaper, the Keene Public Library, and the Keene Country Club.
The city is also home to a number of small businesses, including restaurants, retail stores, and professional services. The city is also home to a number of manufacturing companies, including the Keene Corporation, which produces a variety of products, including medical equipment, automotive parts, and industrial machinery.
Demographics
As of the 2010 census, the population of Keene was 22,958. The racial makeup of the city was 94.3% White, 1.3% African American, 0.5% Native American, 1.2% Asian, 0.1% Pacific Islander, 1.2% from other races, and 1.5% from two or more races. Hispanic or Latino of any race were 3.2% of the population.
The median income for a household in the city was $41,945, and the median income for a family was $51,945. The per capita income for the city was $21,945. About 11.2% of families and 15.2% of the population were below the poverty line, including 22.2% of those under age 18 and 8.2% of those age 65 or over.
Keene is a small city with a rich history and a diverse economy. The city is home to a variety of industries, educational institutions, and small businesses. The city is also home to a diverse population, with a variety of racial and ethnic backgrounds represented in the city.
Common Questions
What is Per Capita Income in Keene?
Per Capita income in Keene is $37,968.
What is the Median Family Income in Keene?
Median Family Income in Keene is $93,196.
What is the Median Household income in Keene?
Median Household Income in Keene is $69,381.
What is Income or Wage Gap in Keene?
Income or Wage Gap in Keene is 17.7%.
Women in Keene earn 82.3 cents for every dollar earned by a man.
What is Inequality or Gini Index in Keene?
Inequality or Gini Index in Keene is 0.44.
What is the Total Population of Keene?
Total Population of Keene is 22,907.
What is the Total Male Population of Keene?
Total Male Population of Keene is 11,235.
What is the Total Female Population of Keene?
Total Female Population of Keene is 11,672.
What is the Ratio of Males per 100 Females in Keene?
There are 96.26 Males per 100 Females in Keene.
What is the Ratio of Females per 100 Males in Keene?
There are 103.89 Females per 100 Males in Keene.
What is the Median Population Age in Keene?
Median Population Age in Keene is 36.1 Years.
What is the Average Family Size in Keene
Average Family Size in Keene is 2.9 People.
What is the Average Household Size in Keene
Average Household Size in Keene is 2.2 People.
How Large is the Labor Force in Keene?
There are 12,282 People in the Labor Forcein in Keene.
What is the Percentage of People in the Labor Force in Keene?
61.2% of People are in the Labor Force in Keene.
What is the Unemployment Rate in Keene?
Unemployment Rate in Keene is 2.6%.