Plymouth, NH Map & Demographics
Plymouth Map
Plymouth Overview
$32,100
PER CAPITA INCOME
$100,812
AVG FAMILY INCOME
$62,172
AVG HOUSEHOLD INCOME
7.4%
WAGE / INCOME GAP [ % ]
92.6¢/ $1
WAGE / INCOME GAP [ $ ]
0.47
INEQUALITY / GINI INDEX
4,428
TOTAL POPULATION
2,464
MALE POPULATION
1,964
FEMALE POPULATION
125.46
MALES / 100 FEMALES
79.71
FEMALES / 100 MALES
24.0
MEDIAN AGE
2.9
AVG FAMILY SIZE
2.3
AVG HOUSEHOLD SIZE
2,401
LABOR FORCE [ PEOPLE ]
59.9%
PERCENT IN LABOR FORCE
6.6%
UNEMPLOYMENT RATE
Plymouth Zip Codes
Plymouth Area Codes
Income in Plymouth
Income Overview in Plymouth
Per Capita Income in Plymouth is $32,100, while median incomes of families and households are $100,812 and $62,172 respectively.
| Characteristic | Number | Measure |
| Per Capita Income | 4,428 | $32,100 |
| Median Family Income | 690 | $100,812 |
| Mean Family Income | 690 | $129,363 |
| Median Household Income | 1,404 | $62,172 |
| Mean Household Income | 1,404 | $88,682 |
| Income Deficit | 690 | $0 |
| Wage / Income Gap (%) | 4,428 | 7.40% |
| Wage / Income Gap ($) | 4,428 | 92.60¢ per $1 |
| Gini / Inequality Index | 4,428 | 0.47 |
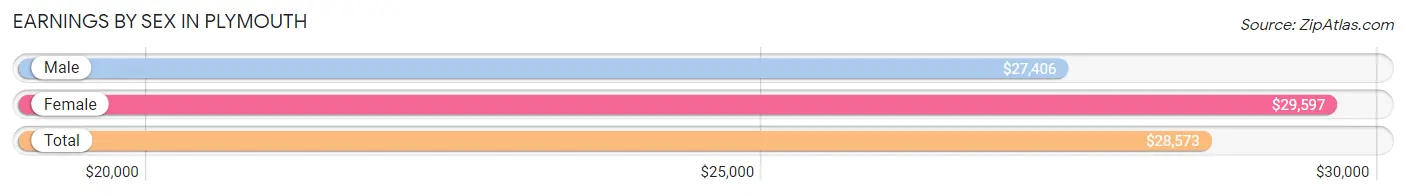
Earnings by Sex in Plymouth
Average Earnings in Plymouth are $28,573, $27,406 for men and $29,597 for women, a difference of 7.4%.
| Sex | Number | Average Earnings |
| Male | 1,689 (57.4%) | $27,406 |
| Female | 1,256 (42.6%) | $29,597 |
| Total | 2,945 (100.0%) | $28,573 |
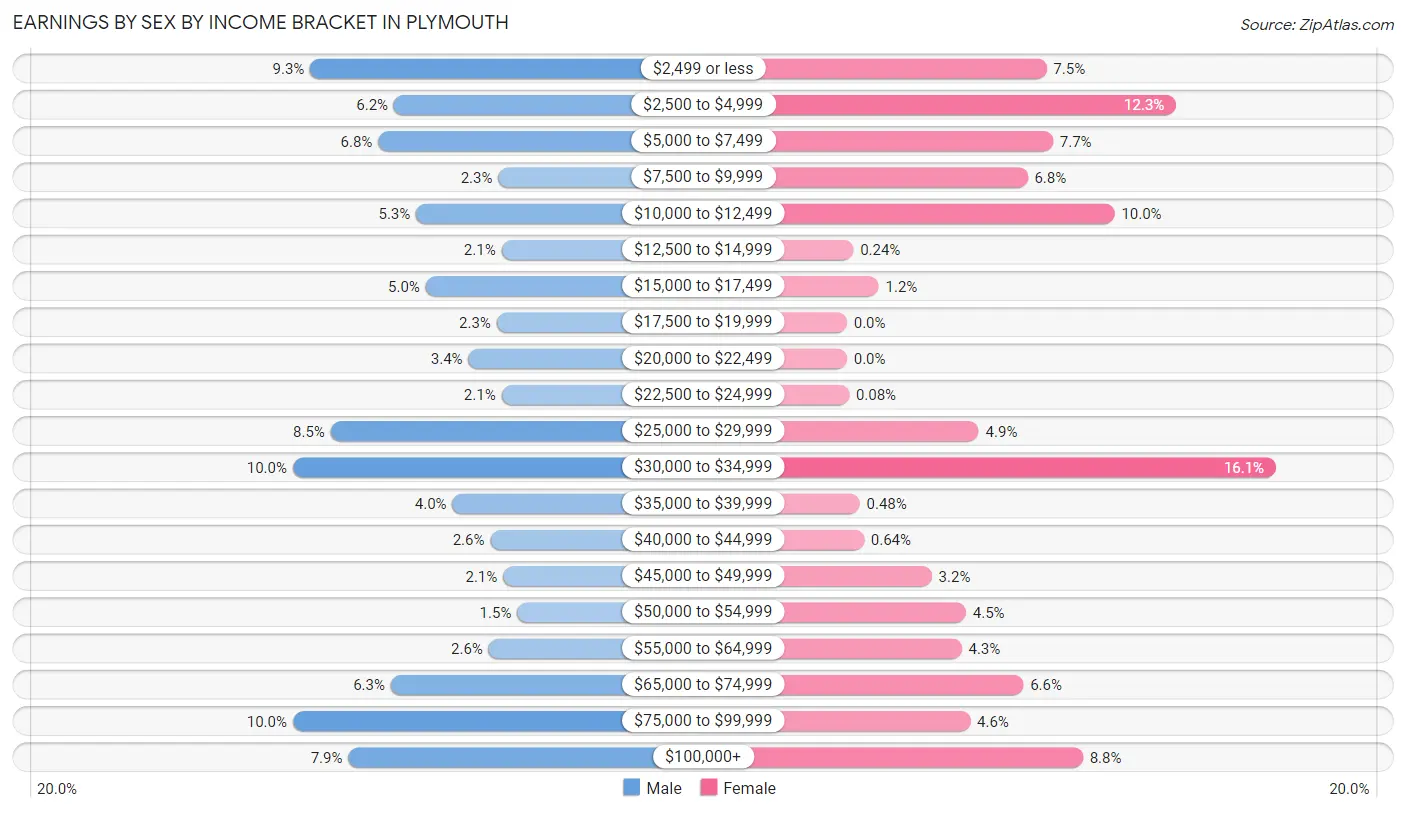
Earnings by Sex by Income Bracket in Plymouth
The most common earnings brackets in Plymouth are $30,000 to $34,999 for men (168 | 10.0%) and $30,000 to $34,999 for women (202 | 16.1%).
| Income | Male | Female |
| $2,499 or less | 157 (9.3%) | 94 (7.5%) |
| $2,500 to $4,999 | 104 (6.2%) | 155 (12.3%) |
| $5,000 to $7,499 | 114 (6.8%) | 97 (7.7%) |
| $7,500 to $9,999 | 38 (2.2%) | 85 (6.8%) |
| $10,000 to $12,499 | 90 (5.3%) | 126 (10.0%) |
| $12,500 to $14,999 | 36 (2.1%) | 3 (0.2%) |
| $15,000 to $17,499 | 84 (5.0%) | 15 (1.2%) |
| $17,500 to $19,999 | 39 (2.3%) | 0 (0.0%) |
| $20,000 to $22,499 | 57 (3.4%) | 0 (0.0%) |
| $22,500 to $24,999 | 36 (2.1%) | 1 (0.1%) |
| $25,000 to $29,999 | 144 (8.5%) | 62 (4.9%) |
| $30,000 to $34,999 | 168 (10.0%) | 202 (16.1%) |
| $35,000 to $39,999 | 67 (4.0%) | 6 (0.5%) |
| $40,000 to $44,999 | 43 (2.5%) | 8 (0.6%) |
| $45,000 to $49,999 | 35 (2.1%) | 40 (3.2%) |
| $50,000 to $54,999 | 26 (1.5%) | 56 (4.5%) |
| $55,000 to $64,999 | 44 (2.6%) | 54 (4.3%) |
| $65,000 to $74,999 | 106 (6.3%) | 83 (6.6%) |
| $75,000 to $99,999 | 168 (10.0%) | 58 (4.6%) |
| $100,000+ | 133 (7.9%) | 111 (8.8%) |
| Total | 1,689 (100.0%) | 1,256 (100.0%) |
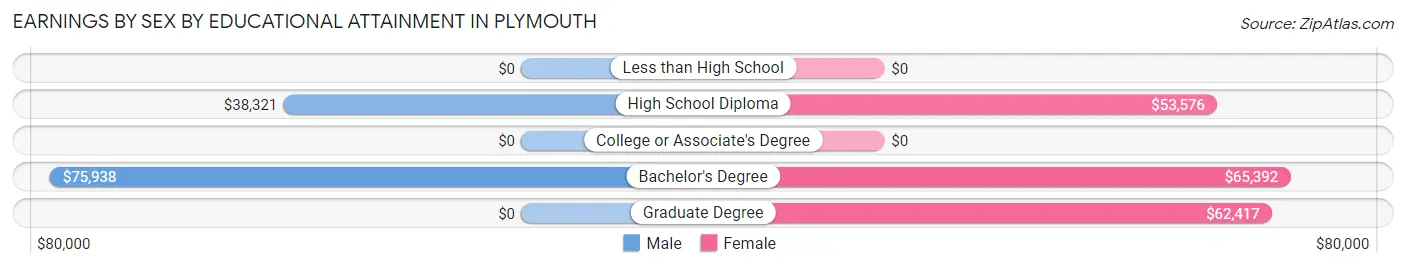
Earnings by Sex by Educational Attainment in Plymouth
Average earnings in Plymouth are $64,318 for men and $52,545 for women, a difference of 18.3%. Men with an educational attainment of bachelor's degree enjoy the highest average annual earnings of $75,938, while those with high school diploma education earn the least with $38,321. Women with an educational attainment of bachelor's degree earn the most with the average annual earnings of $65,392, while those with high school diploma education have the smallest earnings of $53,576.
| Educational Attainment | Male Income | Female Income |
| Less than High School | - | - |
| High School Diploma | $38,321 | $53,576 |
| College or Associate's Degree | - | - |
| Bachelor's Degree | $75,938 | $65,392 |
| Graduate Degree | - | - |
| Total | $64,318 | $52,545 |
Family Income in Plymouth
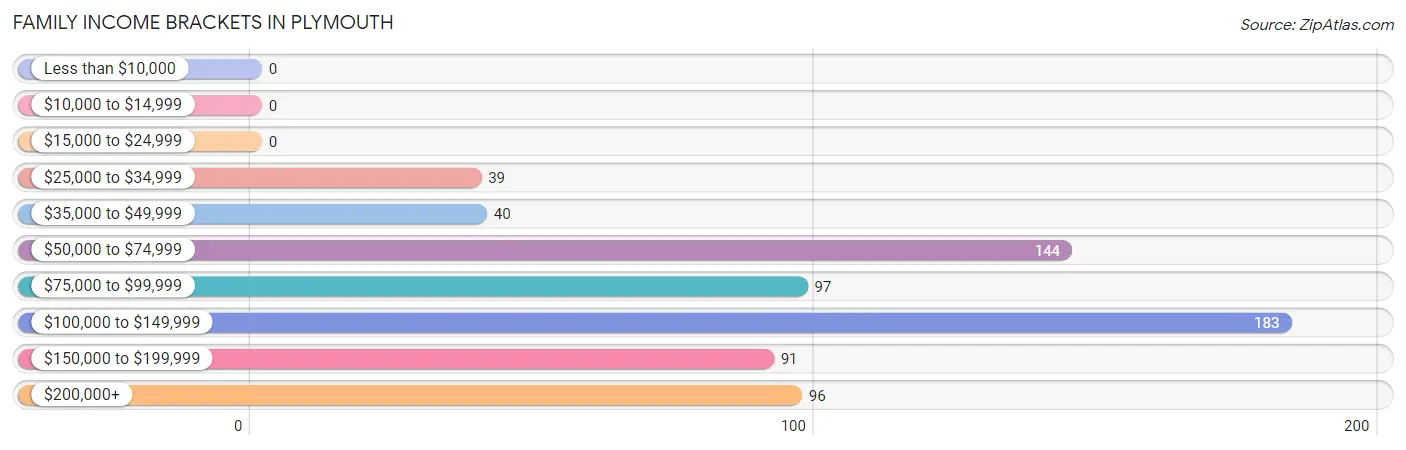
Family Income Brackets in Plymouth
According to the Plymouth family income data, there are 183 families falling into the $100,000 to $149,999 income range, which is the most common income bracket and makes up 26.5% of all families.
| Income Bracket | # Families | % Families |
| Less than $10,000 | 0 | 0.0% |
| $10,000 to $14,999 | 0 | 0.0% |
| $15,000 to $24,999 | 0 | 0.0% |
| $25,000 to $34,999 | 39 | 5.7% |
| $35,000 to $49,999 | 40 | 5.8% |
| $50,000 to $74,999 | 144 | 20.9% |
| $75,000 to $99,999 | 97 | 14.1% |
| $100,000 to $149,999 | 183 | 26.5% |
| $150,000 to $199,999 | 91 | 13.2% |
| $200,000+ | 96 | 13.9% |
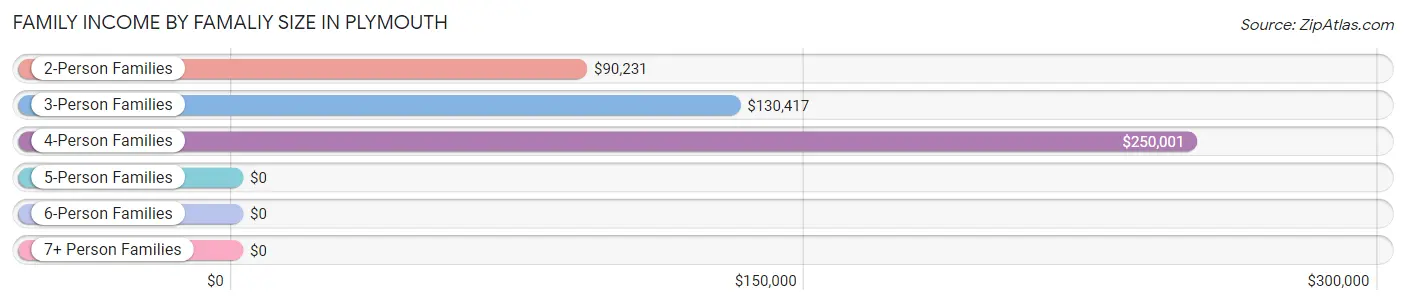
Family Income by Famaliy Size in Plymouth
4-person families (69 | 10.0%) account for the highest median family income in Plymouth with $250,001 per family, while 4-person families (69 | 10.0%) have the highest median income of $62,500 per family member.
| Income Bracket | # Families | Median Income |
| 2-Person Families | 387 (56.1%) | $90,231 |
| 3-Person Families | 140 (20.3%) | $130,417 |
| 4-Person Families | 69 (10.0%) | $250,001 |
| 5-Person Families | 77 (11.2%) | $0 |
| 6-Person Families | 17 (2.5%) | $0 |
| 7+ Person Families | 0 (0.0%) | $0 |
| Total | 690 (100.0%) | $100,812 |
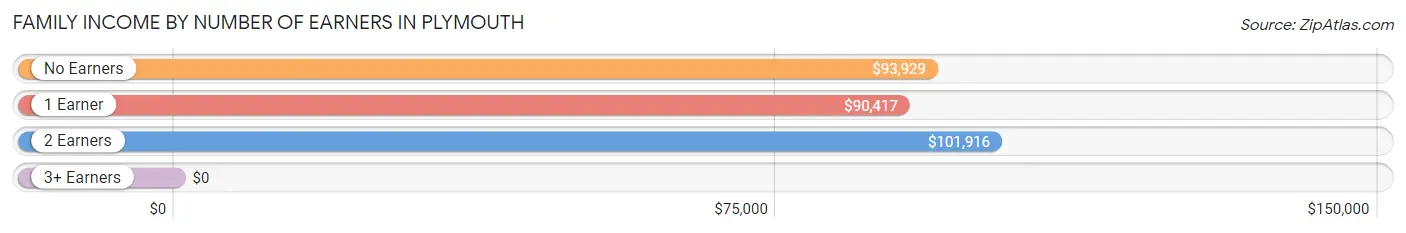
Family Income by Number of Earners in Plymouth
| Number of Earners | # Families | Median Income |
| No Earners | 66 (9.6%) | $93,929 |
| 1 Earner | 169 (24.5%) | $90,417 |
| 2 Earners | 398 (57.7%) | $101,916 |
| 3+ Earners | 57 (8.3%) | $0 |
| Total | 690 (100.0%) | $100,812 |
Household Income in Plymouth
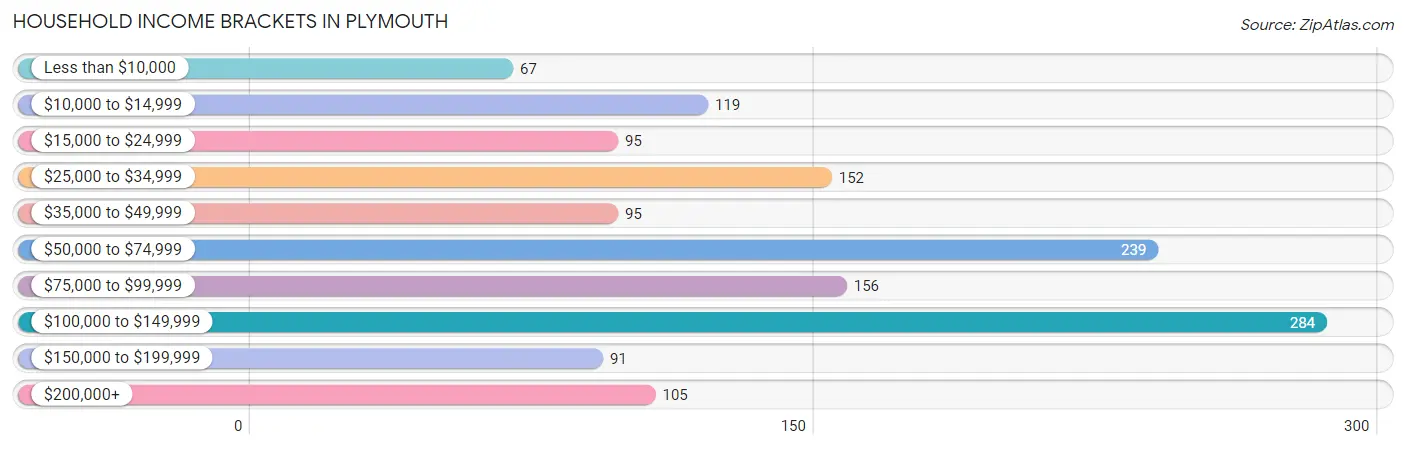
Household Income Brackets in Plymouth
With 284 households falling in the category, the $100,000 to $149,999 income range is the most frequent in Plymouth, accounting for 20.2% of all households. In contrast, only 67 households (4.8%) fall into the less than $10,000 income bracket, making it the least populous group.
| Income Bracket | # Households | % Households |
| Less than $10,000 | 67 | 4.8% |
| $10,000 to $14,999 | 119 | 8.5% |
| $15,000 to $24,999 | 95 | 6.8% |
| $25,000 to $34,999 | 152 | 10.8% |
| $35,000 to $49,999 | 95 | 6.8% |
| $50,000 to $74,999 | 239 | 17.0% |
| $75,000 to $99,999 | 156 | 11.1% |
| $100,000 to $149,999 | 284 | 20.2% |
| $150,000 to $199,999 | 91 | 6.5% |
| $200,000+ | 105 | 7.5% |
Household Income by Householder Age in Plymouth
The median household income in Plymouth is $62,172, with the highest median household income of $90,145 found in the 45 to 64 years age bracket for the primary householder. A total of 549 households (39.1%) fall into this category. Meanwhile, the 15 to 24 years age bracket for the primary householder has the lowest median household income of $0, with 87 households (6.2%) in this group.
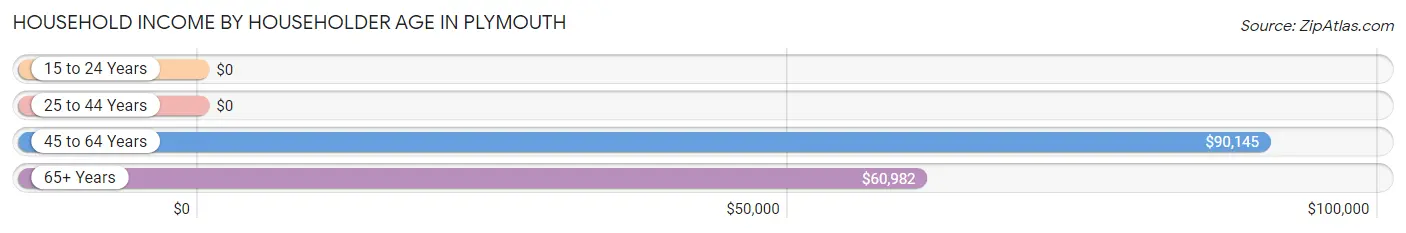
| Income Bracket | # Households | Median Income |
| 15 to 24 Years | 87 (6.2%) | $0 |
| 25 to 44 Years | 429 (30.6%) | $0 |
| 45 to 64 Years | 549 (39.1%) | $90,145 |
| 65+ Years | 339 (24.1%) | $60,982 |
| Total | 1,404 (100.0%) | $62,172 |
Poverty in Plymouth
Income Below Poverty by Sex and Age in Plymouth
With 11.8% poverty level for males and 6.6% for females among the residents of Plymouth, 18 to 24 year old males and 55 to 64 year old females are the most vulnerable to poverty, with 147 males (34.2%) and 86 females (32.2%) in their respective age groups living below the poverty level.
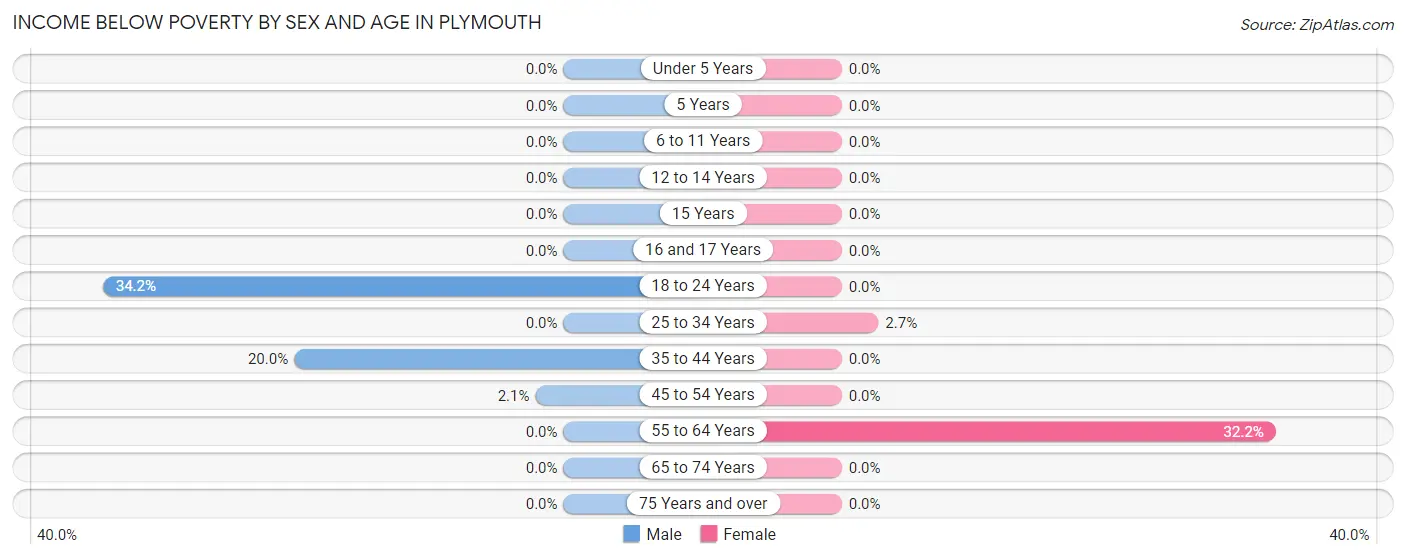
| Age Bracket | Male | Female |
| Under 5 Years | 0 (0.0%) | 0 (0.0%) |
| 5 Years | 0 (0.0%) | 0 (0.0%) |
| 6 to 11 Years | 0 (0.0%) | 0 (0.0%) |
| 12 to 14 Years | 0 (0.0%) | 0 (0.0%) |
| 15 Years | 0 (0.0%) | 0 (0.0%) |
| 16 and 17 Years | 0 (0.0%) | 0 (0.0%) |
| 18 to 24 Years | 147 (34.2%) | 0 (0.0%) |
| 25 to 34 Years | 0 (0.0%) | 4 (2.7%) |
| 35 to 44 Years | 67 (20.0%) | 0 (0.0%) |
| 45 to 54 Years | 4 (2.1%) | 0 (0.0%) |
| 55 to 64 Years | 0 (0.0%) | 86 (32.2%) |
| 65 to 74 Years | 0 (0.0%) | 0 (0.0%) |
| 75 Years and over | 0 (0.0%) | 0 (0.0%) |
| Total | 218 (11.8%) | 90 (6.6%) |
Income Above Poverty by Sex and Age in Plymouth
According to the poverty statistics in Plymouth, males aged 6 to 11 years and females aged under 5 years are the age groups that are most secure financially, with 100.0% of males and 100.0% of females in these age groups living above the poverty line.
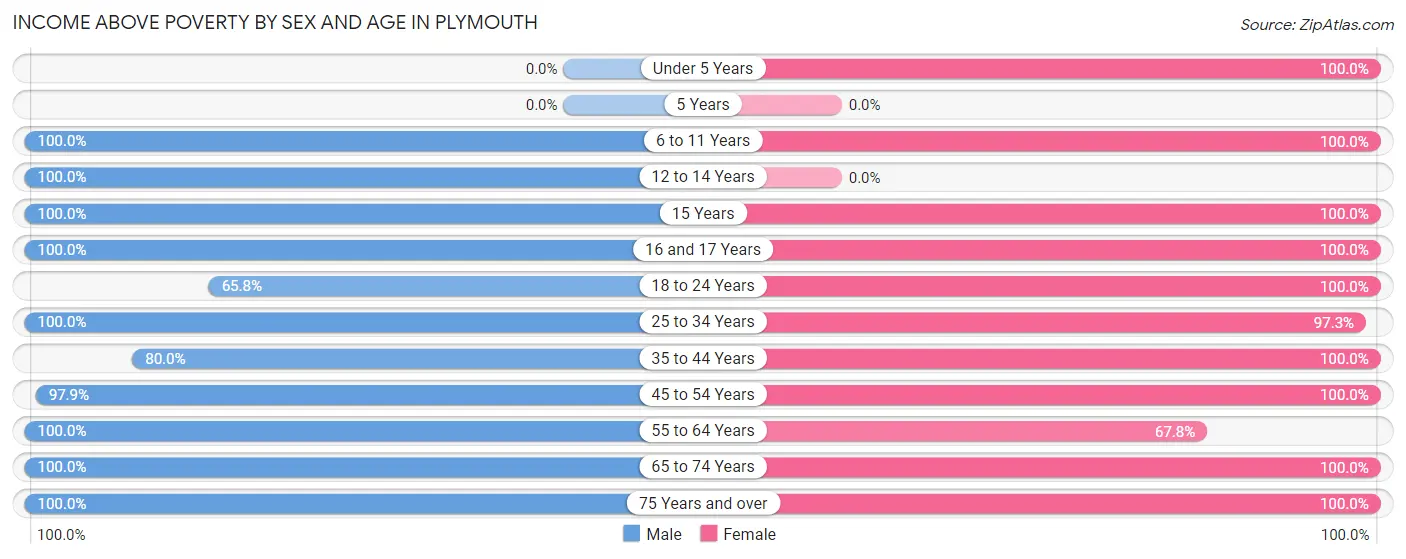
| Age Bracket | Male | Female |
| Under 5 Years | 0 (0.0%) | 29 (100.0%) |
| 5 Years | 0 (0.0%) | 0 (0.0%) |
| 6 to 11 Years | 190 (100.0%) | 45 (100.0%) |
| 12 to 14 Years | 45 (100.0%) | 0 (0.0%) |
| 15 Years | 49 (100.0%) | 45 (100.0%) |
| 16 and 17 Years | 48 (100.0%) | 46 (100.0%) |
| 18 to 24 Years | 283 (65.8%) | 135 (100.0%) |
| 25 to 34 Years | 147 (100.0%) | 143 (97.3%) |
| 35 to 44 Years | 268 (80.0%) | 198 (100.0%) |
| 45 to 54 Years | 188 (97.9%) | 212 (100.0%) |
| 55 to 64 Years | 153 (100.0%) | 181 (67.8%) |
| 65 to 74 Years | 121 (100.0%) | 184 (100.0%) |
| 75 Years and over | 130 (100.0%) | 67 (100.0%) |
| Total | 1,622 (88.1%) | 1,285 (93.4%) |
Income Below Poverty Among Married-Couple Families in Plymouth
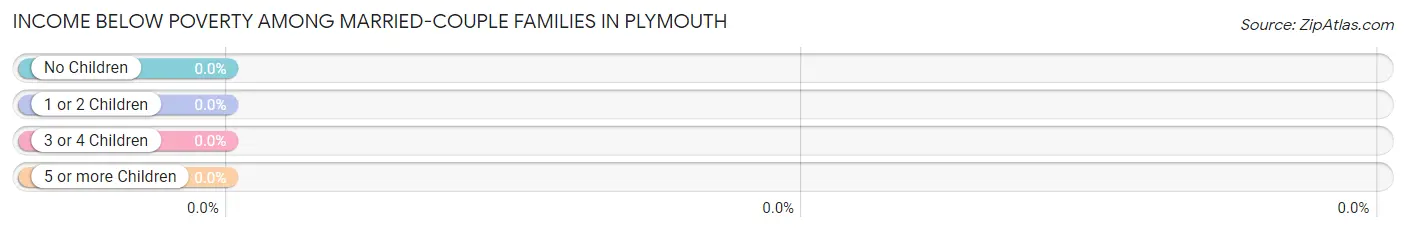
| Children | Above Poverty | Below Poverty |
| No Children | 262 (100.0%) | 0 (0.0%) |
| 1 or 2 Children | 135 (100.0%) | 0 (0.0%) |
| 3 or 4 Children | 77 (100.0%) | 0 (0.0%) |
| 5 or more Children | 0 (0.0%) | 0 (0.0%) |
| Total | 474 (100.0%) | 0 (0.0%) |
Income Below Poverty Among Single-Parent Households in Plymouth
| Children | Single Father | Single Mother |
| No Children | 0 (0.0%) | 0 (0.0%) |
| 1 or 2 Children | 0 (0.0%) | 0 (0.0%) |
| 3 or 4 Children | 0 (0.0%) | 0 (0.0%) |
| 5 or more Children | 0 (0.0%) | 0 (0.0%) |
| Total | 0 (0.0%) | 0 (0.0%) |
Income Below Poverty Among Married-Couple vs Single-Parent Households in Plymouth
| Children | Married-Couple Families | Single-Parent Households |
| No Children | 0 (0.0%) | 0 (0.0%) |
| 1 or 2 Children | 0 (0.0%) | 0 (0.0%) |
| 3 or 4 Children | 0 (0.0%) | 0 (0.0%) |
| 5 or more Children | 0 (0.0%) | 0 (0.0%) |
| Total | 0 (0.0%) | 0 (0.0%) |
Race in Plymouth
The most populous races in Plymouth are White / Caucasian (3,874 | 87.5%), Black / African American (209 | 4.7%), and Two or more Races (209 | 4.7%).
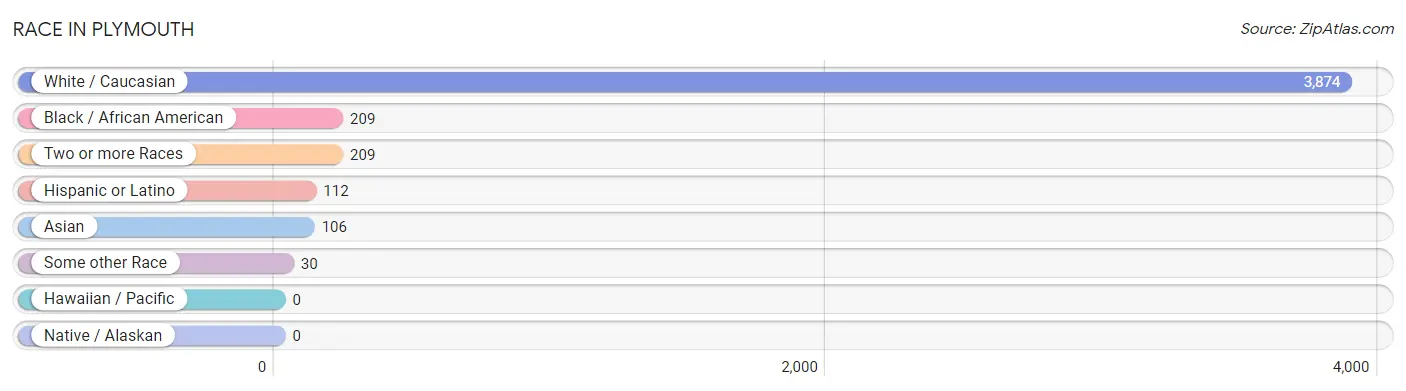
| Race | # Population | % Population |
| Asian | 106 | 2.4% |
| Black / African American | 209 | 4.7% |
| Hawaiian / Pacific | 0 | 0.0% |
| Hispanic or Latino | 112 | 2.5% |
| Native / Alaskan | 0 | 0.0% |
| White / Caucasian | 3,874 | 87.5% |
| Two or more Races | 209 | 4.7% |
| Some other Race | 30 | 0.7% |
| Total | 4,428 | 100.0% |
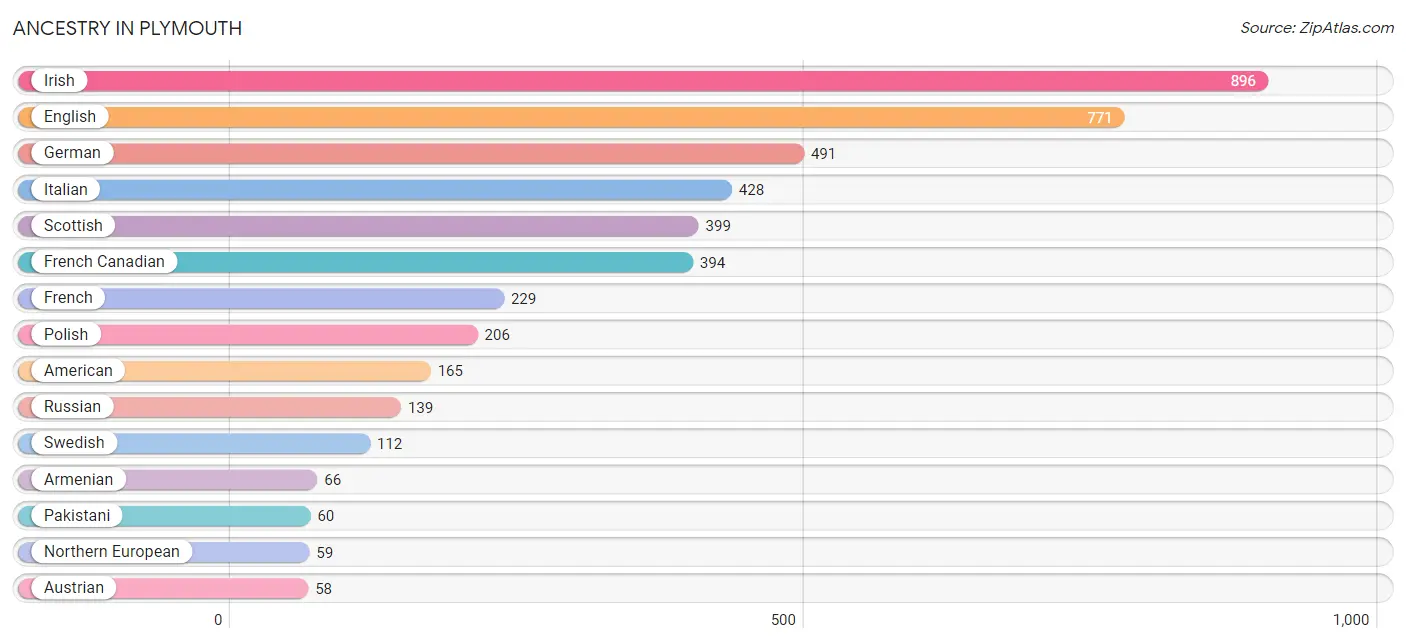
Ancestry in Plymouth
The most populous ancestries reported in Plymouth are Irish (896 | 20.2%), English (771 | 17.4%), German (491 | 11.1%), Italian (428 | 9.7%), and Scottish (399 | 9.0%), together accounting for 67.4% of all Plymouth residents.
| Ancestry | # Population | % Population |
| American | 165 | 3.7% |
| Armenian | 66 | 1.5% |
| Austrian | 58 | 1.3% |
| Bhutanese | 6 | 0.1% |
| British | 43 | 1.0% |
| Bulgarian | 3 | 0.1% |
| Canadian | 17 | 0.4% |
| Central American | 12 | 0.3% |
| Colombian | 4 | 0.1% |
| Costa Rican | 12 | 0.3% |
| Dominican | 6 | 0.1% |
| Dutch | 47 | 1.1% |
| Eastern European | 9 | 0.2% |
| English | 771 | 17.4% |
| European | 32 | 0.7% |
| Finnish | 4 | 0.1% |
| French | 229 | 5.2% |
| French Canadian | 394 | 8.9% |
| German | 491 | 11.1% |
| Greek | 9 | 0.2% |
| Haitian | 7 | 0.2% |
| Indian (Asian) | 57 | 1.3% |
| Irish | 896 | 20.2% |
| Italian | 428 | 9.7% |
| Mexican | 17 | 0.4% |
| Northern European | 59 | 1.3% |
| Pakistani | 60 | 1.4% |
| Polish | 206 | 4.6% |
| Portuguese | 15 | 0.3% |
| Puerto Rican | 5 | 0.1% |
| Romanian | 13 | 0.3% |
| Russian | 139 | 3.1% |
| Scandinavian | 16 | 0.4% |
| Scotch-Irish | 20 | 0.4% |
| Scottish | 399 | 9.0% |
| Senegalese | 3 | 0.1% |
| South American | 4 | 0.1% |
| Spaniard | 23 | 0.5% |
| Spanish | 38 | 0.9% |
| Sri Lankan | 3 | 0.1% |
| Subsaharan African | 3 | 0.1% |
| Swedish | 112 | 2.5% |
| Swiss | 27 | 0.6% |
| Thai | 23 | 0.5% |
| Ukrainian | 20 | 0.4% |
| Welsh | 23 | 0.5% | View All 46 Rows |
Immigrants in Plymouth
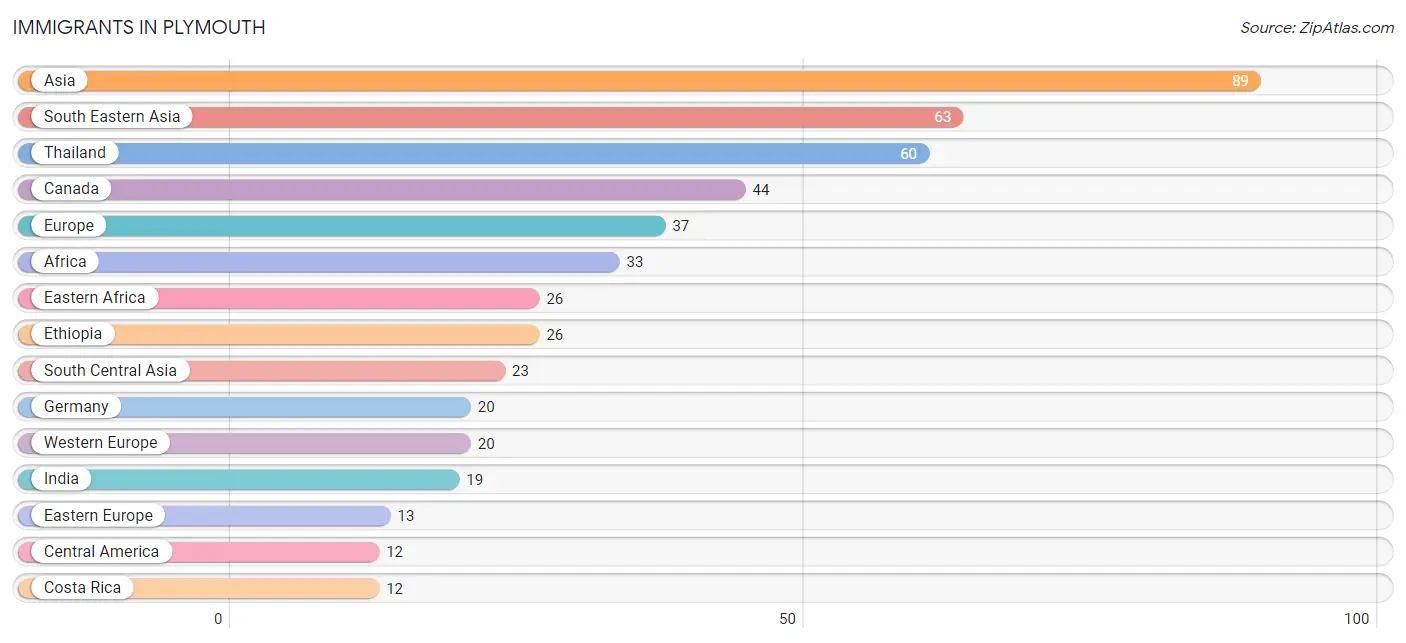
The most numerous immigrant groups reported in Plymouth came from Asia (89 | 2.0%), South Eastern Asia (63 | 1.4%), Thailand (60 | 1.4%), Canada (44 | 1.0%), and Europe (37 | 0.8%), together accounting for 6.6% of all Plymouth residents.
| Immigration Origin | # Population | % Population |
| Africa | 33 | 0.7% |
| Asia | 89 | 2.0% |
| Bulgaria | 3 | 0.1% |
| Canada | 44 | 1.0% |
| Central America | 12 | 0.3% |
| Costa Rica | 12 | 0.3% |
| Eastern Africa | 26 | 0.6% |
| Eastern Asia | 3 | 0.1% |
| Eastern Europe | 13 | 0.3% |
| Ethiopia | 26 | 0.6% |
| Europe | 37 | 0.8% |
| Germany | 20 | 0.4% |
| India | 19 | 0.4% |
| Japan | 3 | 0.1% |
| Latin America | 12 | 0.3% |
| Northern Europe | 4 | 0.1% |
| Pakistan | 4 | 0.1% |
| Poland | 10 | 0.2% |
| South Africa | 7 | 0.2% |
| South Central Asia | 23 | 0.5% |
| South Eastern Asia | 63 | 1.4% |
| Thailand | 60 | 1.4% |
| Vietnam | 3 | 0.1% |
| Western Europe | 20 | 0.4% | View All 24 Rows |
Sex and Age in Plymouth
Sex and Age in Plymouth
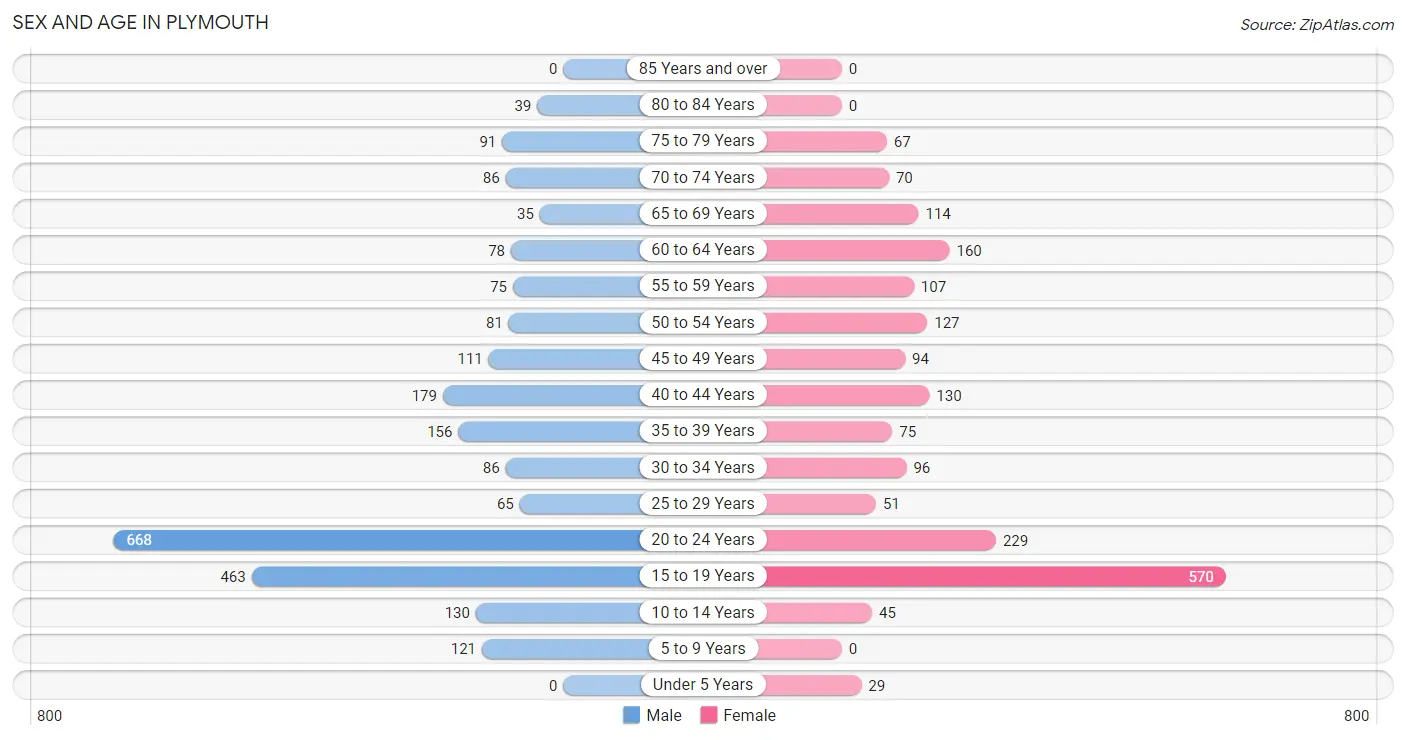
The most populous age groups in Plymouth are 20 to 24 Years (668 | 27.1%) for men and 15 to 19 Years (570 | 29.0%) for women.
| Age Bracket | Male | Female |
| Under 5 Years | 0 (0.0%) | 29 (1.5%) |
| 5 to 9 Years | 121 (4.9%) | 0 (0.0%) |
| 10 to 14 Years | 130 (5.3%) | 45 (2.3%) |
| 15 to 19 Years | 463 (18.8%) | 570 (29.0%) |
| 20 to 24 Years | 668 (27.1%) | 229 (11.7%) |
| 25 to 29 Years | 65 (2.6%) | 51 (2.6%) |
| 30 to 34 Years | 86 (3.5%) | 96 (4.9%) |
| 35 to 39 Years | 156 (6.3%) | 75 (3.8%) |
| 40 to 44 Years | 179 (7.3%) | 130 (6.6%) |
| 45 to 49 Years | 111 (4.5%) | 94 (4.8%) |
| 50 to 54 Years | 81 (3.3%) | 127 (6.5%) |
| 55 to 59 Years | 75 (3.0%) | 107 (5.4%) |
| 60 to 64 Years | 78 (3.2%) | 160 (8.2%) |
| 65 to 69 Years | 35 (1.4%) | 114 (5.8%) |
| 70 to 74 Years | 86 (3.5%) | 70 (3.6%) |
| 75 to 79 Years | 91 (3.7%) | 67 (3.4%) |
| 80 to 84 Years | 39 (1.6%) | 0 (0.0%) |
| 85 Years and over | 0 (0.0%) | 0 (0.0%) |
| Total | 2,464 (100.0%) | 1,964 (100.0%) |
Families and Households in Plymouth
Median Family Size in Plymouth
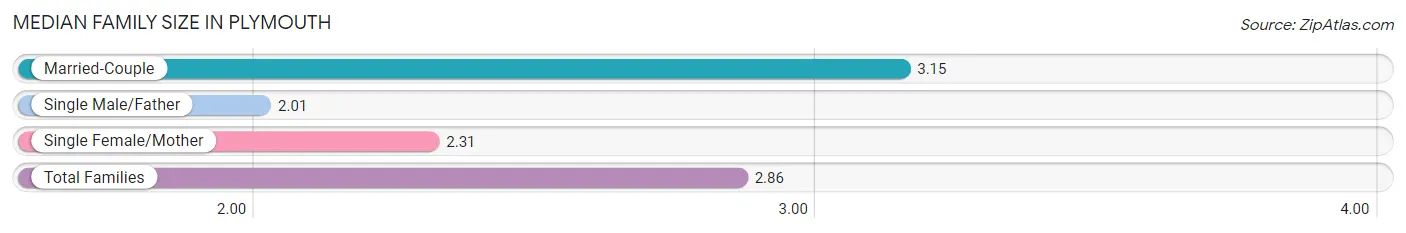
The median family size in Plymouth is 2.86 persons per family, with married-couple families (474 | 68.7%) accounting for the largest median family size of 3.15 persons per family. On the other hand, single male/father families (67 | 9.7%) represent the smallest median family size with 2.01 persons per family.
| Family Type | # Families | Family Size |
| Married-Couple | 474 (68.7%) | 3.15 |
| Single Male/Father | 67 (9.7%) | 2.01 |
| Single Female/Mother | 149 (21.6%) | 2.31 |
| Total Families | 690 (100.0%) | 2.86 |
Median Household Size in Plymouth
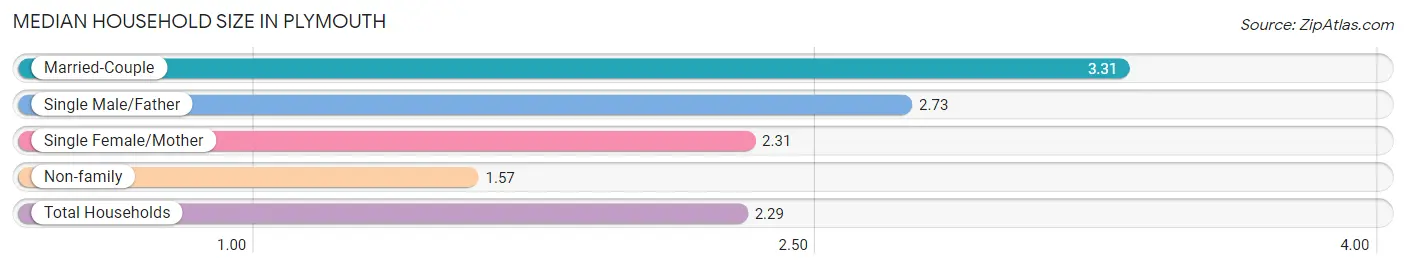
The median household size in Plymouth is 2.29 persons per household, with married-couple households (474 | 33.8%) accounting for the largest median household size of 3.31 persons per household. non-family households (714 | 50.8%) represent the smallest median household size with 1.57 persons per household.
| Household Type | # Households | Household Size |
| Married-Couple | 474 (33.8%) | 3.31 |
| Single Male/Father | 67 (4.8%) | 2.73 |
| Single Female/Mother | 149 (10.6%) | 2.31 |
| Non-family | 714 (50.8%) | 1.57 |
| Total Households | 1,404 (100.0%) | 2.29 |
Household Size by Marriage Status in Plymouth
Out of a total of 1,404 households in Plymouth, 690 (49.1%) are family households, while 714 (50.8%) are nonfamily households. The most numerous type of family households are 2-person households, comprising 301, and the most common type of nonfamily households are 1-person households, comprising 589.
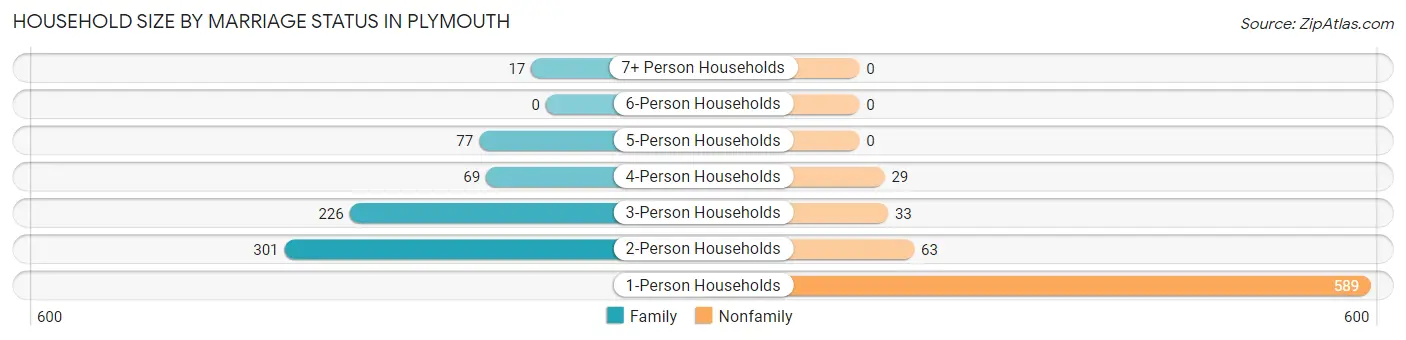
| Household Size | Family Households | Nonfamily Households |
| 1-Person Households | - | 589 (41.9%) |
| 2-Person Households | 301 (21.4%) | 63 (4.5%) |
| 3-Person Households | 226 (16.1%) | 33 (2.4%) |
| 4-Person Households | 69 (4.9%) | 29 (2.1%) |
| 5-Person Households | 77 (5.5%) | 0 (0.0%) |
| 6-Person Households | 0 (0.0%) | 0 (0.0%) |
| 7+ Person Households | 17 (1.2%) | 0 (0.0%) |
| Total | 690 (49.1%) | 714 (50.8%) |
Female Fertility in Plymouth
Fertility by Age in Plymouth
Average fertility rate in Plymouth is 12.0 births per 1,000 women. Women in the age bracket of 20 to 34 years have the highest fertility rate with 40.0 births per 1,000 women. Women in the age bracket of 20 to 34 years acount for 100.0% of all women with births.
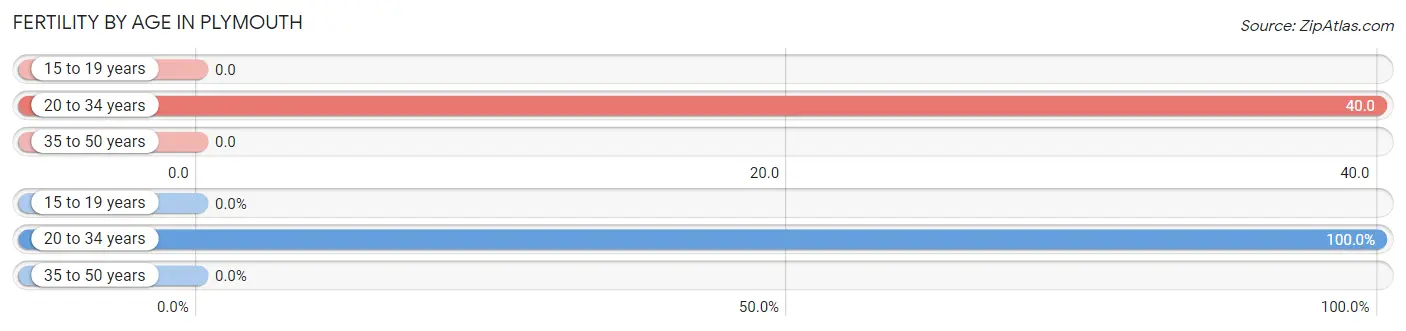
| Age Bracket | Women with Births | Births / 1,000 Women |
| 15 to 19 years | 0 (0.0%) | 0.0 |
| 20 to 34 years | 15 (100.0%) | 40.0 |
| 35 to 50 years | 0 (0.0%) | 0.0 |
| Total | 15 (100.0%) | 12.0 |
Fertility by Age by Marriage Status in Plymouth
86.7% of women with births (15) in Plymouth are married. The highest percentage of unmarried women with births falls into 20 to 34 years age bracket with 13.3% of them unmarried at the time of birth, while the lowest percentage of unmarried women with births belong to 20 to 34 years age bracket with 13.3% of them unmarried.
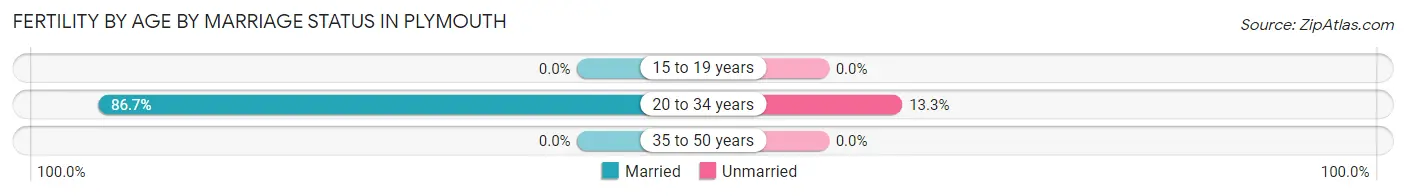
| Age Bracket | Married | Unmarried |
| 15 to 19 years | 0 (0.0%) | 0 (0.0%) |
| 20 to 34 years | 13 (86.7%) | 2 (13.3%) |
| 35 to 50 years | 0 (0.0%) | 0 (0.0%) |
| Total | 13 (86.7%) | 2 (13.3%) |
Fertility by Education in Plymouth
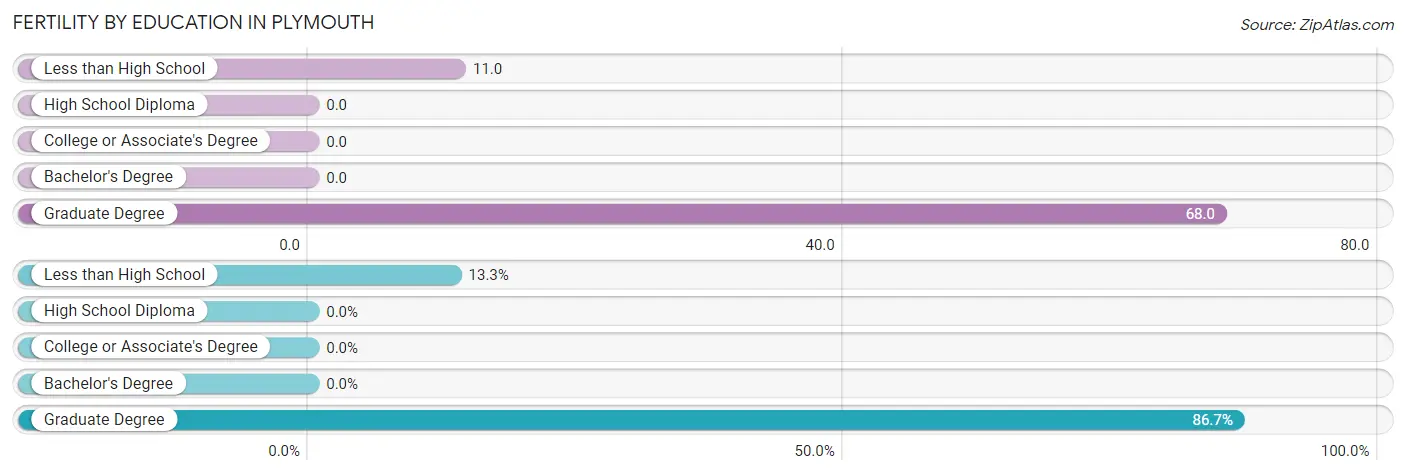
| Educational Attainment | Women with Births | Births / 1,000 Women |
| Less than High School | 2 (13.3%) | 11.0 |
| High School Diploma | 0 (0.0%) | 0.0 |
| College or Associate's Degree | 0 (0.0%) | 0.0 |
| Bachelor's Degree | 0 (0.0%) | 0.0 |
| Graduate Degree | 13 (86.7%) | 68.0 |
| Total | 15 (100.0%) | 12.0 |
Fertility by Education by Marriage Status in Plymouth
13.3% of women with births in Plymouth are unmarried. Women with the educational attainment of graduate degree are most likely to be married with 100.0% of them married at childbirth, while women with the educational attainment of less than high school are least likely to be married with 100.0% of them unmarried at childbirth.
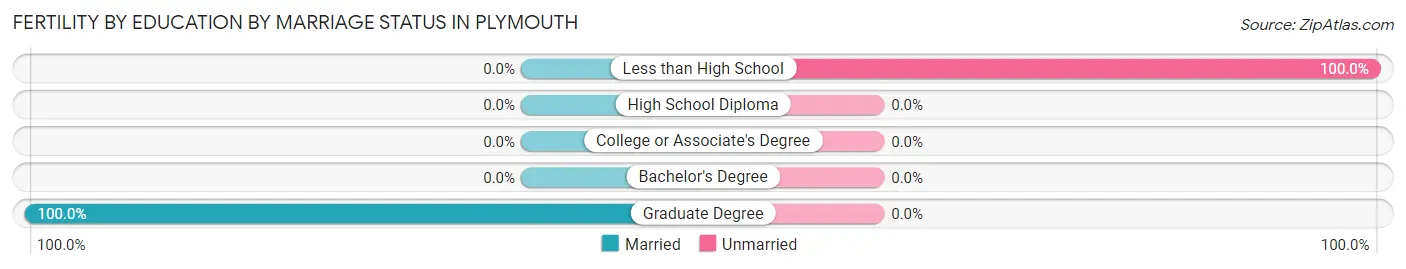
| Educational Attainment | Married | Unmarried |
| Less than High School | 0 (0.0%) | 2 (100.0%) |
| High School Diploma | 0 (0.0%) | 0 (0.0%) |
| College or Associate's Degree | 0 (0.0%) | 0 (0.0%) |
| Bachelor's Degree | 0 (0.0%) | 0 (0.0%) |
| Graduate Degree | 13 (100.0%) | 0 (0.0%) |
| Total | 13 (86.7%) | 2 (13.3%) |
Employment Characteristics in Plymouth
Employment by Class of Employer in Plymouth
Among the 2,120 employed individuals in Plymouth, private company employees (1,150 | 54.2%), state government employees (330 | 15.6%), and not-for-profit organizations (246 | 11.6%) make up the most common classes of employment.
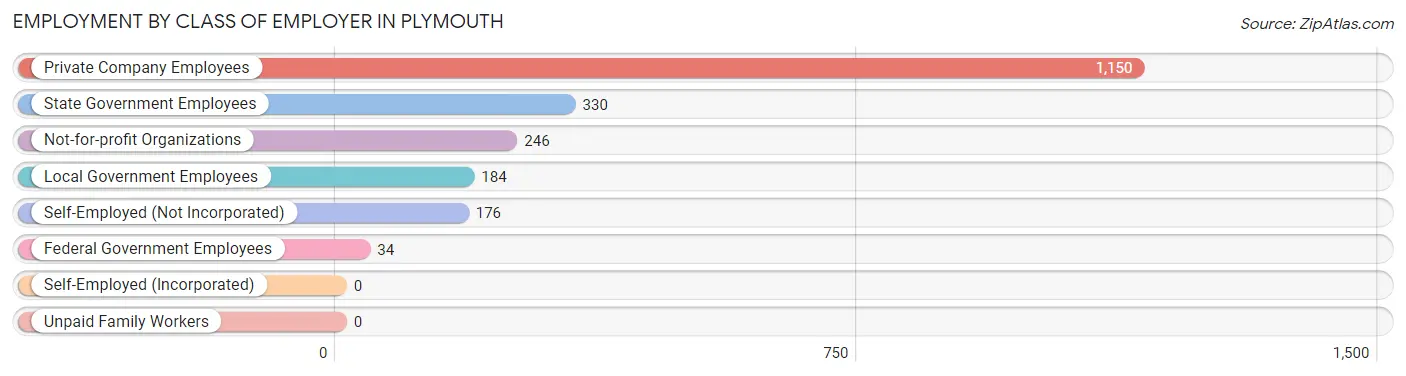
| Employer Class | # Employees | % Employees |
| Private Company Employees | 1,150 | 54.2% |
| Self-Employed (Incorporated) | 0 | 0.0% |
| Self-Employed (Not Incorporated) | 176 | 8.3% |
| Not-for-profit Organizations | 246 | 11.6% |
| Local Government Employees | 184 | 8.7% |
| State Government Employees | 330 | 15.6% |
| Federal Government Employees | 34 | 1.6% |
| Unpaid Family Workers | 0 | 0.0% |
| Total | 2,120 | 100.0% |
Employment Status by Age in Plymouth
According to the labor force statistics for Plymouth, out of the total population over 16 years of age (4,009), 59.9% or 2,401 individuals are in the labor force, with 6.6% or 158 of them unemployed. The age group with the highest labor force participation rate is 25 to 29 years, with 100.0% or 116 individuals in the labor force. Within the labor force, the 16 to 19 years age range has the highest percentage of unemployed individuals, with 32.5% or 121 of them being unemployed.
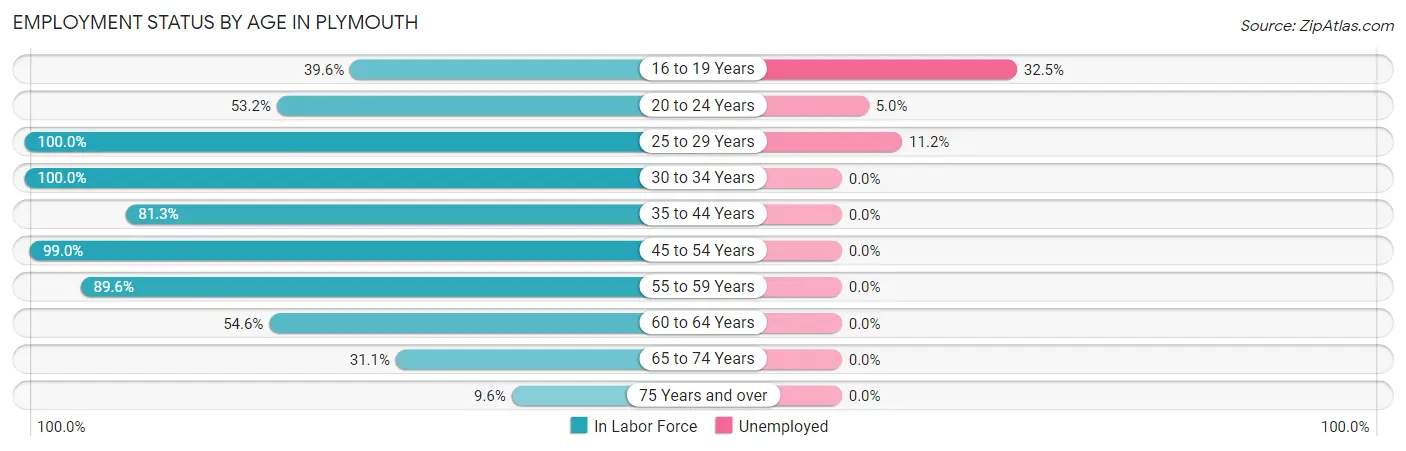
| Age Bracket | In Labor Force | Unemployed |
| 16 to 19 Years | 372 (39.6%) | 121 (32.5%) |
| 20 to 24 Years | 477 (53.2%) | 24 (5.0%) |
| 25 to 29 Years | 116 (100.0%) | 13 (11.2%) |
| 30 to 34 Years | 182 (100.0%) | 0 (0.0%) |
| 35 to 44 Years | 439 (81.3%) | 0 (0.0%) |
| 45 to 54 Years | 409 (99.0%) | 0 (0.0%) |
| 55 to 59 Years | 163 (89.6%) | 0 (0.0%) |
| 60 to 64 Years | 130 (54.6%) | 0 (0.0%) |
| 65 to 74 Years | 95 (31.1%) | 0 (0.0%) |
| 75 Years and over | 19 (9.6%) | 0 (0.0%) |
| Total | 2,401 (59.9%) | 158 (6.6%) |
Employment Status by Educational Attainment in Plymouth
According to labor force statistics for Plymouth, 86.1% of individuals (1,439) out of the total population between 25 and 64 years of age (1,671) are in the labor force, with 0.9% or 13 of them being unemployed. The group with the highest labor force participation rate are those with the educational attainment of bachelor's degree or higher, with 97.0% or 851 individuals in the labor force. Within the labor force, individuals with bachelor's degree or higher education have the highest percentage of unemployment, with 1.5% or 13 of them being unemployed.
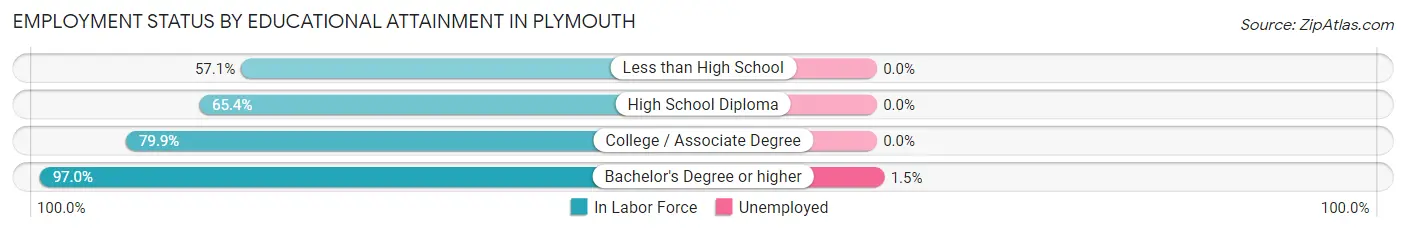
| Educational Attainment | In Labor Force | Unemployed |
| Less than High School | 8 (57.1%) | 0 (0.0%) |
| High School Diploma | 195 (65.4%) | 0 (0.0%) |
| College / Associate Degree | 385 (79.9%) | 0 (0.0%) |
| Bachelor's Degree or higher | 851 (97.0%) | 13 (1.5%) |
| Total | 1,439 (86.1%) | 15 (0.9%) |
Employment Occupations by Sex in Plymouth
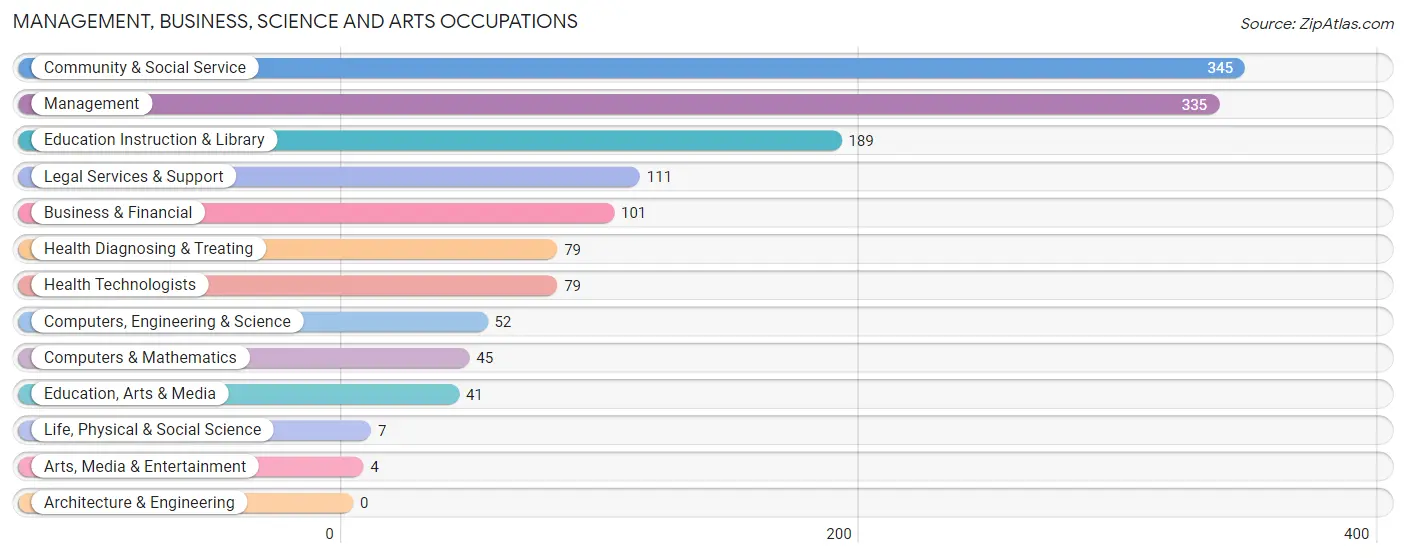
Management, Business, Science and Arts Occupations
The most common Management, Business, Science and Arts occupations in Plymouth are Community & Social Service (345 | 15.4%), Management (335 | 14.9%), Education Instruction & Library (189 | 8.4%), Legal Services & Support (111 | 5.0%), and Business & Financial (101 | 4.5%).
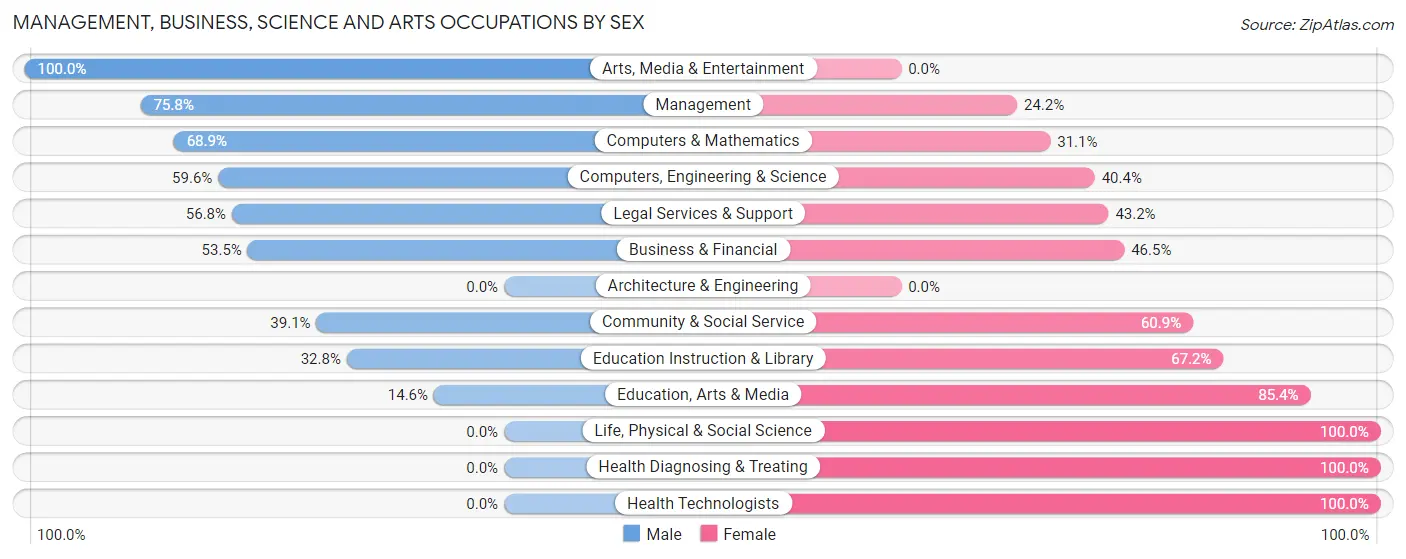
Management, Business, Science and Arts Occupations by Sex
Within the Management, Business, Science and Arts occupations in Plymouth, the most male-oriented occupations are Arts, Media & Entertainment (100.0%), Management (75.8%), and Computers & Mathematics (68.9%), while the most female-oriented occupations are Life, Physical & Social Science (100.0%), Health Diagnosing & Treating (100.0%), and Health Technologists (100.0%).
| Occupation | Male | Female |
| Management | 254 (75.8%) | 81 (24.2%) |
| Business & Financial | 54 (53.5%) | 47 (46.5%) |
| Computers, Engineering & Science | 31 (59.6%) | 21 (40.4%) |
| Computers & Mathematics | 31 (68.9%) | 14 (31.1%) |
| Architecture & Engineering | 0 (0.0%) | 0 (0.0%) |
| Life, Physical & Social Science | 0 (0.0%) | 7 (100.0%) |
| Community & Social Service | 135 (39.1%) | 210 (60.9%) |
| Education, Arts & Media | 6 (14.6%) | 35 (85.4%) |
| Legal Services & Support | 63 (56.8%) | 48 (43.2%) |
| Education Instruction & Library | 62 (32.8%) | 127 (67.2%) |
| Arts, Media & Entertainment | 4 (100.0%) | 0 (0.0%) |
| Health Diagnosing & Treating | 0 (0.0%) | 79 (100.0%) |
| Health Technologists | 0 (0.0%) | 79 (100.0%) |
| Total (Category) | 474 (52.0%) | 438 (48.0%) |
| Total (Overall) | 1,175 (52.4%) | 1,069 (47.6%) |
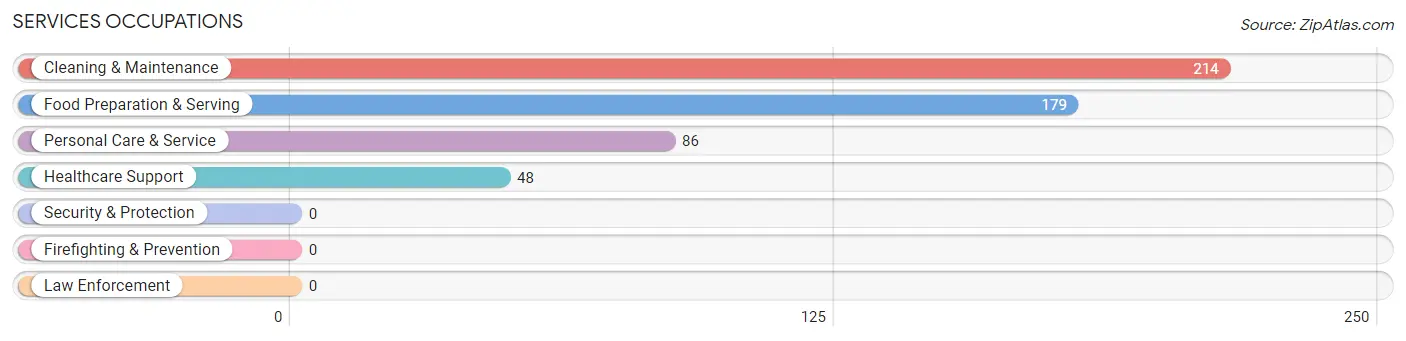
Services Occupations
The most common Services occupations in Plymouth are Cleaning & Maintenance (214 | 9.5%), Food Preparation & Serving (179 | 8.0%), Personal Care & Service (86 | 3.8%), and Healthcare Support (48 | 2.1%).
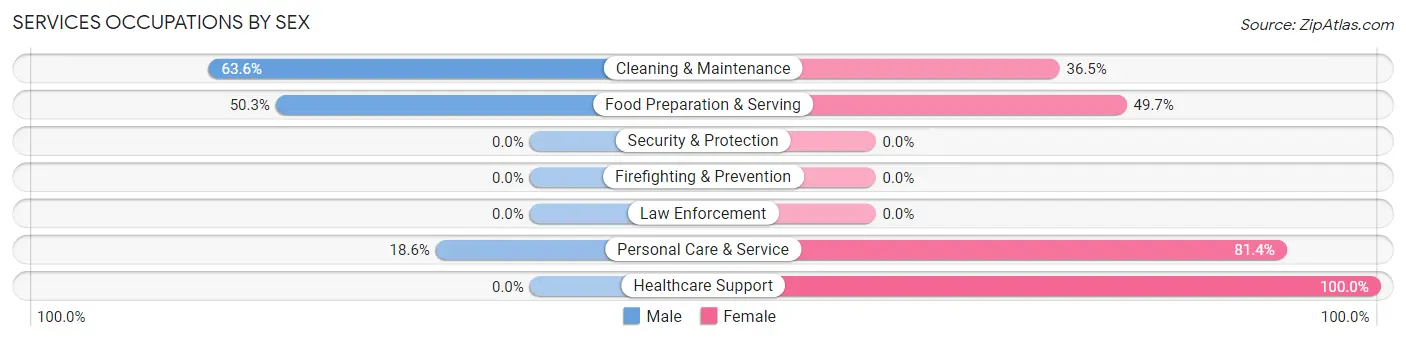
Services Occupations by Sex
Within the Services occupations in Plymouth, the most male-oriented occupations are Cleaning & Maintenance (63.5%), Food Preparation & Serving (50.3%), and Personal Care & Service (18.6%), while the most female-oriented occupations are Healthcare Support (100.0%), Personal Care & Service (81.4%), and Food Preparation & Serving (49.7%).
| Occupation | Male | Female |
| Healthcare Support | 0 (0.0%) | 48 (100.0%) |
| Security & Protection | 0 (0.0%) | 0 (0.0%) |
| Firefighting & Prevention | 0 (0.0%) | 0 (0.0%) |
| Law Enforcement | 0 (0.0%) | 0 (0.0%) |
| Food Preparation & Serving | 90 (50.3%) | 89 (49.7%) |
| Cleaning & Maintenance | 136 (63.5%) | 78 (36.4%) |
| Personal Care & Service | 16 (18.6%) | 70 (81.4%) |
| Total (Category) | 242 (45.9%) | 285 (54.1%) |
| Total (Overall) | 1,175 (52.4%) | 1,069 (47.6%) |
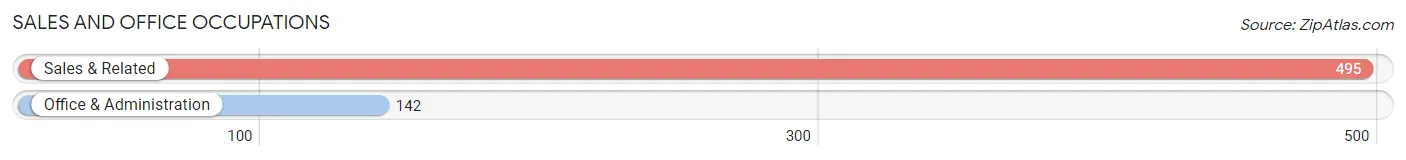
Sales and Office Occupations
The most common Sales and Office occupations in Plymouth are Sales & Related (495 | 22.1%), and Office & Administration (142 | 6.3%).
Sales and Office Occupations by Sex
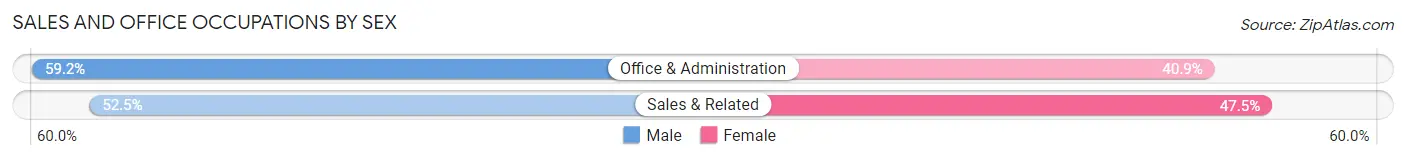
| Occupation | Male | Female |
| Sales & Related | 260 (52.5%) | 235 (47.5%) |
| Office & Administration | 84 (59.2%) | 58 (40.8%) |
| Total (Category) | 344 (54.0%) | 293 (46.0%) |
| Total (Overall) | 1,175 (52.4%) | 1,069 (47.6%) |
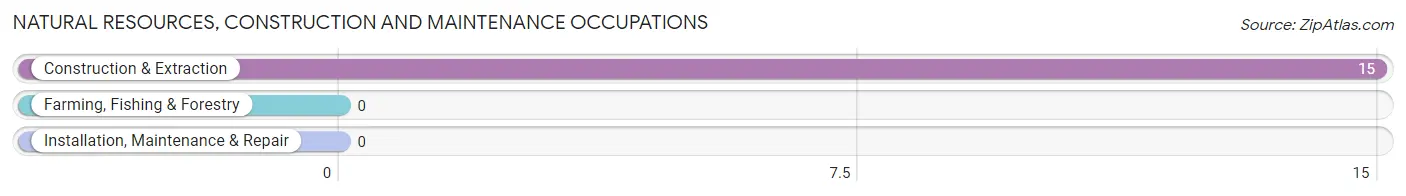
Natural Resources, Construction and Maintenance Occupations
The most common Natural Resources, Construction and Maintenance occupations in Plymouth are , and Construction & Extraction (15 | 0.7%).
Natural Resources, Construction and Maintenance Occupations by Sex
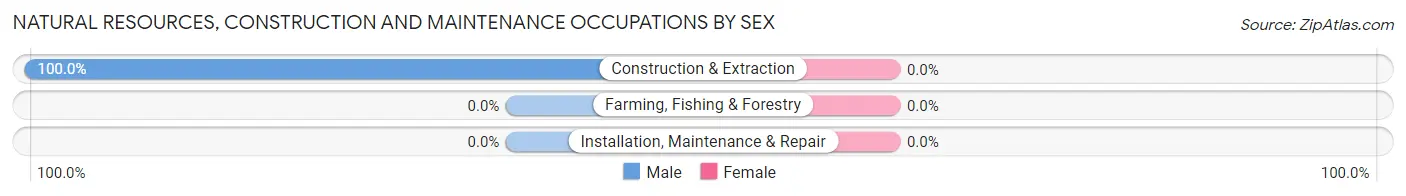
| Occupation | Male | Female |
| Farming, Fishing & Forestry | 0 (0.0%) | 0 (0.0%) |
| Construction & Extraction | 15 (100.0%) | 0 (0.0%) |
| Installation, Maintenance & Repair | 0 (0.0%) | 0 (0.0%) |
| Total (Category) | 15 (100.0%) | 0 (0.0%) |
| Total (Overall) | 1,175 (52.4%) | 1,069 (47.6%) |
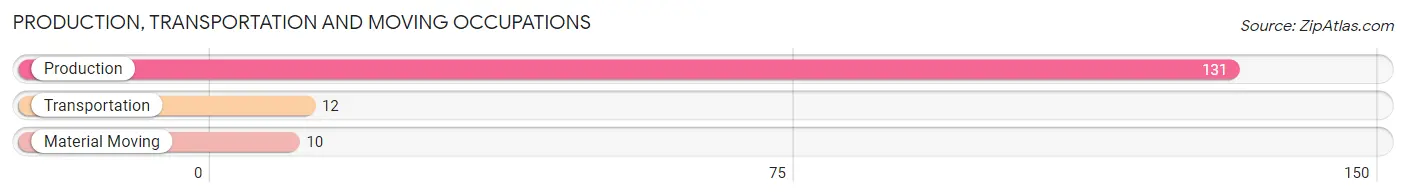
Production, Transportation and Moving Occupations
The most common Production, Transportation and Moving occupations in Plymouth are Production (131 | 5.8%), Transportation (12 | 0.5%), and Material Moving (10 | 0.4%).
Production, Transportation and Moving Occupations by Sex
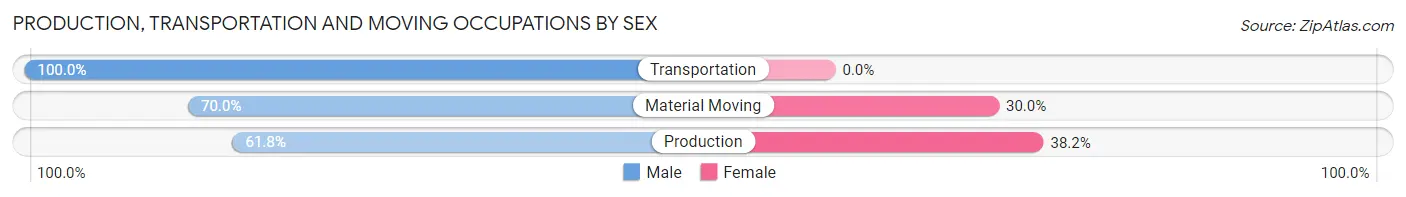
| Occupation | Male | Female |
| Production | 81 (61.8%) | 50 (38.2%) |
| Transportation | 12 (100.0%) | 0 (0.0%) |
| Material Moving | 7 (70.0%) | 3 (30.0%) |
| Total (Category) | 100 (65.4%) | 53 (34.6%) |
| Total (Overall) | 1,175 (52.4%) | 1,069 (47.6%) |
Employment Industries by Sex in Plymouth
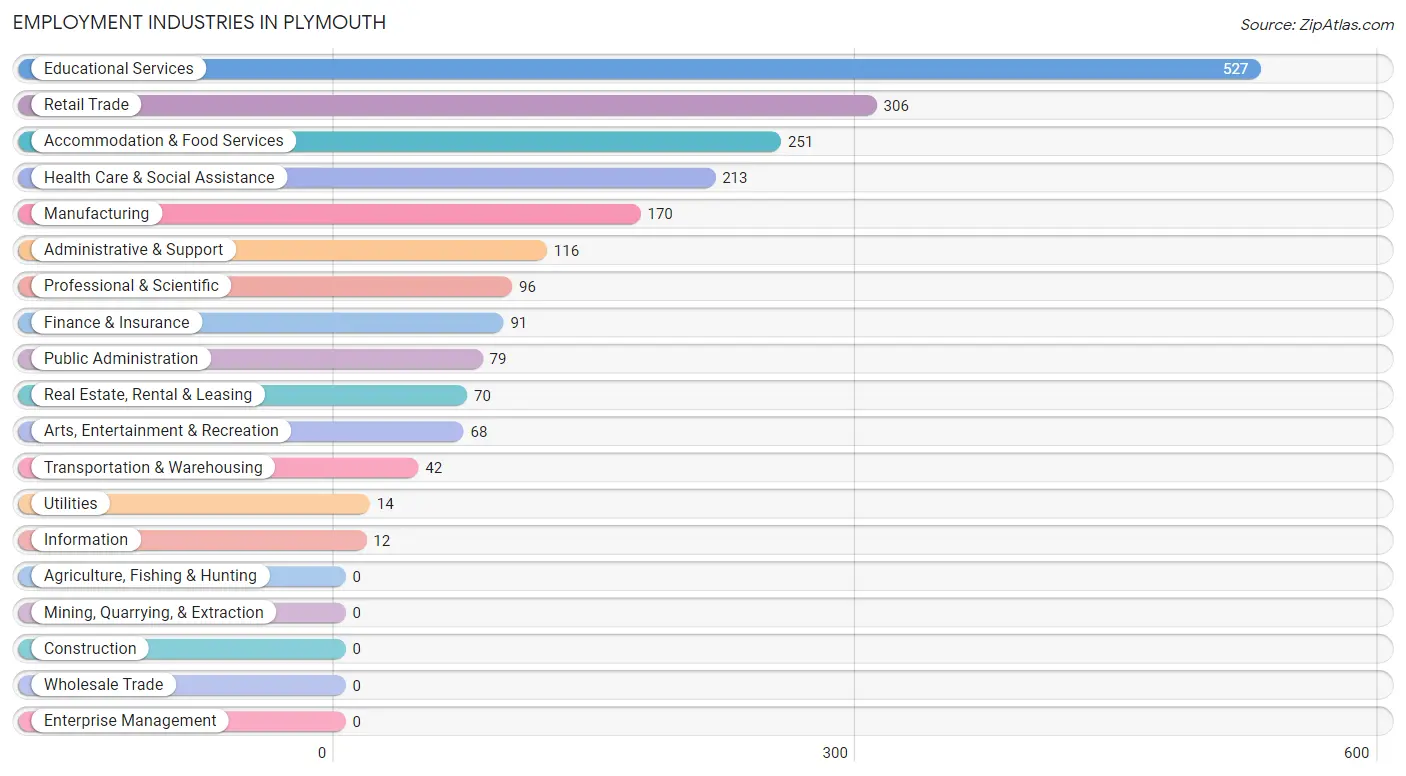
Employment Industries in Plymouth
The major employment industries in Plymouth include Educational Services (527 | 23.5%), Retail Trade (306 | 13.6%), Accommodation & Food Services (251 | 11.2%), Health Care & Social Assistance (213 | 9.5%), and Manufacturing (170 | 7.6%).
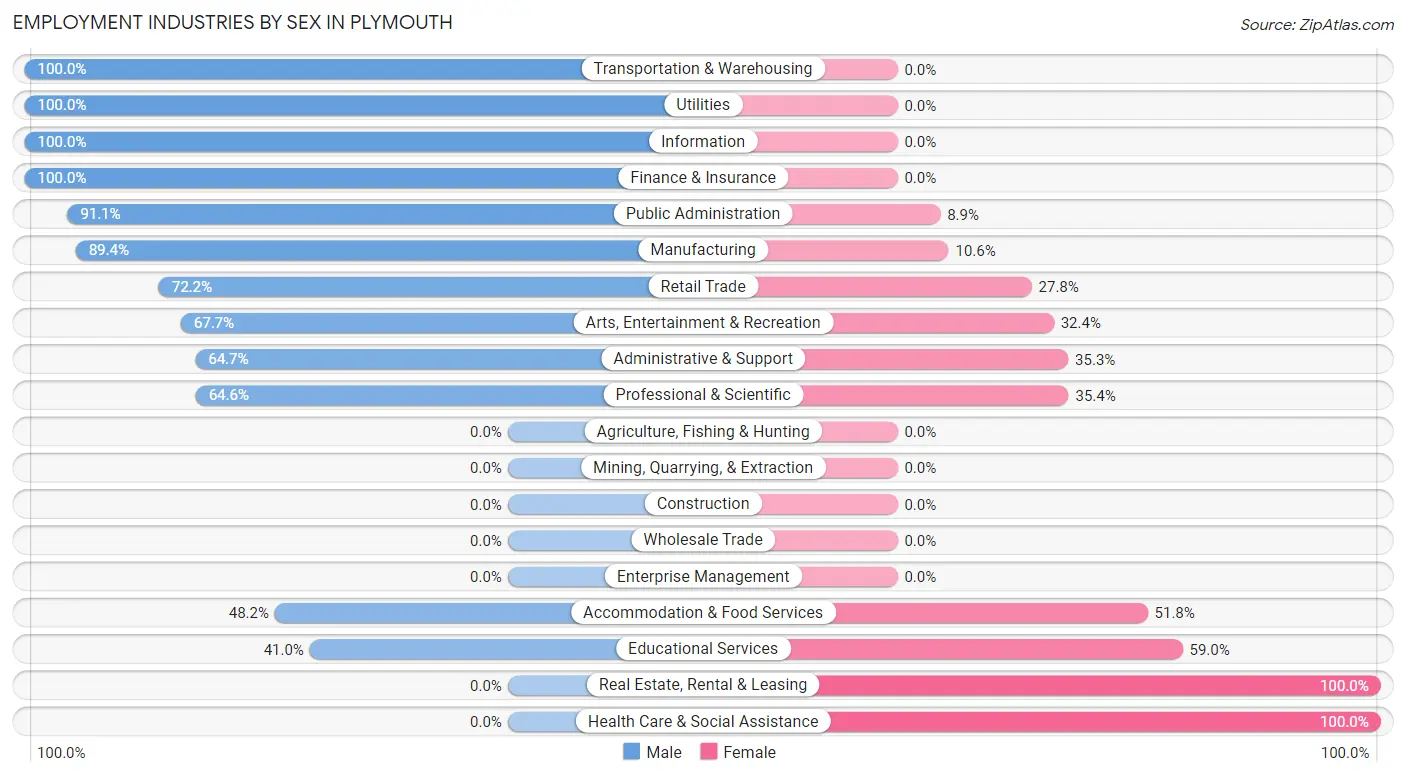
Employment Industries by Sex in Plymouth
The Plymouth industries that see more men than women are Transportation & Warehousing (100.0%), Utilities (100.0%), and Information (100.0%), whereas the industries that tend to have a higher number of women are Real Estate, Rental & Leasing (100.0%), Health Care & Social Assistance (100.0%), and Educational Services (59.0%).
| Industry | Male | Female |
| Agriculture, Fishing & Hunting | 0 (0.0%) | 0 (0.0%) |
| Mining, Quarrying, & Extraction | 0 (0.0%) | 0 (0.0%) |
| Construction | 0 (0.0%) | 0 (0.0%) |
| Manufacturing | 152 (89.4%) | 18 (10.6%) |
| Wholesale Trade | 0 (0.0%) | 0 (0.0%) |
| Retail Trade | 221 (72.2%) | 85 (27.8%) |
| Transportation & Warehousing | 42 (100.0%) | 0 (0.0%) |
| Utilities | 14 (100.0%) | 0 (0.0%) |
| Information | 12 (100.0%) | 0 (0.0%) |
| Finance & Insurance | 91 (100.0%) | 0 (0.0%) |
| Real Estate, Rental & Leasing | 0 (0.0%) | 70 (100.0%) |
| Professional & Scientific | 62 (64.6%) | 34 (35.4%) |
| Enterprise Management | 0 (0.0%) | 0 (0.0%) |
| Administrative & Support | 75 (64.7%) | 41 (35.3%) |
| Educational Services | 216 (41.0%) | 311 (59.0%) |
| Health Care & Social Assistance | 0 (0.0%) | 213 (100.0%) |
| Arts, Entertainment & Recreation | 46 (67.6%) | 22 (32.4%) |
| Accommodation & Food Services | 121 (48.2%) | 130 (51.8%) |
| Public Administration | 72 (91.1%) | 7 (8.9%) |
| Total | 1,175 (52.4%) | 1,069 (47.6%) |
Education in Plymouth
School Enrollment in Plymouth
The most common levels of schooling among the 1,975 students in Plymouth are college / undergraduate (1,413 | 71.5%), middle school (175 | 8.9%), and high school (167 | 8.5%).
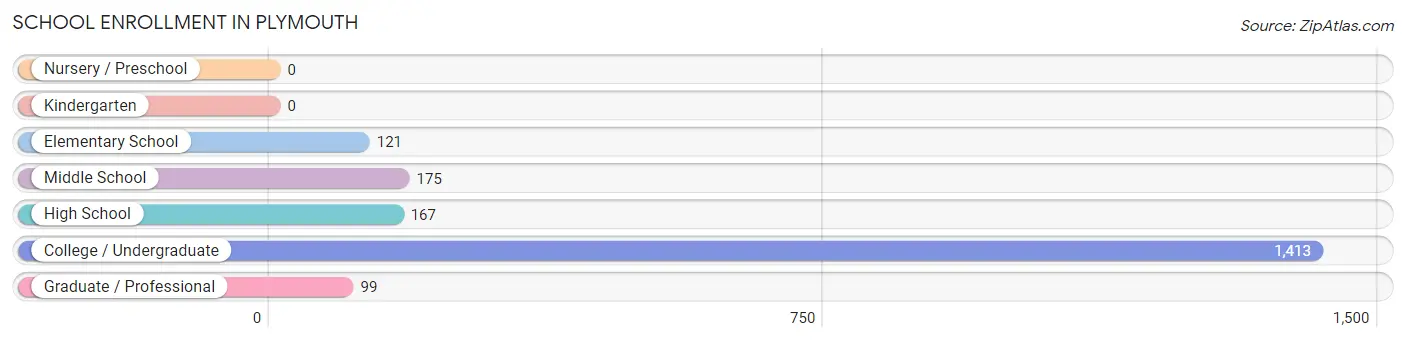
| School Level | # Students | % Students |
| Nursery / Preschool | 0 | 0.0% |
| Kindergarten | 0 | 0.0% |
| Elementary School | 121 | 6.1% |
| Middle School | 175 | 8.9% |
| High School | 167 | 8.5% |
| College / Undergraduate | 1,413 | 71.5% |
| Graduate / Professional | 99 | 5.0% |
| Total | 1,975 | 100.0% |
School Enrollment by Age by Funding Source in Plymouth
Out of a total of 1,975 students who are enrolled in schools in Plymouth, 687 (34.8%) attend a private institution, while the remaining 1,288 (65.2%) are enrolled in public schools. The age group of 35 years and over has the highest likelihood of being enrolled in private schools, with 48 (70.6% in the age bracket) enrolled. Conversely, the age group of 5 to 9 year old has the lowest likelihood of being enrolled in a private school, with 121 (100.0% in the age bracket) attending a public institution.
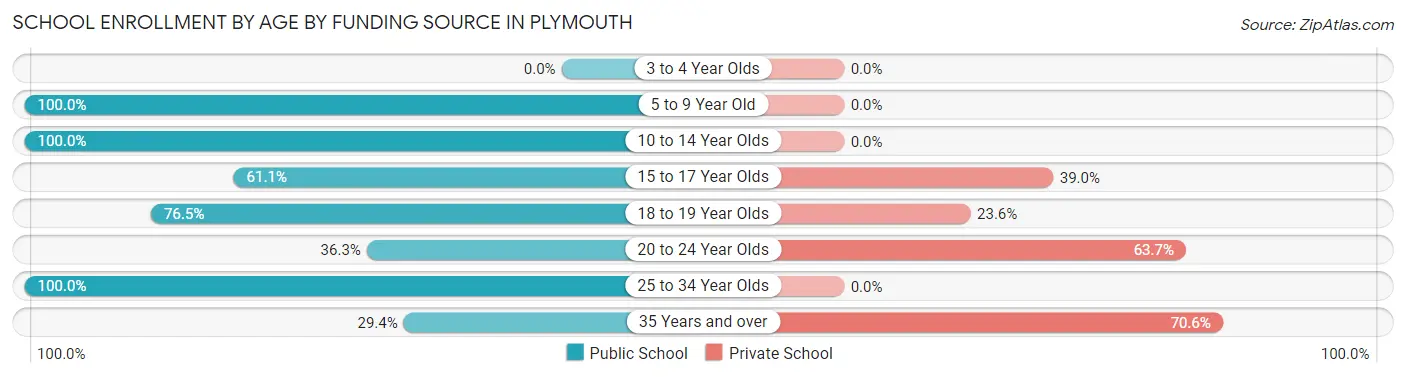
| Age Bracket | Public School | Private School |
| 3 to 4 Year Olds | 0 (0.0%) | 0 (0.0%) |
| 5 to 9 Year Old | 121 (100.0%) | 0 (0.0%) |
| 10 to 14 Year Olds | 175 (100.0%) | 0 (0.0%) |
| 15 to 17 Year Olds | 105 (61.1%) | 67 (39.0%) |
| 18 to 19 Year Olds | 620 (76.4%) | 191 (23.5%) |
| 20 to 24 Year Olds | 217 (36.3%) | 381 (63.7%) |
| 25 to 34 Year Olds | 30 (100.0%) | 0 (0.0%) |
| 35 Years and over | 20 (29.4%) | 48 (70.6%) |
| Total | 1,288 (65.2%) | 687 (34.8%) |
Educational Attainment by Field of Study in Plymouth
Literature & languages (157 | 14.0%), bio, nature & agricultural (139 | 12.4%), business (115 | 10.2%), visual & performing arts (101 | 9.0%), and liberal arts & history (99 | 8.8%) are the most common fields of study among 1,123 individuals in Plymouth who have obtained a bachelor's degree or higher.
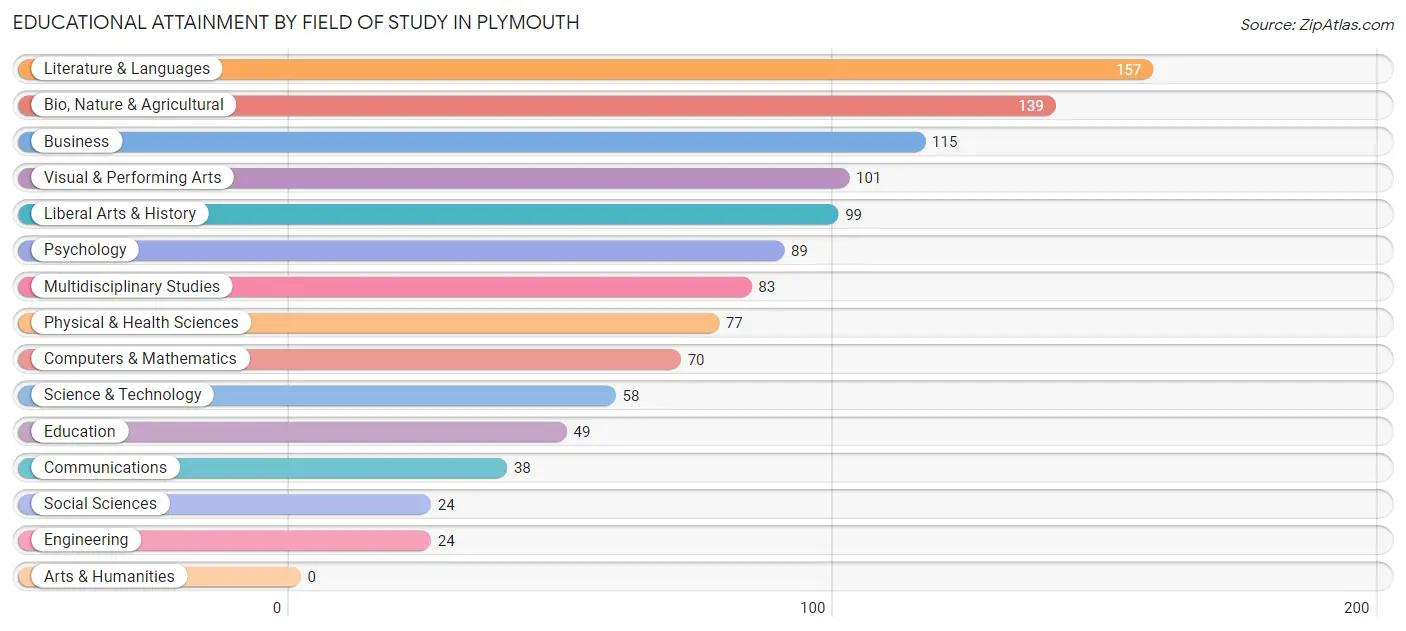
| Field of Study | # Graduates | % Graduates |
| Computers & Mathematics | 70 | 6.2% |
| Bio, Nature & Agricultural | 139 | 12.4% |
| Physical & Health Sciences | 77 | 6.9% |
| Psychology | 89 | 7.9% |
| Social Sciences | 24 | 2.1% |
| Engineering | 24 | 2.1% |
| Multidisciplinary Studies | 83 | 7.4% |
| Science & Technology | 58 | 5.2% |
| Business | 115 | 10.2% |
| Education | 49 | 4.4% |
| Literature & Languages | 157 | 14.0% |
| Liberal Arts & History | 99 | 8.8% |
| Visual & Performing Arts | 101 | 9.0% |
| Communications | 38 | 3.4% |
| Arts & Humanities | 0 | 0.0% |
| Total | 1,123 | 100.0% |
Transportation & Commute in Plymouth
Vehicle Availability by Sex in Plymouth
The most prevalent vehicle ownership categories in Plymouth are males with 3 vehicles (406, accounting for 38.8%) and females with 3 vehicles (128, making up 49.7%).
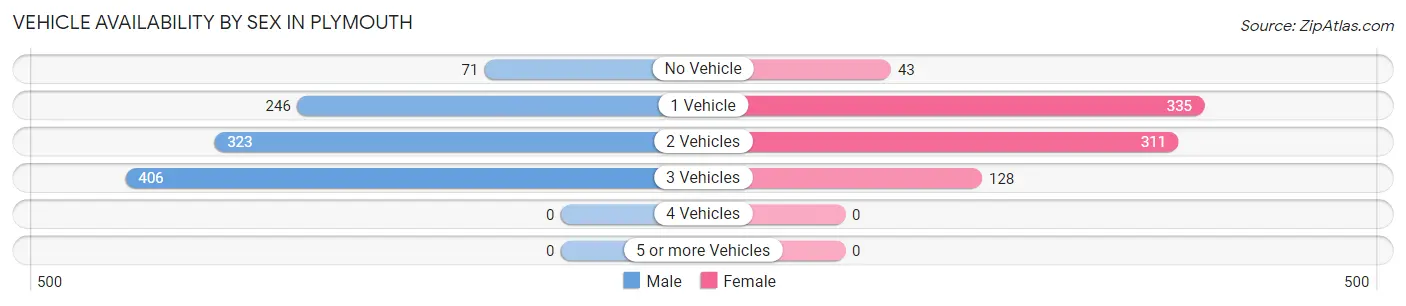
| Vehicles Available | Male | Female |
| No Vehicle | 71 (6.8%) | 43 (5.3%) |
| 1 Vehicle | 246 (23.5%) | 335 (41.0%) |
| 2 Vehicles | 323 (30.9%) | 311 (38.1%) |
| 3 Vehicles | 406 (38.8%) | 128 (15.7%) |
| 4 Vehicles | 0 (0.0%) | 0 (0.0%) |
| 5 or more Vehicles | 0 (0.0%) | 0 (0.0%) |
| Total | 1,046 (100.0%) | 817 (100.0%) |
Commute Time in Plymouth
The most frequently occuring commute durations in Plymouth are 5 to 9 minutes (527 commuters, 27.1%), less than 5 minutes (426 commuters, 21.9%), and 10 to 14 minutes (285 commuters, 14.6%).
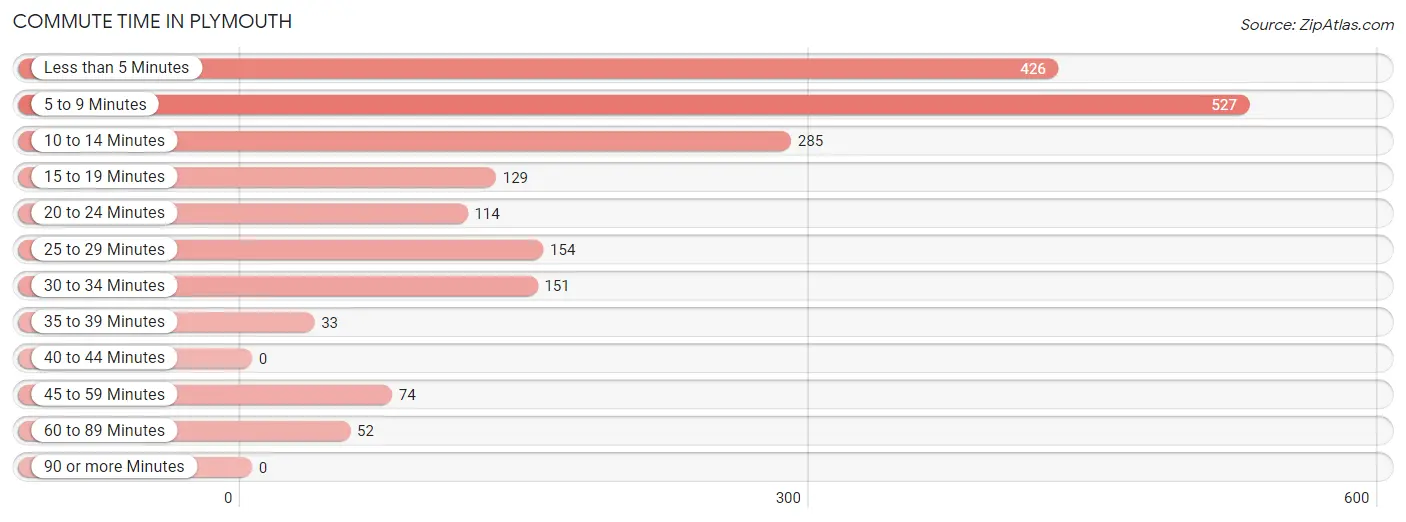
| Commute Time | # Commuters | % Commuters |
| Less than 5 Minutes | 426 | 21.9% |
| 5 to 9 Minutes | 527 | 27.1% |
| 10 to 14 Minutes | 285 | 14.6% |
| 15 to 19 Minutes | 129 | 6.6% |
| 20 to 24 Minutes | 114 | 5.9% |
| 25 to 29 Minutes | 154 | 7.9% |
| 30 to 34 Minutes | 151 | 7.8% |
| 35 to 39 Minutes | 33 | 1.7% |
| 40 to 44 Minutes | 0 | 0.0% |
| 45 to 59 Minutes | 74 | 3.8% |
| 60 to 89 Minutes | 52 | 2.7% |
| 90 or more Minutes | 0 | 0.0% |
Commute Time by Sex in Plymouth
The most common commute times in Plymouth are 5 to 9 minutes (305 commuters, 30.5%) for males and 5 to 9 minutes (222 commuters, 23.5%) for females.
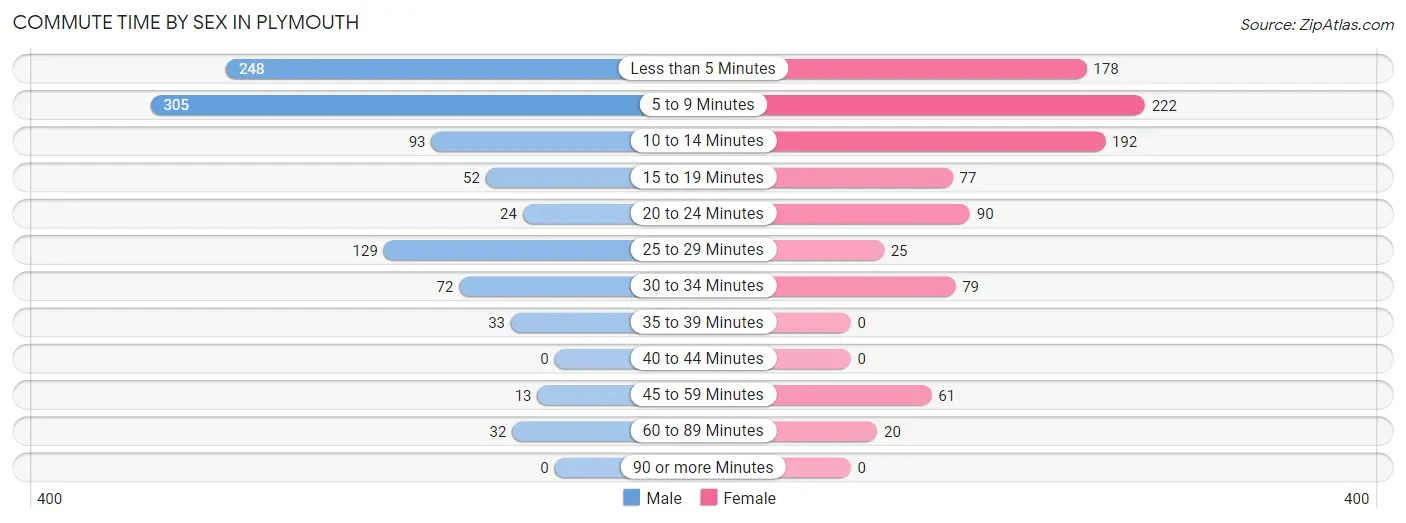
| Commute Time | Male | Female |
| Less than 5 Minutes | 248 (24.8%) | 178 (18.9%) |
| 5 to 9 Minutes | 305 (30.5%) | 222 (23.5%) |
| 10 to 14 Minutes | 93 (9.3%) | 192 (20.3%) |
| 15 to 19 Minutes | 52 (5.2%) | 77 (8.2%) |
| 20 to 24 Minutes | 24 (2.4%) | 90 (9.5%) |
| 25 to 29 Minutes | 129 (12.9%) | 25 (2.6%) |
| 30 to 34 Minutes | 72 (7.2%) | 79 (8.4%) |
| 35 to 39 Minutes | 33 (3.3%) | 0 (0.0%) |
| 40 to 44 Minutes | 0 (0.0%) | 0 (0.0%) |
| 45 to 59 Minutes | 13 (1.3%) | 61 (6.5%) |
| 60 to 89 Minutes | 32 (3.2%) | 20 (2.1%) |
| 90 or more Minutes | 0 (0.0%) | 0 (0.0%) |
Time of Departure to Work by Sex in Plymouth
The most frequent times of departure to work in Plymouth are 6:30 AM to 6:59 AM (187, 18.7%) for males and 7:30 AM to 7:59 AM (254, 26.9%) for females.
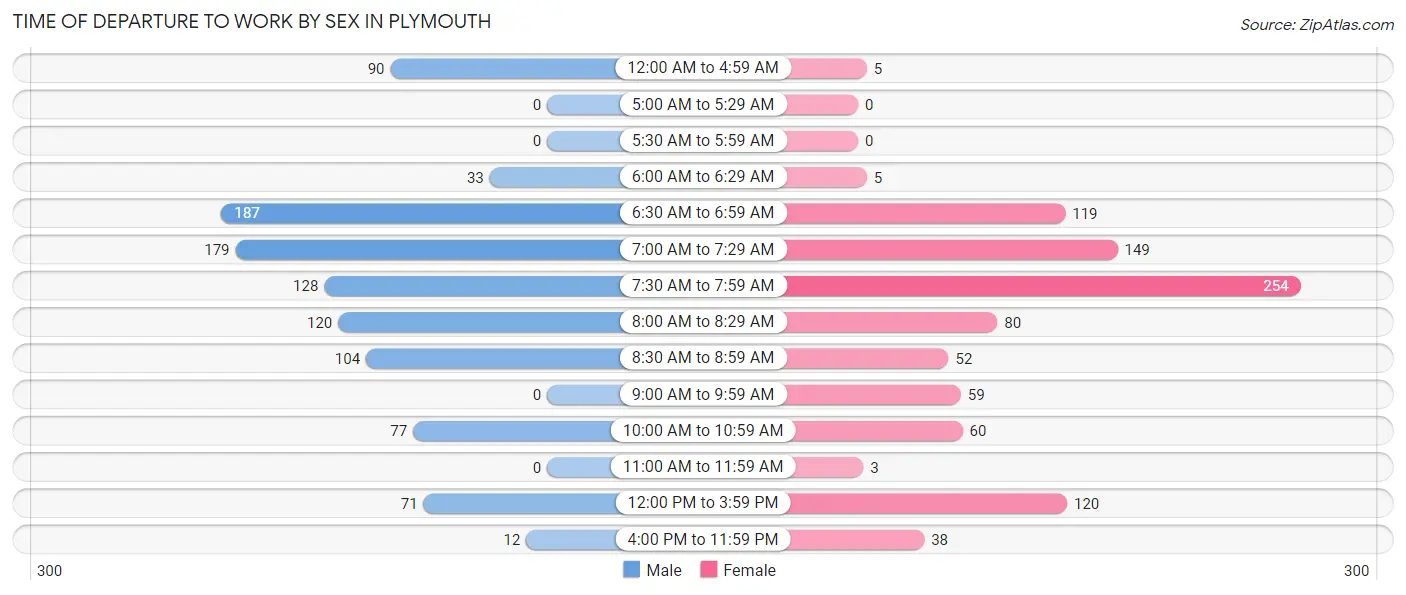
| Time of Departure | Male | Female |
| 12:00 AM to 4:59 AM | 90 (9.0%) | 5 (0.5%) |
| 5:00 AM to 5:29 AM | 0 (0.0%) | 0 (0.0%) |
| 5:30 AM to 5:59 AM | 0 (0.0%) | 0 (0.0%) |
| 6:00 AM to 6:29 AM | 33 (3.3%) | 5 (0.5%) |
| 6:30 AM to 6:59 AM | 187 (18.7%) | 119 (12.6%) |
| 7:00 AM to 7:29 AM | 179 (17.9%) | 149 (15.8%) |
| 7:30 AM to 7:59 AM | 128 (12.8%) | 254 (26.9%) |
| 8:00 AM to 8:29 AM | 120 (12.0%) | 80 (8.5%) |
| 8:30 AM to 8:59 AM | 104 (10.4%) | 52 (5.5%) |
| 9:00 AM to 9:59 AM | 0 (0.0%) | 59 (6.2%) |
| 10:00 AM to 10:59 AM | 77 (7.7%) | 60 (6.4%) |
| 11:00 AM to 11:59 AM | 0 (0.0%) | 3 (0.3%) |
| 12:00 PM to 3:59 PM | 71 (7.1%) | 120 (12.7%) |
| 4:00 PM to 11:59 PM | 12 (1.2%) | 38 (4.0%) |
| Total | 1,001 (100.0%) | 944 (100.0%) |
Housing Occupancy in Plymouth
Occupancy by Ownership in Plymouth
Of the total 1,404 dwellings in Plymouth, owner-occupied units account for 736 (52.4%), while renter-occupied units make up 668 (47.6%).
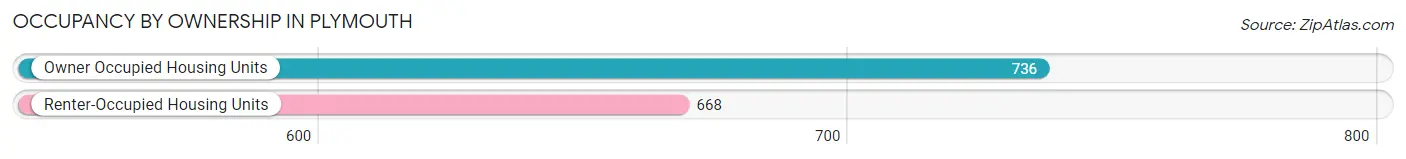
| Occupancy | # Housing Units | % Housing Units |
| Owner Occupied Housing Units | 736 | 52.4% |
| Renter-Occupied Housing Units | 668 | 47.6% |
| Total Occupied Housing Units | 1,404 | 100.0% |
Occupancy by Household Size in Plymouth
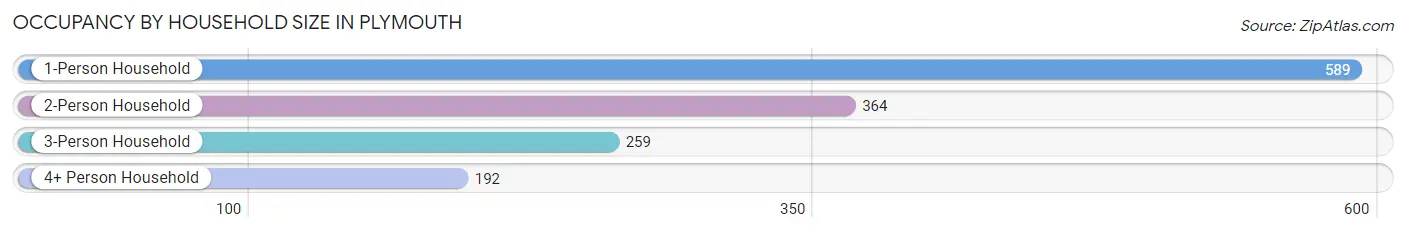
| Household Size | # Housing Units | % Housing Units |
| 1-Person Household | 589 | 41.9% |
| 2-Person Household | 364 | 25.9% |
| 3-Person Household | 259 | 18.4% |
| 4+ Person Household | 192 | 13.7% |
| Total Housing Units | 1,404 | 100.0% |
Occupancy by Ownership by Household Size in Plymouth
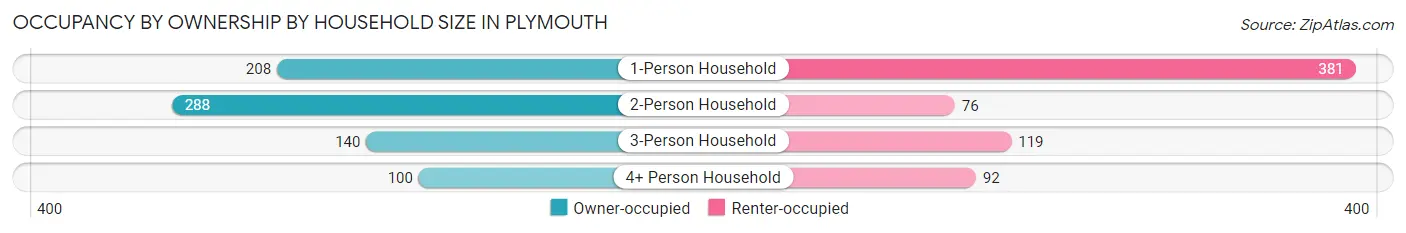
| Household Size | Owner-occupied | Renter-occupied |
| 1-Person Household | 208 (35.3%) | 381 (64.7%) |
| 2-Person Household | 288 (79.1%) | 76 (20.9%) |
| 3-Person Household | 140 (54.0%) | 119 (46.0%) |
| 4+ Person Household | 100 (52.1%) | 92 (47.9%) |
| Total Housing Units | 736 (52.4%) | 668 (47.6%) |
Occupancy by Educational Attainment in Plymouth
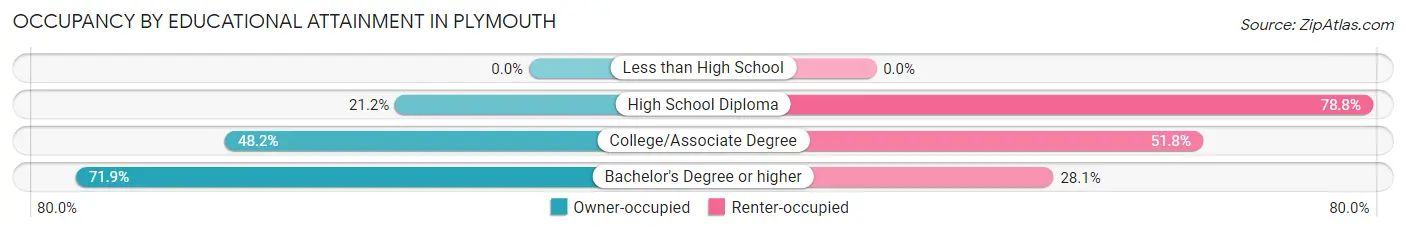
| Household Size | Owner-occupied | Renter-occupied |
| Less than High School | 0 (0.0%) | 0 (0.0%) |
| High School Diploma | 76 (21.2%) | 282 (78.8%) |
| College/Associate Degree | 187 (48.2%) | 201 (51.8%) |
| Bachelor's Degree or higher | 473 (71.9%) | 185 (28.1%) |
Occupancy by Age of Householder in Plymouth
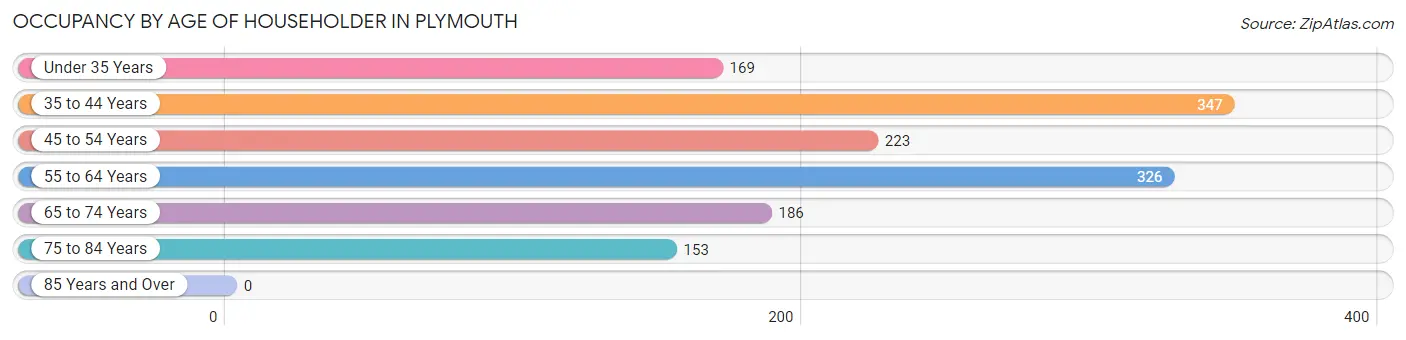
| Age Bracket | # Households | % Households |
| Under 35 Years | 169 | 12.0% |
| 35 to 44 Years | 347 | 24.7% |
| 45 to 54 Years | 223 | 15.9% |
| 55 to 64 Years | 326 | 23.2% |
| 65 to 74 Years | 186 | 13.3% |
| 75 to 84 Years | 153 | 10.9% |
| 85 Years and Over | 0 | 0.0% |
| Total | 1,404 | 100.0% |
Housing Finances in Plymouth
Median Income by Occupancy in Plymouth
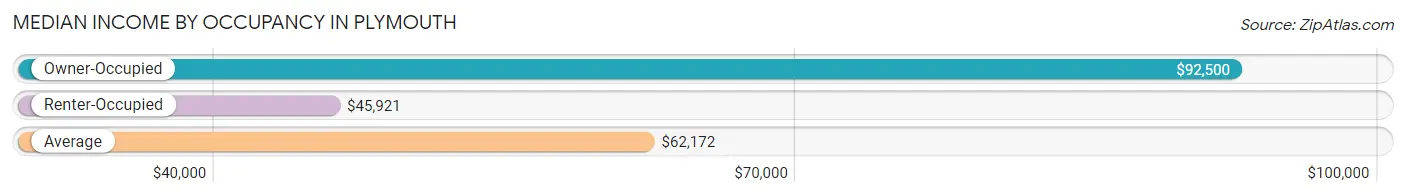
| Occupancy Type | # Households | Median Income |
| Owner-Occupied | 736 (52.4%) | $92,500 |
| Renter-Occupied | 668 (47.6%) | $45,921 |
| Average | 1,404 (100.0%) | $62,172 |
Occupancy by Householder Income Bracket in Plymouth
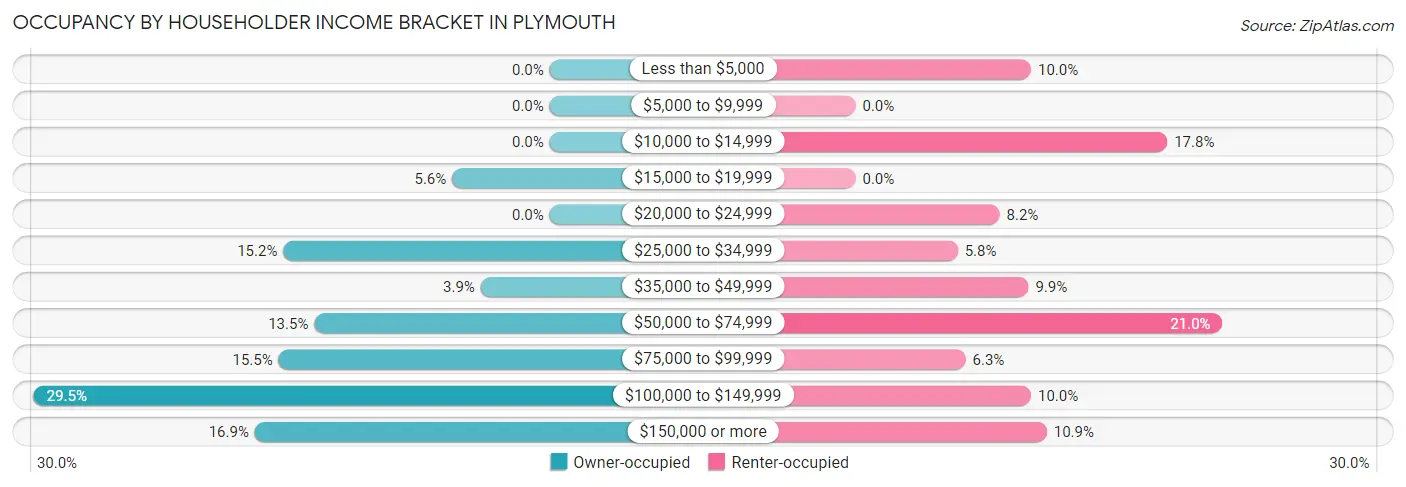
| Income Bracket | Owner-occupied | Renter-occupied |
| Less than $5,000 | 0 (0.0%) | 67 (10.0%) |
| $5,000 to $9,999 | 0 (0.0%) | 0 (0.0%) |
| $10,000 to $14,999 | 0 (0.0%) | 119 (17.8%) |
| $15,000 to $19,999 | 41 (5.6%) | 0 (0.0%) |
| $20,000 to $24,999 | 0 (0.0%) | 55 (8.2%) |
| $25,000 to $34,999 | 112 (15.2%) | 39 (5.8%) |
| $35,000 to $49,999 | 29 (3.9%) | 66 (9.9%) |
| $50,000 to $74,999 | 99 (13.5%) | 140 (21.0%) |
| $75,000 to $99,999 | 114 (15.5%) | 42 (6.3%) |
| $100,000 to $149,999 | 217 (29.5%) | 67 (10.0%) |
| $150,000 or more | 124 (16.9%) | 73 (10.9%) |
| Total | 736 (100.0%) | 668 (100.0%) |
Monthly Housing Cost Tiers in Plymouth
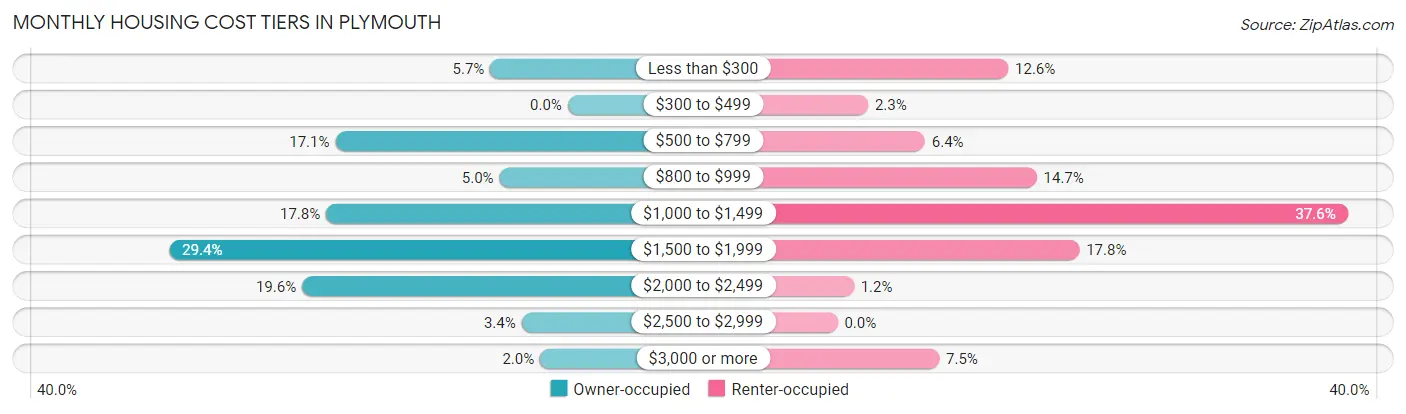
| Monthly Cost | Owner-occupied | Renter-occupied |
| Less than $300 | 42 (5.7%) | 84 (12.6%) |
| $300 to $499 | 0 (0.0%) | 15 (2.2%) |
| $500 to $799 | 126 (17.1%) | 43 (6.4%) |
| $800 to $999 | 37 (5.0%) | 98 (14.7%) |
| $1,000 to $1,499 | 131 (17.8%) | 251 (37.6%) |
| $1,500 to $1,999 | 216 (29.3%) | 119 (17.8%) |
| $2,000 to $2,499 | 144 (19.6%) | 8 (1.2%) |
| $2,500 to $2,999 | 25 (3.4%) | 0 (0.0%) |
| $3,000 or more | 15 (2.0%) | 50 (7.5%) |
| Total | 736 (100.0%) | 668 (100.0%) |
Physical Housing Characteristics in Plymouth
Housing Structures in Plymouth
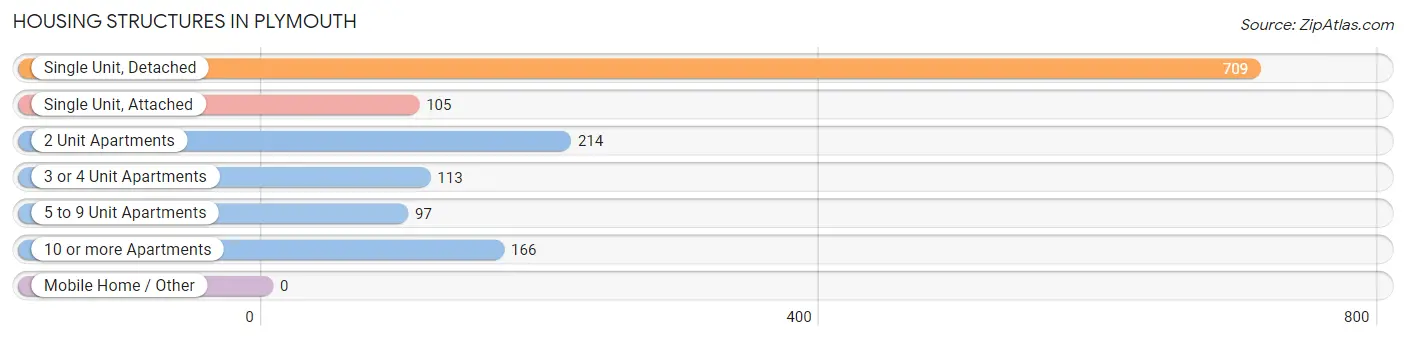
| Structure Type | # Housing Units | % Housing Units |
| Single Unit, Detached | 709 | 50.5% |
| Single Unit, Attached | 105 | 7.5% |
| 2 Unit Apartments | 214 | 15.2% |
| 3 or 4 Unit Apartments | 113 | 8.1% |
| 5 to 9 Unit Apartments | 97 | 6.9% |
| 10 or more Apartments | 166 | 11.8% |
| Mobile Home / Other | 0 | 0.0% |
| Total | 1,404 | 100.0% |
Housing Structures by Occupancy in Plymouth
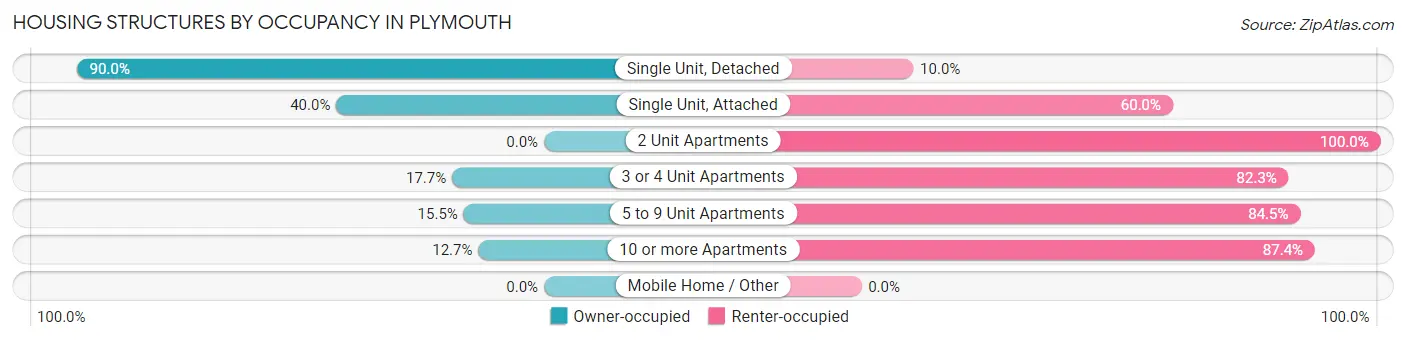
| Structure Type | Owner-occupied | Renter-occupied |
| Single Unit, Detached | 638 (90.0%) | 71 (10.0%) |
| Single Unit, Attached | 42 (40.0%) | 63 (60.0%) |
| 2 Unit Apartments | 0 (0.0%) | 214 (100.0%) |
| 3 or 4 Unit Apartments | 20 (17.7%) | 93 (82.3%) |
| 5 to 9 Unit Apartments | 15 (15.5%) | 82 (84.5%) |
| 10 or more Apartments | 21 (12.7%) | 145 (87.4%) |
| Mobile Home / Other | 0 (0.0%) | 0 (0.0%) |
| Total | 736 (52.4%) | 668 (47.6%) |
Housing Structures by Number of Rooms in Plymouth
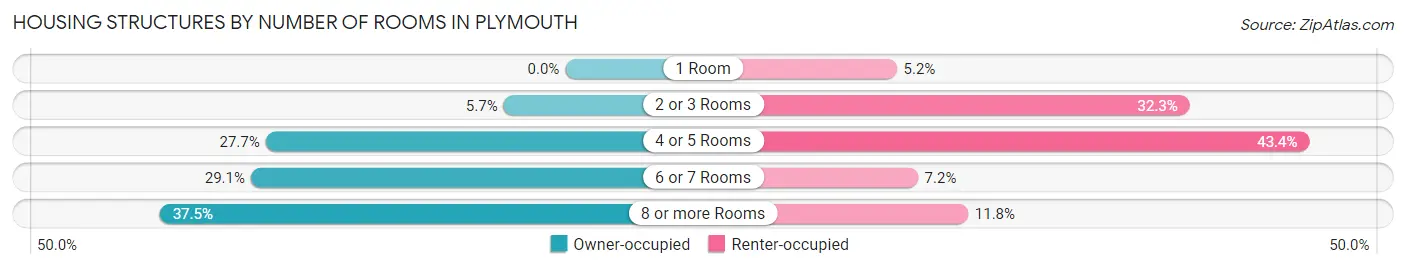
| Number of Rooms | Owner-occupied | Renter-occupied |
| 1 Room | 0 (0.0%) | 35 (5.2%) |
| 2 or 3 Rooms | 42 (5.7%) | 216 (32.3%) |
| 4 or 5 Rooms | 204 (27.7%) | 290 (43.4%) |
| 6 or 7 Rooms | 214 (29.1%) | 48 (7.2%) |
| 8 or more Rooms | 276 (37.5%) | 79 (11.8%) |
| Total | 736 (100.0%) | 668 (100.0%) |
Housing Structure by Heating Type in Plymouth
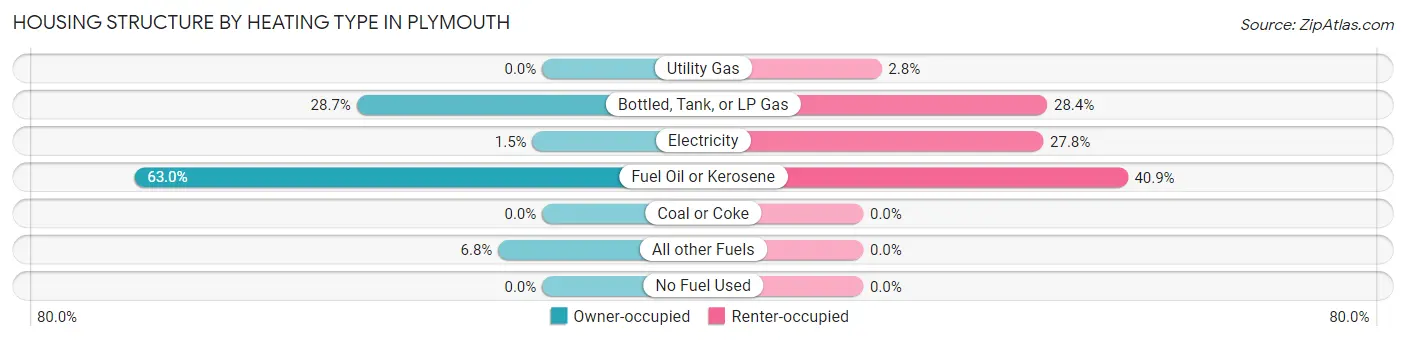
| Heating Type | Owner-occupied | Renter-occupied |
| Utility Gas | 0 (0.0%) | 19 (2.8%) |
| Bottled, Tank, or LP Gas | 211 (28.7%) | 190 (28.4%) |
| Electricity | 11 (1.5%) | 186 (27.8%) |
| Fuel Oil or Kerosene | 464 (63.0%) | 273 (40.9%) |
| Coal or Coke | 0 (0.0%) | 0 (0.0%) |
| All other Fuels | 50 (6.8%) | 0 (0.0%) |
| No Fuel Used | 0 (0.0%) | 0 (0.0%) |
| Total | 736 (100.0%) | 668 (100.0%) |
Household Vehicle Usage in Plymouth
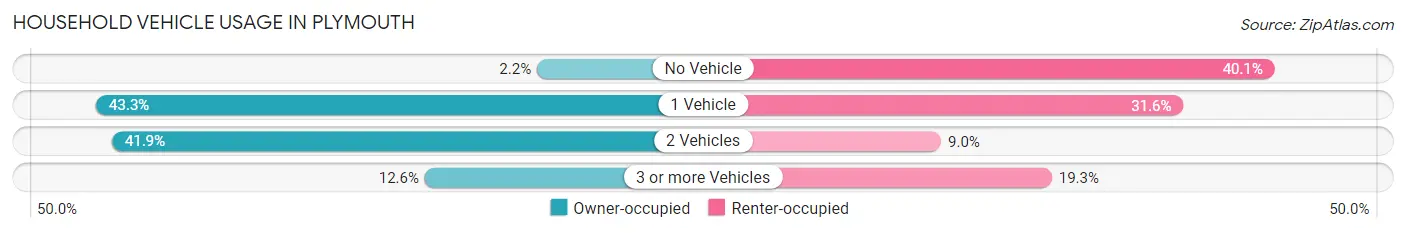
| Vehicles per Household | Owner-occupied | Renter-occupied |
| No Vehicle | 16 (2.2%) | 268 (40.1%) |
| 1 Vehicle | 319 (43.3%) | 211 (31.6%) |
| 2 Vehicles | 308 (41.8%) | 60 (9.0%) |
| 3 or more Vehicles | 93 (12.6%) | 129 (19.3%) |
| Total | 736 (100.0%) | 668 (100.0%) |
Real Estate & Mortgages in Plymouth
Real Estate and Mortgage Overview in Plymouth
| Characteristic | Without Mortgage | With Mortgage |
| Housing Units | 274 | 462 |
| Median Property Value | $233,300 | $244,100 |
| Median Household Income | $34,048 | $85 |
| Monthly Housing Costs | $757 | $15 |
| Real Estate Taxes | $5,905 | $0 |
Property Value by Mortgage Status in Plymouth
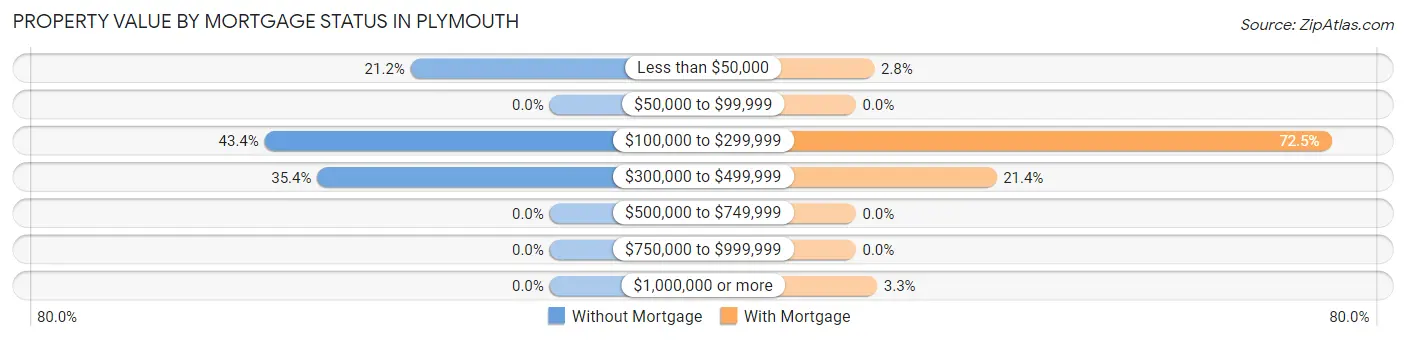
| Property Value | Without Mortgage | With Mortgage |
| Less than $50,000 | 58 (21.2%) | 13 (2.8%) |
| $50,000 to $99,999 | 0 (0.0%) | 0 (0.0%) |
| $100,000 to $299,999 | 119 (43.4%) | 335 (72.5%) |
| $300,000 to $499,999 | 97 (35.4%) | 99 (21.4%) |
| $500,000 to $749,999 | 0 (0.0%) | 0 (0.0%) |
| $750,000 to $999,999 | 0 (0.0%) | 0 (0.0%) |
| $1,000,000 or more | 0 (0.0%) | 15 (3.3%) |
| Total | 274 (100.0%) | 462 (100.0%) |
Household Income by Mortgage Status in Plymouth
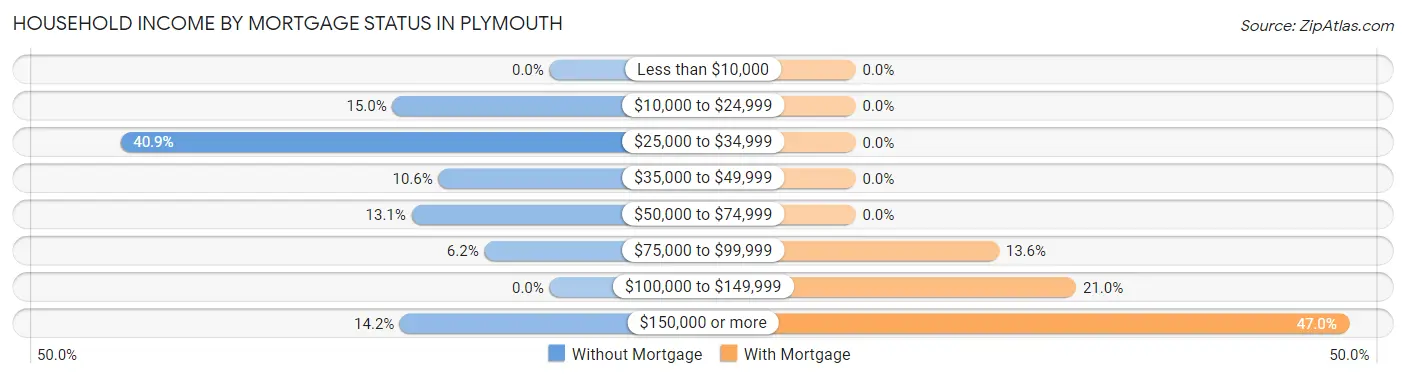
| Household Income | Without Mortgage | With Mortgage |
| Less than $10,000 | 0 (0.0%) | 0 (0.0%) |
| $10,000 to $24,999 | 41 (15.0%) | 0 (0.0%) |
| $25,000 to $34,999 | 112 (40.9%) | 0 (0.0%) |
| $35,000 to $49,999 | 29 (10.6%) | 0 (0.0%) |
| $50,000 to $74,999 | 36 (13.1%) | 0 (0.0%) |
| $75,000 to $99,999 | 17 (6.2%) | 63 (13.6%) |
| $100,000 to $149,999 | 0 (0.0%) | 97 (21.0%) |
| $150,000 or more | 39 (14.2%) | 217 (47.0%) |
| Total | 274 (100.0%) | 462 (100.0%) |
Property Value to Household Income Ratio in Plymouth
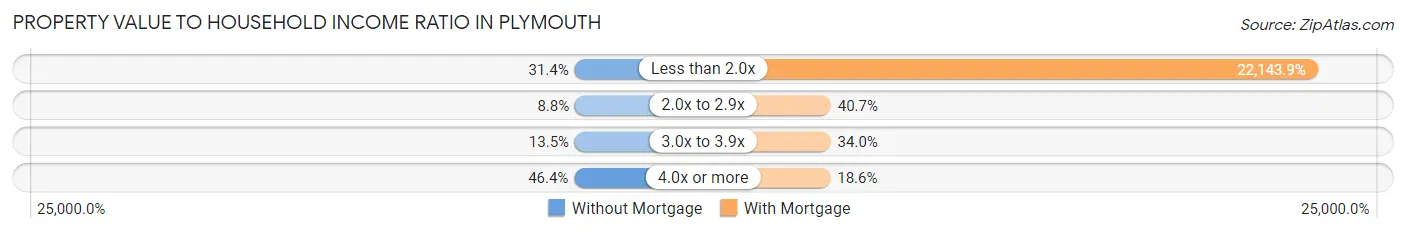
| Value-to-Income Ratio | Without Mortgage | With Mortgage |
| Less than 2.0x | 86 (31.4%) | 102,305 (22,143.9%) |
| 2.0x to 2.9x | 24 (8.8%) | 188 (40.7%) |
| 3.0x to 3.9x | 37 (13.5%) | 157 (34.0%) |
| 4.0x or more | 127 (46.4%) | 86 (18.6%) |
| Total | 274 (100.0%) | 462 (100.0%) |
Real Estate Taxes by Mortgage Status in Plymouth
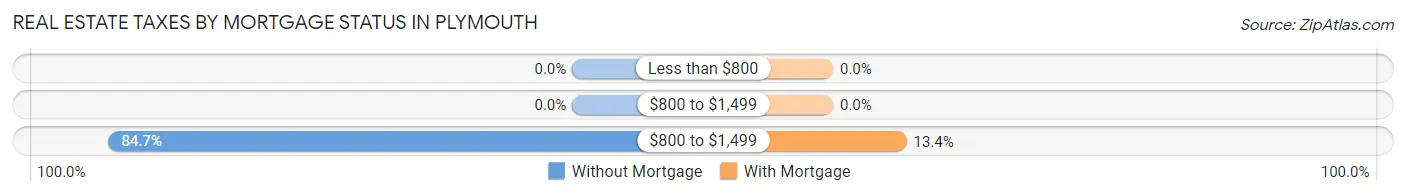
| Property Taxes | Without Mortgage | With Mortgage |
| Less than $800 | 0 (0.0%) | 0 (0.0%) |
| $800 to $1,499 | 0 (0.0%) | 0 (0.0%) |
| $800 to $1,499 | 232 (84.7%) | 62 (13.4%) |
| Total | 274 (100.0%) | 462 (100.0%) |
Health & Disability in Plymouth
Health Insurance Coverage by Age in Plymouth
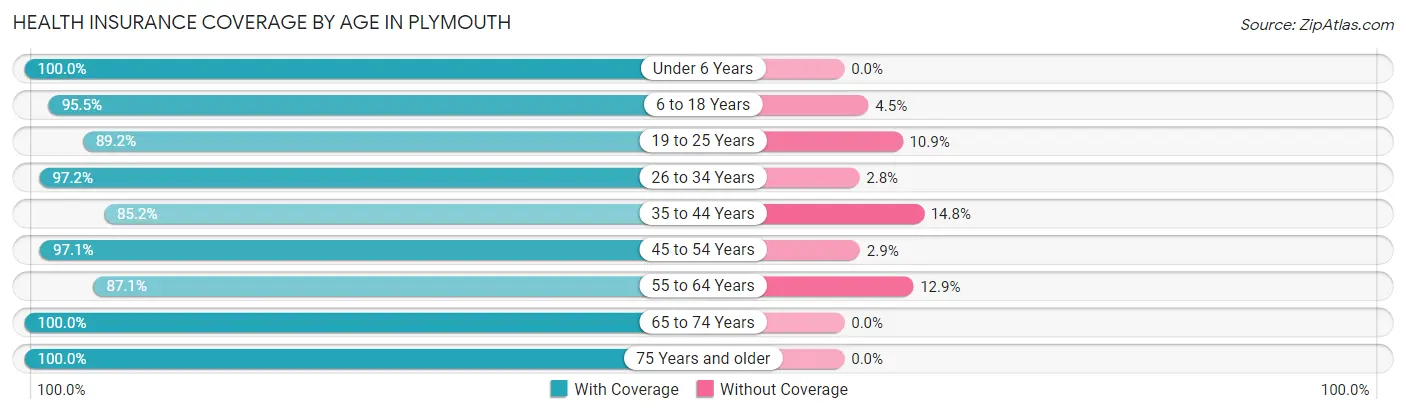
| Age Bracket | With Coverage | Without Coverage |
| Under 6 Years | 29 (100.0%) | 0 (0.0%) |
| 6 to 18 Years | 827 (95.5%) | 39 (4.5%) |
| 19 to 25 Years | 1,224 (89.1%) | 149 (10.8%) |
| 26 to 34 Years | 277 (97.2%) | 8 (2.8%) |
| 35 to 44 Years | 460 (85.2%) | 80 (14.8%) |
| 45 to 54 Years | 401 (97.1%) | 12 (2.9%) |
| 55 to 64 Years | 366 (87.1%) | 54 (12.9%) |
| 65 to 74 Years | 305 (100.0%) | 0 (0.0%) |
| 75 Years and older | 197 (100.0%) | 0 (0.0%) |
| Total | 4,086 (92.3%) | 342 (7.7%) |
Health Insurance Coverage by Citizenship Status in Plymouth
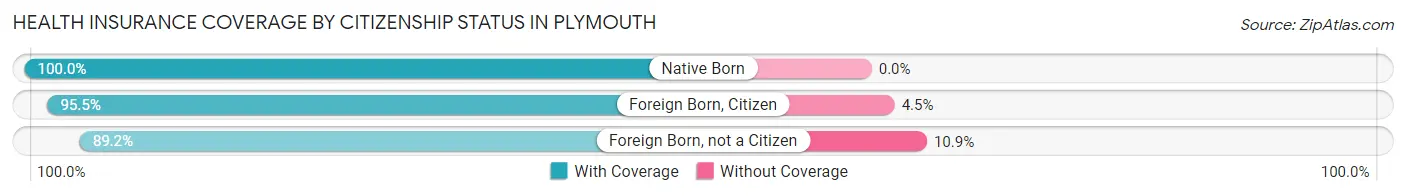
| Citizenship Status | With Coverage | Without Coverage |
| Native Born | 29 (100.0%) | 0 (0.0%) |
| Foreign Born, Citizen | 827 (95.5%) | 39 (4.5%) |
| Foreign Born, not a Citizen | 1,224 (89.1%) | 149 (10.8%) |
Health Insurance Coverage by Household Income in Plymouth
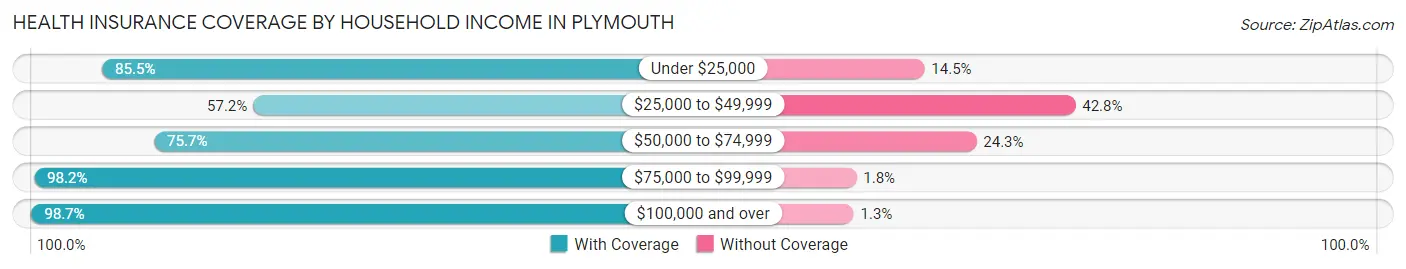
| Household Income | With Coverage | Without Coverage |
| Under $25,000 | 241 (85.5%) | 41 (14.5%) |
| $25,000 to $49,999 | 163 (57.2%) | 122 (42.8%) |
| $50,000 to $74,999 | 387 (75.7%) | 124 (24.3%) |
| $75,000 to $99,999 | 714 (98.2%) | 13 (1.8%) |
| $100,000 and over | 1,394 (98.7%) | 18 (1.3%) |
Public vs Private Health Insurance Coverage by Age in Plymouth
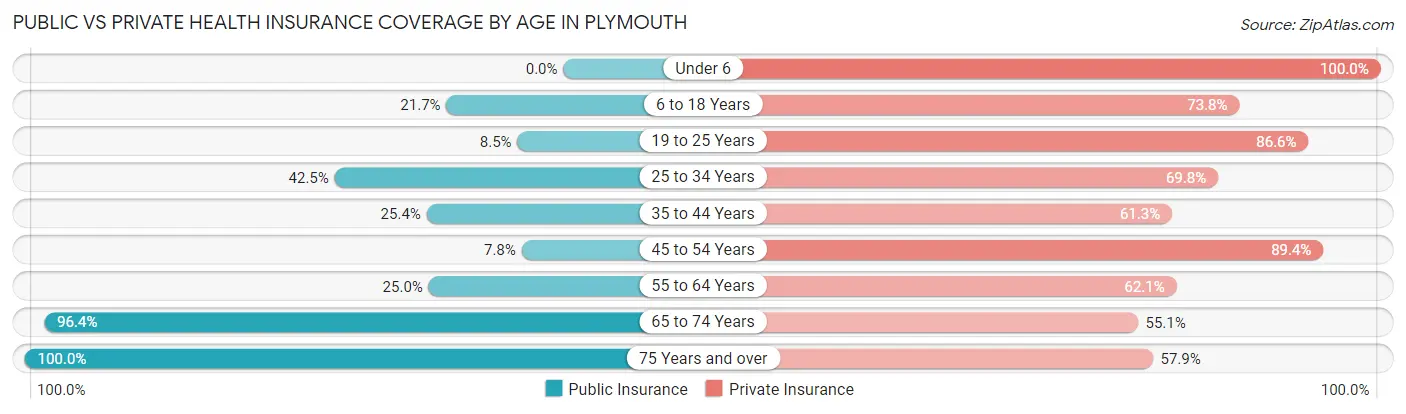
| Age Bracket | Public Insurance | Private Insurance |
| Under 6 | 0 (0.0%) | 29 (100.0%) |
| 6 to 18 Years | 188 (21.7%) | 639 (73.8%) |
| 19 to 25 Years | 117 (8.5%) | 1,189 (86.6%) |
| 25 to 34 Years | 121 (42.5%) | 199 (69.8%) |
| 35 to 44 Years | 137 (25.4%) | 331 (61.3%) |
| 45 to 54 Years | 32 (7.7%) | 369 (89.3%) |
| 55 to 64 Years | 105 (25.0%) | 261 (62.1%) |
| 65 to 74 Years | 294 (96.4%) | 168 (55.1%) |
| 75 Years and over | 197 (100.0%) | 114 (57.9%) |
| Total | 1,191 (26.9%) | 3,299 (74.5%) |
Disability Status by Sex by Age in Plymouth
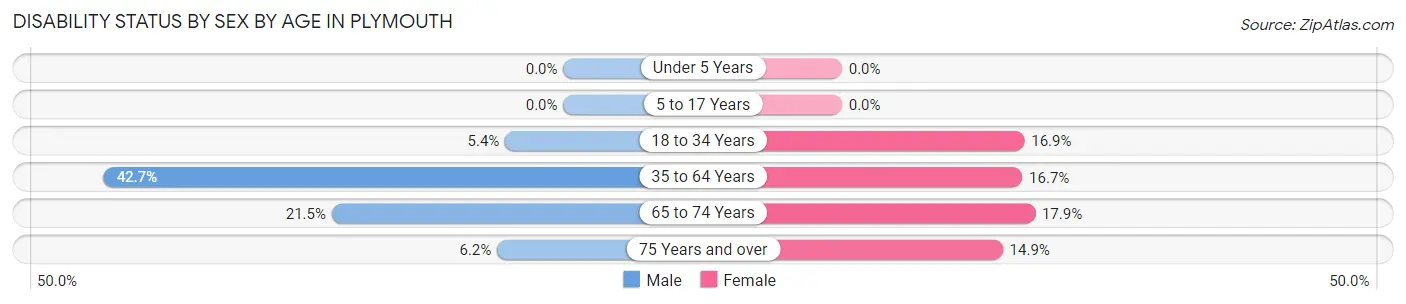
| Age Bracket | Male | Female |
| Under 5 Years | 0 (0.0%) | 0 (0.0%) |
| 5 to 17 Years | 0 (0.0%) | 0 (0.0%) |
| 18 to 34 Years | 64 (5.4%) | 144 (16.9%) |
| 35 to 64 Years | 290 (42.6%) | 116 (16.7%) |
| 65 to 74 Years | 26 (21.5%) | 33 (17.9%) |
| 75 Years and over | 8 (6.1%) | 10 (14.9%) |
Disability Class by Sex by Age in Plymouth
Disability Class: Hearing Difficulty
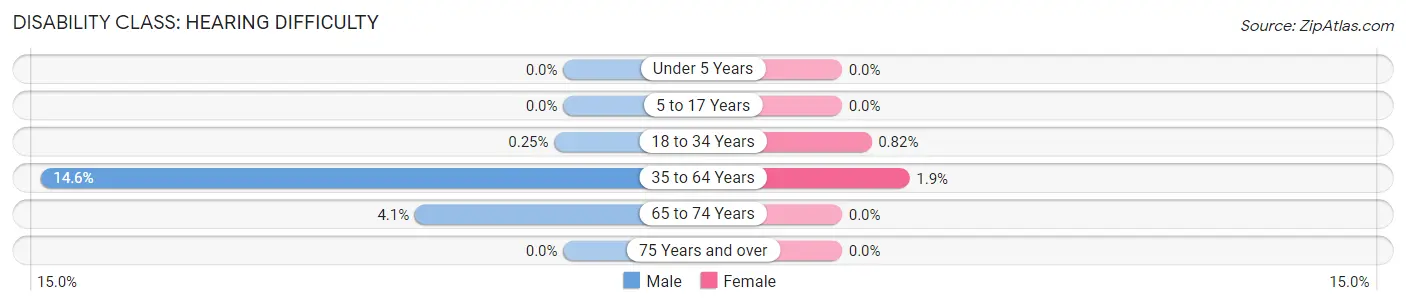
| Age Bracket | Male | Female |
| Under 5 Years | 0 (0.0%) | 0 (0.0%) |
| 5 to 17 Years | 0 (0.0%) | 0 (0.0%) |
| 18 to 34 Years | 3 (0.3%) | 7 (0.8%) |
| 35 to 64 Years | 99 (14.6%) | 13 (1.9%) |
| 65 to 74 Years | 5 (4.1%) | 0 (0.0%) |
| 75 Years and over | 0 (0.0%) | 0 (0.0%) |
Disability Class: Vision Difficulty
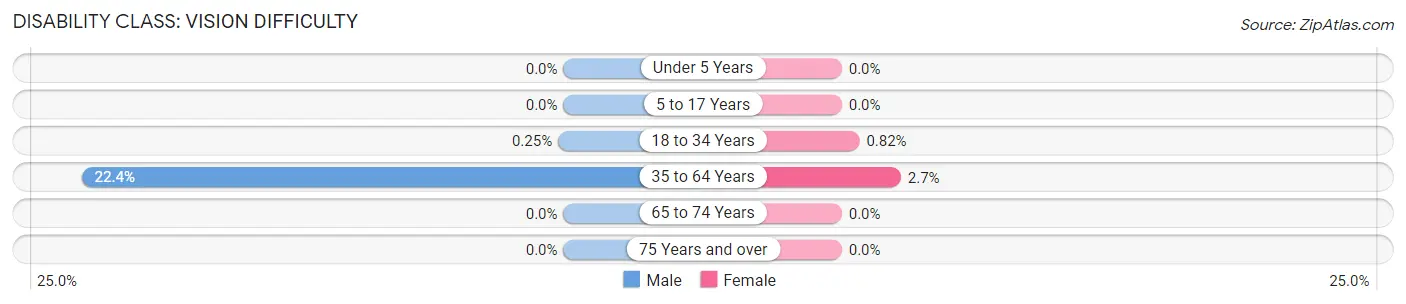
| Age Bracket | Male | Female |
| Under 5 Years | 0 (0.0%) | 0 (0.0%) |
| 5 to 17 Years | 0 (0.0%) | 0 (0.0%) |
| 18 to 34 Years | 3 (0.3%) | 7 (0.8%) |
| 35 to 64 Years | 152 (22.4%) | 19 (2.7%) |
| 65 to 74 Years | 0 (0.0%) | 0 (0.0%) |
| 75 Years and over | 0 (0.0%) | 0 (0.0%) |
Disability Class: Cognitive Difficulty
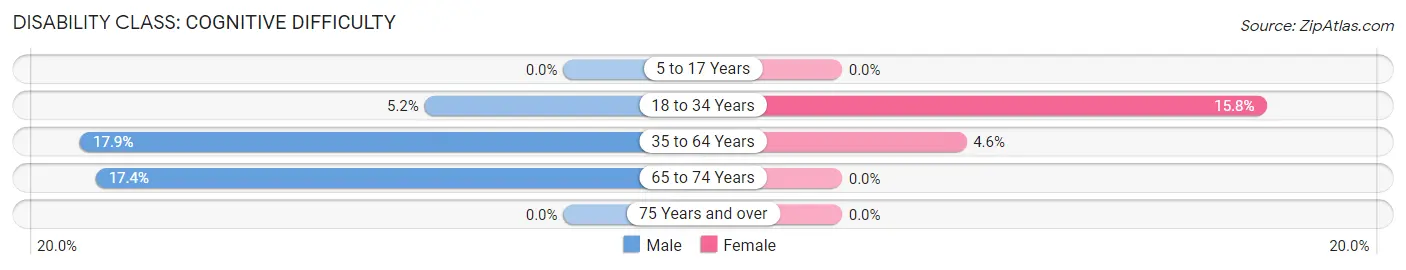
| Age Bracket | Male | Female |
| 5 to 17 Years | 0 (0.0%) | 0 (0.0%) |
| 18 to 34 Years | 61 (5.1%) | 134 (15.8%) |
| 35 to 64 Years | 122 (17.9%) | 32 (4.6%) |
| 65 to 74 Years | 21 (17.4%) | 0 (0.0%) |
| 75 Years and over | 0 (0.0%) | 0 (0.0%) |
Disability Class: Ambulatory Difficulty
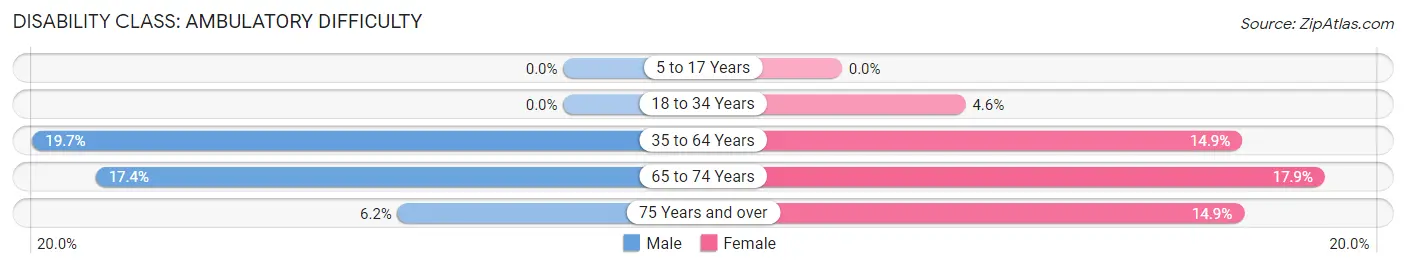
| Age Bracket | Male | Female |
| 5 to 17 Years | 0 (0.0%) | 0 (0.0%) |
| 18 to 34 Years | 0 (0.0%) | 39 (4.6%) |
| 35 to 64 Years | 134 (19.7%) | 103 (14.9%) |
| 65 to 74 Years | 21 (17.4%) | 33 (17.9%) |
| 75 Years and over | 8 (6.1%) | 10 (14.9%) |
Disability Class: Self-Care Difficulty
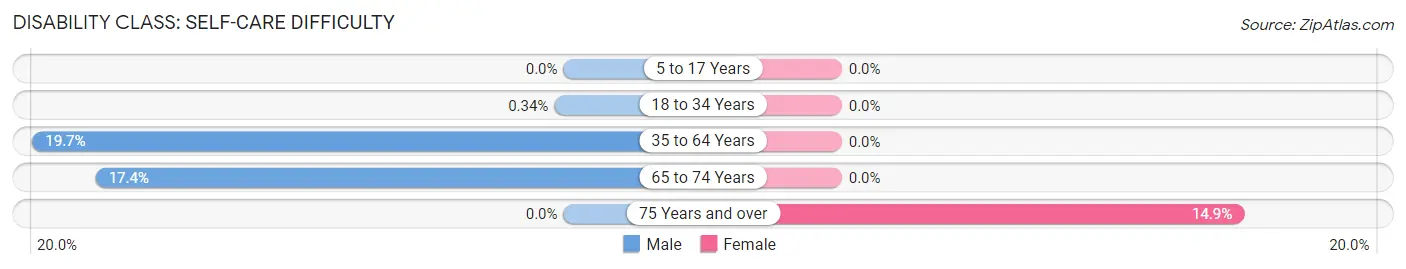
| Age Bracket | Male | Female |
| 5 to 17 Years | 0 (0.0%) | 0 (0.0%) |
| 18 to 34 Years | 4 (0.3%) | 0 (0.0%) |
| 35 to 64 Years | 134 (19.7%) | 0 (0.0%) |
| 65 to 74 Years | 21 (17.4%) | 0 (0.0%) |
| 75 Years and over | 0 (0.0%) | 10 (14.9%) |
Technology Access in Plymouth
Computing Device Access in Plymouth
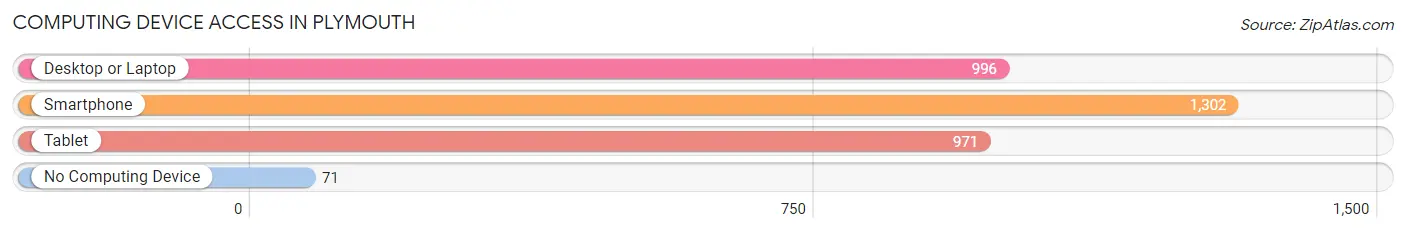
| Device Type | # Households | % Households |
| Desktop or Laptop | 996 | 70.9% |
| Smartphone | 1,302 | 92.7% |
| Tablet | 971 | 69.2% |
| No Computing Device | 71 | 5.1% |
| Total | 1,404 | 100.0% |
Internet Access in Plymouth
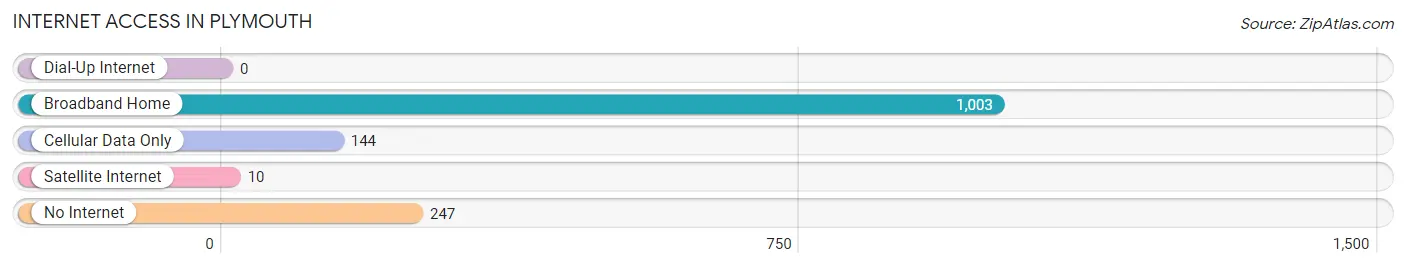
| Internet Type | # Households | % Households |
| Dial-Up Internet | 0 | 0.0% |
| Broadband Home | 1,003 | 71.4% |
| Cellular Data Only | 144 | 10.3% |
| Satellite Internet | 10 | 0.7% |
| No Internet | 247 | 17.6% |
| Total | 1,404 | 100.0% |
Plymouth Summary
Plymouth, New Hampshire is a small town located in the heart of the White Mountains region of the state. It is situated in Grafton County, and is the county seat. The town has a population of approximately 6,500 people, and is home to Plymouth State University.
Geography
Plymouth is located in the White Mountains region of New Hampshire, and is situated in Grafton County. The town is bordered by the towns of Holderness to the north, Campton to the east, Rumney to the south, and Thornton to the west. The town is located at the confluence of the Baker and Pemigewasset Rivers, and is surrounded by the White Mountain National Forest. The town is located at an elevation of 1,000 feet, and has a total area of 24.2 square miles.
History
Plymouth was first settled in 1763, and was incorporated in 1763. The town was named after Plymouth, Massachusetts, and was originally part of the town of Holderness. The town was an important center of industry in the 19th century, with several mills and factories located in the area. The town was also home to several prominent figures in New Hampshire history, including Governor John Wentworth and Senator Henry Wilson.
Economy
Plymouth is a small town with a limited economy. The town is home to several small businesses, including restaurants, retail stores, and service providers. The town is also home to Plymouth State University, which is the largest employer in the area. The university provides jobs for faculty, staff, and students, and is a major contributor to the local economy.
Demographics
As of the 2010 census, the population of Plymouth was 6,495. The racial makeup of the town was 95.3% White, 0.7% African American, 0.4% Native American, 1.2% Asian, 0.1% Pacific Islander, 0.7% from other races, and 1.6% from two or more races. The median household income was $45,945, and the median family income was $54,945. The per capita income was $22,945.
Conclusion
Plymouth, New Hampshire is a small town located in the White Mountains region of the state. It is situated in Grafton County, and is the county seat. The town has a population of approximately 6,500 people, and is home to Plymouth State University. The town has a limited economy, with the university being the largest employer in the area. The town has a diverse population, with the majority of residents being White.
Common Questions
What is Per Capita Income in Plymouth?
Per Capita income in Plymouth is $32,100.
What is the Median Family Income in Plymouth?
Median Family Income in Plymouth is $100,812.
What is the Median Household income in Plymouth?
Median Household Income in Plymouth is $62,172.
What is Income or Wage Gap in Plymouth?
Income or Wage Gap in Plymouth is 7.4%.
Women in Plymouth earn 92.6 cents for every dollar earned by a man.
What is Inequality or Gini Index in Plymouth?
Inequality or Gini Index in Plymouth is 0.47.
What is the Total Population of Plymouth?
Total Population of Plymouth is 4,428.
What is the Total Male Population of Plymouth?
Total Male Population of Plymouth is 2,464.
What is the Total Female Population of Plymouth?
Total Female Population of Plymouth is 1,964.
What is the Ratio of Males per 100 Females in Plymouth?
There are 125.46 Males per 100 Females in Plymouth.
What is the Ratio of Females per 100 Males in Plymouth?
There are 79.71 Females per 100 Males in Plymouth.
What is the Median Population Age in Plymouth?
Median Population Age in Plymouth is 24.0 Years.
What is the Average Family Size in Plymouth
Average Family Size in Plymouth is 2.9 People.
What is the Average Household Size in Plymouth
Average Household Size in Plymouth is 2.3 People.
How Large is the Labor Force in Plymouth?
There are 2,401 People in the Labor Forcein in Plymouth.
What is the Percentage of People in the Labor Force in Plymouth?
59.9% of People are in the Labor Force in Plymouth.
What is the Unemployment Rate in Plymouth?
Unemployment Rate in Plymouth is 6.6%.