East Merrimack, NH Map & Demographics
East Merrimack Map
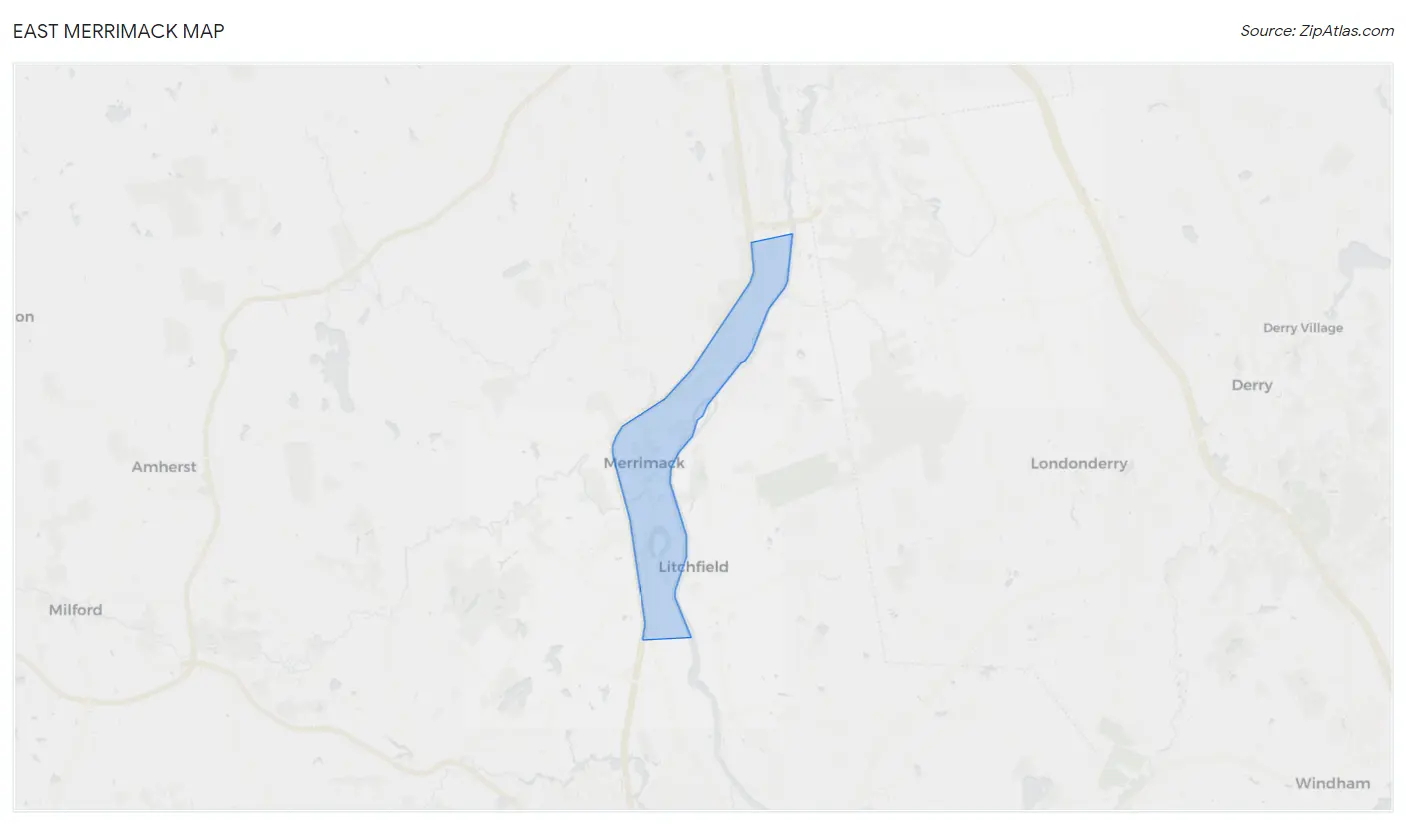
East Merrimack Overview
$48,968
PER CAPITA INCOME
$89,153
AVG FAMILY INCOME
$80,234
AVG HOUSEHOLD INCOME
12.4%
WAGE / INCOME GAP [ % ]
87.6¢/ $1
WAGE / INCOME GAP [ $ ]
0.39
INEQUALITY / GINI INDEX
4,643
TOTAL POPULATION
2,271
MALE POPULATION
2,372
FEMALE POPULATION
95.74
MALES / 100 FEMALES
104.45
FEMALES / 100 MALES
44.6
MEDIAN AGE
2.5
AVG FAMILY SIZE
1.9
AVG HOUSEHOLD SIZE
2,622
LABOR FORCE [ PEOPLE ]
65.5%
PERCENT IN LABOR FORCE
Income in East Merrimack
Income Overview in East Merrimack
Per Capita Income in East Merrimack is $48,968, while median incomes of families and households are $89,153 and $80,234 respectively.
| Characteristic | Number | Measure |
| Per Capita Income | 4,643 | $48,968 |
| Median Family Income | 1,206 | $89,153 |
| Mean Family Income | 1,206 | $108,745 |
| Median Household Income | 2,447 | $80,234 |
| Mean Household Income | 2,447 | $91,659 |
| Income Deficit | 1,206 | $0 |
| Wage / Income Gap (%) | 4,643 | 12.38% |
| Wage / Income Gap ($) | 4,643 | 87.62¢ per $1 |
| Gini / Inequality Index | 4,643 | 0.39 |
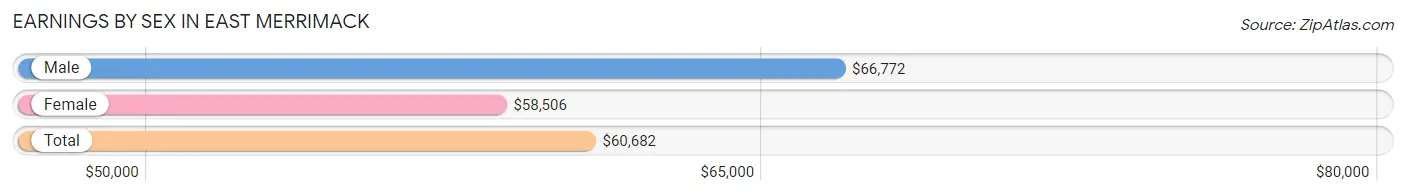
Earnings by Sex in East Merrimack
Average Earnings in East Merrimack are $60,682, $66,772 for men and $58,506 for women, a difference of 12.4%.
| Sex | Number | Average Earnings |
| Male | 1,378 (50.8%) | $66,772 |
| Female | 1,334 (49.2%) | $58,506 |
| Total | 2,712 (100.0%) | $60,682 |
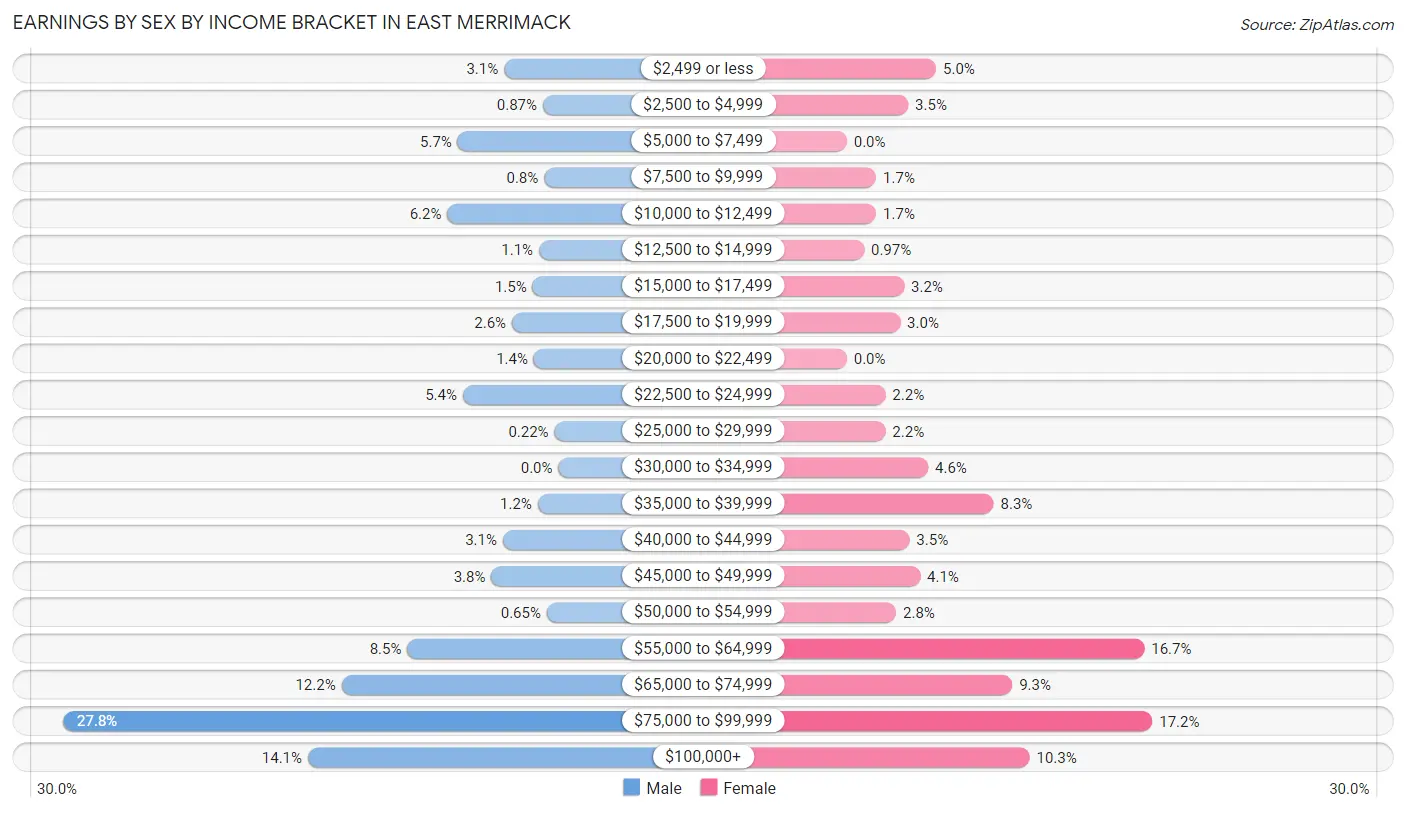
Earnings by Sex by Income Bracket in East Merrimack
The most common earnings brackets in East Merrimack are $75,000 to $99,999 for men (383 | 27.8%) and $75,000 to $99,999 for women (229 | 17.2%).
| Income | Male | Female |
| $2,499 or less | 42 (3.0%) | 67 (5.0%) |
| $2,500 to $4,999 | 12 (0.9%) | 46 (3.5%) |
| $5,000 to $7,499 | 78 (5.7%) | 0 (0.0%) |
| $7,500 to $9,999 | 11 (0.8%) | 22 (1.7%) |
| $10,000 to $12,499 | 86 (6.2%) | 22 (1.7%) |
| $12,500 to $14,999 | 15 (1.1%) | 13 (1.0%) |
| $15,000 to $17,499 | 20 (1.5%) | 43 (3.2%) |
| $17,500 to $19,999 | 36 (2.6%) | 40 (3.0%) |
| $20,000 to $22,499 | 19 (1.4%) | 0 (0.0%) |
| $22,500 to $24,999 | 74 (5.4%) | 29 (2.2%) |
| $25,000 to $29,999 | 3 (0.2%) | 29 (2.2%) |
| $30,000 to $34,999 | 0 (0.0%) | 61 (4.6%) |
| $35,000 to $39,999 | 16 (1.2%) | 110 (8.3%) |
| $40,000 to $44,999 | 43 (3.1%) | 47 (3.5%) |
| $45,000 to $49,999 | 52 (3.8%) | 55 (4.1%) |
| $50,000 to $54,999 | 9 (0.6%) | 37 (2.8%) |
| $55,000 to $64,999 | 117 (8.5%) | 223 (16.7%) |
| $65,000 to $74,999 | 168 (12.2%) | 124 (9.3%) |
| $75,000 to $99,999 | 383 (27.8%) | 229 (17.2%) |
| $100,000+ | 194 (14.1%) | 137 (10.3%) |
| Total | 1,378 (100.0%) | 1,334 (100.0%) |
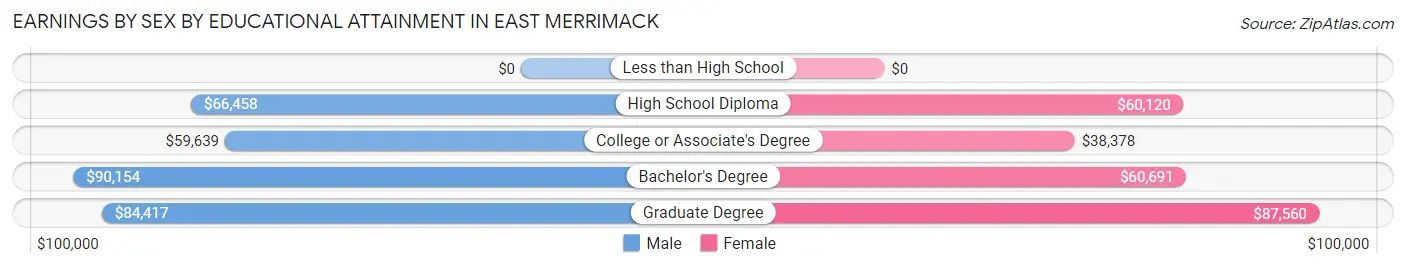
Earnings by Sex by Educational Attainment in East Merrimack
Average earnings in East Merrimack are $72,547 for men and $59,451 for women, a difference of 18.0%. Men with an educational attainment of bachelor's degree enjoy the highest average annual earnings of $90,154, while those with college or associate's degree education earn the least with $59,639. Women with an educational attainment of graduate degree earn the most with the average annual earnings of $87,560, while those with college or associate's degree education have the smallest earnings of $38,378.
| Educational Attainment | Male Income | Female Income |
| Less than High School | - | - |
| High School Diploma | $66,458 | $60,120 |
| College or Associate's Degree | $59,639 | $38,378 |
| Bachelor's Degree | $90,154 | $60,691 |
| Graduate Degree | $84,417 | $87,560 |
| Total | $72,547 | $59,451 |
Family Income in East Merrimack
Family Income Brackets in East Merrimack
According to the East Merrimack family income data, there are 279 families falling into the $75,000 to $99,999 income range, which is the most common income bracket and makes up 23.1% of all families. Conversely, the $25,000 to $34,999 income bracket is the least frequent group with only 8 families (0.7%) belonging to this category.
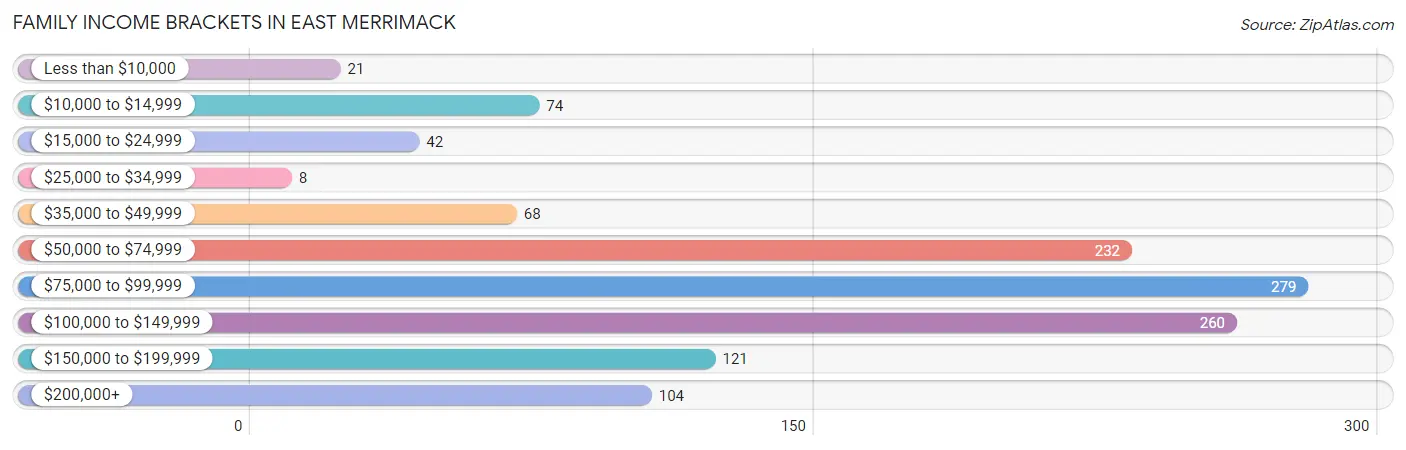
| Income Bracket | # Families | % Families |
| Less than $10,000 | 21 | 1.7% |
| $10,000 to $14,999 | 74 | 6.1% |
| $15,000 to $24,999 | 42 | 3.5% |
| $25,000 to $34,999 | 8 | 0.7% |
| $35,000 to $49,999 | 68 | 5.6% |
| $50,000 to $74,999 | 232 | 19.2% |
| $75,000 to $99,999 | 279 | 23.1% |
| $100,000 to $149,999 | 260 | 21.6% |
| $150,000 to $199,999 | 121 | 10.0% |
| $200,000+ | 104 | 8.6% |
Family Income by Famaliy Size in East Merrimack
3-person families (153 | 12.7%) account for the highest median family income in East Merrimack with $114,464 per family, while 2-person families (883 | 73.2%) have the highest median income of $42,898 per family member.
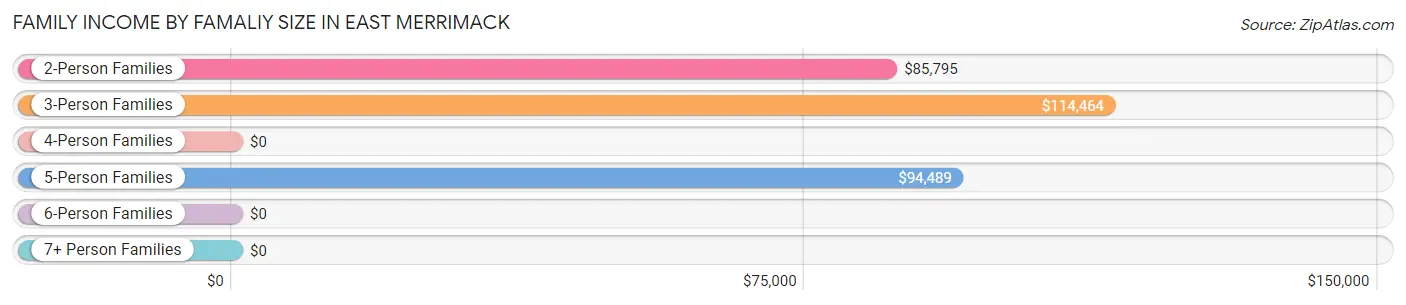
| Income Bracket | # Families | Median Income |
| 2-Person Families | 883 (73.2%) | $85,795 |
| 3-Person Families | 153 (12.7%) | $114,464 |
| 4-Person Families | 116 (9.6%) | $0 |
| 5-Person Families | 53 (4.4%) | $94,489 |
| 6-Person Families | 1 (0.1%) | $0 |
| 7+ Person Families | 0 (0.0%) | $0 |
| Total | 1,206 (100.0%) | $89,153 |
Family Income by Number of Earners in East Merrimack
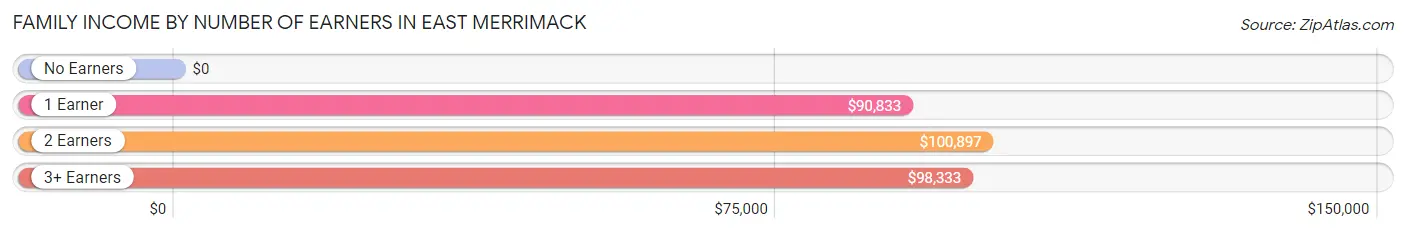
| Number of Earners | # Families | Median Income |
| No Earners | 253 (21.0%) | $0 |
| 1 Earner | 344 (28.5%) | $90,833 |
| 2 Earners | 547 (45.4%) | $100,897 |
| 3+ Earners | 62 (5.1%) | $98,333 |
| Total | 1,206 (100.0%) | $89,153 |
Household Income in East Merrimack
Household Income Brackets in East Merrimack
With 553 households falling in the category, the $75,000 to $99,999 income range is the most frequent in East Merrimack, accounting for 22.6% of all households. In contrast, only 64 households (2.6%) fall into the $25,000 to $34,999 income bracket, making it the least populous group.
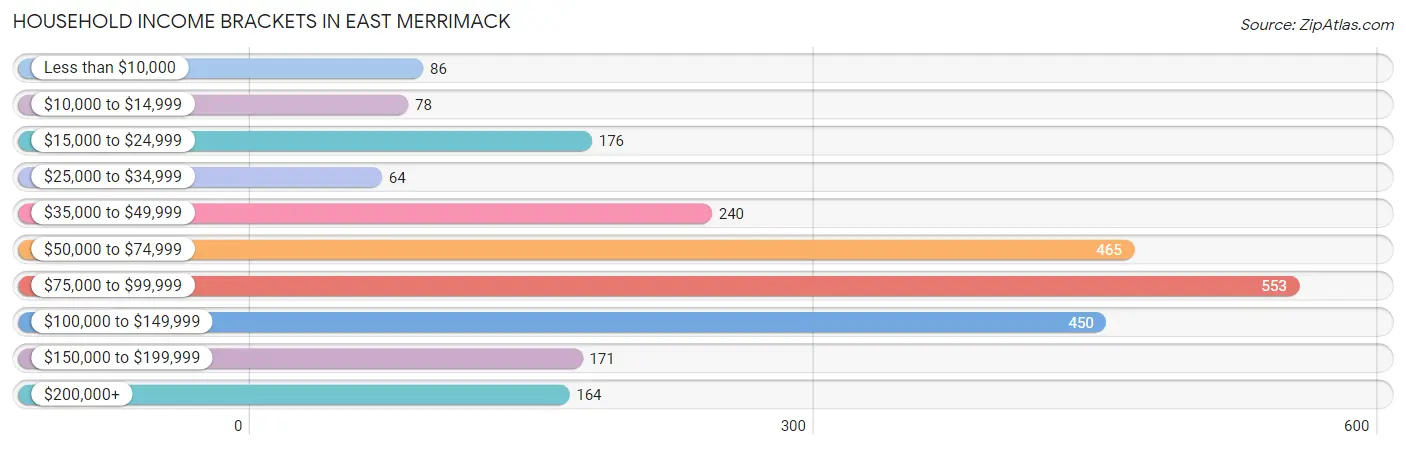
| Income Bracket | # Households | % Households |
| Less than $10,000 | 86 | 3.5% |
| $10,000 to $14,999 | 78 | 3.2% |
| $15,000 to $24,999 | 176 | 7.2% |
| $25,000 to $34,999 | 64 | 2.6% |
| $35,000 to $49,999 | 240 | 9.8% |
| $50,000 to $74,999 | 465 | 19.0% |
| $75,000 to $99,999 | 553 | 22.6% |
| $100,000 to $149,999 | 450 | 18.4% |
| $150,000 to $199,999 | 171 | 7.0% |
| $200,000+ | 164 | 6.7% |
Household Income by Householder Age in East Merrimack
The median household income in East Merrimack is $80,234, with the highest median household income of $93,625 found in the 45 to 64 years age bracket for the primary householder. A total of 765 households (31.3%) fall into this category.
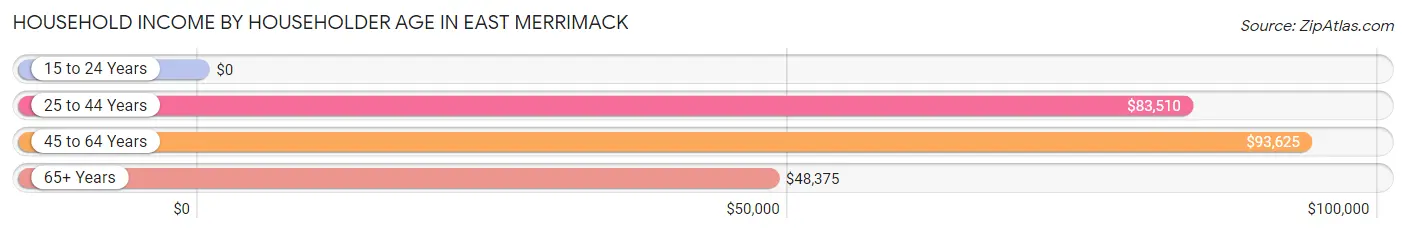
| Income Bracket | # Households | Median Income |
| 15 to 24 Years | 0 (0.0%) | $0 |
| 25 to 44 Years | 919 (37.6%) | $83,510 |
| 45 to 64 Years | 765 (31.3%) | $93,625 |
| 65+ Years | 763 (31.2%) | $48,375 |
| Total | 2,447 (100.0%) | $80,234 |
Poverty in East Merrimack
Income Below Poverty by Sex and Age in East Merrimack
With 11.8% poverty level for males and 6.0% for females among the residents of East Merrimack, 15 year old males and 16 and 17 year old females are the most vulnerable to poverty, with 18 males (62.1%) and 19 females (67.9%) in their respective age groups living below the poverty level.
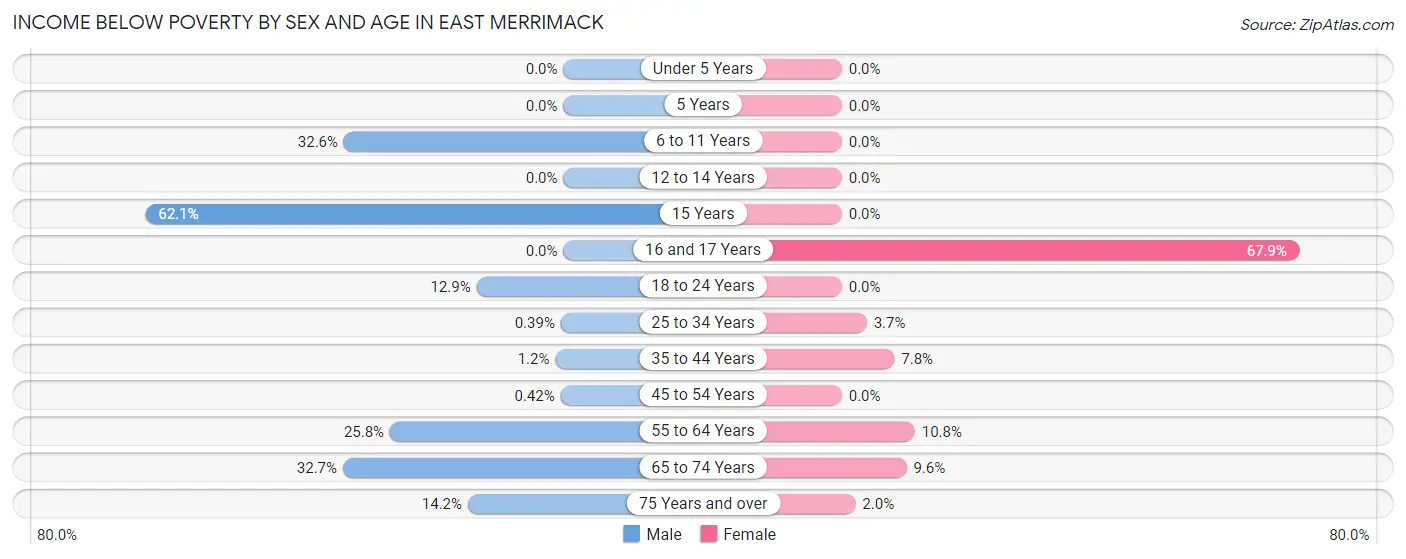
| Age Bracket | Male | Female |
| Under 5 Years | 0 (0.0%) | 0 (0.0%) |
| 5 Years | 0 (0.0%) | 0 (0.0%) |
| 6 to 11 Years | 44 (32.6%) | 0 (0.0%) |
| 12 to 14 Years | 0 (0.0%) | 0 (0.0%) |
| 15 Years | 18 (62.1%) | 0 (0.0%) |
| 16 and 17 Years | 0 (0.0%) | 19 (67.9%) |
| 18 to 24 Years | 16 (12.9%) | 0 (0.0%) |
| 25 to 34 Years | 2 (0.4%) | 15 (3.7%) |
| 35 to 44 Years | 3 (1.2%) | 20 (7.8%) |
| 45 to 54 Years | 1 (0.4%) | 0 (0.0%) |
| 55 to 64 Years | 86 (25.8%) | 44 (10.8%) |
| 65 to 74 Years | 73 (32.7%) | 36 (9.6%) |
| 75 Years and over | 19 (14.2%) | 5 (2.0%) |
| Total | 262 (11.8%) | 139 (6.0%) |
Income Above Poverty by Sex and Age in East Merrimack
According to the poverty statistics in East Merrimack, males aged under 5 years and females aged under 5 years are the age groups that are most secure financially, with 100.0% of males and 100.0% of females in these age groups living above the poverty line.
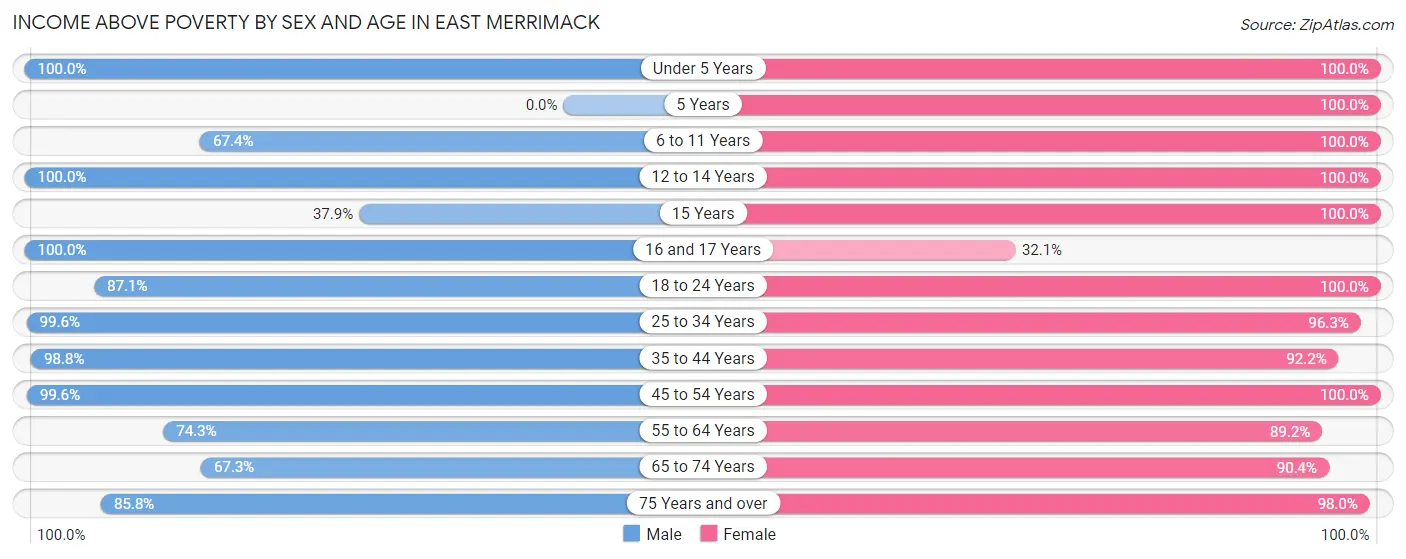
| Age Bracket | Male | Female |
| Under 5 Years | 73 (100.0%) | 72 (100.0%) |
| 5 Years | 0 (0.0%) | 2 (100.0%) |
| 6 to 11 Years | 91 (67.4%) | 89 (100.0%) |
| 12 to 14 Years | 70 (100.0%) | 52 (100.0%) |
| 15 Years | 11 (37.9%) | 58 (100.0%) |
| 16 and 17 Years | 97 (100.0%) | 9 (32.1%) |
| 18 to 24 Years | 108 (87.1%) | 52 (100.0%) |
| 25 to 34 Years | 512 (99.6%) | 390 (96.3%) |
| 35 to 44 Years | 250 (98.8%) | 236 (92.2%) |
| 45 to 54 Years | 236 (99.6%) | 291 (100.0%) |
| 55 to 64 Years | 248 (74.3%) | 362 (89.2%) |
| 65 to 74 Years | 150 (67.3%) | 339 (90.4%) |
| 75 Years and over | 115 (85.8%) | 243 (98.0%) |
| Total | 1,961 (88.2%) | 2,195 (94.0%) |
Income Below Poverty Among Married-Couple Families in East Merrimack
The poverty statistics for married-couple families in East Merrimack show that 8.8% or 73 of the total 833 families live below the poverty line. Families with no children have the highest poverty rate of 11.6%, comprising of 73 families. On the other hand, families with 1 or 2 children have the lowest poverty rate of 0.0%, which includes 0 families.
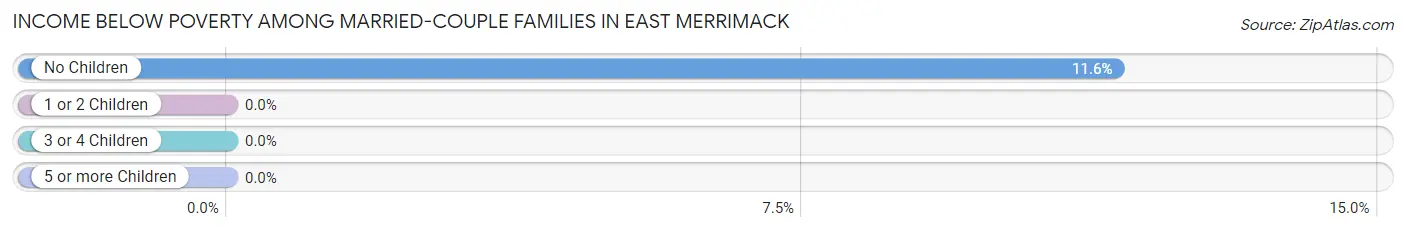
| Children | Above Poverty | Below Poverty |
| No Children | 558 (88.4%) | 73 (11.6%) |
| 1 or 2 Children | 170 (100.0%) | 0 (0.0%) |
| 3 or 4 Children | 32 (100.0%) | 0 (0.0%) |
| 5 or more Children | 0 (0.0%) | 0 (0.0%) |
| Total | 760 (91.2%) | 73 (8.8%) |
Income Below Poverty Among Single-Parent Households in East Merrimack
According to the poverty data in East Merrimack, 87.5% or 42 single-father households and 6.1% or 20 single-mother households are living below the poverty line. Among single-father households, those with 1 or 2 children have the highest poverty rate, with 42 households (100.0%) experiencing poverty. Likewise, among single-mother households, those with 1 or 2 children have the highest poverty rate, with 20 households (9.8%) falling below the poverty line.
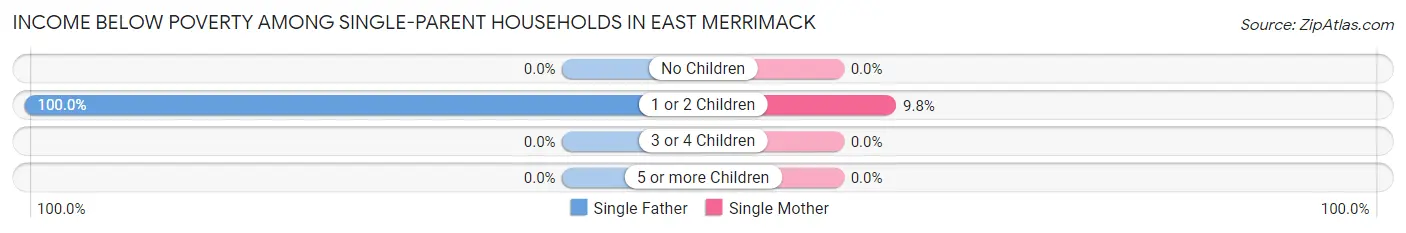
| Children | Single Father | Single Mother |
| No Children | 0 (0.0%) | 0 (0.0%) |
| 1 or 2 Children | 42 (100.0%) | 20 (9.8%) |
| 3 or 4 Children | 0 (0.0%) | 0 (0.0%) |
| 5 or more Children | 0 (0.0%) | 0 (0.0%) |
| Total | 42 (87.5%) | 20 (6.1%) |
Income Below Poverty Among Married-Couple vs Single-Parent Households in East Merrimack
The poverty data for East Merrimack shows that 73 of the married-couple family households (8.8%) and 62 of the single-parent households (16.6%) are living below the poverty level. Within the married-couple family households, those with no children have the highest poverty rate, with 73 households (11.6%) falling below the poverty line. Among the single-parent households, those with 1 or 2 children have the highest poverty rate, with 62 household (25.1%) living below poverty.
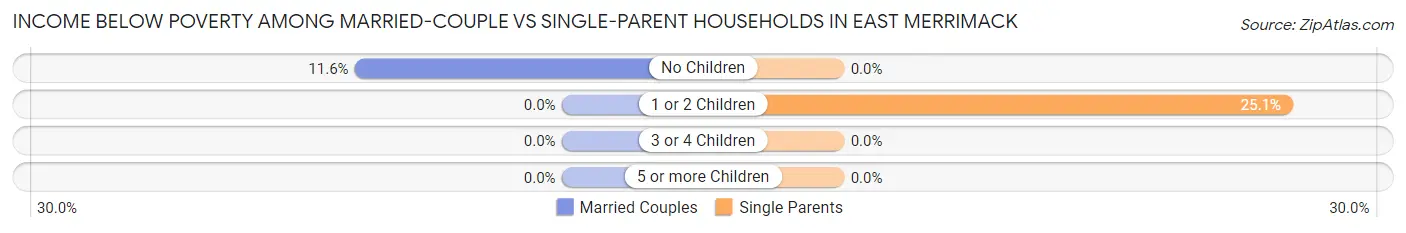
| Children | Married-Couple Families | Single-Parent Households |
| No Children | 73 (11.6%) | 0 (0.0%) |
| 1 or 2 Children | 0 (0.0%) | 62 (25.1%) |
| 3 or 4 Children | 0 (0.0%) | 0 (0.0%) |
| 5 or more Children | 0 (0.0%) | 0 (0.0%) |
| Total | 73 (8.8%) | 62 (16.6%) |
Race in East Merrimack
The most populous races in East Merrimack are White / Caucasian (4,414 | 95.1%), Two or more Races (141 | 3.0%), and Hispanic or Latino (100 | 2.1%).
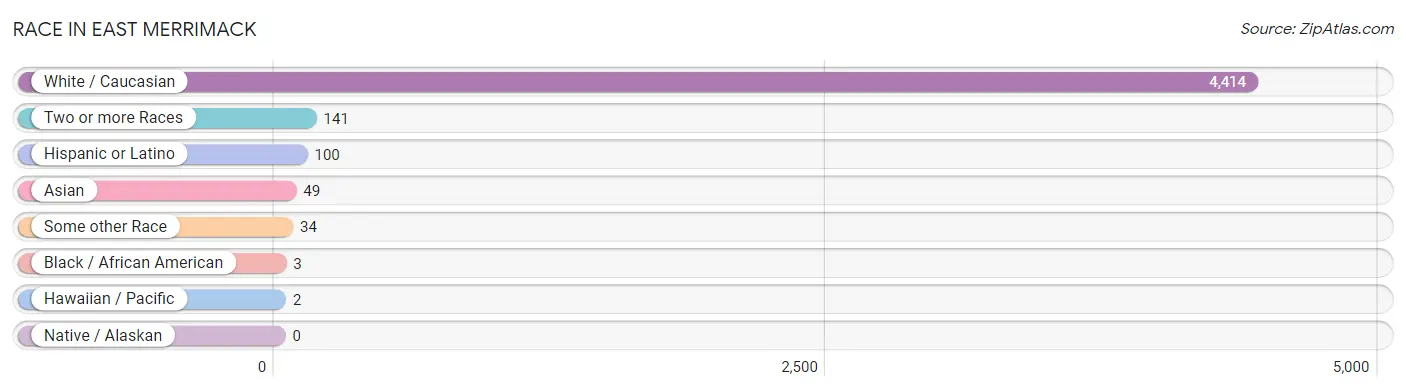
| Race | # Population | % Population |
| Asian | 49 | 1.1% |
| Black / African American | 3 | 0.1% |
| Hawaiian / Pacific | 2 | 0.0% |
| Hispanic or Latino | 100 | 2.1% |
| Native / Alaskan | 0 | 0.0% |
| White / Caucasian | 4,414 | 95.1% |
| Two or more Races | 141 | 3.0% |
| Some other Race | 34 | 0.7% |
| Total | 4,643 | 100.0% |
Ancestry in East Merrimack
The most populous ancestries reported in East Merrimack are Irish (1,054 | 22.7%), English (690 | 14.9%), Italian (558 | 12.0%), French Canadian (490 | 10.5%), and French (445 | 9.6%), together accounting for 69.7% of all East Merrimack residents.
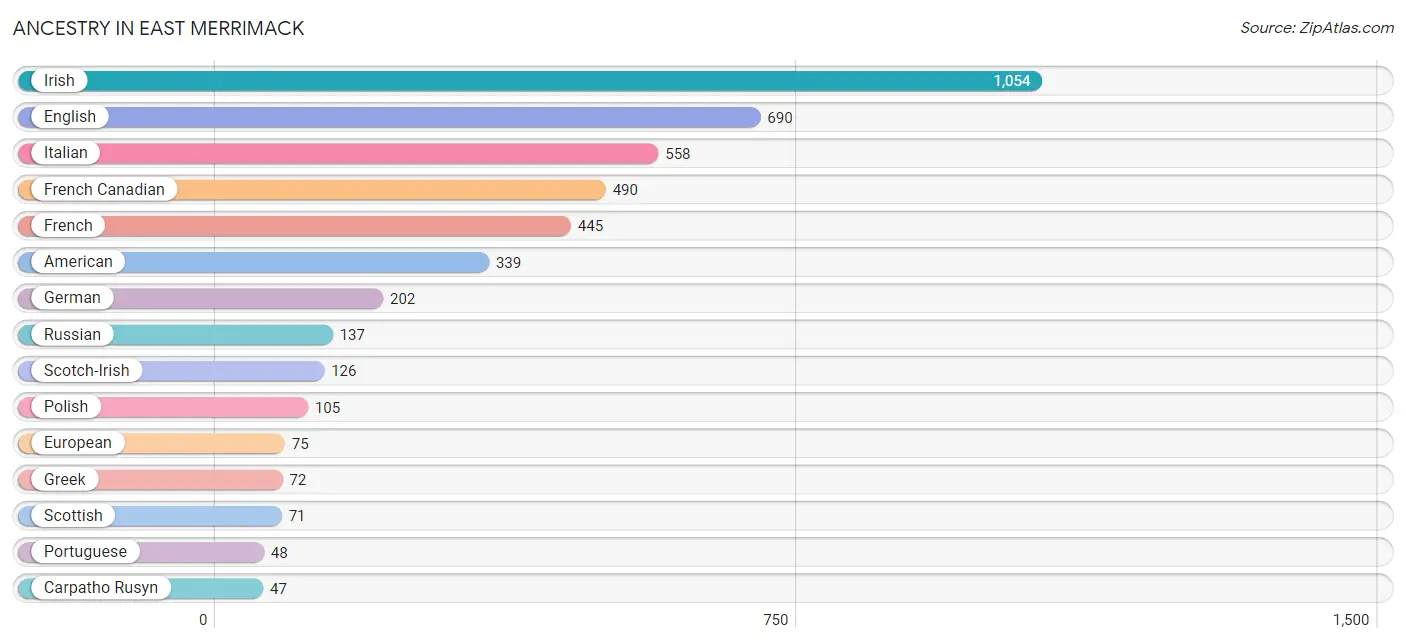
| Ancestry | # Population | % Population |
| American | 339 | 7.3% |
| Arab | 12 | 0.3% |
| Belgian | 17 | 0.4% |
| British | 10 | 0.2% |
| Burmese | 12 | 0.3% |
| Canadian | 37 | 0.8% |
| Carpatho Rusyn | 47 | 1.0% |
| Central American | 18 | 0.4% |
| Cherokee | 20 | 0.4% |
| Cuban | 35 | 0.7% |
| Danish | 6 | 0.1% |
| English | 690 | 14.9% |
| Estonian | 19 | 0.4% |
| European | 75 | 1.6% |
| Filipino | 20 | 0.4% |
| French | 445 | 9.6% |
| French Canadian | 490 | 10.5% |
| German | 202 | 4.3% |
| Greek | 72 | 1.5% |
| Guamanian / Chamorro | 12 | 0.3% |
| Indian (Asian) | 9 | 0.2% |
| Irish | 1,054 | 22.7% |
| Italian | 558 | 12.0% |
| Korean | 22 | 0.5% |
| Lebanese | 12 | 0.3% |
| Norwegian | 15 | 0.3% |
| Peruvian | 42 | 0.9% |
| Polish | 105 | 2.3% |
| Portuguese | 48 | 1.0% |
| Romanian | 20 | 0.4% |
| Russian | 137 | 2.9% |
| Salvadoran | 18 | 0.4% |
| Scandinavian | 9 | 0.2% |
| Scotch-Irish | 126 | 2.7% |
| Scottish | 71 | 1.5% |
| South American | 42 | 0.9% |
| Swedish | 33 | 0.7% |
| Swiss | 12 | 0.3% |
| Thai | 8 | 0.2% |
| Welsh | 26 | 0.6% | View All 40 Rows |
Immigrants in East Merrimack
The most numerous immigrant groups reported in East Merrimack came from Europe (140 | 3.0%), Asia (105 | 2.3%), Western Asia (73 | 1.6%), Germany (56 | 1.2%), and Western Europe (56 | 1.2%), together accounting for 9.3% of all East Merrimack residents.
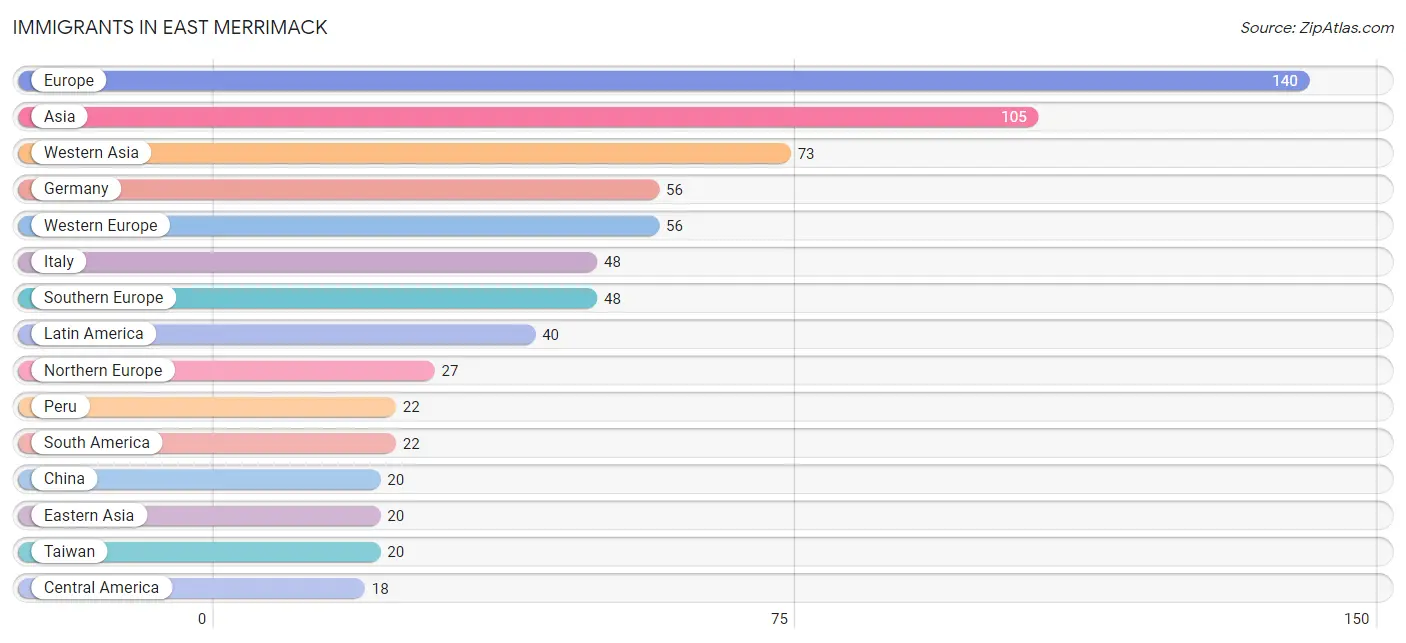
| Immigration Origin | # Population | % Population |
| Asia | 105 | 2.3% |
| Canada | 9 | 0.2% |
| Central America | 18 | 0.4% |
| China | 20 | 0.4% |
| Czechoslovakia | 9 | 0.2% |
| Eastern Asia | 20 | 0.4% |
| Eastern Europe | 9 | 0.2% |
| El Salvador | 18 | 0.4% |
| England | 12 | 0.3% |
| Europe | 140 | 3.0% |
| Germany | 56 | 1.2% |
| Italy | 48 | 1.0% |
| Latin America | 40 | 0.9% |
| Northern Europe | 27 | 0.6% |
| Norway | 15 | 0.3% |
| Peru | 22 | 0.5% |
| Philippines | 12 | 0.3% |
| South America | 22 | 0.5% |
| South Eastern Asia | 12 | 0.3% |
| Southern Europe | 48 | 1.0% |
| Taiwan | 20 | 0.4% |
| Western Asia | 73 | 1.6% |
| Western Europe | 56 | 1.2% | View All 23 Rows |
Sex and Age in East Merrimack
Sex and Age in East Merrimack
The most populous age groups in East Merrimack are 25 to 29 Years (292 | 12.9%) for men and 25 to 29 Years (249 | 10.5%) for women.
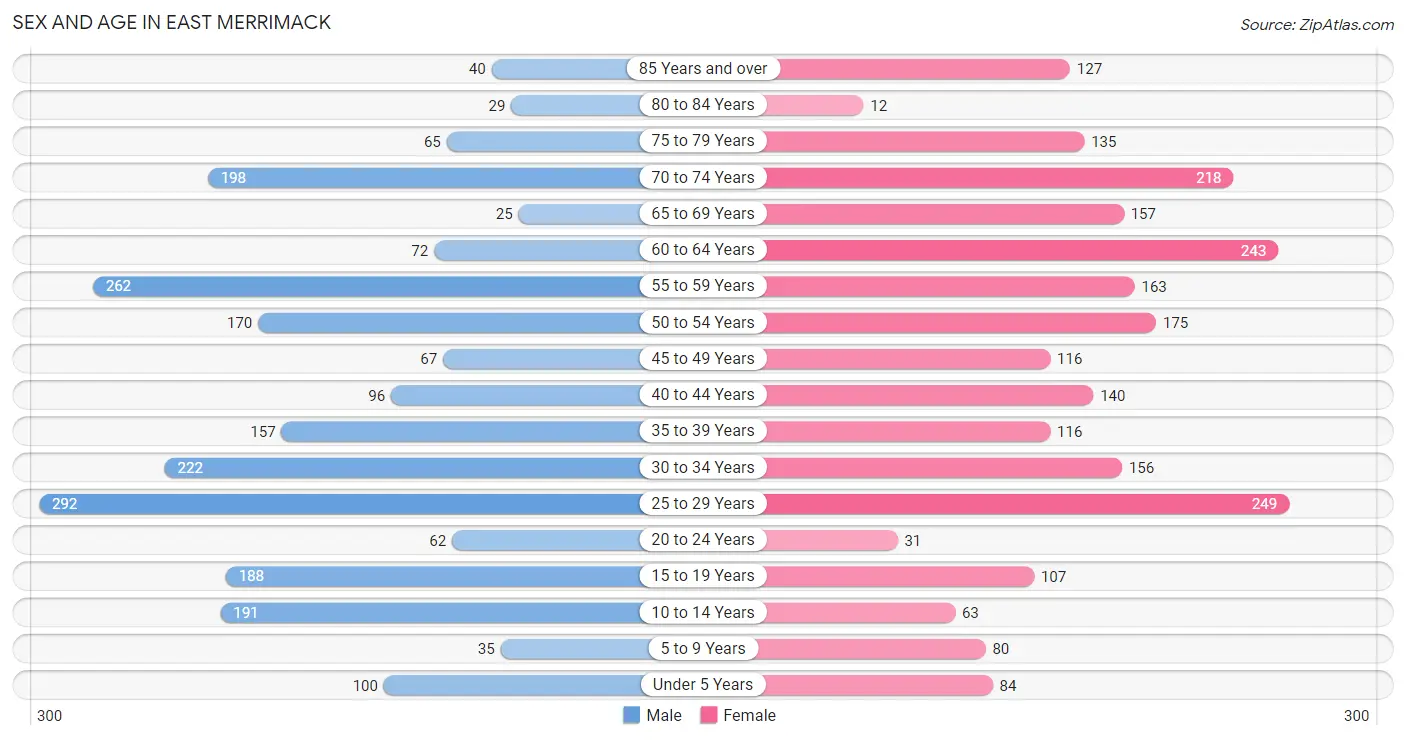
| Age Bracket | Male | Female |
| Under 5 Years | 100 (4.4%) | 84 (3.5%) |
| 5 to 9 Years | 35 (1.5%) | 80 (3.4%) |
| 10 to 14 Years | 191 (8.4%) | 63 (2.7%) |
| 15 to 19 Years | 188 (8.3%) | 107 (4.5%) |
| 20 to 24 Years | 62 (2.7%) | 31 (1.3%) |
| 25 to 29 Years | 292 (12.9%) | 249 (10.5%) |
| 30 to 34 Years | 222 (9.8%) | 156 (6.6%) |
| 35 to 39 Years | 157 (6.9%) | 116 (4.9%) |
| 40 to 44 Years | 96 (4.2%) | 140 (5.9%) |
| 45 to 49 Years | 67 (2.9%) | 116 (4.9%) |
| 50 to 54 Years | 170 (7.5%) | 175 (7.4%) |
| 55 to 59 Years | 262 (11.5%) | 163 (6.9%) |
| 60 to 64 Years | 72 (3.2%) | 243 (10.2%) |
| 65 to 69 Years | 25 (1.1%) | 157 (6.6%) |
| 70 to 74 Years | 198 (8.7%) | 218 (9.2%) |
| 75 to 79 Years | 65 (2.9%) | 135 (5.7%) |
| 80 to 84 Years | 29 (1.3%) | 12 (0.5%) |
| 85 Years and over | 40 (1.8%) | 127 (5.3%) |
| Total | 2,271 (100.0%) | 2,372 (100.0%) |
Families and Households in East Merrimack
Median Family Size in East Merrimack
The median family size in East Merrimack is 2.50 persons per family, with married-couple families (833 | 69.1%) accounting for the largest median family size of 2.54 persons per family. On the other hand, single male/father families (48 | 4.0%) represent the smallest median family size with 2.06 persons per family.
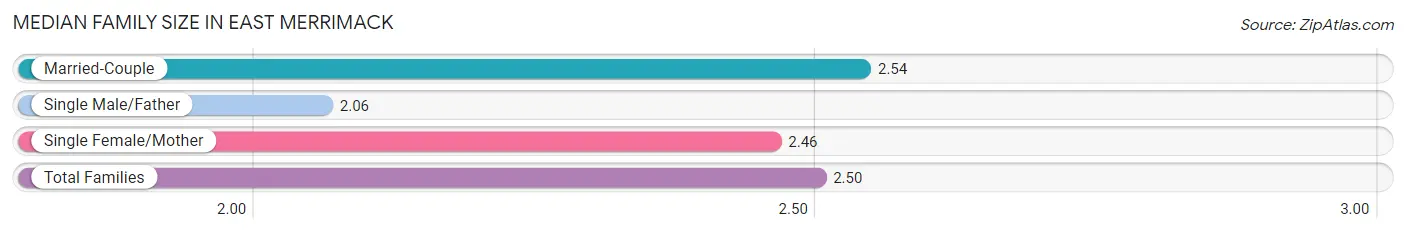
| Family Type | # Families | Family Size |
| Married-Couple | 833 (69.1%) | 2.54 |
| Single Male/Father | 48 (4.0%) | 2.06 |
| Single Female/Mother | 325 (27.0%) | 2.46 |
| Total Families | 1,206 (100.0%) | 2.50 |
Median Household Size in East Merrimack
The median household size in East Merrimack is 1.88 persons per household, with married-couple households (833 | 34.0%) accounting for the largest median household size of 2.59 persons per household. non-family households (1,241 | 50.7%) represent the smallest median household size with 1.21 persons per household.
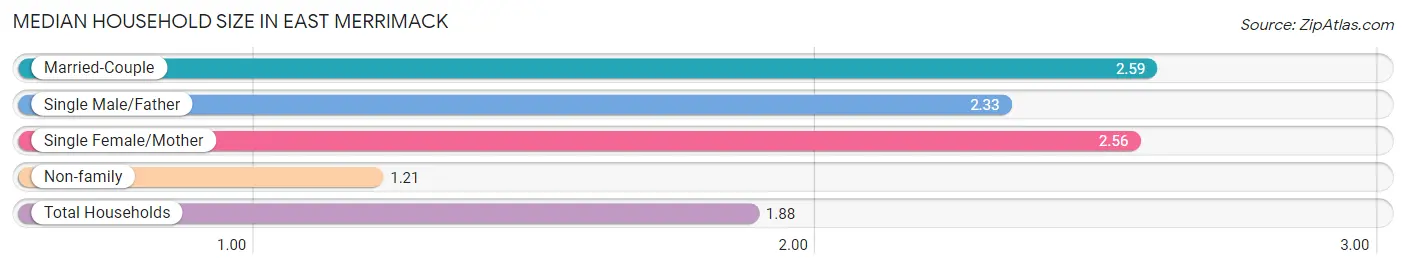
| Household Type | # Households | Household Size |
| Married-Couple | 833 (34.0%) | 2.59 |
| Single Male/Father | 48 (2.0%) | 2.33 |
| Single Female/Mother | 325 (13.3%) | 2.56 |
| Non-family | 1,241 (50.7%) | 1.21 |
| Total Households | 2,447 (100.0%) | 1.88 |
Household Size by Marriage Status in East Merrimack
Out of a total of 2,447 households in East Merrimack, 1,206 (49.3%) are family households, while 1,241 (50.7%) are nonfamily households. The most numerous type of family households are 2-person households, comprising 842, and the most common type of nonfamily households are 1-person households, comprising 1,016.
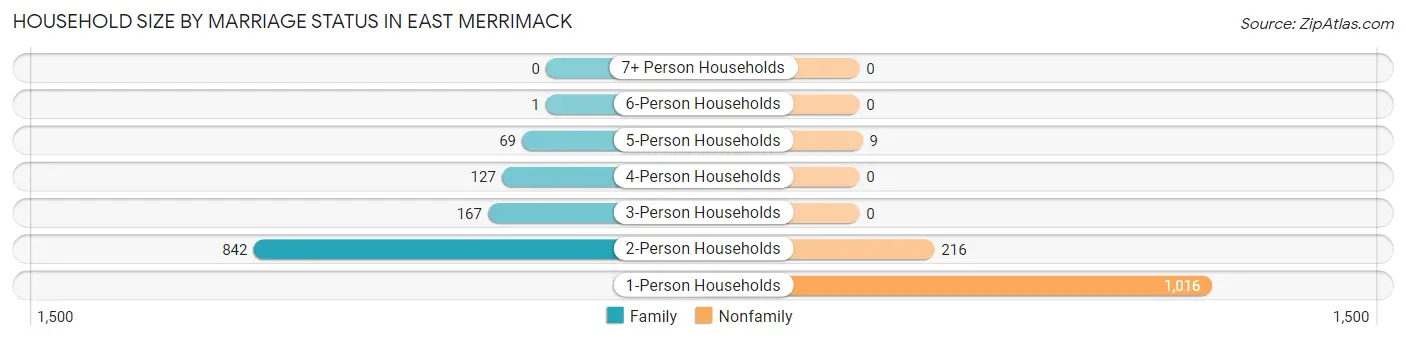
| Household Size | Family Households | Nonfamily Households |
| 1-Person Households | - | 1,016 (41.5%) |
| 2-Person Households | 842 (34.4%) | 216 (8.8%) |
| 3-Person Households | 167 (6.8%) | 0 (0.0%) |
| 4-Person Households | 127 (5.2%) | 0 (0.0%) |
| 5-Person Households | 69 (2.8%) | 9 (0.4%) |
| 6-Person Households | 1 (0.0%) | 0 (0.0%) |
| 7+ Person Households | 0 (0.0%) | 0 (0.0%) |
| Total | 1,206 (49.3%) | 1,241 (50.7%) |
Female Fertility in East Merrimack
Fertility by Age in East Merrimack
Average fertility rate in East Merrimack is 95.0 births per 1,000 women. Women in the age bracket of 35 to 50 years have the highest fertility rate with 139.0 births per 1,000 women. Women in the age bracket of 35 to 50 years acount for 68.0% of all women with births.
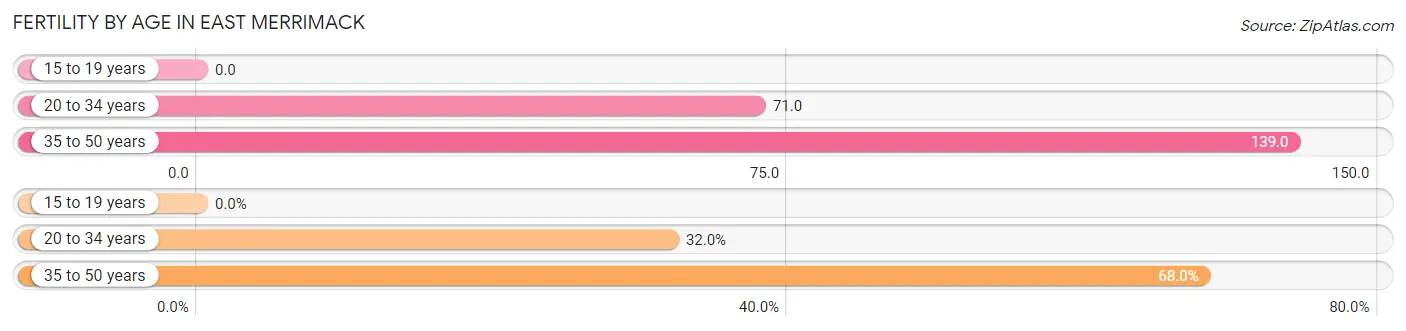
| Age Bracket | Women with Births | Births / 1,000 Women |
| 15 to 19 years | 0 (0.0%) | 0.0 |
| 20 to 34 years | 31 (32.0%) | 71.0 |
| 35 to 50 years | 66 (68.0%) | 139.0 |
| Total | 97 (100.0%) | 95.0 |
Fertility by Age by Marriage Status in East Merrimack
32.0% of women with births (97) in East Merrimack are married. The highest percentage of unmarried women with births falls into 35 to 50 years age bracket with 100.0% of them unmarried at the time of birth, while the lowest percentage of unmarried women with births belong to 20 to 34 years age bracket with 0.0% of them unmarried.
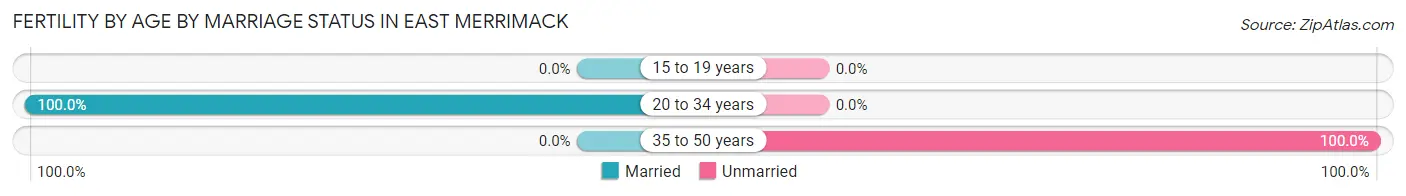
| Age Bracket | Married | Unmarried |
| 15 to 19 years | 0 (0.0%) | 0 (0.0%) |
| 20 to 34 years | 31 (100.0%) | 0 (0.0%) |
| 35 to 50 years | 0 (0.0%) | 66 (100.0%) |
| Total | 31 (32.0%) | 66 (68.0%) |
Fertility by Education in East Merrimack
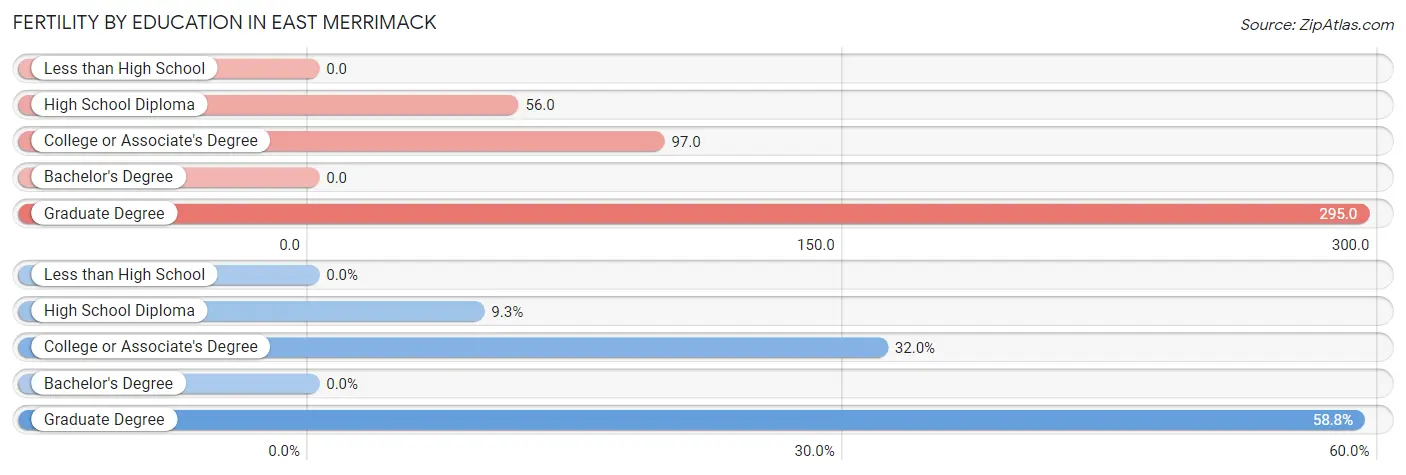
| Educational Attainment | Women with Births | Births / 1,000 Women |
| Less than High School | 0 (0.0%) | 0.0 |
| High School Diploma | 9 (9.3%) | 56.0 |
| College or Associate's Degree | 31 (32.0%) | 97.0 |
| Bachelor's Degree | 0 (0.0%) | 0.0 |
| Graduate Degree | 57 (58.8%) | 295.0 |
| Total | 97 (100.0%) | 95.0 |
Fertility by Education by Marriage Status in East Merrimack
68.0% of women with births in East Merrimack are unmarried. Women with the educational attainment of high school diploma are most likely to be married with 100.0% of them married at childbirth, while women with the educational attainment of graduate degree are least likely to be married with 100.0% of them unmarried at childbirth.
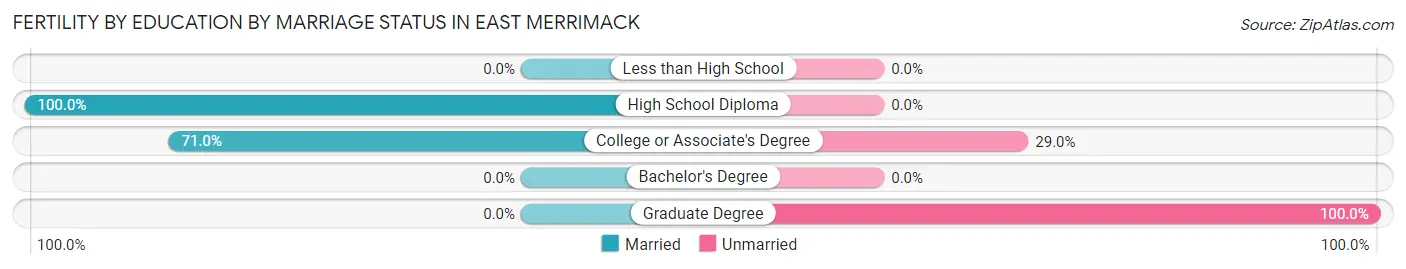
| Educational Attainment | Married | Unmarried |
| Less than High School | 0 (0.0%) | 0 (0.0%) |
| High School Diploma | 9 (100.0%) | 0 (0.0%) |
| College or Associate's Degree | 22 (71.0%) | 9 (29.0%) |
| Bachelor's Degree | 0 (0.0%) | 0 (0.0%) |
| Graduate Degree | 0 (0.0%) | 57 (100.0%) |
| Total | 31 (32.0%) | 66 (68.0%) |
Employment Characteristics in East Merrimack
Employment by Class of Employer in East Merrimack
Among the 2,610 employed individuals in East Merrimack, private company employees (1,697 | 65.0%), not-for-profit organizations (341 | 13.1%), and self-employed (not incorporated) (213 | 8.2%) make up the most common classes of employment.
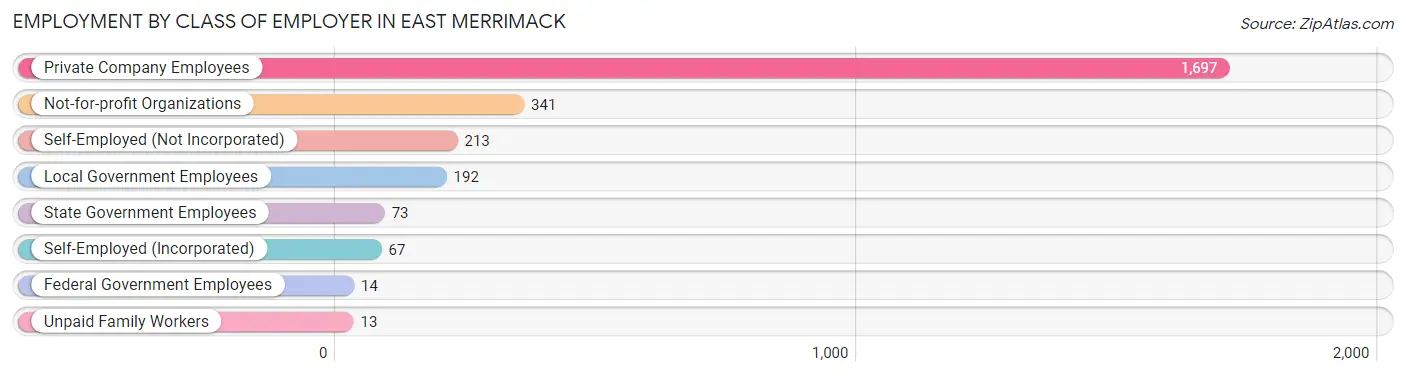
| Employer Class | # Employees | % Employees |
| Private Company Employees | 1,697 | 65.0% |
| Self-Employed (Incorporated) | 67 | 2.6% |
| Self-Employed (Not Incorporated) | 213 | 8.2% |
| Not-for-profit Organizations | 341 | 13.1% |
| Local Government Employees | 192 | 7.4% |
| State Government Employees | 73 | 2.8% |
| Federal Government Employees | 14 | 0.5% |
| Unpaid Family Workers | 13 | 0.5% |
| Total | 2,610 | 100.0% |
Employment Status by Age in East Merrimack
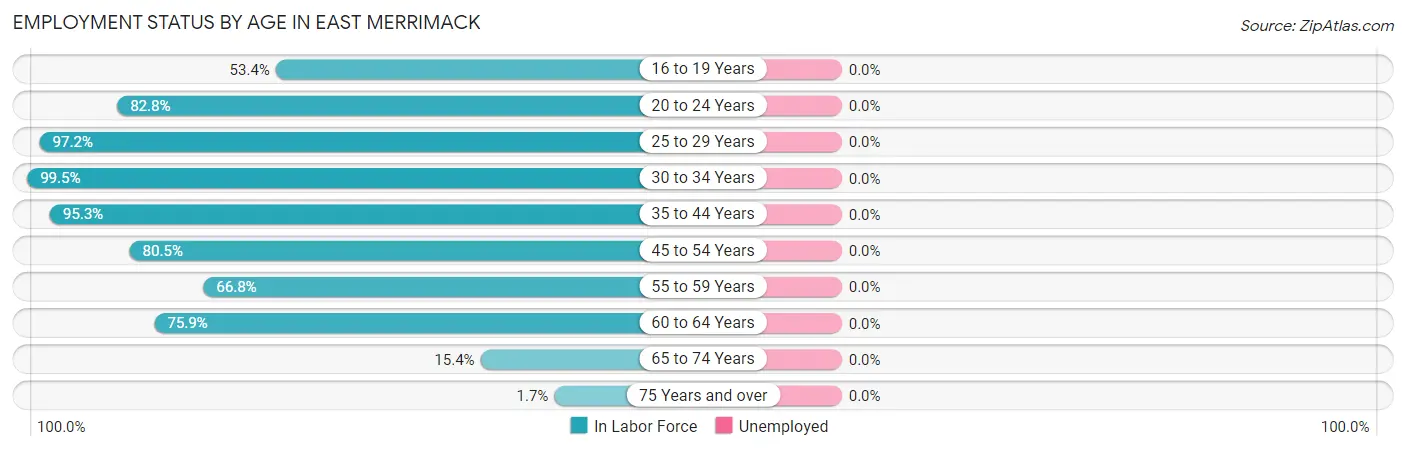
| Age Bracket | In Labor Force | Unemployed |
| 16 to 19 Years | 111 (53.4%) | 0 (0.0%) |
| 20 to 24 Years | 77 (82.8%) | 0 (0.0%) |
| 25 to 29 Years | 526 (97.2%) | 0 (0.0%) |
| 30 to 34 Years | 376 (99.5%) | 0 (0.0%) |
| 35 to 44 Years | 485 (95.3%) | 0 (0.0%) |
| 45 to 54 Years | 425 (80.5%) | 0 (0.0%) |
| 55 to 59 Years | 284 (66.8%) | 0 (0.0%) |
| 60 to 64 Years | 239 (75.9%) | 0 (0.0%) |
| 65 to 74 Years | 92 (15.4%) | 0 (0.0%) |
| 75 Years and over | 7 (1.7%) | 0 (0.0%) |
| Total | 2,622 (65.5%) | 0 (0.0%) |
Employment Status by Educational Attainment in East Merrimack
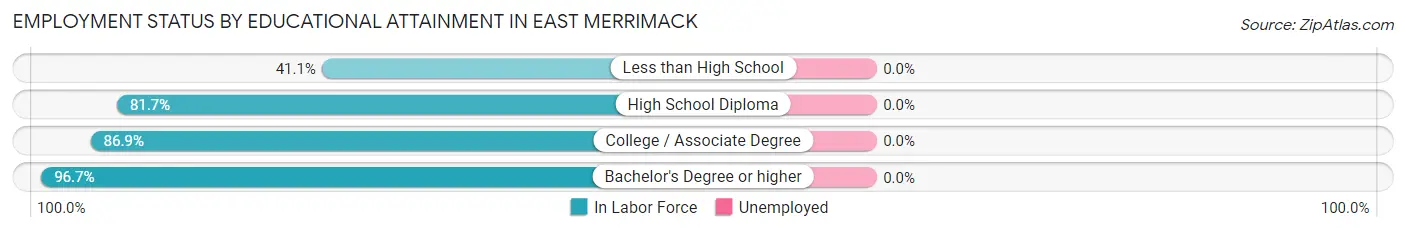
| Educational Attainment | In Labor Force | Unemployed |
| Less than High School | 83 (41.1%) | 0 (0.0%) |
| High School Diploma | 420 (81.7%) | 0 (0.0%) |
| College / Associate Degree | 730 (86.9%) | 0 (0.0%) |
| Bachelor's Degree or higher | 1,102 (96.7%) | 0 (0.0%) |
| Total | 2,335 (86.6%) | 0 (0.0%) |
Employment Occupations by Sex in East Merrimack
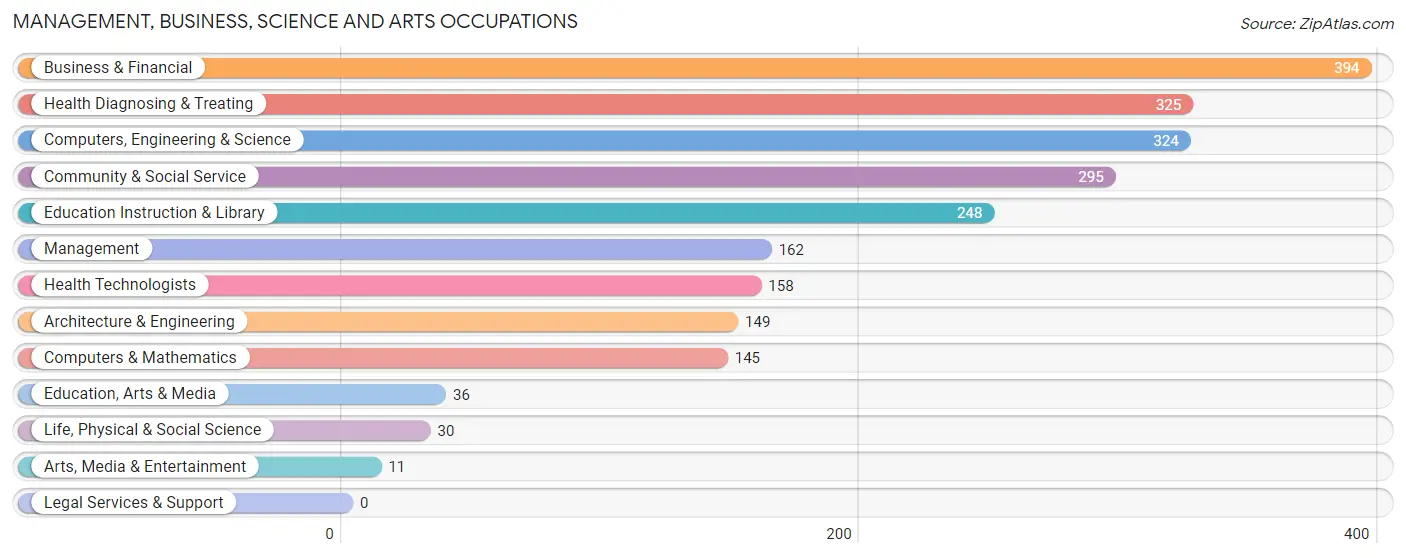
Management, Business, Science and Arts Occupations
The most common Management, Business, Science and Arts occupations in East Merrimack are Business & Financial (394 | 15.0%), Health Diagnosing & Treating (325 | 12.4%), Computers, Engineering & Science (324 | 12.4%), Community & Social Service (295 | 11.3%), and Education Instruction & Library (248 | 9.5%).
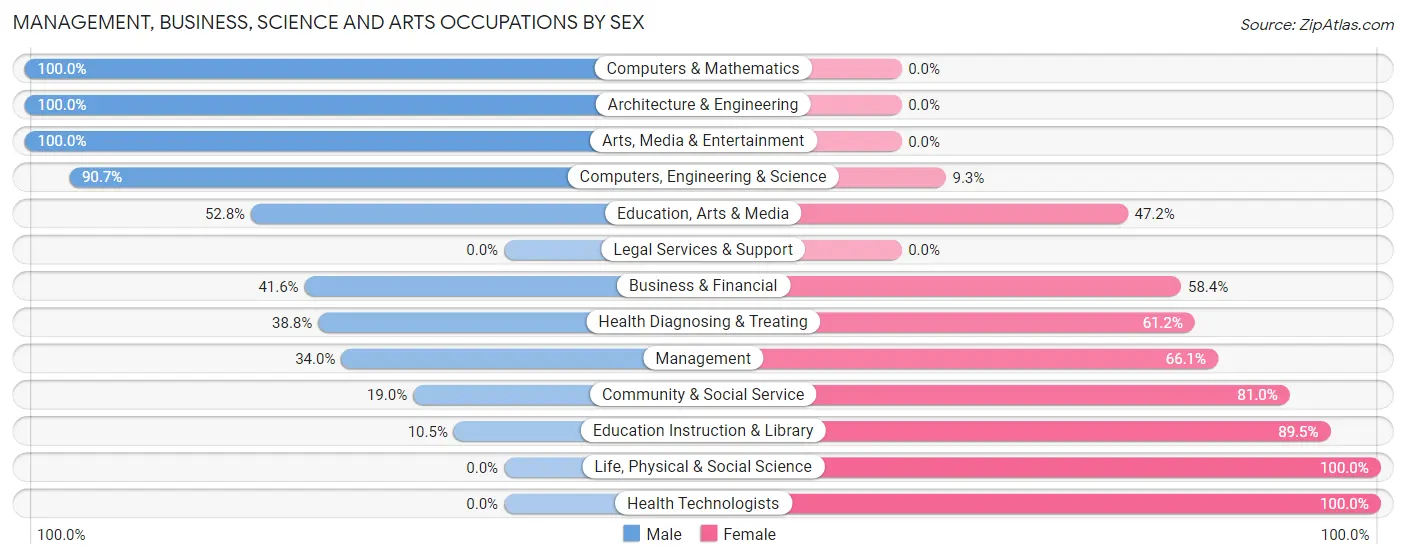
Management, Business, Science and Arts Occupations by Sex
Within the Management, Business, Science and Arts occupations in East Merrimack, the most male-oriented occupations are Computers & Mathematics (100.0%), Architecture & Engineering (100.0%), and Arts, Media & Entertainment (100.0%), while the most female-oriented occupations are Life, Physical & Social Science (100.0%), Health Technologists (100.0%), and Education Instruction & Library (89.5%).
| Occupation | Male | Female |
| Management | 55 (34.0%) | 107 (66.0%) |
| Business & Financial | 164 (41.6%) | 230 (58.4%) |
| Computers, Engineering & Science | 294 (90.7%) | 30 (9.3%) |
| Computers & Mathematics | 145 (100.0%) | 0 (0.0%) |
| Architecture & Engineering | 149 (100.0%) | 0 (0.0%) |
| Life, Physical & Social Science | 0 (0.0%) | 30 (100.0%) |
| Community & Social Service | 56 (19.0%) | 239 (81.0%) |
| Education, Arts & Media | 19 (52.8%) | 17 (47.2%) |
| Legal Services & Support | 0 (0.0%) | 0 (0.0%) |
| Education Instruction & Library | 26 (10.5%) | 222 (89.5%) |
| Arts, Media & Entertainment | 11 (100.0%) | 0 (0.0%) |
| Health Diagnosing & Treating | 126 (38.8%) | 199 (61.2%) |
| Health Technologists | 0 (0.0%) | 158 (100.0%) |
| Total (Category) | 695 (46.3%) | 805 (53.7%) |
| Total (Overall) | 1,341 (51.2%) | 1,280 (48.8%) |
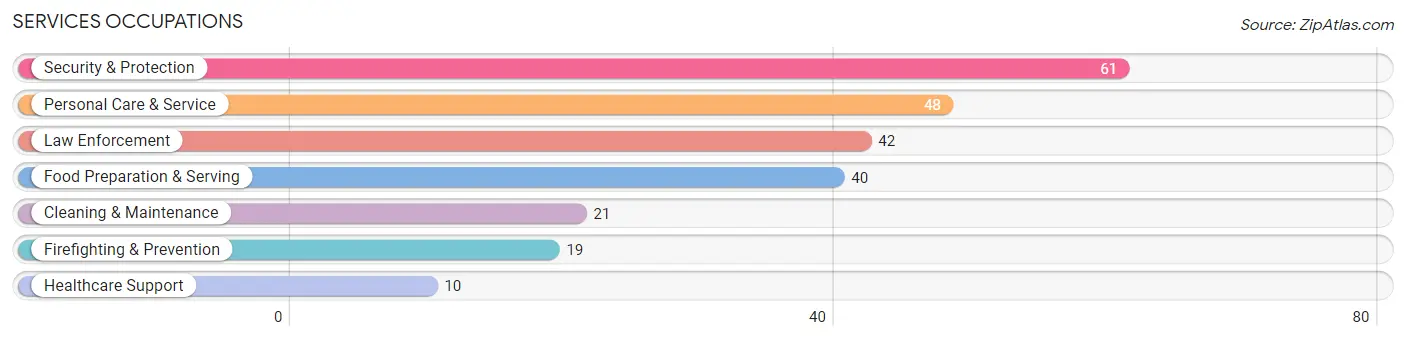
Services Occupations
The most common Services occupations in East Merrimack are Security & Protection (61 | 2.3%), Personal Care & Service (48 | 1.8%), Law Enforcement (42 | 1.6%), Food Preparation & Serving (40 | 1.5%), and Cleaning & Maintenance (21 | 0.8%).
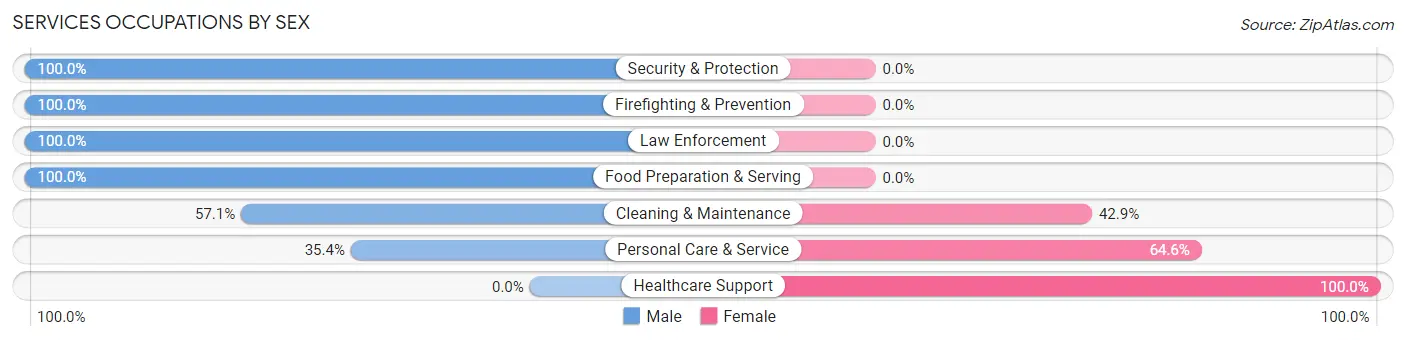
Services Occupations by Sex
Within the Services occupations in East Merrimack, the most male-oriented occupations are Security & Protection (100.0%), Firefighting & Prevention (100.0%), and Law Enforcement (100.0%), while the most female-oriented occupations are Healthcare Support (100.0%), Personal Care & Service (64.6%), and Cleaning & Maintenance (42.9%).
| Occupation | Male | Female |
| Healthcare Support | 0 (0.0%) | 10 (100.0%) |
| Security & Protection | 61 (100.0%) | 0 (0.0%) |
| Firefighting & Prevention | 19 (100.0%) | 0 (0.0%) |
| Law Enforcement | 42 (100.0%) | 0 (0.0%) |
| Food Preparation & Serving | 40 (100.0%) | 0 (0.0%) |
| Cleaning & Maintenance | 12 (57.1%) | 9 (42.9%) |
| Personal Care & Service | 17 (35.4%) | 31 (64.6%) |
| Total (Category) | 130 (72.2%) | 50 (27.8%) |
| Total (Overall) | 1,341 (51.2%) | 1,280 (48.8%) |
Sales and Office Occupations
The most common Sales and Office occupations in East Merrimack are Sales & Related (327 | 12.5%), and Office & Administration (244 | 9.3%).
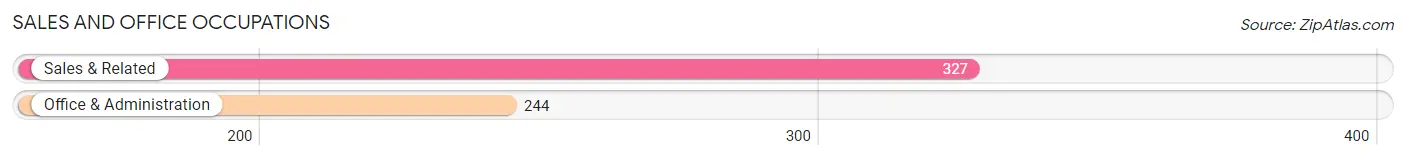
Sales and Office Occupations by Sex
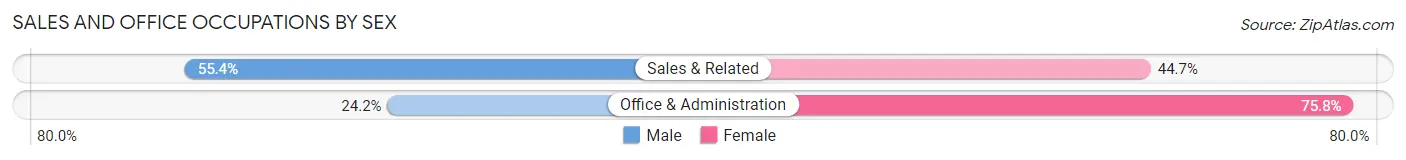
| Occupation | Male | Female |
| Sales & Related | 181 (55.3%) | 146 (44.7%) |
| Office & Administration | 59 (24.2%) | 185 (75.8%) |
| Total (Category) | 240 (42.0%) | 331 (58.0%) |
| Total (Overall) | 1,341 (51.2%) | 1,280 (48.8%) |
Natural Resources, Construction and Maintenance Occupations
The most common Natural Resources, Construction and Maintenance occupations in East Merrimack are Construction & Extraction (73 | 2.8%), and Installation, Maintenance & Repair (38 | 1.5%).
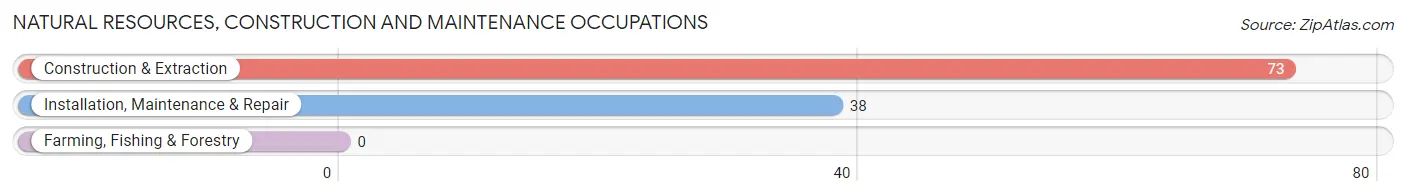
Natural Resources, Construction and Maintenance Occupations by Sex
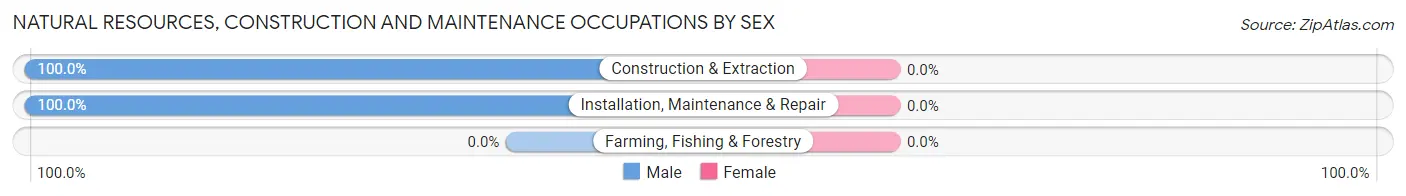
| Occupation | Male | Female |
| Farming, Fishing & Forestry | 0 (0.0%) | 0 (0.0%) |
| Construction & Extraction | 73 (100.0%) | 0 (0.0%) |
| Installation, Maintenance & Repair | 38 (100.0%) | 0 (0.0%) |
| Total (Category) | 111 (100.0%) | 0 (0.0%) |
| Total (Overall) | 1,341 (51.2%) | 1,280 (48.8%) |
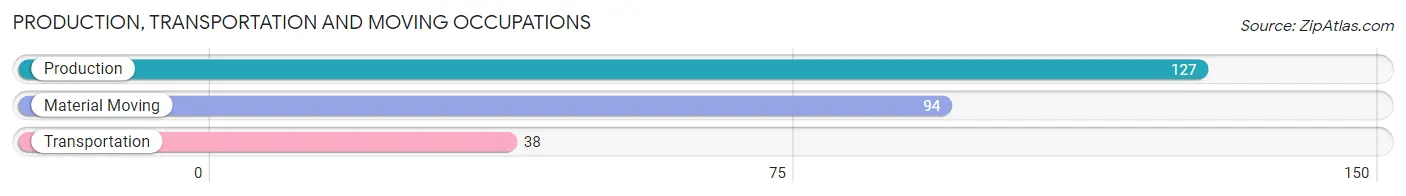
Production, Transportation and Moving Occupations
The most common Production, Transportation and Moving occupations in East Merrimack are Production (127 | 4.9%), Material Moving (94 | 3.6%), and Transportation (38 | 1.5%).
Production, Transportation and Moving Occupations by Sex
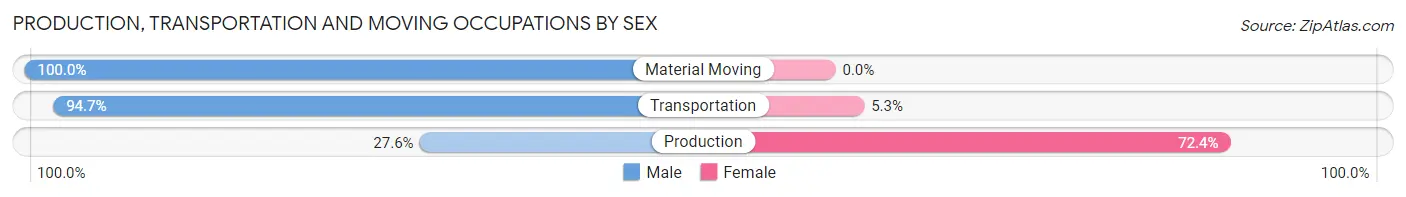
| Occupation | Male | Female |
| Production | 35 (27.6%) | 92 (72.4%) |
| Transportation | 36 (94.7%) | 2 (5.3%) |
| Material Moving | 94 (100.0%) | 0 (0.0%) |
| Total (Category) | 165 (63.7%) | 94 (36.3%) |
| Total (Overall) | 1,341 (51.2%) | 1,280 (48.8%) |
Employment Industries by Sex in East Merrimack
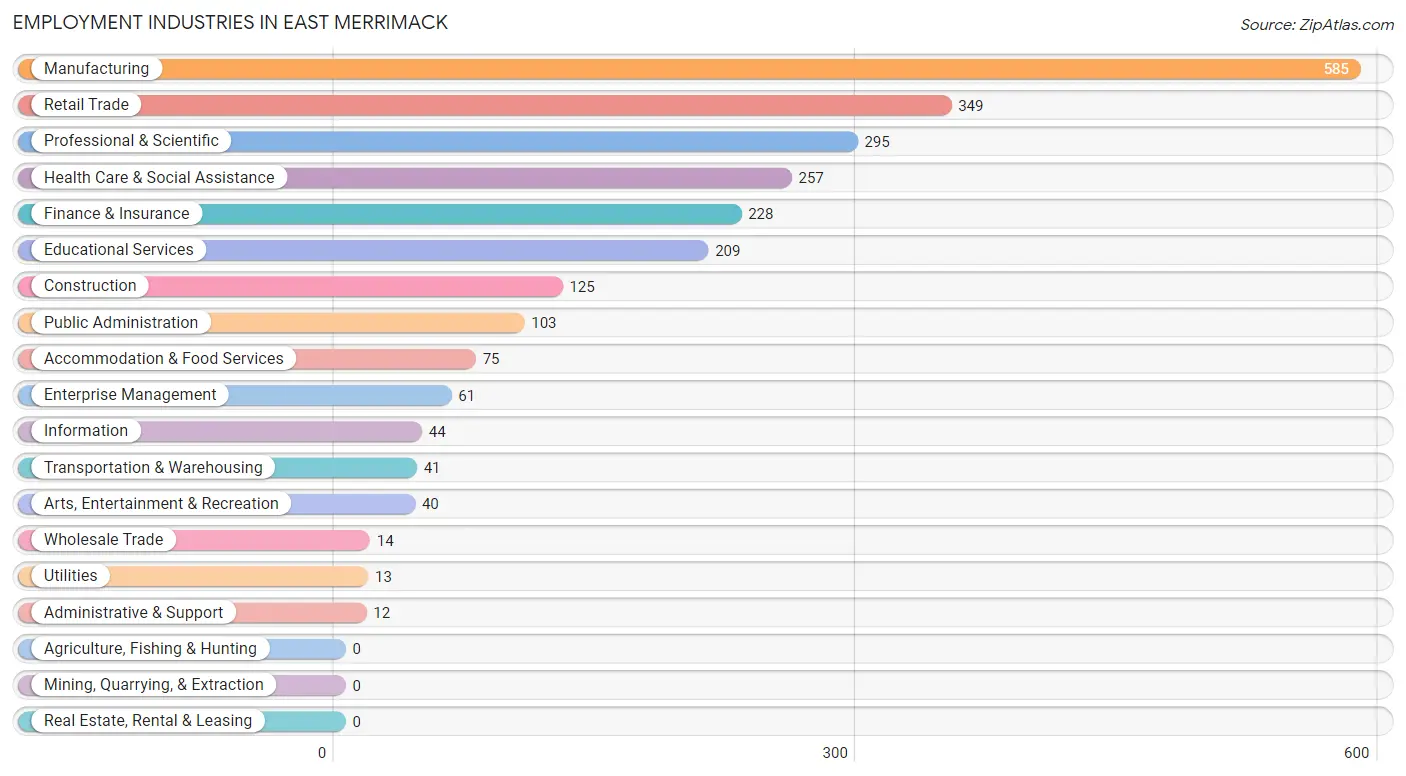
Employment Industries in East Merrimack
The major employment industries in East Merrimack include Manufacturing (585 | 22.3%), Retail Trade (349 | 13.3%), Professional & Scientific (295 | 11.3%), Health Care & Social Assistance (257 | 9.8%), and Finance & Insurance (228 | 8.7%).
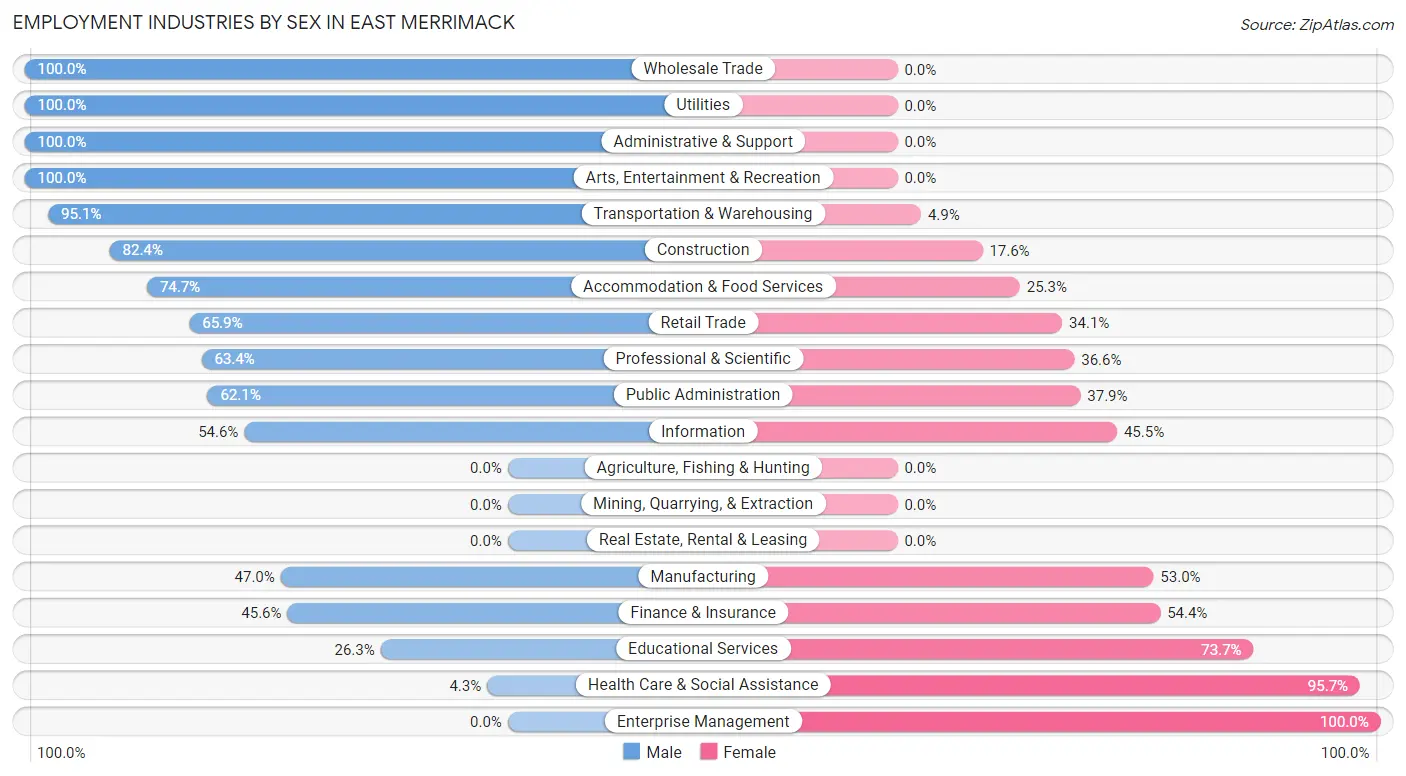
Employment Industries by Sex in East Merrimack
The East Merrimack industries that see more men than women are Wholesale Trade (100.0%), Utilities (100.0%), and Administrative & Support (100.0%), whereas the industries that tend to have a higher number of women are Enterprise Management (100.0%), Health Care & Social Assistance (95.7%), and Educational Services (73.7%).
| Industry | Male | Female |
| Agriculture, Fishing & Hunting | 0 (0.0%) | 0 (0.0%) |
| Mining, Quarrying, & Extraction | 0 (0.0%) | 0 (0.0%) |
| Construction | 103 (82.4%) | 22 (17.6%) |
| Manufacturing | 275 (47.0%) | 310 (53.0%) |
| Wholesale Trade | 14 (100.0%) | 0 (0.0%) |
| Retail Trade | 230 (65.9%) | 119 (34.1%) |
| Transportation & Warehousing | 39 (95.1%) | 2 (4.9%) |
| Utilities | 13 (100.0%) | 0 (0.0%) |
| Information | 24 (54.5%) | 20 (45.5%) |
| Finance & Insurance | 104 (45.6%) | 124 (54.4%) |
| Real Estate, Rental & Leasing | 0 (0.0%) | 0 (0.0%) |
| Professional & Scientific | 187 (63.4%) | 108 (36.6%) |
| Enterprise Management | 0 (0.0%) | 61 (100.0%) |
| Administrative & Support | 12 (100.0%) | 0 (0.0%) |
| Educational Services | 55 (26.3%) | 154 (73.7%) |
| Health Care & Social Assistance | 11 (4.3%) | 246 (95.7%) |
| Arts, Entertainment & Recreation | 40 (100.0%) | 0 (0.0%) |
| Accommodation & Food Services | 56 (74.7%) | 19 (25.3%) |
| Public Administration | 64 (62.1%) | 39 (37.9%) |
| Total | 1,341 (51.2%) | 1,280 (48.8%) |
Education in East Merrimack
School Enrollment in East Merrimack
The most common levels of schooling among the 776 students in East Merrimack are middle school (243 | 31.3%), high school (216 | 27.8%), and college / undergraduate (126 | 16.2%).
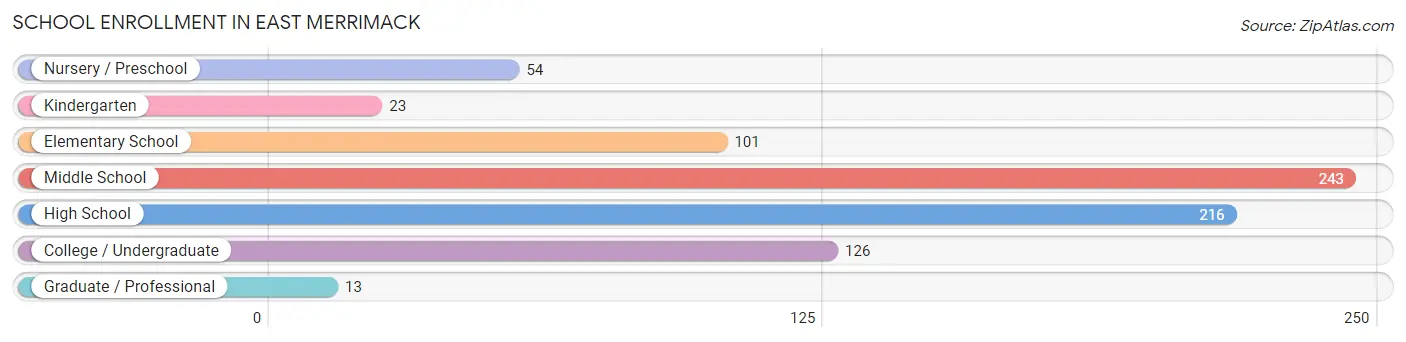
| School Level | # Students | % Students |
| Nursery / Preschool | 54 | 7.0% |
| Kindergarten | 23 | 3.0% |
| Elementary School | 101 | 13.0% |
| Middle School | 243 | 31.3% |
| High School | 216 | 27.8% |
| College / Undergraduate | 126 | 16.2% |
| Graduate / Professional | 13 | 1.7% |
| Total | 776 | 100.0% |
School Enrollment by Age by Funding Source in East Merrimack
Out of a total of 776 students who are enrolled in schools in East Merrimack, 94 (12.1%) attend a private institution, while the remaining 682 (87.9%) are enrolled in public schools. The age group of 20 to 24 year olds has the highest likelihood of being enrolled in private schools, with 36 (78.3% in the age bracket) enrolled. Conversely, the age group of 5 to 9 year old has the lowest likelihood of being enrolled in a private school, with 113 (100.0% in the age bracket) attending a public institution.
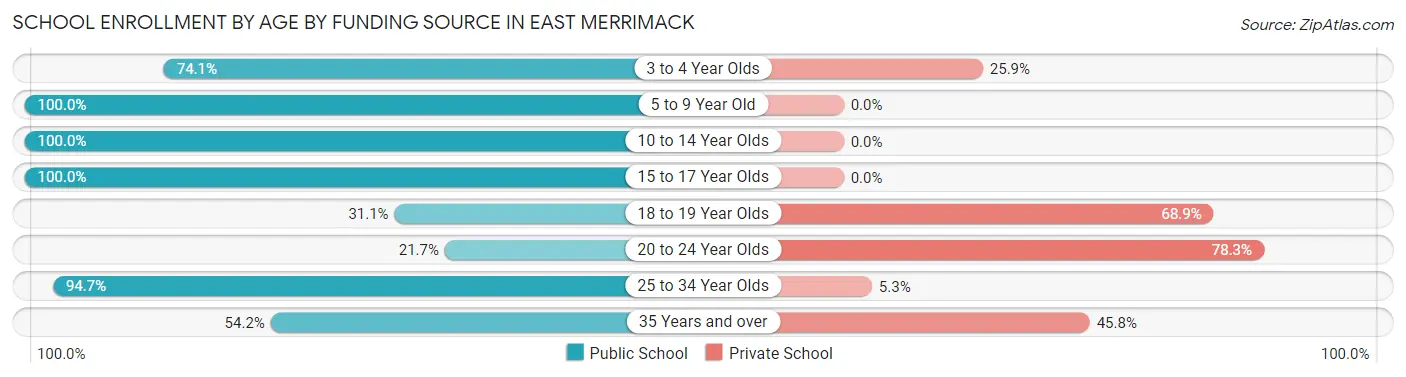
| Age Bracket | Public School | Private School |
| 3 to 4 Year Olds | 40 (74.1%) | 14 (25.9%) |
| 5 to 9 Year Old | 113 (100.0%) | 0 (0.0%) |
| 10 to 14 Year Olds | 254 (100.0%) | 0 (0.0%) |
| 15 to 17 Year Olds | 202 (100.0%) | 0 (0.0%) |
| 18 to 19 Year Olds | 14 (31.1%) | 31 (68.9%) |
| 20 to 24 Year Olds | 10 (21.7%) | 36 (78.3%) |
| 25 to 34 Year Olds | 36 (94.7%) | 2 (5.3%) |
| 35 Years and over | 13 (54.2%) | 11 (45.8%) |
| Total | 682 (87.9%) | 94 (12.1%) |
Educational Attainment by Field of Study in East Merrimack
Business (356 | 23.4%), engineering (222 | 14.6%), education (168 | 11.0%), social sciences (156 | 10.2%), and liberal arts & history (147 | 9.7%) are the most common fields of study among 1,522 individuals in East Merrimack who have obtained a bachelor's degree or higher.
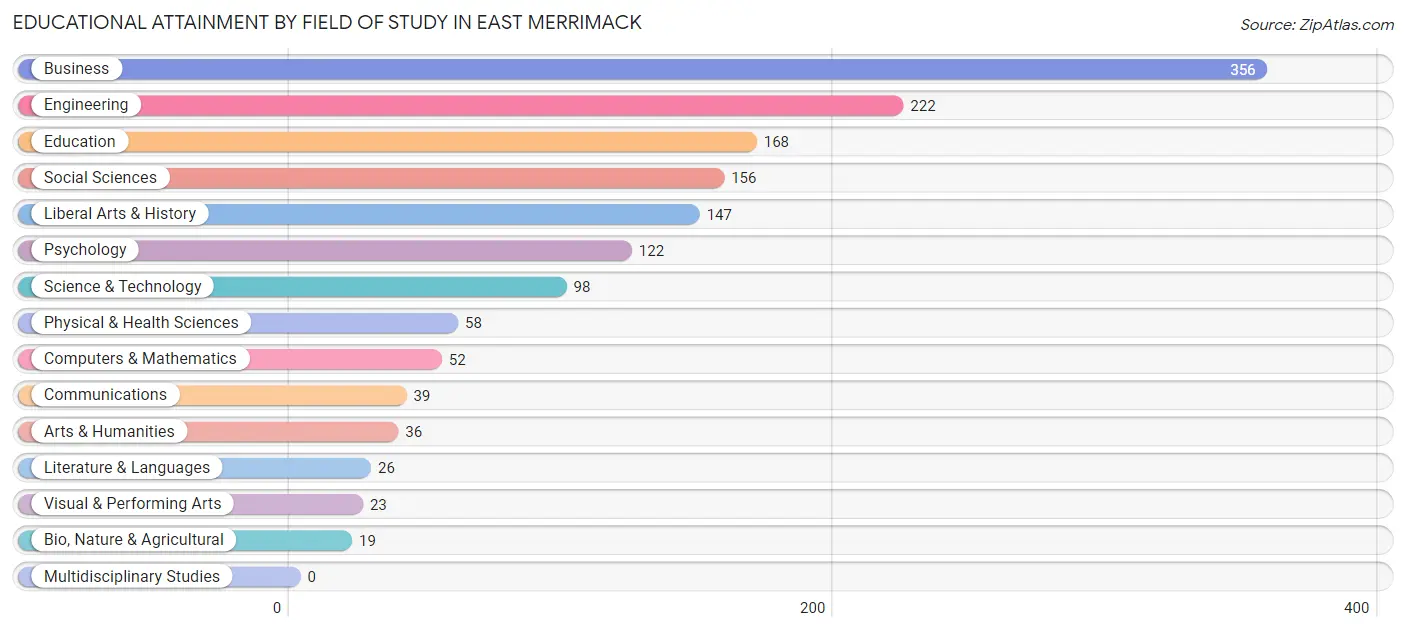
| Field of Study | # Graduates | % Graduates |
| Computers & Mathematics | 52 | 3.4% |
| Bio, Nature & Agricultural | 19 | 1.3% |
| Physical & Health Sciences | 58 | 3.8% |
| Psychology | 122 | 8.0% |
| Social Sciences | 156 | 10.2% |
| Engineering | 222 | 14.6% |
| Multidisciplinary Studies | 0 | 0.0% |
| Science & Technology | 98 | 6.4% |
| Business | 356 | 23.4% |
| Education | 168 | 11.0% |
| Literature & Languages | 26 | 1.7% |
| Liberal Arts & History | 147 | 9.7% |
| Visual & Performing Arts | 23 | 1.5% |
| Communications | 39 | 2.6% |
| Arts & Humanities | 36 | 2.4% |
| Total | 1,522 | 100.0% |
Transportation & Commute in East Merrimack
Vehicle Availability by Sex in East Merrimack
The most prevalent vehicle ownership categories in East Merrimack are males with 2 vehicles (820, accounting for 61.8%) and females with 2 vehicles (797, making up 64.1%).
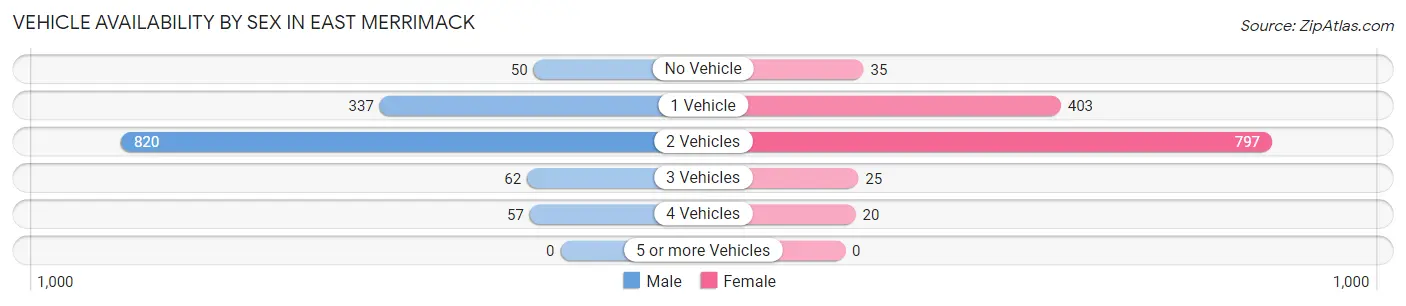
| Vehicles Available | Male | Female |
| No Vehicle | 50 (3.8%) | 35 (2.7%) |
| 1 Vehicle | 337 (25.4%) | 403 (31.5%) |
| 2 Vehicles | 820 (61.8%) | 797 (62.3%) |
| 3 Vehicles | 62 (4.7%) | 25 (1.9%) |
| 4 Vehicles | 57 (4.3%) | 20 (1.6%) |
| 5 or more Vehicles | 0 (0.0%) | 0 (0.0%) |
| Total | 1,326 (100.0%) | 1,280 (100.0%) |
Commute Time in East Merrimack
The most frequently occuring commute durations in East Merrimack are 15 to 19 minutes (445 commuters, 20.4%), 10 to 14 minutes (296 commuters, 13.5%), and 20 to 24 minutes (294 commuters, 13.5%).
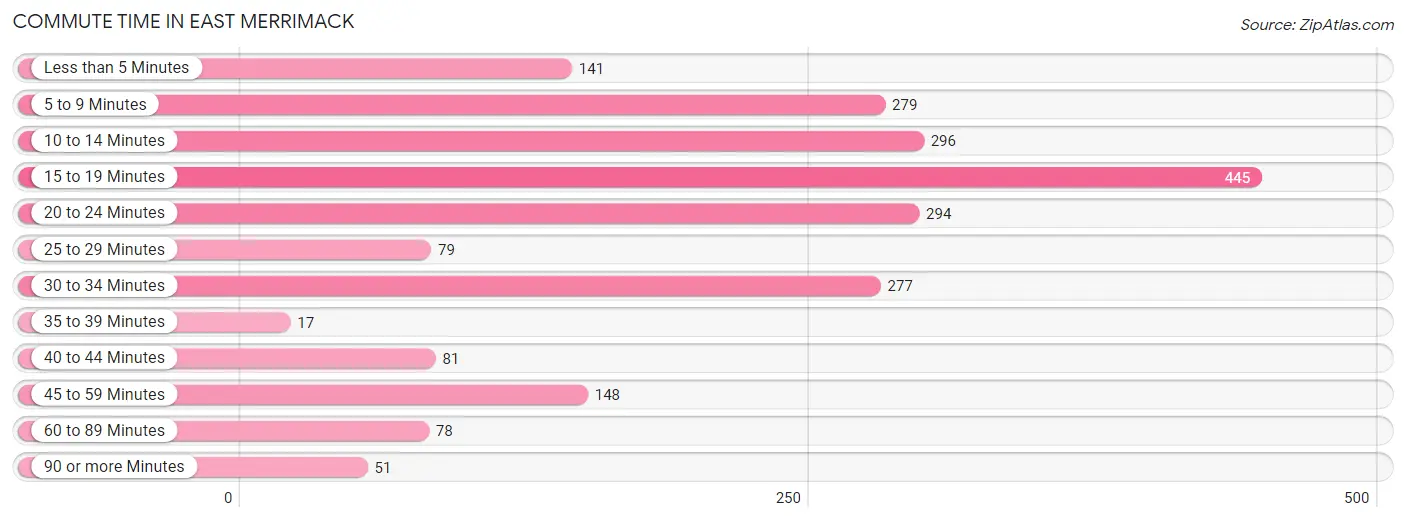
| Commute Time | # Commuters | % Commuters |
| Less than 5 Minutes | 141 | 6.5% |
| 5 to 9 Minutes | 279 | 12.8% |
| 10 to 14 Minutes | 296 | 13.5% |
| 15 to 19 Minutes | 445 | 20.4% |
| 20 to 24 Minutes | 294 | 13.5% |
| 25 to 29 Minutes | 79 | 3.6% |
| 30 to 34 Minutes | 277 | 12.7% |
| 35 to 39 Minutes | 17 | 0.8% |
| 40 to 44 Minutes | 81 | 3.7% |
| 45 to 59 Minutes | 148 | 6.8% |
| 60 to 89 Minutes | 78 | 3.6% |
| 90 or more Minutes | 51 | 2.3% |
Commute Time by Sex in East Merrimack
The most common commute times in East Merrimack are 30 to 34 minutes (207 commuters, 17.7%) for males and 15 to 19 minutes (246 commuters, 24.1%) for females.
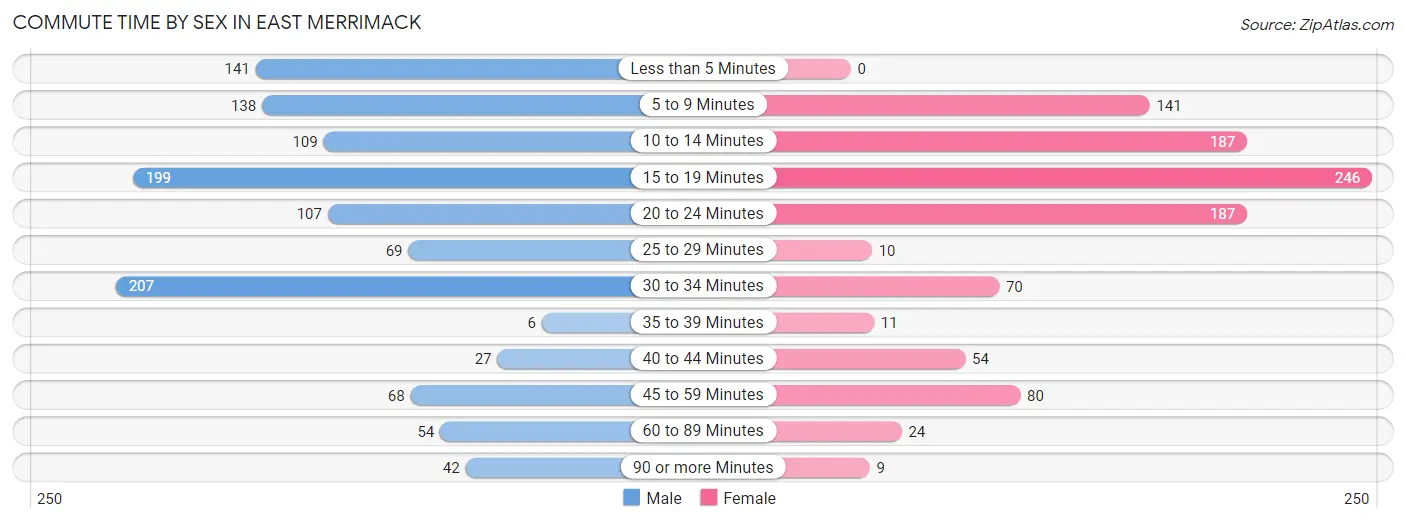
| Commute Time | Male | Female |
| Less than 5 Minutes | 141 (12.1%) | 0 (0.0%) |
| 5 to 9 Minutes | 138 (11.8%) | 141 (13.8%) |
| 10 to 14 Minutes | 109 (9.3%) | 187 (18.3%) |
| 15 to 19 Minutes | 199 (17.1%) | 246 (24.1%) |
| 20 to 24 Minutes | 107 (9.2%) | 187 (18.3%) |
| 25 to 29 Minutes | 69 (5.9%) | 10 (1.0%) |
| 30 to 34 Minutes | 207 (17.7%) | 70 (6.9%) |
| 35 to 39 Minutes | 6 (0.5%) | 11 (1.1%) |
| 40 to 44 Minutes | 27 (2.3%) | 54 (5.3%) |
| 45 to 59 Minutes | 68 (5.8%) | 80 (7.9%) |
| 60 to 89 Minutes | 54 (4.6%) | 24 (2.4%) |
| 90 or more Minutes | 42 (3.6%) | 9 (0.9%) |
Time of Departure to Work by Sex in East Merrimack
The most frequent times of departure to work in East Merrimack are 7:30 AM to 7:59 AM (217, 18.6%) for males and 7:00 AM to 7:29 AM (227, 22.3%) for females.
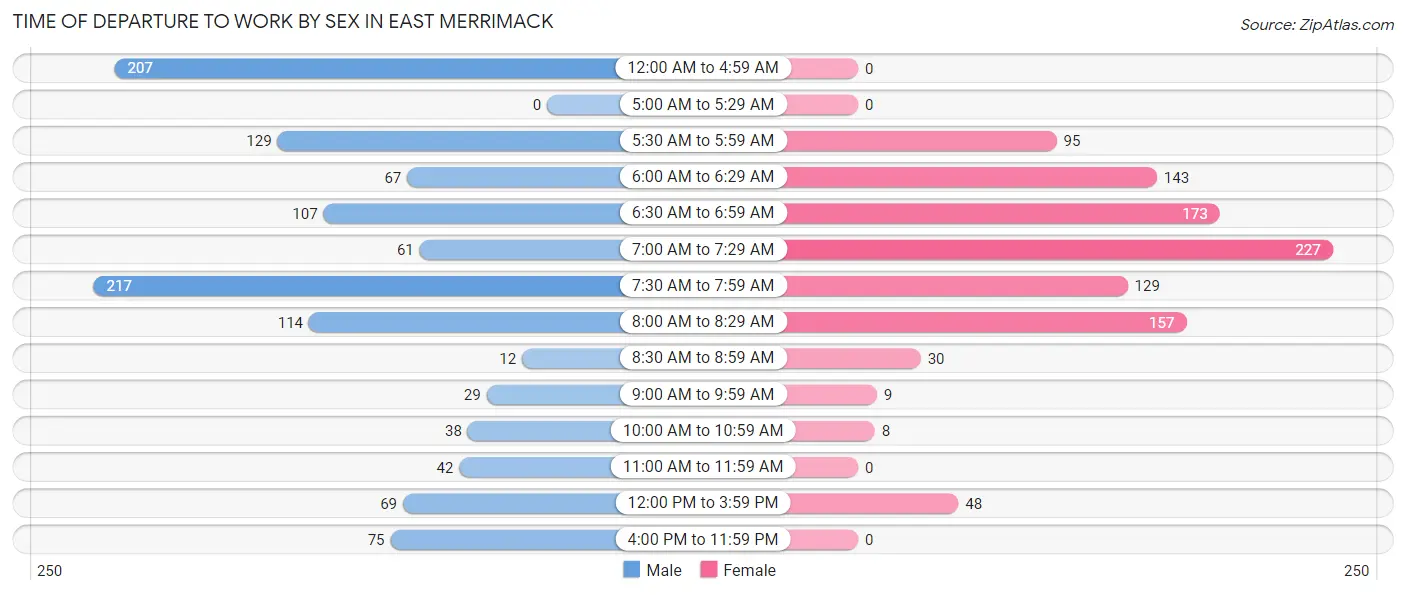
| Time of Departure | Male | Female |
| 12:00 AM to 4:59 AM | 207 (17.7%) | 0 (0.0%) |
| 5:00 AM to 5:29 AM | 0 (0.0%) | 0 (0.0%) |
| 5:30 AM to 5:59 AM | 129 (11.1%) | 95 (9.3%) |
| 6:00 AM to 6:29 AM | 67 (5.7%) | 143 (14.0%) |
| 6:30 AM to 6:59 AM | 107 (9.2%) | 173 (17.0%) |
| 7:00 AM to 7:29 AM | 61 (5.2%) | 227 (22.3%) |
| 7:30 AM to 7:59 AM | 217 (18.6%) | 129 (12.7%) |
| 8:00 AM to 8:29 AM | 114 (9.8%) | 157 (15.4%) |
| 8:30 AM to 8:59 AM | 12 (1.0%) | 30 (2.9%) |
| 9:00 AM to 9:59 AM | 29 (2.5%) | 9 (0.9%) |
| 10:00 AM to 10:59 AM | 38 (3.3%) | 8 (0.8%) |
| 11:00 AM to 11:59 AM | 42 (3.6%) | 0 (0.0%) |
| 12:00 PM to 3:59 PM | 69 (5.9%) | 48 (4.7%) |
| 4:00 PM to 11:59 PM | 75 (6.4%) | 0 (0.0%) |
| Total | 1,167 (100.0%) | 1,019 (100.0%) |
Housing Occupancy in East Merrimack
Occupancy by Ownership in East Merrimack
Of the total 2,447 dwellings in East Merrimack, owner-occupied units account for 1,694 (69.2%), while renter-occupied units make up 753 (30.8%).
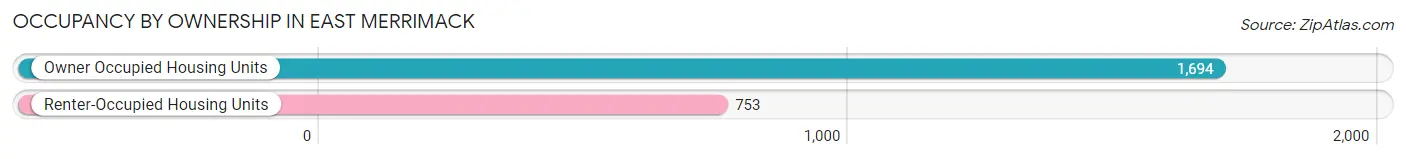
| Occupancy | # Housing Units | % Housing Units |
| Owner Occupied Housing Units | 1,694 | 69.2% |
| Renter-Occupied Housing Units | 753 | 30.8% |
| Total Occupied Housing Units | 2,447 | 100.0% |
Occupancy by Household Size in East Merrimack
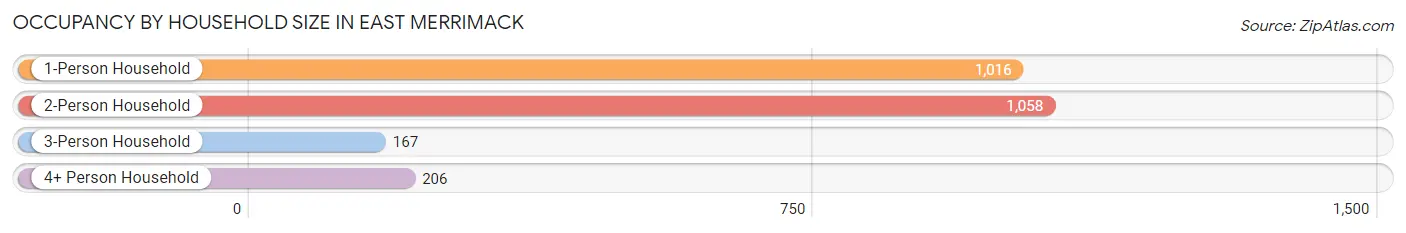
| Household Size | # Housing Units | % Housing Units |
| 1-Person Household | 1,016 | 41.5% |
| 2-Person Household | 1,058 | 43.2% |
| 3-Person Household | 167 | 6.8% |
| 4+ Person Household | 206 | 8.4% |
| Total Housing Units | 2,447 | 100.0% |
Occupancy by Ownership by Household Size in East Merrimack
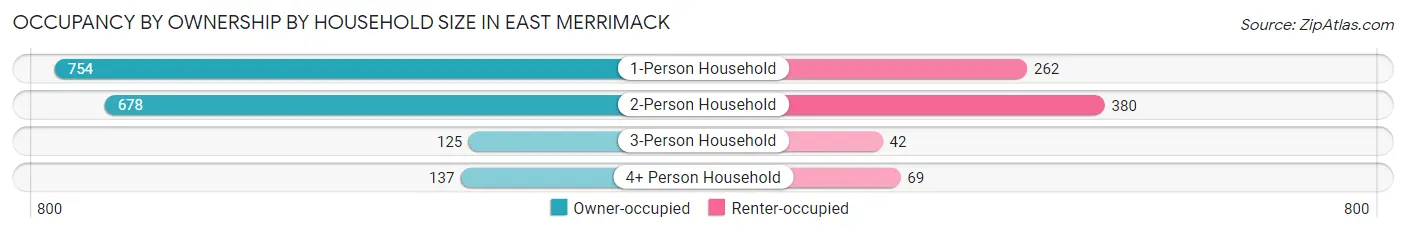
| Household Size | Owner-occupied | Renter-occupied |
| 1-Person Household | 754 (74.2%) | 262 (25.8%) |
| 2-Person Household | 678 (64.1%) | 380 (35.9%) |
| 3-Person Household | 125 (74.9%) | 42 (25.2%) |
| 4+ Person Household | 137 (66.5%) | 69 (33.5%) |
| Total Housing Units | 1,694 (69.2%) | 753 (30.8%) |
Occupancy by Educational Attainment in East Merrimack
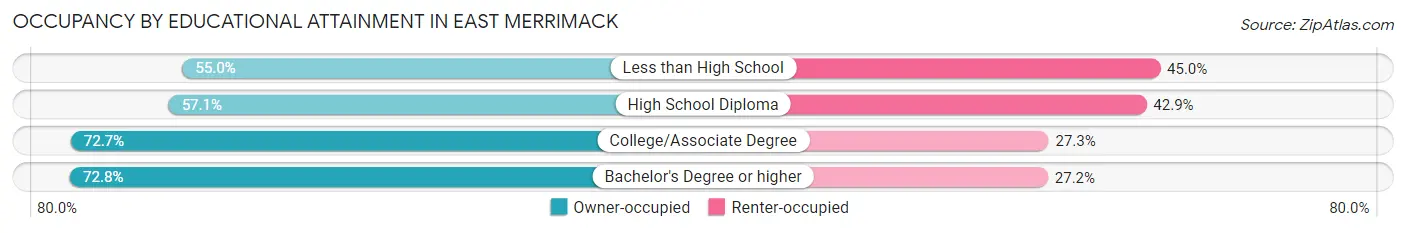
| Household Size | Owner-occupied | Renter-occupied |
| Less than High School | 72 (55.0%) | 59 (45.0%) |
| High School Diploma | 228 (57.1%) | 171 (42.9%) |
| College/Associate Degree | 675 (72.7%) | 254 (27.3%) |
| Bachelor's Degree or higher | 719 (72.8%) | 269 (27.2%) |
Occupancy by Age of Householder in East Merrimack
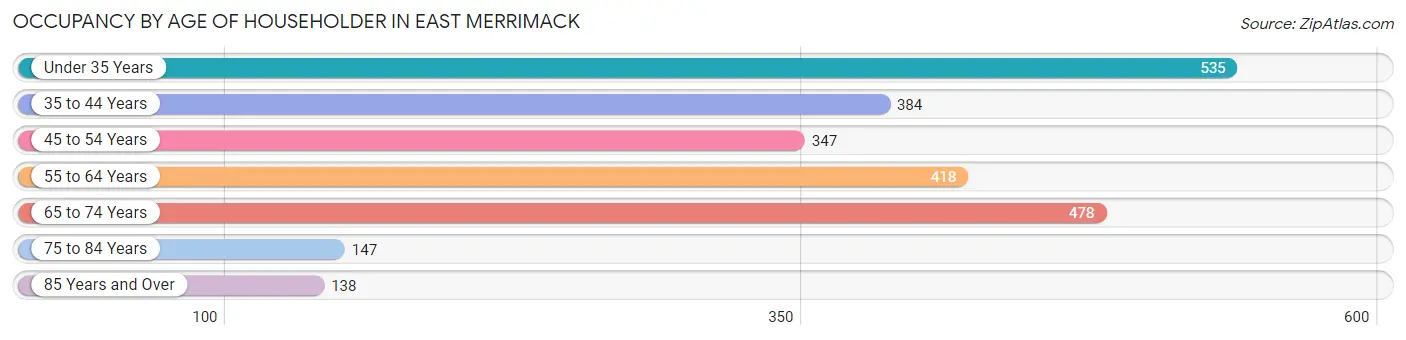
| Age Bracket | # Households | % Households |
| Under 35 Years | 535 | 21.9% |
| 35 to 44 Years | 384 | 15.7% |
| 45 to 54 Years | 347 | 14.2% |
| 55 to 64 Years | 418 | 17.1% |
| 65 to 74 Years | 478 | 19.5% |
| 75 to 84 Years | 147 | 6.0% |
| 85 Years and Over | 138 | 5.6% |
| Total | 2,447 | 100.0% |
Housing Finances in East Merrimack
Median Income by Occupancy in East Merrimack
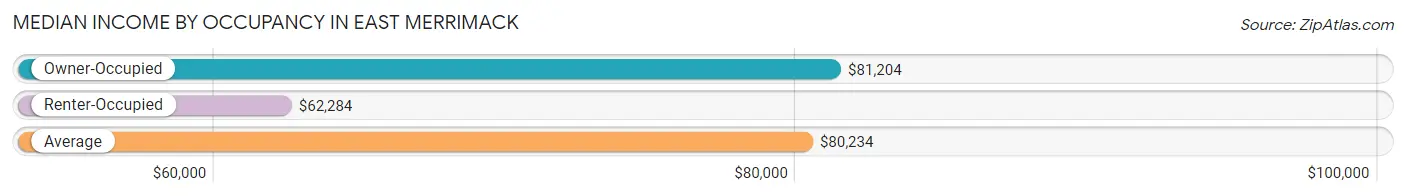
| Occupancy Type | # Households | Median Income |
| Owner-Occupied | 1,694 (69.2%) | $81,204 |
| Renter-Occupied | 753 (30.8%) | $62,284 |
| Average | 2,447 (100.0%) | $80,234 |
Occupancy by Householder Income Bracket in East Merrimack
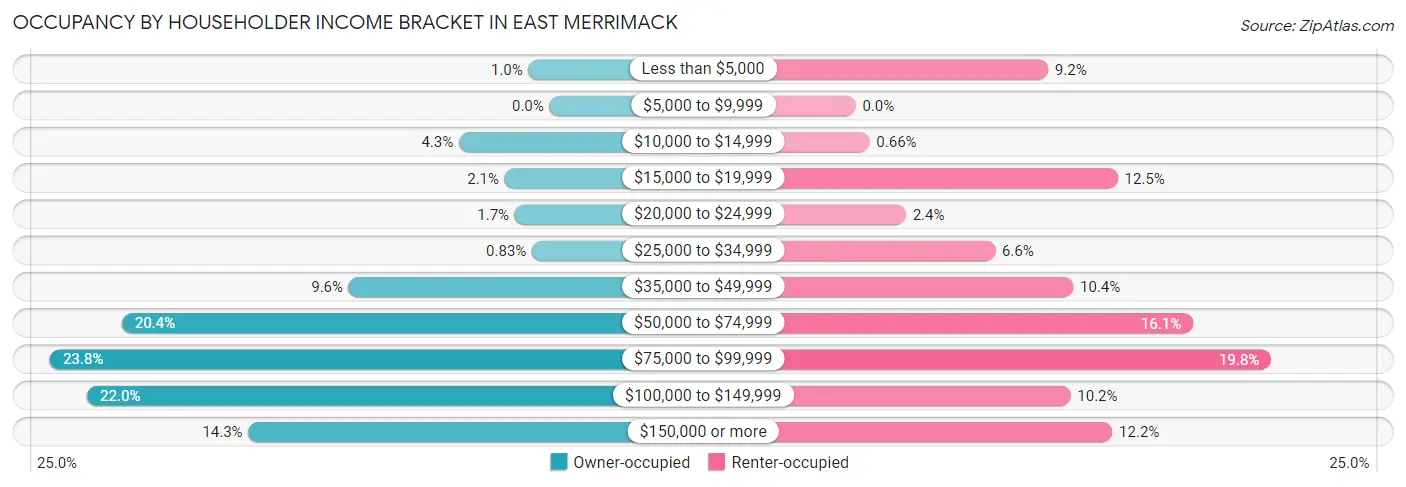
| Income Bracket | Owner-occupied | Renter-occupied |
| Less than $5,000 | 17 (1.0%) | 69 (9.2%) |
| $5,000 to $9,999 | 0 (0.0%) | 0 (0.0%) |
| $10,000 to $14,999 | 73 (4.3%) | 5 (0.7%) |
| $15,000 to $19,999 | 36 (2.1%) | 94 (12.5%) |
| $20,000 to $24,999 | 28 (1.7%) | 18 (2.4%) |
| $25,000 to $34,999 | 14 (0.8%) | 50 (6.6%) |
| $35,000 to $49,999 | 162 (9.6%) | 78 (10.4%) |
| $50,000 to $74,999 | 345 (20.4%) | 121 (16.1%) |
| $75,000 to $99,999 | 403 (23.8%) | 149 (19.8%) |
| $100,000 to $149,999 | 373 (22.0%) | 77 (10.2%) |
| $150,000 or more | 243 (14.3%) | 92 (12.2%) |
| Total | 1,694 (100.0%) | 753 (100.0%) |
Monthly Housing Cost Tiers in East Merrimack
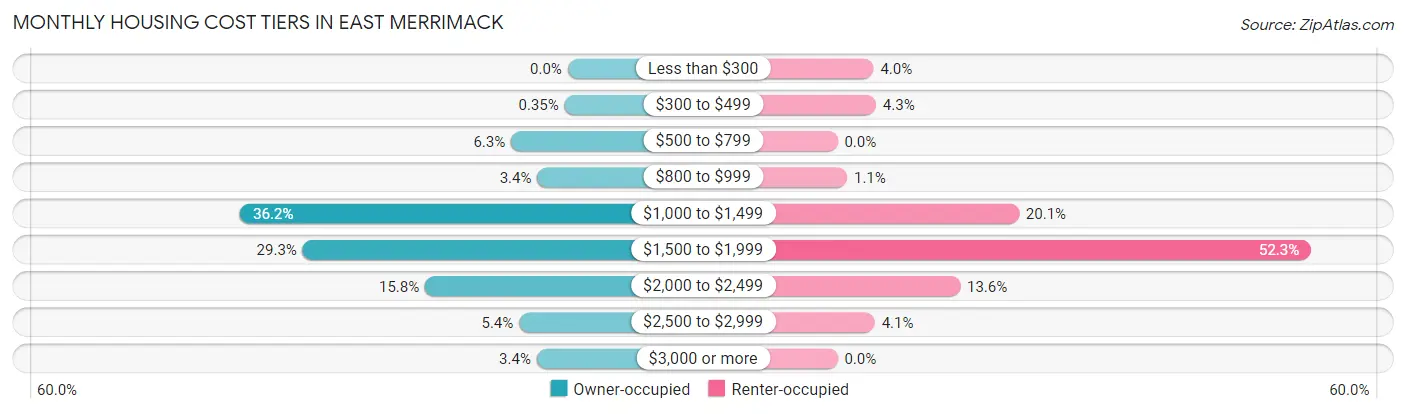
| Monthly Cost | Owner-occupied | Renter-occupied |
| Less than $300 | 0 (0.0%) | 30 (4.0%) |
| $300 to $499 | 6 (0.4%) | 32 (4.3%) |
| $500 to $799 | 106 (6.3%) | 0 (0.0%) |
| $800 to $999 | 57 (3.4%) | 8 (1.1%) |
| $1,000 to $1,499 | 613 (36.2%) | 151 (20.1%) |
| $1,500 to $1,999 | 496 (29.3%) | 394 (52.3%) |
| $2,000 to $2,499 | 267 (15.8%) | 102 (13.6%) |
| $2,500 to $2,999 | 91 (5.4%) | 31 (4.1%) |
| $3,000 or more | 58 (3.4%) | 0 (0.0%) |
| Total | 1,694 (100.0%) | 753 (100.0%) |
Physical Housing Characteristics in East Merrimack
Housing Structures in East Merrimack
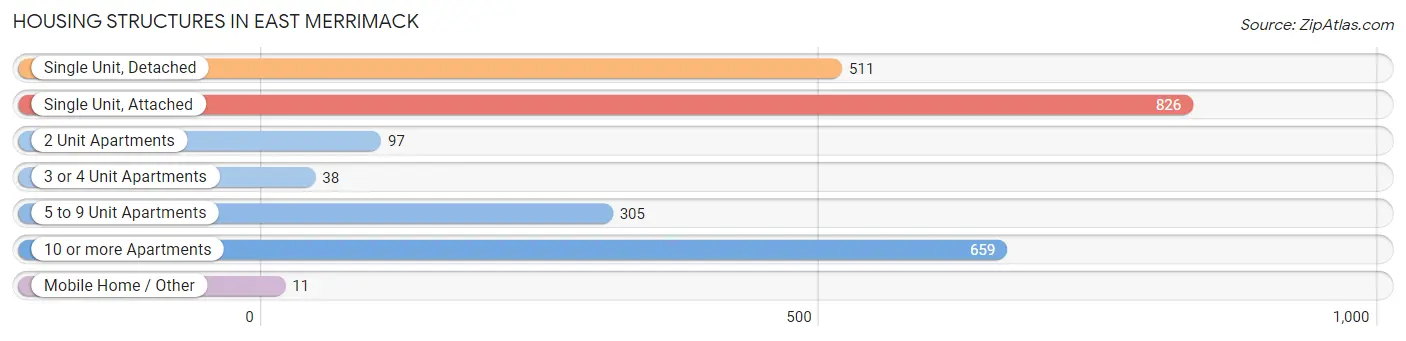
| Structure Type | # Housing Units | % Housing Units |
| Single Unit, Detached | 511 | 20.9% |
| Single Unit, Attached | 826 | 33.8% |
| 2 Unit Apartments | 97 | 4.0% |
| 3 or 4 Unit Apartments | 38 | 1.5% |
| 5 to 9 Unit Apartments | 305 | 12.5% |
| 10 or more Apartments | 659 | 26.9% |
| Mobile Home / Other | 11 | 0.4% |
| Total | 2,447 | 100.0% |
Housing Structures by Occupancy in East Merrimack
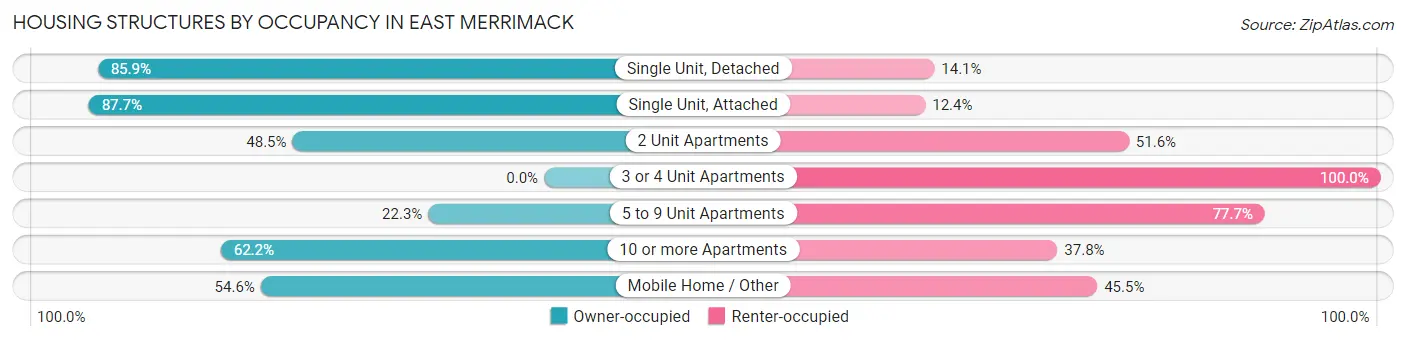
| Structure Type | Owner-occupied | Renter-occupied |
| Single Unit, Detached | 439 (85.9%) | 72 (14.1%) |
| Single Unit, Attached | 724 (87.6%) | 102 (12.3%) |
| 2 Unit Apartments | 47 (48.4%) | 50 (51.5%) |
| 3 or 4 Unit Apartments | 0 (0.0%) | 38 (100.0%) |
| 5 to 9 Unit Apartments | 68 (22.3%) | 237 (77.7%) |
| 10 or more Apartments | 410 (62.2%) | 249 (37.8%) |
| Mobile Home / Other | 6 (54.5%) | 5 (45.5%) |
| Total | 1,694 (69.2%) | 753 (30.8%) |
Housing Structures by Number of Rooms in East Merrimack
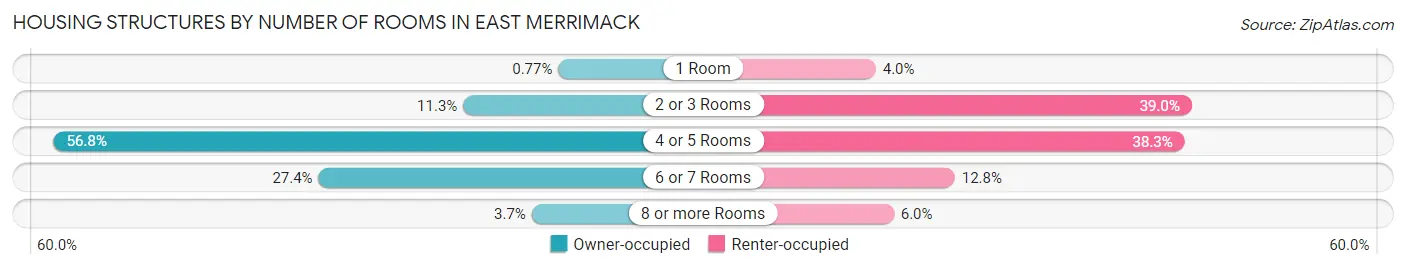
| Number of Rooms | Owner-occupied | Renter-occupied |
| 1 Room | 13 (0.8%) | 30 (4.0%) |
| 2 or 3 Rooms | 192 (11.3%) | 294 (39.0%) |
| 4 or 5 Rooms | 962 (56.8%) | 288 (38.3%) |
| 6 or 7 Rooms | 464 (27.4%) | 96 (12.8%) |
| 8 or more Rooms | 63 (3.7%) | 45 (6.0%) |
| Total | 1,694 (100.0%) | 753 (100.0%) |
Housing Structure by Heating Type in East Merrimack
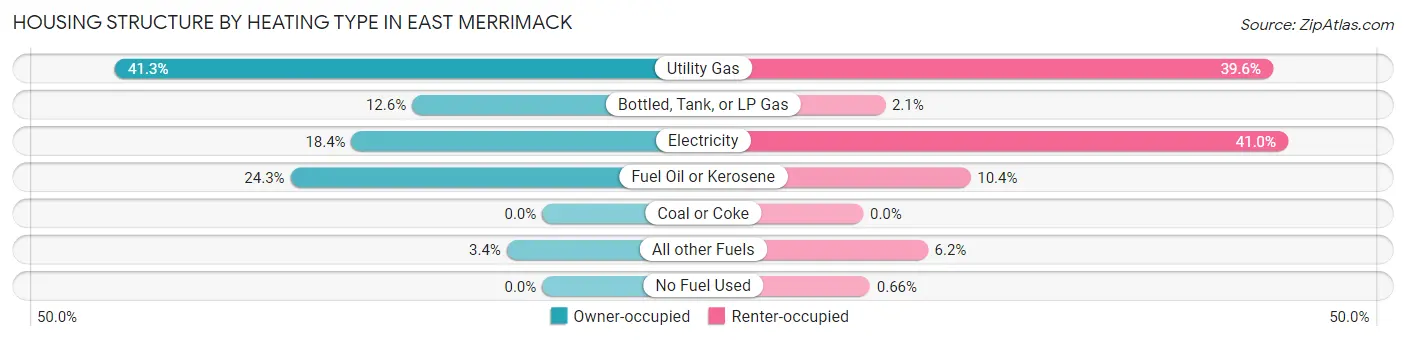
| Heating Type | Owner-occupied | Renter-occupied |
| Utility Gas | 699 (41.3%) | 298 (39.6%) |
| Bottled, Tank, or LP Gas | 213 (12.6%) | 16 (2.1%) |
| Electricity | 312 (18.4%) | 309 (41.0%) |
| Fuel Oil or Kerosene | 412 (24.3%) | 78 (10.4%) |
| Coal or Coke | 0 (0.0%) | 0 (0.0%) |
| All other Fuels | 58 (3.4%) | 47 (6.2%) |
| No Fuel Used | 0 (0.0%) | 5 (0.7%) |
| Total | 1,694 (100.0%) | 753 (100.0%) |
Household Vehicle Usage in East Merrimack
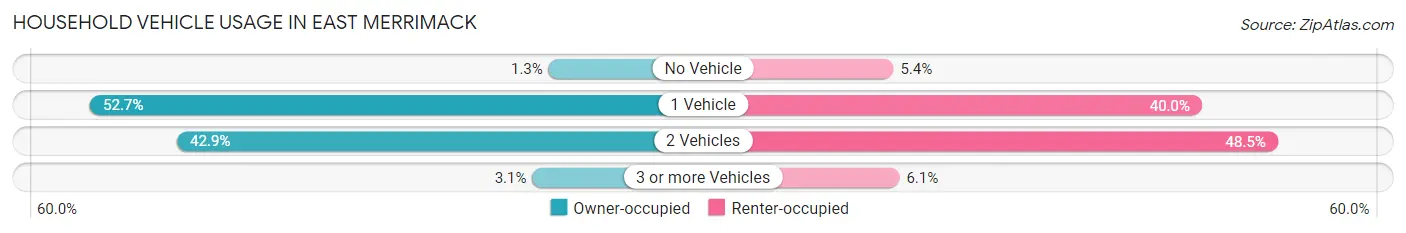
| Vehicles per Household | Owner-occupied | Renter-occupied |
| No Vehicle | 22 (1.3%) | 41 (5.4%) |
| 1 Vehicle | 892 (52.7%) | 301 (40.0%) |
| 2 Vehicles | 727 (42.9%) | 365 (48.5%) |
| 3 or more Vehicles | 53 (3.1%) | 46 (6.1%) |
| Total | 1,694 (100.0%) | 753 (100.0%) |
Real Estate & Mortgages in East Merrimack
Real Estate and Mortgage Overview in East Merrimack
| Characteristic | Without Mortgage | With Mortgage |
| Housing Units | 553 | 1,141 |
| Median Property Value | $292,200 | $246,100 |
| Median Household Income | $57,149 | $151 |
| Monthly Housing Costs | $1,053 | $58 |
| Real Estate Taxes | $5,747 | $51 |
Property Value by Mortgage Status in East Merrimack
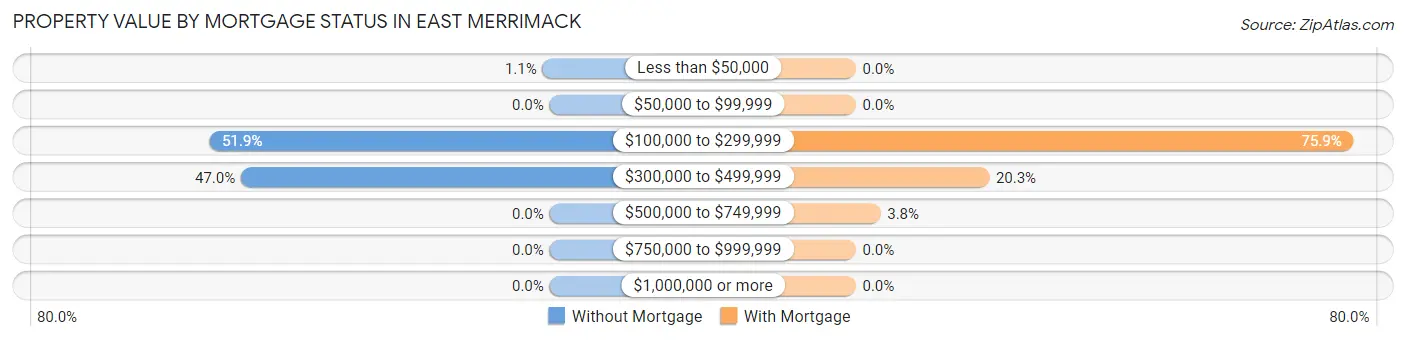
| Property Value | Without Mortgage | With Mortgage |
| Less than $50,000 | 6 (1.1%) | 0 (0.0%) |
| $50,000 to $99,999 | 0 (0.0%) | 0 (0.0%) |
| $100,000 to $299,999 | 287 (51.9%) | 866 (75.9%) |
| $300,000 to $499,999 | 260 (47.0%) | 232 (20.3%) |
| $500,000 to $749,999 | 0 (0.0%) | 43 (3.8%) |
| $750,000 to $999,999 | 0 (0.0%) | 0 (0.0%) |
| $1,000,000 or more | 0 (0.0%) | 0 (0.0%) |
| Total | 553 (100.0%) | 1,141 (100.0%) |
Household Income by Mortgage Status in East Merrimack
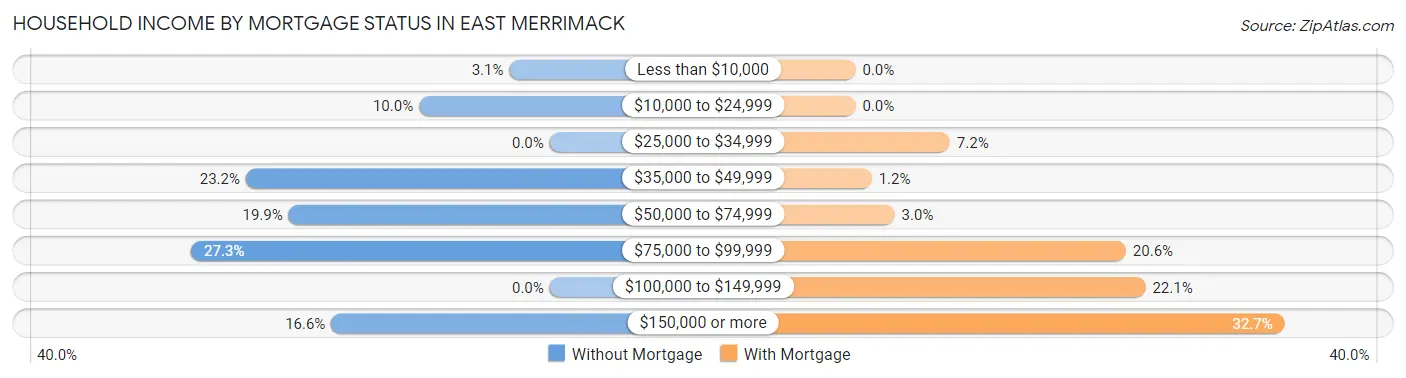
| Household Income | Without Mortgage | With Mortgage |
| Less than $10,000 | 17 (3.1%) | 0 (0.0%) |
| $10,000 to $24,999 | 55 (10.0%) | 0 (0.0%) |
| $25,000 to $34,999 | 0 (0.0%) | 82 (7.2%) |
| $35,000 to $49,999 | 128 (23.2%) | 14 (1.2%) |
| $50,000 to $74,999 | 110 (19.9%) | 34 (3.0%) |
| $75,000 to $99,999 | 151 (27.3%) | 235 (20.6%) |
| $100,000 to $149,999 | 0 (0.0%) | 252 (22.1%) |
| $150,000 or more | 92 (16.6%) | 373 (32.7%) |
| Total | 553 (100.0%) | 1,141 (100.0%) |
Property Value to Household Income Ratio in East Merrimack
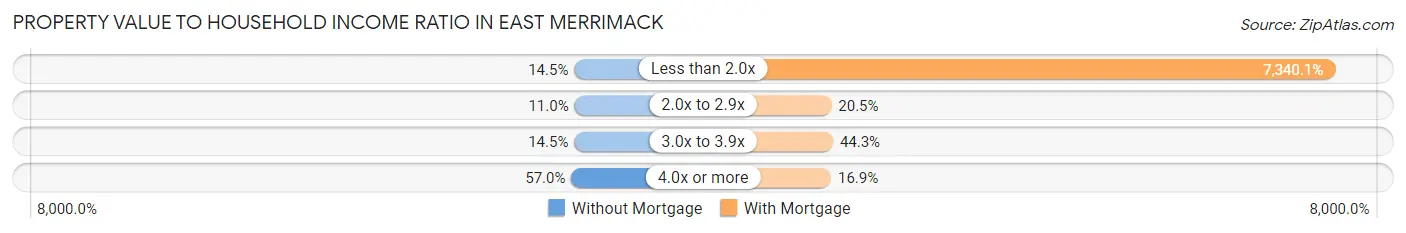
| Value-to-Income Ratio | Without Mortgage | With Mortgage |
| Less than 2.0x | 80 (14.5%) | 83,750 (7,340.0%) |
| 2.0x to 2.9x | 61 (11.0%) | 234 (20.5%) |
| 3.0x to 3.9x | 80 (14.5%) | 505 (44.3%) |
| 4.0x or more | 315 (57.0%) | 193 (16.9%) |
| Total | 553 (100.0%) | 1,141 (100.0%) |
Real Estate Taxes by Mortgage Status in East Merrimack
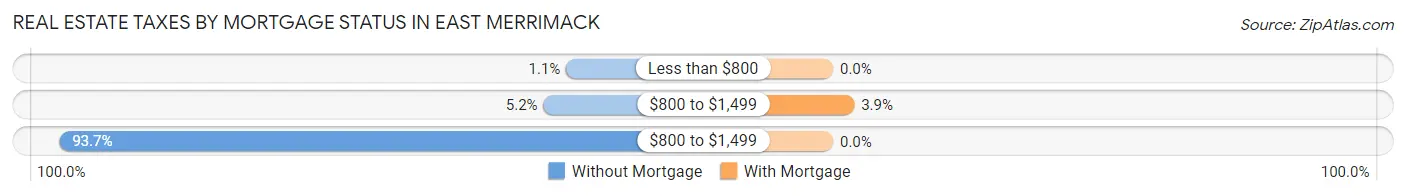
| Property Taxes | Without Mortgage | With Mortgage |
| Less than $800 | 6 (1.1%) | 0 (0.0%) |
| $800 to $1,499 | 29 (5.2%) | 44 (3.9%) |
| $800 to $1,499 | 518 (93.7%) | 0 (0.0%) |
| Total | 553 (100.0%) | 1,141 (100.0%) |
Health & Disability in East Merrimack
Health Insurance Coverage by Age in East Merrimack
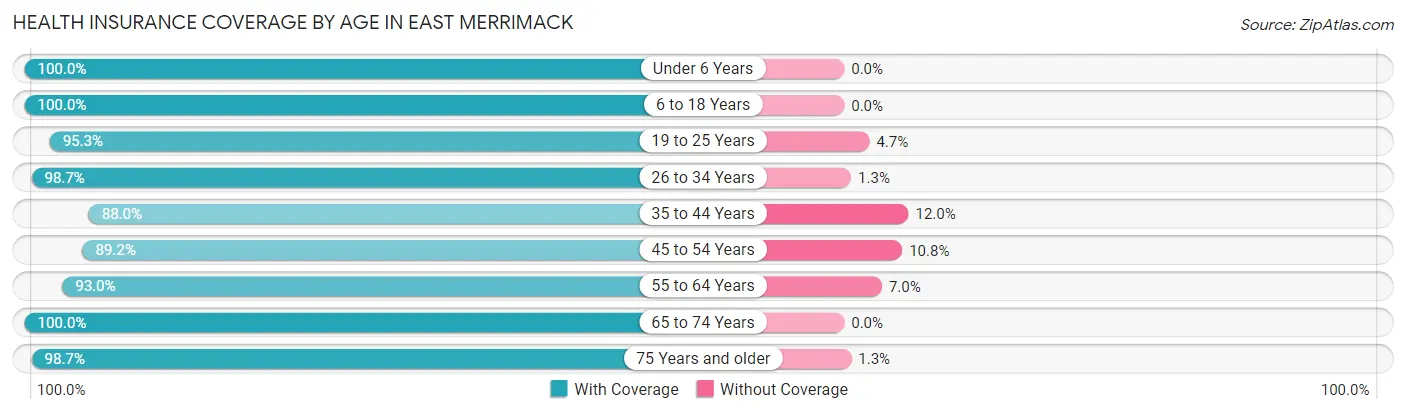
| Age Bracket | With Coverage | Without Coverage |
| Under 6 Years | 186 (100.0%) | 0 (0.0%) |
| 6 to 18 Years | 614 (100.0%) | 0 (0.0%) |
| 19 to 25 Years | 264 (95.3%) | 13 (4.7%) |
| 26 to 34 Years | 772 (98.7%) | 10 (1.3%) |
| 35 to 44 Years | 448 (88.0%) | 61 (12.0%) |
| 45 to 54 Years | 471 (89.2%) | 57 (10.8%) |
| 55 to 64 Years | 688 (93.0%) | 52 (7.0%) |
| 65 to 74 Years | 598 (100.0%) | 0 (0.0%) |
| 75 Years and older | 377 (98.7%) | 5 (1.3%) |
| Total | 4,418 (95.7%) | 198 (4.3%) |
Health Insurance Coverage by Citizenship Status in East Merrimack
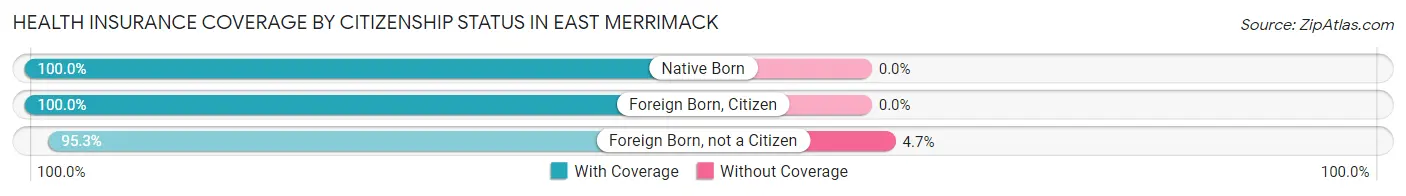
| Citizenship Status | With Coverage | Without Coverage |
| Native Born | 186 (100.0%) | 0 (0.0%) |
| Foreign Born, Citizen | 614 (100.0%) | 0 (0.0%) |
| Foreign Born, not a Citizen | 264 (95.3%) | 13 (4.7%) |
Health Insurance Coverage by Household Income in East Merrimack
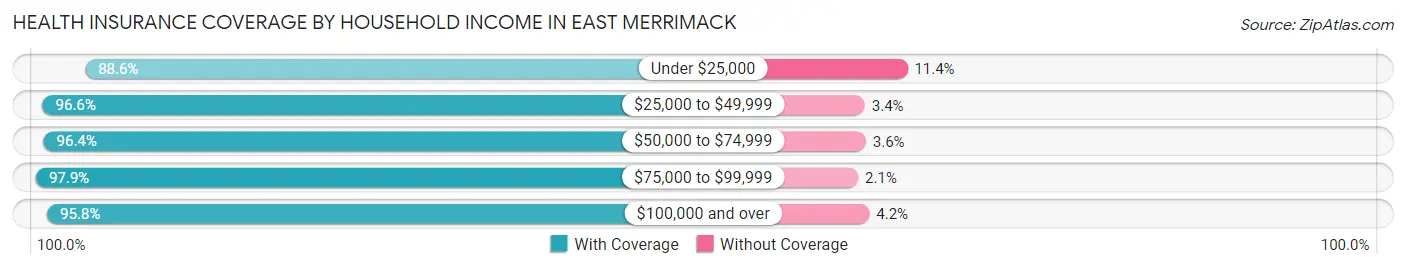
| Household Income | With Coverage | Without Coverage |
| Under $25,000 | 429 (88.6%) | 55 (11.4%) |
| $25,000 to $49,999 | 372 (96.6%) | 13 (3.4%) |
| $50,000 to $74,999 | 864 (96.4%) | 32 (3.6%) |
| $75,000 to $99,999 | 1,011 (97.9%) | 22 (2.1%) |
| $100,000 and over | 1,725 (95.8%) | 76 (4.2%) |
Public vs Private Health Insurance Coverage by Age in East Merrimack
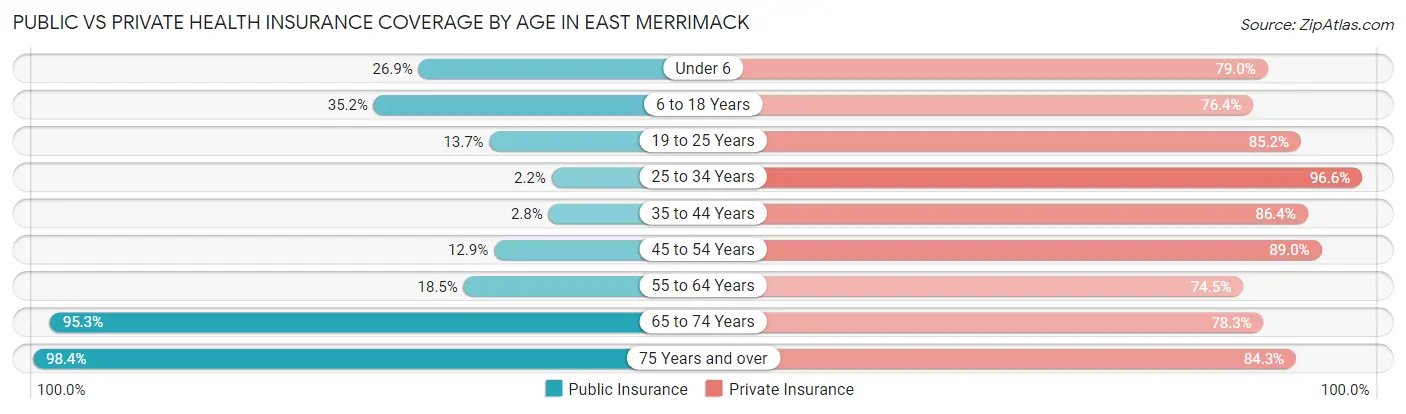
| Age Bracket | Public Insurance | Private Insurance |
| Under 6 | 50 (26.9%) | 147 (79.0%) |
| 6 to 18 Years | 216 (35.2%) | 469 (76.4%) |
| 19 to 25 Years | 38 (13.7%) | 236 (85.2%) |
| 25 to 34 Years | 17 (2.2%) | 755 (96.6%) |
| 35 to 44 Years | 14 (2.8%) | 440 (86.4%) |
| 45 to 54 Years | 68 (12.9%) | 470 (89.0%) |
| 55 to 64 Years | 137 (18.5%) | 551 (74.5%) |
| 65 to 74 Years | 570 (95.3%) | 468 (78.3%) |
| 75 Years and over | 376 (98.4%) | 322 (84.3%) |
| Total | 1,486 (32.2%) | 3,858 (83.6%) |
Disability Status by Sex by Age in East Merrimack
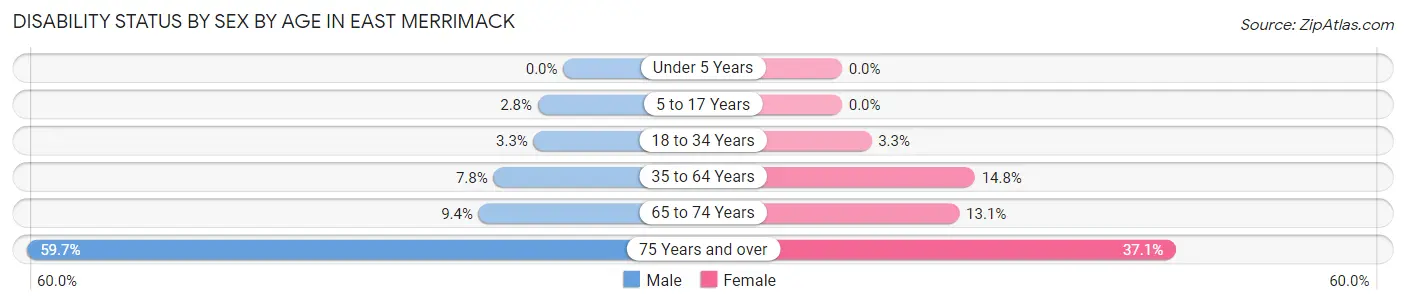
| Age Bracket | Male | Female |
| Under 5 Years | 0 (0.0%) | 0 (0.0%) |
| 5 to 17 Years | 10 (2.8%) | 0 (0.0%) |
| 18 to 34 Years | 21 (3.3%) | 15 (3.3%) |
| 35 to 64 Years | 64 (7.8%) | 141 (14.8%) |
| 65 to 74 Years | 21 (9.4%) | 49 (13.1%) |
| 75 Years and over | 80 (59.7%) | 92 (37.1%) |
Disability Class by Sex by Age in East Merrimack
Disability Class: Hearing Difficulty
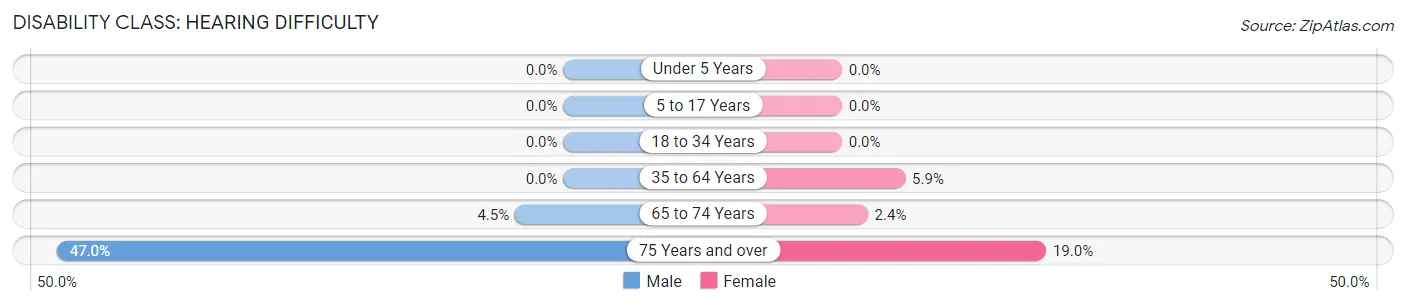
| Age Bracket | Male | Female |
| Under 5 Years | 0 (0.0%) | 0 (0.0%) |
| 5 to 17 Years | 0 (0.0%) | 0 (0.0%) |
| 18 to 34 Years | 0 (0.0%) | 0 (0.0%) |
| 35 to 64 Years | 0 (0.0%) | 56 (5.9%) |
| 65 to 74 Years | 10 (4.5%) | 9 (2.4%) |
| 75 Years and over | 63 (47.0%) | 47 (19.0%) |
Disability Class: Vision Difficulty
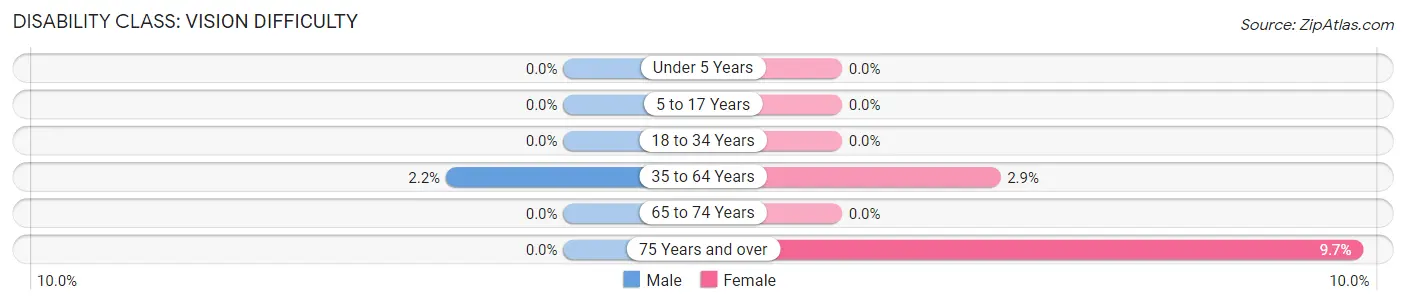
| Age Bracket | Male | Female |
| Under 5 Years | 0 (0.0%) | 0 (0.0%) |
| 5 to 17 Years | 0 (0.0%) | 0 (0.0%) |
| 18 to 34 Years | 0 (0.0%) | 0 (0.0%) |
| 35 to 64 Years | 18 (2.2%) | 28 (2.9%) |
| 65 to 74 Years | 0 (0.0%) | 0 (0.0%) |
| 75 Years and over | 0 (0.0%) | 24 (9.7%) |
Disability Class: Cognitive Difficulty
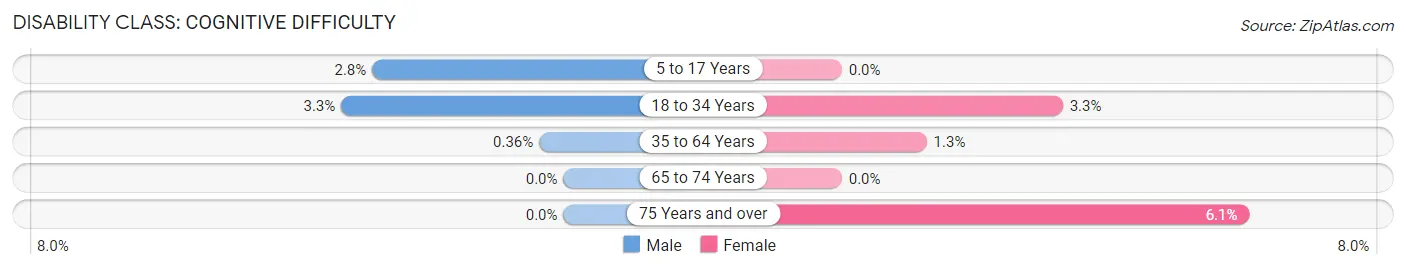
| Age Bracket | Male | Female |
| 5 to 17 Years | 10 (2.8%) | 0 (0.0%) |
| 18 to 34 Years | 21 (3.3%) | 15 (3.3%) |
| 35 to 64 Years | 3 (0.4%) | 12 (1.3%) |
| 65 to 74 Years | 0 (0.0%) | 0 (0.0%) |
| 75 Years and over | 0 (0.0%) | 15 (6.0%) |
Disability Class: Ambulatory Difficulty
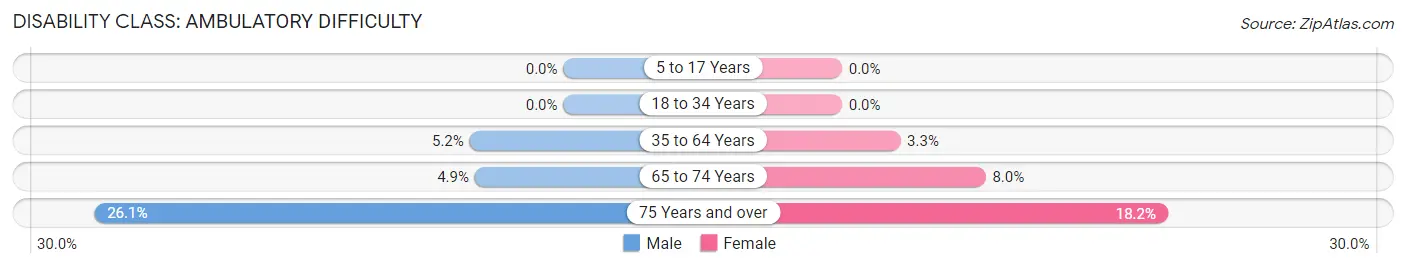
| Age Bracket | Male | Female |
| 5 to 17 Years | 0 (0.0%) | 0 (0.0%) |
| 18 to 34 Years | 0 (0.0%) | 0 (0.0%) |
| 35 to 64 Years | 43 (5.2%) | 31 (3.3%) |
| 65 to 74 Years | 11 (4.9%) | 30 (8.0%) |
| 75 Years and over | 35 (26.1%) | 45 (18.1%) |
Disability Class: Self-Care Difficulty
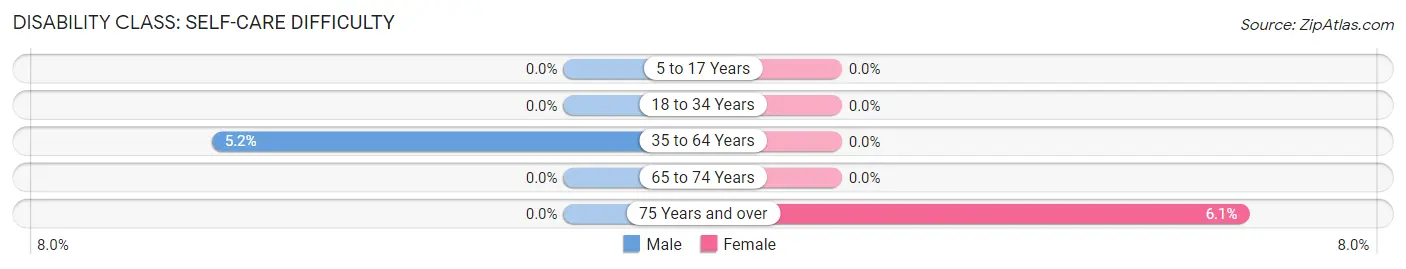
| Age Bracket | Male | Female |
| 5 to 17 Years | 0 (0.0%) | 0 (0.0%) |
| 18 to 34 Years | 0 (0.0%) | 0 (0.0%) |
| 35 to 64 Years | 43 (5.2%) | 0 (0.0%) |
| 65 to 74 Years | 0 (0.0%) | 0 (0.0%) |
| 75 Years and over | 0 (0.0%) | 15 (6.0%) |
Technology Access in East Merrimack
Computing Device Access in East Merrimack
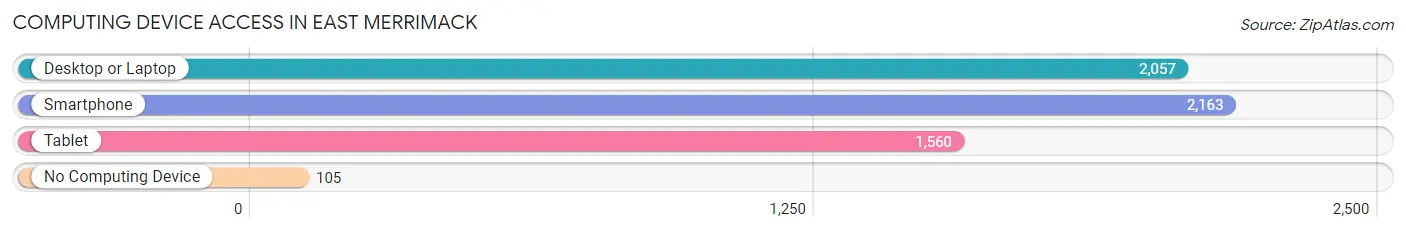
| Device Type | # Households | % Households |
| Desktop or Laptop | 2,057 | 84.1% |
| Smartphone | 2,163 | 88.4% |
| Tablet | 1,560 | 63.7% |
| No Computing Device | 105 | 4.3% |
| Total | 2,447 | 100.0% |
Internet Access in East Merrimack
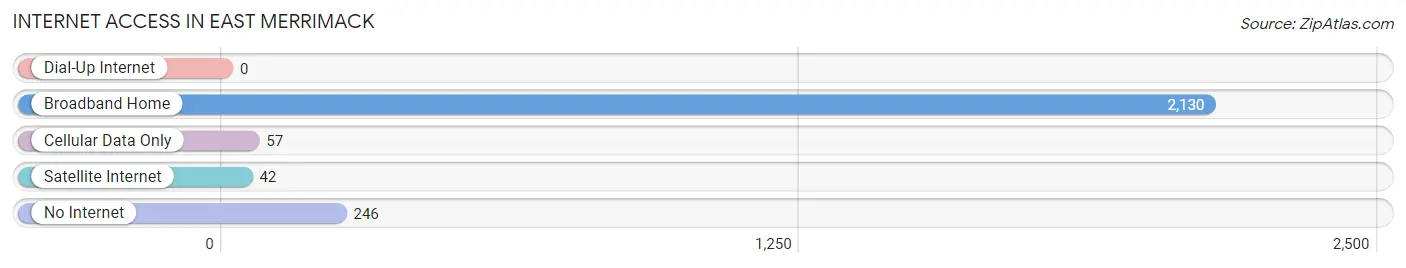
| Internet Type | # Households | % Households |
| Dial-Up Internet | 0 | 0.0% |
| Broadband Home | 2,130 | 87.1% |
| Cellular Data Only | 57 | 2.3% |
| Satellite Internet | 42 | 1.7% |
| No Internet | 246 | 10.1% |
| Total | 2,447 | 100.0% |
East Merrimack Summary
Merrimack, New Hampshire is a small town located in Hillsborough County, in the southern part of the state. It is bordered by the towns of Bedford, Amherst, and Manchester. The town was incorporated in 1746 and is named after the Merrimack River, which runs through the town. The population of Merrimack was 25,494 as of the 2010 census.
History
The area that is now Merrimack was originally inhabited by the Pennacook Native Americans. The first European settlers arrived in the area in the late 1600s. The town was originally part of the Massachusetts Bay Colony, but was annexed to New Hampshire in 1741. The town was officially incorporated in 1746 and was named after the Merrimack River, which runs through the town.
In the late 1700s and early 1800s, Merrimack was a major center for the production of textiles. The Amoskeag Manufacturing Company was founded in 1810 and was one of the largest textile mills in the world. The company employed thousands of people and was a major contributor to the town's economy. The company closed in 1935, but the town still has a strong manufacturing base.
Geography
Merrimack is located in Hillsborough County in the southern part of the state. It is bordered by the towns of Bedford, Amherst, and Manchester. The town is situated on the Merrimack River, which runs through the town. The town is mostly flat, with some hills in the northern part of the town. The highest point in the town is the summit of Pine Hill, which is 590 feet above sea level.
The town has a total area of 28.2 square miles, of which 27.9 square miles is land and 0.3 square miles is water. The town is drained by the Merrimack River and its tributaries.
Economy
Merrimack has a strong manufacturing base, with several large companies located in the town. The largest employer in the town is BAE Systems, which manufactures military and aerospace products. Other major employers in the town include Fidelity Investments, Dell Technologies, and Anheuser-Busch.
The town also has a strong retail sector, with several large shopping centers located in the town. The Merrimack Premium Outlets is the largest shopping center in the town, with over 100 stores.
Demographics
As of the 2010 census, the population of Merrimack was 25,494. The racial makeup of the town was 94.2% White, 1.7% African American, 0.3% Native American, 1.9% Asian, 0.1% Pacific Islander, 0.7% from other races, and 1.2% from two or more races. Hispanic or Latino of any race were 2.7% of the population.
The median household income in Merrimack was $76,837, and the median family income was $90,945. The per capita income for the town was $35,945. About 3.2% of families and 4.3% of the population were below the poverty line, including 5.2% of those under age 18 and 4.2% of those age 65 or over.
Common Questions
What is Per Capita Income in East Merrimack?
Per Capita income in East Merrimack is $48,968.
What is the Median Family Income in East Merrimack?
Median Family Income in East Merrimack is $89,153.
What is the Median Household income in East Merrimack?
Median Household Income in East Merrimack is $80,234.
What is Income or Wage Gap in East Merrimack?
Income or Wage Gap in East Merrimack is 12.4%.
Women in East Merrimack earn 87.6 cents for every dollar earned by a man.
What is Inequality or Gini Index in East Merrimack?
Inequality or Gini Index in East Merrimack is 0.39.
What is the Total Population of East Merrimack?
Total Population of East Merrimack is 4,643.
What is the Total Male Population of East Merrimack?
Total Male Population of East Merrimack is 2,271.
What is the Total Female Population of East Merrimack?
Total Female Population of East Merrimack is 2,372.
What is the Ratio of Males per 100 Females in East Merrimack?
There are 95.74 Males per 100 Females in East Merrimack.
What is the Ratio of Females per 100 Males in East Merrimack?
There are 104.45 Females per 100 Males in East Merrimack.
What is the Median Population Age in East Merrimack?
Median Population Age in East Merrimack is 44.6 Years.
What is the Average Family Size in East Merrimack
Average Family Size in East Merrimack is 2.5 People.
What is the Average Household Size in East Merrimack
Average Household Size in East Merrimack is 1.9 People.
How Large is the Labor Force in East Merrimack?
There are 2,622 People in the Labor Forcein in East Merrimack.
What is the Percentage of People in the Labor Force in East Merrimack?
65.5% of People are in the Labor Force in East Merrimack.