Area Code 603 Map & Demographics
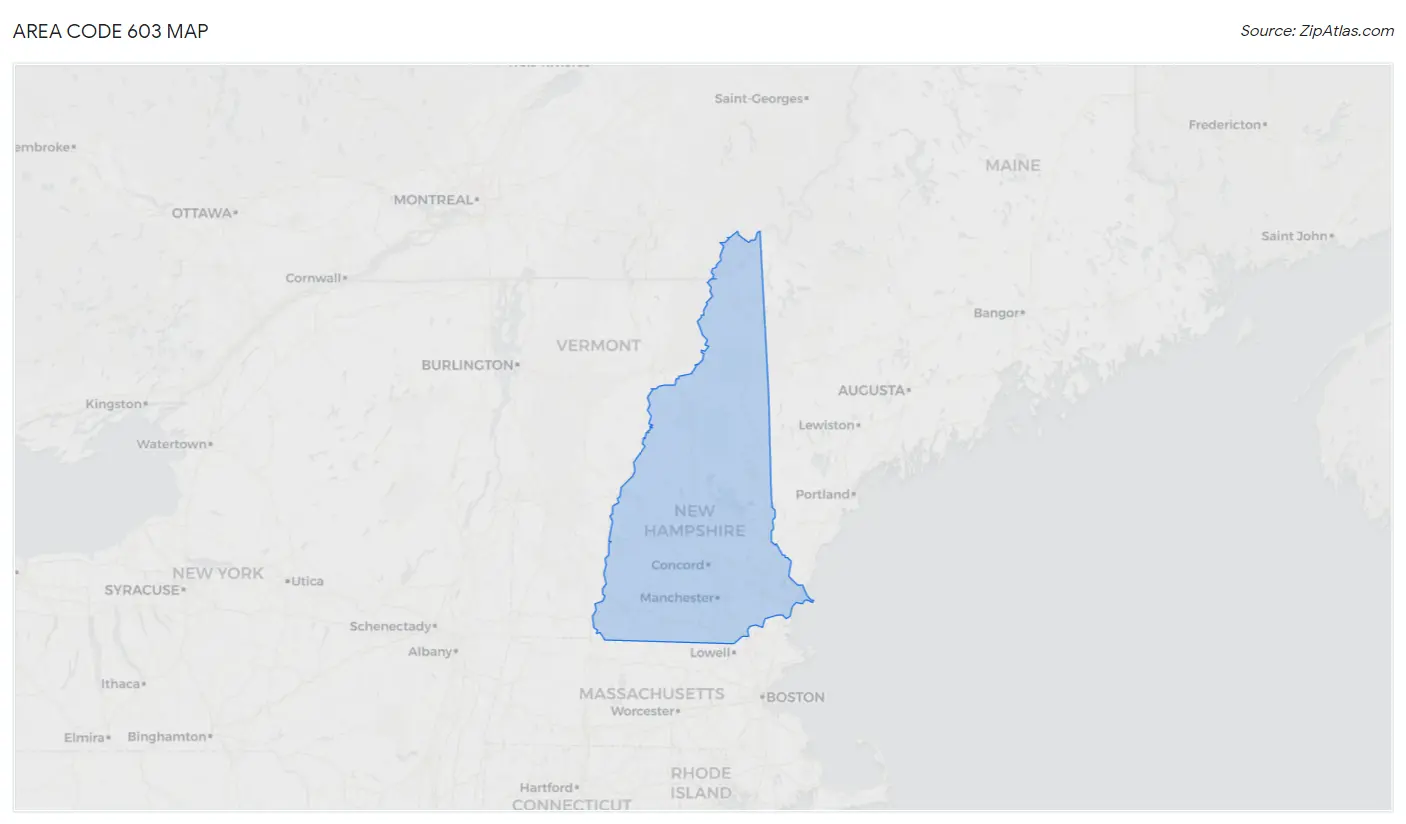
Area Code 603 Map
Area Code 603 Overview
$49,176
PER CAPITA INCOME
$111,451
AVG FAMILY INCOME
$93,430
AVG HOUSEHOLD INCOME
28.8%
WAGE / INCOME GAP [ % ]
71.2¢/ $1
WAGE / INCOME GAP [ $ ]
$10,834
FAMILY INCOME DEFICIT
99.61
INEQUALITY / GINI INDEX
1,379,678
TOTAL POPULATION
689,760
MALE POPULATION
689,918
FEMALE POPULATION
99.98
MALES / 100 FEMALES
100.02
FEMALES / 100 MALES
46.9
MEDIAN AGE
3.0
AVG FAMILY SIZE
2.5
AVG HOUSEHOLD SIZE
736,140
LABOR FORCE [ PEOPLE ]
63.7%
PERCENT IN LABOR FORCE
3.8%
UNEMPLOYMENT RATE
Income in Area Code 603
Income Overview in Area Code 603
Per Capita Income in Area Code 603 is $49,176, while median incomes of families and households are $111,451 and $93,430 respectively.
| Characteristic | Number | Measure |
| Per Capita Income | 1,379,678 | $49,176 |
| Median Family Income | 353,929 | $111,451 |
| Mean Family Income | 353,929 | $32,565,326 |
| Median Household Income | 545,151 | $93,430 |
| Mean Household Income | 545,151 | $28,752,681 |
| Income Deficit | 353,929 | $10,834 |
| Wage / Income Gap (%) | 1,379,678 | 28.80% |
| Wage / Income Gap ($) | 1,379,678 | 71.20¢ per $1 |
| Gini / Inequality Index | 1,379,678 | 99.61 |
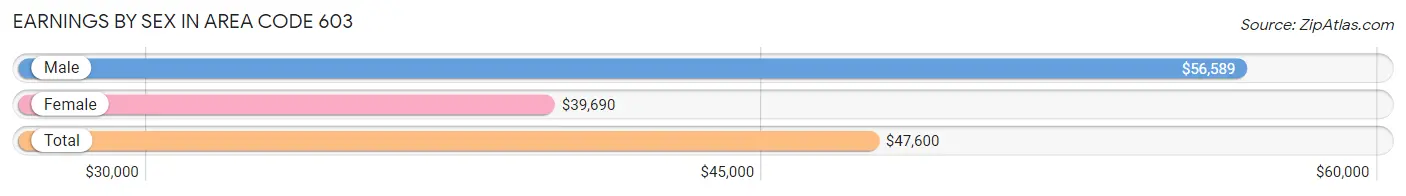
Earnings by Sex in Area Code 603
Average Earnings in Area Code 603 are $47,600, $56,589 for men and $39,690 for women, a difference of 29.9%.
| Sex | Number | Average Earnings |
| Male | 430,577 (52.8%) | $56,589 |
| Female | 385,461 (47.2%) | $39,690 |
| Total | 816,038 (100.0%) | $47,600 |
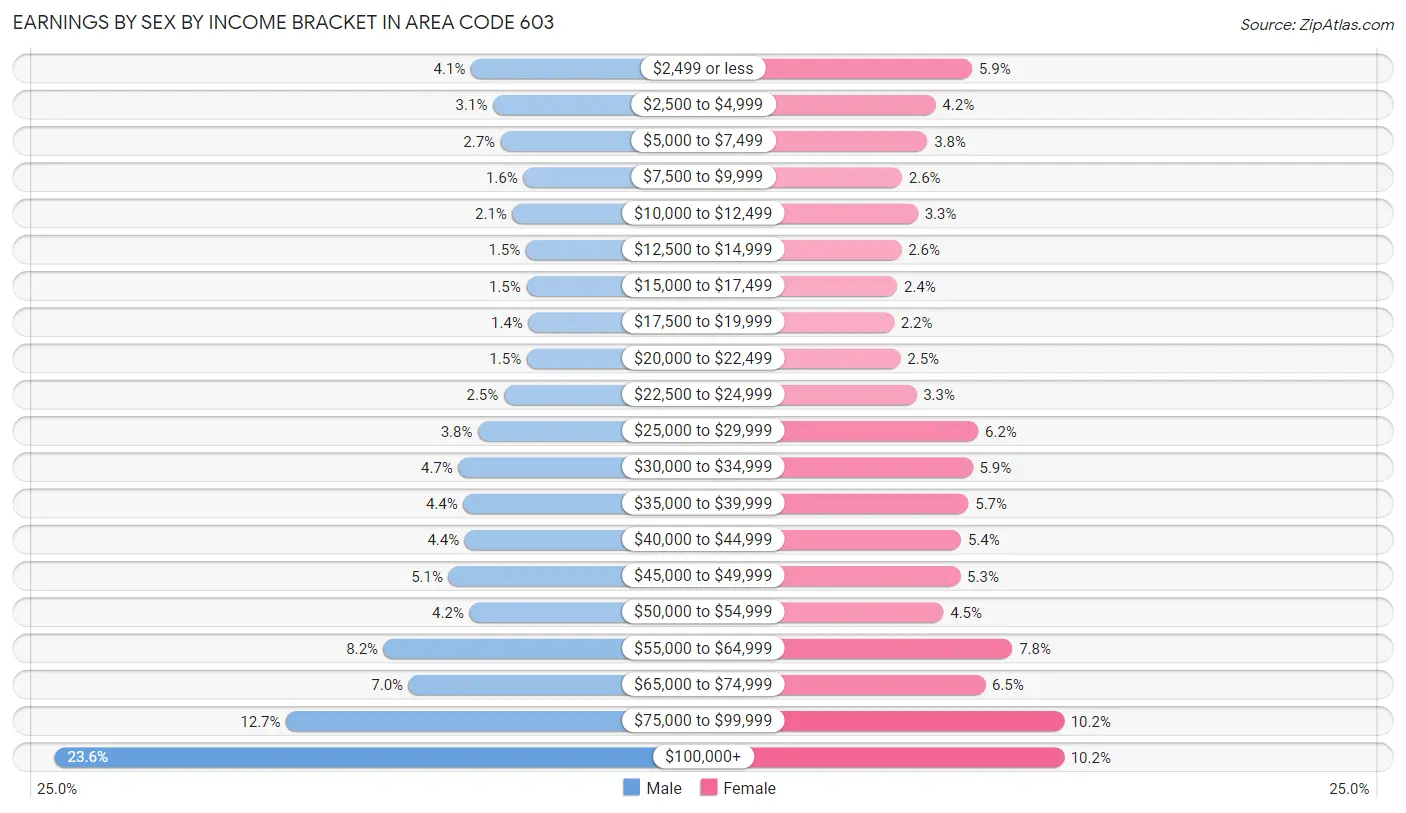
Earnings by Sex by Income Bracket in Area Code 603
The most common earnings brackets in Area Code 603 are $100,000+ for men (101,573 | 23.6%) and $100,000+ for women (39,177 | 10.2%).
| Income | Male | Female |
| $2,499 or less | 17,553 (4.1%) | 22,587 (5.9%) |
| $2,500 to $4,999 | 13,123 (3.0%) | 15,981 (4.2%) |
| $5,000 to $7,499 | 11,581 (2.7%) | 14,520 (3.8%) |
| $7,500 to $9,999 | 7,032 (1.6%) | 9,964 (2.6%) |
| $10,000 to $12,499 | 9,213 (2.1%) | 12,785 (3.3%) |
| $12,500 to $14,999 | 6,484 (1.5%) | 9,844 (2.5%) |
| $15,000 to $17,499 | 6,404 (1.5%) | 9,067 (2.4%) |
| $17,500 to $19,999 | 5,986 (1.4%) | 8,497 (2.2%) |
| $20,000 to $22,499 | 6,320 (1.5%) | 9,689 (2.5%) |
| $22,500 to $24,999 | 10,933 (2.5%) | 12,523 (3.3%) |
| $25,000 to $29,999 | 16,162 (3.7%) | 23,708 (6.1%) |
| $30,000 to $34,999 | 20,129 (4.7%) | 22,712 (5.9%) |
| $35,000 to $39,999 | 19,112 (4.4%) | 21,947 (5.7%) |
| $40,000 to $44,999 | 18,824 (4.4%) | 20,616 (5.3%) |
| $45,000 to $49,999 | 22,094 (5.1%) | 20,474 (5.3%) |
| $50,000 to $54,999 | 17,887 (4.2%) | 17,417 (4.5%) |
| $55,000 to $64,999 | 35,187 (8.2%) | 29,882 (7.7%) |
| $65,000 to $74,999 | 30,124 (7.0%) | 24,922 (6.5%) |
| $75,000 to $99,999 | 54,856 (12.7%) | 39,149 (10.2%) |
| $100,000+ | 101,573 (23.6%) | 39,177 (10.2%) |
| Total | 430,577 (100.0%) | 385,461 (100.0%) |
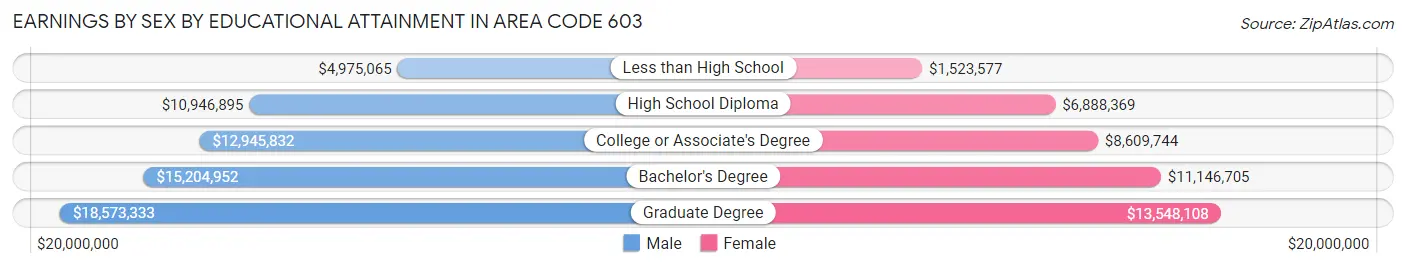
Earnings by Sex by Educational Attainment in Area Code 603
Average earnings in Area Code 603 are $14,769,898 for men and $10,140,201 for women, a difference of 31.4%. Men with an educational attainment of graduate degree enjoy the highest average annual earnings of $18,573,333, while those with less than high school education earn the least with $4,975,065. Women with an educational attainment of graduate degree earn the most with the average annual earnings of $13,548,108, while those with less than high school education have the smallest earnings of $1,523,577.
| Educational Attainment | Male Income | Female Income |
| Less than High School | $4,975,065 | $1,523,577 |
| High School Diploma | $10,946,895 | $6,888,369 |
| College or Associate's Degree | $12,945,832 | $8,609,744 |
| Bachelor's Degree | $15,204,952 | $11,146,705 |
| Graduate Degree | $18,573,333 | $13,548,108 |
| Total | $14,769,898 | $10,140,201 |
Family Income in Area Code 603
Family Income Brackets in Area Code 603
According to the Area Code 603 family income data, there are 21,053,820 families falling into the $100,000 to $149,999 income range, which is the most common income bracket and makes up 5,948.6% of all families. Conversely, the $10,000 to $14,999 income bracket is the least frequent group with only 1,074,175 families (303.5%) belonging to this category.
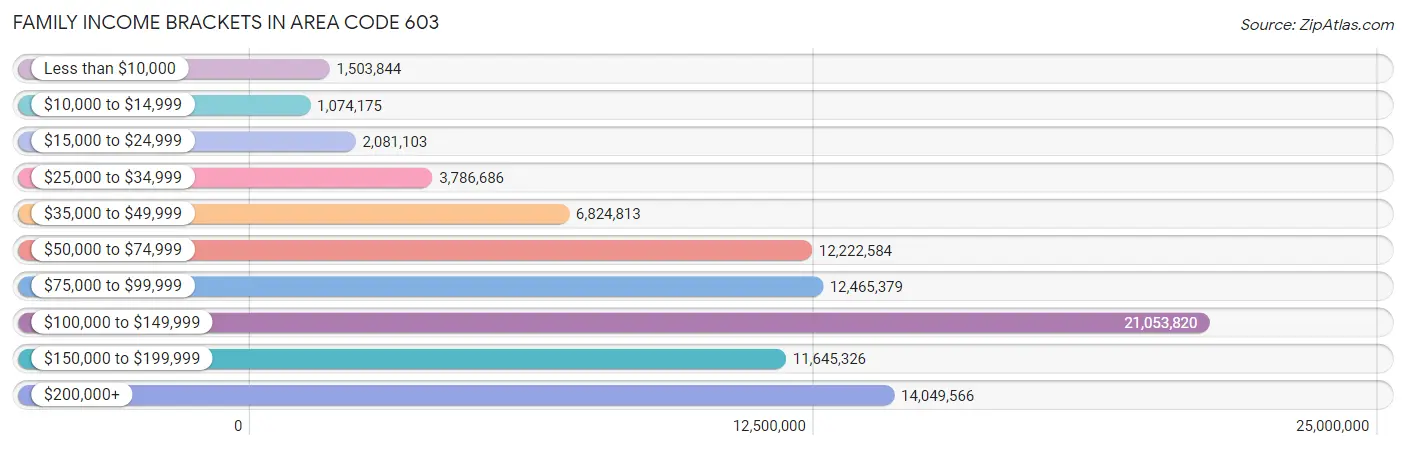
| Income Bracket | # Families | % Families |
| Less than $10,000 | 1,503,844 | 424.9% |
| $10,000 to $14,999 | 1,074,175 | 303.5% |
| $15,000 to $24,999 | 2,081,103 | 588.0% |
| $25,000 to $34,999 | 3,786,686 | 1,069.9% |
| $35,000 to $49,999 | 6,824,813 | 1,928.3% |
| $50,000 to $74,999 | 12,222,584 | 3,453.4% |
| $75,000 to $99,999 | 12,465,379 | 3,522.0% |
| $100,000 to $149,999 | 21,053,820 | 5,948.6% |
| $150,000 to $199,999 | 11,645,326 | 3,290.3% |
| $200,000+ | 14,049,566 | 3,969.6% |
Family Income by Famaliy Size in Area Code 603
5-person families (22,391 | 6.3%) account for the highest median family income in Area Code 603 with $157,299 per family, while 2-person families (184,758 | 52.2%) have the highest median income of $49,446 per family member.
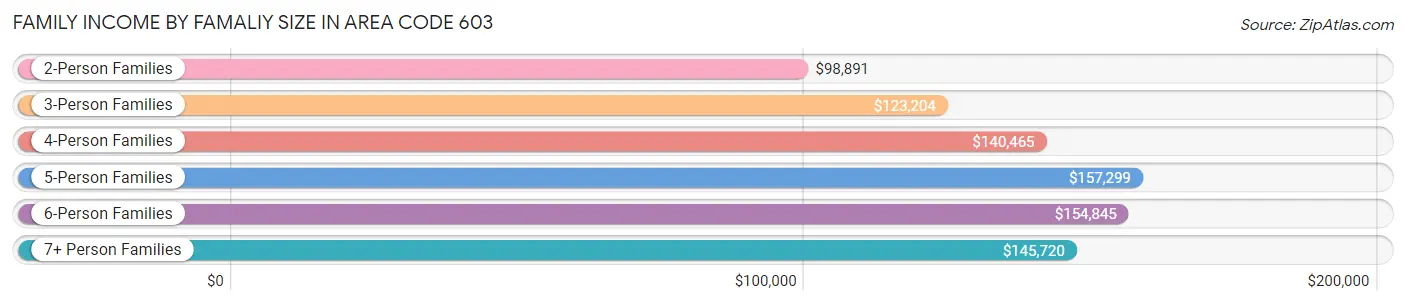
| Income Bracket | # Families | Median Income |
| 2-Person Families | 184,758 (52.2%) | $98,891 |
| 3-Person Families | 75,449 (21.3%) | $123,204 |
| 4-Person Families | 61,786 (17.5%) | $140,465 |
| 5-Person Families | 22,391 (6.3%) | $157,299 |
| 6-Person Families | 6,522 (1.8%) | $154,845 |
| 7+ Person Families | 3,023 (0.9%) | $145,720 |
| Total | 353,929 (100.0%) | $111,451 |
Family Income by Number of Earners in Area Code 603
The median family income in Area Code 603 is $111,451, with families comprising 3+ earners (49,776) having the highest median family income of $163,866, while families with no earners (49,461) have the lowest median family income of $65,563, accounting for 14.1% and 14.0% of families, respectively.
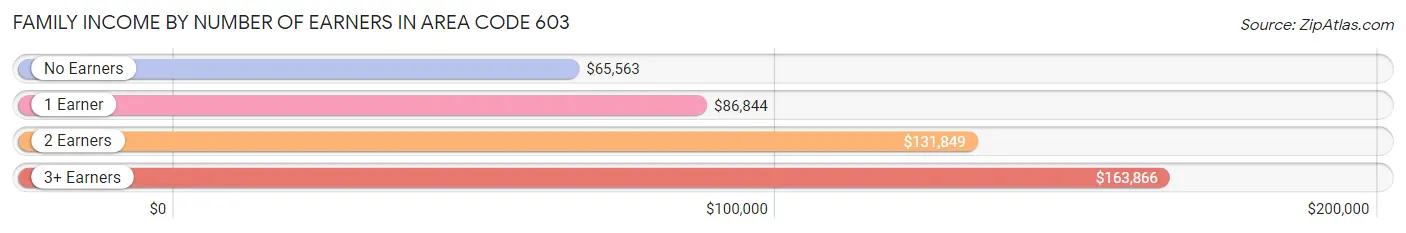
| Number of Earners | # Families | Median Income |
| No Earners | 49,461 (14.0%) | $65,563 |
| 1 Earner | 97,874 (27.7%) | $86,844 |
| 2 Earners | 156,818 (44.3%) | $131,849 |
| 3+ Earners | 49,776 (14.1%) | $163,866 |
| Total | 353,929 (100.0%) | $111,451 |
Household Income in Area Code 603
Household Income Brackets in Area Code 603
With 26,829,061 households falling in the category, the $100,000 to $149,999 income range is the most frequent in Area Code 603, accounting for 4,921.4% of all households. In contrast, only 3,486,241 households (639.5%) fall into the $10,000 to $14,999 income bracket, making it the least populous group.
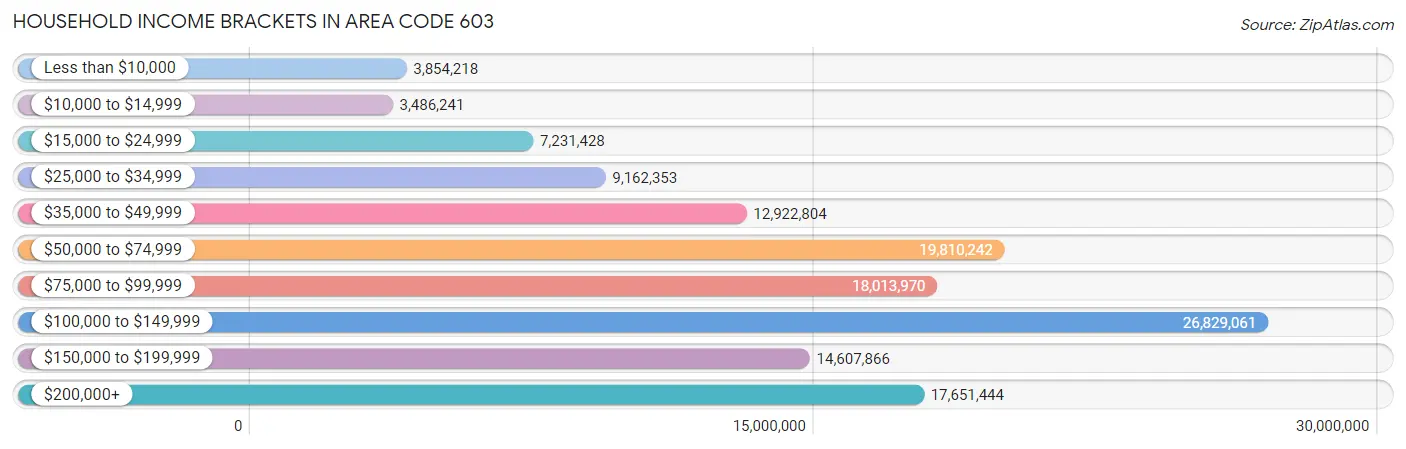
| Income Bracket | # Households | % Households |
| Less than $10,000 | 3,854,218 | 707.0% |
| $10,000 to $14,999 | 3,486,241 | 639.5% |
| $15,000 to $24,999 | 7,231,428 | 1,326.5% |
| $25,000 to $34,999 | 9,162,353 | 1,680.7% |
| $35,000 to $49,999 | 12,922,804 | 2,370.5% |
| $50,000 to $74,999 | 19,810,242 | 3,633.9% |
| $75,000 to $99,999 | 18,013,970 | 3,304.4% |
| $100,000 to $149,999 | 26,829,061 | 4,921.4% |
| $150,000 to $199,999 | 14,607,866 | 2,679.6% |
| $200,000+ | 17,651,444 | 3,237.9% |
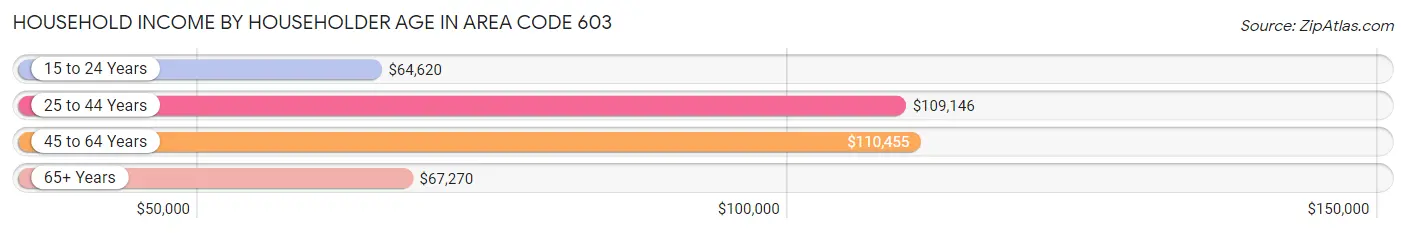
Household Income by Householder Age in Area Code 603
The median household income in Area Code 603 is $93,430, with the highest median household income of $110,455 found in the 45 to 64 years age bracket for the primary householder. A total of 220,625 households (40.5%) fall into this category. Meanwhile, the 15 to 24 years age bracket for the primary householder has the lowest median household income of $64,620, with 14,573 households (2.7%) in this group.
| Income Bracket | # Households | Median Income |
| 15 to 24 Years | 14,573 (2.7%) | $64,620 |
| 25 to 44 Years | 152,090 (27.9%) | $109,146 |
| 45 to 64 Years | 220,625 (40.5%) | $110,455 |
| 65+ Years | 157,863 (29.0%) | $67,270 |
| Total | 545,151 (100.0%) | $93,430 |
Poverty in Area Code 603
Income Below Poverty by Sex and Age in Area Code 603
With 6.4% poverty level for males and 8.3% for females among the residents of Area Code 603, 18 to 24 year old males and 18 to 24 year old females are the most vulnerable to poverty, with 5,718 males (10.4%) and 6,312 females (12.4%) in their respective age groups living below the poverty level.
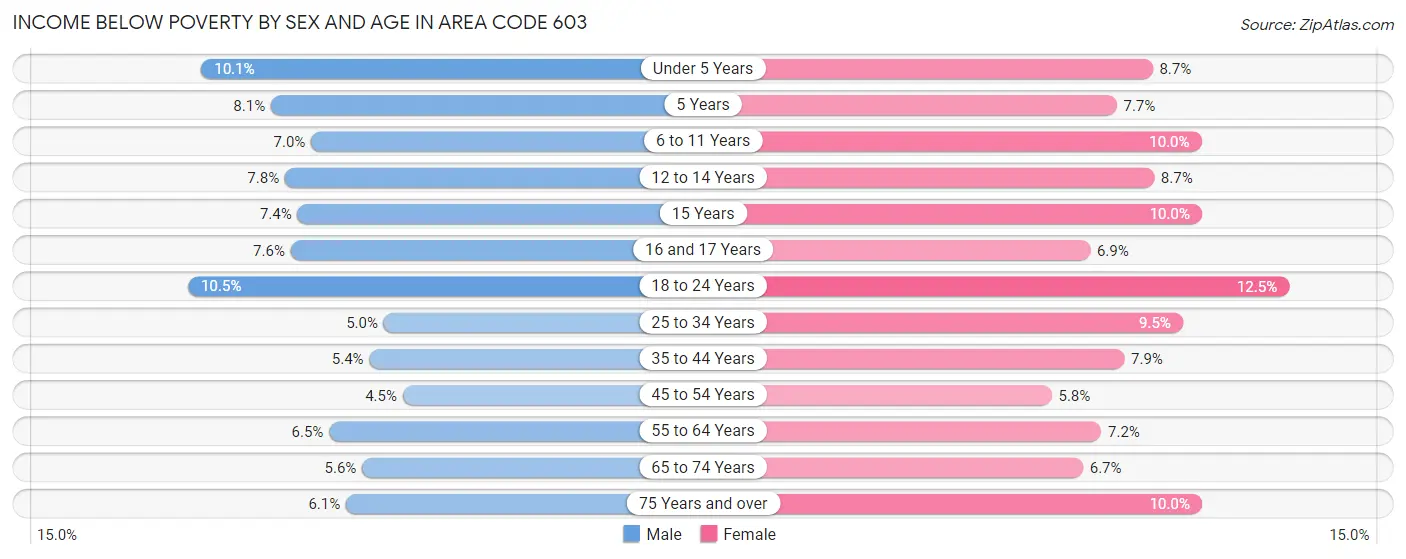
| Age Bracket | Male | Female |
| Under 5 Years | 3,153 (10.1%) | 2,635 (8.6%) |
| 5 Years | 553 (8.1%) | 463 (7.6%) |
| 6 to 11 Years | 3,055 (7.0%) | 4,055 (10.0%) |
| 12 to 14 Years | 1,733 (7.7%) | 1,888 (8.7%) |
| 15 Years | 606 (7.4%) | 802 (10.0%) |
| 16 and 17 Years | 1,275 (7.6%) | 1,073 (6.9%) |
| 18 to 24 Years | 5,718 (10.4%) | 6,312 (12.4%) |
| 25 to 34 Years | 4,466 (5.0%) | 7,863 (9.5%) |
| 35 to 44 Years | 4,432 (5.4%) | 6,284 (7.9%) |
| 45 to 54 Years | 4,046 (4.5%) | 5,266 (5.8%) |
| 55 to 64 Years | 6,992 (6.5%) | 7,821 (7.2%) |
| 65 to 74 Years | 4,287 (5.6%) | 5,409 (6.7%) |
| 75 Years and over | 2,503 (6.0%) | 5,482 (10.0%) |
| Total | 42,819 (6.4%) | 55,353 (8.3%) |
Income Above Poverty by Sex and Age in Area Code 603
According to the poverty statistics in Area Code 603, males aged 45 to 54 years and females aged 45 to 54 years are the age groups that are most secure financially, with 95.5% of males and 94.2% of females in these age groups living above the poverty line.
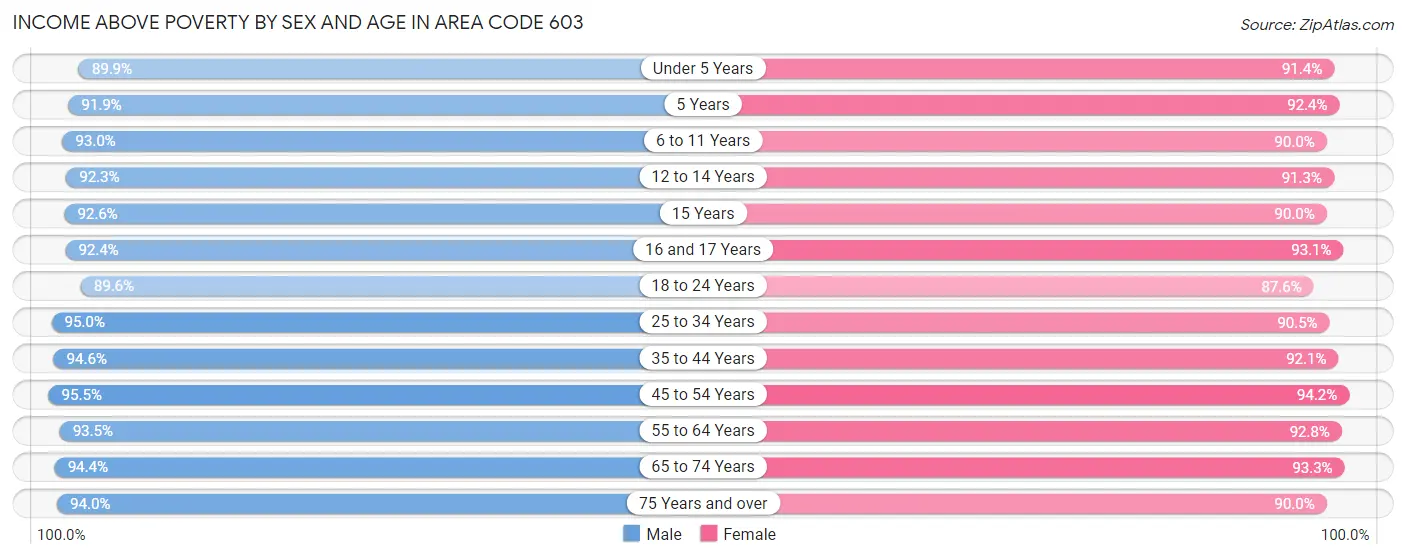
| Age Bracket | Male | Female |
| Under 5 Years | 28,113 (89.9%) | 27,842 (91.3%) |
| 5 Years | 6,241 (91.9%) | 5,592 (92.3%) |
| 6 to 11 Years | 40,443 (93.0%) | 36,461 (90.0%) |
| 12 to 14 Years | 20,633 (92.2%) | 19,848 (91.3%) |
| 15 Years | 7,583 (92.6%) | 7,200 (90.0%) |
| 16 and 17 Years | 15,530 (92.4%) | 14,449 (93.1%) |
| 18 to 24 Years | 48,981 (89.5%) | 44,373 (87.5%) |
| 25 to 34 Years | 84,786 (95.0%) | 75,024 (90.5%) |
| 35 to 44 Years | 77,575 (94.6%) | 73,685 (92.1%) |
| 45 to 54 Years | 86,501 (95.5%) | 84,835 (94.2%) |
| 55 to 64 Years | 100,189 (93.5%) | 100,544 (92.8%) |
| 65 to 74 Years | 72,278 (94.4%) | 75,178 (93.3%) |
| 75 Years and over | 38,875 (94.0%) | 49,211 (90.0%) |
| Total | 627,728 (93.6%) | 614,242 (91.7%) |
Income Below Poverty Among Married-Couple Families in Area Code 603
The poverty statistics for married-couple families in Area Code 603 show that 2.1% or 5,900 of the total 284,067 families live below the poverty line. Families with 5 or more children have the highest poverty rate of 13.9%, comprising of 125 families. On the other hand, families with 1 or 2 children have the lowest poverty rate of 1.7%, which includes 1,398 families.
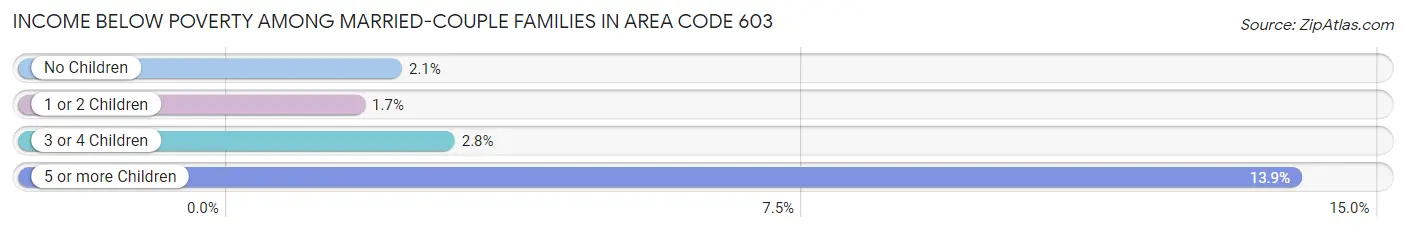
| Children | Above Poverty | Below Poverty |
| No Children | 178,911 (97.9%) | 3,914 (2.1%) |
| 1 or 2 Children | 82,607 (98.3%) | 1,398 (1.7%) |
| 3 or 4 Children | 15,874 (97.2%) | 463 (2.8%) |
| 5 or more Children | 775 (86.1%) | 125 (13.9%) |
| Total | 278,167 (97.9%) | 5,900 (2.1%) |
Income Below Poverty Among Single-Parent Households in Area Code 603
According to the poverty data in Area Code 603, 9.0% or 2,145 single-father households and 16.3% or 7,484 single-mother households are living below the poverty line. Among single-father households, those with 5 or more children have the highest poverty rate, with 11 households (36.7%) experiencing poverty. Likewise, among single-mother households, those with 5 or more children have the highest poverty rate, with 76 households (55.1%) falling below the poverty line.
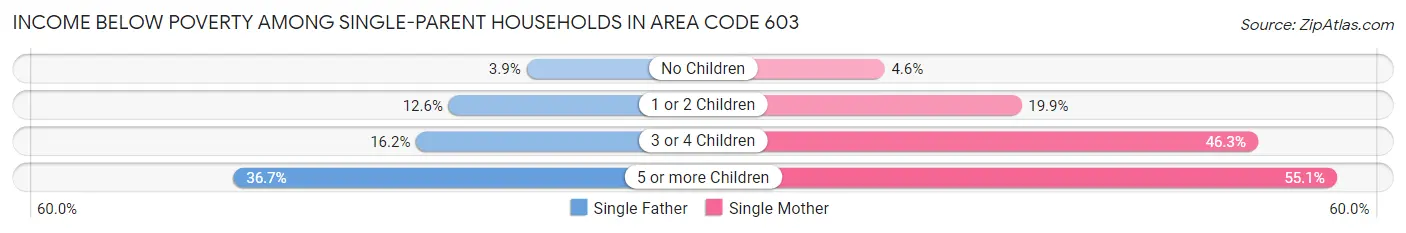
| Children | Single Father | Single Mother |
| No Children | 411 (3.9%) | 813 (4.6%) |
| 1 or 2 Children | 1,523 (12.6%) | 4,795 (19.9%) |
| 3 or 4 Children | 200 (16.2%) | 1,800 (46.3%) |
| 5 or more Children | 11 (36.7%) | 76 (55.1%) |
| Total | 2,145 (9.0%) | 7,484 (16.3%) |
Income Below Poverty Among Married-Couple vs Single-Parent Households in Area Code 603
The poverty data for Area Code 603 shows that 5,900 of the married-couple family households (2.1%) and 9,629 of the single-parent households (13.8%) are living below the poverty level. Within the married-couple family households, those with 5 or more children have the highest poverty rate, with 125 households (13.9%) falling below the poverty line. Among the single-parent households, those with 5 or more children have the highest poverty rate, with 87 household (51.8%) living below poverty.
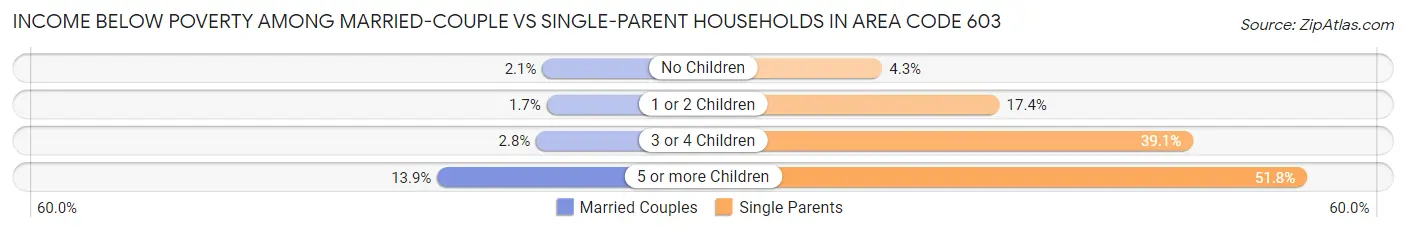
| Children | Married-Couple Families | Single-Parent Households |
| No Children | 3,914 (2.1%) | 1,224 (4.3%) |
| 1 or 2 Children | 1,398 (1.7%) | 6,318 (17.4%) |
| 3 or 4 Children | 463 (2.8%) | 2,000 (39.1%) |
| 5 or more Children | 125 (13.9%) | 87 (51.8%) |
| Total | 5,900 (2.1%) | 9,629 (13.8%) |
Race in Area Code 603
The most populous races in Area Code 603 are White / Caucasian (1,241,654 | 90.0%), Two or more Races (63,323 | 4.6%), and Hispanic or Latino (58,654 | 4.3%).
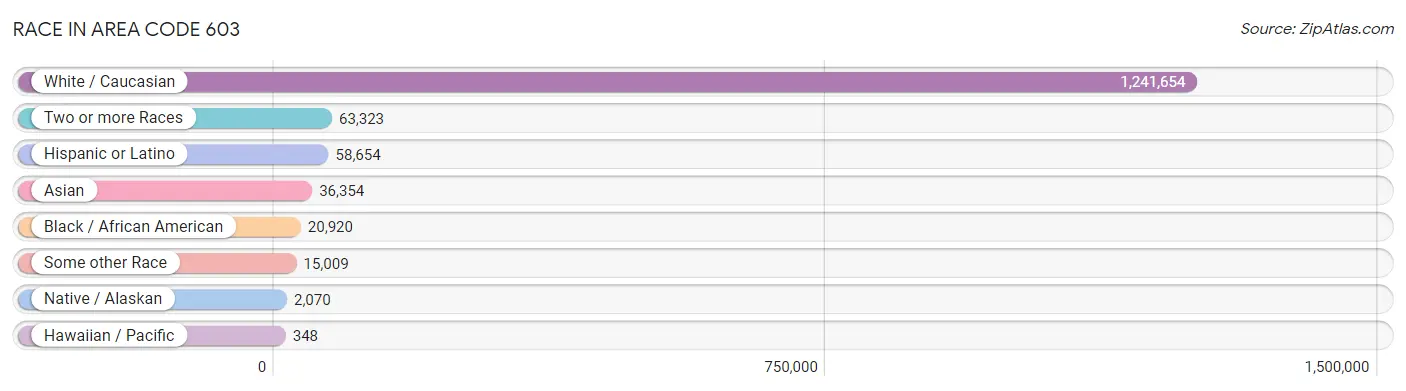
| Race | # Population | % Population |
| Asian | 36,354 | 2.6% |
| Black / African American | 20,920 | 1.5% |
| Hawaiian / Pacific | 348 | 0.0% |
| Hispanic or Latino | 58,654 | 4.3% |
| Native / Alaskan | 2,070 | 0.2% |
| White / Caucasian | 1,241,654 | 90.0% |
| Two or more Races | 63,323 | 4.6% |
| Some other Race | 15,009 | 1.1% |
| Total | 1,379,678 | 100.0% |
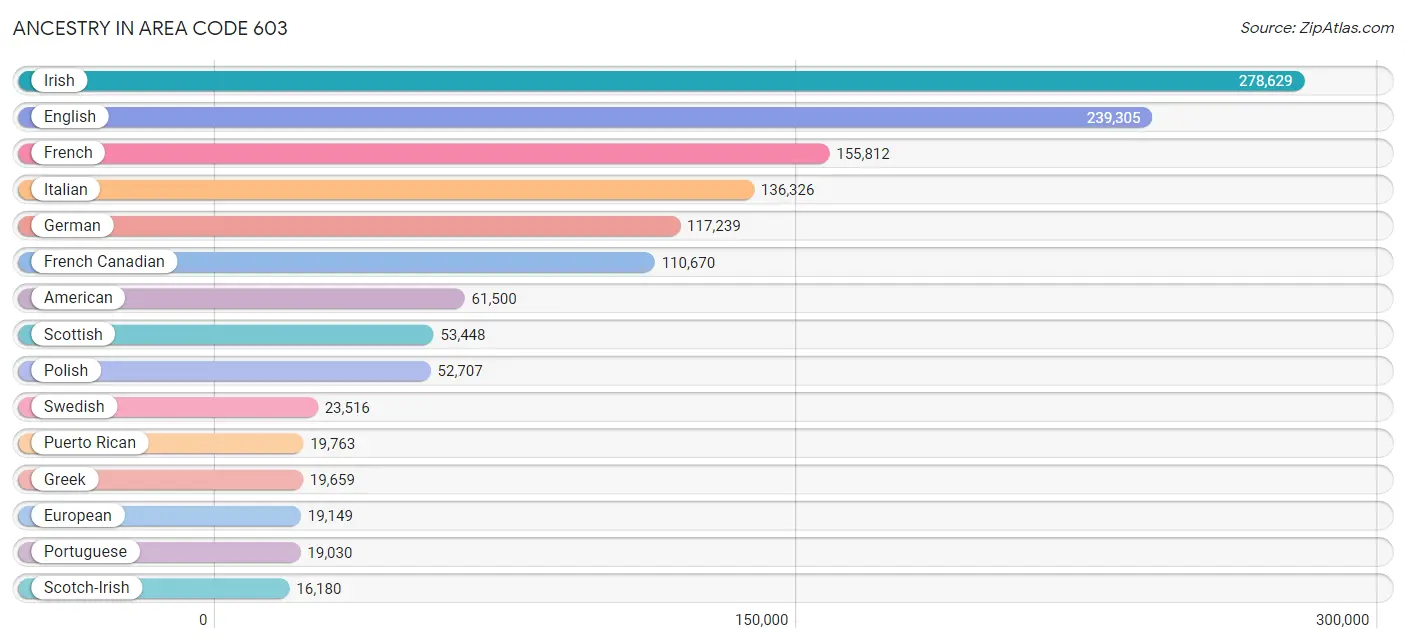
Ancestry in Area Code 603
The most populous ancestries reported in Area Code 603 are Irish (278,629 | 20.2%), English (239,305 | 17.3%), French (155,812 | 11.3%), Italian (136,326 | 9.9%), and German (117,239 | 8.5%), together accounting for 67.2% of all Area Code 603 residents.
| Ancestry | # Population | % Population |
| Afghan | 80 | 0.0% |
| African | 3,061 | 0.2% |
| Alaska Native | 46 | 0.0% |
| Alaskan Athabascan | 61 | 0.0% |
| Albanian | 1,837 | 0.1% |
| Aleut | 29 | 0.0% |
| Alsatian | 49 | 0.0% |
| American | 61,500 | 4.5% |
| Apache | 47 | 0.0% |
| Arab | 8,081 | 0.6% |
| Argentinean | 321 | 0.0% |
| Armenian | 3,639 | 0.3% |
| Assyrian / Chaldean / Syriac | 34 | 0.0% |
| Australian | 429 | 0.0% |
| Austrian | 2,699 | 0.2% |
| Bahamian | 4 | 0.0% |
| Bangladeshi | 20 | 0.0% |
| Barbadian | 171 | 0.0% |
| Basque | 60 | 0.0% |
| Belgian | 1,770 | 0.1% |
| Belizean | 47 | 0.0% |
| Bermudan | 16 | 0.0% |
| Bhutanese | 3,386 | 0.3% |
| Blackfeet | 640 | 0.1% |
| Bolivian | 40 | 0.0% |
| Brazilian | 2,986 | 0.2% |
| British | 9,493 | 0.7% |
| British West Indian | 85 | 0.0% |
| Bulgarian | 614 | 0.0% |
| Burmese | 4,368 | 0.3% |
| Cajun | 144 | 0.0% |
| Cambodian | 12 | 0.0% |
| Canadian | 12,616 | 0.9% |
| Cape Verdean | 669 | 0.1% |
| Carpatho Rusyn | 50 | 0.0% |
| Celtic | 631 | 0.1% |
| Central American | 6,387 | 0.5% |
| Central American Indian | 425 | 0.0% |
| Cherokee | 1,036 | 0.1% |
| Chickasaw | 50 | 0.0% |
| Chilean | 262 | 0.0% |
| Chinese | 13 | 0.0% |
| Chippewa | 205 | 0.0% |
| Choctaw | 106 | 0.0% |
| Colombian | 2,313 | 0.2% |
| Comanche | 3 | 0.0% |
| Costa Rican | 347 | 0.0% |
| Cree | 74 | 0.0% |
| Creek | 30 | 0.0% |
| Croatian | 490 | 0.0% |
| Crow | 3 | 0.0% |
| Cuban | 2,063 | 0.2% |
| Cypriot | 31 | 0.0% |
| Czech | 2,574 | 0.2% |
| Czechoslovakian | 678 | 0.1% |
| Danish | 3,803 | 0.3% |
| Delaware | 57 | 0.0% |
| Dominican | 10,314 | 0.7% |
| Dutch | 10,733 | 0.8% |
| Dutch West Indian | 54 | 0.0% |
| Eastern European | 4,161 | 0.3% |
| Ecuadorian | 497 | 0.0% |
| Egyptian | 298 | 0.0% |
| English | 239,305 | 17.3% |
| Estonian | 215 | 0.0% |
| Ethiopian | 404 | 0.0% |
| European | 19,149 | 1.4% |
| Fijian | 12 | 0.0% |
| Filipino | 230 | 0.0% |
| Finnish | 7,198 | 0.5% |
| French | 155,812 | 11.3% |
| French American Indian | 414 | 0.0% |
| French Canadian | 110,670 | 8.0% |
| German | 117,239 | 8.5% |
| German Russian | 59 | 0.0% |
| Ghanaian | 278 | 0.0% |
| Greek | 19,659 | 1.4% |
| Guamanian / Chamorro | 275 | 0.0% |
| Guatemalan | 1,232 | 0.1% |
| Guyanese | 90 | 0.0% |
| Haitian | 1,753 | 0.1% |
| Honduran | 2,000 | 0.1% |
| Hopi | 148 | 0.0% |
| Hungarian | 4,124 | 0.3% |
| Icelander | 260 | 0.0% |
| Indian (Asian) | 10,056 | 0.7% |
| Indonesian | 364 | 0.0% |
| Inupiat | 90 | 0.0% |
| Iranian | 600 | 0.0% |
| Iraqi | 338 | 0.0% |
| Irish | 278,629 | 20.2% |
| Iroquois | 776 | 0.1% |
| Israeli | 178 | 0.0% |
| Italian | 136,326 | 9.9% |
| Jamaican | 1,780 | 0.1% |
| Japanese | 1,796 | 0.1% |
| Jordanian | 228 | 0.0% |
| Kenyan | 701 | 0.1% |
| Korean | 6,446 | 0.5% |
| Laotian | 934 | 0.1% |
| Latvian | 511 | 0.0% |
| Lebanese | 5,182 | 0.4% |
| Liberian | 373 | 0.0% |
| Lithuanian | 6,605 | 0.5% |
| Luxembourger | 86 | 0.0% |
| Macedonian | 7 | 0.0% |
| Malaysian | 1,111 | 0.1% |
| Maltese | 129 | 0.0% |
| Menominee | 5 | 0.0% |
| Mexican | 9,778 | 0.7% |
| Mexican American Indian | 133 | 0.0% |
| Mongolian | 23 | 0.0% |
| Moroccan | 636 | 0.1% |
| Native Hawaiian | 510 | 0.0% |
| Navajo | 107 | 0.0% |
| New Zealander | 69 | 0.0% |
| Nicaraguan | 620 | 0.0% |
| Nigerian | 345 | 0.0% |
| Northern European | 3,248 | 0.2% |
| Norwegian | 11,385 | 0.8% |
| Osage | 16 | 0.0% |
| Pakistani | 997 | 0.1% |
| Palestinian | 162 | 0.0% |
| Panamanian | 277 | 0.0% |
| Paraguayan | 5 | 0.0% |
| Pennsylvania German | 299 | 0.0% |
| Peruvian | 1,203 | 0.1% |
| Polish | 52,707 | 3.8% |
| Portuguese | 19,030 | 1.4% |
| Potawatomi | 43 | 0.0% |
| Pueblo | 2 | 0.0% |
| Puerto Rican | 19,763 | 1.4% |
| Romanian | 1,473 | 0.1% |
| Russian | 11,473 | 0.8% |
| Salvadoran | 1,911 | 0.1% |
| Samoan | 104 | 0.0% |
| Scandinavian | 4,230 | 0.3% |
| Scotch-Irish | 16,180 | 1.2% |
| Scottish | 53,448 | 3.9% |
| Seminole | 35 | 0.0% |
| Senegalese | 4 | 0.0% |
| Serbian | 550 | 0.0% |
| Sioux | 58 | 0.0% |
| Slavic | 369 | 0.0% |
| Slovak | 1,234 | 0.1% |
| Slovene | 193 | 0.0% |
| Somali | 415 | 0.0% |
| South African | 116 | 0.0% |
| South American | 5,315 | 0.4% |
| South American Indian | 64 | 0.0% |
| Spaniard | 1,305 | 0.1% |
| Spanish | 1,714 | 0.1% |
| Spanish American | 95 | 0.0% |
| Sri Lankan | 4,197 | 0.3% |
| Subsaharan African | 8,310 | 0.6% |
| Sudanese | 821 | 0.1% |
| Swedish | 23,516 | 1.7% |
| Swiss | 2,740 | 0.2% |
| Syrian | 782 | 0.1% |
| Taiwanese | 23 | 0.0% |
| Thai | 11,615 | 0.8% |
| Tlingit-Haida | 3 | 0.0% |
| Trinidadian and Tobagonian | 117 | 0.0% |
| Turkish | 772 | 0.1% |
| U.S. Virgin Islander | 9 | 0.0% |
| Ugandan | 83 | 0.0% |
| Ukrainian | 5,070 | 0.4% |
| Uruguayan | 333 | 0.0% |
| Ute | 2 | 0.0% |
| Venezuelan | 309 | 0.0% |
| Vietnamese | 230 | 0.0% |
| Welsh | 8,720 | 0.6% |
| West Indian | 569 | 0.0% |
| Yakama | 3 | 0.0% |
| Yaqui | 29 | 0.0% |
| Yugoslavian | 1,373 | 0.1% |
| Yuman | 32 | 0.0% |
| Yup'ik | 36 | 0.0% |
| Zimbabwean | 68 | 0.0% | View All 179 Rows |
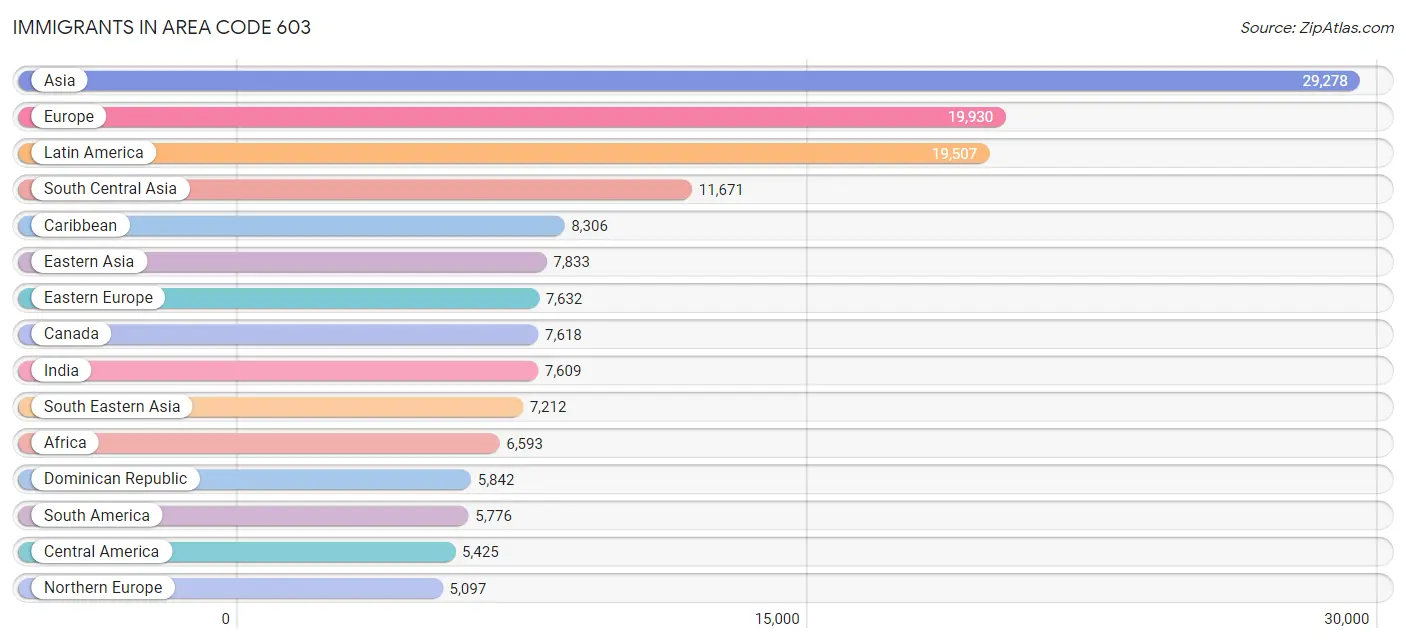
Immigrants in Area Code 603
The most numerous immigrant groups reported in Area Code 603 came from Asia (29,278 | 2.1%), Europe (19,930 | 1.4%), Latin America (19,507 | 1.4%), South Central Asia (11,671 | 0.9%), and Caribbean (8,306 | 0.6%), together accounting for 6.4% of all Area Code 603 residents.
| Immigration Origin | # Population | % Population |
| Afghanistan | 64 | 0.0% |
| Africa | 6,593 | 0.5% |
| Albania | 491 | 0.0% |
| Argentina | 134 | 0.0% |
| Armenia | 67 | 0.0% |
| Asia | 29,278 | 2.1% |
| Australia | 283 | 0.0% |
| Austria | 309 | 0.0% |
| Azores | 182 | 0.0% |
| Bahamas | 5 | 0.0% |
| Bangladesh | 104 | 0.0% |
| Barbados | 21 | 0.0% |
| Belarus | 18 | 0.0% |
| Belgium | 105 | 0.0% |
| Belize | 14 | 0.0% |
| Bosnia and Herzegovina | 1,068 | 0.1% |
| Brazil | 2,964 | 0.2% |
| Bulgaria | 246 | 0.0% |
| Cabo Verde | 26 | 0.0% |
| Cambodia | 419 | 0.0% |
| Cameroon | 207 | 0.0% |
| Canada | 7,618 | 0.5% |
| Caribbean | 8,306 | 0.6% |
| Central America | 5,425 | 0.4% |
| Chile | 97 | 0.0% |
| China | 4,893 | 0.4% |
| Colombia | 1,179 | 0.1% |
| Congo | 238 | 0.0% |
| Costa Rica | 82 | 0.0% |
| Croatia | 297 | 0.0% |
| Cuba | 410 | 0.0% |
| Czechoslovakia | 139 | 0.0% |
| Denmark | 131 | 0.0% |
| Dominica | 79 | 0.0% |
| Dominican Republic | 5,842 | 0.4% |
| Eastern Africa | 2,042 | 0.2% |
| Eastern Asia | 7,833 | 0.6% |
| Eastern Europe | 7,632 | 0.5% |
| Ecuador | 244 | 0.0% |
| Egypt | 300 | 0.0% |
| El Salvador | 1,066 | 0.1% |
| England | 1,607 | 0.1% |
| Ethiopia | 385 | 0.0% |
| Europe | 19,930 | 1.4% |
| Fiji | 2 | 0.0% |
| France | 705 | 0.1% |
| Germany | 2,742 | 0.2% |
| Ghana | 232 | 0.0% |
| Greece | 719 | 0.1% |
| Guatemala | 913 | 0.1% |
| Guyana | 73 | 0.0% |
| Haiti | 735 | 0.1% |
| Honduras | 1,270 | 0.1% |
| Hong Kong | 424 | 0.0% |
| Hungary | 332 | 0.0% |
| India | 7,609 | 0.5% |
| Indonesia | 460 | 0.0% |
| Iran | 382 | 0.0% |
| Iraq | 221 | 0.0% |
| Ireland | 728 | 0.1% |
| Israel | 311 | 0.0% |
| Italy | 661 | 0.1% |
| Jamaica | 897 | 0.1% |
| Japan | 729 | 0.1% |
| Jordan | 241 | 0.0% |
| Kazakhstan | 88 | 0.0% |
| Kenya | 447 | 0.0% |
| Korea | 2,211 | 0.2% |
| Kuwait | 10 | 0.0% |
| Laos | 514 | 0.0% |
| Latin America | 19,507 | 1.4% |
| Latvia | 30 | 0.0% |
| Lebanon | 654 | 0.1% |
| Liberia | 467 | 0.0% |
| Lithuania | 73 | 0.0% |
| Malaysia | 380 | 0.0% |
| Mexico | 1,650 | 0.1% |
| Middle Africa | 940 | 0.1% |
| Moldova | 71 | 0.0% |
| Morocco | 385 | 0.0% |
| Nepal | 2,112 | 0.2% |
| Netherlands | 431 | 0.0% |
| Nicaragua | 357 | 0.0% |
| Nigeria | 464 | 0.0% |
| North Macedonia | 78 | 0.0% |
| Northern Africa | 1,046 | 0.1% |
| Northern Europe | 5,097 | 0.4% |
| Norway | 124 | 0.0% |
| Oceania | 439 | 0.0% |
| Pakistan | 158 | 0.0% |
| Panama | 73 | 0.0% |
| Peru | 686 | 0.1% |
| Philippines | 2,768 | 0.2% |
| Poland | 743 | 0.1% |
| Portugal | 1,058 | 0.1% |
| Romania | 861 | 0.1% |
| Russia | 1,351 | 0.1% |
| Saudi Arabia | 103 | 0.0% |
| Scotland | 708 | 0.1% |
| Senegal | 12 | 0.0% |
| Serbia | 53 | 0.0% |
| Singapore | 9 | 0.0% |
| Somalia | 206 | 0.0% |
| South Africa | 358 | 0.0% |
| South America | 5,776 | 0.4% |
| South Central Asia | 11,671 | 0.9% |
| South Eastern Asia | 7,212 | 0.5% |
| Southern Europe | 2,590 | 0.2% |
| Spain | 146 | 0.0% |
| Sri Lanka | 181 | 0.0% |
| Sudan | 299 | 0.0% |
| Sweden | 244 | 0.0% |
| Switzerland | 319 | 0.0% |
| Syria | 197 | 0.0% |
| Taiwan | 694 | 0.1% |
| Thailand | 527 | 0.0% |
| Trinidad and Tobago | 146 | 0.0% |
| Turkey | 436 | 0.0% |
| Uganda | 127 | 0.0% |
| Ukraine | 936 | 0.1% |
| Uruguay | 131 | 0.0% |
| Uzbekistan | 113 | 0.0% |
| Venezuela | 161 | 0.0% |
| Vietnam | 1,838 | 0.1% |
| Western Africa | 1,493 | 0.1% |
| Western Asia | 2,475 | 0.2% |
| Western Europe | 4,611 | 0.3% |
| Yemen | 15 | 0.0% |
| Zaire | 437 | 0.0% |
| Zimbabwe | 112 | 0.0% | View All 130 Rows |
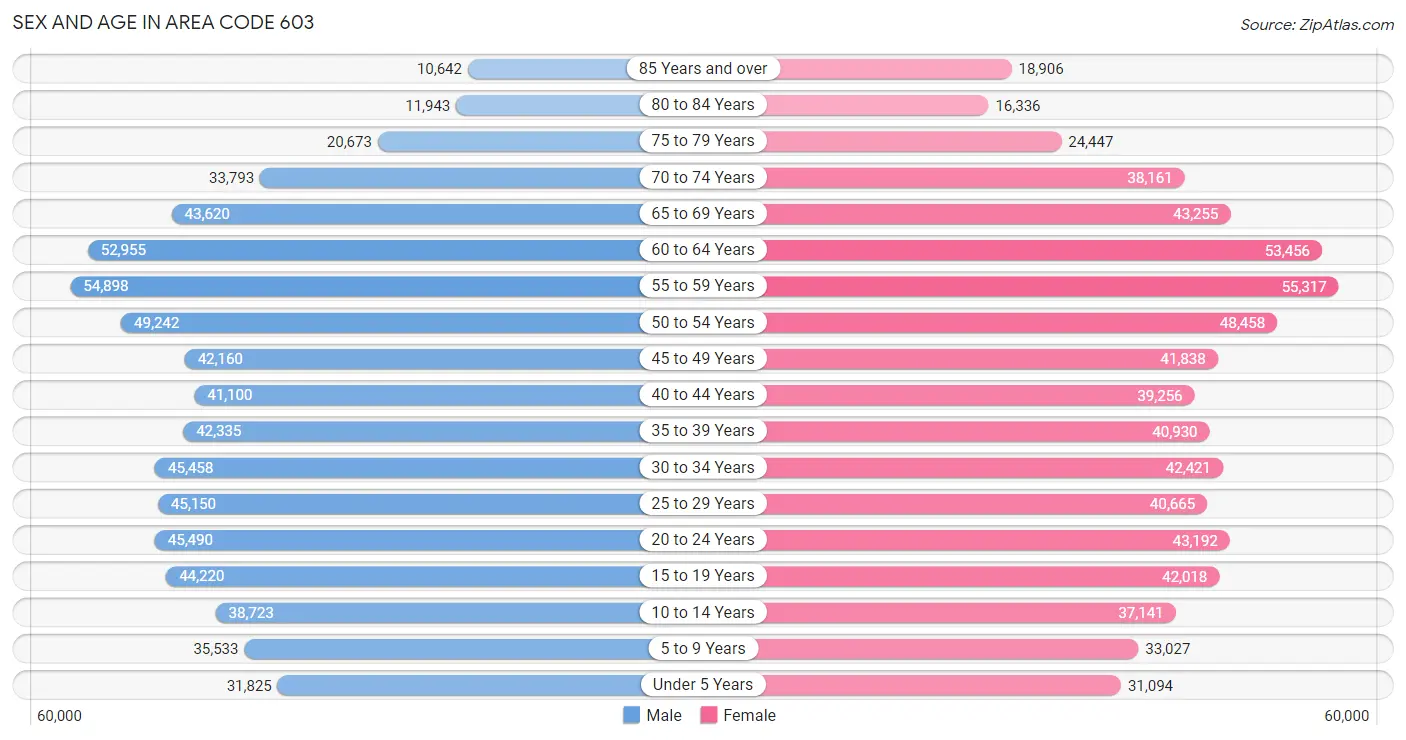
Sex and Age in Area Code 603
Sex and Age in Area Code 603
The most populous age groups in Area Code 603 are 55 to 59 Years (54,898 | 8.0%) for men and 55 to 59 Years (55,317 | 8.0%) for women.
| Age Bracket | Male | Female |
| Under 5 Years | 31,825 (4.6%) | 31,094 (4.5%) |
| 5 to 9 Years | 35,533 (5.1%) | 33,027 (4.8%) |
| 10 to 14 Years | 38,723 (5.6%) | 37,141 (5.4%) |
| 15 to 19 Years | 44,220 (6.4%) | 42,018 (6.1%) |
| 20 to 24 Years | 45,490 (6.6%) | 43,192 (6.3%) |
| 25 to 29 Years | 45,150 (6.6%) | 40,665 (5.9%) |
| 30 to 34 Years | 45,458 (6.6%) | 42,421 (6.1%) |
| 35 to 39 Years | 42,335 (6.1%) | 40,930 (5.9%) |
| 40 to 44 Years | 41,100 (6.0%) | 39,256 (5.7%) |
| 45 to 49 Years | 42,160 (6.1%) | 41,838 (6.1%) |
| 50 to 54 Years | 49,242 (7.1%) | 48,458 (7.0%) |
| 55 to 59 Years | 54,898 (8.0%) | 55,317 (8.0%) |
| 60 to 64 Years | 52,955 (7.7%) | 53,456 (7.7%) |
| 65 to 69 Years | 43,620 (6.3%) | 43,255 (6.3%) |
| 70 to 74 Years | 33,793 (4.9%) | 38,161 (5.5%) |
| 75 to 79 Years | 20,673 (3.0%) | 24,447 (3.5%) |
| 80 to 84 Years | 11,943 (1.7%) | 16,336 (2.4%) |
| 85 Years and over | 10,642 (1.5%) | 18,906 (2.7%) |
| Total | 689,760 (100.0%) | 689,918 (100.0%) |
Families and Households in Area Code 603
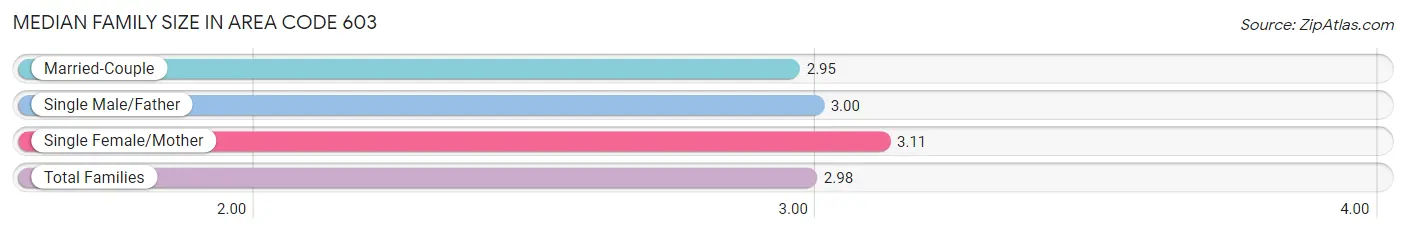
Median Family Size in Area Code 603
The median family size in Area Code 603 is 2.98 persons per family, with single female/mother families (45,996 | 13.0%) accounting for the largest median family size of 3.11401 persons per family. On the other hand, married-couple families (284,067 | 80.3%) represent the smallest median family size with 2.95 persons per family.
| Family Type | # Families | Family Size |
| Married-Couple | 284,067 (80.3%) | 2.95 |
| Single Male/Father | 23,866 (6.7%) | 3.00 |
| Single Female/Mother | 45,996 (13.0%) | 3.11 |
| Total Families | 353,929 (100.0%) | 2.98 |
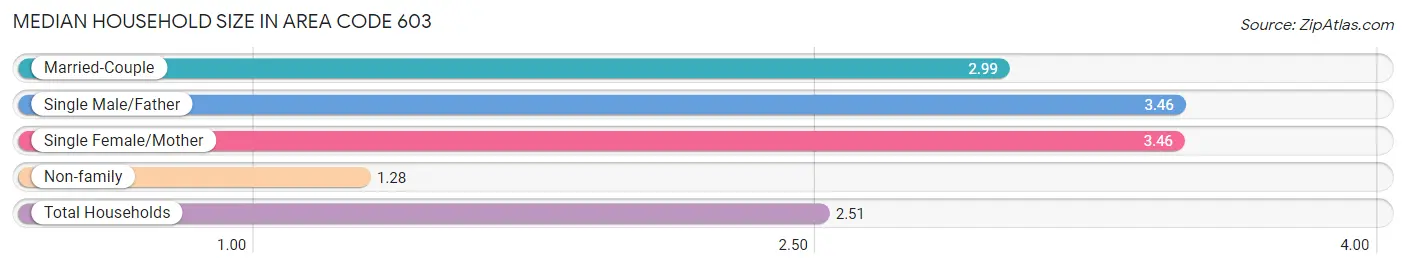
Median Household Size in Area Code 603
The median household size in Area Code 603 is 2.51 persons per household, with single male/father households (23,866 | 4.4%) accounting for the largest median household size of 3.46115 persons per household. non-family households (191,222 | 35.1%) represent the smallest median household size with 1.28 persons per household.
| Household Type | # Households | Household Size |
| Married-Couple | 284,067 (52.1%) | 2.99 |
| Single Male/Father | 23,866 (4.4%) | 3.46 |
| Single Female/Mother | 45,996 (8.4%) | 3.46 |
| Non-family | 191,222 (35.1%) | 1.28 |
| Total Households | 545,151 (100.0%) | 2.51 |
Household Size by Marriage Status in Area Code 603
Out of a total of 545,151 households in Area Code 603, 353,929 (64.9%) are family households, while 191,222 (35.1%) are nonfamily households. The most numerous type of family households are 2-person households, comprising 171,980, and the most common type of nonfamily households are 1-person households, comprising 147,484.
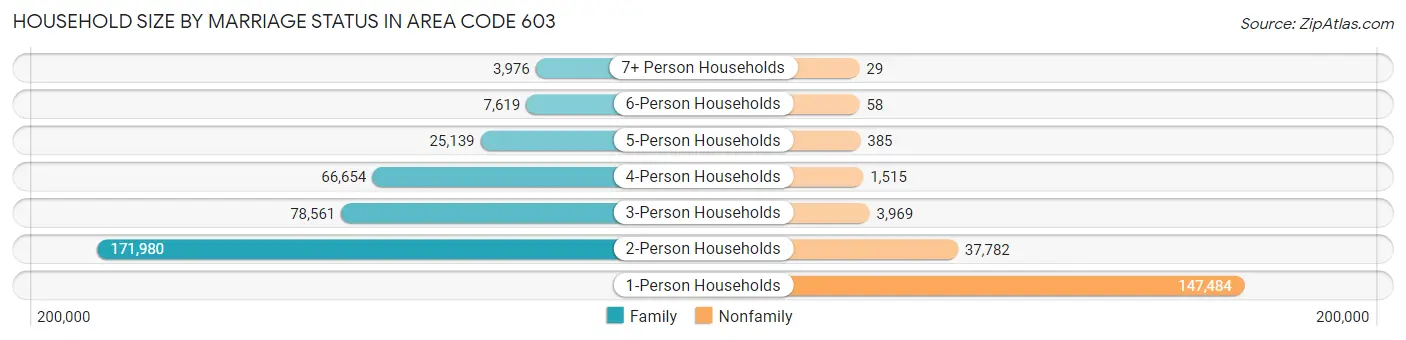
| Household Size | Family Households | Nonfamily Households |
| 1-Person Households | - | 147,484 (27.1%) |
| 2-Person Households | 171,980 (31.6%) | 37,782 (6.9%) |
| 3-Person Households | 78,561 (14.4%) | 3,969 (0.7%) |
| 4-Person Households | 66,654 (12.2%) | 1,515 (0.3%) |
| 5-Person Households | 25,139 (4.6%) | 385 (0.1%) |
| 6-Person Households | 7,619 (1.4%) | 58 (0.0%) |
| 7+ Person Households | 3,976 (0.7%) | 29 (0.0%) |
| Total | 353,929 (64.9%) | 191,222 (35.1%) |
Female Fertility in Area Code 603
Fertility by Age in Area Code 603
Average fertility rate in Area Code 603 is 65.9 births per 1,000 women. Women in the age bracket of 20 to 34 years have the highest fertility rate with 127.6 births per 1,000 women. Women in the age bracket of 20 to 34 years acount for 68.5% of all women with births.
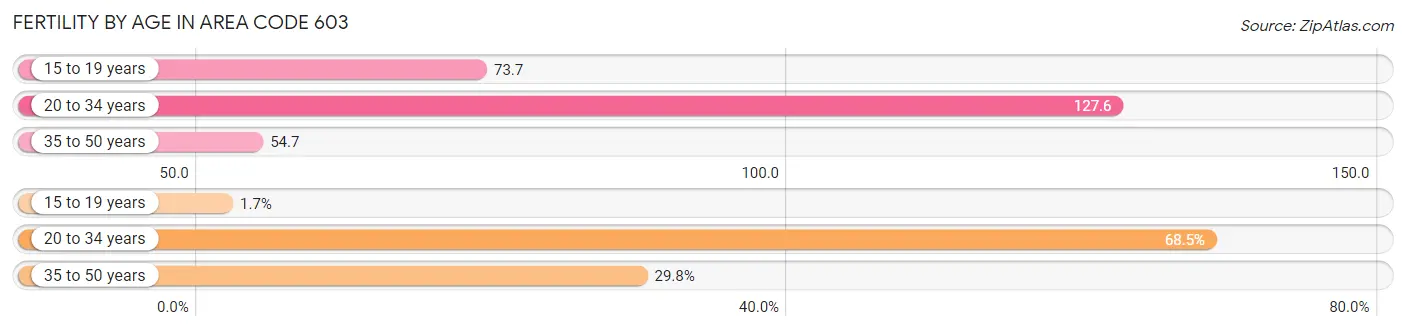
| Age Bracket | Women with Births | Births / 1,000 Women |
| 15 to 19 years | 235 (1.7%) | 73.7 |
| 20 to 34 years | 9,447 (68.5%) | 127.6 |
| 35 to 50 years | 4,116 (29.8%) | 54.7 |
| Total | 13,798 (100.0%) | 65.9 |
Fertility by Age by Marriage Status in Area Code 603
47.8% of women with births (13,798) in Area Code 603 are married. The highest percentage of unmarried women with births falls into 15 to 19 years age bracket with 100.0% of them unmarried at the time of birth, while the lowest percentage of unmarried women with births belong to 20 to 34 years age bracket with 54.4% of them unmarried.
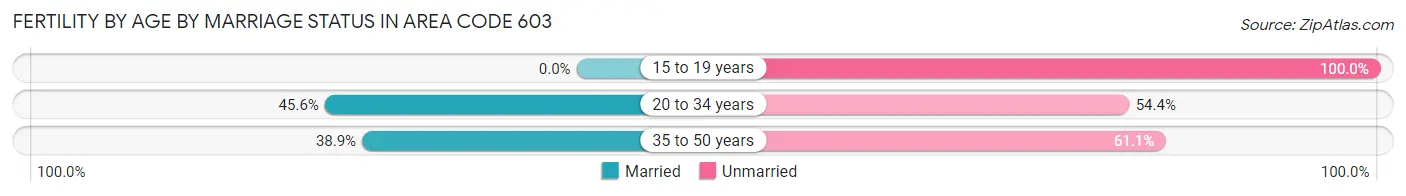
| Age Bracket | Married | Unmarried |
| 15 to 19 years | 0 (0.0%) | 235 (100.0%) |
| 20 to 34 years | 4,311 (45.6%) | 5,136 (54.4%) |
| 35 to 50 years | 1,600 (38.9%) | 2,516 (61.1%) |
| Total | 6,594 (47.8%) | 7,204 (52.2%) |
Fertility by Education in Area Code 603
Average fertility rate in Area Code 603 is 65.9 births per 1,000 women. Women with the education attainment of less than high school have the highest fertility rate of 169.4 births per 1,000 women, while women with the education attainment of college or associate's degree have the lowest fertility at 89.2 births per 1,000 women. Women with the education attainment of bachelor's degree represent 28.1% of all women with births.
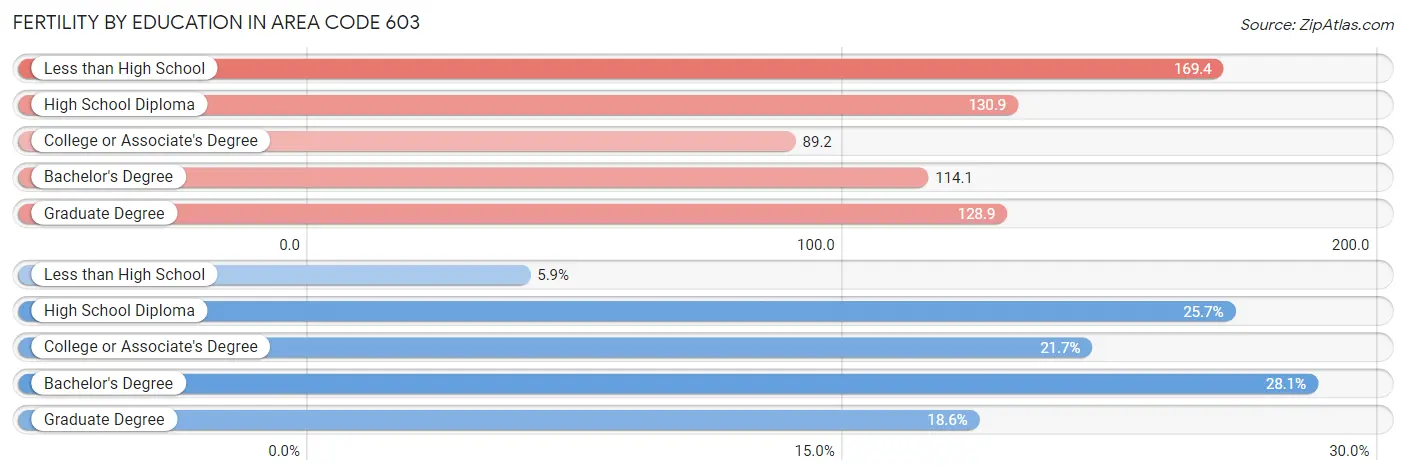
| Educational Attainment | Women with Births | Births / 1,000 Women |
| Less than High School | 818 (5.9%) | 169.4 |
| High School Diploma | 3,551 (25.7%) | 130.9 |
| College or Associate's Degree | 2,997 (21.7%) | 89.2 |
| Bachelor's Degree | 3,872 (28.1%) | 114.1 |
| Graduate Degree | 2,560 (18.5%) | 128.9 |
| Total | 13,798 (100.0%) | 65.9 |
Fertility by Education by Marriage Status in Area Code 603
52.2% of women with births in Area Code 603 are unmarried. Women with the educational attainment of bachelor's degree are most likely to be married with 48.8% of them married at childbirth, while women with the educational attainment of high school diploma are least likely to be married with 79.1% of them unmarried at childbirth.
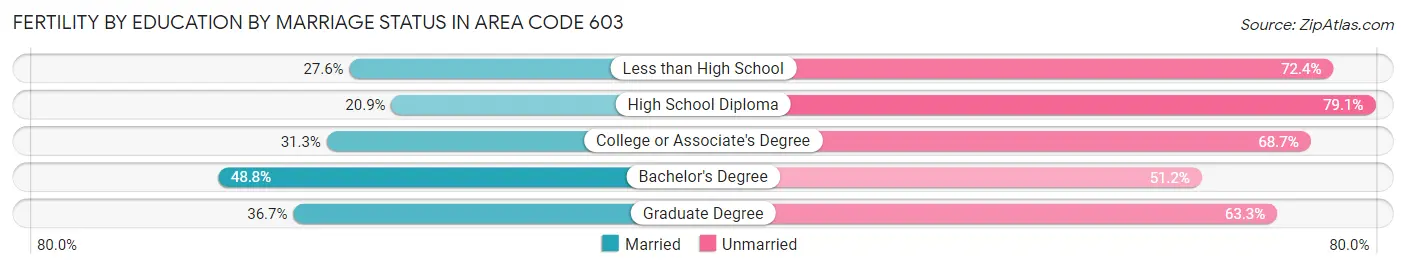
| Educational Attainment | Married | Unmarried |
| Less than High School | 226 (27.6%) | 592 (72.4%) |
| High School Diploma | 741 (20.9%) | 2,810 (79.1%) |
| College or Associate's Degree | 938 (31.3%) | 2,059 (68.7%) |
| Bachelor's Degree | 1,891 (48.8%) | 1,981 (51.2%) |
| Graduate Degree | 939 (36.7%) | 1,621 (63.3%) |
| Total | 6,594 (47.8%) | 7,204 (52.2%) |
Employment Characteristics in Area Code 603
Employment by Class of Employer in Area Code 603
Among the 726,267 employed individuals in Area Code 603, private company employees (477,813 | 65.8%), not-for-profit organizations (85,255 | 11.7%), and local government employees (52,159 | 7.2%) make up the most common classes of employment.
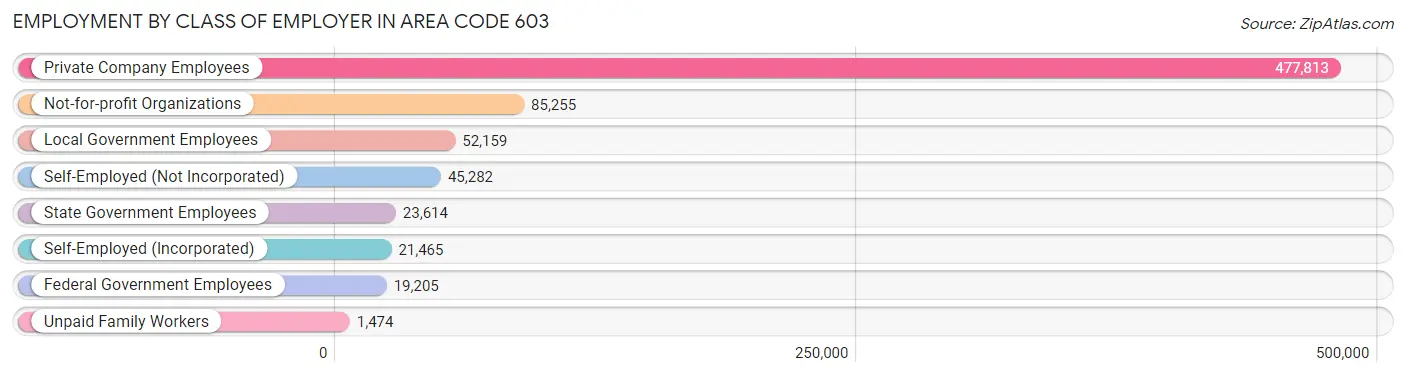
| Employer Class | # Employees | % Employees |
| Private Company Employees | 477,813 | 65.8% |
| Self-Employed (Incorporated) | 21,465 | 3.0% |
| Self-Employed (Not Incorporated) | 45,282 | 6.2% |
| Not-for-profit Organizations | 85,255 | 11.7% |
| Local Government Employees | 52,159 | 7.2% |
| State Government Employees | 23,614 | 3.3% |
| Federal Government Employees | 19,205 | 2.6% |
| Unpaid Family Workers | 1,474 | 0.2% |
| Total | 726,267 | 100.0% |
Employment Status by Age in Area Code 603
According to the labor force statistics for Area Code 603, out of the total population over 16 years of age (1,156,117), 63.7% or 736,100 individuals are in the labor force, with 3.8% or 27,898 of them unemployed. The age group with the highest labor force participation rate is 35 to 44 years, with 86.9% or 142,252 individuals in the labor force. Within the labor force, the 16 to 19 years age range has the highest percentage of unemployed individuals, with 1,912.7% or 722,675 of them being unemployed.
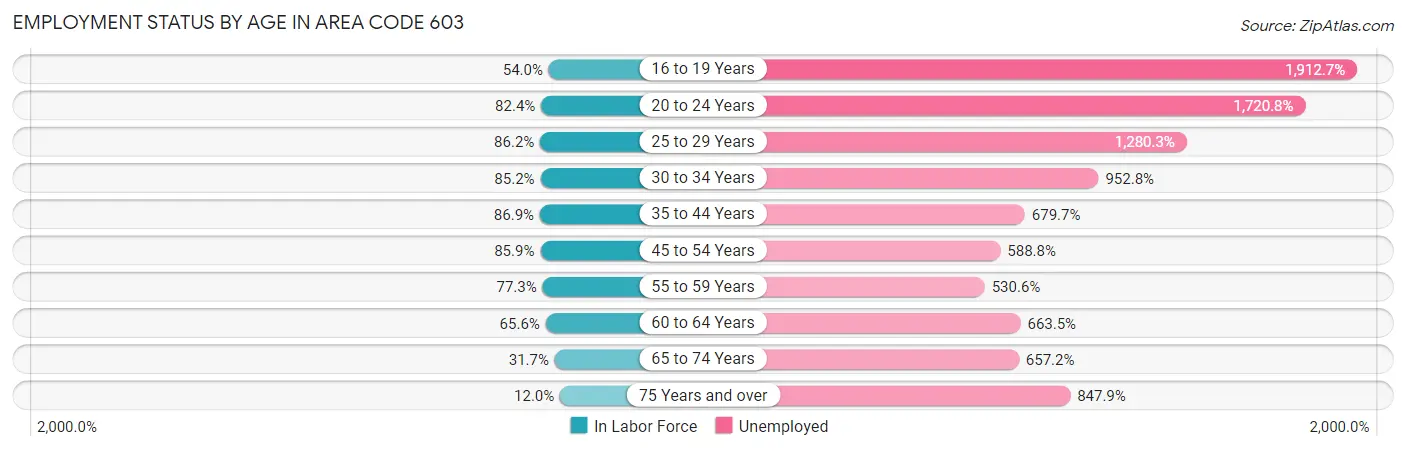
| Age Bracket | In Labor Force | Unemployed |
| 16 to 19 Years | 37,780 (54.0%) | 722,675 (1,912.7%) |
| 20 to 24 Years | 73,070 (82.4%) | 1,257,457 (1,720.8%) |
| 25 to 29 Years | 73,928 (86.2%) | 946,526 (1,280.3%) |
| 30 to 34 Years | 74,826 (85.2%) | 712,971 (952.8%) |
| 35 to 44 Years | 142,253 (86.9%) | 966,887 (679.7%) |
| 45 to 54 Years | 155,987 (85.9%) | 918,457 (588.8%) |
| 55 to 59 Years | 85,227 (77.3%) | 452,225 (530.6%) |
| 60 to 64 Years | 69,841 (65.6%) | 463,375 (663.5%) |
| 65 to 74 Years | 50,291 (31.7%) | 330,473 (657.2%) |
| 75 Years and over | 12,384 (12.0%) | 105,012 (847.9%) |
| Total | 736,140 (63.7%) | 27,918 (3.8%) |
Employment Status by Educational Attainment in Area Code 603
According to labor force statistics for Area Code 603, 80.6% of individuals (593,293) out of the total population between 25 and 64 years of age (735,639) are in the labor force, with 733.1% or 4,349,431 of them being unemployed. The group with the highest labor force participation rate are those with the educational attainment of bachelor's degree or higher, with 86.4% or 256,077 individuals in the labor force. Within the labor force, individuals with less than high school education have the highest percentage of unemployment, with 1,166.5% or 304,888 of them being unemployed.
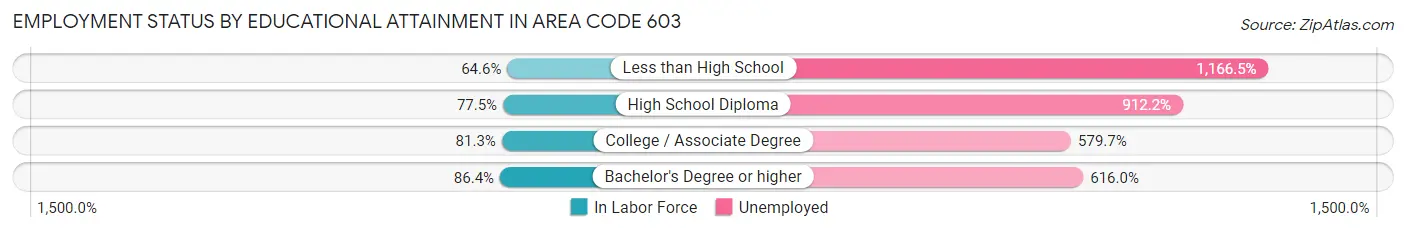
| Educational Attainment | In Labor Force | Unemployed |
| Less than High School | 26,139 (64.6%) | 471,826 (1,166.5%) |
| High School Diploma | 149,313 (77.5%) | 1,757,919 (912.2%) |
| College / Associate Degree | 167,571 (81.2%) | 1,195,521 (579.7%) |
| Bachelor's Degree or higher | 256,089 (86.4%) | 1,824,888 (616.0%) |
| Total | 593,329 (80.6%) | 5,392,970 (733.1%) |
Employment Occupations by Sex in Area Code 603
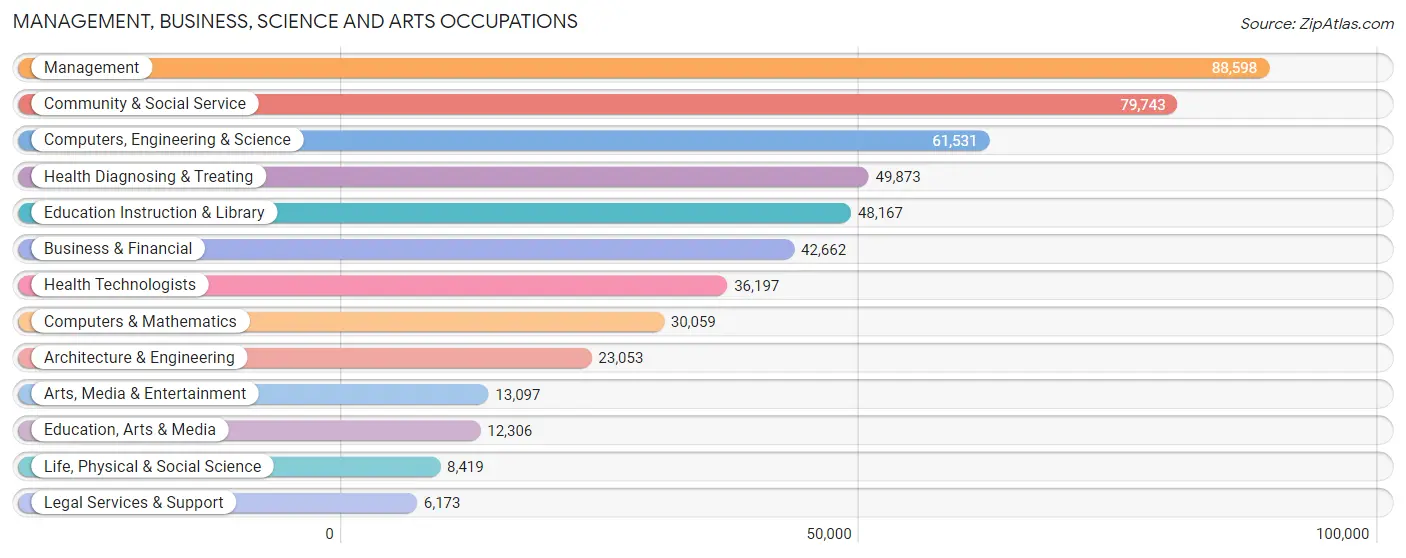
Management, Business, Science and Arts Occupations
The most common Management, Business, Science and Arts occupations in Area Code 603 are Management (88,598 | 12.0%), Community & Social Service (79,743 | 10.8%), Computers, Engineering & Science (61,531 | 8.3%), Health Diagnosing & Treating (49,873 | 6.7%), and Education Instruction & Library (48,167 | 6.5%).
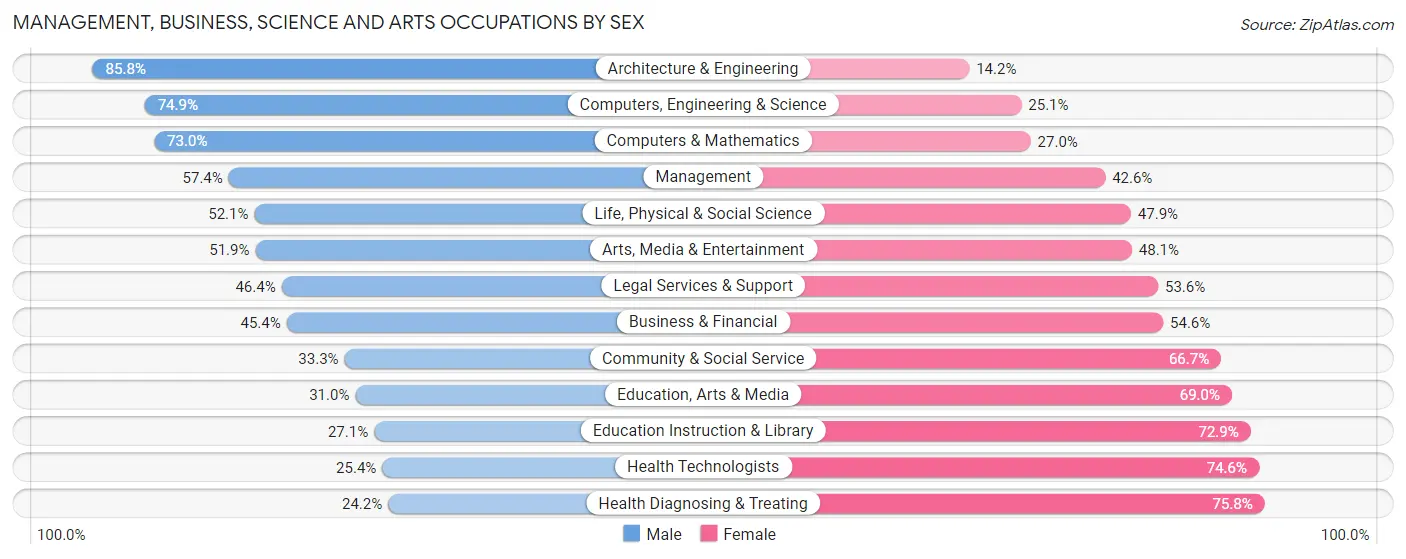
Management, Business, Science and Arts Occupations by Sex
Within the Management, Business, Science and Arts occupations in Area Code 603, the most male-oriented occupations are Architecture & Engineering (85.8%), Computers, Engineering & Science (74.9%), and Computers & Mathematics (73.0%), while the most female-oriented occupations are Health Diagnosing & Treating (75.8%), Health Technologists (74.6%), and Education Instruction & Library (72.9%).
| Occupation | Male | Female |
| Management | 50,890 (57.4%) | 37,708 (42.6%) |
| Business & Financial | 19,351 (45.4%) | 23,311 (54.6%) |
| Computers, Engineering & Science | 46,105 (74.9%) | 15,426 (25.1%) |
| Computers & Mathematics | 21,941 (73.0%) | 8,118 (27.0%) |
| Architecture & Engineering | 19,779 (85.8%) | 3,274 (14.2%) |
| Life, Physical & Social Science | 4,385 (52.1%) | 4,034 (47.9%) |
| Community & Social Service | 26,543 (33.3%) | 53,200 (66.7%) |
| Education, Arts & Media | 3,819 (31.0%) | 8,487 (69.0%) |
| Legal Services & Support | 2,865 (46.4%) | 3,308 (53.6%) |
| Education Instruction & Library | 13,064 (27.1%) | 35,103 (72.9%) |
| Arts, Media & Entertainment | 6,795 (51.9%) | 6,302 (48.1%) |
| Health Diagnosing & Treating | 12,059 (24.2%) | 37,814 (75.8%) |
| Health Technologists | 9,197 (25.4%) | 27,000 (74.6%) |
| Total (Category) | 154,948 (48.1%) | 167,459 (51.9%) |
| Total (Overall) | 390,976 (52.8%) | 350,033 (47.2%) |
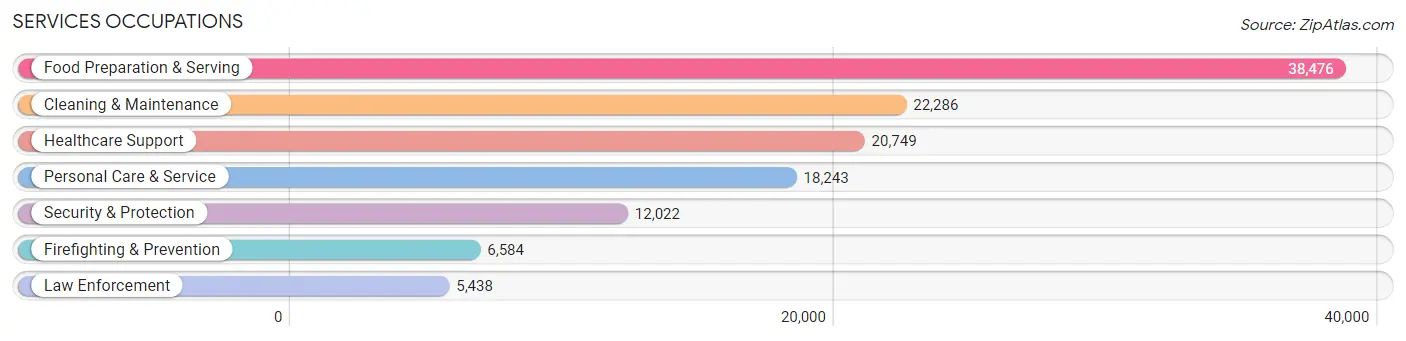
Services Occupations
The most common Services occupations in Area Code 603 are Food Preparation & Serving (38,476 | 5.2%), Cleaning & Maintenance (22,286 | 3.0%), Healthcare Support (20,749 | 2.8%), Personal Care & Service (18,243 | 2.5%), and Security & Protection (12,022 | 1.6%).
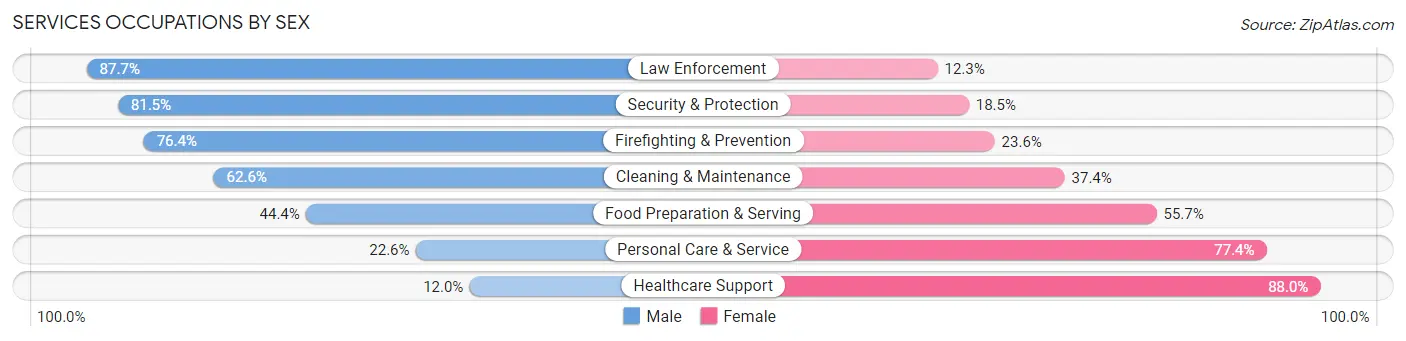
Services Occupations by Sex
Within the Services occupations in Area Code 603, the most male-oriented occupations are Law Enforcement (87.7%), Security & Protection (81.5%), and Firefighting & Prevention (76.4%), while the most female-oriented occupations are Healthcare Support (88.0%), Personal Care & Service (77.4%), and Food Preparation & Serving (55.6%).
| Occupation | Male | Female |
| Healthcare Support | 2,481 (12.0%) | 18,268 (88.0%) |
| Security & Protection | 9,801 (81.5%) | 2,221 (18.5%) |
| Firefighting & Prevention | 5,031 (76.4%) | 1,553 (23.6%) |
| Law Enforcement | 4,770 (87.7%) | 668 (12.3%) |
| Food Preparation & Serving | 17,063 (44.4%) | 21,413 (55.6%) |
| Cleaning & Maintenance | 13,943 (62.6%) | 8,343 (37.4%) |
| Personal Care & Service | 4,127 (22.6%) | 14,116 (77.4%) |
| Total (Category) | 47,415 (42.4%) | 64,361 (57.6%) |
| Total (Overall) | 390,976 (52.8%) | 350,033 (47.2%) |
Sales and Office Occupations
The most common Sales and Office occupations in Area Code 603 are Sales & Related (76,666 | 10.3%), and Office & Administration (76,382 | 10.3%).
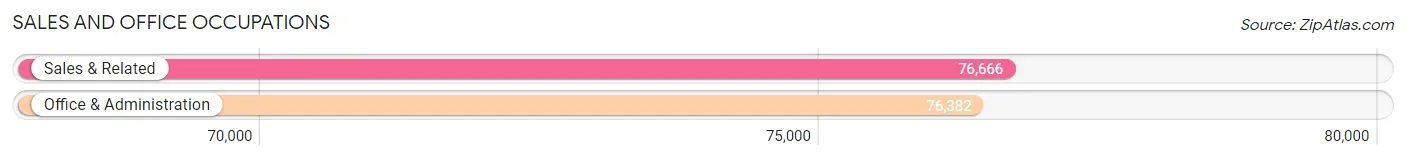
Sales and Office Occupations by Sex
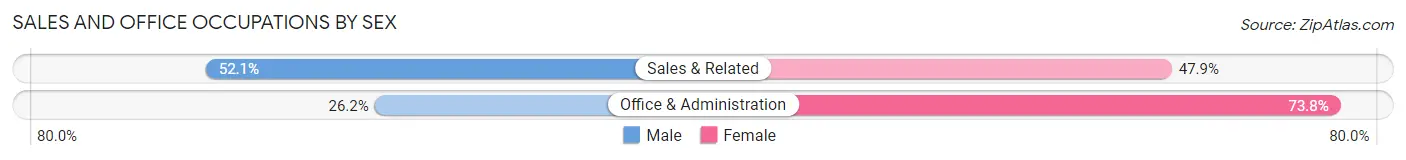
| Occupation | Male | Female |
| Sales & Related | 39,960 (52.1%) | 36,706 (47.9%) |
| Office & Administration | 19,982 (26.2%) | 56,400 (73.8%) |
| Total (Category) | 59,942 (39.2%) | 93,106 (60.8%) |
| Total (Overall) | 390,976 (52.8%) | 350,033 (47.2%) |
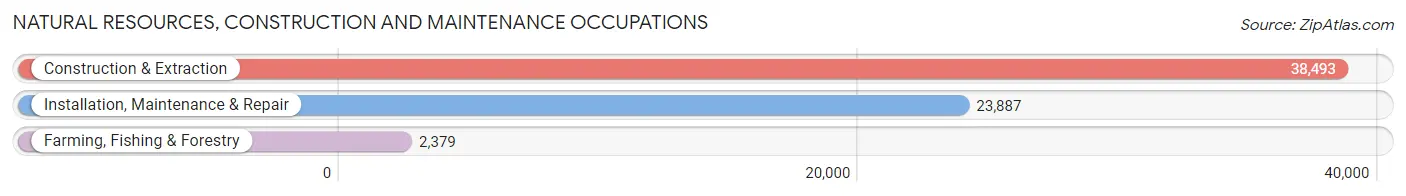
Natural Resources, Construction and Maintenance Occupations
The most common Natural Resources, Construction and Maintenance occupations in Area Code 603 are Construction & Extraction (38,493 | 5.2%), Installation, Maintenance & Repair (23,887 | 3.2%), and Farming, Fishing & Forestry (2,379 | 0.3%).
Natural Resources, Construction and Maintenance Occupations by Sex
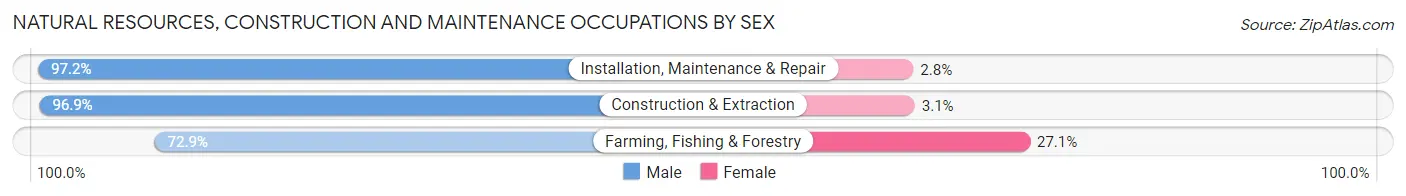
| Occupation | Male | Female |
| Farming, Fishing & Forestry | 1,735 (72.9%) | 644 (27.1%) |
| Construction & Extraction | 37,301 (96.9%) | 1,192 (3.1%) |
| Installation, Maintenance & Repair | 23,217 (97.2%) | 670 (2.8%) |
| Total (Category) | 62,253 (96.1%) | 2,506 (3.9%) |
| Total (Overall) | 390,976 (52.8%) | 350,033 (47.2%) |
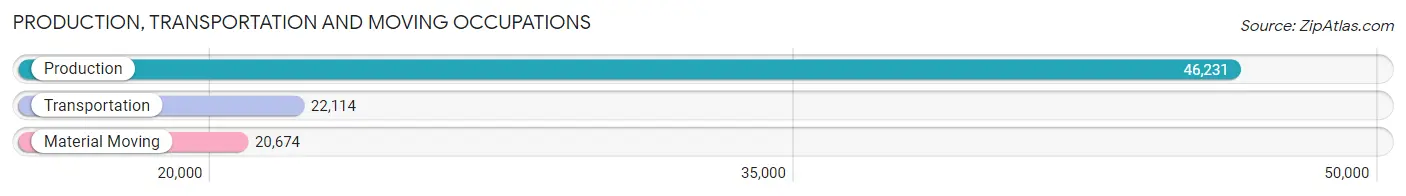
Production, Transportation and Moving Occupations
The most common Production, Transportation and Moving occupations in Area Code 603 are Production (46,231 | 6.2%), Transportation (22,114 | 3.0%), and Material Moving (20,674 | 2.8%).
Production, Transportation and Moving Occupations by Sex
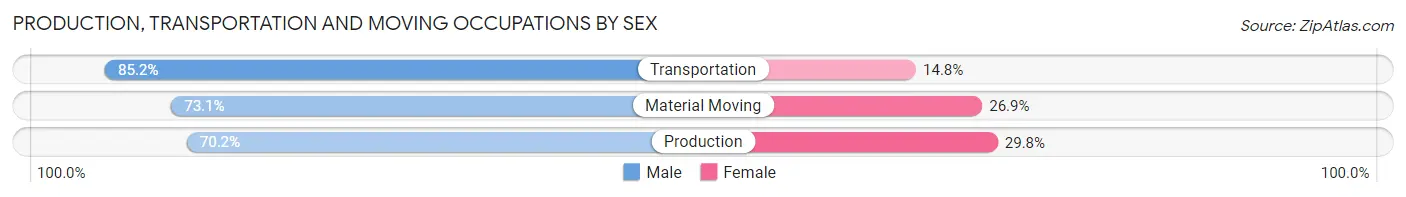
| Occupation | Male | Female |
| Production | 32,465 (70.2%) | 13,766 (29.8%) |
| Transportation | 18,846 (85.2%) | 3,268 (14.8%) |
| Material Moving | 15,107 (73.1%) | 5,567 (26.9%) |
| Total (Category) | 66,418 (74.6%) | 22,601 (25.4%) |
| Total (Overall) | 390,976 (52.8%) | 350,033 (47.2%) |
Employment Industries by Sex in Area Code 603
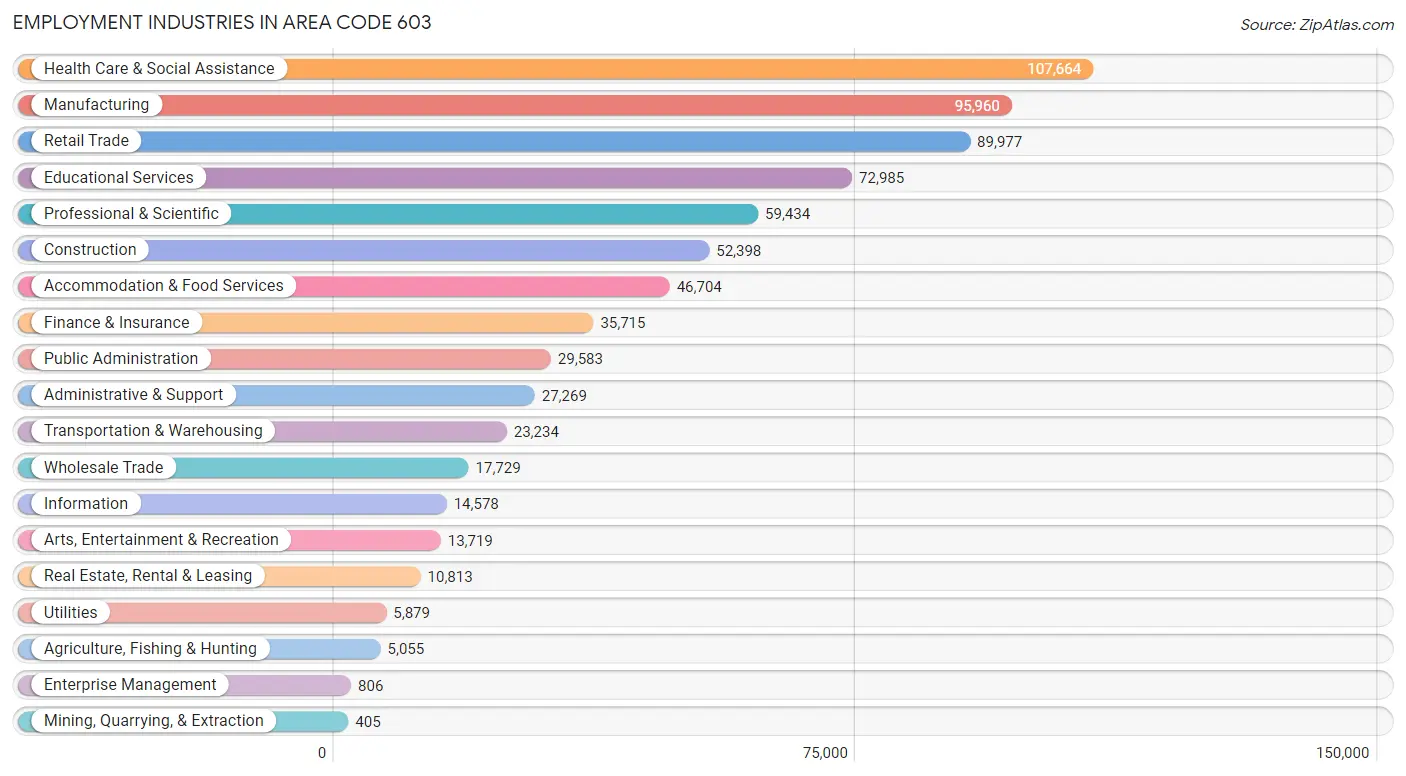
Employment Industries in Area Code 603
The major employment industries in Area Code 603 include Health Care & Social Assistance (107,664 | 14.5%), Manufacturing (95,960 | 13.0%), Retail Trade (89,977 | 12.1%), Educational Services (72,985 | 9.9%), and Professional & Scientific (59,434 | 8.0%).
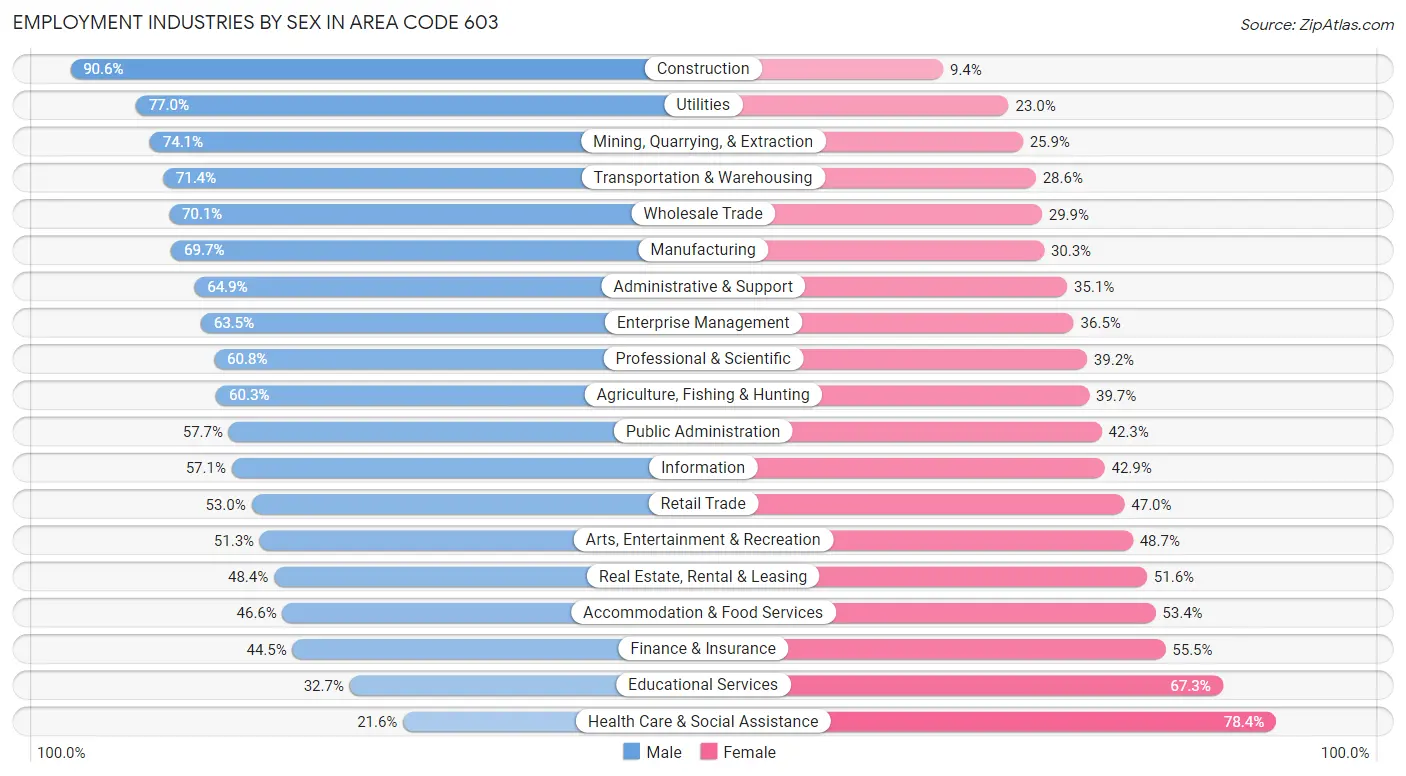
Employment Industries by Sex in Area Code 603
The Area Code 603 industries that see more men than women are Construction (90.6%), Utilities (77.0%), and Mining, Quarrying, & Extraction (74.1%), whereas the industries that tend to have a higher number of women are Health Care & Social Assistance (78.4%), Educational Services (67.3%), and Finance & Insurance (55.5%).
| Industry | Male | Female |
| Agriculture, Fishing & Hunting | 3,050 (60.3%) | 2,005 (39.7%) |
| Mining, Quarrying, & Extraction | 300 (74.1%) | 105 (25.9%) |
| Construction | 47,452 (90.6%) | 4,946 (9.4%) |
| Manufacturing | 66,856 (69.7%) | 29,104 (30.3%) |
| Wholesale Trade | 12,432 (70.1%) | 5,297 (29.9%) |
| Retail Trade | 47,718 (53.0%) | 42,259 (47.0%) |
| Transportation & Warehousing | 16,582 (71.4%) | 6,652 (28.6%) |
| Utilities | 4,526 (77.0%) | 1,353 (23.0%) |
| Information | 8,329 (57.1%) | 6,249 (42.9%) |
| Finance & Insurance | 15,906 (44.5%) | 19,809 (55.5%) |
| Real Estate, Rental & Leasing | 5,229 (48.4%) | 5,584 (51.6%) |
| Professional & Scientific | 36,124 (60.8%) | 23,310 (39.2%) |
| Enterprise Management | 512 (63.5%) | 294 (36.5%) |
| Administrative & Support | 17,690 (64.9%) | 9,579 (35.1%) |
| Educational Services | 23,867 (32.7%) | 49,118 (67.3%) |
| Health Care & Social Assistance | 23,297 (21.6%) | 84,367 (78.4%) |
| Arts, Entertainment & Recreation | 7,036 (51.3%) | 6,683 (48.7%) |
| Accommodation & Food Services | 21,763 (46.6%) | 24,941 (53.4%) |
| Public Administration | 17,079 (57.7%) | 12,504 (42.3%) |
| Total | 390,976 (52.8%) | 350,033 (47.2%) |
Education in Area Code 603
School Enrollment in Area Code 603
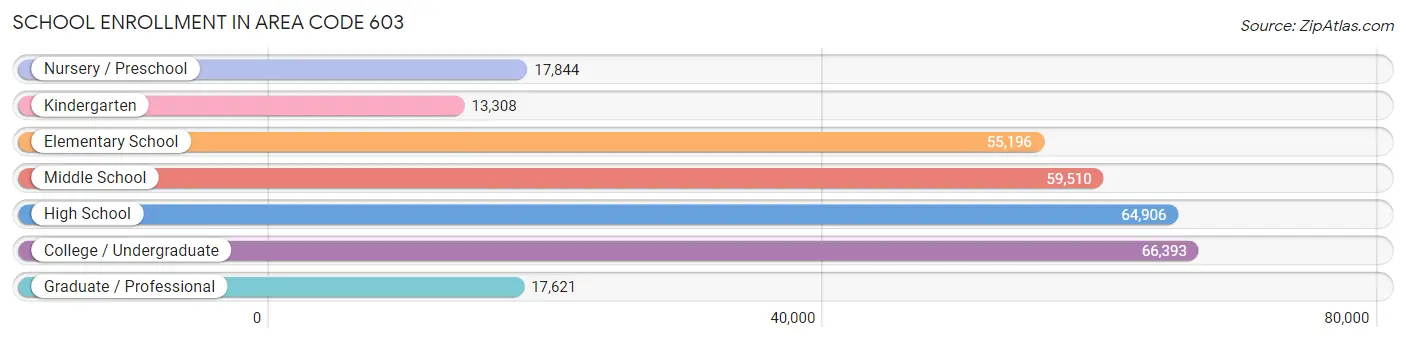
The most common levels of schooling among the 294,778 students in Area Code 603 are college / undergraduate (66,393 | 22.5%), high school (64,906 | 22.0%), and middle school (59,510 | 20.2%).
| School Level | # Students | % Students |
| Nursery / Preschool | 17,844 | 6.0% |
| Kindergarten | 13,308 | 4.5% |
| Elementary School | 55,196 | 18.7% |
| Middle School | 59,510 | 20.2% |
| High School | 64,906 | 22.0% |
| College / Undergraduate | 66,393 | 22.5% |
| Graduate / Professional | 17,621 | 6.0% |
| Total | 294,778 | 100.0% |
School Enrollment by Age by Funding Source in Area Code 603
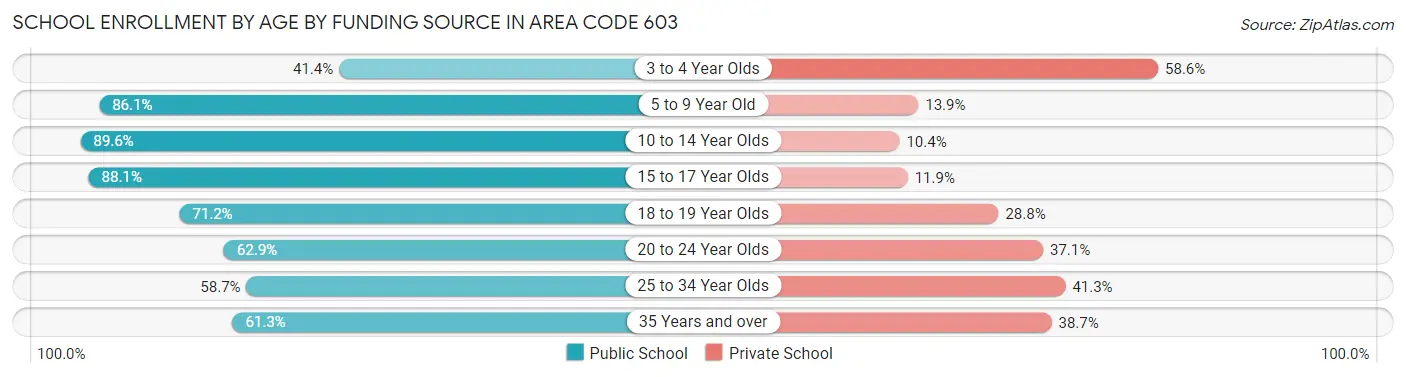
Out of a total of 294,778 students who are enrolled in schools in Area Code 603, 64,227 (21.8%) attend a private institution, while the remaining 230,551 (78.2%) are enrolled in public schools. The age group of 3 to 4 year olds has the highest likelihood of being enrolled in private schools, with 8,348 (58.6% in the age bracket) enrolled. Conversely, the age group of 10 to 14 year olds has the lowest likelihood of being enrolled in a private school, with 66,591 (89.6% in the age bracket) attending a public institution.
| Age Bracket | Public School | Private School |
| 3 to 4 Year Olds | 5,906 (41.4%) | 8,348 (58.6%) |
| 5 to 9 Year Old | 55,362 (86.1%) | 8,941 (13.9%) |
| 10 to 14 Year Olds | 66,591 (89.6%) | 7,730 (10.4%) |
| 15 to 17 Year Olds | 41,947 (88.1%) | 5,680 (11.9%) |
| 18 to 19 Year Olds | 20,345 (71.2%) | 8,244 (28.8%) |
| 20 to 24 Year Olds | 21,500 (62.9%) | 12,697 (37.1%) |
| 25 to 34 Year Olds | 9,141 (58.7%) | 6,433 (41.3%) |
| 35 Years and over | 9,751 (61.3%) | 6,162 (38.7%) |
| Total | 230,553 (78.2%) | 64,227 (21.8%) |
Educational Attainment by Field of Study in Area Code 603
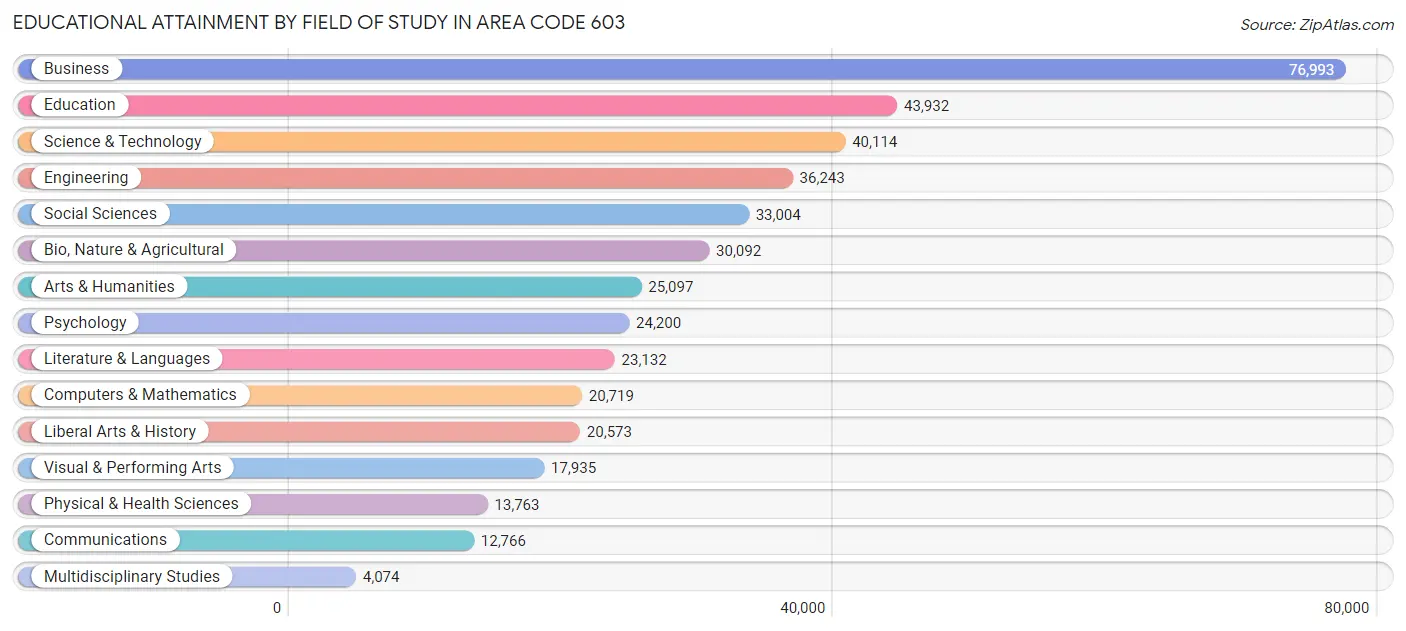
Business (76,993 | 18.2%), education (43,932 | 10.4%), science & technology (40,114 | 9.5%), engineering (36,243 | 8.6%), and social sciences (33,004 | 7.8%) are the most common fields of study among 422,637 individuals in Area Code 603 who have obtained a bachelor's degree or higher.
| Field of Study | # Graduates | % Graduates |
| Computers & Mathematics | 20,719 | 4.9% |
| Bio, Nature & Agricultural | 30,092 | 7.1% |
| Physical & Health Sciences | 13,763 | 3.3% |
| Psychology | 24,200 | 5.7% |
| Social Sciences | 33,004 | 7.8% |
| Engineering | 36,243 | 8.6% |
| Multidisciplinary Studies | 4,074 | 1.0% |
| Science & Technology | 40,114 | 9.5% |
| Business | 76,993 | 18.2% |
| Education | 43,932 | 10.4% |
| Literature & Languages | 23,132 | 5.5% |
| Liberal Arts & History | 20,573 | 4.9% |
| Visual & Performing Arts | 17,935 | 4.2% |
| Communications | 12,766 | 3.0% |
| Arts & Humanities | 25,097 | 5.9% |
| Total | 422,637 | 100.0% |
Transportation & Commute in Area Code 603
Vehicle Availability by Sex in Area Code 603
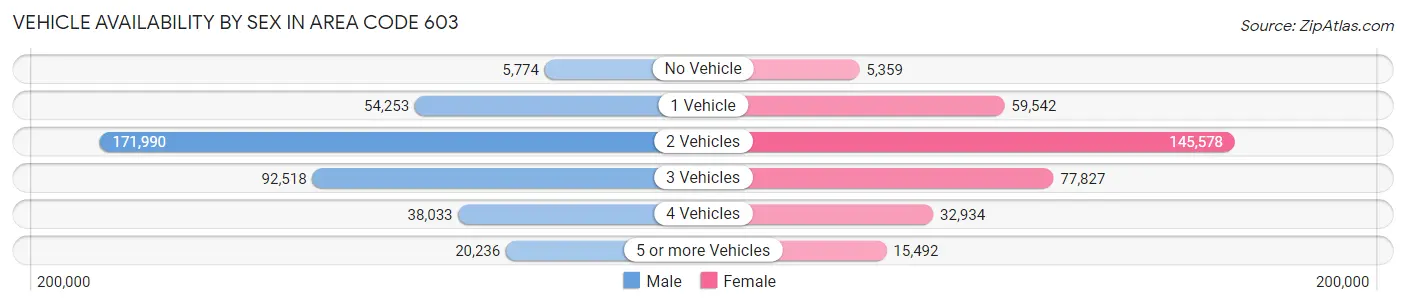
The most prevalent vehicle ownership categories in Area Code 603 are males with 2 vehicles (171,990, accounting for 44.9%) and females with 2 vehicles (145,578, making up 51.1%).
| Vehicles Available | Male | Female |
| No Vehicle | 5,774 (1.5%) | 5,359 (1.6%) |
| 1 Vehicle | 54,253 (14.2%) | 59,542 (17.7%) |
| 2 Vehicles | 171,990 (44.9%) | 145,578 (43.2%) |
| 3 Vehicles | 92,518 (24.2%) | 77,827 (23.1%) |
| 4 Vehicles | 38,033 (9.9%) | 32,934 (9.8%) |
| 5 or more Vehicles | 20,236 (5.3%) | 15,492 (4.6%) |
| Total | 382,804 (100.0%) | 336,732 (100.0%) |
Commute Time in Area Code 603
The most frequently occuring commute durations in Area Code 603 are 10 to 14 minutes (87,146 commuters, 13.8%), 15 to 19 minutes (86,767 commuters, 13.8%), and 20 to 24 minutes (83,893 commuters, 13.3%).
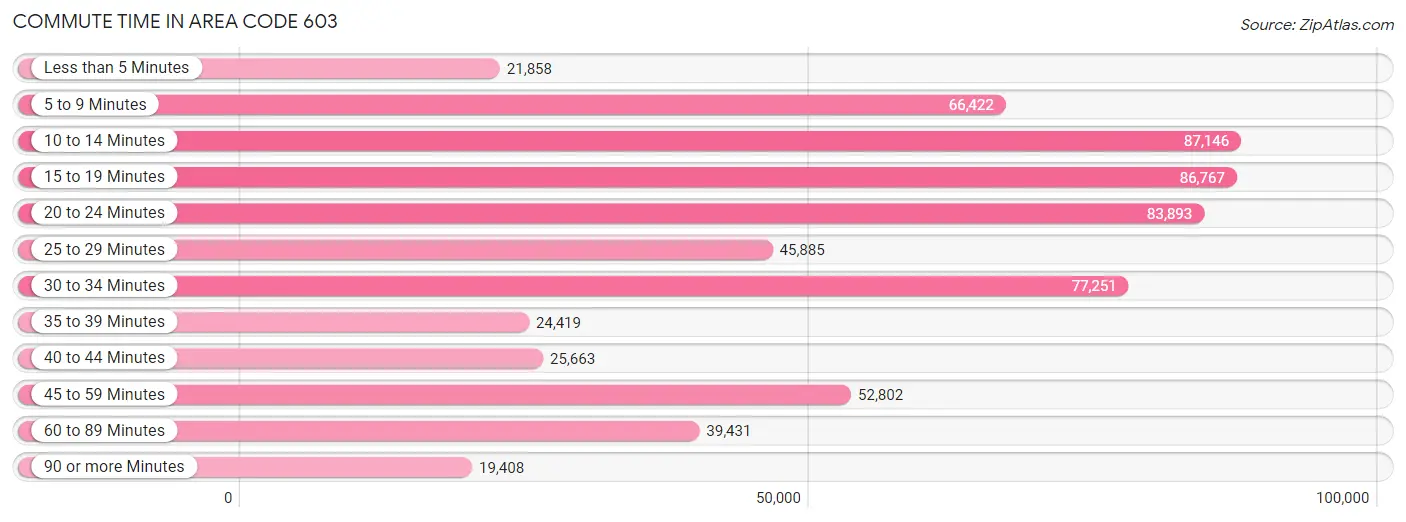
| Commute Time | # Commuters | % Commuters |
| Less than 5 Minutes | 21,858 | 3.5% |
| 5 to 9 Minutes | 66,422 | 10.5% |
| 10 to 14 Minutes | 87,146 | 13.8% |
| 15 to 19 Minutes | 86,767 | 13.8% |
| 20 to 24 Minutes | 83,893 | 13.3% |
| 25 to 29 Minutes | 45,885 | 7.3% |
| 30 to 34 Minutes | 77,251 | 12.2% |
| 35 to 39 Minutes | 24,419 | 3.9% |
| 40 to 44 Minutes | 25,663 | 4.1% |
| 45 to 59 Minutes | 52,802 | 8.4% |
| 60 to 89 Minutes | 39,431 | 6.2% |
| 90 or more Minutes | 19,408 | 3.1% |
Commute Time by Sex in Area Code 603
The most common commute times in Area Code 603 are 20 to 24 minutes (43,073 commuters, 12.9%) for males and 15 to 19 minutes (44,484 commuters, 15.0%) for females.
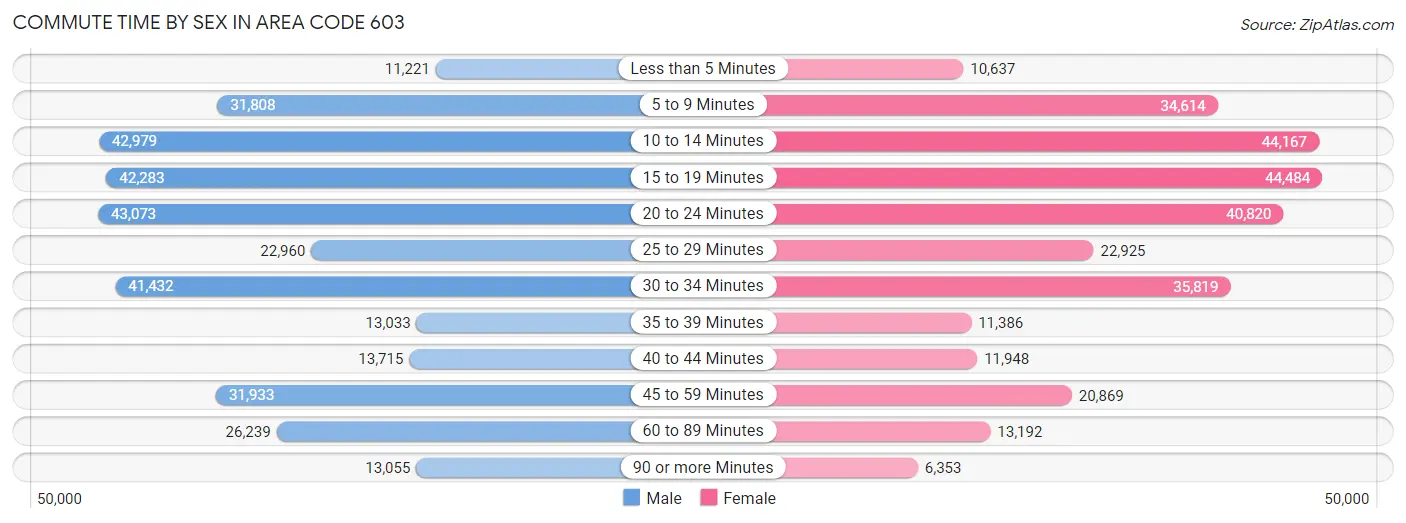
| Commute Time | Male | Female |
| Less than 5 Minutes | 11,221 (3.4%) | 10,637 (3.6%) |
| 5 to 9 Minutes | 31,808 (9.5%) | 34,614 (11.7%) |
| 10 to 14 Minutes | 42,979 (12.9%) | 44,167 (14.9%) |
| 15 to 19 Minutes | 42,283 (12.7%) | 44,484 (15.0%) |
| 20 to 24 Minutes | 43,073 (12.9%) | 40,820 (13.7%) |
| 25 to 29 Minutes | 22,960 (6.9%) | 22,925 (7.7%) |
| 30 to 34 Minutes | 41,432 (12.4%) | 35,819 (12.0%) |
| 35 to 39 Minutes | 13,033 (3.9%) | 11,386 (3.8%) |
| 40 to 44 Minutes | 13,715 (4.1%) | 11,948 (4.0%) |
| 45 to 59 Minutes | 31,933 (9.6%) | 20,869 (7.0%) |
| 60 to 89 Minutes | 26,239 (7.9%) | 13,192 (4.4%) |
| 90 or more Minutes | 13,055 (3.9%) | 6,353 (2.1%) |
Time of Departure to Work by Sex in Area Code 603
The most frequent times of departure to work in Area Code 603 are 7:00 AM to 7:29 AM (46,420, 13.9%) for males and 7:00 AM to 7:29 AM (46,080, 15.5%) for females.
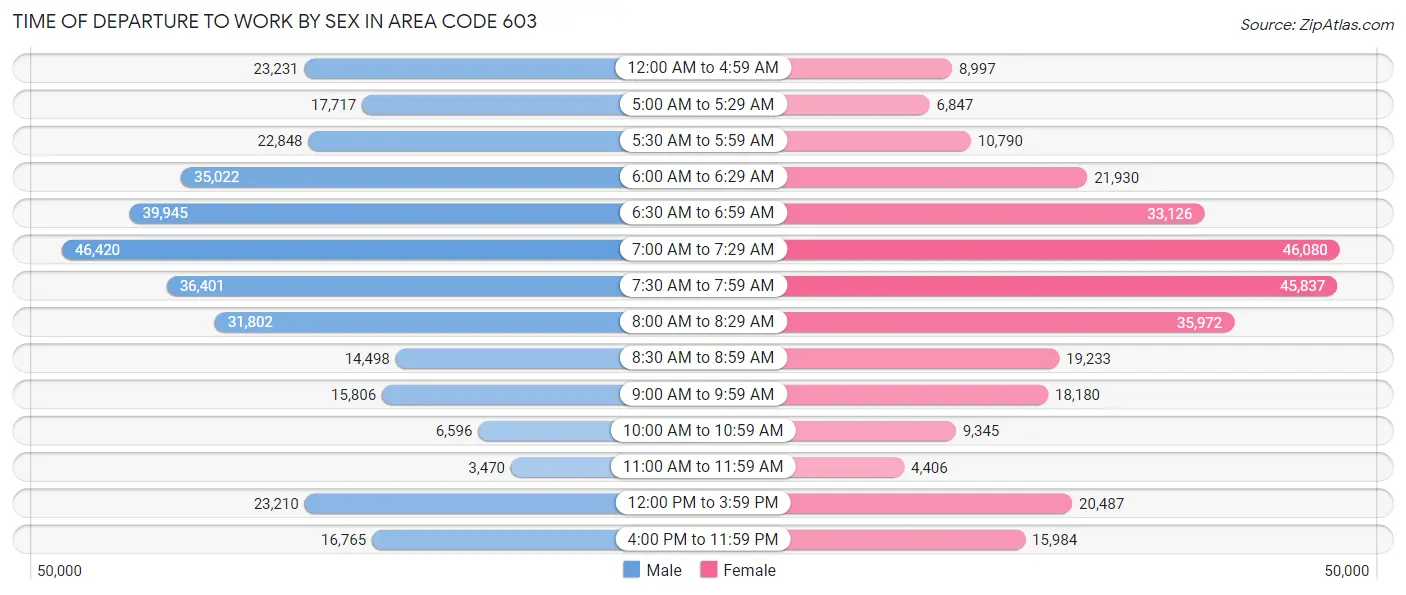
| Time of Departure | Male | Female |
| 12:00 AM to 4:59 AM | 23,231 (7.0%) | 8,997 (3.0%) |
| 5:00 AM to 5:29 AM | 17,717 (5.3%) | 6,847 (2.3%) |
| 5:30 AM to 5:59 AM | 22,848 (6.9%) | 10,790 (3.6%) |
| 6:00 AM to 6:29 AM | 35,022 (10.5%) | 21,930 (7.4%) |
| 6:30 AM to 6:59 AM | 39,945 (12.0%) | 33,126 (11.2%) |
| 7:00 AM to 7:29 AM | 46,420 (13.9%) | 46,080 (15.5%) |
| 7:30 AM to 7:59 AM | 36,401 (10.9%) | 45,837 (15.4%) |
| 8:00 AM to 8:29 AM | 31,802 (9.5%) | 35,972 (12.1%) |
| 8:30 AM to 8:59 AM | 14,498 (4.3%) | 19,233 (6.5%) |
| 9:00 AM to 9:59 AM | 15,806 (4.7%) | 18,180 (6.1%) |
| 10:00 AM to 10:59 AM | 6,596 (2.0%) | 9,345 (3.1%) |
| 11:00 AM to 11:59 AM | 3,470 (1.0%) | 4,406 (1.5%) |
| 12:00 PM to 3:59 PM | 23,210 (7.0%) | 20,487 (6.9%) |
| 4:00 PM to 11:59 PM | 16,765 (5.0%) | 15,984 (5.4%) |
| Total | 333,731 (100.0%) | 297,214 (100.0%) |
Housing Occupancy in Area Code 603
Occupancy by Ownership in Area Code 603
Of the total 545,151 dwellings in Area Code 603, owner-occupied units account for 393,973 (72.3%), while renter-occupied units make up 151,178 (27.7%).
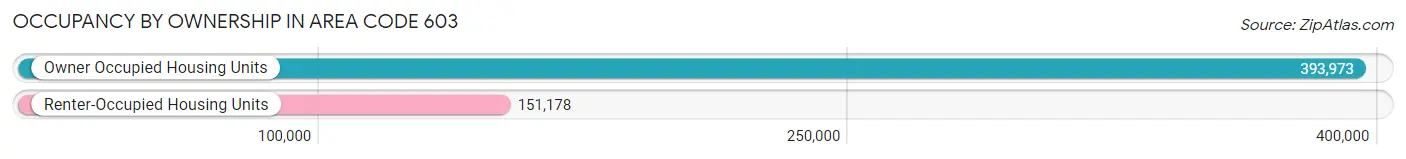
| Occupancy | # Housing Units | % Housing Units |
| Owner Occupied Housing Units | 393,973 | 72.3% |
| Renter-Occupied Housing Units | 151,178 | 27.7% |
| Total Occupied Housing Units | 545,151 | 100.0% |
Occupancy by Household Size in Area Code 603
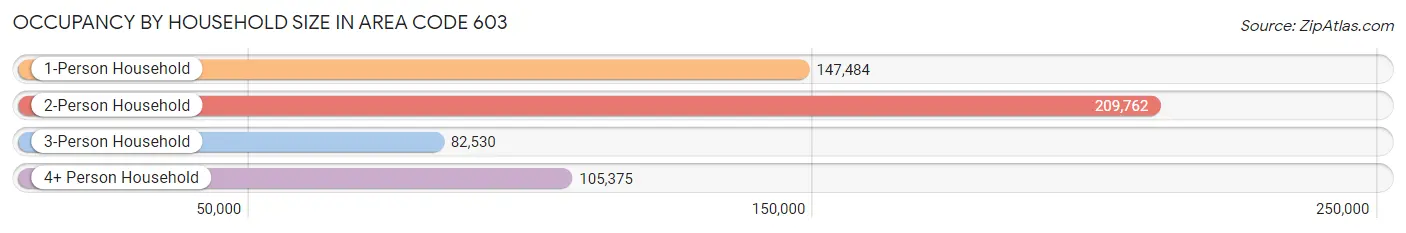
| Household Size | # Housing Units | % Housing Units |
| 1-Person Household | 147,484 | 27.1% |
| 2-Person Household | 209,762 | 38.5% |
| 3-Person Household | 82,530 | 15.1% |
| 4+ Person Household | 105,375 | 19.3% |
| Total Housing Units | 545,151 | 100.0% |
Occupancy by Ownership by Household Size in Area Code 603
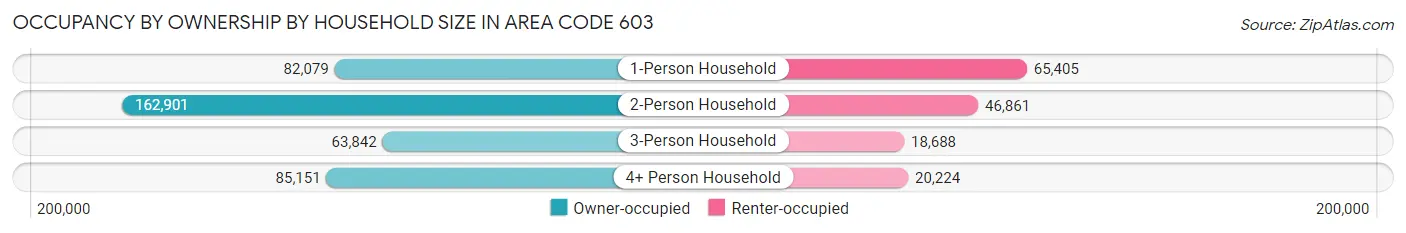
| Household Size | Owner-occupied | Renter-occupied |
| 1-Person Household | 82,079 (55.6%) | 65,405 (44.4%) |
| 2-Person Household | 162,901 (77.7%) | 46,861 (22.3%) |
| 3-Person Household | 63,842 (77.4%) | 18,688 (22.6%) |
| 4+ Person Household | 85,151 (80.8%) | 20,224 (19.2%) |
| Total Housing Units | 393,973 (72.3%) | 151,178 (27.7%) |
Occupancy by Educational Attainment in Area Code 603
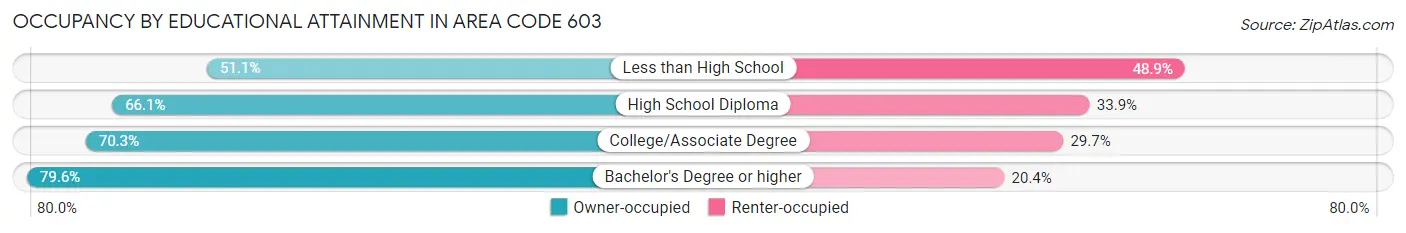
| Household Size | Owner-occupied | Renter-occupied |
| Less than High School | 13,781 (51.1%) | 13,208 (48.9%) |
| High School Diploma | 85,083 (66.1%) | 43,643 (33.9%) |
| College/Associate Degree | 113,005 (70.3%) | 47,754 (29.7%) |
| Bachelor's Degree or higher | 182,104 (79.6%) | 46,573 (20.4%) |
Occupancy by Age of Householder in Area Code 603
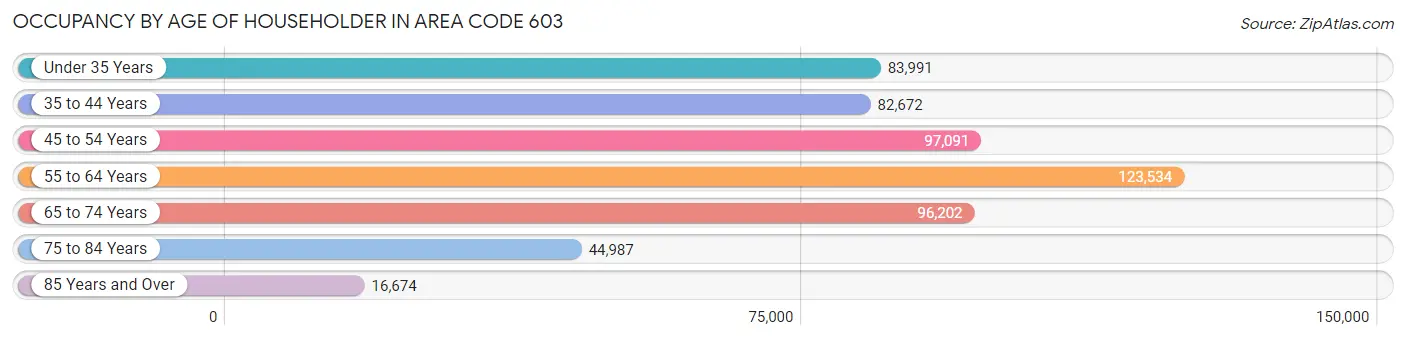
| Age Bracket | # Households | % Households |
| Under 35 Years | 83,991 | 15.4% |
| 35 to 44 Years | 82,672 | 15.2% |
| 45 to 54 Years | 97,091 | 17.8% |
| 55 to 64 Years | 123,534 | 22.7% |
| 65 to 74 Years | 96,202 | 17.6% |
| 75 to 84 Years | 44,987 | 8.3% |
| 85 Years and Over | 16,674 | 3.1% |
| Total | 545,151 | 100.0% |
Housing Finances in Area Code 603
Median Income by Occupancy in Area Code 603
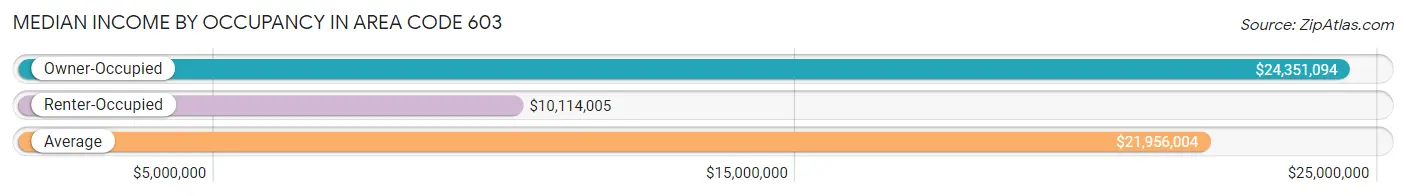
| Occupancy Type | # Households | Median Income |
| Owner-Occupied | 393,973 (72.3%) | $24,351,094 |
| Renter-Occupied | 151,178 (27.7%) | $10,114,005 |
| Average | 545,151 (100.0%) | $21,956,004 |
Occupancy by Householder Income Bracket in Area Code 603
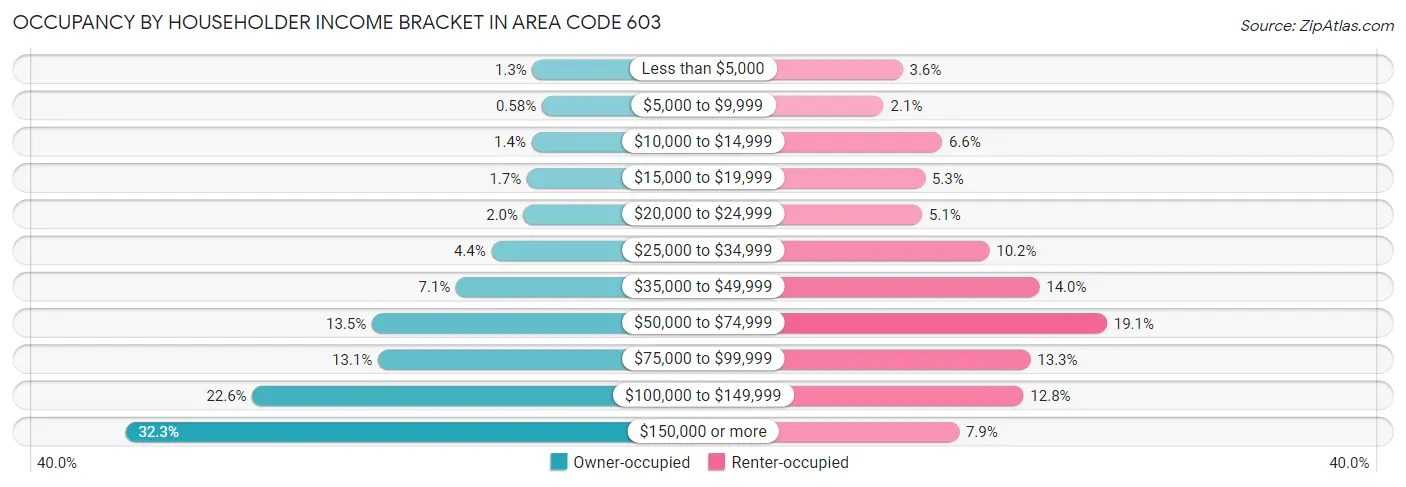
| Income Bracket | Owner-occupied | Renter-occupied |
| Less than $5,000 | 5,101 (1.3%) | 5,408 (3.6%) |
| $5,000 to $9,999 | 2,278 (0.6%) | 3,240 (2.1%) |
| $10,000 to $14,999 | 5,372 (1.4%) | 9,967 (6.6%) |
| $15,000 to $19,999 | 6,761 (1.7%) | 8,002 (5.3%) |
| $20,000 to $24,999 | 7,719 (2.0%) | 7,671 (5.1%) |
| $25,000 to $34,999 | 17,409 (4.4%) | 15,409 (10.2%) |
| $35,000 to $49,999 | 28,039 (7.1%) | 21,166 (14.0%) |
| $50,000 to $74,999 | 53,293 (13.5%) | 28,934 (19.1%) |
| $75,000 to $99,999 | 51,508 (13.1%) | 20,139 (13.3%) |
| $100,000 to $149,999 | 89,206 (22.6%) | 19,335 (12.8%) |
| $150,000 or more | 127,287 (32.3%) | 11,907 (7.9%) |
| Total | 393,973 (100.0%) | 151,178 (100.0%) |
Monthly Housing Cost Tiers in Area Code 603
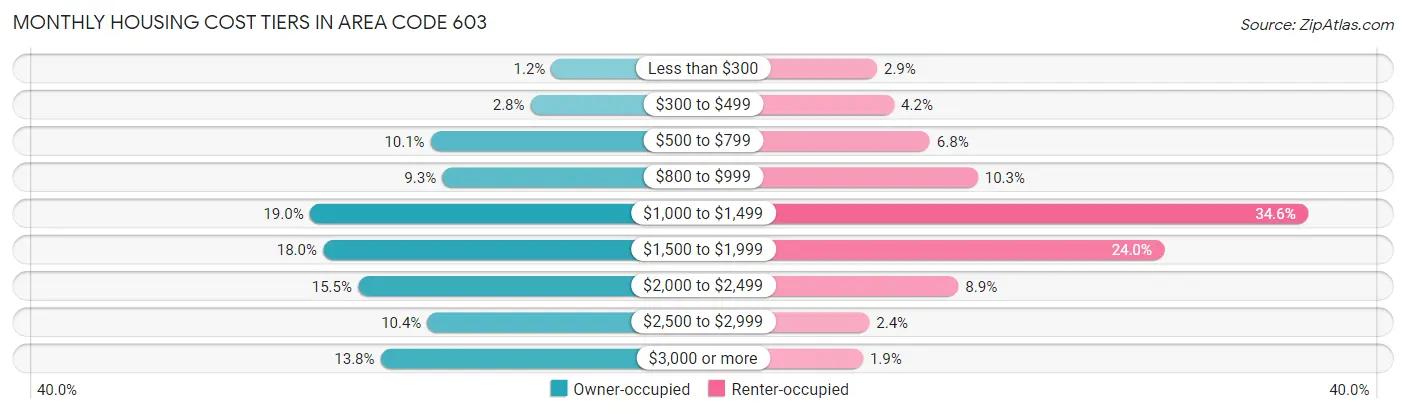
| Monthly Cost | Owner-occupied | Renter-occupied |
| Less than $300 | 4,793 (1.2%) | 4,421 (2.9%) |
| $300 to $499 | 10,823 (2.8%) | 6,316 (4.2%) |
| $500 to $799 | 39,837 (10.1%) | 10,290 (6.8%) |
| $800 to $999 | 36,495 (9.3%) | 15,626 (10.3%) |
| $1,000 to $1,499 | 74,917 (19.0%) | 52,333 (34.6%) |
| $1,500 to $1,999 | 71,087 (18.0%) | 36,344 (24.0%) |
| $2,000 to $2,499 | 60,904 (15.5%) | 13,465 (8.9%) |
| $2,500 to $2,999 | 40,762 (10.3%) | 3,553 (2.4%) |
| $3,000 or more | 54,355 (13.8%) | 2,836 (1.9%) |
| Total | 393,973 (100.0%) | 151,178 (100.0%) |
Physical Housing Characteristics in Area Code 603
Housing Structures in Area Code 603
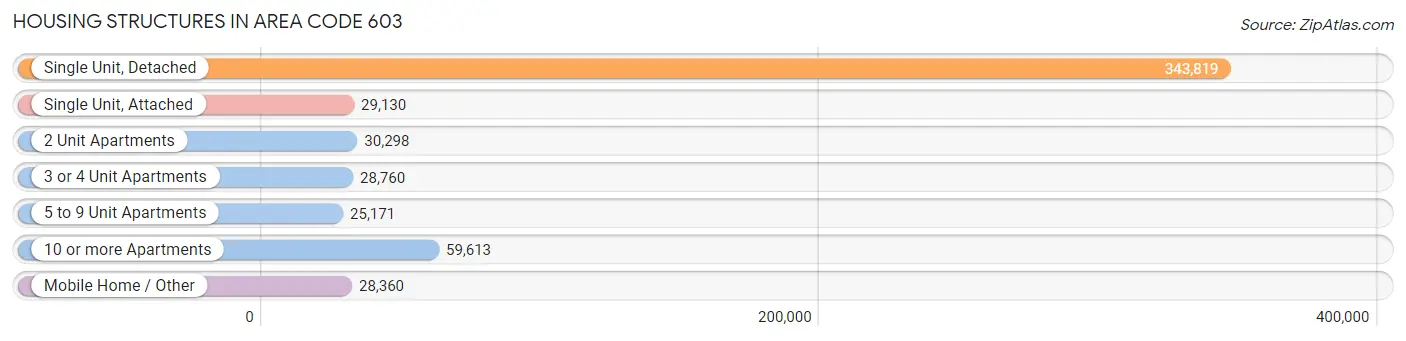
| Structure Type | # Housing Units | % Housing Units |
| Single Unit, Detached | 343,819 | 63.1% |
| Single Unit, Attached | 29,130 | 5.3% |
| 2 Unit Apartments | 30,298 | 5.6% |
| 3 or 4 Unit Apartments | 28,760 | 5.3% |
| 5 to 9 Unit Apartments | 25,171 | 4.6% |
| 10 or more Apartments | 59,613 | 10.9% |
| Mobile Home / Other | 28,360 | 5.2% |
| Total | 545,151 | 100.0% |
Housing Structures by Occupancy in Area Code 603
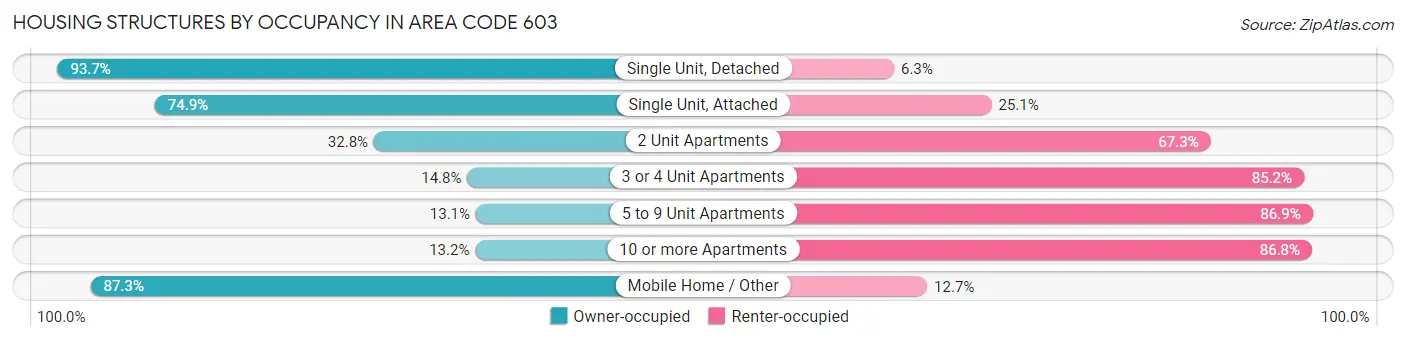
| Structure Type | Owner-occupied | Renter-occupied |
| Single Unit, Detached | 322,039 (93.7%) | 21,780 (6.3%) |
| Single Unit, Attached | 21,818 (74.9%) | 7,312 (25.1%) |
| 2 Unit Apartments | 9,923 (32.8%) | 20,375 (67.2%) |
| 3 or 4 Unit Apartments | 4,248 (14.8%) | 24,512 (85.2%) |
| 5 to 9 Unit Apartments | 3,301 (13.1%) | 21,870 (86.9%) |
| 10 or more Apartments | 7,889 (13.2%) | 51,724 (86.8%) |
| Mobile Home / Other | 24,755 (87.3%) | 3,605 (12.7%) |
| Total | 393,973 (72.3%) | 151,178 (27.7%) |
Housing Structures by Number of Rooms in Area Code 603
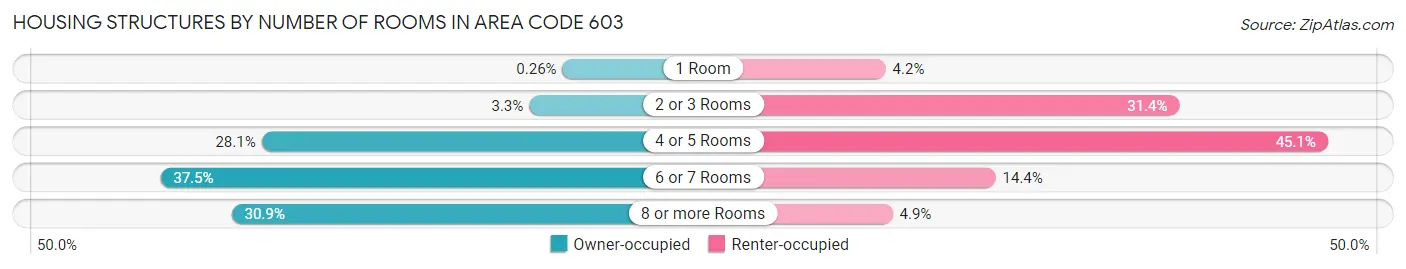
| Number of Rooms | Owner-occupied | Renter-occupied |
| 1 Room | 1,042 (0.3%) | 6,390 (4.2%) |
| 2 or 3 Rooms | 13,167 (3.3%) | 47,450 (31.4%) |
| 4 or 5 Rooms | 110,666 (28.1%) | 68,195 (45.1%) |
| 6 or 7 Rooms | 147,528 (37.4%) | 21,776 (14.4%) |
| 8 or more Rooms | 121,570 (30.9%) | 7,367 (4.9%) |
| Total | 393,973 (100.0%) | 151,178 (100.0%) |
Housing Structure by Heating Type in Area Code 603
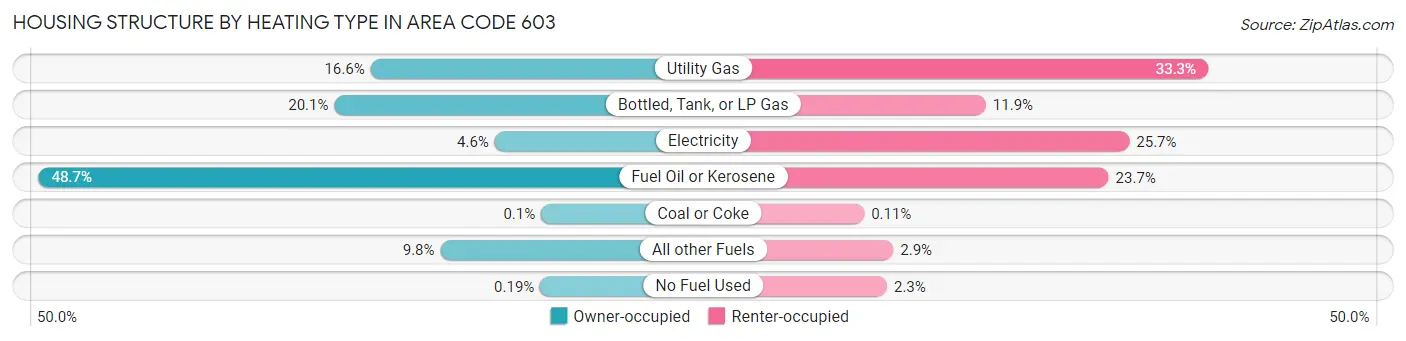
| Heating Type | Owner-occupied | Renter-occupied |
| Utility Gas | 65,327 (16.6%) | 50,350 (33.3%) |
| Bottled, Tank, or LP Gas | 79,099 (20.1%) | 17,948 (11.9%) |
| Electricity | 18,045 (4.6%) | 38,897 (25.7%) |
| Fuel Oil or Kerosene | 191,651 (48.6%) | 35,882 (23.7%) |
| Coal or Coke | 376 (0.1%) | 173 (0.1%) |
| All other Fuels | 38,722 (9.8%) | 4,425 (2.9%) |
| No Fuel Used | 753 (0.2%) | 3,503 (2.3%) |
| Total | 393,973 (100.0%) | 151,178 (100.0%) |
Household Vehicle Usage in Area Code 603
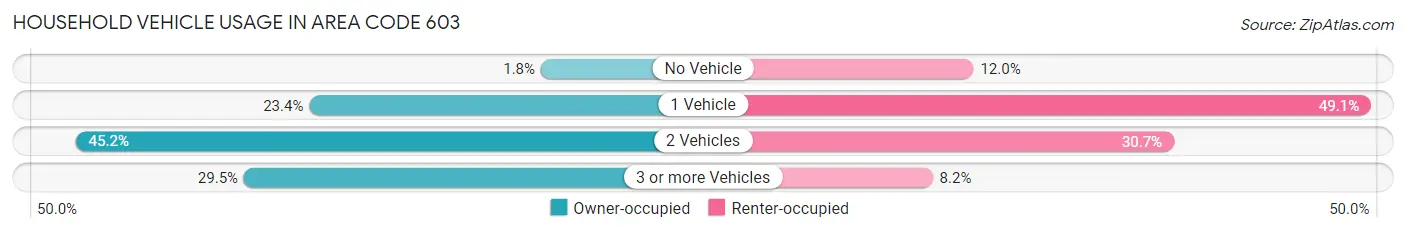
| Vehicles per Household | Owner-occupied | Renter-occupied |
| No Vehicle | 7,129 (1.8%) | 18,134 (12.0%) |
| 1 Vehicle | 92,296 (23.4%) | 74,237 (49.1%) |
| 2 Vehicles | 178,209 (45.2%) | 46,428 (30.7%) |
| 3 or more Vehicles | 116,339 (29.5%) | 12,379 (8.2%) |
| Total | 393,973 (100.0%) | 151,178 (100.0%) |
Real Estate & Mortgages in Area Code 603
Real Estate and Mortgage Overview in Area Code 603
| Characteristic | Without Mortgage | With Mortgage |
| Housing Units | 143,591 | 250,382 |
| Median Property Value | $76,393,701 | $79,063,900 |
| Median Household Income | $18,609,566 | $96,935 |
| Monthly Housing Costs | $208,062 | $53,425 |
| Real Estate Taxes | $1,318,072 | $2,023 |
Property Value by Mortgage Status in Area Code 603
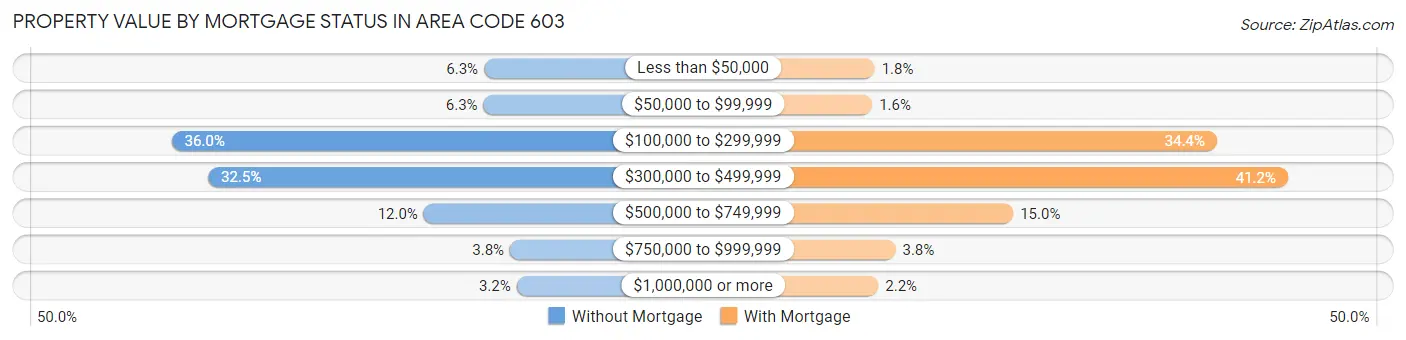
| Property Value | Without Mortgage | With Mortgage |
| Less than $50,000 | 8,972 (6.2%) | 4,588 (1.8%) |
| $50,000 to $99,999 | 9,045 (6.3%) | 3,987 (1.6%) |
| $100,000 to $299,999 | 51,690 (36.0%) | 86,150 (34.4%) |
| $300,000 to $499,999 | 46,713 (32.5%) | 103,064 (41.2%) |
| $500,000 to $749,999 | 17,220 (12.0%) | 37,615 (15.0%) |
| $750,000 to $999,999 | 5,434 (3.8%) | 9,549 (3.8%) |
| $1,000,000 or more | 4,517 (3.2%) | 5,429 (2.2%) |
| Total | 143,591 (100.0%) | 250,382 (100.0%) |
Household Income by Mortgage Status in Area Code 603
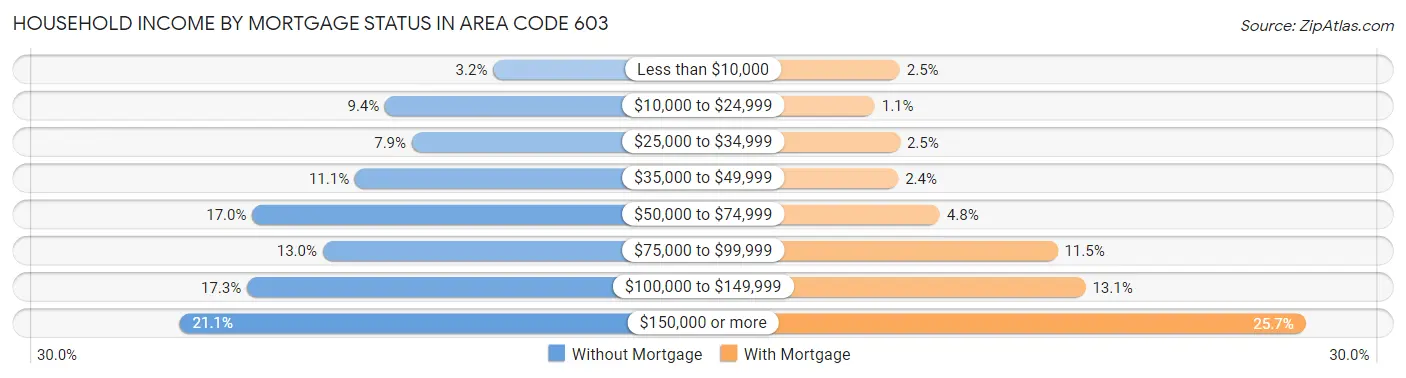
| Household Income | Without Mortgage | With Mortgage |
| Less than $10,000 | 4,630 (3.2%) | 6,342 (2.5%) |
| $10,000 to $24,999 | 13,495 (9.4%) | 2,749 (1.1%) |
| $25,000 to $34,999 | 11,306 (7.9%) | 6,357 (2.5%) |
| $35,000 to $49,999 | 15,965 (11.1%) | 6,103 (2.4%) |
| $50,000 to $74,999 | 24,400 (17.0%) | 12,074 (4.8%) |
| $75,000 to $99,999 | 18,613 (13.0%) | 28,893 (11.5%) |
| $100,000 to $149,999 | 24,830 (17.3%) | 32,895 (13.1%) |
| $150,000 or more | 30,352 (21.1%) | 64,376 (25.7%) |
| Total | 143,591 (100.0%) | 250,382 (100.0%) |
Property Value to Household Income Ratio in Area Code 603
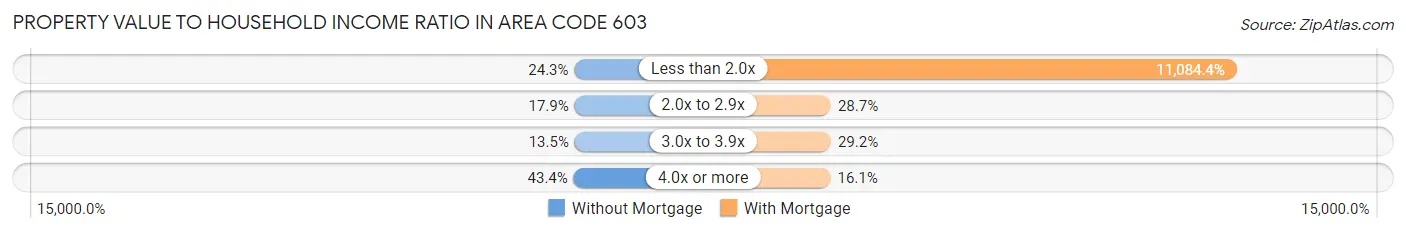
| Value-to-Income Ratio | Without Mortgage | With Mortgage |
| Less than 2.0x | 34,953 (24.3%) | 27,753,377 (11,084.4%) |
| 2.0x to 2.9x | 25,689 (17.9%) | 71,831 (28.7%) |
| 3.0x to 3.9x | 19,343 (13.5%) | 73,206 (29.2%) |
| 4.0x or more | 62,364 (43.4%) | 40,345 (16.1%) |
| Total | 143,591 (100.0%) | 250,382 (100.0%) |
Real Estate Taxes by Mortgage Status in Area Code 603
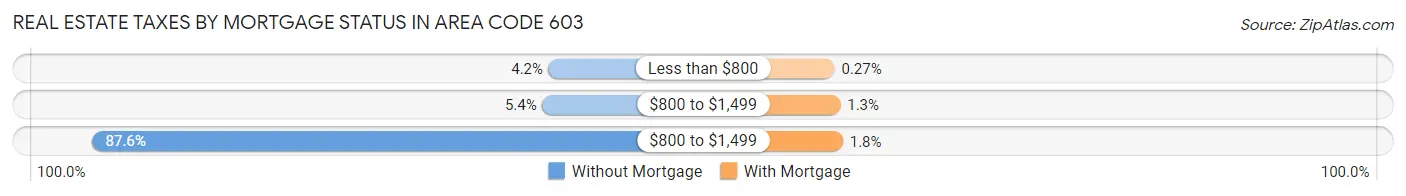
| Property Taxes | Without Mortgage | With Mortgage |
| Less than $800 | 6,087 (4.2%) | 672 (0.3%) |
| $800 to $1,499 | 7,752 (5.4%) | 3,312 (1.3%) |
| $800 to $1,499 | 125,738 (87.6%) | 4,455 (1.8%) |
| Total | 143,591 (100.0%) | 250,382 (100.0%) |
Health & Disability in Area Code 603
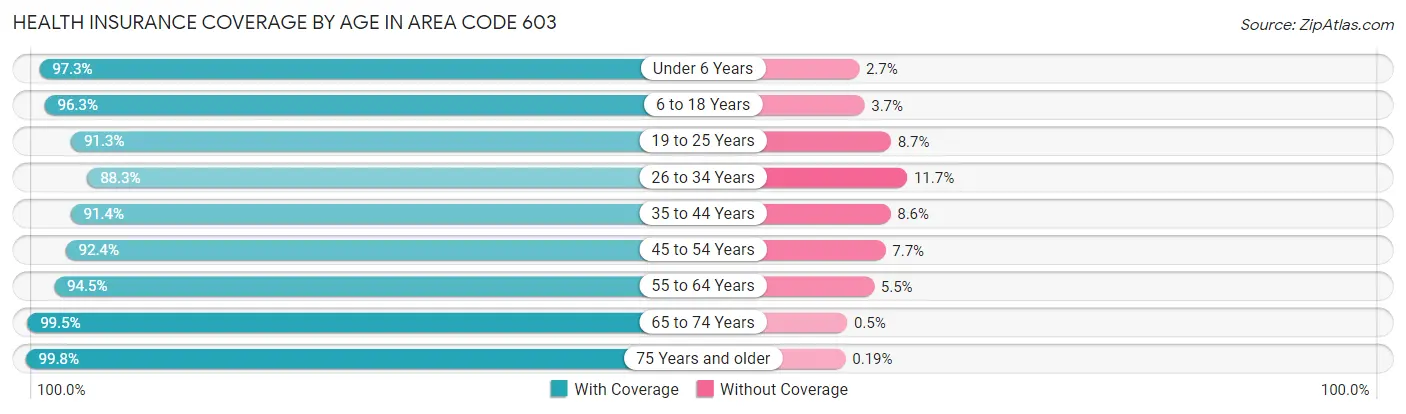
Health Insurance Coverage by Age in Area Code 603
| Age Bracket | With Coverage | Without Coverage |
| Under 6 Years | 74,009 (97.3%) | 2,079 (2.7%) |
| 6 to 18 Years | 190,835 (96.3%) | 7,388 (3.7%) |
| 19 to 25 Years | 111,975 (91.3%) | 10,616 (8.7%) |
| 26 to 34 Years | 137,131 (88.3%) | 18,154 (11.7%) |
| 35 to 44 Years | 147,866 (91.4%) | 13,873 (8.6%) |
| 45 to 54 Years | 166,799 (92.3%) | 13,810 (7.6%) |
| 55 to 64 Years | 203,661 (94.5%) | 11,885 (5.5%) |
| 65 to 74 Years | 156,368 (99.5%) | 784 (0.5%) |
| 75 Years and older | 95,887 (99.8%) | 184 (0.2%) |
| Total | 1,284,531 (94.2%) | 78,773 (5.8%) |
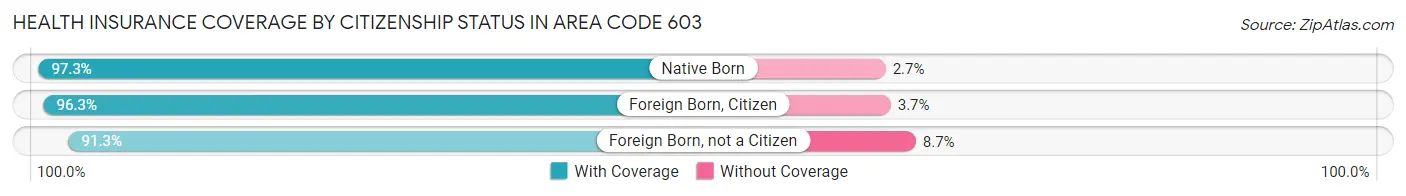
Health Insurance Coverage by Citizenship Status in Area Code 603
| Citizenship Status | With Coverage | Without Coverage |
| Native Born | 74,009 (97.3%) | 2,079 (2.7%) |
| Foreign Born, Citizen | 190,835 (96.3%) | 7,388 (3.7%) |
| Foreign Born, not a Citizen | 111,975 (91.3%) | 10,616 (8.7%) |
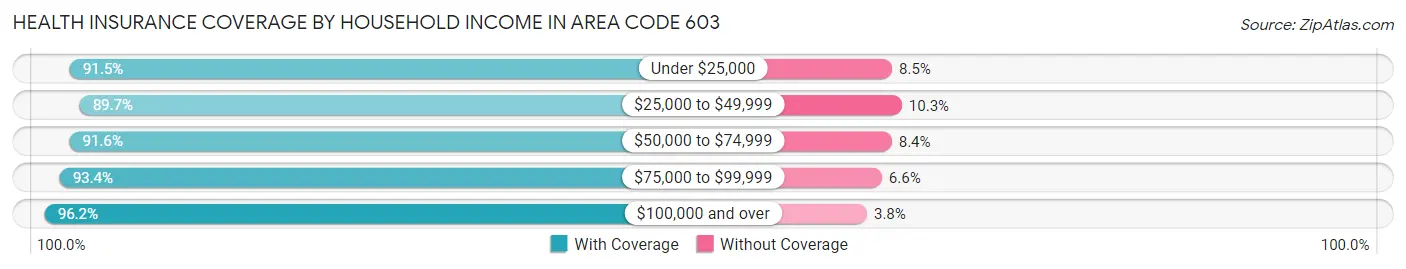
Health Insurance Coverage by Household Income in Area Code 603
| Household Income | With Coverage | Without Coverage |
| Under $25,000 | 84,431 (91.5%) | 7,836 (8.5%) |
| $25,000 to $49,999 | 130,528 (89.7%) | 15,041 (10.3%) |
| $50,000 to $74,999 | 163,268 (91.6%) | 15,029 (8.4%) |
| $75,000 to $99,999 | 164,788 (93.4%) | 11,603 (6.6%) |
| $100,000 and over | 716,507 (96.2%) | 28,200 (3.8%) |
Public vs Private Health Insurance Coverage by Age in Area Code 603

| Age Bracket | Public Insurance | Private Insurance |
| Under 6 | 24,654 (32.4%) | 52,183 (68.6%) |
| 6 to 18 Years | 51,685 (26.1%) | 146,686 (74.0%) |
| 19 to 25 Years | 16,038 (13.1%) | 99,172 (80.9%) |
| 25 to 34 Years | 24,971 (16.1%) | 116,330 (74.9%) |
| 35 to 44 Years | 23,045 (14.2%) | 129,855 (80.3%) |
| 45 to 54 Years | 22,047 (12.2%) | 150,616 (83.4%) |
| 55 to 64 Years | 34,667 (16.1%) | 178,391 (82.8%) |
| 65 to 74 Years | 147,513 (93.9%) | 101,661 (64.7%) |
| 75 Years and over | 95,227 (99.1%) | 63,723 (66.3%) |
| Total | 439,847 (32.3%) | 1,038,617 (76.2%) |
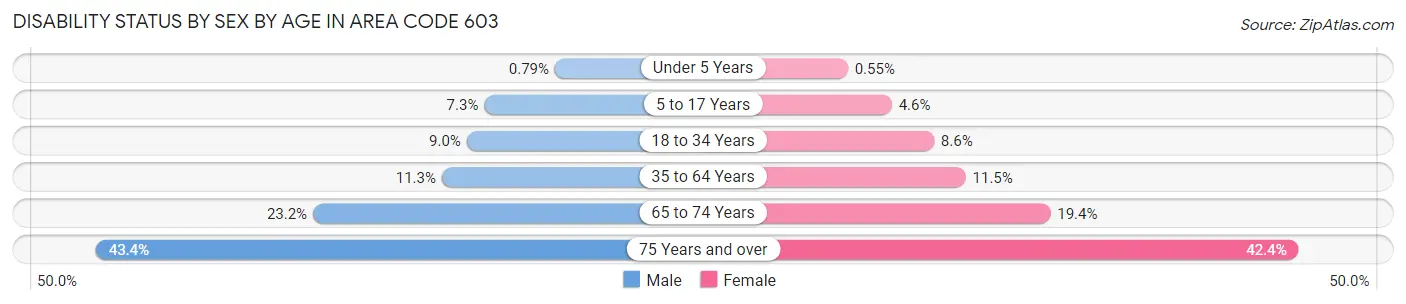
Disability Status by Sex by Age in Area Code 603
| Age Bracket | Male | Female |
| Under 5 Years | 252 (0.8%) | 171 (0.5%) |
| 5 to 17 Years | 7,278 (7.3%) | 4,341 (4.6%) |
| 18 to 34 Years | 13,648 (9.0%) | 12,329 (8.6%) |
| 35 to 64 Years | 31,500 (11.3%) | 32,015 (11.5%) |
| 65 to 74 Years | 17,796 (23.2%) | 15,597 (19.4%) |
| 75 Years and over | 17,954 (43.4%) | 23,178 (42.4%) |
Disability Class by Sex by Age in Area Code 603
Disability Class: Hearing Difficulty
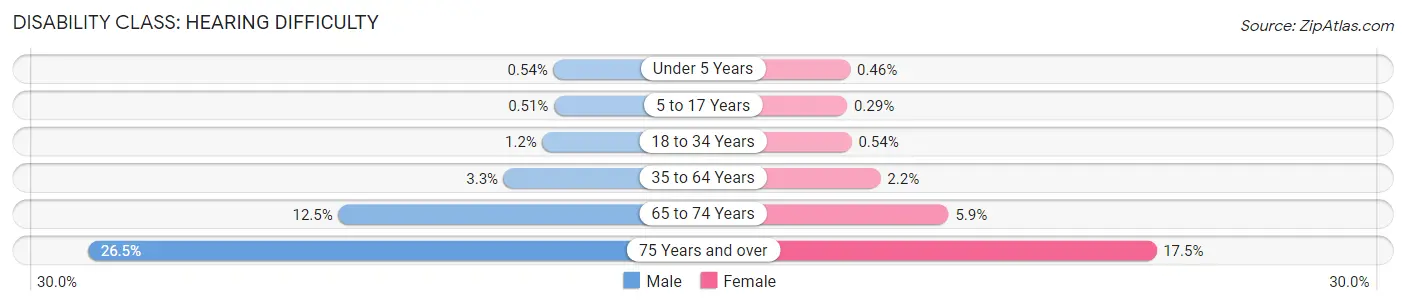
| Age Bracket | Male | Female |
| Under 5 Years | 171 (0.5%) | 144 (0.5%) |
| 5 to 17 Years | 507 (0.5%) | 274 (0.3%) |
| 18 to 34 Years | 1,751 (1.1%) | 776 (0.5%) |
| 35 to 64 Years | 9,254 (3.3%) | 5,976 (2.1%) |
| 65 to 74 Years | 9,589 (12.5%) | 4,787 (5.9%) |
| 75 Years and over | 10,955 (26.5%) | 9,576 (17.5%) |
Disability Class: Vision Difficulty
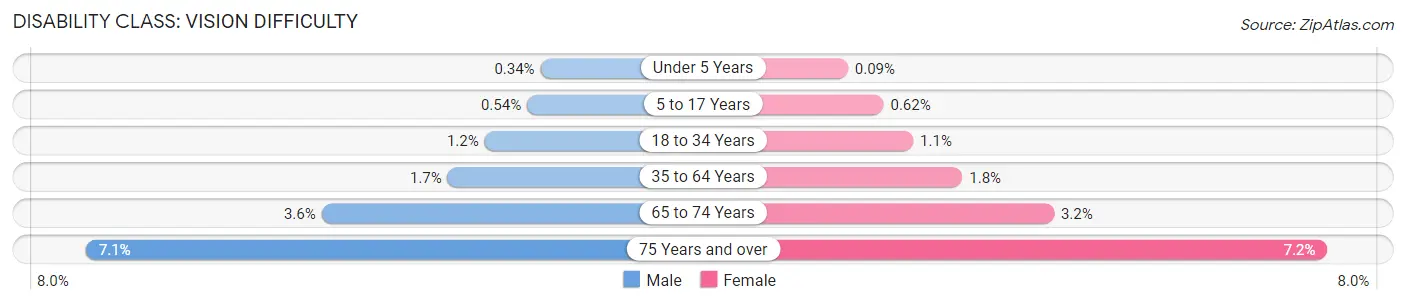
| Age Bracket | Male | Female |
| Under 5 Years | 107 (0.3%) | 27 (0.1%) |
| 5 to 17 Years | 540 (0.5%) | 582 (0.6%) |
| 18 to 34 Years | 1,787 (1.2%) | 1,528 (1.1%) |
| 35 to 64 Years | 4,799 (1.7%) | 4,995 (1.8%) |
| 65 to 74 Years | 2,750 (3.6%) | 2,536 (3.2%) |
| 75 Years and over | 2,935 (7.1%) | 3,944 (7.2%) |
Disability Class: Cognitive Difficulty
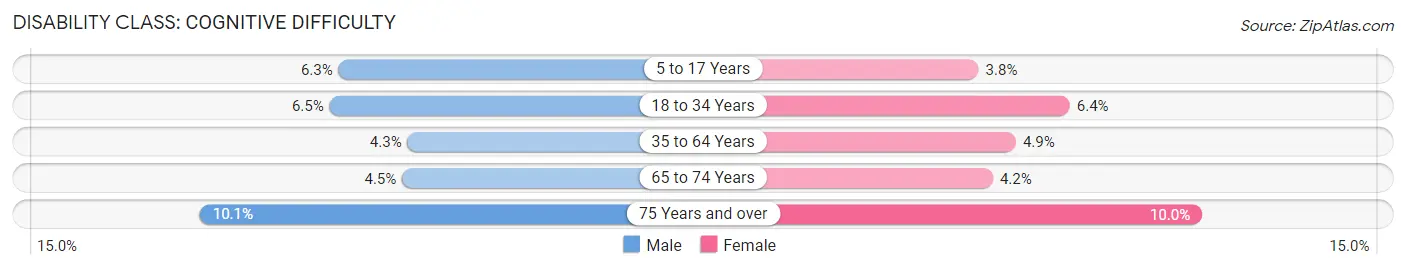
| Age Bracket | Male | Female |
| 5 to 17 Years | 6,205 (6.3%) | 3,572 (3.8%) |
| 18 to 34 Years | 9,902 (6.5%) | 9,160 (6.4%) |
| 35 to 64 Years | 12,130 (4.3%) | 13,519 (4.9%) |
| 65 to 74 Years | 3,435 (4.5%) | 3,389 (4.2%) |
| 75 Years and over | 4,187 (10.1%) | 5,488 (10.0%) |
Disability Class: Ambulatory Difficulty
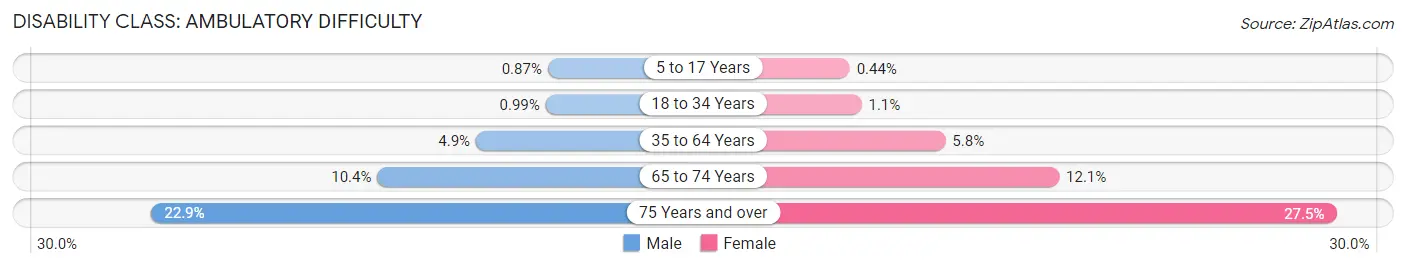
| Age Bracket | Male | Female |
| 5 to 17 Years | 862 (0.9%) | 417 (0.4%) |
| 18 to 34 Years | 1,505 (1.0%) | 1,587 (1.1%) |
| 35 to 64 Years | 13,597 (4.9%) | 16,076 (5.8%) |
| 65 to 74 Years | 7,933 (10.4%) | 9,755 (12.1%) |
| 75 Years and over | 9,493 (22.9%) | 15,055 (27.5%) |
Disability Class: Self-Care Difficulty
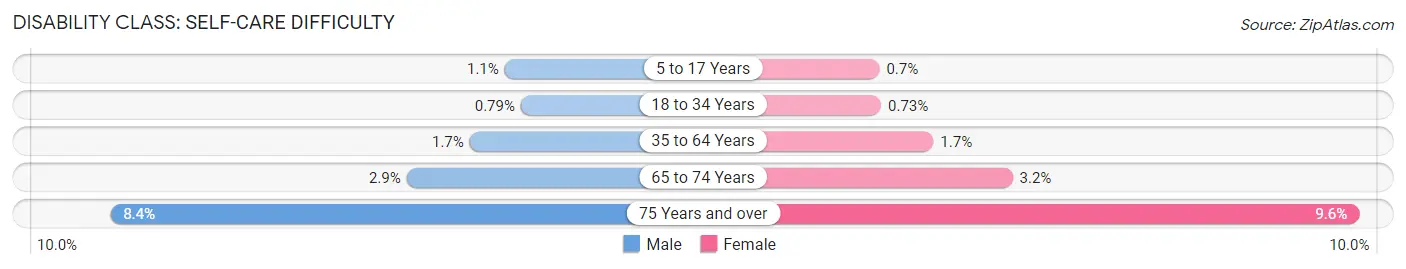
| Age Bracket | Male | Female |
| 5 to 17 Years | 1,084 (1.1%) | 653 (0.7%) |
| 18 to 34 Years | 1,198 (0.8%) | 1,054 (0.7%) |
| 35 to 64 Years | 4,863 (1.7%) | 4,742 (1.7%) |
| 65 to 74 Years | 2,230 (2.9%) | 2,554 (3.2%) |
| 75 Years and over | 3,479 (8.4%) | 5,251 (9.6%) |
Technology Access in Area Code 603
Computing Device Access in Area Code 603
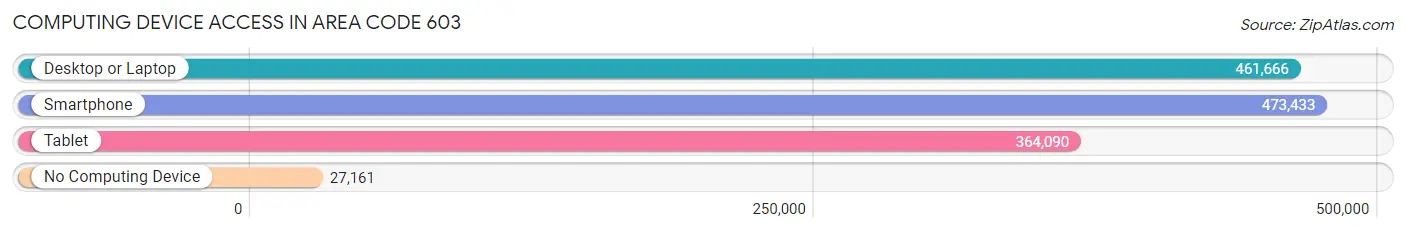
| Device Type | # Households | % Households |
| Desktop or Laptop | 461,666 | 84.7% |
| Smartphone | 473,433 | 86.8% |
| Tablet | 364,090 | 66.8% |
| No Computing Device | 27,161 | 5.0% |
| Total | 545,151 | 100.0% |
Internet Access in Area Code 603
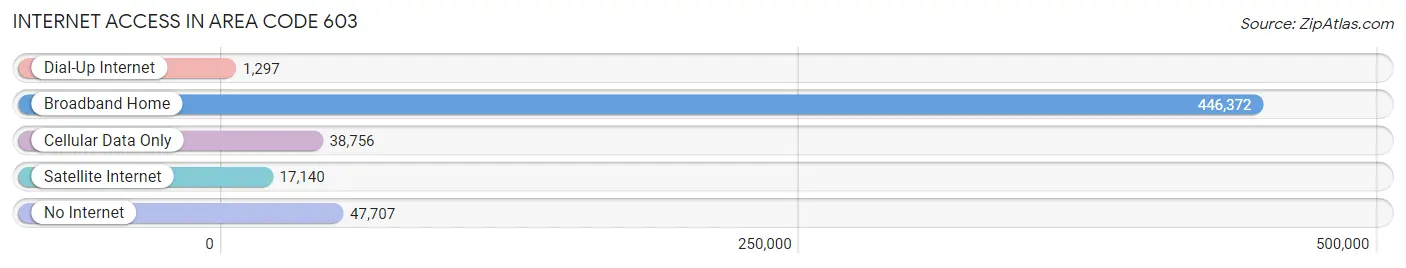
| Internet Type | # Households | % Households |
| Dial-Up Internet | 1,297 | 0.2% |
| Broadband Home | 446,372 | 81.9% |
| Cellular Data Only | 38,756 | 7.1% |
| Satellite Internet | 17,140 | 3.1% |
| No Internet | 47,707 | 8.7% |
| Total | 545,151 | 100.0% |
Area Code 603 Summary
Geography
Area code 603 is a telephone area code in the North American Numbering Plan (NANP) for the state of New Hampshire in the United States. It was created in 1947 as one of the original 86 area codes. It covers the entire state of New Hampshire, including the cities of Manchester, Nashua, Concord, and Portsmouth.
Social
Area code 603 is a vibrant and diverse area, with a wide range of cultural and recreational activities. The area is home to a number of universities and colleges, including the University of New Hampshire, Dartmouth College, and the University of New England. The area is also home to a number of professional sports teams, including the New Hampshire Fisher Cats, the Manchester Monarchs, and the New Hampshire Wildcats.
Economics
Area code 603 is an economically vibrant area, with a strong manufacturing and technology sector. The area is home to a number of major corporations, including BAE Systems, Fidelity Investments, and Stonyfield Farm. The area is also home to a number of small businesses, including restaurants, retail stores, and professional services.
Demographics
Area code 603 is home to a diverse population, with a median age of 38.7 years. The area is home to a number of ethnic and racial groups, including White (90.2%), Hispanic or Latino (4.2%), and Asian (2.7%). The area is also home to a number of religious groups, including Protestant (45.2%), Catholic (25.2%), and Jewish (2.2%).
Common Questions
What is Per Capita Income in Area Code 603?
Per Capita income in Area Code 603 is $49,176.
What is the Median Family Income in Area Code 603?
Median Family Income in Area Code 603 is $111,451.
What is the Median Household income in Area Code 603?
Median Household Income in Area Code 603 is $93,430.
What is Income or Wage Gap in Area Code 603?
Income or Wage Gap in Area Code 603 is 28.8%.
Women in Area Code 603 earn 71.2 cents for every dollar earned by a man.
What is Family Income Deficit in Area Code 603?
Family Income Deficit in Area Code 603 is $10,834.
Families that are below poverty line in Area Code 603 earn $10,834 less on average than the poverty threshold level.
What is Inequality or Gini Index in Area Code 603?
Inequality or Gini Index in Area Code 603 is 99.61.
What is the Total Population of Area Code 603?
Total Population of Area Code 603 is 1,379,678.
What is the Total Male Population of Area Code 603?
Total Male Population of Area Code 603 is 689,760.
What is the Total Female Population of Area Code 603?
Total Female Population of Area Code 603 is 689,918.
What is the Ratio of Males per 100 Females in Area Code 603?
There are 99.98 Males per 100 Females in Area Code 603.
What is the Ratio of Females per 100 Males in Area Code 603?
There are 100.02 Females per 100 Males in Area Code 603.
What is the Median Population Age in Area Code 603?
Median Population Age in Area Code 603 is 46.9 Years.
What is the Average Family Size in Area Code 603
Average Family Size in Area Code 603 is 3.0 People.
What is the Average Household Size in Area Code 603
Average Household Size in Area Code 603 is 2.5 People.
How Large is the Labor Force in Area Code 603?
There are 736,140 People in the Labor Forcein in Area Code 603.
What is the Percentage of People in the Labor Force in Area Code 603?
63.7% of People are in the Labor Force in Area Code 603.
What is the Unemployment Rate in Area Code 603?
Unemployment Rate in Area Code 603 is 3.8%.