Dover, NH Map & Demographics
Dover Map
Dover Overview
$52,752
PER CAPITA INCOME
$132,056
AVG FAMILY INCOME
$90,844
AVG HOUSEHOLD INCOME
33.0%
WAGE / INCOME GAP [ % ]
67.0¢/ $1
WAGE / INCOME GAP [ $ ]
0.43
INEQUALITY / GINI INDEX
32,849
TOTAL POPULATION
16,316
MALE POPULATION
16,533
FEMALE POPULATION
98.69
MALES / 100 FEMALES
101.33
FEMALES / 100 MALES
37.2
MEDIAN AGE
2.7
AVG FAMILY SIZE
2.2
AVG HOUSEHOLD SIZE
20,189
LABOR FORCE [ PEOPLE ]
72.5%
PERCENT IN LABOR FORCE
3.7%
UNEMPLOYMENT RATE
Dover Zip Codes
Dover Area Codes
Income in Dover
Income Overview in Dover
Per Capita Income in Dover is $52,752, while median incomes of families and households are $132,056 and $90,844 respectively.
| Characteristic | Number | Measure |
| Per Capita Income | 32,849 | $52,752 |
| Median Family Income | 8,060 | $132,056 |
| Mean Family Income | 8,060 | $153,572 |
| Median Household Income | 14,606 | $90,844 |
| Mean Household Income | 14,606 | $117,718 |
| Income Deficit | 8,060 | $0 |
| Wage / Income Gap (%) | 32,849 | 33.03% |
| Wage / Income Gap ($) | 32,849 | 66.97¢ per $1 |
| Gini / Inequality Index | 32,849 | 0.43 |
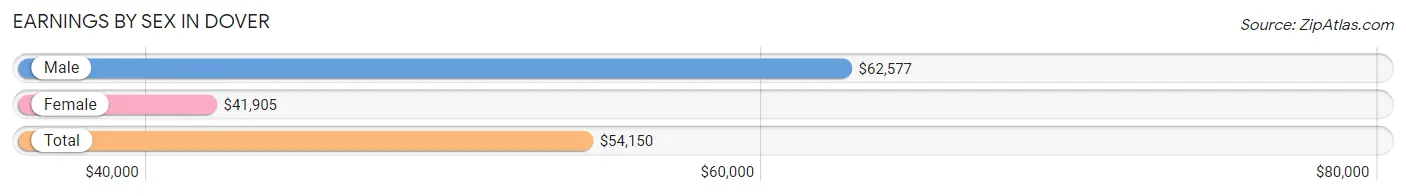
Earnings by Sex in Dover
Average Earnings in Dover are $54,150, $62,577 for men and $41,905 for women, a difference of 33.0%.
| Sex | Number | Average Earnings |
| Male | 11,300 (53.6%) | $62,577 |
| Female | 9,768 (46.4%) | $41,905 |
| Total | 21,068 (100.0%) | $54,150 |
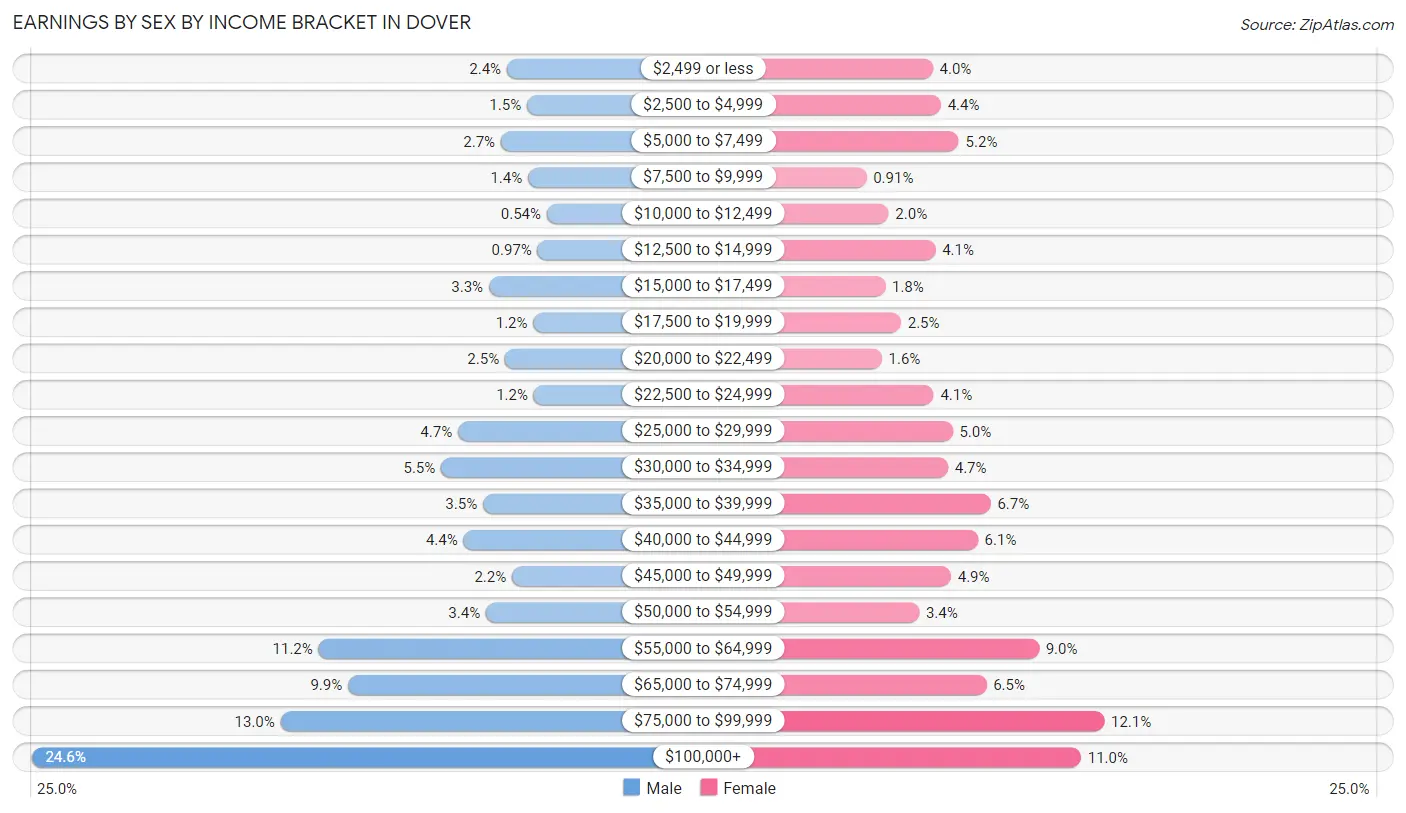
Earnings by Sex by Income Bracket in Dover
The most common earnings brackets in Dover are $100,000+ for men (2,783 | 24.6%) and $75,000 to $99,999 for women (1,177 | 12.0%).
| Income | Male | Female |
| $2,499 or less | 272 (2.4%) | 393 (4.0%) |
| $2,500 to $4,999 | 166 (1.5%) | 430 (4.4%) |
| $5,000 to $7,499 | 304 (2.7%) | 512 (5.2%) |
| $7,500 to $9,999 | 160 (1.4%) | 89 (0.9%) |
| $10,000 to $12,499 | 61 (0.5%) | 190 (1.9%) |
| $12,500 to $14,999 | 110 (1.0%) | 404 (4.1%) |
| $15,000 to $17,499 | 367 (3.3%) | 175 (1.8%) |
| $17,500 to $19,999 | 132 (1.2%) | 247 (2.5%) |
| $20,000 to $22,499 | 283 (2.5%) | 159 (1.6%) |
| $22,500 to $24,999 | 130 (1.1%) | 397 (4.1%) |
| $25,000 to $29,999 | 531 (4.7%) | 484 (5.0%) |
| $30,000 to $34,999 | 620 (5.5%) | 462 (4.7%) |
| $35,000 to $39,999 | 399 (3.5%) | 657 (6.7%) |
| $40,000 to $44,999 | 502 (4.4%) | 599 (6.1%) |
| $45,000 to $49,999 | 245 (2.2%) | 476 (4.9%) |
| $50,000 to $54,999 | 383 (3.4%) | 330 (3.4%) |
| $55,000 to $64,999 | 1,269 (11.2%) | 878 (9.0%) |
| $65,000 to $74,999 | 1,113 (9.9%) | 638 (6.5%) |
| $75,000 to $99,999 | 1,470 (13.0%) | 1,177 (12.0%) |
| $100,000+ | 2,783 (24.6%) | 1,071 (11.0%) |
| Total | 11,300 (100.0%) | 9,768 (100.0%) |
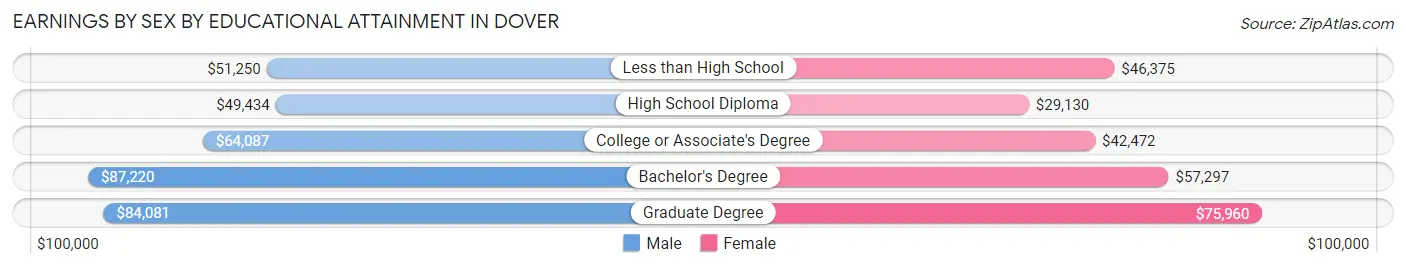
Earnings by Sex by Educational Attainment in Dover
Average earnings in Dover are $68,678 for men and $51,328 for women, a difference of 25.3%. Men with an educational attainment of bachelor's degree enjoy the highest average annual earnings of $87,220, while those with high school diploma education earn the least with $49,434. Women with an educational attainment of graduate degree earn the most with the average annual earnings of $75,960, while those with high school diploma education have the smallest earnings of $29,130.
| Educational Attainment | Male Income | Female Income |
| Less than High School | $51,250 | $46,375 |
| High School Diploma | $49,434 | $29,130 |
| College or Associate's Degree | $64,087 | $42,472 |
| Bachelor's Degree | $87,220 | $57,297 |
| Graduate Degree | $84,081 | $75,960 |
| Total | $68,678 | $51,328 |
Family Income in Dover
Family Income Brackets in Dover
According to the Dover family income data, there are 1,999 families falling into the $100,000 to $149,999 income range, which is the most common income bracket and makes up 24.8% of all families. Conversely, the $10,000 to $14,999 income bracket is the least frequent group with only 24 families (0.3%) belonging to this category.
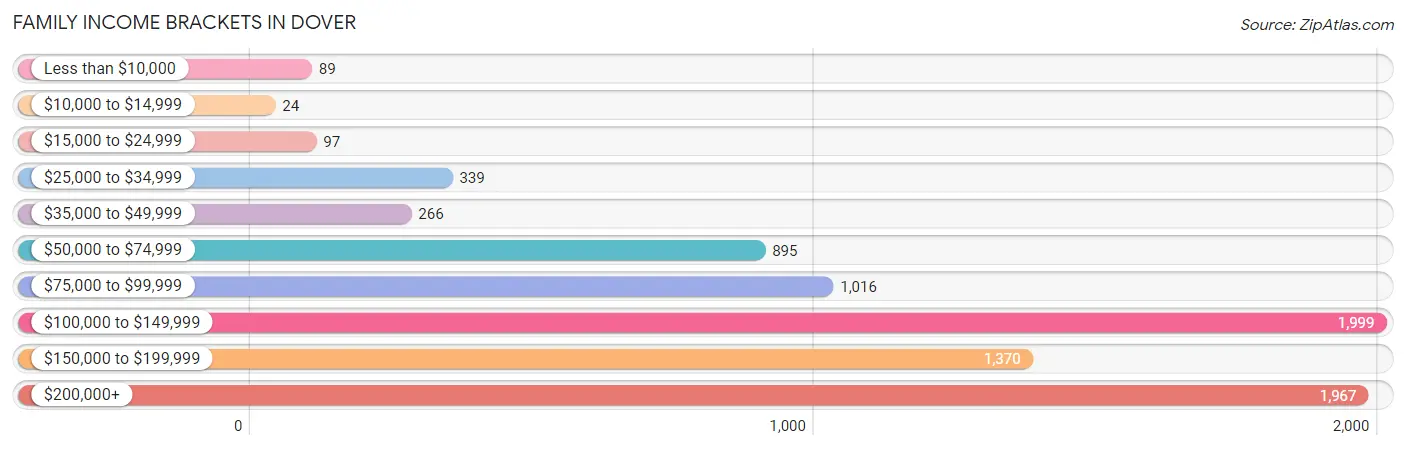
| Income Bracket | # Families | % Families |
| Less than $10,000 | 89 | 1.1% |
| $10,000 to $14,999 | 24 | 0.3% |
| $15,000 to $24,999 | 97 | 1.2% |
| $25,000 to $34,999 | 339 | 4.2% |
| $35,000 to $49,999 | 266 | 3.3% |
| $50,000 to $74,999 | 895 | 11.1% |
| $75,000 to $99,999 | 1,016 | 12.6% |
| $100,000 to $149,999 | 1,999 | 24.8% |
| $150,000 to $199,999 | 1,370 | 17.0% |
| $200,000+ | 1,967 | 24.4% |
Family Income by Famaliy Size in Dover
4-person families (1,605 | 19.9%) account for the highest median family income in Dover with $171,733 per family, while 2-person families (4,234 | 52.5%) have the highest median income of $53,349 per family member.
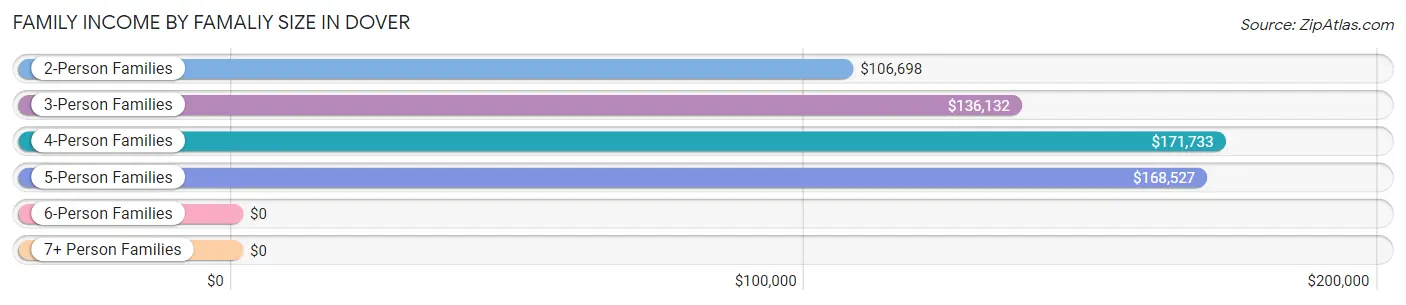
| Income Bracket | # Families | Median Income |
| 2-Person Families | 4,234 (52.5%) | $106,698 |
| 3-Person Families | 1,818 (22.6%) | $136,132 |
| 4-Person Families | 1,605 (19.9%) | $171,733 |
| 5-Person Families | 397 (4.9%) | $168,527 |
| 6-Person Families | 6 (0.1%) | $0 |
| 7+ Person Families | 0 (0.0%) | $0 |
| Total | 8,060 (100.0%) | $132,056 |
Family Income by Number of Earners in Dover
The median family income in Dover is $132,056, with families comprising 3+ earners (849) having the highest median family income of $167,411, while families with no earners (1,010) have the lowest median family income of $56,169, accounting for 10.5% and 12.5% of families, respectively.
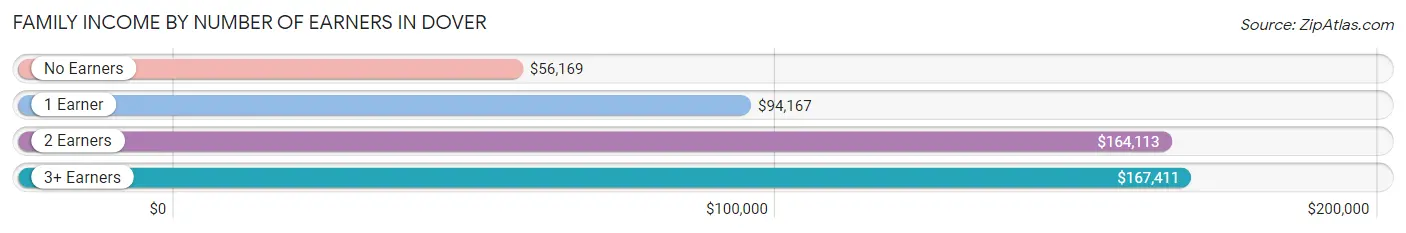
| Number of Earners | # Families | Median Income |
| No Earners | 1,010 (12.5%) | $56,169 |
| 1 Earner | 2,038 (25.3%) | $94,167 |
| 2 Earners | 4,163 (51.6%) | $164,113 |
| 3+ Earners | 849 (10.5%) | $167,411 |
| Total | 8,060 (100.0%) | $132,056 |
Household Income in Dover
Household Income Brackets in Dover
With 2,439 households falling in the category, the $100,000 to $149,999 income range is the most frequent in Dover, accounting for 16.7% of all households. In contrast, only 336 households (2.3%) fall into the less than $10,000 income bracket, making it the least populous group.
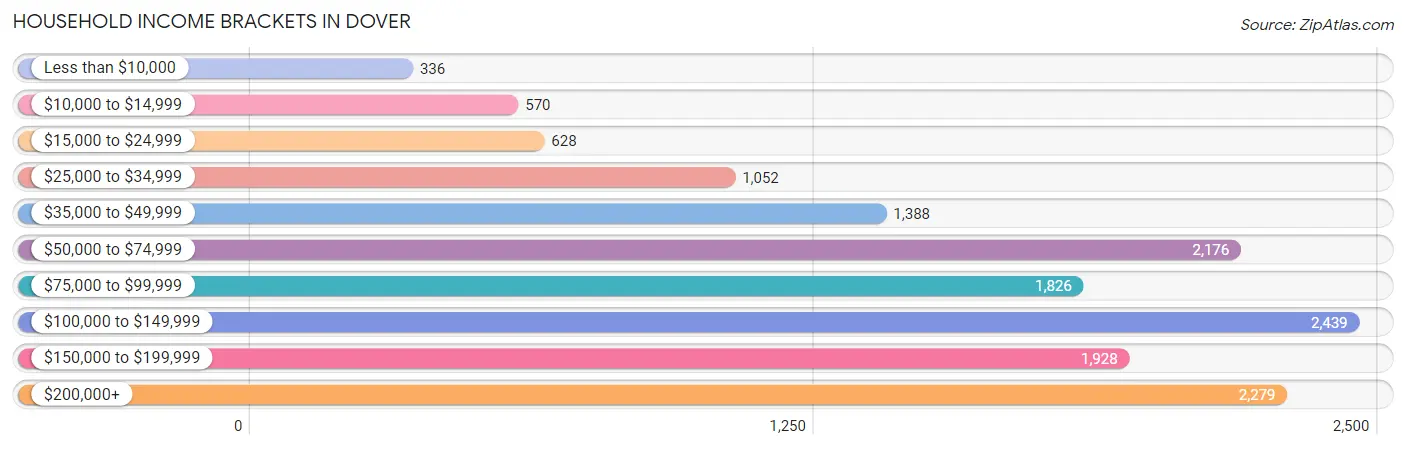
| Income Bracket | # Households | % Households |
| Less than $10,000 | 336 | 2.3% |
| $10,000 to $14,999 | 570 | 3.9% |
| $15,000 to $24,999 | 628 | 4.3% |
| $25,000 to $34,999 | 1,052 | 7.2% |
| $35,000 to $49,999 | 1,388 | 9.5% |
| $50,000 to $74,999 | 2,176 | 14.9% |
| $75,000 to $99,999 | 1,826 | 12.5% |
| $100,000 to $149,999 | 2,439 | 16.7% |
| $150,000 to $199,999 | 1,928 | 13.2% |
| $200,000+ | 2,279 | 15.6% |
Household Income by Householder Age in Dover
The median household income in Dover is $90,844, with the highest median household income of $107,712 found in the 45 to 64 years age bracket for the primary householder. A total of 4,524 households (31.0%) fall into this category. Meanwhile, the 65+ years age bracket for the primary householder has the lowest median household income of $57,386, with 3,373 households (23.1%) in this group.
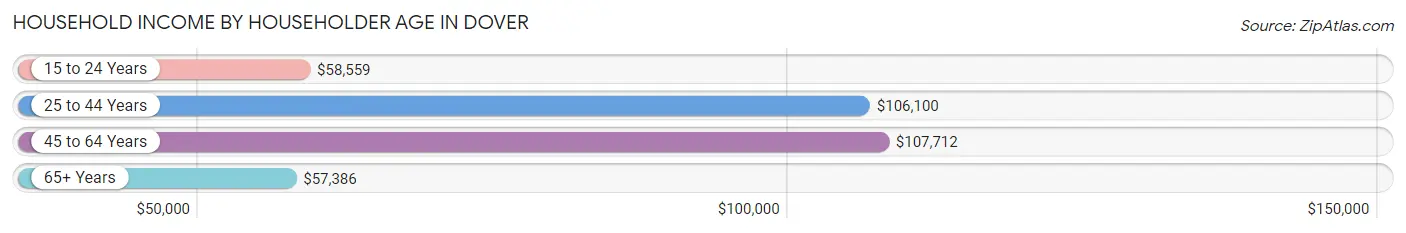
| Income Bracket | # Households | Median Income |
| 15 to 24 Years | 1,097 (7.5%) | $58,559 |
| 25 to 44 Years | 5,612 (38.4%) | $106,100 |
| 45 to 64 Years | 4,524 (31.0%) | $107,712 |
| 65+ Years | 3,373 (23.1%) | $57,386 |
| Total | 14,606 (100.0%) | $90,844 |
Poverty in Dover
Income Below Poverty by Sex and Age in Dover
With 5.4% poverty level for males and 9.8% for females among the residents of Dover, 16 and 17 year old males and 18 to 24 year old females are the most vulnerable to poverty, with 79 males (38.5%) and 515 females (27.6%) in their respective age groups living below the poverty level.
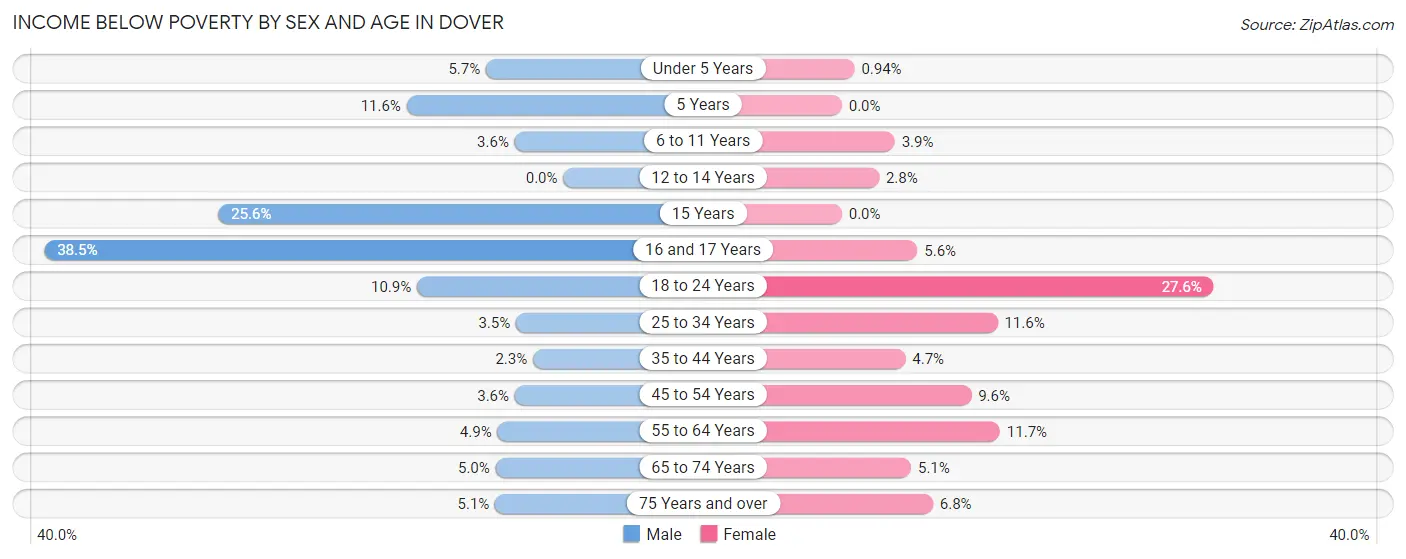
| Age Bracket | Male | Female |
| Under 5 Years | 49 (5.7%) | 8 (0.9%) |
| 5 Years | 10 (11.6%) | 0 (0.0%) |
| 6 to 11 Years | 27 (3.6%) | 28 (3.9%) |
| 12 to 14 Years | 0 (0.0%) | 15 (2.8%) |
| 15 Years | 61 (25.6%) | 0 (0.0%) |
| 16 and 17 Years | 79 (38.5%) | 22 (5.6%) |
| 18 to 24 Years | 176 (10.9%) | 515 (27.6%) |
| 25 to 34 Years | 111 (3.5%) | 325 (11.6%) |
| 35 to 44 Years | 52 (2.2%) | 90 (4.7%) |
| 45 to 54 Years | 64 (3.6%) | 192 (9.6%) |
| 55 to 64 Years | 98 (4.9%) | 220 (11.7%) |
| 65 to 74 Years | 74 (5.0%) | 74 (5.1%) |
| 75 Years and over | 40 (5.1%) | 92 (6.8%) |
| Total | 841 (5.4%) | 1,581 (9.8%) |
Income Above Poverty by Sex and Age in Dover
According to the poverty statistics in Dover, males aged 12 to 14 years and females aged 5 years are the age groups that are most secure financially, with 100.0% of males and 100.0% of females in these age groups living above the poverty line.
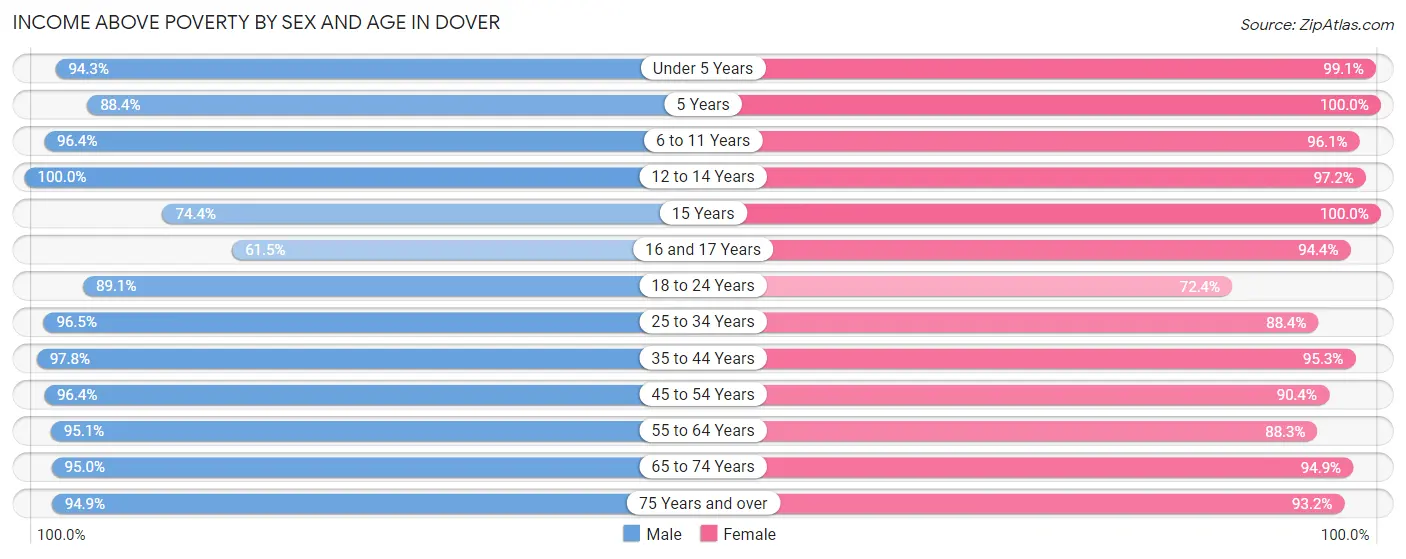
| Age Bracket | Male | Female |
| Under 5 Years | 804 (94.3%) | 841 (99.1%) |
| 5 Years | 76 (88.4%) | 124 (100.0%) |
| 6 to 11 Years | 721 (96.4%) | 685 (96.1%) |
| 12 to 14 Years | 429 (100.0%) | 529 (97.2%) |
| 15 Years | 177 (74.4%) | 241 (100.0%) |
| 16 and 17 Years | 126 (61.5%) | 370 (94.4%) |
| 18 to 24 Years | 1,444 (89.1%) | 1,350 (72.4%) |
| 25 to 34 Years | 3,053 (96.5%) | 2,486 (88.4%) |
| 35 to 44 Years | 2,261 (97.8%) | 1,815 (95.3%) |
| 45 to 54 Years | 1,713 (96.4%) | 1,805 (90.4%) |
| 55 to 64 Years | 1,905 (95.1%) | 1,654 (88.3%) |
| 65 to 74 Years | 1,397 (95.0%) | 1,367 (94.9%) |
| 75 Years and over | 750 (94.9%) | 1,268 (93.2%) |
| Total | 14,856 (94.6%) | 14,535 (90.2%) |
Income Below Poverty Among Married-Couple Families in Dover
The poverty statistics for married-couple families in Dover show that 2.4% or 154 of the total 6,547 families live below the poverty line. Families with 3 or 4 children have the highest poverty rate of 31.6%, comprising of 102 families. On the other hand, families with 1 or 2 children have the lowest poverty rate of 0.0%, which includes 0 families.
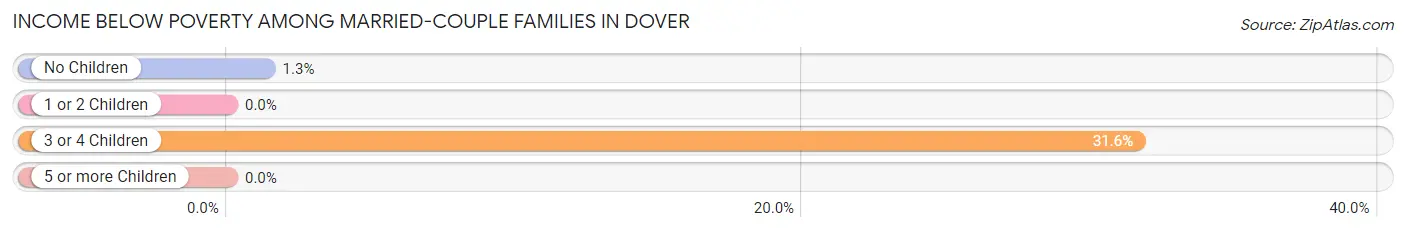
| Children | Above Poverty | Below Poverty |
| No Children | 3,909 (98.7%) | 52 (1.3%) |
| 1 or 2 Children | 2,263 (100.0%) | 0 (0.0%) |
| 3 or 4 Children | 221 (68.4%) | 102 (31.6%) |
| 5 or more Children | 0 (0.0%) | 0 (0.0%) |
| Total | 6,393 (97.7%) | 154 (2.4%) |
Income Below Poverty Among Single-Parent Households in Dover
According to the poverty data in Dover, 6.1% or 33 single-father households and 11.0% or 107 single-mother households are living below the poverty line. Among single-father households, those with 1 or 2 children have the highest poverty rate, with 33 households (14.3%) experiencing poverty. Likewise, among single-mother households, those with 1 or 2 children have the highest poverty rate, with 107 households (22.5%) falling below the poverty line.
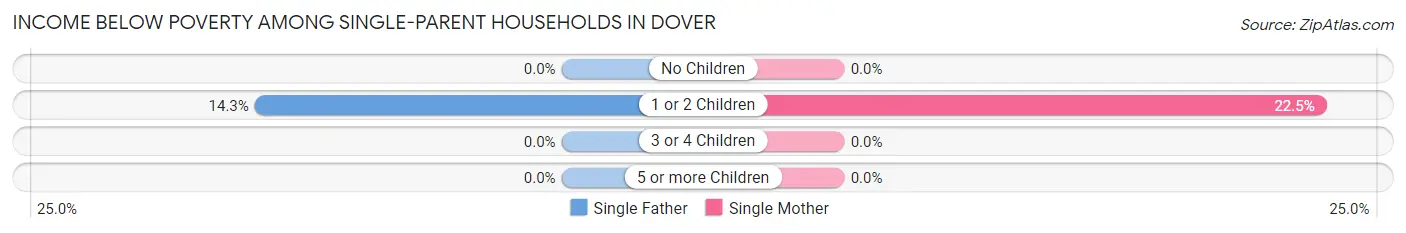
| Children | Single Father | Single Mother |
| No Children | 0 (0.0%) | 0 (0.0%) |
| 1 or 2 Children | 33 (14.3%) | 107 (22.5%) |
| 3 or 4 Children | 0 (0.0%) | 0 (0.0%) |
| 5 or more Children | 0 (0.0%) | 0 (0.0%) |
| Total | 33 (6.1%) | 107 (11.0%) |
Income Below Poverty Among Married-Couple vs Single-Parent Households in Dover
The poverty data for Dover shows that 154 of the married-couple family households (2.4%) and 140 of the single-parent households (9.2%) are living below the poverty level. Within the married-couple family households, those with 3 or 4 children have the highest poverty rate, with 102 households (31.6%) falling below the poverty line. Among the single-parent households, those with 1 or 2 children have the highest poverty rate, with 140 household (19.8%) living below poverty.
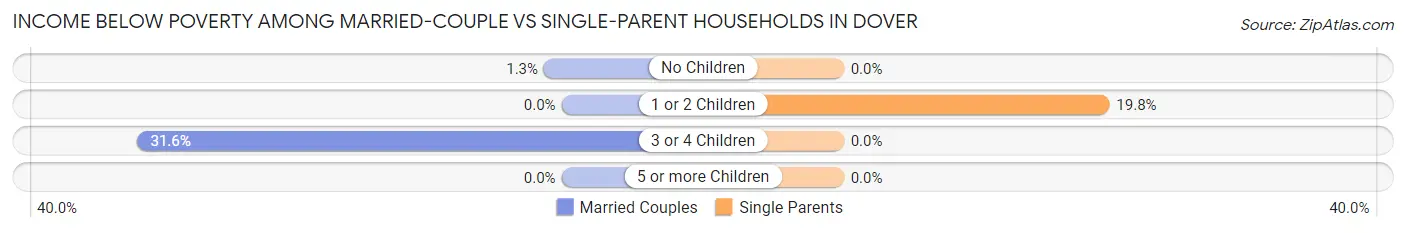
| Children | Married-Couple Families | Single-Parent Households |
| No Children | 52 (1.3%) | 0 (0.0%) |
| 1 or 2 Children | 0 (0.0%) | 140 (19.8%) |
| 3 or 4 Children | 102 (31.6%) | 0 (0.0%) |
| 5 or more Children | 0 (0.0%) | 0 (0.0%) |
| Total | 154 (2.4%) | 140 (9.2%) |
Race in Dover
The most populous races in Dover are White / Caucasian (29,268 | 89.1%), Two or more Races (1,454 | 4.4%), and Hispanic or Latino (1,367 | 4.2%).
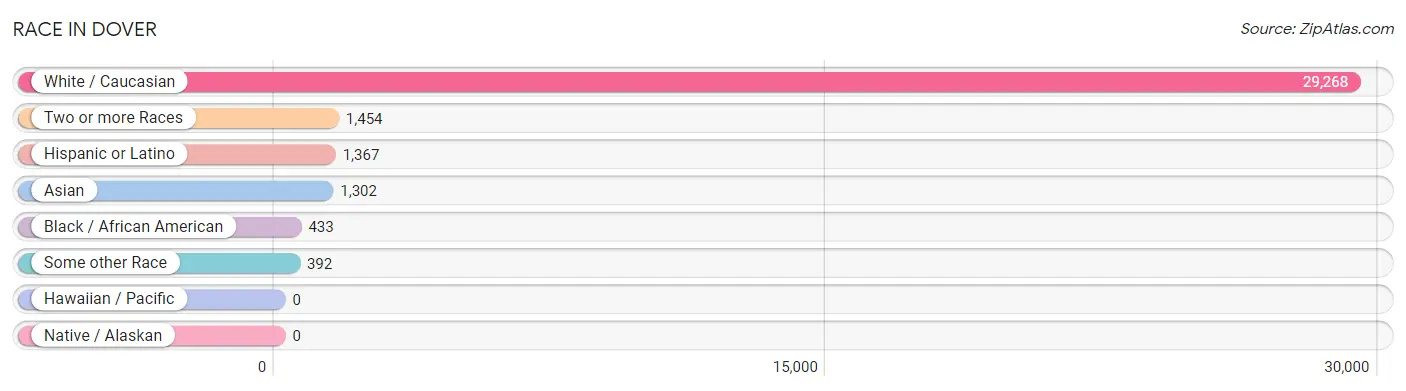
| Race | # Population | % Population |
| Asian | 1,302 | 4.0% |
| Black / African American | 433 | 1.3% |
| Hawaiian / Pacific | 0 | 0.0% |
| Hispanic or Latino | 1,367 | 4.2% |
| Native / Alaskan | 0 | 0.0% |
| White / Caucasian | 29,268 | 89.1% |
| Two or more Races | 1,454 | 4.4% |
| Some other Race | 392 | 1.2% |
| Total | 32,849 | 100.0% |
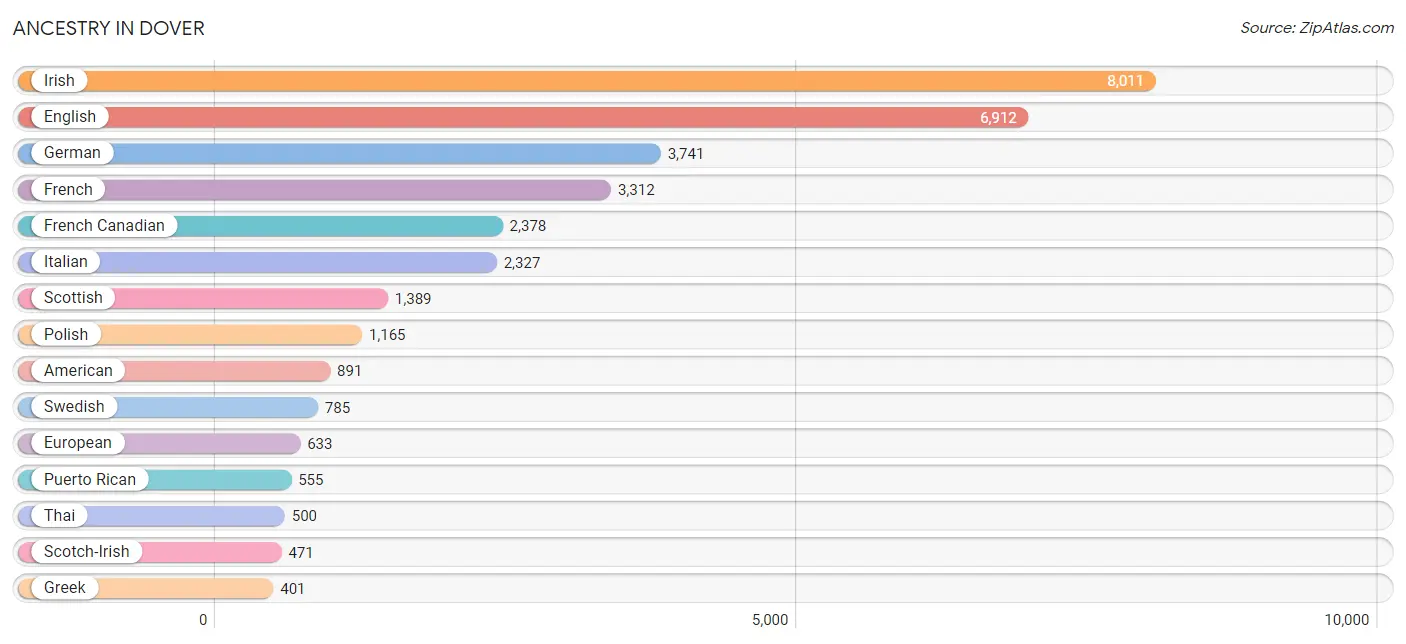
Ancestry in Dover
The most populous ancestries reported in Dover are Irish (8,011 | 24.4%), English (6,912 | 21.0%), German (3,741 | 11.4%), French (3,312 | 10.1%), and French Canadian (2,378 | 7.2%), together accounting for 74.1% of all Dover residents.
| Ancestry | # Population | % Population |
| African | 33 | 0.1% |
| Albanian | 17 | 0.1% |
| American | 891 | 2.7% |
| Arab | 243 | 0.7% |
| Armenian | 40 | 0.1% |
| Austrian | 95 | 0.3% |
| Basque | 14 | 0.0% |
| Belgian | 20 | 0.1% |
| Bhutanese | 46 | 0.1% |
| Brazilian | 141 | 0.4% |
| British | 308 | 0.9% |
| Burmese | 114 | 0.4% |
| Canadian | 341 | 1.0% |
| Celtic | 63 | 0.2% |
| Central American | 44 | 0.1% |
| Central American Indian | 19 | 0.1% |
| Choctaw | 6 | 0.0% |
| Colombian | 26 | 0.1% |
| Croatian | 8 | 0.0% |
| Cuban | 70 | 0.2% |
| Czech | 17 | 0.1% |
| Czechoslovakian | 10 | 0.0% |
| Danish | 130 | 0.4% |
| Dominican | 143 | 0.4% |
| Dutch | 270 | 0.8% |
| Eastern European | 156 | 0.5% |
| Ecuadorian | 54 | 0.2% |
| English | 6,912 | 21.0% |
| Estonian | 6 | 0.0% |
| European | 633 | 1.9% |
| Finnish | 122 | 0.4% |
| French | 3,312 | 10.1% |
| French Canadian | 2,378 | 7.2% |
| German | 3,741 | 11.4% |
| Greek | 401 | 1.2% |
| Haitian | 7 | 0.0% |
| Honduran | 25 | 0.1% |
| Hungarian | 76 | 0.2% |
| Indian (Asian) | 177 | 0.5% |
| Irish | 8,011 | 24.4% |
| Italian | 2,327 | 7.1% |
| Jamaican | 38 | 0.1% |
| Japanese | 35 | 0.1% |
| Korean | 317 | 1.0% |
| Laotian | 77 | 0.2% |
| Latvian | 13 | 0.0% |
| Lebanese | 222 | 0.7% |
| Lithuanian | 226 | 0.7% |
| Malaysian | 102 | 0.3% |
| Mexican | 245 | 0.7% |
| Moroccan | 21 | 0.1% |
| Nigerian | 78 | 0.2% |
| Northern European | 107 | 0.3% |
| Norwegian | 261 | 0.8% |
| Pakistani | 110 | 0.3% |
| Polish | 1,165 | 3.5% |
| Portuguese | 397 | 1.2% |
| Puerto Rican | 555 | 1.7% |
| Romanian | 6 | 0.0% |
| Russian | 376 | 1.1% |
| Salvadoran | 19 | 0.1% |
| Samoan | 57 | 0.2% |
| Scandinavian | 87 | 0.3% |
| Scotch-Irish | 471 | 1.4% |
| Scottish | 1,389 | 4.2% |
| South American | 80 | 0.2% |
| Spaniard | 69 | 0.2% |
| Spanish | 31 | 0.1% |
| Sri Lankan | 190 | 0.6% |
| Subsaharan African | 121 | 0.4% |
| Sudanese | 5 | 0.0% |
| Swedish | 785 | 2.4% |
| Swiss | 53 | 0.2% |
| Thai | 500 | 1.5% |
| Trinidadian and Tobagonian | 6 | 0.0% |
| Ukrainian | 49 | 0.2% |
| Welsh | 157 | 0.5% |
| West Indian | 42 | 0.1% | View All 78 Rows |
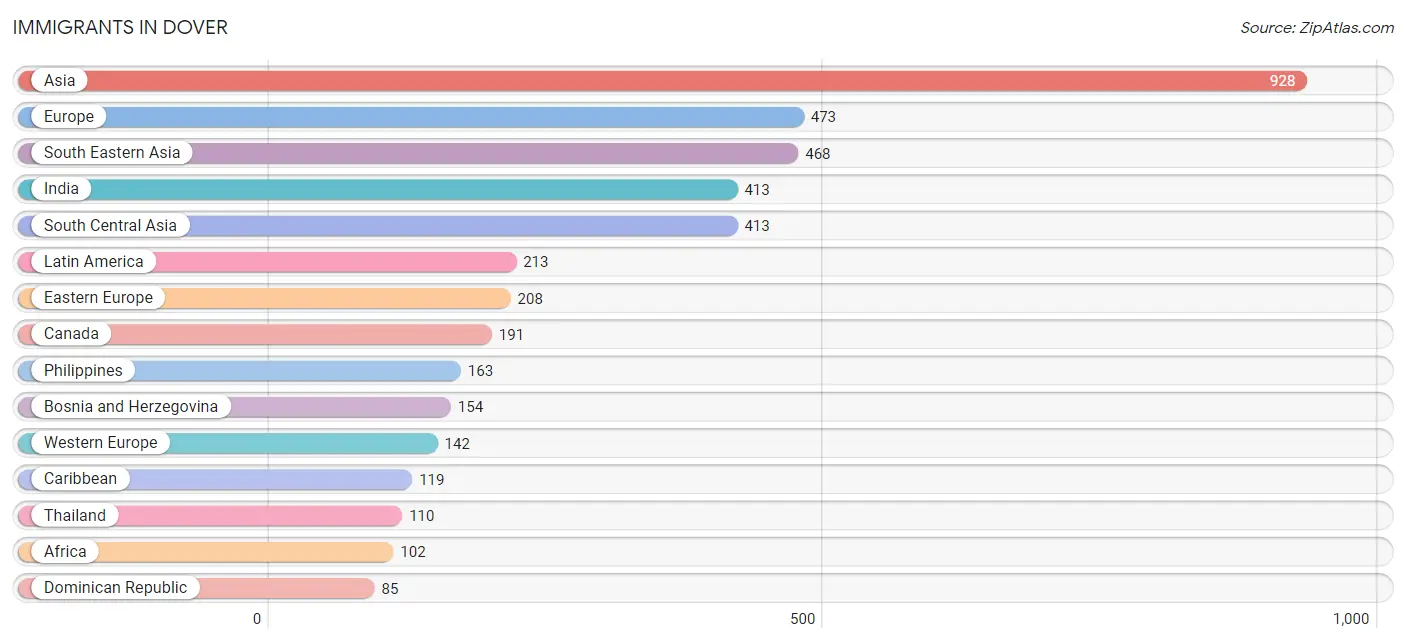
Immigrants in Dover
The most numerous immigrant groups reported in Dover came from Asia (928 | 2.8%), Europe (473 | 1.4%), South Eastern Asia (468 | 1.4%), India (413 | 1.3%), and South Central Asia (413 | 1.3%), together accounting for 8.2% of all Dover residents.
| Immigration Origin | # Population | % Population |
| Africa | 102 | 0.3% |
| Albania | 6 | 0.0% |
| Asia | 928 | 2.8% |
| Australia | 8 | 0.0% |
| Austria | 27 | 0.1% |
| Bosnia and Herzegovina | 154 | 0.5% |
| Brazil | 37 | 0.1% |
| Canada | 191 | 0.6% |
| Caribbean | 119 | 0.4% |
| Central America | 44 | 0.1% |
| China | 18 | 0.1% |
| Colombia | 13 | 0.0% |
| Denmark | 6 | 0.0% |
| Dominican Republic | 85 | 0.3% |
| Eastern Asia | 27 | 0.1% |
| Eastern Europe | 208 | 0.6% |
| El Salvador | 19 | 0.1% |
| England | 9 | 0.0% |
| Europe | 473 | 1.4% |
| France | 13 | 0.0% |
| Germany | 82 | 0.3% |
| Greece | 85 | 0.3% |
| Honduras | 19 | 0.1% |
| India | 413 | 1.3% |
| Indonesia | 75 | 0.2% |
| Jamaica | 34 | 0.1% |
| Japan | 9 | 0.0% |
| Laos | 77 | 0.2% |
| Latin America | 213 | 0.6% |
| Mexico | 6 | 0.0% |
| Middle Africa | 12 | 0.0% |
| Morocco | 7 | 0.0% |
| Netherlands | 6 | 0.0% |
| Nigeria | 78 | 0.2% |
| Northern Africa | 12 | 0.0% |
| Northern Europe | 38 | 0.1% |
| Norway | 8 | 0.0% |
| Oceania | 8 | 0.0% |
| Philippines | 163 | 0.5% |
| Poland | 5 | 0.0% |
| Russia | 10 | 0.0% |
| South America | 50 | 0.2% |
| South Central Asia | 413 | 1.3% |
| South Eastern Asia | 468 | 1.4% |
| Southern Europe | 85 | 0.3% |
| Sudan | 5 | 0.0% |
| Switzerland | 14 | 0.0% |
| Thailand | 110 | 0.3% |
| Vietnam | 43 | 0.1% |
| Western Africa | 78 | 0.2% |
| Western Asia | 20 | 0.1% |
| Western Europe | 142 | 0.4% | View All 52 Rows |
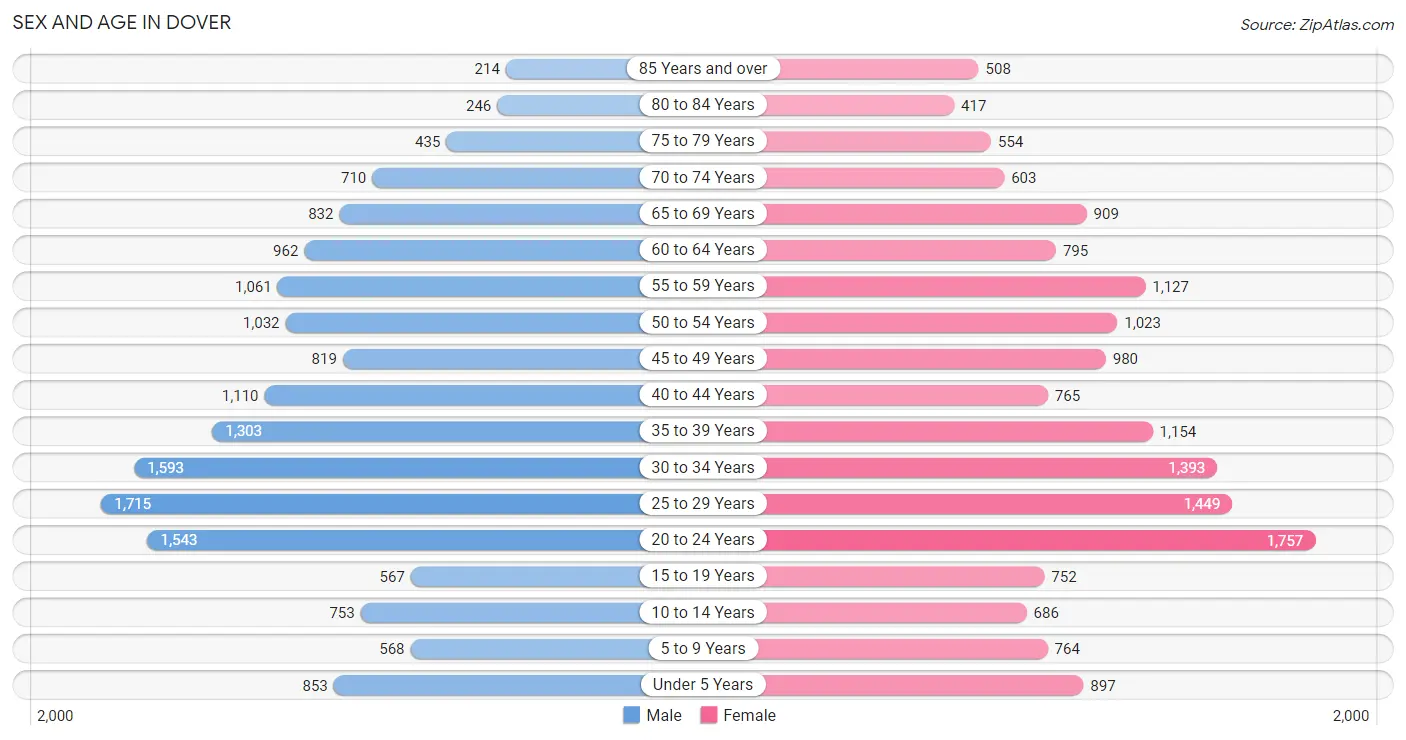
Sex and Age in Dover
Sex and Age in Dover
The most populous age groups in Dover are 25 to 29 Years (1,715 | 10.5%) for men and 20 to 24 Years (1,757 | 10.6%) for women.
| Age Bracket | Male | Female |
| Under 5 Years | 853 (5.2%) | 897 (5.4%) |
| 5 to 9 Years | 568 (3.5%) | 764 (4.6%) |
| 10 to 14 Years | 753 (4.6%) | 686 (4.2%) |
| 15 to 19 Years | 567 (3.5%) | 752 (4.5%) |
| 20 to 24 Years | 1,543 (9.5%) | 1,757 (10.6%) |
| 25 to 29 Years | 1,715 (10.5%) | 1,449 (8.8%) |
| 30 to 34 Years | 1,593 (9.8%) | 1,393 (8.4%) |
| 35 to 39 Years | 1,303 (8.0%) | 1,154 (7.0%) |
| 40 to 44 Years | 1,110 (6.8%) | 765 (4.6%) |
| 45 to 49 Years | 819 (5.0%) | 980 (5.9%) |
| 50 to 54 Years | 1,032 (6.3%) | 1,023 (6.2%) |
| 55 to 59 Years | 1,061 (6.5%) | 1,127 (6.8%) |
| 60 to 64 Years | 962 (5.9%) | 795 (4.8%) |
| 65 to 69 Years | 832 (5.1%) | 909 (5.5%) |
| 70 to 74 Years | 710 (4.3%) | 603 (3.6%) |
| 75 to 79 Years | 435 (2.7%) | 554 (3.4%) |
| 80 to 84 Years | 246 (1.5%) | 417 (2.5%) |
| 85 Years and over | 214 (1.3%) | 508 (3.1%) |
| Total | 16,316 (100.0%) | 16,533 (100.0%) |
Families and Households in Dover
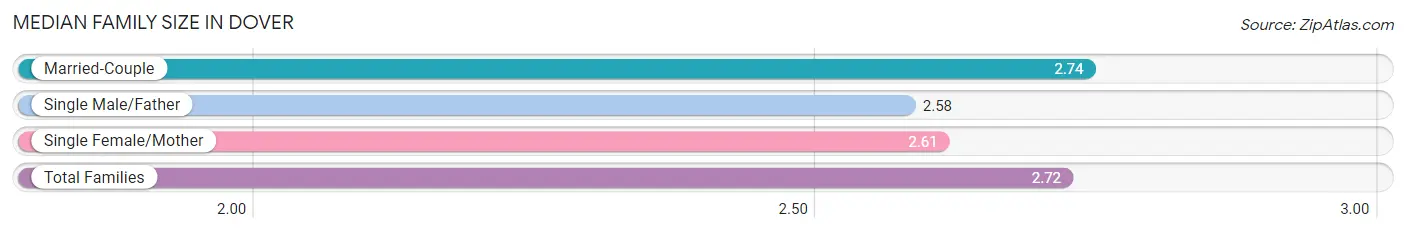
Median Family Size in Dover
The median family size in Dover is 2.72 persons per family, with married-couple families (6,547 | 81.2%) accounting for the largest median family size of 2.74 persons per family. On the other hand, single male/father families (537 | 6.7%) represent the smallest median family size with 2.58 persons per family.
| Family Type | # Families | Family Size |
| Married-Couple | 6,547 (81.2%) | 2.74 |
| Single Male/Father | 537 (6.7%) | 2.58 |
| Single Female/Mother | 976 (12.1%) | 2.61 |
| Total Families | 8,060 (100.0%) | 2.72 |
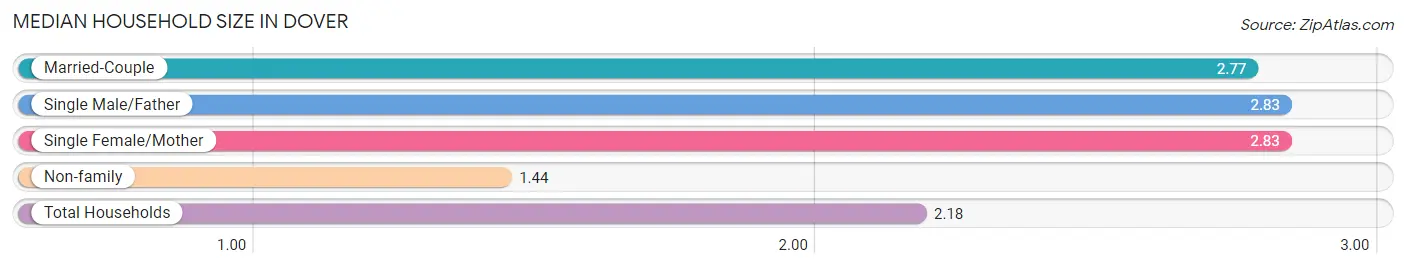
Median Household Size in Dover
The median household size in Dover is 2.18 persons per household, with single male/father households (537 | 3.7%) accounting for the largest median household size of 2.83 persons per household. non-family households (6,546 | 44.8%) represent the smallest median household size with 1.44 persons per household.
| Household Type | # Households | Household Size |
| Married-Couple | 6,547 (44.8%) | 2.77 |
| Single Male/Father | 537 (3.7%) | 2.83 |
| Single Female/Mother | 976 (6.7%) | 2.83 |
| Non-family | 6,546 (44.8%) | 1.44 |
| Total Households | 14,606 (100.0%) | 2.18 |
Household Size by Marriage Status in Dover
Out of a total of 14,606 households in Dover, 8,060 (55.2%) are family households, while 6,546 (44.8%) are nonfamily households. The most numerous type of family households are 2-person households, comprising 3,989, and the most common type of nonfamily households are 1-person households, comprising 4,682.
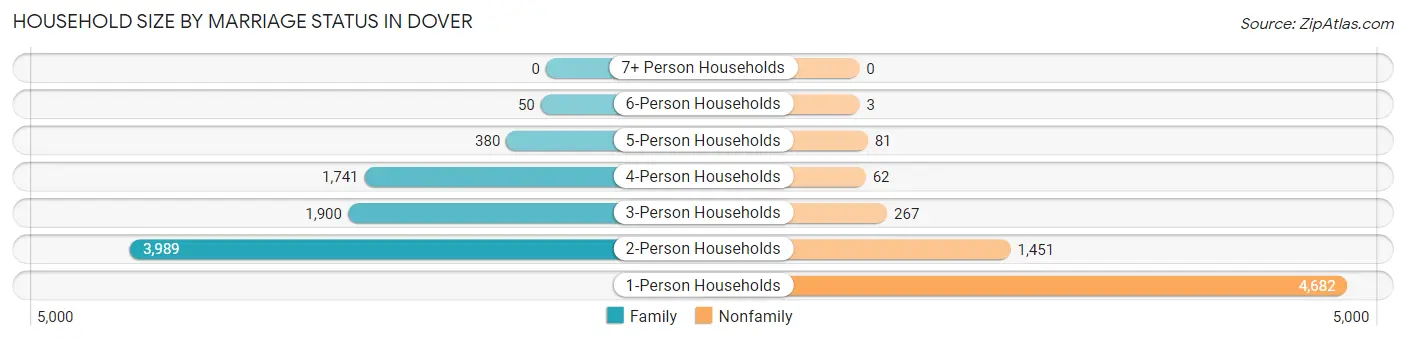
| Household Size | Family Households | Nonfamily Households |
| 1-Person Households | - | 4,682 (32.1%) |
| 2-Person Households | 3,989 (27.3%) | 1,451 (9.9%) |
| 3-Person Households | 1,900 (13.0%) | 267 (1.8%) |
| 4-Person Households | 1,741 (11.9%) | 62 (0.4%) |
| 5-Person Households | 380 (2.6%) | 81 (0.5%) |
| 6-Person Households | 50 (0.3%) | 3 (0.0%) |
| 7+ Person Households | 0 (0.0%) | 0 (0.0%) |
| Total | 8,060 (55.2%) | 6,546 (44.8%) |
Female Fertility in Dover
Fertility by Age in Dover
Average fertility rate in Dover is 50.0 births per 1,000 women. Women in the age bracket of 35 to 50 years have the highest fertility rate with 64.0 births per 1,000 women. Women in the age bracket of 20 to 34 years acount for 53.3% of all women with births.
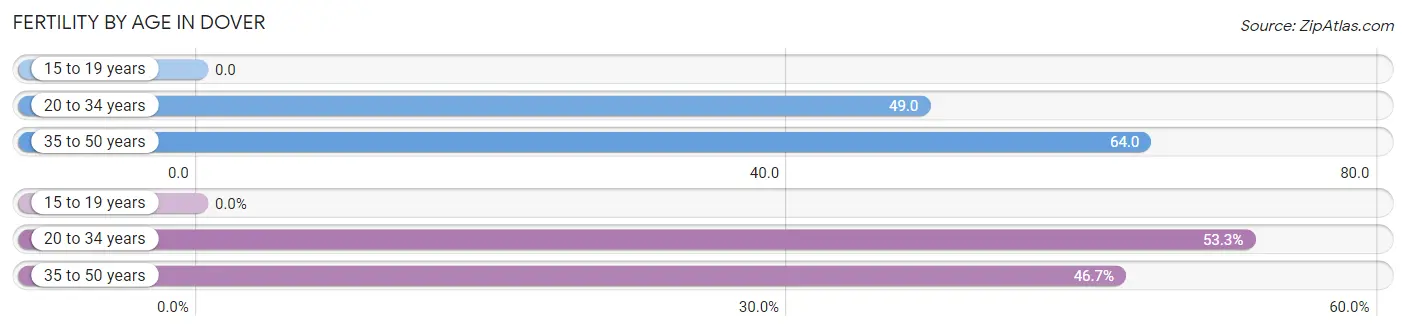
| Age Bracket | Women with Births | Births / 1,000 Women |
| 15 to 19 years | 0 (0.0%) | 0.0 |
| 20 to 34 years | 227 (53.3%) | 49.0 |
| 35 to 50 years | 199 (46.7%) | 64.0 |
| Total | 426 (100.0%) | 50.0 |
Fertility by Age by Marriage Status in Dover
89.2% of women with births (426) in Dover are married. The highest percentage of unmarried women with births falls into 35 to 50 years age bracket with 13.6% of them unmarried at the time of birth, while the lowest percentage of unmarried women with births belong to 20 to 34 years age bracket with 8.4% of them unmarried.
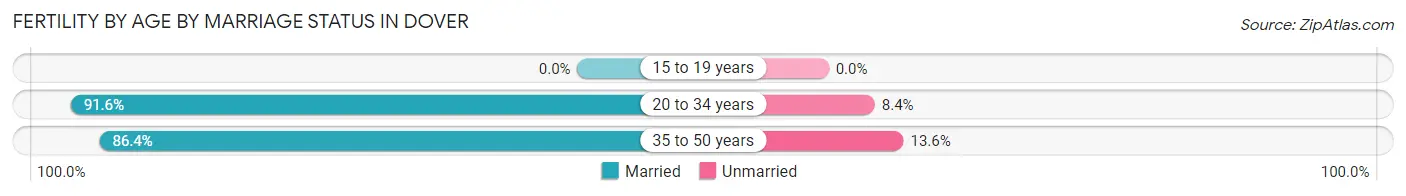
| Age Bracket | Married | Unmarried |
| 15 to 19 years | 0 (0.0%) | 0 (0.0%) |
| 20 to 34 years | 208 (91.6%) | 19 (8.4%) |
| 35 to 50 years | 172 (86.4%) | 27 (13.6%) |
| Total | 380 (89.2%) | 46 (10.8%) |
Fertility by Education in Dover
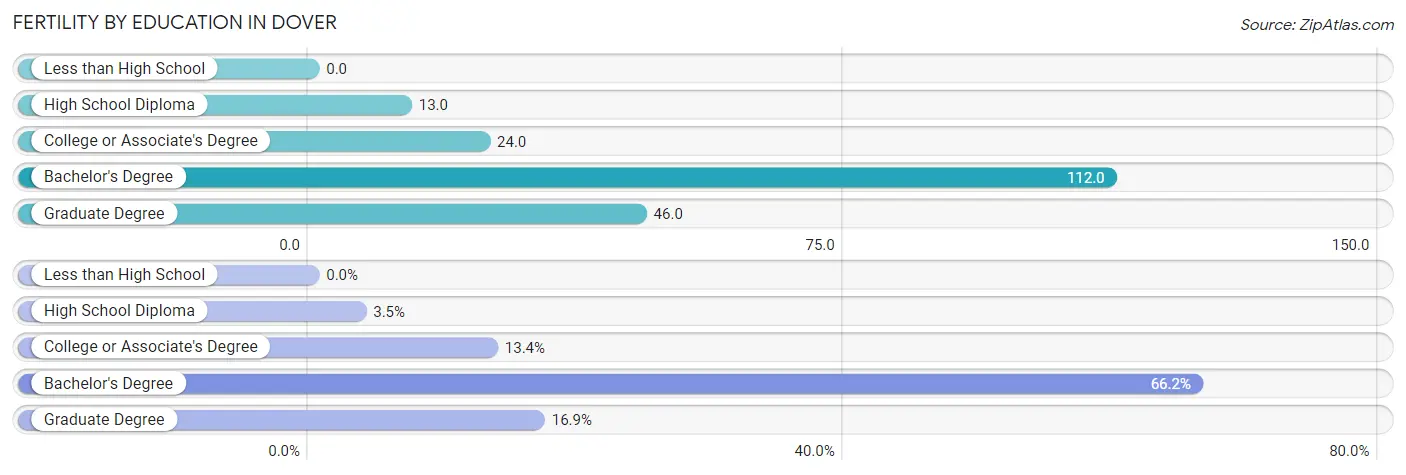
| Educational Attainment | Women with Births | Births / 1,000 Women |
| Less than High School | 0 (0.0%) | 0.0 |
| High School Diploma | 15 (3.5%) | 13.0 |
| College or Associate's Degree | 57 (13.4%) | 24.0 |
| Bachelor's Degree | 282 (66.2%) | 112.0 |
| Graduate Degree | 72 (16.9%) | 46.0 |
| Total | 426 (100.0%) | 50.0 |
Fertility by Education by Marriage Status in Dover
10.8% of women with births in Dover are unmarried. Women with the educational attainment of high school diploma are most likely to be married with 100.0% of them married at childbirth, while women with the educational attainment of bachelor's degree are least likely to be married with 16.3% of them unmarried at childbirth.
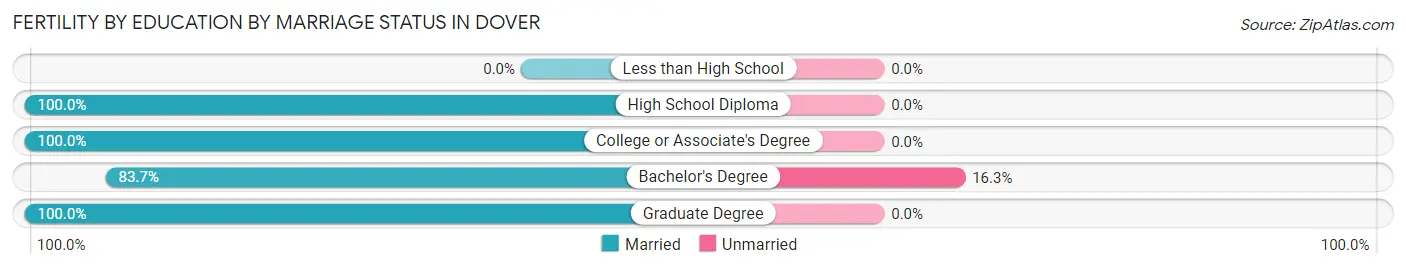
| Educational Attainment | Married | Unmarried |
| Less than High School | 0 (0.0%) | 0 (0.0%) |
| High School Diploma | 15 (100.0%) | 0 (0.0%) |
| College or Associate's Degree | 57 (100.0%) | 0 (0.0%) |
| Bachelor's Degree | 236 (83.7%) | 46 (16.3%) |
| Graduate Degree | 72 (100.0%) | 0 (0.0%) |
| Total | 380 (89.2%) | 46 (10.8%) |
Employment Characteristics in Dover
Employment by Class of Employer in Dover
Among the 19,243 employed individuals in Dover, private company employees (13,123 | 68.2%), not-for-profit organizations (1,758 | 9.1%), and local government employees (1,053 | 5.5%) make up the most common classes of employment.
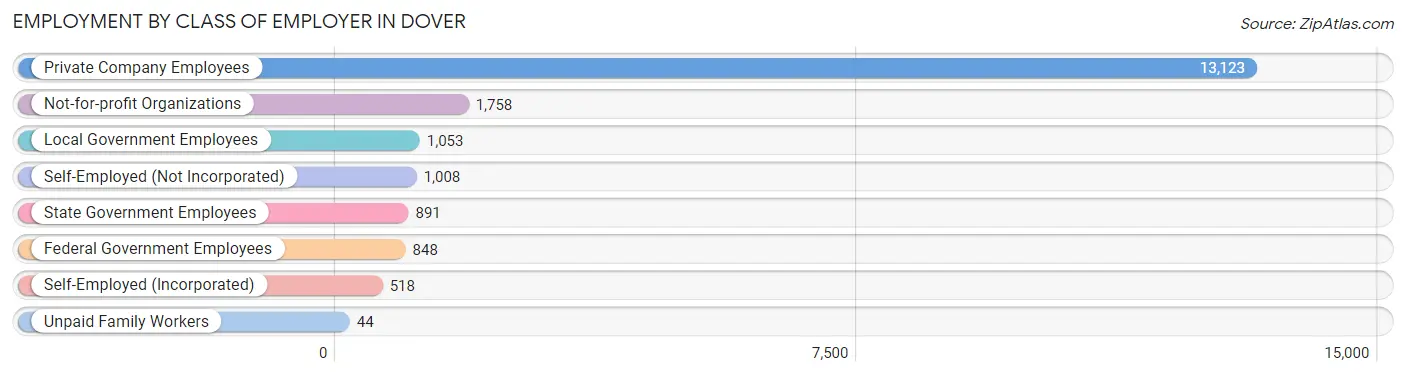
| Employer Class | # Employees | % Employees |
| Private Company Employees | 13,123 | 68.2% |
| Self-Employed (Incorporated) | 518 | 2.7% |
| Self-Employed (Not Incorporated) | 1,008 | 5.2% |
| Not-for-profit Organizations | 1,758 | 9.1% |
| Local Government Employees | 1,053 | 5.5% |
| State Government Employees | 891 | 4.6% |
| Federal Government Employees | 848 | 4.4% |
| Unpaid Family Workers | 44 | 0.2% |
| Total | 19,243 | 100.0% |
Employment Status by Age in Dover
According to the labor force statistics for Dover, out of the total population over 16 years of age (27,847), 72.5% or 20,189 individuals are in the labor force, with 3.7% or 747 of them unemployed. The age group with the highest labor force participation rate is 35 to 44 years, with 91.4% or 3,959 individuals in the labor force. Within the labor force, the 16 to 19 years age range has the highest percentage of unemployed individuals, with 11.7% or 53 of them being unemployed.
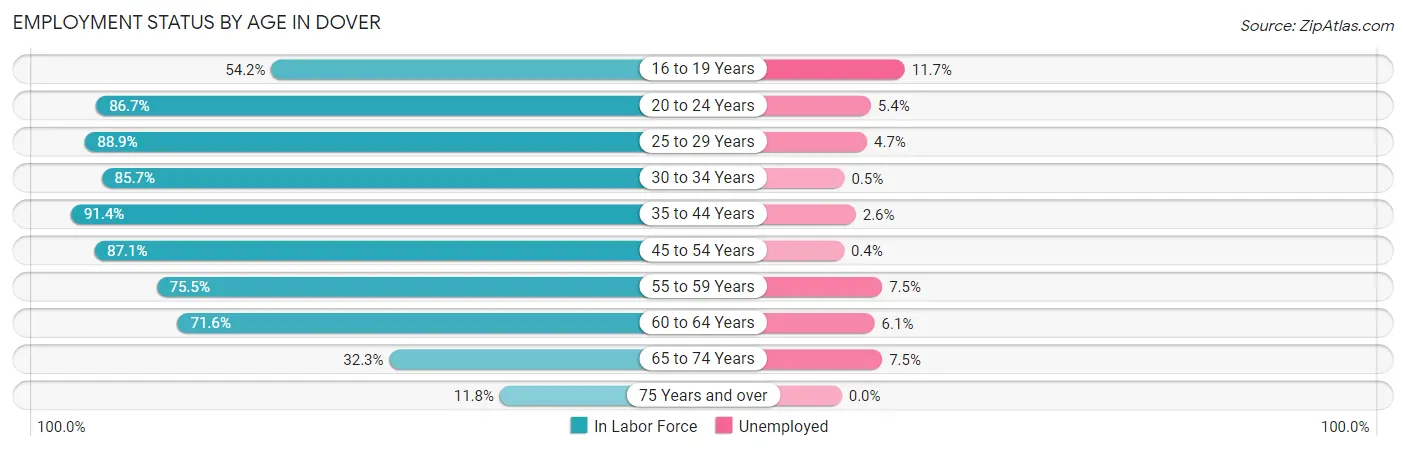
| Age Bracket | In Labor Force | Unemployed |
| 16 to 19 Years | 454 (54.2%) | 53 (11.7%) |
| 20 to 24 Years | 2,861 (86.7%) | 154 (5.4%) |
| 25 to 29 Years | 2,813 (88.9%) | 132 (4.7%) |
| 30 to 34 Years | 2,559 (85.7%) | 13 (0.5%) |
| 35 to 44 Years | 3,959 (91.4%) | 103 (2.6%) |
| 45 to 54 Years | 3,357 (87.1%) | 13 (0.4%) |
| 55 to 59 Years | 1,652 (75.5%) | 124 (7.5%) |
| 60 to 64 Years | 1,258 (71.6%) | 77 (6.1%) |
| 65 to 74 Years | 986 (32.3%) | 74 (7.5%) |
| 75 Years and over | 280 (11.8%) | 0 (0.0%) |
| Total | 20,189 (72.5%) | 747 (3.7%) |
Employment Status by Educational Attainment in Dover
According to labor force statistics for Dover, 85.3% of individuals (15,594) out of the total population between 25 and 64 years of age (18,281) are in the labor force, with 3.0% or 468 of them being unemployed. The group with the highest labor force participation rate are those with the educational attainment of bachelor's degree or higher, with 91.1% or 9,001 individuals in the labor force. Within the labor force, individuals with less than high school education have the highest percentage of unemployment, with 7.5% or 18 of them being unemployed.
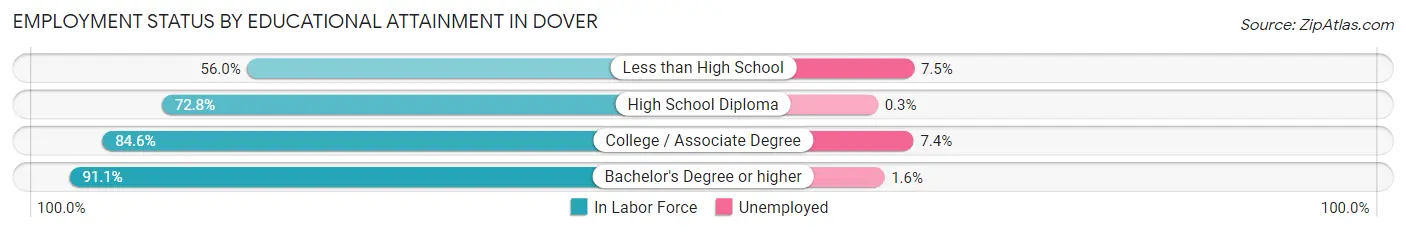
| Educational Attainment | In Labor Force | Unemployed |
| Less than High School | 241 (56.0%) | 32 (7.5%) |
| High School Diploma | 2,399 (72.8%) | 10 (0.3%) |
| College / Associate Degree | 3,955 (84.6%) | 346 (7.4%) |
| Bachelor's Degree or higher | 9,001 (91.1%) | 158 (1.6%) |
| Total | 15,594 (85.3%) | 548 (3.0%) |
Employment Occupations by Sex in Dover
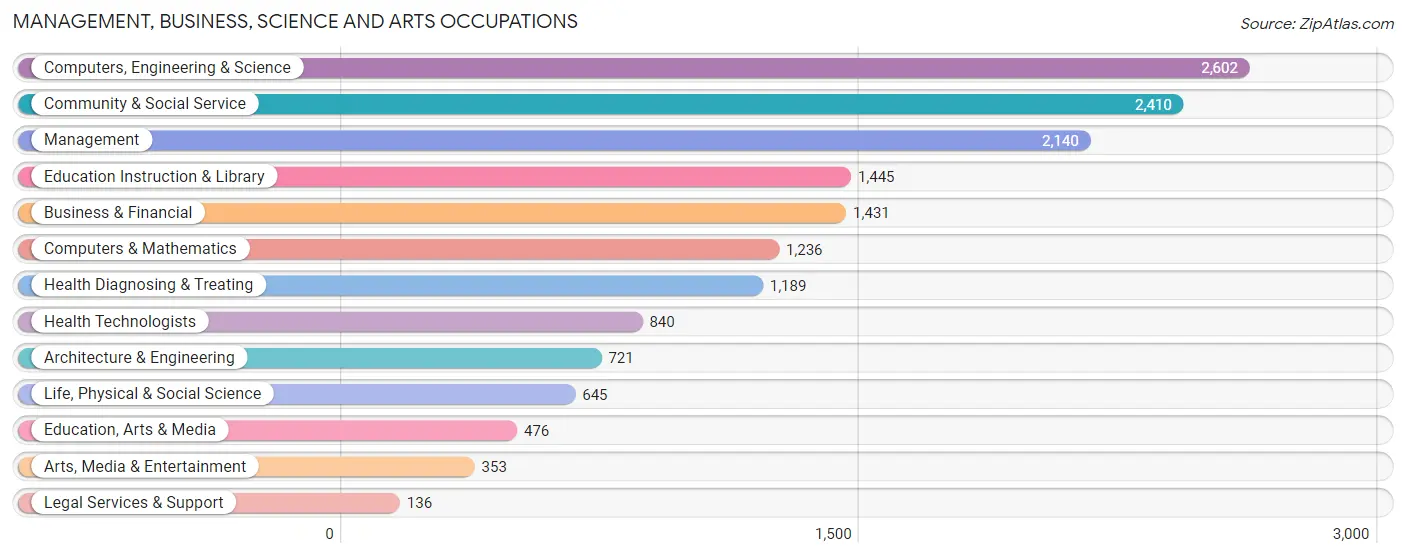
Management, Business, Science and Arts Occupations
The most common Management, Business, Science and Arts occupations in Dover are Computers, Engineering & Science (2,602 | 13.5%), Community & Social Service (2,410 | 12.5%), Management (2,140 | 11.1%), Education Instruction & Library (1,445 | 7.5%), and Business & Financial (1,431 | 7.4%).
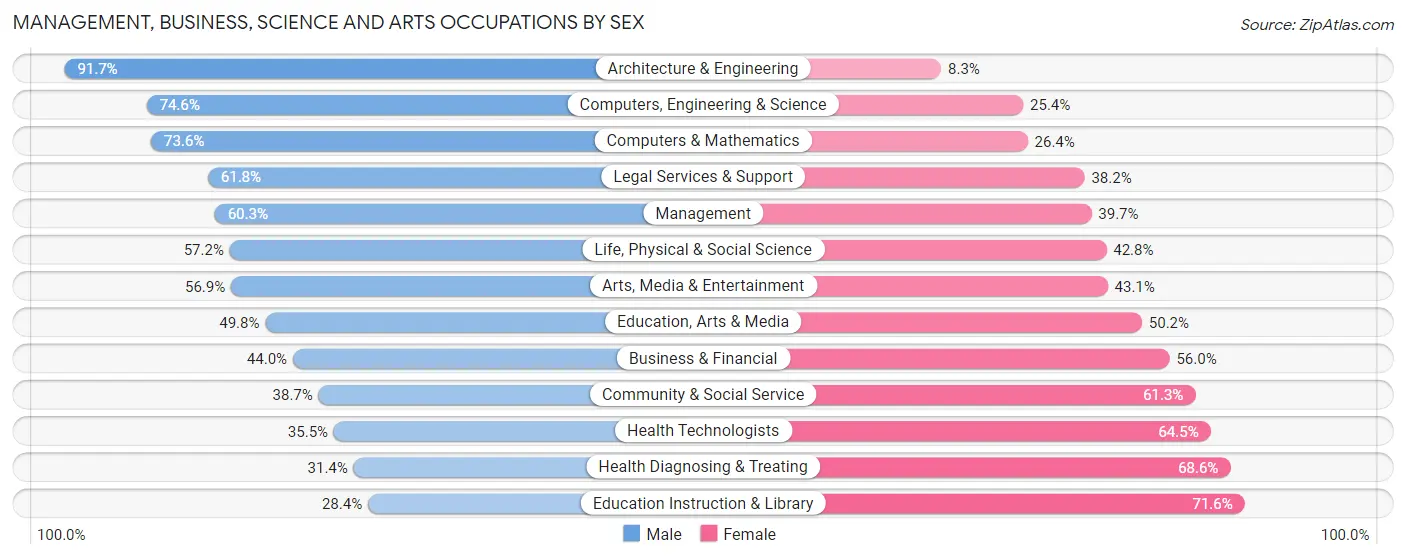
Management, Business, Science and Arts Occupations by Sex
Within the Management, Business, Science and Arts occupations in Dover, the most male-oriented occupations are Architecture & Engineering (91.7%), Computers, Engineering & Science (74.6%), and Computers & Mathematics (73.6%), while the most female-oriented occupations are Education Instruction & Library (71.6%), Health Diagnosing & Treating (68.6%), and Health Technologists (64.5%).
| Occupation | Male | Female |
| Management | 1,291 (60.3%) | 849 (39.7%) |
| Business & Financial | 630 (44.0%) | 801 (56.0%) |
| Computers, Engineering & Science | 1,940 (74.6%) | 662 (25.4%) |
| Computers & Mathematics | 910 (73.6%) | 326 (26.4%) |
| Architecture & Engineering | 661 (91.7%) | 60 (8.3%) |
| Life, Physical & Social Science | 369 (57.2%) | 276 (42.8%) |
| Community & Social Service | 932 (38.7%) | 1,478 (61.3%) |
| Education, Arts & Media | 237 (49.8%) | 239 (50.2%) |
| Legal Services & Support | 84 (61.8%) | 52 (38.2%) |
| Education Instruction & Library | 410 (28.4%) | 1,035 (71.6%) |
| Arts, Media & Entertainment | 201 (56.9%) | 152 (43.1%) |
| Health Diagnosing & Treating | 373 (31.4%) | 816 (68.6%) |
| Health Technologists | 298 (35.5%) | 542 (64.5%) |
| Total (Category) | 5,166 (52.9%) | 4,606 (47.1%) |
| Total (Overall) | 10,531 (54.4%) | 8,816 (45.6%) |
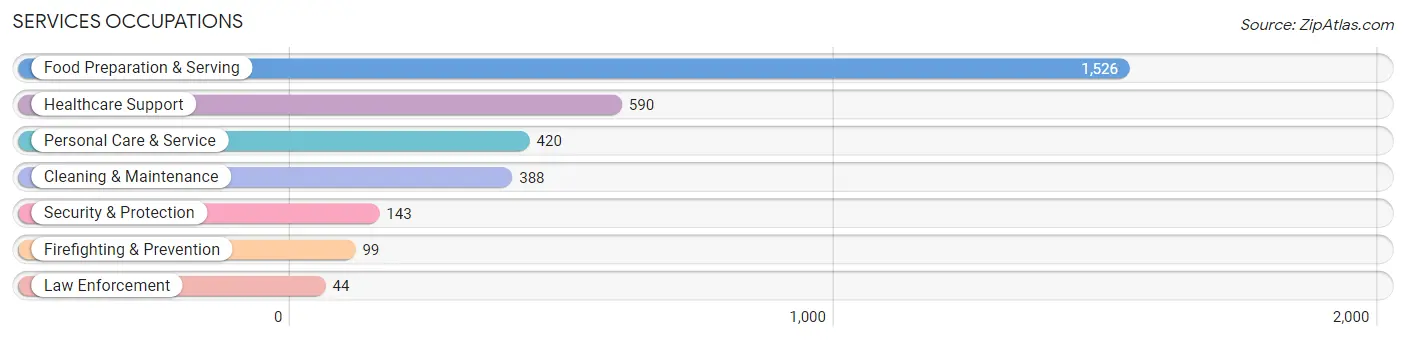
Services Occupations
The most common Services occupations in Dover are Food Preparation & Serving (1,526 | 7.9%), Healthcare Support (590 | 3.0%), Personal Care & Service (420 | 2.2%), Cleaning & Maintenance (388 | 2.0%), and Security & Protection (143 | 0.7%).
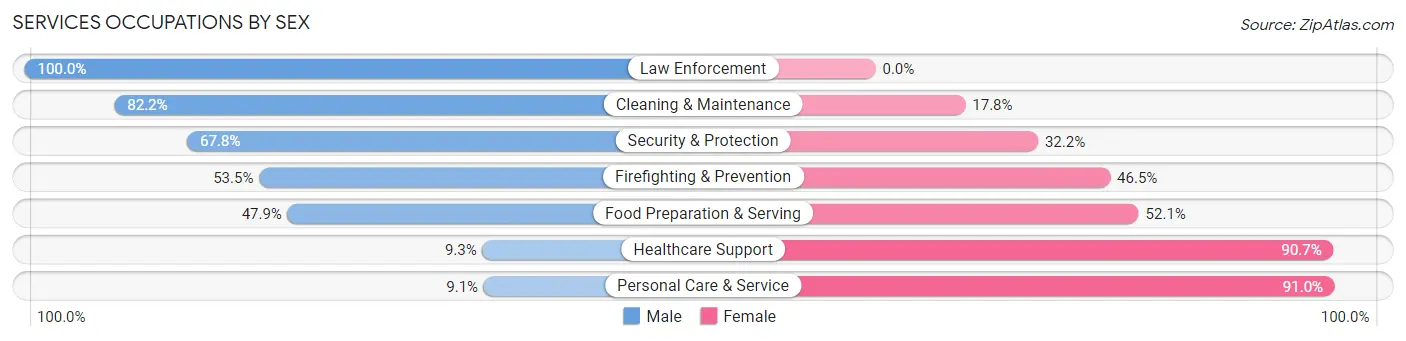
Services Occupations by Sex
Within the Services occupations in Dover, the most male-oriented occupations are Law Enforcement (100.0%), Cleaning & Maintenance (82.2%), and Security & Protection (67.8%), while the most female-oriented occupations are Personal Care & Service (90.9%), Healthcare Support (90.7%), and Food Preparation & Serving (52.1%).
| Occupation | Male | Female |
| Healthcare Support | 55 (9.3%) | 535 (90.7%) |
| Security & Protection | 97 (67.8%) | 46 (32.2%) |
| Firefighting & Prevention | 53 (53.5%) | 46 (46.5%) |
| Law Enforcement | 44 (100.0%) | 0 (0.0%) |
| Food Preparation & Serving | 731 (47.9%) | 795 (52.1%) |
| Cleaning & Maintenance | 319 (82.2%) | 69 (17.8%) |
| Personal Care & Service | 38 (9.0%) | 382 (90.9%) |
| Total (Category) | 1,240 (40.4%) | 1,827 (59.6%) |
| Total (Overall) | 10,531 (54.4%) | 8,816 (45.6%) |
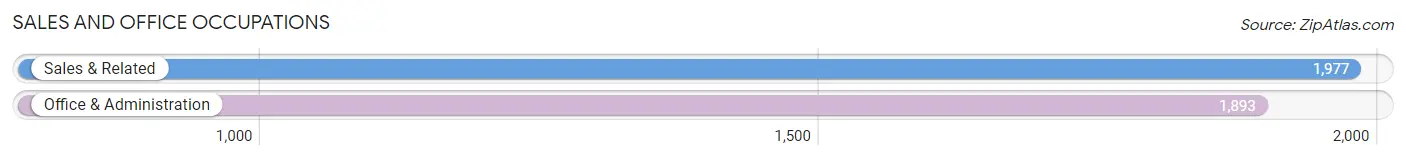
Sales and Office Occupations
The most common Sales and Office occupations in Dover are Sales & Related (1,977 | 10.2%), and Office & Administration (1,893 | 9.8%).
Sales and Office Occupations by Sex
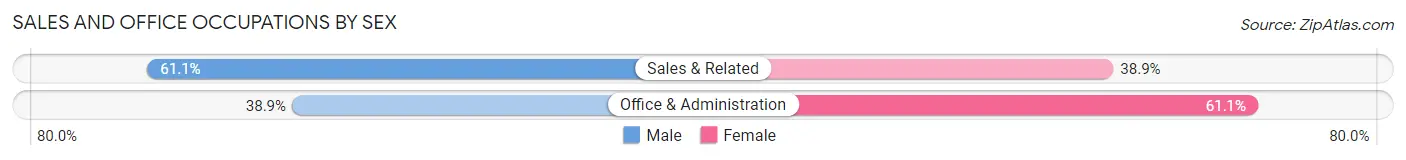
| Occupation | Male | Female |
| Sales & Related | 1,208 (61.1%) | 769 (38.9%) |
| Office & Administration | 736 (38.9%) | 1,157 (61.1%) |
| Total (Category) | 1,944 (50.2%) | 1,926 (49.8%) |
| Total (Overall) | 10,531 (54.4%) | 8,816 (45.6%) |
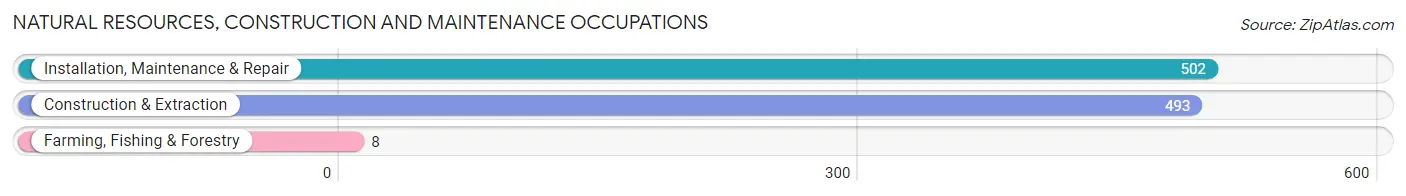
Natural Resources, Construction and Maintenance Occupations
The most common Natural Resources, Construction and Maintenance occupations in Dover are Installation, Maintenance & Repair (502 | 2.6%), Construction & Extraction (493 | 2.5%), and Farming, Fishing & Forestry (8 | 0.0%).
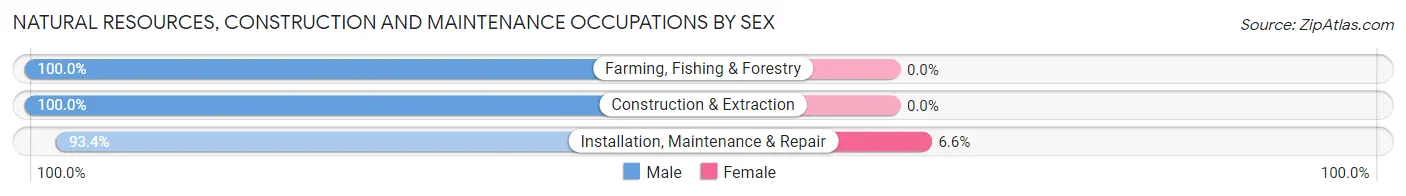
Natural Resources, Construction and Maintenance Occupations by Sex
| Occupation | Male | Female |
| Farming, Fishing & Forestry | 8 (100.0%) | 0 (0.0%) |
| Construction & Extraction | 493 (100.0%) | 0 (0.0%) |
| Installation, Maintenance & Repair | 469 (93.4%) | 33 (6.6%) |
| Total (Category) | 970 (96.7%) | 33 (3.3%) |
| Total (Overall) | 10,531 (54.4%) | 8,816 (45.6%) |
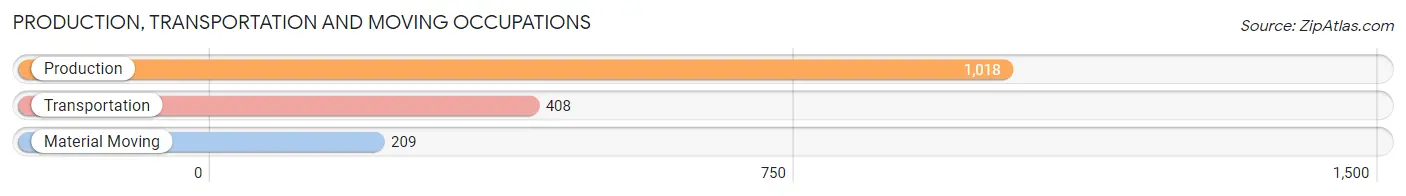
Production, Transportation and Moving Occupations
The most common Production, Transportation and Moving occupations in Dover are Production (1,018 | 5.3%), Transportation (408 | 2.1%), and Material Moving (209 | 1.1%).
Production, Transportation and Moving Occupations by Sex
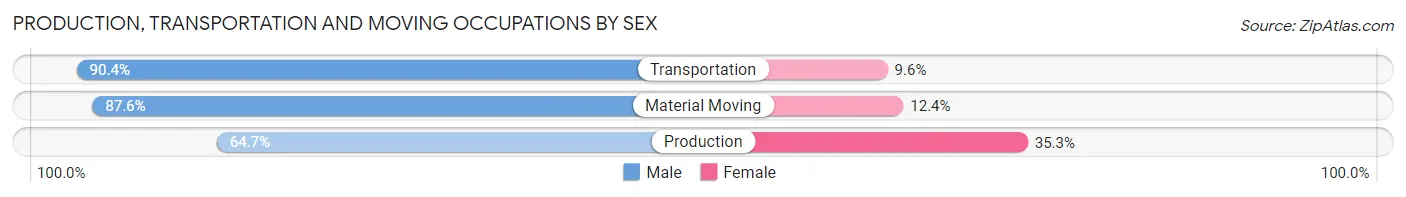
| Occupation | Male | Female |
| Production | 659 (64.7%) | 359 (35.3%) |
| Transportation | 369 (90.4%) | 39 (9.6%) |
| Material Moving | 183 (87.6%) | 26 (12.4%) |
| Total (Category) | 1,211 (74.1%) | 424 (25.9%) |
| Total (Overall) | 10,531 (54.4%) | 8,816 (45.6%) |
Employment Industries by Sex in Dover
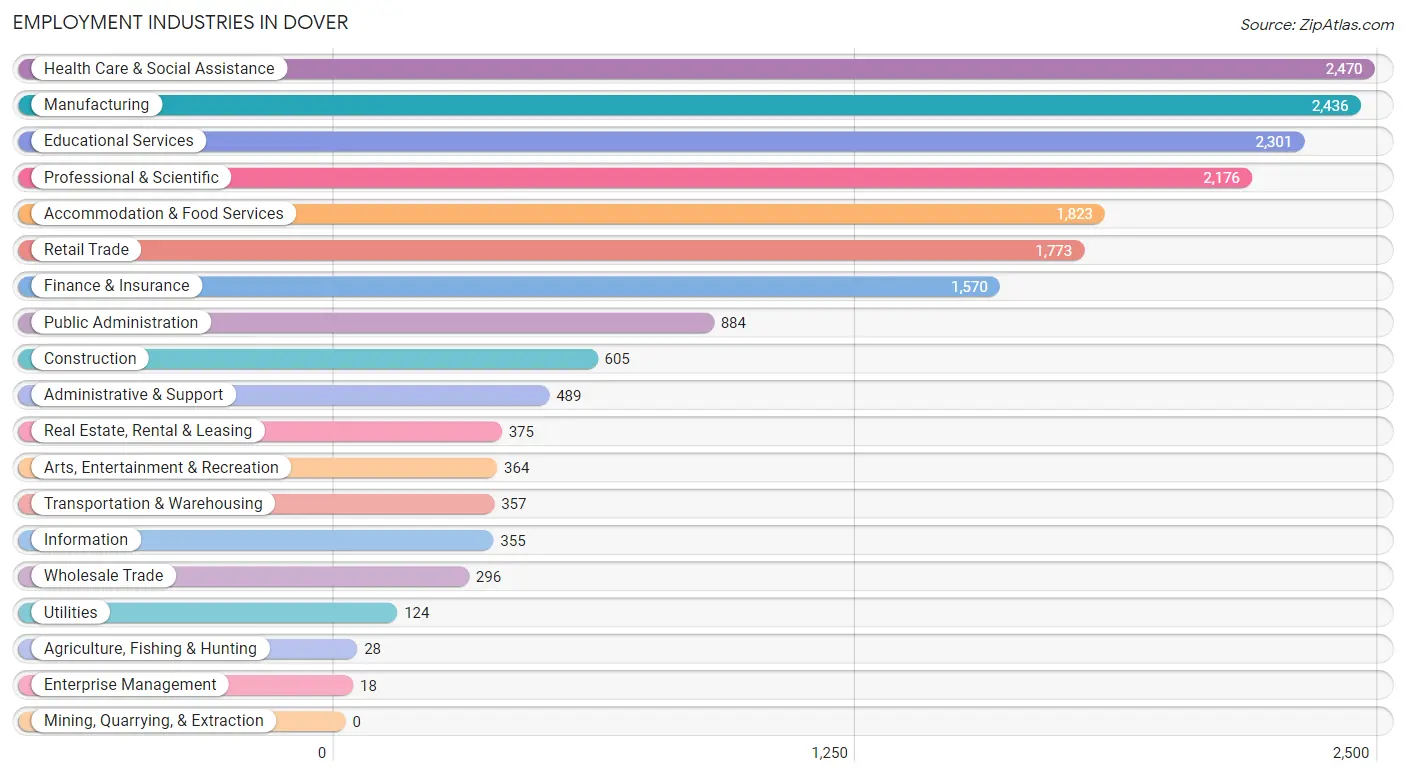
Employment Industries in Dover
The major employment industries in Dover include Health Care & Social Assistance (2,470 | 12.8%), Manufacturing (2,436 | 12.6%), Educational Services (2,301 | 11.9%), Professional & Scientific (2,176 | 11.3%), and Accommodation & Food Services (1,823 | 9.4%).
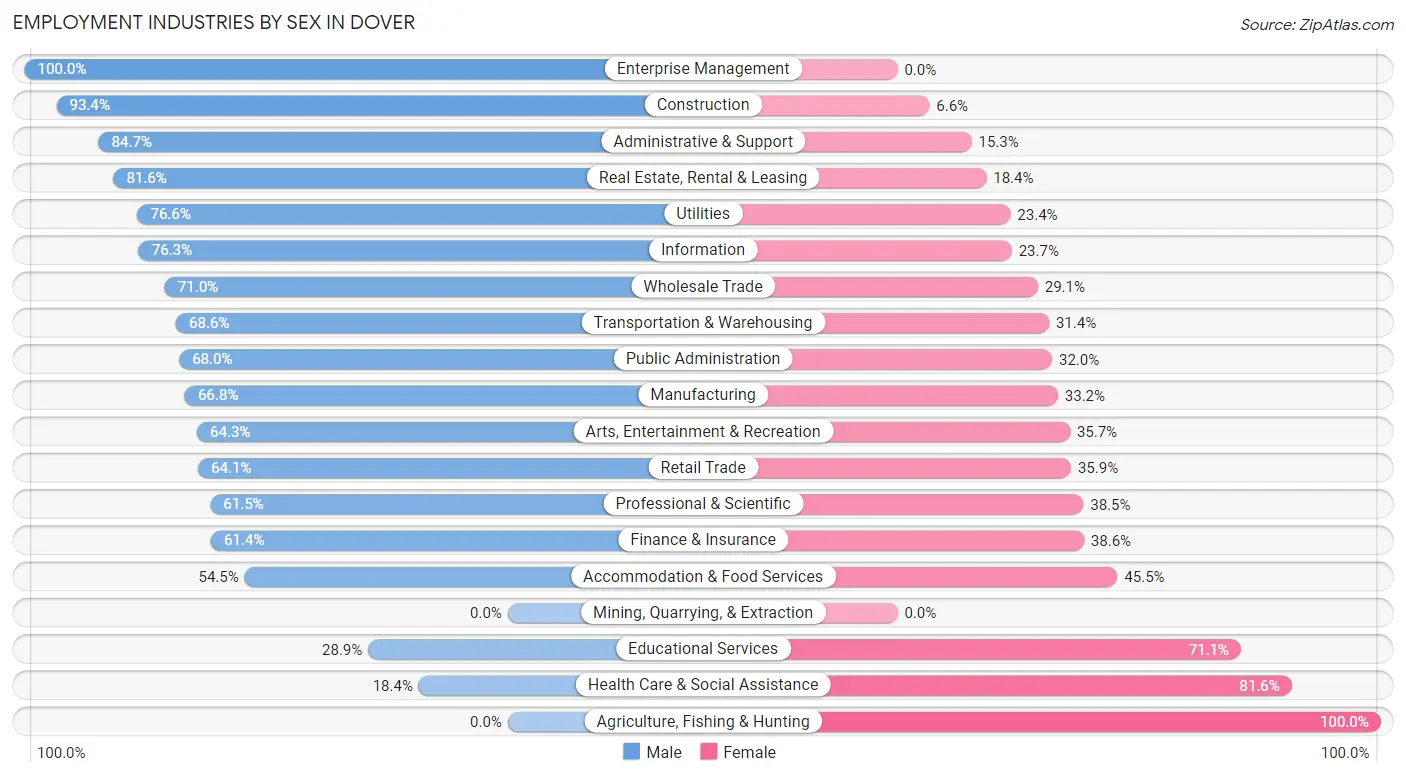
Employment Industries by Sex in Dover
The Dover industries that see more men than women are Enterprise Management (100.0%), Construction (93.4%), and Administrative & Support (84.7%), whereas the industries that tend to have a higher number of women are Agriculture, Fishing & Hunting (100.0%), Health Care & Social Assistance (81.6%), and Educational Services (71.1%).
| Industry | Male | Female |
| Agriculture, Fishing & Hunting | 0 (0.0%) | 28 (100.0%) |
| Mining, Quarrying, & Extraction | 0 (0.0%) | 0 (0.0%) |
| Construction | 565 (93.4%) | 40 (6.6%) |
| Manufacturing | 1,627 (66.8%) | 809 (33.2%) |
| Wholesale Trade | 210 (71.0%) | 86 (29.0%) |
| Retail Trade | 1,136 (64.1%) | 637 (35.9%) |
| Transportation & Warehousing | 245 (68.6%) | 112 (31.4%) |
| Utilities | 95 (76.6%) | 29 (23.4%) |
| Information | 271 (76.3%) | 84 (23.7%) |
| Finance & Insurance | 964 (61.4%) | 606 (38.6%) |
| Real Estate, Rental & Leasing | 306 (81.6%) | 69 (18.4%) |
| Professional & Scientific | 1,339 (61.5%) | 837 (38.5%) |
| Enterprise Management | 18 (100.0%) | 0 (0.0%) |
| Administrative & Support | 414 (84.7%) | 75 (15.3%) |
| Educational Services | 665 (28.9%) | 1,636 (71.1%) |
| Health Care & Social Assistance | 455 (18.4%) | 2,015 (81.6%) |
| Arts, Entertainment & Recreation | 234 (64.3%) | 130 (35.7%) |
| Accommodation & Food Services | 993 (54.5%) | 830 (45.5%) |
| Public Administration | 601 (68.0%) | 283 (32.0%) |
| Total | 10,531 (54.4%) | 8,816 (45.6%) |
Education in Dover
School Enrollment in Dover
The most common levels of schooling among the 6,214 students in Dover are high school (1,288 | 20.7%), middle school (1,187 | 19.1%), and graduate / professional (1,059 | 17.0%).
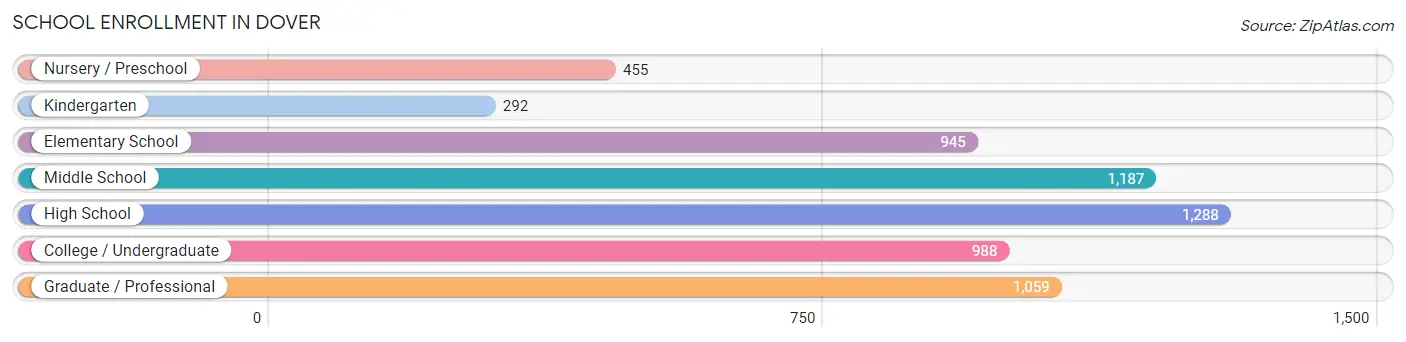
| School Level | # Students | % Students |
| Nursery / Preschool | 455 | 7.3% |
| Kindergarten | 292 | 4.7% |
| Elementary School | 945 | 15.2% |
| Middle School | 1,187 | 19.1% |
| High School | 1,288 | 20.7% |
| College / Undergraduate | 988 | 15.9% |
| Graduate / Professional | 1,059 | 17.0% |
| Total | 6,214 | 100.0% |
School Enrollment by Age by Funding Source in Dover
Out of a total of 6,214 students who are enrolled in schools in Dover, 1,398 (22.5%) attend a private institution, while the remaining 4,816 (77.5%) are enrolled in public schools. The age group of 3 to 4 year olds has the highest likelihood of being enrolled in private schools, with 264 (75.6% in the age bracket) enrolled. Conversely, the age group of 15 to 17 year olds has the lowest likelihood of being enrolled in a private school, with 1,034 (95.9% in the age bracket) attending a public institution.
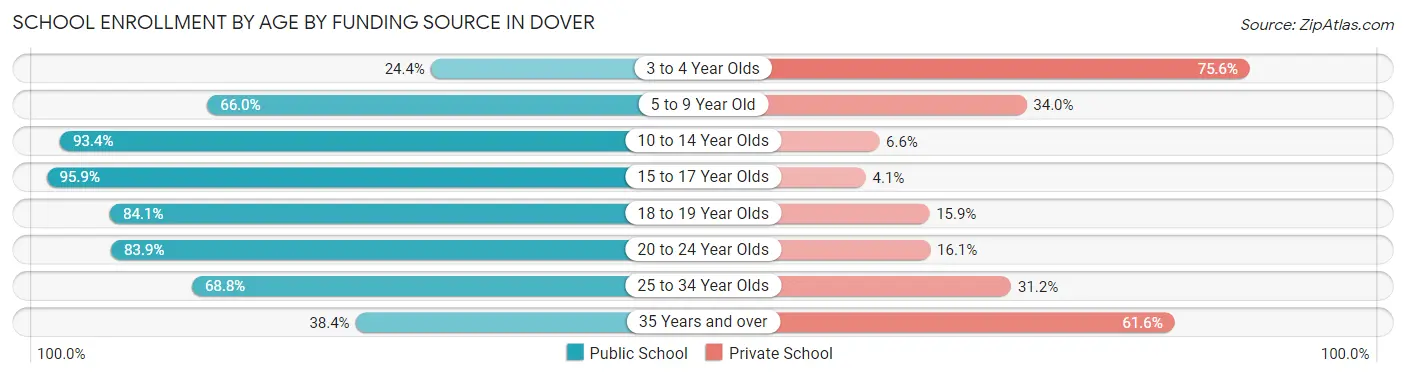
| Age Bracket | Public School | Private School |
| 3 to 4 Year Olds | 85 (24.4%) | 264 (75.6%) |
| 5 to 9 Year Old | 822 (66.0%) | 424 (34.0%) |
| 10 to 14 Year Olds | 1,344 (93.4%) | 95 (6.6%) |
| 15 to 17 Year Olds | 1,034 (95.9%) | 44 (4.1%) |
| 18 to 19 Year Olds | 95 (84.1%) | 18 (15.9%) |
| 20 to 24 Year Olds | 860 (83.9%) | 165 (16.1%) |
| 25 to 34 Year Olds | 468 (68.8%) | 212 (31.2%) |
| 35 Years and over | 109 (38.4%) | 175 (61.6%) |
| Total | 4,816 (77.5%) | 1,398 (22.5%) |
Educational Attainment by Field of Study in Dover
Business (2,426 | 18.9%), engineering (1,339 | 10.4%), science & technology (1,304 | 10.1%), education (989 | 7.7%), and social sciences (922 | 7.2%) are the most common fields of study among 12,863 individuals in Dover who have obtained a bachelor's degree or higher.
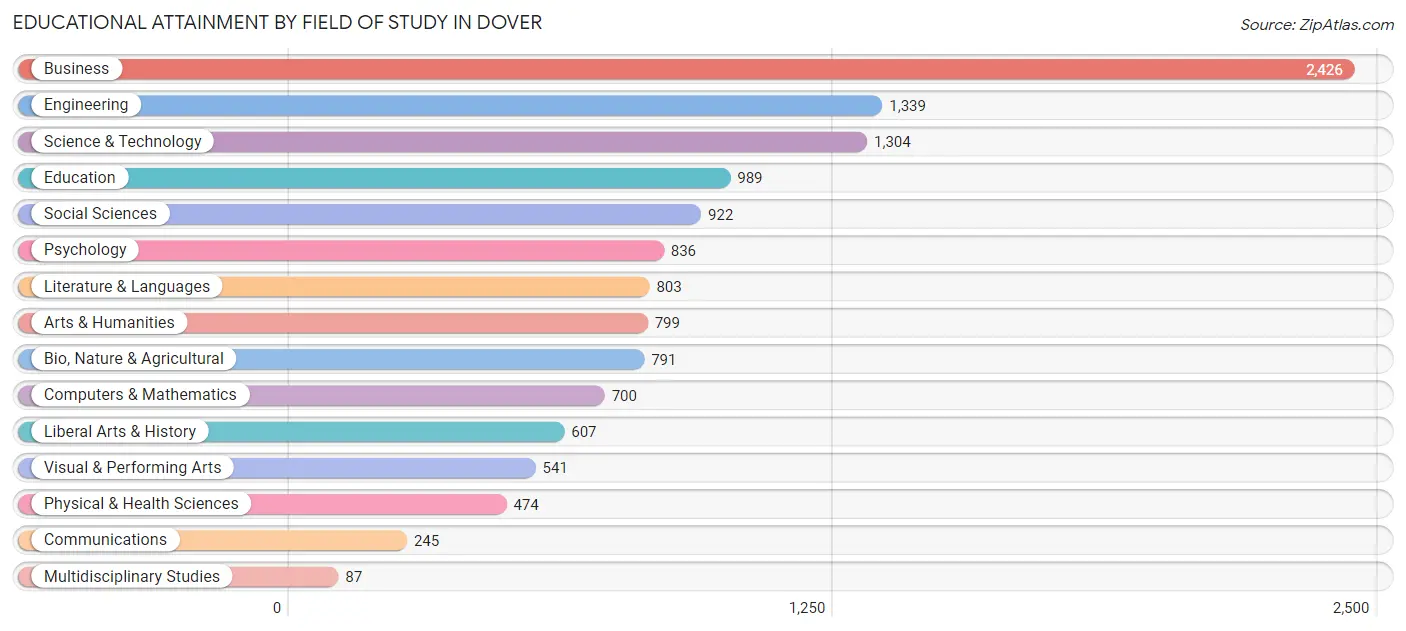
| Field of Study | # Graduates | % Graduates |
| Computers & Mathematics | 700 | 5.4% |
| Bio, Nature & Agricultural | 791 | 6.1% |
| Physical & Health Sciences | 474 | 3.7% |
| Psychology | 836 | 6.5% |
| Social Sciences | 922 | 7.2% |
| Engineering | 1,339 | 10.4% |
| Multidisciplinary Studies | 87 | 0.7% |
| Science & Technology | 1,304 | 10.1% |
| Business | 2,426 | 18.9% |
| Education | 989 | 7.7% |
| Literature & Languages | 803 | 6.2% |
| Liberal Arts & History | 607 | 4.7% |
| Visual & Performing Arts | 541 | 4.2% |
| Communications | 245 | 1.9% |
| Arts & Humanities | 799 | 6.2% |
| Total | 12,863 | 100.0% |
Transportation & Commute in Dover
Vehicle Availability by Sex in Dover
The most prevalent vehicle ownership categories in Dover are males with 2 vehicles (5,298, accounting for 50.6%) and females with 2 vehicles (4,418, making up 60.5%).
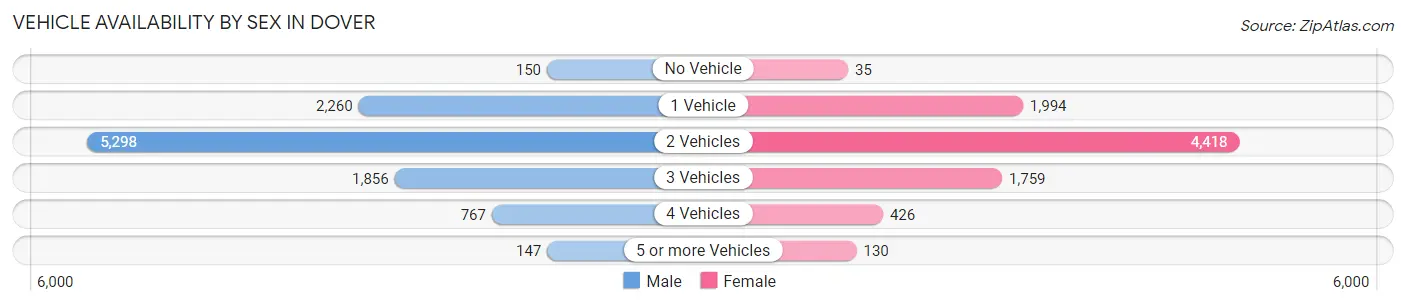
| Vehicles Available | Male | Female |
| No Vehicle | 150 (1.4%) | 35 (0.4%) |
| 1 Vehicle | 2,260 (21.6%) | 1,994 (22.8%) |
| 2 Vehicles | 5,298 (50.6%) | 4,418 (50.4%) |
| 3 Vehicles | 1,856 (17.7%) | 1,759 (20.1%) |
| 4 Vehicles | 767 (7.3%) | 426 (4.9%) |
| 5 or more Vehicles | 147 (1.4%) | 130 (1.5%) |
| Total | 10,478 (100.0%) | 8,762 (100.0%) |
Commute Time in Dover
The most frequently occuring commute durations in Dover are 20 to 24 minutes (3,237 commuters, 19.7%), 15 to 19 minutes (2,962 commuters, 18.0%), and 10 to 14 minutes (2,816 commuters, 17.2%).
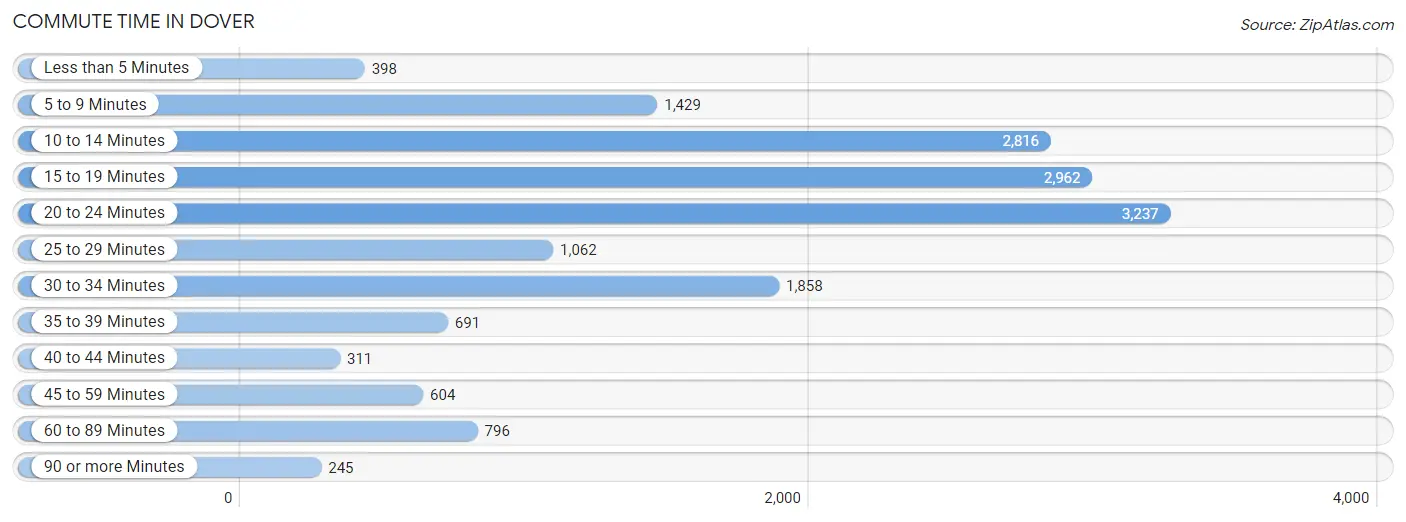
| Commute Time | # Commuters | % Commuters |
| Less than 5 Minutes | 398 | 2.4% |
| 5 to 9 Minutes | 1,429 | 8.7% |
| 10 to 14 Minutes | 2,816 | 17.2% |
| 15 to 19 Minutes | 2,962 | 18.0% |
| 20 to 24 Minutes | 3,237 | 19.7% |
| 25 to 29 Minutes | 1,062 | 6.5% |
| 30 to 34 Minutes | 1,858 | 11.3% |
| 35 to 39 Minutes | 691 | 4.2% |
| 40 to 44 Minutes | 311 | 1.9% |
| 45 to 59 Minutes | 604 | 3.7% |
| 60 to 89 Minutes | 796 | 4.9% |
| 90 or more Minutes | 245 | 1.5% |
Commute Time by Sex in Dover
The most common commute times in Dover are 20 to 24 minutes (1,939 commuters, 22.0%) for males and 10 to 14 minutes (1,495 commuters, 19.7%) for females.
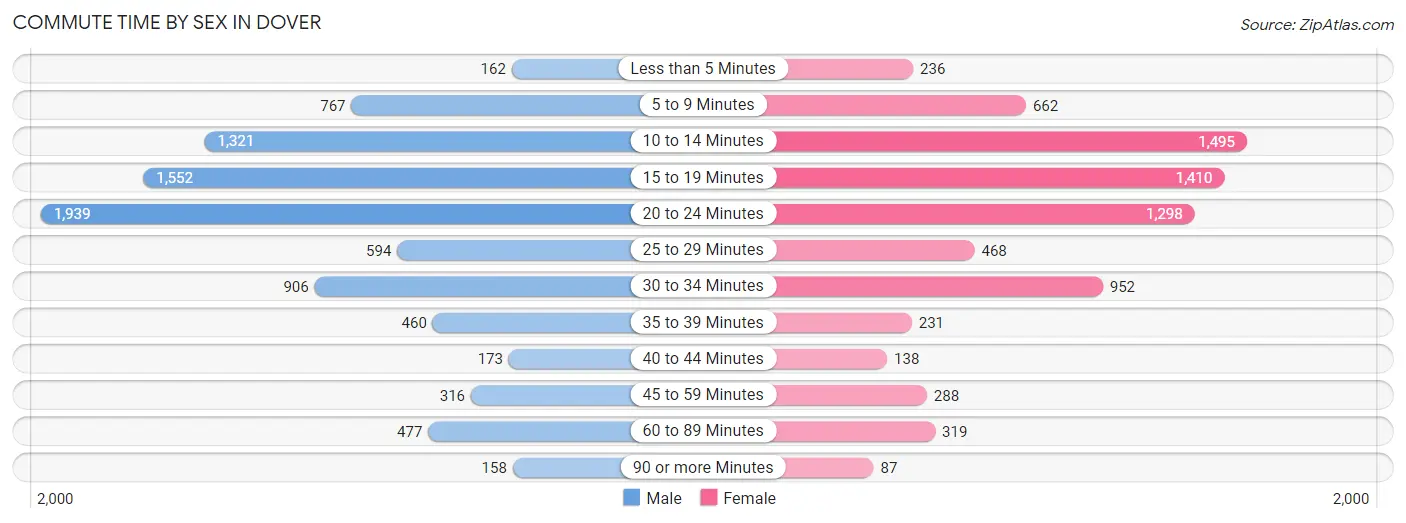
| Commute Time | Male | Female |
| Less than 5 Minutes | 162 (1.8%) | 236 (3.1%) |
| 5 to 9 Minutes | 767 (8.7%) | 662 (8.7%) |
| 10 to 14 Minutes | 1,321 (15.0%) | 1,495 (19.7%) |
| 15 to 19 Minutes | 1,552 (17.6%) | 1,410 (18.6%) |
| 20 to 24 Minutes | 1,939 (22.0%) | 1,298 (17.1%) |
| 25 to 29 Minutes | 594 (6.7%) | 468 (6.2%) |
| 30 to 34 Minutes | 906 (10.3%) | 952 (12.6%) |
| 35 to 39 Minutes | 460 (5.2%) | 231 (3.0%) |
| 40 to 44 Minutes | 173 (2.0%) | 138 (1.8%) |
| 45 to 59 Minutes | 316 (3.6%) | 288 (3.8%) |
| 60 to 89 Minutes | 477 (5.4%) | 319 (4.2%) |
| 90 or more Minutes | 158 (1.8%) | 87 (1.1%) |
Time of Departure to Work by Sex in Dover
The most frequent times of departure to work in Dover are 7:30 AM to 7:59 AM (1,427, 16.2%) for males and 7:30 AM to 7:59 AM (1,416, 18.7%) for females.
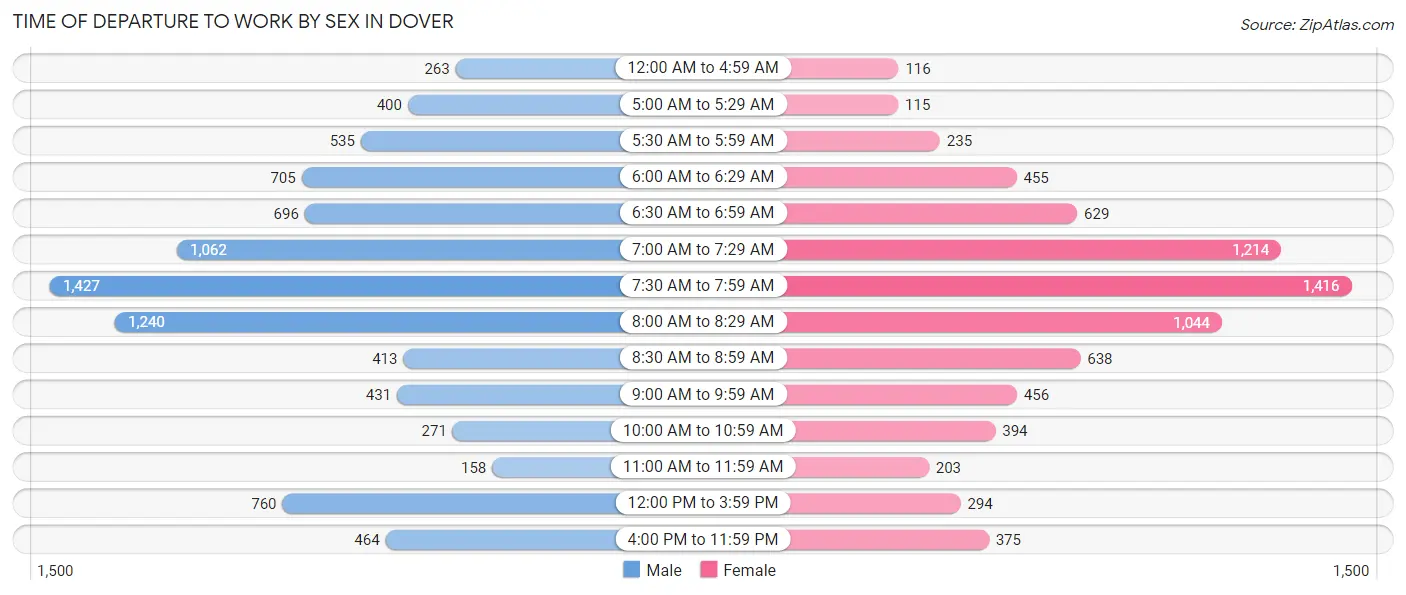
| Time of Departure | Male | Female |
| 12:00 AM to 4:59 AM | 263 (3.0%) | 116 (1.5%) |
| 5:00 AM to 5:29 AM | 400 (4.5%) | 115 (1.5%) |
| 5:30 AM to 5:59 AM | 535 (6.1%) | 235 (3.1%) |
| 6:00 AM to 6:29 AM | 705 (8.0%) | 455 (6.0%) |
| 6:30 AM to 6:59 AM | 696 (7.9%) | 629 (8.3%) |
| 7:00 AM to 7:29 AM | 1,062 (12.0%) | 1,214 (16.0%) |
| 7:30 AM to 7:59 AM | 1,427 (16.2%) | 1,416 (18.7%) |
| 8:00 AM to 8:29 AM | 1,240 (14.1%) | 1,044 (13.8%) |
| 8:30 AM to 8:59 AM | 413 (4.7%) | 638 (8.4%) |
| 9:00 AM to 9:59 AM | 431 (4.9%) | 456 (6.0%) |
| 10:00 AM to 10:59 AM | 271 (3.1%) | 394 (5.2%) |
| 11:00 AM to 11:59 AM | 158 (1.8%) | 203 (2.7%) |
| 12:00 PM to 3:59 PM | 760 (8.6%) | 294 (3.9%) |
| 4:00 PM to 11:59 PM | 464 (5.3%) | 375 (4.9%) |
| Total | 8,825 (100.0%) | 7,584 (100.0%) |
Housing Occupancy in Dover
Occupancy by Ownership in Dover
Of the total 14,606 dwellings in Dover, owner-occupied units account for 7,585 (51.9%), while renter-occupied units make up 7,021 (48.1%).
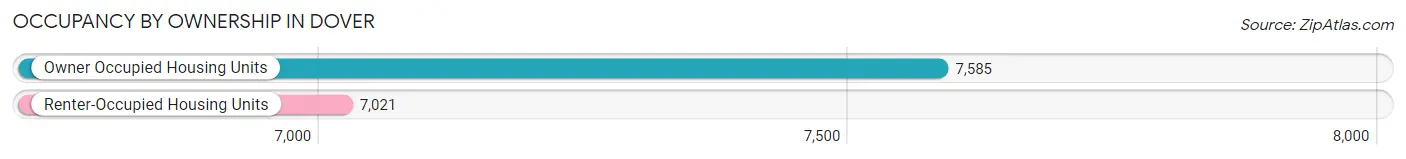
| Occupancy | # Housing Units | % Housing Units |
| Owner Occupied Housing Units | 7,585 | 51.9% |
| Renter-Occupied Housing Units | 7,021 | 48.1% |
| Total Occupied Housing Units | 14,606 | 100.0% |
Occupancy by Household Size in Dover
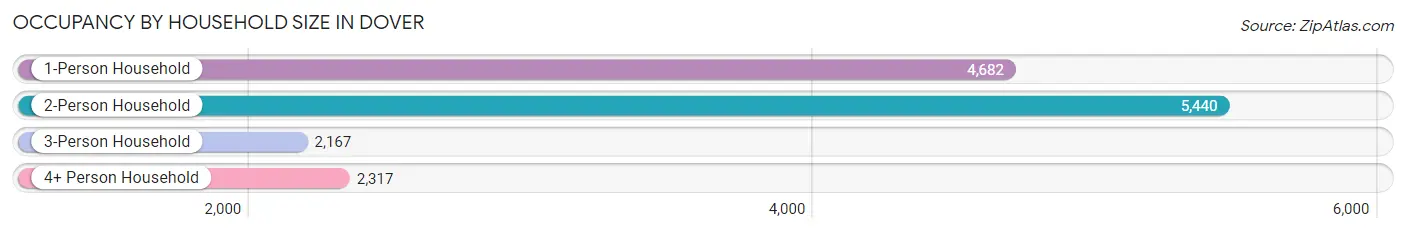
| Household Size | # Housing Units | % Housing Units |
| 1-Person Household | 4,682 | 32.1% |
| 2-Person Household | 5,440 | 37.2% |
| 3-Person Household | 2,167 | 14.8% |
| 4+ Person Household | 2,317 | 15.9% |
| Total Housing Units | 14,606 | 100.0% |
Occupancy by Ownership by Household Size in Dover
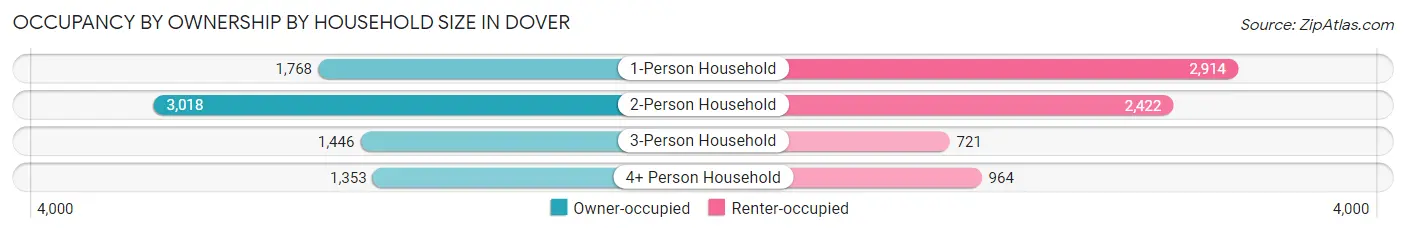
| Household Size | Owner-occupied | Renter-occupied |
| 1-Person Household | 1,768 (37.8%) | 2,914 (62.2%) |
| 2-Person Household | 3,018 (55.5%) | 2,422 (44.5%) |
| 3-Person Household | 1,446 (66.7%) | 721 (33.3%) |
| 4+ Person Household | 1,353 (58.4%) | 964 (41.6%) |
| Total Housing Units | 7,585 (51.9%) | 7,021 (48.1%) |
Occupancy by Educational Attainment in Dover
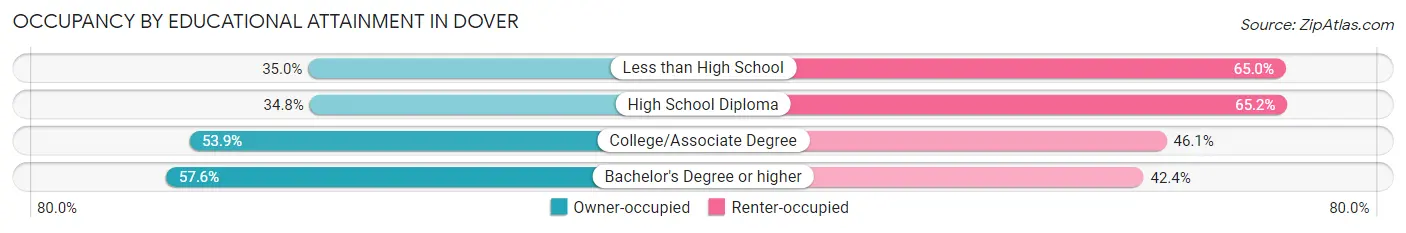
| Household Size | Owner-occupied | Renter-occupied |
| Less than High School | 159 (35.0%) | 295 (65.0%) |
| High School Diploma | 905 (34.8%) | 1,696 (65.2%) |
| College/Associate Degree | 1,930 (53.9%) | 1,649 (46.1%) |
| Bachelor's Degree or higher | 4,591 (57.6%) | 3,381 (42.4%) |
Occupancy by Age of Householder in Dover
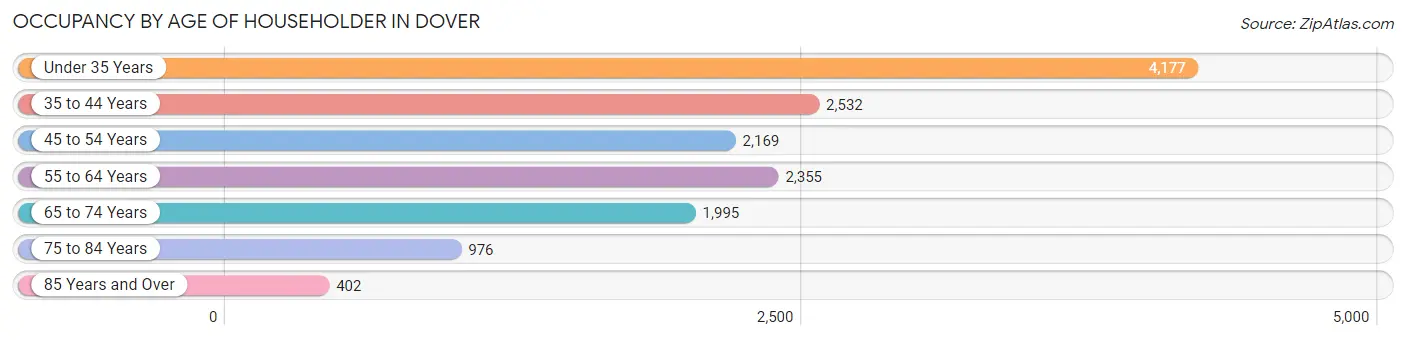
| Age Bracket | # Households | % Households |
| Under 35 Years | 4,177 | 28.6% |
| 35 to 44 Years | 2,532 | 17.3% |
| 45 to 54 Years | 2,169 | 14.8% |
| 55 to 64 Years | 2,355 | 16.1% |
| 65 to 74 Years | 1,995 | 13.7% |
| 75 to 84 Years | 976 | 6.7% |
| 85 Years and Over | 402 | 2.8% |
| Total | 14,606 | 100.0% |
Housing Finances in Dover
Median Income by Occupancy in Dover
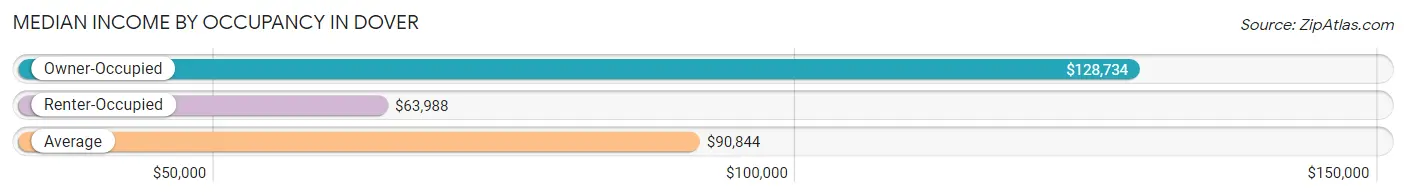
| Occupancy Type | # Households | Median Income |
| Owner-Occupied | 7,585 (51.9%) | $128,734 |
| Renter-Occupied | 7,021 (48.1%) | $63,988 |
| Average | 14,606 (100.0%) | $90,844 |
Occupancy by Householder Income Bracket in Dover
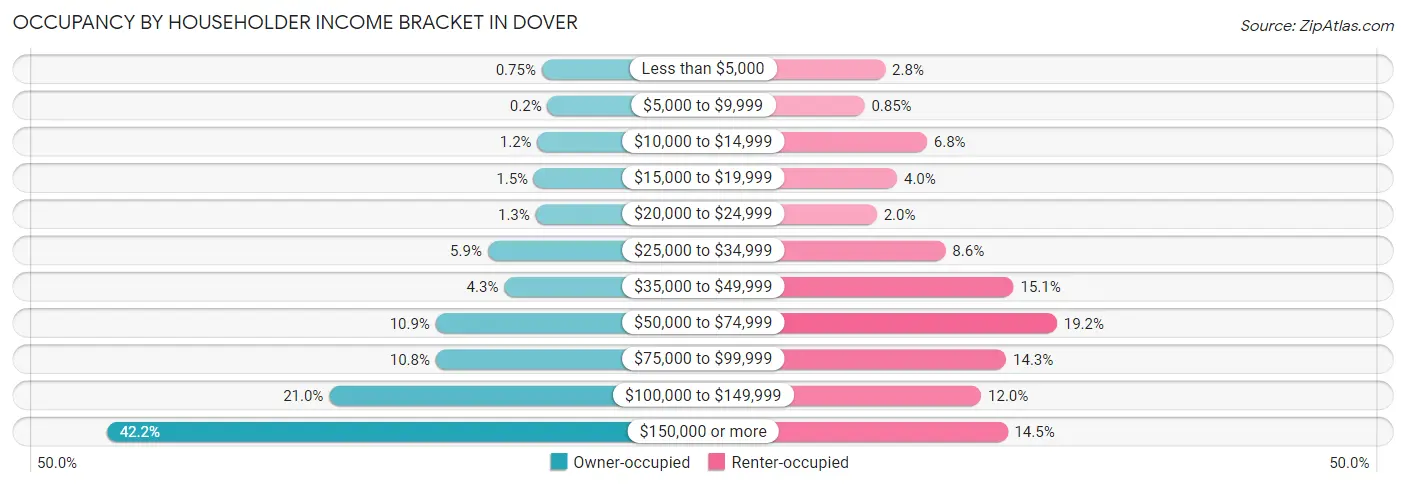
| Income Bracket | Owner-occupied | Renter-occupied |
| Less than $5,000 | 57 (0.7%) | 198 (2.8%) |
| $5,000 to $9,999 | 15 (0.2%) | 60 (0.9%) |
| $10,000 to $14,999 | 88 (1.2%) | 477 (6.8%) |
| $15,000 to $19,999 | 113 (1.5%) | 277 (4.0%) |
| $20,000 to $24,999 | 101 (1.3%) | 142 (2.0%) |
| $25,000 to $34,999 | 447 (5.9%) | 601 (8.6%) |
| $35,000 to $49,999 | 328 (4.3%) | 1,057 (15.0%) |
| $50,000 to $74,999 | 823 (10.8%) | 1,346 (19.2%) |
| $75,000 to $99,999 | 822 (10.8%) | 1,007 (14.3%) |
| $100,000 to $149,999 | 1,592 (21.0%) | 840 (12.0%) |
| $150,000 or more | 3,199 (42.2%) | 1,016 (14.5%) |
| Total | 7,585 (100.0%) | 7,021 (100.0%) |
Monthly Housing Cost Tiers in Dover
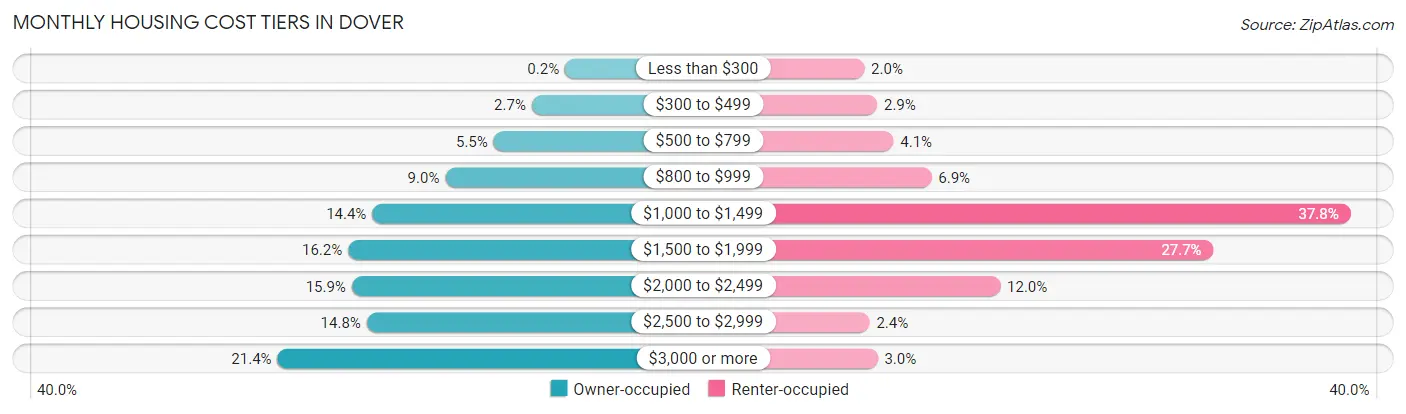
| Monthly Cost | Owner-occupied | Renter-occupied |
| Less than $300 | 15 (0.2%) | 138 (2.0%) |
| $300 to $499 | 201 (2.6%) | 205 (2.9%) |
| $500 to $799 | 414 (5.5%) | 289 (4.1%) |
| $800 to $999 | 684 (9.0%) | 486 (6.9%) |
| $1,000 to $1,499 | 1,092 (14.4%) | 2,653 (37.8%) |
| $1,500 to $1,999 | 1,227 (16.2%) | 1,944 (27.7%) |
| $2,000 to $2,499 | 1,207 (15.9%) | 841 (12.0%) |
| $2,500 to $2,999 | 1,123 (14.8%) | 166 (2.4%) |
| $3,000 or more | 1,622 (21.4%) | 207 (2.9%) |
| Total | 7,585 (100.0%) | 7,021 (100.0%) |
Physical Housing Characteristics in Dover
Housing Structures in Dover
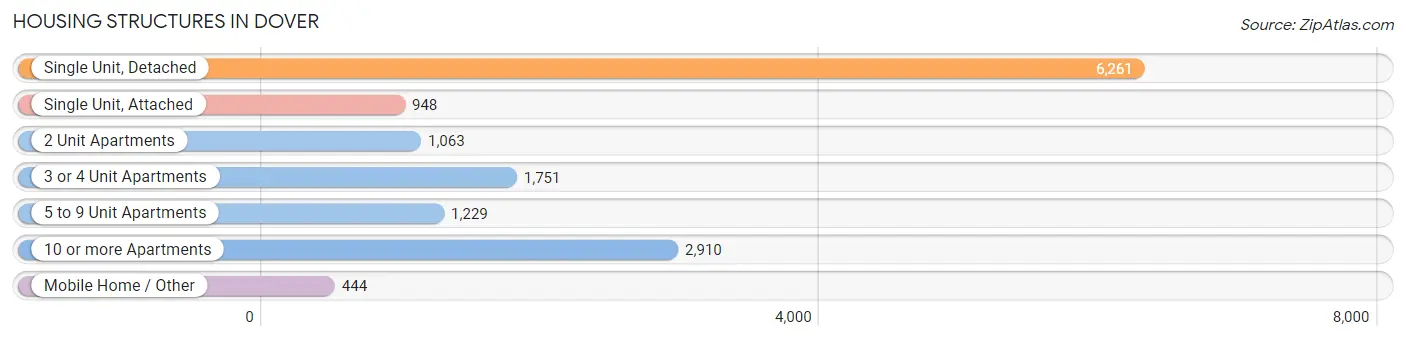
| Structure Type | # Housing Units | % Housing Units |
| Single Unit, Detached | 6,261 | 42.9% |
| Single Unit, Attached | 948 | 6.5% |
| 2 Unit Apartments | 1,063 | 7.3% |
| 3 or 4 Unit Apartments | 1,751 | 12.0% |
| 5 to 9 Unit Apartments | 1,229 | 8.4% |
| 10 or more Apartments | 2,910 | 19.9% |
| Mobile Home / Other | 444 | 3.0% |
| Total | 14,606 | 100.0% |
Housing Structures by Occupancy in Dover
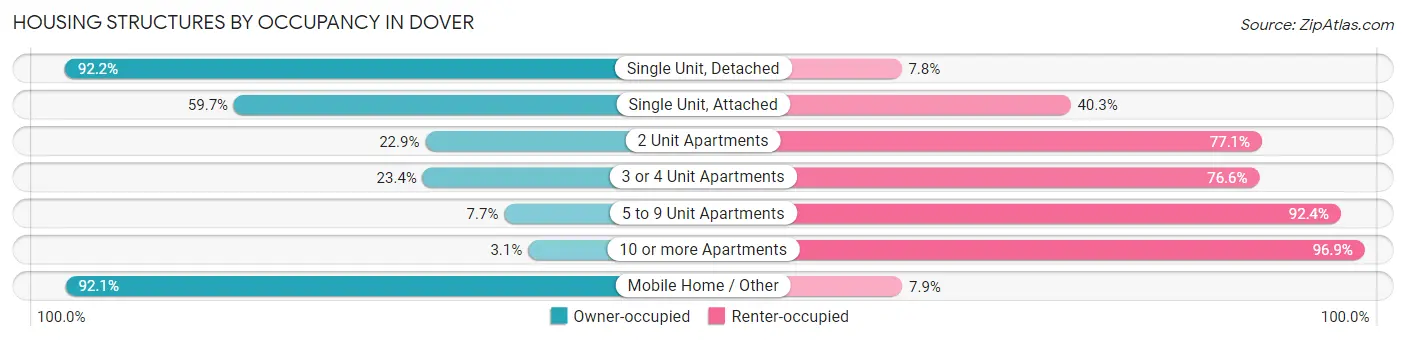
| Structure Type | Owner-occupied | Renter-occupied |
| Single Unit, Detached | 5,775 (92.2%) | 486 (7.8%) |
| Single Unit, Attached | 566 (59.7%) | 382 (40.3%) |
| 2 Unit Apartments | 243 (22.9%) | 820 (77.1%) |
| 3 or 4 Unit Apartments | 409 (23.4%) | 1,342 (76.6%) |
| 5 to 9 Unit Apartments | 94 (7.6%) | 1,135 (92.3%) |
| 10 or more Apartments | 89 (3.1%) | 2,821 (96.9%) |
| Mobile Home / Other | 409 (92.1%) | 35 (7.9%) |
| Total | 7,585 (51.9%) | 7,021 (48.1%) |
Housing Structures by Number of Rooms in Dover
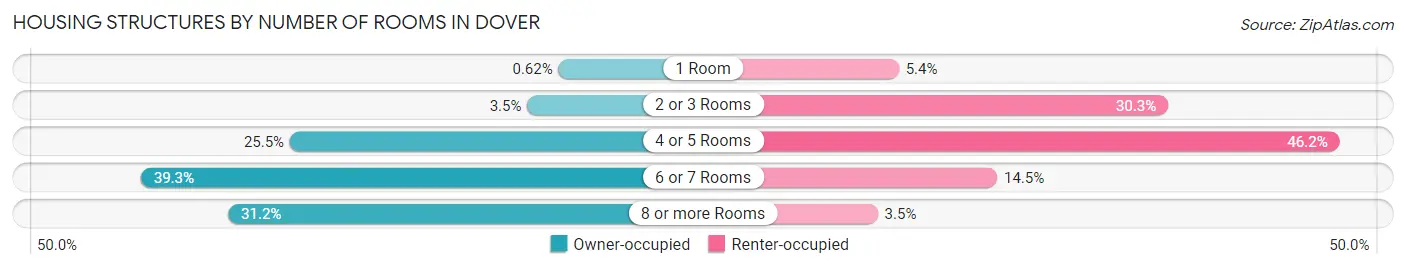
| Number of Rooms | Owner-occupied | Renter-occupied |
| 1 Room | 47 (0.6%) | 382 (5.4%) |
| 2 or 3 Rooms | 266 (3.5%) | 2,130 (30.3%) |
| 4 or 5 Rooms | 1,931 (25.5%) | 3,244 (46.2%) |
| 6 or 7 Rooms | 2,977 (39.3%) | 1,020 (14.5%) |
| 8 or more Rooms | 2,364 (31.2%) | 245 (3.5%) |
| Total | 7,585 (100.0%) | 7,021 (100.0%) |
Housing Structure by Heating Type in Dover
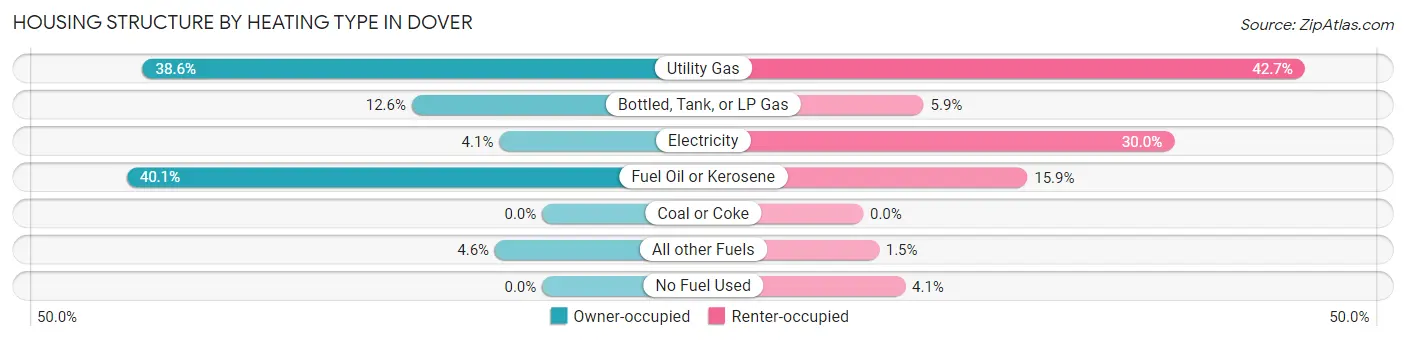
| Heating Type | Owner-occupied | Renter-occupied |
| Utility Gas | 2,927 (38.6%) | 2,995 (42.7%) |
| Bottled, Tank, or LP Gas | 955 (12.6%) | 411 (5.9%) |
| Electricity | 314 (4.1%) | 2,109 (30.0%) |
| Fuel Oil or Kerosene | 3,043 (40.1%) | 1,114 (15.9%) |
| Coal or Coke | 0 (0.0%) | 0 (0.0%) |
| All other Fuels | 346 (4.6%) | 107 (1.5%) |
| No Fuel Used | 0 (0.0%) | 285 (4.1%) |
| Total | 7,585 (100.0%) | 7,021 (100.0%) |
Household Vehicle Usage in Dover
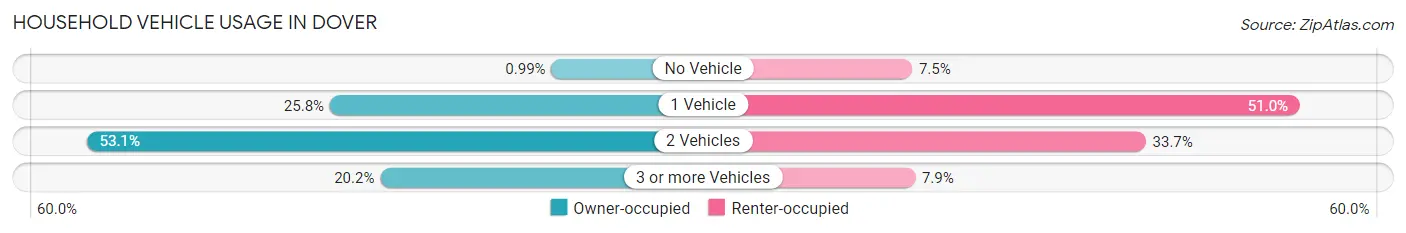
| Vehicles per Household | Owner-occupied | Renter-occupied |
| No Vehicle | 75 (1.0%) | 527 (7.5%) |
| 1 Vehicle | 1,957 (25.8%) | 3,578 (51.0%) |
| 2 Vehicles | 4,024 (53.0%) | 2,365 (33.7%) |
| 3 or more Vehicles | 1,529 (20.2%) | 551 (7.9%) |
| Total | 7,585 (100.0%) | 7,021 (100.0%) |
Real Estate & Mortgages in Dover
Real Estate and Mortgage Overview in Dover
| Characteristic | Without Mortgage | With Mortgage |
| Housing Units | 2,543 | 5,042 |
| Median Property Value | $336,200 | $379,600 |
| Median Household Income | $99,491 | $2,536 |
| Monthly Housing Costs | $1,015 | $1,584 |
| Real Estate Taxes | $7,158 | $84 |
Property Value by Mortgage Status in Dover
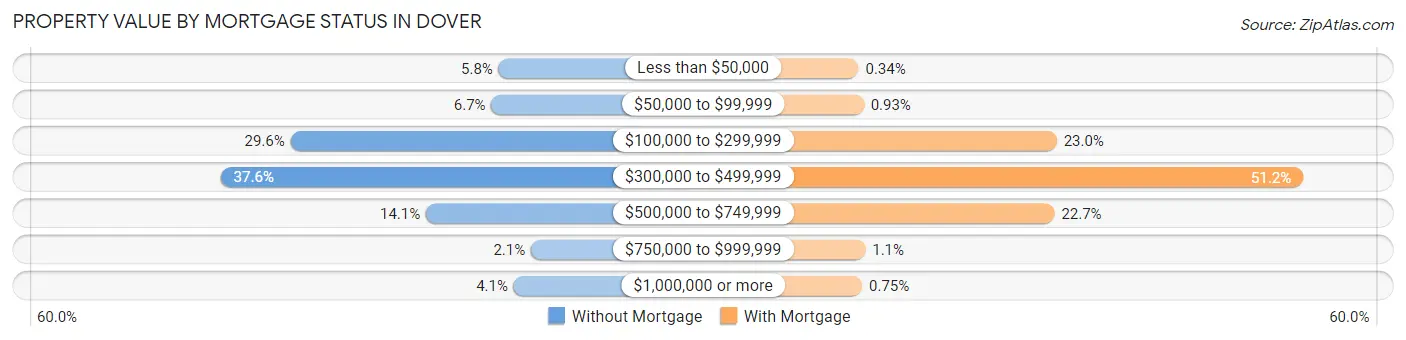
| Property Value | Without Mortgage | With Mortgage |
| Less than $50,000 | 148 (5.8%) | 17 (0.3%) |
| $50,000 to $99,999 | 169 (6.7%) | 47 (0.9%) |
| $100,000 to $299,999 | 753 (29.6%) | 1,159 (23.0%) |
| $300,000 to $499,999 | 956 (37.6%) | 2,579 (51.1%) |
| $500,000 to $749,999 | 359 (14.1%) | 1,146 (22.7%) |
| $750,000 to $999,999 | 54 (2.1%) | 56 (1.1%) |
| $1,000,000 or more | 104 (4.1%) | 38 (0.7%) |
| Total | 2,543 (100.0%) | 5,042 (100.0%) |
Household Income by Mortgage Status in Dover
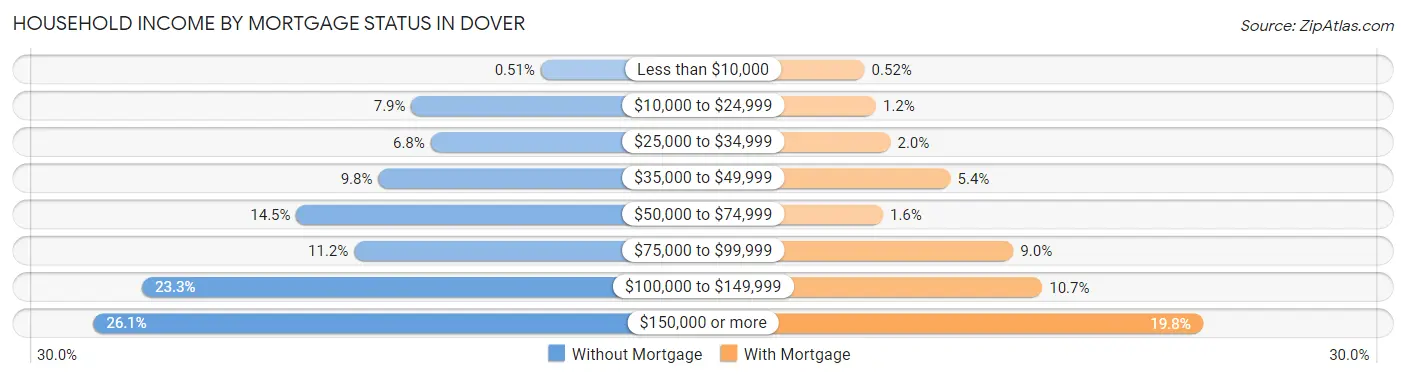
| Household Income | Without Mortgage | With Mortgage |
| Less than $10,000 | 13 (0.5%) | 26 (0.5%) |
| $10,000 to $24,999 | 201 (7.9%) | 59 (1.2%) |
| $25,000 to $34,999 | 173 (6.8%) | 101 (2.0%) |
| $35,000 to $49,999 | 249 (9.8%) | 274 (5.4%) |
| $50,000 to $74,999 | 368 (14.5%) | 79 (1.6%) |
| $75,000 to $99,999 | 284 (11.2%) | 455 (9.0%) |
| $100,000 to $149,999 | 592 (23.3%) | 538 (10.7%) |
| $150,000 or more | 663 (26.1%) | 1,000 (19.8%) |
| Total | 2,543 (100.0%) | 5,042 (100.0%) |
Property Value to Household Income Ratio in Dover
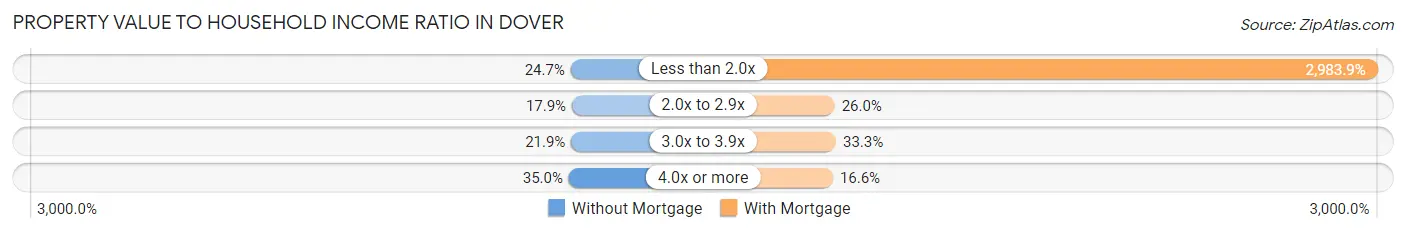
| Value-to-Income Ratio | Without Mortgage | With Mortgage |
| Less than 2.0x | 629 (24.7%) | 150,446 (2,983.9%) |
| 2.0x to 2.9x | 454 (17.8%) | 1,313 (26.0%) |
| 3.0x to 3.9x | 556 (21.9%) | 1,678 (33.3%) |
| 4.0x or more | 891 (35.0%) | 835 (16.6%) |
| Total | 2,543 (100.0%) | 5,042 (100.0%) |
Real Estate Taxes by Mortgage Status in Dover
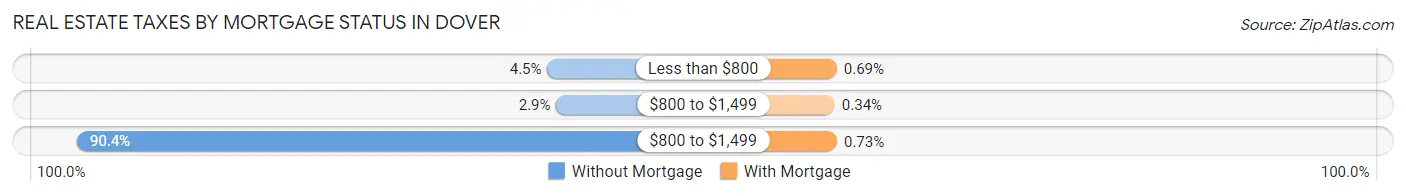
| Property Taxes | Without Mortgage | With Mortgage |
| Less than $800 | 115 (4.5%) | 35 (0.7%) |
| $800 to $1,499 | 73 (2.9%) | 17 (0.3%) |
| $800 to $1,499 | 2,300 (90.4%) | 37 (0.7%) |
| Total | 2,543 (100.0%) | 5,042 (100.0%) |
Health & Disability in Dover
Health Insurance Coverage by Age in Dover
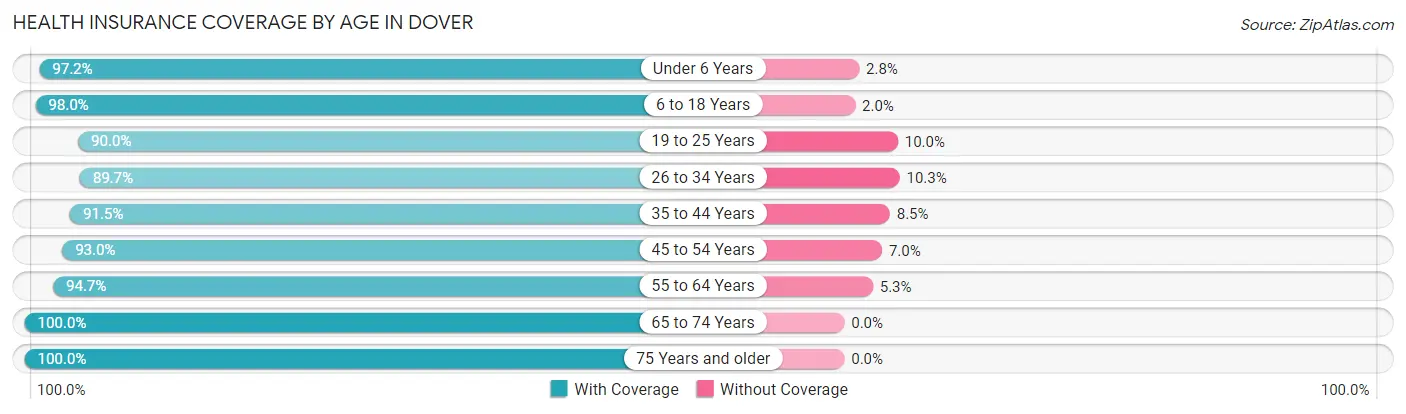
| Age Bracket | With Coverage | Without Coverage |
| Under 6 Years | 1,906 (97.2%) | 54 (2.8%) |
| 6 to 18 Years | 3,634 (98.0%) | 75 (2.0%) |
| 19 to 25 Years | 3,475 (90.0%) | 385 (10.0%) |
| 26 to 34 Years | 4,884 (89.7%) | 561 (10.3%) |
| 35 to 44 Years | 3,843 (91.5%) | 356 (8.5%) |
| 45 to 54 Years | 3,509 (93.0%) | 265 (7.0%) |
| 55 to 64 Years | 3,671 (94.7%) | 206 (5.3%) |
| 65 to 74 Years | 2,912 (100.0%) | 0 (0.0%) |
| 75 Years and older | 2,150 (100.0%) | 0 (0.0%) |
| Total | 29,984 (94.0%) | 1,902 (6.0%) |
Health Insurance Coverage by Citizenship Status in Dover
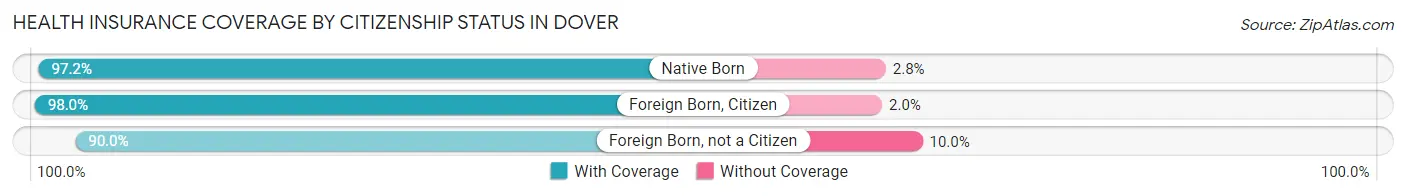
| Citizenship Status | With Coverage | Without Coverage |
| Native Born | 1,906 (97.2%) | 54 (2.8%) |
| Foreign Born, Citizen | 3,634 (98.0%) | 75 (2.0%) |
| Foreign Born, not a Citizen | 3,475 (90.0%) | 385 (10.0%) |
Health Insurance Coverage by Household Income in Dover
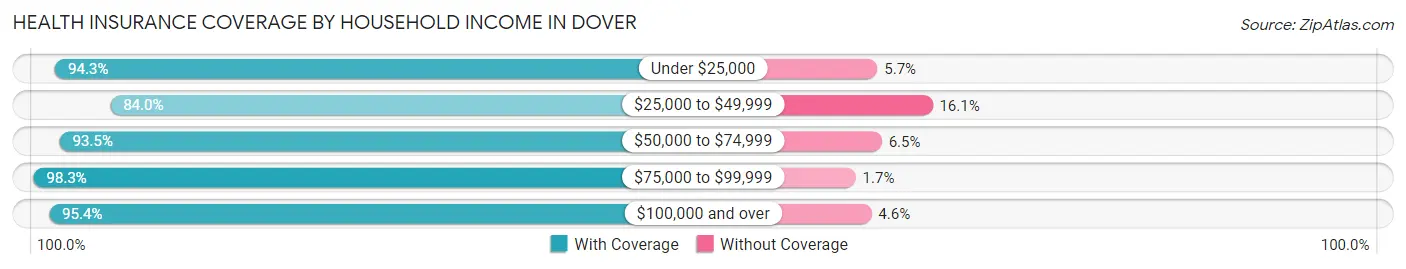
| Household Income | With Coverage | Without Coverage |
| Under $25,000 | 1,831 (94.3%) | 111 (5.7%) |
| $25,000 to $49,999 | 3,143 (84.0%) | 601 (16.1%) |
| $50,000 to $74,999 | 3,800 (93.5%) | 266 (6.5%) |
| $75,000 to $99,999 | 3,903 (98.3%) | 66 (1.7%) |
| $100,000 and over | 17,226 (95.4%) | 832 (4.6%) |
Public vs Private Health Insurance Coverage by Age in Dover
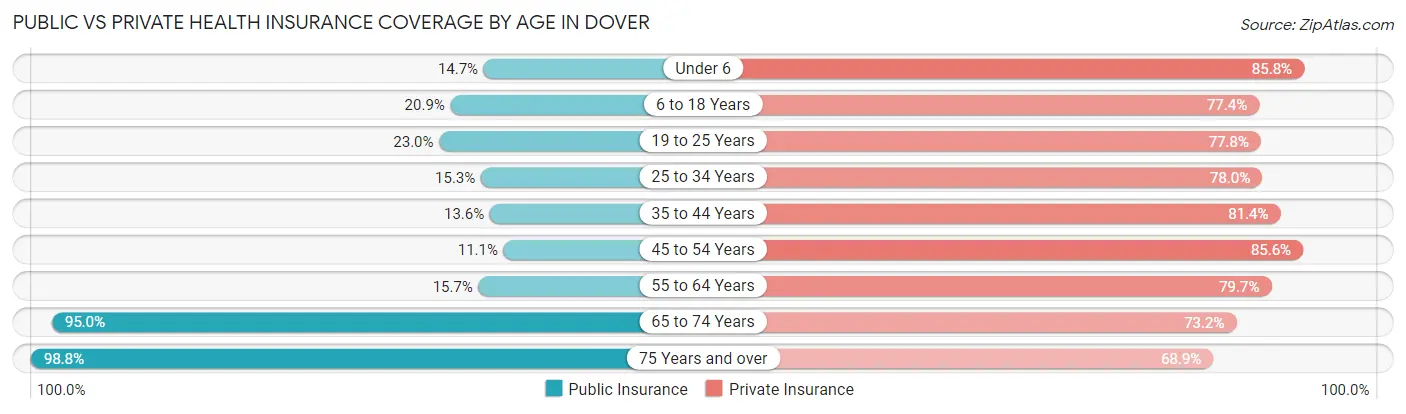
| Age Bracket | Public Insurance | Private Insurance |
| Under 6 | 289 (14.7%) | 1,681 (85.8%) |
| 6 to 18 Years | 776 (20.9%) | 2,872 (77.4%) |
| 19 to 25 Years | 888 (23.0%) | 3,002 (77.8%) |
| 25 to 34 Years | 831 (15.3%) | 4,247 (78.0%) |
| 35 to 44 Years | 571 (13.6%) | 3,417 (81.4%) |
| 45 to 54 Years | 417 (11.1%) | 3,230 (85.6%) |
| 55 to 64 Years | 609 (15.7%) | 3,090 (79.7%) |
| 65 to 74 Years | 2,765 (95.0%) | 2,132 (73.2%) |
| 75 Years and over | 2,125 (98.8%) | 1,482 (68.9%) |
| Total | 9,271 (29.1%) | 25,153 (78.9%) |
Disability Status by Sex by Age in Dover
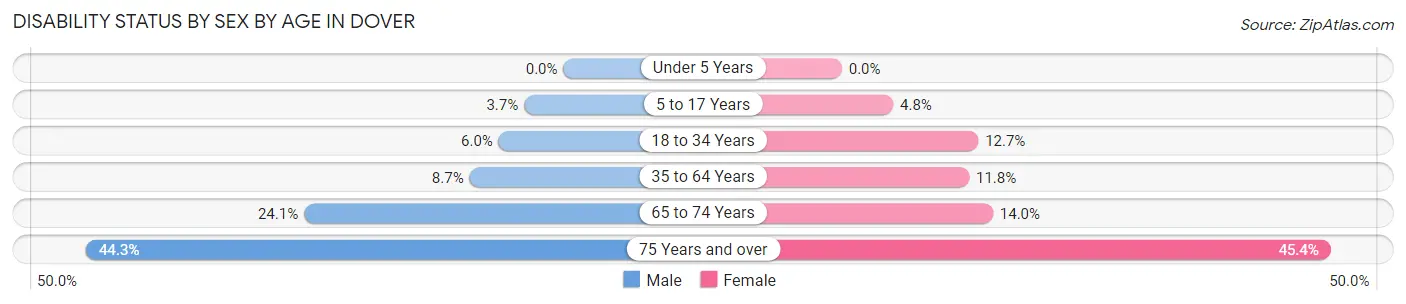
| Age Bracket | Male | Female |
| Under 5 Years | 0 (0.0%) | 0 (0.0%) |
| 5 to 17 Years | 64 (3.6%) | 99 (4.8%) |
| 18 to 34 Years | 283 (6.0%) | 592 (12.7%) |
| 35 to 64 Years | 529 (8.7%) | 682 (11.8%) |
| 65 to 74 Years | 354 (24.1%) | 202 (14.0%) |
| 75 Years and over | 350 (44.3%) | 617 (45.4%) |
Disability Class by Sex by Age in Dover
Disability Class: Hearing Difficulty
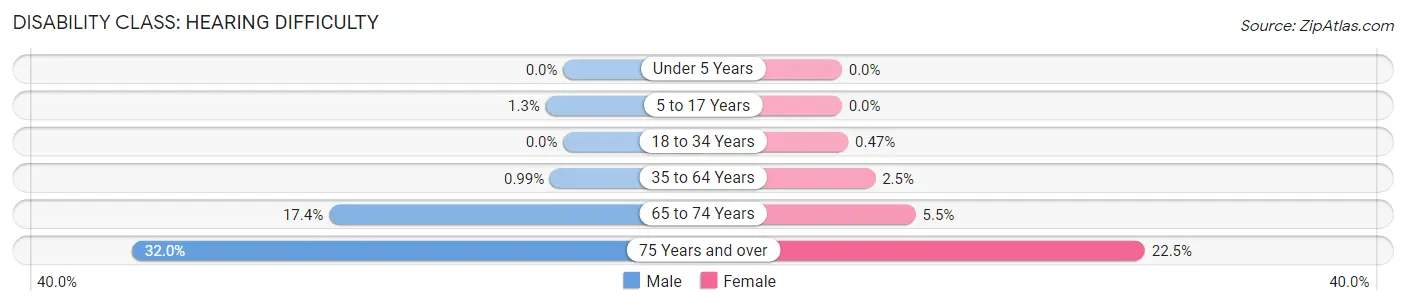
| Age Bracket | Male | Female |
| Under 5 Years | 0 (0.0%) | 0 (0.0%) |
| 5 to 17 Years | 23 (1.3%) | 0 (0.0%) |
| 18 to 34 Years | 0 (0.0%) | 22 (0.5%) |
| 35 to 64 Years | 60 (1.0%) | 143 (2.5%) |
| 65 to 74 Years | 256 (17.4%) | 79 (5.5%) |
| 75 Years and over | 253 (32.0%) | 306 (22.5%) |
Disability Class: Vision Difficulty
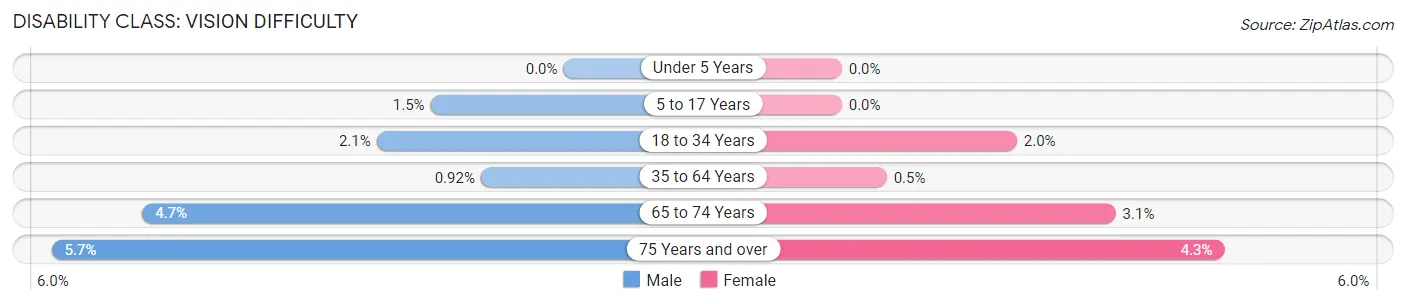
| Age Bracket | Male | Female |
| Under 5 Years | 0 (0.0%) | 0 (0.0%) |
| 5 to 17 Years | 26 (1.5%) | 0 (0.0%) |
| 18 to 34 Years | 98 (2.1%) | 91 (1.9%) |
| 35 to 64 Years | 56 (0.9%) | 29 (0.5%) |
| 65 to 74 Years | 69 (4.7%) | 44 (3.0%) |
| 75 Years and over | 45 (5.7%) | 58 (4.3%) |
Disability Class: Cognitive Difficulty
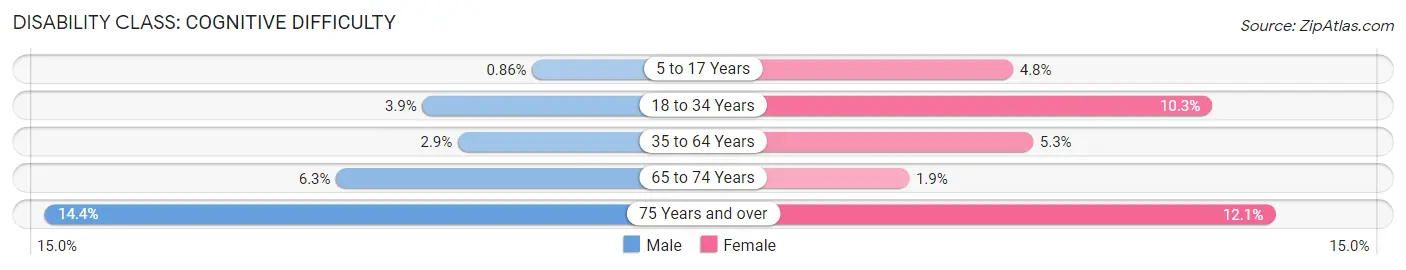
| Age Bracket | Male | Female |
| 5 to 17 Years | 15 (0.9%) | 99 (4.8%) |
| 18 to 34 Years | 185 (3.9%) | 482 (10.3%) |
| 35 to 64 Years | 178 (2.9%) | 307 (5.3%) |
| 65 to 74 Years | 93 (6.3%) | 27 (1.9%) |
| 75 Years and over | 114 (14.4%) | 164 (12.1%) |
Disability Class: Ambulatory Difficulty
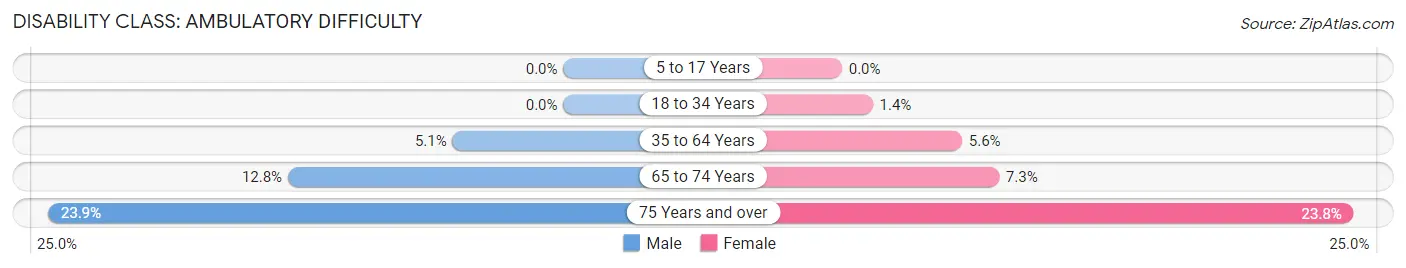
| Age Bracket | Male | Female |
| 5 to 17 Years | 0 (0.0%) | 0 (0.0%) |
| 18 to 34 Years | 0 (0.0%) | 67 (1.4%) |
| 35 to 64 Years | 312 (5.1%) | 322 (5.6%) |
| 65 to 74 Years | 188 (12.8%) | 105 (7.3%) |
| 75 Years and over | 189 (23.9%) | 323 (23.7%) |
Disability Class: Self-Care Difficulty
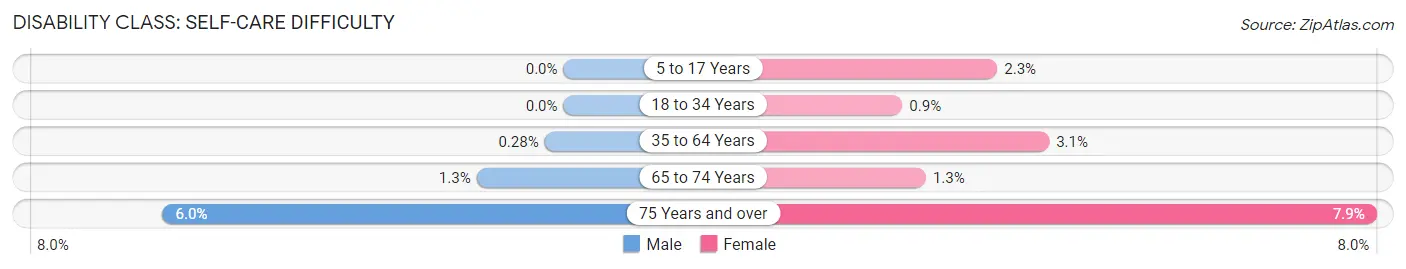
| Age Bracket | Male | Female |
| 5 to 17 Years | 0 (0.0%) | 48 (2.3%) |
| 18 to 34 Years | 0 (0.0%) | 42 (0.9%) |
| 35 to 64 Years | 17 (0.3%) | 178 (3.1%) |
| 65 to 74 Years | 19 (1.3%) | 18 (1.3%) |
| 75 Years and over | 47 (5.9%) | 108 (7.9%) |
Technology Access in Dover
Computing Device Access in Dover
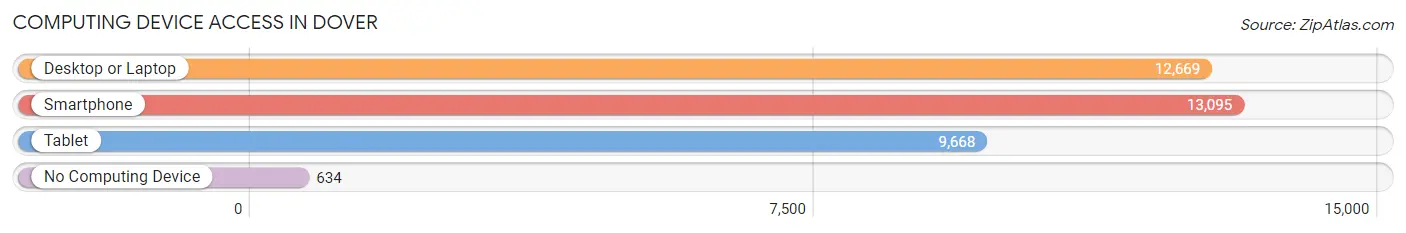
| Device Type | # Households | % Households |
| Desktop or Laptop | 12,669 | 86.7% |
| Smartphone | 13,095 | 89.6% |
| Tablet | 9,668 | 66.2% |
| No Computing Device | 634 | 4.3% |
| Total | 14,606 | 100.0% |
Internet Access in Dover
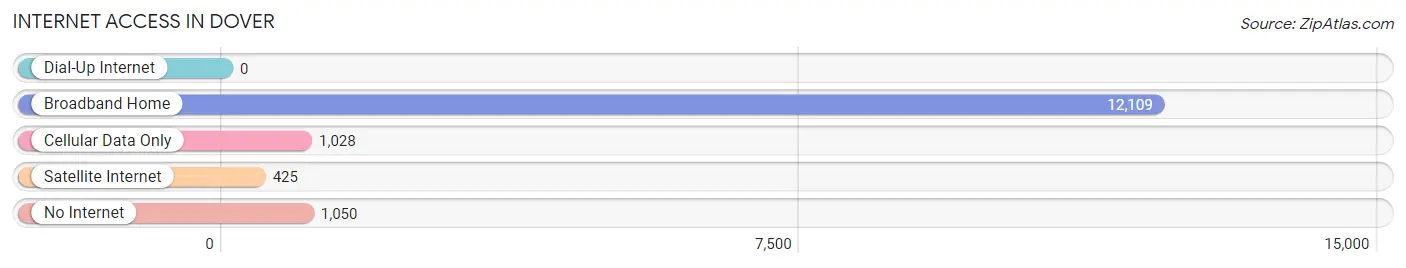
| Internet Type | # Households | % Households |
| Dial-Up Internet | 0 | 0.0% |
| Broadband Home | 12,109 | 82.9% |
| Cellular Data Only | 1,028 | 7.0% |
| Satellite Internet | 425 | 2.9% |
| No Internet | 1,050 | 7.2% |
| Total | 14,606 | 100.0% |
Dover Summary
Dover, New Hampshire is a city located in Strafford County, New Hampshire, United States. The city is situated on the banks of the Cocheco River and is the county seat of Strafford County. As of the 2010 census, the city had a population of 29,987, making it the sixth largest city in the state.
History
The area that is now Dover was first settled in 1623 by William and Edward Hilton. The area was originally part of the Massachusetts Bay Colony, but was later annexed to New Hampshire in 1679. The town was officially incorporated in 1722 and was named after Dover in Kent, England.
In the late 18th century, Dover became an important port for the shipping of lumber and other goods. The city was also a major center for the production of textiles, and by the mid-19th century, Dover was the largest producer of woolen goods in the United States.
In the late 19th century, Dover became a major railroad hub, with the Boston and Maine Railroad and the Portsmouth and Dover Railroad both running through the city. The city was also home to several large shoe factories, which employed many of the city’s residents.
Geography
Dover is located at 43°12′N 70°52′W (43.20, -70.87). According to the United States Census Bureau, the city has a total area of 28.2 square miles (73.1 km2), of which 27.9 square miles (72.2 km2) is land and 0.3 square miles (0.9 km2) is water.
The city is located in the Seacoast region of New Hampshire, and is bordered by the towns of Rollinsford to the north, Somersworth to the east, Durham to the south, and Madbury to the west.
Economy
Dover’s economy is largely based on the service industry, with the city being home to several large employers, including Liberty Mutual Insurance, Wentworth-Douglass Hospital, and the University of New Hampshire. The city is also home to several large manufacturing companies, including Dover Industries, which produces industrial machinery, and Dover Chemical, which produces specialty chemicals.
The city is also home to several large retail stores, including the Dover Mall, which is the largest shopping center in the city.
Demographics
As of the 2010 census, there were 29,987 people, 11,945 households, and 7,717 families residing in the city. The population density was 1,072.2 people per square mile (414.7/km2). There were 12,717 housing units at an average density of 454.7 per square mile (175.7/km2). The racial makeup of the city was 92.2% White, 2.7% African American, 0.3% Native American, 2.2% Asian, 0.1% Pacific Islander, 1.2% from other races, and 1.4% from two or more races. Hispanic or Latino of any race were 3.3% of the population.
There were 11,945 households, out of which 30.2% had children under the age of 18 living with them, 47.2% were married couples living together, 12.3% had a female householder with no husband present, and 36.2% were non-families. 28.7% of all households were made up of individuals, and 10.2% had someone living alone who was 65 years of age or older. The average household size was 2.41 and the average family size was 2.95.
In the city, the population was spread out, with 23.7% under the age of 18, 9.2% from 18 to 24, 29.2% from 25 to 44, 24.2% from 45 to 64, and 13.7% who were 65 years of age or older. The median age was 37 years. For every 100 females, there were 93.2 males. For every 100 females age 18 and over, there were 90.2 males.
The median income for a household in the city was $45,945, and the median income for a family was $55,945. Males had a median income of $40,945 versus $30,945 for females. The per capita income for the city was $23,945. About 6.2% of families and 8.7% of the population were below the poverty line, including 11.2% of those under age 18 and 6.2% of those age 65 or over.
Common Questions
What is Per Capita Income in Dover?
Per Capita income in Dover is $52,752.
What is the Median Family Income in Dover?
Median Family Income in Dover is $132,056.
What is the Median Household income in Dover?
Median Household Income in Dover is $90,844.
What is Income or Wage Gap in Dover?
Income or Wage Gap in Dover is 33.0%.
Women in Dover earn 67.0 cents for every dollar earned by a man.
What is Inequality or Gini Index in Dover?
Inequality or Gini Index in Dover is 0.43.
What is the Total Population of Dover?
Total Population of Dover is 32,849.
What is the Total Male Population of Dover?
Total Male Population of Dover is 16,316.
What is the Total Female Population of Dover?
Total Female Population of Dover is 16,533.
What is the Ratio of Males per 100 Females in Dover?
There are 98.69 Males per 100 Females in Dover.
What is the Ratio of Females per 100 Males in Dover?
There are 101.33 Females per 100 Males in Dover.
What is the Median Population Age in Dover?
Median Population Age in Dover is 37.2 Years.
What is the Average Family Size in Dover
Average Family Size in Dover is 2.7 People.
What is the Average Household Size in Dover
Average Household Size in Dover is 2.2 People.
How Large is the Labor Force in Dover?
There are 20,189 People in the Labor Forcein in Dover.
What is the Percentage of People in the Labor Force in Dover?
72.5% of People are in the Labor Force in Dover.
What is the Unemployment Rate in Dover?
Unemployment Rate in Dover is 3.7%.