Newmarket, NH Map & Demographics
Newmarket Map
Newmarket Overview
$49,100
PER CAPITA INCOME
$106,106
AVG FAMILY INCOME
$88,295
AVG HOUSEHOLD INCOME
33.0%
WAGE / INCOME GAP [ % ]
67.0¢/ $1
WAGE / INCOME GAP [ $ ]
0.36
INEQUALITY / GINI INDEX
5,829
TOTAL POPULATION
2,976
MALE POPULATION
2,853
FEMALE POPULATION
104.31
MALES / 100 FEMALES
95.87
FEMALES / 100 MALES
34.6
MEDIAN AGE
2.6
AVG FAMILY SIZE
2.1
AVG HOUSEHOLD SIZE
3,974
LABOR FORCE [ PEOPLE ]
79.1%
PERCENT IN LABOR FORCE
1.0%
UNEMPLOYMENT RATE
Newmarket Zip Codes
Newmarket Area Codes
Income in Newmarket
Income Overview in Newmarket
Per Capita Income in Newmarket is $49,100, while median incomes of families and households are $106,106 and $88,295 respectively.
| Characteristic | Number | Measure |
| Per Capita Income | 5,829 | $49,100 |
| Median Family Income | 1,256 | $106,106 |
| Mean Family Income | 1,256 | $118,366 |
| Median Household Income | 2,734 | $88,295 |
| Mean Household Income | 2,734 | $101,515 |
| Income Deficit | 1,256 | $0 |
| Wage / Income Gap (%) | 5,829 | 33.02% |
| Wage / Income Gap ($) | 5,829 | 66.98¢ per $1 |
| Gini / Inequality Index | 5,829 | 0.36 |
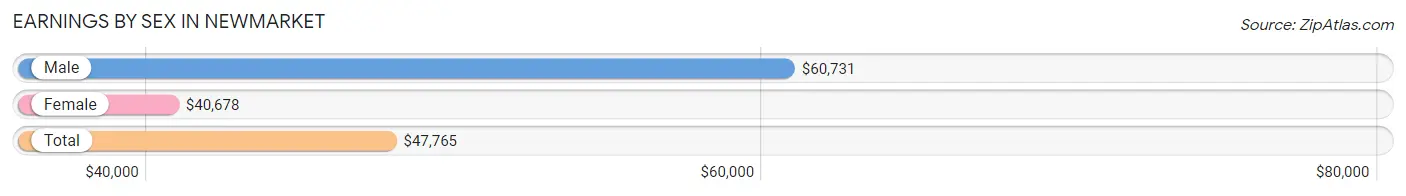
Earnings by Sex in Newmarket
Average Earnings in Newmarket are $47,765, $60,731 for men and $40,678 for women, a difference of 33.0%.
| Sex | Number | Average Earnings |
| Male | 2,174 (51.5%) | $60,731 |
| Female | 2,043 (48.4%) | $40,678 |
| Total | 4,217 (100.0%) | $47,765 |
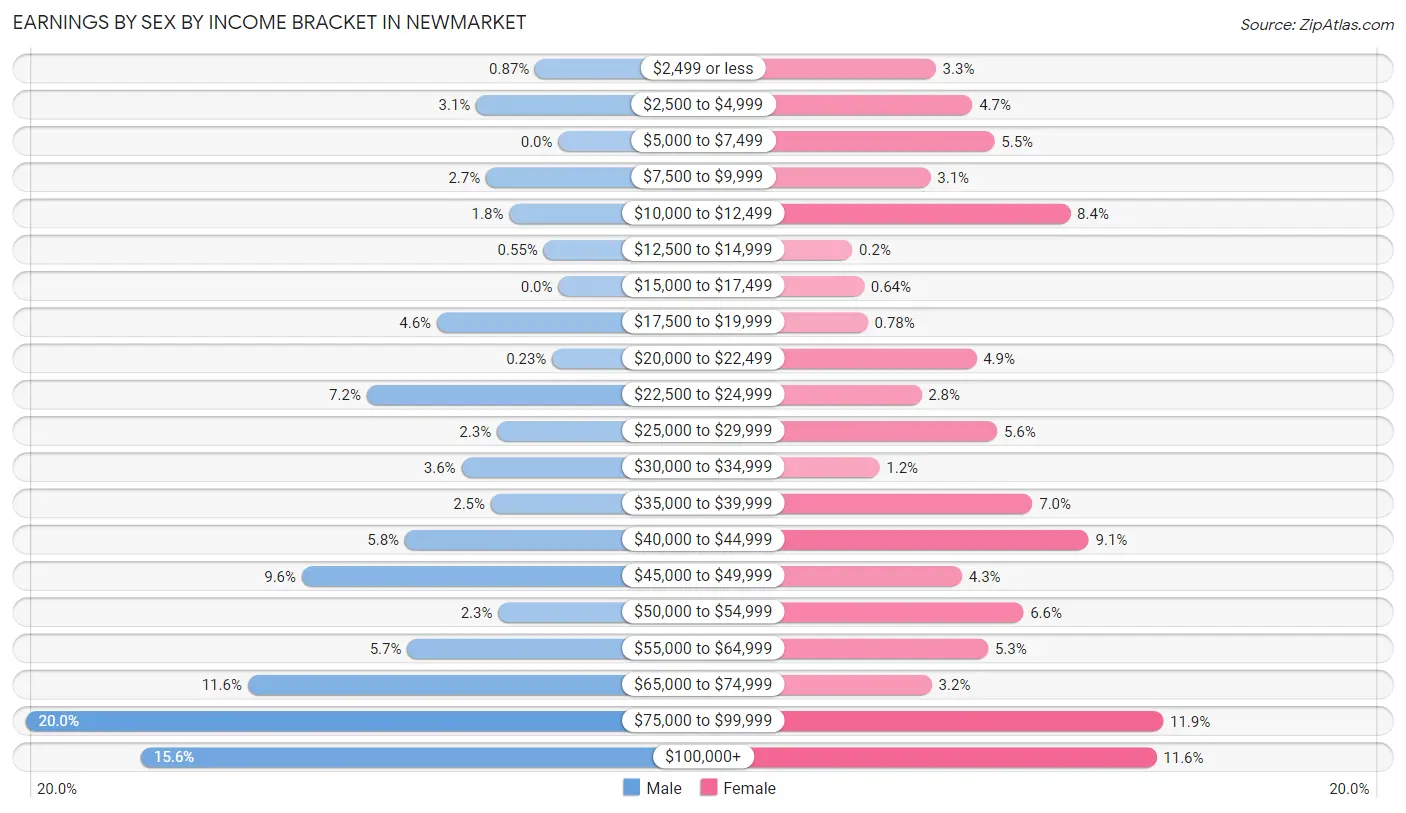
Earnings by Sex by Income Bracket in Newmarket
The most common earnings brackets in Newmarket are $75,000 to $99,999 for men (434 | 20.0%) and $75,000 to $99,999 for women (242 | 11.8%).
| Income | Male | Female |
| $2,499 or less | 19 (0.9%) | 68 (3.3%) |
| $2,500 to $4,999 | 67 (3.1%) | 96 (4.7%) |
| $5,000 to $7,499 | 0 (0.0%) | 113 (5.5%) |
| $7,500 to $9,999 | 59 (2.7%) | 64 (3.1%) |
| $10,000 to $12,499 | 40 (1.8%) | 171 (8.4%) |
| $12,500 to $14,999 | 12 (0.5%) | 4 (0.2%) |
| $15,000 to $17,499 | 0 (0.0%) | 13 (0.6%) |
| $17,500 to $19,999 | 99 (4.5%) | 16 (0.8%) |
| $20,000 to $22,499 | 5 (0.2%) | 99 (4.9%) |
| $22,500 to $24,999 | 156 (7.2%) | 57 (2.8%) |
| $25,000 to $29,999 | 50 (2.3%) | 115 (5.6%) |
| $30,000 to $34,999 | 79 (3.6%) | 25 (1.2%) |
| $35,000 to $39,999 | 55 (2.5%) | 142 (7.0%) |
| $40,000 to $44,999 | 125 (5.8%) | 185 (9.1%) |
| $45,000 to $49,999 | 209 (9.6%) | 88 (4.3%) |
| $50,000 to $54,999 | 49 (2.2%) | 135 (6.6%) |
| $55,000 to $64,999 | 123 (5.7%) | 108 (5.3%) |
| $65,000 to $74,999 | 253 (11.6%) | 65 (3.2%) |
| $75,000 to $99,999 | 434 (20.0%) | 242 (11.8%) |
| $100,000+ | 340 (15.6%) | 237 (11.6%) |
| Total | 2,174 (100.0%) | 2,043 (100.0%) |
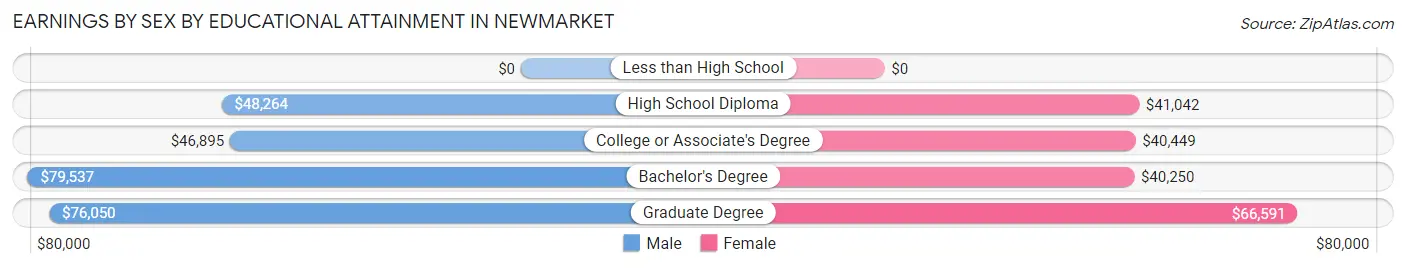
Earnings by Sex by Educational Attainment in Newmarket
Average earnings in Newmarket are $69,451 for men and $42,558 for women, a difference of 38.7%. Men with an educational attainment of bachelor's degree enjoy the highest average annual earnings of $79,537, while those with college or associate's degree education earn the least with $46,895. Women with an educational attainment of graduate degree earn the most with the average annual earnings of $66,591, while those with bachelor's degree education have the smallest earnings of $40,250.
| Educational Attainment | Male Income | Female Income |
| Less than High School | - | - |
| High School Diploma | $48,264 | $41,042 |
| College or Associate's Degree | $46,895 | $40,449 |
| Bachelor's Degree | $79,537 | $40,250 |
| Graduate Degree | $76,050 | $66,591 |
| Total | $69,451 | $42,558 |
Family Income in Newmarket
Family Income Brackets in Newmarket
According to the Newmarket family income data, there are 345 families falling into the $100,000 to $149,999 income range, which is the most common income bracket and makes up 27.5% of all families.
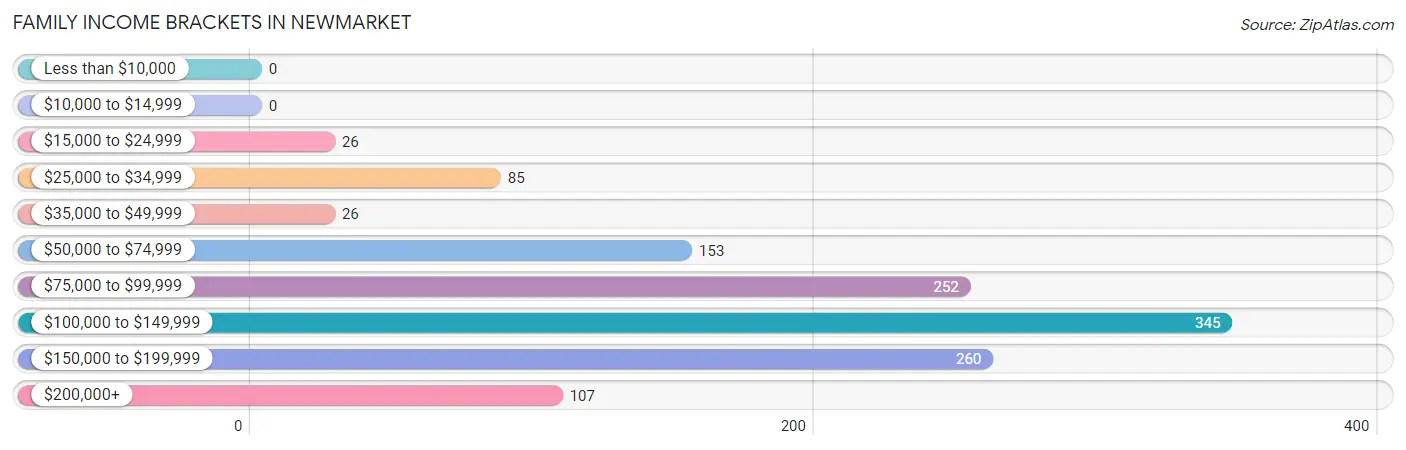
| Income Bracket | # Families | % Families |
| Less than $10,000 | 0 | 0.0% |
| $10,000 to $14,999 | 0 | 0.0% |
| $15,000 to $24,999 | 26 | 2.1% |
| $25,000 to $34,999 | 85 | 6.8% |
| $35,000 to $49,999 | 26 | 2.1% |
| $50,000 to $74,999 | 153 | 12.2% |
| $75,000 to $99,999 | 252 | 20.1% |
| $100,000 to $149,999 | 345 | 27.5% |
| $150,000 to $199,999 | 260 | 20.7% |
| $200,000+ | 107 | 8.5% |
Family Income by Famaliy Size in Newmarket
5-person families (32 | 2.5%) account for the highest median family income in Newmarket with $250,001 per family, while 2-person families (726 | 57.8%) have the highest median income of $50,454 per family member.
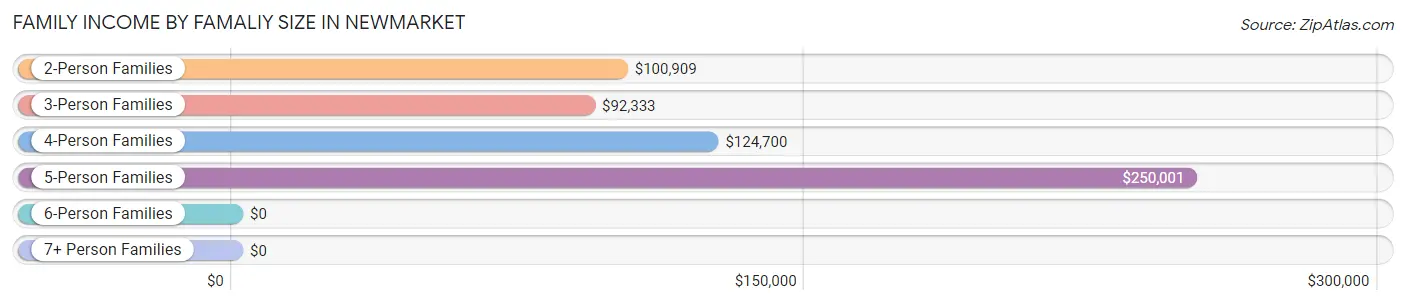
| Income Bracket | # Families | Median Income |
| 2-Person Families | 726 (57.8%) | $100,909 |
| 3-Person Families | 332 (26.4%) | $92,333 |
| 4-Person Families | 166 (13.2%) | $124,700 |
| 5-Person Families | 32 (2.5%) | $250,001 |
| 6-Person Families | 0 (0.0%) | $0 |
| 7+ Person Families | 0 (0.0%) | $0 |
| Total | 1,256 (100.0%) | $106,106 |
Family Income by Number of Earners in Newmarket
The median family income in Newmarket is $106,106, with families comprising 3+ earners (62) having the highest median family income of $226,500, while families with no earners (57) have the lowest median family income of $68,438, accounting for 4.9% and 4.5% of families, respectively.
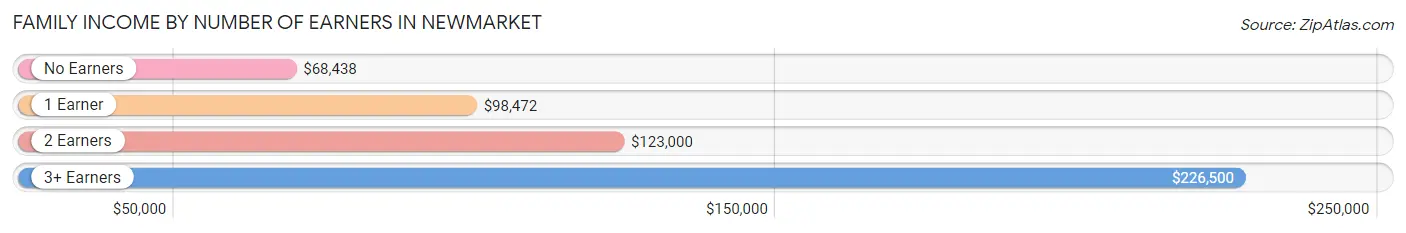
| Number of Earners | # Families | Median Income |
| No Earners | 57 (4.5%) | $68,438 |
| 1 Earner | 419 (33.4%) | $98,472 |
| 2 Earners | 718 (57.2%) | $123,000 |
| 3+ Earners | 62 (4.9%) | $226,500 |
| Total | 1,256 (100.0%) | $106,106 |
Household Income in Newmarket
Household Income Brackets in Newmarket
With 558 households falling in the category, the $100,000 to $149,999 income range is the most frequent in Newmarket, accounting for 20.4% of all households.
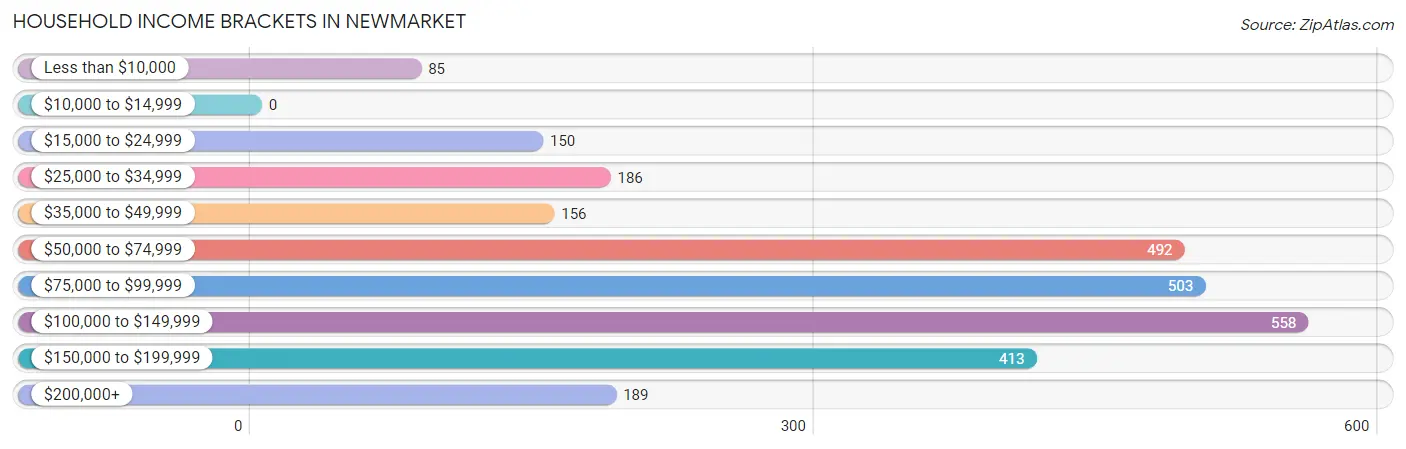
| Income Bracket | # Households | % Households |
| Less than $10,000 | 85 | 3.1% |
| $10,000 to $14,999 | 0 | 0.0% |
| $15,000 to $24,999 | 150 | 5.5% |
| $25,000 to $34,999 | 186 | 6.8% |
| $35,000 to $49,999 | 156 | 5.7% |
| $50,000 to $74,999 | 492 | 18.0% |
| $75,000 to $99,999 | 503 | 18.4% |
| $100,000 to $149,999 | 558 | 20.4% |
| $150,000 to $199,999 | 413 | 15.1% |
| $200,000+ | 189 | 6.9% |
Household Income by Householder Age in Newmarket
The median household income in Newmarket is $88,295, with the highest median household income of $120,122 found in the 45 to 64 years age bracket for the primary householder. A total of 894 households (32.7%) fall into this category. Meanwhile, the 15 to 24 years age bracket for the primary householder has the lowest median household income of $0, with 191 households (7.0%) in this group.
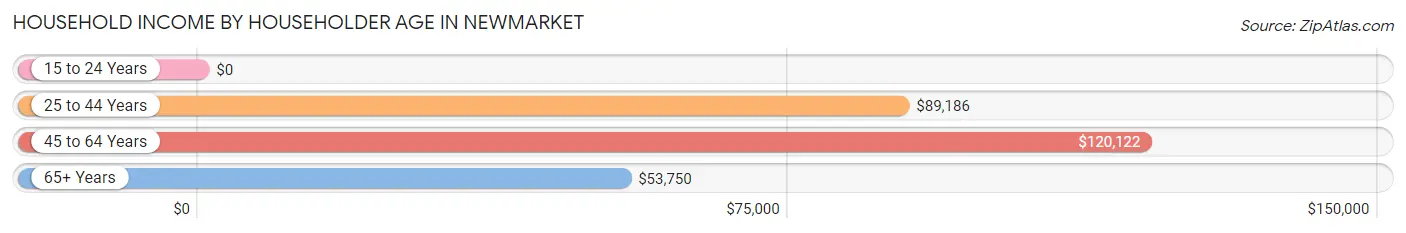
| Income Bracket | # Households | Median Income |
| 15 to 24 Years | 191 (7.0%) | $0 |
| 25 to 44 Years | 1,130 (41.3%) | $89,186 |
| 45 to 64 Years | 894 (32.7%) | $120,122 |
| 65+ Years | 519 (19.0%) | $53,750 |
| Total | 2,734 (100.0%) | $88,295 |
Poverty in Newmarket
Income Below Poverty by Sex and Age in Newmarket
With 4.6% poverty level for males and 7.6% for females among the residents of Newmarket, 18 to 24 year old males and 18 to 24 year old females are the most vulnerable to poverty, with 75 males (23.4%) and 163 females (46.3%) in their respective age groups living below the poverty level.
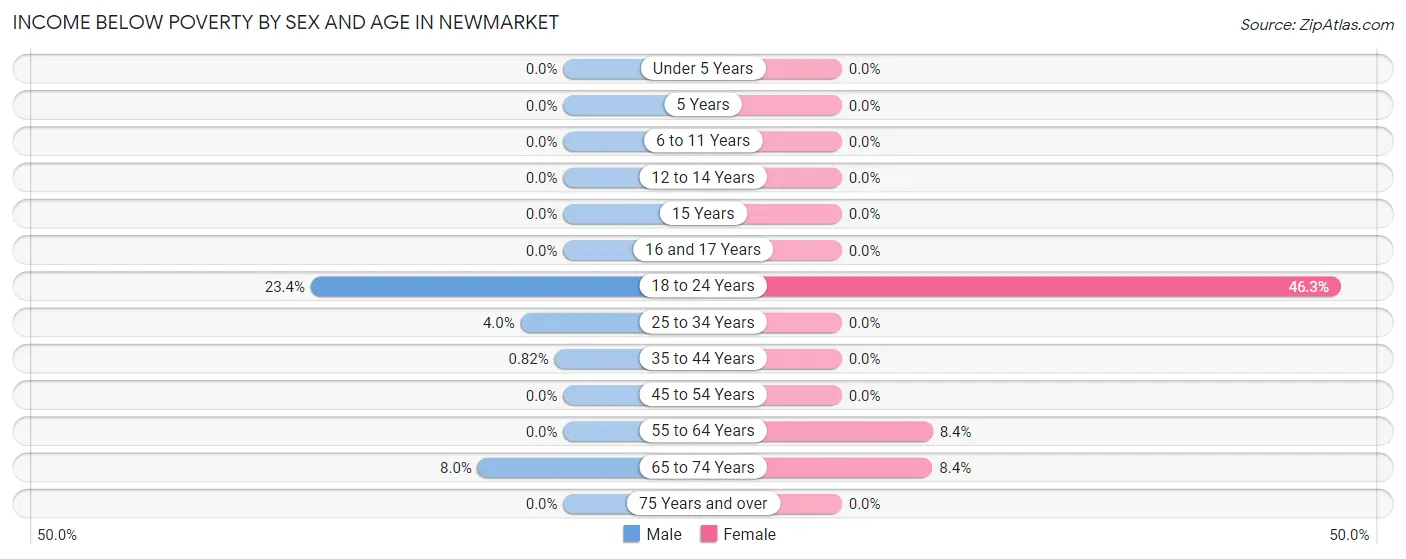
| Age Bracket | Male | Female |
| Under 5 Years | 0 (0.0%) | 0 (0.0%) |
| 5 Years | 0 (0.0%) | 0 (0.0%) |
| 6 to 11 Years | 0 (0.0%) | 0 (0.0%) |
| 12 to 14 Years | 0 (0.0%) | 0 (0.0%) |
| 15 Years | 0 (0.0%) | 0 (0.0%) |
| 16 and 17 Years | 0 (0.0%) | 0 (0.0%) |
| 18 to 24 Years | 75 (23.4%) | 163 (46.3%) |
| 25 to 34 Years | 34 (4.0%) | 0 (0.0%) |
| 35 to 44 Years | 3 (0.8%) | 0 (0.0%) |
| 45 to 54 Years | 0 (0.0%) | 0 (0.0%) |
| 55 to 64 Years | 0 (0.0%) | 27 (8.4%) |
| 65 to 74 Years | 21 (8.0%) | 26 (8.4%) |
| 75 Years and over | 0 (0.0%) | 0 (0.0%) |
| Total | 133 (4.6%) | 216 (7.6%) |
Income Above Poverty by Sex and Age in Newmarket
According to the poverty statistics in Newmarket, males aged under 5 years and females aged under 5 years are the age groups that are most secure financially, with 100.0% of males and 100.0% of females in these age groups living above the poverty line.
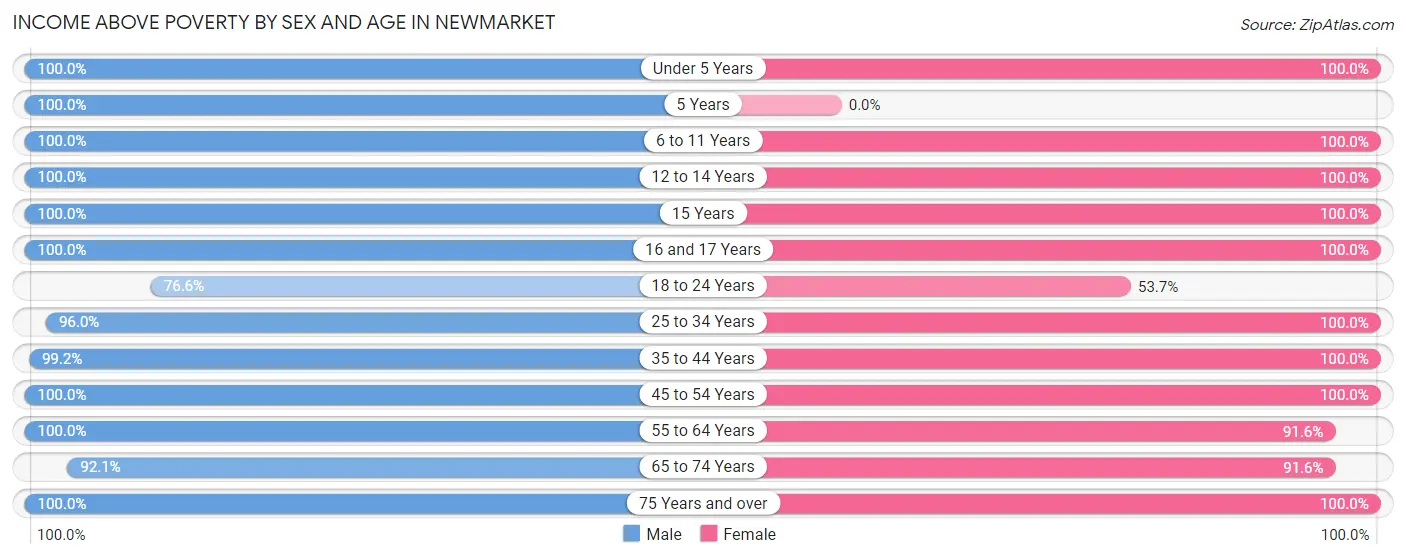
| Age Bracket | Male | Female |
| Under 5 Years | 117 (100.0%) | 178 (100.0%) |
| 5 Years | 42 (100.0%) | 0 (0.0%) |
| 6 to 11 Years | 116 (100.0%) | 102 (100.0%) |
| 12 to 14 Years | 102 (100.0%) | 46 (100.0%) |
| 15 Years | 4 (100.0%) | 17 (100.0%) |
| 16 and 17 Years | 68 (100.0%) | 18 (100.0%) |
| 18 to 24 Years | 245 (76.6%) | 189 (53.7%) |
| 25 to 34 Years | 822 (96.0%) | 552 (100.0%) |
| 35 to 44 Years | 362 (99.2%) | 487 (100.0%) |
| 45 to 54 Years | 405 (100.0%) | 363 (100.0%) |
| 55 to 64 Years | 173 (100.0%) | 293 (91.6%) |
| 65 to 74 Years | 243 (92.0%) | 283 (91.6%) |
| 75 Years and over | 63 (100.0%) | 101 (100.0%) |
| Total | 2,762 (95.4%) | 2,629 (92.4%) |
Income Below Poverty Among Married-Couple Families in Newmarket
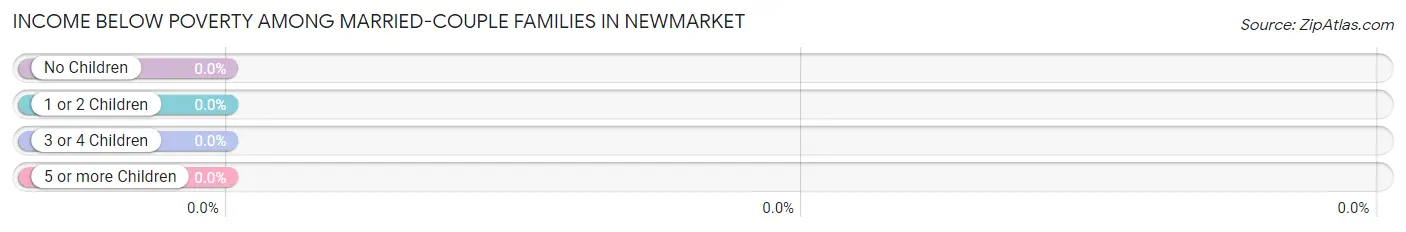
| Children | Above Poverty | Below Poverty |
| No Children | 552 (100.0%) | 0 (0.0%) |
| 1 or 2 Children | 326 (100.0%) | 0 (0.0%) |
| 3 or 4 Children | 9 (100.0%) | 0 (0.0%) |
| 5 or more Children | 0 (0.0%) | 0 (0.0%) |
| Total | 887 (100.0%) | 0 (0.0%) |
Income Below Poverty Among Single-Parent Households in Newmarket
| Children | Single Father | Single Mother |
| No Children | 0 (0.0%) | 0 (0.0%) |
| 1 or 2 Children | 0 (0.0%) | 0 (0.0%) |
| 3 or 4 Children | 0 (0.0%) | 0 (0.0%) |
| 5 or more Children | 0 (0.0%) | 0 (0.0%) |
| Total | 0 (0.0%) | 0 (0.0%) |
Income Below Poverty Among Married-Couple vs Single-Parent Households in Newmarket
| Children | Married-Couple Families | Single-Parent Households |
| No Children | 0 (0.0%) | 0 (0.0%) |
| 1 or 2 Children | 0 (0.0%) | 0 (0.0%) |
| 3 or 4 Children | 0 (0.0%) | 0 (0.0%) |
| 5 or more Children | 0 (0.0%) | 0 (0.0%) |
| Total | 0 (0.0%) | 0 (0.0%) |
Race in Newmarket
The most populous races in Newmarket are White / Caucasian (5,424 | 93.0%), Two or more Races (226 | 3.9%), and Asian (130 | 2.2%).
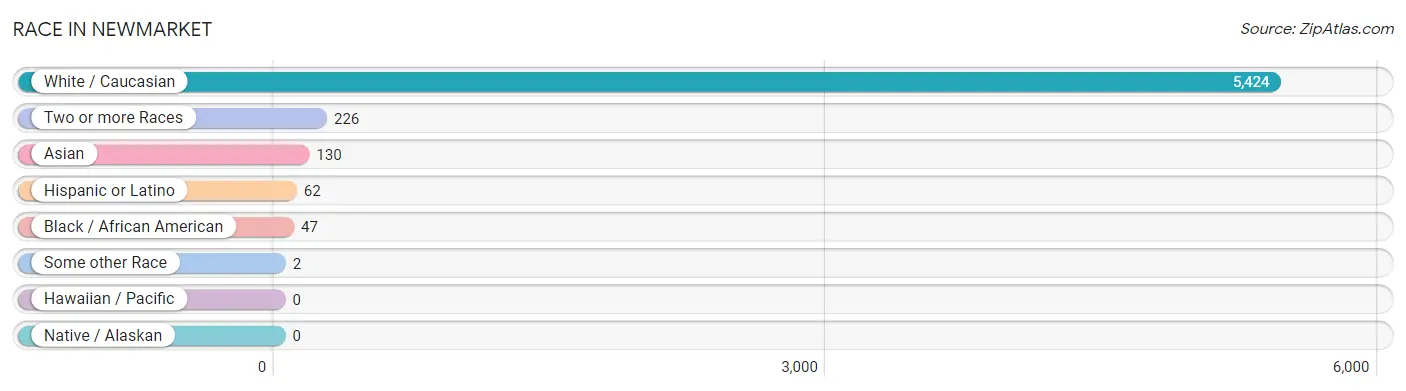
| Race | # Population | % Population |
| Asian | 130 | 2.2% |
| Black / African American | 47 | 0.8% |
| Hawaiian / Pacific | 0 | 0.0% |
| Hispanic or Latino | 62 | 1.1% |
| Native / Alaskan | 0 | 0.0% |
| White / Caucasian | 5,424 | 93.0% |
| Two or more Races | 226 | 3.9% |
| Some other Race | 2 | 0.0% |
| Total | 5,829 | 100.0% |
Ancestry in Newmarket
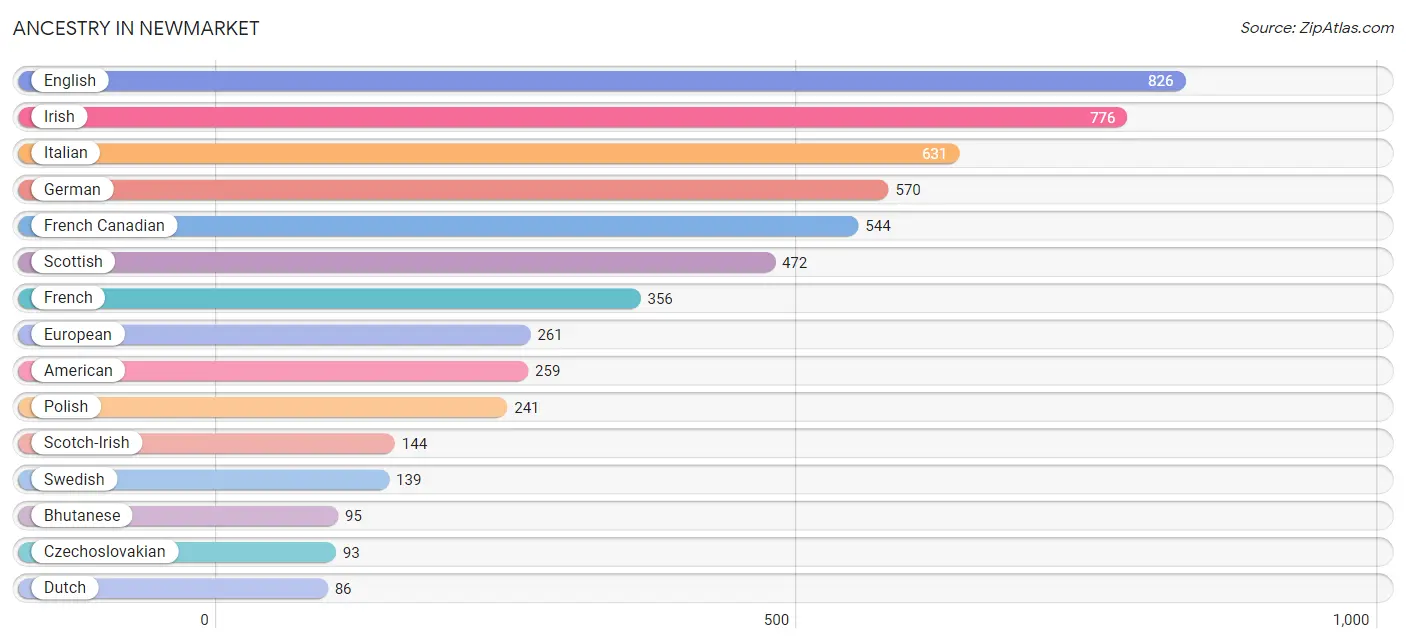
The most populous ancestries reported in Newmarket are English (826 | 14.2%), Irish (776 | 13.3%), Italian (631 | 10.8%), German (570 | 9.8%), and French Canadian (544 | 9.3%), together accounting for 57.4% of all Newmarket residents.
| Ancestry | # Population | % Population |
| African | 2 | 0.0% |
| American | 259 | 4.4% |
| Arab | 5 | 0.1% |
| Armenian | 16 | 0.3% |
| Austrian | 43 | 0.7% |
| Belgian | 5 | 0.1% |
| Bhutanese | 95 | 1.6% |
| British | 19 | 0.3% |
| Burmese | 32 | 0.5% |
| Canadian | 25 | 0.4% |
| Celtic | 9 | 0.2% |
| Colombian | 4 | 0.1% |
| Czech | 51 | 0.9% |
| Czechoslovakian | 93 | 1.6% |
| Danish | 11 | 0.2% |
| Dutch | 86 | 1.5% |
| Eastern European | 24 | 0.4% |
| English | 826 | 14.2% |
| European | 261 | 4.5% |
| Finnish | 11 | 0.2% |
| French | 356 | 6.1% |
| French Canadian | 544 | 9.3% |
| German | 570 | 9.8% |
| Greek | 10 | 0.2% |
| Haitian | 9 | 0.2% |
| Hungarian | 10 | 0.2% |
| Irish | 776 | 13.3% |
| Italian | 631 | 10.8% |
| Kenyan | 19 | 0.3% |
| Korean | 21 | 0.4% |
| Lithuanian | 17 | 0.3% |
| Mexican | 58 | 1.0% |
| Moroccan | 5 | 0.1% |
| Norwegian | 34 | 0.6% |
| Polish | 241 | 4.1% |
| Portuguese | 26 | 0.4% |
| Russian | 21 | 0.4% |
| Scandinavian | 13 | 0.2% |
| Scotch-Irish | 144 | 2.5% |
| Scottish | 472 | 8.1% |
| South American | 4 | 0.1% |
| Subsaharan African | 21 | 0.4% |
| Swedish | 139 | 2.4% |
| Swiss | 21 | 0.4% |
| Thai | 64 | 1.1% |
| Ukrainian | 12 | 0.2% |
| Welsh | 14 | 0.2% | View All 47 Rows |
Immigrants in Newmarket
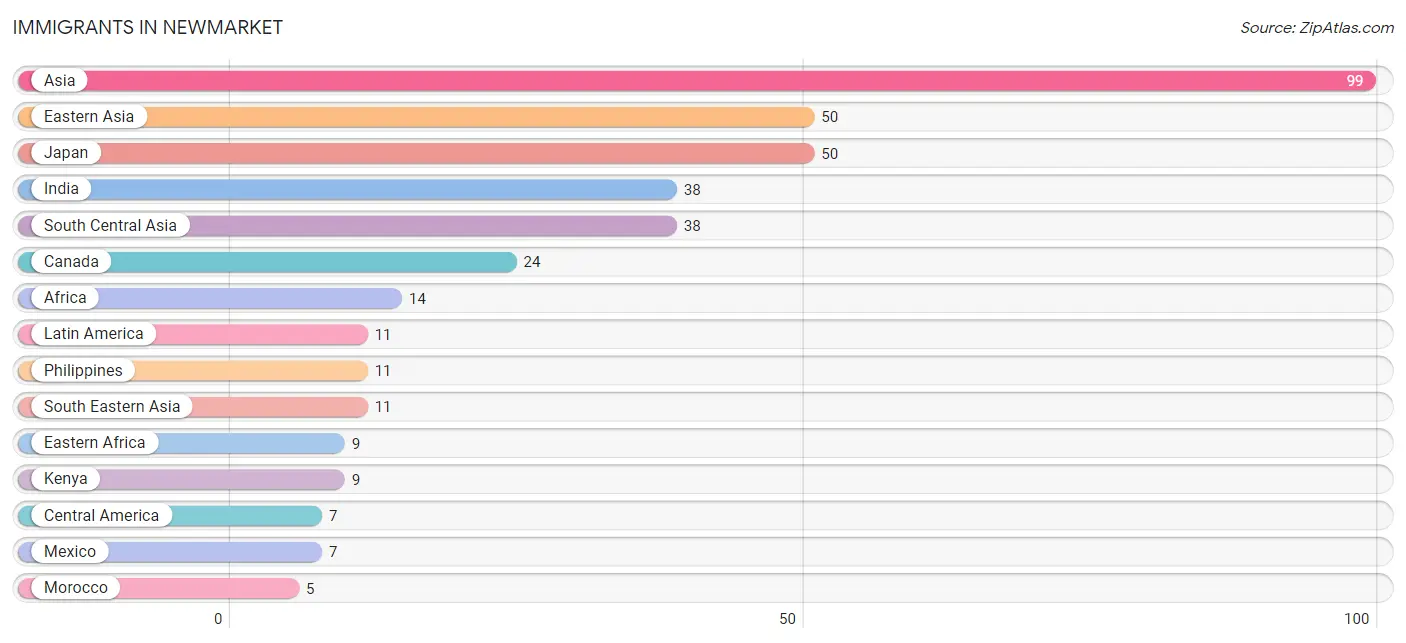
The most numerous immigrant groups reported in Newmarket came from Asia (99 | 1.7%), Eastern Asia (50 | 0.9%), Japan (50 | 0.9%), India (38 | 0.6%), and South Central Asia (38 | 0.6%), together accounting for 4.7% of all Newmarket residents.
| Immigration Origin | # Population | % Population |
| Africa | 14 | 0.2% |
| Asia | 99 | 1.7% |
| Canada | 24 | 0.4% |
| Central America | 7 | 0.1% |
| Colombia | 4 | 0.1% |
| Eastern Africa | 9 | 0.2% |
| Eastern Asia | 50 | 0.9% |
| India | 38 | 0.6% |
| Japan | 50 | 0.9% |
| Kenya | 9 | 0.2% |
| Latin America | 11 | 0.2% |
| Mexico | 7 | 0.1% |
| Morocco | 5 | 0.1% |
| Northern Africa | 5 | 0.1% |
| Philippines | 11 | 0.2% |
| South America | 4 | 0.1% |
| South Central Asia | 38 | 0.6% |
| South Eastern Asia | 11 | 0.2% | View All 18 Rows |
Sex and Age in Newmarket
Sex and Age in Newmarket
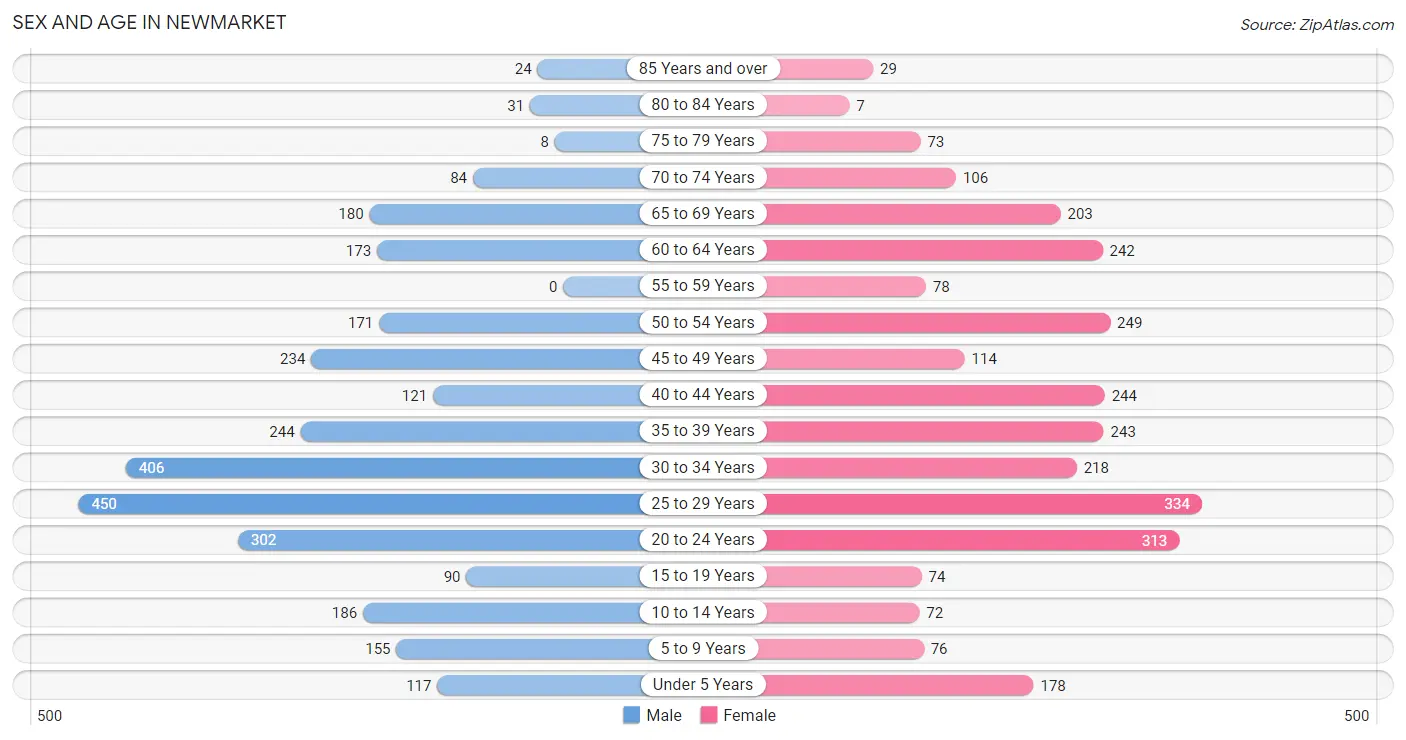
The most populous age groups in Newmarket are 25 to 29 Years (450 | 15.1%) for men and 25 to 29 Years (334 | 11.7%) for women.
| Age Bracket | Male | Female |
| Under 5 Years | 117 (3.9%) | 178 (6.2%) |
| 5 to 9 Years | 155 (5.2%) | 76 (2.7%) |
| 10 to 14 Years | 186 (6.2%) | 72 (2.5%) |
| 15 to 19 Years | 90 (3.0%) | 74 (2.6%) |
| 20 to 24 Years | 302 (10.2%) | 313 (11.0%) |
| 25 to 29 Years | 450 (15.1%) | 334 (11.7%) |
| 30 to 34 Years | 406 (13.6%) | 218 (7.6%) |
| 35 to 39 Years | 244 (8.2%) | 243 (8.5%) |
| 40 to 44 Years | 121 (4.1%) | 244 (8.6%) |
| 45 to 49 Years | 234 (7.9%) | 114 (4.0%) |
| 50 to 54 Years | 171 (5.8%) | 249 (8.7%) |
| 55 to 59 Years | 0 (0.0%) | 78 (2.7%) |
| 60 to 64 Years | 173 (5.8%) | 242 (8.5%) |
| 65 to 69 Years | 180 (6.0%) | 203 (7.1%) |
| 70 to 74 Years | 84 (2.8%) | 106 (3.7%) |
| 75 to 79 Years | 8 (0.3%) | 73 (2.6%) |
| 80 to 84 Years | 31 (1.0%) | 7 (0.3%) |
| 85 Years and over | 24 (0.8%) | 29 (1.0%) |
| Total | 2,976 (100.0%) | 2,853 (100.0%) |
Families and Households in Newmarket
Median Family Size in Newmarket
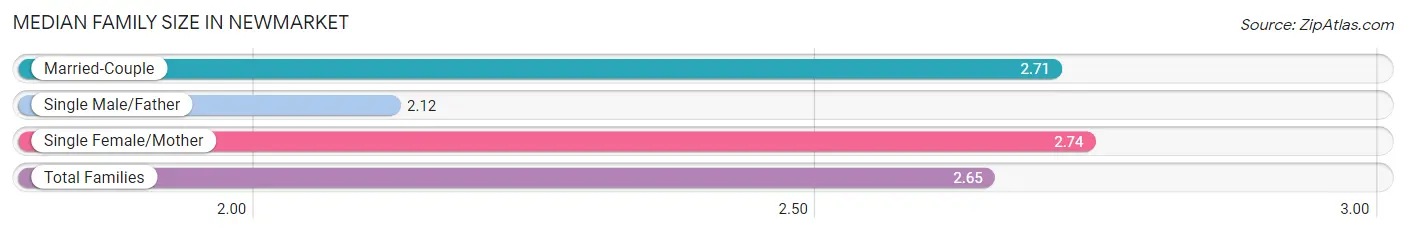
The median family size in Newmarket is 2.65 persons per family, with single female/mother families (228 | 18.1%) accounting for the largest median family size of 2.74 persons per family. On the other hand, single male/father families (141 | 11.2%) represent the smallest median family size with 2.12 persons per family.
| Family Type | # Families | Family Size |
| Married-Couple | 887 (70.6%) | 2.71 |
| Single Male/Father | 141 (11.2%) | 2.12 |
| Single Female/Mother | 228 (18.1%) | 2.74 |
| Total Families | 1,256 (100.0%) | 2.65 |
Median Household Size in Newmarket
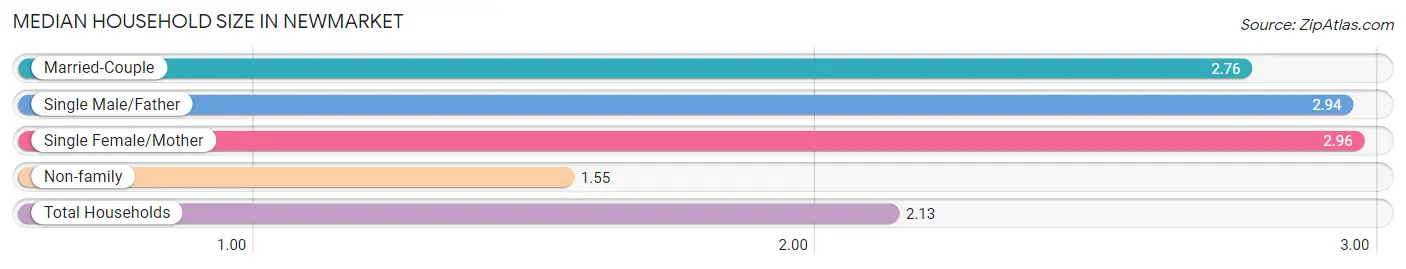
The median household size in Newmarket is 2.13 persons per household, with single female/mother households (228 | 8.3%) accounting for the largest median household size of 2.96 persons per household. non-family households (1,478 | 54.1%) represent the smallest median household size with 1.55 persons per household.
| Household Type | # Households | Household Size |
| Married-Couple | 887 (32.4%) | 2.76 |
| Single Male/Father | 141 (5.2%) | 2.94 |
| Single Female/Mother | 228 (8.3%) | 2.96 |
| Non-family | 1,478 (54.1%) | 1.55 |
| Total Households | 2,734 (100.0%) | 2.13 |
Household Size by Marriage Status in Newmarket
Out of a total of 2,734 households in Newmarket, 1,256 (45.9%) are family households, while 1,478 (54.1%) are nonfamily households. The most numerous type of family households are 2-person households, comprising 598, and the most common type of nonfamily households are 1-person households, comprising 933.
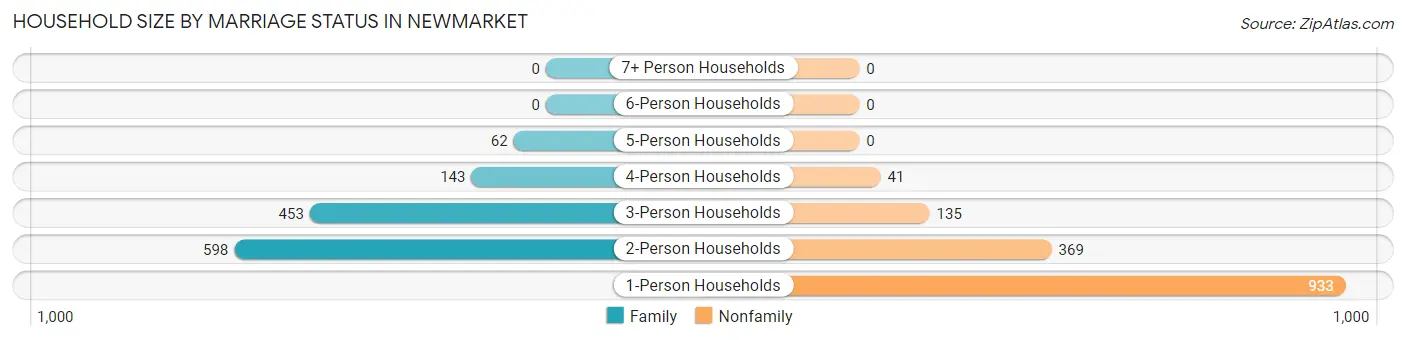
| Household Size | Family Households | Nonfamily Households |
| 1-Person Households | - | 933 (34.1%) |
| 2-Person Households | 598 (21.9%) | 369 (13.5%) |
| 3-Person Households | 453 (16.6%) | 135 (4.9%) |
| 4-Person Households | 143 (5.2%) | 41 (1.5%) |
| 5-Person Households | 62 (2.3%) | 0 (0.0%) |
| 6-Person Households | 0 (0.0%) | 0 (0.0%) |
| 7+ Person Households | 0 (0.0%) | 0 (0.0%) |
| Total | 1,256 (45.9%) | 1,478 (54.1%) |
Female Fertility in Newmarket
Fertility by Age in Newmarket
Average fertility rate in Newmarket is 43.0 births per 1,000 women. Women in the age bracket of 20 to 34 years have the highest fertility rate with 79.0 births per 1,000 women. Women in the age bracket of 20 to 34 years acount for 100.0% of all women with births.
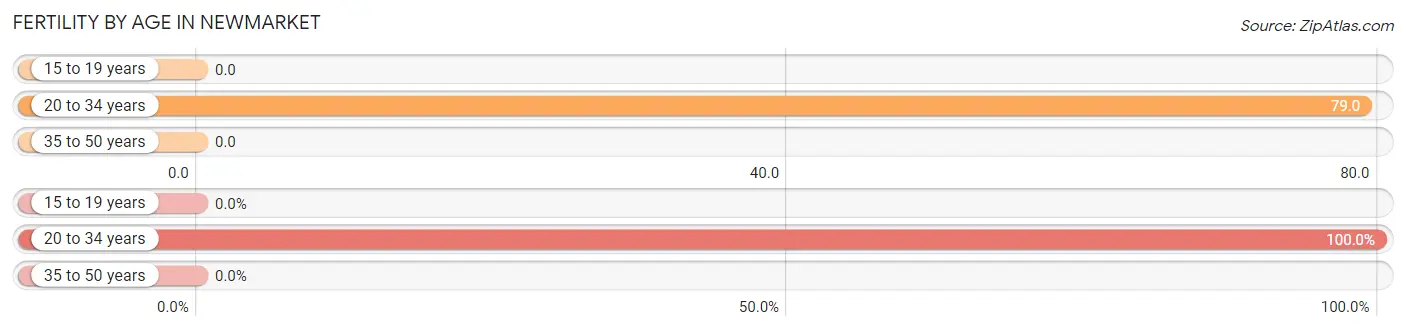
| Age Bracket | Women with Births | Births / 1,000 Women |
| 15 to 19 years | 0 (0.0%) | 0.0 |
| 20 to 34 years | 68 (100.0%) | 79.0 |
| 35 to 50 years | 0 (0.0%) | 0.0 |
| Total | 68 (100.0%) | 43.0 |
Fertility by Age by Marriage Status in Newmarket
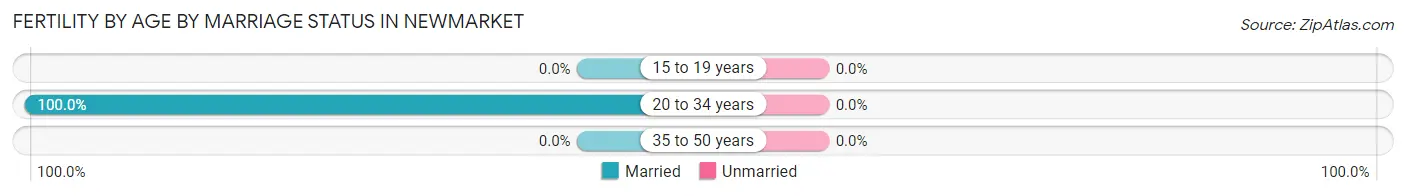
| Age Bracket | Married | Unmarried |
| 15 to 19 years | 0 (0.0%) | 0 (0.0%) |
| 20 to 34 years | 68 (100.0%) | 0 (0.0%) |
| 35 to 50 years | 0 (0.0%) | 0 (0.0%) |
| Total | 68 (100.0%) | 0 (0.0%) |
Fertility by Education in Newmarket
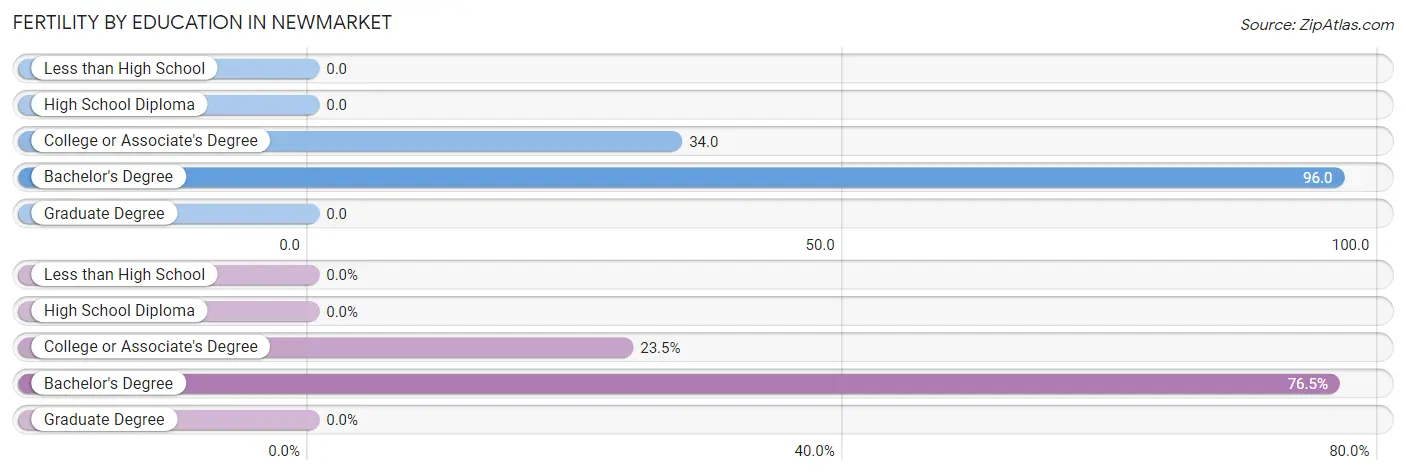
| Educational Attainment | Women with Births | Births / 1,000 Women |
| Less than High School | 0 (0.0%) | 0.0 |
| High School Diploma | 0 (0.0%) | 0.0 |
| College or Associate's Degree | 16 (23.5%) | 34.0 |
| Bachelor's Degree | 52 (76.5%) | 96.0 |
| Graduate Degree | 0 (0.0%) | 0.0 |
| Total | 68 (100.0%) | 43.0 |
Fertility by Education by Marriage Status in Newmarket
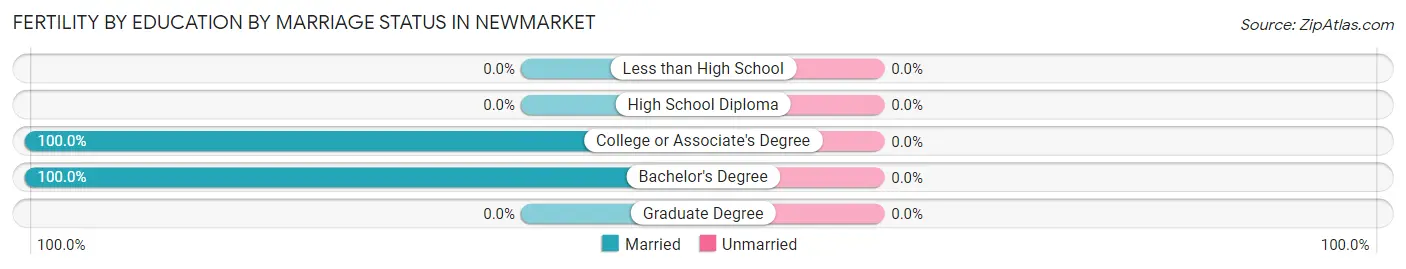
| Educational Attainment | Married | Unmarried |
| Less than High School | 0 (0.0%) | 0 (0.0%) |
| High School Diploma | 0 (0.0%) | 0 (0.0%) |
| College or Associate's Degree | 16 (100.0%) | 0 (0.0%) |
| Bachelor's Degree | 52 (100.0%) | 0 (0.0%) |
| Graduate Degree | 0 (0.0%) | 0 (0.0%) |
| Total | 68 (100.0%) | 0 (0.0%) |
Employment Characteristics in Newmarket
Employment by Class of Employer in Newmarket
Among the 3,878 employed individuals in Newmarket, private company employees (2,424 | 62.5%), not-for-profit organizations (566 | 14.6%), and state government employees (241 | 6.2%) make up the most common classes of employment.
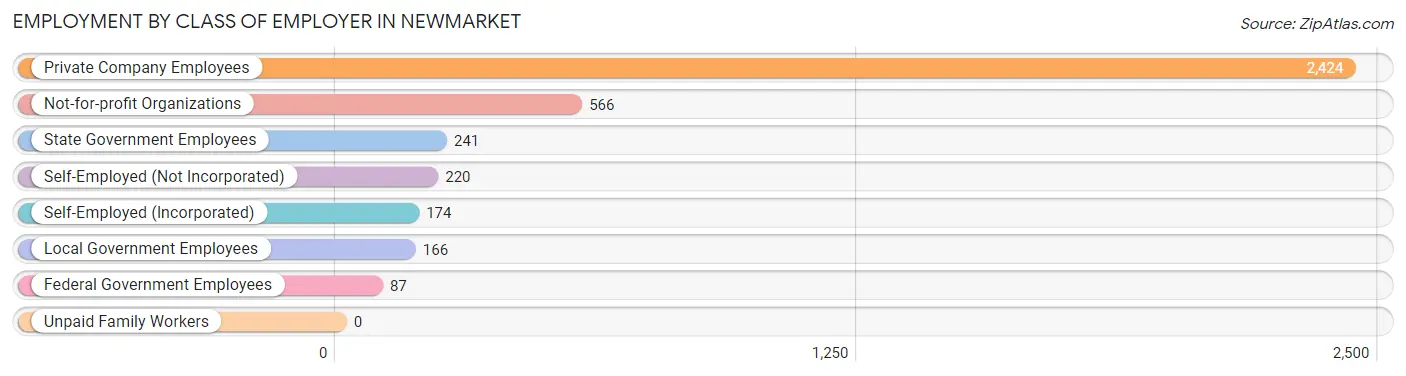
| Employer Class | # Employees | % Employees |
| Private Company Employees | 2,424 | 62.5% |
| Self-Employed (Incorporated) | 174 | 4.5% |
| Self-Employed (Not Incorporated) | 220 | 5.7% |
| Not-for-profit Organizations | 566 | 14.6% |
| Local Government Employees | 166 | 4.3% |
| State Government Employees | 241 | 6.2% |
| Federal Government Employees | 87 | 2.2% |
| Unpaid Family Workers | 0 | 0.0% |
| Total | 3,878 | 100.0% |
Employment Status by Age in Newmarket
According to the labor force statistics for Newmarket, out of the total population over 16 years of age (5,024), 79.1% or 3,974 individuals are in the labor force, with 1.0% or 40 of them unemployed. The age group with the highest labor force participation rate is 25 to 29 years, with 96.2% or 754 individuals in the labor force. Within the labor force, the 60 to 64 years age range has the highest percentage of unemployed individuals, with 4.1% or 13 of them being unemployed.
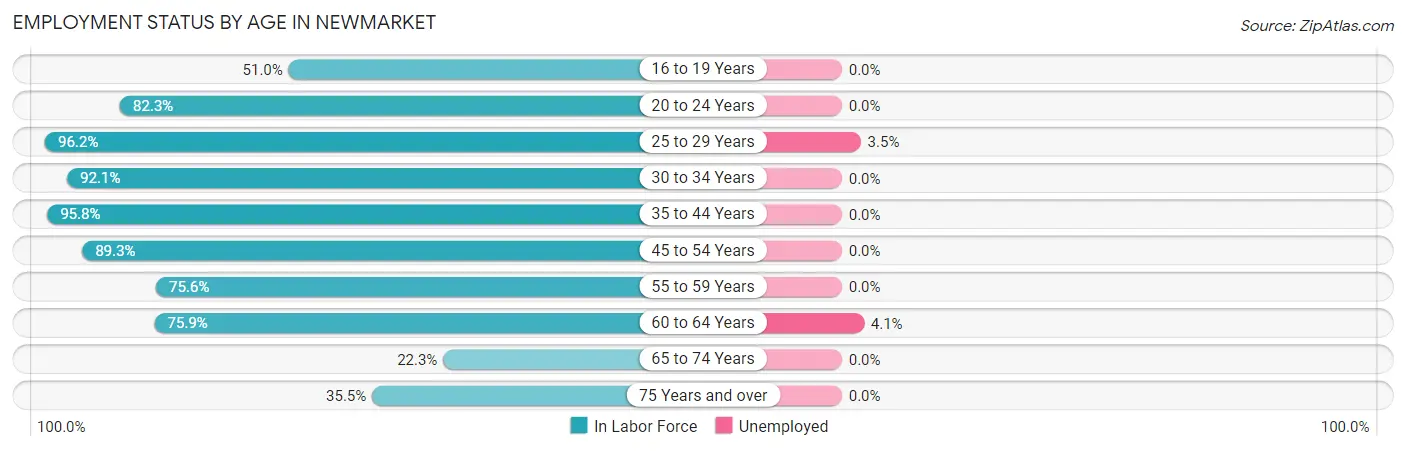
| Age Bracket | In Labor Force | Unemployed |
| 16 to 19 Years | 73 (51.0%) | 0 (0.0%) |
| 20 to 24 Years | 506 (82.3%) | 0 (0.0%) |
| 25 to 29 Years | 754 (96.2%) | 26 (3.5%) |
| 30 to 34 Years | 575 (92.1%) | 0 (0.0%) |
| 35 to 44 Years | 816 (95.8%) | 0 (0.0%) |
| 45 to 54 Years | 686 (89.3%) | 0 (0.0%) |
| 55 to 59 Years | 59 (75.6%) | 0 (0.0%) |
| 60 to 64 Years | 315 (75.9%) | 13 (4.1%) |
| 65 to 74 Years | 128 (22.3%) | 0 (0.0%) |
| 75 Years and over | 61 (35.5%) | 0 (0.0%) |
| Total | 3,974 (79.1%) | 40 (1.0%) |
Employment Status by Educational Attainment in Newmarket
According to labor force statistics for Newmarket, 91.0% of individuals (3,204) out of the total population between 25 and 64 years of age (3,521) are in the labor force, with 1.2% or 38 of them being unemployed. The group with the highest labor force participation rate are those with the educational attainment of less than high school, with 100.0% or 5 individuals in the labor force. Within the labor force, individuals with college / associate degree education have the highest percentage of unemployment, with 3.8% or 33 of them being unemployed.
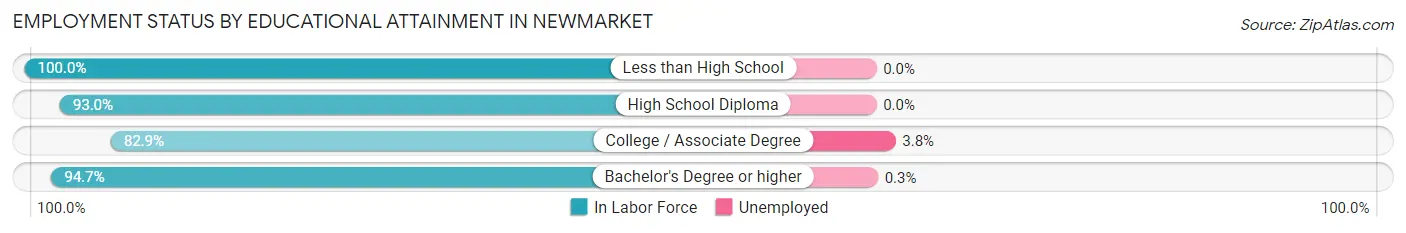
| Educational Attainment | In Labor Force | Unemployed |
| Less than High School | 5 (100.0%) | 0 (0.0%) |
| High School Diploma | 410 (93.0%) | 0 (0.0%) |
| College / Associate Degree | 864 (82.9%) | 40 (3.8%) |
| Bachelor's Degree or higher | 1,925 (94.7%) | 6 (0.3%) |
| Total | 3,204 (91.0%) | 42 (1.2%) |
Employment Occupations by Sex in Newmarket
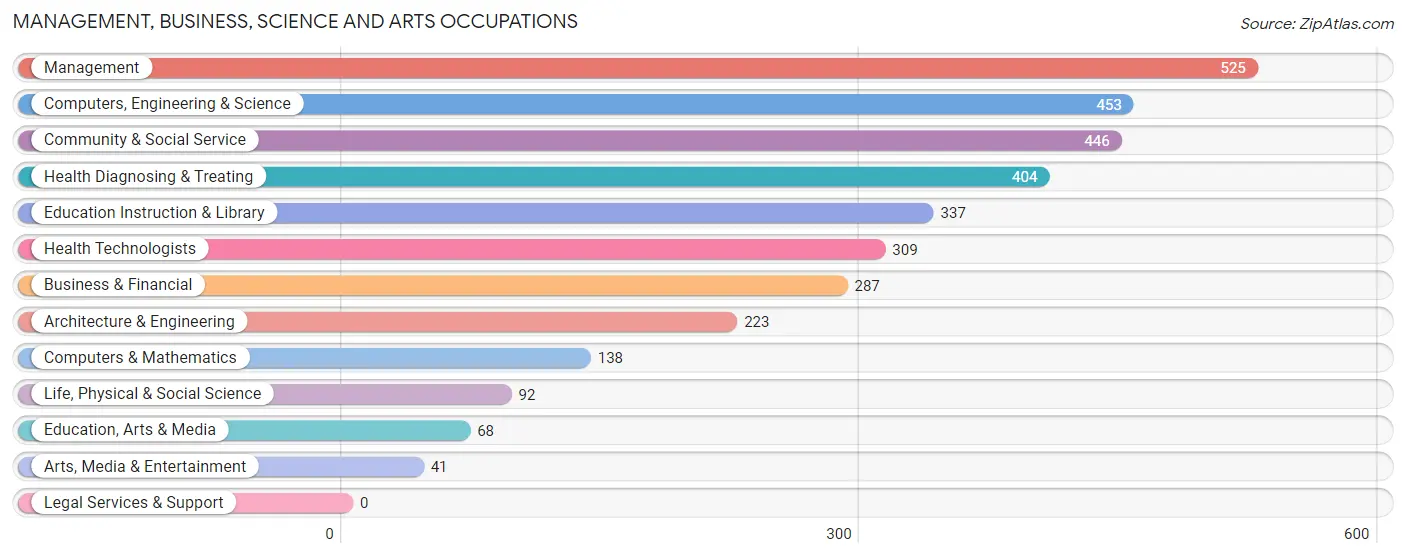
Management, Business, Science and Arts Occupations
The most common Management, Business, Science and Arts occupations in Newmarket are Management (525 | 13.6%), Computers, Engineering & Science (453 | 11.7%), Community & Social Service (446 | 11.5%), Health Diagnosing & Treating (404 | 10.4%), and Education Instruction & Library (337 | 8.7%).
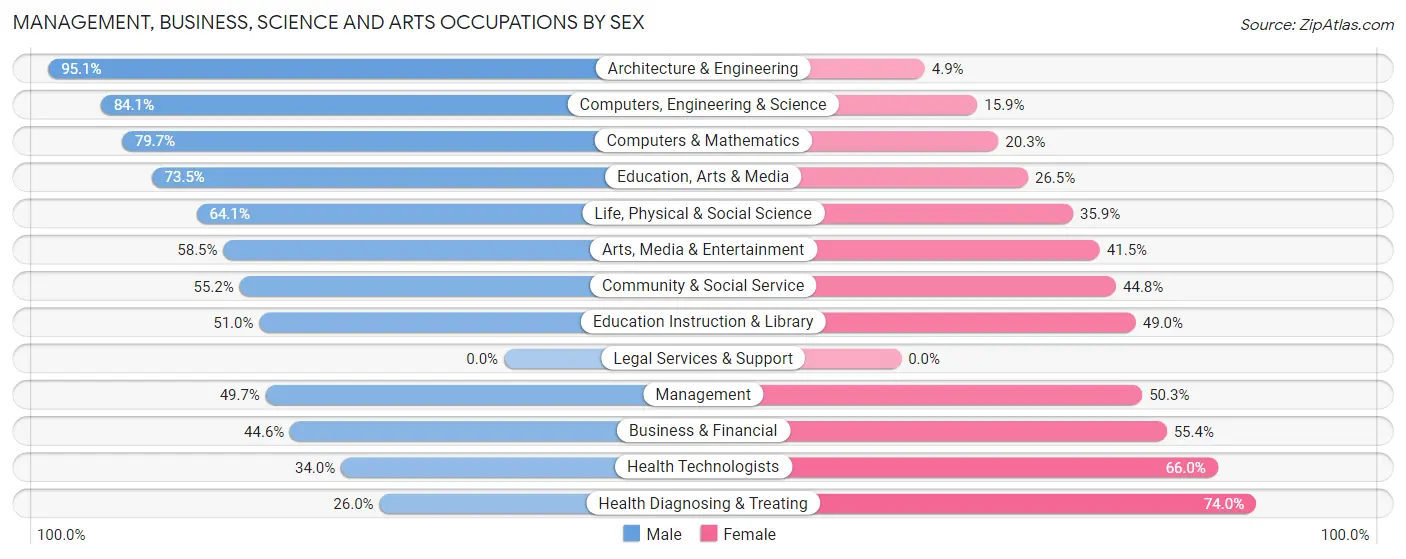
Management, Business, Science and Arts Occupations by Sex
Within the Management, Business, Science and Arts occupations in Newmarket, the most male-oriented occupations are Architecture & Engineering (95.1%), Computers, Engineering & Science (84.1%), and Computers & Mathematics (79.7%), while the most female-oriented occupations are Health Diagnosing & Treating (74.0%), Health Technologists (66.0%), and Business & Financial (55.4%).
| Occupation | Male | Female |
| Management | 261 (49.7%) | 264 (50.3%) |
| Business & Financial | 128 (44.6%) | 159 (55.4%) |
| Computers, Engineering & Science | 381 (84.1%) | 72 (15.9%) |
| Computers & Mathematics | 110 (79.7%) | 28 (20.3%) |
| Architecture & Engineering | 212 (95.1%) | 11 (4.9%) |
| Life, Physical & Social Science | 59 (64.1%) | 33 (35.9%) |
| Community & Social Service | 246 (55.2%) | 200 (44.8%) |
| Education, Arts & Media | 50 (73.5%) | 18 (26.5%) |
| Legal Services & Support | 0 (0.0%) | 0 (0.0%) |
| Education Instruction & Library | 172 (51.0%) | 165 (49.0%) |
| Arts, Media & Entertainment | 24 (58.5%) | 17 (41.5%) |
| Health Diagnosing & Treating | 105 (26.0%) | 299 (74.0%) |
| Health Technologists | 105 (34.0%) | 204 (66.0%) |
| Total (Category) | 1,121 (53.0%) | 994 (47.0%) |
| Total (Overall) | 2,076 (53.6%) | 1,799 (46.4%) |
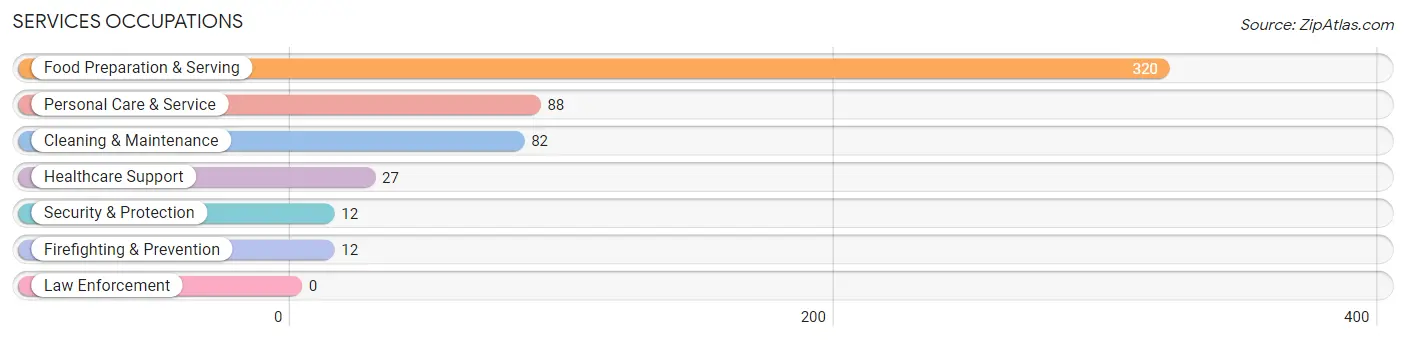
Services Occupations
The most common Services occupations in Newmarket are Food Preparation & Serving (320 | 8.3%), Personal Care & Service (88 | 2.3%), Cleaning & Maintenance (82 | 2.1%), Healthcare Support (27 | 0.7%), and Security & Protection (12 | 0.3%).
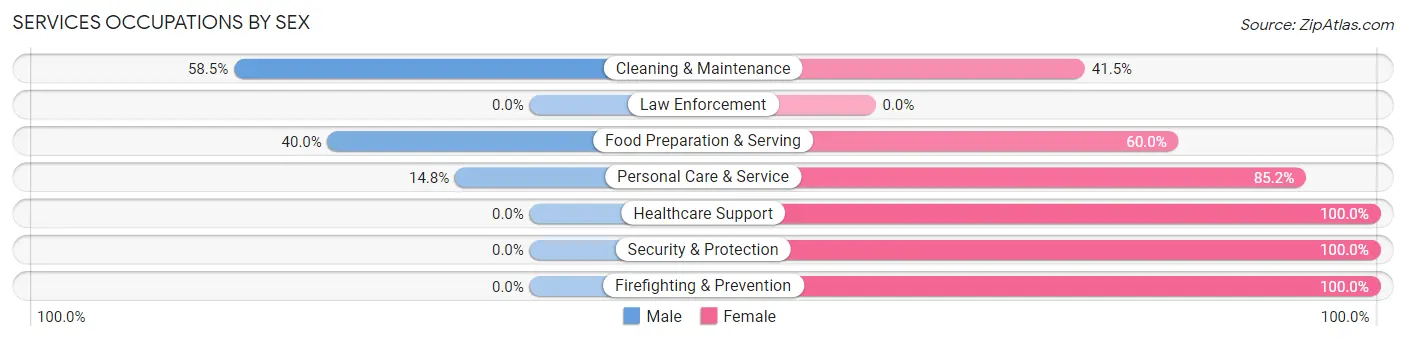
Services Occupations by Sex
Within the Services occupations in Newmarket, the most male-oriented occupations are Cleaning & Maintenance (58.5%), Food Preparation & Serving (40.0%), and Personal Care & Service (14.8%), while the most female-oriented occupations are Healthcare Support (100.0%), Security & Protection (100.0%), and Firefighting & Prevention (100.0%).
| Occupation | Male | Female |
| Healthcare Support | 0 (0.0%) | 27 (100.0%) |
| Security & Protection | 0 (0.0%) | 12 (100.0%) |
| Firefighting & Prevention | 0 (0.0%) | 12 (100.0%) |
| Law Enforcement | 0 (0.0%) | 0 (0.0%) |
| Food Preparation & Serving | 128 (40.0%) | 192 (60.0%) |
| Cleaning & Maintenance | 48 (58.5%) | 34 (41.5%) |
| Personal Care & Service | 13 (14.8%) | 75 (85.2%) |
| Total (Category) | 189 (35.7%) | 340 (64.3%) |
| Total (Overall) | 2,076 (53.6%) | 1,799 (46.4%) |
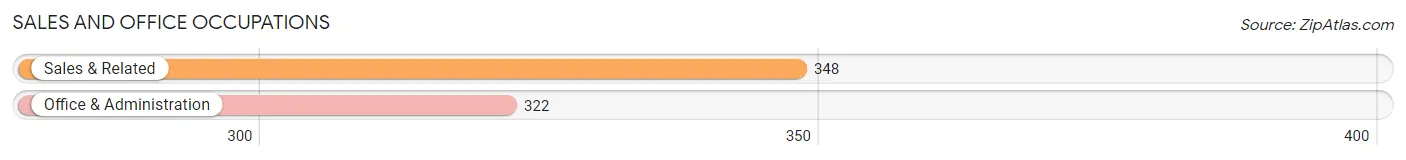
Sales and Office Occupations
The most common Sales and Office occupations in Newmarket are Sales & Related (348 | 9.0%), and Office & Administration (322 | 8.3%).
Sales and Office Occupations by Sex
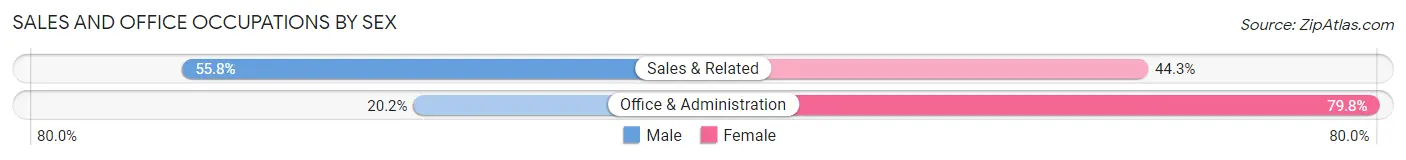
| Occupation | Male | Female |
| Sales & Related | 194 (55.7%) | 154 (44.3%) |
| Office & Administration | 65 (20.2%) | 257 (79.8%) |
| Total (Category) | 259 (38.7%) | 411 (61.3%) |
| Total (Overall) | 2,076 (53.6%) | 1,799 (46.4%) |
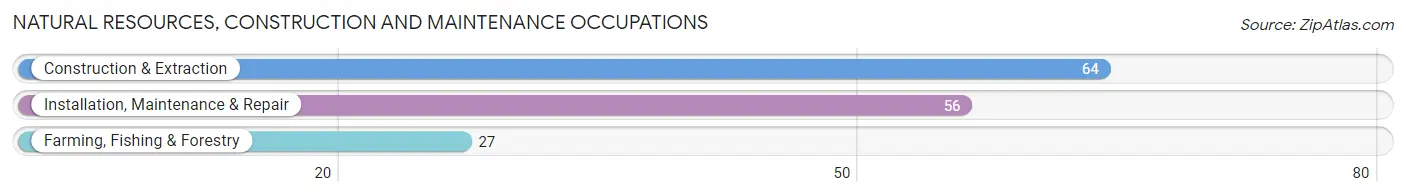
Natural Resources, Construction and Maintenance Occupations
The most common Natural Resources, Construction and Maintenance occupations in Newmarket are Construction & Extraction (64 | 1.7%), Installation, Maintenance & Repair (56 | 1.5%), and Farming, Fishing & Forestry (27 | 0.7%).
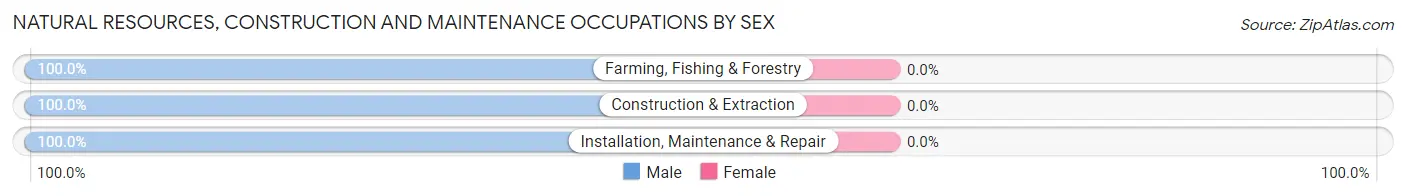
Natural Resources, Construction and Maintenance Occupations by Sex
| Occupation | Male | Female |
| Farming, Fishing & Forestry | 27 (100.0%) | 0 (0.0%) |
| Construction & Extraction | 64 (100.0%) | 0 (0.0%) |
| Installation, Maintenance & Repair | 56 (100.0%) | 0 (0.0%) |
| Total (Category) | 147 (100.0%) | 0 (0.0%) |
| Total (Overall) | 2,076 (53.6%) | 1,799 (46.4%) |
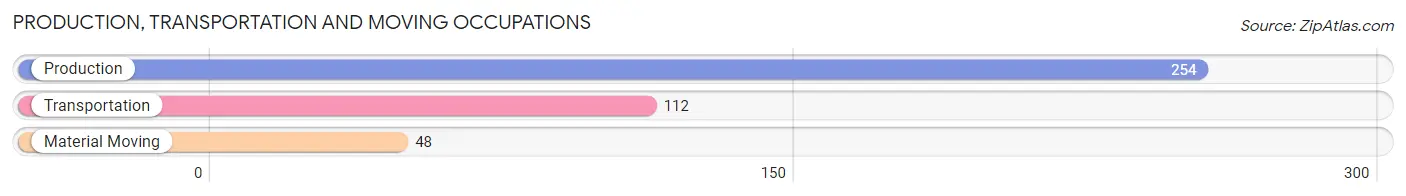
Production, Transportation and Moving Occupations
The most common Production, Transportation and Moving occupations in Newmarket are Production (254 | 6.6%), Transportation (112 | 2.9%), and Material Moving (48 | 1.2%).
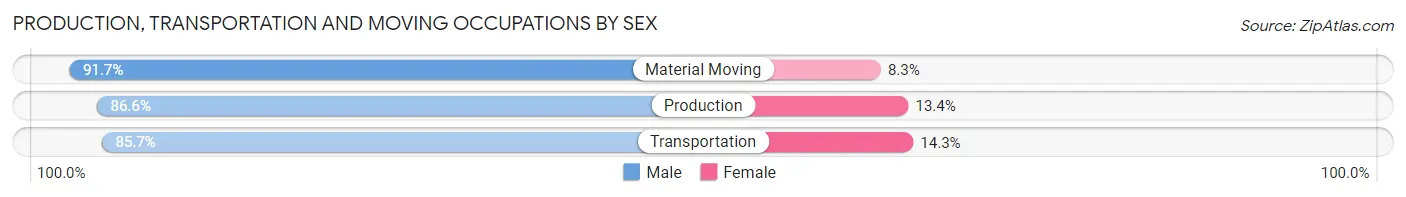
Production, Transportation and Moving Occupations by Sex
| Occupation | Male | Female |
| Production | 220 (86.6%) | 34 (13.4%) |
| Transportation | 96 (85.7%) | 16 (14.3%) |
| Material Moving | 44 (91.7%) | 4 (8.3%) |
| Total (Category) | 360 (87.0%) | 54 (13.0%) |
| Total (Overall) | 2,076 (53.6%) | 1,799 (46.4%) |
Employment Industries by Sex in Newmarket
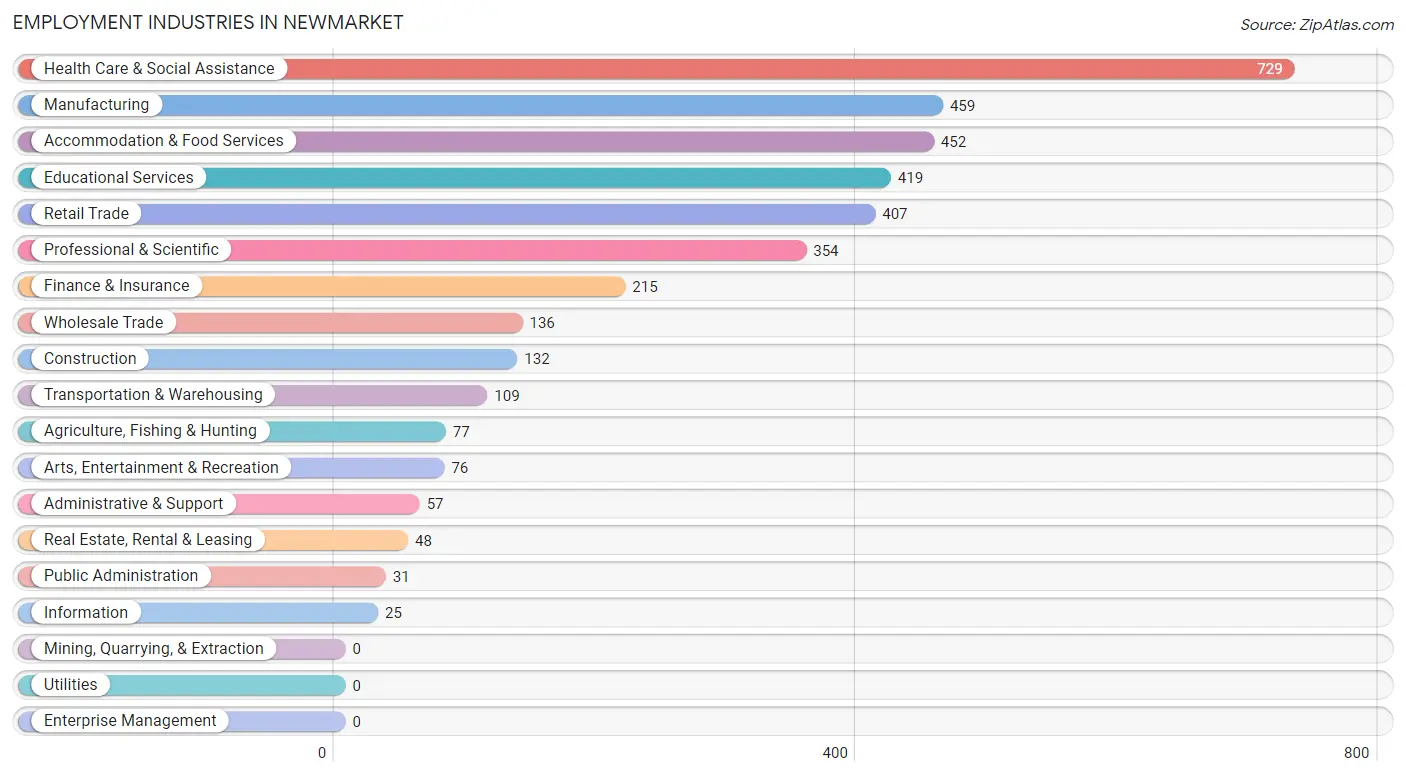
Employment Industries in Newmarket
The major employment industries in Newmarket include Health Care & Social Assistance (729 | 18.8%), Manufacturing (459 | 11.8%), Accommodation & Food Services (452 | 11.7%), Educational Services (419 | 10.8%), and Retail Trade (407 | 10.5%).
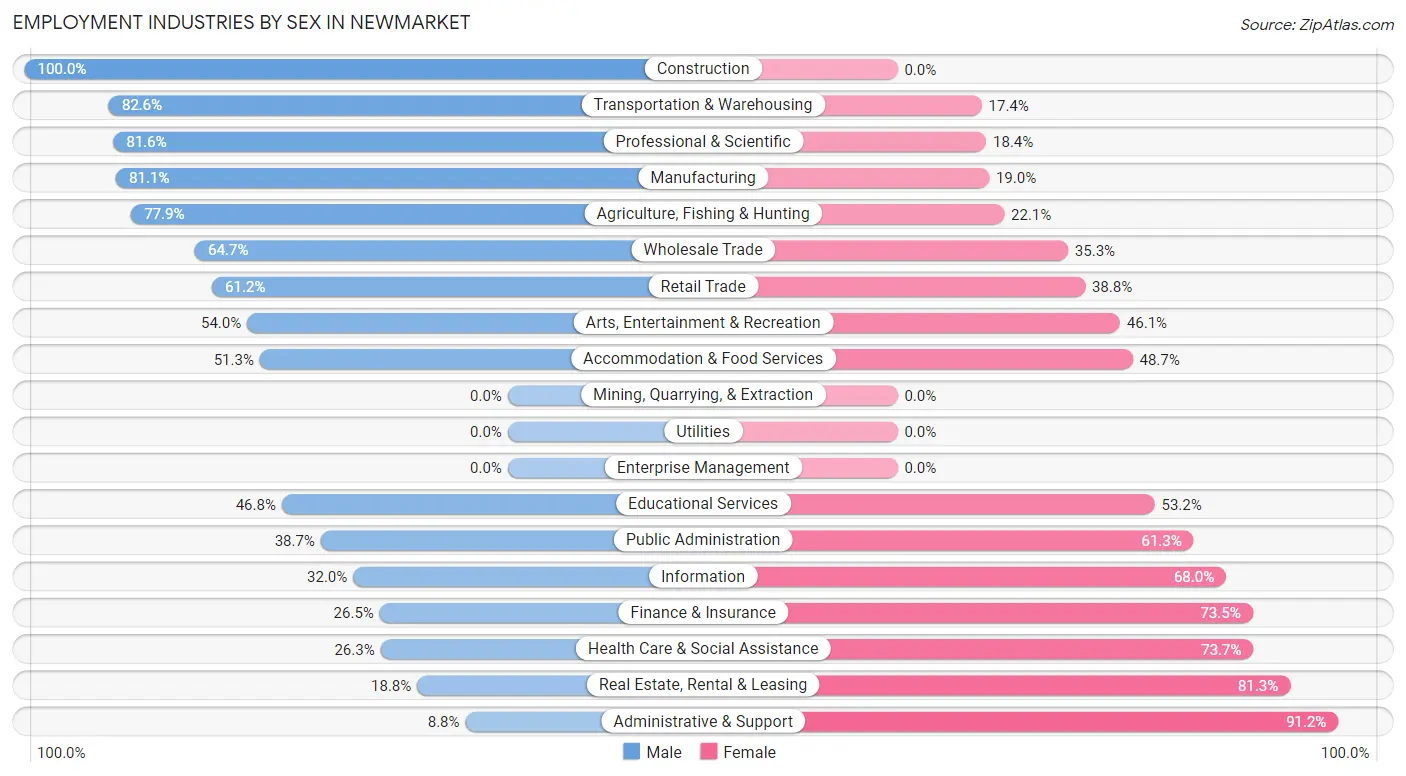
Employment Industries by Sex in Newmarket
The Newmarket industries that see more men than women are Construction (100.0%), Transportation & Warehousing (82.6%), and Professional & Scientific (81.6%), whereas the industries that tend to have a higher number of women are Administrative & Support (91.2%), Real Estate, Rental & Leasing (81.2%), and Health Care & Social Assistance (73.7%).
| Industry | Male | Female |
| Agriculture, Fishing & Hunting | 60 (77.9%) | 17 (22.1%) |
| Mining, Quarrying, & Extraction | 0 (0.0%) | 0 (0.0%) |
| Construction | 132 (100.0%) | 0 (0.0%) |
| Manufacturing | 372 (81.0%) | 87 (19.0%) |
| Wholesale Trade | 88 (64.7%) | 48 (35.3%) |
| Retail Trade | 249 (61.2%) | 158 (38.8%) |
| Transportation & Warehousing | 90 (82.6%) | 19 (17.4%) |
| Utilities | 0 (0.0%) | 0 (0.0%) |
| Information | 8 (32.0%) | 17 (68.0%) |
| Finance & Insurance | 57 (26.5%) | 158 (73.5%) |
| Real Estate, Rental & Leasing | 9 (18.8%) | 39 (81.2%) |
| Professional & Scientific | 289 (81.6%) | 65 (18.4%) |
| Enterprise Management | 0 (0.0%) | 0 (0.0%) |
| Administrative & Support | 5 (8.8%) | 52 (91.2%) |
| Educational Services | 196 (46.8%) | 223 (53.2%) |
| Health Care & Social Assistance | 192 (26.3%) | 537 (73.7%) |
| Arts, Entertainment & Recreation | 41 (53.9%) | 35 (46.1%) |
| Accommodation & Food Services | 232 (51.3%) | 220 (48.7%) |
| Public Administration | 12 (38.7%) | 19 (61.3%) |
| Total | 2,076 (53.6%) | 1,799 (46.4%) |
Education in Newmarket
School Enrollment in Newmarket
The most common levels of schooling among the 1,165 students in Newmarket are graduate / professional (269 | 23.1%), college / undergraduate (227 | 19.5%), and high school (190 | 16.3%).
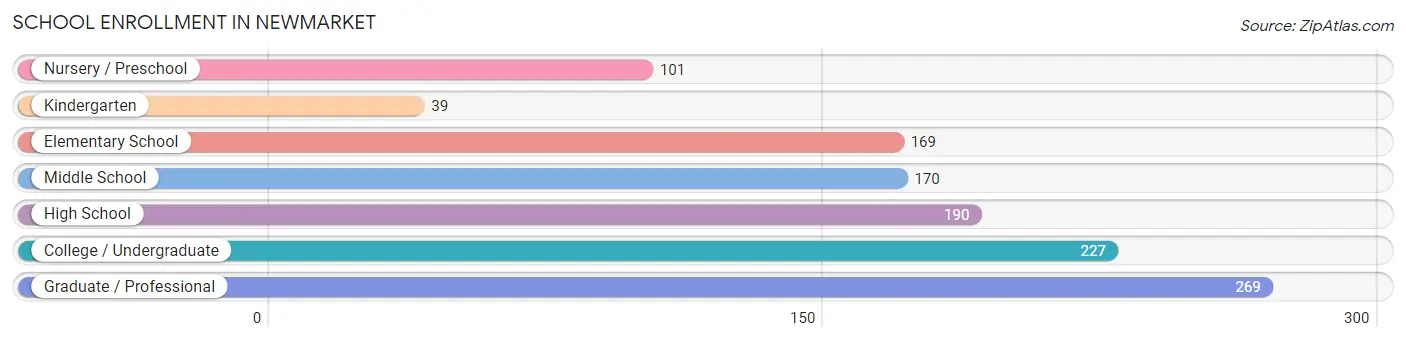
| School Level | # Students | % Students |
| Nursery / Preschool | 101 | 8.7% |
| Kindergarten | 39 | 3.4% |
| Elementary School | 169 | 14.5% |
| Middle School | 170 | 14.6% |
| High School | 190 | 16.3% |
| College / Undergraduate | 227 | 19.5% |
| Graduate / Professional | 269 | 23.1% |
| Total | 1,165 | 100.0% |
School Enrollment by Age by Funding Source in Newmarket
Out of a total of 1,165 students who are enrolled in schools in Newmarket, 214 (18.4%) attend a private institution, while the remaining 951 (81.6%) are enrolled in public schools. The age group of 25 to 34 year olds has the highest likelihood of being enrolled in private schools, with 111 (53.6% in the age bracket) enrolled. Conversely, the age group of 15 to 17 year olds has the lowest likelihood of being enrolled in a private school, with 107 (100.0% in the age bracket) attending a public institution.
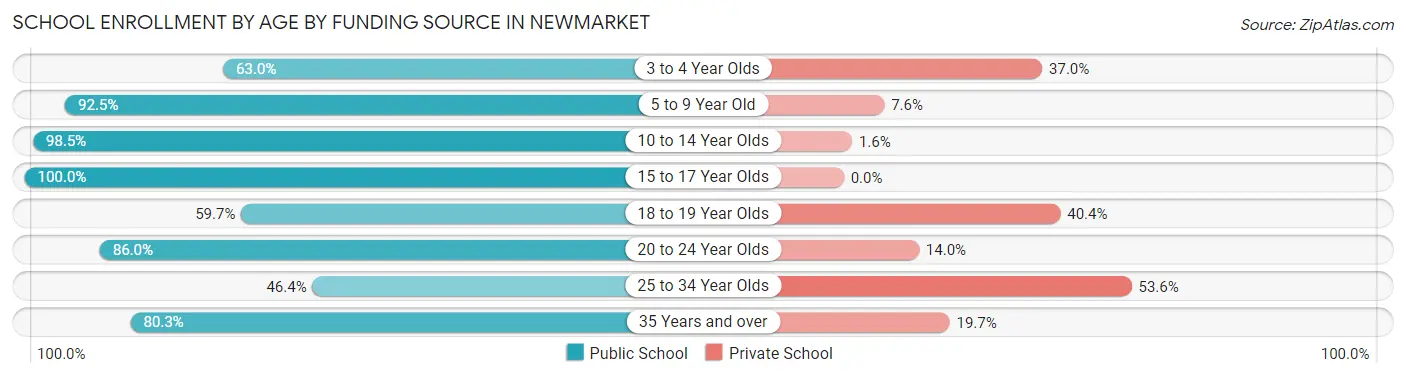
| Age Bracket | Public School | Private School |
| 3 to 4 Year Olds | 29 (63.0%) | 17 (37.0%) |
| 5 to 9 Year Old | 196 (92.4%) | 16 (7.5%) |
| 10 to 14 Year Olds | 254 (98.5%) | 4 (1.5%) |
| 15 to 17 Year Olds | 107 (100.0%) | 0 (0.0%) |
| 18 to 19 Year Olds | 34 (59.7%) | 23 (40.4%) |
| 20 to 24 Year Olds | 178 (86.0%) | 29 (14.0%) |
| 25 to 34 Year Olds | 96 (46.4%) | 111 (53.6%) |
| 35 Years and over | 57 (80.3%) | 14 (19.7%) |
| Total | 951 (81.6%) | 214 (18.4%) |
Educational Attainment by Field of Study in Newmarket
Business (355 | 13.9%), arts & humanities (274 | 10.8%), education (248 | 9.7%), psychology (236 | 9.3%), and social sciences (209 | 8.2%) are the most common fields of study among 2,547 individuals in Newmarket who have obtained a bachelor's degree or higher.
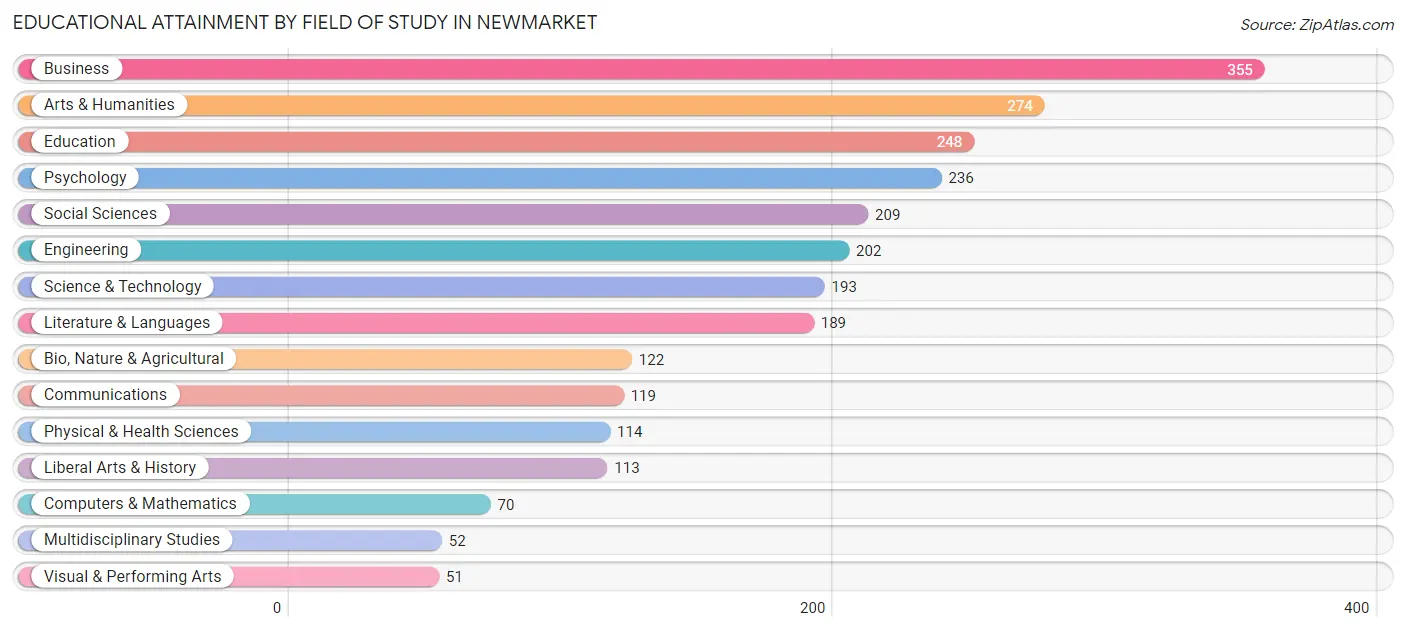
| Field of Study | # Graduates | % Graduates |
| Computers & Mathematics | 70 | 2.8% |
| Bio, Nature & Agricultural | 122 | 4.8% |
| Physical & Health Sciences | 114 | 4.5% |
| Psychology | 236 | 9.3% |
| Social Sciences | 209 | 8.2% |
| Engineering | 202 | 7.9% |
| Multidisciplinary Studies | 52 | 2.0% |
| Science & Technology | 193 | 7.6% |
| Business | 355 | 13.9% |
| Education | 248 | 9.7% |
| Literature & Languages | 189 | 7.4% |
| Liberal Arts & History | 113 | 4.4% |
| Visual & Performing Arts | 51 | 2.0% |
| Communications | 119 | 4.7% |
| Arts & Humanities | 274 | 10.8% |
| Total | 2,547 | 100.0% |
Transportation & Commute in Newmarket
Vehicle Availability by Sex in Newmarket
The most prevalent vehicle ownership categories in Newmarket are males with 2 vehicles (1,145, accounting for 54.4%) and females with 2 vehicles (1,087, making up 64.6%).
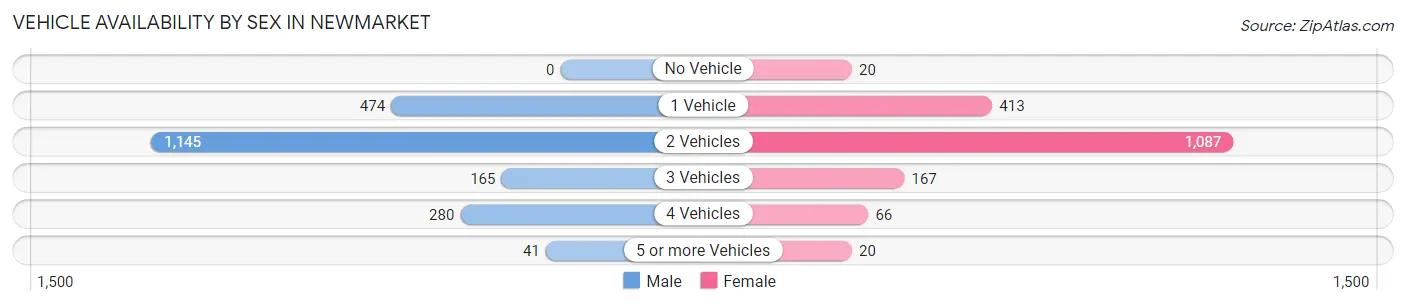
| Vehicles Available | Male | Female |
| No Vehicle | 0 (0.0%) | 20 (1.1%) |
| 1 Vehicle | 474 (22.5%) | 413 (23.3%) |
| 2 Vehicles | 1,145 (54.4%) | 1,087 (61.3%) |
| 3 Vehicles | 165 (7.8%) | 167 (9.4%) |
| 4 Vehicles | 280 (13.3%) | 66 (3.7%) |
| 5 or more Vehicles | 41 (1.9%) | 20 (1.1%) |
| Total | 2,105 (100.0%) | 1,773 (100.0%) |
Commute Time in Newmarket
The most frequently occuring commute durations in Newmarket are 20 to 24 minutes (681 commuters, 19.7%), 30 to 34 minutes (641 commuters, 18.5%), and 15 to 19 minutes (636 commuters, 18.4%).
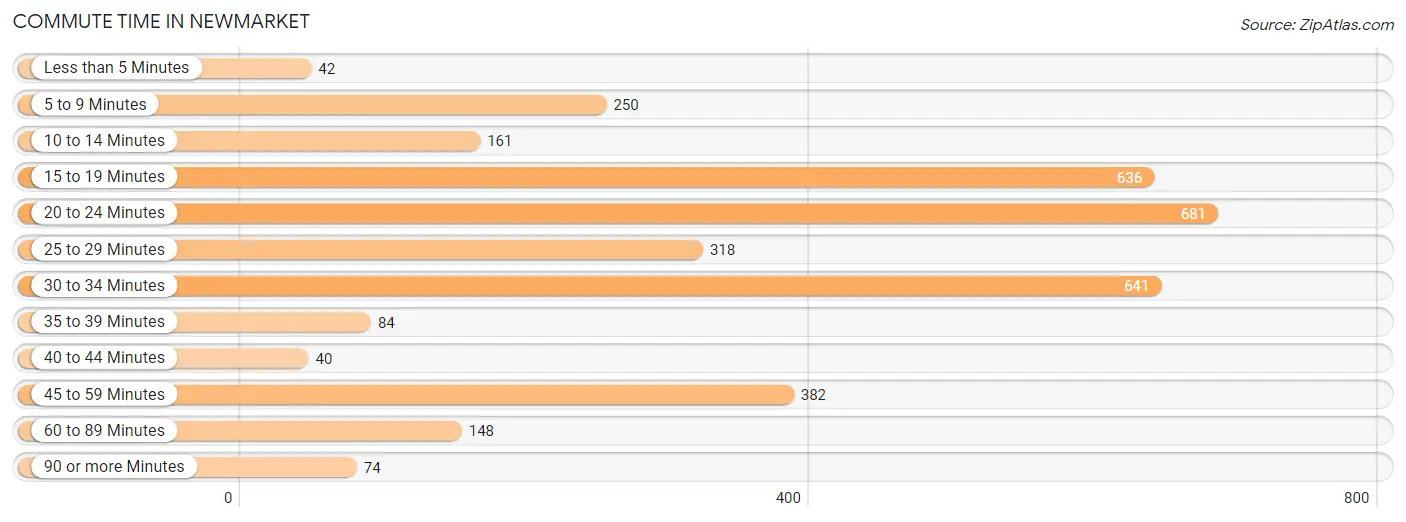
| Commute Time | # Commuters | % Commuters |
| Less than 5 Minutes | 42 | 1.2% |
| 5 to 9 Minutes | 250 | 7.2% |
| 10 to 14 Minutes | 161 | 4.7% |
| 15 to 19 Minutes | 636 | 18.4% |
| 20 to 24 Minutes | 681 | 19.7% |
| 25 to 29 Minutes | 318 | 9.2% |
| 30 to 34 Minutes | 641 | 18.5% |
| 35 to 39 Minutes | 84 | 2.4% |
| 40 to 44 Minutes | 40 | 1.2% |
| 45 to 59 Minutes | 382 | 11.1% |
| 60 to 89 Minutes | 148 | 4.3% |
| 90 or more Minutes | 74 | 2.1% |
Commute Time by Sex in Newmarket
The most common commute times in Newmarket are 30 to 34 minutes (428 commuters, 22.6%) for males and 20 to 24 minutes (348 commuters, 22.3%) for females.
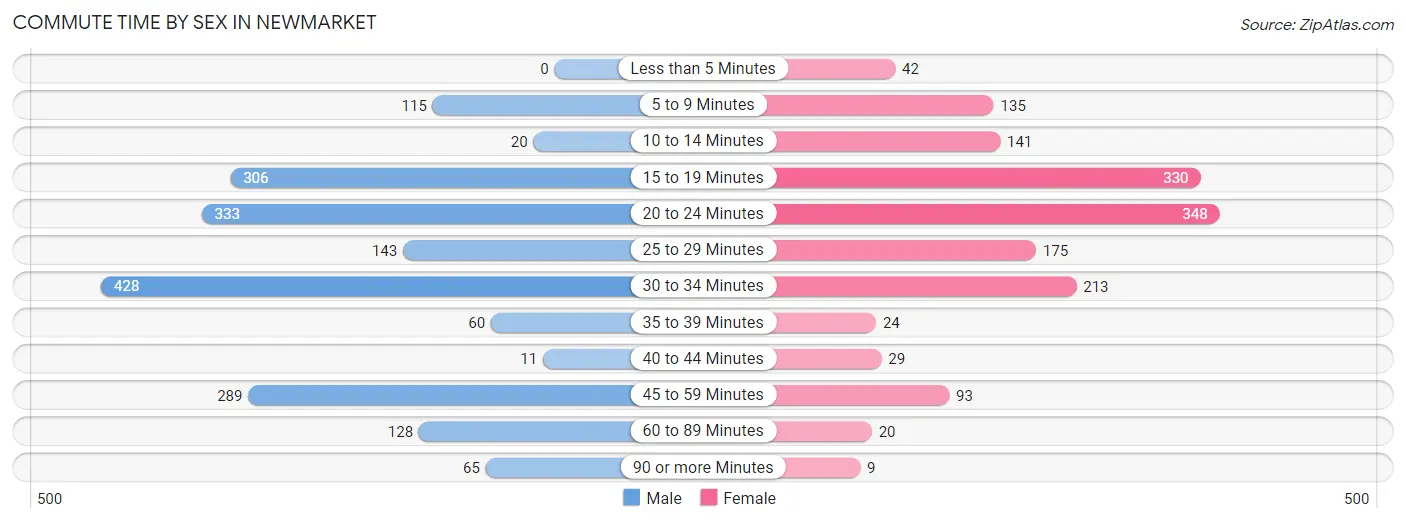
| Commute Time | Male | Female |
| Less than 5 Minutes | 0 (0.0%) | 42 (2.7%) |
| 5 to 9 Minutes | 115 (6.1%) | 135 (8.7%) |
| 10 to 14 Minutes | 20 (1.1%) | 141 (9.0%) |
| 15 to 19 Minutes | 306 (16.1%) | 330 (21.2%) |
| 20 to 24 Minutes | 333 (17.5%) | 348 (22.3%) |
| 25 to 29 Minutes | 143 (7.5%) | 175 (11.2%) |
| 30 to 34 Minutes | 428 (22.6%) | 213 (13.7%) |
| 35 to 39 Minutes | 60 (3.2%) | 24 (1.5%) |
| 40 to 44 Minutes | 11 (0.6%) | 29 (1.9%) |
| 45 to 59 Minutes | 289 (15.2%) | 93 (6.0%) |
| 60 to 89 Minutes | 128 (6.7%) | 20 (1.3%) |
| 90 or more Minutes | 65 (3.4%) | 9 (0.6%) |
Time of Departure to Work by Sex in Newmarket
The most frequent times of departure to work in Newmarket are 6:30 AM to 6:59 AM (284, 15.0%) for males and 7:30 AM to 7:59 AM (383, 24.6%) for females.
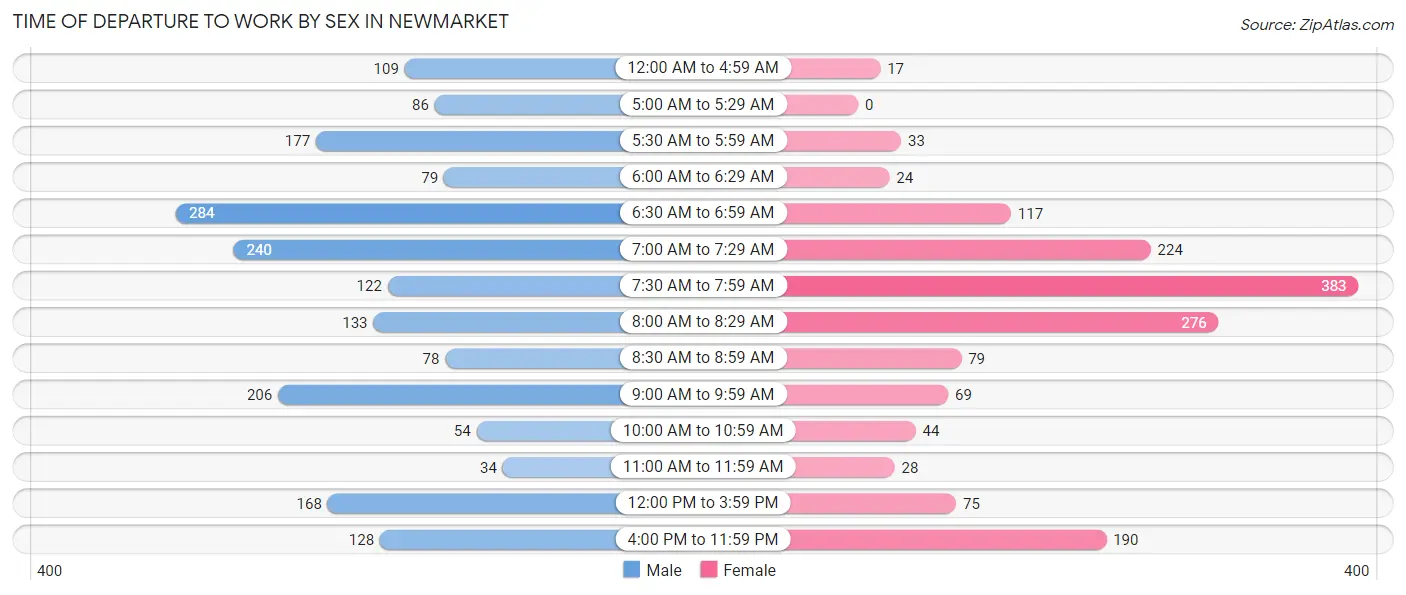
| Time of Departure | Male | Female |
| 12:00 AM to 4:59 AM | 109 (5.7%) | 17 (1.1%) |
| 5:00 AM to 5:29 AM | 86 (4.5%) | 0 (0.0%) |
| 5:30 AM to 5:59 AM | 177 (9.3%) | 33 (2.1%) |
| 6:00 AM to 6:29 AM | 79 (4.2%) | 24 (1.5%) |
| 6:30 AM to 6:59 AM | 284 (15.0%) | 117 (7.5%) |
| 7:00 AM to 7:29 AM | 240 (12.6%) | 224 (14.4%) |
| 7:30 AM to 7:59 AM | 122 (6.4%) | 383 (24.6%) |
| 8:00 AM to 8:29 AM | 133 (7.0%) | 276 (17.7%) |
| 8:30 AM to 8:59 AM | 78 (4.1%) | 79 (5.1%) |
| 9:00 AM to 9:59 AM | 206 (10.8%) | 69 (4.4%) |
| 10:00 AM to 10:59 AM | 54 (2.9%) | 44 (2.8%) |
| 11:00 AM to 11:59 AM | 34 (1.8%) | 28 (1.8%) |
| 12:00 PM to 3:59 PM | 168 (8.8%) | 75 (4.8%) |
| 4:00 PM to 11:59 PM | 128 (6.7%) | 190 (12.2%) |
| Total | 1,898 (100.0%) | 1,559 (100.0%) |
Housing Occupancy in Newmarket
Occupancy by Ownership in Newmarket
Of the total 2,734 dwellings in Newmarket, owner-occupied units account for 1,170 (42.8%), while renter-occupied units make up 1,564 (57.2%).
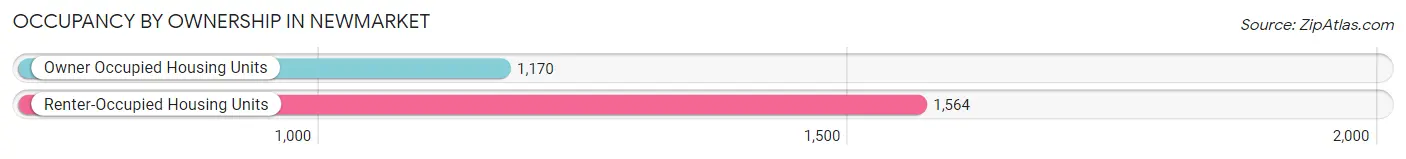
| Occupancy | # Housing Units | % Housing Units |
| Owner Occupied Housing Units | 1,170 | 42.8% |
| Renter-Occupied Housing Units | 1,564 | 57.2% |
| Total Occupied Housing Units | 2,734 | 100.0% |
Occupancy by Household Size in Newmarket
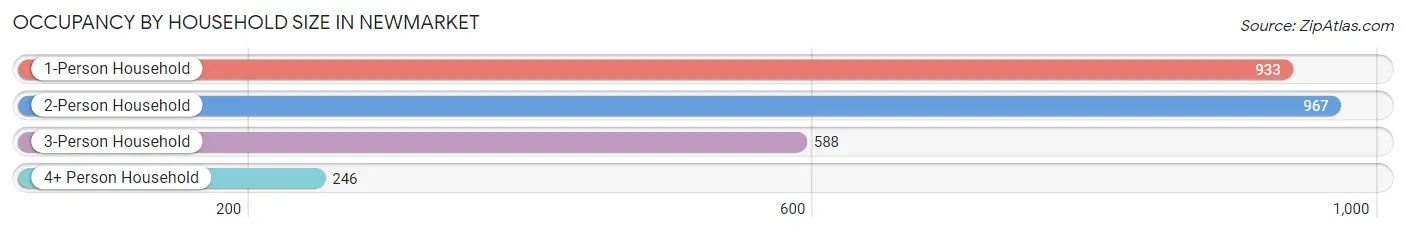
| Household Size | # Housing Units | % Housing Units |
| 1-Person Household | 933 | 34.1% |
| 2-Person Household | 967 | 35.4% |
| 3-Person Household | 588 | 21.5% |
| 4+ Person Household | 246 | 9.0% |
| Total Housing Units | 2,734 | 100.0% |
Occupancy by Ownership by Household Size in Newmarket
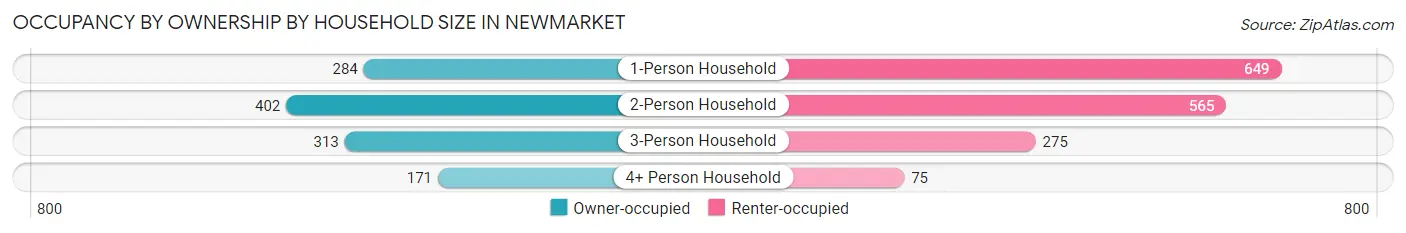
| Household Size | Owner-occupied | Renter-occupied |
| 1-Person Household | 284 (30.4%) | 649 (69.6%) |
| 2-Person Household | 402 (41.6%) | 565 (58.4%) |
| 3-Person Household | 313 (53.2%) | 275 (46.8%) |
| 4+ Person Household | 171 (69.5%) | 75 (30.5%) |
| Total Housing Units | 1,170 (42.8%) | 1,564 (57.2%) |
Occupancy by Educational Attainment in Newmarket
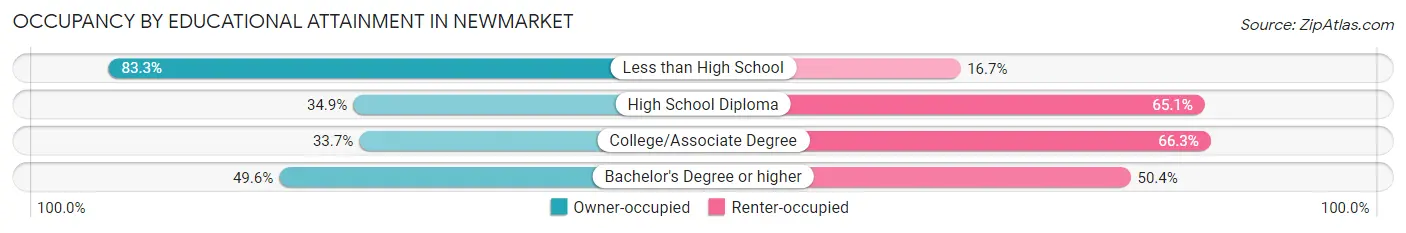
| Household Size | Owner-occupied | Renter-occupied |
| Less than High School | 15 (83.3%) | 3 (16.7%) |
| High School Diploma | 143 (34.9%) | 267 (65.1%) |
| College/Associate Degree | 278 (33.7%) | 547 (66.3%) |
| Bachelor's Degree or higher | 734 (49.6%) | 747 (50.4%) |
Occupancy by Age of Householder in Newmarket
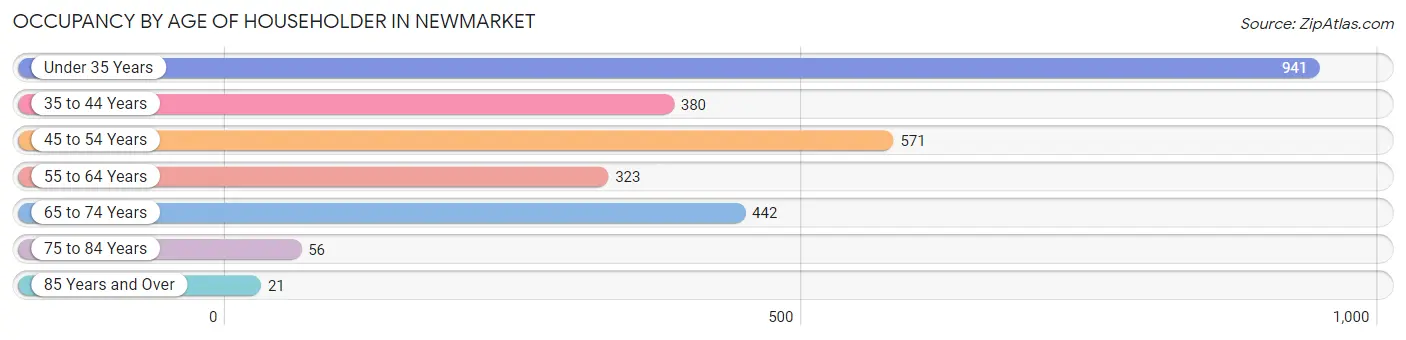
| Age Bracket | # Households | % Households |
| Under 35 Years | 941 | 34.4% |
| 35 to 44 Years | 380 | 13.9% |
| 45 to 54 Years | 571 | 20.9% |
| 55 to 64 Years | 323 | 11.8% |
| 65 to 74 Years | 442 | 16.2% |
| 75 to 84 Years | 56 | 2.1% |
| 85 Years and Over | 21 | 0.8% |
| Total | 2,734 | 100.0% |
Housing Finances in Newmarket
Median Income by Occupancy in Newmarket
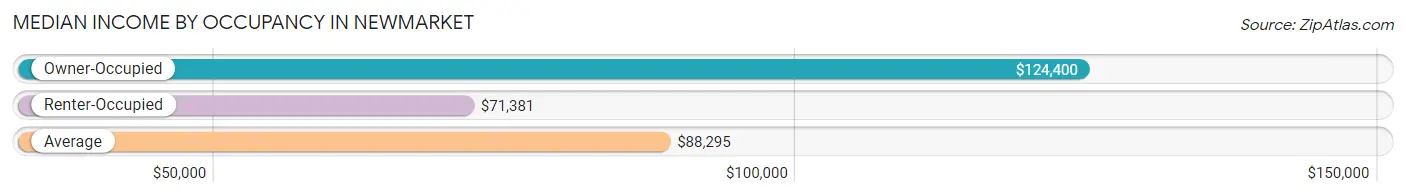
| Occupancy Type | # Households | Median Income |
| Owner-Occupied | 1,170 (42.8%) | $124,400 |
| Renter-Occupied | 1,564 (57.2%) | $71,381 |
| Average | 2,734 (100.0%) | $88,295 |
Occupancy by Householder Income Bracket in Newmarket
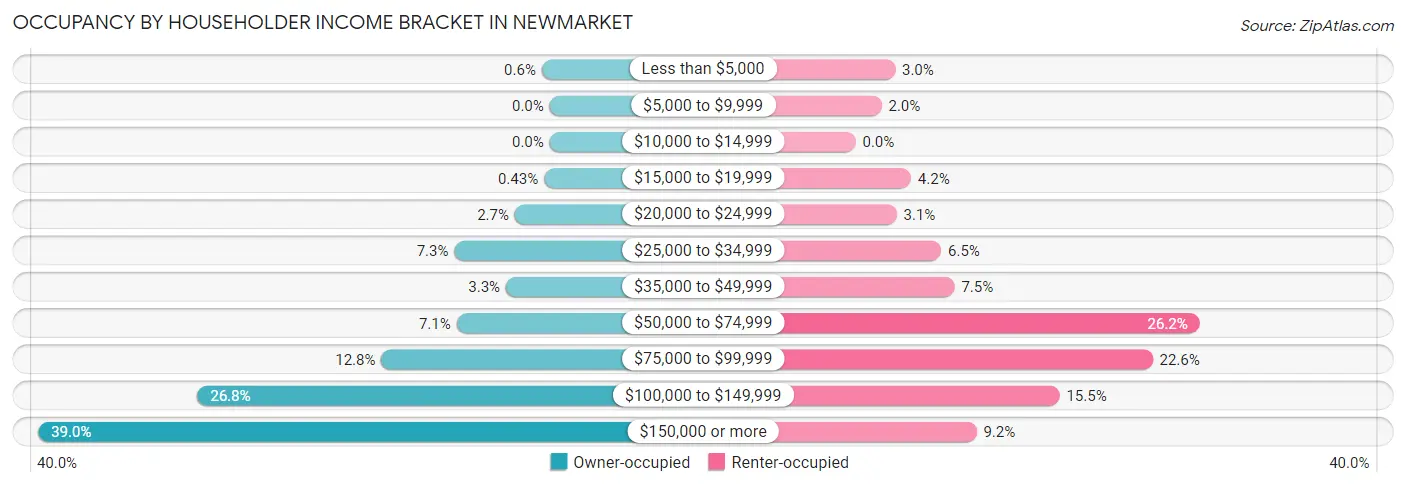
| Income Bracket | Owner-occupied | Renter-occupied |
| Less than $5,000 | 7 (0.6%) | 47 (3.0%) |
| $5,000 to $9,999 | 0 (0.0%) | 31 (2.0%) |
| $10,000 to $14,999 | 0 (0.0%) | 0 (0.0%) |
| $15,000 to $19,999 | 5 (0.4%) | 66 (4.2%) |
| $20,000 to $24,999 | 31 (2.6%) | 49 (3.1%) |
| $25,000 to $34,999 | 85 (7.3%) | 102 (6.5%) |
| $35,000 to $49,999 | 39 (3.3%) | 118 (7.5%) |
| $50,000 to $74,999 | 83 (7.1%) | 410 (26.2%) |
| $75,000 to $99,999 | 150 (12.8%) | 354 (22.6%) |
| $100,000 to $149,999 | 314 (26.8%) | 243 (15.5%) |
| $150,000 or more | 456 (39.0%) | 144 (9.2%) |
| Total | 1,170 (100.0%) | 1,564 (100.0%) |
Monthly Housing Cost Tiers in Newmarket
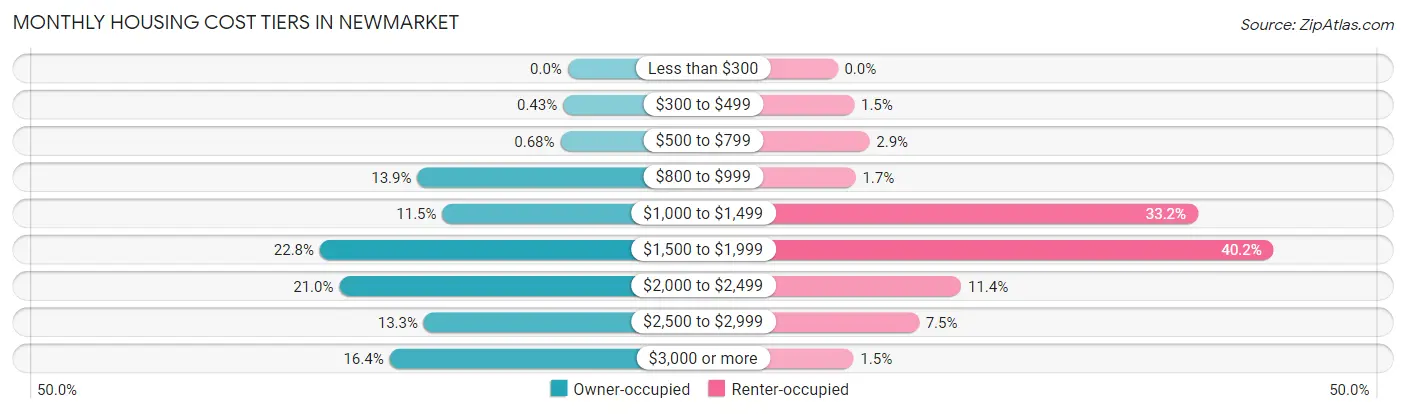
| Monthly Cost | Owner-occupied | Renter-occupied |
| Less than $300 | 0 (0.0%) | 0 (0.0%) |
| $300 to $499 | 5 (0.4%) | 24 (1.5%) |
| $500 to $799 | 8 (0.7%) | 46 (2.9%) |
| $800 to $999 | 162 (13.9%) | 26 (1.7%) |
| $1,000 to $1,499 | 135 (11.5%) | 519 (33.2%) |
| $1,500 to $1,999 | 267 (22.8%) | 628 (40.2%) |
| $2,000 to $2,499 | 246 (21.0%) | 178 (11.4%) |
| $2,500 to $2,999 | 155 (13.3%) | 117 (7.5%) |
| $3,000 or more | 192 (16.4%) | 23 (1.5%) |
| Total | 1,170 (100.0%) | 1,564 (100.0%) |
Physical Housing Characteristics in Newmarket
Housing Structures in Newmarket
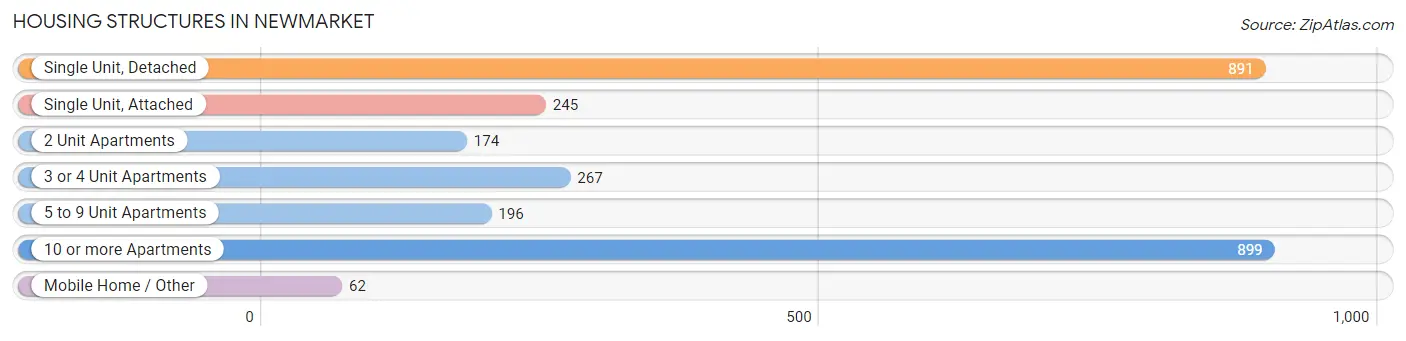
| Structure Type | # Housing Units | % Housing Units |
| Single Unit, Detached | 891 | 32.6% |
| Single Unit, Attached | 245 | 9.0% |
| 2 Unit Apartments | 174 | 6.4% |
| 3 or 4 Unit Apartments | 267 | 9.8% |
| 5 to 9 Unit Apartments | 196 | 7.2% |
| 10 or more Apartments | 899 | 32.9% |
| Mobile Home / Other | 62 | 2.3% |
| Total | 2,734 | 100.0% |
Housing Structures by Occupancy in Newmarket
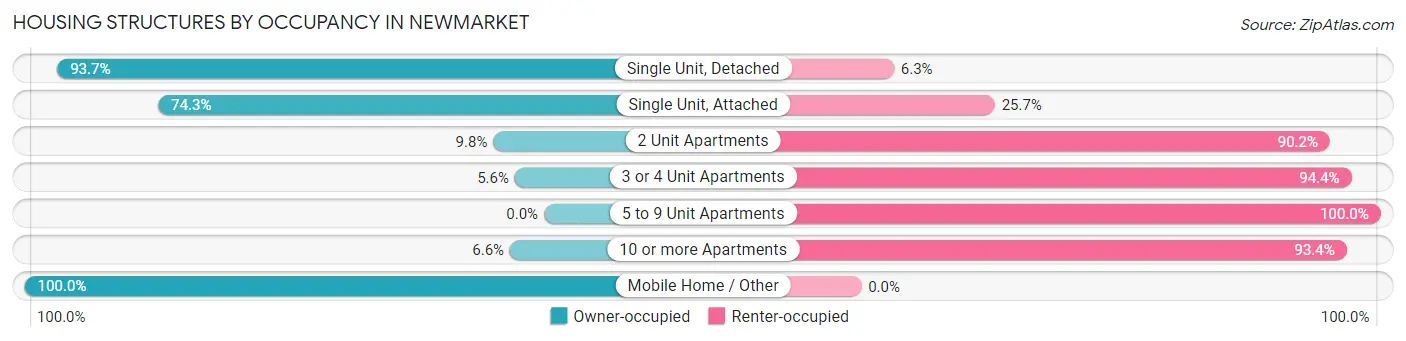
| Structure Type | Owner-occupied | Renter-occupied |
| Single Unit, Detached | 835 (93.7%) | 56 (6.3%) |
| Single Unit, Attached | 182 (74.3%) | 63 (25.7%) |
| 2 Unit Apartments | 17 (9.8%) | 157 (90.2%) |
| 3 or 4 Unit Apartments | 15 (5.6%) | 252 (94.4%) |
| 5 to 9 Unit Apartments | 0 (0.0%) | 196 (100.0%) |
| 10 or more Apartments | 59 (6.6%) | 840 (93.4%) |
| Mobile Home / Other | 62 (100.0%) | 0 (0.0%) |
| Total | 1,170 (42.8%) | 1,564 (57.2%) |
Housing Structures by Number of Rooms in Newmarket
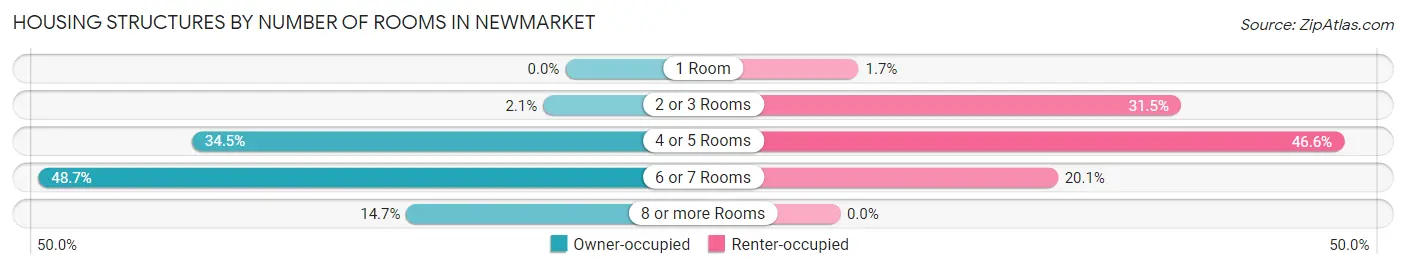
| Number of Rooms | Owner-occupied | Renter-occupied |
| 1 Room | 0 (0.0%) | 27 (1.7%) |
| 2 or 3 Rooms | 24 (2.1%) | 493 (31.5%) |
| 4 or 5 Rooms | 404 (34.5%) | 729 (46.6%) |
| 6 or 7 Rooms | 570 (48.7%) | 315 (20.1%) |
| 8 or more Rooms | 172 (14.7%) | 0 (0.0%) |
| Total | 1,170 (100.0%) | 1,564 (100.0%) |
Housing Structure by Heating Type in Newmarket
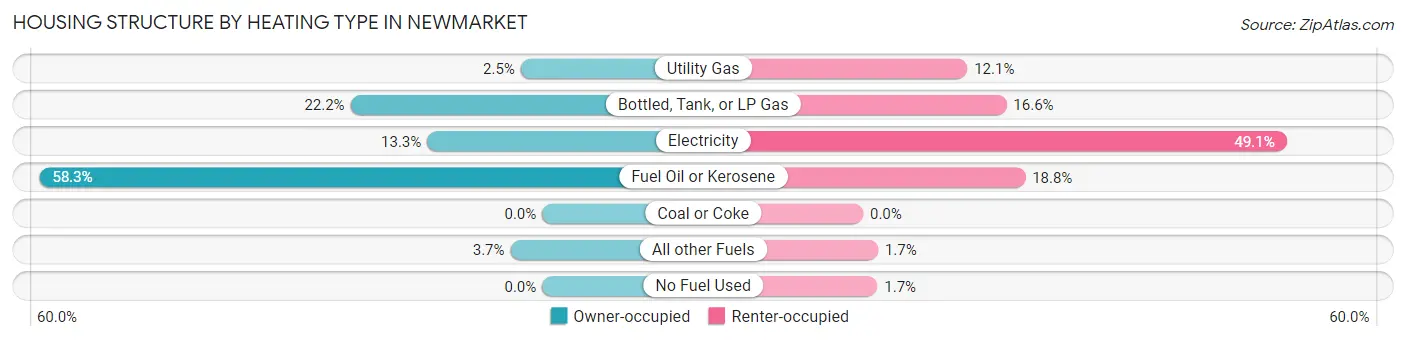
| Heating Type | Owner-occupied | Renter-occupied |
| Utility Gas | 29 (2.5%) | 189 (12.1%) |
| Bottled, Tank, or LP Gas | 260 (22.2%) | 260 (16.6%) |
| Electricity | 156 (13.3%) | 768 (49.1%) |
| Fuel Oil or Kerosene | 682 (58.3%) | 294 (18.8%) |
| Coal or Coke | 0 (0.0%) | 0 (0.0%) |
| All other Fuels | 43 (3.7%) | 27 (1.7%) |
| No Fuel Used | 0 (0.0%) | 26 (1.7%) |
| Total | 1,170 (100.0%) | 1,564 (100.0%) |
Household Vehicle Usage in Newmarket
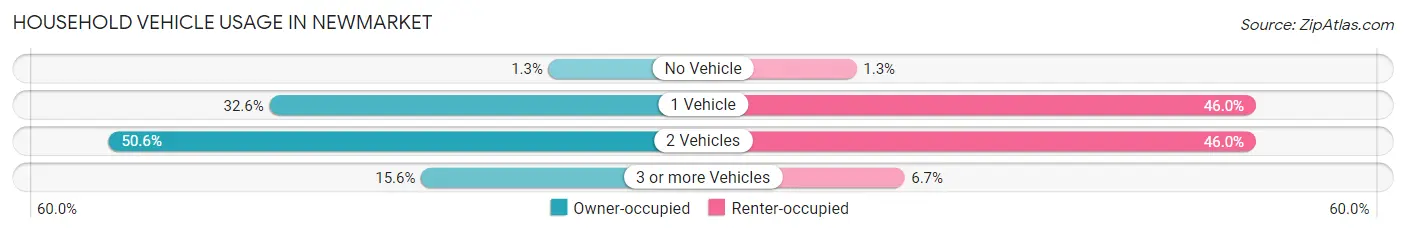
| Vehicles per Household | Owner-occupied | Renter-occupied |
| No Vehicle | 15 (1.3%) | 20 (1.3%) |
| 1 Vehicle | 381 (32.6%) | 720 (46.0%) |
| 2 Vehicles | 592 (50.6%) | 720 (46.0%) |
| 3 or more Vehicles | 182 (15.6%) | 104 (6.7%) |
| Total | 1,170 (100.0%) | 1,564 (100.0%) |
Real Estate & Mortgages in Newmarket
Real Estate and Mortgage Overview in Newmarket
| Characteristic | Without Mortgage | With Mortgage |
| Housing Units | 217 | 953 |
| Median Property Value | $276,000 | $347,500 |
| Median Household Income | $88,875 | $418 |
| Monthly Housing Costs | $967 | $192 |
| Real Estate Taxes | $6,067 | $0 |
Property Value by Mortgage Status in Newmarket
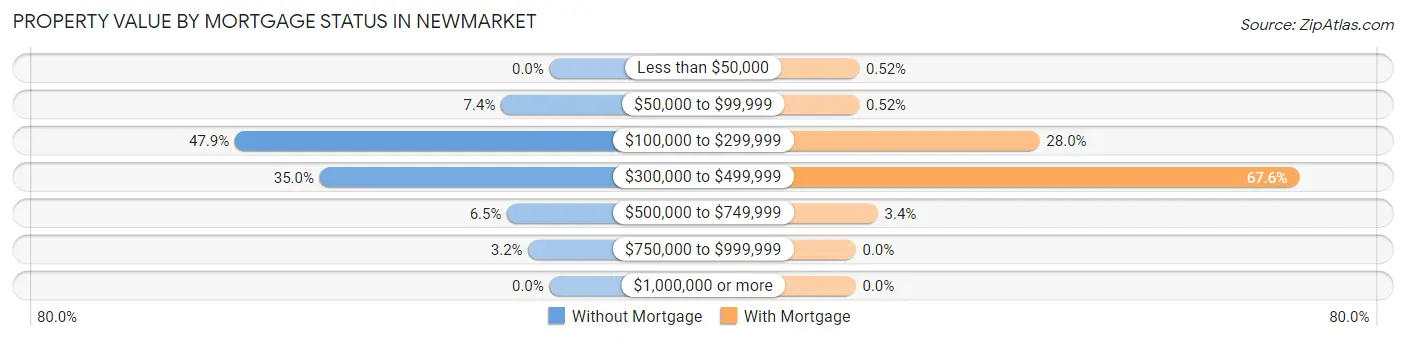
| Property Value | Without Mortgage | With Mortgage |
| Less than $50,000 | 0 (0.0%) | 5 (0.5%) |
| $50,000 to $99,999 | 16 (7.4%) | 5 (0.5%) |
| $100,000 to $299,999 | 104 (47.9%) | 267 (28.0%) |
| $300,000 to $499,999 | 76 (35.0%) | 644 (67.6%) |
| $500,000 to $749,999 | 14 (6.5%) | 32 (3.4%) |
| $750,000 to $999,999 | 7 (3.2%) | 0 (0.0%) |
| $1,000,000 or more | 0 (0.0%) | 0 (0.0%) |
| Total | 217 (100.0%) | 953 (100.0%) |
Household Income by Mortgage Status in Newmarket
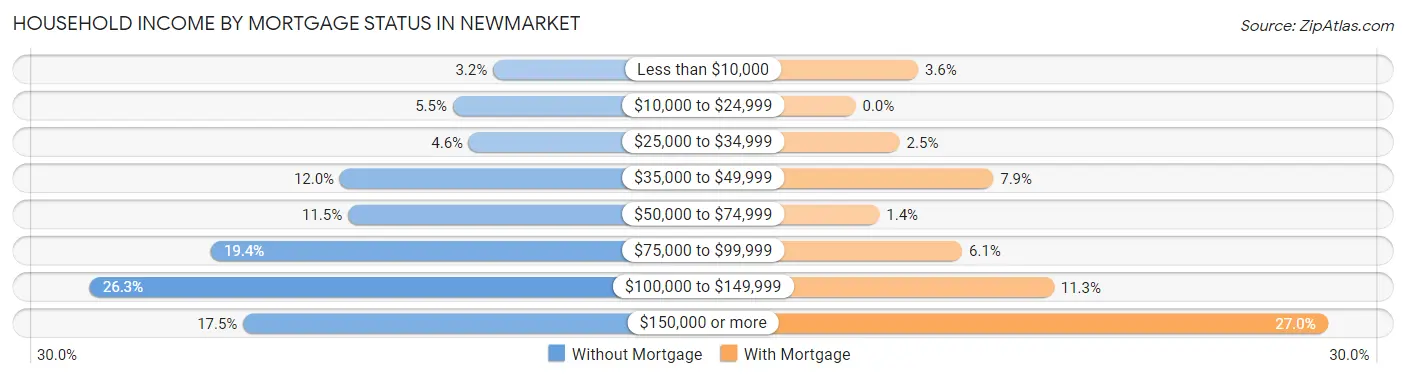
| Household Income | Without Mortgage | With Mortgage |
| Less than $10,000 | 7 (3.2%) | 34 (3.6%) |
| $10,000 to $24,999 | 12 (5.5%) | 0 (0.0%) |
| $25,000 to $34,999 | 10 (4.6%) | 24 (2.5%) |
| $35,000 to $49,999 | 26 (12.0%) | 75 (7.9%) |
| $50,000 to $74,999 | 25 (11.5%) | 13 (1.4%) |
| $75,000 to $99,999 | 42 (19.4%) | 58 (6.1%) |
| $100,000 to $149,999 | 57 (26.3%) | 108 (11.3%) |
| $150,000 or more | 38 (17.5%) | 257 (27.0%) |
| Total | 217 (100.0%) | 953 (100.0%) |
Property Value to Household Income Ratio in Newmarket
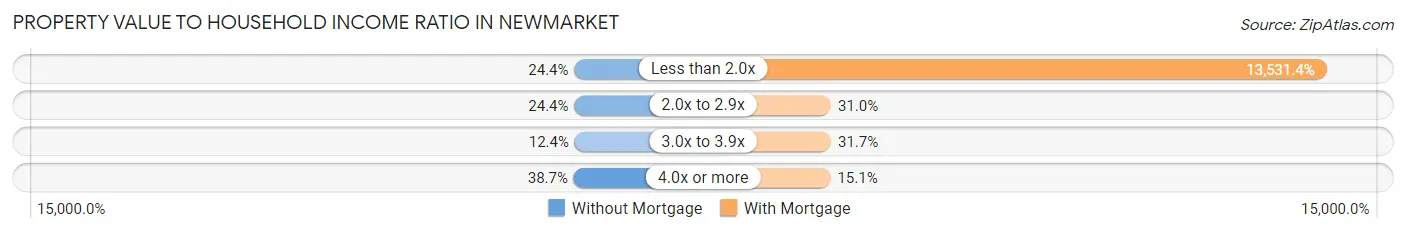
| Value-to-Income Ratio | Without Mortgage | With Mortgage |
| Less than 2.0x | 53 (24.4%) | 128,954 (13,531.4%) |
| 2.0x to 2.9x | 53 (24.4%) | 295 (30.9%) |
| 3.0x to 3.9x | 27 (12.4%) | 302 (31.7%) |
| 4.0x or more | 84 (38.7%) | 144 (15.1%) |
| Total | 217 (100.0%) | 953 (100.0%) |
Real Estate Taxes by Mortgage Status in Newmarket
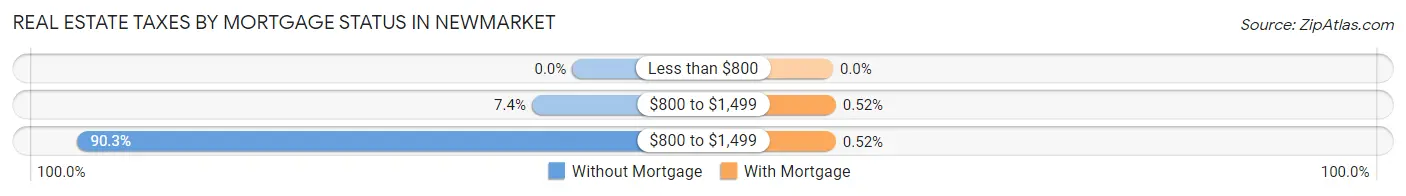
| Property Taxes | Without Mortgage | With Mortgage |
| Less than $800 | 0 (0.0%) | 0 (0.0%) |
| $800 to $1,499 | 16 (7.4%) | 5 (0.5%) |
| $800 to $1,499 | 196 (90.3%) | 5 (0.5%) |
| Total | 217 (100.0%) | 953 (100.0%) |
Health & Disability in Newmarket
Health Insurance Coverage by Age in Newmarket
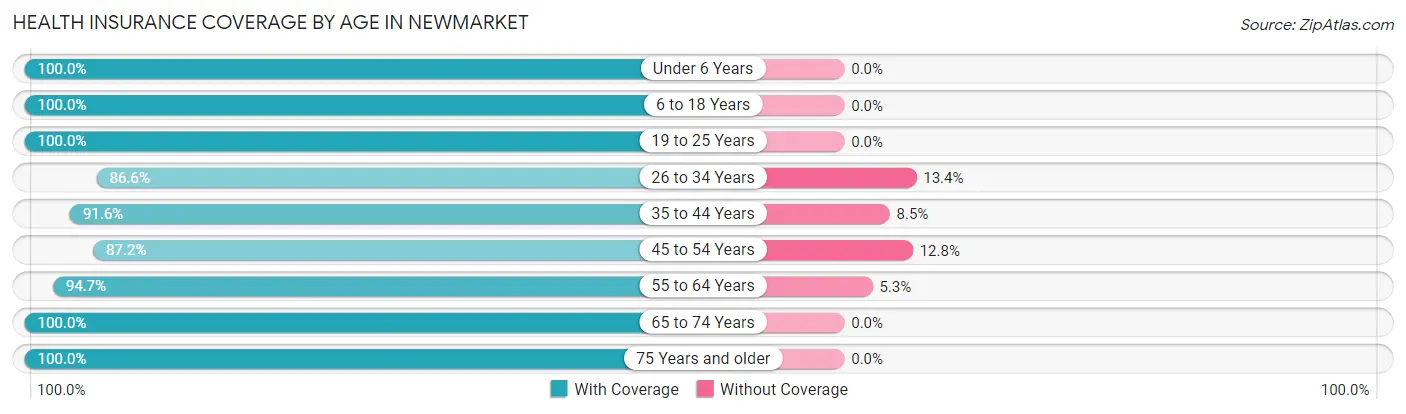
| Age Bracket | With Coverage | Without Coverage |
| Under 6 Years | 376 (100.0%) | 0 (0.0%) |
| 6 to 18 Years | 549 (100.0%) | 0 (0.0%) |
| 19 to 25 Years | 772 (100.0%) | 0 (0.0%) |
| 26 to 34 Years | 1,052 (86.6%) | 163 (13.4%) |
| 35 to 44 Years | 780 (91.5%) | 72 (8.5%) |
| 45 to 54 Years | 670 (87.2%) | 98 (12.8%) |
| 55 to 64 Years | 467 (94.7%) | 26 (5.3%) |
| 65 to 74 Years | 573 (100.0%) | 0 (0.0%) |
| 75 Years and older | 164 (100.0%) | 0 (0.0%) |
| Total | 5,403 (93.8%) | 359 (6.2%) |
Health Insurance Coverage by Citizenship Status in Newmarket
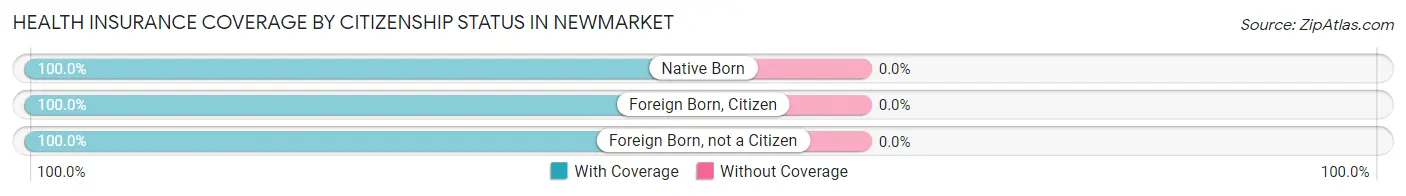
| Citizenship Status | With Coverage | Without Coverage |
| Native Born | 376 (100.0%) | 0 (0.0%) |
| Foreign Born, Citizen | 549 (100.0%) | 0 (0.0%) |
| Foreign Born, not a Citizen | 772 (100.0%) | 0 (0.0%) |
Health Insurance Coverage by Household Income in Newmarket
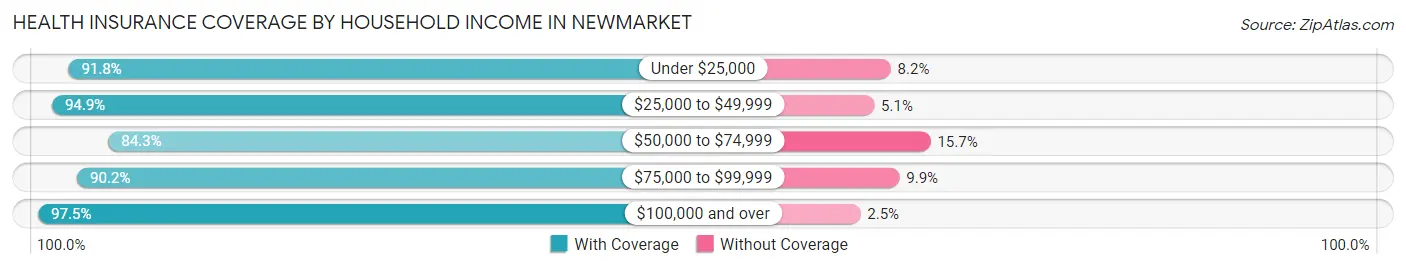
| Household Income | With Coverage | Without Coverage |
| Under $25,000 | 335 (91.8%) | 30 (8.2%) |
| $25,000 to $49,999 | 536 (94.9%) | 29 (5.1%) |
| $50,000 to $74,999 | 710 (84.3%) | 132 (15.7%) |
| $75,000 to $99,999 | 824 (90.1%) | 90 (9.9%) |
| $100,000 and over | 2,998 (97.5%) | 78 (2.5%) |
Public vs Private Health Insurance Coverage by Age in Newmarket
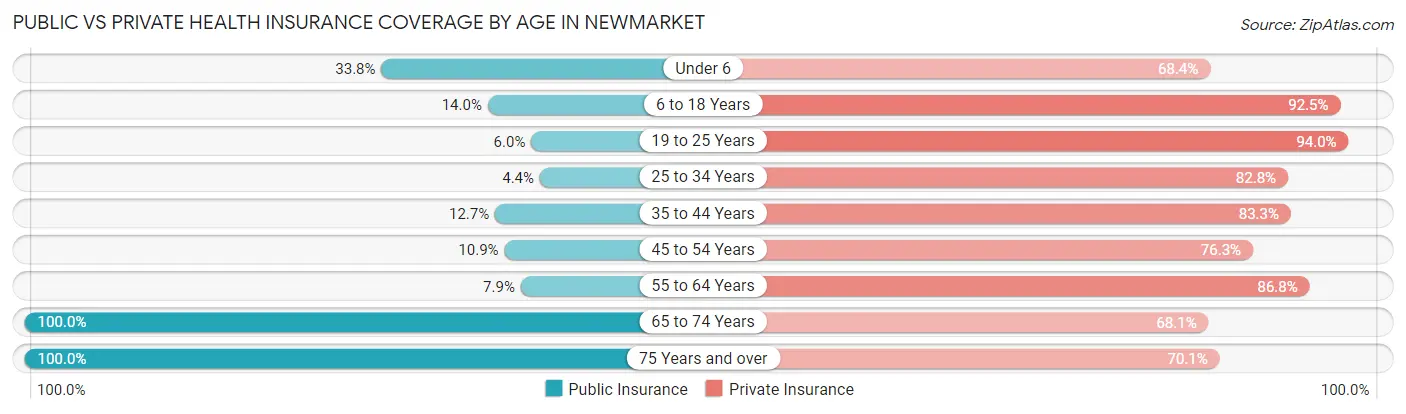
| Age Bracket | Public Insurance | Private Insurance |
| Under 6 | 127 (33.8%) | 257 (68.3%) |
| 6 to 18 Years | 77 (14.0%) | 508 (92.5%) |
| 19 to 25 Years | 46 (6.0%) | 726 (94.0%) |
| 25 to 34 Years | 53 (4.4%) | 1,006 (82.8%) |
| 35 to 44 Years | 108 (12.7%) | 710 (83.3%) |
| 45 to 54 Years | 84 (10.9%) | 586 (76.3%) |
| 55 to 64 Years | 39 (7.9%) | 428 (86.8%) |
| 65 to 74 Years | 573 (100.0%) | 390 (68.1%) |
| 75 Years and over | 164 (100.0%) | 115 (70.1%) |
| Total | 1,271 (22.1%) | 4,726 (82.0%) |
Disability Status by Sex by Age in Newmarket
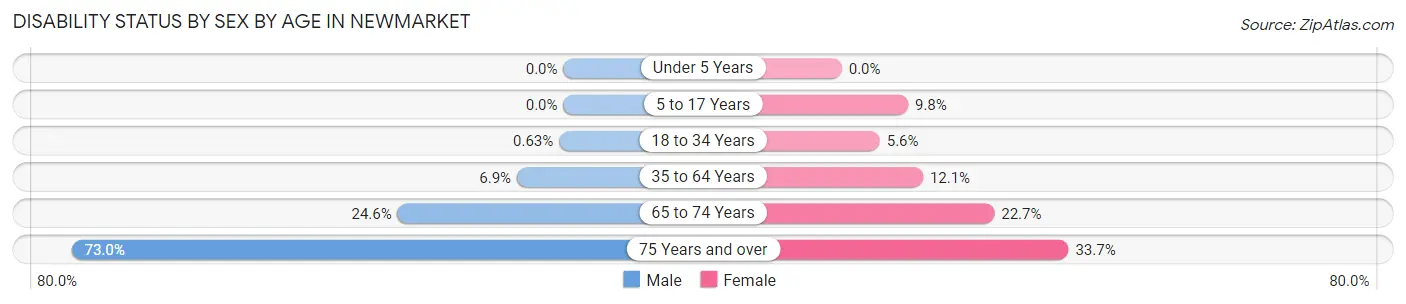
| Age Bracket | Male | Female |
| Under 5 Years | 0 (0.0%) | 0 (0.0%) |
| 5 to 17 Years | 0 (0.0%) | 18 (9.8%) |
| 18 to 34 Years | 7 (0.6%) | 51 (5.6%) |
| 35 to 64 Years | 65 (6.9%) | 141 (12.0%) |
| 65 to 74 Years | 65 (24.6%) | 70 (22.7%) |
| 75 Years and over | 46 (73.0%) | 34 (33.7%) |
Disability Class by Sex by Age in Newmarket
Disability Class: Hearing Difficulty
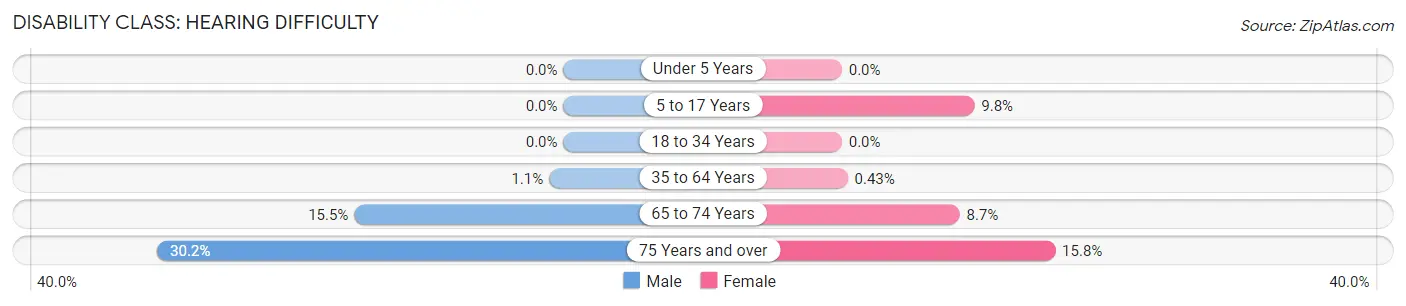
| Age Bracket | Male | Female |
| Under 5 Years | 0 (0.0%) | 0 (0.0%) |
| 5 to 17 Years | 0 (0.0%) | 18 (9.8%) |
| 18 to 34 Years | 0 (0.0%) | 0 (0.0%) |
| 35 to 64 Years | 10 (1.1%) | 5 (0.4%) |
| 65 to 74 Years | 41 (15.5%) | 27 (8.7%) |
| 75 Years and over | 19 (30.2%) | 16 (15.8%) |
Disability Class: Vision Difficulty
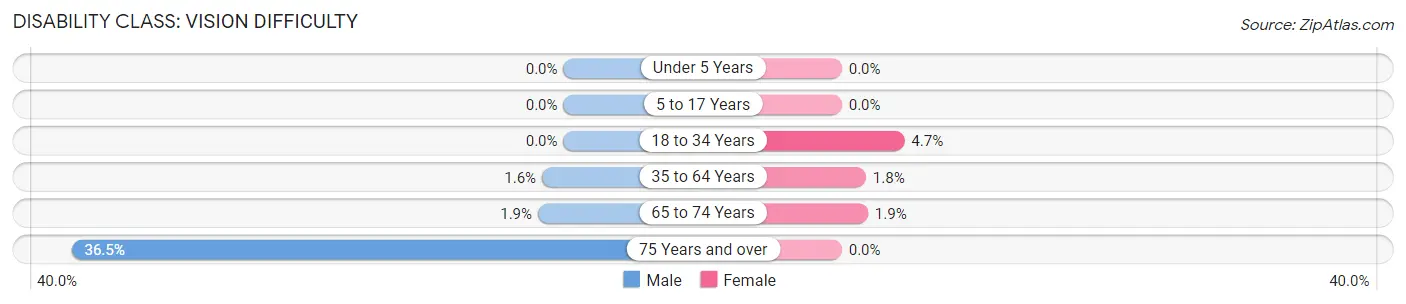
| Age Bracket | Male | Female |
| Under 5 Years | 0 (0.0%) | 0 (0.0%) |
| 5 to 17 Years | 0 (0.0%) | 0 (0.0%) |
| 18 to 34 Years | 0 (0.0%) | 42 (4.6%) |
| 35 to 64 Years | 15 (1.6%) | 21 (1.8%) |
| 65 to 74 Years | 5 (1.9%) | 6 (1.9%) |
| 75 Years and over | 23 (36.5%) | 0 (0.0%) |
Disability Class: Cognitive Difficulty
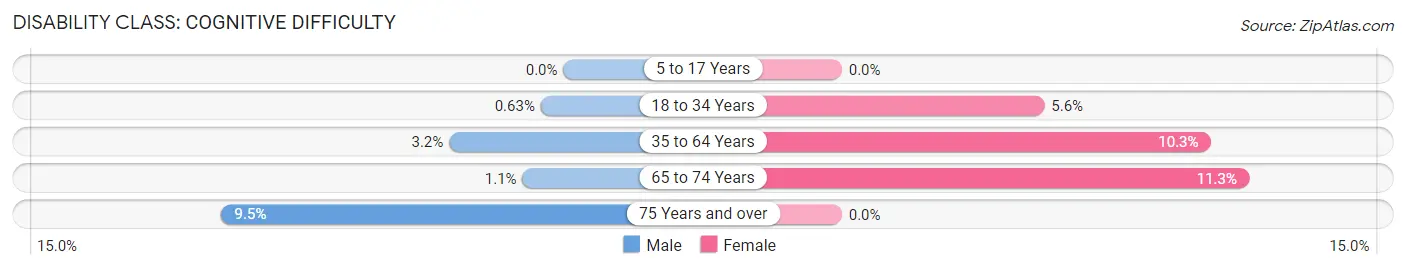
| Age Bracket | Male | Female |
| 5 to 17 Years | 0 (0.0%) | 0 (0.0%) |
| 18 to 34 Years | 7 (0.6%) | 51 (5.6%) |
| 35 to 64 Years | 30 (3.2%) | 120 (10.3%) |
| 65 to 74 Years | 3 (1.1%) | 35 (11.3%) |
| 75 Years and over | 6 (9.5%) | 0 (0.0%) |
Disability Class: Ambulatory Difficulty
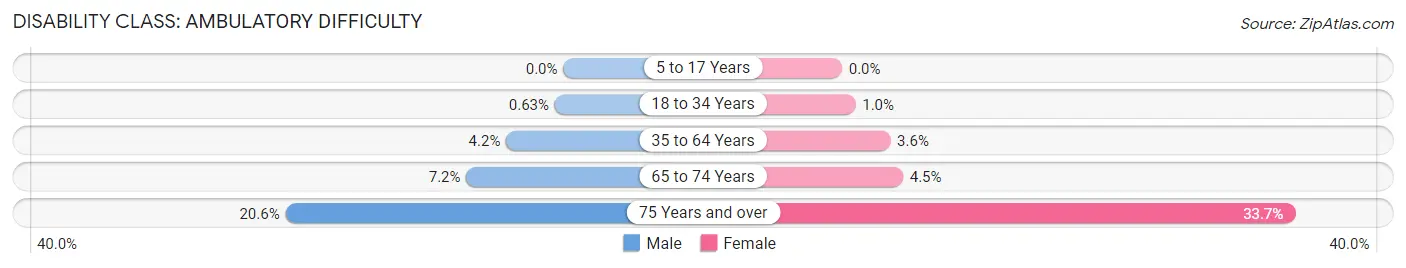
| Age Bracket | Male | Female |
| 5 to 17 Years | 0 (0.0%) | 0 (0.0%) |
| 18 to 34 Years | 7 (0.6%) | 9 (1.0%) |
| 35 to 64 Years | 40 (4.2%) | 42 (3.6%) |
| 65 to 74 Years | 19 (7.2%) | 14 (4.5%) |
| 75 Years and over | 13 (20.6%) | 34 (33.7%) |
Disability Class: Self-Care Difficulty
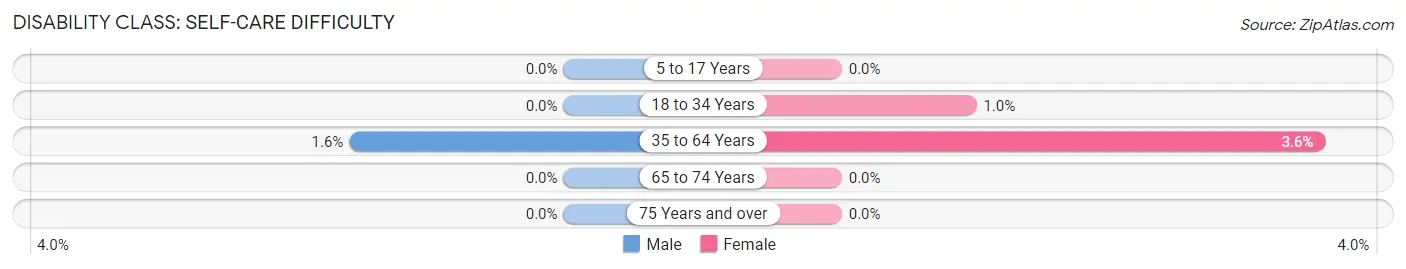
| Age Bracket | Male | Female |
| 5 to 17 Years | 0 (0.0%) | 0 (0.0%) |
| 18 to 34 Years | 0 (0.0%) | 9 (1.0%) |
| 35 to 64 Years | 15 (1.6%) | 42 (3.6%) |
| 65 to 74 Years | 0 (0.0%) | 0 (0.0%) |
| 75 Years and over | 0 (0.0%) | 0 (0.0%) |
Technology Access in Newmarket
Computing Device Access in Newmarket
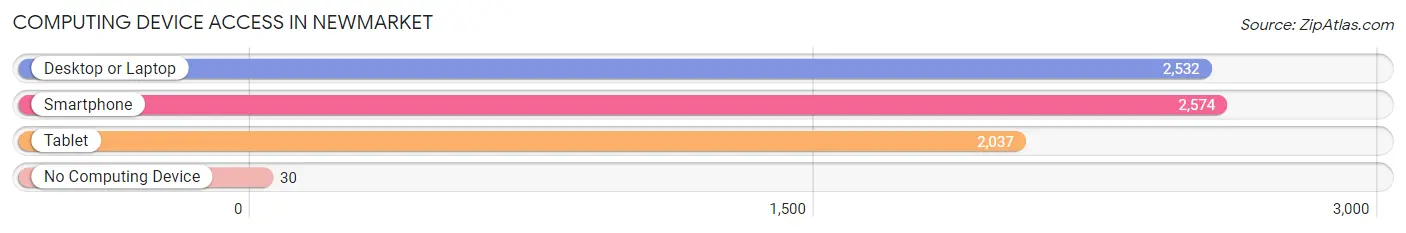
| Device Type | # Households | % Households |
| Desktop or Laptop | 2,532 | 92.6% |
| Smartphone | 2,574 | 94.2% |
| Tablet | 2,037 | 74.5% |
| No Computing Device | 30 | 1.1% |
| Total | 2,734 | 100.0% |
Internet Access in Newmarket
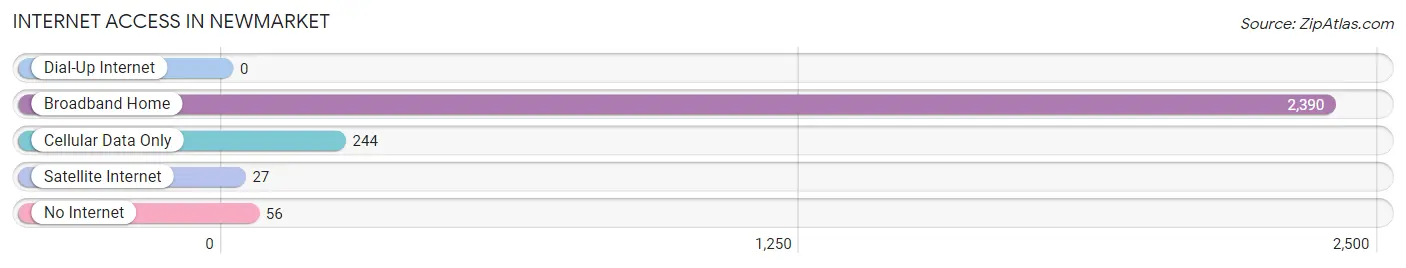
| Internet Type | # Households | % Households |
| Dial-Up Internet | 0 | 0.0% |
| Broadband Home | 2,390 | 87.4% |
| Cellular Data Only | 244 | 8.9% |
| Satellite Internet | 27 | 1.0% |
| No Internet | 56 | 2.1% |
| Total | 2,734 | 100.0% |
Newmarket Summary
Newmarket is a small town located in the southeastern corner of New Hampshire, in the United States. It is situated on the Lamprey River, and is part of the Seacoast Region of the state. The town has a population of 8,985 as of the 2010 census, and is part of the larger Portsmouth metropolitan area.
History
Newmarket was first settled in 1638 by a group of English colonists led by Reverend John Wheelwright. The town was originally known as "New Meadows", and was part of the Massachusetts Bay Colony. In 1641, the town was granted a charter by the Massachusetts General Court, and was renamed "Newmarket". The town was incorporated in 1727, and was one of the first towns in the state to be granted a charter.
In the late 18th century, Newmarket was a major shipbuilding center, and was home to several shipyards. The town was also a major center for the production of textiles, and was home to several mills. The town was also home to a number of other industries, including a tannery, a gristmill, and a sawmill.
Geography
Newmarket is located in southeastern New Hampshire, in the Seacoast Region of the state. The town is situated on the Lamprey River, and is bordered by the towns of Durham to the north, Lee to the east, and Epping to the south. The town is located approximately 25 miles from the state capital of Concord, and is part of the larger Portsmouth metropolitan area.
The town has a total area of 16.2 square miles, of which 15.9 square miles is land and 0.3 square miles is water. The town is mostly flat, with some rolling hills in the northern part of town. The highest point in town is located at the intersection of Main Street and High Street, and is approximately 200 feet above sea level.
Economy
Newmarket has a diverse economy, with a number of different industries represented in the town. The largest employers in the town are the Portsmouth Regional Hospital, the University of New Hampshire, and the Newmarket School District. Other major employers in the town include the Newmarket Mills, the Newmarket Shopping Center, and the Newmarket Industrial Park.
The town is also home to a number of small businesses, including restaurants, retail stores, and professional services. The town is also home to a number of tourist attractions, including the Newmarket Historical Society, the Newmarket Opera House, and the Newmarket Farmers Market.
Demographics
As of the 2010 census, there were 8,985 people, 3,717 households, and 2,521 families residing in the town. The population density was 562.3 people per square mile. The racial makeup of the town was 94.2% White, 1.3% African American, 0.4% Native American, 1.2% Asian, 0.1% Pacific Islander, 1.2% from other races, and 1.6% from two or more races. Hispanic or Latino of any race were 3.2% of the population.
The median income for a household in the town was $60,945, and the median income for a family was $71,917. The per capita income for the town was $27,945. About 4.2% of families and 6.2% of the population were below the poverty line, including 8.2% of those under age 18 and 4.2% of those age 65 or over.
Common Questions
What is Per Capita Income in Newmarket?
Per Capita income in Newmarket is $49,100.
What is the Median Family Income in Newmarket?
Median Family Income in Newmarket is $106,106.
What is the Median Household income in Newmarket?
Median Household Income in Newmarket is $88,295.
What is Income or Wage Gap in Newmarket?
Income or Wage Gap in Newmarket is 33.0%.
Women in Newmarket earn 67.0 cents for every dollar earned by a man.
What is Inequality or Gini Index in Newmarket?
Inequality or Gini Index in Newmarket is 0.36.
What is the Total Population of Newmarket?
Total Population of Newmarket is 5,829.
What is the Total Male Population of Newmarket?
Total Male Population of Newmarket is 2,976.
What is the Total Female Population of Newmarket?
Total Female Population of Newmarket is 2,853.
What is the Ratio of Males per 100 Females in Newmarket?
There are 104.31 Males per 100 Females in Newmarket.
What is the Ratio of Females per 100 Males in Newmarket?
There are 95.87 Females per 100 Males in Newmarket.
What is the Median Population Age in Newmarket?
Median Population Age in Newmarket is 34.6 Years.
What is the Average Family Size in Newmarket
Average Family Size in Newmarket is 2.6 People.
What is the Average Household Size in Newmarket
Average Household Size in Newmarket is 2.1 People.
How Large is the Labor Force in Newmarket?
There are 3,974 People in the Labor Forcein in Newmarket.
What is the Percentage of People in the Labor Force in Newmarket?
79.1% of People are in the Labor Force in Newmarket.
What is the Unemployment Rate in Newmarket?
Unemployment Rate in Newmarket is 1.0%.