Merrimack County, NH Map & Demographics
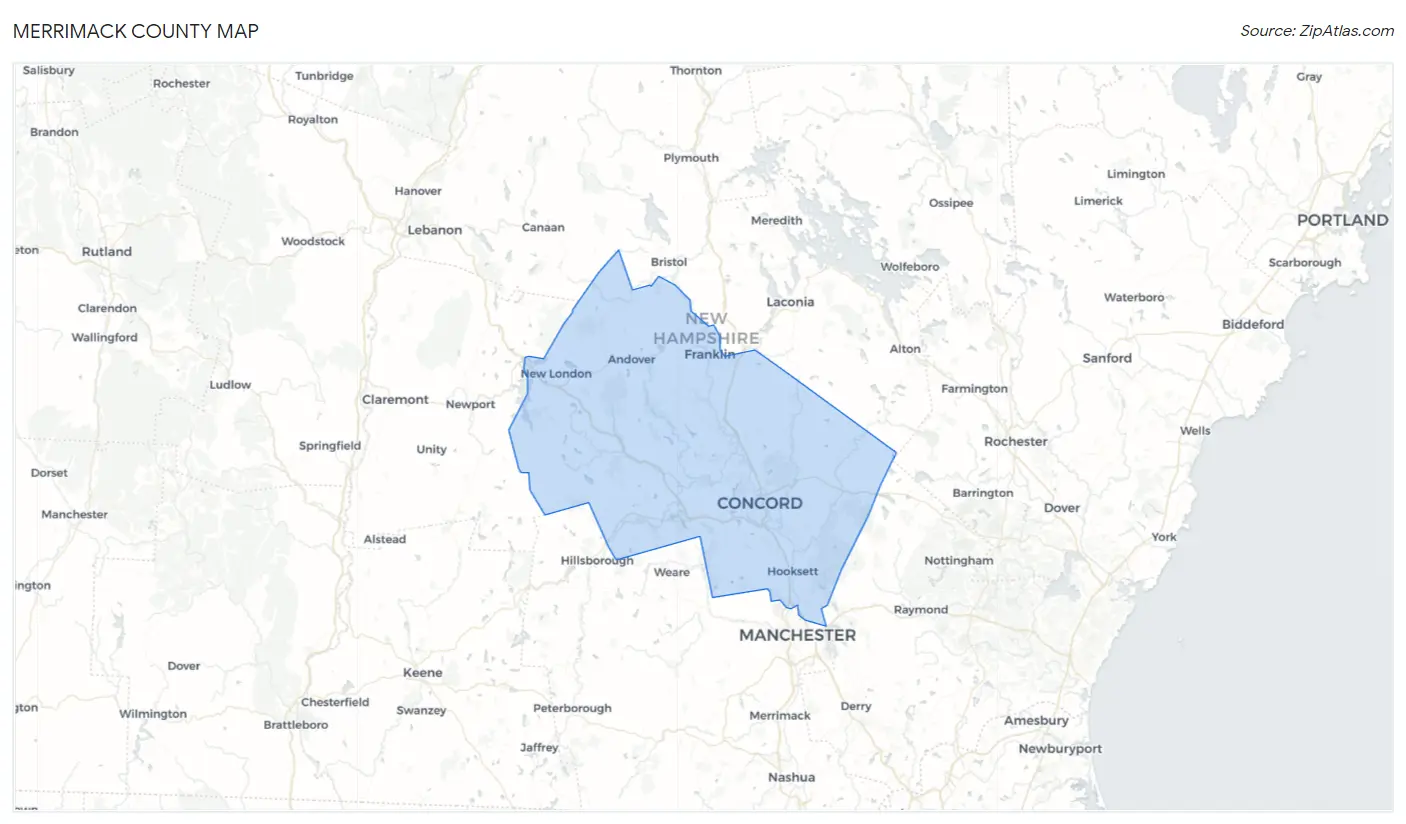
Merrimack County Map
Merrimack County Overview
$44,391
PER CAPITA INCOME
$110,587
AVG FAMILY INCOME
$88,806
AVG HOUSEHOLD INCOME
26.2%
WAGE / INCOME GAP [ % ]
73.8¢/ $1
WAGE / INCOME GAP [ $ ]
$11,049
FAMILY INCOME DEFICIT
0.44
INEQUALITY / GINI INDEX
153,918
TOTAL POPULATION
76,723
MALE POPULATION
77,195
FEMALE POPULATION
99.39
MALES / 100 FEMALES
100.62
FEMALES / 100 MALES
42.8
MEDIAN AGE
2.9
AVG FAMILY SIZE
2.5
AVG HOUSEHOLD SIZE
83,735
LABOR FORCE [ PEOPLE ]
64.9%
PERCENT IN LABOR FORCE
3.6%
UNEMPLOYMENT RATE
Merrimack County Area Codes
Income in Merrimack County
Income Overview in Merrimack County
Per Capita Income in Merrimack County is $44,391, while median incomes of families and households are $110,587 and $88,806 respectively.
| Characteristic | Number | Measure |
| Per Capita Income | 153,918 | $44,391 |
| Median Family Income | 40,116 | $110,587 |
| Mean Family Income | 40,116 | $134,675 |
| Median Household Income | 59,851 | $88,806 |
| Mean Household Income | 59,851 | $112,435 |
| Income Deficit | 40,116 | $11,049 |
| Wage / Income Gap (%) | 153,918 | 26.19% |
| Wage / Income Gap ($) | 153,918 | 73.81¢ per $1 |
| Gini / Inequality Index | 153,918 | 0.44 |
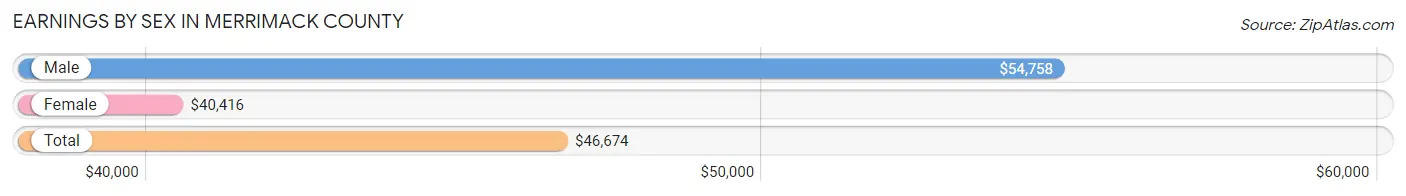
Earnings by Sex in Merrimack County
Average Earnings in Merrimack County are $46,674, $54,758 for men and $40,416 for women, a difference of 26.2%.
| Sex | Number | Average Earnings |
| Male | 46,960 (53.0%) | $54,758 |
| Female | 41,693 (47.0%) | $40,416 |
| Total | 88,653 (100.0%) | $46,674 |
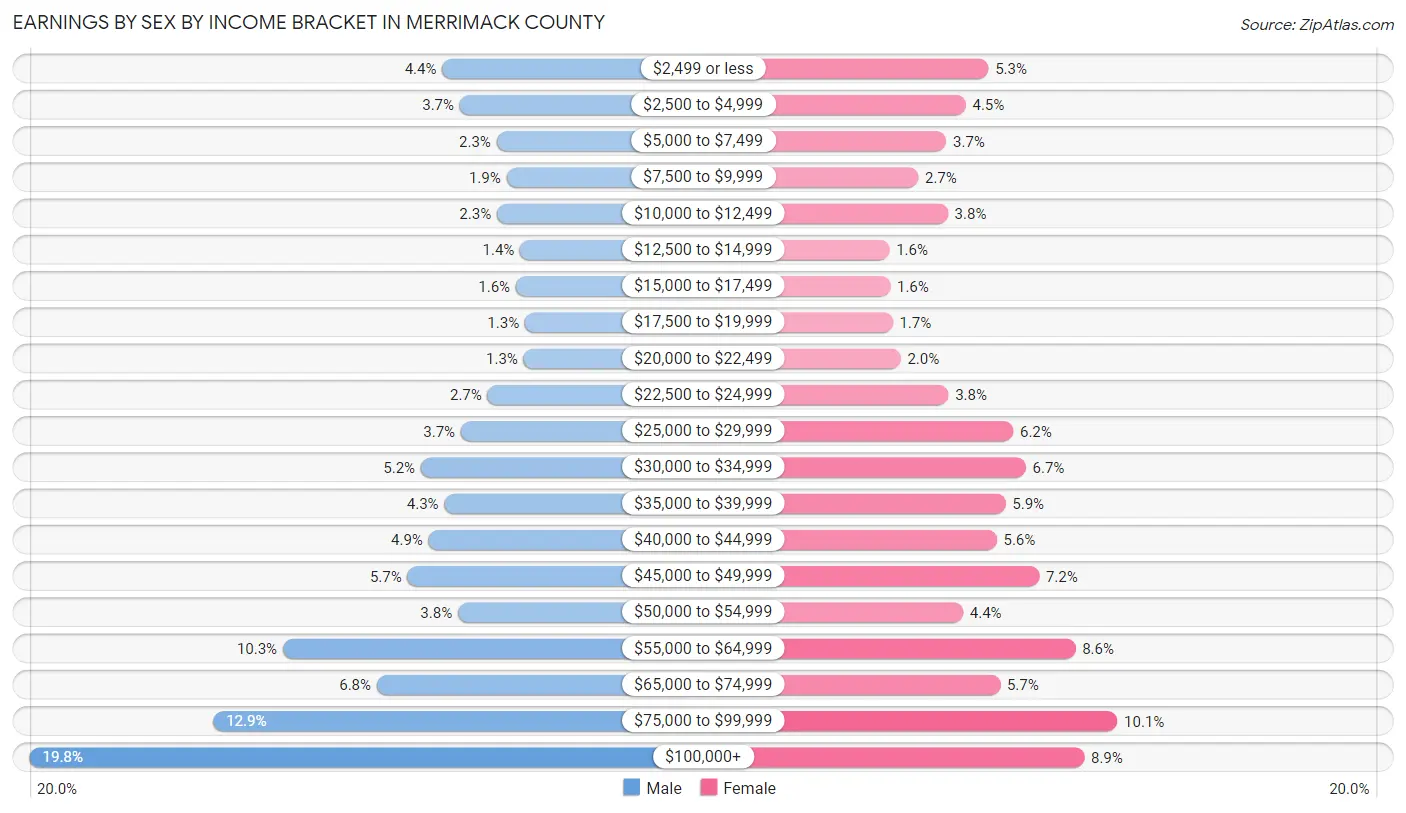
Earnings by Sex by Income Bracket in Merrimack County
The most common earnings brackets in Merrimack County are $100,000+ for men (9,302 | 19.8%) and $75,000 to $99,999 for women (4,223 | 10.1%).
| Income | Male | Female |
| $2,499 or less | 2,042 (4.3%) | 2,211 (5.3%) |
| $2,500 to $4,999 | 1,732 (3.7%) | 1,856 (4.4%) |
| $5,000 to $7,499 | 1,086 (2.3%) | 1,552 (3.7%) |
| $7,500 to $9,999 | 910 (1.9%) | 1,112 (2.7%) |
| $10,000 to $12,499 | 1,078 (2.3%) | 1,576 (3.8%) |
| $12,500 to $14,999 | 671 (1.4%) | 662 (1.6%) |
| $15,000 to $17,499 | 748 (1.6%) | 677 (1.6%) |
| $17,500 to $19,999 | 587 (1.3%) | 711 (1.7%) |
| $20,000 to $22,499 | 609 (1.3%) | 836 (2.0%) |
| $22,500 to $24,999 | 1,243 (2.6%) | 1,585 (3.8%) |
| $25,000 to $29,999 | 1,716 (3.6%) | 2,598 (6.2%) |
| $30,000 to $34,999 | 2,419 (5.1%) | 2,795 (6.7%) |
| $35,000 to $39,999 | 2,007 (4.3%) | 2,476 (5.9%) |
| $40,000 to $44,999 | 2,280 (4.9%) | 2,340 (5.6%) |
| $45,000 to $49,999 | 2,651 (5.7%) | 3,001 (7.2%) |
| $50,000 to $54,999 | 1,767 (3.8%) | 1,813 (4.3%) |
| $55,000 to $64,999 | 4,845 (10.3%) | 3,569 (8.6%) |
| $65,000 to $74,999 | 3,195 (6.8%) | 2,392 (5.7%) |
| $75,000 to $99,999 | 6,072 (12.9%) | 4,223 (10.1%) |
| $100,000+ | 9,302 (19.8%) | 3,708 (8.9%) |
| Total | 46,960 (100.0%) | 41,693 (100.0%) |
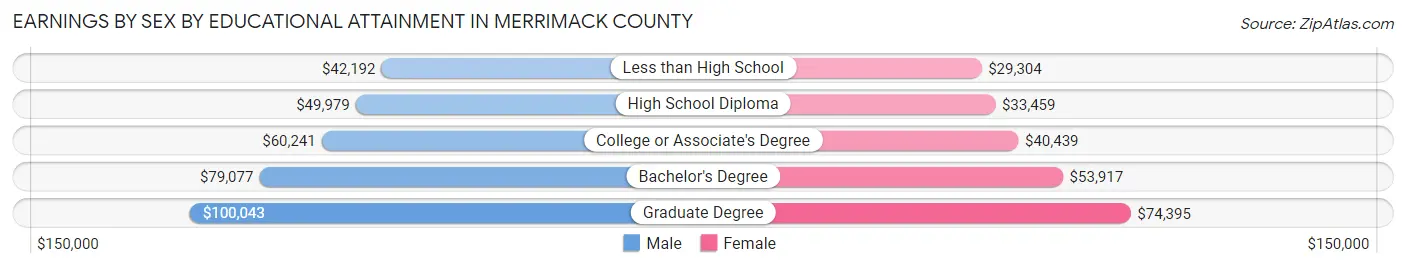
Earnings by Sex by Educational Attainment in Merrimack County
Average earnings in Merrimack County are $61,753 for men and $45,737 for women, a difference of 25.9%. Men with an educational attainment of graduate degree enjoy the highest average annual earnings of $100,043, while those with less than high school education earn the least with $42,192. Women with an educational attainment of graduate degree earn the most with the average annual earnings of $74,395, while those with less than high school education have the smallest earnings of $29,304.
| Educational Attainment | Male Income | Female Income |
| Less than High School | $42,192 | $29,304 |
| High School Diploma | $49,979 | $33,459 |
| College or Associate's Degree | $60,241 | $40,439 |
| Bachelor's Degree | $79,077 | $53,917 |
| Graduate Degree | $100,043 | $74,395 |
| Total | $61,753 | $45,737 |
Family Income in Merrimack County
Family Income Brackets in Merrimack County
According to the Merrimack County family income data, there are 9,828 families falling into the $100,000 to $149,999 income range, which is the most common income bracket and makes up 24.5% of all families. Conversely, the $10,000 to $14,999 income bracket is the least frequent group with only 481 families (1.2%) belonging to this category.
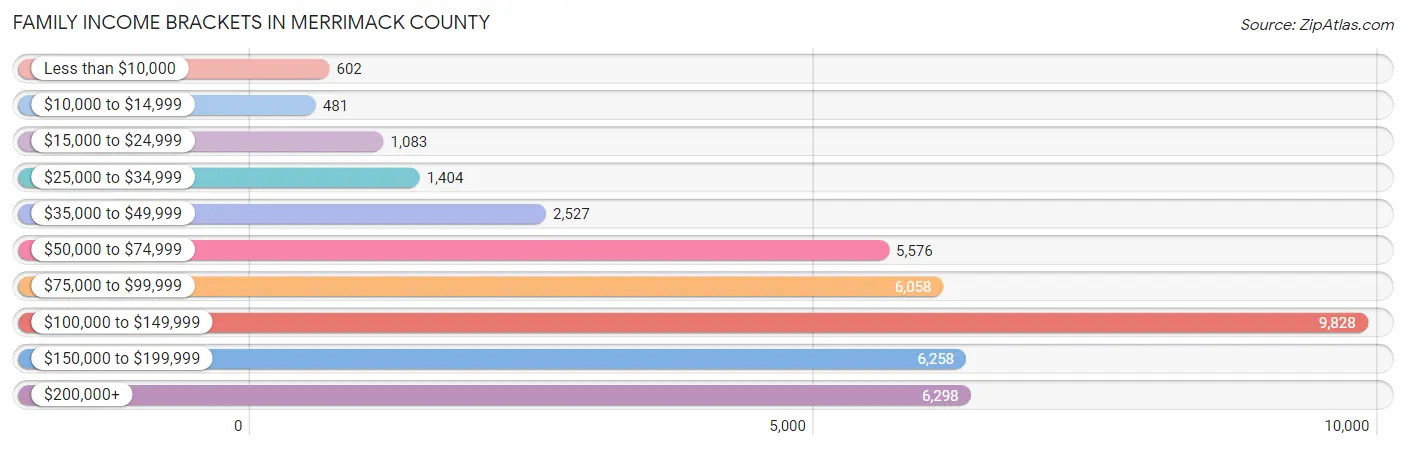
| Income Bracket | # Families | % Families |
| Less than $10,000 | 602 | 1.5% |
| $10,000 to $14,999 | 481 | 1.2% |
| $15,000 to $24,999 | 1,083 | 2.7% |
| $25,000 to $34,999 | 1,404 | 3.5% |
| $35,000 to $49,999 | 2,527 | 6.3% |
| $50,000 to $74,999 | 5,576 | 13.9% |
| $75,000 to $99,999 | 6,058 | 15.1% |
| $100,000 to $149,999 | 9,828 | 24.5% |
| $150,000 to $199,999 | 6,258 | 15.6% |
| $200,000+ | 6,298 | 15.7% |
Family Income by Famaliy Size in Merrimack County
6-person families (674 | 1.7%) account for the highest median family income in Merrimack County with $162,200 per family, while 2-person families (21,330 | 53.2%) have the highest median income of $46,290 per family member.
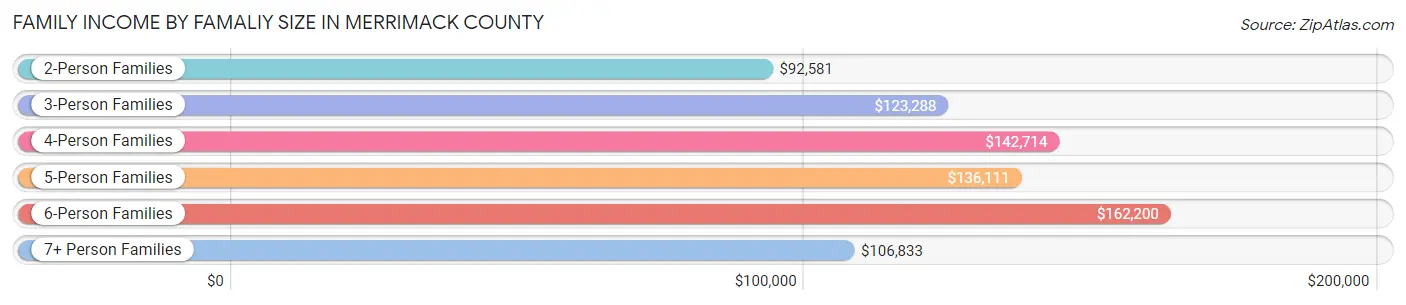
| Income Bracket | # Families | Median Income |
| 2-Person Families | 21,330 (53.2%) | $92,581 |
| 3-Person Families | 7,922 (19.8%) | $123,288 |
| 4-Person Families | 7,584 (18.9%) | $142,714 |
| 5-Person Families | 2,170 (5.4%) | $136,111 |
| 6-Person Families | 674 (1.7%) | $162,200 |
| 7+ Person Families | 436 (1.1%) | $106,833 |
| Total | 40,116 (100.0%) | $110,587 |
Family Income by Number of Earners in Merrimack County
The median family income in Merrimack County is $110,587, with families comprising 3+ earners (5,653) having the highest median family income of $164,472, while families with no earners (5,341) have the lowest median family income of $57,650, accounting for 14.1% and 13.3% of families, respectively.
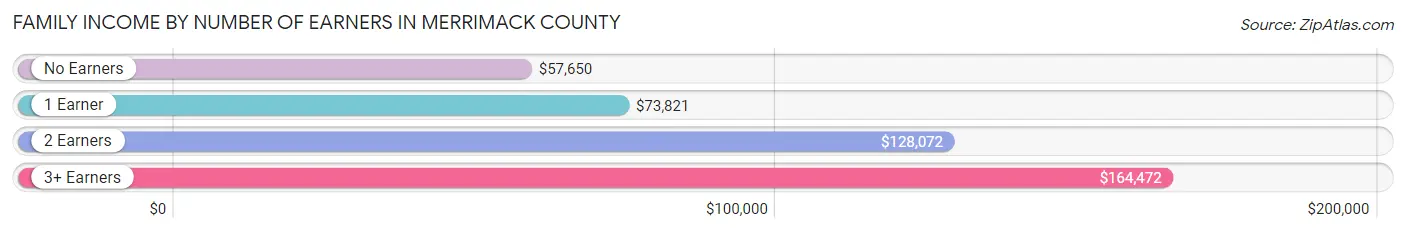
| Number of Earners | # Families | Median Income |
| No Earners | 5,341 (13.3%) | $57,650 |
| 1 Earner | 11,178 (27.9%) | $73,821 |
| 2 Earners | 17,944 (44.7%) | $128,072 |
| 3+ Earners | 5,653 (14.1%) | $164,472 |
| Total | 40,116 (100.0%) | $110,587 |
Household Income in Merrimack County
Household Income Brackets in Merrimack County
With 12,210 households falling in the category, the $100,000 to $149,999 income range is the most frequent in Merrimack County, accounting for 20.4% of all households. In contrast, only 1,676 households (2.8%) fall into the less than $10,000 income bracket, making it the least populous group.
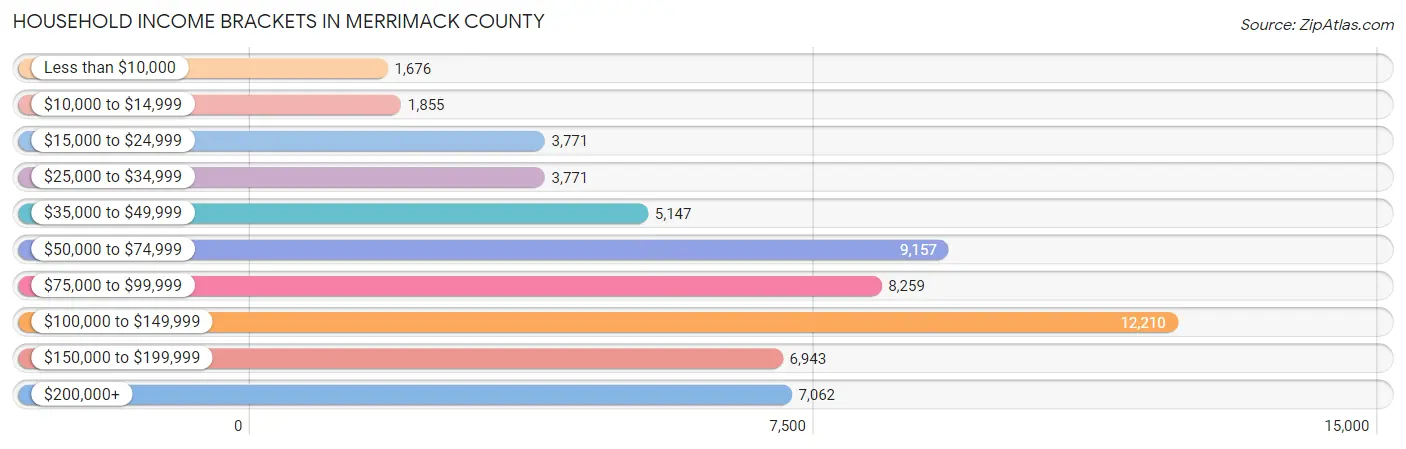
| Income Bracket | # Households | % Households |
| Less than $10,000 | 1,676 | 2.8% |
| $10,000 to $14,999 | 1,855 | 3.1% |
| $15,000 to $24,999 | 3,771 | 6.3% |
| $25,000 to $34,999 | 3,771 | 6.3% |
| $35,000 to $49,999 | 5,147 | 8.6% |
| $50,000 to $74,999 | 9,157 | 15.3% |
| $75,000 to $99,999 | 8,259 | 13.8% |
| $100,000 to $149,999 | 12,210 | 20.4% |
| $150,000 to $199,999 | 6,943 | 11.6% |
| $200,000+ | 7,062 | 11.8% |
Household Income by Householder Age in Merrimack County
The median household income in Merrimack County is $88,806, with the highest median household income of $110,116 found in the 45 to 64 years age bracket for the primary householder. A total of 23,729 households (39.7%) fall into this category. Meanwhile, the 15 to 24 years age bracket for the primary householder has the lowest median household income of $56,075, with 1,953 households (3.3%) in this group.
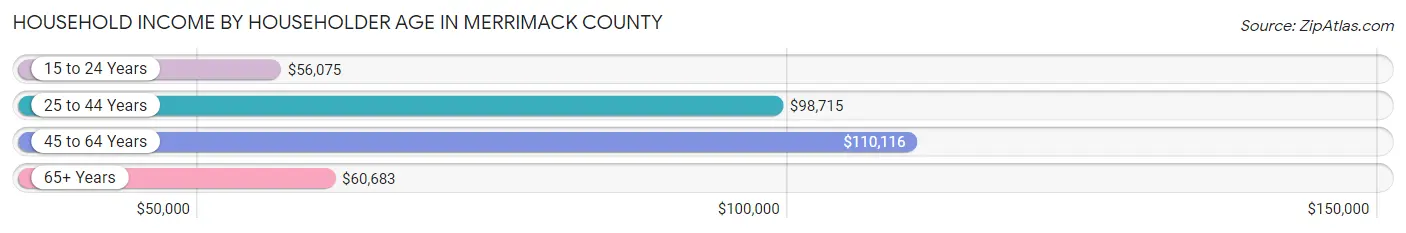
| Income Bracket | # Households | Median Income |
| 15 to 24 Years | 1,953 (3.3%) | $56,075 |
| 25 to 44 Years | 16,742 (28.0%) | $98,715 |
| 45 to 64 Years | 23,729 (39.7%) | $110,116 |
| 65+ Years | 17,427 (29.1%) | $60,683 |
| Total | 59,851 (100.0%) | $88,806 |
Poverty in Merrimack County
Income Below Poverty by Sex and Age in Merrimack County
With 6.4% poverty level for males and 8.1% for females among the residents of Merrimack County, 5 year old males and 18 to 24 year old females are the most vulnerable to poverty, with 118 males (17.1%) and 864 females (15.0%) in their respective age groups living below the poverty level.
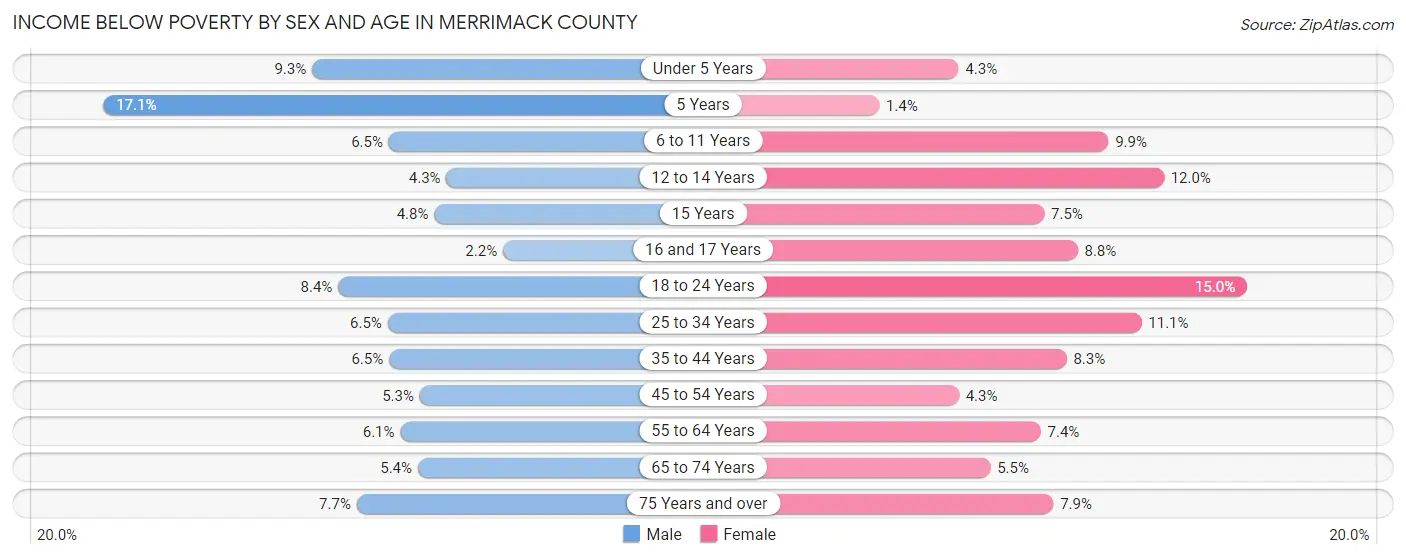
| Age Bracket | Male | Female |
| Under 5 Years | 324 (9.3%) | 145 (4.3%) |
| 5 Years | 118 (17.1%) | 11 (1.4%) |
| 6 to 11 Years | 299 (6.5%) | 448 (9.9%) |
| 12 to 14 Years | 121 (4.3%) | 303 (11.9%) |
| 15 Years | 43 (4.8%) | 64 (7.5%) |
| 16 and 17 Years | 42 (2.2%) | 163 (8.7%) |
| 18 to 24 Years | 517 (8.4%) | 864 (15.0%) |
| 25 to 34 Years | 639 (6.5%) | 1,001 (11.1%) |
| 35 to 44 Years | 590 (6.5%) | 755 (8.3%) |
| 45 to 54 Years | 523 (5.3%) | 430 (4.3%) |
| 55 to 64 Years | 689 (6.0%) | 871 (7.4%) |
| 65 to 74 Years | 446 (5.4%) | 508 (5.5%) |
| 75 Years and over | 343 (7.7%) | 465 (7.9%) |
| Total | 4,694 (6.4%) | 6,028 (8.1%) |
Income Above Poverty by Sex and Age in Merrimack County
According to the poverty statistics in Merrimack County, males aged 16 and 17 years and females aged 5 years are the age groups that are most secure financially, with 97.8% of males and 98.6% of females in these age groups living above the poverty line.
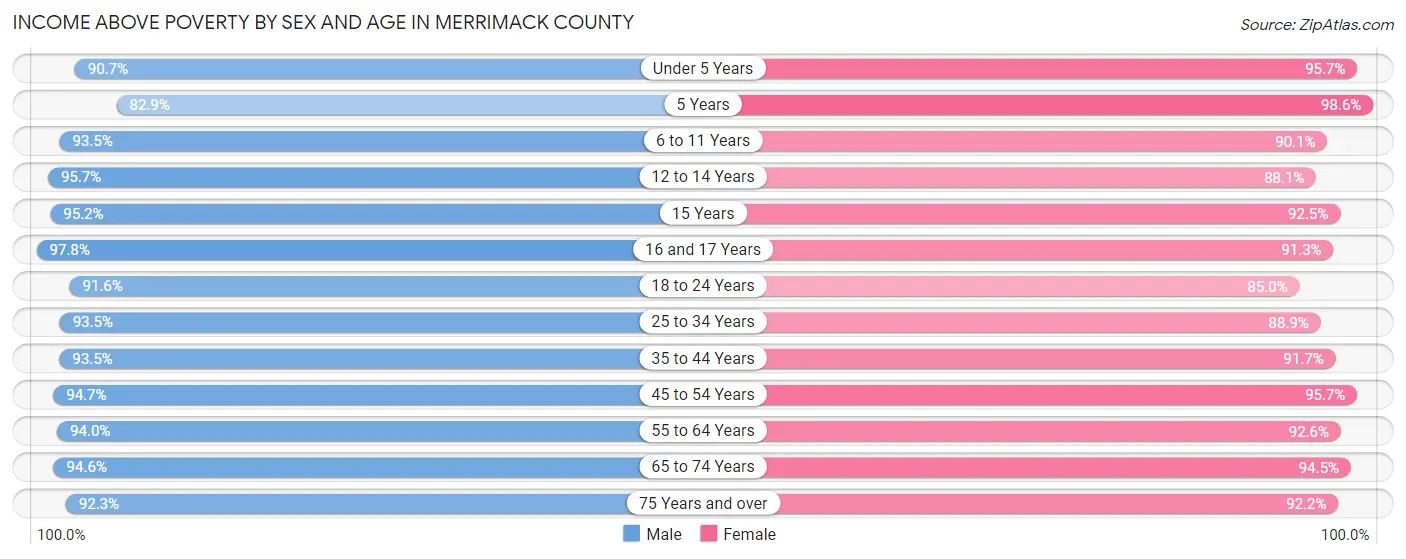
| Age Bracket | Male | Female |
| Under 5 Years | 3,148 (90.7%) | 3,205 (95.7%) |
| 5 Years | 573 (82.9%) | 788 (98.6%) |
| 6 to 11 Years | 4,314 (93.5%) | 4,084 (90.1%) |
| 12 to 14 Years | 2,665 (95.7%) | 2,232 (88.0%) |
| 15 Years | 854 (95.2%) | 788 (92.5%) |
| 16 and 17 Years | 1,831 (97.8%) | 1,699 (91.2%) |
| 18 to 24 Years | 5,664 (91.6%) | 4,880 (85.0%) |
| 25 to 34 Years | 9,167 (93.5%) | 8,002 (88.9%) |
| 35 to 44 Years | 8,523 (93.5%) | 8,293 (91.7%) |
| 45 to 54 Years | 9,287 (94.7%) | 9,481 (95.7%) |
| 55 to 64 Years | 10,697 (94.0%) | 10,939 (92.6%) |
| 65 to 74 Years | 7,808 (94.6%) | 8,712 (94.5%) |
| 75 Years and over | 4,127 (92.3%) | 5,458 (92.1%) |
| Total | 68,658 (93.6%) | 68,561 (91.9%) |
Income Below Poverty Among Married-Couple Families in Merrimack County
The poverty statistics for married-couple families in Merrimack County show that 1.5% or 497 of the total 32,405 families live below the poverty line. Families with 5 or more children have the highest poverty rate of 4.7%, comprising of 8 families. On the other hand, families with 1 or 2 children have the lowest poverty rate of 0.8%, which includes 76 families.
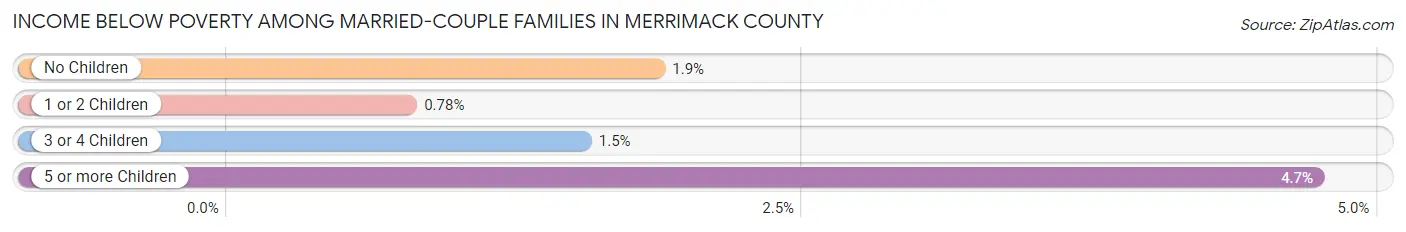
| Children | Above Poverty | Below Poverty |
| No Children | 20,429 (98.1%) | 388 (1.9%) |
| 1 or 2 Children | 9,724 (99.2%) | 76 (0.8%) |
| 3 or 4 Children | 1,594 (98.5%) | 25 (1.5%) |
| 5 or more Children | 161 (95.3%) | 8 (4.7%) |
| Total | 31,908 (98.5%) | 497 (1.5%) |
Income Below Poverty Among Single-Parent Households in Merrimack County
According to the poverty data in Merrimack County, 10.6% or 334 single-father households and 15.6% or 712 single-mother households are living below the poverty line. Among single-father households, those with 5 or more children have the highest poverty rate, with 11 households (100.0%) experiencing poverty. Likewise, among single-mother households, those with 3 or 4 children have the highest poverty rate, with 118 households (31.5%) falling below the poverty line.
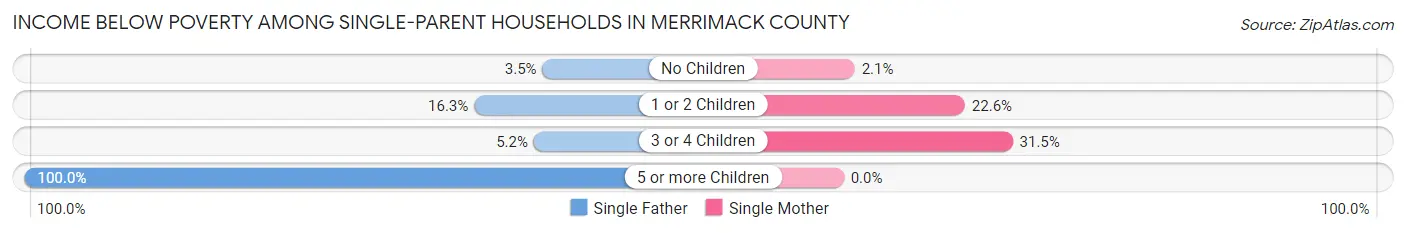
| Children | Single Father | Single Mother |
| No Children | 46 (3.5%) | 35 (2.1%) |
| 1 or 2 Children | 266 (16.3%) | 559 (22.6%) |
| 3 or 4 Children | 11 (5.2%) | 118 (31.5%) |
| 5 or more Children | 11 (100.0%) | 0 (0.0%) |
| Total | 334 (10.6%) | 712 (15.6%) |
Income Below Poverty Among Married-Couple vs Single-Parent Households in Merrimack County
The poverty data for Merrimack County shows that 497 of the married-couple family households (1.5%) and 1,046 of the single-parent households (13.6%) are living below the poverty level. Within the married-couple family households, those with 5 or more children have the highest poverty rate, with 8 households (4.7%) falling below the poverty line. Among the single-parent households, those with 5 or more children have the highest poverty rate, with 11 household (100.0%) living below poverty.
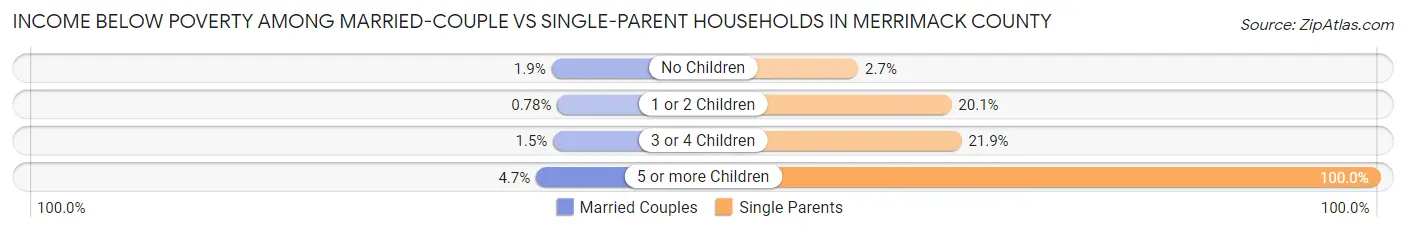
| Children | Married-Couple Families | Single-Parent Households |
| No Children | 388 (1.9%) | 81 (2.7%) |
| 1 or 2 Children | 76 (0.8%) | 825 (20.1%) |
| 3 or 4 Children | 25 (1.5%) | 129 (21.9%) |
| 5 or more Children | 8 (4.7%) | 11 (100.0%) |
| Total | 497 (1.5%) | 1,046 (13.6%) |
Race in Merrimack County
The most populous races in Merrimack County are White / Caucasian (141,787 | 92.1%), Two or more Races (5,457 | 3.5%), and Hispanic or Latino (3,802 | 2.5%).

| Race | # Population | % Population |
| Asian | 2,986 | 1.9% |
| Black / African American | 2,451 | 1.6% |
| Hawaiian / Pacific | 31 | 0.0% |
| Hispanic or Latino | 3,802 | 2.5% |
| Native / Alaskan | 407 | 0.3% |
| White / Caucasian | 141,787 | 92.1% |
| Two or more Races | 5,457 | 3.5% |
| Some other Race | 799 | 0.5% |
| Total | 153,918 | 100.0% |
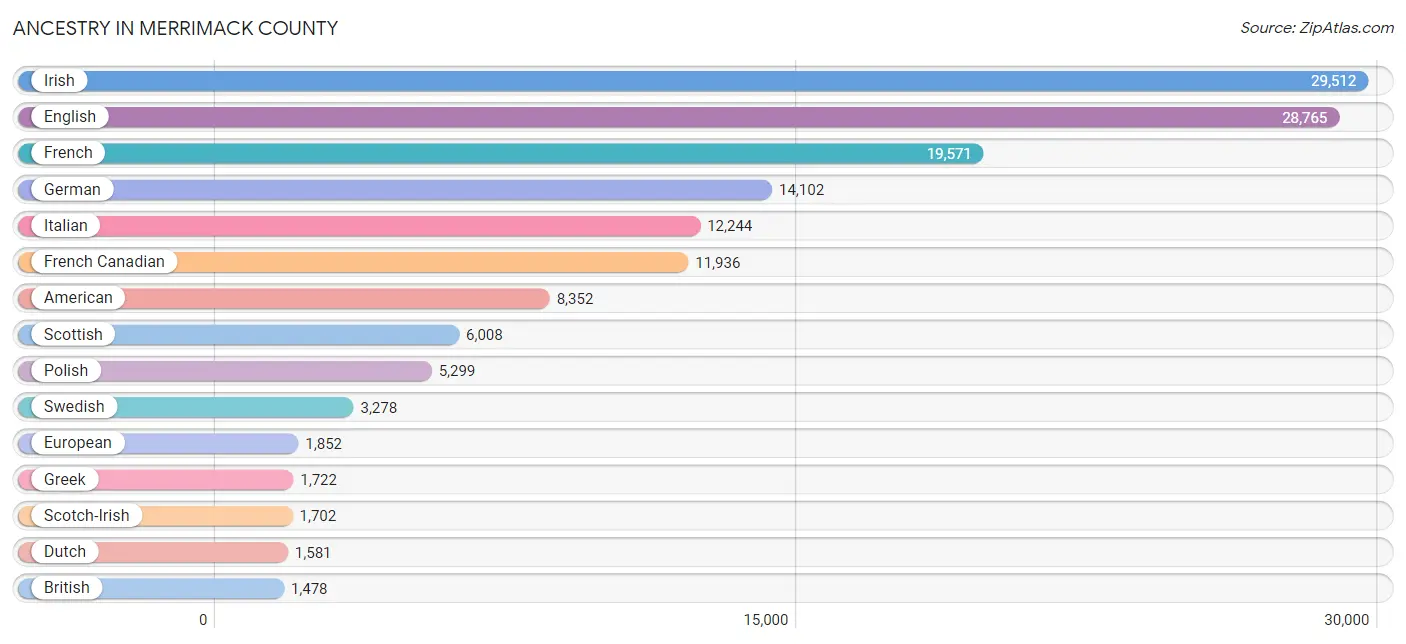
Ancestry in Merrimack County
The most populous ancestries reported in Merrimack County are Irish (29,512 | 19.2%), English (28,765 | 18.7%), French (19,571 | 12.7%), German (14,102 | 9.2%), and Italian (12,244 | 8.0%), together accounting for 67.7% of all Merrimack County residents.
| Ancestry | # Population | % Population |
| Afghan | 13 | 0.0% |
| African | 800 | 0.5% |
| Alaska Native | 1 | 0.0% |
| Albanian | 213 | 0.1% |
| Alsatian | 7 | 0.0% |
| American | 8,352 | 5.4% |
| Apache | 11 | 0.0% |
| Arab | 674 | 0.4% |
| Argentinean | 4 | 0.0% |
| Armenian | 165 | 0.1% |
| Assyrian / Chaldean / Syriac | 11 | 0.0% |
| Australian | 178 | 0.1% |
| Austrian | 267 | 0.2% |
| Barbadian | 30 | 0.0% |
| Basque | 15 | 0.0% |
| Belgian | 175 | 0.1% |
| Bermudan | 11 | 0.0% |
| Bhutanese | 298 | 0.2% |
| Blackfeet | 90 | 0.1% |
| Brazilian | 50 | 0.0% |
| British | 1,478 | 1.0% |
| Bulgarian | 67 | 0.0% |
| Burmese | 570 | 0.4% |
| Cajun | 12 | 0.0% |
| Canadian | 1,367 | 0.9% |
| Cape Verdean | 12 | 0.0% |
| Celtic | 20 | 0.0% |
| Central American | 525 | 0.3% |
| Central American Indian | 32 | 0.0% |
| Cherokee | 61 | 0.0% |
| Chippewa | 31 | 0.0% |
| Choctaw | 7 | 0.0% |
| Colombian | 154 | 0.1% |
| Costa Rican | 40 | 0.0% |
| Cree | 5 | 0.0% |
| Creek | 3 | 0.0% |
| Croatian | 215 | 0.1% |
| Cuban | 187 | 0.1% |
| Czech | 388 | 0.3% |
| Czechoslovakian | 109 | 0.1% |
| Danish | 382 | 0.3% |
| Delaware | 19 | 0.0% |
| Dominican | 204 | 0.1% |
| Dutch | 1,581 | 1.0% |
| Eastern European | 284 | 0.2% |
| Ecuadorian | 29 | 0.0% |
| Egyptian | 22 | 0.0% |
| English | 28,765 | 18.7% |
| Ethiopian | 60 | 0.0% |
| European | 1,852 | 1.2% |
| Filipino | 86 | 0.1% |
| Finnish | 540 | 0.4% |
| French | 19,571 | 12.7% |
| French American Indian | 32 | 0.0% |
| French Canadian | 11,936 | 7.7% |
| German | 14,102 | 9.2% |
| Ghanaian | 100 | 0.1% |
| Greek | 1,722 | 1.1% |
| Guamanian / Chamorro | 13 | 0.0% |
| Guatemalan | 46 | 0.0% |
| Haitian | 14 | 0.0% |
| Honduran | 112 | 0.1% |
| Hungarian | 362 | 0.2% |
| Icelander | 35 | 0.0% |
| Indian (Asian) | 826 | 0.5% |
| Indonesian | 32 | 0.0% |
| Inupiat | 24 | 0.0% |
| Iranian | 10 | 0.0% |
| Iraqi | 21 | 0.0% |
| Irish | 29,512 | 19.2% |
| Iroquois | 197 | 0.1% |
| Italian | 12,244 | 8.0% |
| Jamaican | 176 | 0.1% |
| Japanese | 92 | 0.1% |
| Kenyan | 5 | 0.0% |
| Korean | 731 | 0.5% |
| Laotian | 85 | 0.1% |
| Latvian | 51 | 0.0% |
| Lebanese | 542 | 0.4% |
| Liberian | 131 | 0.1% |
| Lithuanian | 769 | 0.5% |
| Malaysian | 79 | 0.1% |
| Menominee | 5 | 0.0% |
| Mexican | 477 | 0.3% |
| Mexican American Indian | 6 | 0.0% |
| Moroccan | 7 | 0.0% |
| Native Hawaiian | 89 | 0.1% |
| Navajo | 14 | 0.0% |
| New Zealander | 37 | 0.0% |
| Nicaraguan | 130 | 0.1% |
| Northern European | 434 | 0.3% |
| Norwegian | 1,127 | 0.7% |
| Pakistani | 234 | 0.2% |
| Palestinian | 36 | 0.0% |
| Panamanian | 35 | 0.0% |
| Pennsylvania German | 18 | 0.0% |
| Peruvian | 122 | 0.1% |
| Polish | 5,299 | 3.4% |
| Portuguese | 1,275 | 0.8% |
| Pueblo | 2 | 0.0% |
| Puerto Rican | 1,452 | 0.9% |
| Romanian | 198 | 0.1% |
| Russian | 1,272 | 0.8% |
| Salvadoran | 162 | 0.1% |
| Samoan | 15 | 0.0% |
| Scandinavian | 340 | 0.2% |
| Scotch-Irish | 1,702 | 1.1% |
| Scottish | 6,008 | 3.9% |
| Seminole | 6 | 0.0% |
| Serbian | 184 | 0.1% |
| Sioux | 11 | 0.0% |
| Slavic | 58 | 0.0% |
| Slovak | 295 | 0.2% |
| Slovene | 15 | 0.0% |
| South African | 66 | 0.0% |
| South American | 479 | 0.3% |
| Spaniard | 66 | 0.0% |
| Spanish | 282 | 0.2% |
| Spanish American | 10 | 0.0% |
| Sri Lankan | 317 | 0.2% |
| Subsaharan African | 1,440 | 0.9% |
| Sudanese | 129 | 0.1% |
| Swedish | 3,278 | 2.1% |
| Swiss | 274 | 0.2% |
| Syrian | 61 | 0.0% |
| Taiwanese | 23 | 0.0% |
| Thai | 432 | 0.3% |
| Trinidadian and Tobagonian | 72 | 0.1% |
| Turkish | 102 | 0.1% |
| Ugandan | 23 | 0.0% |
| Ukrainian | 700 | 0.4% |
| Uruguayan | 107 | 0.1% |
| Venezuelan | 63 | 0.0% |
| Vietnamese | 15 | 0.0% |
| Welsh | 1,243 | 0.8% |
| West Indian | 28 | 0.0% |
| Yugoslavian | 289 | 0.2% | View All 137 Rows |
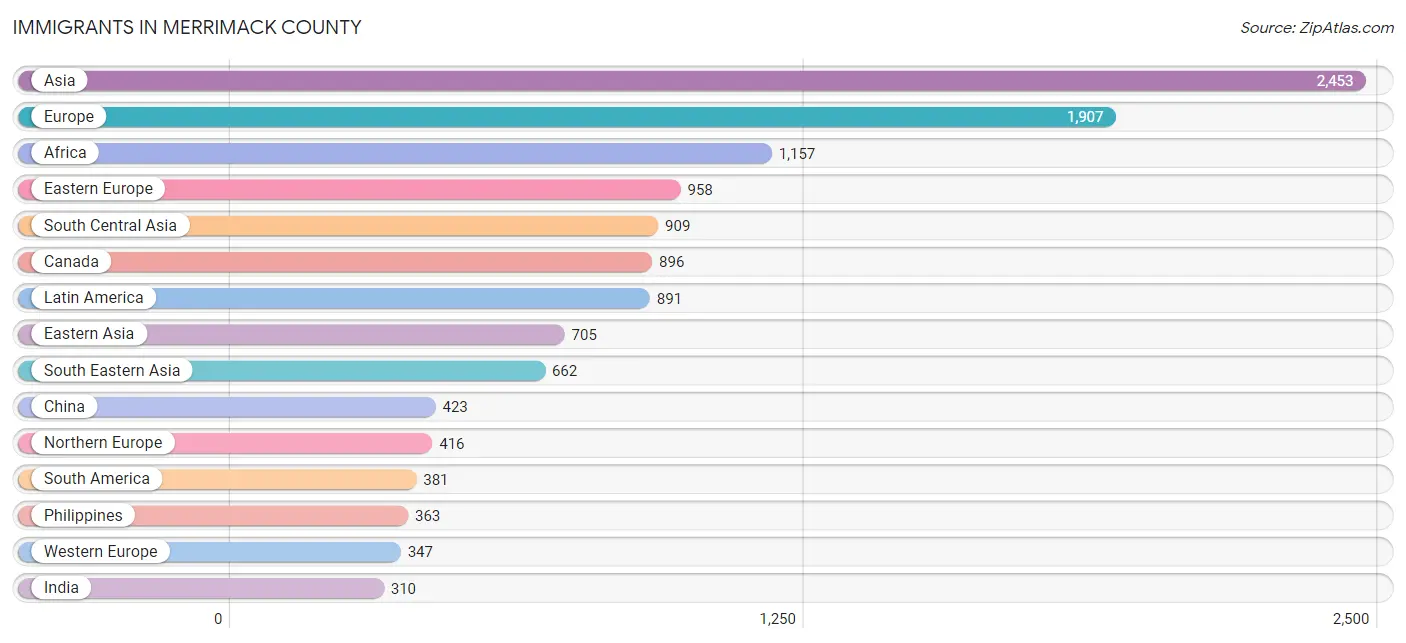
Immigrants in Merrimack County
The most numerous immigrant groups reported in Merrimack County came from Asia (2,453 | 1.6%), Europe (1,907 | 1.2%), Africa (1,157 | 0.7%), Eastern Europe (958 | 0.6%), and South Central Asia (909 | 0.6%), together accounting for 4.8% of all Merrimack County residents.
| Immigration Origin | # Population | % Population |
| Afghanistan | 13 | 0.0% |
| Africa | 1,157 | 0.7% |
| Albania | 72 | 0.1% |
| Asia | 2,453 | 1.6% |
| Australia | 4 | 0.0% |
| Austria | 42 | 0.0% |
| Barbados | 1 | 0.0% |
| Belarus | 11 | 0.0% |
| Belgium | 8 | 0.0% |
| Bosnia and Herzegovina | 173 | 0.1% |
| Brazil | 87 | 0.1% |
| Bulgaria | 74 | 0.1% |
| Cambodia | 44 | 0.0% |
| Cameroon | 39 | 0.0% |
| Canada | 896 | 0.6% |
| Caribbean | 263 | 0.2% |
| Central America | 247 | 0.2% |
| China | 423 | 0.3% |
| Colombia | 29 | 0.0% |
| Congo | 184 | 0.1% |
| Costa Rica | 12 | 0.0% |
| Croatia | 108 | 0.1% |
| Cuba | 21 | 0.0% |
| Czechoslovakia | 21 | 0.0% |
| Denmark | 6 | 0.0% |
| Dominican Republic | 112 | 0.1% |
| Eastern Africa | 138 | 0.1% |
| Eastern Asia | 705 | 0.5% |
| Eastern Europe | 958 | 0.6% |
| El Salvador | 79 | 0.1% |
| England | 87 | 0.1% |
| Ethiopia | 60 | 0.0% |
| Europe | 1,907 | 1.2% |
| France | 44 | 0.0% |
| Germany | 223 | 0.1% |
| Ghana | 45 | 0.0% |
| Greece | 73 | 0.1% |
| Guatemala | 50 | 0.0% |
| Haiti | 7 | 0.0% |
| Honduras | 41 | 0.0% |
| Hungary | 33 | 0.0% |
| India | 310 | 0.2% |
| Indonesia | 27 | 0.0% |
| Iraq | 11 | 0.0% |
| Ireland | 86 | 0.1% |
| Italy | 87 | 0.1% |
| Jamaica | 93 | 0.1% |
| Japan | 57 | 0.0% |
| Kenya | 5 | 0.0% |
| Korea | 225 | 0.2% |
| Laos | 35 | 0.0% |
| Latin America | 891 | 0.6% |
| Lebanon | 69 | 0.0% |
| Liberia | 93 | 0.1% |
| Lithuania | 2 | 0.0% |
| Malaysia | 9 | 0.0% |
| Mexico | 30 | 0.0% |
| Middle Africa | 247 | 0.2% |
| Nepal | 264 | 0.2% |
| Netherlands | 30 | 0.0% |
| Nicaragua | 14 | 0.0% |
| Northern Africa | 165 | 0.1% |
| Northern Europe | 416 | 0.3% |
| Oceania | 40 | 0.0% |
| Panama | 21 | 0.0% |
| Peru | 122 | 0.1% |
| Philippines | 363 | 0.2% |
| Poland | 55 | 0.0% |
| Portugal | 26 | 0.0% |
| Romania | 80 | 0.1% |
| Russia | 134 | 0.1% |
| Scotland | 66 | 0.0% |
| South Africa | 146 | 0.1% |
| South America | 381 | 0.3% |
| South Central Asia | 909 | 0.6% |
| South Eastern Asia | 662 | 0.4% |
| Southern Europe | 186 | 0.1% |
| Sri Lanka | 10 | 0.0% |
| Sudan | 165 | 0.1% |
| Sweden | 8 | 0.0% |
| Syria | 5 | 0.0% |
| Taiwan | 144 | 0.1% |
| Thailand | 42 | 0.0% |
| Trinidad and Tobago | 29 | 0.0% |
| Turkey | 82 | 0.1% |
| Uganda | 21 | 0.0% |
| Ukraine | 153 | 0.1% |
| Uruguay | 67 | 0.0% |
| Venezuela | 50 | 0.0% |
| Vietnam | 110 | 0.1% |
| Western Africa | 178 | 0.1% |
| Western Asia | 167 | 0.1% |
| Western Europe | 347 | 0.2% |
| Zaire | 24 | 0.0% | View All 94 Rows |
Sex and Age in Merrimack County
Sex and Age in Merrimack County
The most populous age groups in Merrimack County are 60 to 64 Years (5,834 | 7.6%) for men and 60 to 64 Years (6,157 | 8.0%) for women.
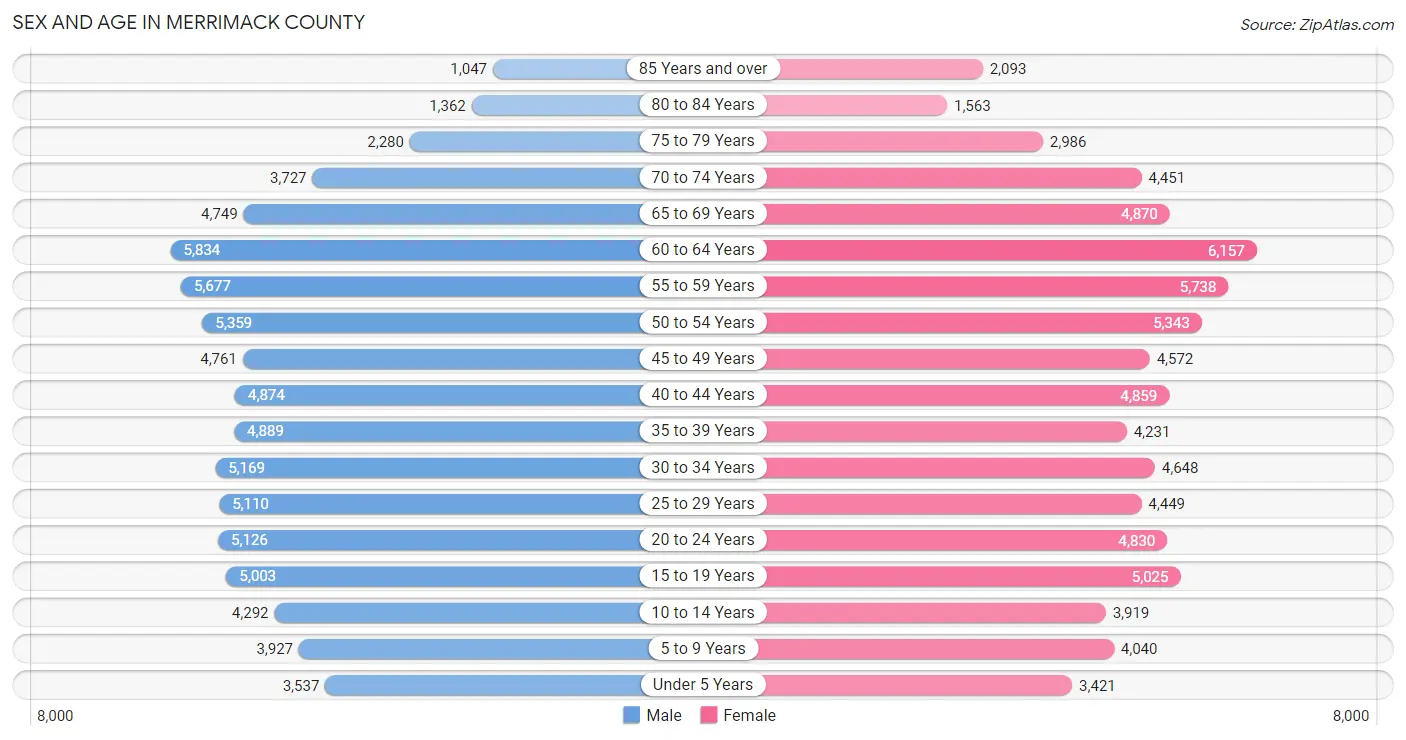
| Age Bracket | Male | Female |
| Under 5 Years | 3,537 (4.6%) | 3,421 (4.4%) |
| 5 to 9 Years | 3,927 (5.1%) | 4,040 (5.2%) |
| 10 to 14 Years | 4,292 (5.6%) | 3,919 (5.1%) |
| 15 to 19 Years | 5,003 (6.5%) | 5,025 (6.5%) |
| 20 to 24 Years | 5,126 (6.7%) | 4,830 (6.3%) |
| 25 to 29 Years | 5,110 (6.7%) | 4,449 (5.8%) |
| 30 to 34 Years | 5,169 (6.7%) | 4,648 (6.0%) |
| 35 to 39 Years | 4,889 (6.4%) | 4,231 (5.5%) |
| 40 to 44 Years | 4,874 (6.4%) | 4,859 (6.3%) |
| 45 to 49 Years | 4,761 (6.2%) | 4,572 (5.9%) |
| 50 to 54 Years | 5,359 (7.0%) | 5,343 (6.9%) |
| 55 to 59 Years | 5,677 (7.4%) | 5,738 (7.4%) |
| 60 to 64 Years | 5,834 (7.6%) | 6,157 (8.0%) |
| 65 to 69 Years | 4,749 (6.2%) | 4,870 (6.3%) |
| 70 to 74 Years | 3,727 (4.9%) | 4,451 (5.8%) |
| 75 to 79 Years | 2,280 (3.0%) | 2,986 (3.9%) |
| 80 to 84 Years | 1,362 (1.8%) | 1,563 (2.0%) |
| 85 Years and over | 1,047 (1.4%) | 2,093 (2.7%) |
| Total | 76,723 (100.0%) | 77,195 (100.0%) |
Families and Households in Merrimack County
Median Family Size in Merrimack County
The median family size in Merrimack County is 2.94 persons per family, with married-couple families (32,405 | 80.8%) accounting for the largest median family size of 2.97 persons per family. On the other hand, single male/father families (3,160 | 7.9%) represent the smallest median family size with 2.80 persons per family.
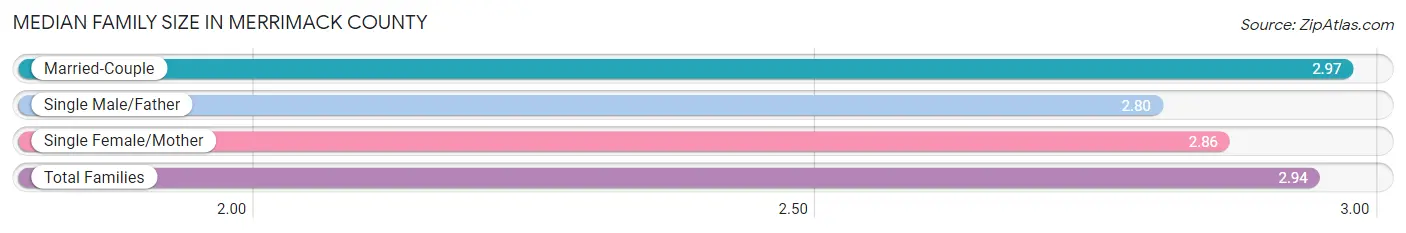
| Family Type | # Families | Family Size |
| Married-Couple | 32,405 (80.8%) | 2.97 |
| Single Male/Father | 3,160 (7.9%) | 2.80 |
| Single Female/Mother | 4,551 (11.3%) | 2.86 |
| Total Families | 40,116 (100.0%) | 2.94 |
Median Household Size in Merrimack County
The median household size in Merrimack County is 2.46 persons per household, with single male/father households (3,160 | 5.3%) accounting for the largest median household size of 3.31 persons per household. non-family households (19,735 | 33.0%) represent the smallest median household size with 1.27 persons per household.
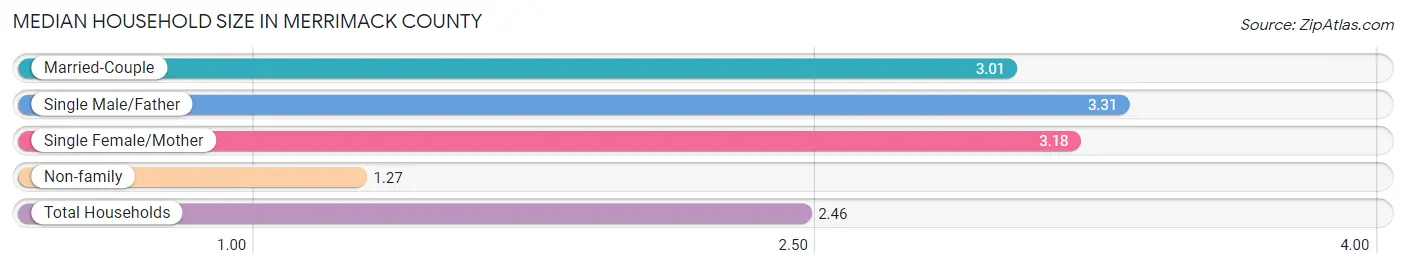
| Household Type | # Households | Household Size |
| Married-Couple | 32,405 (54.1%) | 3.01 |
| Single Male/Father | 3,160 (5.3%) | 3.31 |
| Single Female/Mother | 4,551 (7.6%) | 3.18 |
| Non-family | 19,735 (33.0%) | 1.27 |
| Total Households | 59,851 (100.0%) | 2.46 |
Household Size by Marriage Status in Merrimack County
Out of a total of 59,851 households in Merrimack County, 40,116 (67.0%) are family households, while 19,735 (33.0%) are nonfamily households. The most numerous type of family households are 2-person households, comprising 19,831, and the most common type of nonfamily households are 1-person households, comprising 15,256.
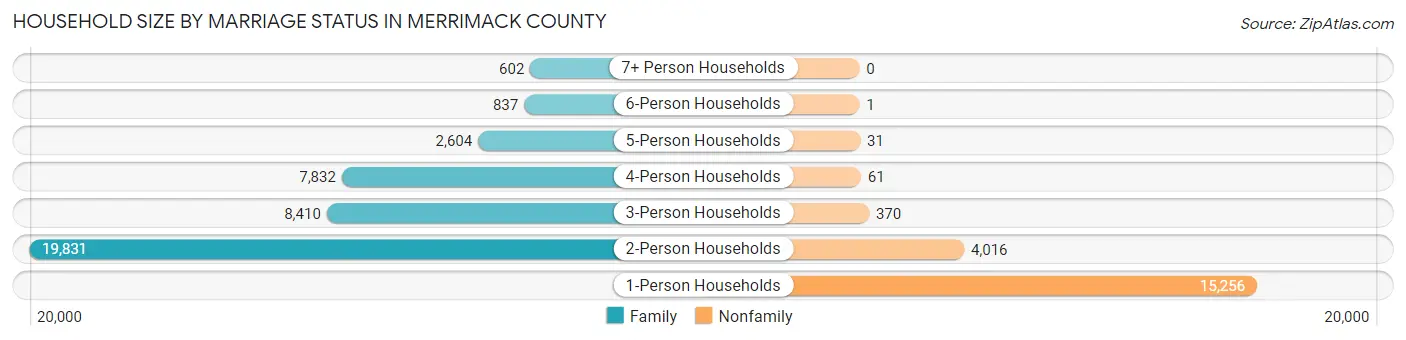
| Household Size | Family Households | Nonfamily Households |
| 1-Person Households | - | 15,256 (25.5%) |
| 2-Person Households | 19,831 (33.1%) | 4,016 (6.7%) |
| 3-Person Households | 8,410 (14.1%) | 370 (0.6%) |
| 4-Person Households | 7,832 (13.1%) | 61 (0.1%) |
| 5-Person Households | 2,604 (4.3%) | 31 (0.1%) |
| 6-Person Households | 837 (1.4%) | 1 (0.0%) |
| 7+ Person Households | 602 (1.0%) | 0 (0.0%) |
| Total | 40,116 (67.0%) | 19,735 (33.0%) |
Female Fertility in Merrimack County
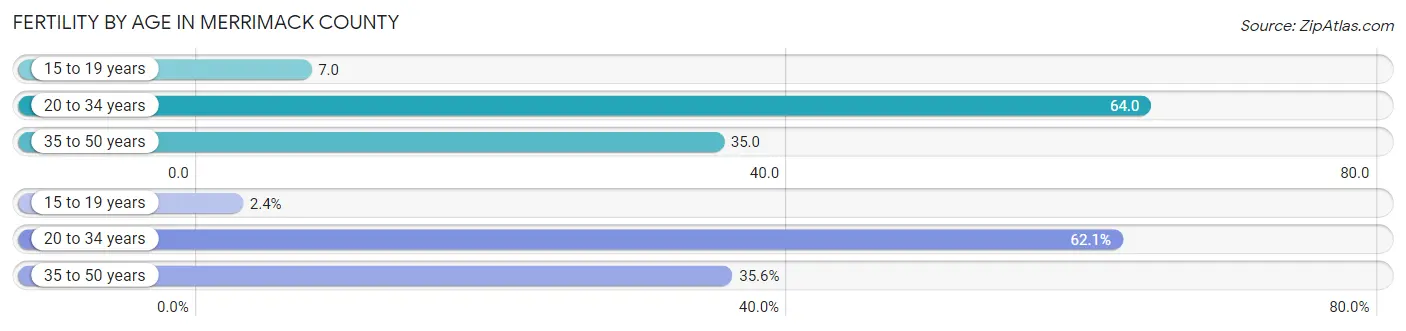
Fertility by Age in Merrimack County
Average fertility rate in Merrimack County is 43.0 births per 1,000 women. Women in the age bracket of 20 to 34 years have the highest fertility rate with 64.0 births per 1,000 women. Women in the age bracket of 20 to 34 years acount for 62.1% of all women with births.
| Age Bracket | Women with Births | Births / 1,000 Women |
| 15 to 19 years | 34 (2.4%) | 7.0 |
| 20 to 34 years | 895 (62.1%) | 64.0 |
| 35 to 50 years | 513 (35.6%) | 35.0 |
| Total | 1,442 (100.0%) | 43.0 |
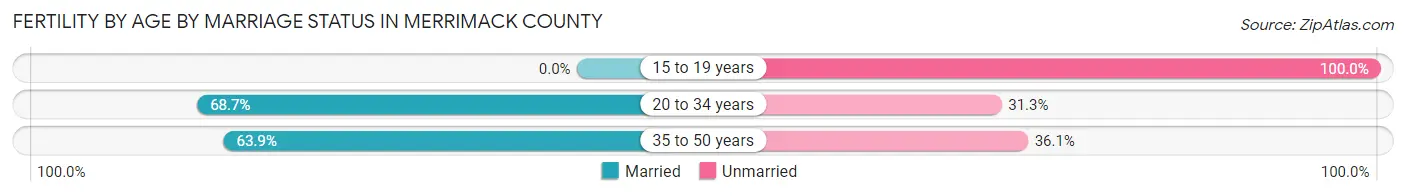
Fertility by Age by Marriage Status in Merrimack County
65.4% of women with births (1,442) in Merrimack County are married. The highest percentage of unmarried women with births falls into 15 to 19 years age bracket with 100.0% of them unmarried at the time of birth, while the lowest percentage of unmarried women with births belong to 20 to 34 years age bracket with 31.3% of them unmarried.
| Age Bracket | Married | Unmarried |
| 15 to 19 years | 0 (0.0%) | 34 (100.0%) |
| 20 to 34 years | 615 (68.7%) | 280 (31.3%) |
| 35 to 50 years | 328 (63.9%) | 185 (36.1%) |
| Total | 943 (65.4%) | 499 (34.6%) |
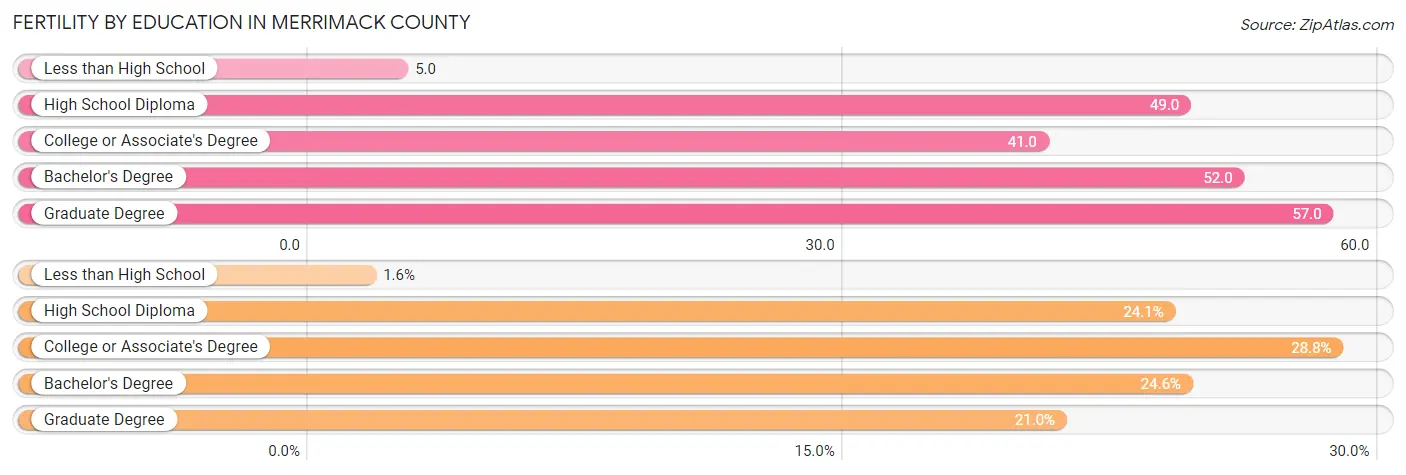
Fertility by Education in Merrimack County
Average fertility rate in Merrimack County is 43.0 births per 1,000 women. Women with the education attainment of graduate degree have the highest fertility rate of 57.0 births per 1,000 women, while women with the education attainment of less than high school have the lowest fertility at 5.0 births per 1,000 women. Women with the education attainment of college or associate's degree represent 28.8% of all women with births.
| Educational Attainment | Women with Births | Births / 1,000 Women |
| Less than High School | 23 (1.6%) | 5.0 |
| High School Diploma | 347 (24.1%) | 49.0 |
| College or Associate's Degree | 415 (28.8%) | 41.0 |
| Bachelor's Degree | 354 (24.5%) | 52.0 |
| Graduate Degree | 303 (21.0%) | 57.0 |
| Total | 1,442 (100.0%) | 43.0 |
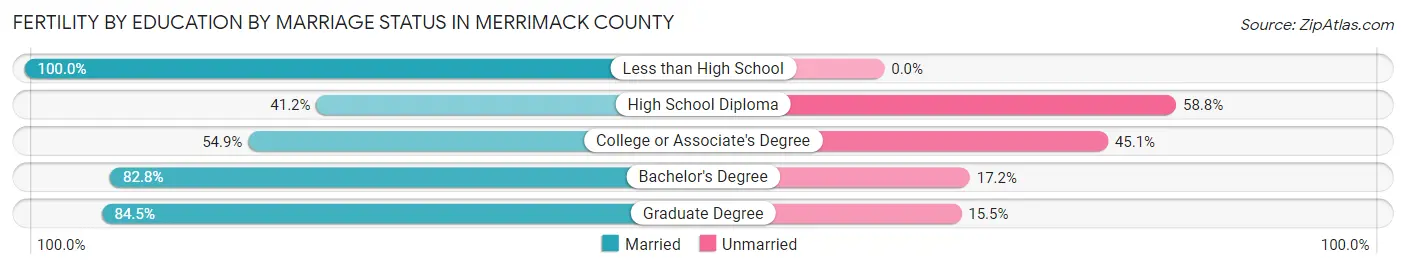
Fertility by Education by Marriage Status in Merrimack County
34.6% of women with births in Merrimack County are unmarried. Women with the educational attainment of less than high school are most likely to be married with 100.0% of them married at childbirth, while women with the educational attainment of high school diploma are least likely to be married with 58.8% of them unmarried at childbirth.
| Educational Attainment | Married | Unmarried |
| Less than High School | 23 (100.0%) | 0 (0.0%) |
| High School Diploma | 143 (41.2%) | 204 (58.8%) |
| College or Associate's Degree | 228 (54.9%) | 187 (45.1%) |
| Bachelor's Degree | 293 (82.8%) | 61 (17.2%) |
| Graduate Degree | 256 (84.5%) | 47 (15.5%) |
| Total | 943 (65.4%) | 499 (34.6%) |
Employment Characteristics in Merrimack County
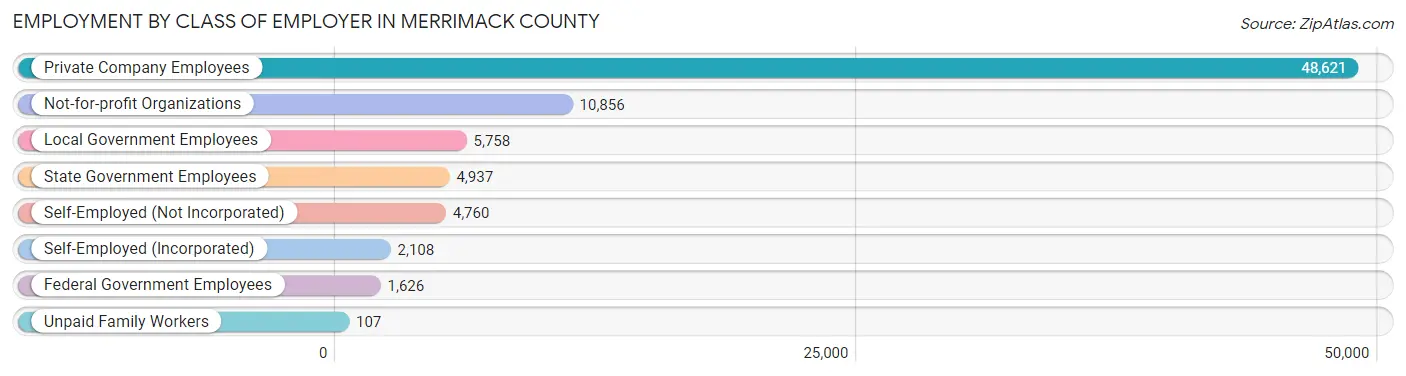
Employment by Class of Employer in Merrimack County
Among the 78,773 employed individuals in Merrimack County, private company employees (48,621 | 61.7%), not-for-profit organizations (10,856 | 13.8%), and local government employees (5,758 | 7.3%) make up the most common classes of employment.
| Employer Class | # Employees | % Employees |
| Private Company Employees | 48,621 | 61.7% |
| Self-Employed (Incorporated) | 2,108 | 2.7% |
| Self-Employed (Not Incorporated) | 4,760 | 6.0% |
| Not-for-profit Organizations | 10,856 | 13.8% |
| Local Government Employees | 5,758 | 7.3% |
| State Government Employees | 4,937 | 6.3% |
| Federal Government Employees | 1,626 | 2.1% |
| Unpaid Family Workers | 107 | 0.1% |
| Total | 78,773 | 100.0% |
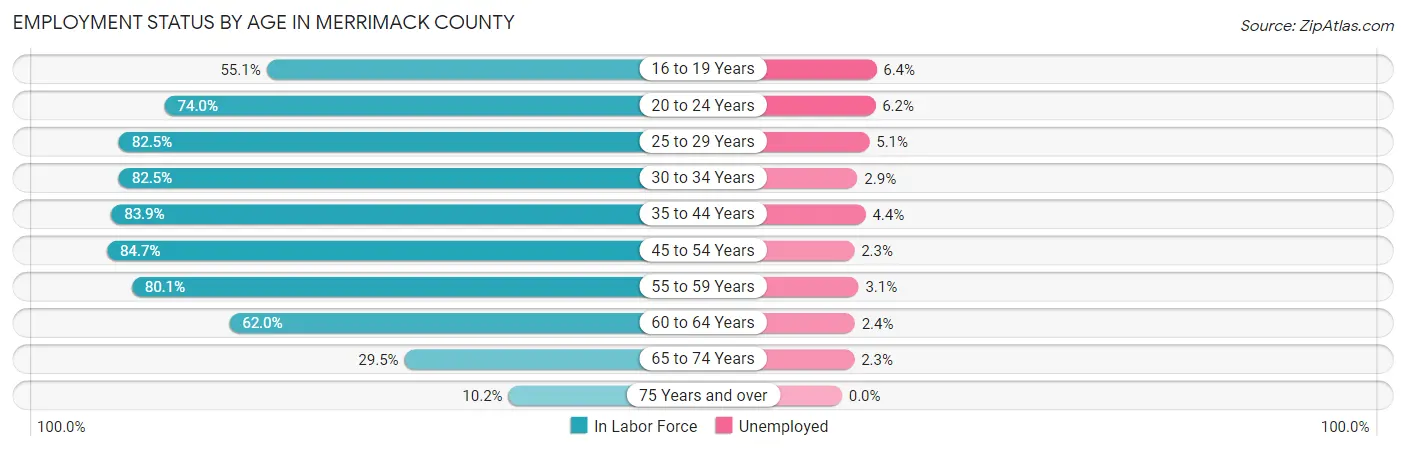
Employment Status by Age in Merrimack County
According to the labor force statistics for Merrimack County, out of the total population over 16 years of age (129,022), 64.9% or 83,735 individuals are in the labor force, with 3.6% or 3,014 of them unemployed. The age group with the highest labor force participation rate is 45 to 54 years, with 84.7% or 16,970 individuals in the labor force. Within the labor force, the 16 to 19 years age range has the highest percentage of unemployed individuals, with 6.4% or 292 of them being unemployed.
| Age Bracket | In Labor Force | Unemployed |
| 16 to 19 Years | 4,556 (55.1%) | 292 (6.4%) |
| 20 to 24 Years | 7,367 (74.0%) | 457 (6.2%) |
| 25 to 29 Years | 7,886 (82.5%) | 402 (5.1%) |
| 30 to 34 Years | 8,099 (82.5%) | 235 (2.9%) |
| 35 to 44 Years | 15,818 (83.9%) | 696 (4.4%) |
| 45 to 54 Years | 16,970 (84.7%) | 390 (2.3%) |
| 55 to 59 Years | 9,143 (80.1%) | 283 (3.1%) |
| 60 to 64 Years | 7,434 (62.0%) | 178 (2.4%) |
| 65 to 74 Years | 5,250 (29.5%) | 121 (2.3%) |
| 75 Years and over | 1,156 (10.2%) | 0 (0.0%) |
| Total | 83,735 (64.9%) | 3,014 (3.6%) |
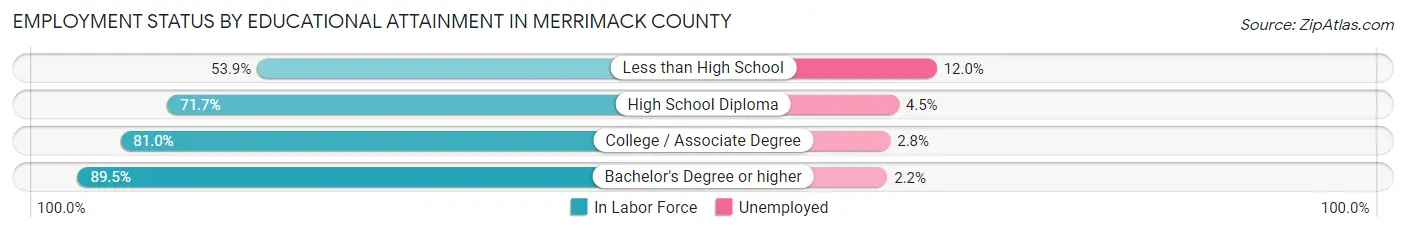
Employment Status by Educational Attainment in Merrimack County
According to labor force statistics for Merrimack County, 80.0% of individuals (65,336) out of the total population between 25 and 64 years of age (81,670) are in the labor force, with 3.3% or 2,156 of them being unemployed. The group with the highest labor force participation rate are those with the educational attainment of bachelor's degree or higher, with 89.5% or 27,596 individuals in the labor force. Within the labor force, individuals with less than high school education have the highest percentage of unemployment, with 12.0% or 302 of them being unemployed.
| Educational Attainment | In Labor Force | Unemployed |
| Less than High School | 2,514 (53.9%) | 560 (12.0%) |
| High School Diploma | 16,489 (71.7%) | 1,035 (4.5%) |
| College / Associate Degree | 18,773 (81.0%) | 649 (2.8%) |
| Bachelor's Degree or higher | 27,596 (89.5%) | 678 (2.2%) |
| Total | 65,336 (80.0%) | 2,695 (3.3%) |
Employment Occupations by Sex in Merrimack County
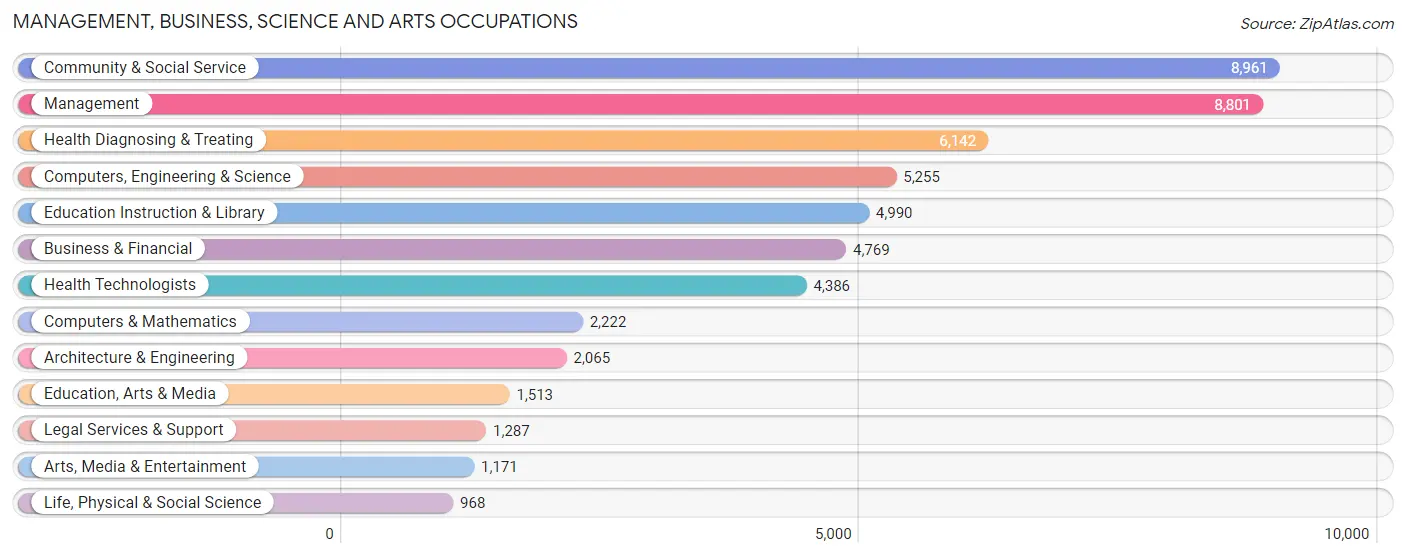
Management, Business, Science and Arts Occupations
The most common Management, Business, Science and Arts occupations in Merrimack County are Community & Social Service (8,961 | 11.1%), Management (8,801 | 10.9%), Health Diagnosing & Treating (6,142 | 7.6%), Computers, Engineering & Science (5,255 | 6.5%), and Education Instruction & Library (4,990 | 6.2%).
Management, Business, Science and Arts Occupations by Sex
Within the Management, Business, Science and Arts occupations in Merrimack County, the most male-oriented occupations are Architecture & Engineering (85.8%), Computers, Engineering & Science (72.6%), and Computers & Mathematics (70.4%), while the most female-oriented occupations are Health Diagnosing & Treating (72.3%), Education Instruction & Library (70.8%), and Health Technologists (68.6%).
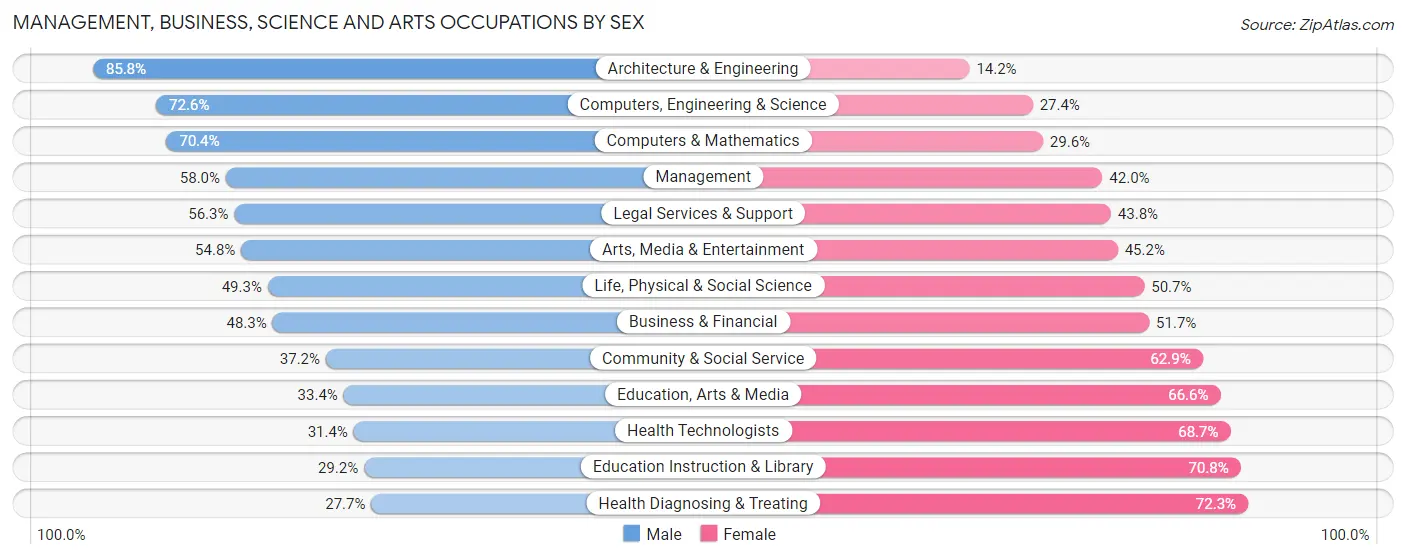
| Occupation | Male | Female |
| Management | 5,106 (58.0%) | 3,695 (42.0%) |
| Business & Financial | 2,302 (48.3%) | 2,467 (51.7%) |
| Computers, Engineering & Science | 3,813 (72.6%) | 1,442 (27.4%) |
| Computers & Mathematics | 1,565 (70.4%) | 657 (29.6%) |
| Architecture & Engineering | 1,771 (85.8%) | 294 (14.2%) |
| Life, Physical & Social Science | 477 (49.3%) | 491 (50.7%) |
| Community & Social Service | 3,329 (37.1%) | 5,632 (62.8%) |
| Education, Arts & Media | 506 (33.4%) | 1,007 (66.6%) |
| Legal Services & Support | 724 (56.2%) | 563 (43.8%) |
| Education Instruction & Library | 1,457 (29.2%) | 3,533 (70.8%) |
| Arts, Media & Entertainment | 642 (54.8%) | 529 (45.2%) |
| Health Diagnosing & Treating | 1,700 (27.7%) | 4,442 (72.3%) |
| Health Technologists | 1,375 (31.4%) | 3,011 (68.6%) |
| Total (Category) | 16,250 (47.9%) | 17,678 (52.1%) |
| Total (Overall) | 42,526 (52.9%) | 37,897 (47.1%) |
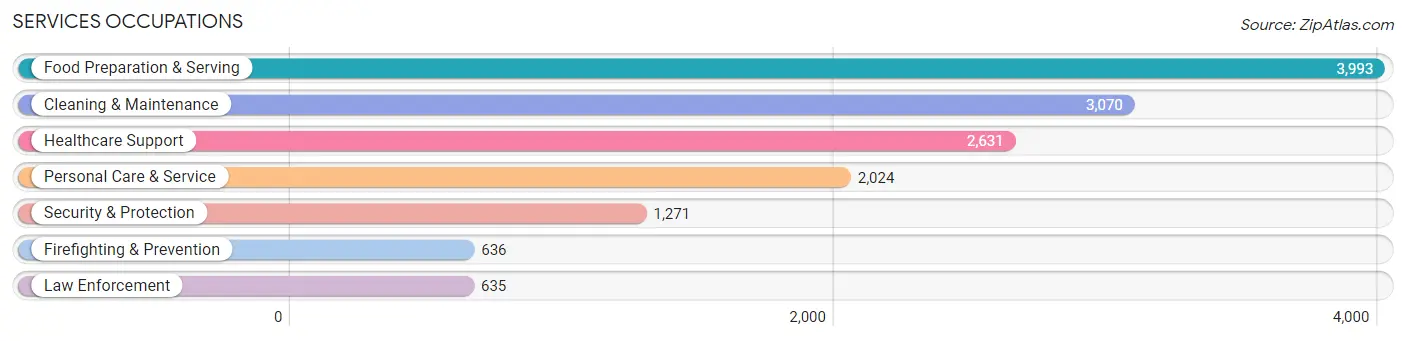
Services Occupations
The most common Services occupations in Merrimack County are Food Preparation & Serving (3,993 | 5.0%), Cleaning & Maintenance (3,070 | 3.8%), Healthcare Support (2,631 | 3.3%), Personal Care & Service (2,024 | 2.5%), and Security & Protection (1,271 | 1.6%).
Services Occupations by Sex
Within the Services occupations in Merrimack County, the most male-oriented occupations are Law Enforcement (86.9%), Security & Protection (81.6%), and Firefighting & Prevention (76.3%), while the most female-oriented occupations are Healthcare Support (83.1%), Personal Care & Service (79.9%), and Food Preparation & Serving (51.7%).
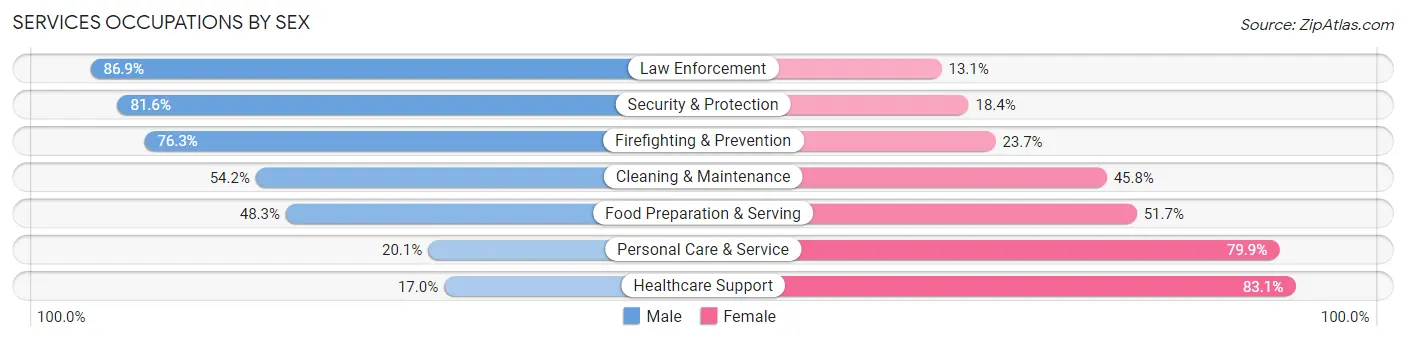
| Occupation | Male | Female |
| Healthcare Support | 446 (17.0%) | 2,185 (83.1%) |
| Security & Protection | 1,037 (81.6%) | 234 (18.4%) |
| Firefighting & Prevention | 485 (76.3%) | 151 (23.7%) |
| Law Enforcement | 552 (86.9%) | 83 (13.1%) |
| Food Preparation & Serving | 1,928 (48.3%) | 2,065 (51.7%) |
| Cleaning & Maintenance | 1,665 (54.2%) | 1,405 (45.8%) |
| Personal Care & Service | 407 (20.1%) | 1,617 (79.9%) |
| Total (Category) | 5,483 (42.2%) | 7,506 (57.8%) |
| Total (Overall) | 42,526 (52.9%) | 37,897 (47.1%) |
Sales and Office Occupations
The most common Sales and Office occupations in Merrimack County are Office & Administration (8,586 | 10.7%), and Sales & Related (8,173 | 10.2%).

Sales and Office Occupations by Sex
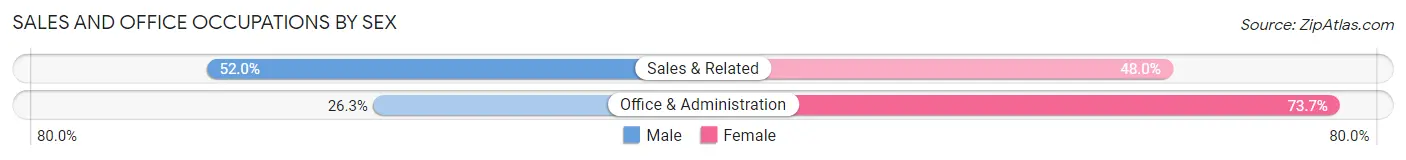
| Occupation | Male | Female |
| Sales & Related | 4,250 (52.0%) | 3,923 (48.0%) |
| Office & Administration | 2,257 (26.3%) | 6,329 (73.7%) |
| Total (Category) | 6,507 (38.8%) | 10,252 (61.2%) |
| Total (Overall) | 42,526 (52.9%) | 37,897 (47.1%) |
Natural Resources, Construction and Maintenance Occupations
The most common Natural Resources, Construction and Maintenance occupations in Merrimack County are Construction & Extraction (4,005 | 5.0%), Installation, Maintenance & Repair (3,170 | 3.9%), and Farming, Fishing & Forestry (214 | 0.3%).

Natural Resources, Construction and Maintenance Occupations by Sex
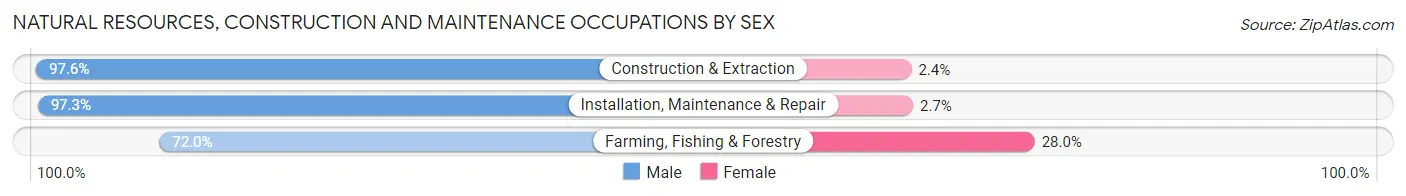
| Occupation | Male | Female |
| Farming, Fishing & Forestry | 154 (72.0%) | 60 (28.0%) |
| Construction & Extraction | 3,909 (97.6%) | 96 (2.4%) |
| Installation, Maintenance & Repair | 3,083 (97.3%) | 87 (2.7%) |
| Total (Category) | 7,146 (96.7%) | 243 (3.3%) |
| Total (Overall) | 42,526 (52.9%) | 37,897 (47.1%) |
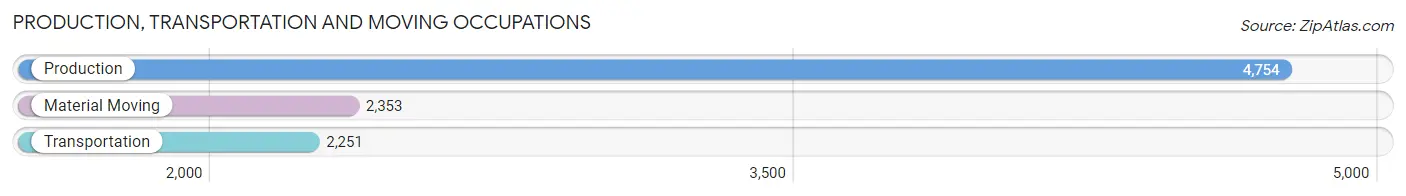
Production, Transportation and Moving Occupations
The most common Production, Transportation and Moving occupations in Merrimack County are Production (4,754 | 5.9%), Material Moving (2,353 | 2.9%), and Transportation (2,251 | 2.8%).
Production, Transportation and Moving Occupations by Sex
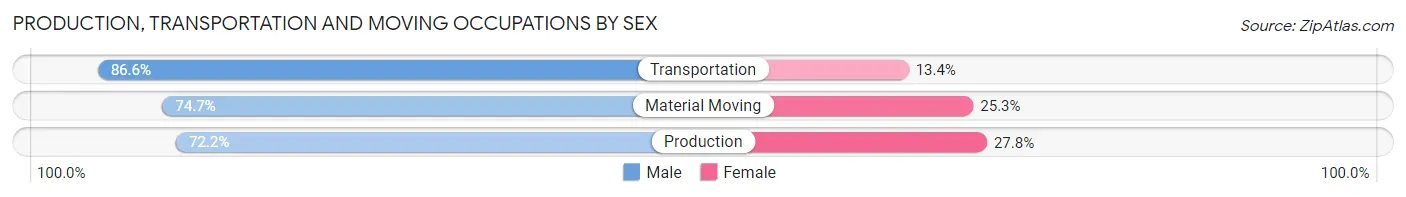
| Occupation | Male | Female |
| Production | 3,433 (72.2%) | 1,321 (27.8%) |
| Transportation | 1,949 (86.6%) | 302 (13.4%) |
| Material Moving | 1,758 (74.7%) | 595 (25.3%) |
| Total (Category) | 7,140 (76.3%) | 2,218 (23.7%) |
| Total (Overall) | 42,526 (52.9%) | 37,897 (47.1%) |
Employment Industries by Sex in Merrimack County
Employment Industries in Merrimack County
The major employment industries in Merrimack County include Health Care & Social Assistance (12,498 | 15.5%), Retail Trade (9,609 | 11.9%), Educational Services (7,771 | 9.7%), Manufacturing (7,675 | 9.5%), and Construction (6,044 | 7.5%).

Employment Industries by Sex in Merrimack County
The Merrimack County industries that see more men than women are Construction (90.9%), Wholesale Trade (75.3%), and Manufacturing (75.0%), whereas the industries that tend to have a higher number of women are Health Care & Social Assistance (75.7%), Educational Services (68.0%), and Finance & Insurance (62.8%).
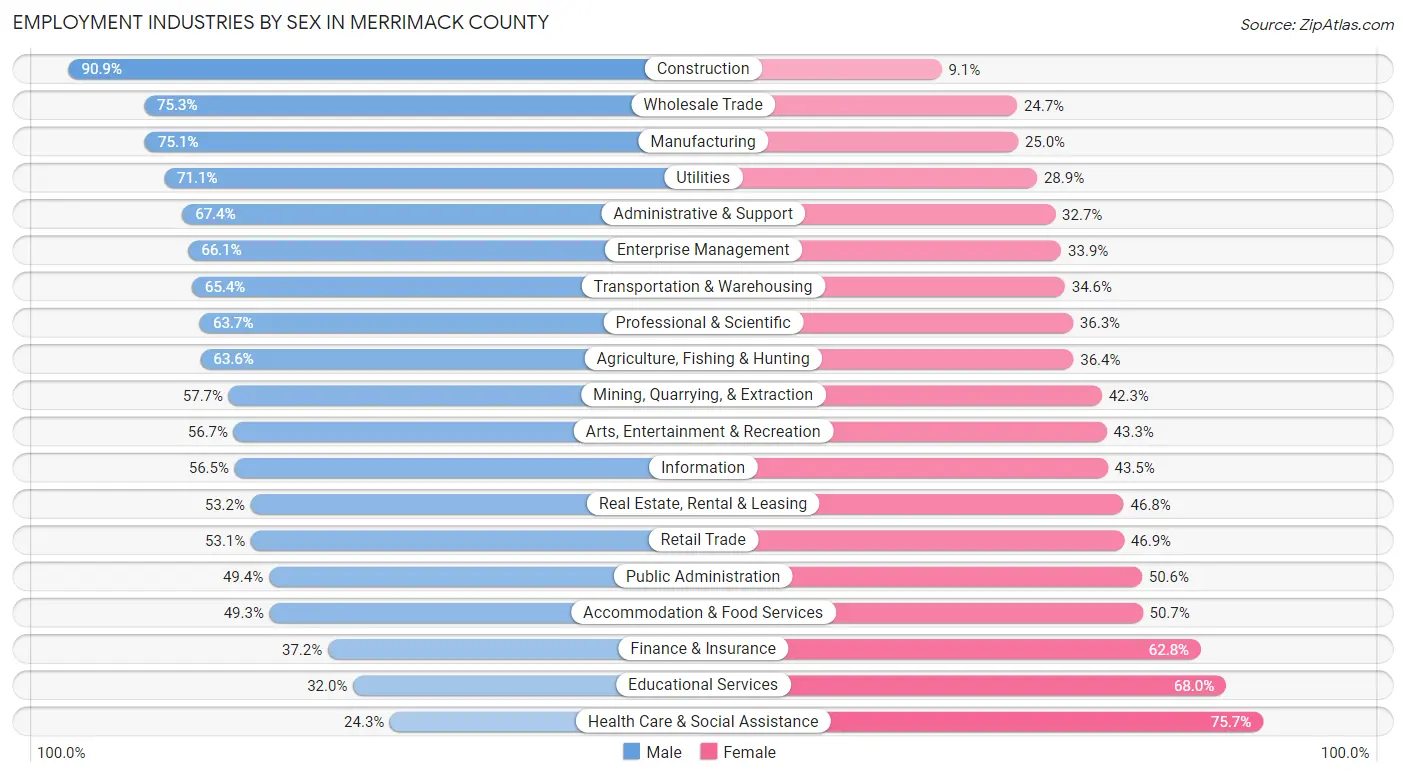
| Industry | Male | Female |
| Agriculture, Fishing & Hunting | 360 (63.6%) | 206 (36.4%) |
| Mining, Quarrying, & Extraction | 71 (57.7%) | 52 (42.3%) |
| Construction | 5,493 (90.9%) | 551 (9.1%) |
| Manufacturing | 5,760 (75.0%) | 1,915 (24.9%) |
| Wholesale Trade | 1,971 (75.3%) | 648 (24.7%) |
| Retail Trade | 5,104 (53.1%) | 4,505 (46.9%) |
| Transportation & Warehousing | 1,387 (65.4%) | 735 (34.6%) |
| Utilities | 416 (71.1%) | 169 (28.9%) |
| Information | 831 (56.5%) | 640 (43.5%) |
| Finance & Insurance | 1,308 (37.2%) | 2,209 (62.8%) |
| Real Estate, Rental & Leasing | 401 (53.2%) | 353 (46.8%) |
| Professional & Scientific | 3,776 (63.7%) | 2,154 (36.3%) |
| Enterprise Management | 119 (66.1%) | 61 (33.9%) |
| Administrative & Support | 2,069 (67.3%) | 1,003 (32.7%) |
| Educational Services | 2,485 (32.0%) | 5,286 (68.0%) |
| Health Care & Social Assistance | 3,041 (24.3%) | 9,457 (75.7%) |
| Arts, Entertainment & Recreation | 928 (56.7%) | 709 (43.3%) |
| Accommodation & Food Services | 2,208 (49.3%) | 2,274 (50.7%) |
| Public Administration | 2,779 (49.4%) | 2,844 (50.6%) |
| Total | 42,526 (52.9%) | 37,897 (47.1%) |
Education in Merrimack County
School Enrollment in Merrimack County
The most common levels of schooling among the 34,112 students in Merrimack County are high school (8,043 | 23.6%), college / undergraduate (7,624 | 22.4%), and middle school (6,707 | 19.7%).
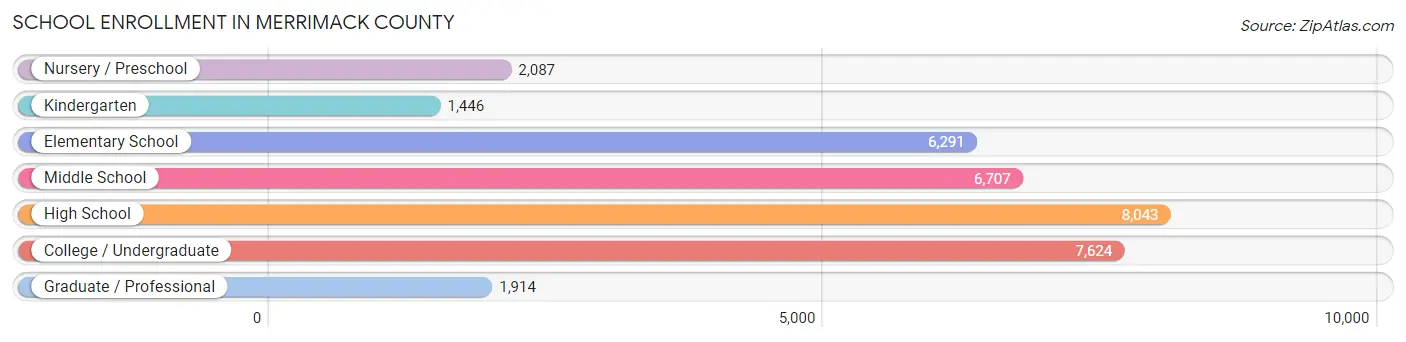
| School Level | # Students | % Students |
| Nursery / Preschool | 2,087 | 6.1% |
| Kindergarten | 1,446 | 4.2% |
| Elementary School | 6,291 | 18.4% |
| Middle School | 6,707 | 19.7% |
| High School | 8,043 | 23.6% |
| College / Undergraduate | 7,624 | 22.4% |
| Graduate / Professional | 1,914 | 5.6% |
| Total | 34,112 | 100.0% |
School Enrollment by Age by Funding Source in Merrimack County
Out of a total of 34,112 students who are enrolled in schools in Merrimack County, 8,357 (24.5%) attend a private institution, while the remaining 25,755 (75.5%) are enrolled in public schools. The age group of 3 to 4 year olds has the highest likelihood of being enrolled in private schools, with 968 (58.2% in the age bracket) enrolled. Conversely, the age group of 10 to 14 year olds has the lowest likelihood of being enrolled in a private school, with 7,237 (89.2% in the age bracket) attending a public institution.
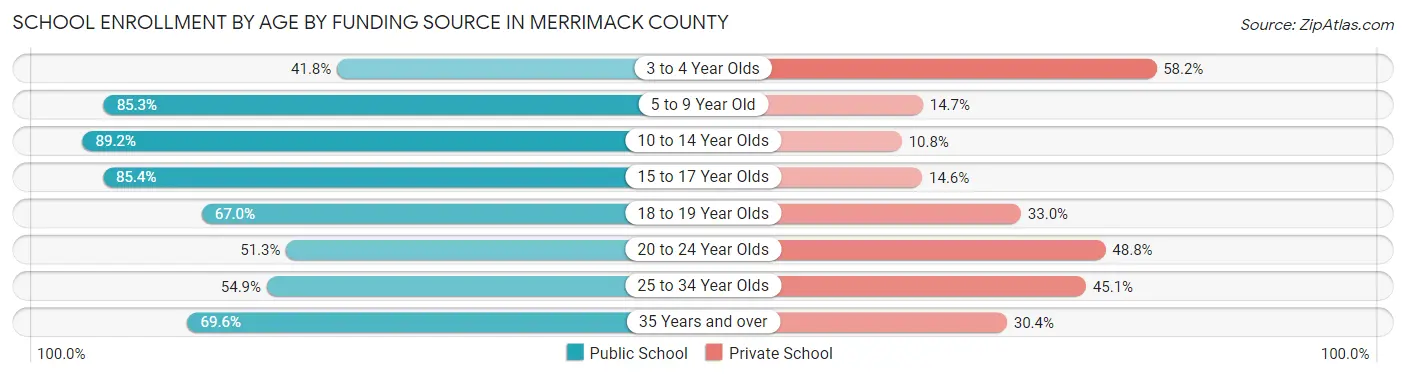
| Age Bracket | Public School | Private School |
| 3 to 4 Year Olds | 695 (41.8%) | 968 (58.2%) |
| 5 to 9 Year Old | 6,401 (85.3%) | 1,107 (14.7%) |
| 10 to 14 Year Olds | 7,237 (89.2%) | 877 (10.8%) |
| 15 to 17 Year Olds | 4,647 (85.4%) | 795 (14.6%) |
| 18 to 19 Year Olds | 2,210 (67.0%) | 1,089 (33.0%) |
| 20 to 24 Year Olds | 2,201 (51.2%) | 2,094 (48.7%) |
| 25 to 34 Year Olds | 1,029 (54.9%) | 846 (45.1%) |
| 35 Years and over | 1,334 (69.6%) | 582 (30.4%) |
| Total | 25,755 (75.5%) | 8,357 (24.5%) |
Educational Attainment by Field of Study in Merrimack County
Business (7,415 | 16.5%), education (5,697 | 12.7%), science & technology (4,464 | 10.0%), social sciences (3,814 | 8.5%), and bio, nature & agricultural (3,360 | 7.5%) are the most common fields of study among 44,879 individuals in Merrimack County who have obtained a bachelor's degree or higher.
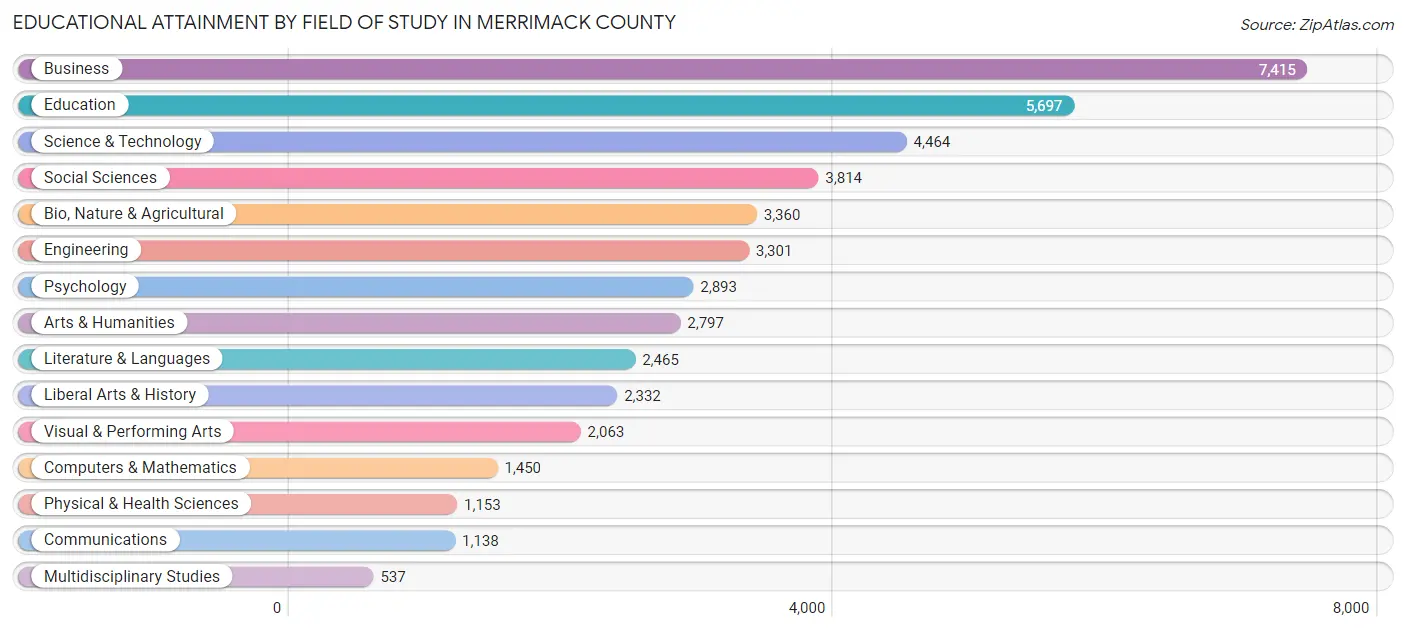
| Field of Study | # Graduates | % Graduates |
| Computers & Mathematics | 1,450 | 3.2% |
| Bio, Nature & Agricultural | 3,360 | 7.5% |
| Physical & Health Sciences | 1,153 | 2.6% |
| Psychology | 2,893 | 6.5% |
| Social Sciences | 3,814 | 8.5% |
| Engineering | 3,301 | 7.4% |
| Multidisciplinary Studies | 537 | 1.2% |
| Science & Technology | 4,464 | 10.0% |
| Business | 7,415 | 16.5% |
| Education | 5,697 | 12.7% |
| Literature & Languages | 2,465 | 5.5% |
| Liberal Arts & History | 2,332 | 5.2% |
| Visual & Performing Arts | 2,063 | 4.6% |
| Communications | 1,138 | 2.5% |
| Arts & Humanities | 2,797 | 6.2% |
| Total | 44,879 | 100.0% |
Transportation & Commute in Merrimack County
Vehicle Availability by Sex in Merrimack County
The most prevalent vehicle ownership categories in Merrimack County are males with 2 vehicles (19,256, accounting for 46.2%) and females with 2 vehicles (16,233, making up 52.9%).
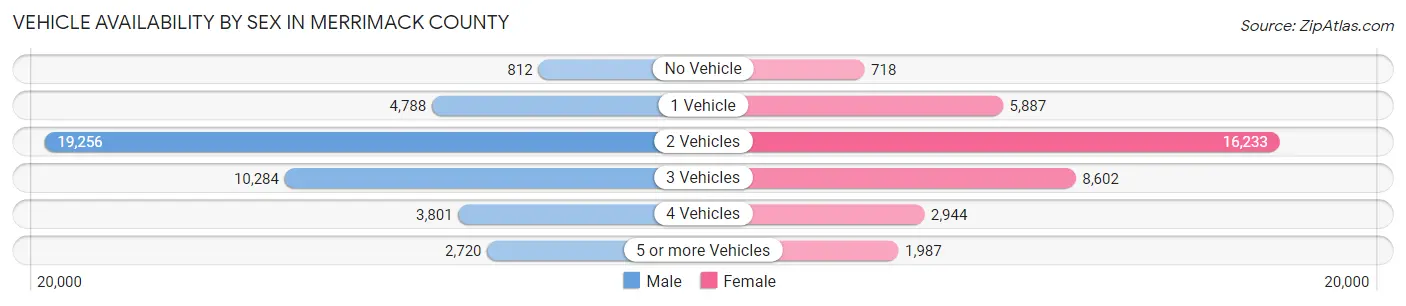
| Vehicles Available | Male | Female |
| No Vehicle | 812 (1.9%) | 718 (2.0%) |
| 1 Vehicle | 4,788 (11.5%) | 5,887 (16.2%) |
| 2 Vehicles | 19,256 (46.2%) | 16,233 (44.6%) |
| 3 Vehicles | 10,284 (24.7%) | 8,602 (23.6%) |
| 4 Vehicles | 3,801 (9.1%) | 2,944 (8.1%) |
| 5 or more Vehicles | 2,720 (6.5%) | 1,987 (5.5%) |
| Total | 41,661 (100.0%) | 36,371 (100.0%) |
Commute Time in Merrimack County
The most frequently occuring commute durations in Merrimack County are 20 to 24 minutes (9,974 commuters, 14.4%), 15 to 19 minutes (9,538 commuters, 13.8%), and 30 to 34 minutes (9,482 commuters, 13.7%).
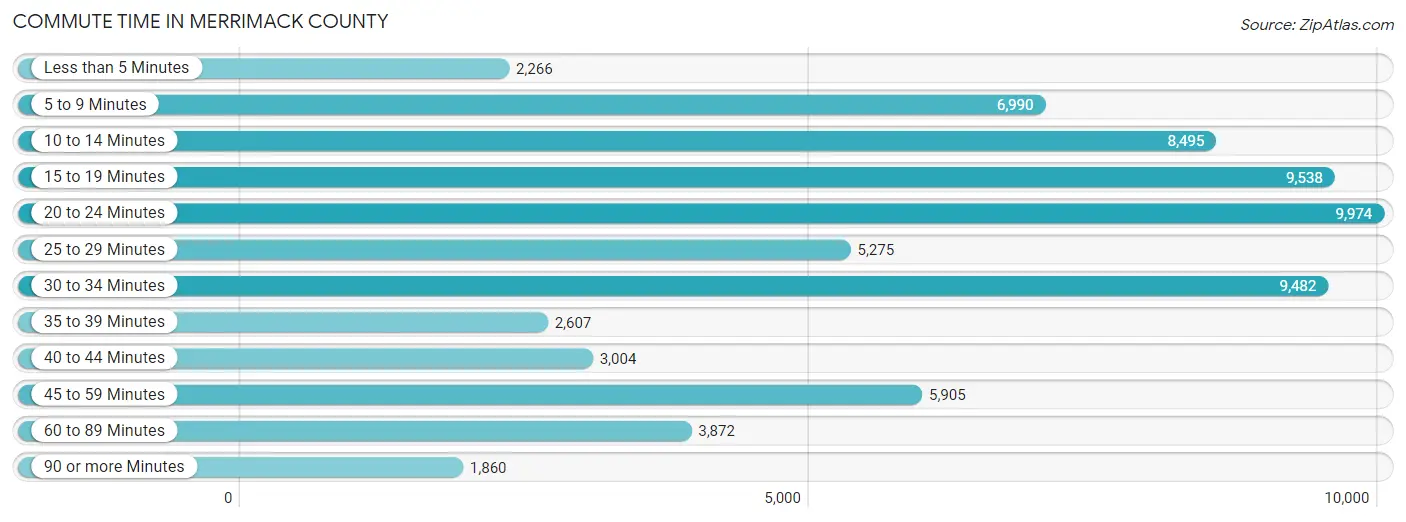
| Commute Time | # Commuters | % Commuters |
| Less than 5 Minutes | 2,266 | 3.3% |
| 5 to 9 Minutes | 6,990 | 10.1% |
| 10 to 14 Minutes | 8,495 | 12.3% |
| 15 to 19 Minutes | 9,538 | 13.8% |
| 20 to 24 Minutes | 9,974 | 14.4% |
| 25 to 29 Minutes | 5,275 | 7.6% |
| 30 to 34 Minutes | 9,482 | 13.7% |
| 35 to 39 Minutes | 2,607 | 3.8% |
| 40 to 44 Minutes | 3,004 | 4.3% |
| 45 to 59 Minutes | 5,905 | 8.5% |
| 60 to 89 Minutes | 3,872 | 5.6% |
| 90 or more Minutes | 1,860 | 2.7% |
Commute Time by Sex in Merrimack County
The most common commute times in Merrimack County are 30 to 34 minutes (5,412 commuters, 14.7%) for males and 20 to 24 minutes (5,134 commuters, 15.8%) for females.
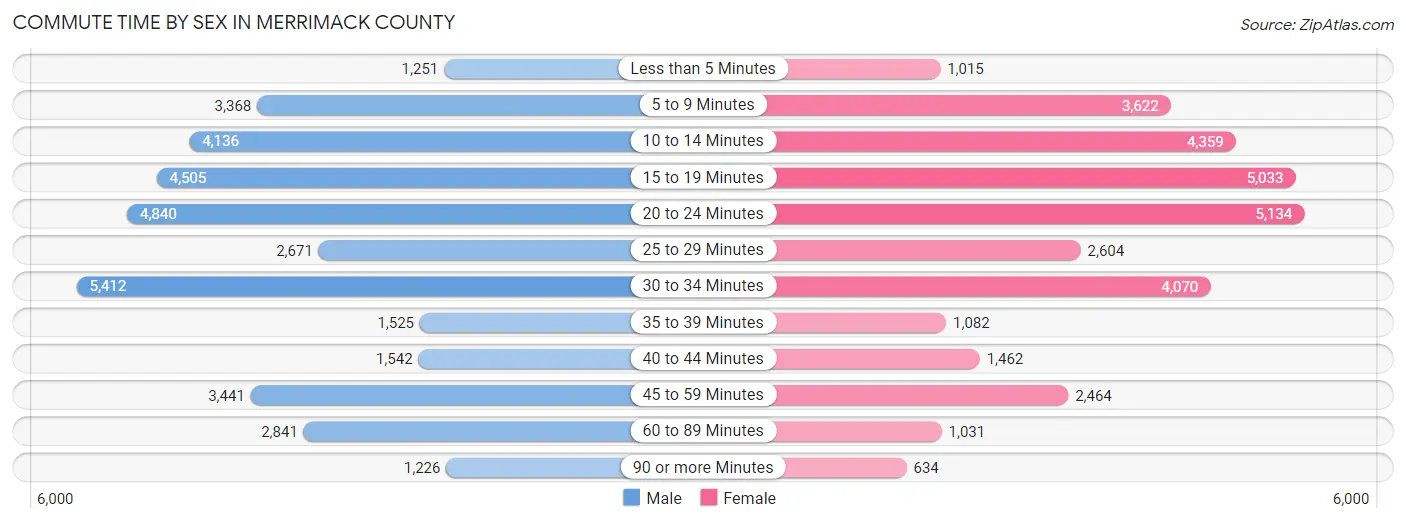
| Commute Time | Male | Female |
| Less than 5 Minutes | 1,251 (3.4%) | 1,015 (3.1%) |
| 5 to 9 Minutes | 3,368 (9.2%) | 3,622 (11.1%) |
| 10 to 14 Minutes | 4,136 (11.3%) | 4,359 (13.4%) |
| 15 to 19 Minutes | 4,505 (12.3%) | 5,033 (15.5%) |
| 20 to 24 Minutes | 4,840 (13.2%) | 5,134 (15.8%) |
| 25 to 29 Minutes | 2,671 (7.3%) | 2,604 (8.0%) |
| 30 to 34 Minutes | 5,412 (14.7%) | 4,070 (12.5%) |
| 35 to 39 Minutes | 1,525 (4.2%) | 1,082 (3.3%) |
| 40 to 44 Minutes | 1,542 (4.2%) | 1,462 (4.5%) |
| 45 to 59 Minutes | 3,441 (9.4%) | 2,464 (7.6%) |
| 60 to 89 Minutes | 2,841 (7.7%) | 1,031 (3.2%) |
| 90 or more Minutes | 1,226 (3.3%) | 634 (1.9%) |
Time of Departure to Work by Sex in Merrimack County
The most frequent times of departure to work in Merrimack County are 7:00 AM to 7:29 AM (5,459, 14.8%) for males and 7:30 AM to 7:59 AM (5,976, 18.4%) for females.
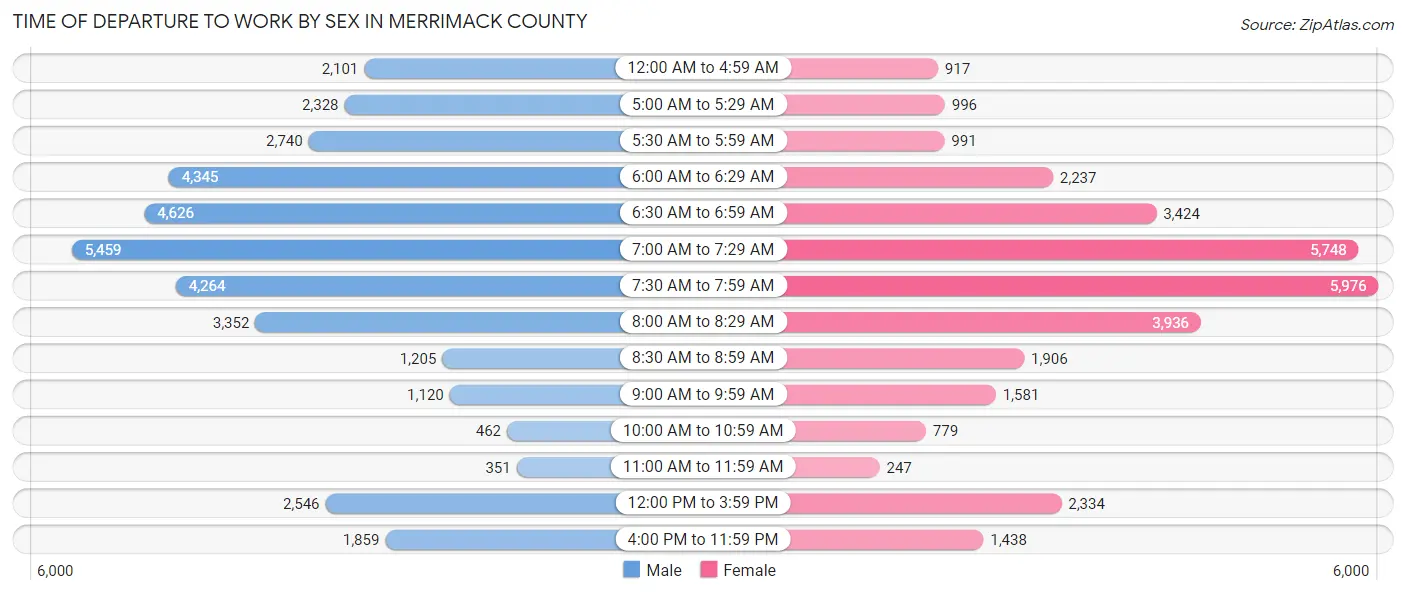
| Time of Departure | Male | Female |
| 12:00 AM to 4:59 AM | 2,101 (5.7%) | 917 (2.8%) |
| 5:00 AM to 5:29 AM | 2,328 (6.3%) | 996 (3.1%) |
| 5:30 AM to 5:59 AM | 2,740 (7.4%) | 991 (3.0%) |
| 6:00 AM to 6:29 AM | 4,345 (11.8%) | 2,237 (6.9%) |
| 6:30 AM to 6:59 AM | 4,626 (12.6%) | 3,424 (10.5%) |
| 7:00 AM to 7:29 AM | 5,459 (14.8%) | 5,748 (17.7%) |
| 7:30 AM to 7:59 AM | 4,264 (11.6%) | 5,976 (18.4%) |
| 8:00 AM to 8:29 AM | 3,352 (9.1%) | 3,936 (12.1%) |
| 8:30 AM to 8:59 AM | 1,205 (3.3%) | 1,906 (5.9%) |
| 9:00 AM to 9:59 AM | 1,120 (3.0%) | 1,581 (4.9%) |
| 10:00 AM to 10:59 AM | 462 (1.3%) | 779 (2.4%) |
| 11:00 AM to 11:59 AM | 351 (0.9%) | 247 (0.8%) |
| 12:00 PM to 3:59 PM | 2,546 (6.9%) | 2,334 (7.2%) |
| 4:00 PM to 11:59 PM | 1,859 (5.1%) | 1,438 (4.4%) |
| Total | 36,758 (100.0%) | 32,510 (100.0%) |
Housing Occupancy in Merrimack County
Occupancy by Ownership in Merrimack County
Of the total 59,851 dwellings in Merrimack County, owner-occupied units account for 44,153 (73.8%), while renter-occupied units make up 15,698 (26.2%).
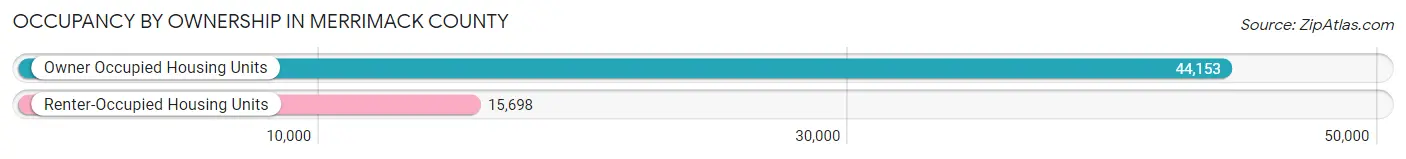
| Occupancy | # Housing Units | % Housing Units |
| Owner Occupied Housing Units | 44,153 | 73.8% |
| Renter-Occupied Housing Units | 15,698 | 26.2% |
| Total Occupied Housing Units | 59,851 | 100.0% |
Occupancy by Household Size in Merrimack County
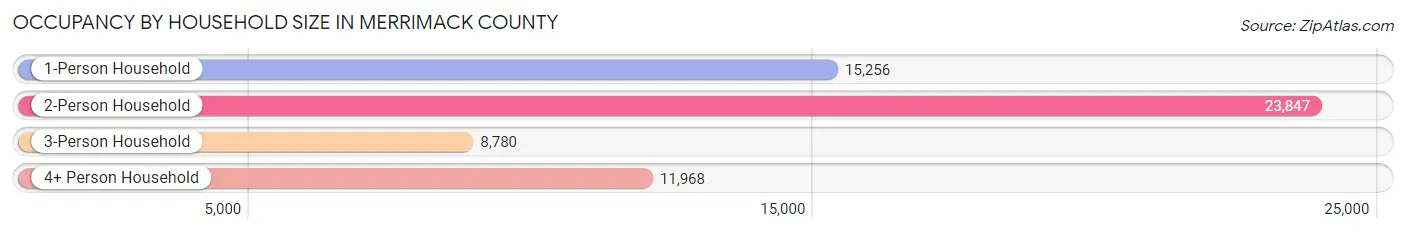
| Household Size | # Housing Units | % Housing Units |
| 1-Person Household | 15,256 | 25.5% |
| 2-Person Household | 23,847 | 39.8% |
| 3-Person Household | 8,780 | 14.7% |
| 4+ Person Household | 11,968 | 20.0% |
| Total Housing Units | 59,851 | 100.0% |
Occupancy by Ownership by Household Size in Merrimack County
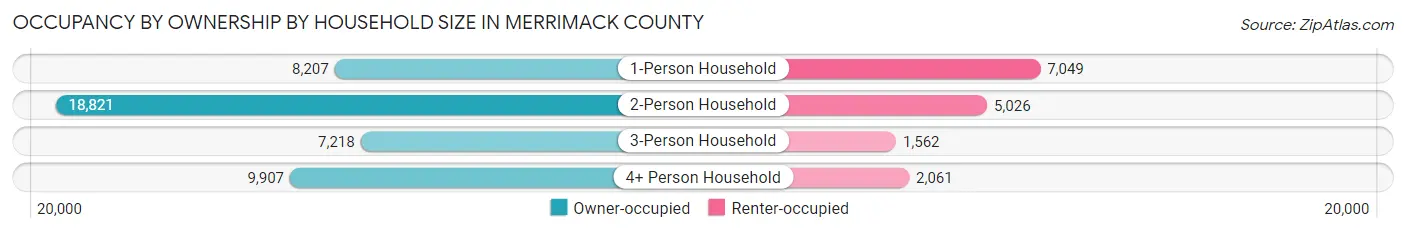
| Household Size | Owner-occupied | Renter-occupied |
| 1-Person Household | 8,207 (53.8%) | 7,049 (46.2%) |
| 2-Person Household | 18,821 (78.9%) | 5,026 (21.1%) |
| 3-Person Household | 7,218 (82.2%) | 1,562 (17.8%) |
| 4+ Person Household | 9,907 (82.8%) | 2,061 (17.2%) |
| Total Housing Units | 44,153 (73.8%) | 15,698 (26.2%) |
Occupancy by Educational Attainment in Merrimack County
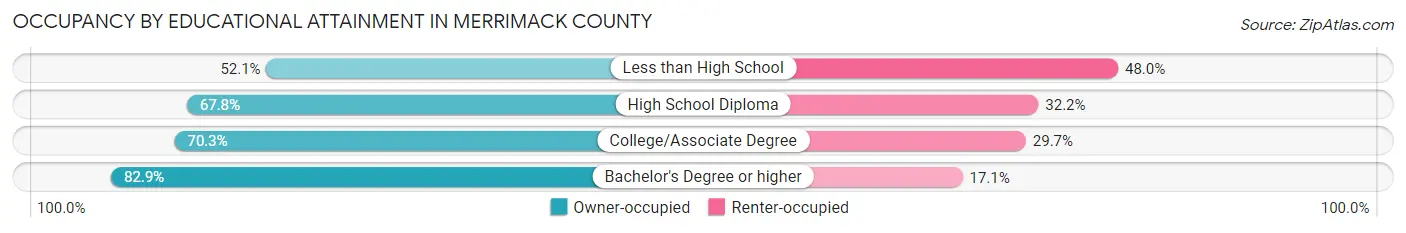
| Household Size | Owner-occupied | Renter-occupied |
| Less than High School | 1,635 (52.0%) | 1,506 (47.9%) |
| High School Diploma | 10,015 (67.8%) | 4,747 (32.2%) |
| College/Associate Degree | 12,663 (70.3%) | 5,345 (29.7%) |
| Bachelor's Degree or higher | 19,840 (82.9%) | 4,100 (17.1%) |
Occupancy by Age of Householder in Merrimack County
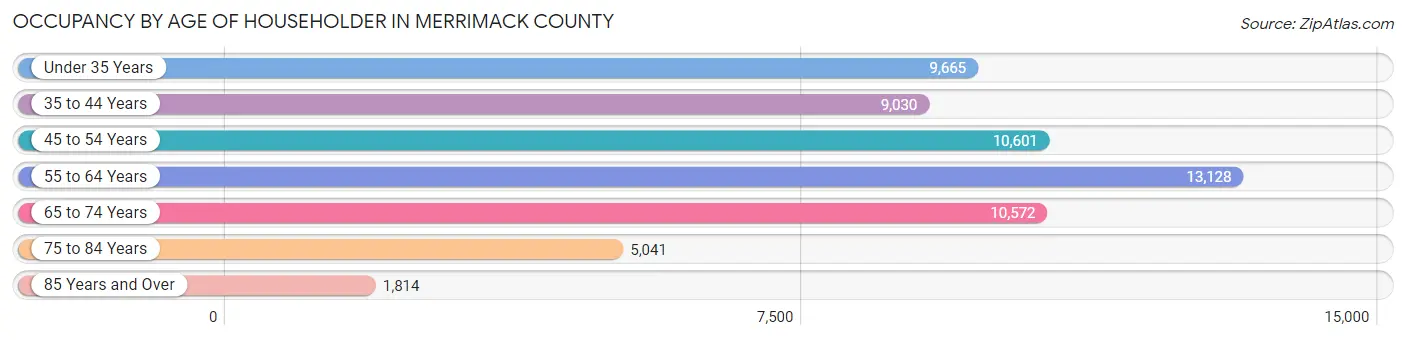
| Age Bracket | # Households | % Households |
| Under 35 Years | 9,665 | 16.2% |
| 35 to 44 Years | 9,030 | 15.1% |
| 45 to 54 Years | 10,601 | 17.7% |
| 55 to 64 Years | 13,128 | 21.9% |
| 65 to 74 Years | 10,572 | 17.7% |
| 75 to 84 Years | 5,041 | 8.4% |
| 85 Years and Over | 1,814 | 3.0% |
| Total | 59,851 | 100.0% |
Housing Finances in Merrimack County
Median Income by Occupancy in Merrimack County
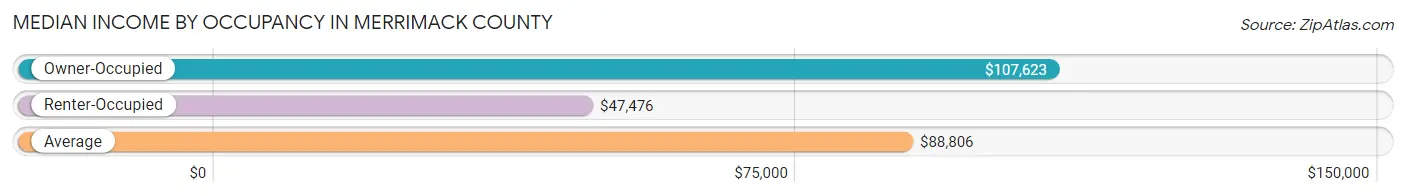
| Occupancy Type | # Households | Median Income |
| Owner-Occupied | 44,153 (73.8%) | $107,623 |
| Renter-Occupied | 15,698 (26.2%) | $47,476 |
| Average | 59,851 (100.0%) | $88,806 |
Occupancy by Householder Income Bracket in Merrimack County
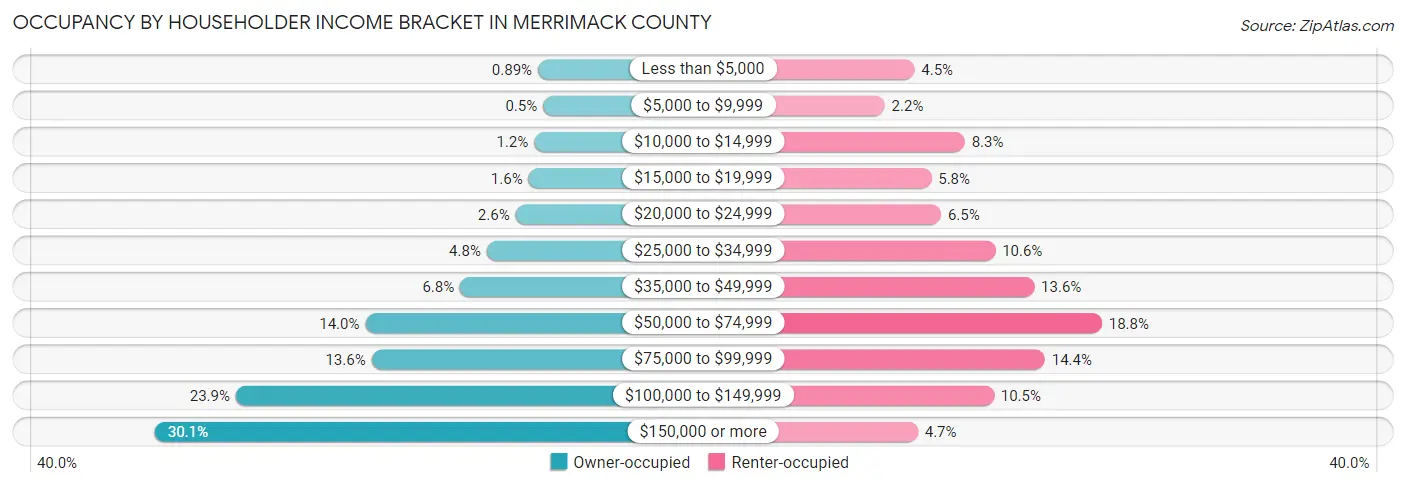
| Income Bracket | Owner-occupied | Renter-occupied |
| Less than $5,000 | 395 (0.9%) | 704 (4.5%) |
| $5,000 to $9,999 | 221 (0.5%) | 349 (2.2%) |
| $10,000 to $14,999 | 522 (1.2%) | 1,306 (8.3%) |
| $15,000 to $19,999 | 709 (1.6%) | 905 (5.8%) |
| $20,000 to $24,999 | 1,147 (2.6%) | 1,022 (6.5%) |
| $25,000 to $34,999 | 2,113 (4.8%) | 1,671 (10.6%) |
| $35,000 to $49,999 | 3,013 (6.8%) | 2,136 (13.6%) |
| $50,000 to $74,999 | 6,200 (14.0%) | 2,945 (18.8%) |
| $75,000 to $99,999 | 5,993 (13.6%) | 2,263 (14.4%) |
| $100,000 to $149,999 | 10,559 (23.9%) | 1,653 (10.5%) |
| $150,000 or more | 13,281 (30.1%) | 744 (4.7%) |
| Total | 44,153 (100.0%) | 15,698 (100.0%) |
Monthly Housing Cost Tiers in Merrimack County
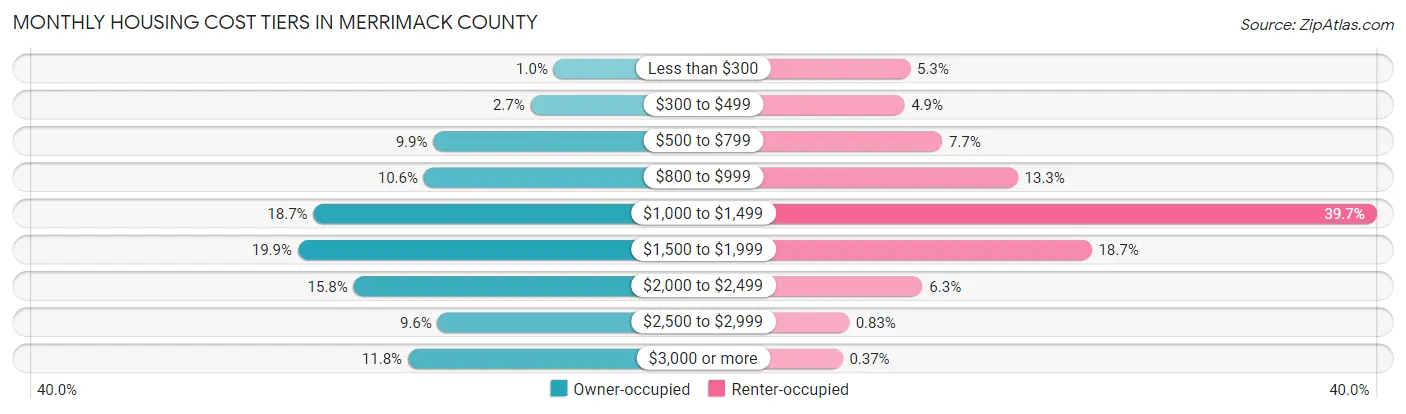
| Monthly Cost | Owner-occupied | Renter-occupied |
| Less than $300 | 456 (1.0%) | 839 (5.3%) |
| $300 to $499 | 1,208 (2.7%) | 772 (4.9%) |
| $500 to $799 | 4,371 (9.9%) | 1,208 (7.7%) |
| $800 to $999 | 4,680 (10.6%) | 2,083 (13.3%) |
| $1,000 to $1,499 | 8,269 (18.7%) | 6,232 (39.7%) |
| $1,500 to $1,999 | 8,776 (19.9%) | 2,937 (18.7%) |
| $2,000 to $2,499 | 6,963 (15.8%) | 982 (6.3%) |
| $2,500 to $2,999 | 4,232 (9.6%) | 130 (0.8%) |
| $3,000 or more | 5,198 (11.8%) | 58 (0.4%) |
| Total | 44,153 (100.0%) | 15,698 (100.0%) |
Physical Housing Characteristics in Merrimack County
Housing Structures in Merrimack County
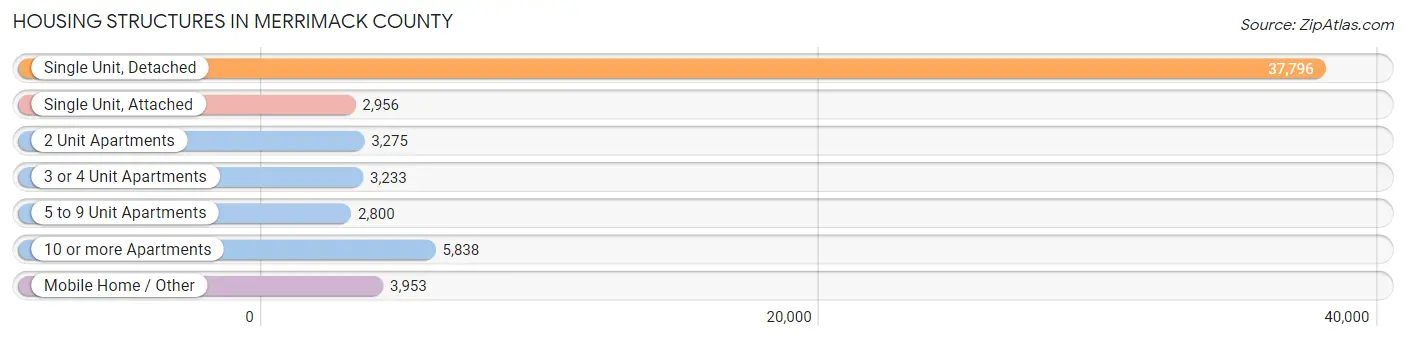
| Structure Type | # Housing Units | % Housing Units |
| Single Unit, Detached | 37,796 | 63.1% |
| Single Unit, Attached | 2,956 | 4.9% |
| 2 Unit Apartments | 3,275 | 5.5% |
| 3 or 4 Unit Apartments | 3,233 | 5.4% |
| 5 to 9 Unit Apartments | 2,800 | 4.7% |
| 10 or more Apartments | 5,838 | 9.8% |
| Mobile Home / Other | 3,953 | 6.6% |
| Total | 59,851 | 100.0% |
Housing Structures by Occupancy in Merrimack County
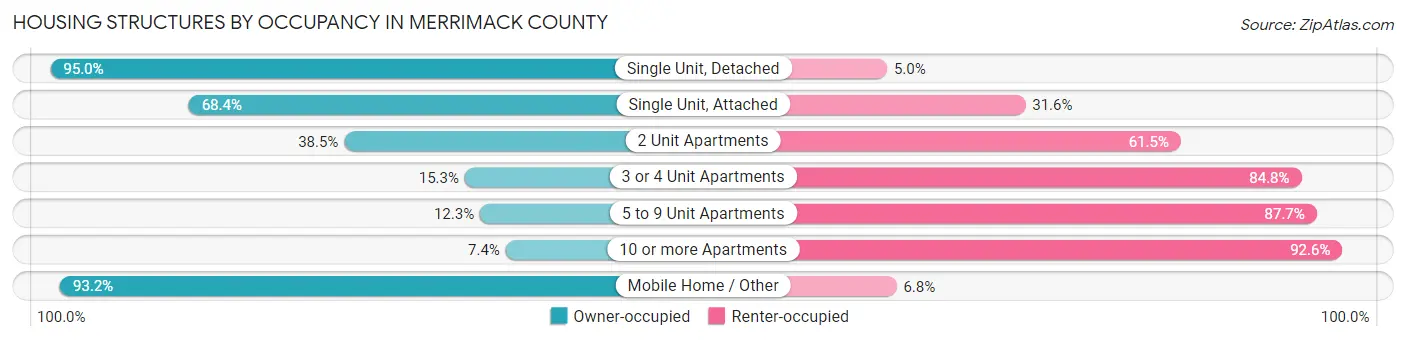
| Structure Type | Owner-occupied | Renter-occupied |
| Single Unit, Detached | 35,918 (95.0%) | 1,878 (5.0%) |
| Single Unit, Attached | 2,022 (68.4%) | 934 (31.6%) |
| 2 Unit Apartments | 1,260 (38.5%) | 2,015 (61.5%) |
| 3 or 4 Unit Apartments | 493 (15.2%) | 2,740 (84.8%) |
| 5 to 9 Unit Apartments | 345 (12.3%) | 2,455 (87.7%) |
| 10 or more Apartments | 431 (7.4%) | 5,407 (92.6%) |
| Mobile Home / Other | 3,684 (93.2%) | 269 (6.8%) |
| Total | 44,153 (73.8%) | 15,698 (26.2%) |
Housing Structures by Number of Rooms in Merrimack County
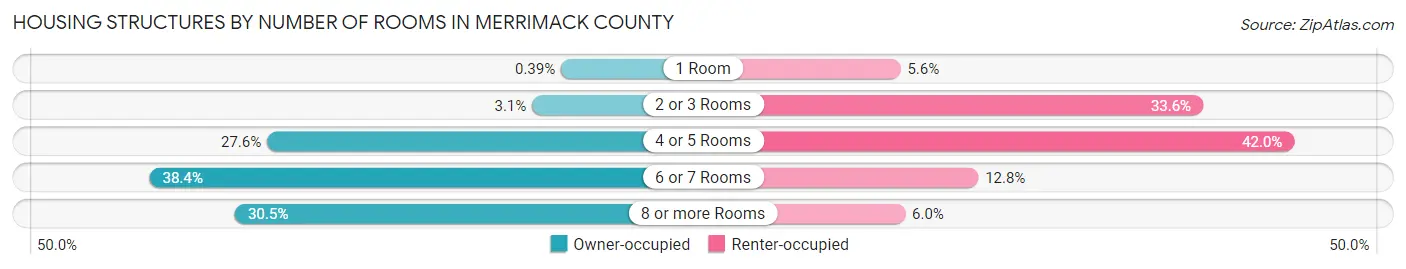
| Number of Rooms | Owner-occupied | Renter-occupied |
| 1 Room | 170 (0.4%) | 879 (5.6%) |
| 2 or 3 Rooms | 1,350 (3.1%) | 5,270 (33.6%) |
| 4 or 5 Rooms | 12,177 (27.6%) | 6,594 (42.0%) |
| 6 or 7 Rooms | 16,971 (38.4%) | 2,008 (12.8%) |
| 8 or more Rooms | 13,485 (30.5%) | 947 (6.0%) |
| Total | 44,153 (100.0%) | 15,698 (100.0%) |
Housing Structure by Heating Type in Merrimack County
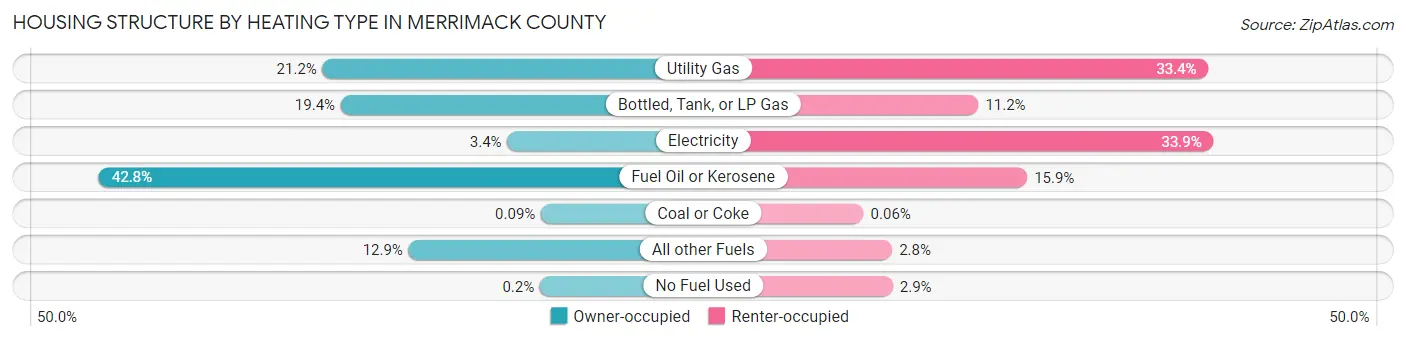
| Heating Type | Owner-occupied | Renter-occupied |
| Utility Gas | 9,361 (21.2%) | 5,238 (33.4%) |
| Bottled, Tank, or LP Gas | 8,585 (19.4%) | 1,750 (11.2%) |
| Electricity | 1,481 (3.4%) | 5,316 (33.9%) |
| Fuel Oil or Kerosene | 18,908 (42.8%) | 2,490 (15.9%) |
| Coal or Coke | 38 (0.1%) | 10 (0.1%) |
| All other Fuels | 5,692 (12.9%) | 442 (2.8%) |
| No Fuel Used | 88 (0.2%) | 452 (2.9%) |
| Total | 44,153 (100.0%) | 15,698 (100.0%) |
Household Vehicle Usage in Merrimack County
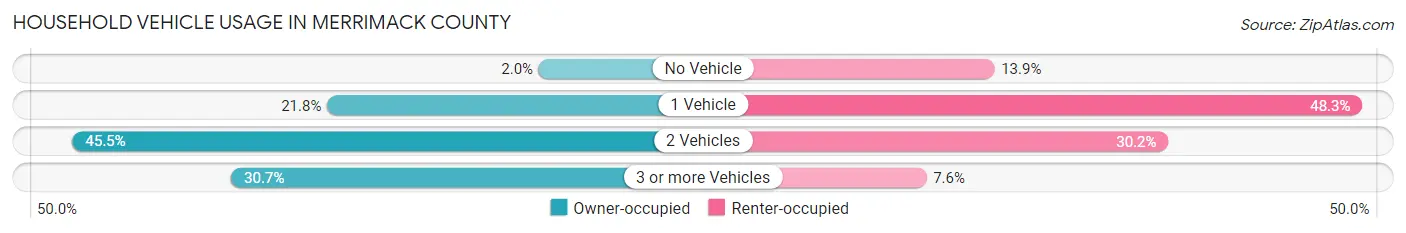
| Vehicles per Household | Owner-occupied | Renter-occupied |
| No Vehicle | 878 (2.0%) | 2,188 (13.9%) |
| 1 Vehicle | 9,605 (21.7%) | 7,580 (48.3%) |
| 2 Vehicles | 20,108 (45.5%) | 4,739 (30.2%) |
| 3 or more Vehicles | 13,562 (30.7%) | 1,191 (7.6%) |
| Total | 44,153 (100.0%) | 15,698 (100.0%) |
Real Estate & Mortgages in Merrimack County
Real Estate and Mortgage Overview in Merrimack County
| Characteristic | Without Mortgage | With Mortgage |
| Housing Units | 16,055 | 28,098 |
| Median Property Value | $269,500 | $313,500 |
| Median Household Income | $72,472 | $10,199 |
| Monthly Housing Costs | $920 | $5,179 |
| Real Estate Taxes | $5,751 | $213 |
Property Value by Mortgage Status in Merrimack County
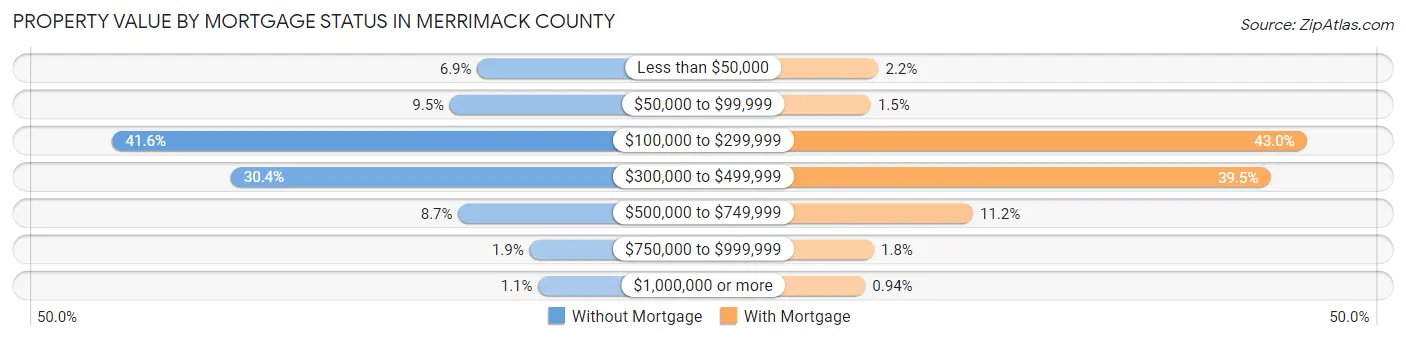
| Property Value | Without Mortgage | With Mortgage |
| Less than $50,000 | 1,105 (6.9%) | 616 (2.2%) |
| $50,000 to $99,999 | 1,523 (9.5%) | 413 (1.5%) |
| $100,000 to $299,999 | 6,681 (41.6%) | 12,068 (42.9%) |
| $300,000 to $499,999 | 4,873 (30.3%) | 11,097 (39.5%) |
| $500,000 to $749,999 | 1,395 (8.7%) | 3,143 (11.2%) |
| $750,000 to $999,999 | 306 (1.9%) | 498 (1.8%) |
| $1,000,000 or more | 172 (1.1%) | 263 (0.9%) |
| Total | 16,055 (100.0%) | 28,098 (100.0%) |
Household Income by Mortgage Status in Merrimack County
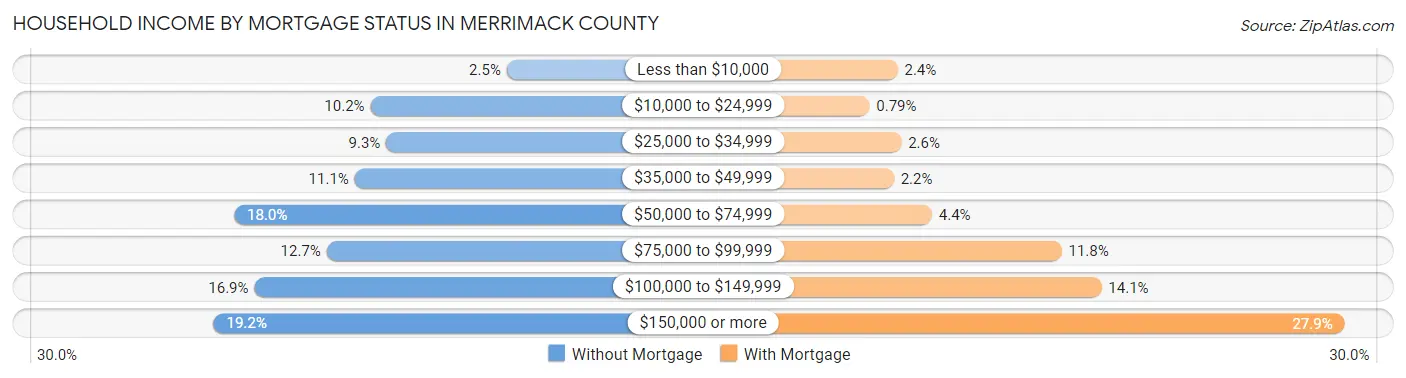
| Household Income | Without Mortgage | With Mortgage |
| Less than $10,000 | 393 (2.5%) | 673 (2.4%) |
| $10,000 to $24,999 | 1,644 (10.2%) | 223 (0.8%) |
| $25,000 to $34,999 | 1,500 (9.3%) | 734 (2.6%) |
| $35,000 to $49,999 | 1,789 (11.1%) | 613 (2.2%) |
| $50,000 to $74,999 | 2,894 (18.0%) | 1,224 (4.4%) |
| $75,000 to $99,999 | 2,045 (12.7%) | 3,306 (11.8%) |
| $100,000 to $149,999 | 2,708 (16.9%) | 3,948 (14.1%) |
| $150,000 or more | 3,082 (19.2%) | 7,851 (27.9%) |
| Total | 16,055 (100.0%) | 28,098 (100.0%) |
Property Value to Household Income Ratio in Merrimack County
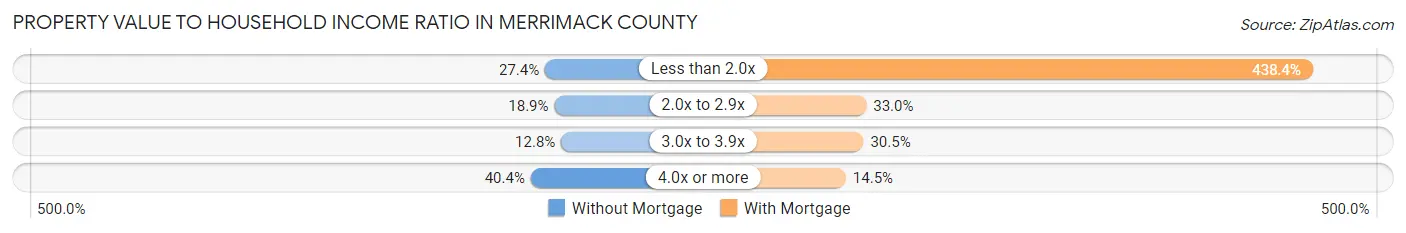
| Value-to-Income Ratio | Without Mortgage | With Mortgage |
| Less than 2.0x | 4,394 (27.4%) | 123,188 (438.4%) |
| 2.0x to 2.9x | 3,040 (18.9%) | 9,271 (33.0%) |
| 3.0x to 3.9x | 2,052 (12.8%) | 8,571 (30.5%) |
| 4.0x or more | 6,488 (40.4%) | 4,076 (14.5%) |
| Total | 16,055 (100.0%) | 28,098 (100.0%) |
Real Estate Taxes by Mortgage Status in Merrimack County
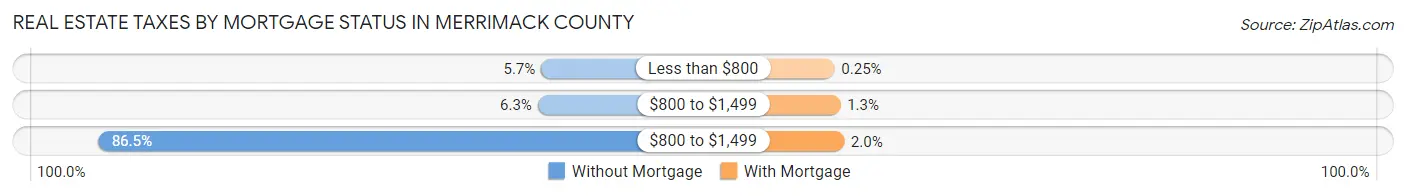
| Property Taxes | Without Mortgage | With Mortgage |
| Less than $800 | 909 (5.7%) | 71 (0.3%) |
| $800 to $1,499 | 1,009 (6.3%) | 369 (1.3%) |
| $800 to $1,499 | 13,879 (86.5%) | 556 (2.0%) |
| Total | 16,055 (100.0%) | 28,098 (100.0%) |
Health & Disability in Merrimack County
Health Insurance Coverage by Age in Merrimack County
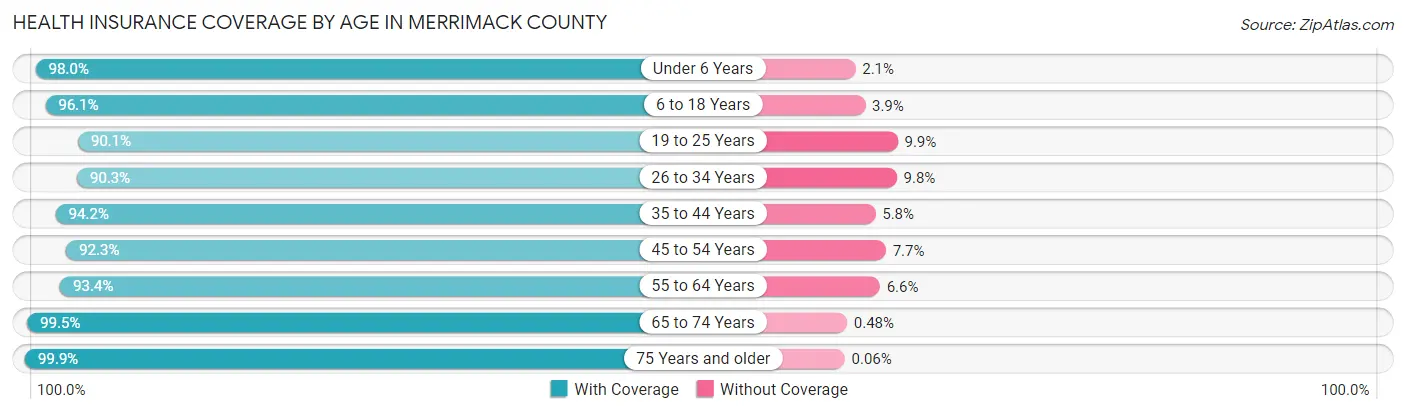
| Age Bracket | With Coverage | Without Coverage |
| Under 6 Years | 8,298 (98.0%) | 174 (2.1%) |
| 6 to 18 Years | 21,697 (96.1%) | 874 (3.9%) |
| 19 to 25 Years | 12,052 (90.1%) | 1,328 (9.9%) |
| 26 to 34 Years | 15,554 (90.2%) | 1,680 (9.8%) |
| 35 to 44 Years | 17,007 (94.2%) | 1,043 (5.8%) |
| 45 to 54 Years | 18,192 (92.3%) | 1,525 (7.7%) |
| 55 to 64 Years | 21,662 (93.4%) | 1,534 (6.6%) |
| 65 to 74 Years | 17,390 (99.5%) | 84 (0.5%) |
| 75 Years and older | 10,387 (99.9%) | 6 (0.1%) |
| Total | 142,239 (94.5%) | 8,248 (5.5%) |
Health Insurance Coverage by Citizenship Status in Merrimack County
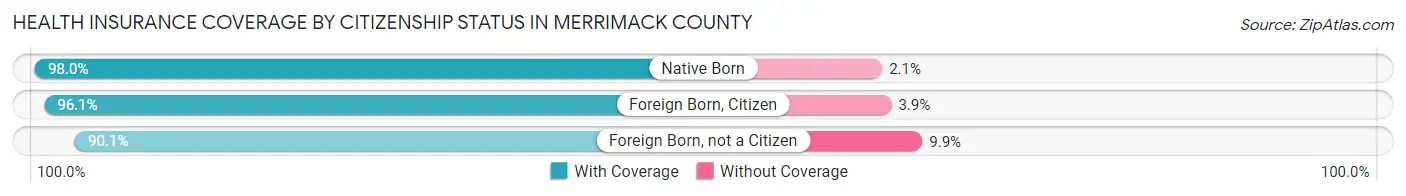
| Citizenship Status | With Coverage | Without Coverage |
| Native Born | 8,298 (98.0%) | 174 (2.1%) |
| Foreign Born, Citizen | 21,697 (96.1%) | 874 (3.9%) |
| Foreign Born, not a Citizen | 12,052 (90.1%) | 1,328 (9.9%) |
Health Insurance Coverage by Household Income in Merrimack County
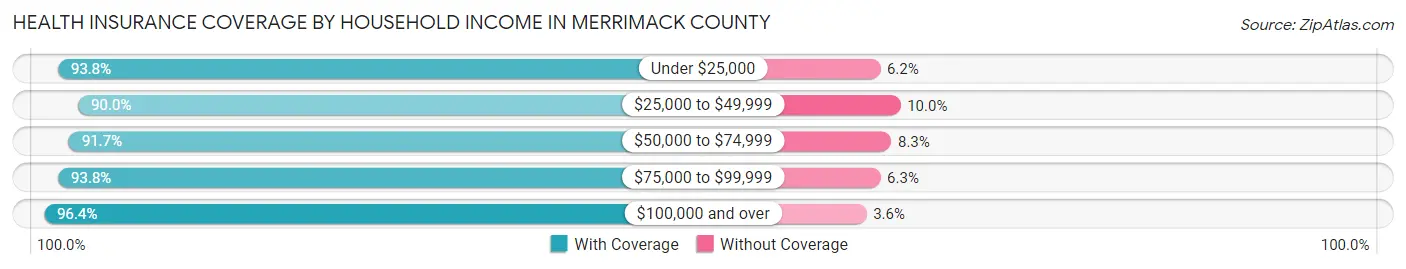
| Household Income | With Coverage | Without Coverage |
| Under $25,000 | 10,021 (93.8%) | 665 (6.2%) |
| $25,000 to $49,999 | 13,853 (90.0%) | 1,541 (10.0%) |
| $50,000 to $74,999 | 17,794 (91.7%) | 1,609 (8.3%) |
| $75,000 to $99,999 | 19,251 (93.8%) | 1,283 (6.2%) |
| $100,000 and over | 78,222 (96.4%) | 2,959 (3.6%) |
Public vs Private Health Insurance Coverage by Age in Merrimack County
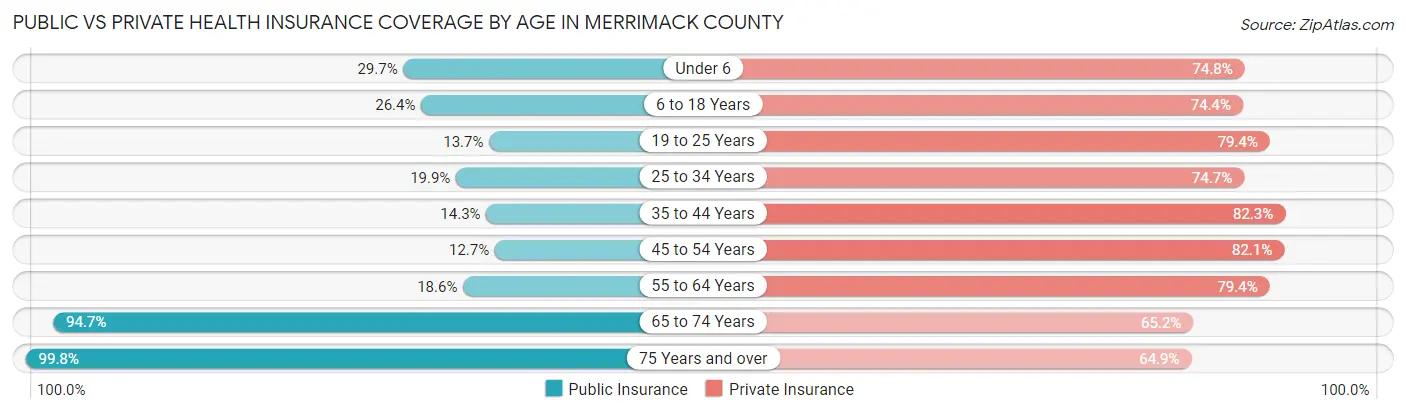
| Age Bracket | Public Insurance | Private Insurance |
| Under 6 | 2,514 (29.7%) | 6,334 (74.8%) |
| 6 to 18 Years | 5,950 (26.4%) | 16,802 (74.4%) |
| 19 to 25 Years | 1,838 (13.7%) | 10,628 (79.4%) |
| 25 to 34 Years | 3,427 (19.9%) | 12,869 (74.7%) |
| 35 to 44 Years | 2,577 (14.3%) | 14,849 (82.3%) |
| 45 to 54 Years | 2,500 (12.7%) | 16,184 (82.1%) |
| 55 to 64 Years | 4,309 (18.6%) | 18,412 (79.4%) |
| 65 to 74 Years | 16,552 (94.7%) | 11,395 (65.2%) |
| 75 Years and over | 10,373 (99.8%) | 6,743 (64.9%) |
| Total | 50,040 (33.3%) | 114,216 (75.9%) |
Disability Status by Sex by Age in Merrimack County
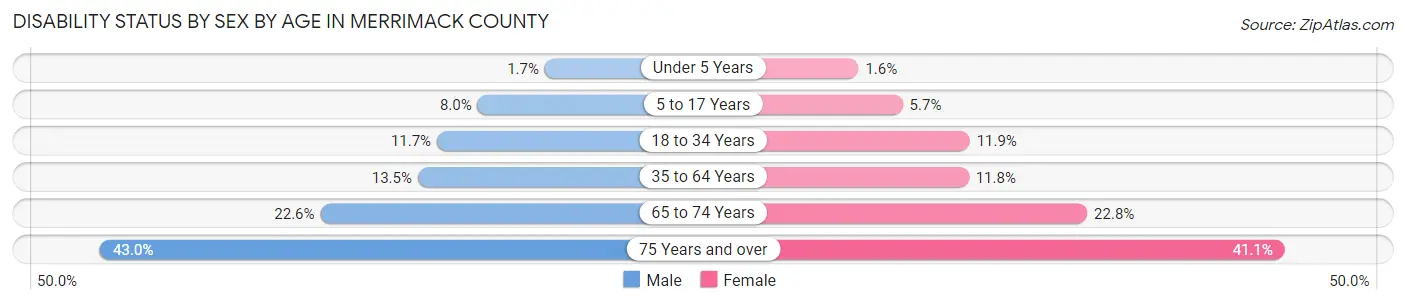
| Age Bracket | Male | Female |
| Under 5 Years | 61 (1.7%) | 53 (1.5%) |
| 5 to 17 Years | 873 (8.0%) | 602 (5.7%) |
| 18 to 34 Years | 1,987 (11.7%) | 1,916 (11.9%) |
| 35 to 64 Years | 4,081 (13.5%) | 3,624 (11.8%) |
| 65 to 74 Years | 1,861 (22.6%) | 2,099 (22.8%) |
| 75 Years and over | 1,922 (43.0%) | 2,435 (41.1%) |
Disability Class by Sex by Age in Merrimack County
Disability Class: Hearing Difficulty
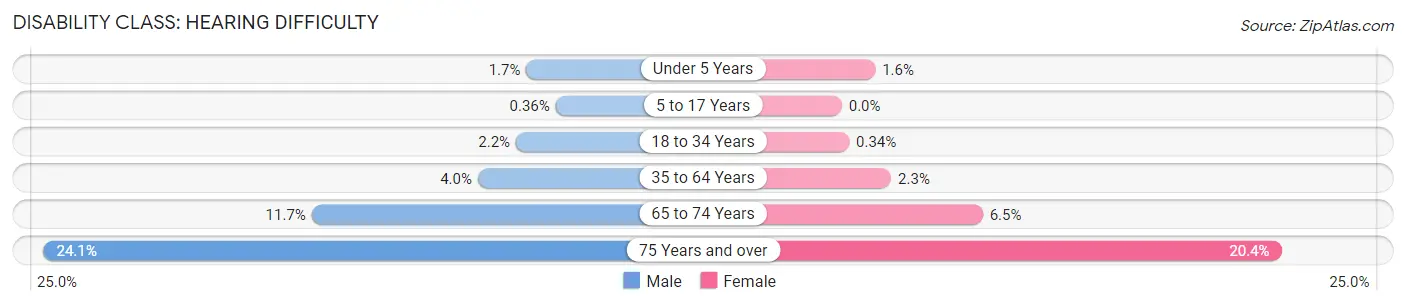
| Age Bracket | Male | Female |
| Under 5 Years | 61 (1.7%) | 53 (1.5%) |
| 5 to 17 Years | 39 (0.4%) | 0 (0.0%) |
| 18 to 34 Years | 372 (2.2%) | 55 (0.3%) |
| 35 to 64 Years | 1,198 (4.0%) | 703 (2.3%) |
| 65 to 74 Years | 964 (11.7%) | 603 (6.5%) |
| 75 Years and over | 1,078 (24.1%) | 1,208 (20.4%) |
Disability Class: Vision Difficulty
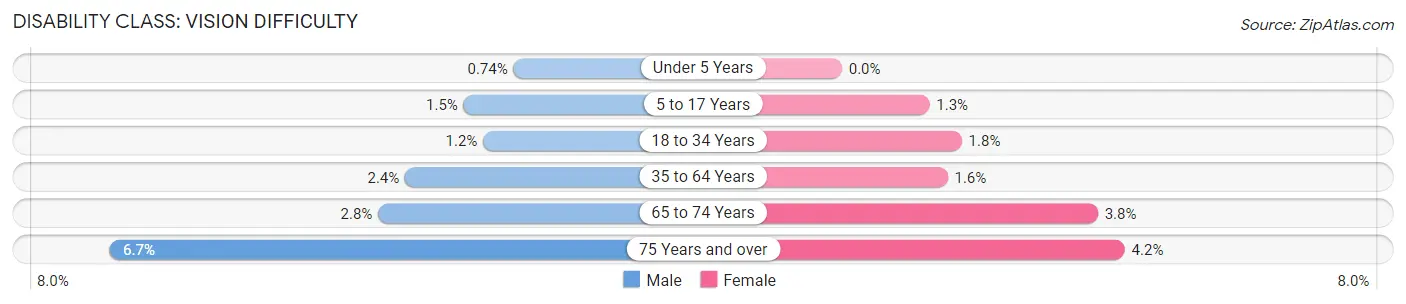
| Age Bracket | Male | Female |
| Under 5 Years | 26 (0.7%) | 0 (0.0%) |
| 5 to 17 Years | 162 (1.5%) | 139 (1.3%) |
| 18 to 34 Years | 201 (1.2%) | 287 (1.8%) |
| 35 to 64 Years | 711 (2.4%) | 482 (1.6%) |
| 65 to 74 Years | 227 (2.8%) | 350 (3.8%) |
| 75 Years and over | 301 (6.7%) | 249 (4.2%) |
Disability Class: Cognitive Difficulty
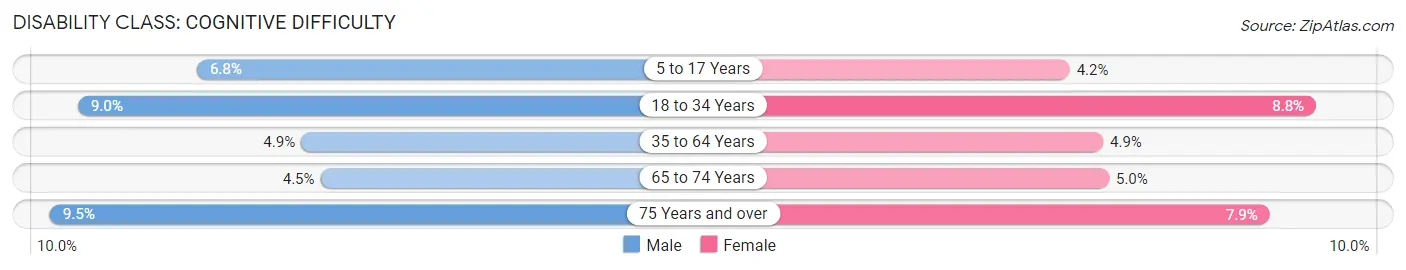
| Age Bracket | Male | Female |
| 5 to 17 Years | 746 (6.8%) | 451 (4.2%) |
| 18 to 34 Years | 1,526 (9.0%) | 1,421 (8.8%) |
| 35 to 64 Years | 1,470 (4.9%) | 1,491 (4.9%) |
| 65 to 74 Years | 372 (4.5%) | 457 (5.0%) |
| 75 Years and over | 426 (9.5%) | 470 (7.9%) |
Disability Class: Ambulatory Difficulty
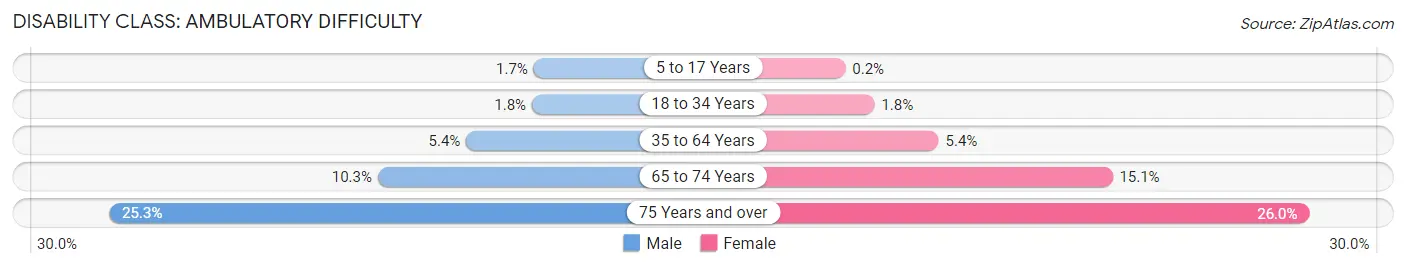
| Age Bracket | Male | Female |
| 5 to 17 Years | 181 (1.7%) | 21 (0.2%) |
| 18 to 34 Years | 296 (1.8%) | 293 (1.8%) |
| 35 to 64 Years | 1,635 (5.4%) | 1,657 (5.4%) |
| 65 to 74 Years | 853 (10.3%) | 1,389 (15.1%) |
| 75 Years and over | 1,131 (25.3%) | 1,542 (26.0%) |
Disability Class: Self-Care Difficulty
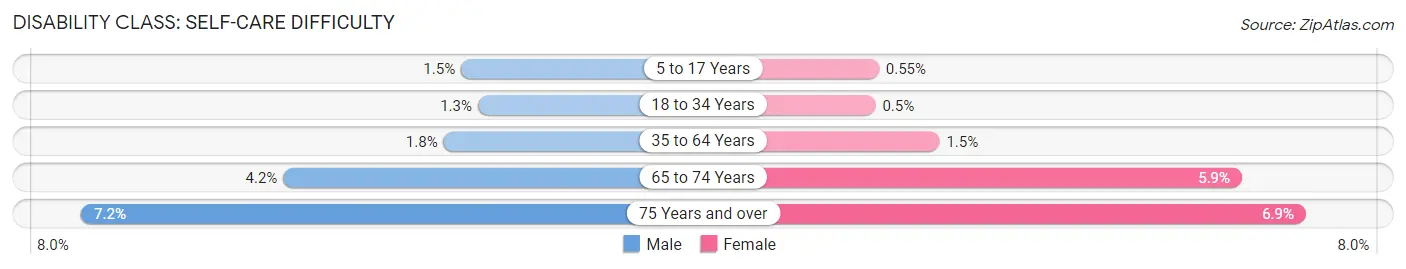
| Age Bracket | Male | Female |
| 5 to 17 Years | 167 (1.5%) | 59 (0.5%) |
| 18 to 34 Years | 215 (1.3%) | 80 (0.5%) |
| 35 to 64 Years | 538 (1.8%) | 446 (1.5%) |
| 65 to 74 Years | 343 (4.2%) | 548 (5.9%) |
| 75 Years and over | 320 (7.2%) | 408 (6.9%) |
Technology Access in Merrimack County
Computing Device Access in Merrimack County
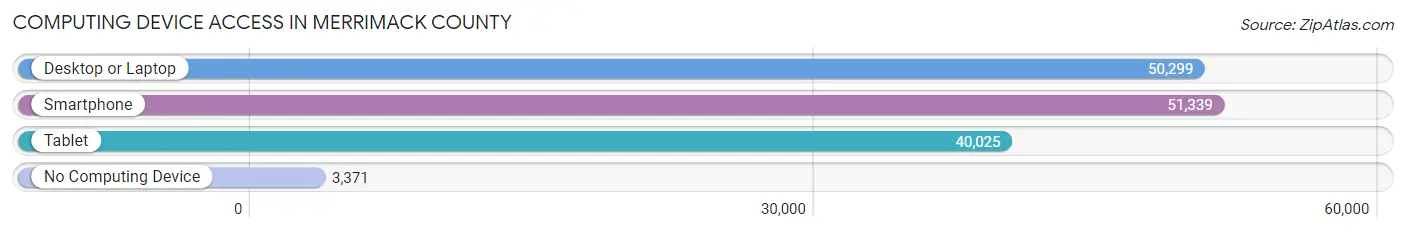
| Device Type | # Households | % Households |
| Desktop or Laptop | 50,299 | 84.0% |
| Smartphone | 51,339 | 85.8% |
| Tablet | 40,025 | 66.9% |
| No Computing Device | 3,371 | 5.6% |
| Total | 59,851 | 100.0% |
Internet Access in Merrimack County
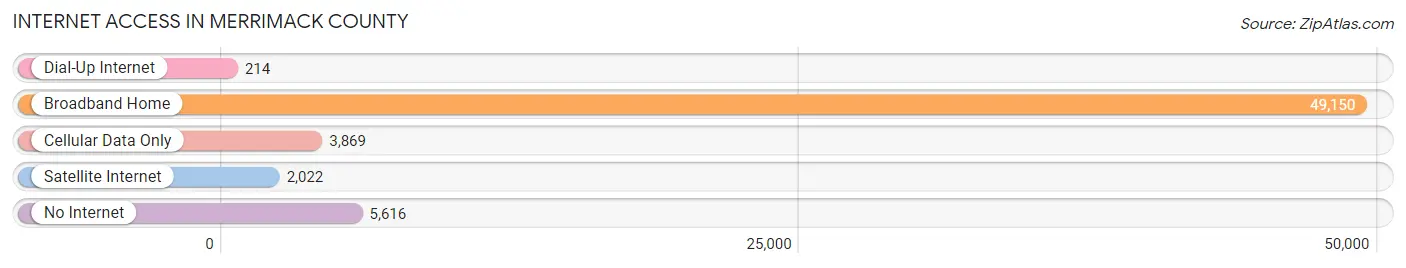
| Internet Type | # Households | % Households |
| Dial-Up Internet | 214 | 0.4% |
| Broadband Home | 49,150 | 82.1% |
| Cellular Data Only | 3,869 | 6.5% |
| Satellite Internet | 2,022 | 3.4% |
| No Internet | 5,616 | 9.4% |
| Total | 59,851 | 100.0% |
Merrimack County Summary
Merrimack County is located in the state of New Hampshire in the United States. It is the second most populous county in the state, with an estimated population of 146,761 in 2019. The county seat is Concord, the state capital. Merrimack County is bordered by Hillsborough County to the north, Rockingham County to the east, Belknap County to the south, and Sullivan County to the west.
History
Merrimack County was created in 1823 from parts of Hillsborough and Rockingham counties. It was named after the Merrimack River, which runs through the county. The river was named after the Merrimack tribe, a Native American tribe that lived in the area.
The county was originally home to several Native American tribes, including the Pennacook, Abenaki, and Sokoki. The first European settlers arrived in the area in the late 1600s. The county was an important agricultural and industrial center during the 19th century. The county was also home to several prominent abolitionists, including Amos Tuck and William Lloyd Garrison.
Geography
Merrimack County covers an area of 845 square miles. It is located in the southeastern part of the state, and is bordered by Hillsborough County to the north, Rockingham County to the east, Belknap County to the south, and Sullivan County to the west. The county is mostly rural, with the majority of the population living in the cities of Concord and Franklin.
The county is home to several rivers, including the Merrimack, Contoocook, and Soucook rivers. The highest point in the county is Mount Kearsarge, which has an elevation of 2,937 feet. The county also contains several state parks, including Bear Brook State Park, Pawtuckaway State Park, and White Lake State Park.
Economy
The economy of Merrimack County is largely based on manufacturing, healthcare, and retail. The county is home to several large companies, including BAE Systems, St. Mary's Bank, and the New Hampshire Motor Speedway. The county is also home to several hospitals, including Concord Hospital and Franklin Regional Hospital.
The county has a strong agricultural sector, with dairy, poultry, and apple farming being the main industries. The county is also home to several wineries and breweries, including the White Mountain Winery and the Concord Craft Brewing Company.
Demographics
As of the 2019 census, Merrimack County had an estimated population of 146,761. The population is mostly white (93.3%), with small percentages of African American (2.2%), Asian (1.7%), and Hispanic or Latino (2.2%) residents. The median household income is $68,845, and the median age is 40.
Merrimack County is home to several colleges and universities, including the University of New Hampshire, Franklin Pierce University, and New England College. The county is also home to several museums, including the McAuliffe-Shepard Discovery Center and the New Hampshire Historical Society.
Common Questions
What is Per Capita Income in Merrimack County?
Per Capita income in Merrimack County is $44,391.
What is the Median Family Income in Merrimack County?
Median Family Income in Merrimack County is $110,587.
What is the Median Household income in Merrimack County?
Median Household Income in Merrimack County is $88,806.
What is Income or Wage Gap in Merrimack County?
Income or Wage Gap in Merrimack County is 26.2%.
Women in Merrimack County earn 73.8 cents for every dollar earned by a man.
What is Family Income Deficit in Merrimack County?
Family Income Deficit in Merrimack County is $11,049.
Families that are below poverty line in Merrimack County earn $11,049 less on average than the poverty threshold level.
What is Inequality or Gini Index in Merrimack County?
Inequality or Gini Index in Merrimack County is 0.44.
What is the Total Population of Merrimack County?
Total Population of Merrimack County is 153,918.
What is the Total Male Population of Merrimack County?
Total Male Population of Merrimack County is 76,723.
What is the Total Female Population of Merrimack County?
Total Female Population of Merrimack County is 77,195.
What is the Ratio of Males per 100 Females in Merrimack County?
There are 99.39 Males per 100 Females in Merrimack County.
What is the Ratio of Females per 100 Males in Merrimack County?
There are 100.62 Females per 100 Males in Merrimack County.
What is the Median Population Age in Merrimack County?
Median Population Age in Merrimack County is 42.8 Years.
What is the Average Family Size in Merrimack County
Average Family Size in Merrimack County is 2.9 People.
What is the Average Household Size in Merrimack County
Average Household Size in Merrimack County is 2.5 People.
How Large is the Labor Force in Merrimack County?
There are 83,735 People in the Labor Forcein in Merrimack County.
What is the Percentage of People in the Labor Force in Merrimack County?
64.9% of People are in the Labor Force in Merrimack County.
What is the Unemployment Rate in Merrimack County?
Unemployment Rate in Merrimack County is 3.6%.