Hooksett, NH Map & Demographics
Hooksett Map
Hooksett Overview
$45,096
PER CAPITA INCOME
$91,343
AVG FAMILY INCOME
$83,456
AVG HOUSEHOLD INCOME
9.5%
WAGE / INCOME GAP [ % ]
90.5¢/ $1
WAGE / INCOME GAP [ $ ]
0.41
INEQUALITY / GINI INDEX
5,268
TOTAL POPULATION
2,553
MALE POPULATION
2,715
FEMALE POPULATION
94.03
MALES / 100 FEMALES
106.35
FEMALES / 100 MALES
42.0
MEDIAN AGE
2.7
AVG FAMILY SIZE
2.4
AVG HOUSEHOLD SIZE
3,108
LABOR FORCE [ PEOPLE ]
68.0%
PERCENT IN LABOR FORCE
4.3%
UNEMPLOYMENT RATE
Hooksett Zip Codes
Hooksett Area Codes
Income in Hooksett
Income Overview in Hooksett
Per Capita Income in Hooksett is $45,096, while median incomes of families and households are $91,343 and $83,456 respectively.
| Characteristic | Number | Measure |
| Per Capita Income | 5,268 | $45,096 |
| Median Family Income | 1,425 | $91,343 |
| Mean Family Income | 1,425 | $122,095 |
| Median Household Income | 2,221 | $83,456 |
| Mean Household Income | 2,221 | $104,857 |
| Income Deficit | 1,425 | $0 |
| Wage / Income Gap (%) | 5,268 | 9.54% |
| Wage / Income Gap ($) | 5,268 | 90.46¢ per $1 |
| Gini / Inequality Index | 5,268 | 0.41 |
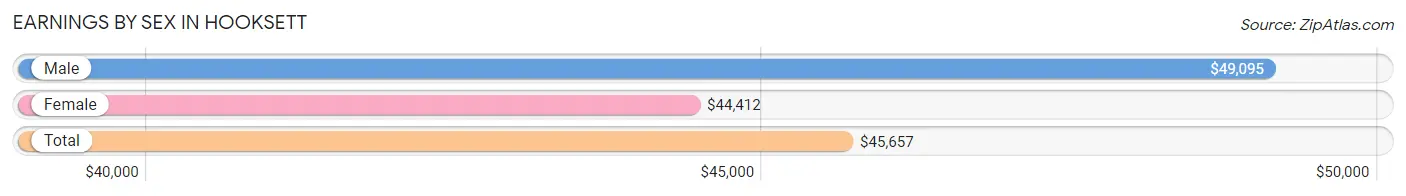
Earnings by Sex in Hooksett
Average Earnings in Hooksett are $45,657, $49,095 for men and $44,412 for women, a difference of 9.5%.
| Sex | Number | Average Earnings |
| Male | 1,661 (50.6%) | $49,095 |
| Female | 1,620 (49.4%) | $44,412 |
| Total | 3,281 (100.0%) | $45,657 |
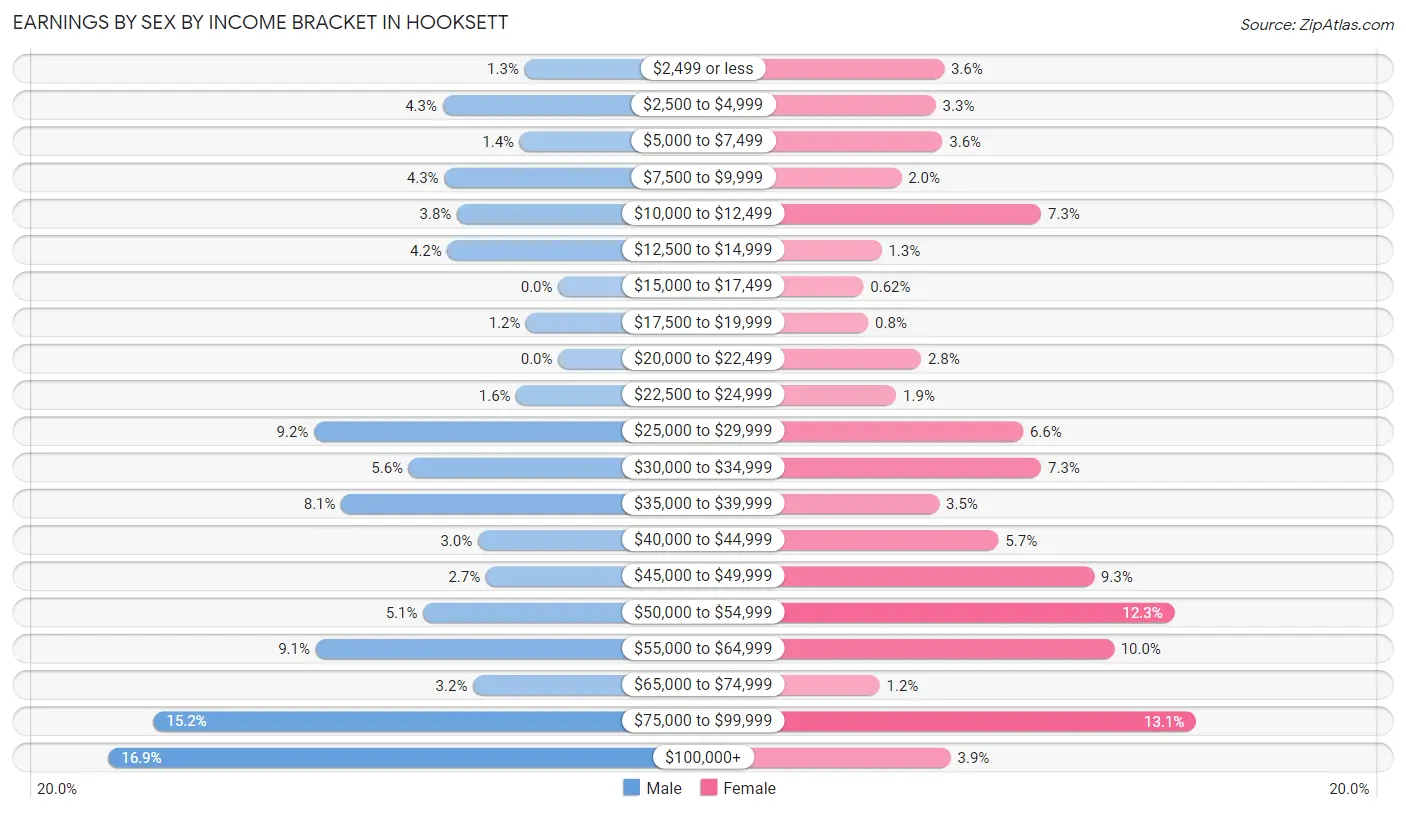
Earnings by Sex by Income Bracket in Hooksett
The most common earnings brackets in Hooksett are $100,000+ for men (280 | 16.9%) and $75,000 to $99,999 for women (212 | 13.1%).
| Income | Male | Female |
| $2,499 or less | 21 (1.3%) | 59 (3.6%) |
| $2,500 to $4,999 | 72 (4.3%) | 54 (3.3%) |
| $5,000 to $7,499 | 24 (1.4%) | 58 (3.6%) |
| $7,500 to $9,999 | 71 (4.3%) | 33 (2.0%) |
| $10,000 to $12,499 | 63 (3.8%) | 118 (7.3%) |
| $12,500 to $14,999 | 69 (4.2%) | 21 (1.3%) |
| $15,000 to $17,499 | 0 (0.0%) | 10 (0.6%) |
| $17,500 to $19,999 | 20 (1.2%) | 13 (0.8%) |
| $20,000 to $22,499 | 0 (0.0%) | 45 (2.8%) |
| $22,500 to $24,999 | 26 (1.6%) | 30 (1.8%) |
| $25,000 to $29,999 | 152 (9.1%) | 107 (6.6%) |
| $30,000 to $34,999 | 93 (5.6%) | 118 (7.3%) |
| $35,000 to $39,999 | 135 (8.1%) | 56 (3.5%) |
| $40,000 to $44,999 | 50 (3.0%) | 92 (5.7%) |
| $45,000 to $49,999 | 45 (2.7%) | 150 (9.3%) |
| $50,000 to $54,999 | 84 (5.1%) | 199 (12.3%) |
| $55,000 to $64,999 | 151 (9.1%) | 162 (10.0%) |
| $65,000 to $74,999 | 53 (3.2%) | 20 (1.2%) |
| $75,000 to $99,999 | 252 (15.2%) | 212 (13.1%) |
| $100,000+ | 280 (16.9%) | 63 (3.9%) |
| Total | 1,661 (100.0%) | 1,620 (100.0%) |
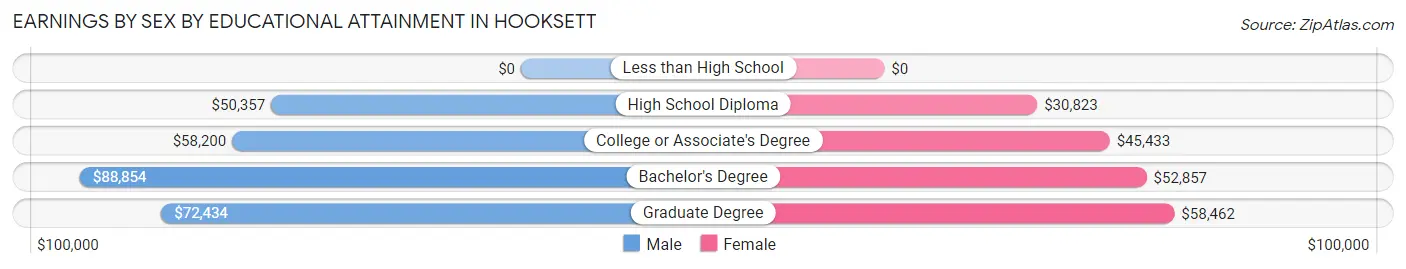
Earnings by Sex by Educational Attainment in Hooksett
Average earnings in Hooksett are $61,204 for men and $46,375 for women, a difference of 24.2%. Men with an educational attainment of bachelor's degree enjoy the highest average annual earnings of $88,854, while those with high school diploma education earn the least with $50,357. Women with an educational attainment of graduate degree earn the most with the average annual earnings of $58,462, while those with high school diploma education have the smallest earnings of $30,823.
| Educational Attainment | Male Income | Female Income |
| Less than High School | - | - |
| High School Diploma | $50,357 | $30,823 |
| College or Associate's Degree | $58,200 | $45,433 |
| Bachelor's Degree | $88,854 | $52,857 |
| Graduate Degree | $72,434 | $58,462 |
| Total | $61,204 | $46,375 |
Family Income in Hooksett
Family Income Brackets in Hooksett
According to the Hooksett family income data, there are 383 families falling into the $75,000 to $99,999 income range, which is the most common income bracket and makes up 26.9% of all families. Conversely, the less than $10,000 income bracket is the least frequent group with only 13 families (0.9%) belonging to this category.
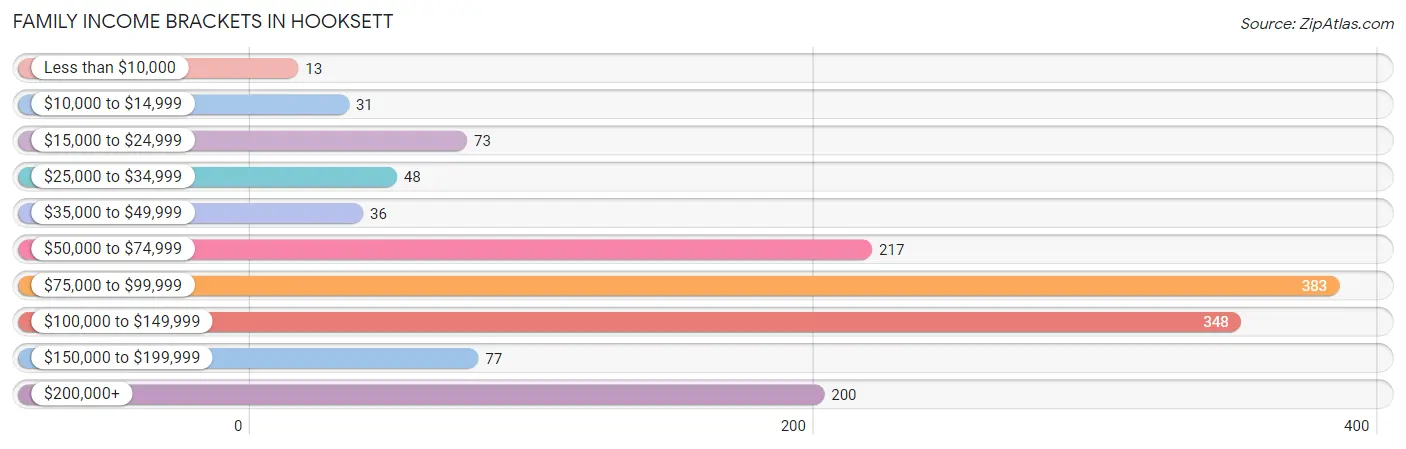
| Income Bracket | # Families | % Families |
| Less than $10,000 | 13 | 0.9% |
| $10,000 to $14,999 | 31 | 2.2% |
| $15,000 to $24,999 | 73 | 5.1% |
| $25,000 to $34,999 | 48 | 3.4% |
| $35,000 to $49,999 | 36 | 2.5% |
| $50,000 to $74,999 | 217 | 15.2% |
| $75,000 to $99,999 | 383 | 26.9% |
| $100,000 to $149,999 | 348 | 24.4% |
| $150,000 to $199,999 | 77 | 5.4% |
| $200,000+ | 200 | 14.0% |
Family Income by Famaliy Size in Hooksett
5-person families (83 | 5.8%) account for the highest median family income in Hooksett with $214,875 per family, while 5-person families (83 | 5.8%) have the highest median income of $42,975 per family member.
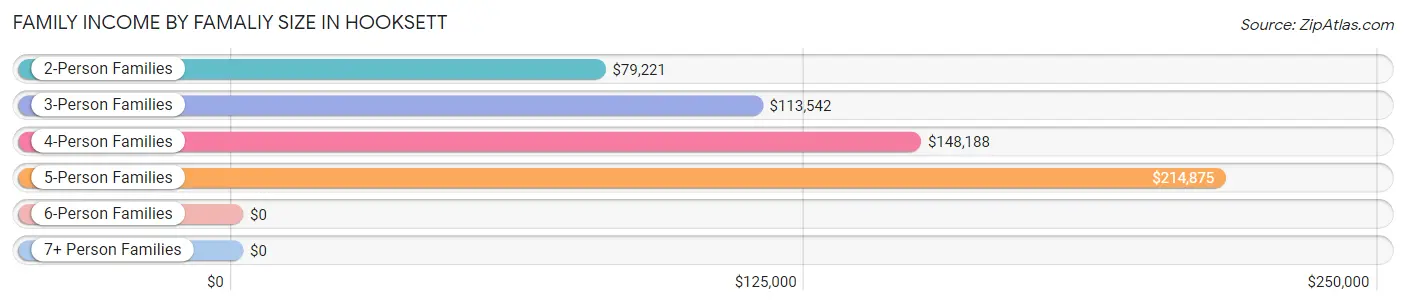
| Income Bracket | # Families | Median Income |
| 2-Person Families | 853 (59.9%) | $79,221 |
| 3-Person Families | 304 (21.3%) | $113,542 |
| 4-Person Families | 185 (13.0%) | $148,188 |
| 5-Person Families | 83 (5.8%) | $214,875 |
| 6-Person Families | 0 (0.0%) | $0 |
| 7+ Person Families | 0 (0.0%) | $0 |
| Total | 1,425 (100.0%) | $91,343 |
Family Income by Number of Earners in Hooksett
The median family income in Hooksett is $91,343, with families comprising 3+ earners (123) having the highest median family income of $214,875, while families with no earners (229) have the lowest median family income of $58,050, accounting for 8.6% and 16.1% of families, respectively.
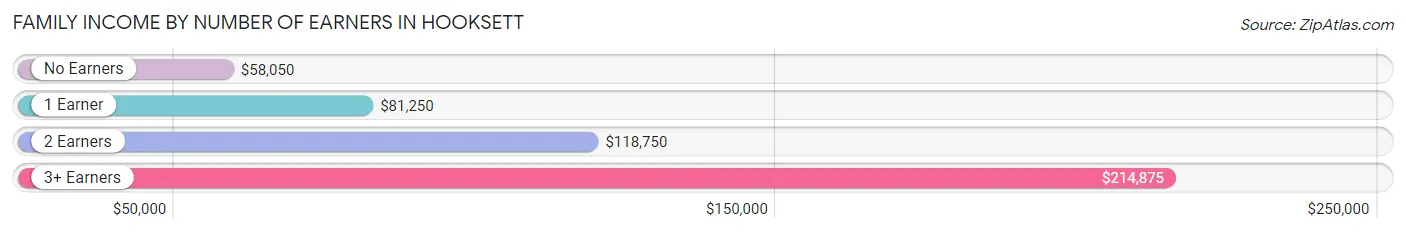
| Number of Earners | # Families | Median Income |
| No Earners | 229 (16.1%) | $58,050 |
| 1 Earner | 396 (27.8%) | $81,250 |
| 2 Earners | 677 (47.5%) | $118,750 |
| 3+ Earners | 123 (8.6%) | $214,875 |
| Total | 1,425 (100.0%) | $91,343 |
Household Income in Hooksett
Household Income Brackets in Hooksett
With 526 households falling in the category, the $100,000 to $149,999 income range is the most frequent in Hooksett, accounting for 23.7% of all households. In contrast, only 31 households (1.4%) fall into the $10,000 to $14,999 income bracket, making it the least populous group.
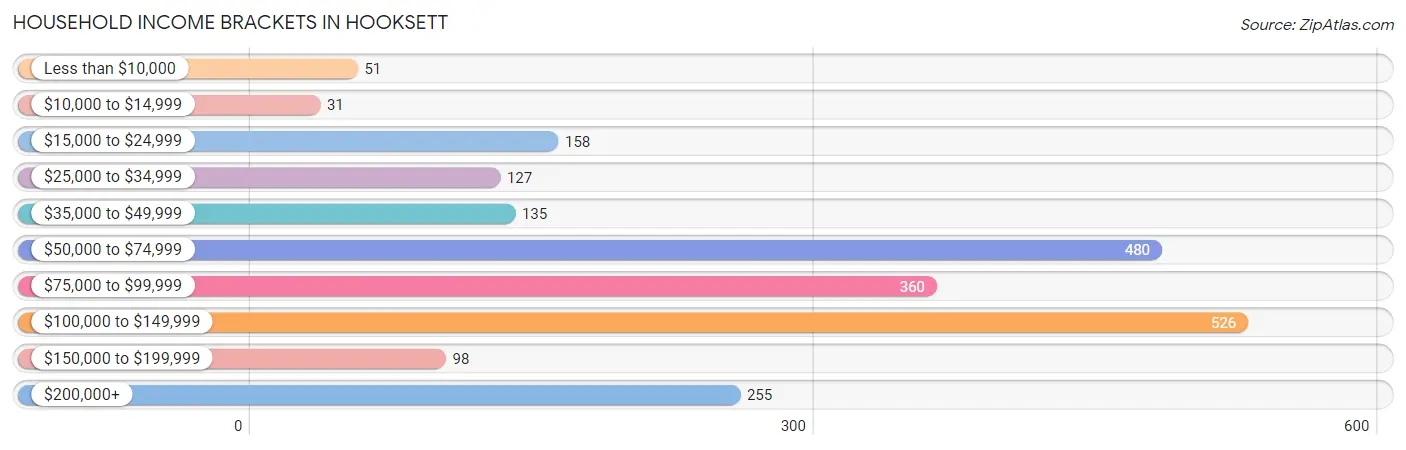
| Income Bracket | # Households | % Households |
| Less than $10,000 | 51 | 2.3% |
| $10,000 to $14,999 | 31 | 1.4% |
| $15,000 to $24,999 | 158 | 7.1% |
| $25,000 to $34,999 | 127 | 5.7% |
| $35,000 to $49,999 | 135 | 6.1% |
| $50,000 to $74,999 | 480 | 21.6% |
| $75,000 to $99,999 | 360 | 16.2% |
| $100,000 to $149,999 | 526 | 23.7% |
| $150,000 to $199,999 | 98 | 4.4% |
| $200,000+ | 255 | 11.5% |
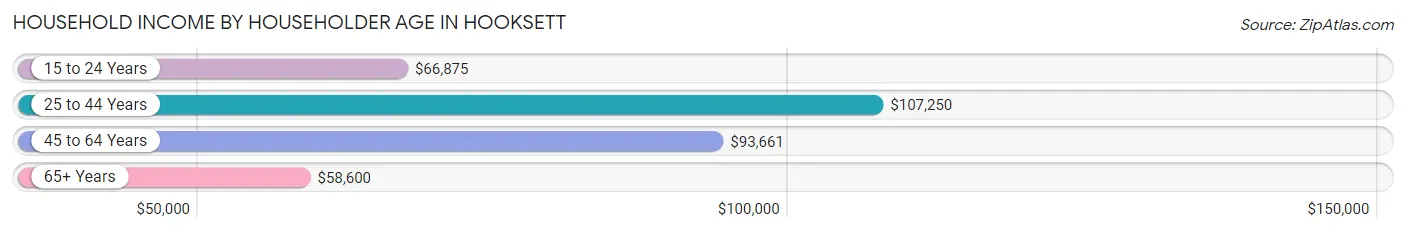
Household Income by Householder Age in Hooksett
The median household income in Hooksett is $83,456, with the highest median household income of $107,250 found in the 25 to 44 years age bracket for the primary householder. A total of 735 households (33.1%) fall into this category. Meanwhile, the 65+ years age bracket for the primary householder has the lowest median household income of $58,600, with 788 households (35.5%) in this group.
| Income Bracket | # Households | Median Income |
| 15 to 24 Years | 48 (2.2%) | $66,875 |
| 25 to 44 Years | 735 (33.1%) | $107,250 |
| 45 to 64 Years | 650 (29.3%) | $93,661 |
| 65+ Years | 788 (35.5%) | $58,600 |
| Total | 2,221 (100.0%) | $83,456 |
Poverty in Hooksett
Income Below Poverty by Sex and Age in Hooksett
With 4.9% poverty level for males and 7.9% for females among the residents of Hooksett, 18 to 24 year old males and 6 to 11 year old females are the most vulnerable to poverty, with 63 males (13.2%) and 27 females (67.5%) in their respective age groups living below the poverty level.
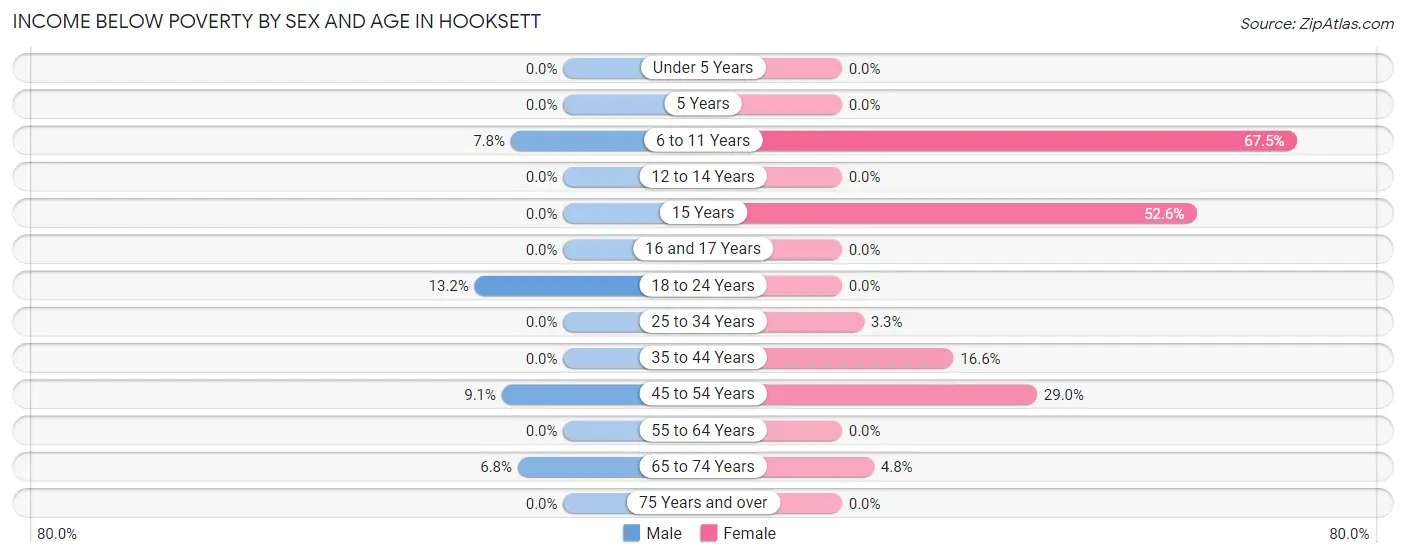
| Age Bracket | Male | Female |
| Under 5 Years | 0 (0.0%) | 0 (0.0%) |
| 5 Years | 0 (0.0%) | 0 (0.0%) |
| 6 to 11 Years | 17 (7.8%) | 27 (67.5%) |
| 12 to 14 Years | 0 (0.0%) | 0 (0.0%) |
| 15 Years | 0 (0.0%) | 10 (52.6%) |
| 16 and 17 Years | 0 (0.0%) | 0 (0.0%) |
| 18 to 24 Years | 63 (13.2%) | 0 (0.0%) |
| 25 to 34 Years | 0 (0.0%) | 14 (3.3%) |
| 35 to 44 Years | 0 (0.0%) | 66 (16.6%) |
| 45 to 54 Years | 24 (9.1%) | 73 (29.0%) |
| 55 to 64 Years | 0 (0.0%) | 0 (0.0%) |
| 65 to 74 Years | 21 (6.8%) | 21 (4.8%) |
| 75 Years and over | 0 (0.0%) | 0 (0.0%) |
| Total | 125 (4.9%) | 211 (7.9%) |
Income Above Poverty by Sex and Age in Hooksett
According to the poverty statistics in Hooksett, males aged under 5 years and females aged under 5 years are the age groups that are most secure financially, with 100.0% of males and 100.0% of females in these age groups living above the poverty line.
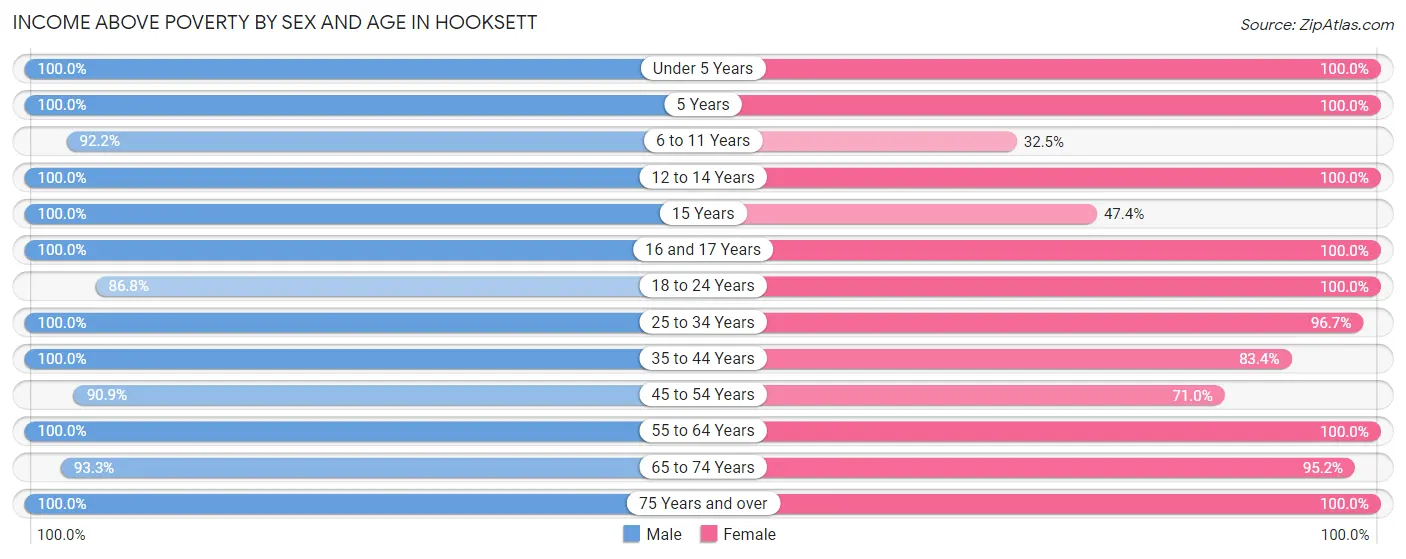
| Age Bracket | Male | Female |
| Under 5 Years | 135 (100.0%) | 17 (100.0%) |
| 5 Years | 9 (100.0%) | 88 (100.0%) |
| 6 to 11 Years | 201 (92.2%) | 13 (32.5%) |
| 12 to 14 Years | 66 (100.0%) | 55 (100.0%) |
| 15 Years | 22 (100.0%) | 9 (47.4%) |
| 16 and 17 Years | 14 (100.0%) | 98 (100.0%) |
| 18 to 24 Years | 415 (86.8%) | 160 (100.0%) |
| 25 to 34 Years | 272 (100.0%) | 416 (96.7%) |
| 35 to 44 Years | 296 (100.0%) | 332 (83.4%) |
| 45 to 54 Years | 239 (90.9%) | 179 (71.0%) |
| 55 to 64 Years | 331 (100.0%) | 351 (100.0%) |
| 65 to 74 Years | 290 (93.2%) | 420 (95.2%) |
| 75 Years and over | 138 (100.0%) | 337 (100.0%) |
| Total | 2,428 (95.1%) | 2,475 (92.1%) |
Income Below Poverty Among Married-Couple Families in Hooksett
The poverty statistics for married-couple families in Hooksett show that 1.9% or 21 of the total 1,078 families live below the poverty line. Families with no children have the highest poverty rate of 2.6%, comprising of 21 families. On the other hand, families with 1 or 2 children have the lowest poverty rate of 0.0%, which includes 0 families.
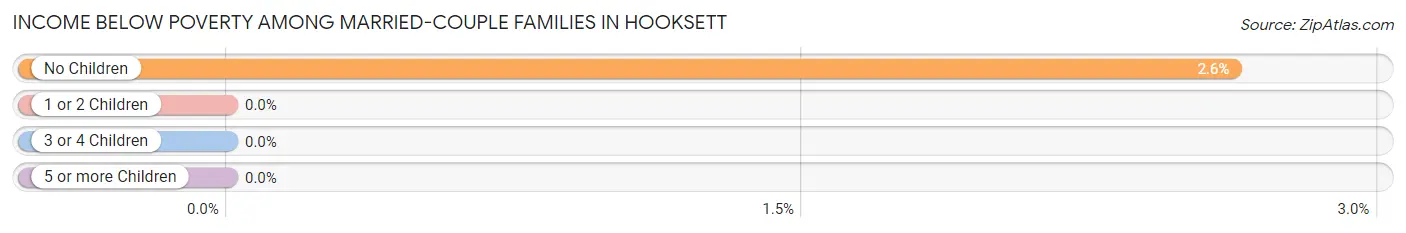
| Children | Above Poverty | Below Poverty |
| No Children | 781 (97.4%) | 21 (2.6%) |
| 1 or 2 Children | 235 (100.0%) | 0 (0.0%) |
| 3 or 4 Children | 41 (100.0%) | 0 (0.0%) |
| 5 or more Children | 0 (0.0%) | 0 (0.0%) |
| Total | 1,057 (98.1%) | 21 (1.9%) |
Income Below Poverty Among Single-Parent Households in Hooksett
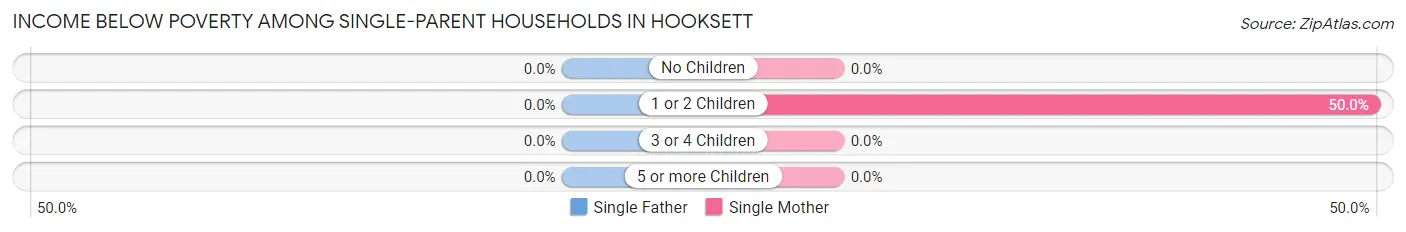
| Children | Single Father | Single Mother |
| No Children | 0 (0.0%) | 0 (0.0%) |
| 1 or 2 Children | 0 (0.0%) | 40 (50.0%) |
| 3 or 4 Children | 0 (0.0%) | 0 (0.0%) |
| 5 or more Children | 0 (0.0%) | 0 (0.0%) |
| Total | 0 (0.0%) | 40 (16.7%) |
Income Below Poverty Among Married-Couple vs Single-Parent Households in Hooksett
The poverty data for Hooksett shows that 21 of the married-couple family households (1.9%) and 40 of the single-parent households (11.5%) are living below the poverty level. Within the married-couple family households, those with no children have the highest poverty rate, with 21 households (2.6%) falling below the poverty line. Among the single-parent households, those with 1 or 2 children have the highest poverty rate, with 40 household (24.1%) living below poverty.
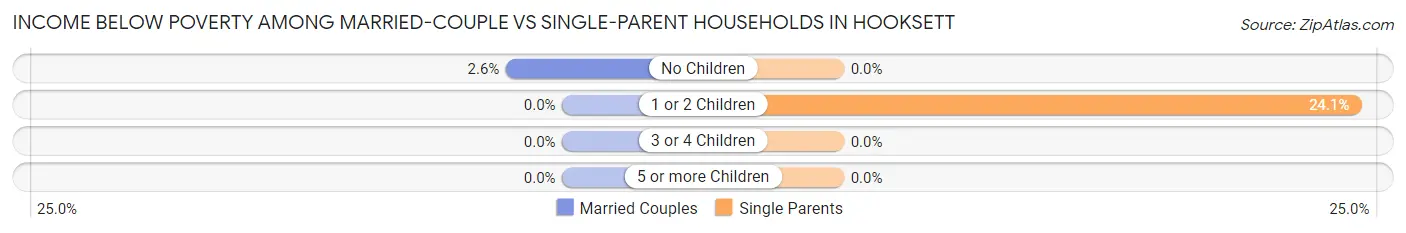
| Children | Married-Couple Families | Single-Parent Households |
| No Children | 21 (2.6%) | 0 (0.0%) |
| 1 or 2 Children | 0 (0.0%) | 40 (24.1%) |
| 3 or 4 Children | 0 (0.0%) | 0 (0.0%) |
| 5 or more Children | 0 (0.0%) | 0 (0.0%) |
| Total | 21 (1.9%) | 40 (11.5%) |
Race in Hooksett
The most populous races in Hooksett are White / Caucasian (4,803 | 91.2%), Asian (217 | 4.1%), and Two or more Races (211 | 4.0%).
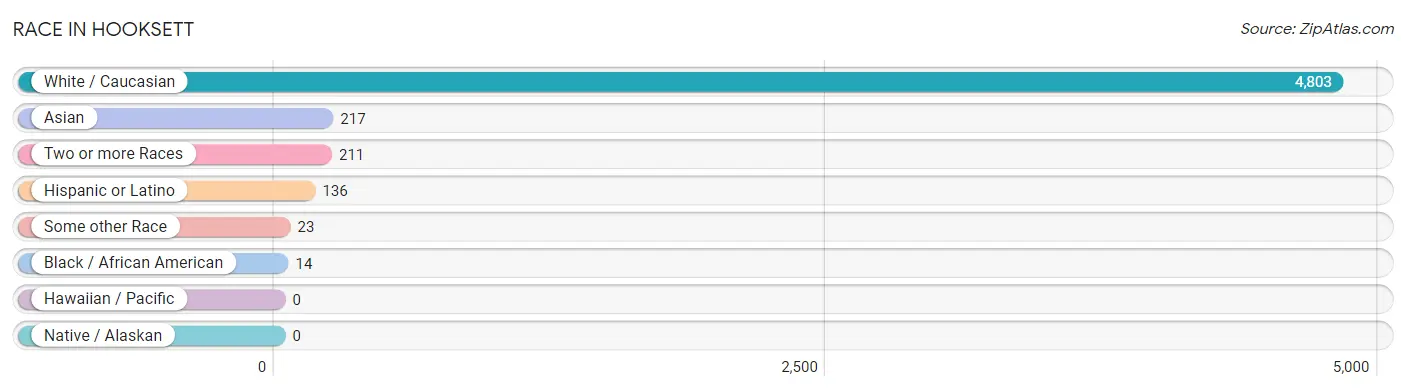
| Race | # Population | % Population |
| Asian | 217 | 4.1% |
| Black / African American | 14 | 0.3% |
| Hawaiian / Pacific | 0 | 0.0% |
| Hispanic or Latino | 136 | 2.6% |
| Native / Alaskan | 0 | 0.0% |
| White / Caucasian | 4,803 | 91.2% |
| Two or more Races | 211 | 4.0% |
| Some other Race | 23 | 0.4% |
| Total | 5,268 | 100.0% |
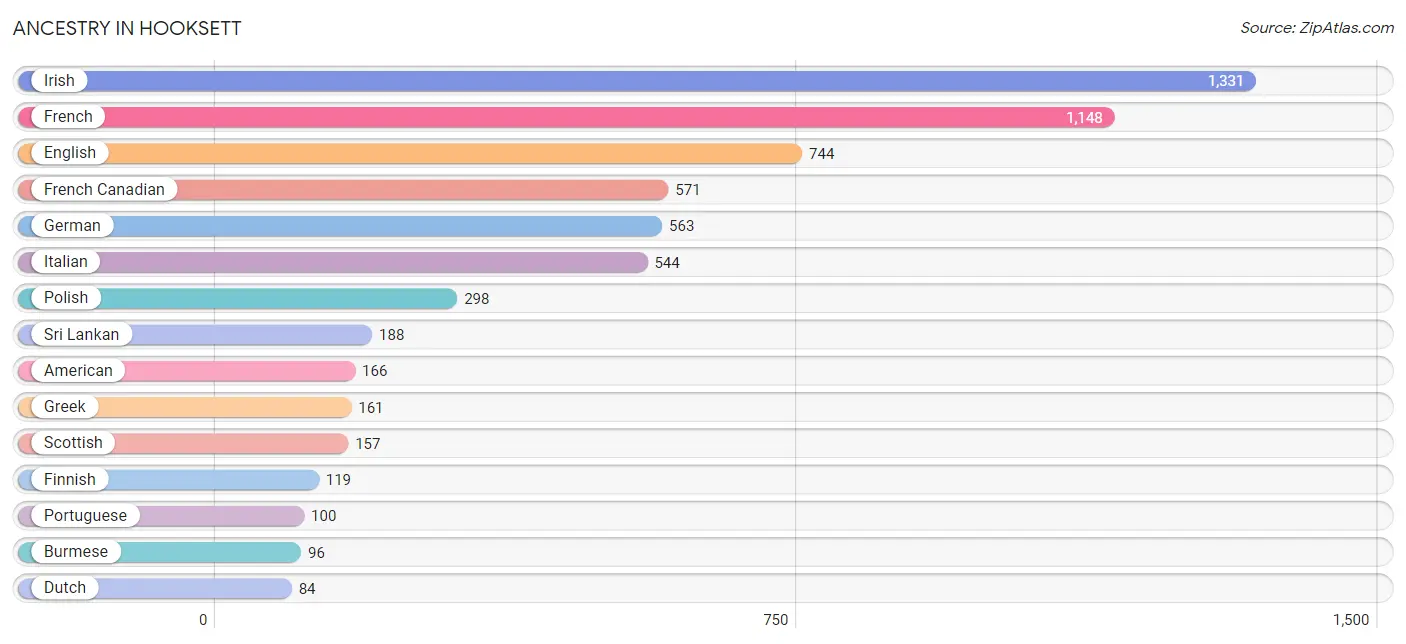
Ancestry in Hooksett
The most populous ancestries reported in Hooksett are Irish (1,331 | 25.3%), French (1,148 | 21.8%), English (744 | 14.1%), French Canadian (571 | 10.8%), and German (563 | 10.7%), together accounting for 82.7% of all Hooksett residents.
| Ancestry | # Population | % Population |
| Albanian | 79 | 1.5% |
| American | 166 | 3.2% |
| Arab | 10 | 0.2% |
| Belgian | 16 | 0.3% |
| Brazilian | 15 | 0.3% |
| British | 22 | 0.4% |
| Burmese | 96 | 1.8% |
| Canadian | 47 | 0.9% |
| Central American | 7 | 0.1% |
| Colombian | 34 | 0.6% |
| Cuban | 20 | 0.4% |
| Czech | 17 | 0.3% |
| Dutch | 84 | 1.6% |
| English | 744 | 14.1% |
| European | 49 | 0.9% |
| Finnish | 119 | 2.3% |
| French | 1,148 | 21.8% |
| French Canadian | 571 | 10.8% |
| German | 563 | 10.7% |
| Greek | 161 | 3.1% |
| Honduran | 7 | 0.1% |
| Indian (Asian) | 50 | 0.9% |
| Irish | 1,331 | 25.3% |
| Italian | 544 | 10.3% |
| Lithuanian | 59 | 1.1% |
| Native Hawaiian | 31 | 0.6% |
| Palestinian | 10 | 0.2% |
| Polish | 298 | 5.7% |
| Portuguese | 100 | 1.9% |
| Puerto Rican | 60 | 1.1% |
| Romanian | 22 | 0.4% |
| Russian | 19 | 0.4% |
| Scandinavian | 13 | 0.3% |
| Scotch-Irish | 45 | 0.9% |
| Scottish | 157 | 3.0% |
| South American | 34 | 0.6% |
| Sri Lankan | 188 | 3.6% |
| Swedish | 48 | 0.9% |
| Ukrainian | 8 | 0.2% |
| Welsh | 84 | 1.6% | View All 40 Rows |
Immigrants in Hooksett
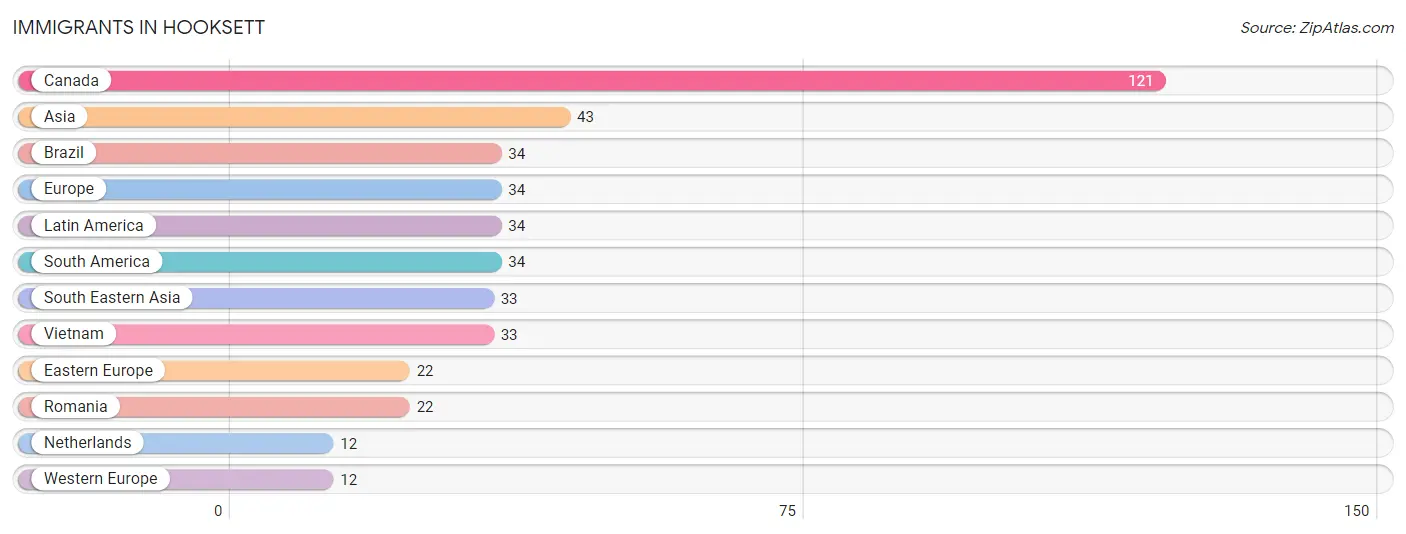
The most numerous immigrant groups reported in Hooksett came from Canada (121 | 2.3%), Asia (43 | 0.8%), Brazil (34 | 0.6%), Europe (34 | 0.6%), and Latin America (34 | 0.6%), together accounting for 5.1% of all Hooksett residents.
| Immigration Origin | # Population | % Population |
| Asia | 43 | 0.8% |
| Brazil | 34 | 0.6% |
| Canada | 121 | 2.3% |
| Eastern Europe | 22 | 0.4% |
| Europe | 34 | 0.6% |
| Latin America | 34 | 0.6% |
| Netherlands | 12 | 0.2% |
| Romania | 22 | 0.4% |
| South America | 34 | 0.6% |
| South Eastern Asia | 33 | 0.6% |
| Vietnam | 33 | 0.6% |
| Western Europe | 12 | 0.2% | View All 12 Rows |
Sex and Age in Hooksett
Sex and Age in Hooksett
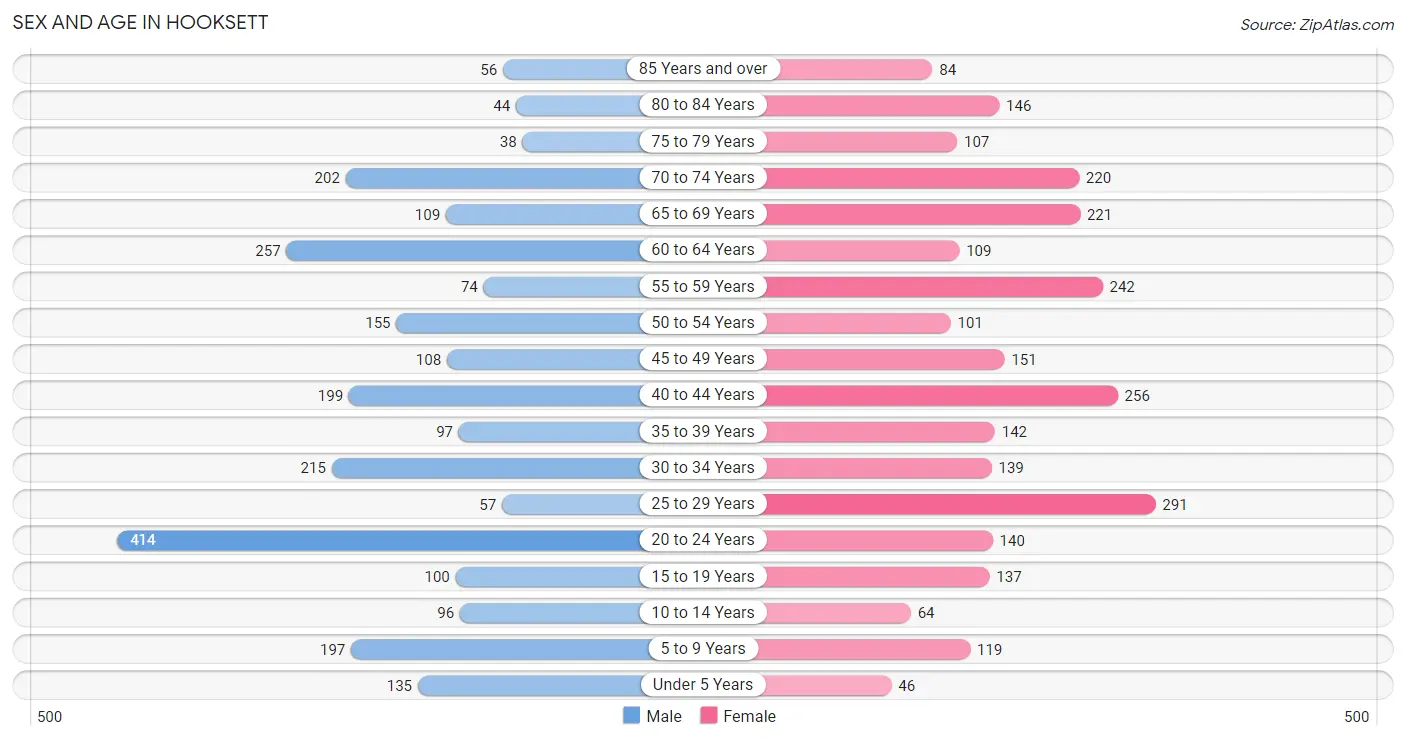
The most populous age groups in Hooksett are 20 to 24 Years (414 | 16.2%) for men and 25 to 29 Years (291 | 10.7%) for women.
| Age Bracket | Male | Female |
| Under 5 Years | 135 (5.3%) | 46 (1.7%) |
| 5 to 9 Years | 197 (7.7%) | 119 (4.4%) |
| 10 to 14 Years | 96 (3.8%) | 64 (2.4%) |
| 15 to 19 Years | 100 (3.9%) | 137 (5.1%) |
| 20 to 24 Years | 414 (16.2%) | 140 (5.2%) |
| 25 to 29 Years | 57 (2.2%) | 291 (10.7%) |
| 30 to 34 Years | 215 (8.4%) | 139 (5.1%) |
| 35 to 39 Years | 97 (3.8%) | 142 (5.2%) |
| 40 to 44 Years | 199 (7.8%) | 256 (9.4%) |
| 45 to 49 Years | 108 (4.2%) | 151 (5.6%) |
| 50 to 54 Years | 155 (6.1%) | 101 (3.7%) |
| 55 to 59 Years | 74 (2.9%) | 242 (8.9%) |
| 60 to 64 Years | 257 (10.1%) | 109 (4.0%) |
| 65 to 69 Years | 109 (4.3%) | 221 (8.1%) |
| 70 to 74 Years | 202 (7.9%) | 220 (8.1%) |
| 75 to 79 Years | 38 (1.5%) | 107 (3.9%) |
| 80 to 84 Years | 44 (1.7%) | 146 (5.4%) |
| 85 Years and over | 56 (2.2%) | 84 (3.1%) |
| Total | 2,553 (100.0%) | 2,715 (100.0%) |
Families and Households in Hooksett
Median Family Size in Hooksett
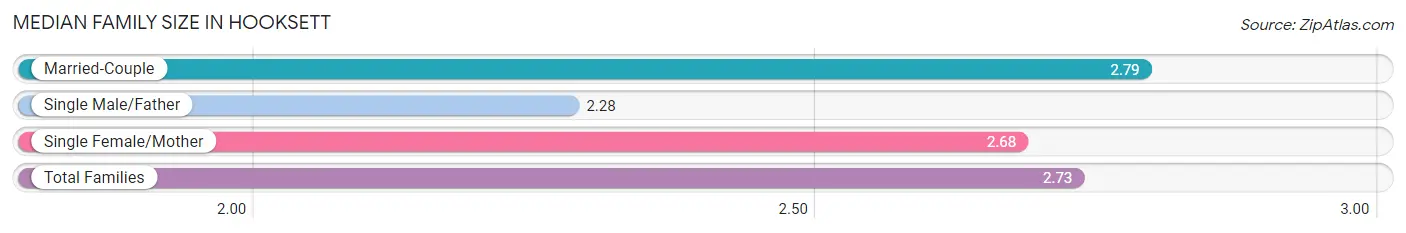
The median family size in Hooksett is 2.73 persons per family, with married-couple families (1,078 | 75.6%) accounting for the largest median family size of 2.79 persons per family. On the other hand, single male/father families (107 | 7.5%) represent the smallest median family size with 2.28 persons per family.
| Family Type | # Families | Family Size |
| Married-Couple | 1,078 (75.6%) | 2.79 |
| Single Male/Father | 107 (7.5%) | 2.28 |
| Single Female/Mother | 240 (16.8%) | 2.68 |
| Total Families | 1,425 (100.0%) | 2.73 |
Median Household Size in Hooksett
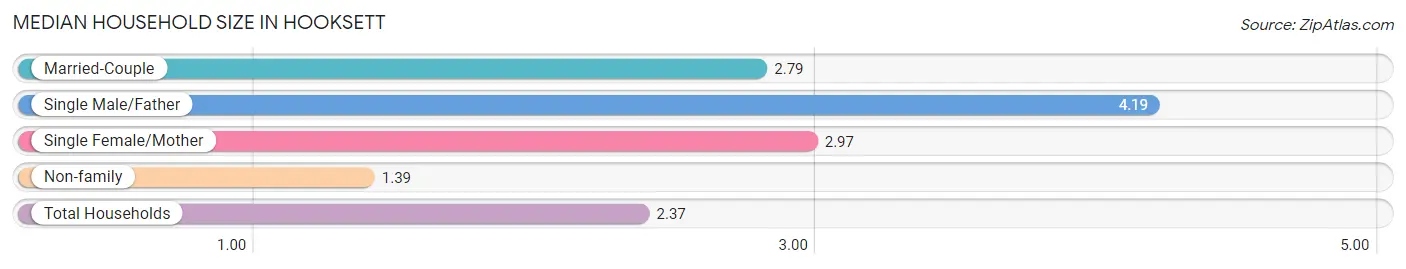
The median household size in Hooksett is 2.37 persons per household, with single male/father households (107 | 4.8%) accounting for the largest median household size of 4.19 persons per household. non-family households (796 | 35.8%) represent the smallest median household size with 1.39 persons per household.
| Household Type | # Households | Household Size |
| Married-Couple | 1,078 (48.5%) | 2.79 |
| Single Male/Father | 107 (4.8%) | 4.19 |
| Single Female/Mother | 240 (10.8%) | 2.97 |
| Non-family | 796 (35.8%) | 1.39 |
| Total Households | 2,221 (100.0%) | 2.37 |
Household Size by Marriage Status in Hooksett
Out of a total of 2,221 households in Hooksett, 1,425 (64.2%) are family households, while 796 (35.8%) are nonfamily households. The most numerous type of family households are 2-person households, comprising 716, and the most common type of nonfamily households are 1-person households, comprising 554.
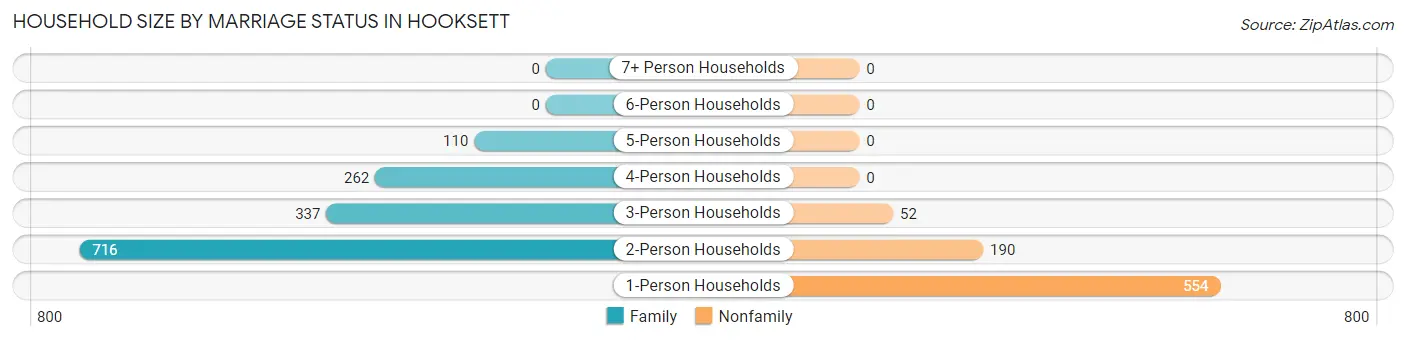
| Household Size | Family Households | Nonfamily Households |
| 1-Person Households | - | 554 (24.9%) |
| 2-Person Households | 716 (32.2%) | 190 (8.6%) |
| 3-Person Households | 337 (15.2%) | 52 (2.3%) |
| 4-Person Households | 262 (11.8%) | 0 (0.0%) |
| 5-Person Households | 110 (5.0%) | 0 (0.0%) |
| 6-Person Households | 0 (0.0%) | 0 (0.0%) |
| 7+ Person Households | 0 (0.0%) | 0 (0.0%) |
| Total | 1,425 (64.2%) | 796 (35.8%) |
Female Fertility in Hooksett
Fertility by Age in Hooksett
| Age Bracket | Women with Births | Births / 1,000 Women |
| 15 to 19 years | 0 (0.0%) | 0.0 |
| 20 to 34 years | 0 (0.0%) | 0.0 |
| 35 to 50 years | 0 (0.0%) | 0.0 |
| Total | 0 (0.0%) | 0.0 |
Fertility by Age by Marriage Status in Hooksett
| Age Bracket | Married | Unmarried |
| 15 to 19 years | 0 (0.0%) | 0 (0.0%) |
| 20 to 34 years | 0 (0.0%) | 0 (0.0%) |
| 35 to 50 years | 0 (0.0%) | 0 (0.0%) |
| Total | 0 (0.0%) | 0 (0.0%) |
Fertility by Education in Hooksett
| Educational Attainment | Women with Births | Births / 1,000 Women |
| Less than High School | 0 (0.0%) | 0.0 |
| High School Diploma | 0 (0.0%) | 0.0 |
| College or Associate's Degree | 0 (0.0%) | 0.0 |
| Bachelor's Degree | 0 (0.0%) | 0.0 |
| Graduate Degree | 0 (0.0%) | 0.0 |
| Total | 0 (0.0%) | 0.0 |
Fertility by Education by Marriage Status in Hooksett
| Educational Attainment | Married | Unmarried |
| Less than High School | 0 (0.0%) | 0 (0.0%) |
| High School Diploma | 0 (0.0%) | 0 (0.0%) |
| College or Associate's Degree | 0 (0.0%) | 0 (0.0%) |
| Bachelor's Degree | 0 (0.0%) | 0 (0.0%) |
| Graduate Degree | 0 (0.0%) | 0 (0.0%) |
| Total | 0 (0.0%) | 0 (0.0%) |
Employment Characteristics in Hooksett
Employment by Class of Employer in Hooksett
Among the 2,948 employed individuals in Hooksett, private company employees (1,807 | 61.3%), not-for-profit organizations (438 | 14.9%), and self-employed (incorporated) (173 | 5.9%) make up the most common classes of employment.
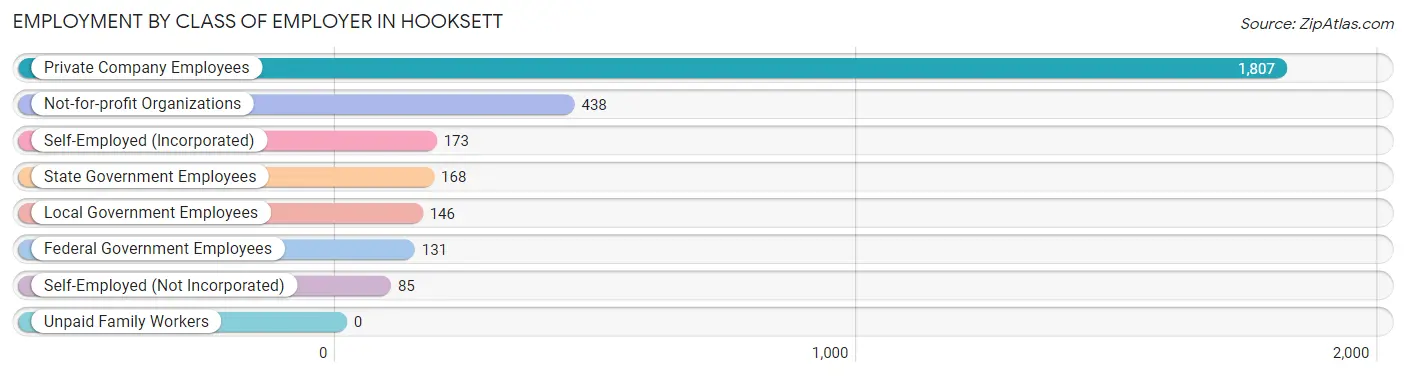
| Employer Class | # Employees | % Employees |
| Private Company Employees | 1,807 | 61.3% |
| Self-Employed (Incorporated) | 173 | 5.9% |
| Self-Employed (Not Incorporated) | 85 | 2.9% |
| Not-for-profit Organizations | 438 | 14.9% |
| Local Government Employees | 146 | 5.0% |
| State Government Employees | 168 | 5.7% |
| Federal Government Employees | 131 | 4.4% |
| Unpaid Family Workers | 0 | 0.0% |
| Total | 2,948 | 100.0% |
Employment Status by Age in Hooksett
According to the labor force statistics for Hooksett, out of the total population over 16 years of age (4,570), 68.0% or 3,108 individuals are in the labor force, with 4.3% or 134 of them unemployed. The age group with the highest labor force participation rate is 30 to 34 years, with 100.0% or 354 individuals in the labor force. Within the labor force, the 16 to 19 years age range has the highest percentage of unemployed individuals, with 30.8% or 20 of them being unemployed.
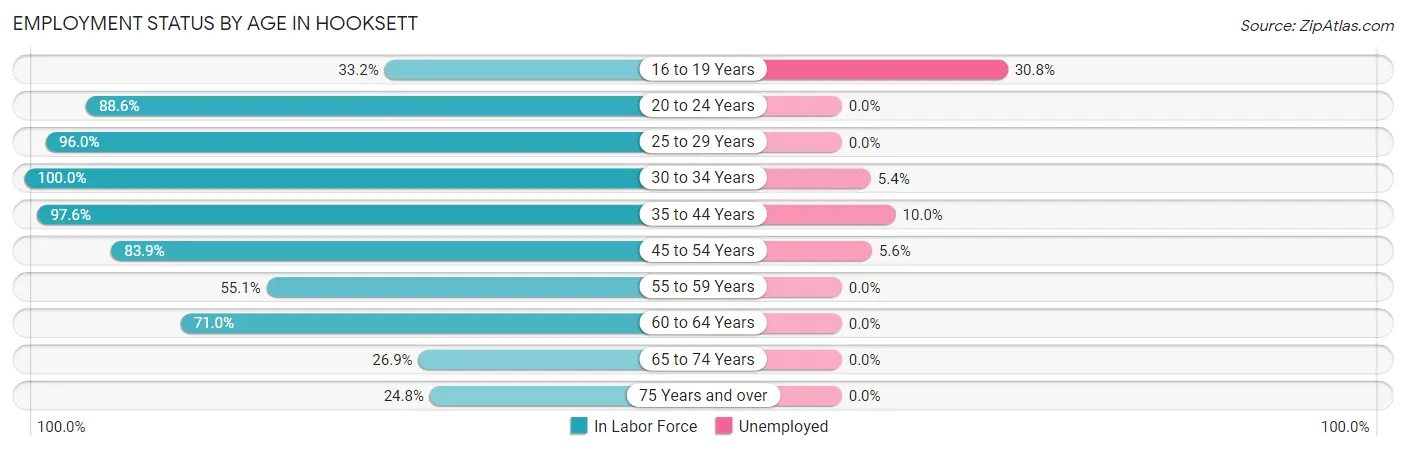
| Age Bracket | In Labor Force | Unemployed |
| 16 to 19 Years | 65 (33.2%) | 20 (30.8%) |
| 20 to 24 Years | 491 (88.6%) | 0 (0.0%) |
| 25 to 29 Years | 334 (96.0%) | 0 (0.0%) |
| 30 to 34 Years | 354 (100.0%) | 19 (5.4%) |
| 35 to 44 Years | 677 (97.6%) | 68 (10.0%) |
| 45 to 54 Years | 432 (83.9%) | 24 (5.6%) |
| 55 to 59 Years | 174 (55.1%) | 0 (0.0%) |
| 60 to 64 Years | 260 (71.0%) | 0 (0.0%) |
| 65 to 74 Years | 202 (26.9%) | 0 (0.0%) |
| 75 Years and over | 118 (24.8%) | 0 (0.0%) |
| Total | 3,108 (68.0%) | 134 (4.3%) |
Employment Status by Educational Attainment in Hooksett
According to labor force statistics for Hooksett, 86.0% of individuals (2,230) out of the total population between 25 and 64 years of age (2,593) are in the labor force, with 5.0% or 112 of them being unemployed. The group with the highest labor force participation rate are those with the educational attainment of bachelor's degree or higher, with 96.6% or 1,151 individuals in the labor force. Within the labor force, individuals with high school diploma education have the highest percentage of unemployment, with 9.8% or 49 of them being unemployed.
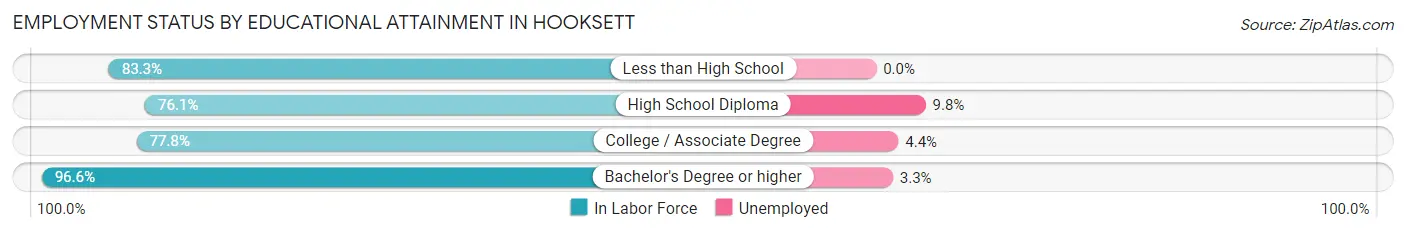
| Educational Attainment | In Labor Force | Unemployed |
| Less than High School | 30 (83.3%) | 0 (0.0%) |
| High School Diploma | 502 (76.1%) | 65 (9.8%) |
| College / Associate Degree | 549 (77.8%) | 31 (4.4%) |
| Bachelor's Degree or higher | 1,151 (96.6%) | 39 (3.3%) |
| Total | 2,230 (86.0%) | 130 (5.0%) |
Employment Occupations by Sex in Hooksett
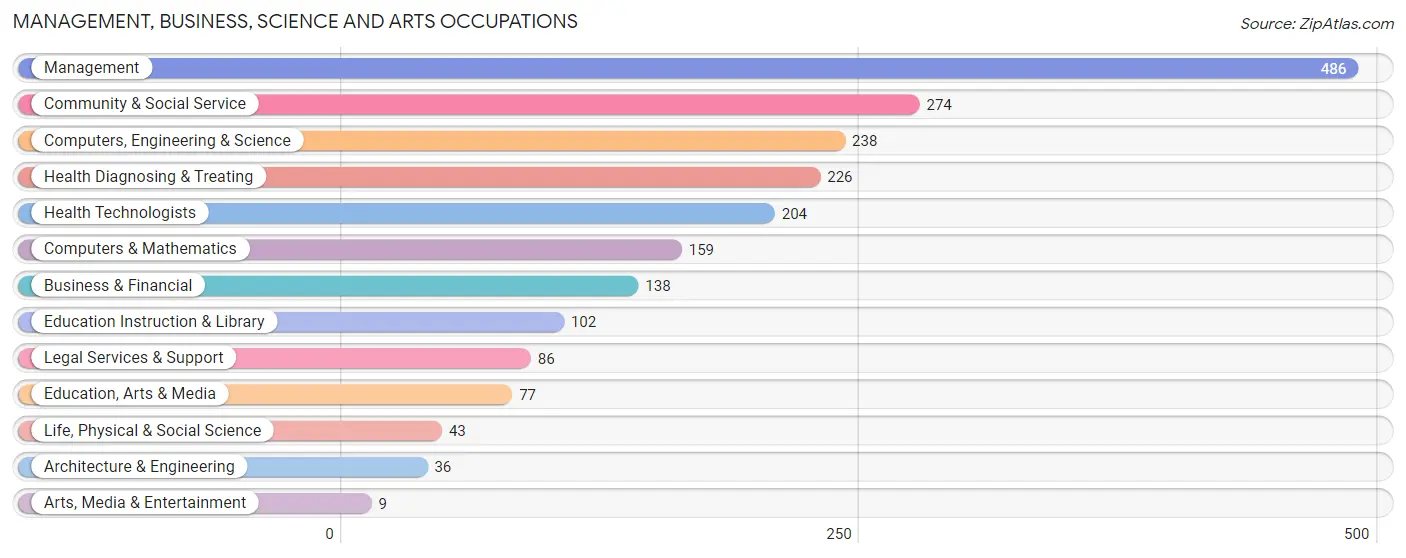
Management, Business, Science and Arts Occupations
The most common Management, Business, Science and Arts occupations in Hooksett are Management (486 | 16.7%), Community & Social Service (274 | 9.4%), Computers, Engineering & Science (238 | 8.2%), Health Diagnosing & Treating (226 | 7.8%), and Health Technologists (204 | 7.0%).
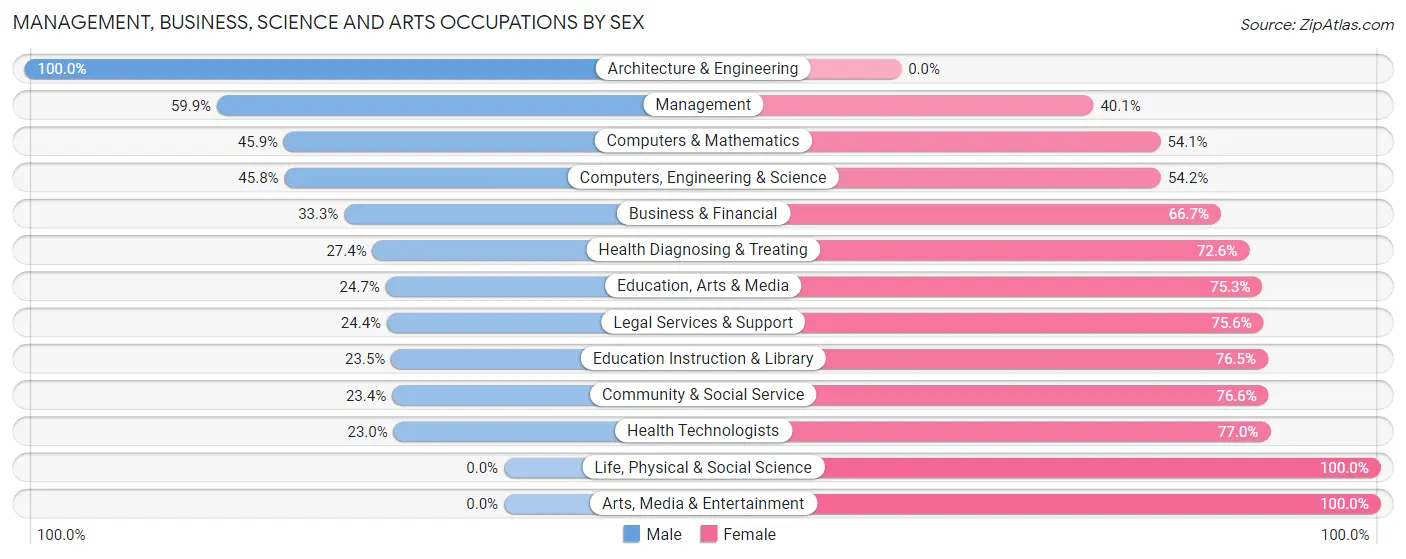
Management, Business, Science and Arts Occupations by Sex
Within the Management, Business, Science and Arts occupations in Hooksett, the most male-oriented occupations are Architecture & Engineering (100.0%), Management (59.9%), and Computers & Mathematics (45.9%), while the most female-oriented occupations are Life, Physical & Social Science (100.0%), Arts, Media & Entertainment (100.0%), and Health Technologists (77.0%).
| Occupation | Male | Female |
| Management | 291 (59.9%) | 195 (40.1%) |
| Business & Financial | 46 (33.3%) | 92 (66.7%) |
| Computers, Engineering & Science | 109 (45.8%) | 129 (54.2%) |
| Computers & Mathematics | 73 (45.9%) | 86 (54.1%) |
| Architecture & Engineering | 36 (100.0%) | 0 (0.0%) |
| Life, Physical & Social Science | 0 (0.0%) | 43 (100.0%) |
| Community & Social Service | 64 (23.4%) | 210 (76.6%) |
| Education, Arts & Media | 19 (24.7%) | 58 (75.3%) |
| Legal Services & Support | 21 (24.4%) | 65 (75.6%) |
| Education Instruction & Library | 24 (23.5%) | 78 (76.5%) |
| Arts, Media & Entertainment | 0 (0.0%) | 9 (100.0%) |
| Health Diagnosing & Treating | 62 (27.4%) | 164 (72.6%) |
| Health Technologists | 47 (23.0%) | 157 (77.0%) |
| Total (Category) | 572 (42.0%) | 790 (58.0%) |
| Total (Overall) | 1,489 (51.1%) | 1,424 (48.9%) |
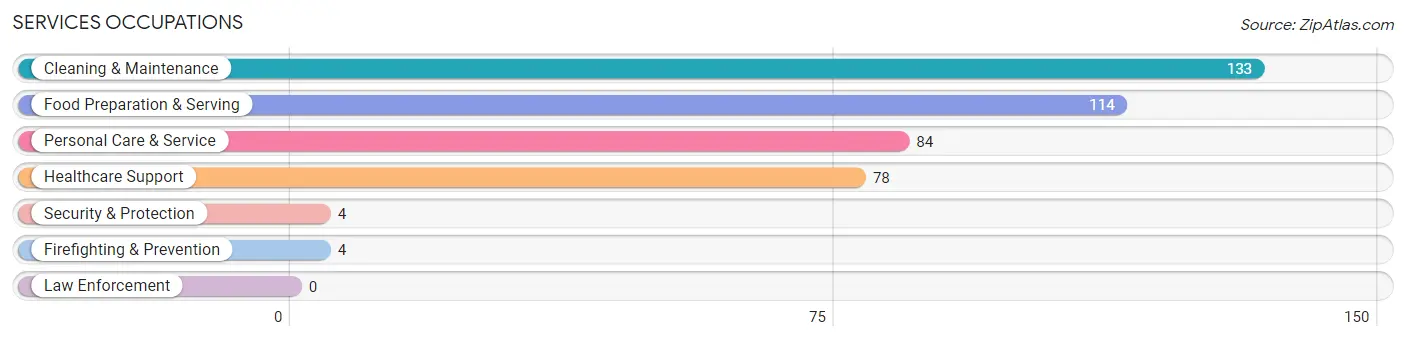
Services Occupations
The most common Services occupations in Hooksett are Cleaning & Maintenance (133 | 4.6%), Food Preparation & Serving (114 | 3.9%), Personal Care & Service (84 | 2.9%), Healthcare Support (78 | 2.7%), and Security & Protection (4 | 0.1%).
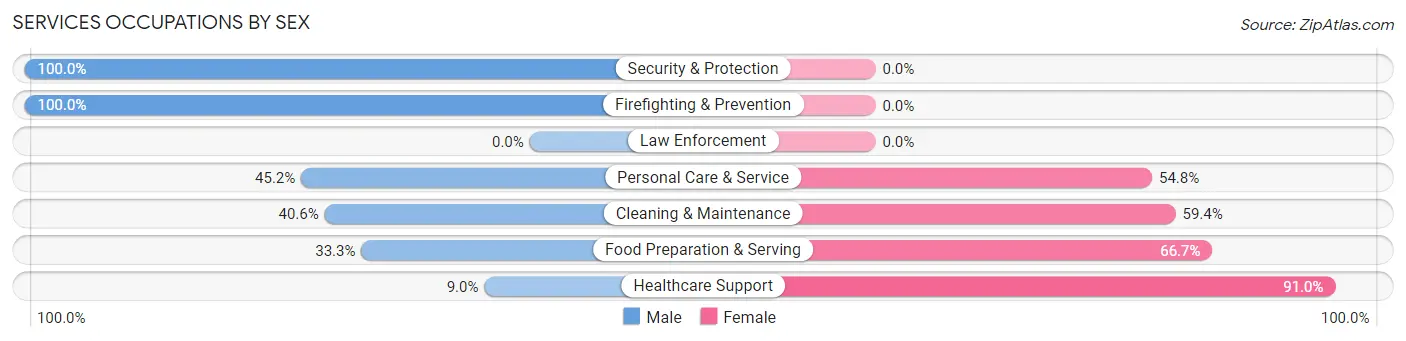
Services Occupations by Sex
Within the Services occupations in Hooksett, the most male-oriented occupations are Security & Protection (100.0%), Firefighting & Prevention (100.0%), and Personal Care & Service (45.2%), while the most female-oriented occupations are Healthcare Support (91.0%), Food Preparation & Serving (66.7%), and Cleaning & Maintenance (59.4%).
| Occupation | Male | Female |
| Healthcare Support | 7 (9.0%) | 71 (91.0%) |
| Security & Protection | 4 (100.0%) | 0 (0.0%) |
| Firefighting & Prevention | 4 (100.0%) | 0 (0.0%) |
| Law Enforcement | 0 (0.0%) | 0 (0.0%) |
| Food Preparation & Serving | 38 (33.3%) | 76 (66.7%) |
| Cleaning & Maintenance | 54 (40.6%) | 79 (59.4%) |
| Personal Care & Service | 38 (45.2%) | 46 (54.8%) |
| Total (Category) | 141 (34.1%) | 272 (65.9%) |
| Total (Overall) | 1,489 (51.1%) | 1,424 (48.9%) |
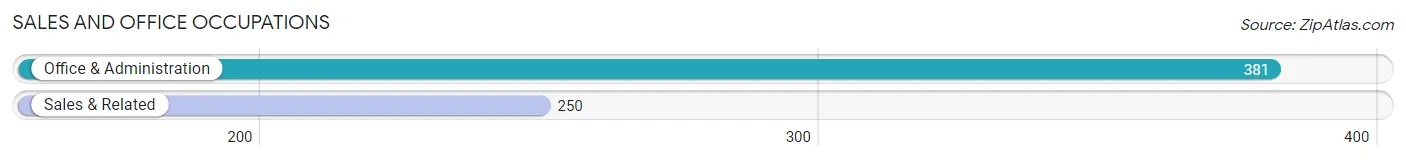
Sales and Office Occupations
The most common Sales and Office occupations in Hooksett are Office & Administration (381 | 13.1%), and Sales & Related (250 | 8.6%).
Sales and Office Occupations by Sex
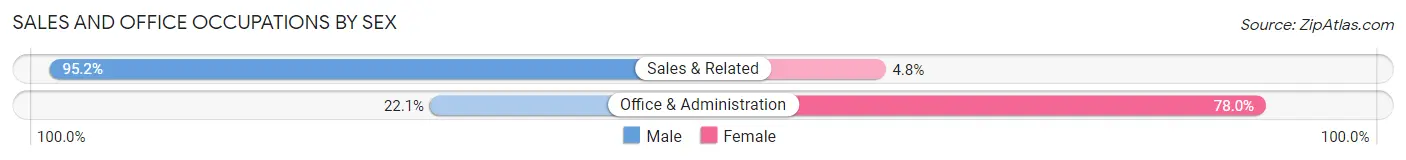
| Occupation | Male | Female |
| Sales & Related | 238 (95.2%) | 12 (4.8%) |
| Office & Administration | 84 (22.1%) | 297 (77.9%) |
| Total (Category) | 322 (51.0%) | 309 (49.0%) |
| Total (Overall) | 1,489 (51.1%) | 1,424 (48.9%) |
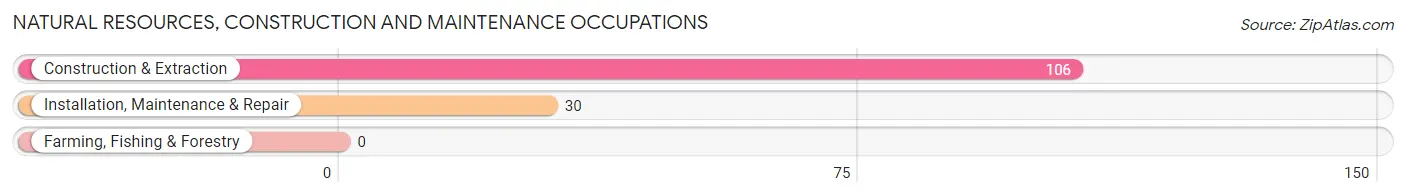
Natural Resources, Construction and Maintenance Occupations
The most common Natural Resources, Construction and Maintenance occupations in Hooksett are Construction & Extraction (106 | 3.6%), and Installation, Maintenance & Repair (30 | 1.0%).
Natural Resources, Construction and Maintenance Occupations by Sex
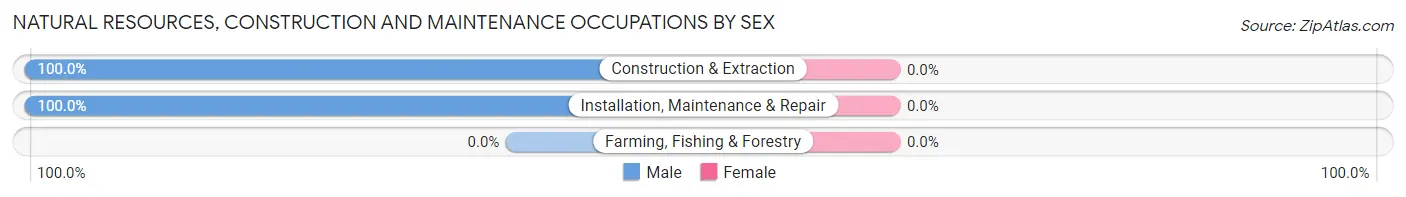
| Occupation | Male | Female |
| Farming, Fishing & Forestry | 0 (0.0%) | 0 (0.0%) |
| Construction & Extraction | 106 (100.0%) | 0 (0.0%) |
| Installation, Maintenance & Repair | 30 (100.0%) | 0 (0.0%) |
| Total (Category) | 136 (100.0%) | 0 (0.0%) |
| Total (Overall) | 1,489 (51.1%) | 1,424 (48.9%) |
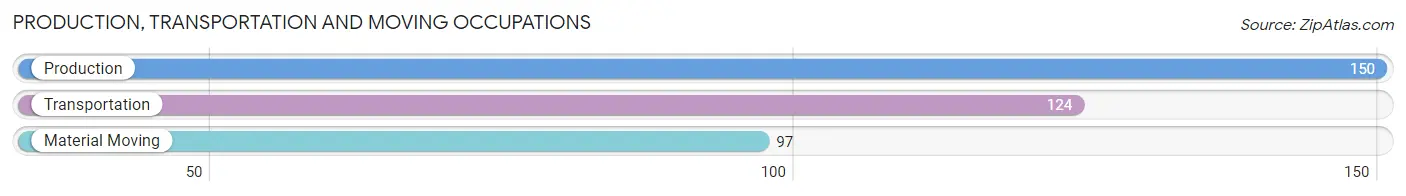
Production, Transportation and Moving Occupations
The most common Production, Transportation and Moving occupations in Hooksett are Production (150 | 5.1%), Transportation (124 | 4.3%), and Material Moving (97 | 3.3%).
Production, Transportation and Moving Occupations by Sex
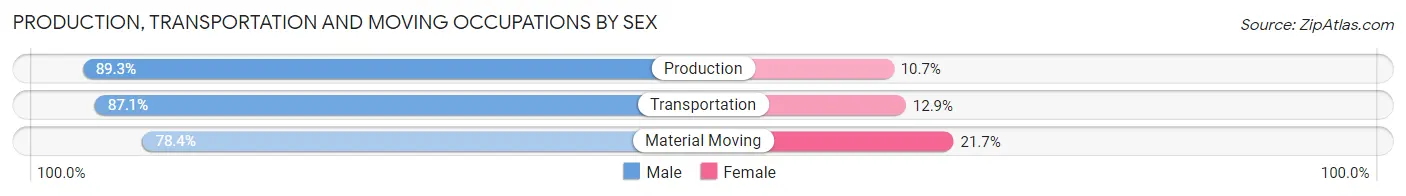
| Occupation | Male | Female |
| Production | 134 (89.3%) | 16 (10.7%) |
| Transportation | 108 (87.1%) | 16 (12.9%) |
| Material Moving | 76 (78.3%) | 21 (21.6%) |
| Total (Category) | 318 (85.7%) | 53 (14.3%) |
| Total (Overall) | 1,489 (51.1%) | 1,424 (48.9%) |
Employment Industries by Sex in Hooksett
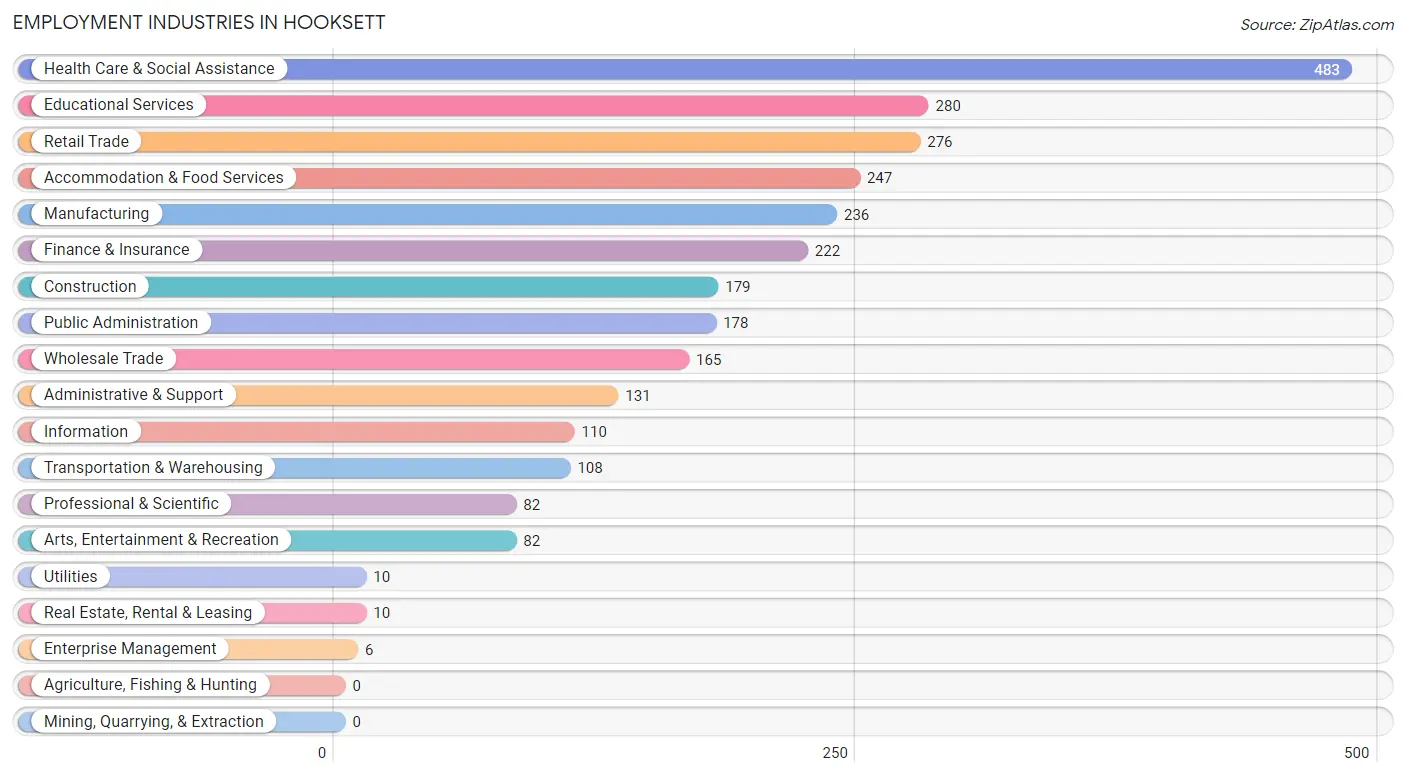
Employment Industries in Hooksett
The major employment industries in Hooksett include Health Care & Social Assistance (483 | 16.6%), Educational Services (280 | 9.6%), Retail Trade (276 | 9.5%), Accommodation & Food Services (247 | 8.5%), and Manufacturing (236 | 8.1%).
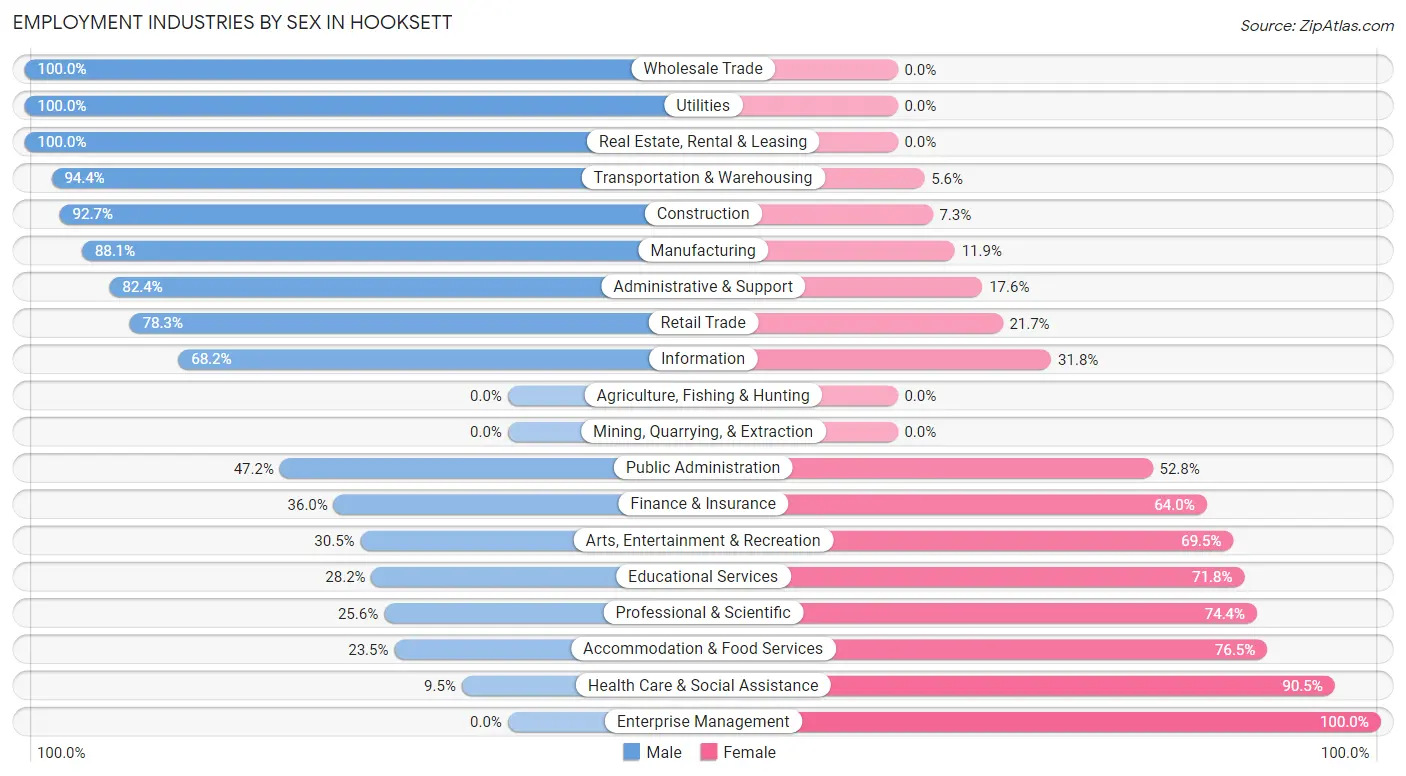
Employment Industries by Sex in Hooksett
The Hooksett industries that see more men than women are Wholesale Trade (100.0%), Utilities (100.0%), and Real Estate, Rental & Leasing (100.0%), whereas the industries that tend to have a higher number of women are Enterprise Management (100.0%), Health Care & Social Assistance (90.5%), and Accommodation & Food Services (76.5%).
| Industry | Male | Female |
| Agriculture, Fishing & Hunting | 0 (0.0%) | 0 (0.0%) |
| Mining, Quarrying, & Extraction | 0 (0.0%) | 0 (0.0%) |
| Construction | 166 (92.7%) | 13 (7.3%) |
| Manufacturing | 208 (88.1%) | 28 (11.9%) |
| Wholesale Trade | 165 (100.0%) | 0 (0.0%) |
| Retail Trade | 216 (78.3%) | 60 (21.7%) |
| Transportation & Warehousing | 102 (94.4%) | 6 (5.6%) |
| Utilities | 10 (100.0%) | 0 (0.0%) |
| Information | 75 (68.2%) | 35 (31.8%) |
| Finance & Insurance | 80 (36.0%) | 142 (64.0%) |
| Real Estate, Rental & Leasing | 10 (100.0%) | 0 (0.0%) |
| Professional & Scientific | 21 (25.6%) | 61 (74.4%) |
| Enterprise Management | 0 (0.0%) | 6 (100.0%) |
| Administrative & Support | 108 (82.4%) | 23 (17.6%) |
| Educational Services | 79 (28.2%) | 201 (71.8%) |
| Health Care & Social Assistance | 46 (9.5%) | 437 (90.5%) |
| Arts, Entertainment & Recreation | 25 (30.5%) | 57 (69.5%) |
| Accommodation & Food Services | 58 (23.5%) | 189 (76.5%) |
| Public Administration | 84 (47.2%) | 94 (52.8%) |
| Total | 1,489 (51.1%) | 1,424 (48.9%) |
Education in Hooksett
School Enrollment in Hooksett
The most common levels of schooling among the 1,064 students in Hooksett are college / undergraduate (352 | 33.1%), elementary school (241 | 22.7%), and middle school (138 | 13.0%).
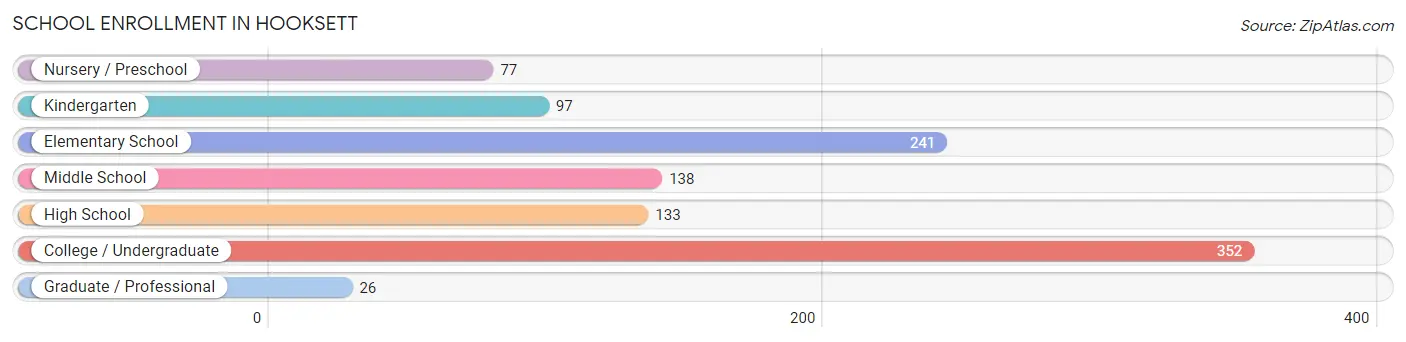
| School Level | # Students | % Students |
| Nursery / Preschool | 77 | 7.2% |
| Kindergarten | 97 | 9.1% |
| Elementary School | 241 | 22.7% |
| Middle School | 138 | 13.0% |
| High School | 133 | 12.5% |
| College / Undergraduate | 352 | 33.1% |
| Graduate / Professional | 26 | 2.4% |
| Total | 1,064 | 100.0% |
School Enrollment by Age by Funding Source in Hooksett
Out of a total of 1,064 students who are enrolled in schools in Hooksett, 255 (24.0%) attend a private institution, while the remaining 809 (76.0%) are enrolled in public schools. The age group of 25 to 34 year olds has the highest likelihood of being enrolled in private schools, with 12 (100.0% in the age bracket) enrolled. Conversely, the age group of 5 to 9 year old has the lowest likelihood of being enrolled in a private school, with 316 (100.0% in the age bracket) attending a public institution.
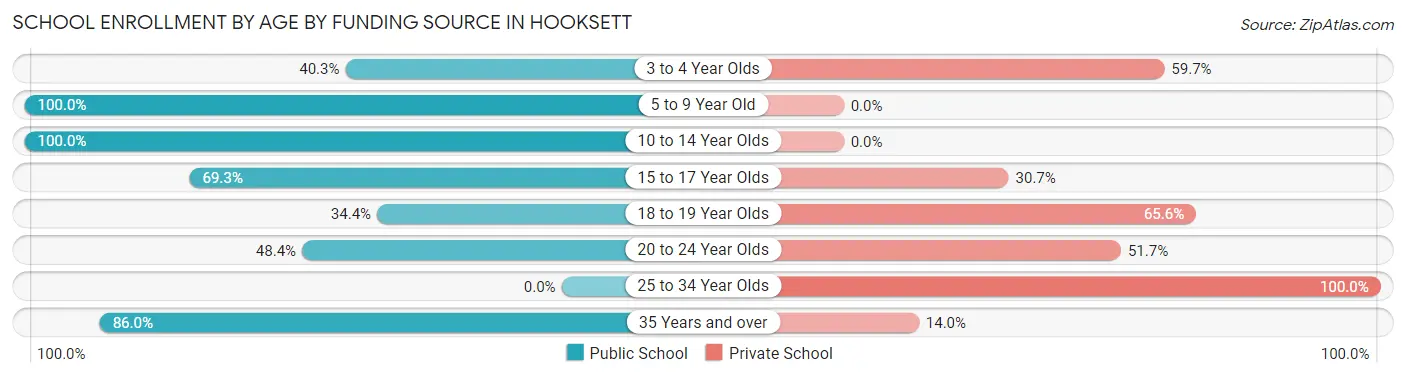
| Age Bracket | Public School | Private School |
| 3 to 4 Year Olds | 31 (40.3%) | 46 (59.7%) |
| 5 to 9 Year Old | 316 (100.0%) | 0 (0.0%) |
| 10 to 14 Year Olds | 160 (100.0%) | 0 (0.0%) |
| 15 to 17 Year Olds | 106 (69.3%) | 47 (30.7%) |
| 18 to 19 Year Olds | 22 (34.4%) | 42 (65.6%) |
| 20 to 24 Year Olds | 88 (48.3%) | 94 (51.6%) |
| 25 to 34 Year Olds | 0 (0.0%) | 12 (100.0%) |
| 35 Years and over | 86 (86.0%) | 14 (14.0%) |
| Total | 809 (76.0%) | 255 (24.0%) |
Educational Attainment by Field of Study in Hooksett
Business (261 | 14.7%), social sciences (241 | 13.6%), education (233 | 13.1%), science & technology (217 | 12.2%), and arts & humanities (141 | 7.9%) are the most common fields of study among 1,775 individuals in Hooksett who have obtained a bachelor's degree or higher.
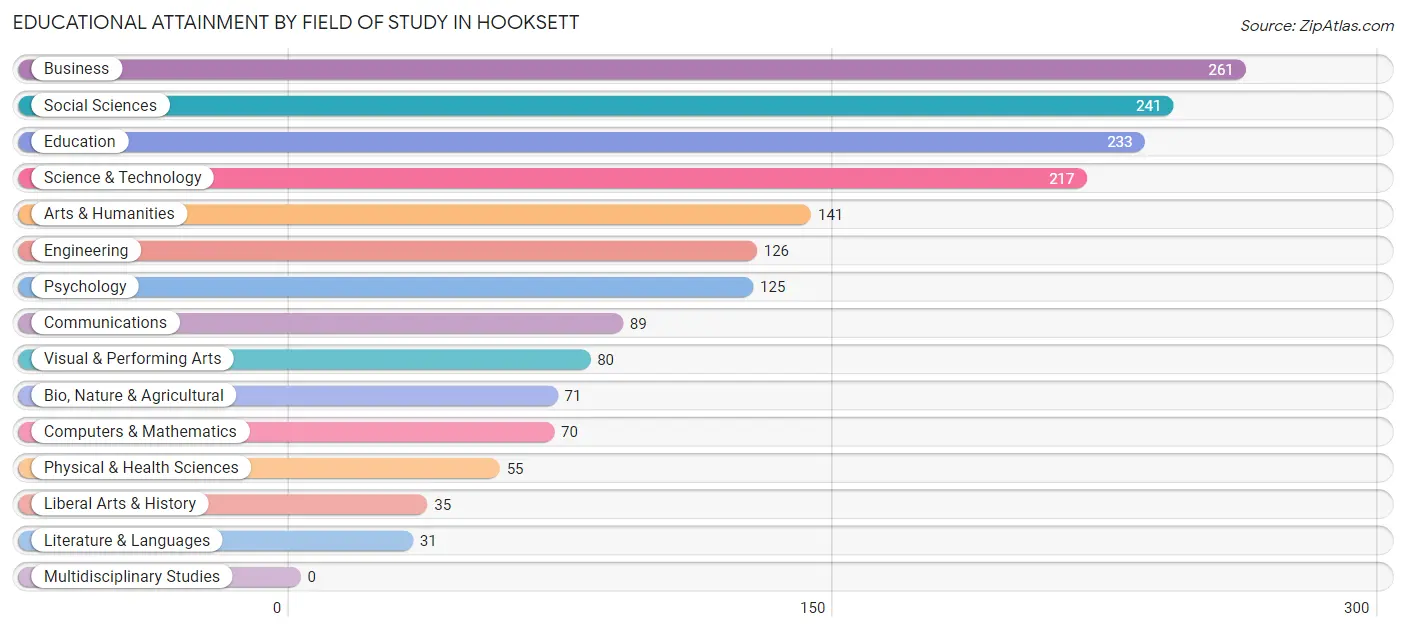
| Field of Study | # Graduates | % Graduates |
| Computers & Mathematics | 70 | 3.9% |
| Bio, Nature & Agricultural | 71 | 4.0% |
| Physical & Health Sciences | 55 | 3.1% |
| Psychology | 125 | 7.0% |
| Social Sciences | 241 | 13.6% |
| Engineering | 126 | 7.1% |
| Multidisciplinary Studies | 0 | 0.0% |
| Science & Technology | 217 | 12.2% |
| Business | 261 | 14.7% |
| Education | 233 | 13.1% |
| Literature & Languages | 31 | 1.8% |
| Liberal Arts & History | 35 | 2.0% |
| Visual & Performing Arts | 80 | 4.5% |
| Communications | 89 | 5.0% |
| Arts & Humanities | 141 | 7.9% |
| Total | 1,775 | 100.0% |
Transportation & Commute in Hooksett
Vehicle Availability by Sex in Hooksett
The most prevalent vehicle ownership categories in Hooksett are males with 2 vehicles (697, accounting for 45.4%) and females with 2 vehicles (777, making up 49.4%).
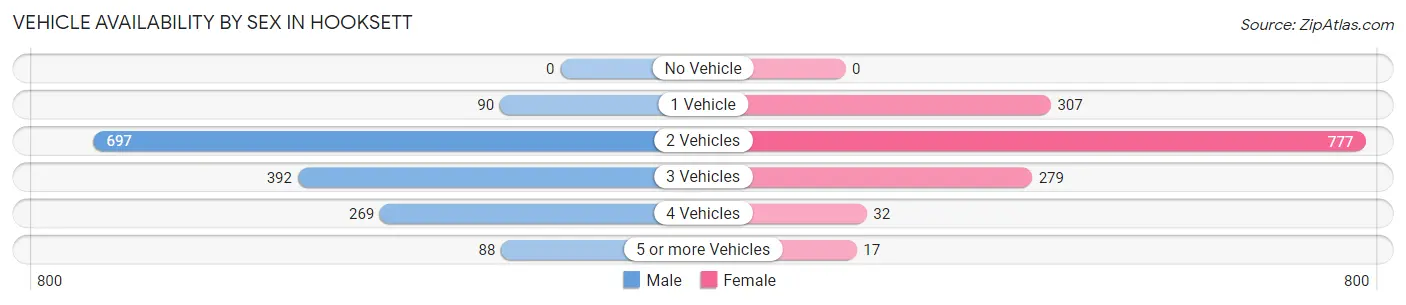
| Vehicles Available | Male | Female |
| No Vehicle | 0 (0.0%) | 0 (0.0%) |
| 1 Vehicle | 90 (5.9%) | 307 (21.7%) |
| 2 Vehicles | 697 (45.4%) | 777 (55.0%) |
| 3 Vehicles | 392 (25.5%) | 279 (19.8%) |
| 4 Vehicles | 269 (17.5%) | 32 (2.3%) |
| 5 or more Vehicles | 88 (5.7%) | 17 (1.2%) |
| Total | 1,536 (100.0%) | 1,412 (100.0%) |
Commute Time in Hooksett
The most frequently occuring commute durations in Hooksett are 20 to 24 minutes (752 commuters, 29.6%), 15 to 19 minutes (526 commuters, 20.7%), and 30 to 34 minutes (361 commuters, 14.2%).
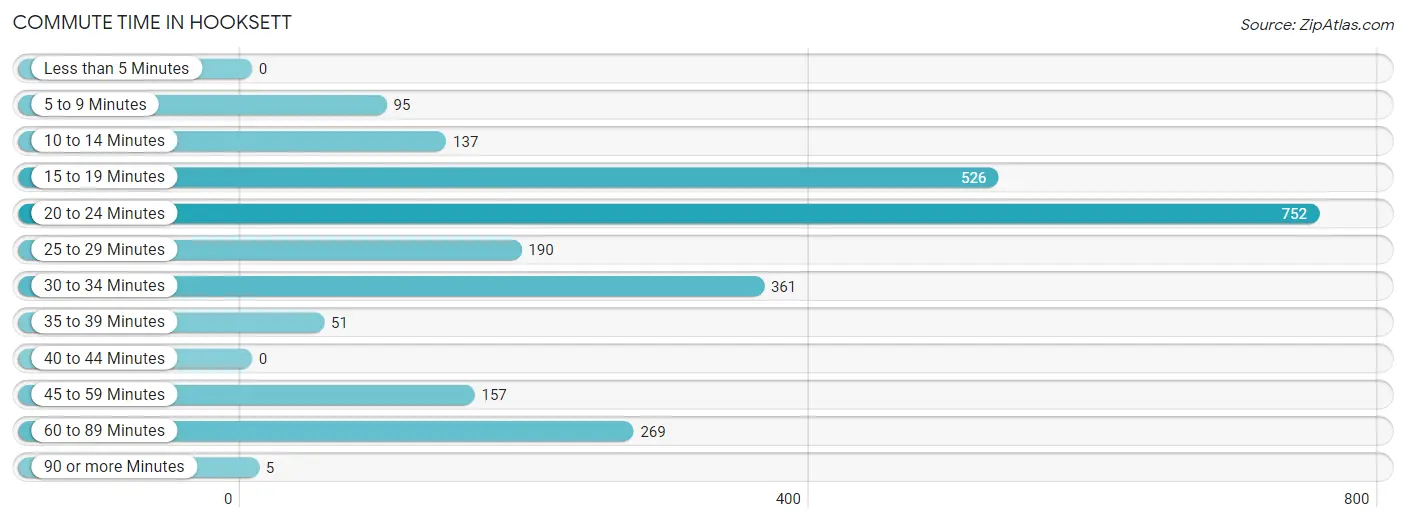
| Commute Time | # Commuters | % Commuters |
| Less than 5 Minutes | 0 | 0.0% |
| 5 to 9 Minutes | 95 | 3.7% |
| 10 to 14 Minutes | 137 | 5.4% |
| 15 to 19 Minutes | 526 | 20.7% |
| 20 to 24 Minutes | 752 | 29.6% |
| 25 to 29 Minutes | 190 | 7.5% |
| 30 to 34 Minutes | 361 | 14.2% |
| 35 to 39 Minutes | 51 | 2.0% |
| 40 to 44 Minutes | 0 | 0.0% |
| 45 to 59 Minutes | 157 | 6.2% |
| 60 to 89 Minutes | 269 | 10.6% |
| 90 or more Minutes | 5 | 0.2% |
Commute Time by Sex in Hooksett
The most common commute times in Hooksett are 20 to 24 minutes (349 commuters, 26.5%) for males and 20 to 24 minutes (403 commuters, 32.8%) for females.
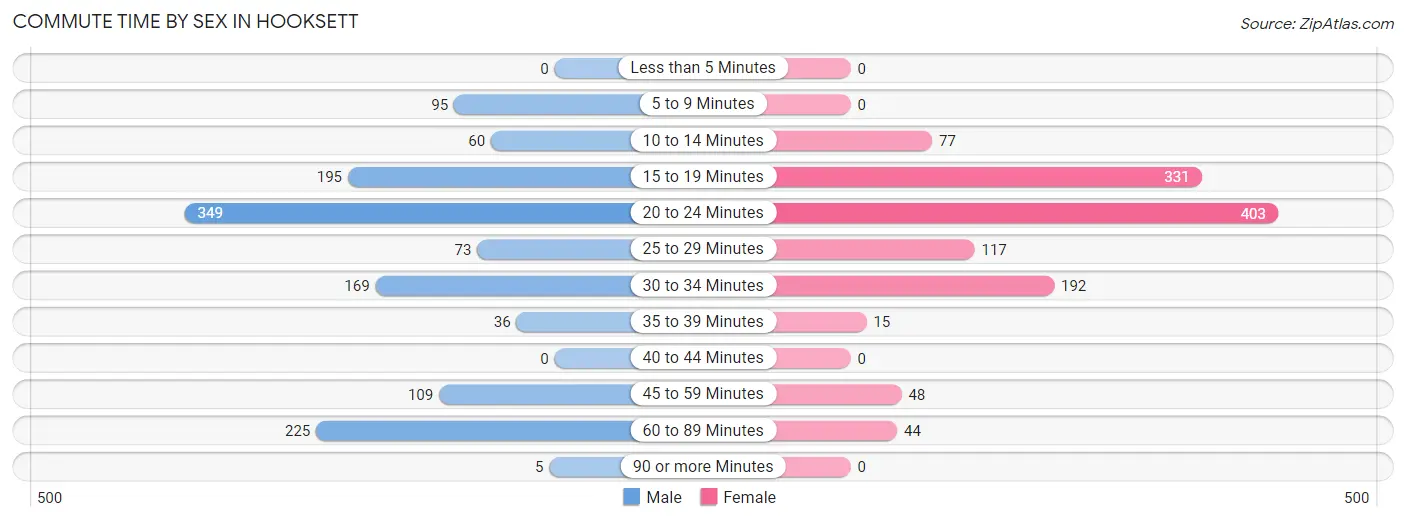
| Commute Time | Male | Female |
| Less than 5 Minutes | 0 (0.0%) | 0 (0.0%) |
| 5 to 9 Minutes | 95 (7.2%) | 0 (0.0%) |
| 10 to 14 Minutes | 60 (4.6%) | 77 (6.3%) |
| 15 to 19 Minutes | 195 (14.8%) | 331 (27.0%) |
| 20 to 24 Minutes | 349 (26.5%) | 403 (32.8%) |
| 25 to 29 Minutes | 73 (5.6%) | 117 (9.5%) |
| 30 to 34 Minutes | 169 (12.8%) | 192 (15.7%) |
| 35 to 39 Minutes | 36 (2.7%) | 15 (1.2%) |
| 40 to 44 Minutes | 0 (0.0%) | 0 (0.0%) |
| 45 to 59 Minutes | 109 (8.3%) | 48 (3.9%) |
| 60 to 89 Minutes | 225 (17.1%) | 44 (3.6%) |
| 90 or more Minutes | 5 (0.4%) | 0 (0.0%) |
Time of Departure to Work by Sex in Hooksett
The most frequent times of departure to work in Hooksett are 6:30 AM to 6:59 AM (233, 17.7%) for males and 7:30 AM to 7:59 AM (385, 31.4%) for females.
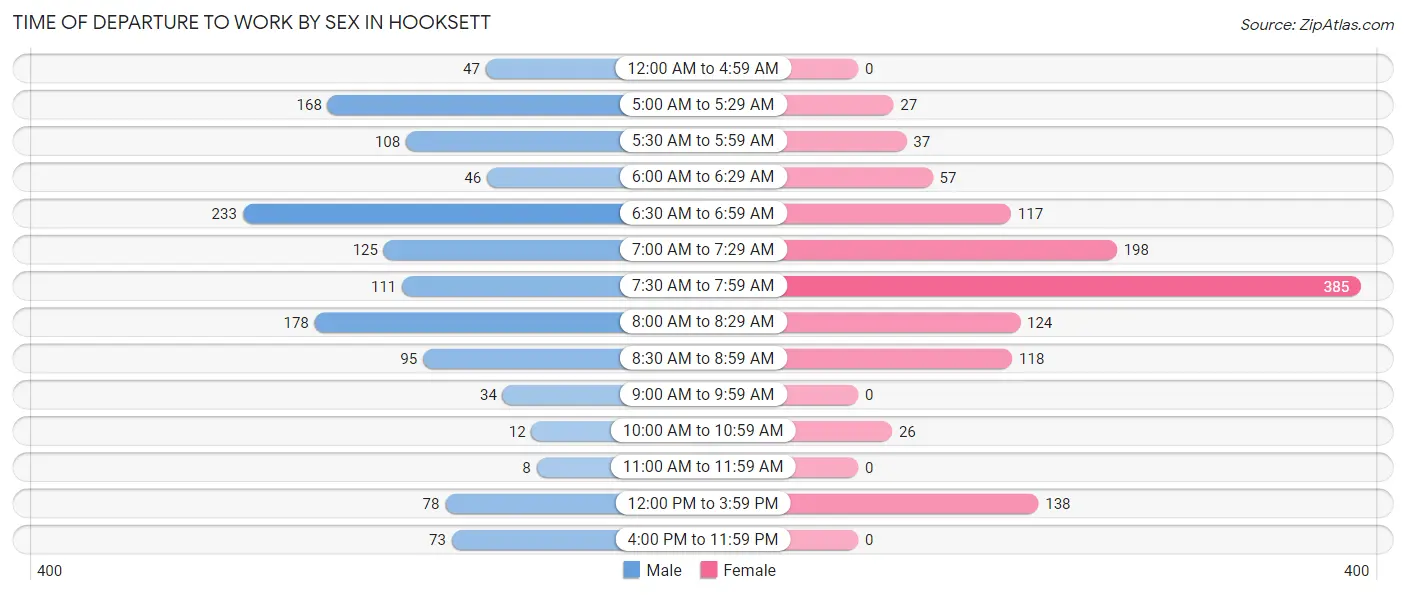
| Time of Departure | Male | Female |
| 12:00 AM to 4:59 AM | 47 (3.6%) | 0 (0.0%) |
| 5:00 AM to 5:29 AM | 168 (12.8%) | 27 (2.2%) |
| 5:30 AM to 5:59 AM | 108 (8.2%) | 37 (3.0%) |
| 6:00 AM to 6:29 AM | 46 (3.5%) | 57 (4.6%) |
| 6:30 AM to 6:59 AM | 233 (17.7%) | 117 (9.5%) |
| 7:00 AM to 7:29 AM | 125 (9.5%) | 198 (16.1%) |
| 7:30 AM to 7:59 AM | 111 (8.4%) | 385 (31.4%) |
| 8:00 AM to 8:29 AM | 178 (13.5%) | 124 (10.1%) |
| 8:30 AM to 8:59 AM | 95 (7.2%) | 118 (9.6%) |
| 9:00 AM to 9:59 AM | 34 (2.6%) | 0 (0.0%) |
| 10:00 AM to 10:59 AM | 12 (0.9%) | 26 (2.1%) |
| 11:00 AM to 11:59 AM | 8 (0.6%) | 0 (0.0%) |
| 12:00 PM to 3:59 PM | 78 (5.9%) | 138 (11.3%) |
| 4:00 PM to 11:59 PM | 73 (5.6%) | 0 (0.0%) |
| Total | 1,316 (100.0%) | 1,227 (100.0%) |
Housing Occupancy in Hooksett
Occupancy by Ownership in Hooksett
Of the total 2,221 dwellings in Hooksett, owner-occupied units account for 1,475 (66.4%), while renter-occupied units make up 746 (33.6%).
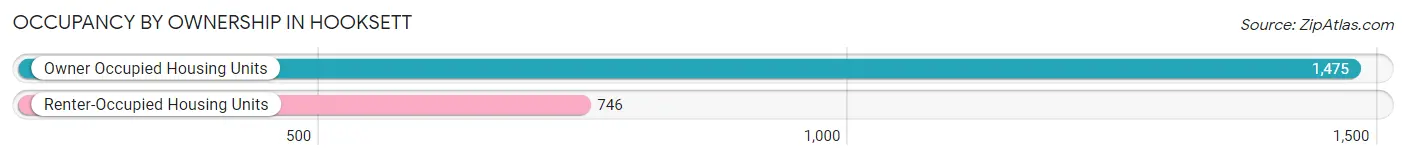
| Occupancy | # Housing Units | % Housing Units |
| Owner Occupied Housing Units | 1,475 | 66.4% |
| Renter-Occupied Housing Units | 746 | 33.6% |
| Total Occupied Housing Units | 2,221 | 100.0% |
Occupancy by Household Size in Hooksett
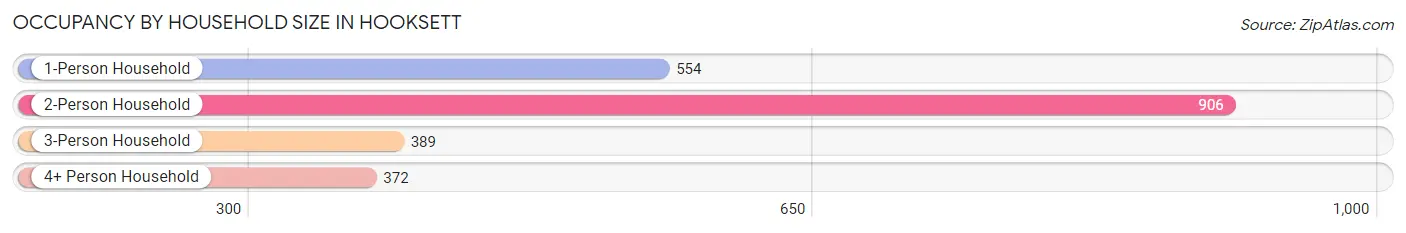
| Household Size | # Housing Units | % Housing Units |
| 1-Person Household | 554 | 24.9% |
| 2-Person Household | 906 | 40.8% |
| 3-Person Household | 389 | 17.5% |
| 4+ Person Household | 372 | 16.8% |
| Total Housing Units | 2,221 | 100.0% |
Occupancy by Ownership by Household Size in Hooksett
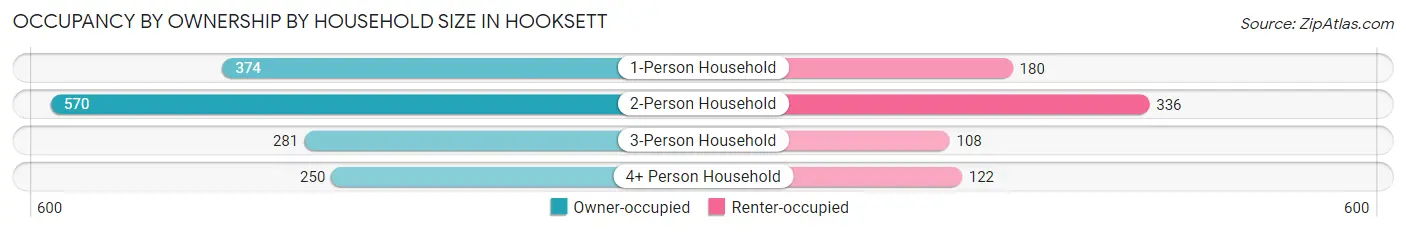
| Household Size | Owner-occupied | Renter-occupied |
| 1-Person Household | 374 (67.5%) | 180 (32.5%) |
| 2-Person Household | 570 (62.9%) | 336 (37.1%) |
| 3-Person Household | 281 (72.2%) | 108 (27.8%) |
| 4+ Person Household | 250 (67.2%) | 122 (32.8%) |
| Total Housing Units | 1,475 (66.4%) | 746 (33.6%) |
Occupancy by Educational Attainment in Hooksett
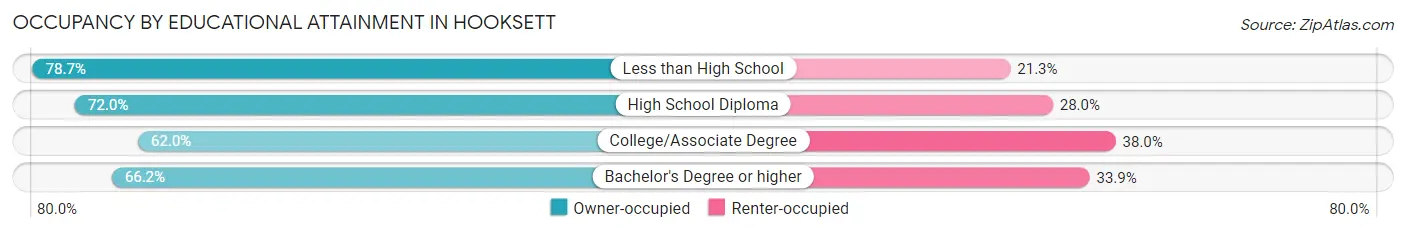
| Household Size | Owner-occupied | Renter-occupied |
| Less than High School | 37 (78.7%) | 10 (21.3%) |
| High School Diploma | 357 (72.0%) | 139 (28.0%) |
| College/Associate Degree | 436 (62.0%) | 267 (38.0%) |
| Bachelor's Degree or higher | 645 (66.1%) | 330 (33.9%) |
Occupancy by Age of Householder in Hooksett
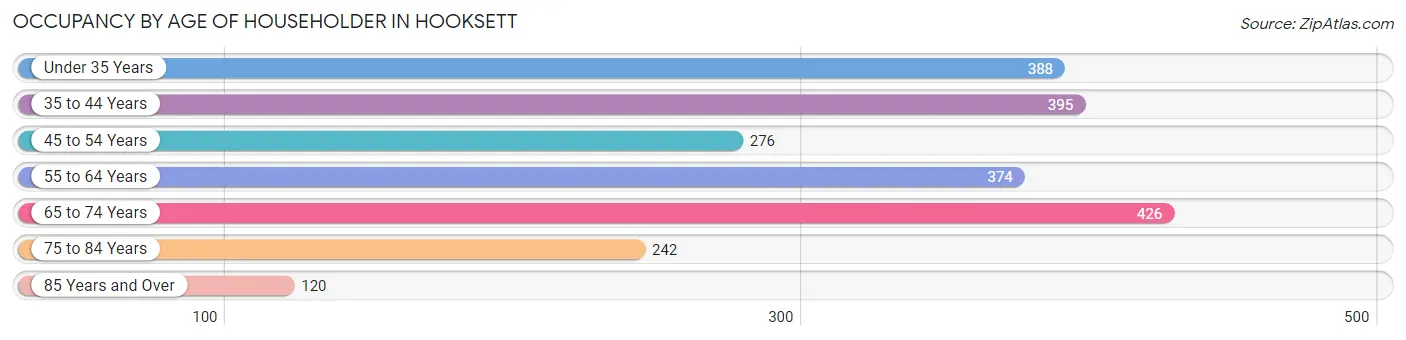
| Age Bracket | # Households | % Households |
| Under 35 Years | 388 | 17.5% |
| 35 to 44 Years | 395 | 17.8% |
| 45 to 54 Years | 276 | 12.4% |
| 55 to 64 Years | 374 | 16.8% |
| 65 to 74 Years | 426 | 19.2% |
| 75 to 84 Years | 242 | 10.9% |
| 85 Years and Over | 120 | 5.4% |
| Total | 2,221 | 100.0% |
Housing Finances in Hooksett
Median Income by Occupancy in Hooksett
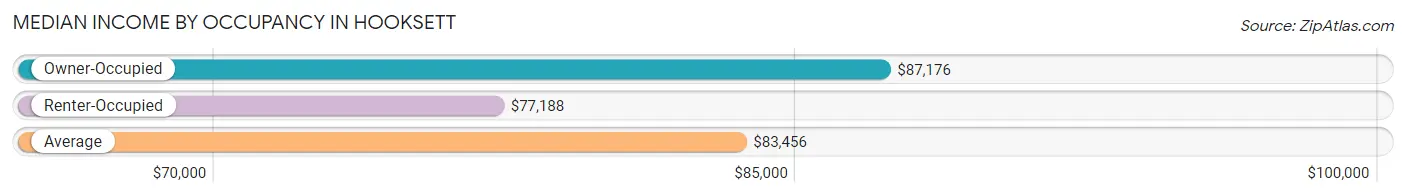
| Occupancy Type | # Households | Median Income |
| Owner-Occupied | 1,475 (66.4%) | $87,176 |
| Renter-Occupied | 746 (33.6%) | $77,188 |
| Average | 2,221 (100.0%) | $83,456 |
Occupancy by Householder Income Bracket in Hooksett
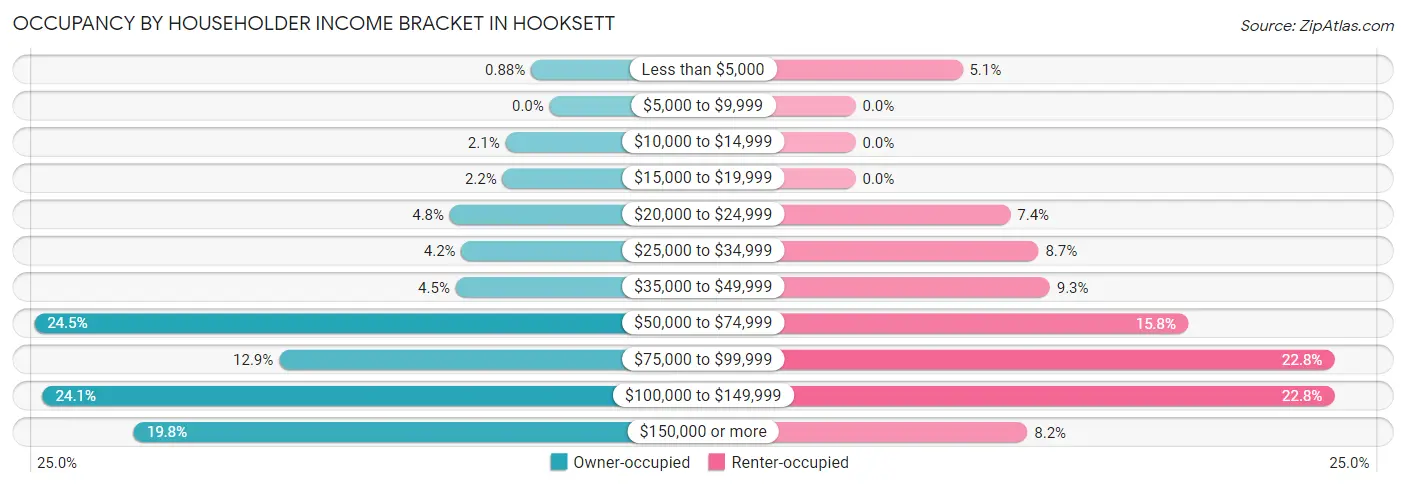
| Income Bracket | Owner-occupied | Renter-occupied |
| Less than $5,000 | 13 (0.9%) | 38 (5.1%) |
| $5,000 to $9,999 | 0 (0.0%) | 0 (0.0%) |
| $10,000 to $14,999 | 31 (2.1%) | 0 (0.0%) |
| $15,000 to $19,999 | 33 (2.2%) | 0 (0.0%) |
| $20,000 to $24,999 | 70 (4.8%) | 55 (7.4%) |
| $25,000 to $34,999 | 62 (4.2%) | 65 (8.7%) |
| $35,000 to $49,999 | 66 (4.5%) | 69 (9.2%) |
| $50,000 to $74,999 | 362 (24.5%) | 118 (15.8%) |
| $75,000 to $99,999 | 190 (12.9%) | 170 (22.8%) |
| $100,000 to $149,999 | 356 (24.1%) | 170 (22.8%) |
| $150,000 or more | 292 (19.8%) | 61 (8.2%) |
| Total | 1,475 (100.0%) | 746 (100.0%) |
Monthly Housing Cost Tiers in Hooksett
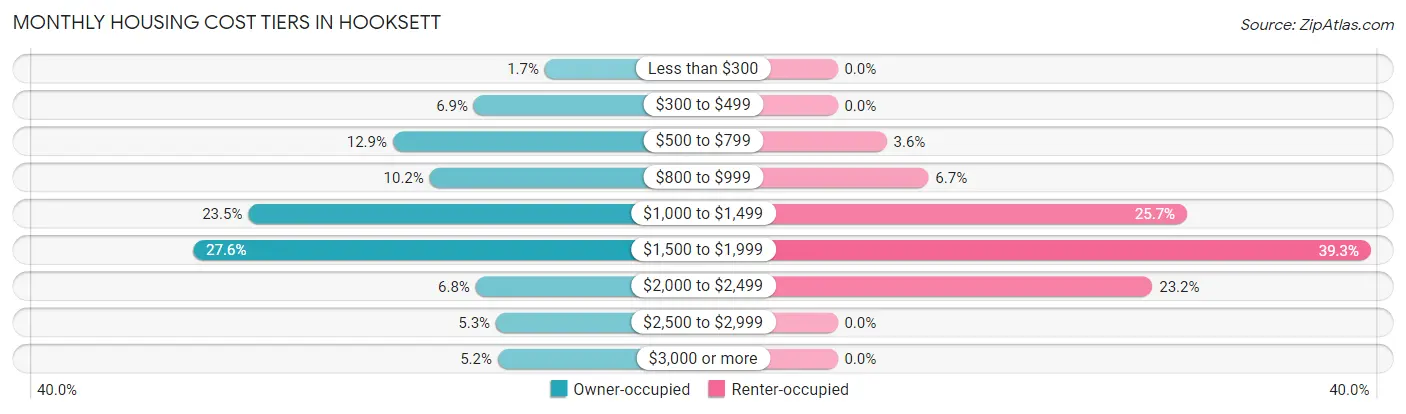
| Monthly Cost | Owner-occupied | Renter-occupied |
| Less than $300 | 25 (1.7%) | 0 (0.0%) |
| $300 to $499 | 102 (6.9%) | 0 (0.0%) |
| $500 to $799 | 190 (12.9%) | 27 (3.6%) |
| $800 to $999 | 150 (10.2%) | 50 (6.7%) |
| $1,000 to $1,499 | 347 (23.5%) | 192 (25.7%) |
| $1,500 to $1,999 | 407 (27.6%) | 293 (39.3%) |
| $2,000 to $2,499 | 100 (6.8%) | 173 (23.2%) |
| $2,500 to $2,999 | 78 (5.3%) | 0 (0.0%) |
| $3,000 or more | 76 (5.1%) | 0 (0.0%) |
| Total | 1,475 (100.0%) | 746 (100.0%) |
Physical Housing Characteristics in Hooksett
Housing Structures in Hooksett
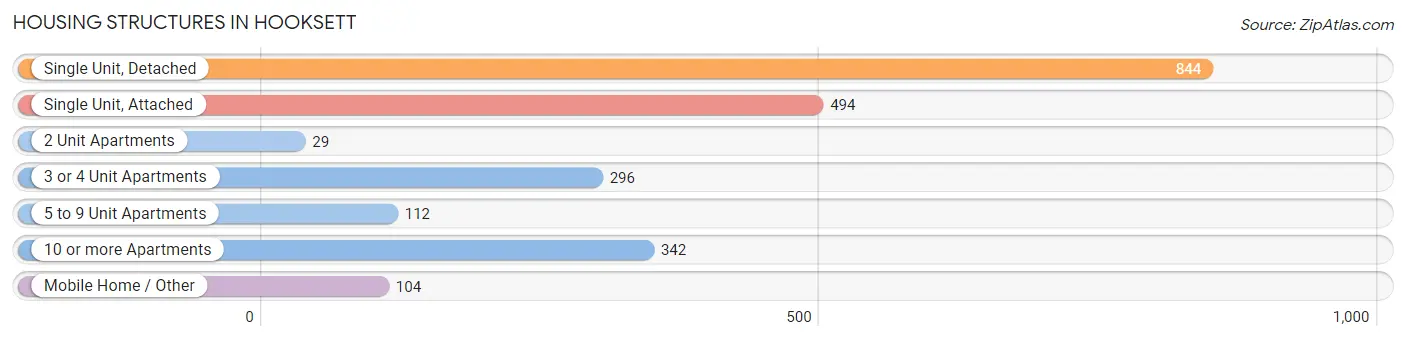
| Structure Type | # Housing Units | % Housing Units |
| Single Unit, Detached | 844 | 38.0% |
| Single Unit, Attached | 494 | 22.2% |
| 2 Unit Apartments | 29 | 1.3% |
| 3 or 4 Unit Apartments | 296 | 13.3% |
| 5 to 9 Unit Apartments | 112 | 5.0% |
| 10 or more Apartments | 342 | 15.4% |
| Mobile Home / Other | 104 | 4.7% |
| Total | 2,221 | 100.0% |
Housing Structures by Occupancy in Hooksett
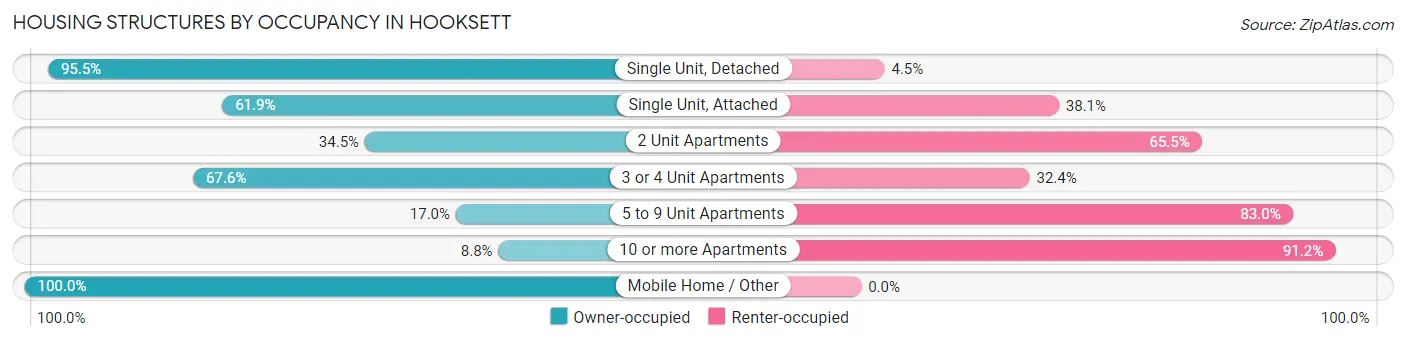
| Structure Type | Owner-occupied | Renter-occupied |
| Single Unit, Detached | 806 (95.5%) | 38 (4.5%) |
| Single Unit, Attached | 306 (61.9%) | 188 (38.1%) |
| 2 Unit Apartments | 10 (34.5%) | 19 (65.5%) |
| 3 or 4 Unit Apartments | 200 (67.6%) | 96 (32.4%) |
| 5 to 9 Unit Apartments | 19 (17.0%) | 93 (83.0%) |
| 10 or more Apartments | 30 (8.8%) | 312 (91.2%) |
| Mobile Home / Other | 104 (100.0%) | 0 (0.0%) |
| Total | 1,475 (66.4%) | 746 (33.6%) |
Housing Structures by Number of Rooms in Hooksett
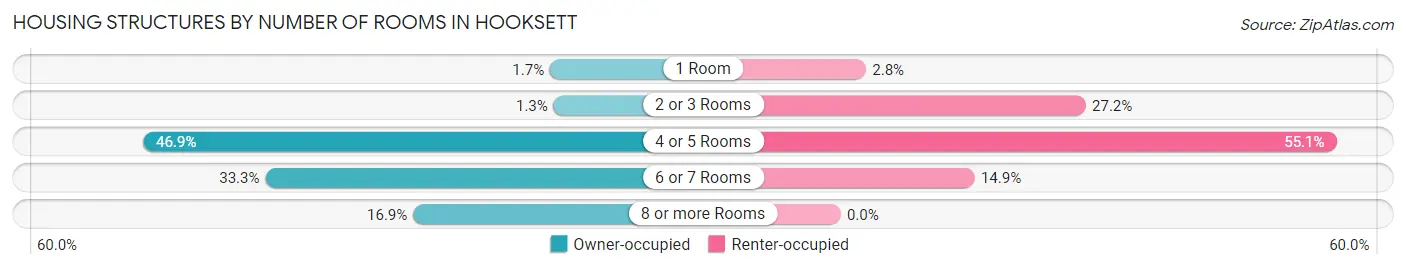
| Number of Rooms | Owner-occupied | Renter-occupied |
| 1 Room | 25 (1.7%) | 21 (2.8%) |
| 2 or 3 Rooms | 19 (1.3%) | 203 (27.2%) |
| 4 or 5 Rooms | 691 (46.9%) | 411 (55.1%) |
| 6 or 7 Rooms | 491 (33.3%) | 111 (14.9%) |
| 8 or more Rooms | 249 (16.9%) | 0 (0.0%) |
| Total | 1,475 (100.0%) | 746 (100.0%) |
Housing Structure by Heating Type in Hooksett
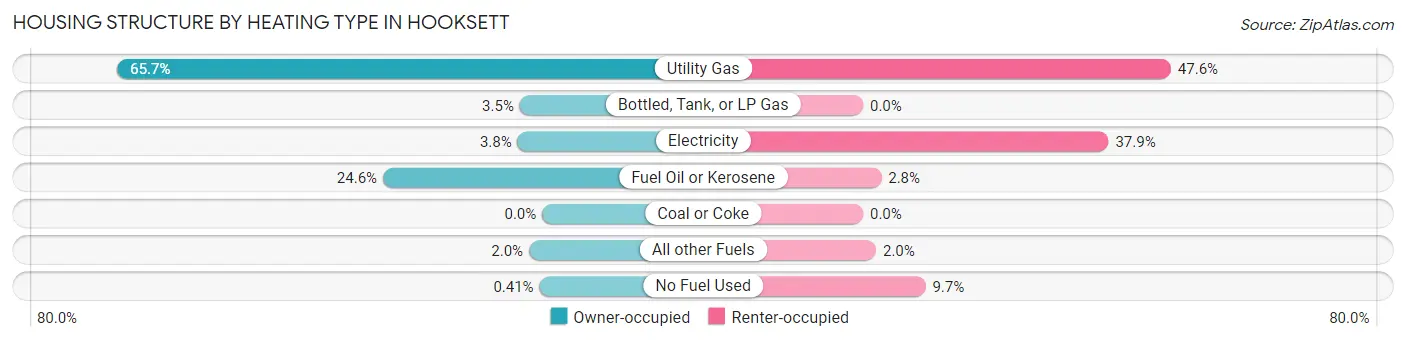
| Heating Type | Owner-occupied | Renter-occupied |
| Utility Gas | 969 (65.7%) | 355 (47.6%) |
| Bottled, Tank, or LP Gas | 51 (3.5%) | 0 (0.0%) |
| Electricity | 56 (3.8%) | 283 (37.9%) |
| Fuel Oil or Kerosene | 363 (24.6%) | 21 (2.8%) |
| Coal or Coke | 0 (0.0%) | 0 (0.0%) |
| All other Fuels | 30 (2.0%) | 15 (2.0%) |
| No Fuel Used | 6 (0.4%) | 72 (9.7%) |
| Total | 1,475 (100.0%) | 746 (100.0%) |
Household Vehicle Usage in Hooksett
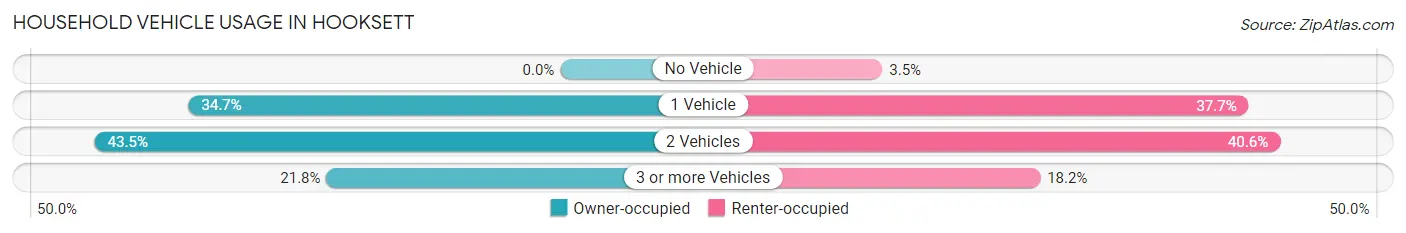
| Vehicles per Household | Owner-occupied | Renter-occupied |
| No Vehicle | 0 (0.0%) | 26 (3.5%) |
| 1 Vehicle | 512 (34.7%) | 281 (37.7%) |
| 2 Vehicles | 641 (43.5%) | 303 (40.6%) |
| 3 or more Vehicles | 322 (21.8%) | 136 (18.2%) |
| Total | 1,475 (100.0%) | 746 (100.0%) |
Real Estate & Mortgages in Hooksett
Real Estate and Mortgage Overview in Hooksett
| Characteristic | Without Mortgage | With Mortgage |
| Housing Units | 767 | 708 |
| Median Property Value | $225,500 | $275,300 |
| Median Household Income | $63,194 | $184 |
| Monthly Housing Costs | $886 | $76 |
| Real Estate Taxes | $4,332 | $0 |
Property Value by Mortgage Status in Hooksett
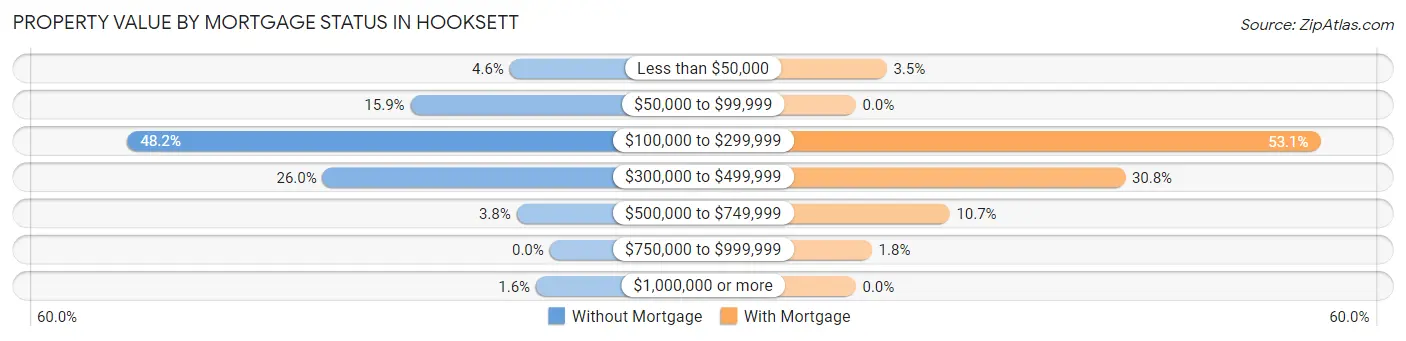
| Property Value | Without Mortgage | With Mortgage |
| Less than $50,000 | 35 (4.6%) | 25 (3.5%) |
| $50,000 to $99,999 | 122 (15.9%) | 0 (0.0%) |
| $100,000 to $299,999 | 370 (48.2%) | 376 (53.1%) |
| $300,000 to $499,999 | 199 (26.0%) | 218 (30.8%) |
| $500,000 to $749,999 | 29 (3.8%) | 76 (10.7%) |
| $750,000 to $999,999 | 0 (0.0%) | 13 (1.8%) |
| $1,000,000 or more | 12 (1.6%) | 0 (0.0%) |
| Total | 767 (100.0%) | 708 (100.0%) |
Household Income by Mortgage Status in Hooksett
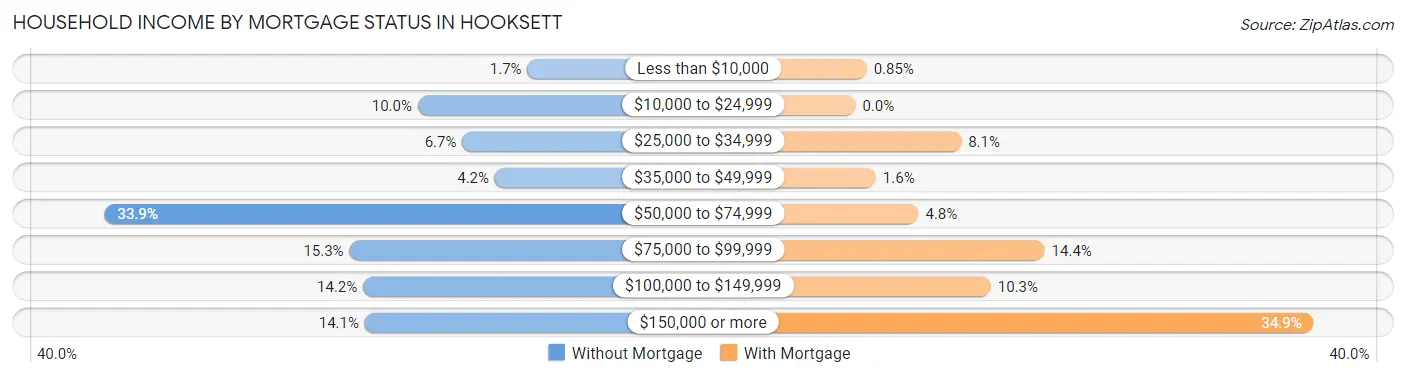
| Household Income | Without Mortgage | With Mortgage |
| Less than $10,000 | 13 (1.7%) | 6 (0.9%) |
| $10,000 to $24,999 | 77 (10.0%) | 0 (0.0%) |
| $25,000 to $34,999 | 51 (6.7%) | 57 (8.1%) |
| $35,000 to $49,999 | 32 (4.2%) | 11 (1.5%) |
| $50,000 to $74,999 | 260 (33.9%) | 34 (4.8%) |
| $75,000 to $99,999 | 117 (15.2%) | 102 (14.4%) |
| $100,000 to $149,999 | 109 (14.2%) | 73 (10.3%) |
| $150,000 or more | 108 (14.1%) | 247 (34.9%) |
| Total | 767 (100.0%) | 708 (100.0%) |
Property Value to Household Income Ratio in Hooksett
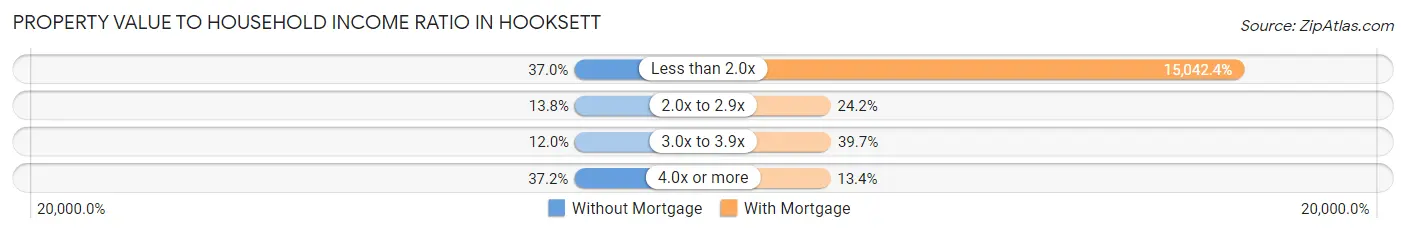
| Value-to-Income Ratio | Without Mortgage | With Mortgage |
| Less than 2.0x | 284 (37.0%) | 106,500 (15,042.4%) |
| 2.0x to 2.9x | 106 (13.8%) | 171 (24.1%) |
| 3.0x to 3.9x | 92 (12.0%) | 281 (39.7%) |
| 4.0x or more | 285 (37.2%) | 95 (13.4%) |
| Total | 767 (100.0%) | 708 (100.0%) |
Real Estate Taxes by Mortgage Status in Hooksett
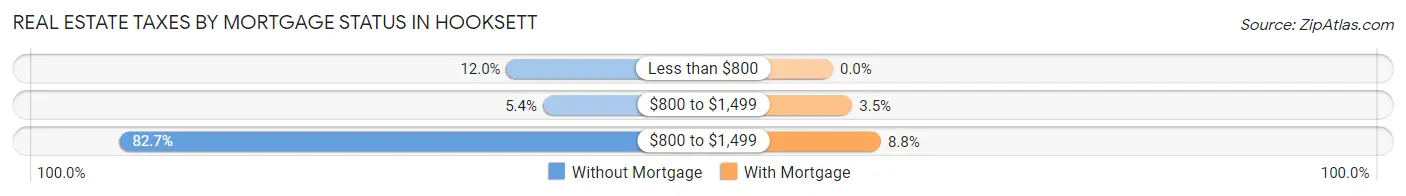
| Property Taxes | Without Mortgage | With Mortgage |
| Less than $800 | 92 (12.0%) | 0 (0.0%) |
| $800 to $1,499 | 41 (5.3%) | 25 (3.5%) |
| $800 to $1,499 | 634 (82.7%) | 62 (8.8%) |
| Total | 767 (100.0%) | 708 (100.0%) |
Health & Disability in Hooksett
Health Insurance Coverage by Age in Hooksett
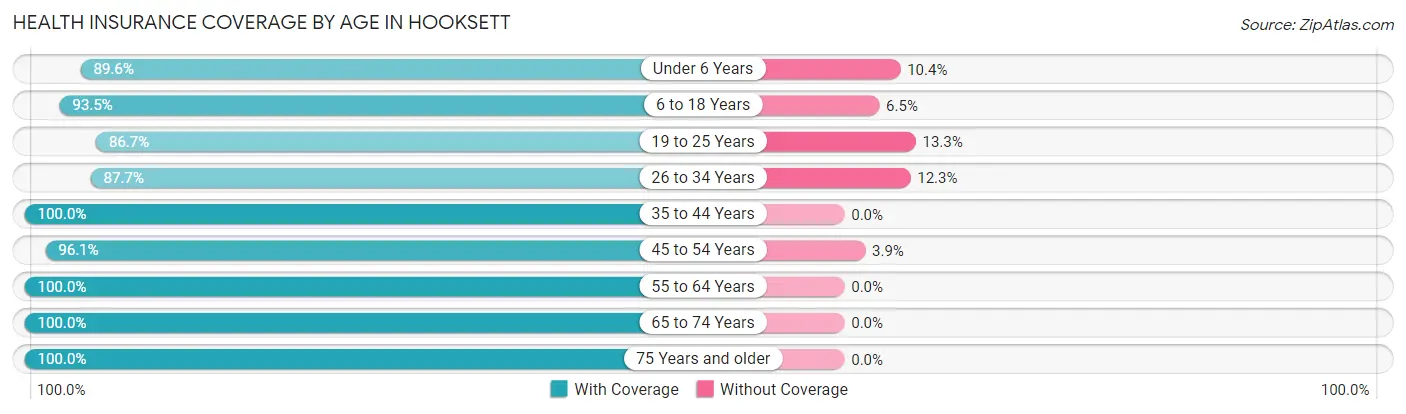
| Age Bracket | With Coverage | Without Coverage |
| Under 6 Years | 249 (89.6%) | 29 (10.4%) |
| 6 to 18 Years | 518 (93.5%) | 36 (6.5%) |
| 19 to 25 Years | 503 (86.7%) | 77 (13.3%) |
| 26 to 34 Years | 592 (87.7%) | 83 (12.3%) |
| 35 to 44 Years | 694 (100.0%) | 0 (0.0%) |
| 45 to 54 Years | 495 (96.1%) | 20 (3.9%) |
| 55 to 64 Years | 682 (100.0%) | 0 (0.0%) |
| 65 to 74 Years | 752 (100.0%) | 0 (0.0%) |
| 75 Years and older | 475 (100.0%) | 0 (0.0%) |
| Total | 4,960 (95.3%) | 245 (4.7%) |
Health Insurance Coverage by Citizenship Status in Hooksett
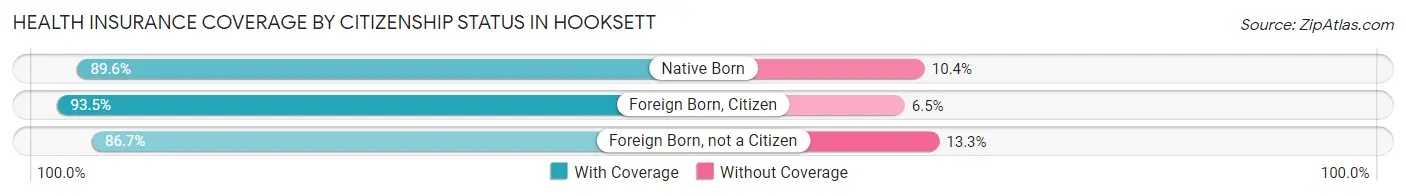
| Citizenship Status | With Coverage | Without Coverage |
| Native Born | 249 (89.6%) | 29 (10.4%) |
| Foreign Born, Citizen | 518 (93.5%) | 36 (6.5%) |
| Foreign Born, not a Citizen | 503 (86.7%) | 77 (13.3%) |
Health Insurance Coverage by Household Income in Hooksett
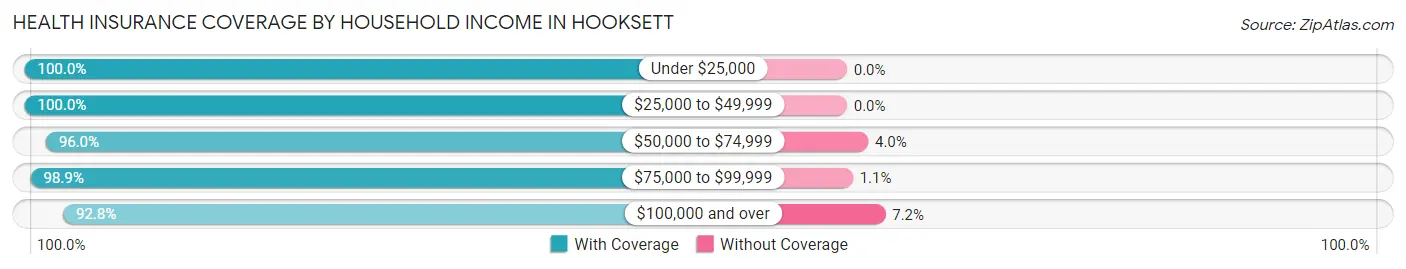
| Household Income | With Coverage | Without Coverage |
| Under $25,000 | 378 (100.0%) | 0 (0.0%) |
| $25,000 to $49,999 | 368 (100.0%) | 0 (0.0%) |
| $50,000 to $74,999 | 797 (96.0%) | 33 (4.0%) |
| $75,000 to $99,999 | 805 (98.9%) | 9 (1.1%) |
| $100,000 and over | 2,612 (92.8%) | 203 (7.2%) |
Public vs Private Health Insurance Coverage by Age in Hooksett
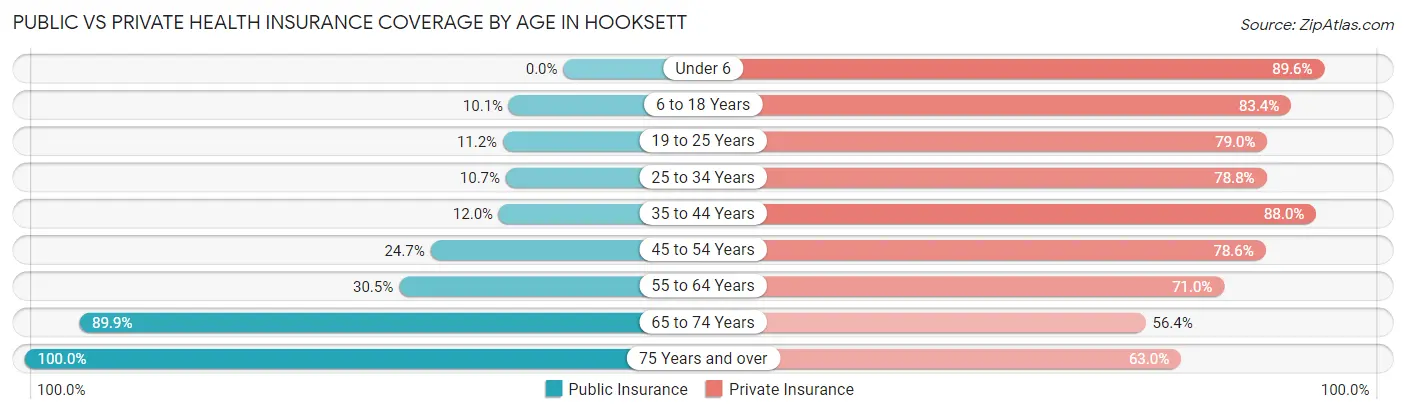
| Age Bracket | Public Insurance | Private Insurance |
| Under 6 | 0 (0.0%) | 249 (89.6%) |
| 6 to 18 Years | 56 (10.1%) | 462 (83.4%) |
| 19 to 25 Years | 65 (11.2%) | 458 (79.0%) |
| 25 to 34 Years | 72 (10.7%) | 532 (78.8%) |
| 35 to 44 Years | 83 (12.0%) | 611 (88.0%) |
| 45 to 54 Years | 127 (24.7%) | 405 (78.6%) |
| 55 to 64 Years | 208 (30.5%) | 484 (71.0%) |
| 65 to 74 Years | 676 (89.9%) | 424 (56.4%) |
| 75 Years and over | 475 (100.0%) | 299 (62.9%) |
| Total | 1,762 (33.9%) | 3,924 (75.4%) |
Disability Status by Sex by Age in Hooksett
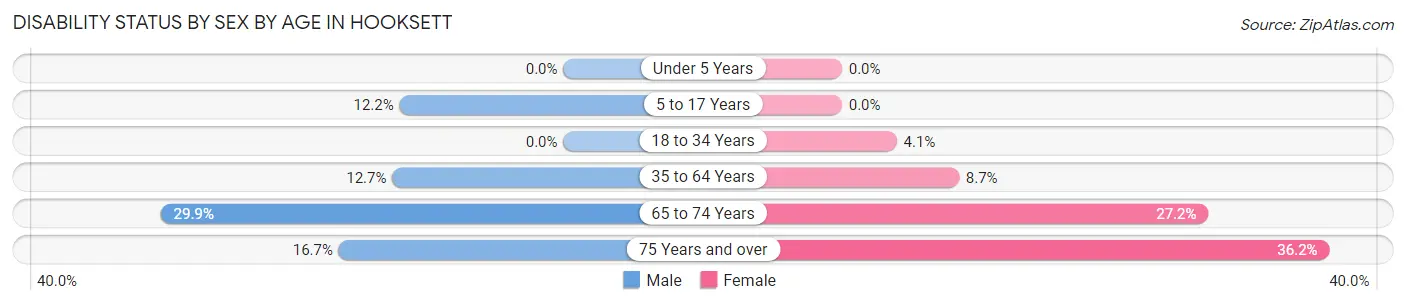
| Age Bracket | Male | Female |
| Under 5 Years | 0 (0.0%) | 0 (0.0%) |
| 5 to 17 Years | 40 (12.2%) | 0 (0.0%) |
| 18 to 34 Years | 0 (0.0%) | 24 (4.1%) |
| 35 to 64 Years | 113 (12.7%) | 87 (8.7%) |
| 65 to 74 Years | 93 (29.9%) | 120 (27.2%) |
| 75 Years and over | 23 (16.7%) | 122 (36.2%) |
Disability Class by Sex by Age in Hooksett
Disability Class: Hearing Difficulty
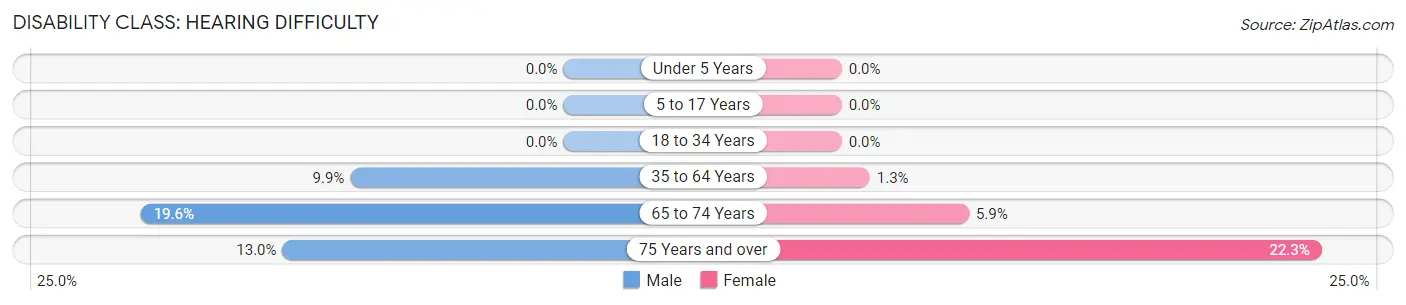
| Age Bracket | Male | Female |
| Under 5 Years | 0 (0.0%) | 0 (0.0%) |
| 5 to 17 Years | 0 (0.0%) | 0 (0.0%) |
| 18 to 34 Years | 0 (0.0%) | 0 (0.0%) |
| 35 to 64 Years | 88 (9.9%) | 13 (1.3%) |
| 65 to 74 Years | 61 (19.6%) | 26 (5.9%) |
| 75 Years and over | 18 (13.0%) | 75 (22.3%) |
Disability Class: Vision Difficulty
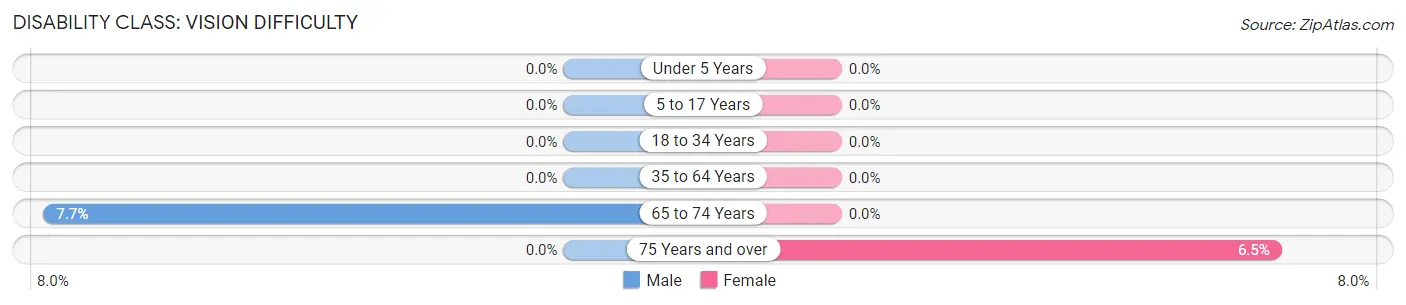
| Age Bracket | Male | Female |
| Under 5 Years | 0 (0.0%) | 0 (0.0%) |
| 5 to 17 Years | 0 (0.0%) | 0 (0.0%) |
| 18 to 34 Years | 0 (0.0%) | 0 (0.0%) |
| 35 to 64 Years | 0 (0.0%) | 0 (0.0%) |
| 65 to 74 Years | 24 (7.7%) | 0 (0.0%) |
| 75 Years and over | 0 (0.0%) | 22 (6.5%) |
Disability Class: Cognitive Difficulty
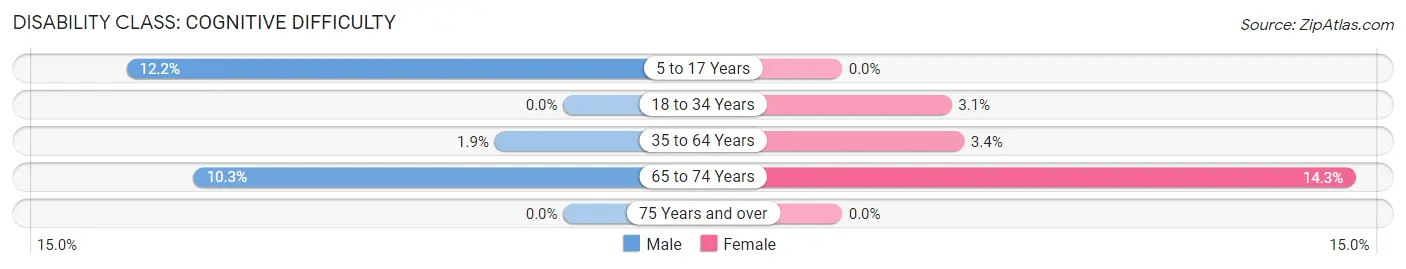
| Age Bracket | Male | Female |
| 5 to 17 Years | 40 (12.2%) | 0 (0.0%) |
| 18 to 34 Years | 0 (0.0%) | 18 (3.0%) |
| 35 to 64 Years | 17 (1.9%) | 34 (3.4%) |
| 65 to 74 Years | 32 (10.3%) | 63 (14.3%) |
| 75 Years and over | 0 (0.0%) | 0 (0.0%) |
Disability Class: Ambulatory Difficulty
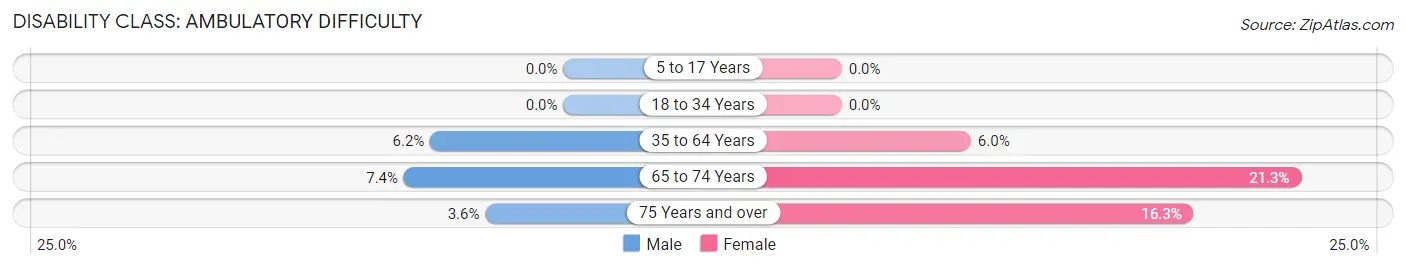
| Age Bracket | Male | Female |
| 5 to 17 Years | 0 (0.0%) | 0 (0.0%) |
| 18 to 34 Years | 0 (0.0%) | 0 (0.0%) |
| 35 to 64 Years | 55 (6.2%) | 60 (6.0%) |
| 65 to 74 Years | 23 (7.4%) | 94 (21.3%) |
| 75 Years and over | 5 (3.6%) | 55 (16.3%) |
Disability Class: Self-Care Difficulty
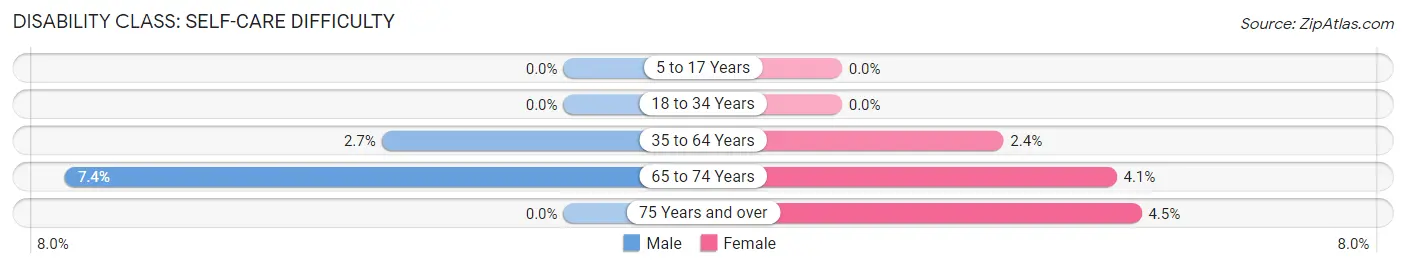
| Age Bracket | Male | Female |
| 5 to 17 Years | 0 (0.0%) | 0 (0.0%) |
| 18 to 34 Years | 0 (0.0%) | 0 (0.0%) |
| 35 to 64 Years | 24 (2.7%) | 24 (2.4%) |
| 65 to 74 Years | 23 (7.4%) | 18 (4.1%) |
| 75 Years and over | 0 (0.0%) | 15 (4.4%) |
Technology Access in Hooksett
Computing Device Access in Hooksett
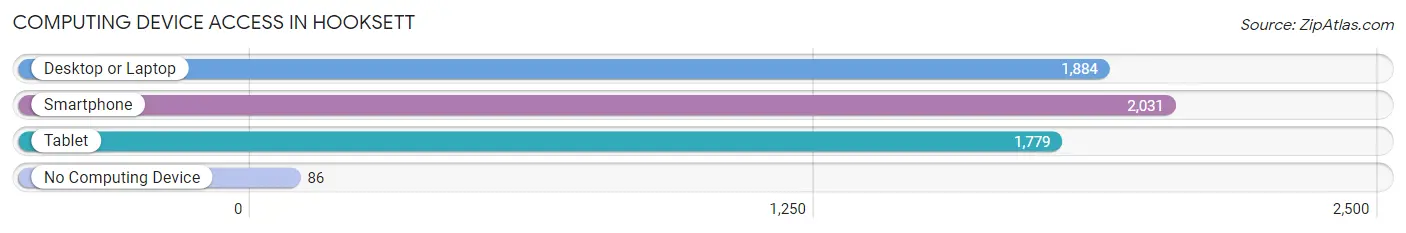
| Device Type | # Households | % Households |
| Desktop or Laptop | 1,884 | 84.8% |
| Smartphone | 2,031 | 91.4% |
| Tablet | 1,779 | 80.1% |
| No Computing Device | 86 | 3.9% |
| Total | 2,221 | 100.0% |
Internet Access in Hooksett
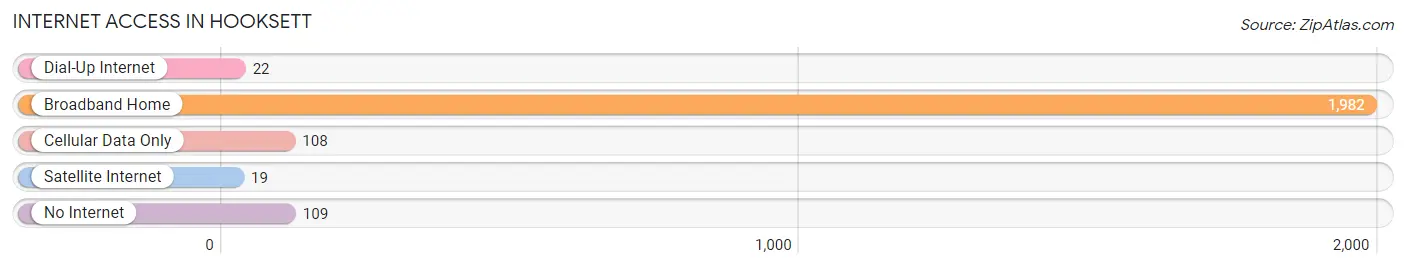
| Internet Type | # Households | % Households |
| Dial-Up Internet | 22 | 1.0% |
| Broadband Home | 1,982 | 89.2% |
| Cellular Data Only | 108 | 4.9% |
| Satellite Internet | 19 | 0.9% |
| No Internet | 109 | 4.9% |
| Total | 2,221 | 100.0% |
Hooksett Summary
Hooksett is a town located in Merrimack County, New Hampshire, United States. It is situated along the Merrimack River, and is bordered by the towns of Bow, Candia, and Manchester. The population was 13,451 at the 2010 census.
Geography
Hooksett is located in southeastern New Hampshire, approximately 10 miles north of Manchester and 20 miles south of Concord. It is bordered by the towns of Bow to the north, Candia to the east, and Manchester to the south and west. The town is situated along the Merrimack River, and is home to several small lakes and ponds, including Lake Massabesic and the Hooksett Reservoir.
The town has a total area of 24.2 square miles, of which 23.7 square miles is land and 0.5 square miles is water. The highest point in Hooksett is the summit of Pine Hill, at an elevation of 590 feet above sea level.
History
Hooksett was first settled in 1722, and was incorporated as a town in 1746. The town was named after the Hooksett Falls, which were located on the Merrimack River. The falls were used to power several mills, and the town quickly became an important industrial center.
In the 19th century, Hooksett was home to several large factories, including a paper mill, a cotton mill, and a woolen mill. The town also had a thriving agricultural industry, and was home to several farms.
In the 20th century, Hooksett experienced a period of rapid growth, as the town became a popular bedroom community for Manchester and Concord. The population of Hooksett more than doubled between 1950 and 2000, and continues to grow today.
Economy
Hooksett is home to several large employers, including the Hooksett School District, the Hooksett Public Library, and the Hooksett Fire Department. The town is also home to several retail stores, including the Mall of New Hampshire, which is the largest shopping mall in the state.
The town is also home to several manufacturing companies, including the Hooksett Paper Company, which produces paper products, and the Hooksett Textile Company, which produces textiles.
Demographics
As of the 2010 census, there were 13,451 people, 5,541 households, and 3,717 families residing in the town. The population density was 563.3 people per square mile. There were 5,845 housing units, of which 4,845 were owner-occupied, and 996 were renter-occupied.
The racial makeup of the town was 94.2% White, 1.3% African American, 0.3% Native American, 1.7% Asian, 0.1% Pacific Islander, 0.7% from other races, and 1.9% from two or more races. Hispanic or Latino of any race were 2.3% of the population.
The median income for a household in the town was $63,917, and the median income for a family was $76,917. The per capita income for the town was $30,917. About 3.2% of families and 4.7% of the population were below the poverty line, including 5.3% of those under age 18 and 4.2% of those age 65 or over.
Common Questions
What is Per Capita Income in Hooksett?
Per Capita income in Hooksett is $45,096.
What is the Median Family Income in Hooksett?
Median Family Income in Hooksett is $91,343.
What is the Median Household income in Hooksett?
Median Household Income in Hooksett is $83,456.
What is Income or Wage Gap in Hooksett?
Income or Wage Gap in Hooksett is 9.5%.
Women in Hooksett earn 90.5 cents for every dollar earned by a man.
What is Inequality or Gini Index in Hooksett?
Inequality or Gini Index in Hooksett is 0.41.
What is the Total Population of Hooksett?
Total Population of Hooksett is 5,268.
What is the Total Male Population of Hooksett?
Total Male Population of Hooksett is 2,553.
What is the Total Female Population of Hooksett?
Total Female Population of Hooksett is 2,715.
What is the Ratio of Males per 100 Females in Hooksett?
There are 94.03 Males per 100 Females in Hooksett.
What is the Ratio of Females per 100 Males in Hooksett?
There are 106.35 Females per 100 Males in Hooksett.
What is the Median Population Age in Hooksett?
Median Population Age in Hooksett is 42.0 Years.
What is the Average Family Size in Hooksett
Average Family Size in Hooksett is 2.7 People.
What is the Average Household Size in Hooksett
Average Household Size in Hooksett is 2.4 People.
How Large is the Labor Force in Hooksett?
There are 3,108 People in the Labor Forcein in Hooksett.
What is the Percentage of People in the Labor Force in Hooksett?
68.0% of People are in the Labor Force in Hooksett.
What is the Unemployment Rate in Hooksett?
Unemployment Rate in Hooksett is 4.3%.