Strafford County, NH Map & Demographics
Strafford County Overview
$43,338
PER CAPITA INCOME
$112,051
AVG FAMILY INCOME
$83,212
AVG HOUSEHOLD INCOME
30.4%
WAGE / INCOME GAP [ % ]
69.6¢/ $1
WAGE / INCOME GAP [ $ ]
$10,500
FAMILY INCOME DEFICIT
0.43
INEQUALITY / GINI INDEX
130,965
TOTAL POPULATION
64,834
MALE POPULATION
66,131
FEMALE POPULATION
98.04
MALES / 100 FEMALES
102.00
FEMALES / 100 MALES
37.7
MEDIAN AGE
2.9
AVG FAMILY SIZE
2.4
AVG HOUSEHOLD SIZE
74,793
LABOR FORCE [ PEOPLE ]
67.9%
PERCENT IN LABOR FORCE
3.7%
UNEMPLOYMENT RATE
Strafford County Area Codes
Income in Strafford County
Income Overview in Strafford County
Per Capita Income in Strafford County is $43,338, while median incomes of families and households are $112,051 and $83,212 respectively.
| Characteristic | Number | Measure |
| Per Capita Income | 130,965 | $43,338 |
| Median Family Income | 31,623 | $112,051 |
| Mean Family Income | 31,623 | $132,305 |
| Median Household Income | 50,953 | $83,212 |
| Mean Household Income | 50,953 | $108,377 |
| Income Deficit | 31,623 | $10,500 |
| Wage / Income Gap (%) | 130,965 | 30.43% |
| Wage / Income Gap ($) | 130,965 | 69.57¢ per $1 |
| Gini / Inequality Index | 130,965 | 0.43 |
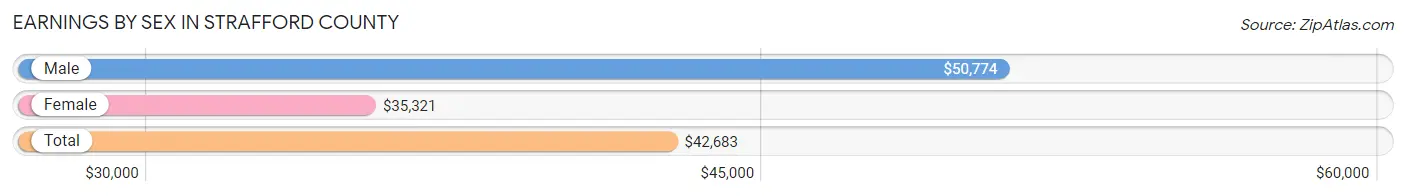
Earnings by Sex in Strafford County
Average Earnings in Strafford County are $42,683, $50,774 for men and $35,321 for women, a difference of 30.4%.
| Sex | Number | Average Earnings |
| Male | 42,330 (51.9%) | $50,774 |
| Female | 39,222 (48.1%) | $35,321 |
| Total | 81,552 (100.0%) | $42,683 |
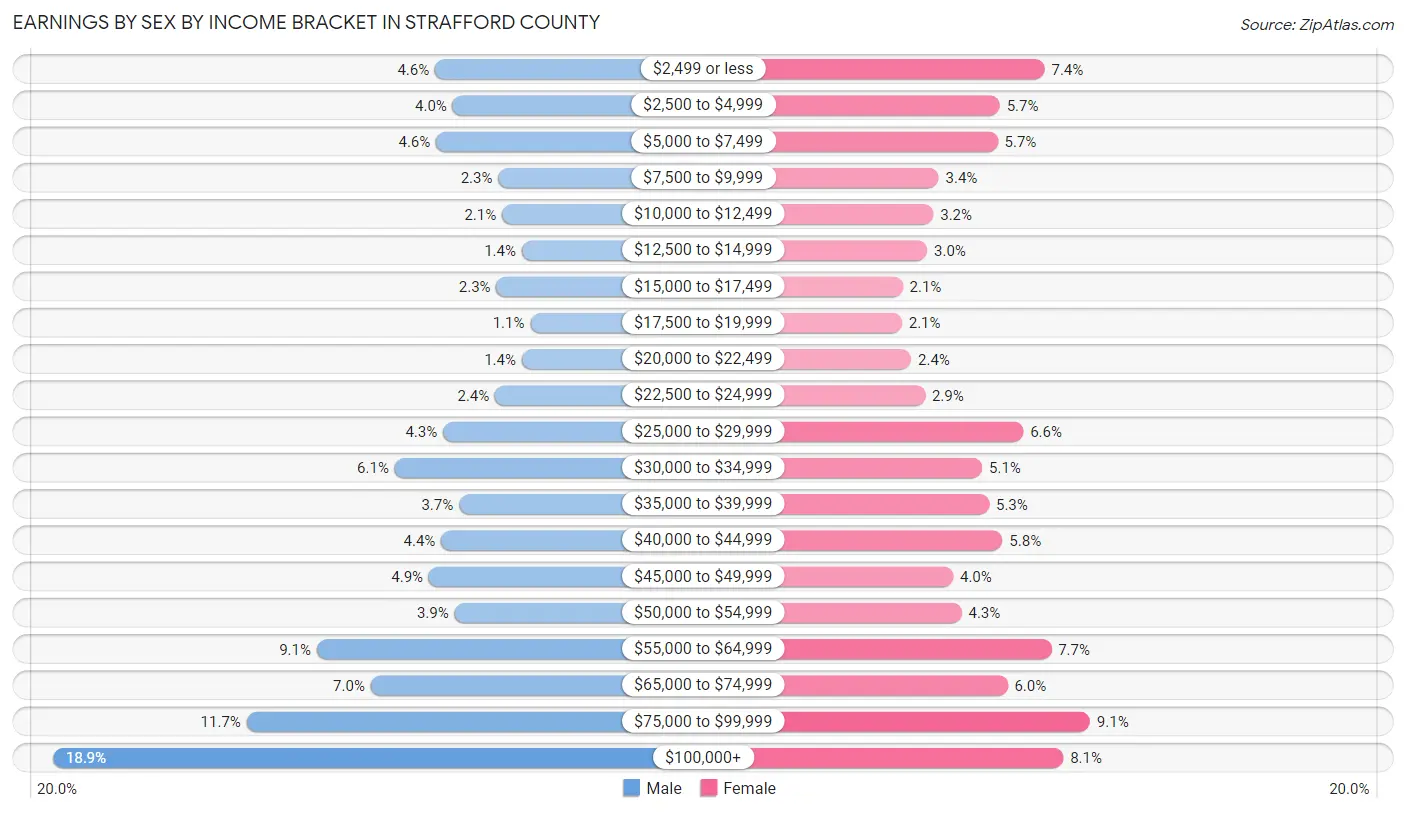
Earnings by Sex by Income Bracket in Strafford County
The most common earnings brackets in Strafford County are $100,000+ for men (8,017 | 18.9%) and $75,000 to $99,999 for women (3,574 | 9.1%).
| Income | Male | Female |
| $2,499 or less | 1,954 (4.6%) | 2,905 (7.4%) |
| $2,500 to $4,999 | 1,677 (4.0%) | 2,249 (5.7%) |
| $5,000 to $7,499 | 1,939 (4.6%) | 2,218 (5.7%) |
| $7,500 to $9,999 | 951 (2.2%) | 1,351 (3.4%) |
| $10,000 to $12,499 | 895 (2.1%) | 1,271 (3.2%) |
| $12,500 to $14,999 | 580 (1.4%) | 1,181 (3.0%) |
| $15,000 to $17,499 | 980 (2.3%) | 821 (2.1%) |
| $17,500 to $19,999 | 446 (1.1%) | 808 (2.1%) |
| $20,000 to $22,499 | 580 (1.4%) | 945 (2.4%) |
| $22,500 to $24,999 | 1,004 (2.4%) | 1,151 (2.9%) |
| $25,000 to $29,999 | 1,828 (4.3%) | 2,594 (6.6%) |
| $30,000 to $34,999 | 2,596 (6.1%) | 1,987 (5.1%) |
| $35,000 to $39,999 | 1,574 (3.7%) | 2,090 (5.3%) |
| $40,000 to $44,999 | 1,859 (4.4%) | 2,287 (5.8%) |
| $45,000 to $49,999 | 2,052 (4.9%) | 1,560 (4.0%) |
| $50,000 to $54,999 | 1,648 (3.9%) | 1,685 (4.3%) |
| $55,000 to $64,999 | 3,830 (9.0%) | 3,005 (7.7%) |
| $65,000 to $74,999 | 2,975 (7.0%) | 2,361 (6.0%) |
| $75,000 to $99,999 | 4,945 (11.7%) | 3,574 (9.1%) |
| $100,000+ | 8,017 (18.9%) | 3,179 (8.1%) |
| Total | 42,330 (100.0%) | 39,222 (100.0%) |
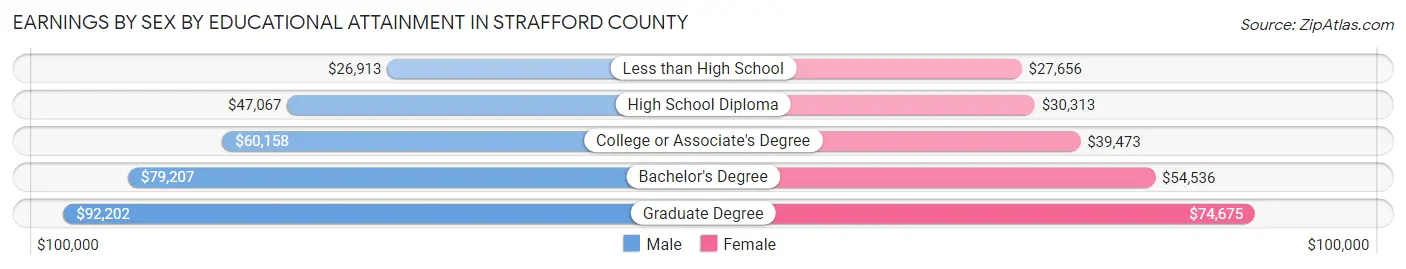
Earnings by Sex by Educational Attainment in Strafford County
Average earnings in Strafford County are $61,434 for men and $44,996 for women, a difference of 26.8%. Men with an educational attainment of graduate degree enjoy the highest average annual earnings of $92,202, while those with less than high school education earn the least with $26,913. Women with an educational attainment of graduate degree earn the most with the average annual earnings of $74,675, while those with less than high school education have the smallest earnings of $27,656.
| Educational Attainment | Male Income | Female Income |
| Less than High School | $26,913 | $27,656 |
| High School Diploma | $47,067 | $30,313 |
| College or Associate's Degree | $60,158 | $39,473 |
| Bachelor's Degree | $79,207 | $54,536 |
| Graduate Degree | $92,202 | $74,675 |
| Total | $61,434 | $44,996 |
Family Income in Strafford County
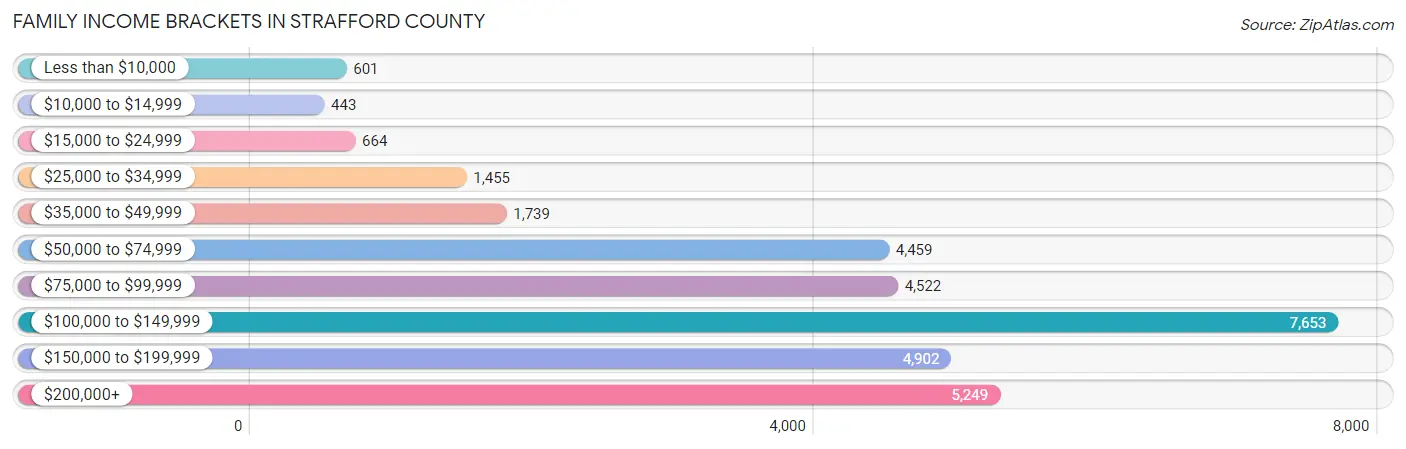
Family Income Brackets in Strafford County
According to the Strafford County family income data, there are 7,653 families falling into the $100,000 to $149,999 income range, which is the most common income bracket and makes up 24.2% of all families. Conversely, the $10,000 to $14,999 income bracket is the least frequent group with only 443 families (1.4%) belonging to this category.
| Income Bracket | # Families | % Families |
| Less than $10,000 | 601 | 1.9% |
| $10,000 to $14,999 | 443 | 1.4% |
| $15,000 to $24,999 | 664 | 2.1% |
| $25,000 to $34,999 | 1,455 | 4.6% |
| $35,000 to $49,999 | 1,739 | 5.5% |
| $50,000 to $74,999 | 4,459 | 14.1% |
| $75,000 to $99,999 | 4,522 | 14.3% |
| $100,000 to $149,999 | 7,653 | 24.2% |
| $150,000 to $199,999 | 4,902 | 15.5% |
| $200,000+ | 5,249 | 16.6% |
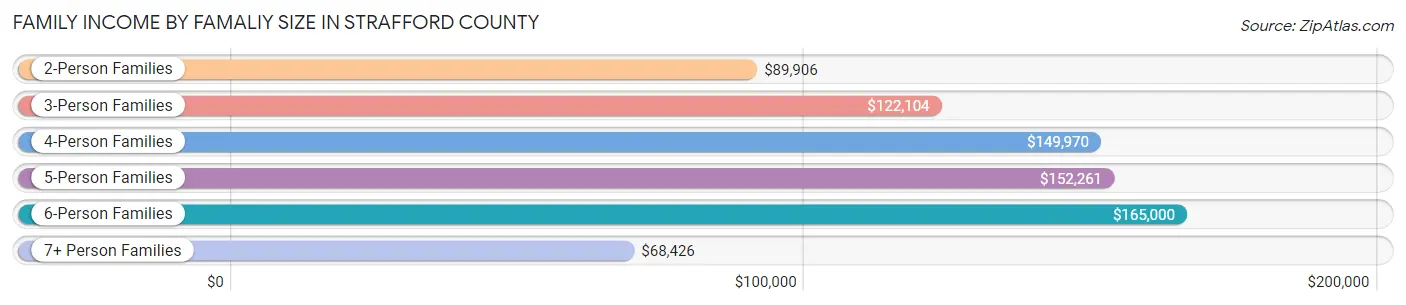
Family Income by Famaliy Size in Strafford County
6-person families (426 | 1.3%) account for the highest median family income in Strafford County with $165,000 per family, while 2-person families (16,536 | 52.3%) have the highest median income of $44,953 per family member.
| Income Bracket | # Families | Median Income |
| 2-Person Families | 16,536 (52.3%) | $89,906 |
| 3-Person Families | 6,962 (22.0%) | $122,104 |
| 4-Person Families | 5,488 (17.3%) | $149,970 |
| 5-Person Families | 2,045 (6.5%) | $152,261 |
| 6-Person Families | 426 (1.3%) | $165,000 |
| 7+ Person Families | 166 (0.5%) | $68,426 |
| Total | 31,623 (100.0%) | $112,051 |
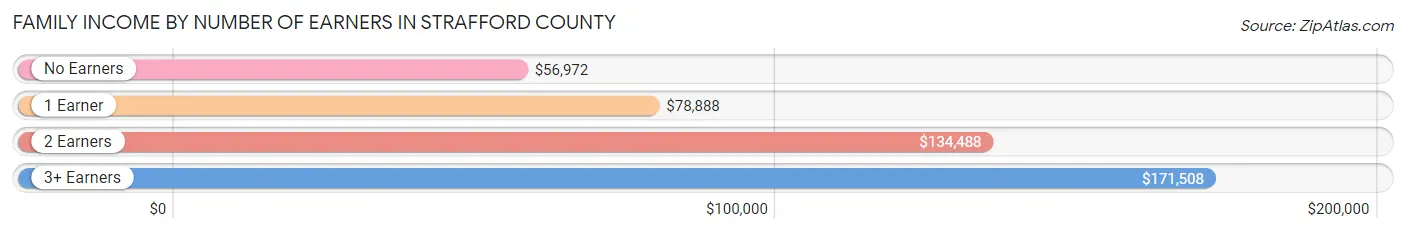
Family Income by Number of Earners in Strafford County
The median family income in Strafford County is $112,051, with families comprising 3+ earners (3,974) having the highest median family income of $171,508, while families with no earners (4,274) have the lowest median family income of $56,972, accounting for 12.6% and 13.5% of families, respectively.
| Number of Earners | # Families | Median Income |
| No Earners | 4,274 (13.5%) | $56,972 |
| 1 Earner | 8,330 (26.3%) | $78,888 |
| 2 Earners | 15,045 (47.6%) | $134,488 |
| 3+ Earners | 3,974 (12.6%) | $171,508 |
| Total | 31,623 (100.0%) | $112,051 |
Household Income in Strafford County
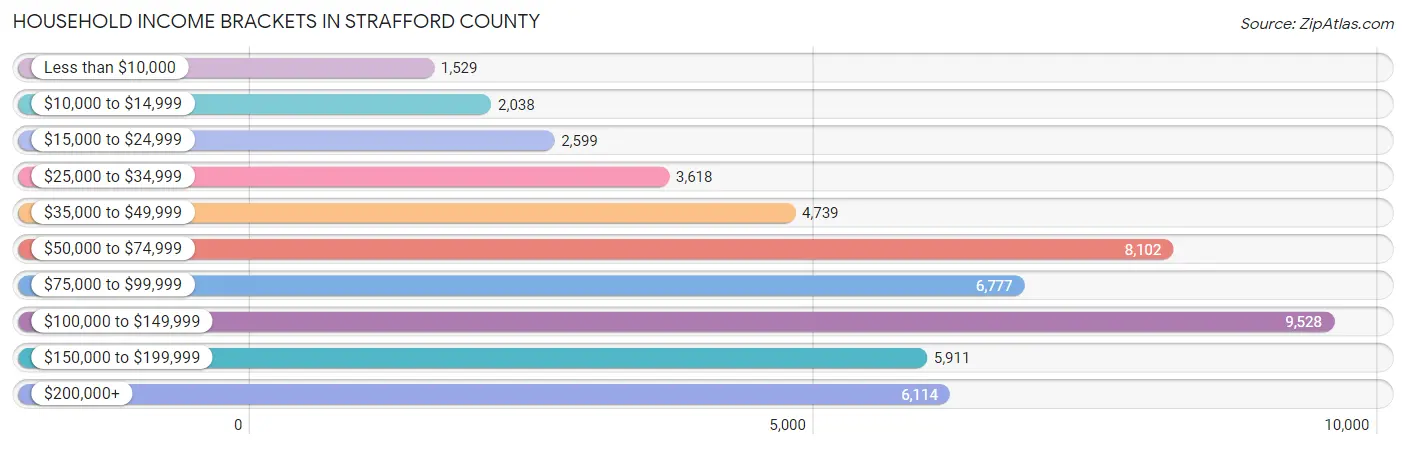
Household Income Brackets in Strafford County
With 9,528 households falling in the category, the $100,000 to $149,999 income range is the most frequent in Strafford County, accounting for 18.7% of all households. In contrast, only 1,529 households (3.0%) fall into the less than $10,000 income bracket, making it the least populous group.
| Income Bracket | # Households | % Households |
| Less than $10,000 | 1,529 | 3.0% |
| $10,000 to $14,999 | 2,038 | 4.0% |
| $15,000 to $24,999 | 2,599 | 5.1% |
| $25,000 to $34,999 | 3,618 | 7.1% |
| $35,000 to $49,999 | 4,739 | 9.3% |
| $50,000 to $74,999 | 8,102 | 15.9% |
| $75,000 to $99,999 | 6,777 | 13.3% |
| $100,000 to $149,999 | 9,528 | 18.7% |
| $150,000 to $199,999 | 5,911 | 11.6% |
| $200,000+ | 6,114 | 12.0% |
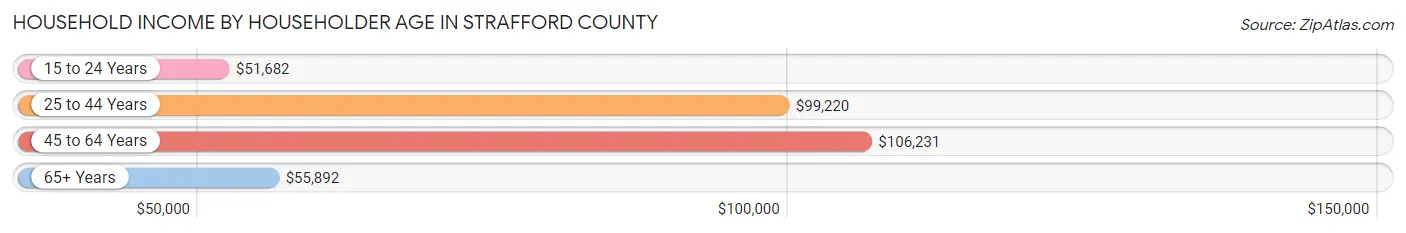
Household Income by Householder Age in Strafford County
The median household income in Strafford County is $83,212, with the highest median household income of $106,231 found in the 45 to 64 years age bracket for the primary householder. A total of 19,229 households (37.7%) fall into this category. Meanwhile, the 15 to 24 years age bracket for the primary householder has the lowest median household income of $51,682, with 2,755 households (5.4%) in this group.
| Income Bracket | # Households | Median Income |
| 15 to 24 Years | 2,755 (5.4%) | $51,682 |
| 25 to 44 Years | 15,738 (30.9%) | $99,220 |
| 45 to 64 Years | 19,229 (37.7%) | $106,231 |
| 65+ Years | 13,231 (26.0%) | $55,892 |
| Total | 50,953 (100.0%) | $83,212 |
Poverty in Strafford County
Income Below Poverty by Sex and Age in Strafford County
With 7.8% poverty level for males and 10.4% for females among the residents of Strafford County, 18 to 24 year old males and 18 to 24 year old females are the most vulnerable to poverty, with 1,323 males (22.1%) and 1,732 females (26.7%) in their respective age groups living below the poverty level.
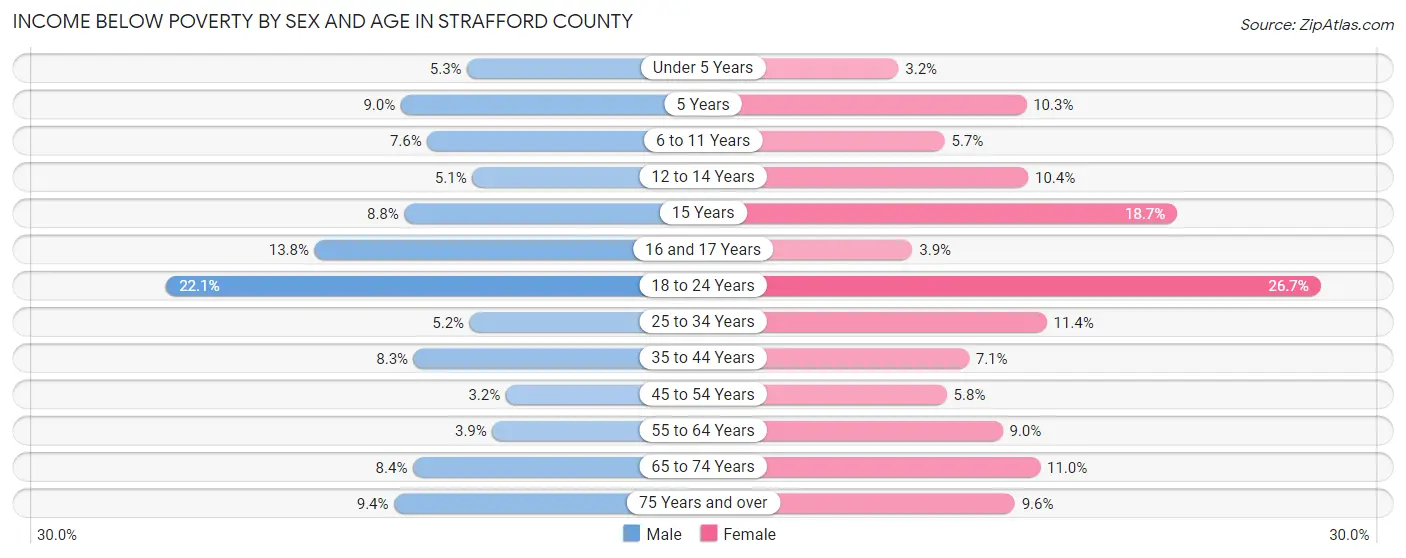
| Age Bracket | Male | Female |
| Under 5 Years | 156 (5.3%) | 88 (3.2%) |
| 5 Years | 63 (9.0%) | 53 (10.3%) |
| 6 to 11 Years | 281 (7.6%) | 181 (5.7%) |
| 12 to 14 Years | 110 (5.1%) | 239 (10.4%) |
| 15 Years | 90 (8.8%) | 118 (18.7%) |
| 16 and 17 Years | 186 (13.8%) | 53 (3.9%) |
| 18 to 24 Years | 1,323 (22.1%) | 1,732 (26.7%) |
| 25 to 34 Years | 482 (5.2%) | 945 (11.4%) |
| 35 to 44 Years | 647 (8.3%) | 523 (7.1%) |
| 45 to 54 Years | 244 (3.2%) | 475 (5.8%) |
| 55 to 64 Years | 350 (3.9%) | 798 (8.9%) |
| 65 to 74 Years | 485 (8.4%) | 721 (11.0%) |
| 75 Years and over | 302 (9.4%) | 467 (9.6%) |
| Total | 4,719 (7.8%) | 6,393 (10.4%) |
Income Above Poverty by Sex and Age in Strafford County
According to the poverty statistics in Strafford County, males aged 45 to 54 years and females aged under 5 years are the age groups that are most secure financially, with 96.8% of males and 96.9% of females in these age groups living above the poverty line.
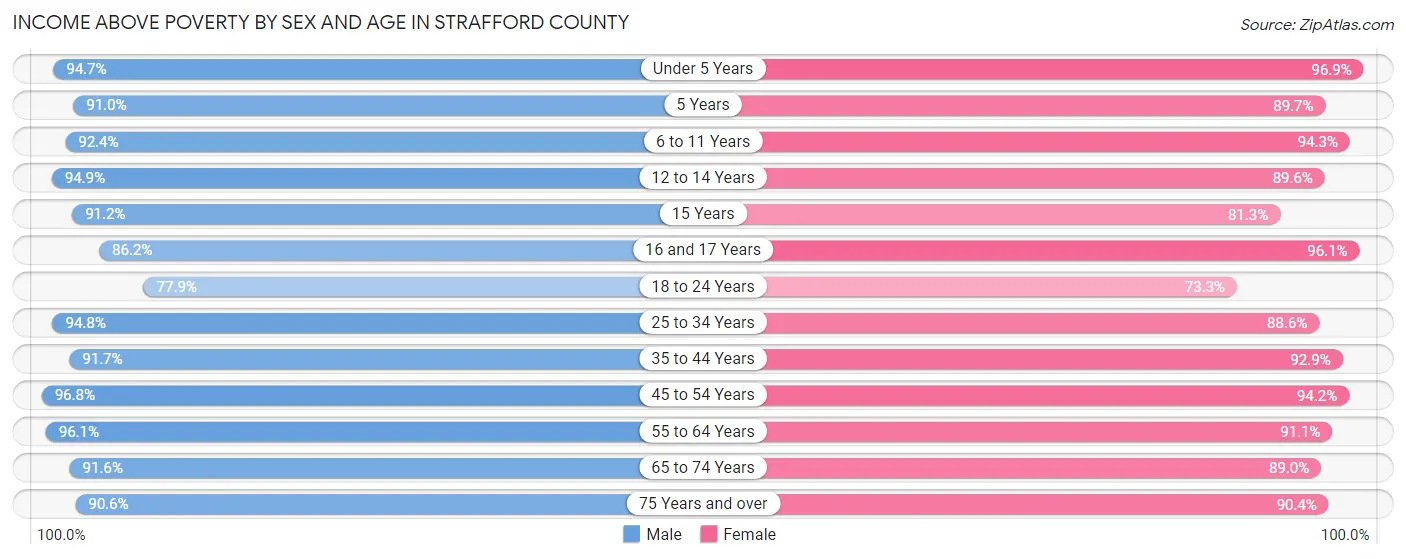
| Age Bracket | Male | Female |
| Under 5 Years | 2,764 (94.7%) | 2,709 (96.9%) |
| 5 Years | 634 (91.0%) | 463 (89.7%) |
| 6 to 11 Years | 3,437 (92.4%) | 2,984 (94.3%) |
| 12 to 14 Years | 2,066 (94.9%) | 2,066 (89.6%) |
| 15 Years | 928 (91.2%) | 514 (81.3%) |
| 16 and 17 Years | 1,158 (86.2%) | 1,297 (96.1%) |
| 18 to 24 Years | 4,660 (77.9%) | 4,764 (73.3%) |
| 25 to 34 Years | 8,785 (94.8%) | 7,348 (88.6%) |
| 35 to 44 Years | 7,127 (91.7%) | 6,879 (92.9%) |
| 45 to 54 Years | 7,416 (96.8%) | 7,659 (94.2%) |
| 55 to 64 Years | 8,532 (96.1%) | 8,121 (91.0%) |
| 65 to 74 Years | 5,317 (91.6%) | 5,807 (89.0%) |
| 75 Years and over | 2,909 (90.6%) | 4,382 (90.4%) |
| Total | 55,733 (92.2%) | 54,993 (89.6%) |
Income Below Poverty Among Married-Couple Families in Strafford County
The poverty statistics for married-couple families in Strafford County show that 2.5% or 627 of the total 25,257 families live below the poverty line. Families with 5 or more children have the highest poverty rate of 12.0%, comprising of 12 families. On the other hand, families with no children have the lowest poverty rate of 2.0%, which includes 316 families.
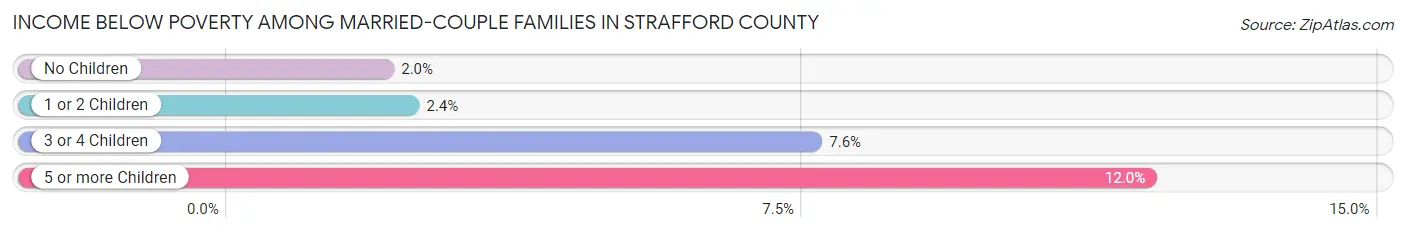
| Children | Above Poverty | Below Poverty |
| No Children | 15,203 (98.0%) | 316 (2.0%) |
| 1 or 2 Children | 8,104 (97.6%) | 197 (2.4%) |
| 3 or 4 Children | 1,235 (92.4%) | 102 (7.6%) |
| 5 or more Children | 88 (88.0%) | 12 (12.0%) |
| Total | 24,630 (97.5%) | 627 (2.5%) |
Income Below Poverty Among Single-Parent Households in Strafford County
According to the poverty data in Strafford County, 15.1% or 357 single-father households and 13.3% or 532 single-mother households are living below the poverty line. Among single-father households, those with 1 or 2 children have the highest poverty rate, with 316 households (24.0%) experiencing poverty. Likewise, among single-mother households, those with 3 or 4 children have the highest poverty rate, with 55 households (20.2%) falling below the poverty line.
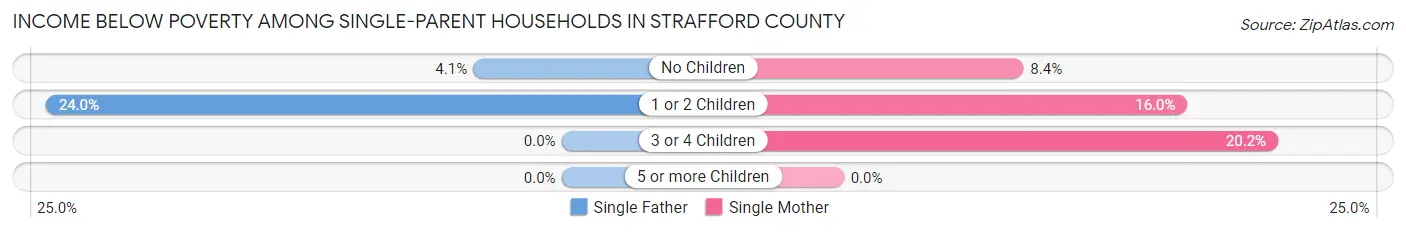
| Children | Single Father | Single Mother |
| No Children | 41 (4.1%) | 131 (8.4%) |
| 1 or 2 Children | 316 (24.0%) | 346 (16.0%) |
| 3 or 4 Children | 0 (0.0%) | 55 (20.2%) |
| 5 or more Children | 0 (0.0%) | 0 (0.0%) |
| Total | 357 (15.1%) | 532 (13.3%) |
Income Below Poverty Among Married-Couple vs Single-Parent Households in Strafford County
The poverty data for Strafford County shows that 627 of the married-couple family households (2.5%) and 889 of the single-parent households (14.0%) are living below the poverty level. Within the married-couple family households, those with 5 or more children have the highest poverty rate, with 12 households (12.0%) falling below the poverty line. Among the single-parent households, those with 1 or 2 children have the highest poverty rate, with 662 household (19.0%) living below poverty.
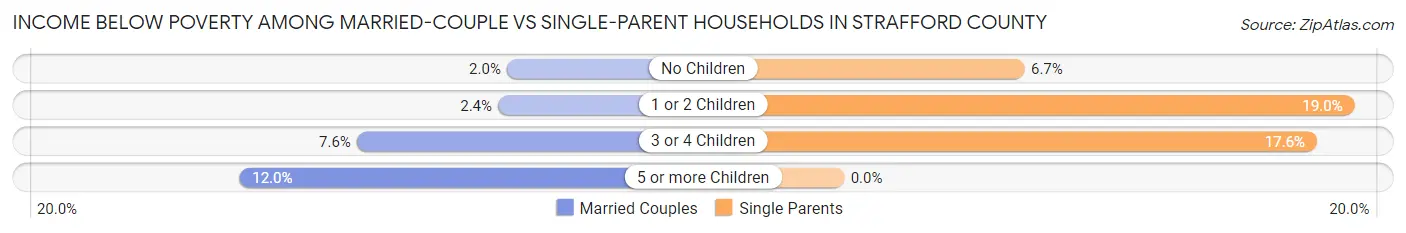
| Children | Married-Couple Families | Single-Parent Households |
| No Children | 316 (2.0%) | 172 (6.7%) |
| 1 or 2 Children | 197 (2.4%) | 662 (19.0%) |
| 3 or 4 Children | 102 (7.6%) | 55 (17.6%) |
| 5 or more Children | 12 (12.0%) | 0 (0.0%) |
| Total | 627 (2.5%) | 889 (14.0%) |
Race in Strafford County
The most populous races in Strafford County are White / Caucasian (117,587 | 89.8%), Two or more Races (6,785 | 5.2%), and Asian (3,908 | 3.0%).
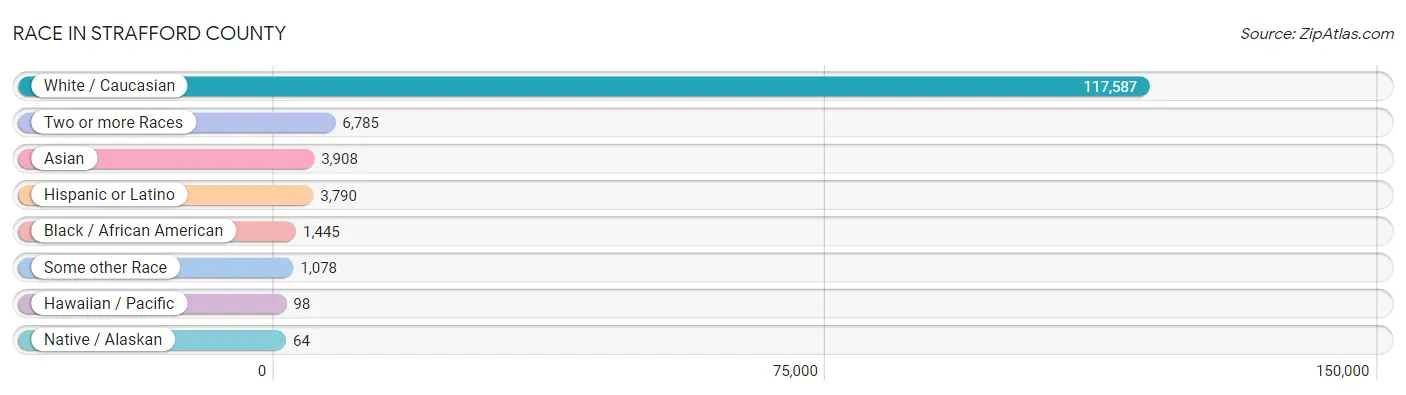
| Race | # Population | % Population |
| Asian | 3,908 | 3.0% |
| Black / African American | 1,445 | 1.1% |
| Hawaiian / Pacific | 98 | 0.1% |
| Hispanic or Latino | 3,790 | 2.9% |
| Native / Alaskan | 64 | 0.1% |
| White / Caucasian | 117,587 | 89.8% |
| Two or more Races | 6,785 | 5.2% |
| Some other Race | 1,078 | 0.8% |
| Total | 130,965 | 100.0% |
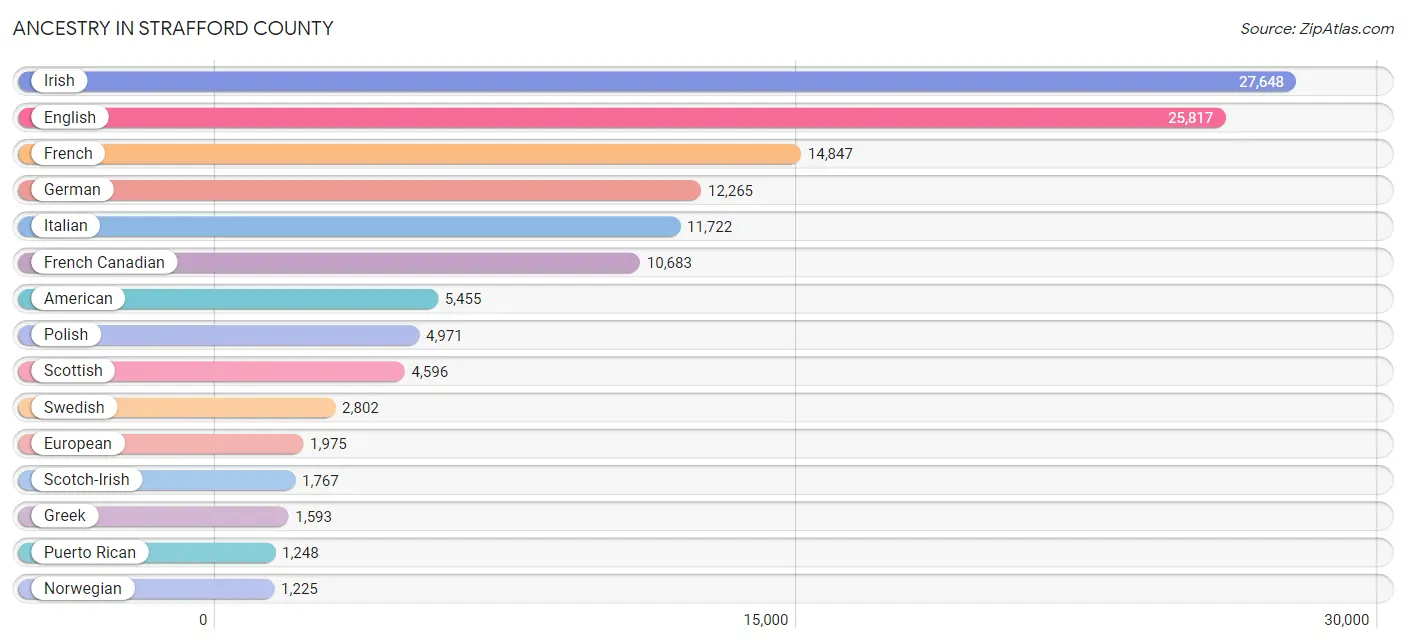
Ancestry in Strafford County
The most populous ancestries reported in Strafford County are Irish (27,648 | 21.1%), English (25,817 | 19.7%), French (14,847 | 11.3%), German (12,265 | 9.4%), and Italian (11,722 | 8.9%), together accounting for 70.5% of all Strafford County residents.
| Ancestry | # Population | % Population |
| African | 84 | 0.1% |
| Albanian | 38 | 0.0% |
| American | 5,455 | 4.2% |
| Apache | 23 | 0.0% |
| Arab | 600 | 0.5% |
| Argentinean | 10 | 0.0% |
| Armenian | 201 | 0.2% |
| Australian | 17 | 0.0% |
| Austrian | 194 | 0.2% |
| Barbadian | 16 | 0.0% |
| Basque | 14 | 0.0% |
| Belgian | 111 | 0.1% |
| Bhutanese | 557 | 0.4% |
| Blackfeet | 44 | 0.0% |
| Bolivian | 10 | 0.0% |
| Brazilian | 263 | 0.2% |
| British | 938 | 0.7% |
| Bulgarian | 5 | 0.0% |
| Burmese | 537 | 0.4% |
| Cajun | 15 | 0.0% |
| Canadian | 1,192 | 0.9% |
| Cape Verdean | 73 | 0.1% |
| Celtic | 101 | 0.1% |
| Central American | 205 | 0.2% |
| Central American Indian | 45 | 0.0% |
| Cherokee | 96 | 0.1% |
| Chickasaw | 45 | 0.0% |
| Chilean | 28 | 0.0% |
| Choctaw | 9 | 0.0% |
| Colombian | 70 | 0.1% |
| Costa Rican | 59 | 0.1% |
| Creek | 7 | 0.0% |
| Croatian | 38 | 0.0% |
| Cuban | 211 | 0.2% |
| Czech | 199 | 0.2% |
| Czechoslovakian | 35 | 0.0% |
| Danish | 510 | 0.4% |
| Dominican | 302 | 0.2% |
| Dutch | 1,066 | 0.8% |
| Eastern European | 291 | 0.2% |
| Ecuadorian | 125 | 0.1% |
| Egyptian | 4 | 0.0% |
| English | 25,817 | 19.7% |
| Estonian | 20 | 0.0% |
| Ethiopian | 121 | 0.1% |
| European | 1,975 | 1.5% |
| Finnish | 419 | 0.3% |
| French | 14,847 | 11.3% |
| French American Indian | 30 | 0.0% |
| French Canadian | 10,683 | 8.2% |
| German | 12,265 | 9.4% |
| Ghanaian | 33 | 0.0% |
| Greek | 1,593 | 1.2% |
| Guamanian / Chamorro | 98 | 0.1% |
| Guatemalan | 102 | 0.1% |
| Haitian | 128 | 0.1% |
| Honduran | 25 | 0.0% |
| Hungarian | 409 | 0.3% |
| Icelander | 2 | 0.0% |
| Indian (Asian) | 1,182 | 0.9% |
| Iranian | 19 | 0.0% |
| Iraqi | 21 | 0.0% |
| Irish | 27,648 | 21.1% |
| Iroquois | 20 | 0.0% |
| Israeli | 7 | 0.0% |
| Italian | 11,722 | 8.9% |
| Jamaican | 103 | 0.1% |
| Japanese | 304 | 0.2% |
| Kenyan | 50 | 0.0% |
| Korean | 743 | 0.6% |
| Laotian | 325 | 0.3% |
| Latvian | 45 | 0.0% |
| Lebanese | 497 | 0.4% |
| Lithuanian | 534 | 0.4% |
| Luxembourger | 26 | 0.0% |
| Malaysian | 156 | 0.1% |
| Mexican | 1,049 | 0.8% |
| Moroccan | 46 | 0.0% |
| Native Hawaiian | 26 | 0.0% |
| Navajo | 13 | 0.0% |
| Nigerian | 86 | 0.1% |
| Northern European | 440 | 0.3% |
| Norwegian | 1,225 | 0.9% |
| Pakistani | 110 | 0.1% |
| Pennsylvania German | 33 | 0.0% |
| Peruvian | 9 | 0.0% |
| Polish | 4,971 | 3.8% |
| Portuguese | 1,206 | 0.9% |
| Puerto Rican | 1,248 | 0.9% |
| Romanian | 74 | 0.1% |
| Russian | 838 | 0.6% |
| Salvadoran | 19 | 0.0% |
| Samoan | 57 | 0.0% |
| Scandinavian | 279 | 0.2% |
| Scotch-Irish | 1,767 | 1.3% |
| Scottish | 4,596 | 3.5% |
| Seminole | 3 | 0.0% |
| Serbian | 34 | 0.0% |
| Slavic | 29 | 0.0% |
| Slovak | 114 | 0.1% |
| Slovene | 11 | 0.0% |
| South American | 282 | 0.2% |
| Spaniard | 126 | 0.1% |
| Spanish | 208 | 0.2% |
| Sri Lankan | 629 | 0.5% |
| Subsaharan African | 478 | 0.4% |
| Sudanese | 5 | 0.0% |
| Swedish | 2,802 | 2.1% |
| Swiss | 391 | 0.3% |
| Syrian | 12 | 0.0% |
| Thai | 1,178 | 0.9% |
| Trinidadian and Tobagonian | 6 | 0.0% |
| Turkish | 20 | 0.0% |
| Ukrainian | 284 | 0.2% |
| Venezuelan | 30 | 0.0% |
| Vietnamese | 16 | 0.0% |
| Welsh | 1,038 | 0.8% |
| West Indian | 42 | 0.0% |
| Yugoslavian | 38 | 0.0% |
| Yup'ik | 7 | 0.0% |
| Zimbabwean | 12 | 0.0% | View All 121 Rows |
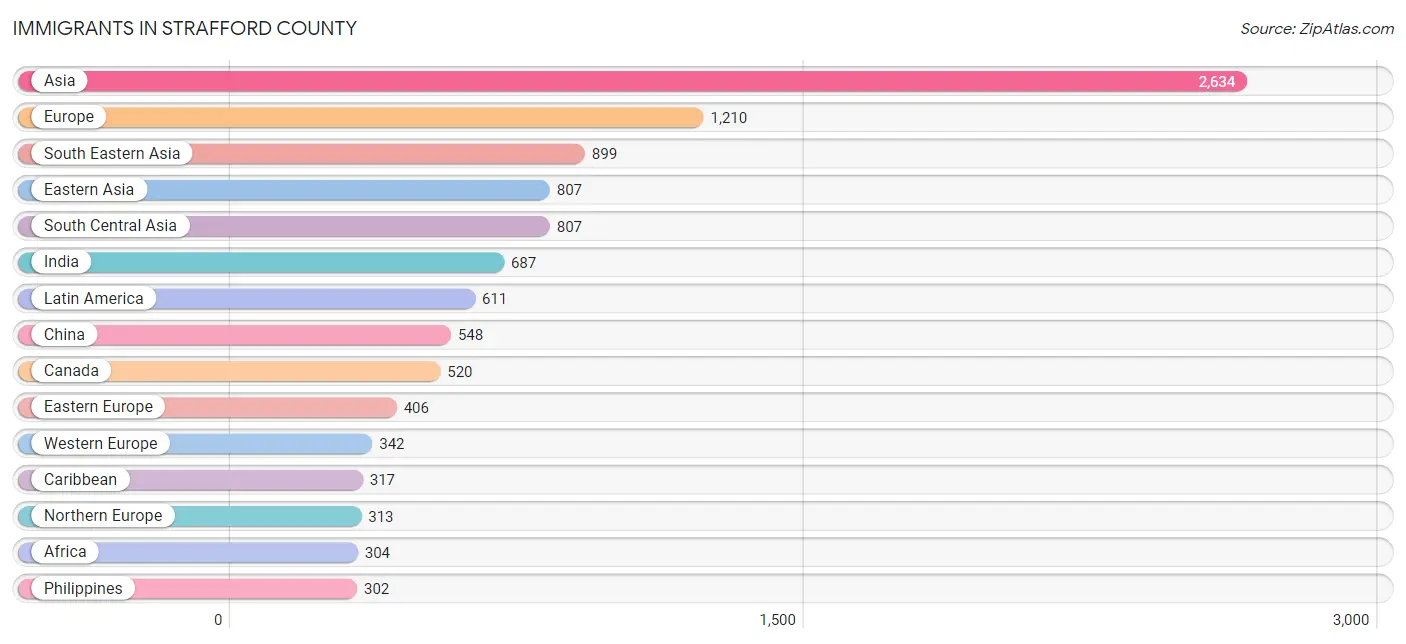
Immigrants in Strafford County
The most numerous immigrant groups reported in Strafford County came from Asia (2,634 | 2.0%), Europe (1,210 | 0.9%), South Eastern Asia (899 | 0.7%), Eastern Asia (807 | 0.6%), and South Central Asia (807 | 0.6%), together accounting for 4.9% of all Strafford County residents.
| Immigration Origin | # Population | % Population |
| Africa | 304 | 0.2% |
| Albania | 10 | 0.0% |
| Asia | 2,634 | 2.0% |
| Australia | 61 | 0.1% |
| Austria | 38 | 0.0% |
| Bangladesh | 16 | 0.0% |
| Belgium | 19 | 0.0% |
| Bosnia and Herzegovina | 173 | 0.1% |
| Brazil | 112 | 0.1% |
| Bulgaria | 10 | 0.0% |
| Cambodia | 76 | 0.1% |
| Canada | 520 | 0.4% |
| Caribbean | 317 | 0.2% |
| Central America | 73 | 0.1% |
| Chile | 27 | 0.0% |
| China | 548 | 0.4% |
| Colombia | 13 | 0.0% |
| Costa Rica | 16 | 0.0% |
| Cuba | 10 | 0.0% |
| Czechoslovakia | 2 | 0.0% |
| Denmark | 6 | 0.0% |
| Dominica | 3 | 0.0% |
| Dominican Republic | 208 | 0.2% |
| Eastern Africa | 146 | 0.1% |
| Eastern Asia | 807 | 0.6% |
| Eastern Europe | 406 | 0.3% |
| Ecuador | 69 | 0.1% |
| Egypt | 4 | 0.0% |
| El Salvador | 19 | 0.0% |
| England | 88 | 0.1% |
| Ethiopia | 121 | 0.1% |
| Europe | 1,210 | 0.9% |
| France | 58 | 0.0% |
| Germany | 192 | 0.2% |
| Ghana | 19 | 0.0% |
| Greece | 116 | 0.1% |
| Guatemala | 7 | 0.0% |
| Haiti | 62 | 0.1% |
| Honduras | 19 | 0.0% |
| Hungary | 20 | 0.0% |
| India | 687 | 0.5% |
| Indonesia | 199 | 0.2% |
| Iran | 18 | 0.0% |
| Iraq | 21 | 0.0% |
| Ireland | 79 | 0.1% |
| Israel | 12 | 0.0% |
| Italy | 23 | 0.0% |
| Jamaica | 34 | 0.0% |
| Japan | 131 | 0.1% |
| Korea | 128 | 0.1% |
| Laos | 104 | 0.1% |
| Latin America | 611 | 0.5% |
| Lebanon | 68 | 0.1% |
| Malaysia | 10 | 0.0% |
| Mexico | 12 | 0.0% |
| Middle Africa | 12 | 0.0% |
| Morocco | 32 | 0.0% |
| Nepal | 80 | 0.1% |
| Netherlands | 15 | 0.0% |
| Nigeria | 86 | 0.1% |
| Northern Africa | 41 | 0.0% |
| Northern Europe | 313 | 0.2% |
| Norway | 23 | 0.0% |
| Oceania | 62 | 0.1% |
| Pakistan | 6 | 0.0% |
| Philippines | 302 | 0.2% |
| Poland | 12 | 0.0% |
| Portugal | 7 | 0.0% |
| Romania | 7 | 0.0% |
| Russia | 122 | 0.1% |
| Scotland | 23 | 0.0% |
| South America | 221 | 0.2% |
| South Central Asia | 807 | 0.6% |
| South Eastern Asia | 899 | 0.7% |
| Southern Europe | 149 | 0.1% |
| Spain | 3 | 0.0% |
| Sudan | 5 | 0.0% |
| Switzerland | 20 | 0.0% |
| Taiwan | 11 | 0.0% |
| Thailand | 111 | 0.1% |
| Ukraine | 17 | 0.0% |
| Vietnam | 97 | 0.1% |
| Western Africa | 105 | 0.1% |
| Western Asia | 121 | 0.1% |
| Western Europe | 342 | 0.3% |
| Zimbabwe | 12 | 0.0% | View All 86 Rows |
Sex and Age in Strafford County
Sex and Age in Strafford County
The most populous age groups in Strafford County are 20 to 24 Years (6,508 | 10.0%) for men and 20 to 24 Years (7,002 | 10.6%) for women.
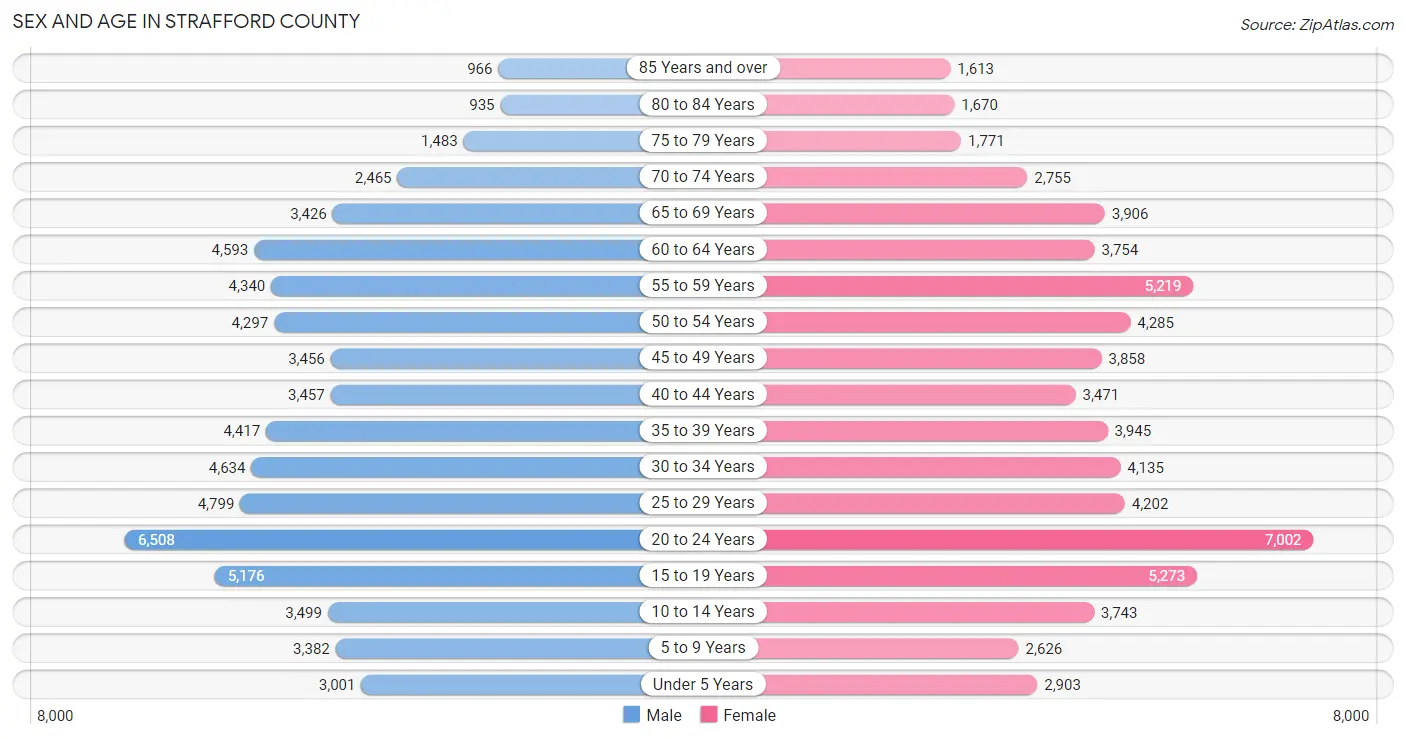
| Age Bracket | Male | Female |
| Under 5 Years | 3,001 (4.6%) | 2,903 (4.4%) |
| 5 to 9 Years | 3,382 (5.2%) | 2,626 (4.0%) |
| 10 to 14 Years | 3,499 (5.4%) | 3,743 (5.7%) |
| 15 to 19 Years | 5,176 (8.0%) | 5,273 (8.0%) |
| 20 to 24 Years | 6,508 (10.0%) | 7,002 (10.6%) |
| 25 to 29 Years | 4,799 (7.4%) | 4,202 (6.4%) |
| 30 to 34 Years | 4,634 (7.1%) | 4,135 (6.2%) |
| 35 to 39 Years | 4,417 (6.8%) | 3,945 (6.0%) |
| 40 to 44 Years | 3,457 (5.3%) | 3,471 (5.2%) |
| 45 to 49 Years | 3,456 (5.3%) | 3,858 (5.8%) |
| 50 to 54 Years | 4,297 (6.6%) | 4,285 (6.5%) |
| 55 to 59 Years | 4,340 (6.7%) | 5,219 (7.9%) |
| 60 to 64 Years | 4,593 (7.1%) | 3,754 (5.7%) |
| 65 to 69 Years | 3,426 (5.3%) | 3,906 (5.9%) |
| 70 to 74 Years | 2,465 (3.8%) | 2,755 (4.2%) |
| 75 to 79 Years | 1,483 (2.3%) | 1,771 (2.7%) |
| 80 to 84 Years | 935 (1.4%) | 1,670 (2.5%) |
| 85 Years and over | 966 (1.5%) | 1,613 (2.4%) |
| Total | 64,834 (100.0%) | 66,131 (100.0%) |
Families and Households in Strafford County
Median Family Size in Strafford County
The median family size in Strafford County is 2.89 persons per family, with married-couple families (25,257 | 79.9%) accounting for the largest median family size of 2.92 persons per family. On the other hand, single male/father families (2,360 | 7.5%) represent the smallest median family size with 2.56 persons per family.
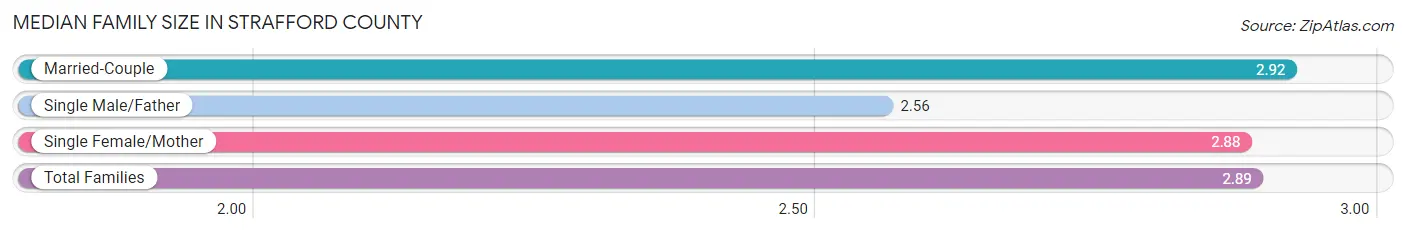
| Family Type | # Families | Family Size |
| Married-Couple | 25,257 (79.9%) | 2.92 |
| Single Male/Father | 2,360 (7.5%) | 2.56 |
| Single Female/Mother | 4,006 (12.7%) | 2.88 |
| Total Families | 31,623 (100.0%) | 2.89 |
Median Household Size in Strafford County
The median household size in Strafford County is 2.40 persons per household, with single female/mother households (4,006 | 7.9%) accounting for the largest median household size of 3.17 persons per household. non-family households (19,330 | 37.9%) represent the smallest median household size with 1.42 persons per household.
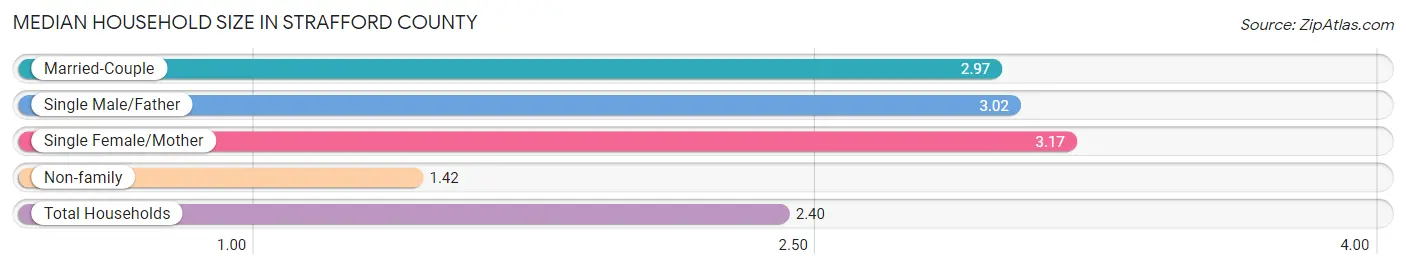
| Household Type | # Households | Household Size |
| Married-Couple | 25,257 (49.6%) | 2.97 |
| Single Male/Father | 2,360 (4.6%) | 3.02 |
| Single Female/Mother | 4,006 (7.9%) | 3.17 |
| Non-family | 19,330 (37.9%) | 1.42 |
| Total Households | 50,953 (100.0%) | 2.40 |
Household Size by Marriage Status in Strafford County
Out of a total of 50,953 households in Strafford County, 31,623 (62.1%) are family households, while 19,330 (37.9%) are nonfamily households. The most numerous type of family households are 2-person households, comprising 15,295, and the most common type of nonfamily households are 1-person households, comprising 14,174.
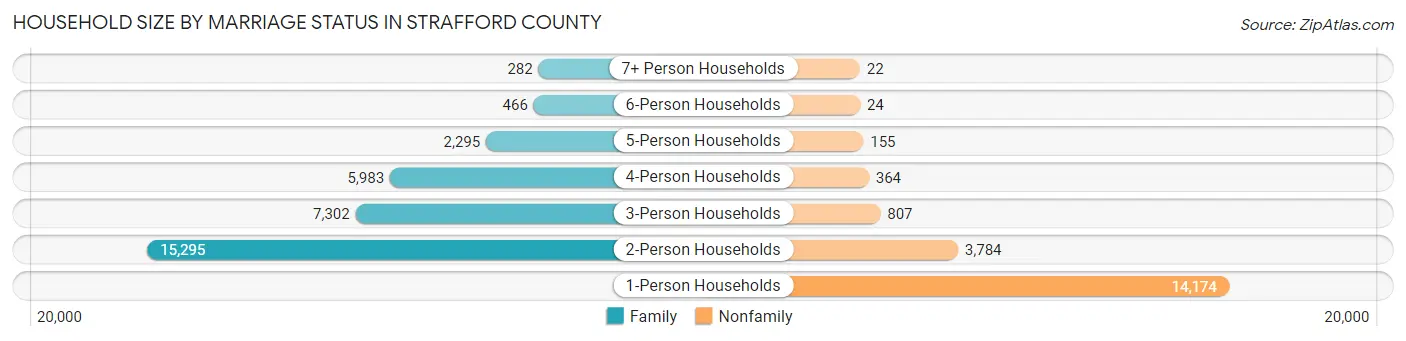
| Household Size | Family Households | Nonfamily Households |
| 1-Person Households | - | 14,174 (27.8%) |
| 2-Person Households | 15,295 (30.0%) | 3,784 (7.4%) |
| 3-Person Households | 7,302 (14.3%) | 807 (1.6%) |
| 4-Person Households | 5,983 (11.7%) | 364 (0.7%) |
| 5-Person Households | 2,295 (4.5%) | 155 (0.3%) |
| 6-Person Households | 466 (0.9%) | 24 (0.1%) |
| 7+ Person Households | 282 (0.5%) | 22 (0.0%) |
| Total | 31,623 (62.1%) | 19,330 (37.9%) |
Female Fertility in Strafford County
Fertility by Age in Strafford County
Average fertility rate in Strafford County is 44.0 births per 1,000 women. Women in the age bracket of 20 to 34 years have the highest fertility rate with 64.0 births per 1,000 women. Women in the age bracket of 20 to 34 years acount for 68.1% of all women with births.
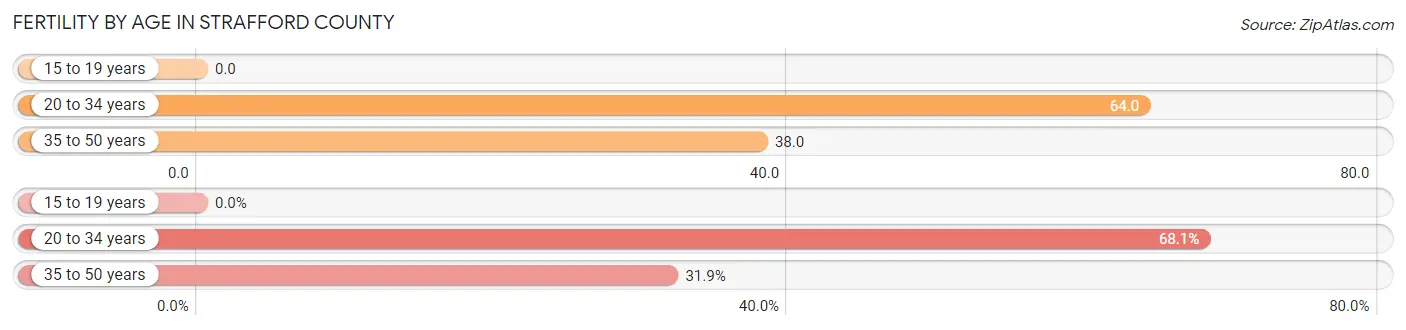
| Age Bracket | Women with Births | Births / 1,000 Women |
| 15 to 19 years | 0 (0.0%) | 0.0 |
| 20 to 34 years | 985 (68.1%) | 64.0 |
| 35 to 50 years | 462 (31.9%) | 38.0 |
| Total | 1,447 (100.0%) | 44.0 |
Fertility by Age by Marriage Status in Strafford County
71.9% of women with births (1,447) in Strafford County are married. The highest percentage of unmarried women with births falls into 20 to 34 years age bracket with 29.8% of them unmarried at the time of birth, while the lowest percentage of unmarried women with births belong to 35 to 50 years age bracket with 24.2% of them unmarried.
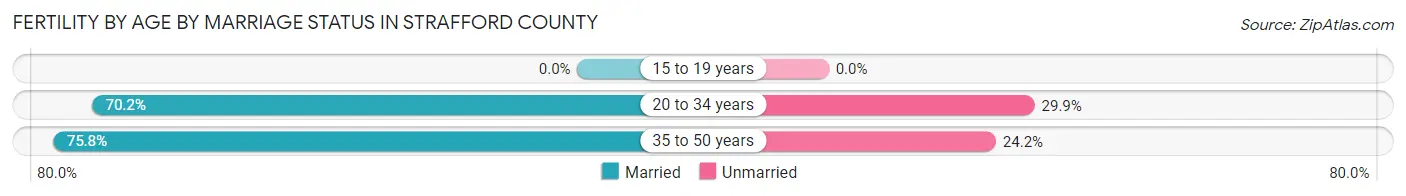
| Age Bracket | Married | Unmarried |
| 15 to 19 years | 0 (0.0%) | 0 (0.0%) |
| 20 to 34 years | 691 (70.2%) | 294 (29.8%) |
| 35 to 50 years | 350 (75.8%) | 112 (24.2%) |
| Total | 1,040 (71.9%) | 407 (28.1%) |
Fertility by Education in Strafford County
Average fertility rate in Strafford County is 44.0 births per 1,000 women. Women with the education attainment of bachelor's degree have the highest fertility rate of 84.0 births per 1,000 women, while women with the education attainment of less than high school have the lowest fertility at 4.0 births per 1,000 women. Women with the education attainment of bachelor's degree represent 42.3% of all women with births.
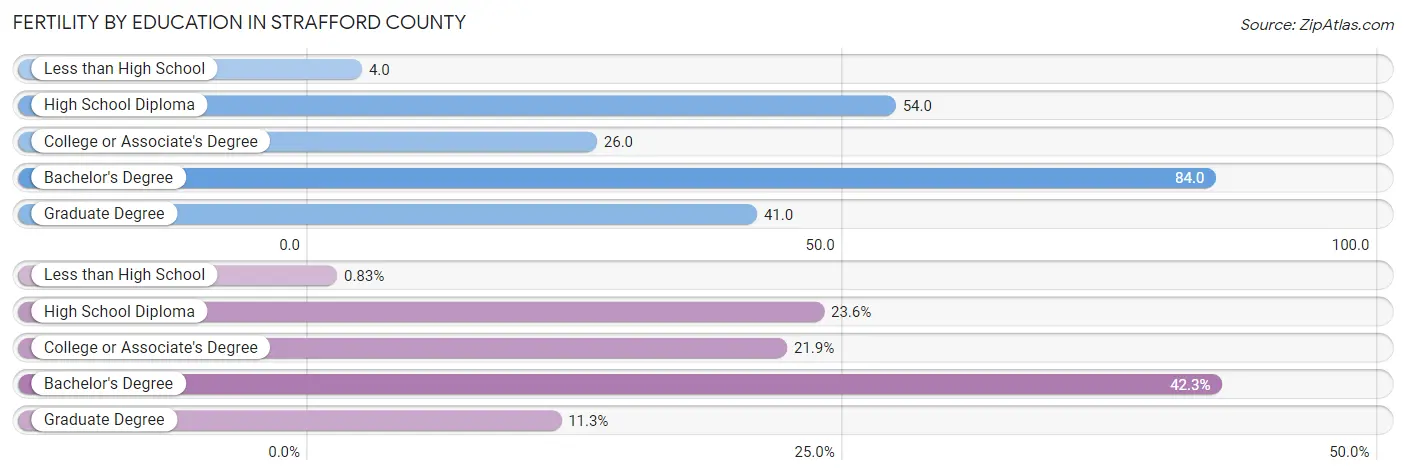
| Educational Attainment | Women with Births | Births / 1,000 Women |
| Less than High School | 12 (0.8%) | 4.0 |
| High School Diploma | 342 (23.6%) | 54.0 |
| College or Associate's Degree | 317 (21.9%) | 26.0 |
| Bachelor's Degree | 612 (42.3%) | 84.0 |
| Graduate Degree | 164 (11.3%) | 41.0 |
| Total | 1,447 (100.0%) | 44.0 |
Fertility by Education by Marriage Status in Strafford County
28.1% of women with births in Strafford County are unmarried. Women with the educational attainment of less than high school are most likely to be married with 100.0% of them married at childbirth, while women with the educational attainment of high school diploma are least likely to be married with 59.1% of them unmarried at childbirth.
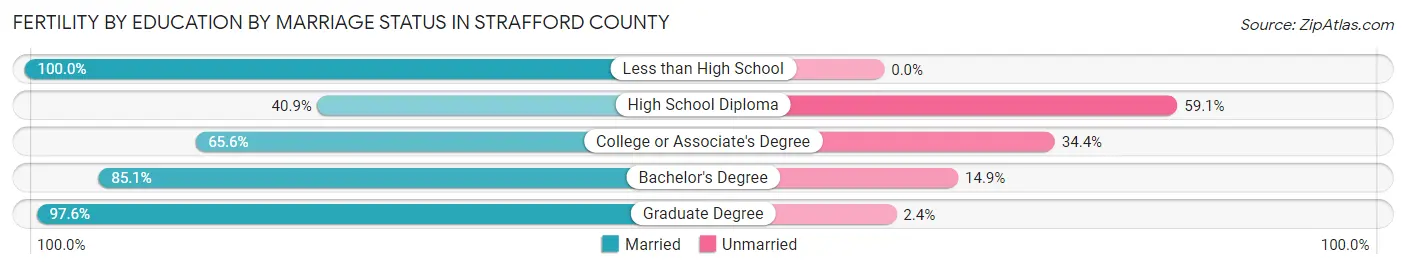
| Educational Attainment | Married | Unmarried |
| Less than High School | 12 (100.0%) | 0 (0.0%) |
| High School Diploma | 140 (40.9%) | 202 (59.1%) |
| College or Associate's Degree | 208 (65.6%) | 109 (34.4%) |
| Bachelor's Degree | 521 (85.1%) | 91 (14.9%) |
| Graduate Degree | 160 (97.6%) | 4 (2.4%) |
| Total | 1,040 (71.9%) | 407 (28.1%) |
Employment Characteristics in Strafford County
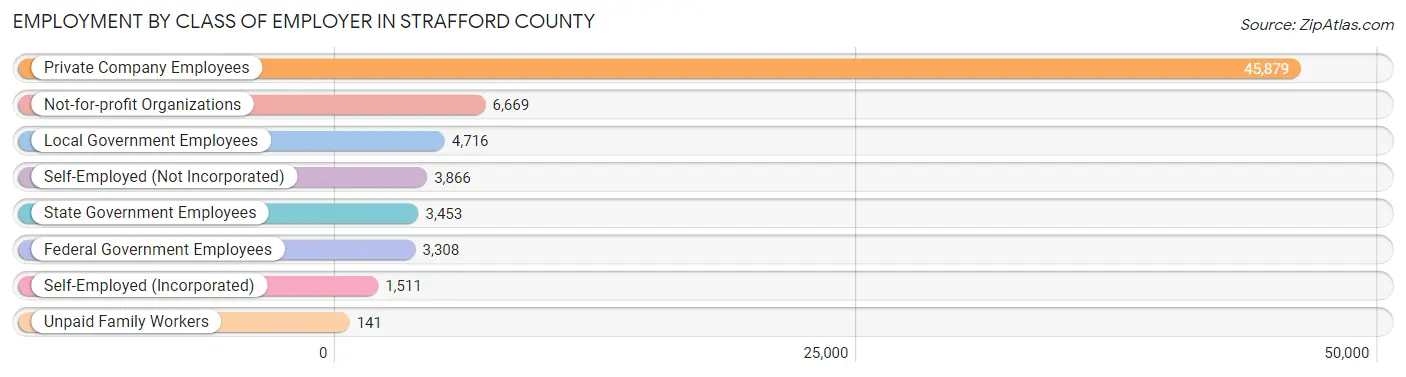
Employment by Class of Employer in Strafford County
Among the 69,543 employed individuals in Strafford County, private company employees (45,879 | 66.0%), not-for-profit organizations (6,669 | 9.6%), and local government employees (4,716 | 6.8%) make up the most common classes of employment.
| Employer Class | # Employees | % Employees |
| Private Company Employees | 45,879 | 66.0% |
| Self-Employed (Incorporated) | 1,511 | 2.2% |
| Self-Employed (Not Incorporated) | 3,866 | 5.6% |
| Not-for-profit Organizations | 6,669 | 9.6% |
| Local Government Employees | 4,716 | 6.8% |
| State Government Employees | 3,453 | 5.0% |
| Federal Government Employees | 3,308 | 4.8% |
| Unpaid Family Workers | 141 | 0.2% |
| Total | 69,543 | 100.0% |
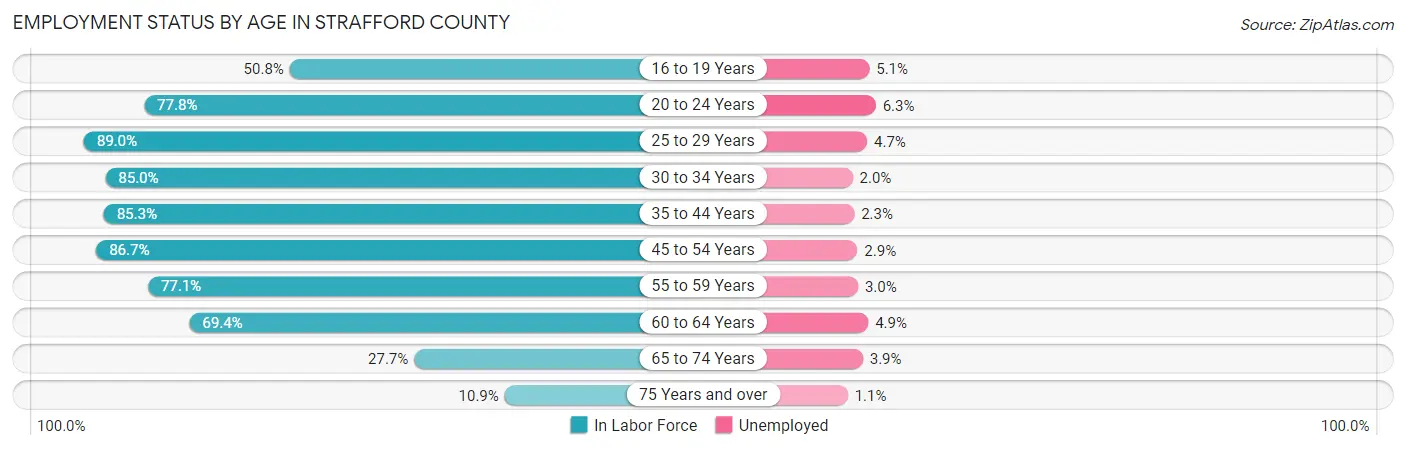
Employment Status by Age in Strafford County
According to the labor force statistics for Strafford County, out of the total population over 16 years of age (110,152), 67.9% or 74,793 individuals are in the labor force, with 3.7% or 2,767 of them unemployed. The age group with the highest labor force participation rate is 25 to 29 years, with 89.0% or 8,011 individuals in the labor force. Within the labor force, the 20 to 24 years age range has the highest percentage of unemployed individuals, with 6.3% or 662 of them being unemployed.
| Age Bracket | In Labor Force | Unemployed |
| 16 to 19 Years | 4,465 (50.8%) | 228 (5.1%) |
| 20 to 24 Years | 10,511 (77.8%) | 662 (6.3%) |
| 25 to 29 Years | 8,011 (89.0%) | 377 (4.7%) |
| 30 to 34 Years | 7,454 (85.0%) | 149 (2.0%) |
| 35 to 44 Years | 13,042 (85.3%) | 300 (2.3%) |
| 45 to 54 Years | 13,782 (86.7%) | 400 (2.9%) |
| 55 to 59 Years | 7,370 (77.1%) | 221 (3.0%) |
| 60 to 64 Years | 5,793 (69.4%) | 284 (4.9%) |
| 65 to 74 Years | 3,477 (27.7%) | 136 (3.9%) |
| 75 Years and over | 920 (10.9%) | 10 (1.1%) |
| Total | 74,793 (67.9%) | 2,767 (3.7%) |
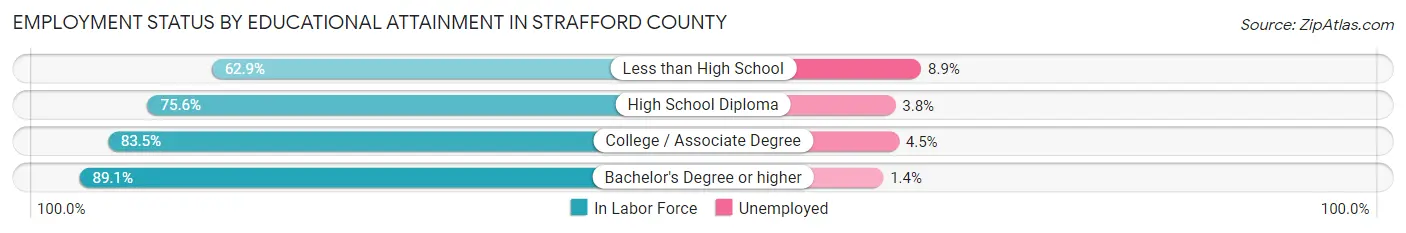
Employment Status by Educational Attainment in Strafford County
According to labor force statistics for Strafford County, 82.9% of individuals (55,429) out of the total population between 25 and 64 years of age (66,862) are in the labor force, with 3.1% or 1,718 of them being unemployed. The group with the highest labor force participation rate are those with the educational attainment of bachelor's degree or higher, with 89.1% or 24,058 individuals in the labor force. Within the labor force, individuals with less than high school education have the highest percentage of unemployment, with 8.9% or 150 of them being unemployed.
| Educational Attainment | In Labor Force | Unemployed |
| Less than High School | 1,689 (62.9%) | 239 (8.9%) |
| High School Diploma | 12,672 (75.6%) | 637 (3.8%) |
| College / Associate Degree | 17,045 (83.5%) | 919 (4.5%) |
| Bachelor's Degree or higher | 24,058 (89.1%) | 378 (1.4%) |
| Total | 55,429 (82.9%) | 2,073 (3.1%) |
Employment Occupations by Sex in Strafford County
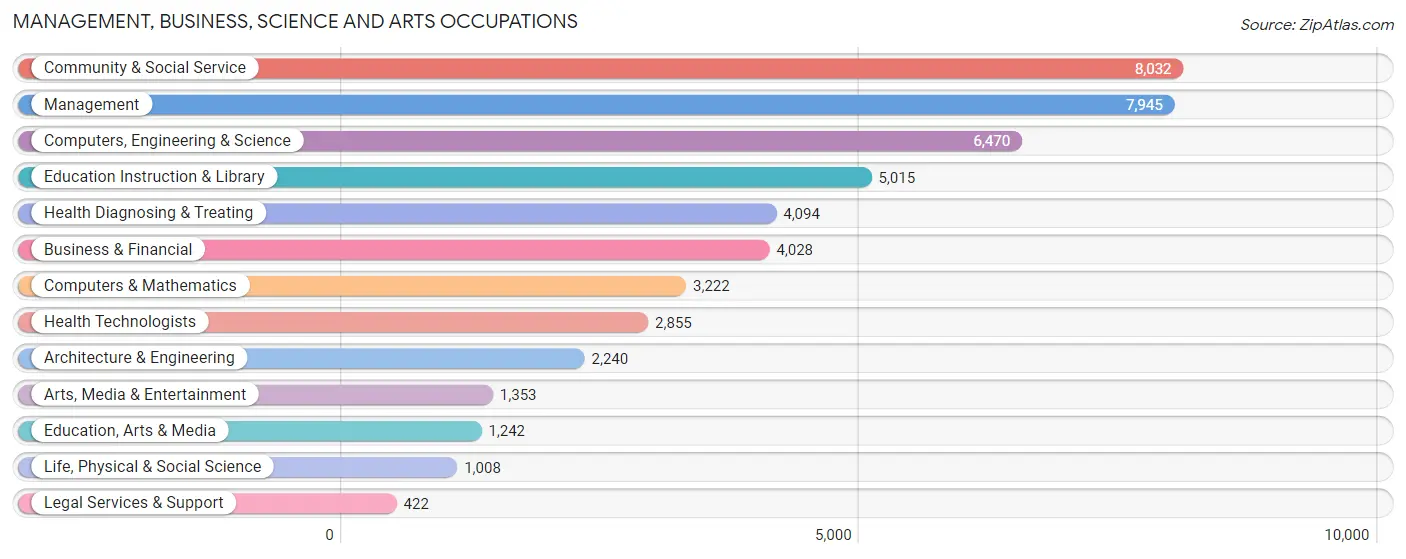
Management, Business, Science and Arts Occupations
The most common Management, Business, Science and Arts occupations in Strafford County are Community & Social Service (8,032 | 11.2%), Management (7,945 | 11.1%), Computers, Engineering & Science (6,470 | 9.0%), Education Instruction & Library (5,015 | 7.0%), and Health Diagnosing & Treating (4,094 | 5.7%).
Management, Business, Science and Arts Occupations by Sex
Within the Management, Business, Science and Arts occupations in Strafford County, the most male-oriented occupations are Architecture & Engineering (83.3%), Computers & Mathematics (74.8%), and Computers, Engineering & Science (74.1%), while the most female-oriented occupations are Health Diagnosing & Treating (78.3%), Health Technologists (75.0%), and Legal Services & Support (69.7%).
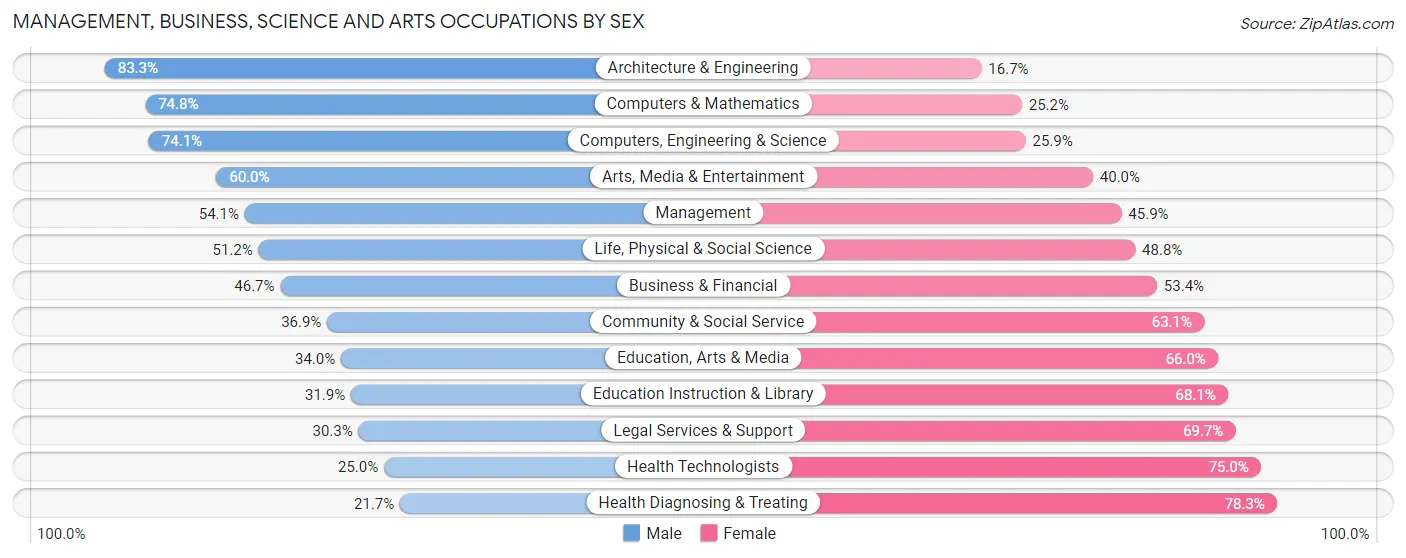
| Occupation | Male | Female |
| Management | 4,295 (54.1%) | 3,650 (45.9%) |
| Business & Financial | 1,879 (46.7%) | 2,149 (53.3%) |
| Computers, Engineering & Science | 4,792 (74.1%) | 1,678 (25.9%) |
| Computers & Mathematics | 2,411 (74.8%) | 811 (25.2%) |
| Architecture & Engineering | 1,865 (83.3%) | 375 (16.7%) |
| Life, Physical & Social Science | 516 (51.2%) | 492 (48.8%) |
| Community & Social Service | 2,962 (36.9%) | 5,070 (63.1%) |
| Education, Arts & Media | 422 (34.0%) | 820 (66.0%) |
| Legal Services & Support | 128 (30.3%) | 294 (69.7%) |
| Education Instruction & Library | 1,600 (31.9%) | 3,415 (68.1%) |
| Arts, Media & Entertainment | 812 (60.0%) | 541 (40.0%) |
| Health Diagnosing & Treating | 887 (21.7%) | 3,207 (78.3%) |
| Health Technologists | 714 (25.0%) | 2,141 (75.0%) |
| Total (Category) | 14,815 (48.5%) | 15,754 (51.5%) |
| Total (Overall) | 37,379 (52.2%) | 34,263 (47.8%) |
Services Occupations
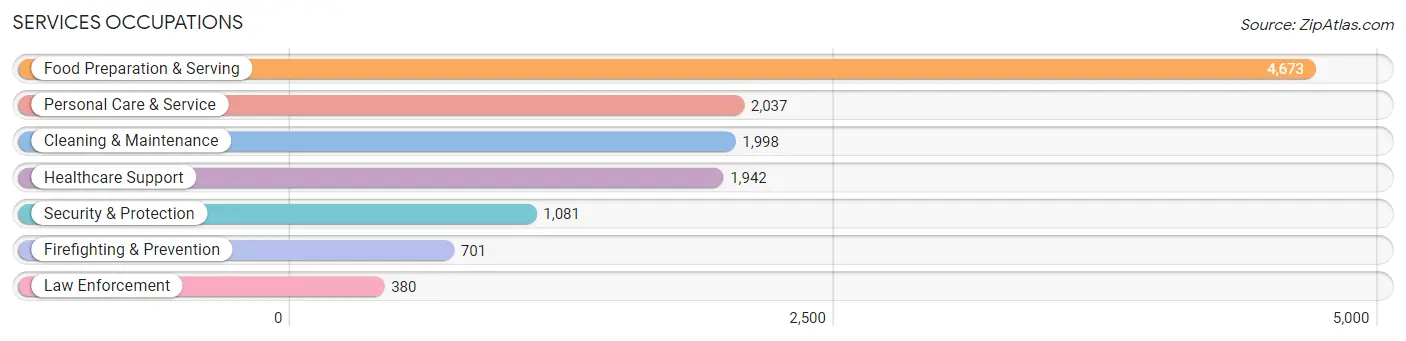
The most common Services occupations in Strafford County are Food Preparation & Serving (4,673 | 6.5%), Personal Care & Service (2,037 | 2.8%), Cleaning & Maintenance (1,998 | 2.8%), Healthcare Support (1,942 | 2.7%), and Security & Protection (1,081 | 1.5%).
Services Occupations by Sex
Within the Services occupations in Strafford County, the most male-oriented occupations are Law Enforcement (75.0%), Security & Protection (74.3%), and Firefighting & Prevention (73.9%), while the most female-oriented occupations are Healthcare Support (83.8%), Personal Care & Service (76.9%), and Food Preparation & Serving (61.9%).
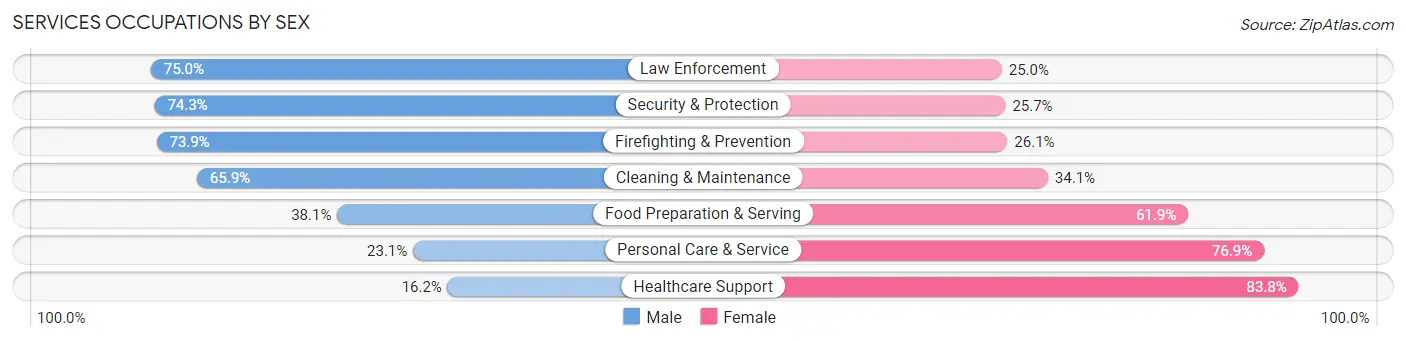
| Occupation | Male | Female |
| Healthcare Support | 315 (16.2%) | 1,627 (83.8%) |
| Security & Protection | 803 (74.3%) | 278 (25.7%) |
| Firefighting & Prevention | 518 (73.9%) | 183 (26.1%) |
| Law Enforcement | 285 (75.0%) | 95 (25.0%) |
| Food Preparation & Serving | 1,780 (38.1%) | 2,893 (61.9%) |
| Cleaning & Maintenance | 1,316 (65.9%) | 682 (34.1%) |
| Personal Care & Service | 470 (23.1%) | 1,567 (76.9%) |
| Total (Category) | 4,684 (39.9%) | 7,047 (60.1%) |
| Total (Overall) | 37,379 (52.2%) | 34,263 (47.8%) |
Sales and Office Occupations
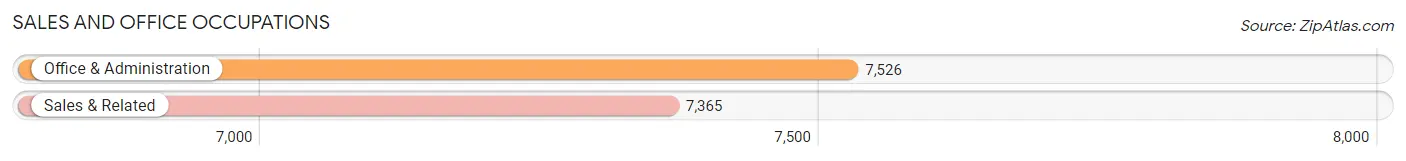
The most common Sales and Office occupations in Strafford County are Office & Administration (7,526 | 10.5%), and Sales & Related (7,365 | 10.3%).
Sales and Office Occupations by Sex
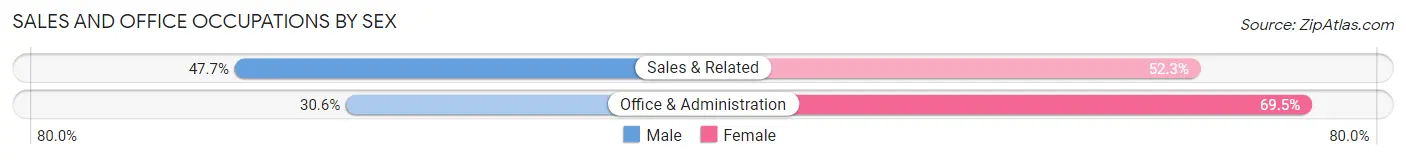
| Occupation | Male | Female |
| Sales & Related | 3,511 (47.7%) | 3,854 (52.3%) |
| Office & Administration | 2,299 (30.5%) | 5,227 (69.5%) |
| Total (Category) | 5,810 (39.0%) | 9,081 (61.0%) |
| Total (Overall) | 37,379 (52.2%) | 34,263 (47.8%) |
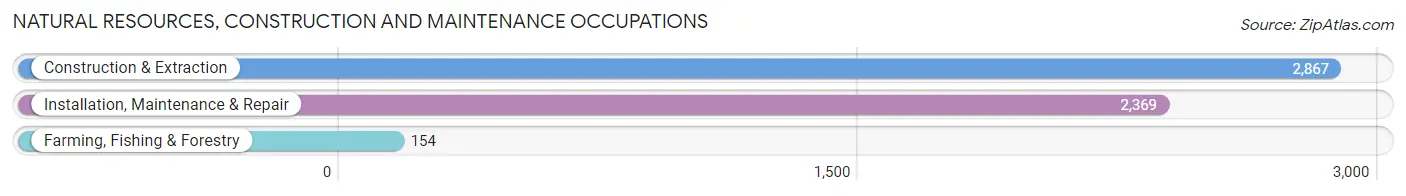
Natural Resources, Construction and Maintenance Occupations
The most common Natural Resources, Construction and Maintenance occupations in Strafford County are Construction & Extraction (2,867 | 4.0%), Installation, Maintenance & Repair (2,369 | 3.3%), and Farming, Fishing & Forestry (154 | 0.2%).
Natural Resources, Construction and Maintenance Occupations by Sex
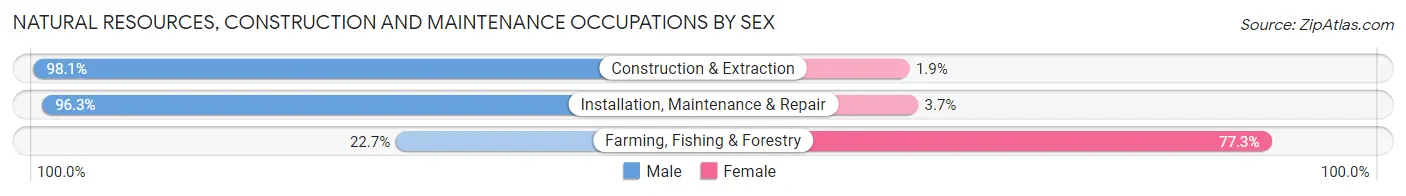
| Occupation | Male | Female |
| Farming, Fishing & Forestry | 35 (22.7%) | 119 (77.3%) |
| Construction & Extraction | 2,813 (98.1%) | 54 (1.9%) |
| Installation, Maintenance & Repair | 2,282 (96.3%) | 87 (3.7%) |
| Total (Category) | 5,130 (95.2%) | 260 (4.8%) |
| Total (Overall) | 37,379 (52.2%) | 34,263 (47.8%) |
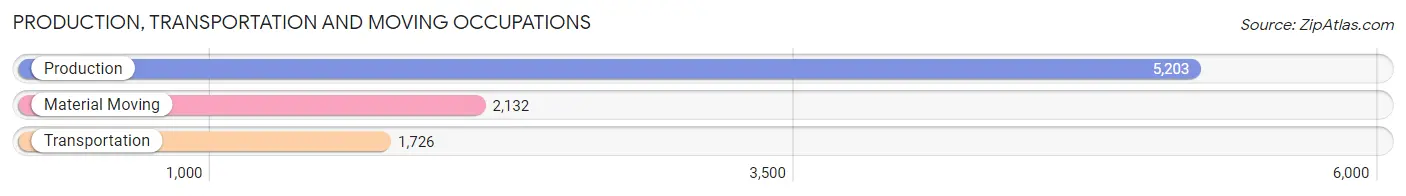
Production, Transportation and Moving Occupations
The most common Production, Transportation and Moving occupations in Strafford County are Production (5,203 | 7.3%), Material Moving (2,132 | 3.0%), and Transportation (1,726 | 2.4%).
Production, Transportation and Moving Occupations by Sex
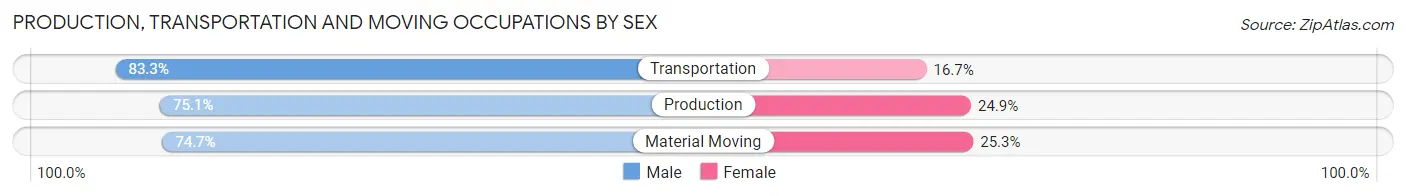
| Occupation | Male | Female |
| Production | 3,909 (75.1%) | 1,294 (24.9%) |
| Transportation | 1,438 (83.3%) | 288 (16.7%) |
| Material Moving | 1,593 (74.7%) | 539 (25.3%) |
| Total (Category) | 6,940 (76.6%) | 2,121 (23.4%) |
| Total (Overall) | 37,379 (52.2%) | 34,263 (47.8%) |
Employment Industries by Sex in Strafford County
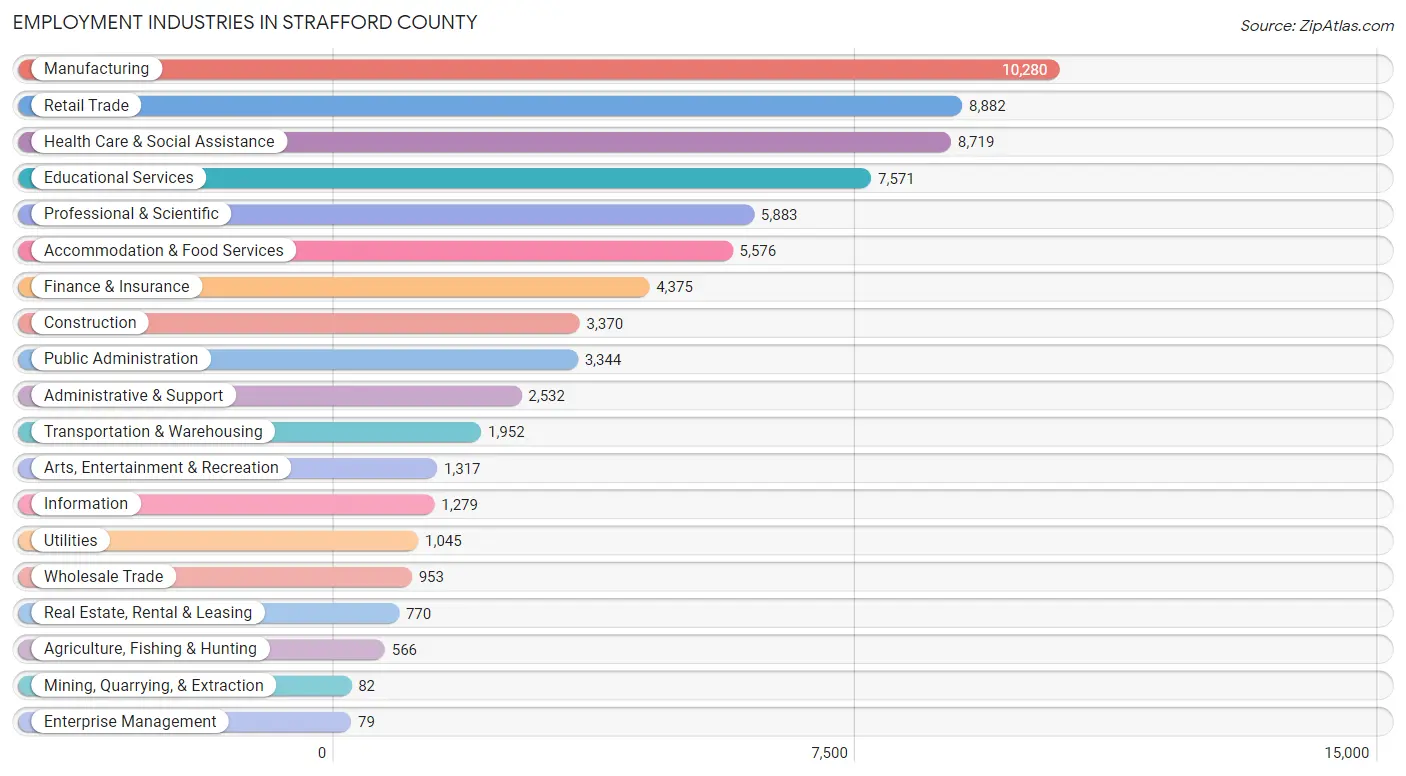
Employment Industries in Strafford County
The major employment industries in Strafford County include Manufacturing (10,280 | 14.3%), Retail Trade (8,882 | 12.4%), Health Care & Social Assistance (8,719 | 12.2%), Educational Services (7,571 | 10.6%), and Professional & Scientific (5,883 | 8.2%).
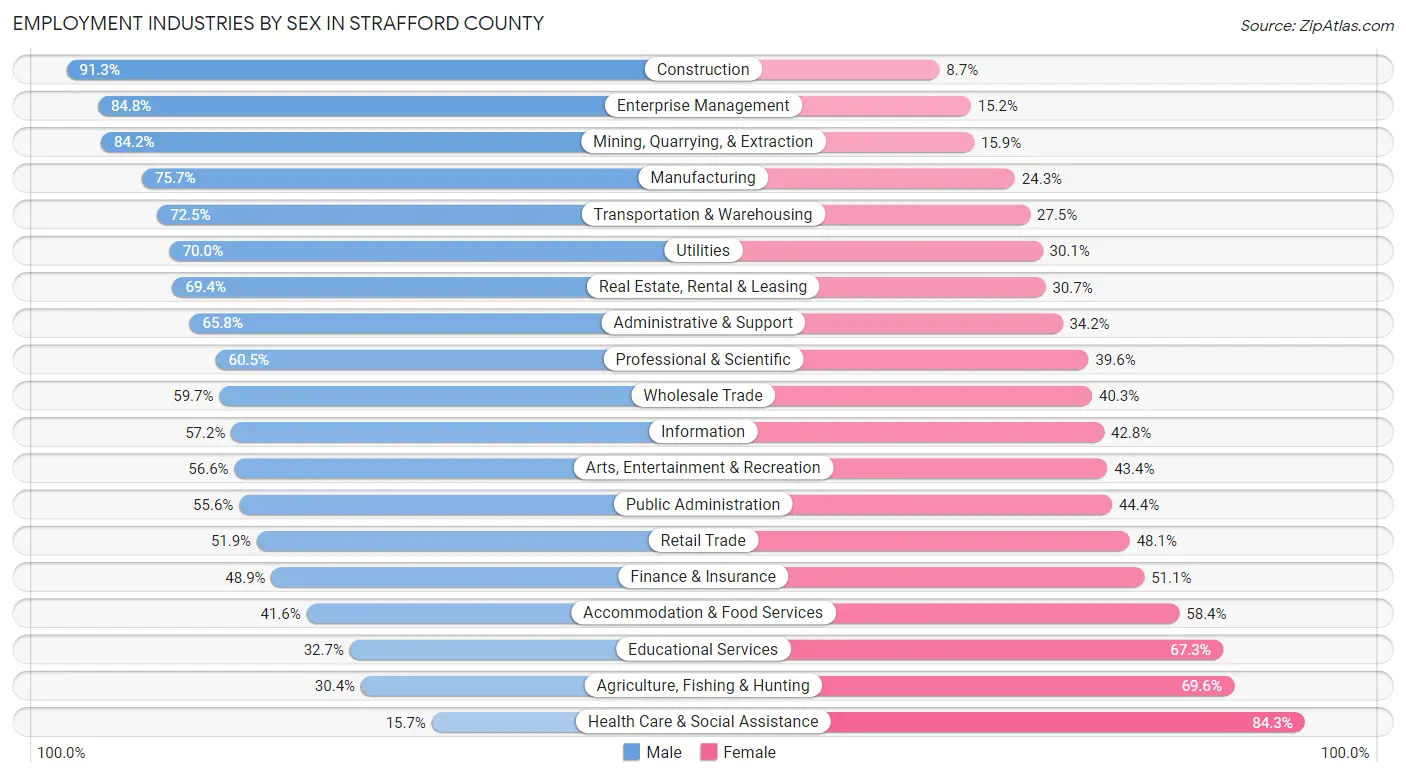
Employment Industries by Sex in Strafford County
The Strafford County industries that see more men than women are Construction (91.3%), Enterprise Management (84.8%), and Mining, Quarrying, & Extraction (84.2%), whereas the industries that tend to have a higher number of women are Health Care & Social Assistance (84.3%), Agriculture, Fishing & Hunting (69.6%), and Educational Services (67.3%).
| Industry | Male | Female |
| Agriculture, Fishing & Hunting | 172 (30.4%) | 394 (69.6%) |
| Mining, Quarrying, & Extraction | 69 (84.2%) | 13 (15.9%) |
| Construction | 3,077 (91.3%) | 293 (8.7%) |
| Manufacturing | 7,780 (75.7%) | 2,500 (24.3%) |
| Wholesale Trade | 569 (59.7%) | 384 (40.3%) |
| Retail Trade | 4,611 (51.9%) | 4,271 (48.1%) |
| Transportation & Warehousing | 1,416 (72.5%) | 536 (27.5%) |
| Utilities | 731 (70.0%) | 314 (30.0%) |
| Information | 732 (57.2%) | 547 (42.8%) |
| Finance & Insurance | 2,140 (48.9%) | 2,235 (51.1%) |
| Real Estate, Rental & Leasing | 534 (69.4%) | 236 (30.6%) |
| Professional & Scientific | 3,556 (60.5%) | 2,327 (39.6%) |
| Enterprise Management | 67 (84.8%) | 12 (15.2%) |
| Administrative & Support | 1,667 (65.8%) | 865 (34.2%) |
| Educational Services | 2,476 (32.7%) | 5,095 (67.3%) |
| Health Care & Social Assistance | 1,372 (15.7%) | 7,347 (84.3%) |
| Arts, Entertainment & Recreation | 745 (56.6%) | 572 (43.4%) |
| Accommodation & Food Services | 2,322 (41.6%) | 3,254 (58.4%) |
| Public Administration | 1,859 (55.6%) | 1,485 (44.4%) |
| Total | 37,379 (52.2%) | 34,263 (47.8%) |
Education in Strafford County
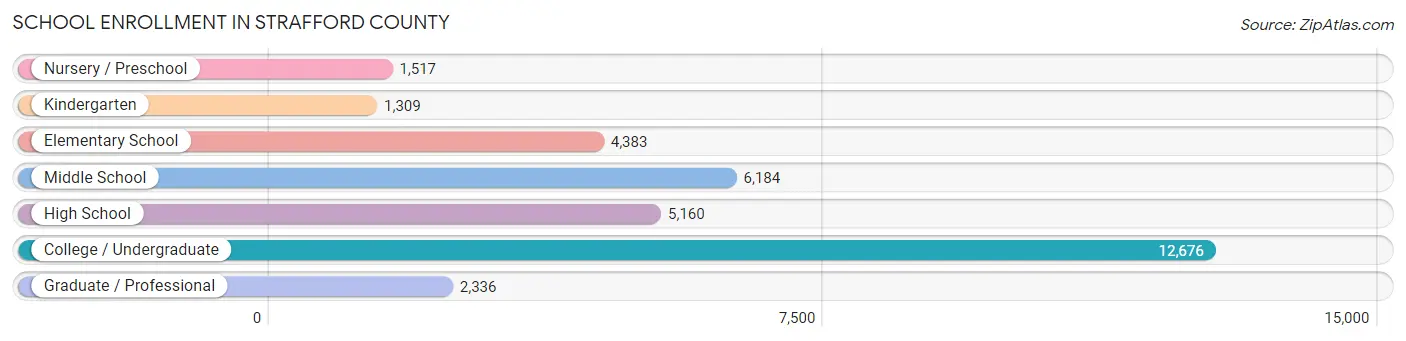
School Enrollment in Strafford County
The most common levels of schooling among the 33,565 students in Strafford County are college / undergraduate (12,676 | 37.8%), middle school (6,184 | 18.4%), and high school (5,160 | 15.4%).
| School Level | # Students | % Students |
| Nursery / Preschool | 1,517 | 4.5% |
| Kindergarten | 1,309 | 3.9% |
| Elementary School | 4,383 | 13.1% |
| Middle School | 6,184 | 18.4% |
| High School | 5,160 | 15.4% |
| College / Undergraduate | 12,676 | 37.8% |
| Graduate / Professional | 2,336 | 7.0% |
| Total | 33,565 | 100.0% |
School Enrollment by Age by Funding Source in Strafford County
Out of a total of 33,565 students who are enrolled in schools in Strafford County, 4,598 (13.7%) attend a private institution, while the remaining 28,967 (86.3%) are enrolled in public schools. The age group of 3 to 4 year olds has the highest likelihood of being enrolled in private schools, with 676 (55.2% in the age bracket) enrolled. Conversely, the age group of 18 to 19 year olds has the lowest likelihood of being enrolled in a private school, with 5,320 (97.5% in the age bracket) attending a public institution.
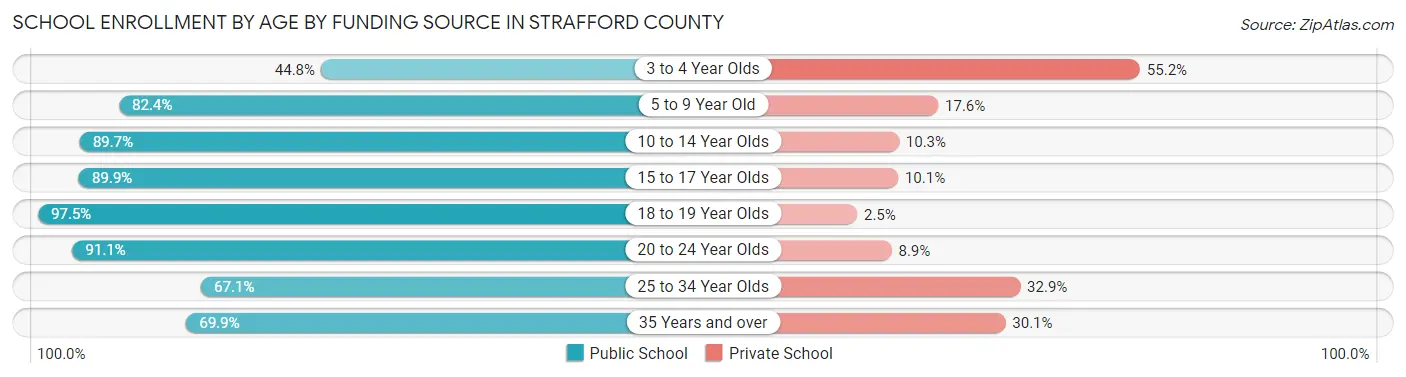
| Age Bracket | Public School | Private School |
| 3 to 4 Year Olds | 549 (44.8%) | 676 (55.2%) |
| 5 to 9 Year Old | 4,466 (82.4%) | 953 (17.6%) |
| 10 to 14 Year Olds | 6,391 (89.7%) | 732 (10.3%) |
| 15 to 17 Year Olds | 3,900 (89.9%) | 439 (10.1%) |
| 18 to 19 Year Olds | 5,320 (97.5%) | 136 (2.5%) |
| 20 to 24 Year Olds | 6,034 (91.1%) | 590 (8.9%) |
| 25 to 34 Year Olds | 1,350 (67.1%) | 661 (32.9%) |
| 35 Years and over | 956 (69.9%) | 412 (30.1%) |
| Total | 28,967 (86.3%) | 4,598 (13.7%) |
Educational Attainment by Field of Study in Strafford County
Business (6,377 | 17.4%), engineering (3,621 | 9.9%), science & technology (3,420 | 9.3%), education (3,223 | 8.8%), and social sciences (3,051 | 8.3%) are the most common fields of study among 36,651 individuals in Strafford County who have obtained a bachelor's degree or higher.
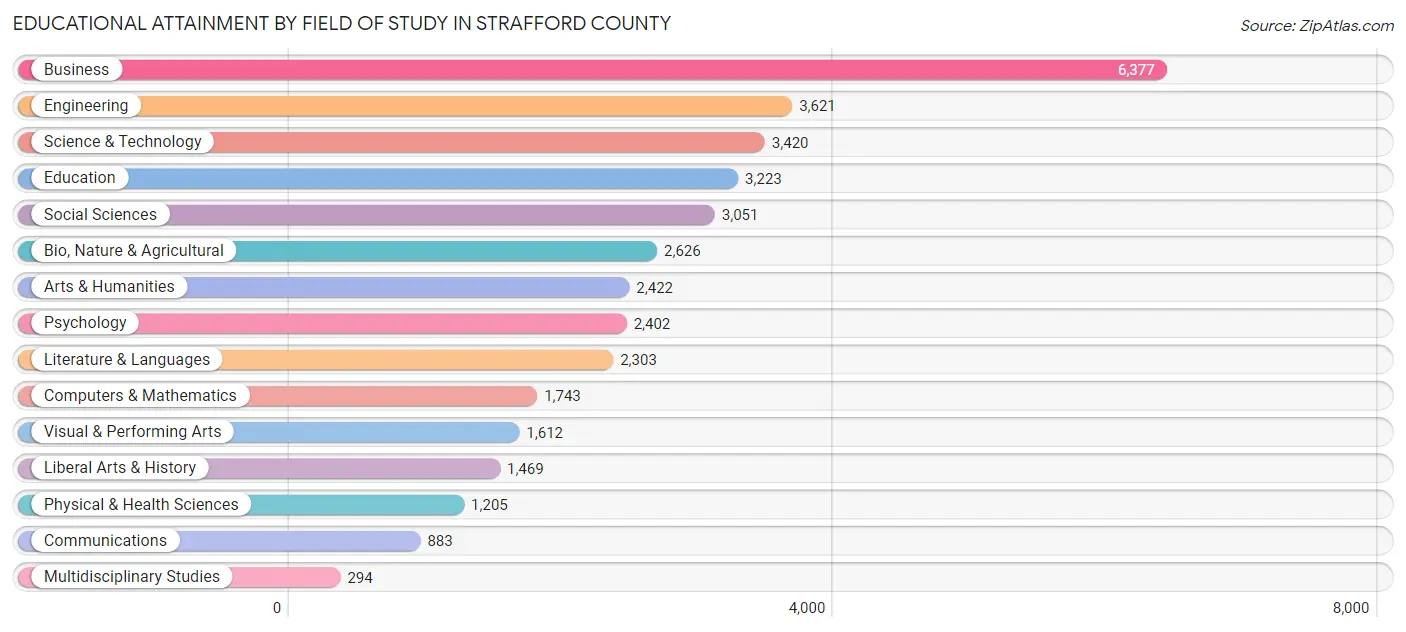
| Field of Study | # Graduates | % Graduates |
| Computers & Mathematics | 1,743 | 4.8% |
| Bio, Nature & Agricultural | 2,626 | 7.2% |
| Physical & Health Sciences | 1,205 | 3.3% |
| Psychology | 2,402 | 6.6% |
| Social Sciences | 3,051 | 8.3% |
| Engineering | 3,621 | 9.9% |
| Multidisciplinary Studies | 294 | 0.8% |
| Science & Technology | 3,420 | 9.3% |
| Business | 6,377 | 17.4% |
| Education | 3,223 | 8.8% |
| Literature & Languages | 2,303 | 6.3% |
| Liberal Arts & History | 1,469 | 4.0% |
| Visual & Performing Arts | 1,612 | 4.4% |
| Communications | 883 | 2.4% |
| Arts & Humanities | 2,422 | 6.6% |
| Total | 36,651 | 100.0% |
Transportation & Commute in Strafford County
Vehicle Availability by Sex in Strafford County
The most prevalent vehicle ownership categories in Strafford County are males with 2 vehicles (16,460, accounting for 46.3%) and females with 2 vehicles (14,000, making up 51.7%).
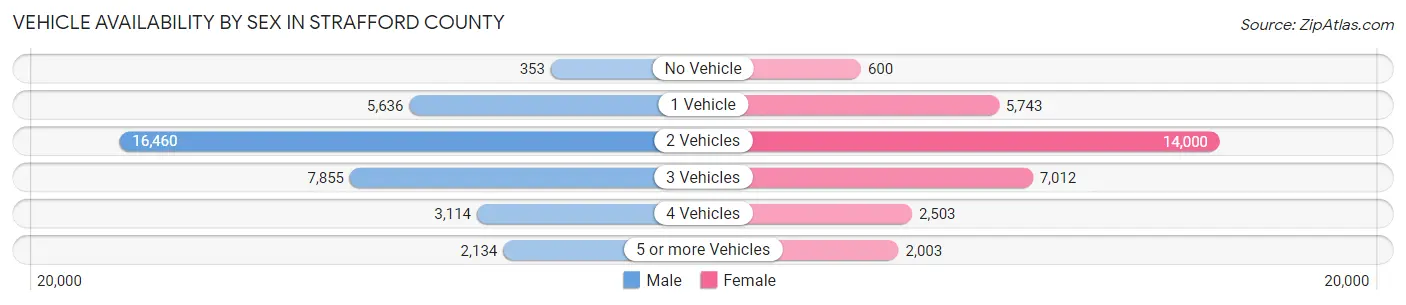
| Vehicles Available | Male | Female |
| No Vehicle | 353 (1.0%) | 600 (1.9%) |
| 1 Vehicle | 5,636 (15.9%) | 5,743 (18.0%) |
| 2 Vehicles | 16,460 (46.3%) | 14,000 (43.9%) |
| 3 Vehicles | 7,855 (22.1%) | 7,012 (22.0%) |
| 4 Vehicles | 3,114 (8.8%) | 2,503 (7.9%) |
| 5 or more Vehicles | 2,134 (6.0%) | 2,003 (6.3%) |
| Total | 35,552 (100.0%) | 31,861 (100.0%) |
Commute Time in Strafford County
The most frequently occuring commute durations in Strafford County are 20 to 24 minutes (8,704 commuters, 14.4%), 15 to 19 minutes (8,549 commuters, 14.1%), and 30 to 34 minutes (8,511 commuters, 14.0%).
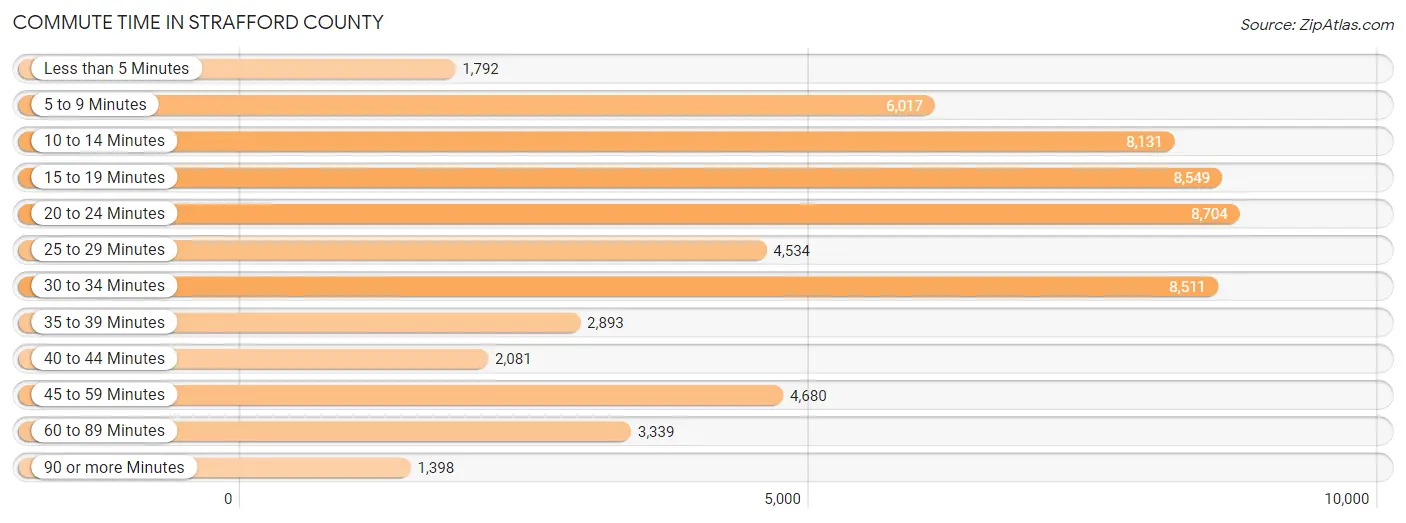
| Commute Time | # Commuters | % Commuters |
| Less than 5 Minutes | 1,792 | 3.0% |
| 5 to 9 Minutes | 6,017 | 9.9% |
| 10 to 14 Minutes | 8,131 | 13.4% |
| 15 to 19 Minutes | 8,549 | 14.1% |
| 20 to 24 Minutes | 8,704 | 14.4% |
| 25 to 29 Minutes | 4,534 | 7.5% |
| 30 to 34 Minutes | 8,511 | 14.0% |
| 35 to 39 Minutes | 2,893 | 4.8% |
| 40 to 44 Minutes | 2,081 | 3.4% |
| 45 to 59 Minutes | 4,680 | 7.7% |
| 60 to 89 Minutes | 3,339 | 5.5% |
| 90 or more Minutes | 1,398 | 2.3% |
Commute Time by Sex in Strafford County
The most common commute times in Strafford County are 20 to 24 minutes (5,168 commuters, 16.2%) for males and 30 to 34 minutes (4,322 commuters, 15.0%) for females.
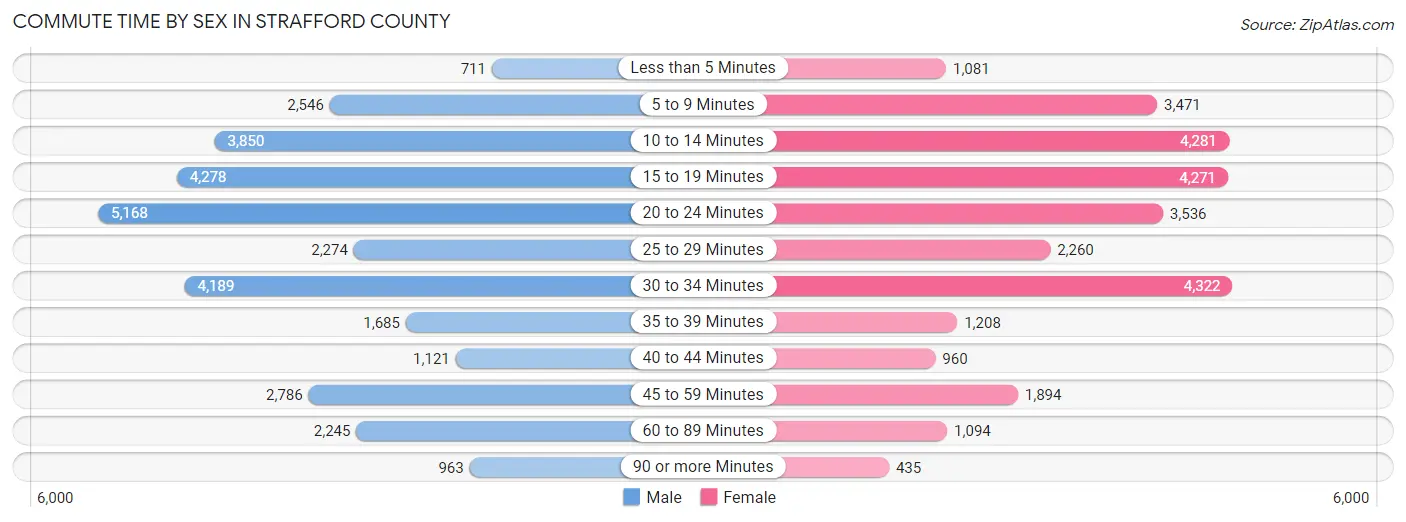
| Commute Time | Male | Female |
| Less than 5 Minutes | 711 (2.2%) | 1,081 (3.7%) |
| 5 to 9 Minutes | 2,546 (8.0%) | 3,471 (12.0%) |
| 10 to 14 Minutes | 3,850 (12.1%) | 4,281 (14.9%) |
| 15 to 19 Minutes | 4,278 (13.5%) | 4,271 (14.8%) |
| 20 to 24 Minutes | 5,168 (16.2%) | 3,536 (12.3%) |
| 25 to 29 Minutes | 2,274 (7.1%) | 2,260 (7.8%) |
| 30 to 34 Minutes | 4,189 (13.2%) | 4,322 (15.0%) |
| 35 to 39 Minutes | 1,685 (5.3%) | 1,208 (4.2%) |
| 40 to 44 Minutes | 1,121 (3.5%) | 960 (3.3%) |
| 45 to 59 Minutes | 2,786 (8.8%) | 1,894 (6.6%) |
| 60 to 89 Minutes | 2,245 (7.1%) | 1,094 (3.8%) |
| 90 or more Minutes | 963 (3.0%) | 435 (1.5%) |
Time of Departure to Work by Sex in Strafford County
The most frequent times of departure to work in Strafford County are 7:00 AM to 7:29 AM (4,013, 12.6%) for males and 7:30 AM to 7:59 AM (4,478, 15.5%) for females.
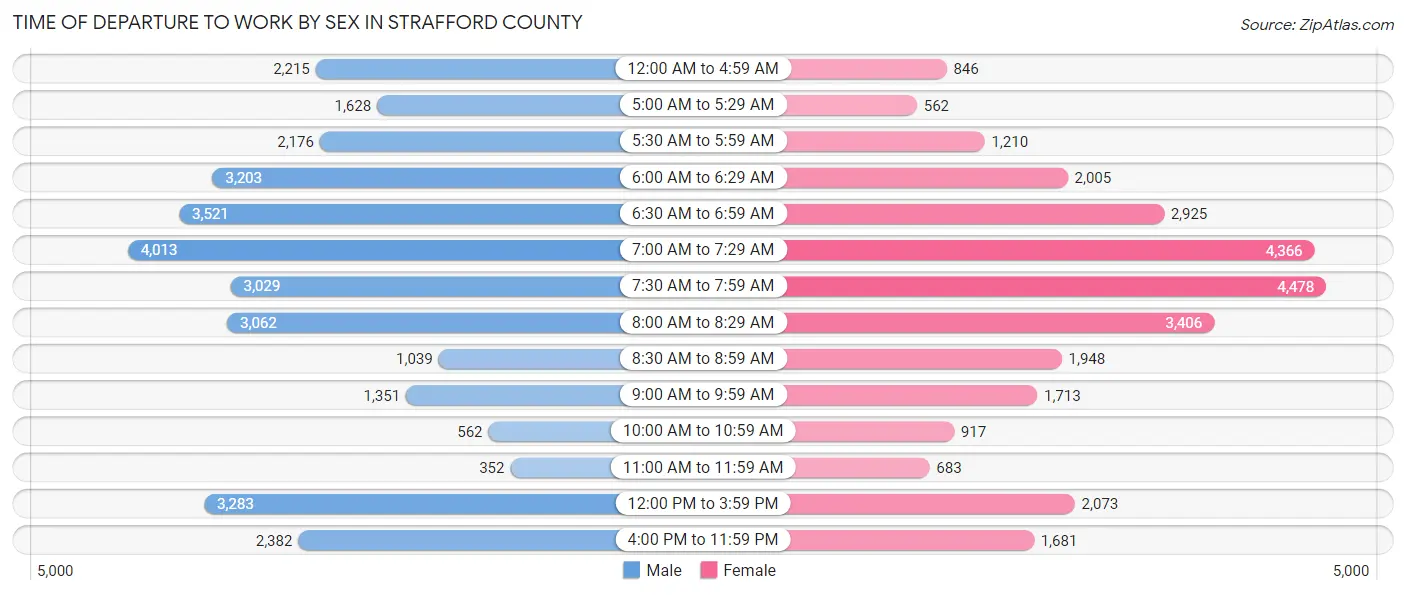
| Time of Departure | Male | Female |
| 12:00 AM to 4:59 AM | 2,215 (7.0%) | 846 (2.9%) |
| 5:00 AM to 5:29 AM | 1,628 (5.1%) | 562 (1.9%) |
| 5:30 AM to 5:59 AM | 2,176 (6.8%) | 1,210 (4.2%) |
| 6:00 AM to 6:29 AM | 3,203 (10.1%) | 2,005 (7.0%) |
| 6:30 AM to 6:59 AM | 3,521 (11.1%) | 2,925 (10.2%) |
| 7:00 AM to 7:29 AM | 4,013 (12.6%) | 4,366 (15.1%) |
| 7:30 AM to 7:59 AM | 3,029 (9.5%) | 4,478 (15.5%) |
| 8:00 AM to 8:29 AM | 3,062 (9.6%) | 3,406 (11.8%) |
| 8:30 AM to 8:59 AM | 1,039 (3.3%) | 1,948 (6.8%) |
| 9:00 AM to 9:59 AM | 1,351 (4.3%) | 1,713 (5.9%) |
| 10:00 AM to 10:59 AM | 562 (1.8%) | 917 (3.2%) |
| 11:00 AM to 11:59 AM | 352 (1.1%) | 683 (2.4%) |
| 12:00 PM to 3:59 PM | 3,283 (10.3%) | 2,073 (7.2%) |
| 4:00 PM to 11:59 PM | 2,382 (7.5%) | 1,681 (5.8%) |
| Total | 31,816 (100.0%) | 28,813 (100.0%) |
Housing Occupancy in Strafford County
Occupancy by Ownership in Strafford County
Of the total 50,953 dwellings in Strafford County, owner-occupied units account for 34,187 (67.1%), while renter-occupied units make up 16,766 (32.9%).
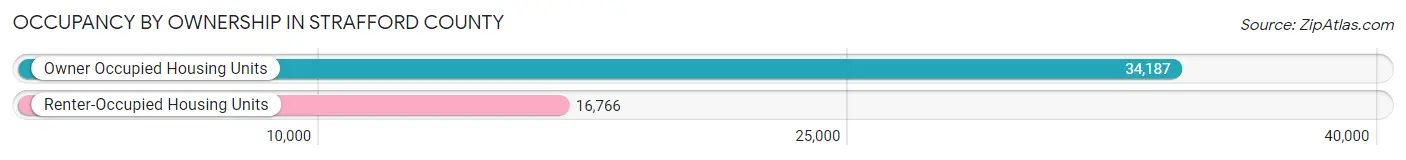
| Occupancy | # Housing Units | % Housing Units |
| Owner Occupied Housing Units | 34,187 | 67.1% |
| Renter-Occupied Housing Units | 16,766 | 32.9% |
| Total Occupied Housing Units | 50,953 | 100.0% |
Occupancy by Household Size in Strafford County
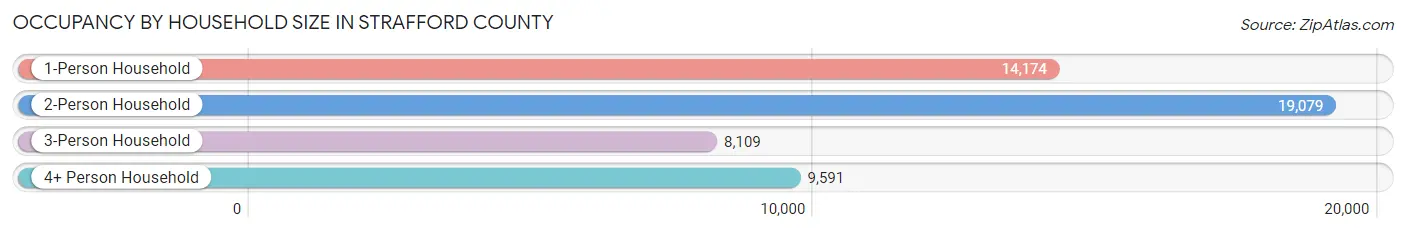
| Household Size | # Housing Units | % Housing Units |
| 1-Person Household | 14,174 | 27.8% |
| 2-Person Household | 19,079 | 37.4% |
| 3-Person Household | 8,109 | 15.9% |
| 4+ Person Household | 9,591 | 18.8% |
| Total Housing Units | 50,953 | 100.0% |
Occupancy by Ownership by Household Size in Strafford County
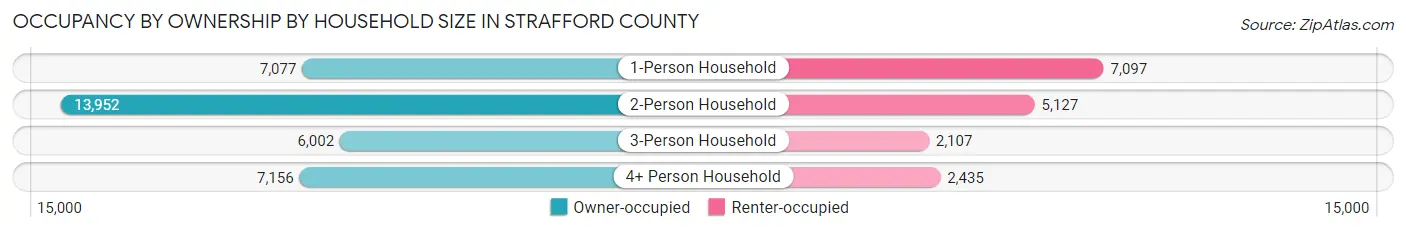
| Household Size | Owner-occupied | Renter-occupied |
| 1-Person Household | 7,077 (49.9%) | 7,097 (50.1%) |
| 2-Person Household | 13,952 (73.1%) | 5,127 (26.9%) |
| 3-Person Household | 6,002 (74.0%) | 2,107 (26.0%) |
| 4+ Person Household | 7,156 (74.6%) | 2,435 (25.4%) |
| Total Housing Units | 34,187 (67.1%) | 16,766 (32.9%) |
Occupancy by Educational Attainment in Strafford County
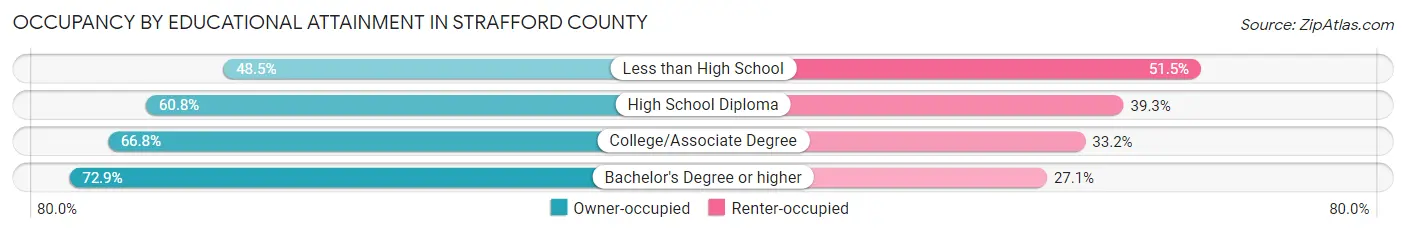
| Household Size | Owner-occupied | Renter-occupied |
| Less than High School | 1,074 (48.5%) | 1,141 (51.5%) |
| High School Diploma | 7,243 (60.8%) | 4,680 (39.3%) |
| College/Associate Degree | 10,641 (66.8%) | 5,287 (33.2%) |
| Bachelor's Degree or higher | 15,229 (72.9%) | 5,658 (27.1%) |
Occupancy by Age of Householder in Strafford County
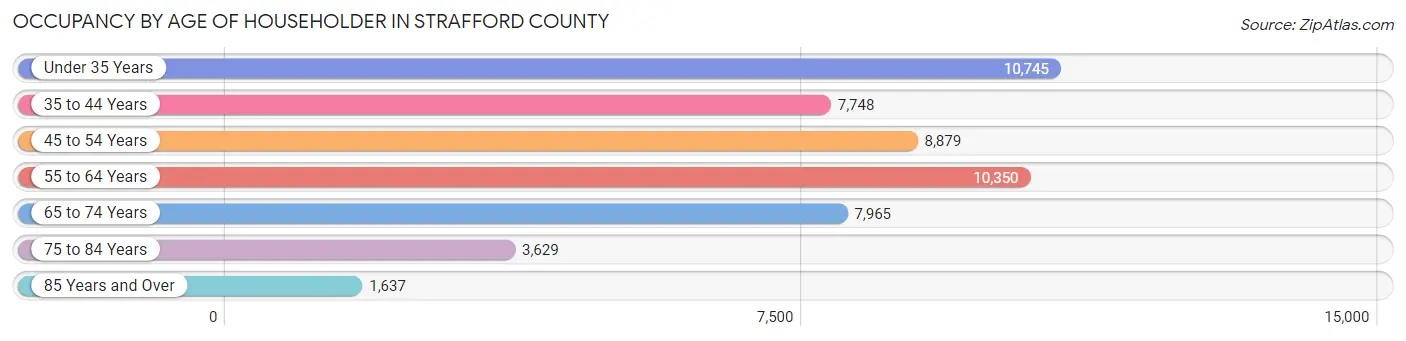
| Age Bracket | # Households | % Households |
| Under 35 Years | 10,745 | 21.1% |
| 35 to 44 Years | 7,748 | 15.2% |
| 45 to 54 Years | 8,879 | 17.4% |
| 55 to 64 Years | 10,350 | 20.3% |
| 65 to 74 Years | 7,965 | 15.6% |
| 75 to 84 Years | 3,629 | 7.1% |
| 85 Years and Over | 1,637 | 3.2% |
| Total | 50,953 | 100.0% |
Housing Finances in Strafford County
Median Income by Occupancy in Strafford County
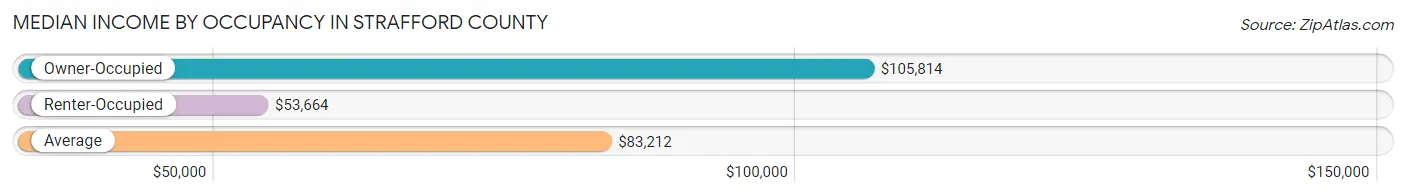
| Occupancy Type | # Households | Median Income |
| Owner-Occupied | 34,187 (67.1%) | $105,814 |
| Renter-Occupied | 16,766 (32.9%) | $53,664 |
| Average | 50,953 (100.0%) | $83,212 |
Occupancy by Householder Income Bracket in Strafford County
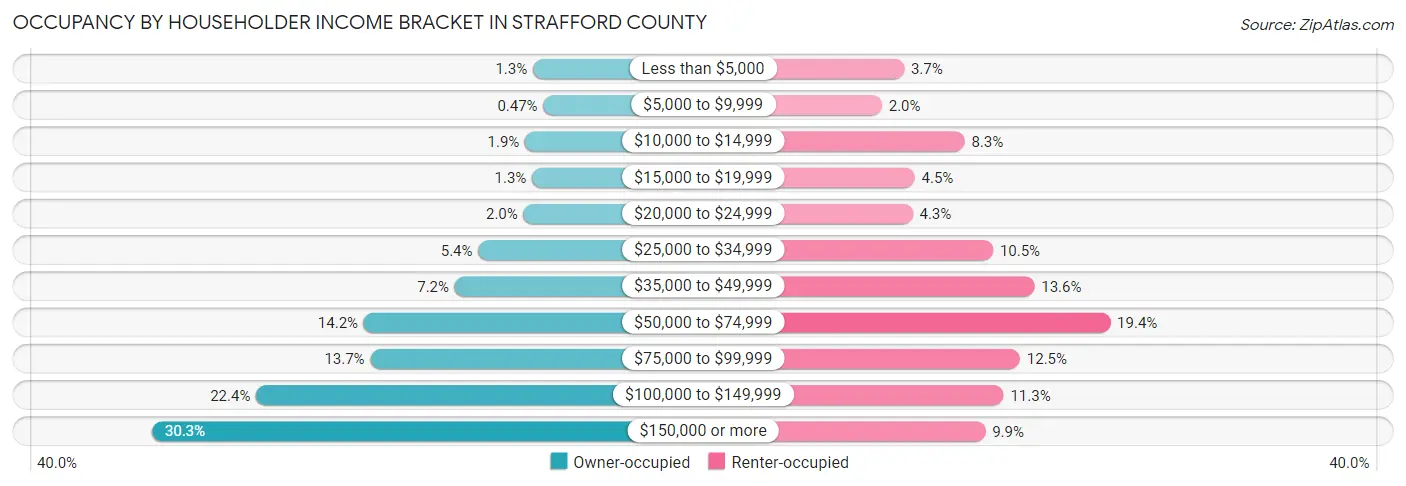
| Income Bracket | Owner-occupied | Renter-occupied |
| Less than $5,000 | 430 (1.3%) | 619 (3.7%) |
| $5,000 to $9,999 | 162 (0.5%) | 336 (2.0%) |
| $10,000 to $14,999 | 636 (1.9%) | 1,392 (8.3%) |
| $15,000 to $19,999 | 453 (1.3%) | 755 (4.5%) |
| $20,000 to $24,999 | 676 (2.0%) | 727 (4.3%) |
| $25,000 to $34,999 | 1,856 (5.4%) | 1,756 (10.5%) |
| $35,000 to $49,999 | 2,469 (7.2%) | 2,283 (13.6%) |
| $50,000 to $74,999 | 4,838 (14.1%) | 3,252 (19.4%) |
| $75,000 to $99,999 | 4,667 (13.7%) | 2,099 (12.5%) |
| $100,000 to $149,999 | 7,641 (22.4%) | 1,890 (11.3%) |
| $150,000 or more | 10,359 (30.3%) | 1,657 (9.9%) |
| Total | 34,187 (100.0%) | 16,766 (100.0%) |
Monthly Housing Cost Tiers in Strafford County
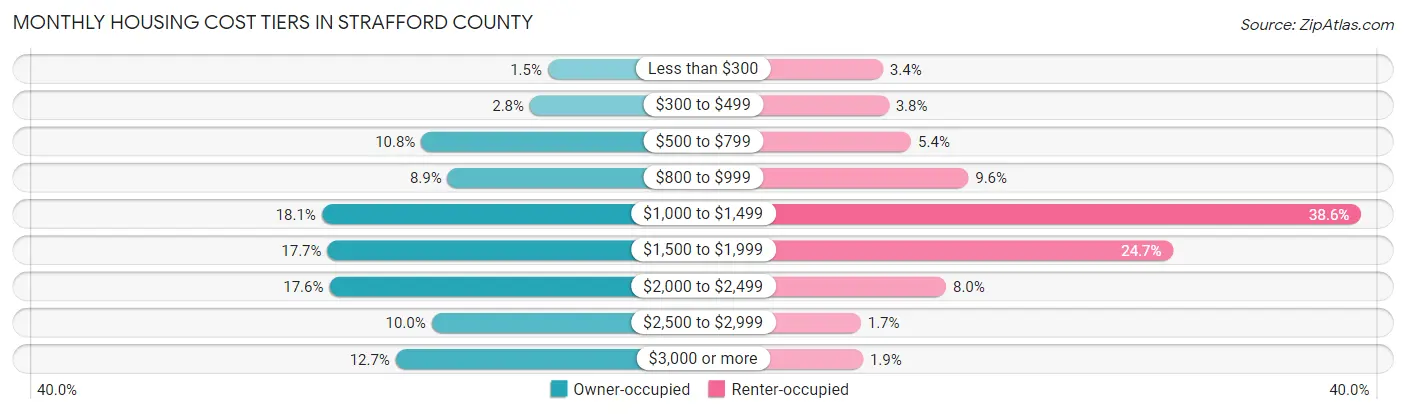
| Monthly Cost | Owner-occupied | Renter-occupied |
| Less than $300 | 504 (1.5%) | 562 (3.4%) |
| $300 to $499 | 955 (2.8%) | 633 (3.8%) |
| $500 to $799 | 3,690 (10.8%) | 911 (5.4%) |
| $800 to $999 | 3,027 (8.8%) | 1,617 (9.6%) |
| $1,000 to $1,499 | 6,196 (18.1%) | 6,466 (38.6%) |
| $1,500 to $1,999 | 6,051 (17.7%) | 4,148 (24.7%) |
| $2,000 to $2,499 | 6,003 (17.6%) | 1,342 (8.0%) |
| $2,500 to $2,999 | 3,428 (10.0%) | 288 (1.7%) |
| $3,000 or more | 4,333 (12.7%) | 316 (1.9%) |
| Total | 34,187 (100.0%) | 16,766 (100.0%) |
Physical Housing Characteristics in Strafford County
Housing Structures in Strafford County
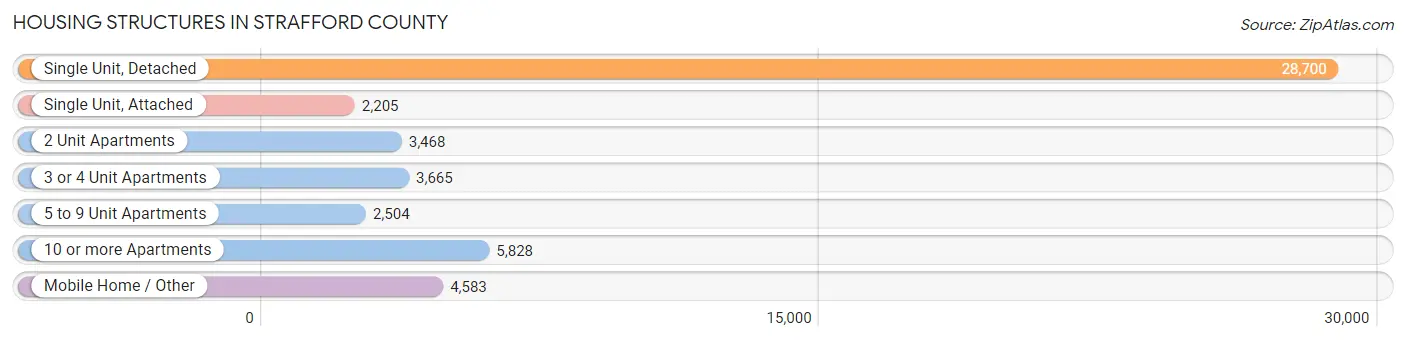
| Structure Type | # Housing Units | % Housing Units |
| Single Unit, Detached | 28,700 | 56.3% |
| Single Unit, Attached | 2,205 | 4.3% |
| 2 Unit Apartments | 3,468 | 6.8% |
| 3 or 4 Unit Apartments | 3,665 | 7.2% |
| 5 to 9 Unit Apartments | 2,504 | 4.9% |
| 10 or more Apartments | 5,828 | 11.4% |
| Mobile Home / Other | 4,583 | 9.0% |
| Total | 50,953 | 100.0% |
Housing Structures by Occupancy in Strafford County
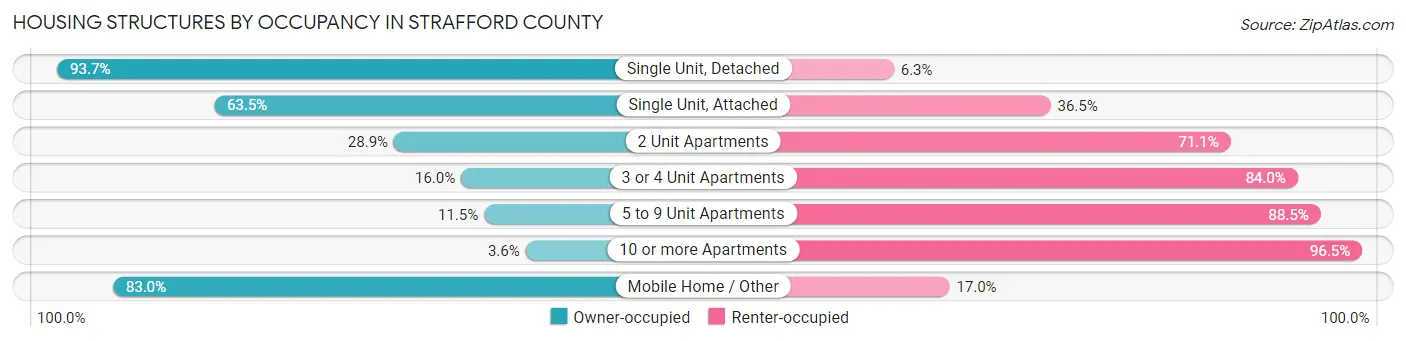
| Structure Type | Owner-occupied | Renter-occupied |
| Single Unit, Detached | 26,899 (93.7%) | 1,801 (6.3%) |
| Single Unit, Attached | 1,401 (63.5%) | 804 (36.5%) |
| 2 Unit Apartments | 1,002 (28.9%) | 2,466 (71.1%) |
| 3 or 4 Unit Apartments | 585 (16.0%) | 3,080 (84.0%) |
| 5 to 9 Unit Apartments | 289 (11.5%) | 2,215 (88.5%) |
| 10 or more Apartments | 207 (3.5%) | 5,621 (96.5%) |
| Mobile Home / Other | 3,804 (83.0%) | 779 (17.0%) |
| Total | 34,187 (67.1%) | 16,766 (32.9%) |
Housing Structures by Number of Rooms in Strafford County
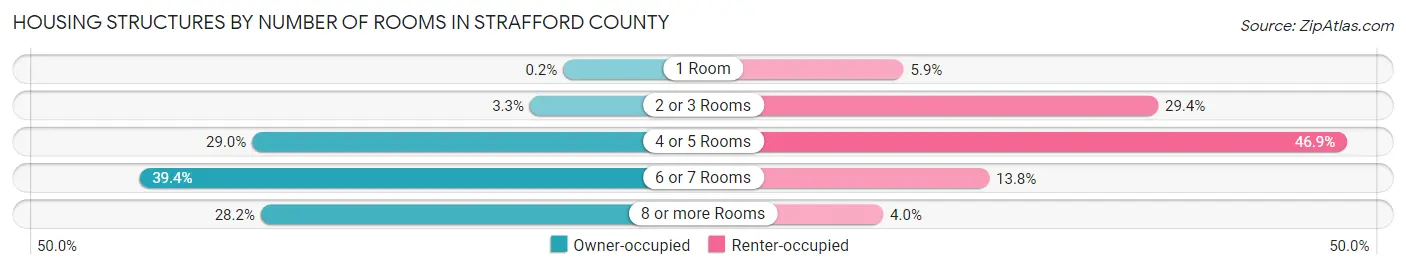
| Number of Rooms | Owner-occupied | Renter-occupied |
| 1 Room | 70 (0.2%) | 988 (5.9%) |
| 2 or 3 Rooms | 1,120 (3.3%) | 4,932 (29.4%) |
| 4 or 5 Rooms | 9,902 (29.0%) | 7,863 (46.9%) |
| 6 or 7 Rooms | 13,469 (39.4%) | 2,313 (13.8%) |
| 8 or more Rooms | 9,626 (28.2%) | 670 (4.0%) |
| Total | 34,187 (100.0%) | 16,766 (100.0%) |
Housing Structure by Heating Type in Strafford County
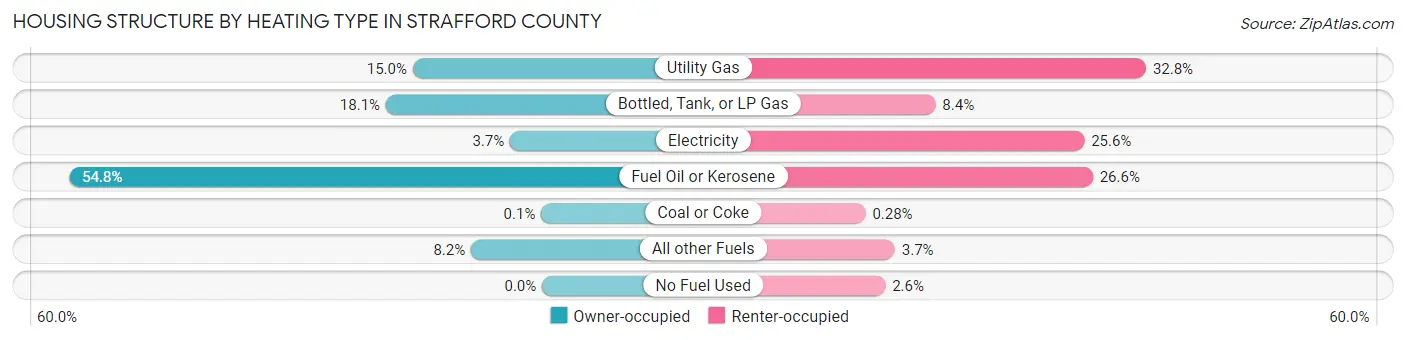
| Heating Type | Owner-occupied | Renter-occupied |
| Utility Gas | 5,125 (15.0%) | 5,500 (32.8%) |
| Bottled, Tank, or LP Gas | 6,190 (18.1%) | 1,406 (8.4%) |
| Electricity | 1,272 (3.7%) | 4,299 (25.6%) |
| Fuel Oil or Kerosene | 18,749 (54.8%) | 4,465 (26.6%) |
| Coal or Coke | 33 (0.1%) | 47 (0.3%) |
| All other Fuels | 2,818 (8.2%) | 618 (3.7%) |
| No Fuel Used | 0 (0.0%) | 431 (2.6%) |
| Total | 34,187 (100.0%) | 16,766 (100.0%) |
Household Vehicle Usage in Strafford County
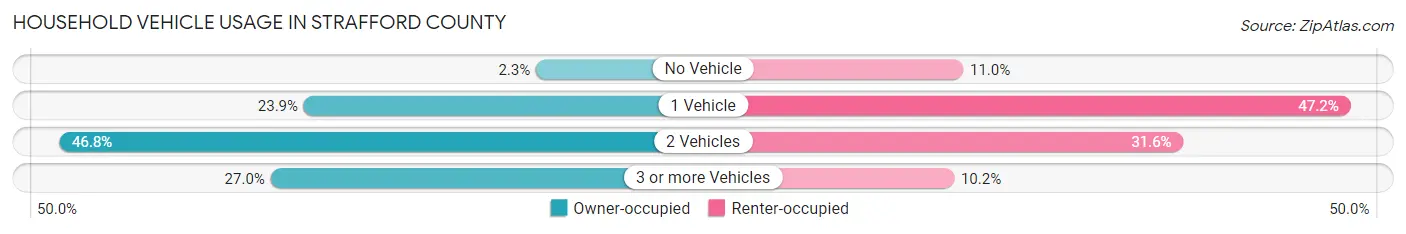
| Vehicles per Household | Owner-occupied | Renter-occupied |
| No Vehicle | 771 (2.3%) | 1,849 (11.0%) |
| 1 Vehicle | 8,180 (23.9%) | 7,913 (47.2%) |
| 2 Vehicles | 15,995 (46.8%) | 5,298 (31.6%) |
| 3 or more Vehicles | 9,241 (27.0%) | 1,706 (10.2%) |
| Total | 34,187 (100.0%) | 16,766 (100.0%) |
Real Estate & Mortgages in Strafford County
Real Estate and Mortgage Overview in Strafford County
| Characteristic | Without Mortgage | With Mortgage |
| Housing Units | 12,634 | 21,553 |
| Median Property Value | $260,900 | $324,400 |
| Median Household Income | $73,719 | $7,954 |
| Monthly Housing Costs | $899 | $4,201 |
| Real Estate Taxes | $5,832 | $183 |
Property Value by Mortgage Status in Strafford County
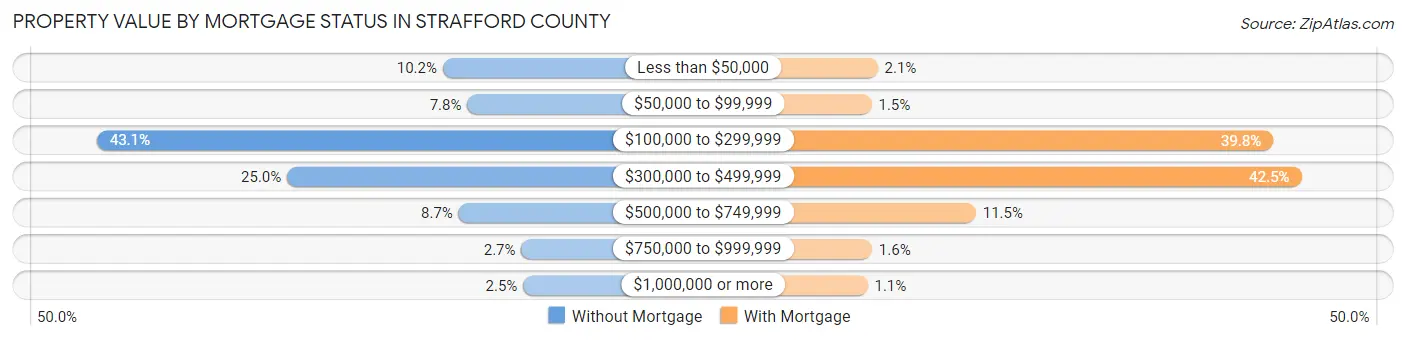
| Property Value | Without Mortgage | With Mortgage |
| Less than $50,000 | 1,285 (10.2%) | 452 (2.1%) |
| $50,000 to $99,999 | 991 (7.8%) | 327 (1.5%) |
| $100,000 to $299,999 | 5,448 (43.1%) | 8,571 (39.8%) |
| $300,000 to $499,999 | 3,158 (25.0%) | 9,152 (42.5%) |
| $500,000 to $749,999 | 1,094 (8.7%) | 2,468 (11.5%) |
| $750,000 to $999,999 | 340 (2.7%) | 337 (1.6%) |
| $1,000,000 or more | 318 (2.5%) | 246 (1.1%) |
| Total | 12,634 (100.0%) | 21,553 (100.0%) |
Household Income by Mortgage Status in Strafford County
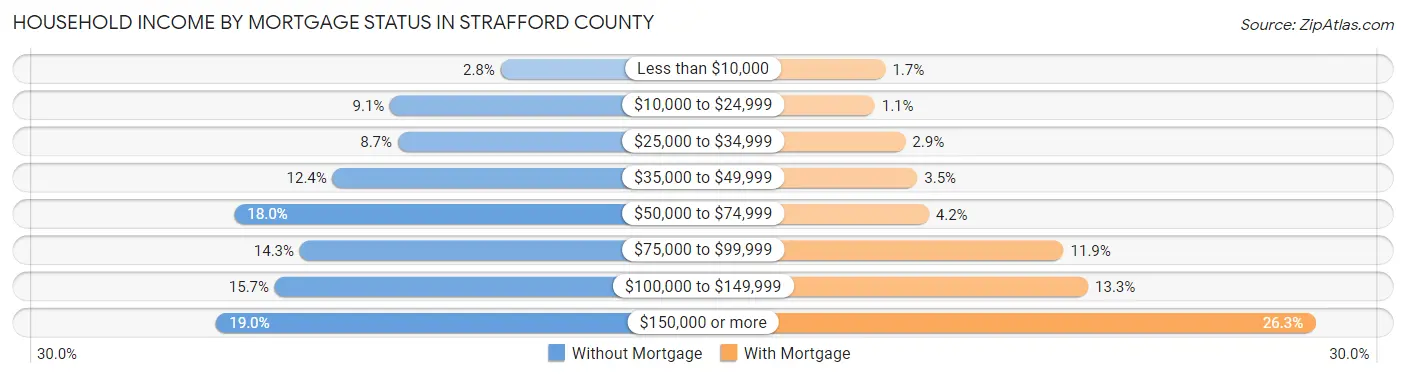
| Household Income | Without Mortgage | With Mortgage |
| Less than $10,000 | 354 (2.8%) | 369 (1.7%) |
| $10,000 to $24,999 | 1,151 (9.1%) | 238 (1.1%) |
| $25,000 to $34,999 | 1,095 (8.7%) | 614 (2.9%) |
| $35,000 to $49,999 | 1,567 (12.4%) | 761 (3.5%) |
| $50,000 to $74,999 | 2,275 (18.0%) | 902 (4.2%) |
| $75,000 to $99,999 | 1,803 (14.3%) | 2,563 (11.9%) |
| $100,000 to $149,999 | 1,984 (15.7%) | 2,864 (13.3%) |
| $150,000 or more | 2,405 (19.0%) | 5,657 (26.3%) |
| Total | 12,634 (100.0%) | 21,553 (100.0%) |
Property Value to Household Income Ratio in Strafford County
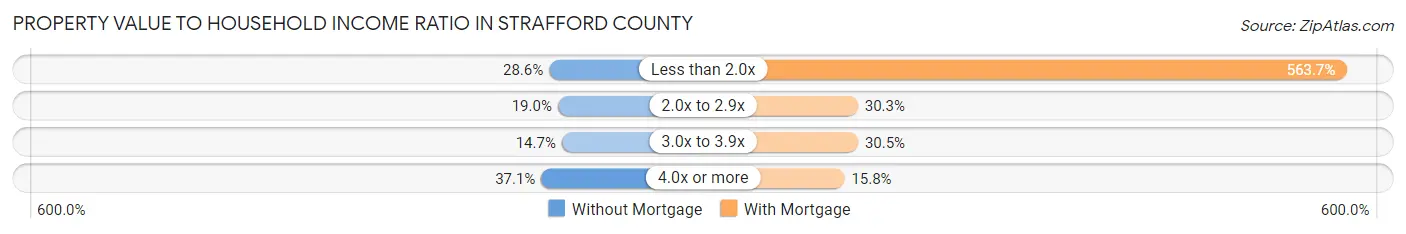
| Value-to-Income Ratio | Without Mortgage | With Mortgage |
| Less than 2.0x | 3,607 (28.5%) | 121,484 (563.6%) |
| 2.0x to 2.9x | 2,406 (19.0%) | 6,539 (30.3%) |
| 3.0x to 3.9x | 1,858 (14.7%) | 6,582 (30.5%) |
| 4.0x or more | 4,684 (37.1%) | 3,412 (15.8%) |
| Total | 12,634 (100.0%) | 21,553 (100.0%) |
Real Estate Taxes by Mortgage Status in Strafford County
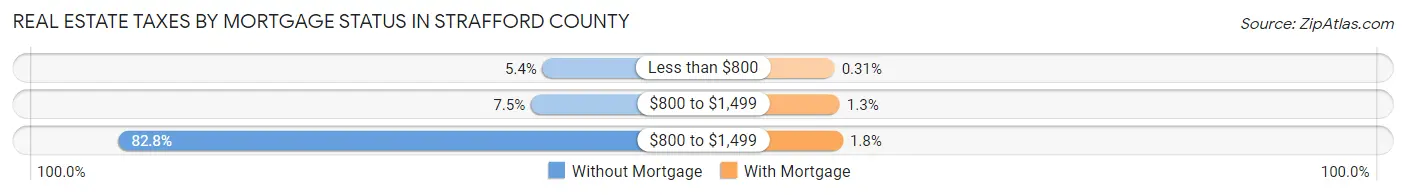
| Property Taxes | Without Mortgage | With Mortgage |
| Less than $800 | 679 (5.4%) | 66 (0.3%) |
| $800 to $1,499 | 947 (7.5%) | 269 (1.3%) |
| $800 to $1,499 | 10,465 (82.8%) | 390 (1.8%) |
| Total | 12,634 (100.0%) | 21,553 (100.0%) |
Health & Disability in Strafford County
Health Insurance Coverage by Age in Strafford County
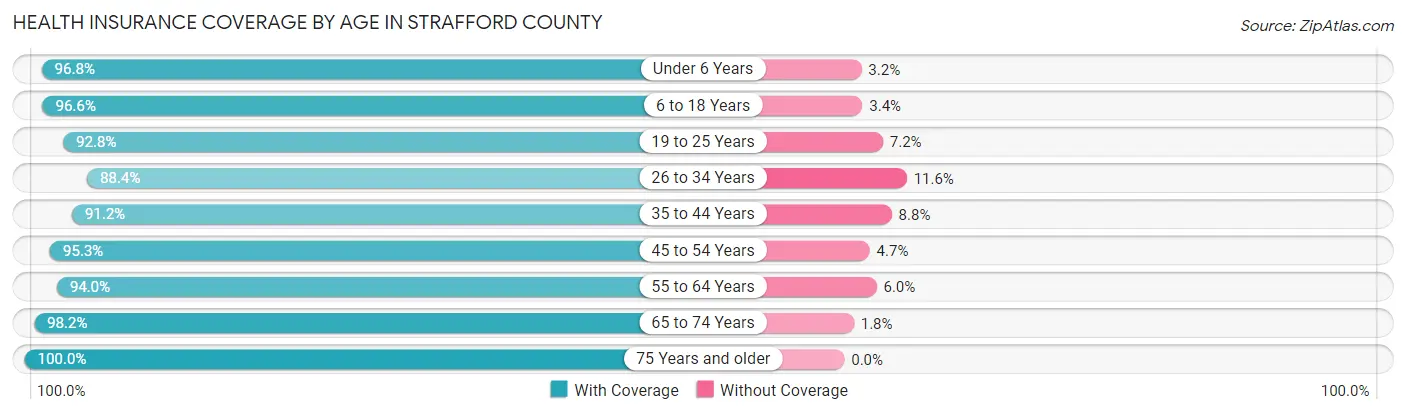
| Age Bracket | With Coverage | Without Coverage |
| Under 6 Years | 6,890 (96.8%) | 227 (3.2%) |
| 6 to 18 Years | 18,382 (96.6%) | 639 (3.4%) |
| 19 to 25 Years | 17,112 (92.8%) | 1,326 (7.2%) |
| 26 to 34 Years | 13,825 (88.4%) | 1,821 (11.6%) |
| 35 to 44 Years | 13,797 (91.2%) | 1,336 (8.8%) |
| 45 to 54 Years | 15,032 (95.3%) | 746 (4.7%) |
| 55 to 64 Years | 16,731 (94.0%) | 1,070 (6.0%) |
| 65 to 74 Years | 12,112 (98.2%) | 218 (1.8%) |
| 75 Years and older | 8,060 (100.0%) | 0 (0.0%) |
| Total | 121,941 (94.3%) | 7,383 (5.7%) |
Health Insurance Coverage by Citizenship Status in Strafford County
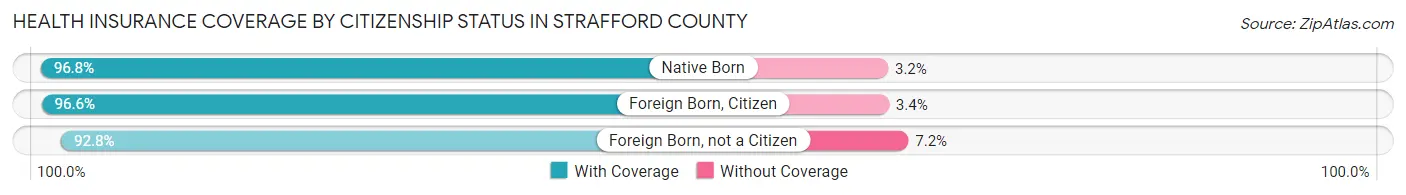
| Citizenship Status | With Coverage | Without Coverage |
| Native Born | 6,890 (96.8%) | 227 (3.2%) |
| Foreign Born, Citizen | 18,382 (96.6%) | 639 (3.4%) |
| Foreign Born, not a Citizen | 17,112 (92.8%) | 1,326 (7.2%) |
Health Insurance Coverage by Household Income in Strafford County
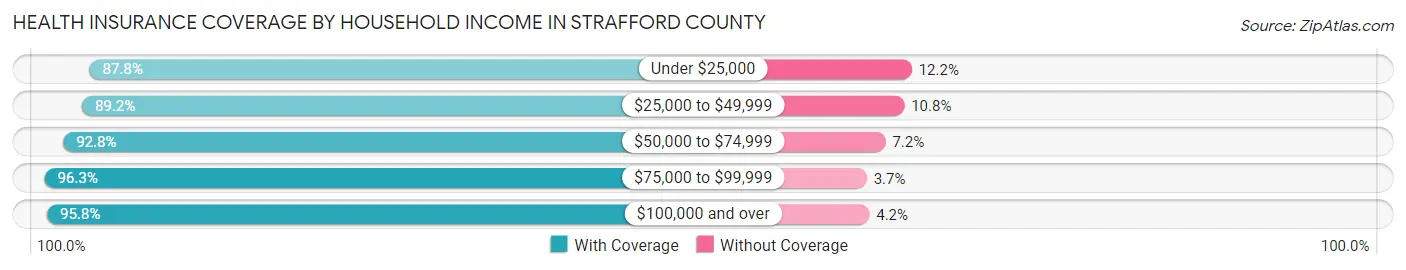
| Household Income | With Coverage | Without Coverage |
| Under $25,000 | 8,249 (87.8%) | 1,143 (12.2%) |
| $25,000 to $49,999 | 12,428 (89.2%) | 1,498 (10.8%) |
| $50,000 to $74,999 | 16,523 (92.8%) | 1,290 (7.2%) |
| $75,000 to $99,999 | 16,003 (96.3%) | 620 (3.7%) |
| $100,000 and over | 61,581 (95.8%) | 2,706 (4.2%) |
Public vs Private Health Insurance Coverage by Age in Strafford County
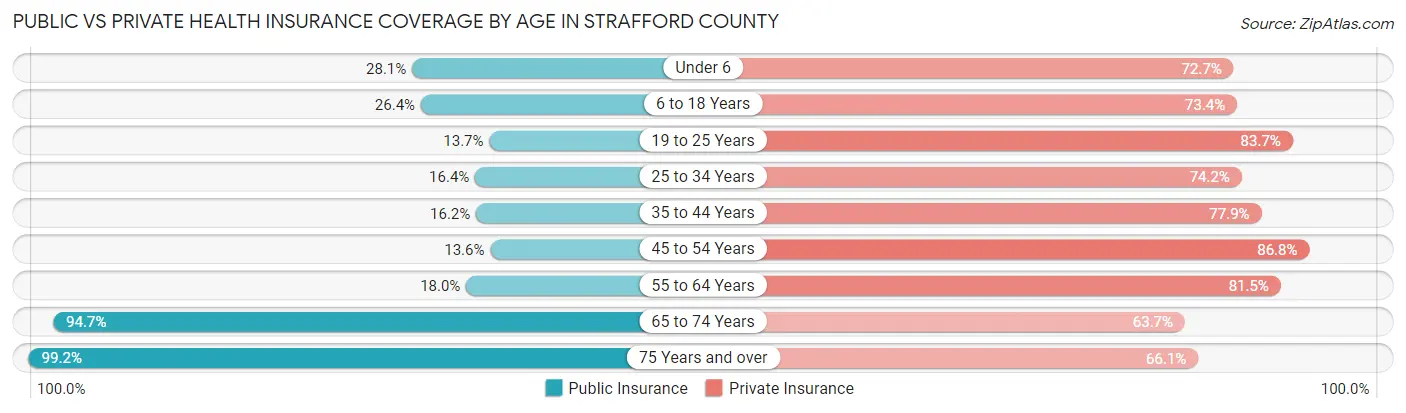
| Age Bracket | Public Insurance | Private Insurance |
| Under 6 | 1,998 (28.1%) | 5,176 (72.7%) |
| 6 to 18 Years | 5,029 (26.4%) | 13,955 (73.4%) |
| 19 to 25 Years | 2,531 (13.7%) | 15,428 (83.7%) |
| 25 to 34 Years | 2,561 (16.4%) | 11,613 (74.2%) |
| 35 to 44 Years | 2,450 (16.2%) | 11,785 (77.9%) |
| 45 to 54 Years | 2,139 (13.6%) | 13,690 (86.8%) |
| 55 to 64 Years | 3,209 (18.0%) | 14,500 (81.5%) |
| 65 to 74 Years | 11,679 (94.7%) | 7,850 (63.7%) |
| 75 Years and over | 7,999 (99.2%) | 5,331 (66.1%) |
| Total | 39,595 (30.6%) | 99,328 (76.8%) |
Disability Status by Sex by Age in Strafford County
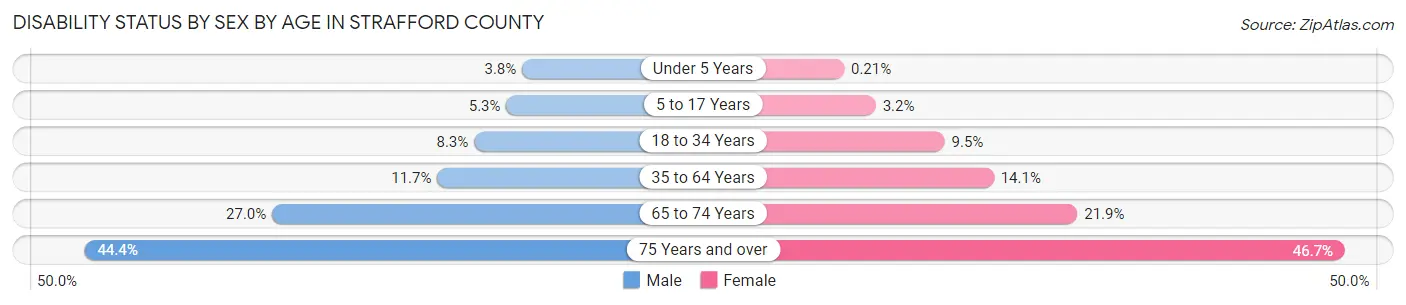
| Age Bracket | Male | Female |
| Under 5 Years | 115 (3.8%) | 6 (0.2%) |
| 5 to 17 Years | 489 (5.3%) | 264 (3.2%) |
| 18 to 34 Years | 1,506 (8.3%) | 1,764 (9.5%) |
| 35 to 64 Years | 2,837 (11.7%) | 3,448 (14.1%) |
| 65 to 74 Years | 1,568 (27.0%) | 1,427 (21.9%) |
| 75 Years and over | 1,427 (44.4%) | 2,264 (46.7%) |
Disability Class by Sex by Age in Strafford County
Disability Class: Hearing Difficulty
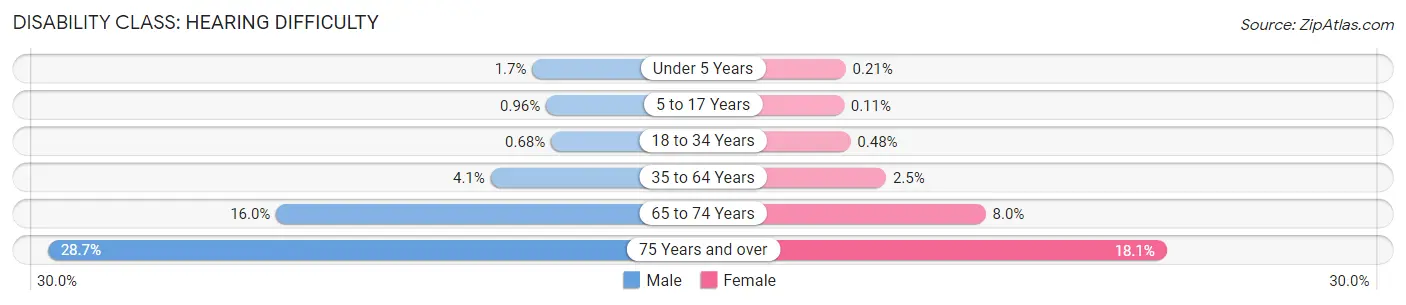
| Age Bracket | Male | Female |
| Under 5 Years | 52 (1.7%) | 6 (0.2%) |
| 5 to 17 Years | 89 (1.0%) | 9 (0.1%) |
| 18 to 34 Years | 124 (0.7%) | 88 (0.5%) |
| 35 to 64 Years | 982 (4.1%) | 601 (2.5%) |
| 65 to 74 Years | 928 (16.0%) | 523 (8.0%) |
| 75 Years and over | 922 (28.7%) | 877 (18.1%) |
Disability Class: Vision Difficulty
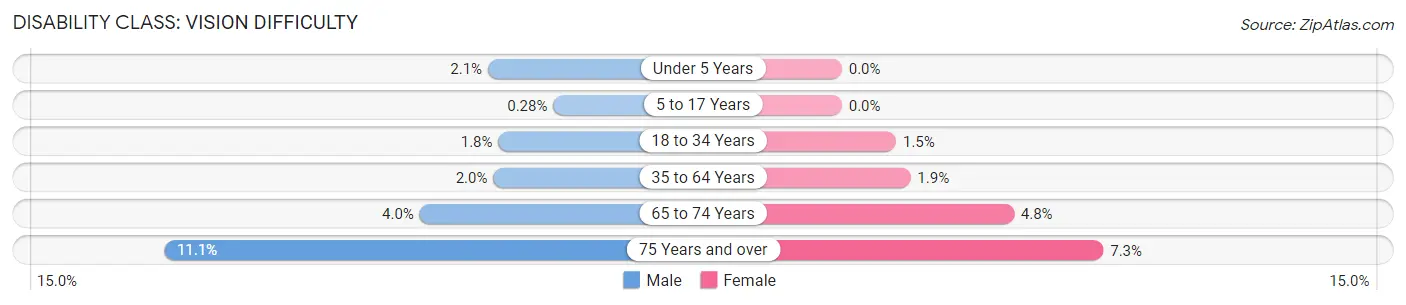
| Age Bracket | Male | Female |
| Under 5 Years | 63 (2.1%) | 0 (0.0%) |
| 5 to 17 Years | 26 (0.3%) | 0 (0.0%) |
| 18 to 34 Years | 329 (1.8%) | 279 (1.5%) |
| 35 to 64 Years | 473 (1.9%) | 466 (1.9%) |
| 65 to 74 Years | 232 (4.0%) | 313 (4.8%) |
| 75 Years and over | 357 (11.1%) | 353 (7.3%) |
Disability Class: Cognitive Difficulty
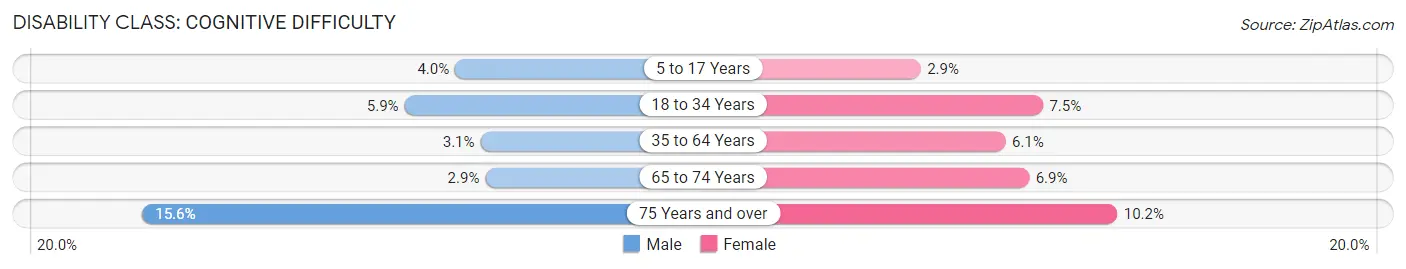
| Age Bracket | Male | Female |
| 5 to 17 Years | 372 (4.0%) | 244 (2.9%) |
| 18 to 34 Years | 1,073 (5.9%) | 1,377 (7.4%) |
| 35 to 64 Years | 747 (3.1%) | 1,481 (6.1%) |
| 65 to 74 Years | 168 (2.9%) | 453 (6.9%) |
| 75 Years and over | 502 (15.6%) | 495 (10.2%) |
Disability Class: Ambulatory Difficulty
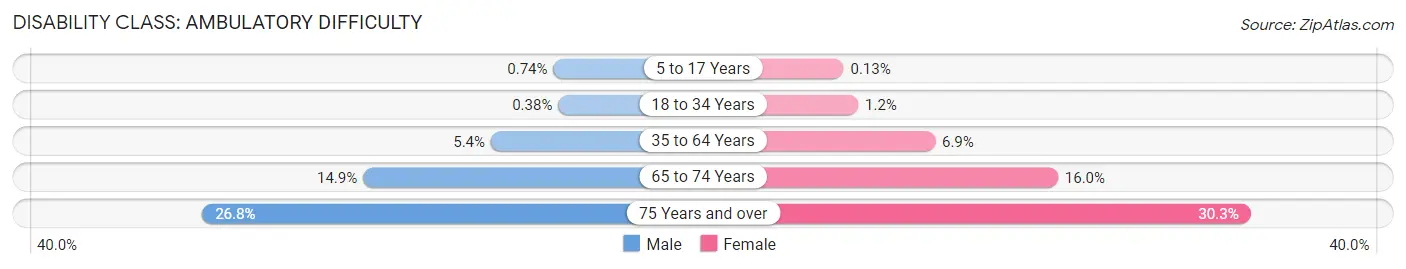
| Age Bracket | Male | Female |
| 5 to 17 Years | 68 (0.7%) | 11 (0.1%) |
| 18 to 34 Years | 69 (0.4%) | 224 (1.2%) |
| 35 to 64 Years | 1,304 (5.4%) | 1,693 (6.9%) |
| 65 to 74 Years | 863 (14.9%) | 1,047 (16.0%) |
| 75 Years and over | 861 (26.8%) | 1,471 (30.3%) |
Disability Class: Self-Care Difficulty
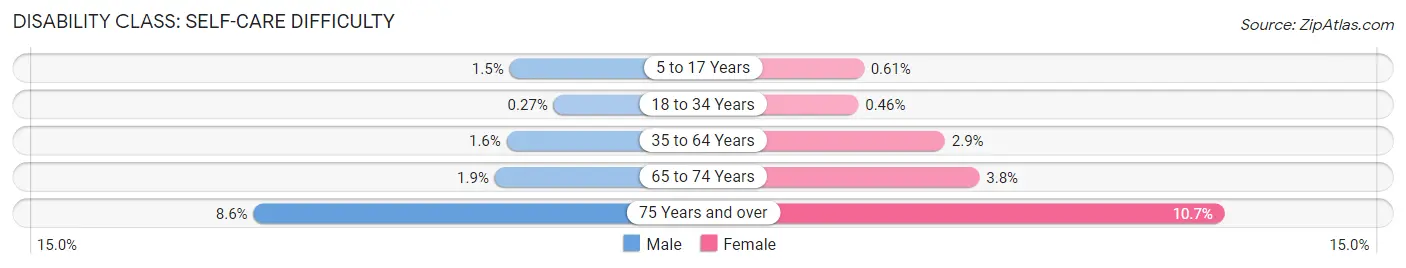
| Age Bracket | Male | Female |
| 5 to 17 Years | 139 (1.5%) | 51 (0.6%) |
| 18 to 34 Years | 50 (0.3%) | 86 (0.5%) |
| 35 to 64 Years | 384 (1.6%) | 703 (2.9%) |
| 65 to 74 Years | 111 (1.9%) | 250 (3.8%) |
| 75 Years and over | 277 (8.6%) | 517 (10.7%) |
Technology Access in Strafford County
Computing Device Access in Strafford County
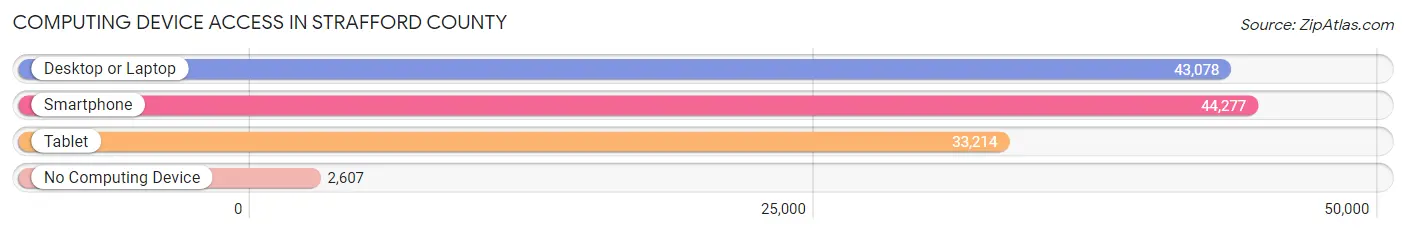
| Device Type | # Households | % Households |
| Desktop or Laptop | 43,078 | 84.5% |
| Smartphone | 44,277 | 86.9% |
| Tablet | 33,214 | 65.2% |
| No Computing Device | 2,607 | 5.1% |
| Total | 50,953 | 100.0% |
Internet Access in Strafford County
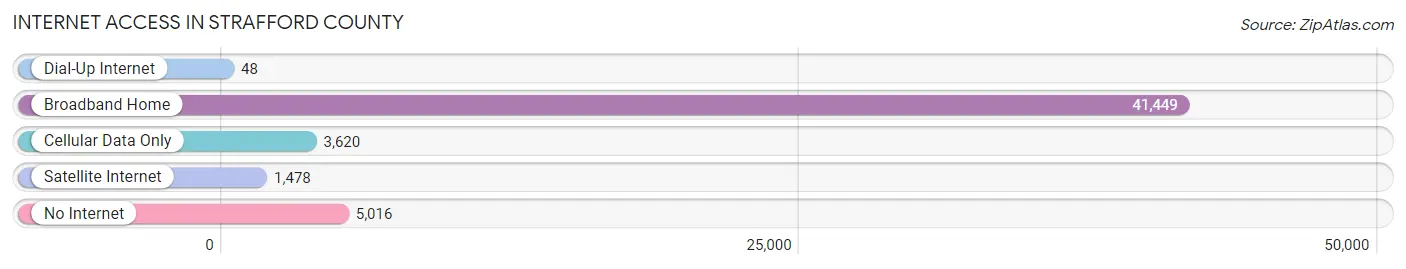
| Internet Type | # Households | % Households |
| Dial-Up Internet | 48 | 0.1% |
| Broadband Home | 41,449 | 81.4% |
| Cellular Data Only | 3,620 | 7.1% |
| Satellite Internet | 1,478 | 2.9% |
| No Internet | 5,016 | 9.8% |
| Total | 50,953 | 100.0% |
Strafford County Summary
Strafford County is a county located in the state of New Hampshire, in the United States. It is the second-most populous county in the state, with a population of 123,143 as of the 2010 census. The county seat is Dover. The county was created in 1771 and was named after William Strafford, an English statesman.
Geography
Strafford County is located in the southeastern corner of New Hampshire, bordered by the states of Maine and Massachusetts. It is the second-smallest county in the state, with an area of 545 square miles. The county is divided into two distinct regions: the Seacoast region in the east and the Lakes region in the west. The highest point in the county is Mount Agamenticus, located in the town of York, which has an elevation of 692 feet. The county is home to several rivers, including the Cocheco, Salmon Falls, and Lamprey rivers.
The county is home to several state parks, including Pawtuckaway State Park, which is located in the town of Nottingham and is the largest state park in the county. The park is home to a variety of wildlife, including deer, moose, and black bears.
Demographics
As of the 2010 census, the population of Strafford County was 123,143, making it the second-most populous county in the state. The population density was 224.3 people per square mile. The racial makeup of the county was 94.2% White, 1.7% African American, 0.5% Native American, 1.3% Asian, 0.1% Pacific Islander, 0.7% from other races, and 1.5% from two or more races. Hispanic or Latino of any race were 2.3% of the population.
The median income for a household in the county was $60,945, and the median income for a family was $71,945. The per capita income for the county was $30,945. About 5.2% of families and 7.3% of the population were below the poverty line, including 8.7% of those under age 18 and 5.2% of those age 65 or over.
Economy
The economy of Strafford County is largely based on the service industry, with the largest employers being health care and social assistance, retail trade, and accommodation and food services. The county is also home to several manufacturing companies, including Liberty Mutual Insurance, which is headquartered in Dover.
The county is home to several colleges and universities, including the University of New Hampshire, which is located in Durham. The university is the largest employer in the county, with over 10,000 employees.
The county is also home to several tourist attractions, including the historic Strawbery Banke Museum in Portsmouth and the Seacoast Science Center in Rye.
Conclusion
Strafford County is a county located in the state of New Hampshire, in the United States. It is the second-most populous county in the state, with a population of 123,143 as of the 2010 census. The county is divided into two distinct regions: the Seacoast region in the east and the Lakes region in the west. The economy of Strafford County is largely based on the service industry, with the largest employers being health care and social assistance, retail trade, and accommodation and food services. The county is also home to several tourist attractions, including the historic Strawbery Banke Museum in Portsmouth and the Seacoast Science Center in Rye.
Common Questions
What is Per Capita Income in Strafford County?
Per Capita income in Strafford County is $43,338.
What is the Median Family Income in Strafford County?
Median Family Income in Strafford County is $112,051.
What is the Median Household income in Strafford County?
Median Household Income in Strafford County is $83,212.
What is Income or Wage Gap in Strafford County?
Income or Wage Gap in Strafford County is 30.4%.
Women in Strafford County earn 69.6 cents for every dollar earned by a man.
What is Family Income Deficit in Strafford County?
Family Income Deficit in Strafford County is $10,500.
Families that are below poverty line in Strafford County earn $10,500 less on average than the poverty threshold level.
What is Inequality or Gini Index in Strafford County?
Inequality or Gini Index in Strafford County is 0.43.
What is the Total Population of Strafford County?
Total Population of Strafford County is 130,965.
What is the Total Male Population of Strafford County?
Total Male Population of Strafford County is 64,834.
What is the Total Female Population of Strafford County?
Total Female Population of Strafford County is 66,131.
What is the Ratio of Males per 100 Females in Strafford County?
There are 98.04 Males per 100 Females in Strafford County.
What is the Ratio of Females per 100 Males in Strafford County?
There are 102.00 Females per 100 Males in Strafford County.
What is the Median Population Age in Strafford County?
Median Population Age in Strafford County is 37.7 Years.
What is the Average Family Size in Strafford County
Average Family Size in Strafford County is 2.9 People.
What is the Average Household Size in Strafford County
Average Household Size in Strafford County is 2.4 People.
How Large is the Labor Force in Strafford County?
There are 74,793 People in the Labor Forcein in Strafford County.
What is the Percentage of People in the Labor Force in Strafford County?
67.9% of People are in the Labor Force in Strafford County.
What is the Unemployment Rate in Strafford County?
Unemployment Rate in Strafford County is 3.7%.