Claremont, NH Map & Demographics
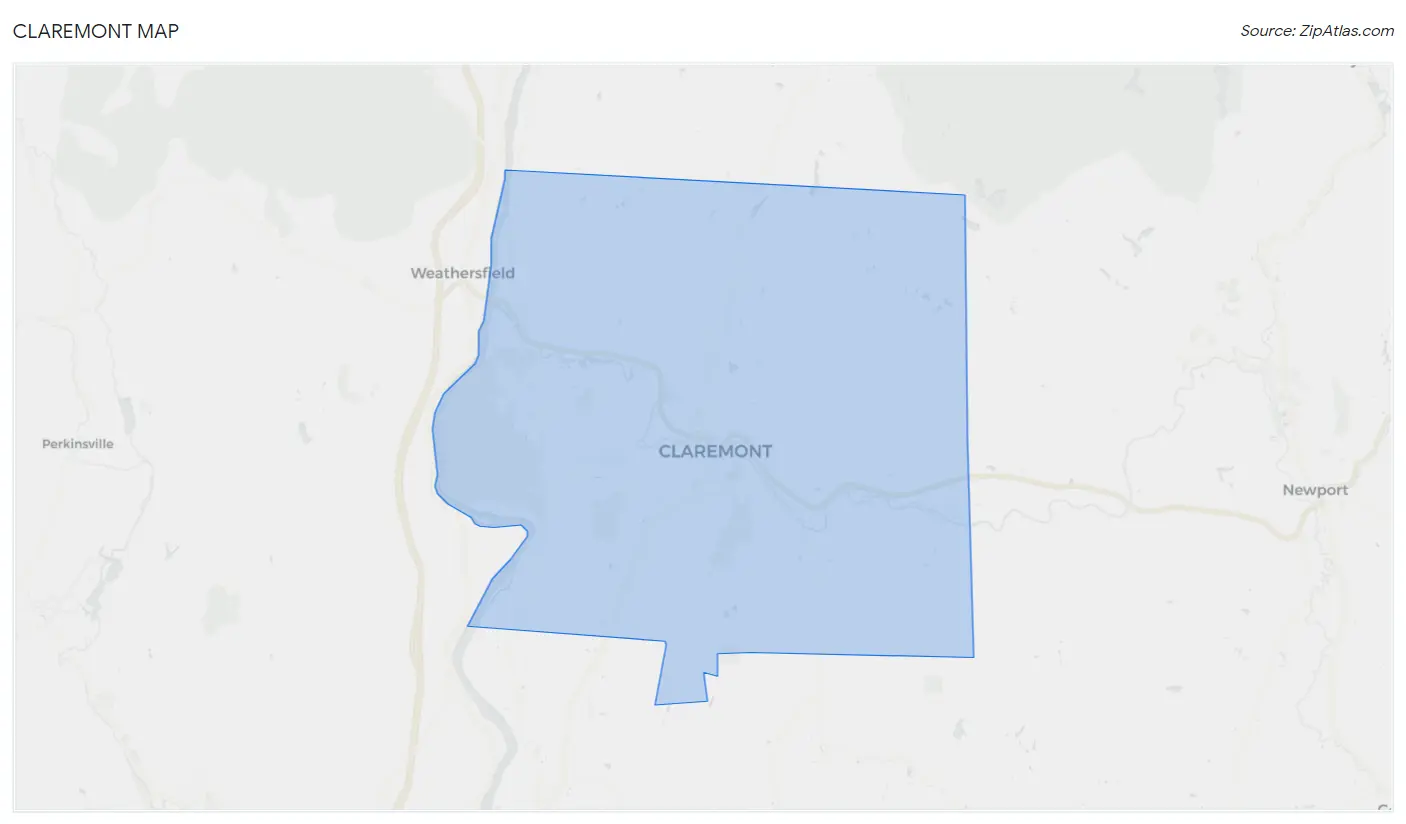
Claremont Map
Claremont Overview
$35,331
PER CAPITA INCOME
$62,161
AVG FAMILY INCOME
$53,697
AVG HOUSEHOLD INCOME
17.9%
WAGE / INCOME GAP [ % ]
82.1¢/ $1
WAGE / INCOME GAP [ $ ]
0.52
INEQUALITY / GINI INDEX
13,018
TOTAL POPULATION
6,565
MALE POPULATION
6,453
FEMALE POPULATION
101.74
MALES / 100 FEMALES
98.29
FEMALES / 100 MALES
44.1
MEDIAN AGE
3.2
AVG FAMILY SIZE
2.5
AVG HOUSEHOLD SIZE
5,939
LABOR FORCE [ PEOPLE ]
54.7%
PERCENT IN LABOR FORCE
2.2%
UNEMPLOYMENT RATE
Claremont Zip Codes
Claremont Area Codes
Income in Claremont
Income Overview in Claremont
Per Capita Income in Claremont is $35,331, while median incomes of families and households are $62,161 and $53,697 respectively.
| Characteristic | Number | Measure |
| Per Capita Income | 13,018 | $35,331 |
| Median Family Income | 2,826 | $62,161 |
| Mean Family Income | 2,826 | $75,619 |
| Median Household Income | 5,203 | $53,697 |
| Mean Household Income | 5,203 | $82,059 |
| Income Deficit | 2,826 | $0 |
| Wage / Income Gap (%) | 13,018 | 17.87% |
| Wage / Income Gap ($) | 13,018 | 82.13¢ per $1 |
| Gini / Inequality Index | 13,018 | 0.52 |
Earnings by Sex in Claremont
Average Earnings in Claremont are $43,750, $45,687 for men and $37,525 for women, a difference of 17.9%.
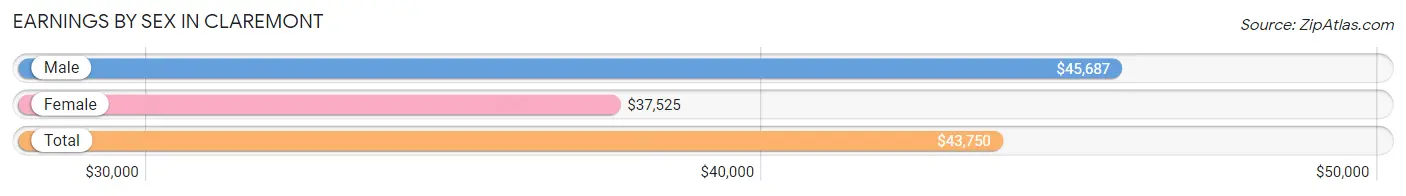
| Sex | Number | Average Earnings |
| Male | 3,401 (54.7%) | $45,687 |
| Female | 2,812 (45.3%) | $37,525 |
| Total | 6,213 (100.0%) | $43,750 |
Earnings by Sex by Income Bracket in Claremont
The most common earnings brackets in Claremont are $45,000 to $49,999 for men (531 | 15.6%) and $45,000 to $49,999 for women (304 | 10.8%).
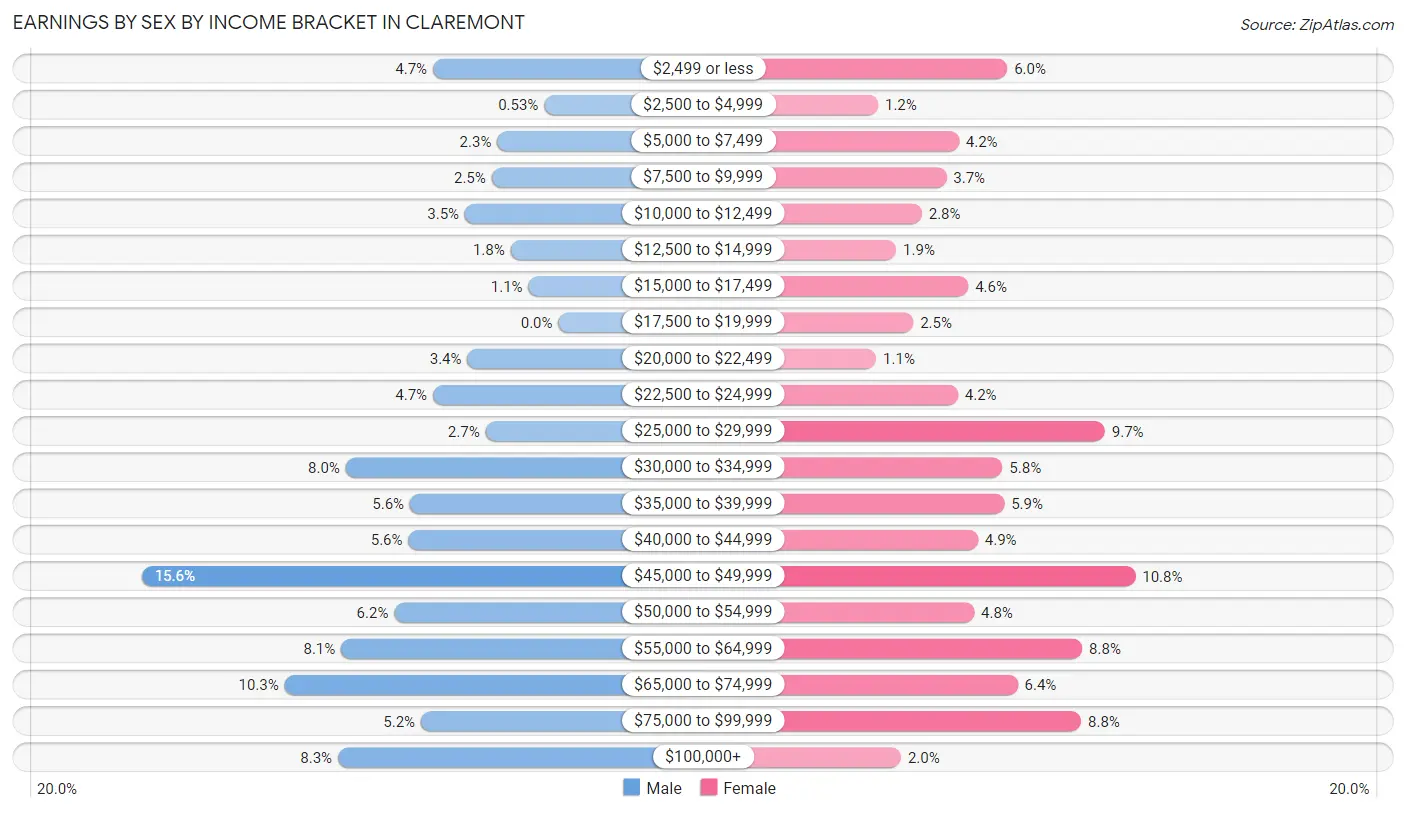
| Income | Male | Female |
| $2,499 or less | 160 (4.7%) | 169 (6.0%) |
| $2,500 to $4,999 | 18 (0.5%) | 33 (1.2%) |
| $5,000 to $7,499 | 78 (2.3%) | 118 (4.2%) |
| $7,500 to $9,999 | 85 (2.5%) | 105 (3.7%) |
| $10,000 to $12,499 | 119 (3.5%) | 79 (2.8%) |
| $12,500 to $14,999 | 61 (1.8%) | 52 (1.8%) |
| $15,000 to $17,499 | 38 (1.1%) | 128 (4.5%) |
| $17,500 to $19,999 | 0 (0.0%) | 70 (2.5%) |
| $20,000 to $22,499 | 116 (3.4%) | 31 (1.1%) |
| $22,500 to $24,999 | 160 (4.7%) | 117 (4.2%) |
| $25,000 to $29,999 | 93 (2.7%) | 272 (9.7%) |
| $30,000 to $34,999 | 271 (8.0%) | 164 (5.8%) |
| $35,000 to $39,999 | 189 (5.6%) | 166 (5.9%) |
| $40,000 to $44,999 | 191 (5.6%) | 138 (4.9%) |
| $45,000 to $49,999 | 531 (15.6%) | 304 (10.8%) |
| $50,000 to $54,999 | 209 (6.1%) | 134 (4.8%) |
| $55,000 to $64,999 | 277 (8.1%) | 248 (8.8%) |
| $65,000 to $74,999 | 349 (10.3%) | 180 (6.4%) |
| $75,000 to $99,999 | 175 (5.1%) | 247 (8.8%) |
| $100,000+ | 281 (8.3%) | 57 (2.0%) |
| Total | 3,401 (100.0%) | 2,812 (100.0%) |
Earnings by Sex by Educational Attainment in Claremont
Average earnings in Claremont are $46,582 for men and $41,090 for women, a difference of 11.8%. Men with an educational attainment of college or associate's degree enjoy the highest average annual earnings of $66,190, while those with less than high school education earn the least with $33,606. Women with an educational attainment of bachelor's degree earn the most with the average annual earnings of $60,417, while those with college or associate's degree education have the smallest earnings of $34,974.
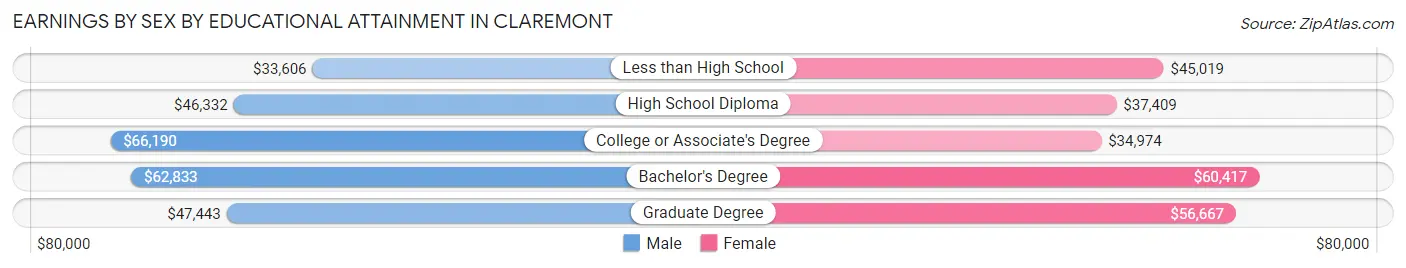
| Educational Attainment | Male Income | Female Income |
| Less than High School | $33,606 | $45,019 |
| High School Diploma | $46,332 | $37,409 |
| College or Associate's Degree | $66,190 | $34,974 |
| Bachelor's Degree | $62,833 | $60,417 |
| Graduate Degree | $47,443 | $56,667 |
| Total | $46,582 | $41,090 |
Family Income in Claremont
Family Income Brackets in Claremont
According to the Claremont family income data, there are 633 families falling into the $50,000 to $74,999 income range, which is the most common income bracket and makes up 22.4% of all families. Conversely, the $10,000 to $14,999 income bracket is the least frequent group with only 11 families (0.4%) belonging to this category.
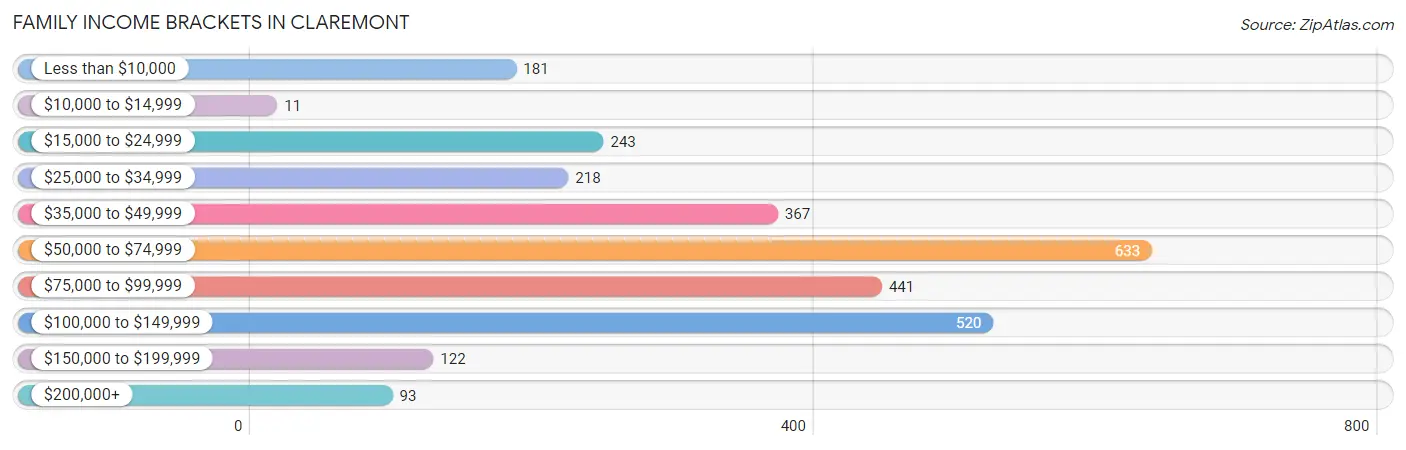
| Income Bracket | # Families | % Families |
| Less than $10,000 | 181 | 6.4% |
| $10,000 to $14,999 | 11 | 0.4% |
| $15,000 to $24,999 | 243 | 8.6% |
| $25,000 to $34,999 | 218 | 7.7% |
| $35,000 to $49,999 | 367 | 13.0% |
| $50,000 to $74,999 | 633 | 22.4% |
| $75,000 to $99,999 | 441 | 15.6% |
| $100,000 to $149,999 | 520 | 18.4% |
| $150,000 to $199,999 | 122 | 4.3% |
| $200,000+ | 93 | 3.3% |
Family Income by Famaliy Size in Claremont
4-person families (537 | 19.0%) account for the highest median family income in Claremont with $97,663 per family, while 2-person families (1,680 | 59.5%) have the highest median income of $30,042 per family member.
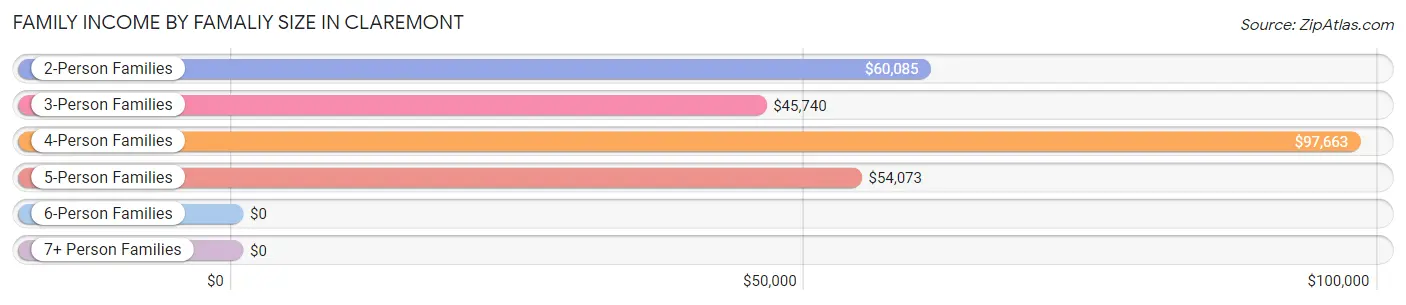
| Income Bracket | # Families | Median Income |
| 2-Person Families | 1,680 (59.5%) | $60,085 |
| 3-Person Families | 441 (15.6%) | $45,740 |
| 4-Person Families | 537 (19.0%) | $97,663 |
| 5-Person Families | 155 (5.5%) | $54,073 |
| 6-Person Families | 13 (0.5%) | $0 |
| 7+ Person Families | 0 (0.0%) | $0 |
| Total | 2,826 (100.0%) | $62,161 |
Family Income by Number of Earners in Claremont
The median family income in Claremont is $62,161, with families comprising 2 earners (832) having the highest median family income of $117,595, while families with no earners (620) have the lowest median family income of $28,036, accounting for 29.4% and 21.9% of families, respectively.
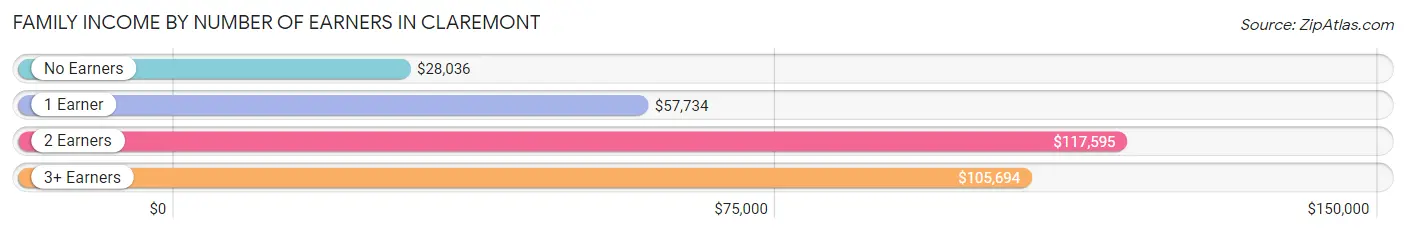
| Number of Earners | # Families | Median Income |
| No Earners | 620 (21.9%) | $28,036 |
| 1 Earner | 1,176 (41.6%) | $57,734 |
| 2 Earners | 832 (29.4%) | $117,595 |
| 3+ Earners | 198 (7.0%) | $105,694 |
| Total | 2,826 (100.0%) | $62,161 |
Household Income in Claremont
Household Income Brackets in Claremont
With 1,046 households falling in the category, the $50,000 to $74,999 income range is the most frequent in Claremont, accounting for 20.1% of all households. In contrast, only 140 households (2.7%) fall into the $150,000 to $199,999 income bracket, making it the least populous group.
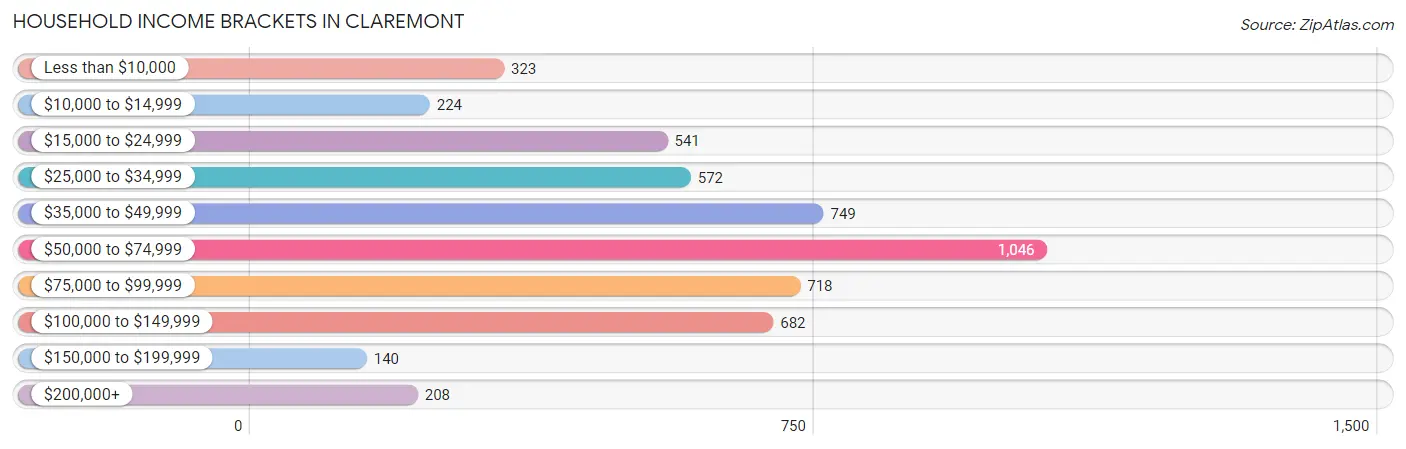
| Income Bracket | # Households | % Households |
| Less than $10,000 | 323 | 6.2% |
| $10,000 to $14,999 | 224 | 4.3% |
| $15,000 to $24,999 | 541 | 10.4% |
| $25,000 to $34,999 | 572 | 11.0% |
| $35,000 to $49,999 | 749 | 14.4% |
| $50,000 to $74,999 | 1,046 | 20.1% |
| $75,000 to $99,999 | 718 | 13.8% |
| $100,000 to $149,999 | 682 | 13.1% |
| $150,000 to $199,999 | 140 | 2.7% |
| $200,000+ | 208 | 4.0% |
Household Income by Householder Age in Claremont
The median household income in Claremont is $53,697, with the highest median household income of $70,688 found in the 25 to 44 years age bracket for the primary householder. A total of 1,639 households (31.5%) fall into this category. Meanwhile, the 15 to 24 years age bracket for the primary householder has the lowest median household income of $0, with 148 households (2.8%) in this group.
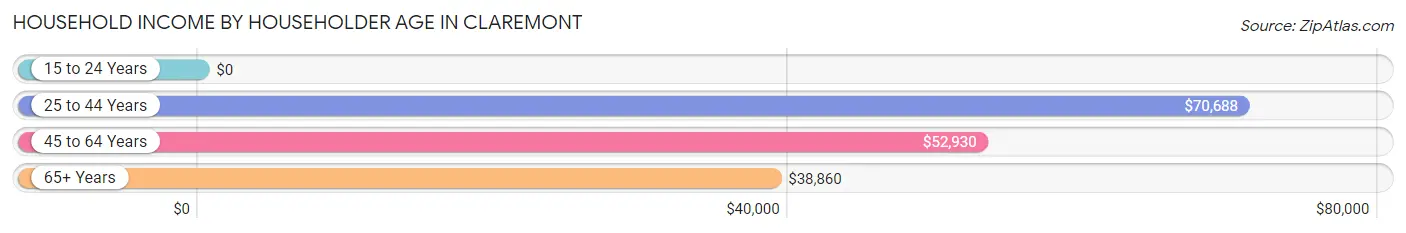
| Income Bracket | # Households | Median Income |
| 15 to 24 Years | 148 (2.8%) | $0 |
| 25 to 44 Years | 1,639 (31.5%) | $70,688 |
| 45 to 64 Years | 1,925 (37.0%) | $52,930 |
| 65+ Years | 1,491 (28.7%) | $38,860 |
| Total | 5,203 (100.0%) | $53,697 |
Poverty in Claremont
Income Below Poverty by Sex and Age in Claremont
With 15.2% poverty level for males and 16.5% for females among the residents of Claremont, under 5 year old males and 35 to 44 year old females are the most vulnerable to poverty, with 147 males (47.0%) and 212 females (32.5%) in their respective age groups living below the poverty level.
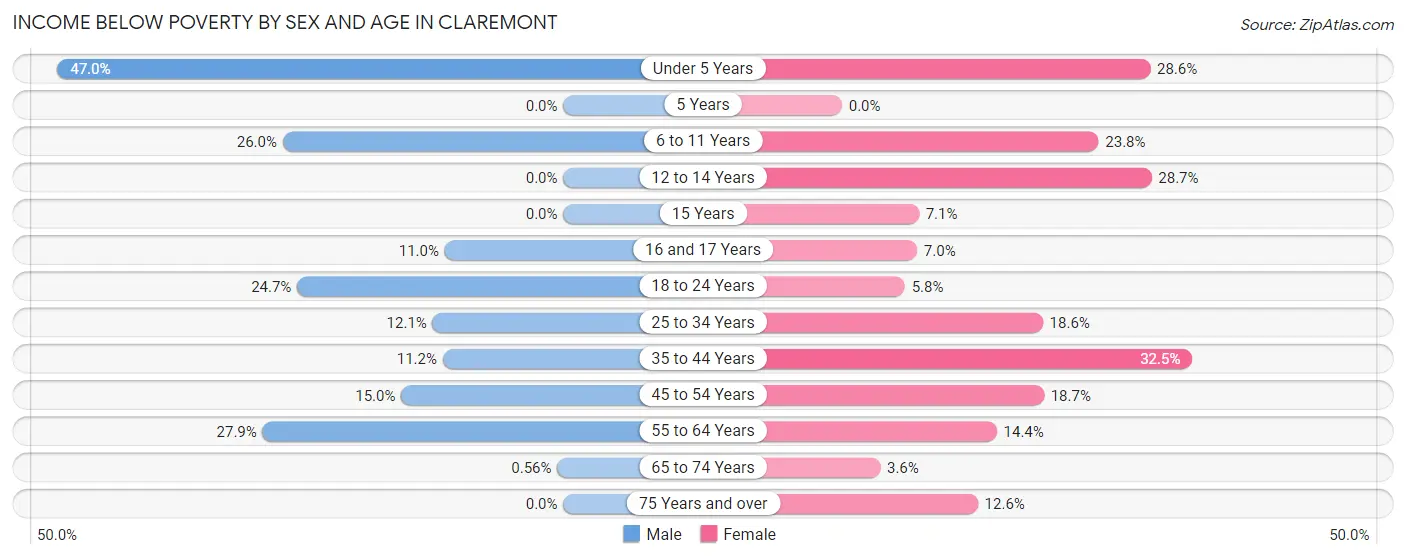
| Age Bracket | Male | Female |
| Under 5 Years | 147 (47.0%) | 109 (28.6%) |
| 5 Years | 0 (0.0%) | 0 (0.0%) |
| 6 to 11 Years | 119 (26.0%) | 80 (23.8%) |
| 12 to 14 Years | 0 (0.0%) | 77 (28.7%) |
| 15 Years | 0 (0.0%) | 4 (7.1%) |
| 16 and 17 Years | 22 (11.0%) | 14 (7.0%) |
| 18 to 24 Years | 125 (24.7%) | 25 (5.8%) |
| 25 to 34 Years | 103 (12.1%) | 143 (18.6%) |
| 35 to 44 Years | 107 (11.2%) | 212 (32.5%) |
| 45 to 54 Years | 159 (15.0%) | 181 (18.7%) |
| 55 to 64 Years | 204 (27.9%) | 126 (14.4%) |
| 65 to 74 Years | 5 (0.6%) | 33 (3.5%) |
| 75 Years and over | 0 (0.0%) | 56 (12.6%) |
| Total | 991 (15.2%) | 1,060 (16.5%) |
Income Above Poverty by Sex and Age in Claremont
According to the poverty statistics in Claremont, males aged 5 years and females aged 5 years are the age groups that are most secure financially, with 100.0% of males and 100.0% of females in these age groups living above the poverty line.
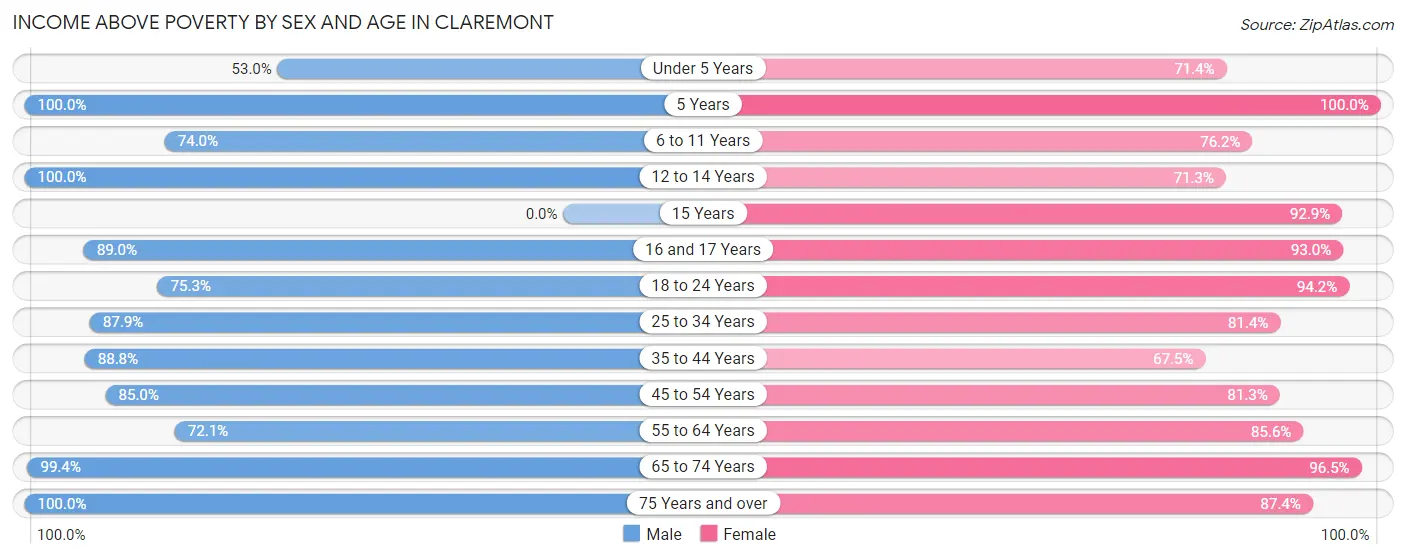
| Age Bracket | Male | Female |
| Under 5 Years | 166 (53.0%) | 272 (71.4%) |
| 5 Years | 25 (100.0%) | 118 (100.0%) |
| 6 to 11 Years | 338 (74.0%) | 256 (76.2%) |
| 12 to 14 Years | 181 (100.0%) | 191 (71.3%) |
| 15 Years | 0 (0.0%) | 52 (92.9%) |
| 16 and 17 Years | 178 (89.0%) | 187 (93.0%) |
| 18 to 24 Years | 381 (75.3%) | 403 (94.2%) |
| 25 to 34 Years | 746 (87.9%) | 624 (81.4%) |
| 35 to 44 Years | 849 (88.8%) | 440 (67.5%) |
| 45 to 54 Years | 898 (85.0%) | 785 (81.3%) |
| 55 to 64 Years | 527 (72.1%) | 751 (85.6%) |
| 65 to 74 Years | 889 (99.4%) | 896 (96.5%) |
| 75 Years and over | 348 (100.0%) | 388 (87.4%) |
| Total | 5,526 (84.8%) | 5,363 (83.5%) |
Income Below Poverty Among Married-Couple Families in Claremont
The poverty statistics for married-couple families in Claremont show that 6.9% or 130 of the total 1,875 families live below the poverty line. Families with no children have the highest poverty rate of 8.8%, comprising of 127 families. On the other hand, families with 1 or 2 children have the lowest poverty rate of 0.7%, which includes 3 families.
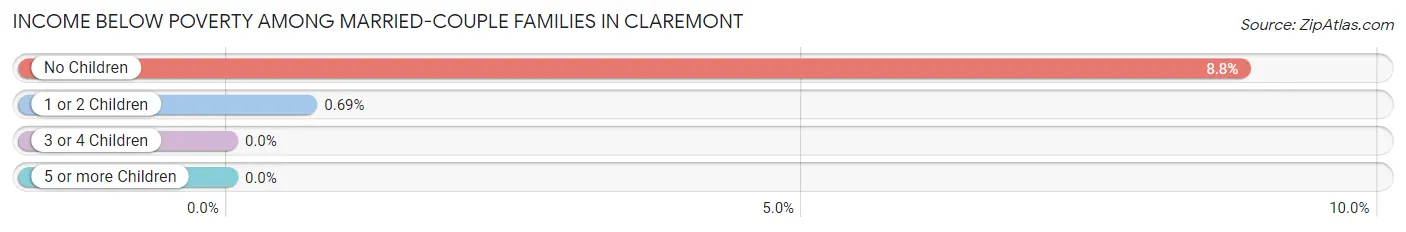
| Children | Above Poverty | Below Poverty |
| No Children | 1,314 (91.2%) | 127 (8.8%) |
| 1 or 2 Children | 431 (99.3%) | 3 (0.7%) |
| 3 or 4 Children | 0 (0.0%) | 0 (0.0%) |
| 5 or more Children | 0 (0.0%) | 0 (0.0%) |
| Total | 1,745 (93.1%) | 130 (6.9%) |
Income Below Poverty Among Single-Parent Households in Claremont
According to the poverty data in Claremont, 10.9% or 21 single-father households and 28.1% or 213 single-mother households are living below the poverty line. Among single-father households, those with 3 or 4 children have the highest poverty rate, with 19 households (100.0%) experiencing poverty. Likewise, among single-mother households, those with 3 or 4 children have the highest poverty rate, with 67 households (72.8%) falling below the poverty line.
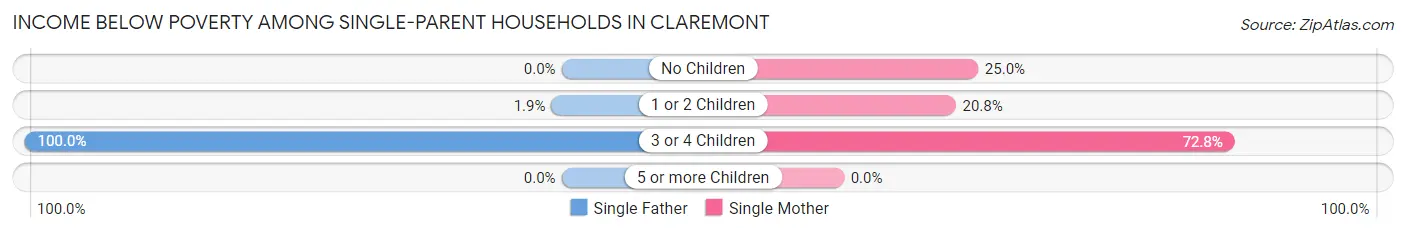
| Children | Single Father | Single Mother |
| No Children | 0 (0.0%) | 42 (25.0%) |
| 1 or 2 Children | 2 (1.9%) | 104 (20.8%) |
| 3 or 4 Children | 19 (100.0%) | 67 (72.8%) |
| 5 or more Children | 0 (0.0%) | 0 (0.0%) |
| Total | 21 (10.9%) | 213 (28.1%) |
Income Below Poverty Among Married-Couple vs Single-Parent Households in Claremont
The poverty data for Claremont shows that 130 of the married-couple family households (6.9%) and 234 of the single-parent households (24.6%) are living below the poverty level. Within the married-couple family households, those with no children have the highest poverty rate, with 127 households (8.8%) falling below the poverty line. Among the single-parent households, those with 3 or 4 children have the highest poverty rate, with 86 household (77.5%) living below poverty.
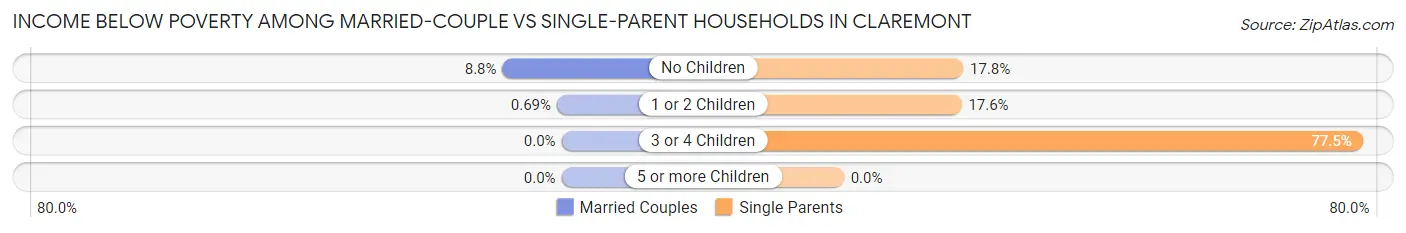
| Children | Married-Couple Families | Single-Parent Households |
| No Children | 127 (8.8%) | 42 (17.8%) |
| 1 or 2 Children | 3 (0.7%) | 106 (17.5%) |
| 3 or 4 Children | 0 (0.0%) | 86 (77.5%) |
| 5 or more Children | 0 (0.0%) | 0 (0.0%) |
| Total | 130 (6.9%) | 234 (24.6%) |
Race in Claremont
The most populous races in Claremont are White / Caucasian (11,968 | 91.9%), Two or more Races (662 | 5.1%), and Black / African American (265 | 2.0%).
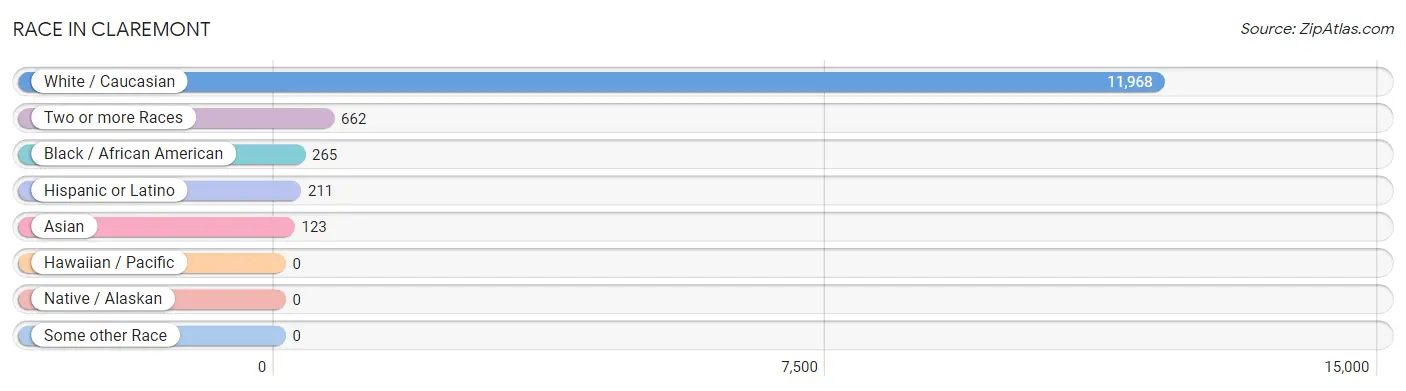
| Race | # Population | % Population |
| Asian | 123 | 0.9% |
| Black / African American | 265 | 2.0% |
| Hawaiian / Pacific | 0 | 0.0% |
| Hispanic or Latino | 211 | 1.6% |
| Native / Alaskan | 0 | 0.0% |
| White / Caucasian | 11,968 | 91.9% |
| Two or more Races | 662 | 5.1% |
| Some other Race | 0 | 0.0% |
| Total | 13,018 | 100.0% |
Ancestry in Claremont
The most populous ancestries reported in Claremont are French (2,280 | 17.5%), English (2,027 | 15.6%), Irish (1,151 | 8.8%), French Canadian (969 | 7.4%), and Italian (908 | 7.0%), together accounting for 56.3% of all Claremont residents.
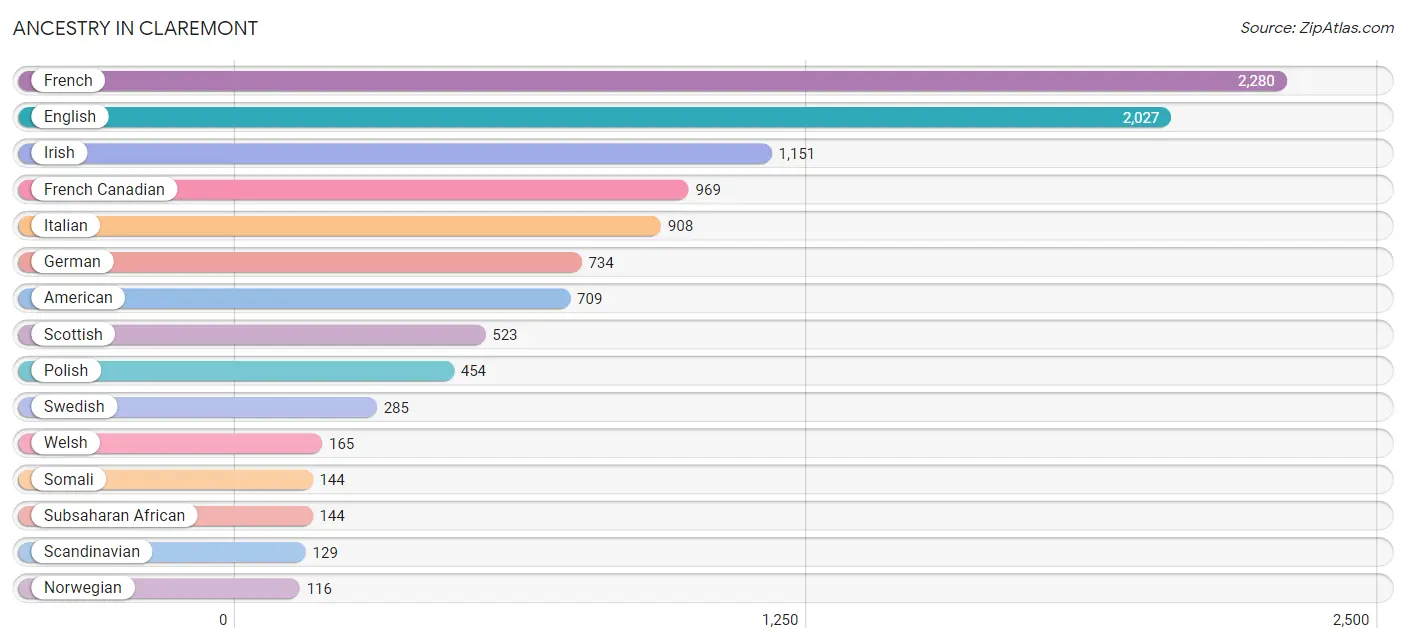
| Ancestry | # Population | % Population |
| Albanian | 23 | 0.2% |
| American | 709 | 5.4% |
| Arab | 64 | 0.5% |
| Armenian | 7 | 0.1% |
| Belgian | 91 | 0.7% |
| Blackfeet | 38 | 0.3% |
| British | 34 | 0.3% |
| Canadian | 87 | 0.7% |
| Celtic | 27 | 0.2% |
| Central American | 52 | 0.4% |
| Cherokee | 16 | 0.1% |
| Cuban | 57 | 0.4% |
| Czech | 17 | 0.1% |
| Czechoslovakian | 23 | 0.2% |
| Danish | 41 | 0.3% |
| Delaware | 5 | 0.0% |
| Dutch | 36 | 0.3% |
| Eastern European | 14 | 0.1% |
| English | 2,027 | 15.6% |
| European | 113 | 0.9% |
| Finnish | 23 | 0.2% |
| French | 2,280 | 17.5% |
| French Canadian | 969 | 7.4% |
| German | 734 | 5.6% |
| Greek | 43 | 0.3% |
| Hungarian | 86 | 0.7% |
| Indian (Asian) | 79 | 0.6% |
| Irish | 1,151 | 8.8% |
| Italian | 908 | 7.0% |
| Jamaican | 92 | 0.7% |
| Korean | 40 | 0.3% |
| Latvian | 15 | 0.1% |
| Lebanese | 44 | 0.3% |
| Lithuanian | 15 | 0.1% |
| Mexican | 25 | 0.2% |
| Northern European | 16 | 0.1% |
| Norwegian | 116 | 0.9% |
| Panamanian | 52 | 0.4% |
| Polish | 454 | 3.5% |
| Portuguese | 68 | 0.5% |
| Puerto Rican | 77 | 0.6% |
| Russian | 108 | 0.8% |
| Scandinavian | 129 | 1.0% |
| Scotch-Irish | 75 | 0.6% |
| Scottish | 523 | 4.0% |
| Somali | 144 | 1.1% |
| Sri Lankan | 44 | 0.3% |
| Subsaharan African | 144 | 1.1% |
| Swedish | 285 | 2.2% |
| Swiss | 8 | 0.1% |
| Ukrainian | 24 | 0.2% |
| Welsh | 165 | 1.3% | View All 52 Rows |
Immigrants in Claremont
The most numerous immigrant groups reported in Claremont came from Asia (150 | 1.1%), Africa (144 | 1.1%), Eastern Africa (144 | 1.1%), Somalia (144 | 1.1%), and Caribbean (92 | 0.7%), together accounting for 5.2% of all Claremont residents.
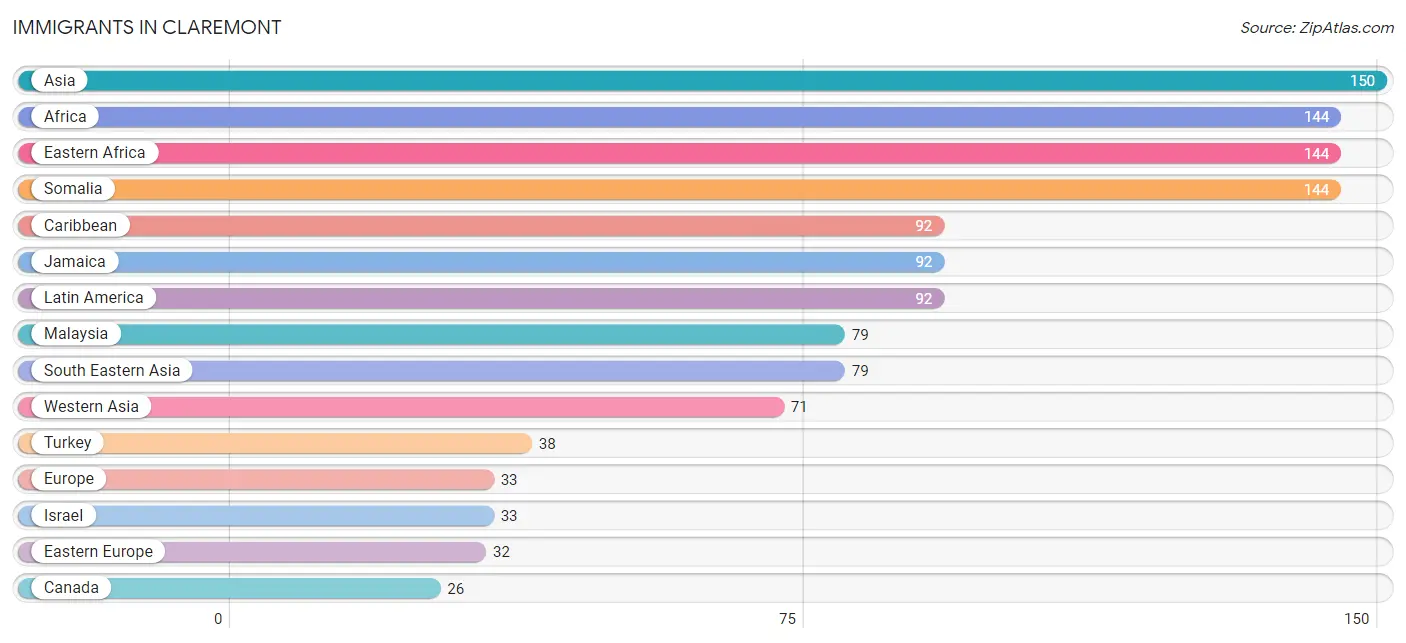
| Immigration Origin | # Population | % Population |
| Africa | 144 | 1.1% |
| Asia | 150 | 1.1% |
| Canada | 26 | 0.2% |
| Caribbean | 92 | 0.7% |
| Eastern Africa | 144 | 1.1% |
| Eastern Europe | 32 | 0.3% |
| Europe | 33 | 0.3% |
| Hungary | 12 | 0.1% |
| Ireland | 1 | 0.0% |
| Israel | 33 | 0.3% |
| Jamaica | 92 | 0.7% |
| Latin America | 92 | 0.7% |
| Malaysia | 79 | 0.6% |
| Northern Europe | 1 | 0.0% |
| Russia | 16 | 0.1% |
| Somalia | 144 | 1.1% |
| South Eastern Asia | 79 | 0.6% |
| Turkey | 38 | 0.3% |
| Ukraine | 4 | 0.0% |
| Western Asia | 71 | 0.5% | View All 20 Rows |
Sex and Age in Claremont
Sex and Age in Claremont
The most populous age groups in Claremont are 45 to 49 Years (592 | 9.0%) for men and 50 to 54 Years (551 | 8.5%) for women.
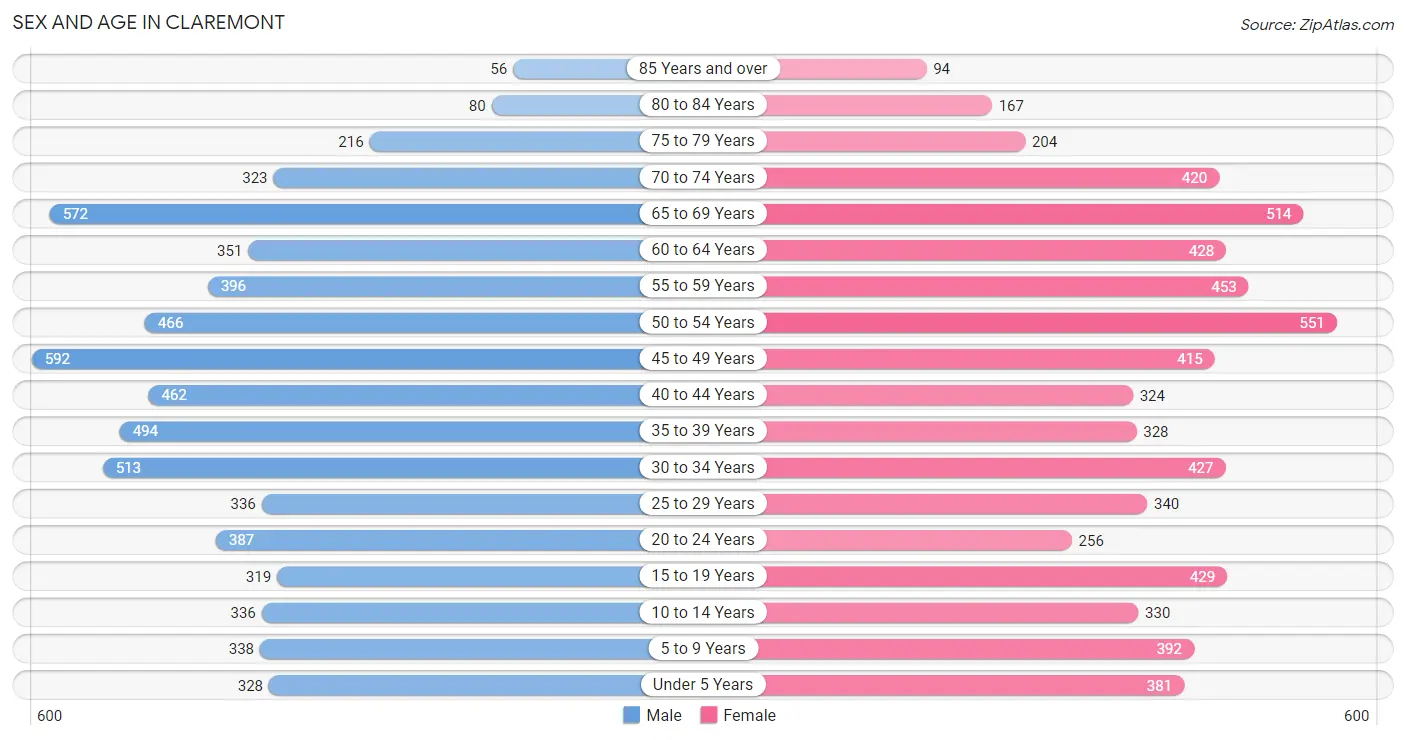
| Age Bracket | Male | Female |
| Under 5 Years | 328 (5.0%) | 381 (5.9%) |
| 5 to 9 Years | 338 (5.1%) | 392 (6.1%) |
| 10 to 14 Years | 336 (5.1%) | 330 (5.1%) |
| 15 to 19 Years | 319 (4.9%) | 429 (6.7%) |
| 20 to 24 Years | 387 (5.9%) | 256 (4.0%) |
| 25 to 29 Years | 336 (5.1%) | 340 (5.3%) |
| 30 to 34 Years | 513 (7.8%) | 427 (6.6%) |
| 35 to 39 Years | 494 (7.5%) | 328 (5.1%) |
| 40 to 44 Years | 462 (7.0%) | 324 (5.0%) |
| 45 to 49 Years | 592 (9.0%) | 415 (6.4%) |
| 50 to 54 Years | 466 (7.1%) | 551 (8.5%) |
| 55 to 59 Years | 396 (6.0%) | 453 (7.0%) |
| 60 to 64 Years | 351 (5.3%) | 428 (6.6%) |
| 65 to 69 Years | 572 (8.7%) | 514 (8.0%) |
| 70 to 74 Years | 323 (4.9%) | 420 (6.5%) |
| 75 to 79 Years | 216 (3.3%) | 204 (3.2%) |
| 80 to 84 Years | 80 (1.2%) | 167 (2.6%) |
| 85 Years and over | 56 (0.9%) | 94 (1.5%) |
| Total | 6,565 (100.0%) | 6,453 (100.0%) |
Families and Households in Claremont
Median Family Size in Claremont
The median family size in Claremont is 3.20 persons per family, with single male/father families (192 | 6.8%) accounting for the largest median family size of 4.01 persons per family. On the other hand, married-couple families (1,875 | 66.3%) represent the smallest median family size with 2.79 persons per family.
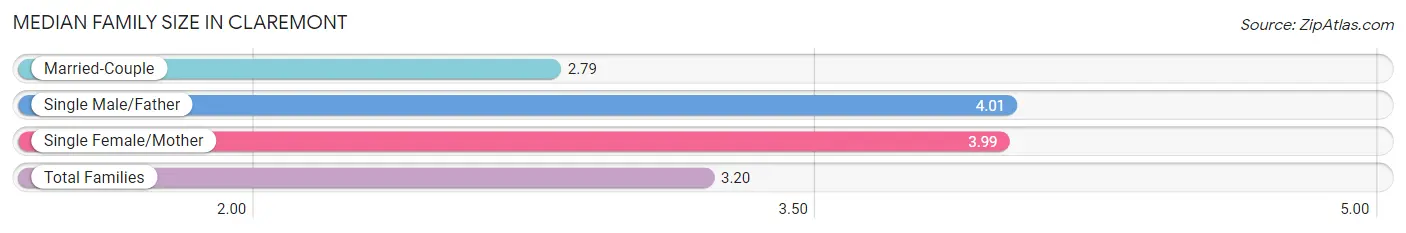
| Family Type | # Families | Family Size |
| Married-Couple | 1,875 (66.3%) | 2.79 |
| Single Male/Father | 192 (6.8%) | 4.01 |
| Single Female/Mother | 759 (26.9%) | 3.99 |
| Total Families | 2,826 (100.0%) | 3.20 |
Median Household Size in Claremont
The median household size in Claremont is 2.47 persons per household, with single female/mother households (759 | 14.6%) accounting for the largest median household size of 4.51 persons per household. non-family households (2,377 | 45.7%) represent the smallest median household size with 1.36 persons per household.
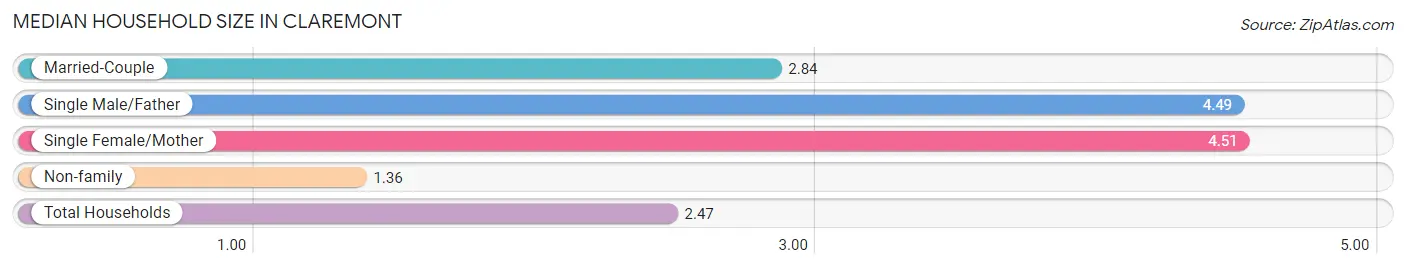
| Household Type | # Households | Household Size |
| Married-Couple | 1,875 (36.0%) | 2.84 |
| Single Male/Father | 192 (3.7%) | 4.49 |
| Single Female/Mother | 759 (14.6%) | 4.51 |
| Non-family | 2,377 (45.7%) | 1.36 |
| Total Households | 5,203 (100.0%) | 2.47 |
Household Size by Marriage Status in Claremont
Out of a total of 5,203 households in Claremont, 2,826 (54.3%) are family households, while 2,377 (45.7%) are nonfamily households. The most numerous type of family households are 2-person households, comprising 1,545, and the most common type of nonfamily households are 1-person households, comprising 1,885.
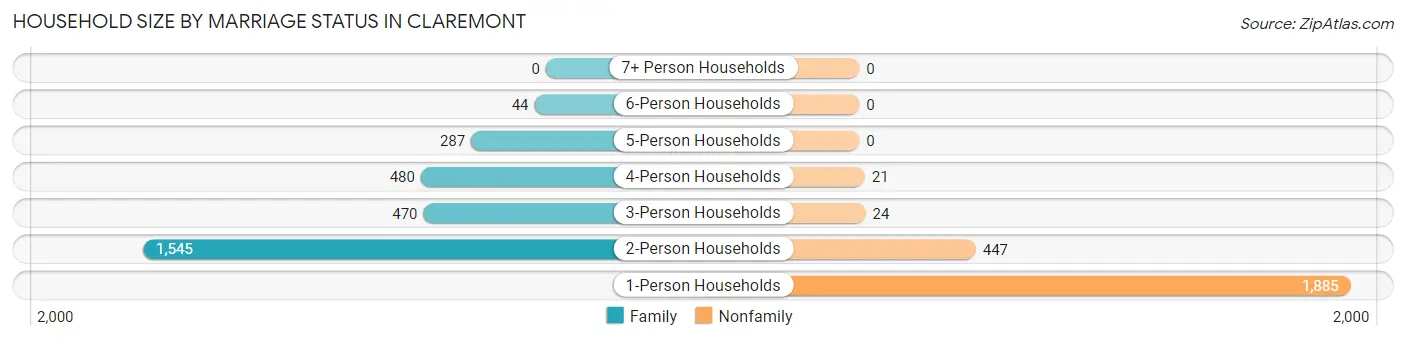
| Household Size | Family Households | Nonfamily Households |
| 1-Person Households | - | 1,885 (36.2%) |
| 2-Person Households | 1,545 (29.7%) | 447 (8.6%) |
| 3-Person Households | 470 (9.0%) | 24 (0.5%) |
| 4-Person Households | 480 (9.2%) | 21 (0.4%) |
| 5-Person Households | 287 (5.5%) | 0 (0.0%) |
| 6-Person Households | 44 (0.9%) | 0 (0.0%) |
| 7+ Person Households | 0 (0.0%) | 0 (0.0%) |
| Total | 2,826 (54.3%) | 2,377 (45.7%) |
Female Fertility in Claremont
Fertility by Age in Claremont
Average fertility rate in Claremont is 71.0 births per 1,000 women. Women in the age bracket of 20 to 34 years have the highest fertility rate with 172.0 births per 1,000 women. Women in the age bracket of 20 to 34 years acount for 93.6% of all women with births.
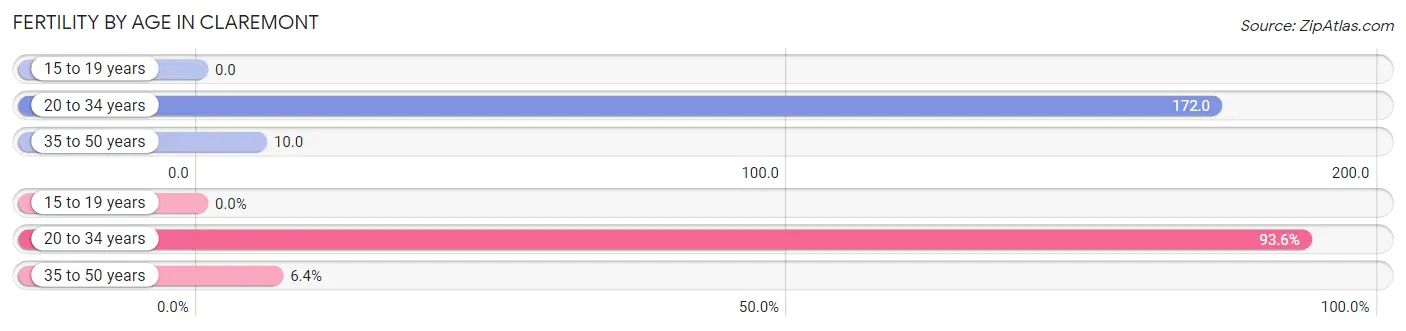
| Age Bracket | Women with Births | Births / 1,000 Women |
| 15 to 19 years | 0 (0.0%) | 0.0 |
| 20 to 34 years | 176 (93.6%) | 172.0 |
| 35 to 50 years | 12 (6.4%) | 10.0 |
| Total | 188 (100.0%) | 71.0 |
Fertility by Age by Marriage Status in Claremont
31.9% of women with births (188) in Claremont are married. The highest percentage of unmarried women with births falls into 20 to 34 years age bracket with 72.7% of them unmarried at the time of birth, while the lowest percentage of unmarried women with births belong to 35 to 50 years age bracket with 0.0% of them unmarried.
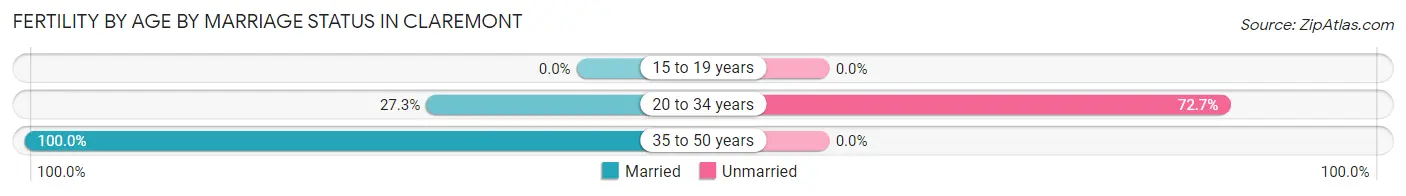
| Age Bracket | Married | Unmarried |
| 15 to 19 years | 0 (0.0%) | 0 (0.0%) |
| 20 to 34 years | 48 (27.3%) | 128 (72.7%) |
| 35 to 50 years | 12 (100.0%) | 0 (0.0%) |
| Total | 60 (31.9%) | 128 (68.1%) |
Fertility by Education in Claremont
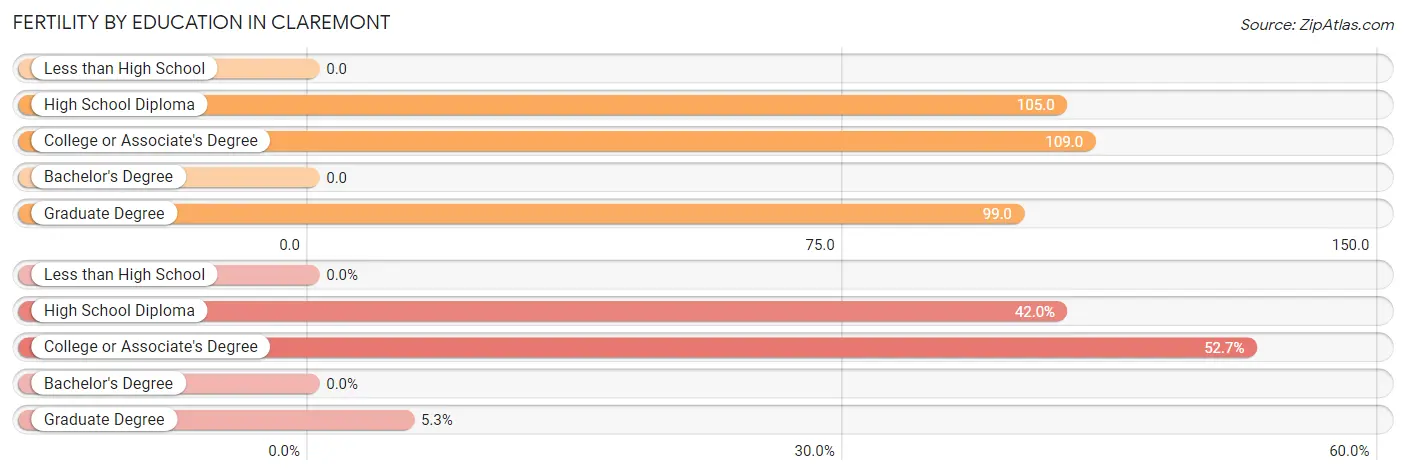
| Educational Attainment | Women with Births | Births / 1,000 Women |
| Less than High School | 0 (0.0%) | 0.0 |
| High School Diploma | 79 (42.0%) | 105.0 |
| College or Associate's Degree | 99 (52.7%) | 109.0 |
| Bachelor's Degree | 0 (0.0%) | 0.0 |
| Graduate Degree | 10 (5.3%) | 99.0 |
| Total | 188 (100.0%) | 71.0 |
Fertility by Education by Marriage Status in Claremont
68.1% of women with births in Claremont are unmarried. Women with the educational attainment of graduate degree are most likely to be married with 100.0% of them married at childbirth, while women with the educational attainment of high school diploma are least likely to be married with 91.1% of them unmarried at childbirth.
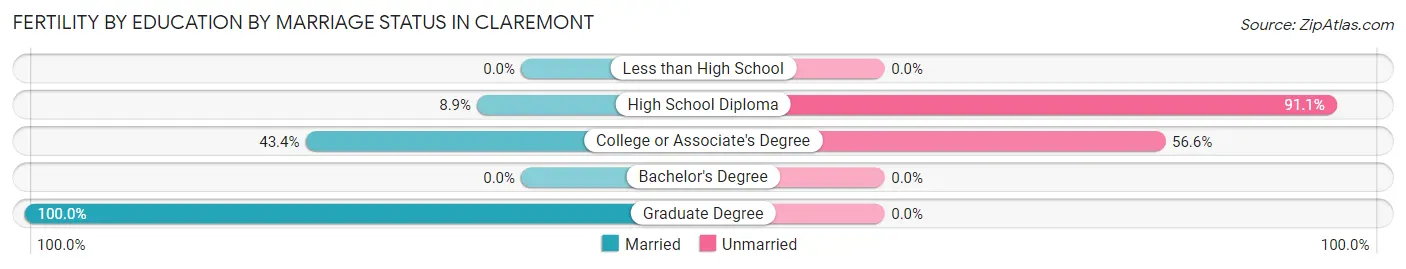
| Educational Attainment | Married | Unmarried |
| Less than High School | 0 (0.0%) | 0 (0.0%) |
| High School Diploma | 7 (8.9%) | 72 (91.1%) |
| College or Associate's Degree | 43 (43.4%) | 56 (56.6%) |
| Bachelor's Degree | 0 (0.0%) | 0 (0.0%) |
| Graduate Degree | 10 (100.0%) | 0 (0.0%) |
| Total | 60 (31.9%) | 128 (68.1%) |
Employment Characteristics in Claremont
Employment by Class of Employer in Claremont
Among the 5,541 employed individuals in Claremont, private company employees (3,984 | 71.9%), not-for-profit organizations (723 | 13.1%), and self-employed (incorporated) (280 | 5.1%) make up the most common classes of employment.
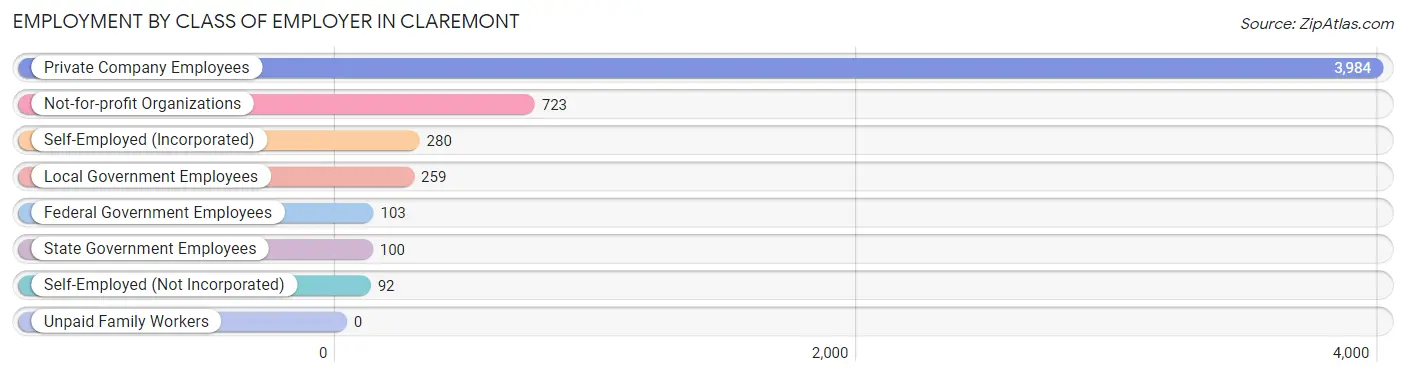
| Employer Class | # Employees | % Employees |
| Private Company Employees | 3,984 | 71.9% |
| Self-Employed (Incorporated) | 280 | 5.1% |
| Self-Employed (Not Incorporated) | 92 | 1.7% |
| Not-for-profit Organizations | 723 | 13.1% |
| Local Government Employees | 259 | 4.7% |
| State Government Employees | 100 | 1.8% |
| Federal Government Employees | 103 | 1.9% |
| Unpaid Family Workers | 0 | 0.0% |
| Total | 5,541 | 100.0% |
Employment Status by Age in Claremont
According to the labor force statistics for Claremont, out of the total population over 16 years of age (10,857), 54.7% or 5,939 individuals are in the labor force, with 2.2% or 131 of them unemployed. The age group with the highest labor force participation rate is 35 to 44 years, with 77.7% or 1,249 individuals in the labor force. Within the labor force, the 65 to 74 years age range has the highest percentage of unemployed individuals, with 6.6% or 31 of them being unemployed.
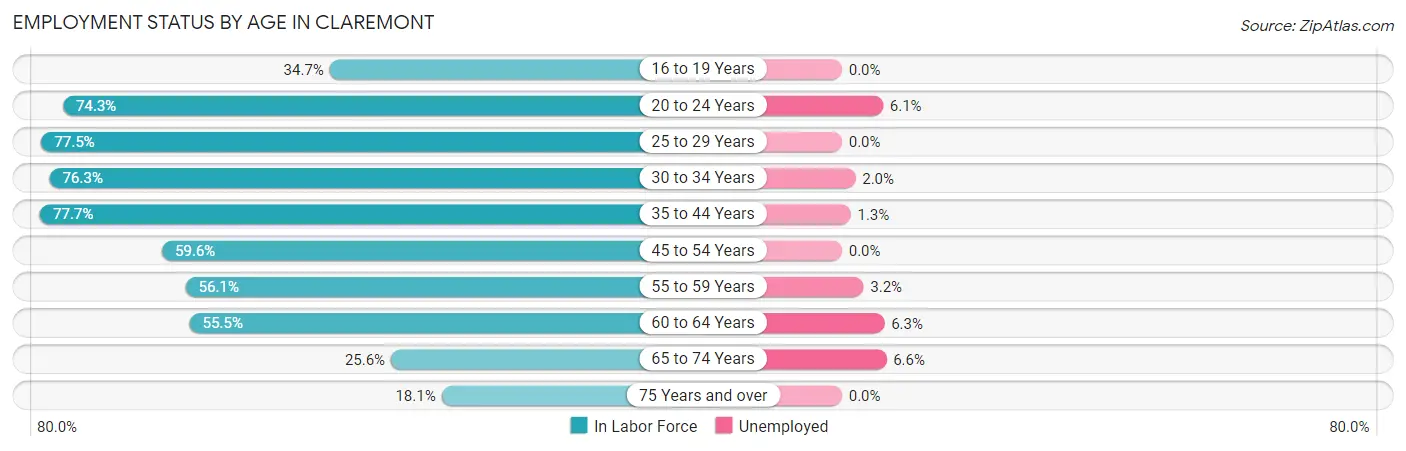
| Age Bracket | In Labor Force | Unemployed |
| 16 to 19 Years | 240 (34.7%) | 0 (0.0%) |
| 20 to 24 Years | 478 (74.3%) | 29 (6.1%) |
| 25 to 29 Years | 524 (77.5%) | 0 (0.0%) |
| 30 to 34 Years | 717 (76.3%) | 14 (2.0%) |
| 35 to 44 Years | 1,249 (77.7%) | 16 (1.3%) |
| 45 to 54 Years | 1,206 (59.6%) | 0 (0.0%) |
| 55 to 59 Years | 476 (56.1%) | 15 (3.2%) |
| 60 to 64 Years | 432 (55.5%) | 27 (6.3%) |
| 65 to 74 Years | 468 (25.6%) | 31 (6.6%) |
| 75 Years and over | 148 (18.1%) | 0 (0.0%) |
| Total | 5,939 (54.7%) | 131 (2.2%) |
Employment Status by Educational Attainment in Claremont
According to labor force statistics for Claremont, 67.0% of individuals (4,607) out of the total population between 25 and 64 years of age (6,876) are in the labor force, with 1.6% or 74 of them being unemployed. The group with the highest labor force participation rate are those with the educational attainment of bachelor's degree or higher, with 79.6% or 1,317 individuals in the labor force. Within the labor force, individuals with high school diploma education have the highest percentage of unemployment, with 3.3% or 63 of them being unemployed.
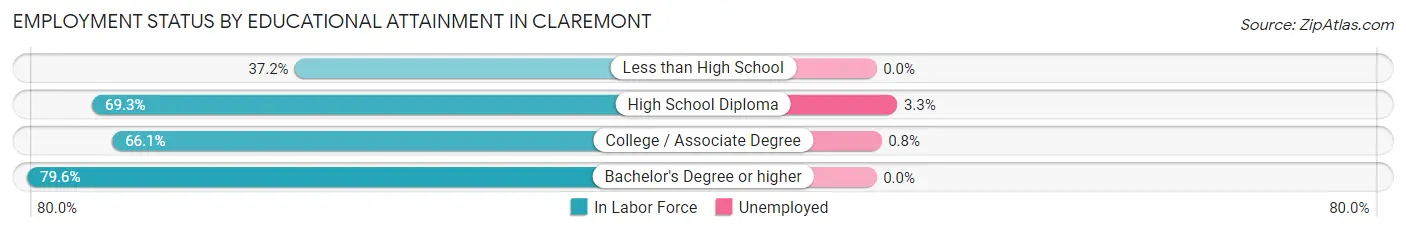
| Educational Attainment | In Labor Force | Unemployed |
| Less than High School | 323 (37.2%) | 0 (0.0%) |
| High School Diploma | 1,896 (69.3%) | 90 (3.3%) |
| College / Associate Degree | 1,069 (66.1%) | 13 (0.8%) |
| Bachelor's Degree or higher | 1,317 (79.6%) | 0 (0.0%) |
| Total | 4,607 (67.0%) | 110 (1.6%) |
Employment Occupations by Sex in Claremont
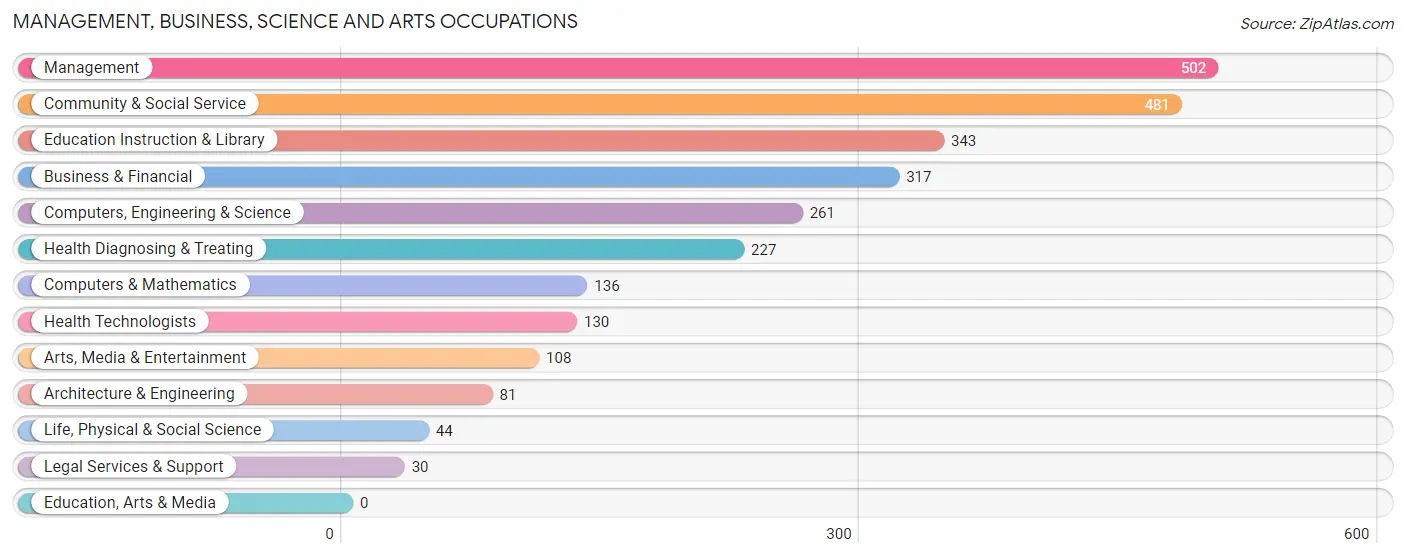
Management, Business, Science and Arts Occupations
The most common Management, Business, Science and Arts occupations in Claremont are Management (502 | 8.6%), Community & Social Service (481 | 8.3%), Education Instruction & Library (343 | 5.9%), Business & Financial (317 | 5.5%), and Computers, Engineering & Science (261 | 4.5%).
Management, Business, Science and Arts Occupations by Sex
Within the Management, Business, Science and Arts occupations in Claremont, the most male-oriented occupations are Life, Physical & Social Science (100.0%), Arts, Media & Entertainment (75.0%), and Computers, Engineering & Science (69.0%), while the most female-oriented occupations are Legal Services & Support (100.0%), Health Technologists (100.0%), and Health Diagnosing & Treating (82.8%).
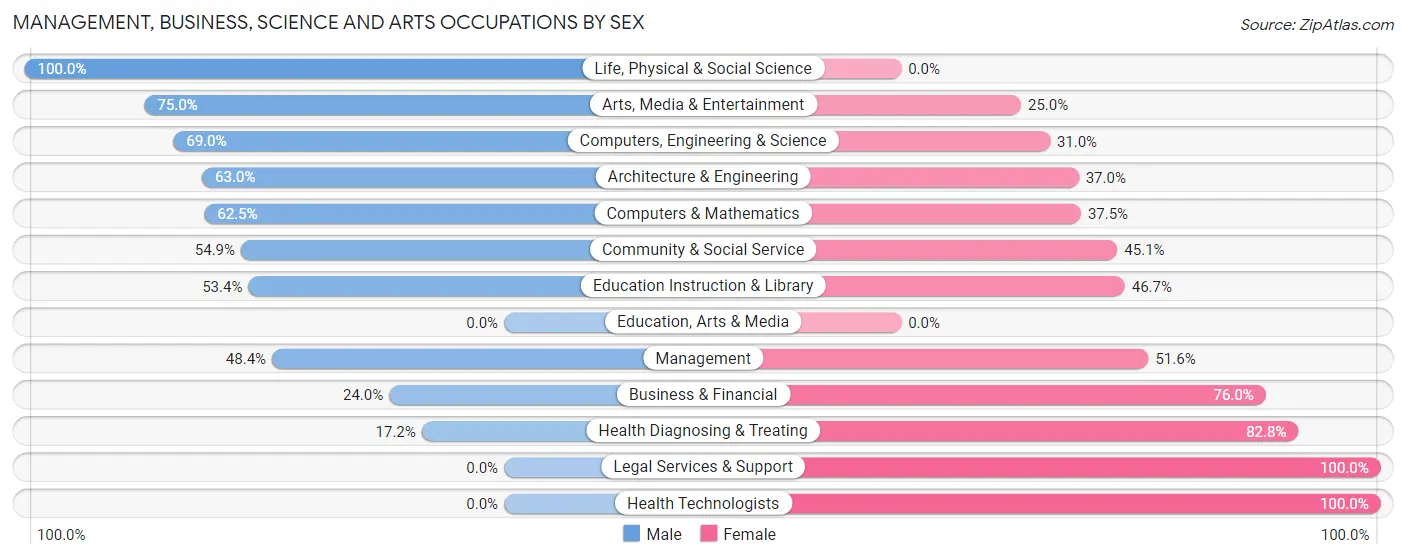
| Occupation | Male | Female |
| Management | 243 (48.4%) | 259 (51.6%) |
| Business & Financial | 76 (24.0%) | 241 (76.0%) |
| Computers, Engineering & Science | 180 (69.0%) | 81 (31.0%) |
| Computers & Mathematics | 85 (62.5%) | 51 (37.5%) |
| Architecture & Engineering | 51 (63.0%) | 30 (37.0%) |
| Life, Physical & Social Science | 44 (100.0%) | 0 (0.0%) |
| Community & Social Service | 264 (54.9%) | 217 (45.1%) |
| Education, Arts & Media | 0 (0.0%) | 0 (0.0%) |
| Legal Services & Support | 0 (0.0%) | 30 (100.0%) |
| Education Instruction & Library | 183 (53.3%) | 160 (46.7%) |
| Arts, Media & Entertainment | 81 (75.0%) | 27 (25.0%) |
| Health Diagnosing & Treating | 39 (17.2%) | 188 (82.8%) |
| Health Technologists | 0 (0.0%) | 130 (100.0%) |
| Total (Category) | 802 (44.9%) | 986 (55.1%) |
| Total (Overall) | 3,108 (53.5%) | 2,701 (46.5%) |
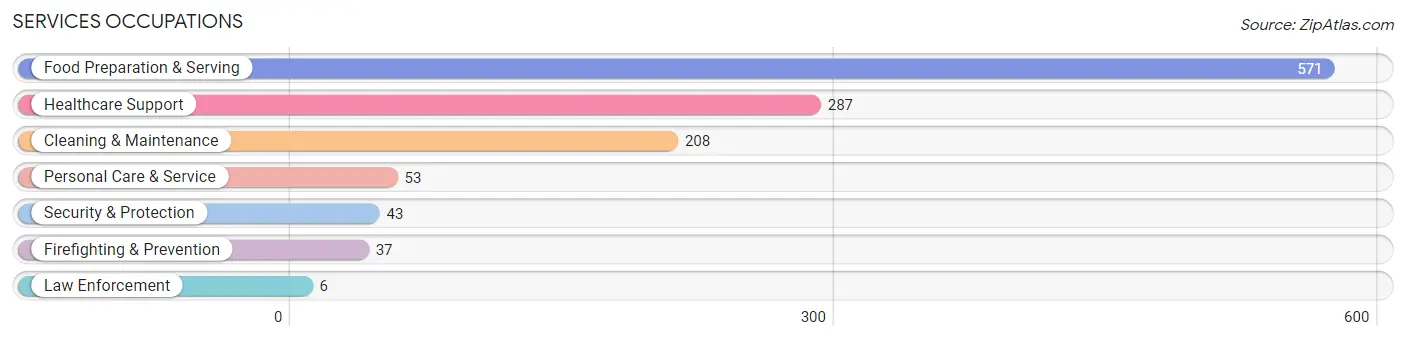
Services Occupations
The most common Services occupations in Claremont are Food Preparation & Serving (571 | 9.8%), Healthcare Support (287 | 4.9%), Cleaning & Maintenance (208 | 3.6%), Personal Care & Service (53 | 0.9%), and Security & Protection (43 | 0.7%).
Services Occupations by Sex
Within the Services occupations in Claremont, the most male-oriented occupations are Security & Protection (100.0%), Firefighting & Prevention (100.0%), and Law Enforcement (100.0%), while the most female-oriented occupations are Healthcare Support (92.7%), Personal Care & Service (64.1%), and Food Preparation & Serving (39.2%).
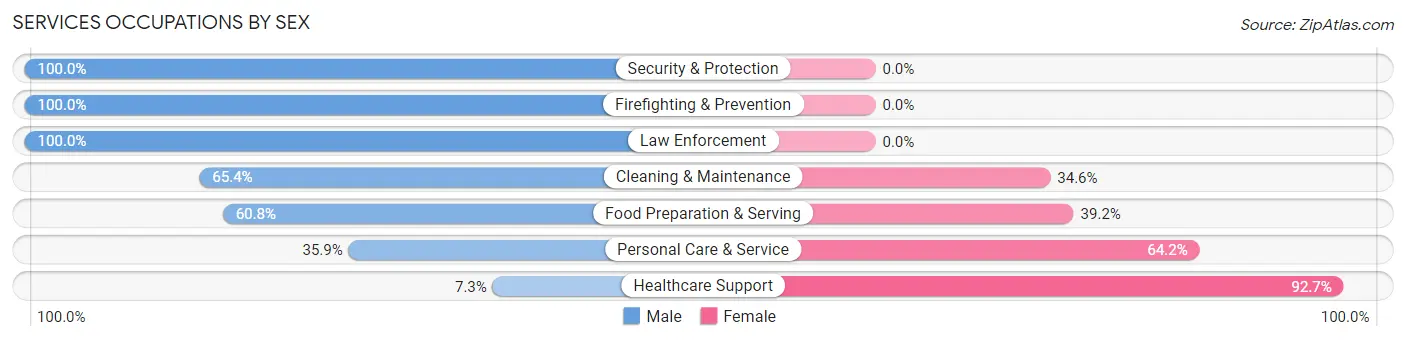
| Occupation | Male | Female |
| Healthcare Support | 21 (7.3%) | 266 (92.7%) |
| Security & Protection | 43 (100.0%) | 0 (0.0%) |
| Firefighting & Prevention | 37 (100.0%) | 0 (0.0%) |
| Law Enforcement | 6 (100.0%) | 0 (0.0%) |
| Food Preparation & Serving | 347 (60.8%) | 224 (39.2%) |
| Cleaning & Maintenance | 136 (65.4%) | 72 (34.6%) |
| Personal Care & Service | 19 (35.8%) | 34 (64.1%) |
| Total (Category) | 566 (48.7%) | 596 (51.3%) |
| Total (Overall) | 3,108 (53.5%) | 2,701 (46.5%) |
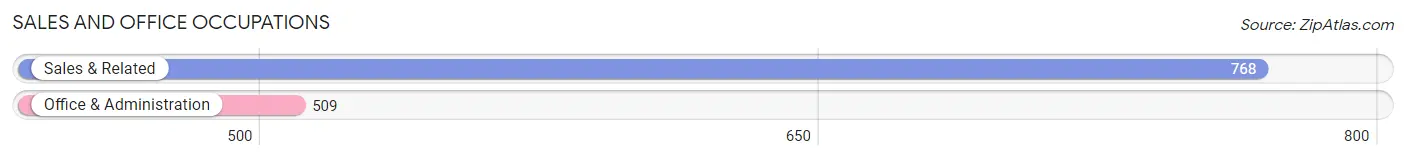
Sales and Office Occupations
The most common Sales and Office occupations in Claremont are Sales & Related (768 | 13.2%), and Office & Administration (509 | 8.8%).
Sales and Office Occupations by Sex
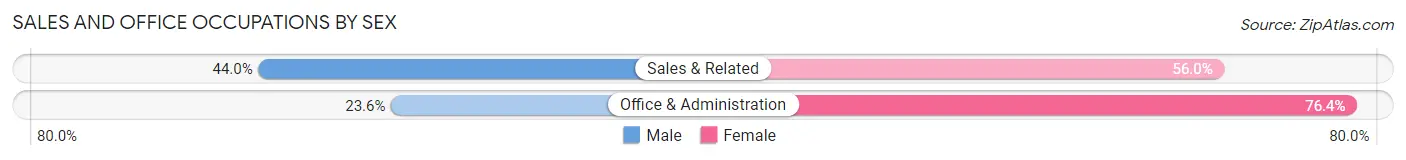
| Occupation | Male | Female |
| Sales & Related | 338 (44.0%) | 430 (56.0%) |
| Office & Administration | 120 (23.6%) | 389 (76.4%) |
| Total (Category) | 458 (35.9%) | 819 (64.1%) |
| Total (Overall) | 3,108 (53.5%) | 2,701 (46.5%) |
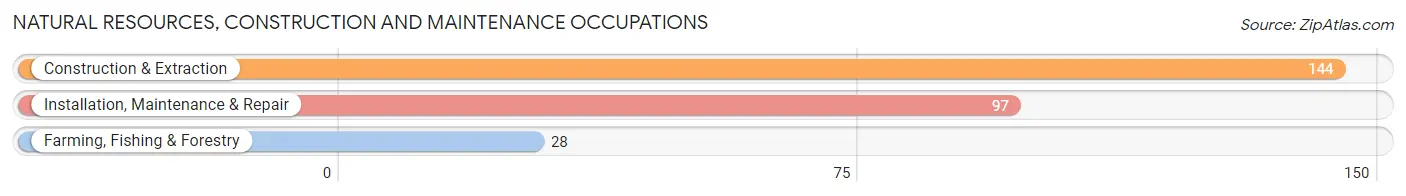
Natural Resources, Construction and Maintenance Occupations
The most common Natural Resources, Construction and Maintenance occupations in Claremont are Construction & Extraction (144 | 2.5%), Installation, Maintenance & Repair (97 | 1.7%), and Farming, Fishing & Forestry (28 | 0.5%).
Natural Resources, Construction and Maintenance Occupations by Sex
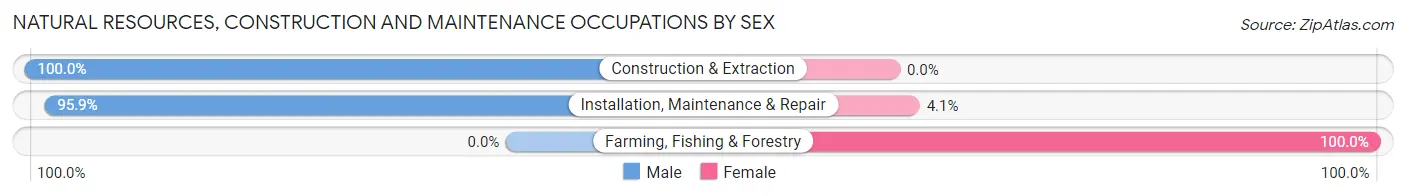
| Occupation | Male | Female |
| Farming, Fishing & Forestry | 0 (0.0%) | 28 (100.0%) |
| Construction & Extraction | 144 (100.0%) | 0 (0.0%) |
| Installation, Maintenance & Repair | 93 (95.9%) | 4 (4.1%) |
| Total (Category) | 237 (88.1%) | 32 (11.9%) |
| Total (Overall) | 3,108 (53.5%) | 2,701 (46.5%) |
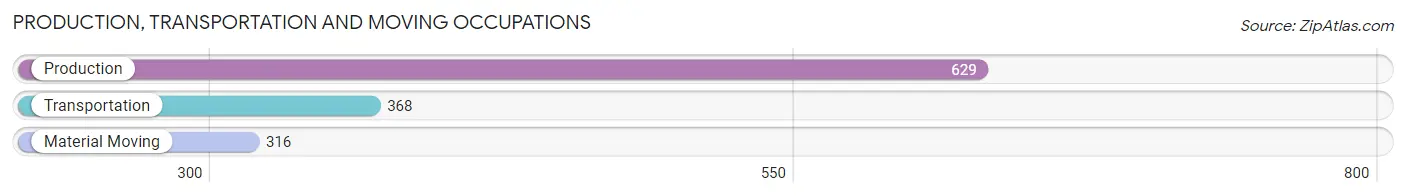
Production, Transportation and Moving Occupations
The most common Production, Transportation and Moving occupations in Claremont are Production (629 | 10.8%), Transportation (368 | 6.3%), and Material Moving (316 | 5.4%).
Production, Transportation and Moving Occupations by Sex
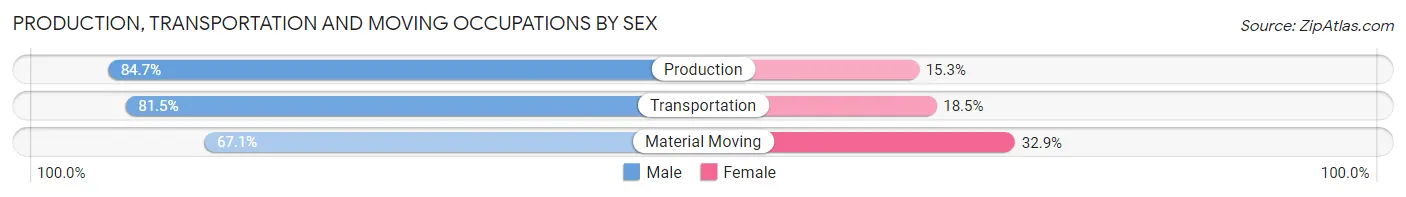
| Occupation | Male | Female |
| Production | 533 (84.7%) | 96 (15.3%) |
| Transportation | 300 (81.5%) | 68 (18.5%) |
| Material Moving | 212 (67.1%) | 104 (32.9%) |
| Total (Category) | 1,045 (79.6%) | 268 (20.4%) |
| Total (Overall) | 3,108 (53.5%) | 2,701 (46.5%) |
Employment Industries by Sex in Claremont
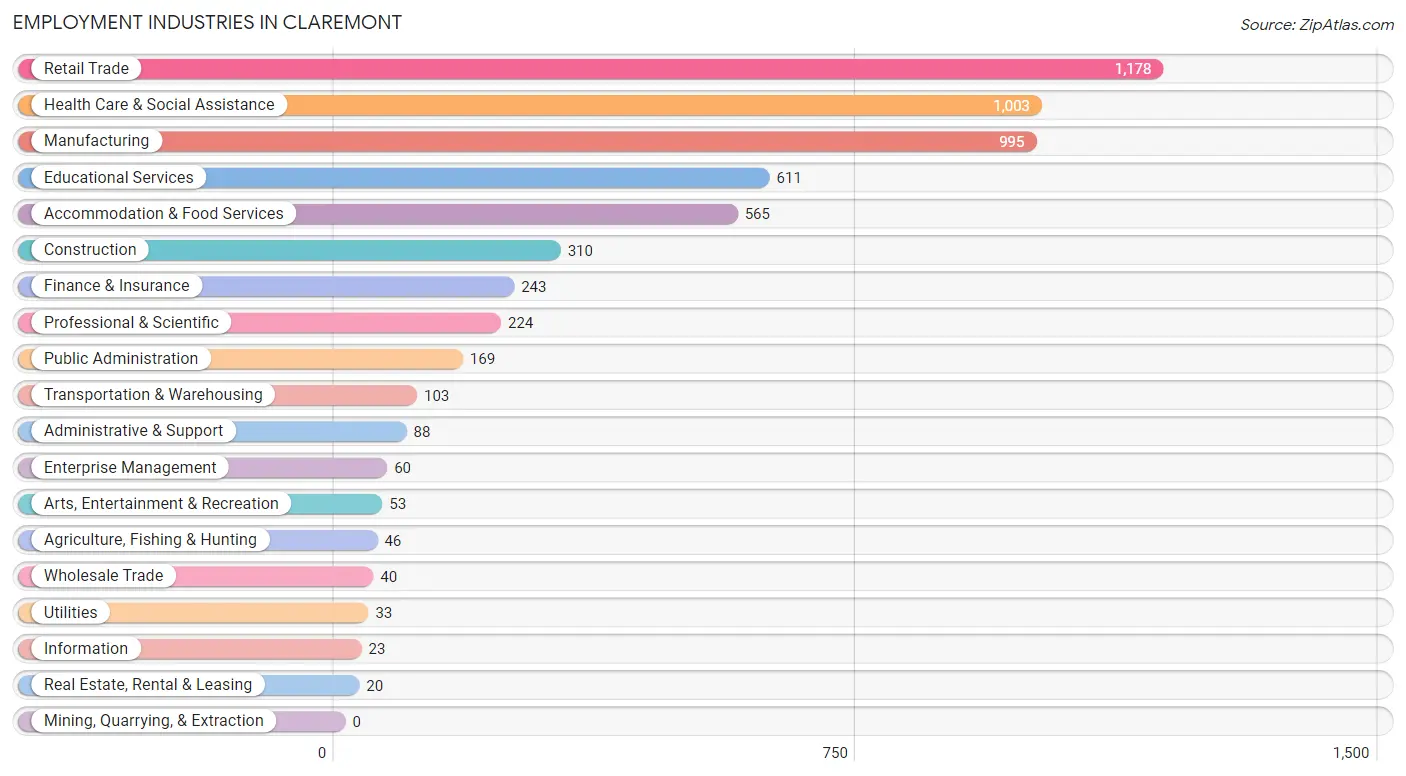
Employment Industries in Claremont
The major employment industries in Claremont include Retail Trade (1,178 | 20.3%), Health Care & Social Assistance (1,003 | 17.3%), Manufacturing (995 | 17.1%), Educational Services (611 | 10.5%), and Accommodation & Food Services (565 | 9.7%).
Employment Industries by Sex in Claremont
The Claremont industries that see more men than women are Utilities (100.0%), Information (100.0%), and Enterprise Management (100.0%), whereas the industries that tend to have a higher number of women are Public Administration (78.7%), Health Care & Social Assistance (73.6%), and Arts, Entertainment & Recreation (67.9%).
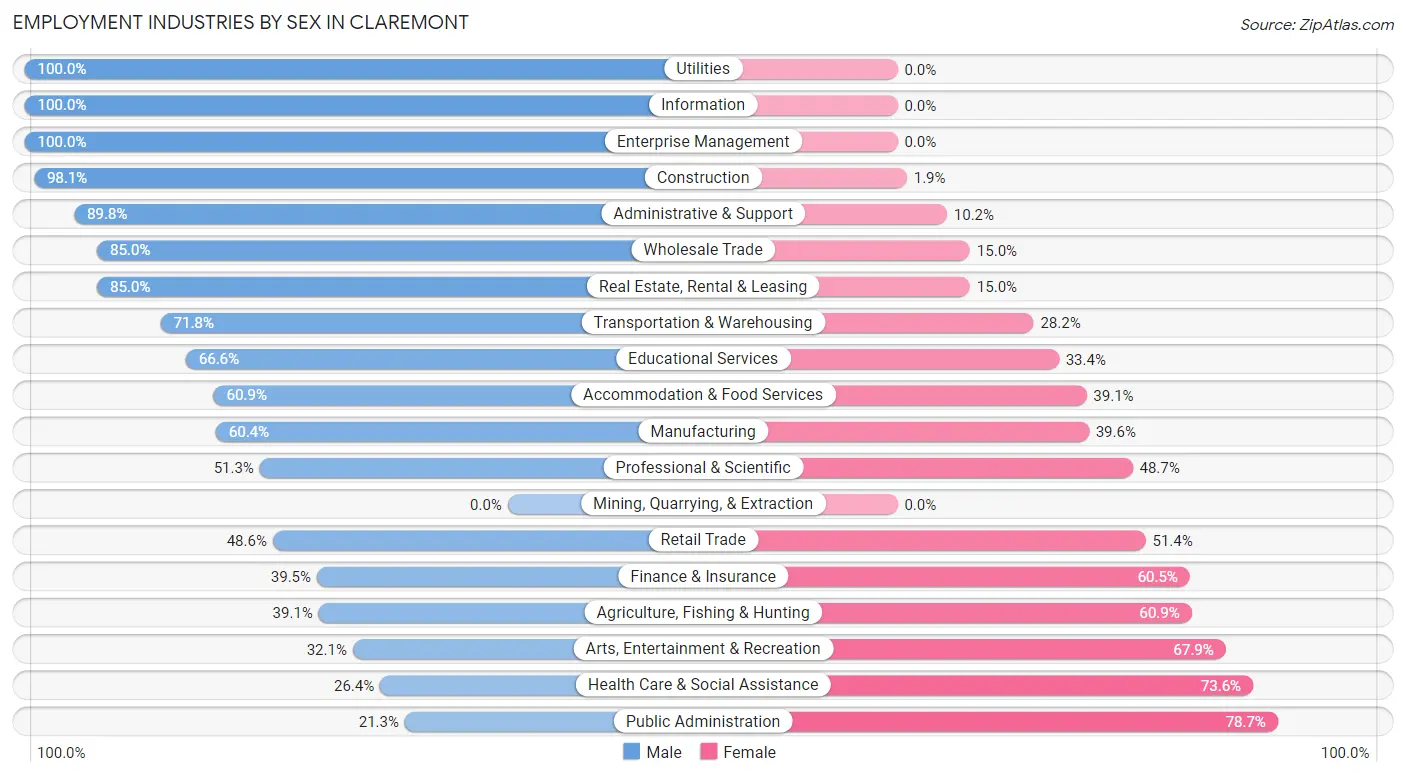
| Industry | Male | Female |
| Agriculture, Fishing & Hunting | 18 (39.1%) | 28 (60.9%) |
| Mining, Quarrying, & Extraction | 0 (0.0%) | 0 (0.0%) |
| Construction | 304 (98.1%) | 6 (1.9%) |
| Manufacturing | 601 (60.4%) | 394 (39.6%) |
| Wholesale Trade | 34 (85.0%) | 6 (15.0%) |
| Retail Trade | 573 (48.6%) | 605 (51.4%) |
| Transportation & Warehousing | 74 (71.8%) | 29 (28.2%) |
| Utilities | 33 (100.0%) | 0 (0.0%) |
| Information | 23 (100.0%) | 0 (0.0%) |
| Finance & Insurance | 96 (39.5%) | 147 (60.5%) |
| Real Estate, Rental & Leasing | 17 (85.0%) | 3 (15.0%) |
| Professional & Scientific | 115 (51.3%) | 109 (48.7%) |
| Enterprise Management | 60 (100.0%) | 0 (0.0%) |
| Administrative & Support | 79 (89.8%) | 9 (10.2%) |
| Educational Services | 407 (66.6%) | 204 (33.4%) |
| Health Care & Social Assistance | 265 (26.4%) | 738 (73.6%) |
| Arts, Entertainment & Recreation | 17 (32.1%) | 36 (67.9%) |
| Accommodation & Food Services | 344 (60.9%) | 221 (39.1%) |
| Public Administration | 36 (21.3%) | 133 (78.7%) |
| Total | 3,108 (53.5%) | 2,701 (46.5%) |
Education in Claremont
School Enrollment in Claremont
The most common levels of schooling among the 2,487 students in Claremont are high school (642 | 25.8%), elementary school (623 | 25.1%), and middle school (507 | 20.4%).
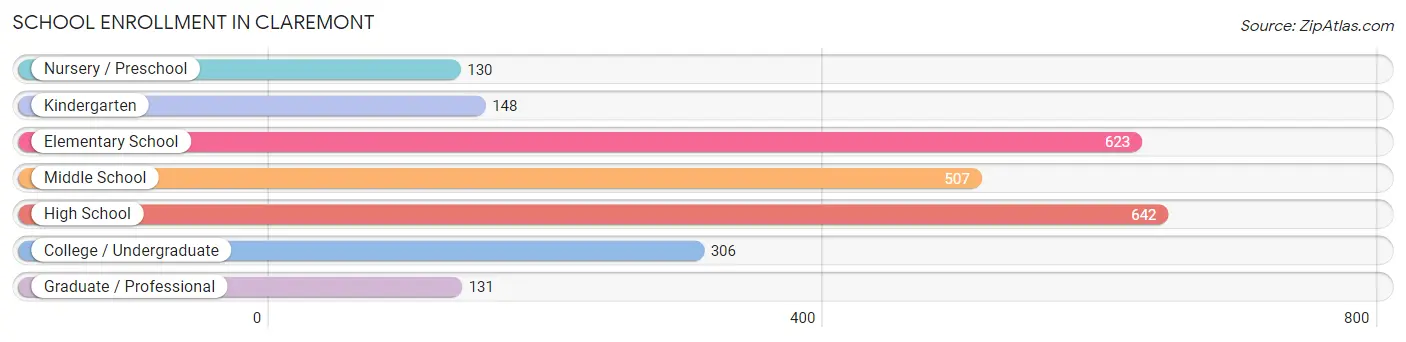
| School Level | # Students | % Students |
| Nursery / Preschool | 130 | 5.2% |
| Kindergarten | 148 | 5.9% |
| Elementary School | 623 | 25.1% |
| Middle School | 507 | 20.4% |
| High School | 642 | 25.8% |
| College / Undergraduate | 306 | 12.3% |
| Graduate / Professional | 131 | 5.3% |
| Total | 2,487 | 100.0% |
School Enrollment by Age by Funding Source in Claremont
Out of a total of 2,487 students who are enrolled in schools in Claremont, 453 (18.2%) attend a private institution, while the remaining 2,034 (81.8%) are enrolled in public schools. The age group of 3 to 4 year olds has the highest likelihood of being enrolled in private schools, with 32 (44.4% in the age bracket) enrolled. Conversely, the age group of 20 to 24 year olds has the lowest likelihood of being enrolled in a private school, with 125 (97.7% in the age bracket) attending a public institution.
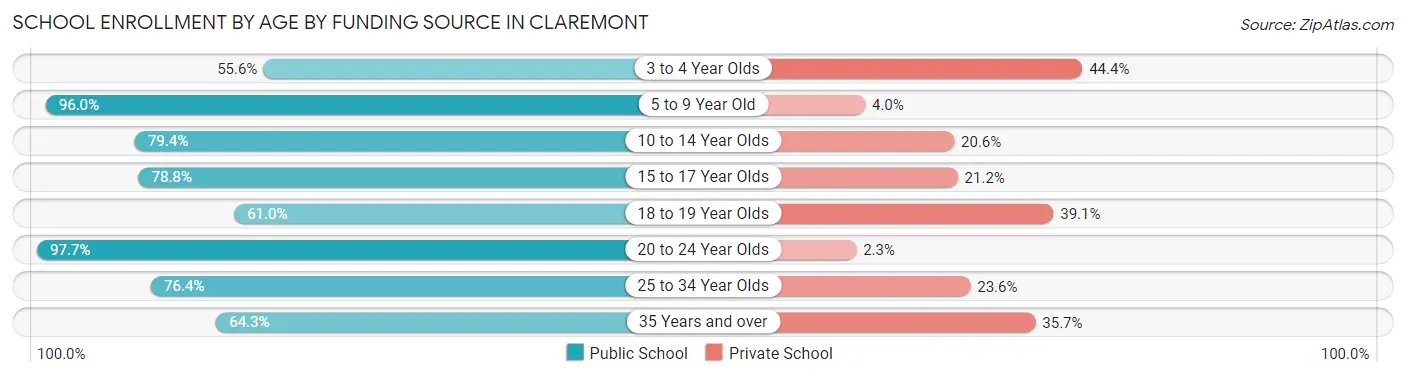
| Age Bracket | Public School | Private School |
| 3 to 4 Year Olds | 40 (55.6%) | 32 (44.4%) |
| 5 to 9 Year Old | 677 (96.0%) | 28 (4.0%) |
| 10 to 14 Year Olds | 529 (79.4%) | 137 (20.6%) |
| 15 to 17 Year Olds | 360 (78.8%) | 97 (21.2%) |
| 18 to 19 Year Olds | 128 (61.0%) | 82 (39.1%) |
| 20 to 24 Year Olds | 125 (97.7%) | 3 (2.3%) |
| 25 to 34 Year Olds | 94 (76.4%) | 29 (23.6%) |
| 35 Years and over | 81 (64.3%) | 45 (35.7%) |
| Total | 2,034 (81.8%) | 453 (18.2%) |
Educational Attainment by Field of Study in Claremont
Business (513 | 20.7%), science & technology (316 | 12.7%), social sciences (298 | 12.0%), bio, nature & agricultural (226 | 9.1%), and education (208 | 8.4%) are the most common fields of study among 2,482 individuals in Claremont who have obtained a bachelor's degree or higher.
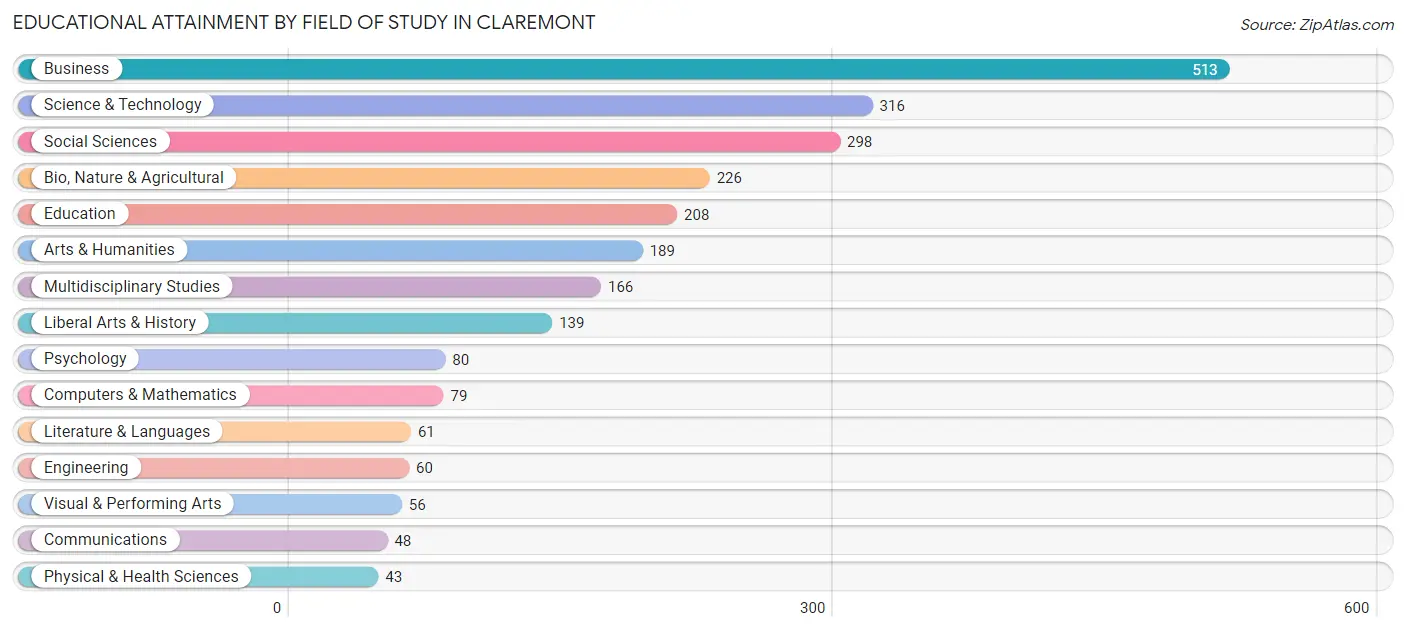
| Field of Study | # Graduates | % Graduates |
| Computers & Mathematics | 79 | 3.2% |
| Bio, Nature & Agricultural | 226 | 9.1% |
| Physical & Health Sciences | 43 | 1.7% |
| Psychology | 80 | 3.2% |
| Social Sciences | 298 | 12.0% |
| Engineering | 60 | 2.4% |
| Multidisciplinary Studies | 166 | 6.7% |
| Science & Technology | 316 | 12.7% |
| Business | 513 | 20.7% |
| Education | 208 | 8.4% |
| Literature & Languages | 61 | 2.5% |
| Liberal Arts & History | 139 | 5.6% |
| Visual & Performing Arts | 56 | 2.3% |
| Communications | 48 | 1.9% |
| Arts & Humanities | 189 | 7.6% |
| Total | 2,482 | 100.0% |
Transportation & Commute in Claremont
Vehicle Availability by Sex in Claremont
The most prevalent vehicle ownership categories in Claremont are males with 2 vehicles (1,288, accounting for 44.3%) and females with 2 vehicles (1,311, making up 49.0%).
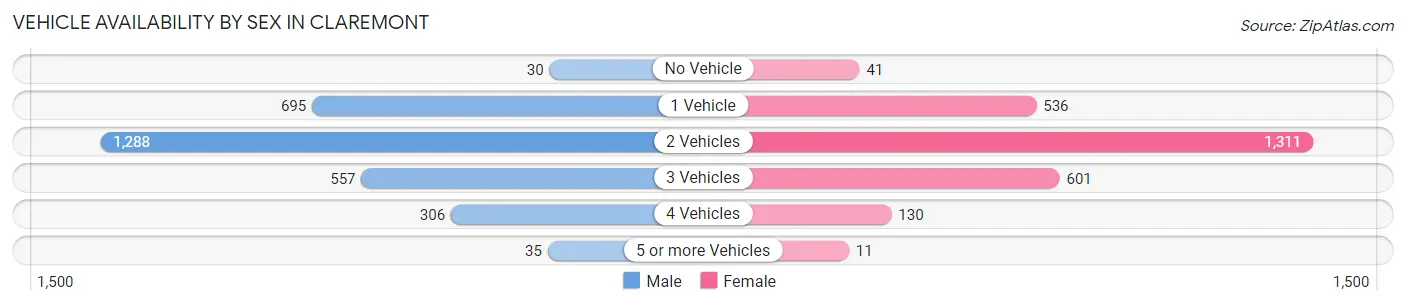
| Vehicles Available | Male | Female |
| No Vehicle | 30 (1.0%) | 41 (1.6%) |
| 1 Vehicle | 695 (23.9%) | 536 (20.4%) |
| 2 Vehicles | 1,288 (44.3%) | 1,311 (49.8%) |
| 3 Vehicles | 557 (19.1%) | 601 (22.9%) |
| 4 Vehicles | 306 (10.5%) | 130 (4.9%) |
| 5 or more Vehicles | 35 (1.2%) | 11 (0.4%) |
| Total | 2,911 (100.0%) | 2,630 (100.0%) |
Commute Time in Claremont
The most frequently occuring commute durations in Claremont are 10 to 14 minutes (933 commuters, 18.2%), 5 to 9 minutes (784 commuters, 15.3%), and 30 to 34 minutes (558 commuters, 10.9%).
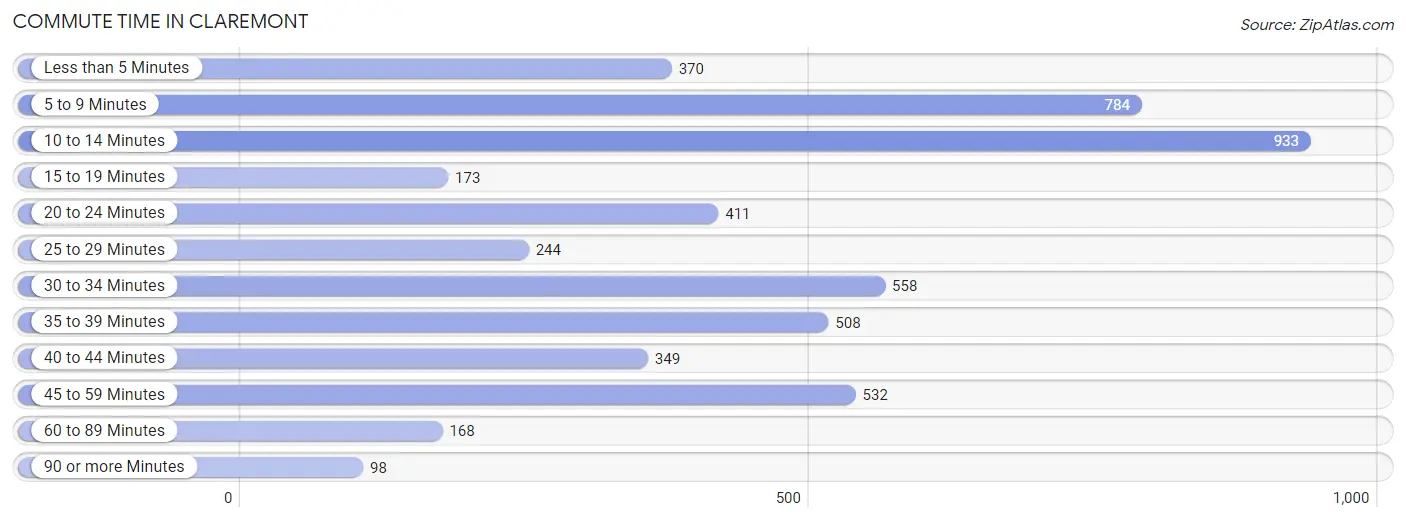
| Commute Time | # Commuters | % Commuters |
| Less than 5 Minutes | 370 | 7.2% |
| 5 to 9 Minutes | 784 | 15.3% |
| 10 to 14 Minutes | 933 | 18.2% |
| 15 to 19 Minutes | 173 | 3.4% |
| 20 to 24 Minutes | 411 | 8.0% |
| 25 to 29 Minutes | 244 | 4.8% |
| 30 to 34 Minutes | 558 | 10.9% |
| 35 to 39 Minutes | 508 | 9.9% |
| 40 to 44 Minutes | 349 | 6.8% |
| 45 to 59 Minutes | 532 | 10.4% |
| 60 to 89 Minutes | 168 | 3.3% |
| 90 or more Minutes | 98 | 1.9% |
Commute Time by Sex in Claremont
The most common commute times in Claremont are 10 to 14 minutes (441 commuters, 16.4%) for males and 10 to 14 minutes (492 commuters, 20.1%) for females.
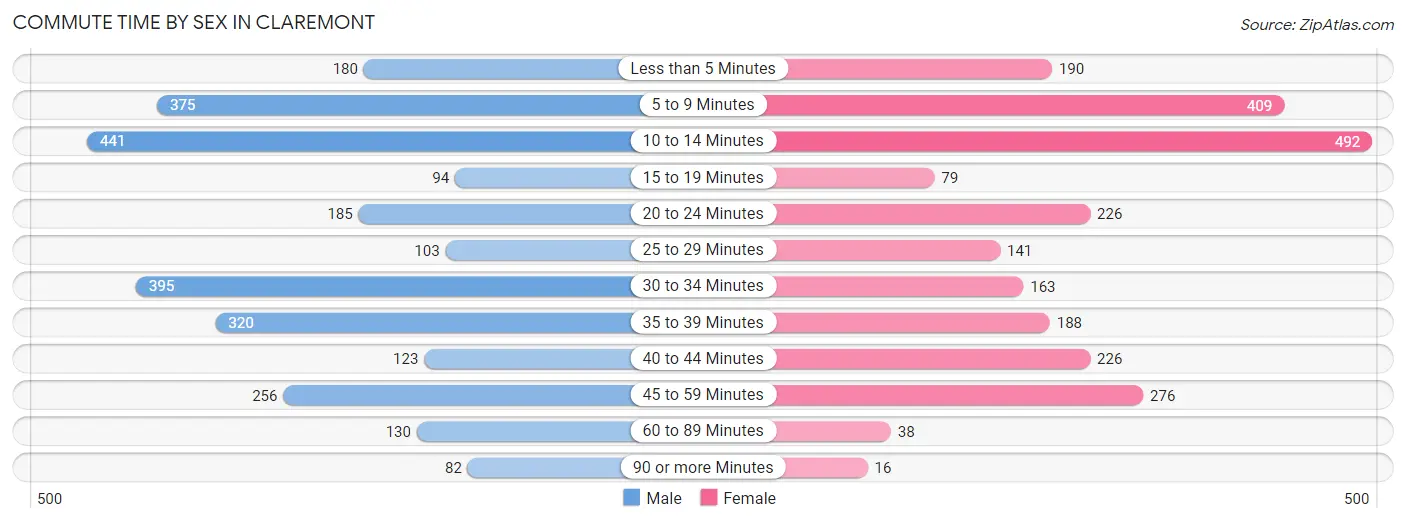
| Commute Time | Male | Female |
| Less than 5 Minutes | 180 (6.7%) | 190 (7.8%) |
| 5 to 9 Minutes | 375 (14.0%) | 409 (16.7%) |
| 10 to 14 Minutes | 441 (16.4%) | 492 (20.1%) |
| 15 to 19 Minutes | 94 (3.5%) | 79 (3.2%) |
| 20 to 24 Minutes | 185 (6.9%) | 226 (9.2%) |
| 25 to 29 Minutes | 103 (3.8%) | 141 (5.8%) |
| 30 to 34 Minutes | 395 (14.7%) | 163 (6.7%) |
| 35 to 39 Minutes | 320 (11.9%) | 188 (7.7%) |
| 40 to 44 Minutes | 123 (4.6%) | 226 (9.2%) |
| 45 to 59 Minutes | 256 (9.5%) | 276 (11.3%) |
| 60 to 89 Minutes | 130 (4.8%) | 38 (1.5%) |
| 90 or more Minutes | 82 (3.1%) | 16 (0.6%) |
Time of Departure to Work by Sex in Claremont
The most frequent times of departure to work in Claremont are 7:00 AM to 7:29 AM (384, 14.3%) for males and 7:00 AM to 7:29 AM (516, 21.1%) for females.
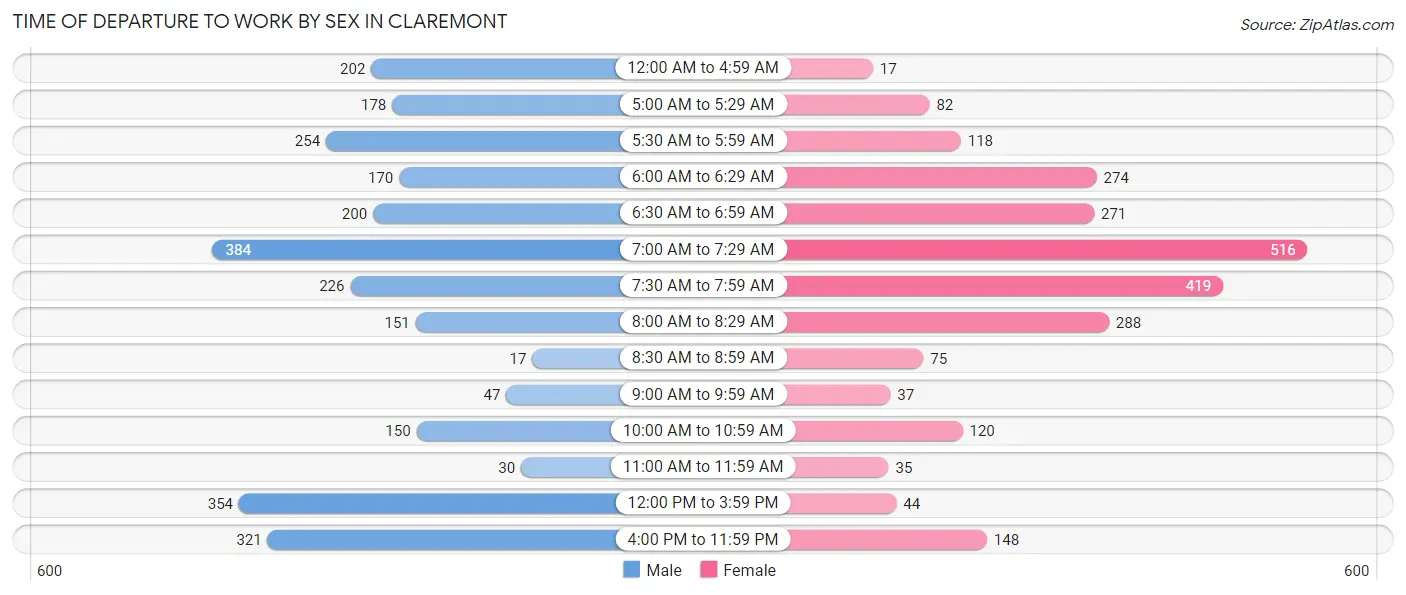
| Time of Departure | Male | Female |
| 12:00 AM to 4:59 AM | 202 (7.5%) | 17 (0.7%) |
| 5:00 AM to 5:29 AM | 178 (6.6%) | 82 (3.4%) |
| 5:30 AM to 5:59 AM | 254 (9.5%) | 118 (4.8%) |
| 6:00 AM to 6:29 AM | 170 (6.3%) | 274 (11.2%) |
| 6:30 AM to 6:59 AM | 200 (7.4%) | 271 (11.1%) |
| 7:00 AM to 7:29 AM | 384 (14.3%) | 516 (21.1%) |
| 7:30 AM to 7:59 AM | 226 (8.4%) | 419 (17.1%) |
| 8:00 AM to 8:29 AM | 151 (5.6%) | 288 (11.8%) |
| 8:30 AM to 8:59 AM | 17 (0.6%) | 75 (3.1%) |
| 9:00 AM to 9:59 AM | 47 (1.8%) | 37 (1.5%) |
| 10:00 AM to 10:59 AM | 150 (5.6%) | 120 (4.9%) |
| 11:00 AM to 11:59 AM | 30 (1.1%) | 35 (1.4%) |
| 12:00 PM to 3:59 PM | 354 (13.2%) | 44 (1.8%) |
| 4:00 PM to 11:59 PM | 321 (12.0%) | 148 (6.1%) |
| Total | 2,684 (100.0%) | 2,444 (100.0%) |
Housing Occupancy in Claremont
Occupancy by Ownership in Claremont
Of the total 5,203 dwellings in Claremont, owner-occupied units account for 3,082 (59.2%), while renter-occupied units make up 2,121 (40.8%).
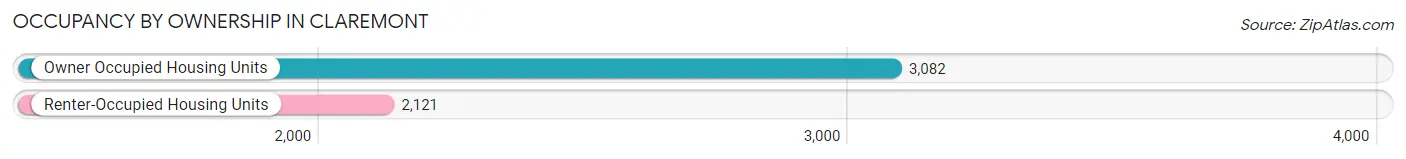
| Occupancy | # Housing Units | % Housing Units |
| Owner Occupied Housing Units | 3,082 | 59.2% |
| Renter-Occupied Housing Units | 2,121 | 40.8% |
| Total Occupied Housing Units | 5,203 | 100.0% |
Occupancy by Household Size in Claremont
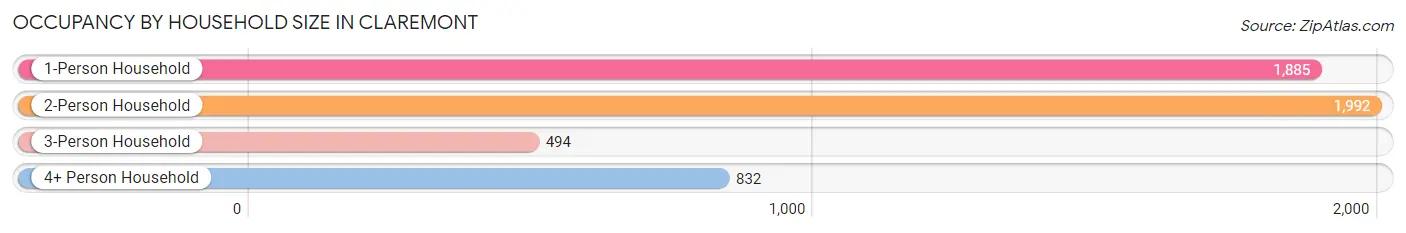
| Household Size | # Housing Units | % Housing Units |
| 1-Person Household | 1,885 | 36.2% |
| 2-Person Household | 1,992 | 38.3% |
| 3-Person Household | 494 | 9.5% |
| 4+ Person Household | 832 | 16.0% |
| Total Housing Units | 5,203 | 100.0% |
Occupancy by Ownership by Household Size in Claremont
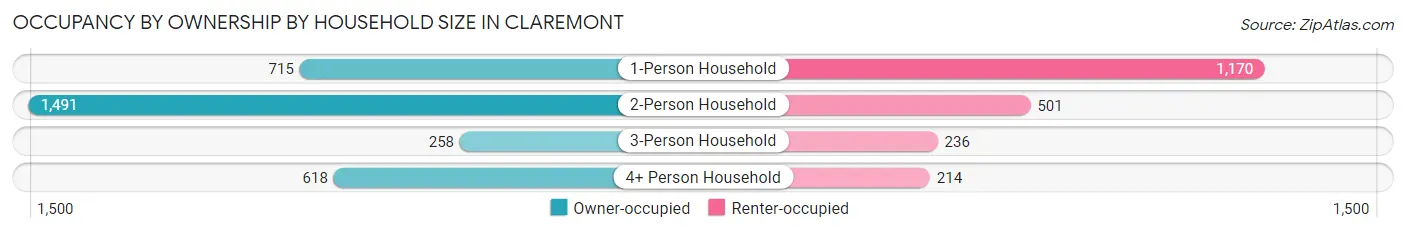
| Household Size | Owner-occupied | Renter-occupied |
| 1-Person Household | 715 (37.9%) | 1,170 (62.1%) |
| 2-Person Household | 1,491 (74.9%) | 501 (25.2%) |
| 3-Person Household | 258 (52.2%) | 236 (47.8%) |
| 4+ Person Household | 618 (74.3%) | 214 (25.7%) |
| Total Housing Units | 3,082 (59.2%) | 2,121 (40.8%) |
Occupancy by Educational Attainment in Claremont
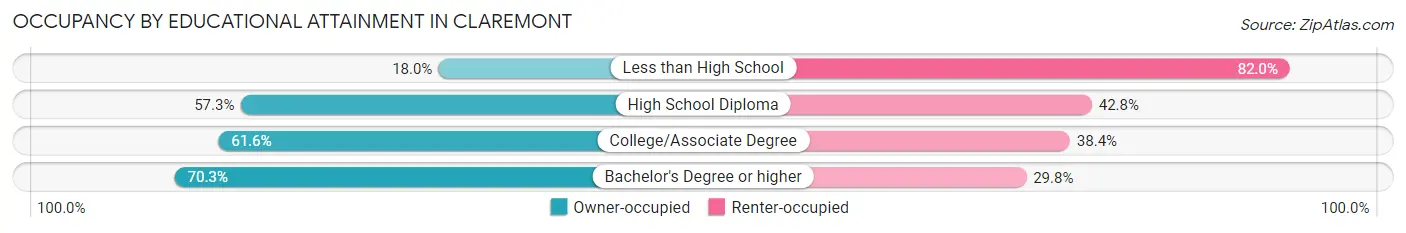
| Household Size | Owner-occupied | Renter-occupied |
| Less than High School | 63 (18.0%) | 287 (82.0%) |
| High School Diploma | 1,165 (57.3%) | 870 (42.7%) |
| College/Associate Degree | 893 (61.6%) | 557 (38.4%) |
| Bachelor's Degree or higher | 961 (70.3%) | 407 (29.7%) |
Occupancy by Age of Householder in Claremont
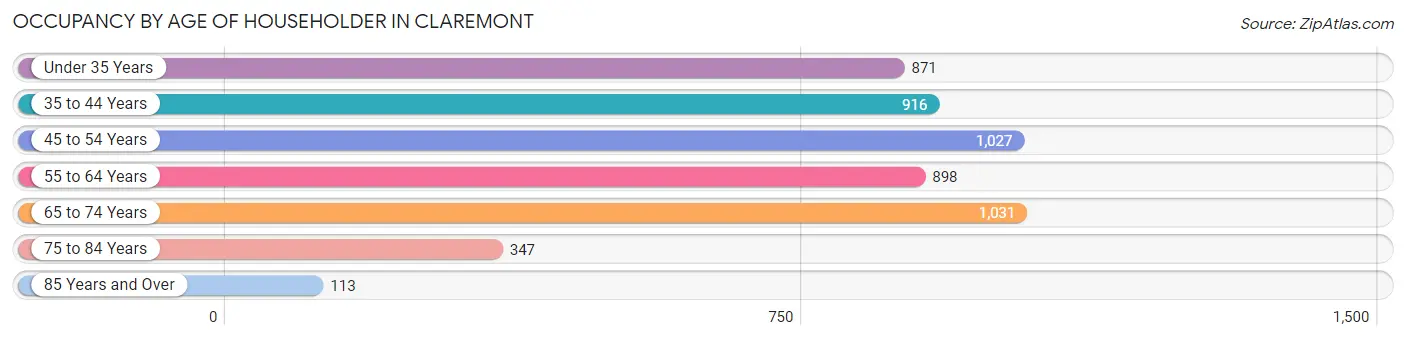
| Age Bracket | # Households | % Households |
| Under 35 Years | 871 | 16.7% |
| 35 to 44 Years | 916 | 17.6% |
| 45 to 54 Years | 1,027 | 19.7% |
| 55 to 64 Years | 898 | 17.3% |
| 65 to 74 Years | 1,031 | 19.8% |
| 75 to 84 Years | 347 | 6.7% |
| 85 Years and Over | 113 | 2.2% |
| Total | 5,203 | 100.0% |
Housing Finances in Claremont
Median Income by Occupancy in Claremont
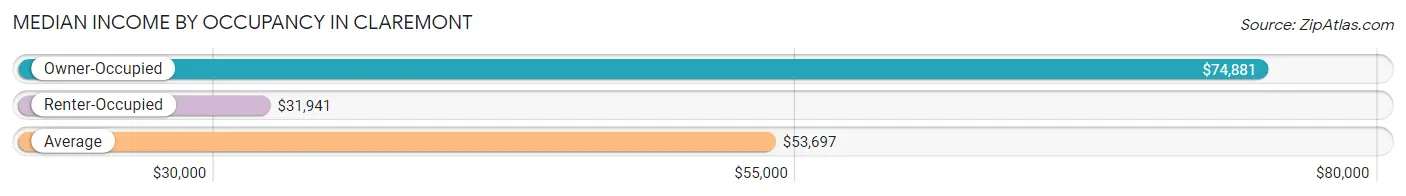
| Occupancy Type | # Households | Median Income |
| Owner-Occupied | 3,082 (59.2%) | $74,881 |
| Renter-Occupied | 2,121 (40.8%) | $31,941 |
| Average | 5,203 (100.0%) | $53,697 |
Occupancy by Householder Income Bracket in Claremont
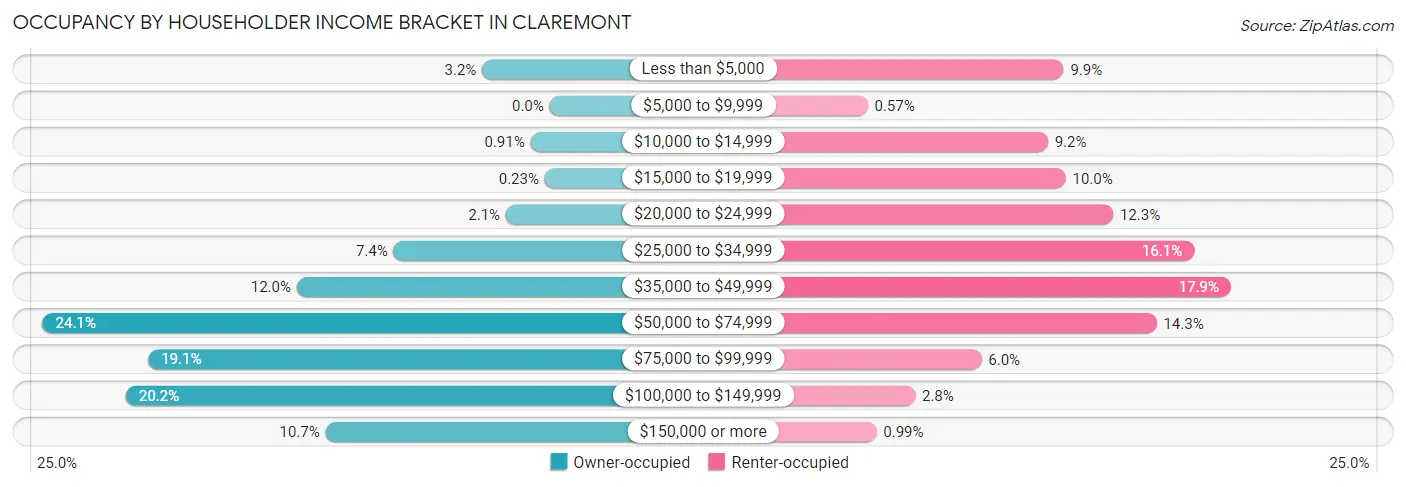
| Income Bracket | Owner-occupied | Renter-occupied |
| Less than $5,000 | 99 (3.2%) | 210 (9.9%) |
| $5,000 to $9,999 | 0 (0.0%) | 12 (0.6%) |
| $10,000 to $14,999 | 28 (0.9%) | 194 (9.1%) |
| $15,000 to $19,999 | 7 (0.2%) | 212 (10.0%) |
| $20,000 to $24,999 | 64 (2.1%) | 260 (12.3%) |
| $25,000 to $34,999 | 229 (7.4%) | 342 (16.1%) |
| $35,000 to $49,999 | 371 (12.0%) | 379 (17.9%) |
| $50,000 to $74,999 | 744 (24.1%) | 304 (14.3%) |
| $75,000 to $99,999 | 589 (19.1%) | 127 (6.0%) |
| $100,000 to $149,999 | 622 (20.2%) | 60 (2.8%) |
| $150,000 or more | 329 (10.7%) | 21 (1.0%) |
| Total | 3,082 (100.0%) | 2,121 (100.0%) |
Monthly Housing Cost Tiers in Claremont
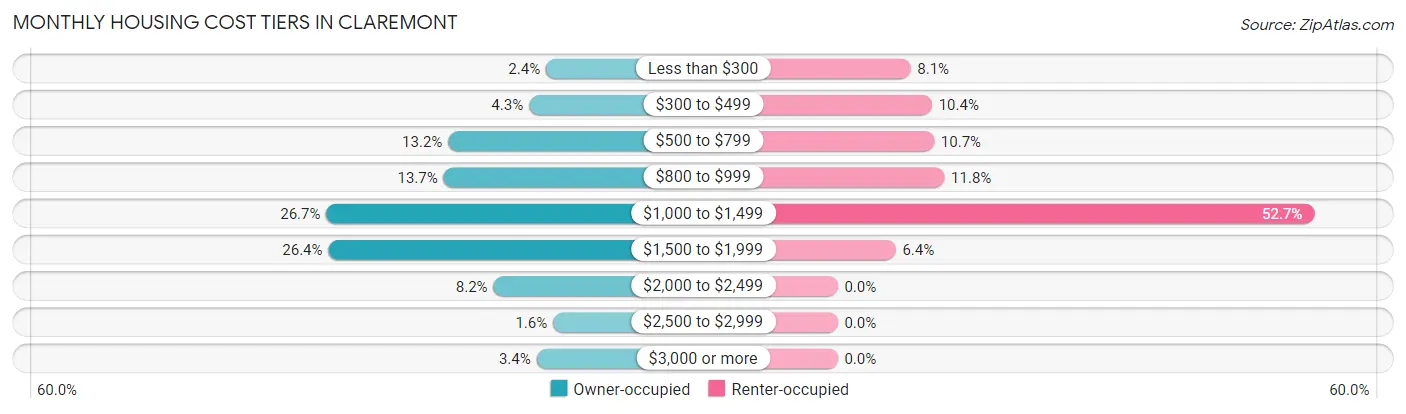
| Monthly Cost | Owner-occupied | Renter-occupied |
| Less than $300 | 74 (2.4%) | 171 (8.1%) |
| $300 to $499 | 132 (4.3%) | 221 (10.4%) |
| $500 to $799 | 407 (13.2%) | 226 (10.7%) |
| $800 to $999 | 423 (13.7%) | 250 (11.8%) |
| $1,000 to $1,499 | 822 (26.7%) | 1,117 (52.7%) |
| $1,500 to $1,999 | 815 (26.4%) | 136 (6.4%) |
| $2,000 to $2,499 | 253 (8.2%) | 0 (0.0%) |
| $2,500 to $2,999 | 50 (1.6%) | 0 (0.0%) |
| $3,000 or more | 106 (3.4%) | 0 (0.0%) |
| Total | 3,082 (100.0%) | 2,121 (100.0%) |
Physical Housing Characteristics in Claremont
Housing Structures in Claremont
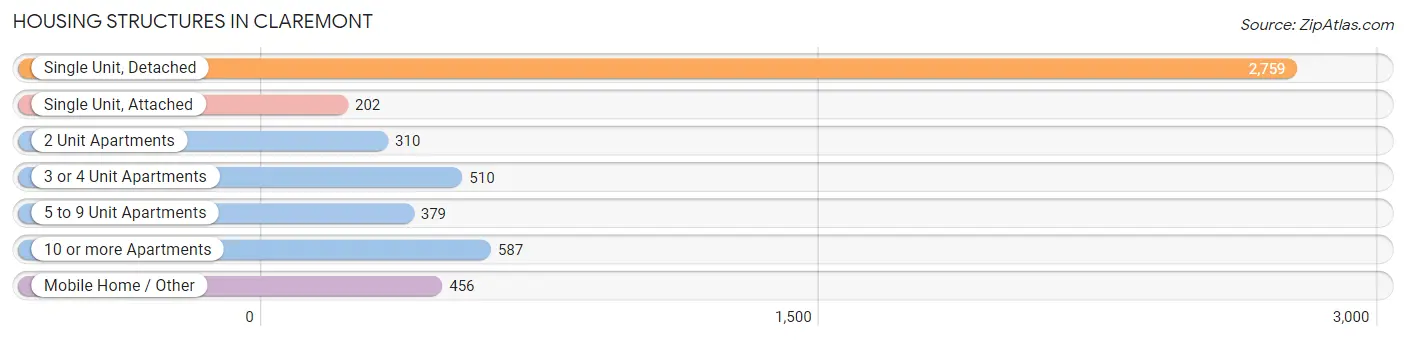
| Structure Type | # Housing Units | % Housing Units |
| Single Unit, Detached | 2,759 | 53.0% |
| Single Unit, Attached | 202 | 3.9% |
| 2 Unit Apartments | 310 | 6.0% |
| 3 or 4 Unit Apartments | 510 | 9.8% |
| 5 to 9 Unit Apartments | 379 | 7.3% |
| 10 or more Apartments | 587 | 11.3% |
| Mobile Home / Other | 456 | 8.8% |
| Total | 5,203 | 100.0% |
Housing Structures by Occupancy in Claremont
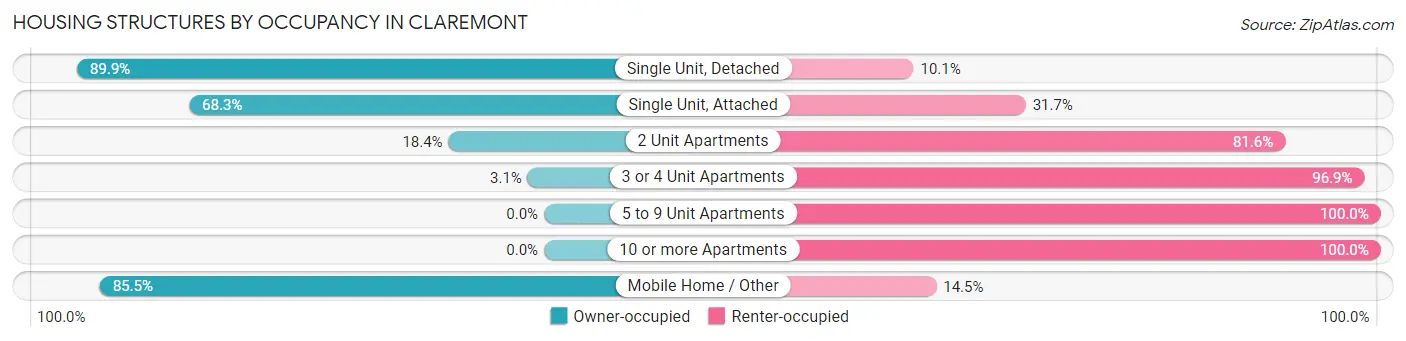
| Structure Type | Owner-occupied | Renter-occupied |
| Single Unit, Detached | 2,481 (89.9%) | 278 (10.1%) |
| Single Unit, Attached | 138 (68.3%) | 64 (31.7%) |
| 2 Unit Apartments | 57 (18.4%) | 253 (81.6%) |
| 3 or 4 Unit Apartments | 16 (3.1%) | 494 (96.9%) |
| 5 to 9 Unit Apartments | 0 (0.0%) | 379 (100.0%) |
| 10 or more Apartments | 0 (0.0%) | 587 (100.0%) |
| Mobile Home / Other | 390 (85.5%) | 66 (14.5%) |
| Total | 3,082 (59.2%) | 2,121 (40.8%) |
Housing Structures by Number of Rooms in Claremont
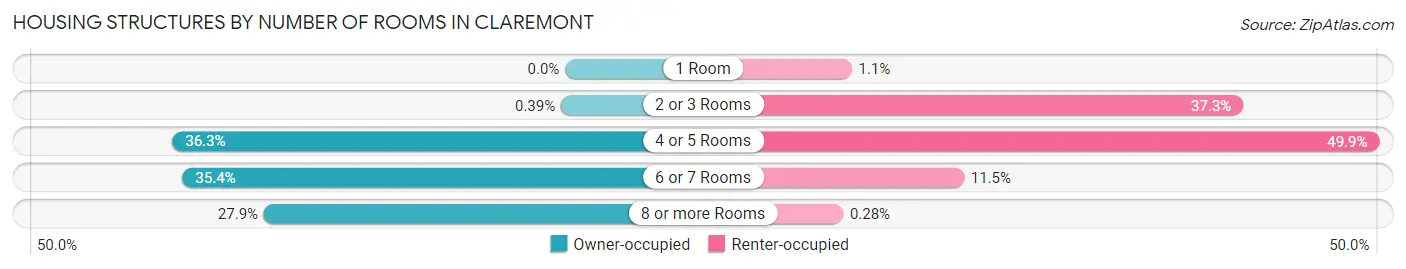
| Number of Rooms | Owner-occupied | Renter-occupied |
| 1 Room | 0 (0.0%) | 23 (1.1%) |
| 2 or 3 Rooms | 12 (0.4%) | 791 (37.3%) |
| 4 or 5 Rooms | 1,120 (36.3%) | 1,058 (49.9%) |
| 6 or 7 Rooms | 1,091 (35.4%) | 243 (11.5%) |
| 8 or more Rooms | 859 (27.9%) | 6 (0.3%) |
| Total | 3,082 (100.0%) | 2,121 (100.0%) |
Housing Structure by Heating Type in Claremont
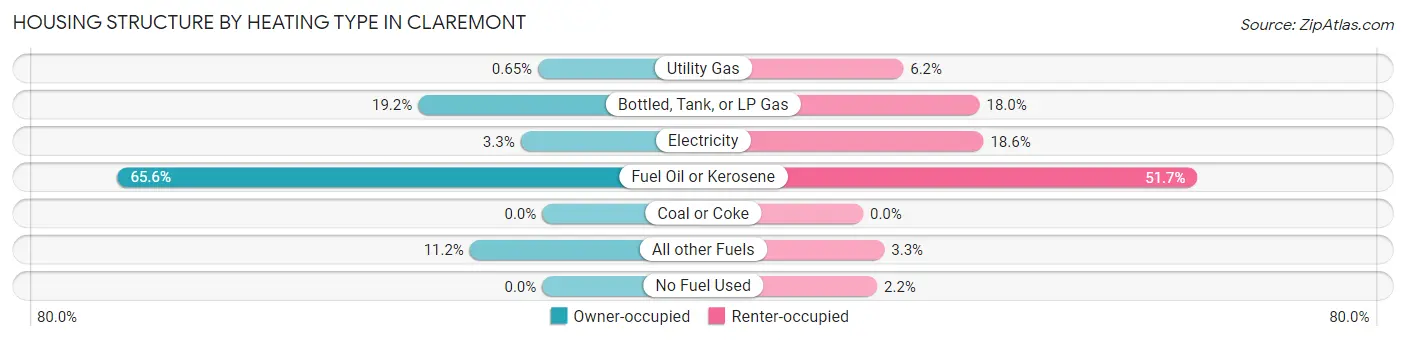
| Heating Type | Owner-occupied | Renter-occupied |
| Utility Gas | 20 (0.6%) | 132 (6.2%) |
| Bottled, Tank, or LP Gas | 591 (19.2%) | 382 (18.0%) |
| Electricity | 103 (3.3%) | 395 (18.6%) |
| Fuel Oil or Kerosene | 2,023 (65.6%) | 1,096 (51.7%) |
| Coal or Coke | 0 (0.0%) | 0 (0.0%) |
| All other Fuels | 345 (11.2%) | 70 (3.3%) |
| No Fuel Used | 0 (0.0%) | 46 (2.2%) |
| Total | 3,082 (100.0%) | 2,121 (100.0%) |
Household Vehicle Usage in Claremont
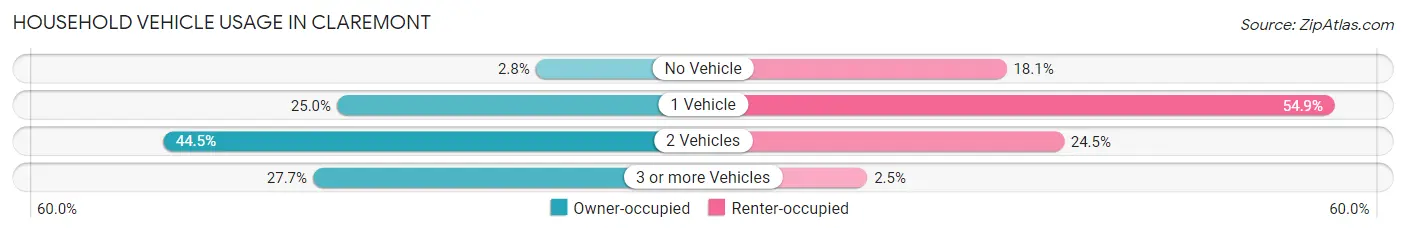
| Vehicles per Household | Owner-occupied | Renter-occupied |
| No Vehicle | 85 (2.8%) | 384 (18.1%) |
| 1 Vehicle | 771 (25.0%) | 1,164 (54.9%) |
| 2 Vehicles | 1,372 (44.5%) | 520 (24.5%) |
| 3 or more Vehicles | 854 (27.7%) | 53 (2.5%) |
| Total | 3,082 (100.0%) | 2,121 (100.0%) |
Real Estate & Mortgages in Claremont
Real Estate and Mortgage Overview in Claremont
| Characteristic | Without Mortgage | With Mortgage |
| Housing Units | 1,352 | 1,730 |
| Median Property Value | $143,400 | $163,500 |
| Median Household Income | $58,801 | $229 |
| Monthly Housing Costs | $863 | $106 |
| Real Estate Taxes | $5,264 | $30 |
Property Value by Mortgage Status in Claremont
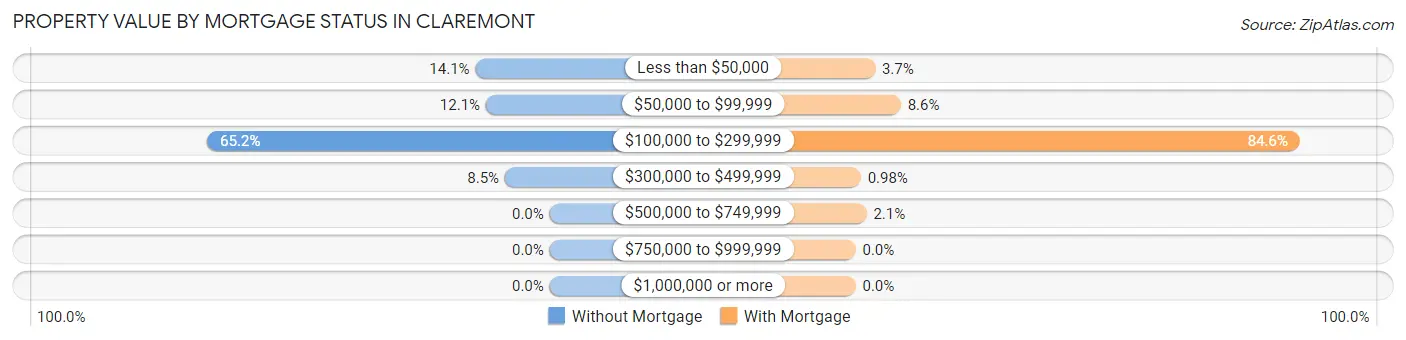
| Property Value | Without Mortgage | With Mortgage |
| Less than $50,000 | 191 (14.1%) | 64 (3.7%) |
| $50,000 to $99,999 | 164 (12.1%) | 149 (8.6%) |
| $100,000 to $299,999 | 882 (65.2%) | 1,464 (84.6%) |
| $300,000 to $499,999 | 115 (8.5%) | 17 (1.0%) |
| $500,000 to $749,999 | 0 (0.0%) | 36 (2.1%) |
| $750,000 to $999,999 | 0 (0.0%) | 0 (0.0%) |
| $1,000,000 or more | 0 (0.0%) | 0 (0.0%) |
| Total | 1,352 (100.0%) | 1,730 (100.0%) |
Household Income by Mortgage Status in Claremont
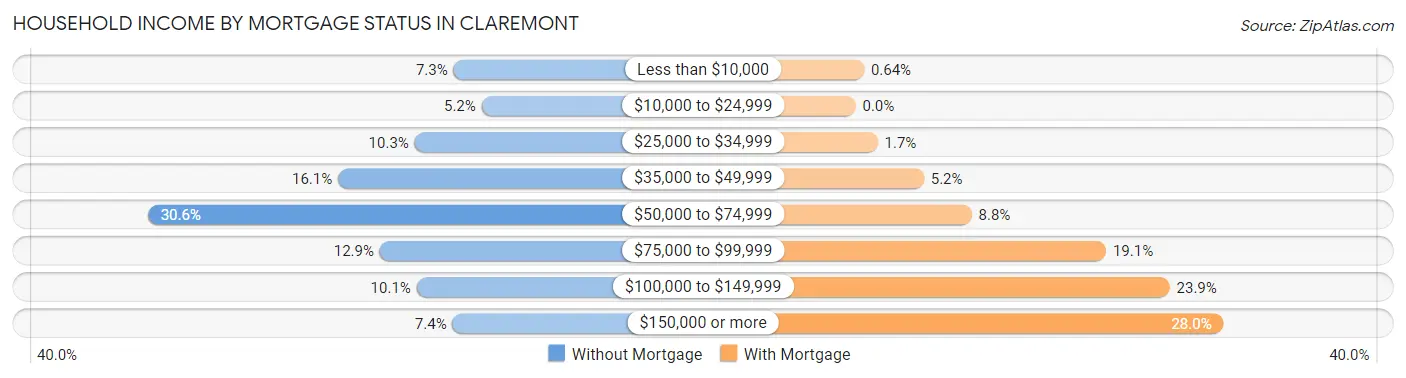
| Household Income | Without Mortgage | With Mortgage |
| Less than $10,000 | 99 (7.3%) | 11 (0.6%) |
| $10,000 to $24,999 | 70 (5.2%) | 0 (0.0%) |
| $25,000 to $34,999 | 139 (10.3%) | 29 (1.7%) |
| $35,000 to $49,999 | 218 (16.1%) | 90 (5.2%) |
| $50,000 to $74,999 | 414 (30.6%) | 153 (8.8%) |
| $75,000 to $99,999 | 175 (12.9%) | 330 (19.1%) |
| $100,000 to $149,999 | 137 (10.1%) | 414 (23.9%) |
| $150,000 or more | 100 (7.4%) | 485 (28.0%) |
| Total | 1,352 (100.0%) | 1,730 (100.0%) |
Property Value to Household Income Ratio in Claremont
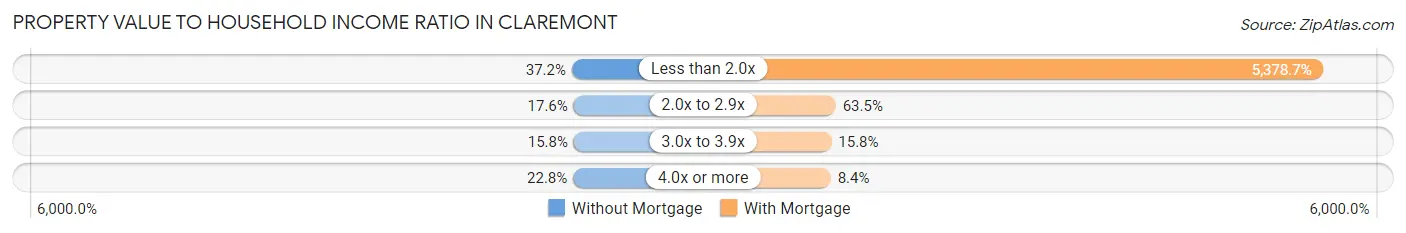
| Value-to-Income Ratio | Without Mortgage | With Mortgage |
| Less than 2.0x | 503 (37.2%) | 93,051 (5,378.7%) |
| 2.0x to 2.9x | 238 (17.6%) | 1,099 (63.5%) |
| 3.0x to 3.9x | 213 (15.8%) | 273 (15.8%) |
| 4.0x or more | 308 (22.8%) | 146 (8.4%) |
| Total | 1,352 (100.0%) | 1,730 (100.0%) |
Real Estate Taxes by Mortgage Status in Claremont
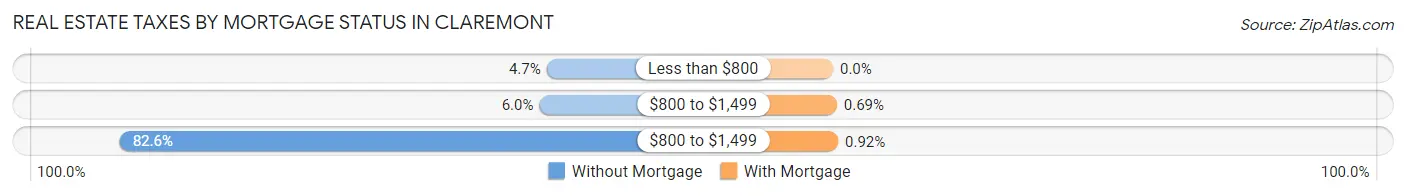
| Property Taxes | Without Mortgage | With Mortgage |
| Less than $800 | 63 (4.7%) | 0 (0.0%) |
| $800 to $1,499 | 81 (6.0%) | 12 (0.7%) |
| $800 to $1,499 | 1,117 (82.6%) | 16 (0.9%) |
| Total | 1,352 (100.0%) | 1,730 (100.0%) |
Health & Disability in Claremont
Health Insurance Coverage by Age in Claremont
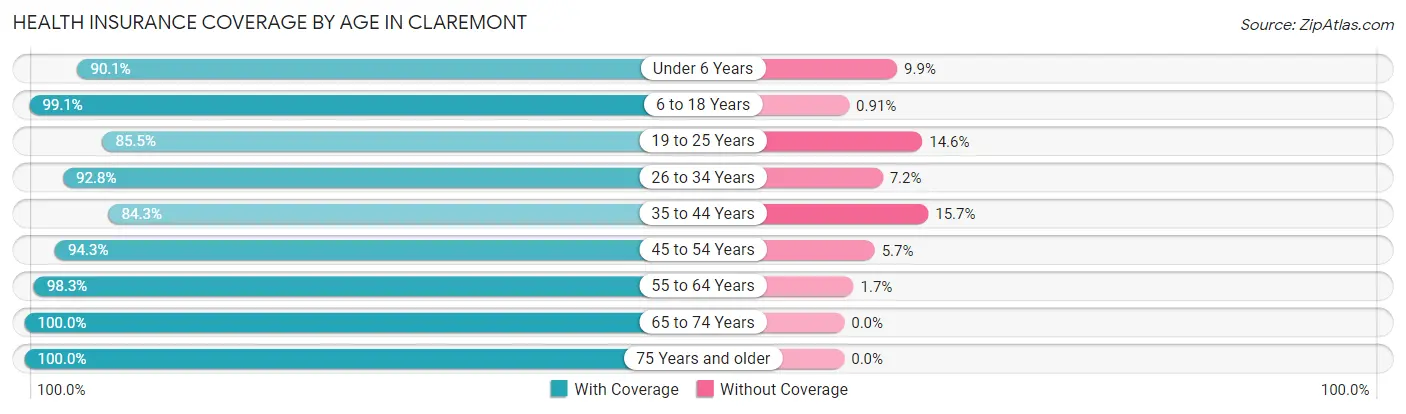
| Age Bracket | With Coverage | Without Coverage |
| Under 6 Years | 768 (90.1%) | 84 (9.9%) |
| 6 to 18 Years | 1,857 (99.1%) | 17 (0.9%) |
| 19 to 25 Years | 740 (85.5%) | 126 (14.5%) |
| 26 to 34 Years | 1,411 (92.8%) | 109 (7.2%) |
| 35 to 44 Years | 1,356 (84.3%) | 252 (15.7%) |
| 45 to 54 Years | 1,908 (94.3%) | 115 (5.7%) |
| 55 to 64 Years | 1,580 (98.3%) | 28 (1.7%) |
| 65 to 74 Years | 1,823 (100.0%) | 0 (0.0%) |
| 75 Years and older | 792 (100.0%) | 0 (0.0%) |
| Total | 12,235 (94.4%) | 731 (5.6%) |
Health Insurance Coverage by Citizenship Status in Claremont
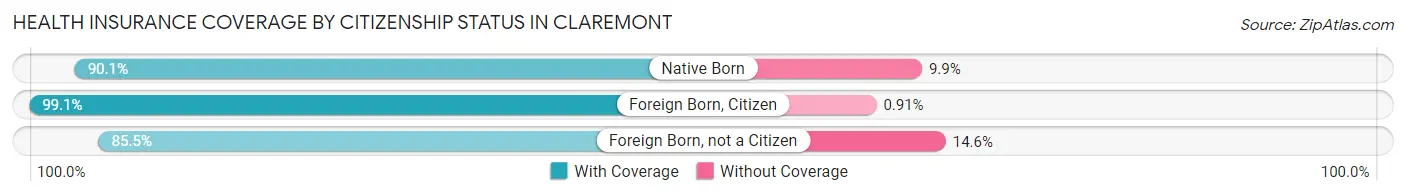
| Citizenship Status | With Coverage | Without Coverage |
| Native Born | 768 (90.1%) | 84 (9.9%) |
| Foreign Born, Citizen | 1,857 (99.1%) | 17 (0.9%) |
| Foreign Born, not a Citizen | 740 (85.5%) | 126 (14.5%) |
Health Insurance Coverage by Household Income in Claremont
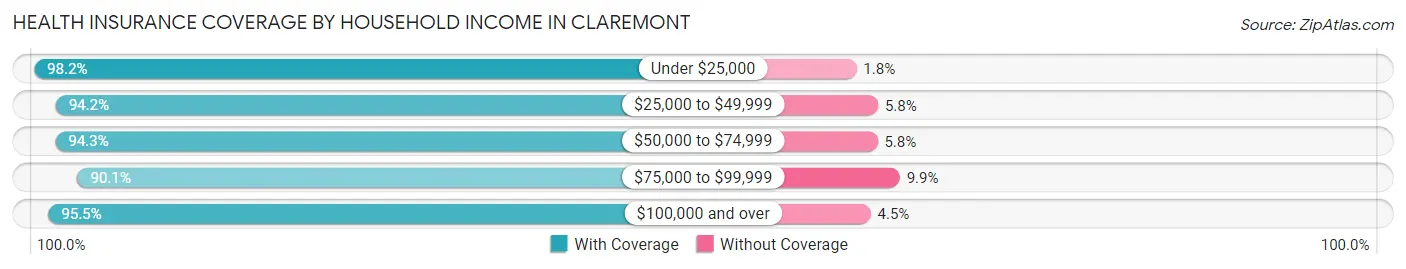
| Household Income | With Coverage | Without Coverage |
| Under $25,000 | 1,856 (98.2%) | 34 (1.8%) |
| $25,000 to $49,999 | 2,420 (94.2%) | 150 (5.8%) |
| $50,000 to $74,999 | 2,491 (94.3%) | 152 (5.8%) |
| $75,000 to $99,999 | 2,006 (90.1%) | 221 (9.9%) |
| $100,000 and over | 3,341 (95.5%) | 156 (4.5%) |
Public vs Private Health Insurance Coverage by Age in Claremont
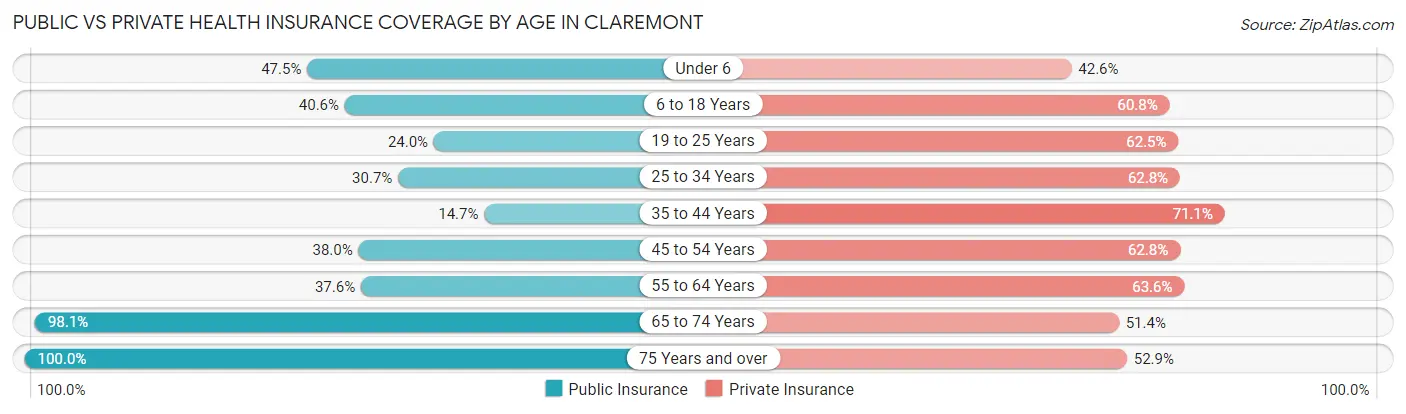
| Age Bracket | Public Insurance | Private Insurance |
| Under 6 | 405 (47.5%) | 363 (42.6%) |
| 6 to 18 Years | 760 (40.6%) | 1,140 (60.8%) |
| 19 to 25 Years | 208 (24.0%) | 541 (62.5%) |
| 25 to 34 Years | 466 (30.7%) | 954 (62.8%) |
| 35 to 44 Years | 236 (14.7%) | 1,143 (71.1%) |
| 45 to 54 Years | 769 (38.0%) | 1,270 (62.8%) |
| 55 to 64 Years | 604 (37.6%) | 1,022 (63.6%) |
| 65 to 74 Years | 1,788 (98.1%) | 937 (51.4%) |
| 75 Years and over | 792 (100.0%) | 419 (52.9%) |
| Total | 6,028 (46.5%) | 7,789 (60.1%) |
Disability Status by Sex by Age in Claremont
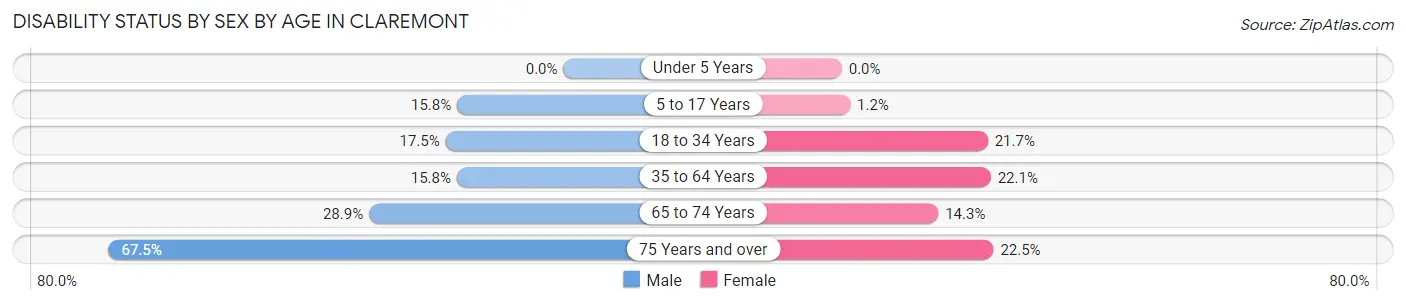
| Age Bracket | Male | Female |
| Under 5 Years | 0 (0.0%) | 0 (0.0%) |
| 5 to 17 Years | 138 (15.8%) | 12 (1.2%) |
| 18 to 34 Years | 237 (17.5%) | 259 (21.7%) |
| 35 to 64 Years | 434 (15.8%) | 552 (22.1%) |
| 65 to 74 Years | 258 (28.9%) | 133 (14.3%) |
| 75 Years and over | 235 (67.5%) | 100 (22.5%) |
Disability Class by Sex by Age in Claremont
Disability Class: Hearing Difficulty
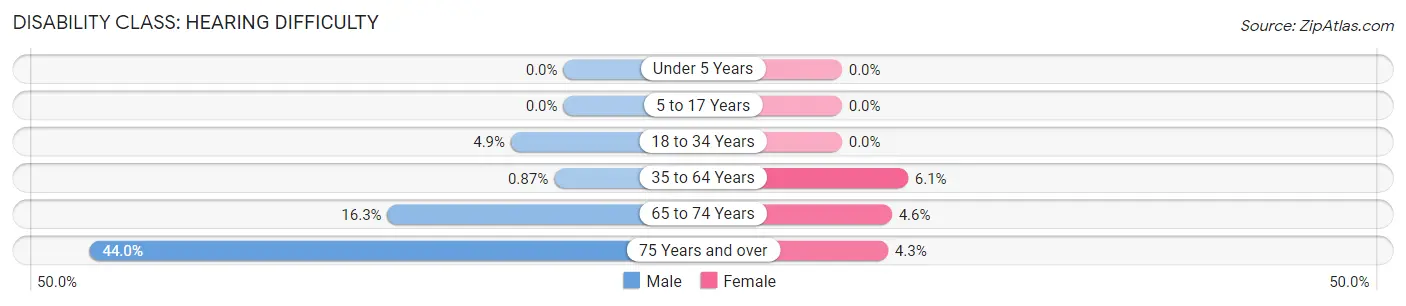
| Age Bracket | Male | Female |
| Under 5 Years | 0 (0.0%) | 0 (0.0%) |
| 5 to 17 Years | 0 (0.0%) | 0 (0.0%) |
| 18 to 34 Years | 66 (4.9%) | 0 (0.0%) |
| 35 to 64 Years | 24 (0.9%) | 153 (6.1%) |
| 65 to 74 Years | 146 (16.3%) | 43 (4.6%) |
| 75 Years and over | 153 (44.0%) | 19 (4.3%) |
Disability Class: Vision Difficulty
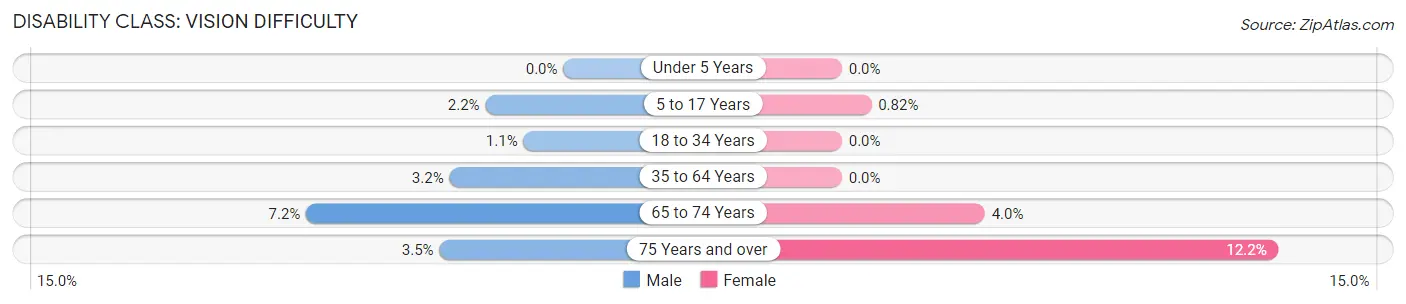
| Age Bracket | Male | Female |
| Under 5 Years | 0 (0.0%) | 0 (0.0%) |
| 5 to 17 Years | 19 (2.2%) | 8 (0.8%) |
| 18 to 34 Years | 15 (1.1%) | 0 (0.0%) |
| 35 to 64 Years | 87 (3.2%) | 0 (0.0%) |
| 65 to 74 Years | 64 (7.2%) | 37 (4.0%) |
| 75 Years and over | 12 (3.5%) | 54 (12.2%) |
Disability Class: Cognitive Difficulty
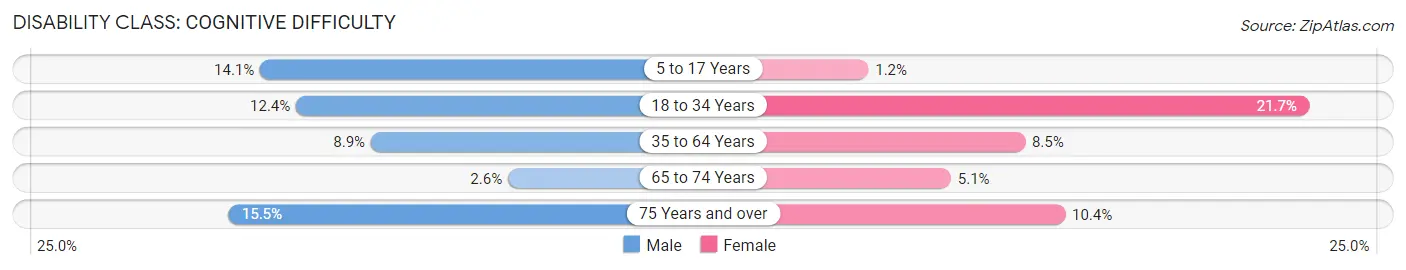
| Age Bracket | Male | Female |
| 5 to 17 Years | 123 (14.1%) | 12 (1.2%) |
| 18 to 34 Years | 168 (12.4%) | 259 (21.7%) |
| 35 to 64 Years | 245 (8.9%) | 212 (8.5%) |
| 65 to 74 Years | 23 (2.6%) | 47 (5.1%) |
| 75 Years and over | 54 (15.5%) | 46 (10.4%) |
Disability Class: Ambulatory Difficulty
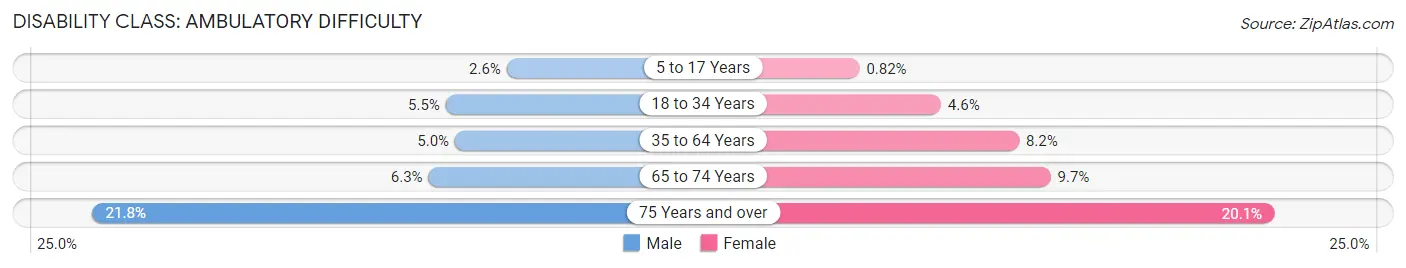
| Age Bracket | Male | Female |
| 5 to 17 Years | 23 (2.6%) | 8 (0.8%) |
| 18 to 34 Years | 74 (5.5%) | 55 (4.6%) |
| 35 to 64 Years | 138 (5.0%) | 205 (8.2%) |
| 65 to 74 Years | 56 (6.3%) | 90 (9.7%) |
| 75 Years and over | 76 (21.8%) | 89 (20.1%) |
Disability Class: Self-Care Difficulty
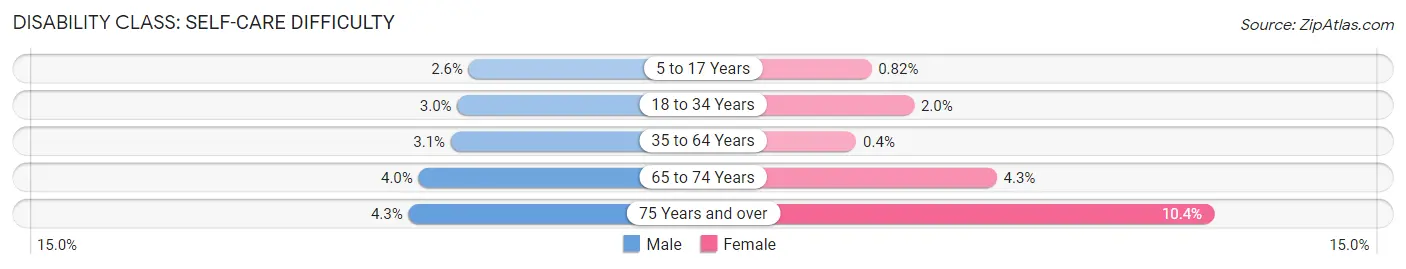
| Age Bracket | Male | Female |
| 5 to 17 Years | 23 (2.6%) | 8 (0.8%) |
| 18 to 34 Years | 40 (2.9%) | 24 (2.0%) |
| 35 to 64 Years | 86 (3.1%) | 10 (0.4%) |
| 65 to 74 Years | 36 (4.0%) | 40 (4.3%) |
| 75 Years and over | 15 (4.3%) | 46 (10.4%) |
Technology Access in Claremont
Computing Device Access in Claremont
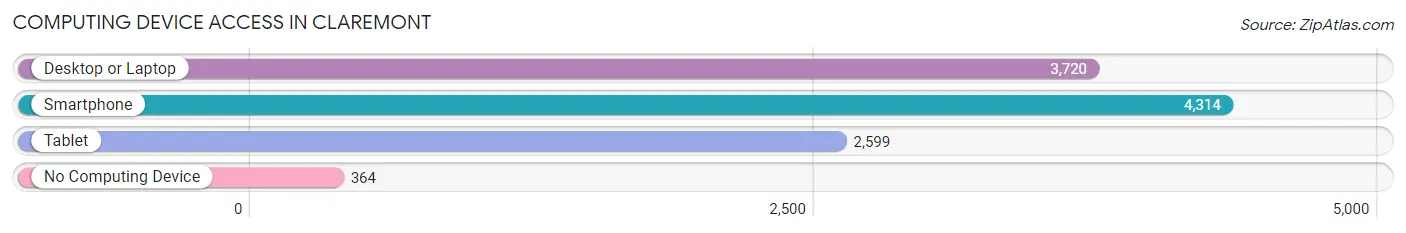
| Device Type | # Households | % Households |
| Desktop or Laptop | 3,720 | 71.5% |
| Smartphone | 4,314 | 82.9% |
| Tablet | 2,599 | 49.9% |
| No Computing Device | 364 | 7.0% |
| Total | 5,203 | 100.0% |
Internet Access in Claremont
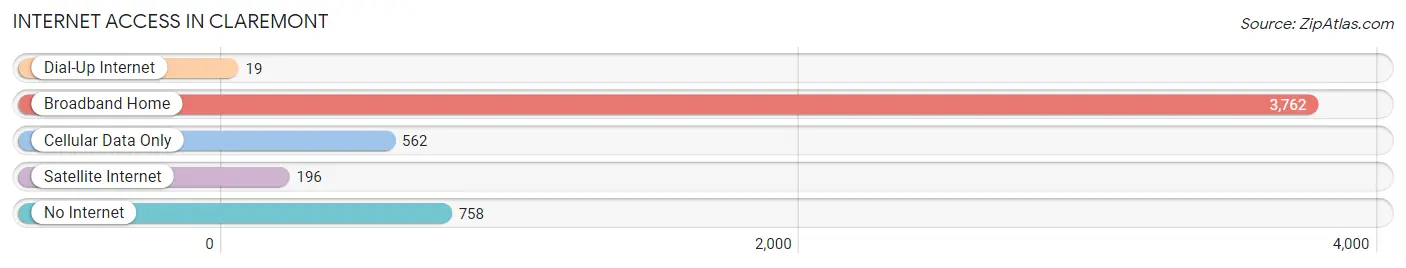
| Internet Type | # Households | % Households |
| Dial-Up Internet | 19 | 0.4% |
| Broadband Home | 3,762 | 72.3% |
| Cellular Data Only | 562 | 10.8% |
| Satellite Internet | 196 | 3.8% |
| No Internet | 758 | 14.6% |
| Total | 5,203 | 100.0% |
Claremont Summary
Claremont is a city located in Sullivan County, New Hampshire, United States. The population was 13,355 at the 2010 census. It is the county seat of Sullivan County. Claremont is part of the Lebanon, NH–VT Micropolitan Statistical Area.
History
Claremont was first settled in 1764 by a group of settlers from Connecticut. The town was originally known as "Upper Ashuelot" and was part of the town of Charlestown. In 1767, the town was incorporated as "Claremont" after the Earl of Claremont, a British nobleman.
The town grew rapidly in the late 18th and early 19th centuries, due to its location on the Connecticut River. The river provided a means of transportation for goods and people, and the town became a center of trade and industry. The town was home to several mills, including a paper mill, a woolen mill, and a grist mill.
In the mid-19th century, the town was a major stop on the Underground Railroad, with many escaped slaves passing through on their way to freedom in Canada.
Geography
Claremont is located in the Connecticut River Valley in southwestern New Hampshire. The city is situated on the east bank of the Connecticut River, just south of the Massachusetts border. The city is bordered to the north by the town of Charlestown, to the east by the town of Unity, to the south by the town of Cornish, and to the west by the town of Plainfield.
The city has a total area of 11.2 square miles, of which 10.9 square miles is land and 0.3 square miles is water. The city is located in the Connecticut River Valley, and is surrounded by hills and mountains. The highest point in the city is the summit of Mount Ascutney, which has an elevation of 3,144 feet.
Economy
Claremont is a small city with a diverse economy. The city is home to several manufacturing companies, including a paper mill, a woolen mill, and a grist mill. The city is also home to several retail stores, restaurants, and other businesses.
The city is also home to several educational institutions, including the River Valley Community College and the New Hampshire Technical Institute.
Demographics
As of the 2010 census, there were 13,355 people, 5,541 households, and 3,541 families residing in the city. The population density was 1,219.3 people per square mile. There were 5,945 housing units at an average density of 545.3 per square mile. The racial makeup of the city was 94.2% White, 1.3% African American, 0.4% Native American, 0.9% Asian, 0.1% Pacific Islander, 1.2% from other races, and 2.0% from two or more races. Hispanic or Latino of any race were 3.2% of the population.
The median income for a household in the city was $41,945, and the median income for a family was $51,945. Males had a median income of $37,945 versus $30,945 for females. The per capita income for the city was $20,945. About 8.2% of families and 11.2% of the population were below the poverty line, including 15.2% of those under age 18 and 8.2% of those age 65 or over.
Common Questions
What is Per Capita Income in Claremont?
Per Capita income in Claremont is $35,331.
What is the Median Family Income in Claremont?
Median Family Income in Claremont is $62,161.
What is the Median Household income in Claremont?
Median Household Income in Claremont is $53,697.
What is Income or Wage Gap in Claremont?
Income or Wage Gap in Claremont is 17.9%.
Women in Claremont earn 82.1 cents for every dollar earned by a man.
What is Inequality or Gini Index in Claremont?
Inequality or Gini Index in Claremont is 0.52.
What is the Total Population of Claremont?
Total Population of Claremont is 13,018.
What is the Total Male Population of Claremont?
Total Male Population of Claremont is 6,565.
What is the Total Female Population of Claremont?
Total Female Population of Claremont is 6,453.
What is the Ratio of Males per 100 Females in Claremont?
There are 101.74 Males per 100 Females in Claremont.
What is the Ratio of Females per 100 Males in Claremont?
There are 98.29 Females per 100 Males in Claremont.
What is the Median Population Age in Claremont?
Median Population Age in Claremont is 44.1 Years.
What is the Average Family Size in Claremont
Average Family Size in Claremont is 3.2 People.
What is the Average Household Size in Claremont
Average Household Size in Claremont is 2.5 People.
How Large is the Labor Force in Claremont?
There are 5,939 People in the Labor Forcein in Claremont.
What is the Percentage of People in the Labor Force in Claremont?
54.7% of People are in the Labor Force in Claremont.
What is the Unemployment Rate in Claremont?
Unemployment Rate in Claremont is 2.2%.