Laconia, NH Map & Demographics
Laconia Map
Laconia Overview
$39,171
PER CAPITA INCOME
$88,464
AVG FAMILY INCOME
$67,856
AVG HOUSEHOLD INCOME
27.0%
WAGE / INCOME GAP [ % ]
73.0¢/ $1
WAGE / INCOME GAP [ $ ]
$6,283
FAMILY INCOME DEFICIT
0.45
INEQUALITY / GINI INDEX
16,898
TOTAL POPULATION
8,397
MALE POPULATION
8,501
FEMALE POPULATION
98.78
MALES / 100 FEMALES
101.24
FEMALES / 100 MALES
43.7
MEDIAN AGE
3.0
AVG FAMILY SIZE
2.4
AVG HOUSEHOLD SIZE
9,171
LABOR FORCE [ PEOPLE ]
64.1%
PERCENT IN LABOR FORCE
3.1%
UNEMPLOYMENT RATE
Laconia Zip Codes
Laconia Area Codes
Income in Laconia
Income Overview in Laconia
Per Capita Income in Laconia is $39,171, while median incomes of families and households are $88,464 and $67,856 respectively.
| Characteristic | Number | Measure |
| Per Capita Income | 16,898 | $39,171 |
| Median Family Income | 4,057 | $88,464 |
| Mean Family Income | 4,057 | $104,762 |
| Median Household Income | 6,965 | $67,856 |
| Mean Household Income | 6,965 | $88,002 |
| Income Deficit | 4,057 | $6,283 |
| Wage / Income Gap (%) | 16,898 | 27.02% |
| Wage / Income Gap ($) | 16,898 | 72.98¢ per $1 |
| Gini / Inequality Index | 16,898 | 0.45 |
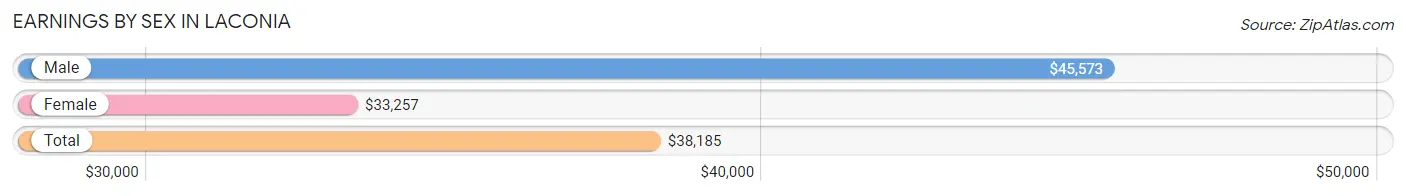
Earnings by Sex in Laconia
Average Earnings in Laconia are $38,185, $45,573 for men and $33,257 for women, a difference of 27.0%.
| Sex | Number | Average Earnings |
| Male | 4,963 (51.3%) | $45,573 |
| Female | 4,710 (48.7%) | $33,257 |
| Total | 9,673 (100.0%) | $38,185 |
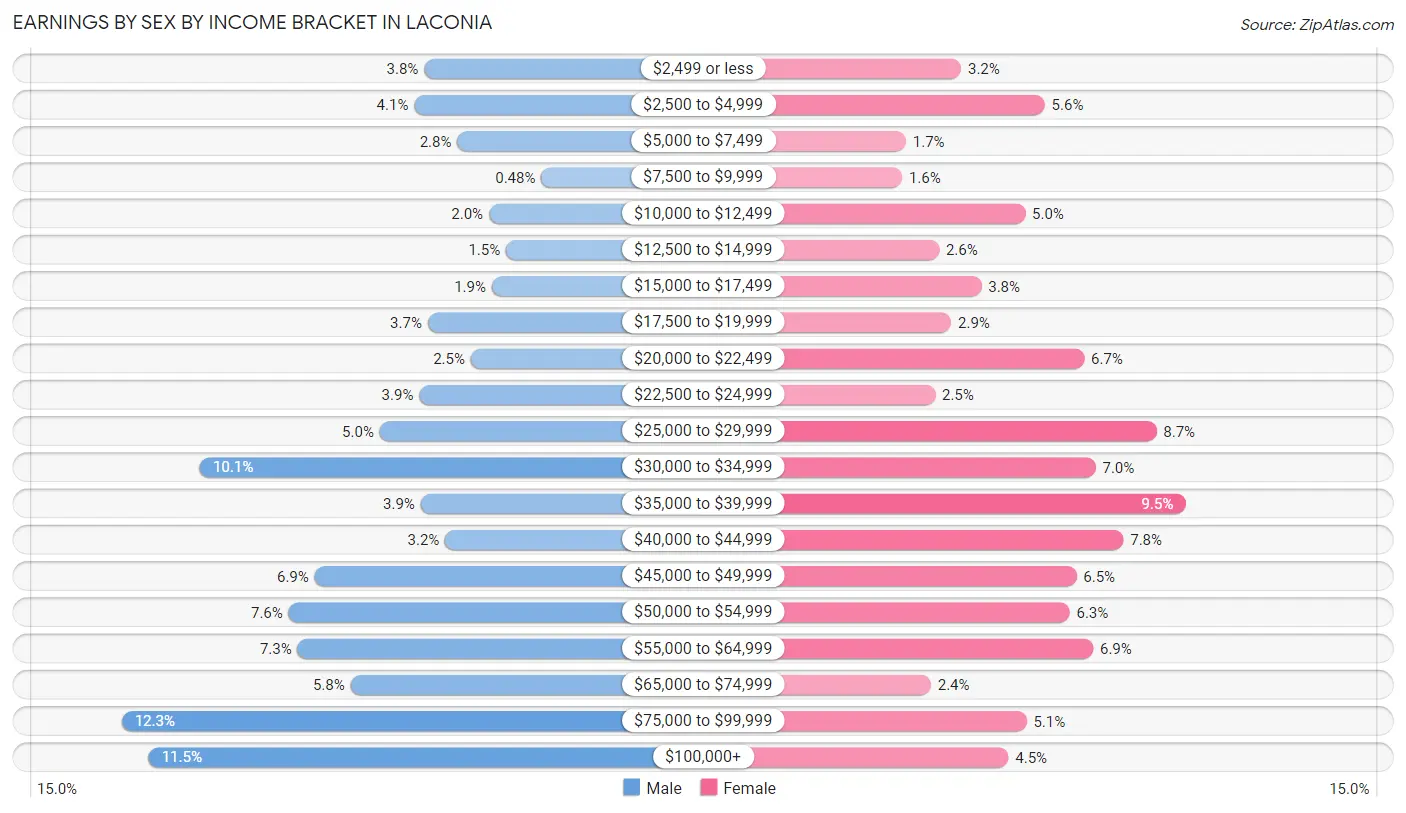
Earnings by Sex by Income Bracket in Laconia
The most common earnings brackets in Laconia are $75,000 to $99,999 for men (609 | 12.3%) and $35,000 to $39,999 for women (448 | 9.5%).
| Income | Male | Female |
| $2,499 or less | 187 (3.8%) | 151 (3.2%) |
| $2,500 to $4,999 | 201 (4.1%) | 262 (5.6%) |
| $5,000 to $7,499 | 141 (2.8%) | 78 (1.7%) |
| $7,500 to $9,999 | 24 (0.5%) | 73 (1.5%) |
| $10,000 to $12,499 | 97 (1.9%) | 236 (5.0%) |
| $12,500 to $14,999 | 73 (1.5%) | 122 (2.6%) |
| $15,000 to $17,499 | 93 (1.9%) | 178 (3.8%) |
| $17,500 to $19,999 | 182 (3.7%) | 138 (2.9%) |
| $20,000 to $22,499 | 122 (2.5%) | 314 (6.7%) |
| $22,500 to $24,999 | 194 (3.9%) | 117 (2.5%) |
| $25,000 to $29,999 | 249 (5.0%) | 410 (8.7%) |
| $30,000 to $34,999 | 500 (10.1%) | 329 (7.0%) |
| $35,000 to $39,999 | 192 (3.9%) | 448 (9.5%) |
| $40,000 to $44,999 | 158 (3.2%) | 366 (7.8%) |
| $45,000 to $49,999 | 340 (6.9%) | 304 (6.5%) |
| $50,000 to $54,999 | 376 (7.6%) | 295 (6.3%) |
| $55,000 to $64,999 | 364 (7.3%) | 326 (6.9%) |
| $65,000 to $74,999 | 290 (5.8%) | 111 (2.4%) |
| $75,000 to $99,999 | 609 (12.3%) | 238 (5.1%) |
| $100,000+ | 571 (11.5%) | 214 (4.5%) |
| Total | 4,963 (100.0%) | 4,710 (100.0%) |
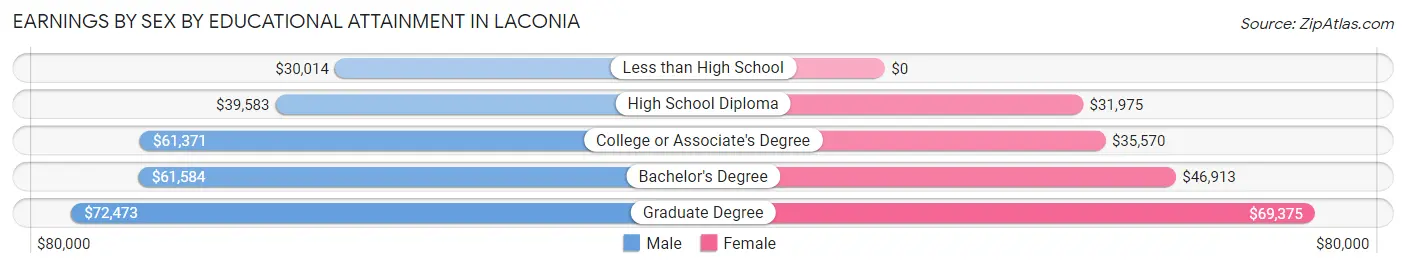
Earnings by Sex by Educational Attainment in Laconia
Average earnings in Laconia are $50,698 for men and $37,500 for women, a difference of 26.0%. Men with an educational attainment of graduate degree enjoy the highest average annual earnings of $72,473, while those with less than high school education earn the least with $30,014. Women with an educational attainment of graduate degree earn the most with the average annual earnings of $69,375, while those with high school diploma education have the smallest earnings of $31,975.
| Educational Attainment | Male Income | Female Income |
| Less than High School | $30,014 | $0 |
| High School Diploma | $39,583 | $31,975 |
| College or Associate's Degree | $61,371 | $35,570 |
| Bachelor's Degree | $61,584 | $46,913 |
| Graduate Degree | $72,473 | $69,375 |
| Total | $50,698 | $37,500 |
Family Income in Laconia
Family Income Brackets in Laconia
According to the Laconia family income data, there are 848 families falling into the $100,000 to $149,999 income range, which is the most common income bracket and makes up 20.9% of all families. Conversely, the less than $10,000 income bracket is the least frequent group with only 4 families (0.1%) belonging to this category.
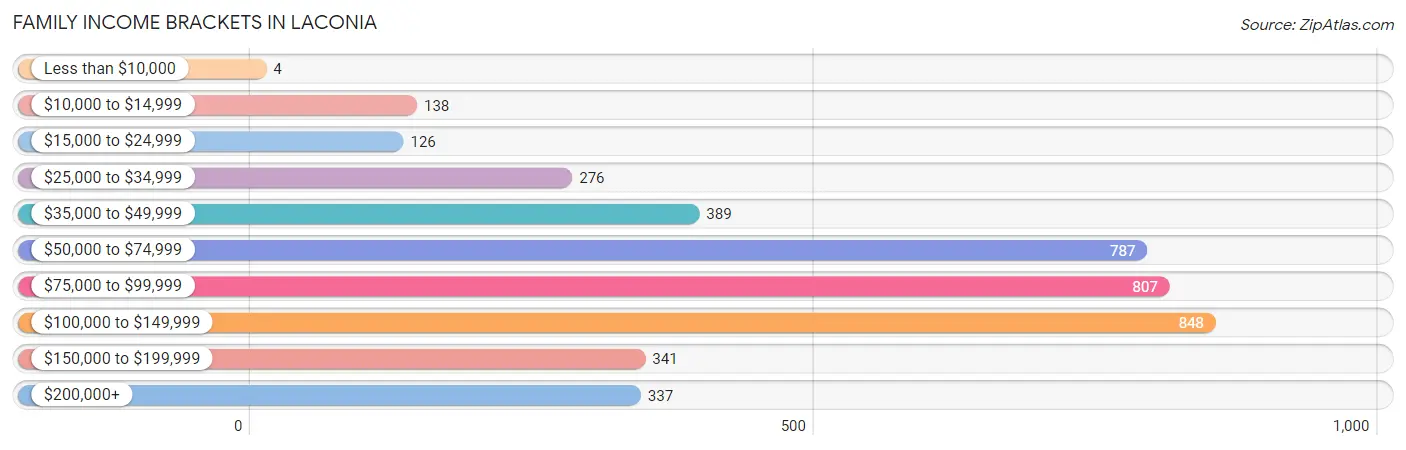
| Income Bracket | # Families | % Families |
| Less than $10,000 | 4 | 0.1% |
| $10,000 to $14,999 | 138 | 3.4% |
| $15,000 to $24,999 | 126 | 3.1% |
| $25,000 to $34,999 | 276 | 6.8% |
| $35,000 to $49,999 | 389 | 9.6% |
| $50,000 to $74,999 | 787 | 19.4% |
| $75,000 to $99,999 | 807 | 19.9% |
| $100,000 to $149,999 | 848 | 20.9% |
| $150,000 to $199,999 | 341 | 8.4% |
| $200,000+ | 337 | 8.3% |
Family Income by Famaliy Size in Laconia
7+ person families (77 | 1.9%) account for the highest median family income in Laconia with $102,092 per family, while 2-person families (2,374 | 58.5%) have the highest median income of $42,444 per family member.
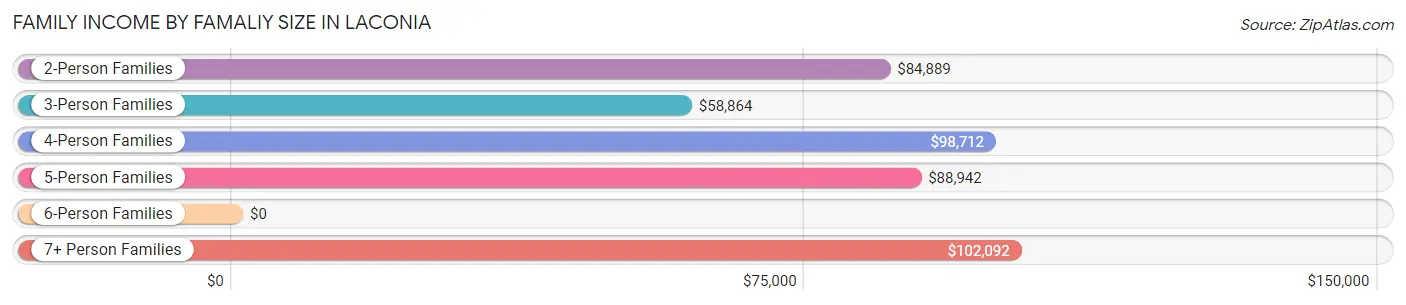
| Income Bracket | # Families | Median Income |
| 2-Person Families | 2,374 (58.5%) | $84,889 |
| 3-Person Families | 850 (20.9%) | $58,864 |
| 4-Person Families | 530 (13.1%) | $98,712 |
| 5-Person Families | 216 (5.3%) | $88,942 |
| 6-Person Families | 10 (0.3%) | $0 |
| 7+ Person Families | 77 (1.9%) | $102,092 |
| Total | 4,057 (100.0%) | $88,464 |
Family Income by Number of Earners in Laconia
The median family income in Laconia is $88,464, with families comprising 3+ earners (435) having the highest median family income of $108,281, while families with no earners (638) have the lowest median family income of $54,000, accounting for 10.7% and 15.7% of families, respectively.
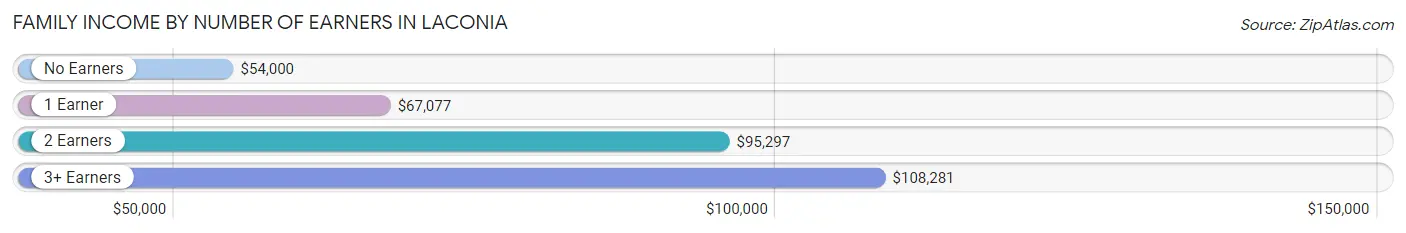
| Number of Earners | # Families | Median Income |
| No Earners | 638 (15.7%) | $54,000 |
| 1 Earner | 1,205 (29.7%) | $67,077 |
| 2 Earners | 1,779 (43.9%) | $95,297 |
| 3+ Earners | 435 (10.7%) | $108,281 |
| Total | 4,057 (100.0%) | $88,464 |
Household Income in Laconia
Household Income Brackets in Laconia
With 1,247 households falling in the category, the $50,000 to $74,999 income range is the most frequent in Laconia, accounting for 17.9% of all households. In contrast, only 272 households (3.9%) fall into the less than $10,000 income bracket, making it the least populous group.
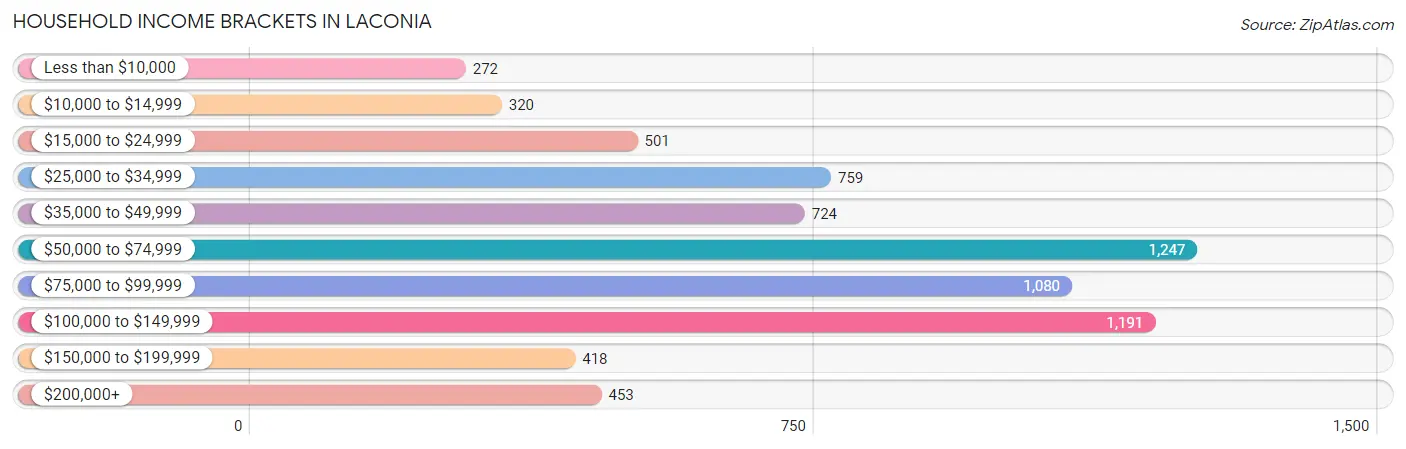
| Income Bracket | # Households | % Households |
| Less than $10,000 | 272 | 3.9% |
| $10,000 to $14,999 | 320 | 4.6% |
| $15,000 to $24,999 | 501 | 7.2% |
| $25,000 to $34,999 | 759 | 10.9% |
| $35,000 to $49,999 | 724 | 10.4% |
| $50,000 to $74,999 | 1,247 | 17.9% |
| $75,000 to $99,999 | 1,080 | 15.5% |
| $100,000 to $149,999 | 1,191 | 17.1% |
| $150,000 to $199,999 | 418 | 6.0% |
| $200,000+ | 453 | 6.5% |
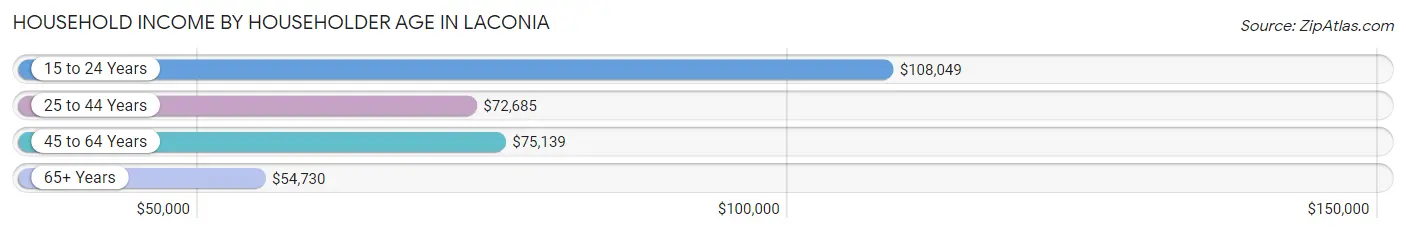
Household Income by Householder Age in Laconia
The median household income in Laconia is $67,856, with the highest median household income of $108,049 found in the 15 to 24 years age bracket for the primary householder. A total of 64 households (0.9%) fall into this category. Meanwhile, the 65+ years age bracket for the primary householder has the lowest median household income of $54,730, with 2,204 households (31.6%) in this group.
| Income Bracket | # Households | Median Income |
| 15 to 24 Years | 64 (0.9%) | $108,049 |
| 25 to 44 Years | 2,086 (29.9%) | $72,685 |
| 45 to 64 Years | 2,611 (37.5%) | $75,139 |
| 65+ Years | 2,204 (31.6%) | $54,730 |
| Total | 6,965 (100.0%) | $67,856 |
Poverty in Laconia
Income Below Poverty by Sex and Age in Laconia
With 8.0% poverty level for males and 12.3% for females among the residents of Laconia, 5 year old males and under 5 year old females are the most vulnerable to poverty, with 20 males (100.0%) and 137 females (35.3%) in their respective age groups living below the poverty level.
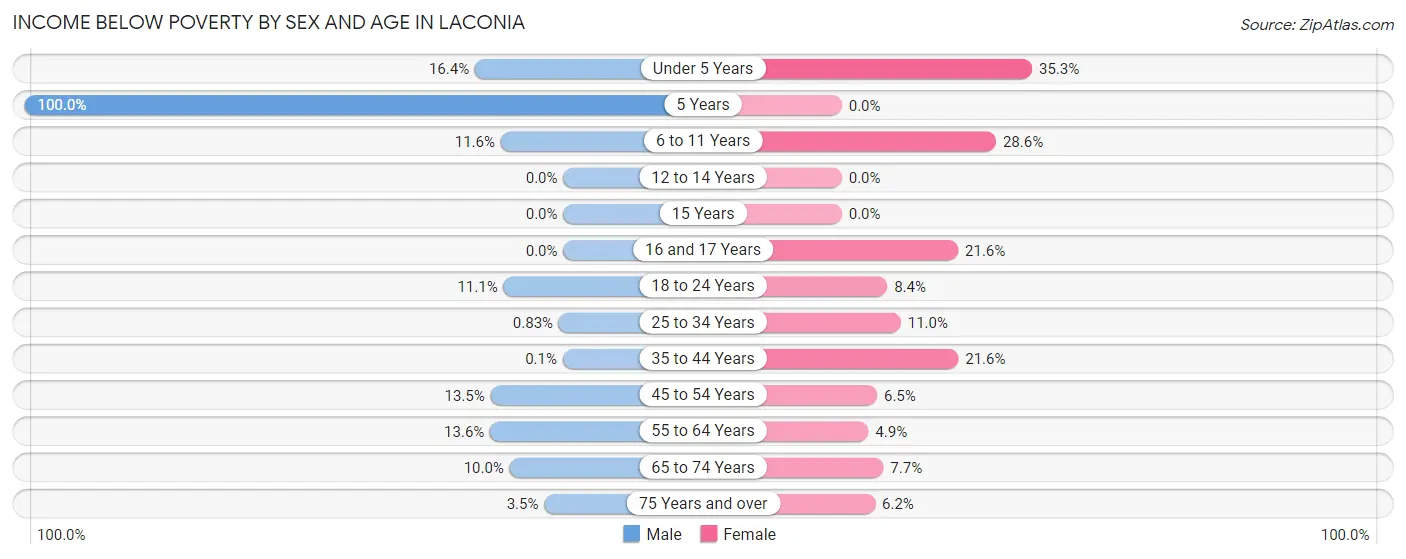
| Age Bracket | Male | Female |
| Under 5 Years | 51 (16.4%) | 137 (35.3%) |
| 5 Years | 20 (100.0%) | 0 (0.0%) |
| 6 to 11 Years | 59 (11.6%) | 154 (28.6%) |
| 12 to 14 Years | 0 (0.0%) | 0 (0.0%) |
| 15 Years | 0 (0.0%) | 0 (0.0%) |
| 16 and 17 Years | 0 (0.0%) | 65 (21.6%) |
| 18 to 24 Years | 84 (11.1%) | 52 (8.4%) |
| 25 to 34 Years | 9 (0.8%) | 99 (11.0%) |
| 35 to 44 Years | 1 (0.1%) | 259 (21.6%) |
| 45 to 54 Years | 125 (13.5%) | 58 (6.5%) |
| 55 to 64 Years | 170 (13.6%) | 66 (4.9%) |
| 65 to 74 Years | 124 (10.0%) | 89 (7.7%) |
| 75 Years and over | 12 (3.5%) | 40 (6.2%) |
| Total | 655 (8.0%) | 1,019 (12.3%) |
Income Above Poverty by Sex and Age in Laconia
According to the poverty statistics in Laconia, males aged 12 to 14 years and females aged 5 years are the age groups that are most secure financially, with 100.0% of males and 100.0% of females in these age groups living above the poverty line.
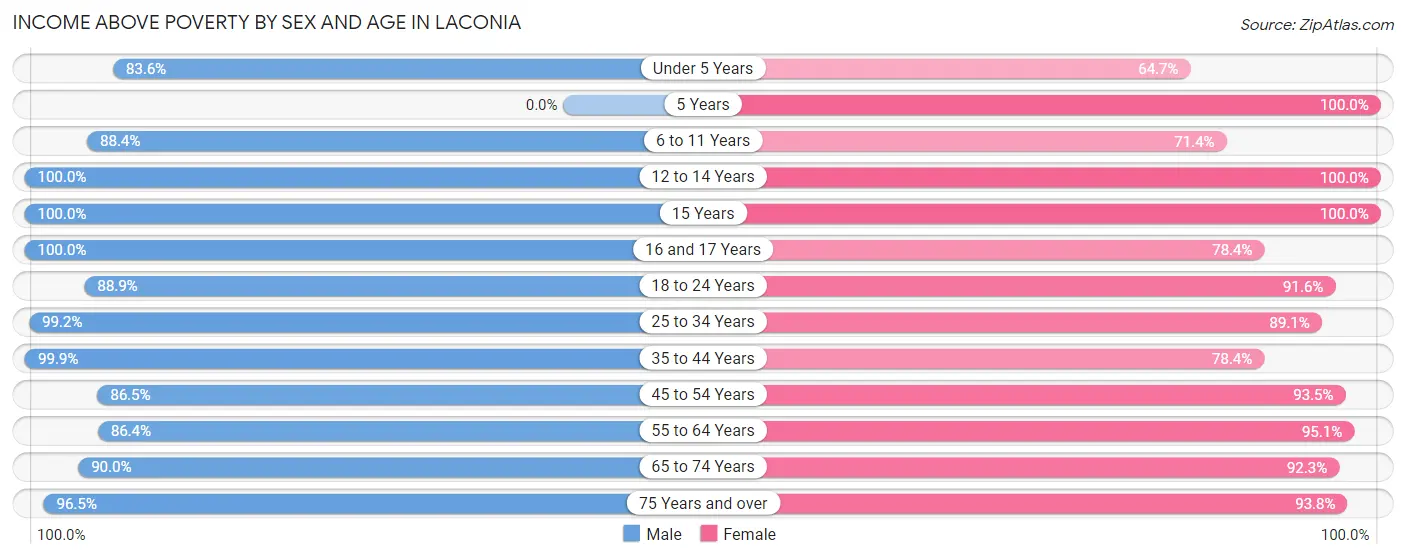
| Age Bracket | Male | Female |
| Under 5 Years | 260 (83.6%) | 251 (64.7%) |
| 5 Years | 0 (0.0%) | 121 (100.0%) |
| 6 to 11 Years | 449 (88.4%) | 384 (71.4%) |
| 12 to 14 Years | 384 (100.0%) | 140 (100.0%) |
| 15 Years | 107 (100.0%) | 28 (100.0%) |
| 16 and 17 Years | 205 (100.0%) | 236 (78.4%) |
| 18 to 24 Years | 672 (88.9%) | 565 (91.6%) |
| 25 to 34 Years | 1,079 (99.2%) | 805 (89.0%) |
| 35 to 44 Years | 1,014 (99.9%) | 939 (78.4%) |
| 45 to 54 Years | 801 (86.5%) | 829 (93.5%) |
| 55 to 64 Years | 1,081 (86.4%) | 1,270 (95.1%) |
| 65 to 74 Years | 1,121 (90.0%) | 1,064 (92.3%) |
| 75 Years and over | 328 (96.5%) | 607 (93.8%) |
| Total | 7,501 (92.0%) | 7,239 (87.7%) |
Income Below Poverty Among Married-Couple Families in Laconia
The poverty statistics for married-couple families in Laconia show that 2.3% or 64 of the total 2,785 families live below the poverty line. Families with no children have the highest poverty rate of 2.5%, comprising of 50 families. On the other hand, families with 3 or 4 children have the lowest poverty rate of 0.0%, which includes 0 families.
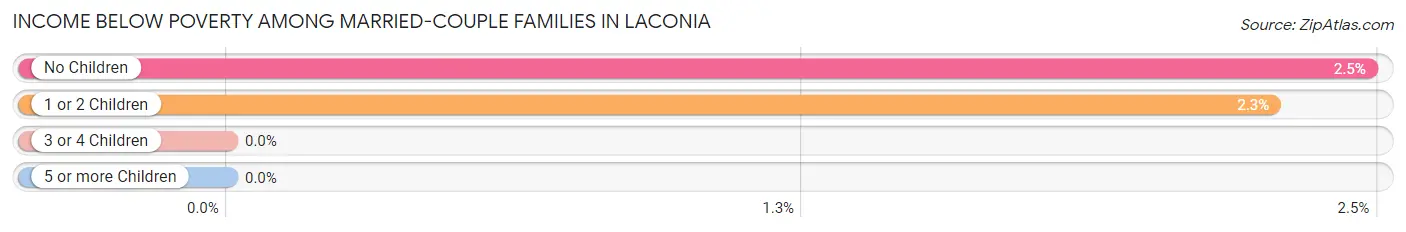
| Children | Above Poverty | Below Poverty |
| No Children | 1,969 (97.5%) | 50 (2.5%) |
| 1 or 2 Children | 604 (97.7%) | 14 (2.3%) |
| 3 or 4 Children | 148 (100.0%) | 0 (0.0%) |
| 5 or more Children | 0 (0.0%) | 0 (0.0%) |
| Total | 2,721 (97.7%) | 64 (2.3%) |
Income Below Poverty Among Single-Parent Households in Laconia
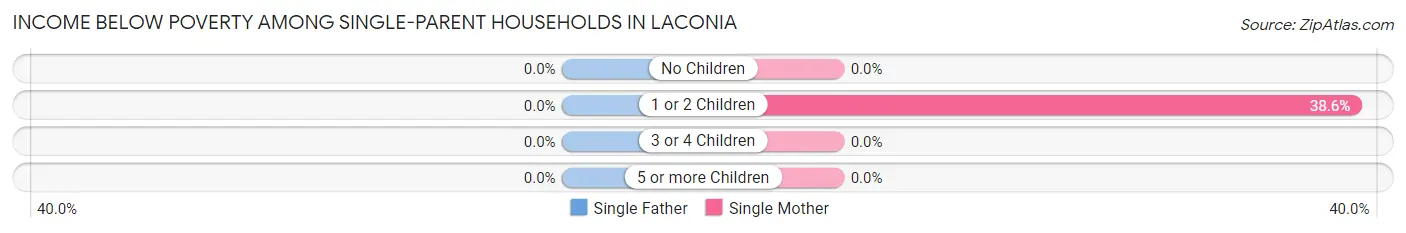
| Children | Single Father | Single Mother |
| No Children | 0 (0.0%) | 0 (0.0%) |
| 1 or 2 Children | 0 (0.0%) | 185 (38.6%) |
| 3 or 4 Children | 0 (0.0%) | 0 (0.0%) |
| 5 or more Children | 0 (0.0%) | 0 (0.0%) |
| Total | 0 (0.0%) | 185 (20.0%) |
Income Below Poverty Among Married-Couple vs Single-Parent Households in Laconia
The poverty data for Laconia shows that 64 of the married-couple family households (2.3%) and 185 of the single-parent households (14.5%) are living below the poverty level. Within the married-couple family households, those with no children have the highest poverty rate, with 50 households (2.5%) falling below the poverty line. Among the single-parent households, those with 1 or 2 children have the highest poverty rate, with 185 household (27.3%) living below poverty.
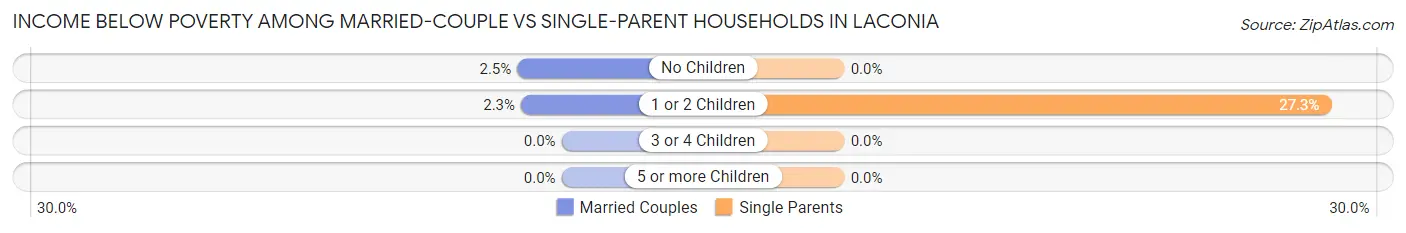
| Children | Married-Couple Families | Single-Parent Households |
| No Children | 50 (2.5%) | 0 (0.0%) |
| 1 or 2 Children | 14 (2.3%) | 185 (27.3%) |
| 3 or 4 Children | 0 (0.0%) | 0 (0.0%) |
| 5 or more Children | 0 (0.0%) | 0 (0.0%) |
| Total | 64 (2.3%) | 185 (14.5%) |
Race in Laconia
The most populous races in Laconia are White / Caucasian (15,754 | 93.2%), Hispanic or Latino (483 | 2.9%), and Some other Race (433 | 2.6%).
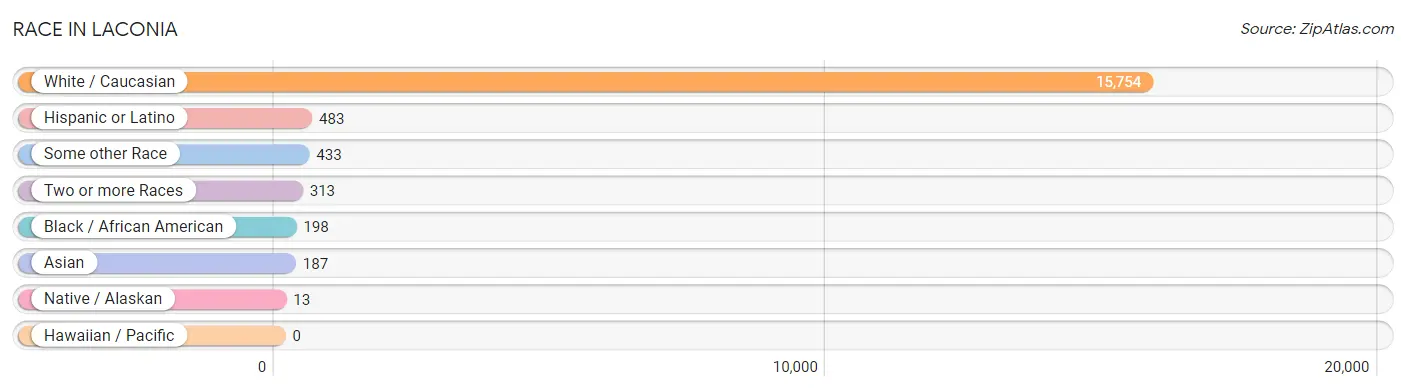
| Race | # Population | % Population |
| Asian | 187 | 1.1% |
| Black / African American | 198 | 1.2% |
| Hawaiian / Pacific | 0 | 0.0% |
| Hispanic or Latino | 483 | 2.9% |
| Native / Alaskan | 13 | 0.1% |
| White / Caucasian | 15,754 | 93.2% |
| Two or more Races | 313 | 1.8% |
| Some other Race | 433 | 2.6% |
| Total | 16,898 | 100.0% |
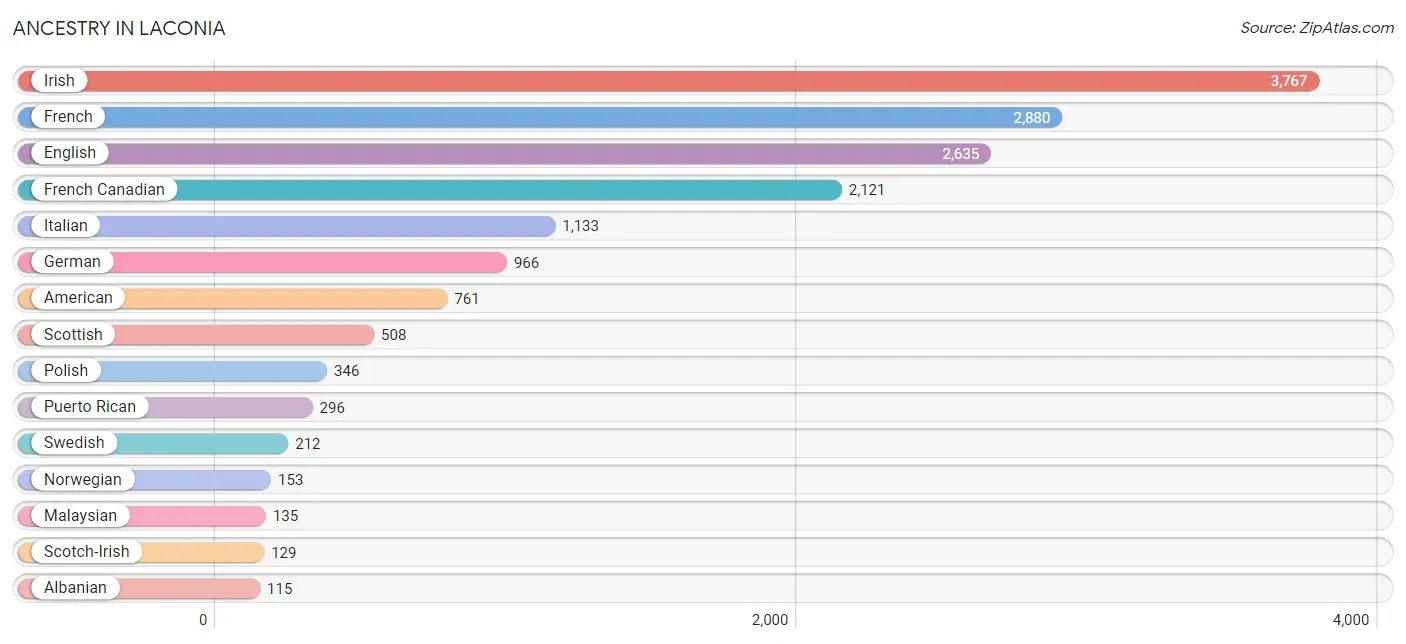
Ancestry in Laconia
The most populous ancestries reported in Laconia are Irish (3,767 | 22.3%), French (2,880 | 17.0%), English (2,635 | 15.6%), French Canadian (2,121 | 12.6%), and Italian (1,133 | 6.7%), together accounting for 74.2% of all Laconia residents.
| Ancestry | # Population | % Population |
| Albanian | 115 | 0.7% |
| American | 761 | 4.5% |
| Apache | 3 | 0.0% |
| Austrian | 15 | 0.1% |
| Brazilian | 39 | 0.2% |
| British | 49 | 0.3% |
| Burmese | 1 | 0.0% |
| Canadian | 59 | 0.4% |
| Celtic | 12 | 0.1% |
| Central American | 7 | 0.0% |
| Cherokee | 5 | 0.0% |
| Colombian | 71 | 0.4% |
| Croatian | 10 | 0.1% |
| Czech | 67 | 0.4% |
| Czechoslovakian | 3 | 0.0% |
| Danish | 113 | 0.7% |
| Dominican | 1 | 0.0% |
| Dutch | 82 | 0.5% |
| Eastern European | 39 | 0.2% |
| English | 2,635 | 15.6% |
| European | 106 | 0.6% |
| Finnish | 66 | 0.4% |
| French | 2,880 | 17.0% |
| French Canadian | 2,121 | 12.6% |
| German | 966 | 5.7% |
| Greek | 25 | 0.2% |
| Hungarian | 9 | 0.1% |
| Indian (Asian) | 19 | 0.1% |
| Irish | 3,767 | 22.3% |
| Iroquois | 20 | 0.1% |
| Italian | 1,133 | 6.7% |
| Jamaican | 53 | 0.3% |
| Korean | 1 | 0.0% |
| Latvian | 19 | 0.1% |
| Lithuanian | 29 | 0.2% |
| Malaysian | 135 | 0.8% |
| Mexican | 108 | 0.6% |
| Northern European | 16 | 0.1% |
| Norwegian | 153 | 0.9% |
| Pakistani | 14 | 0.1% |
| Polish | 346 | 2.1% |
| Portuguese | 69 | 0.4% |
| Puerto Rican | 296 | 1.8% |
| Romanian | 100 | 0.6% |
| Russian | 79 | 0.5% |
| Salvadoran | 7 | 0.0% |
| Scandinavian | 94 | 0.6% |
| Scotch-Irish | 129 | 0.8% |
| Scottish | 508 | 3.0% |
| Serbian | 31 | 0.2% |
| Slovene | 6 | 0.0% |
| South American | 71 | 0.4% |
| Sri Lankan | 24 | 0.1% |
| Swedish | 212 | 1.3% |
| Thai | 20 | 0.1% |
| Ukrainian | 30 | 0.2% |
| Welsh | 21 | 0.1% | View All 57 Rows |
Immigrants in Laconia
The most numerous immigrant groups reported in Laconia came from Europe (276 | 1.6%), Eastern Europe (225 | 1.3%), Asia (168 | 1.0%), South Eastern Asia (105 | 0.6%), and Laos (90 | 0.5%), together accounting for 5.1% of all Laconia residents.
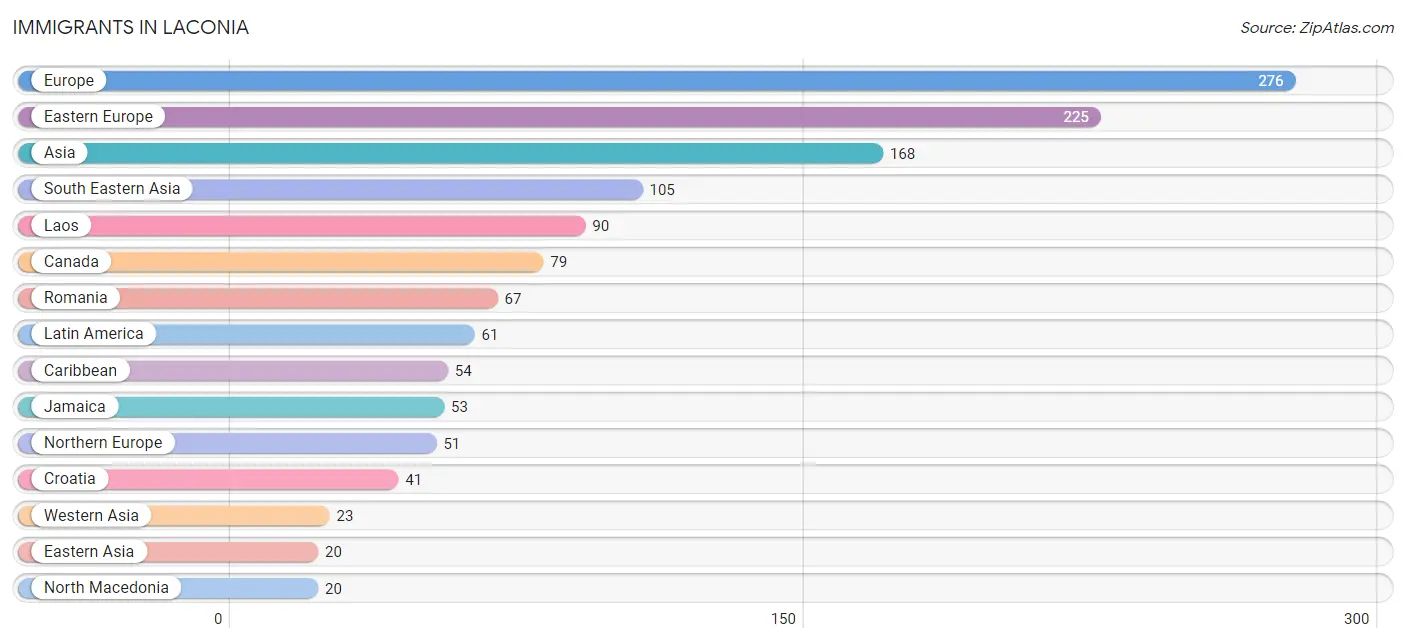
| Immigration Origin | # Population | % Population |
| Asia | 168 | 1.0% |
| Canada | 79 | 0.5% |
| Caribbean | 54 | 0.3% |
| Central America | 7 | 0.0% |
| China | 19 | 0.1% |
| Croatia | 41 | 0.2% |
| Dominica | 1 | 0.0% |
| Eastern Asia | 20 | 0.1% |
| Eastern Europe | 225 | 1.3% |
| El Salvador | 7 | 0.0% |
| Europe | 276 | 1.6% |
| Jamaica | 53 | 0.3% |
| Korea | 1 | 0.0% |
| Laos | 90 | 0.5% |
| Latin America | 61 | 0.4% |
| North Macedonia | 20 | 0.1% |
| Northern Europe | 51 | 0.3% |
| Philippines | 1 | 0.0% |
| Romania | 67 | 0.4% |
| Russia | 8 | 0.1% |
| Scotland | 11 | 0.1% |
| South Central Asia | 20 | 0.1% |
| South Eastern Asia | 105 | 0.6% |
| Ukraine | 7 | 0.0% |
| Vietnam | 14 | 0.1% |
| Western Asia | 23 | 0.1% | View All 26 Rows |
Sex and Age in Laconia
Sex and Age in Laconia
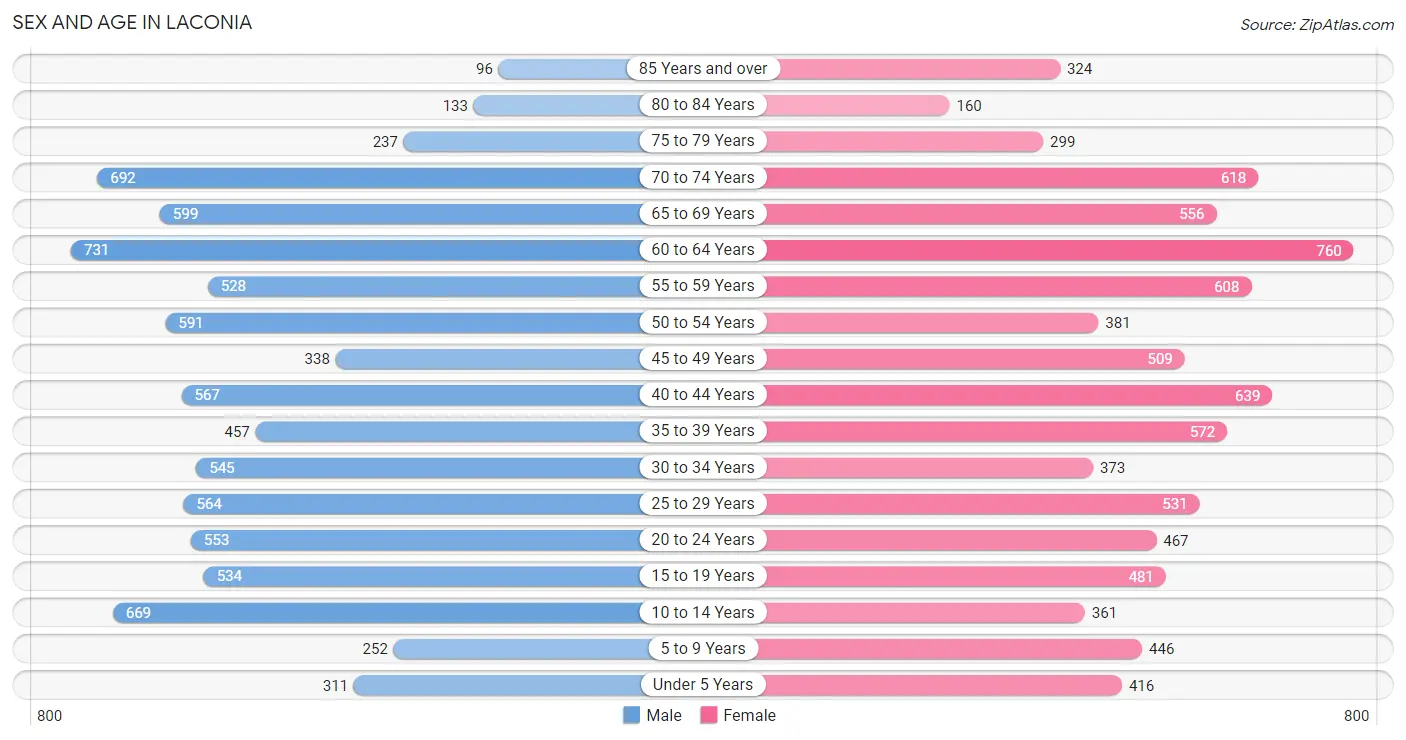
The most populous age groups in Laconia are 60 to 64 Years (731 | 8.7%) for men and 60 to 64 Years (760 | 8.9%) for women.
| Age Bracket | Male | Female |
| Under 5 Years | 311 (3.7%) | 416 (4.9%) |
| 5 to 9 Years | 252 (3.0%) | 446 (5.2%) |
| 10 to 14 Years | 669 (8.0%) | 361 (4.3%) |
| 15 to 19 Years | 534 (6.4%) | 481 (5.7%) |
| 20 to 24 Years | 553 (6.6%) | 467 (5.5%) |
| 25 to 29 Years | 564 (6.7%) | 531 (6.2%) |
| 30 to 34 Years | 545 (6.5%) | 373 (4.4%) |
| 35 to 39 Years | 457 (5.4%) | 572 (6.7%) |
| 40 to 44 Years | 567 (6.8%) | 639 (7.5%) |
| 45 to 49 Years | 338 (4.0%) | 509 (6.0%) |
| 50 to 54 Years | 591 (7.0%) | 381 (4.5%) |
| 55 to 59 Years | 528 (6.3%) | 608 (7.1%) |
| 60 to 64 Years | 731 (8.7%) | 760 (8.9%) |
| 65 to 69 Years | 599 (7.1%) | 556 (6.5%) |
| 70 to 74 Years | 692 (8.2%) | 618 (7.3%) |
| 75 to 79 Years | 237 (2.8%) | 299 (3.5%) |
| 80 to 84 Years | 133 (1.6%) | 160 (1.9%) |
| 85 Years and over | 96 (1.1%) | 324 (3.8%) |
| Total | 8,397 (100.0%) | 8,501 (100.0%) |
Families and Households in Laconia
Median Family Size in Laconia
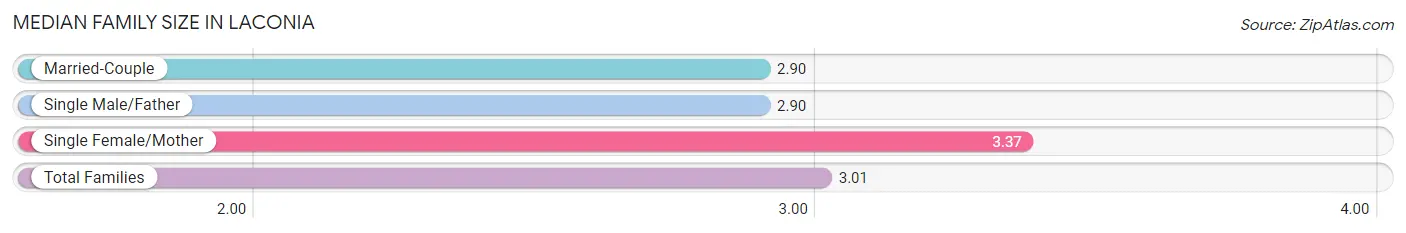
The median family size in Laconia is 3.01 persons per family, with single female/mother families (926 | 22.8%) accounting for the largest median family size of 3.37 persons per family. On the other hand, married-couple families (2,785 | 68.6%) represent the smallest median family size with 2.90 persons per family.
| Family Type | # Families | Family Size |
| Married-Couple | 2,785 (68.6%) | 2.90 |
| Single Male/Father | 346 (8.5%) | 2.90 |
| Single Female/Mother | 926 (22.8%) | 3.37 |
| Total Families | 4,057 (100.0%) | 3.01 |
Median Household Size in Laconia
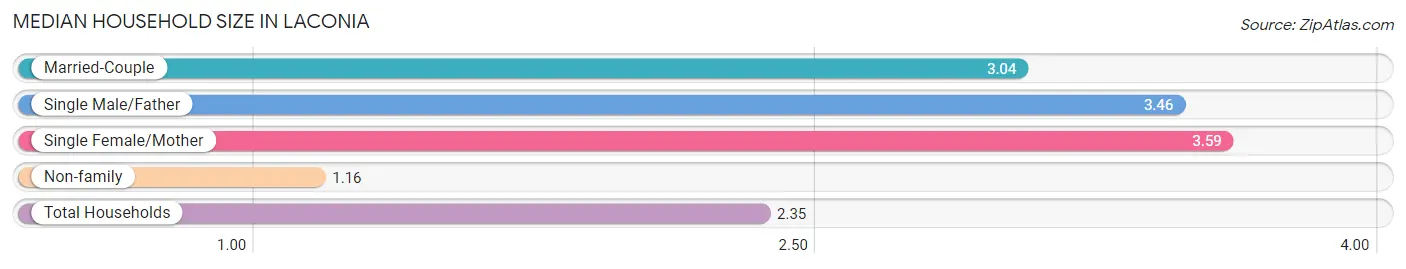
The median household size in Laconia is 2.35 persons per household, with single female/mother households (926 | 13.3%) accounting for the largest median household size of 3.59 persons per household. non-family households (2,908 | 41.7%) represent the smallest median household size with 1.16 persons per household.
| Household Type | # Households | Household Size |
| Married-Couple | 2,785 (40.0%) | 3.04 |
| Single Male/Father | 346 (5.0%) | 3.46 |
| Single Female/Mother | 926 (13.3%) | 3.59 |
| Non-family | 2,908 (41.7%) | 1.16 |
| Total Households | 6,965 (100.0%) | 2.35 |
Household Size by Marriage Status in Laconia
Out of a total of 6,965 households in Laconia, 4,057 (58.3%) are family households, while 2,908 (41.7%) are nonfamily households. The most numerous type of family households are 2-person households, comprising 2,032, and the most common type of nonfamily households are 1-person households, comprising 2,572.

| Household Size | Family Households | Nonfamily Households |
| 1-Person Households | - | 2,572 (36.9%) |
| 2-Person Households | 2,032 (29.2%) | 334 (4.8%) |
| 3-Person Households | 959 (13.8%) | 2 (0.0%) |
| 4-Person Households | 679 (9.8%) | 0 (0.0%) |
| 5-Person Households | 265 (3.8%) | 0 (0.0%) |
| 6-Person Households | 32 (0.5%) | 0 (0.0%) |
| 7+ Person Households | 90 (1.3%) | 0 (0.0%) |
| Total | 4,057 (58.3%) | 2,908 (41.7%) |
Female Fertility in Laconia
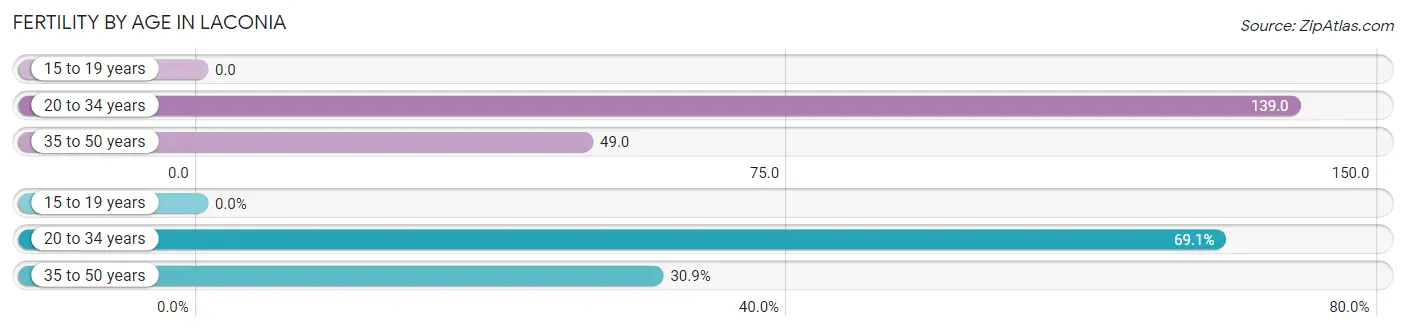
Fertility by Age in Laconia
Average fertility rate in Laconia is 76.0 births per 1,000 women. Women in the age bracket of 20 to 34 years have the highest fertility rate with 139.0 births per 1,000 women. Women in the age bracket of 20 to 34 years acount for 69.1% of all women with births.
| Age Bracket | Women with Births | Births / 1,000 Women |
| 15 to 19 years | 0 (0.0%) | 0.0 |
| 20 to 34 years | 190 (69.1%) | 139.0 |
| 35 to 50 years | 85 (30.9%) | 49.0 |
| Total | 275 (100.0%) | 76.0 |
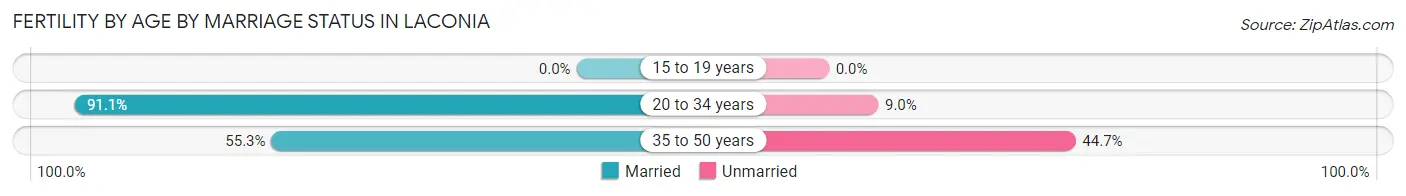
Fertility by Age by Marriage Status in Laconia
80.0% of women with births (275) in Laconia are married. The highest percentage of unmarried women with births falls into 35 to 50 years age bracket with 44.7% of them unmarried at the time of birth, while the lowest percentage of unmarried women with births belong to 20 to 34 years age bracket with 9.0% of them unmarried.
| Age Bracket | Married | Unmarried |
| 15 to 19 years | 0 (0.0%) | 0 (0.0%) |
| 20 to 34 years | 173 (91.0%) | 17 (8.9%) |
| 35 to 50 years | 47 (55.3%) | 38 (44.7%) |
| Total | 220 (80.0%) | 55 (20.0%) |
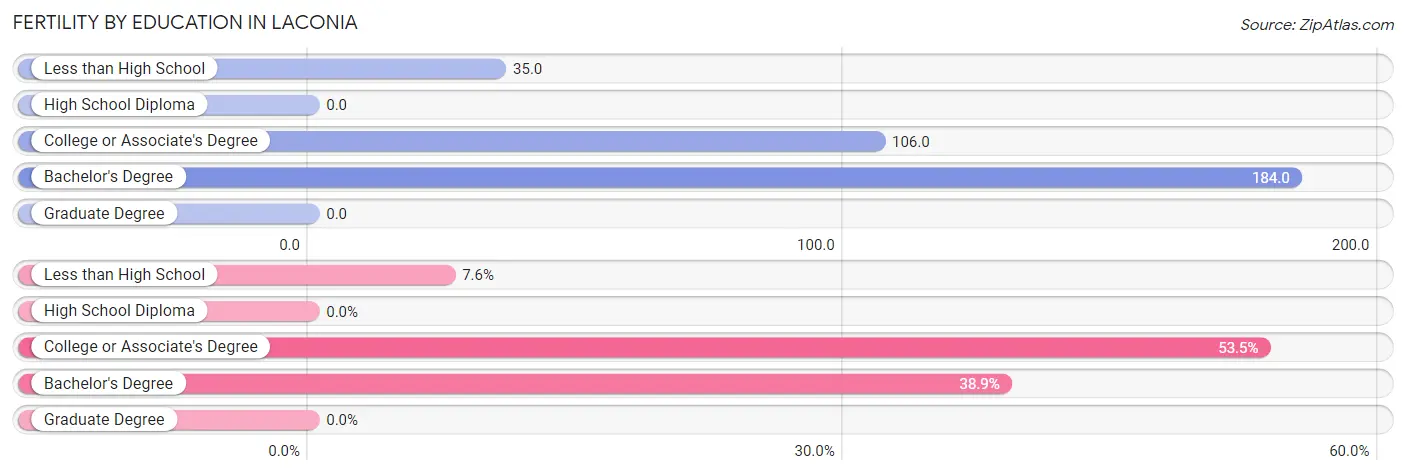
Fertility by Education in Laconia
| Educational Attainment | Women with Births | Births / 1,000 Women |
| Less than High School | 21 (7.6%) | 35.0 |
| High School Diploma | 0 (0.0%) | 0.0 |
| College or Associate's Degree | 147 (53.4%) | 106.0 |
| Bachelor's Degree | 107 (38.9%) | 184.0 |
| Graduate Degree | 0 (0.0%) | 0.0 |
| Total | 275 (100.0%) | 76.0 |
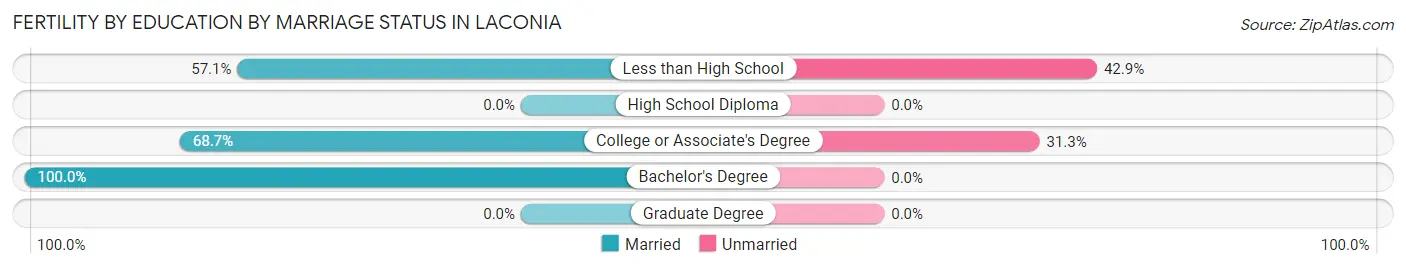
Fertility by Education by Marriage Status in Laconia
20.0% of women with births in Laconia are unmarried. Women with the educational attainment of bachelor's degree are most likely to be married with 100.0% of them married at childbirth, while women with the educational attainment of less than high school are least likely to be married with 42.9% of them unmarried at childbirth.
| Educational Attainment | Married | Unmarried |
| Less than High School | 12 (57.1%) | 9 (42.9%) |
| High School Diploma | 0 (0.0%) | 0 (0.0%) |
| College or Associate's Degree | 101 (68.7%) | 46 (31.3%) |
| Bachelor's Degree | 107 (100.0%) | 0 (0.0%) |
| Graduate Degree | 0 (0.0%) | 0 (0.0%) |
| Total | 220 (80.0%) | 55 (20.0%) |
Employment Characteristics in Laconia
Employment by Class of Employer in Laconia
Among the 8,600 employed individuals in Laconia, private company employees (5,598 | 65.1%), not-for-profit organizations (1,094 | 12.7%), and local government employees (670 | 7.8%) make up the most common classes of employment.
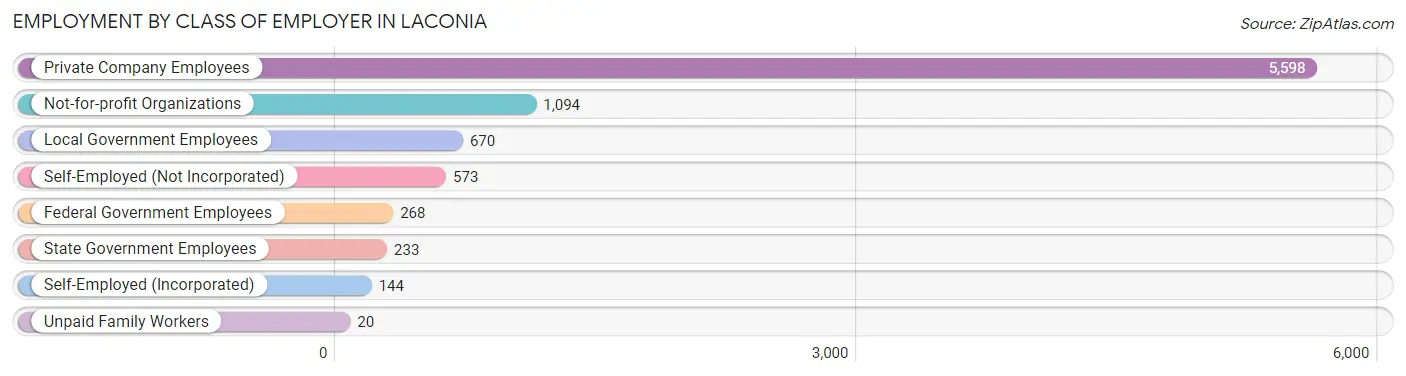
| Employer Class | # Employees | % Employees |
| Private Company Employees | 5,598 | 65.1% |
| Self-Employed (Incorporated) | 144 | 1.7% |
| Self-Employed (Not Incorporated) | 573 | 6.7% |
| Not-for-profit Organizations | 1,094 | 12.7% |
| Local Government Employees | 670 | 7.8% |
| State Government Employees | 233 | 2.7% |
| Federal Government Employees | 268 | 3.1% |
| Unpaid Family Workers | 20 | 0.2% |
| Total | 8,600 | 100.0% |
Employment Status by Age in Laconia
According to the labor force statistics for Laconia, out of the total population over 16 years of age (14,308), 64.1% or 9,171 individuals are in the labor force, with 3.1% or 284 of them unemployed. The age group with the highest labor force participation rate is 30 to 34 years, with 96.6% or 887 individuals in the labor force. Within the labor force, the 25 to 29 years age range has the highest percentage of unemployed individuals, with 12.0% or 119 of them being unemployed.
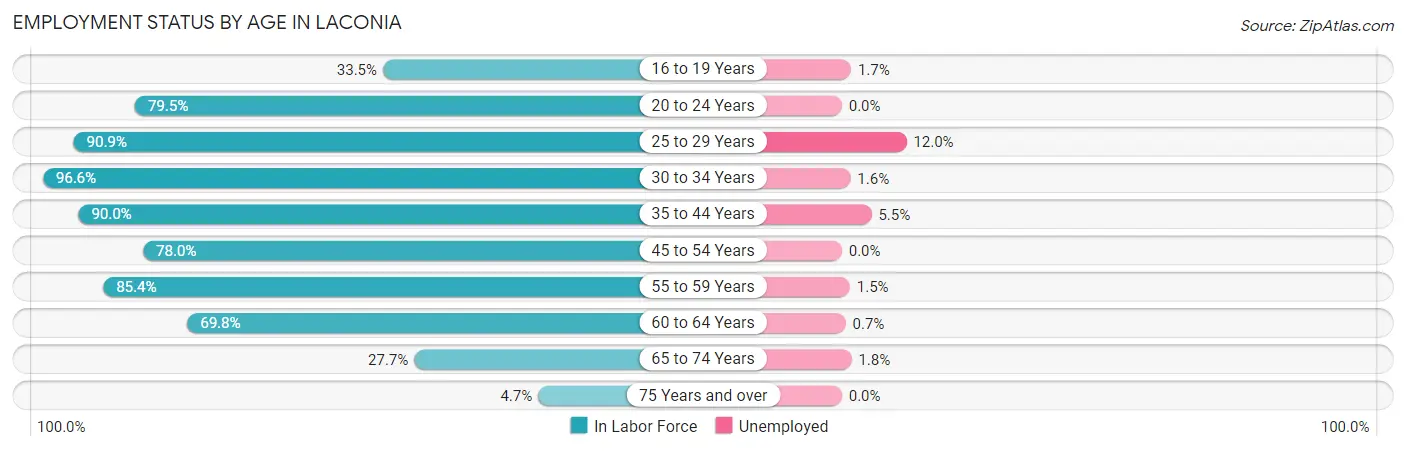
| Age Bracket | In Labor Force | Unemployed |
| 16 to 19 Years | 295 (33.5%) | 5 (1.7%) |
| 20 to 24 Years | 811 (79.5%) | 0 (0.0%) |
| 25 to 29 Years | 995 (90.9%) | 119 (12.0%) |
| 30 to 34 Years | 887 (96.6%) | 14 (1.6%) |
| 35 to 44 Years | 2,012 (90.0%) | 111 (5.5%) |
| 45 to 54 Years | 1,419 (78.0%) | 0 (0.0%) |
| 55 to 59 Years | 970 (85.4%) | 15 (1.5%) |
| 60 to 64 Years | 1,041 (69.8%) | 7 (0.7%) |
| 65 to 74 Years | 683 (27.7%) | 12 (1.8%) |
| 75 Years and over | 59 (4.7%) | 0 (0.0%) |
| Total | 9,171 (64.1%) | 284 (3.1%) |
Employment Status by Educational Attainment in Laconia
According to labor force statistics for Laconia, 84.2% of individuals (7,320) out of the total population between 25 and 64 years of age (8,694) are in the labor force, with 3.6% or 264 of them being unemployed. The group with the highest labor force participation rate are those with the educational attainment of bachelor's degree or higher, with 92.3% or 1,896 individuals in the labor force. Within the labor force, individuals with less than high school education have the highest percentage of unemployment, with 20.0% or 86 of them being unemployed.
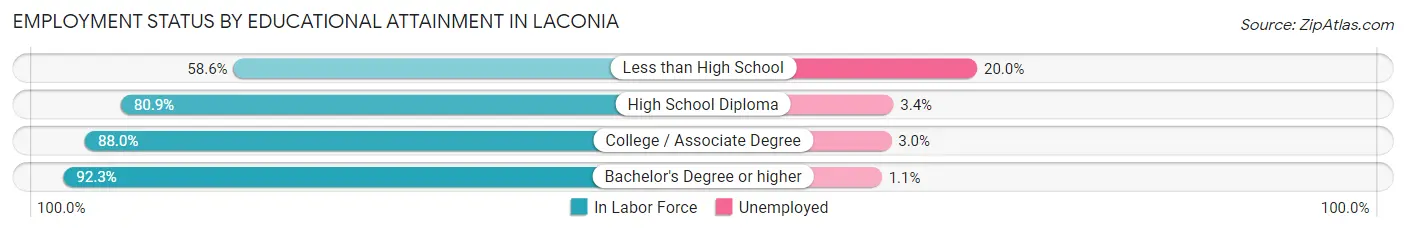
| Educational Attainment | In Labor Force | Unemployed |
| Less than High School | 430 (58.6%) | 147 (20.0%) |
| High School Diploma | 2,288 (80.9%) | 96 (3.4%) |
| College / Associate Degree | 2,709 (88.0%) | 92 (3.0%) |
| Bachelor's Degree or higher | 1,896 (92.3%) | 23 (1.1%) |
| Total | 7,320 (84.2%) | 313 (3.6%) |
Employment Occupations by Sex in Laconia
Management, Business, Science and Arts Occupations
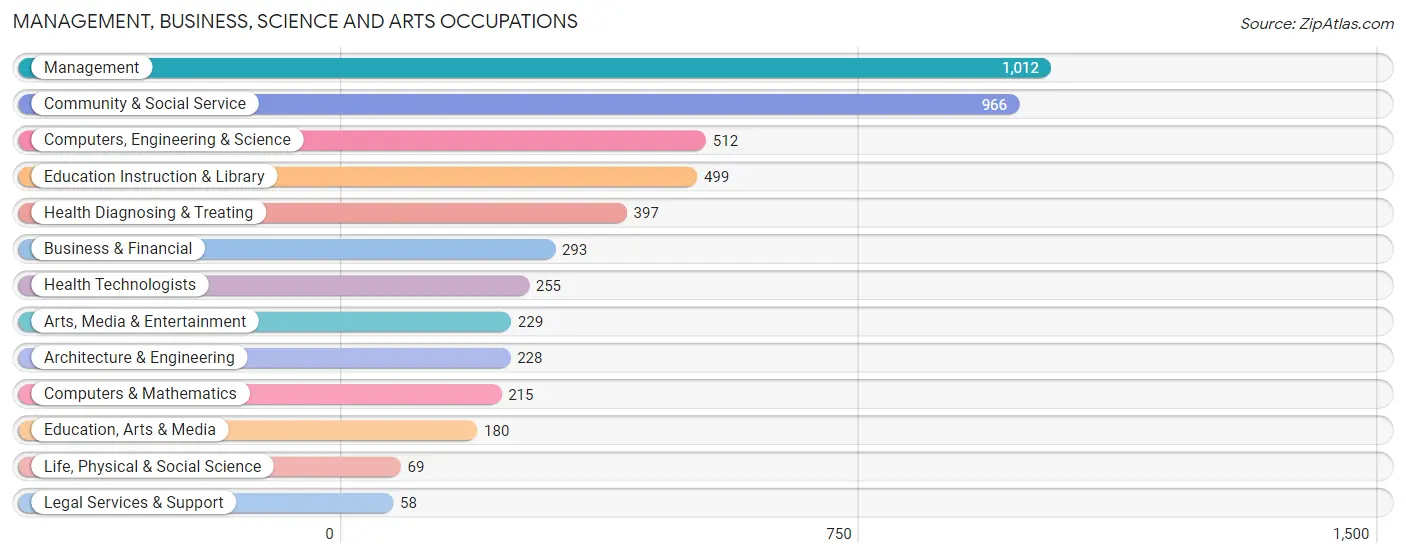
The most common Management, Business, Science and Arts occupations in Laconia are Management (1,012 | 11.5%), Community & Social Service (966 | 11.0%), Computers, Engineering & Science (512 | 5.8%), Education Instruction & Library (499 | 5.7%), and Health Diagnosing & Treating (397 | 4.5%).
Management, Business, Science and Arts Occupations by Sex
Within the Management, Business, Science and Arts occupations in Laconia, the most male-oriented occupations are Architecture & Engineering (100.0%), Computers, Engineering & Science (75.0%), and Computers & Mathematics (67.9%), while the most female-oriented occupations are Health Diagnosing & Treating (94.2%), Health Technologists (94.1%), and Life, Physical & Social Science (85.5%).
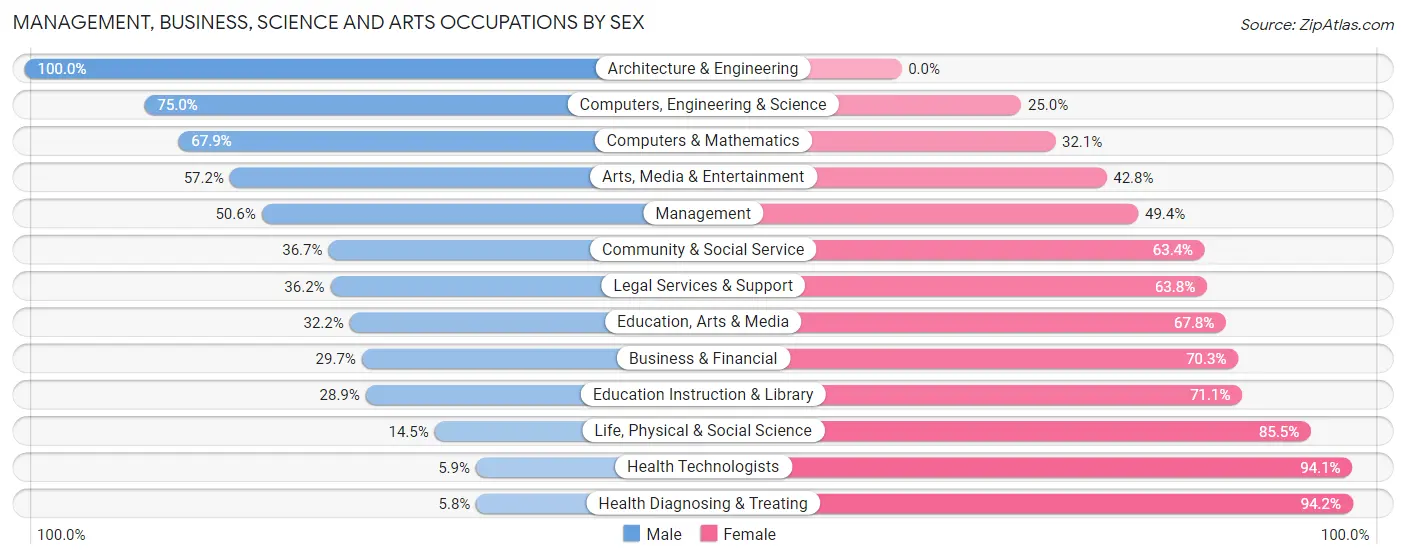
| Occupation | Male | Female |
| Management | 512 (50.6%) | 500 (49.4%) |
| Business & Financial | 87 (29.7%) | 206 (70.3%) |
| Computers, Engineering & Science | 384 (75.0%) | 128 (25.0%) |
| Computers & Mathematics | 146 (67.9%) | 69 (32.1%) |
| Architecture & Engineering | 228 (100.0%) | 0 (0.0%) |
| Life, Physical & Social Science | 10 (14.5%) | 59 (85.5%) |
| Community & Social Service | 354 (36.6%) | 612 (63.3%) |
| Education, Arts & Media | 58 (32.2%) | 122 (67.8%) |
| Legal Services & Support | 21 (36.2%) | 37 (63.8%) |
| Education Instruction & Library | 144 (28.9%) | 355 (71.1%) |
| Arts, Media & Entertainment | 131 (57.2%) | 98 (42.8%) |
| Health Diagnosing & Treating | 23 (5.8%) | 374 (94.2%) |
| Health Technologists | 15 (5.9%) | 240 (94.1%) |
| Total (Category) | 1,360 (42.8%) | 1,820 (57.2%) |
| Total (Overall) | 4,516 (51.2%) | 4,298 (48.8%) |
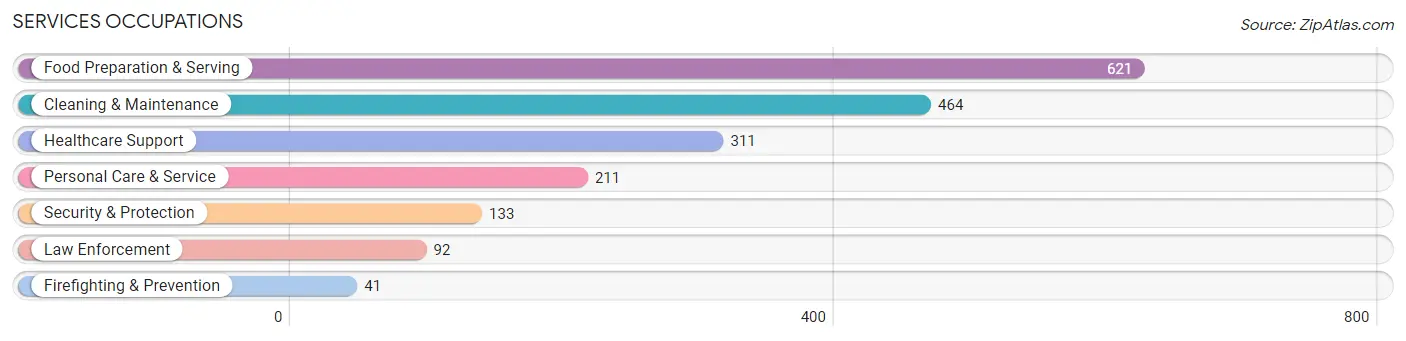
Services Occupations
The most common Services occupations in Laconia are Food Preparation & Serving (621 | 7.0%), Cleaning & Maintenance (464 | 5.3%), Healthcare Support (311 | 3.5%), Personal Care & Service (211 | 2.4%), and Security & Protection (133 | 1.5%).
Services Occupations by Sex
Within the Services occupations in Laconia, the most male-oriented occupations are Cleaning & Maintenance (75.9%), Law Enforcement (75.0%), and Security & Protection (72.2%), while the most female-oriented occupations are Healthcare Support (100.0%), Personal Care & Service (72.5%), and Food Preparation & Serving (58.1%).
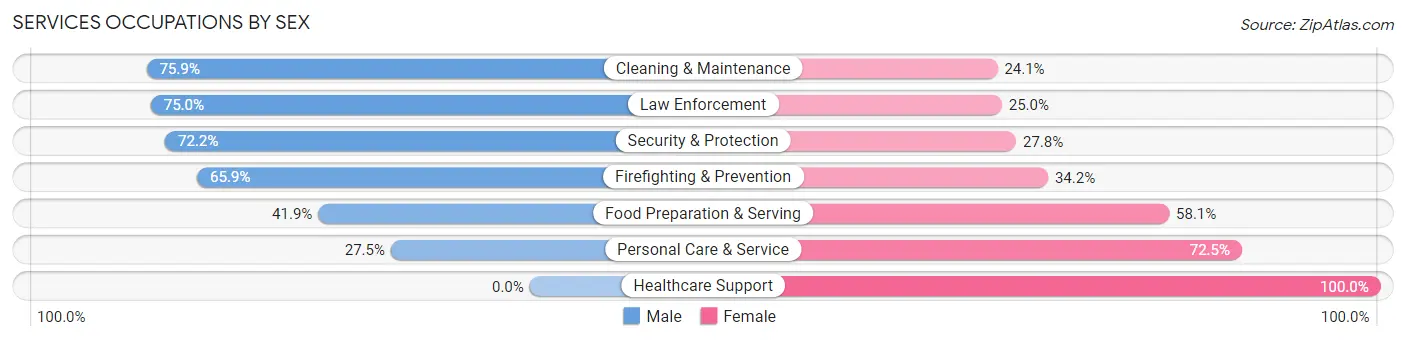
| Occupation | Male | Female |
| Healthcare Support | 0 (0.0%) | 311 (100.0%) |
| Security & Protection | 96 (72.2%) | 37 (27.8%) |
| Firefighting & Prevention | 27 (65.8%) | 14 (34.2%) |
| Law Enforcement | 69 (75.0%) | 23 (25.0%) |
| Food Preparation & Serving | 260 (41.9%) | 361 (58.1%) |
| Cleaning & Maintenance | 352 (75.9%) | 112 (24.1%) |
| Personal Care & Service | 58 (27.5%) | 153 (72.5%) |
| Total (Category) | 766 (44.0%) | 974 (56.0%) |
| Total (Overall) | 4,516 (51.2%) | 4,298 (48.8%) |
Sales and Office Occupations
The most common Sales and Office occupations in Laconia are Sales & Related (1,233 | 14.0%), and Office & Administration (922 | 10.5%).

Sales and Office Occupations by Sex
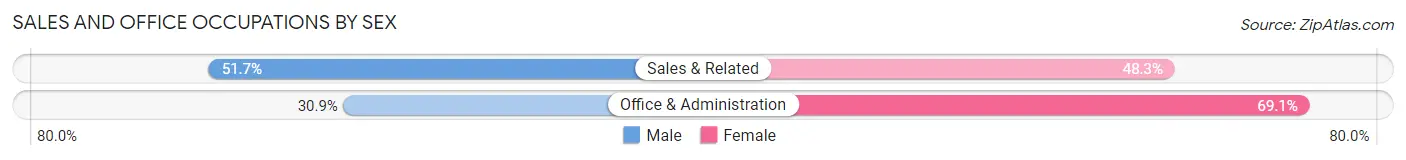
| Occupation | Male | Female |
| Sales & Related | 637 (51.7%) | 596 (48.3%) |
| Office & Administration | 285 (30.9%) | 637 (69.1%) |
| Total (Category) | 922 (42.8%) | 1,233 (57.2%) |
| Total (Overall) | 4,516 (51.2%) | 4,298 (48.8%) |
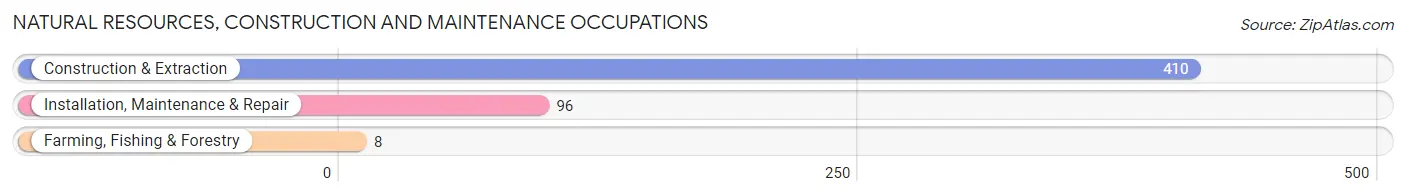
Natural Resources, Construction and Maintenance Occupations
The most common Natural Resources, Construction and Maintenance occupations in Laconia are Construction & Extraction (410 | 4.6%), Installation, Maintenance & Repair (96 | 1.1%), and Farming, Fishing & Forestry (8 | 0.1%).
Natural Resources, Construction and Maintenance Occupations by Sex
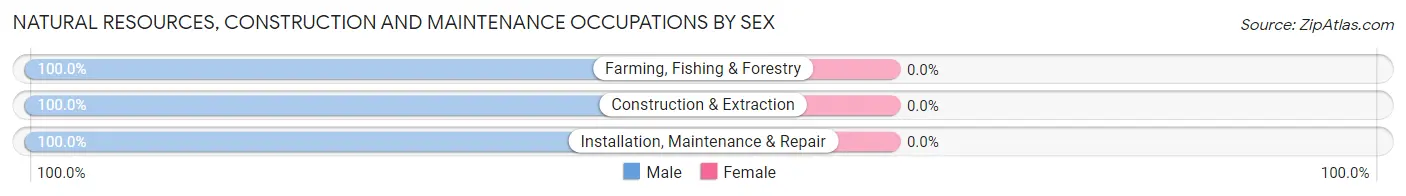
| Occupation | Male | Female |
| Farming, Fishing & Forestry | 8 (100.0%) | 0 (0.0%) |
| Construction & Extraction | 410 (100.0%) | 0 (0.0%) |
| Installation, Maintenance & Repair | 96 (100.0%) | 0 (0.0%) |
| Total (Category) | 514 (100.0%) | 0 (0.0%) |
| Total (Overall) | 4,516 (51.2%) | 4,298 (48.8%) |
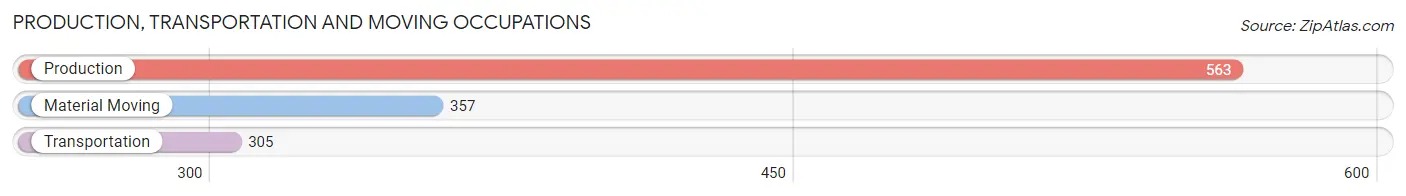
Production, Transportation and Moving Occupations
The most common Production, Transportation and Moving occupations in Laconia are Production (563 | 6.4%), Material Moving (357 | 4.1%), and Transportation (305 | 3.5%).
Production, Transportation and Moving Occupations by Sex
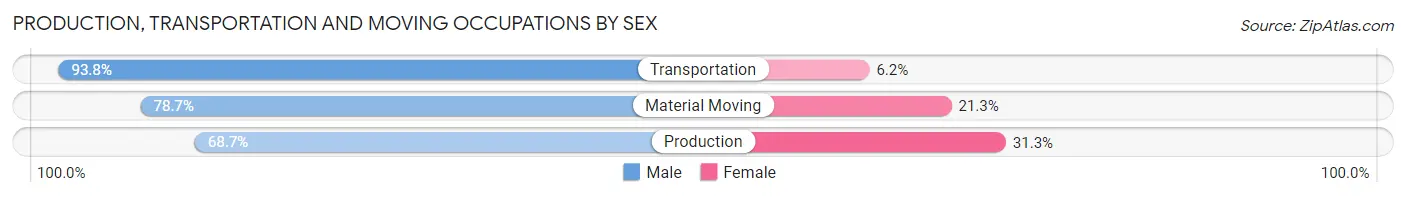
| Occupation | Male | Female |
| Production | 387 (68.7%) | 176 (31.3%) |
| Transportation | 286 (93.8%) | 19 (6.2%) |
| Material Moving | 281 (78.7%) | 76 (21.3%) |
| Total (Category) | 954 (77.9%) | 271 (22.1%) |
| Total (Overall) | 4,516 (51.2%) | 4,298 (48.8%) |
Employment Industries by Sex in Laconia
Employment Industries in Laconia
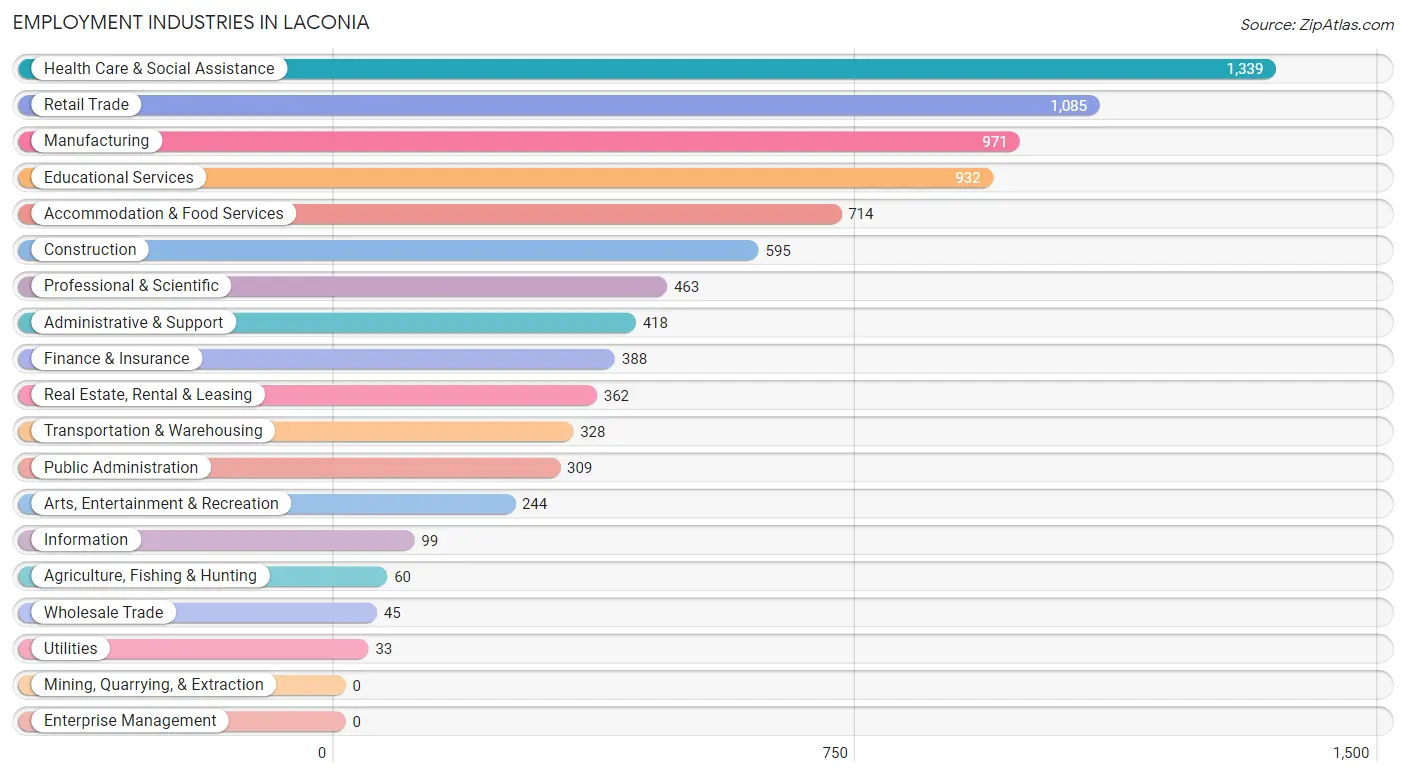
The major employment industries in Laconia include Health Care & Social Assistance (1,339 | 15.2%), Retail Trade (1,085 | 12.3%), Manufacturing (971 | 11.0%), Educational Services (932 | 10.6%), and Accommodation & Food Services (714 | 8.1%).
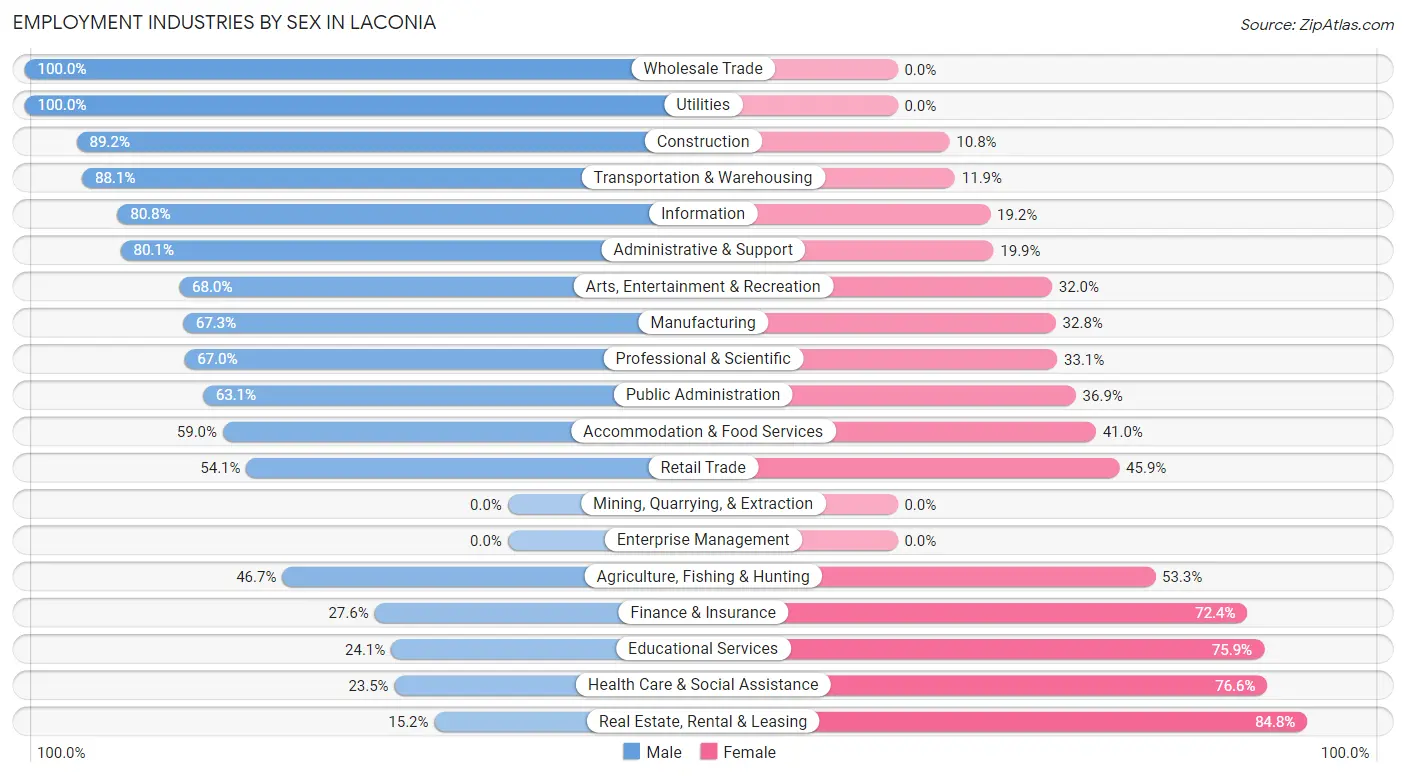
Employment Industries by Sex in Laconia
The Laconia industries that see more men than women are Wholesale Trade (100.0%), Utilities (100.0%), and Construction (89.2%), whereas the industries that tend to have a higher number of women are Real Estate, Rental & Leasing (84.8%), Health Care & Social Assistance (76.5%), and Educational Services (75.9%).
| Industry | Male | Female |
| Agriculture, Fishing & Hunting | 28 (46.7%) | 32 (53.3%) |
| Mining, Quarrying, & Extraction | 0 (0.0%) | 0 (0.0%) |
| Construction | 531 (89.2%) | 64 (10.8%) |
| Manufacturing | 653 (67.2%) | 318 (32.8%) |
| Wholesale Trade | 45 (100.0%) | 0 (0.0%) |
| Retail Trade | 587 (54.1%) | 498 (45.9%) |
| Transportation & Warehousing | 289 (88.1%) | 39 (11.9%) |
| Utilities | 33 (100.0%) | 0 (0.0%) |
| Information | 80 (80.8%) | 19 (19.2%) |
| Finance & Insurance | 107 (27.6%) | 281 (72.4%) |
| Real Estate, Rental & Leasing | 55 (15.2%) | 307 (84.8%) |
| Professional & Scientific | 310 (66.9%) | 153 (33.1%) |
| Enterprise Management | 0 (0.0%) | 0 (0.0%) |
| Administrative & Support | 335 (80.1%) | 83 (19.9%) |
| Educational Services | 225 (24.1%) | 707 (75.9%) |
| Health Care & Social Assistance | 314 (23.4%) | 1,025 (76.5%) |
| Arts, Entertainment & Recreation | 166 (68.0%) | 78 (32.0%) |
| Accommodation & Food Services | 421 (59.0%) | 293 (41.0%) |
| Public Administration | 195 (63.1%) | 114 (36.9%) |
| Total | 4,516 (51.2%) | 4,298 (48.8%) |
Education in Laconia
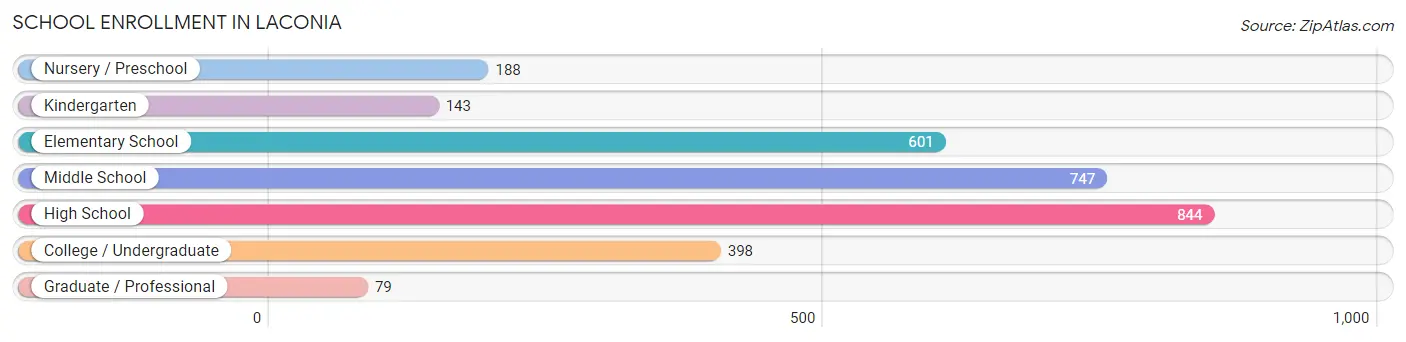
School Enrollment in Laconia
The most common levels of schooling among the 3,000 students in Laconia are high school (844 | 28.1%), middle school (747 | 24.9%), and elementary school (601 | 20.0%).
| School Level | # Students | % Students |
| Nursery / Preschool | 188 | 6.3% |
| Kindergarten | 143 | 4.8% |
| Elementary School | 601 | 20.0% |
| Middle School | 747 | 24.9% |
| High School | 844 | 28.1% |
| College / Undergraduate | 398 | 13.3% |
| Graduate / Professional | 79 | 2.6% |
| Total | 3,000 | 100.0% |
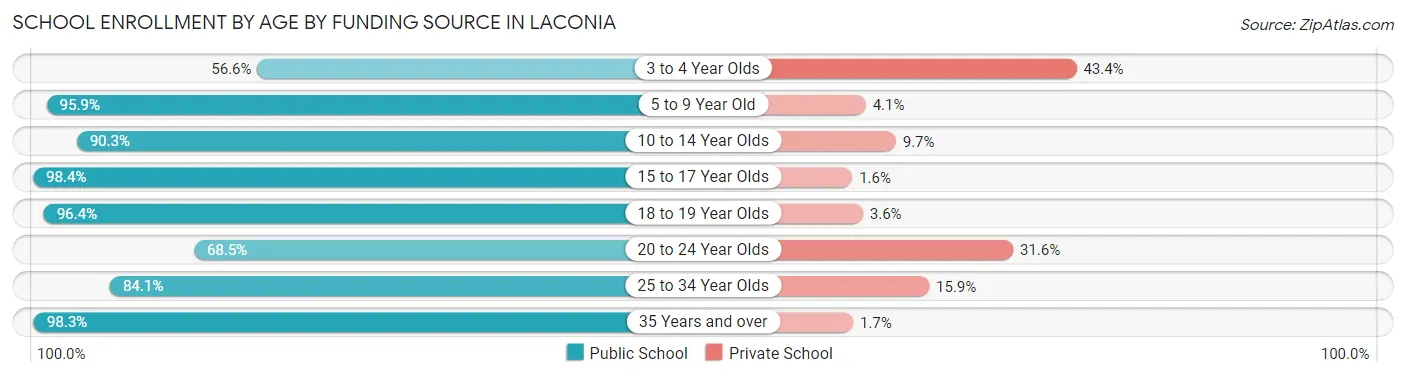
School Enrollment by Age by Funding Source in Laconia
Out of a total of 3,000 students who are enrolled in schools in Laconia, 285 (9.5%) attend a private institution, while the remaining 2,715 (90.5%) are enrolled in public schools. The age group of 3 to 4 year olds has the highest likelihood of being enrolled in private schools, with 62 (43.4% in the age bracket) enrolled. Conversely, the age group of 15 to 17 year olds has the lowest likelihood of being enrolled in a private school, with 553 (98.4% in the age bracket) attending a public institution.
| Age Bracket | Public School | Private School |
| 3 to 4 Year Olds | 81 (56.6%) | 62 (43.4%) |
| 5 to 9 Year Old | 632 (95.9%) | 27 (4.1%) |
| 10 to 14 Year Olds | 930 (90.3%) | 100 (9.7%) |
| 15 to 17 Year Olds | 553 (98.4%) | 9 (1.6%) |
| 18 to 19 Year Olds | 135 (96.4%) | 5 (3.6%) |
| 20 to 24 Year Olds | 141 (68.4%) | 65 (31.6%) |
| 25 to 34 Year Olds | 74 (84.1%) | 14 (15.9%) |
| 35 Years and over | 169 (98.3%) | 3 (1.7%) |
| Total | 2,715 (90.5%) | 285 (9.5%) |
Educational Attainment by Field of Study in Laconia
Business (903 | 24.4%), education (417 | 11.3%), social sciences (353 | 9.5%), arts & humanities (324 | 8.7%), and engineering (228 | 6.2%) are the most common fields of study among 3,701 individuals in Laconia who have obtained a bachelor's degree or higher.
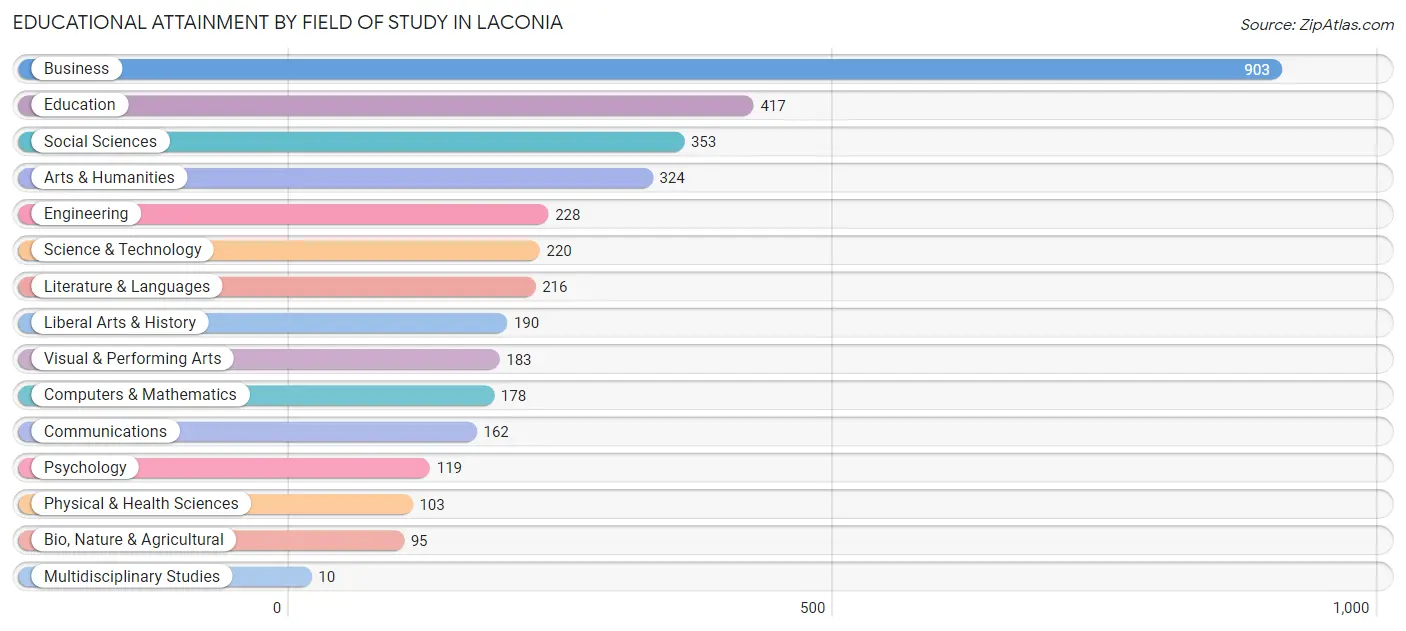
| Field of Study | # Graduates | % Graduates |
| Computers & Mathematics | 178 | 4.8% |
| Bio, Nature & Agricultural | 95 | 2.6% |
| Physical & Health Sciences | 103 | 2.8% |
| Psychology | 119 | 3.2% |
| Social Sciences | 353 | 9.5% |
| Engineering | 228 | 6.2% |
| Multidisciplinary Studies | 10 | 0.3% |
| Science & Technology | 220 | 5.9% |
| Business | 903 | 24.4% |
| Education | 417 | 11.3% |
| Literature & Languages | 216 | 5.8% |
| Liberal Arts & History | 190 | 5.1% |
| Visual & Performing Arts | 183 | 4.9% |
| Communications | 162 | 4.4% |
| Arts & Humanities | 324 | 8.7% |
| Total | 3,701 | 100.0% |
Transportation & Commute in Laconia
Vehicle Availability by Sex in Laconia
The most prevalent vehicle ownership categories in Laconia are males with 2 vehicles (1,765, accounting for 39.1%) and females with 2 vehicles (1,425, making up 43.3%).
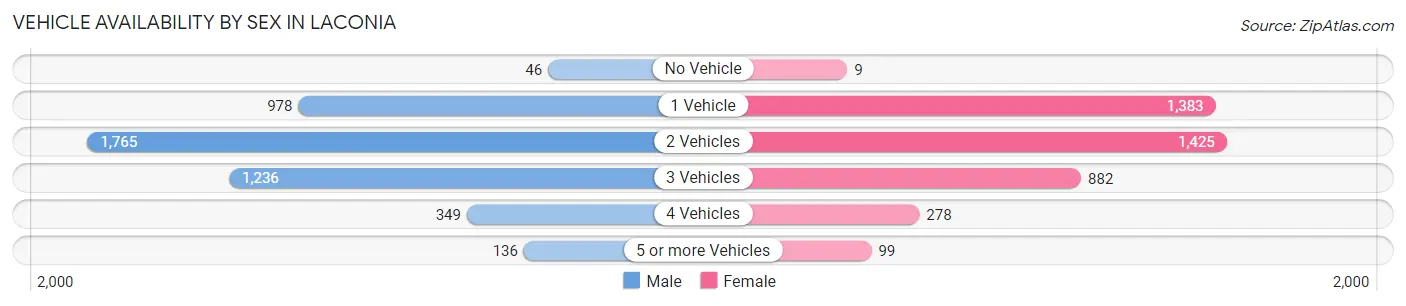
| Vehicles Available | Male | Female |
| No Vehicle | 46 (1.0%) | 9 (0.2%) |
| 1 Vehicle | 978 (21.7%) | 1,383 (33.9%) |
| 2 Vehicles | 1,765 (39.1%) | 1,425 (35.0%) |
| 3 Vehicles | 1,236 (27.4%) | 882 (21.6%) |
| 4 Vehicles | 349 (7.7%) | 278 (6.8%) |
| 5 or more Vehicles | 136 (3.0%) | 99 (2.4%) |
| Total | 4,510 (100.0%) | 4,076 (100.0%) |
Commute Time in Laconia
The most frequently occuring commute durations in Laconia are 10 to 14 minutes (1,803 commuters, 22.5%), 5 to 9 minutes (1,796 commuters, 22.4%), and 15 to 19 minutes (1,105 commuters, 13.8%).
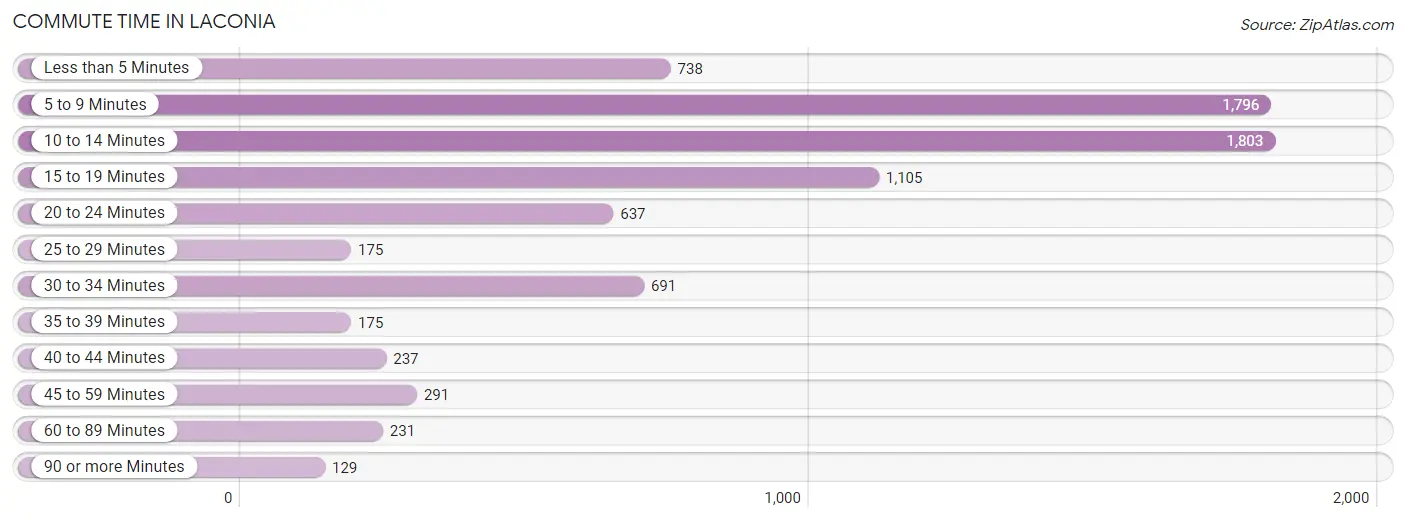
| Commute Time | # Commuters | % Commuters |
| Less than 5 Minutes | 738 | 9.2% |
| 5 to 9 Minutes | 1,796 | 22.4% |
| 10 to 14 Minutes | 1,803 | 22.5% |
| 15 to 19 Minutes | 1,105 | 13.8% |
| 20 to 24 Minutes | 637 | 8.0% |
| 25 to 29 Minutes | 175 | 2.2% |
| 30 to 34 Minutes | 691 | 8.6% |
| 35 to 39 Minutes | 175 | 2.2% |
| 40 to 44 Minutes | 237 | 3.0% |
| 45 to 59 Minutes | 291 | 3.6% |
| 60 to 89 Minutes | 231 | 2.9% |
| 90 or more Minutes | 129 | 1.6% |
Commute Time by Sex in Laconia
The most common commute times in Laconia are 5 to 9 minutes (939 commuters, 22.6%) for males and 10 to 14 minutes (927 commuters, 24.1%) for females.
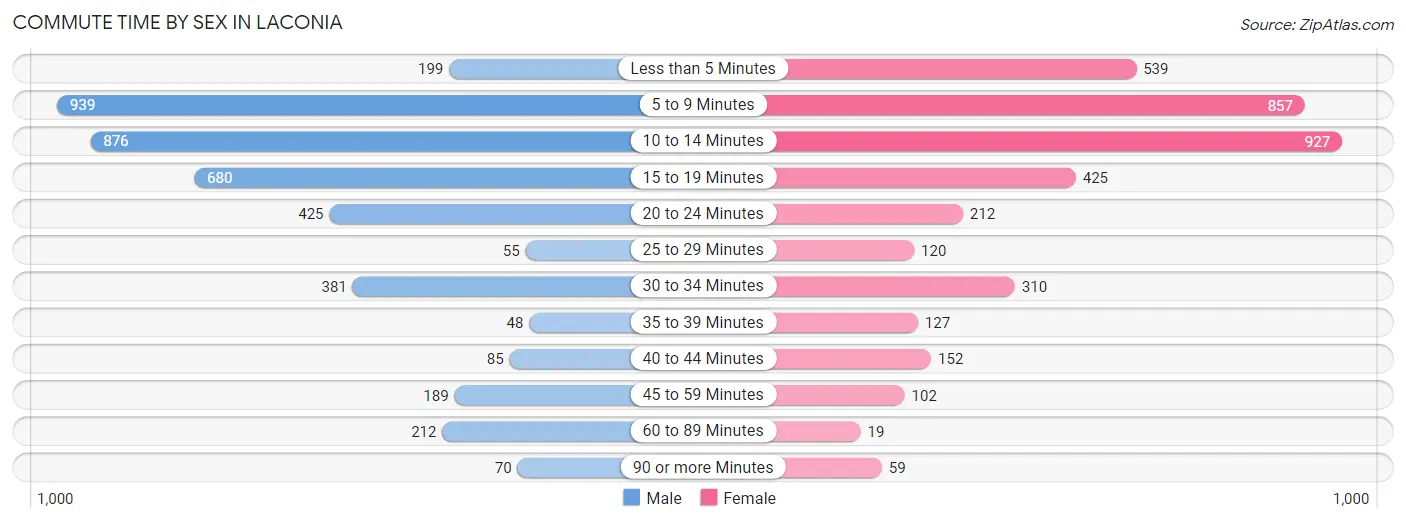
| Commute Time | Male | Female |
| Less than 5 Minutes | 199 (4.8%) | 539 (14.0%) |
| 5 to 9 Minutes | 939 (22.6%) | 857 (22.3%) |
| 10 to 14 Minutes | 876 (21.1%) | 927 (24.1%) |
| 15 to 19 Minutes | 680 (16.4%) | 425 (11.0%) |
| 20 to 24 Minutes | 425 (10.2%) | 212 (5.5%) |
| 25 to 29 Minutes | 55 (1.3%) | 120 (3.1%) |
| 30 to 34 Minutes | 381 (9.2%) | 310 (8.1%) |
| 35 to 39 Minutes | 48 (1.1%) | 127 (3.3%) |
| 40 to 44 Minutes | 85 (2.0%) | 152 (4.0%) |
| 45 to 59 Minutes | 189 (4.5%) | 102 (2.6%) |
| 60 to 89 Minutes | 212 (5.1%) | 19 (0.5%) |
| 90 or more Minutes | 70 (1.7%) | 59 (1.5%) |
Time of Departure to Work by Sex in Laconia
The most frequent times of departure to work in Laconia are 7:00 AM to 7:29 AM (849, 20.4%) for males and 12:00 PM to 3:59 PM (615, 16.0%) for females.
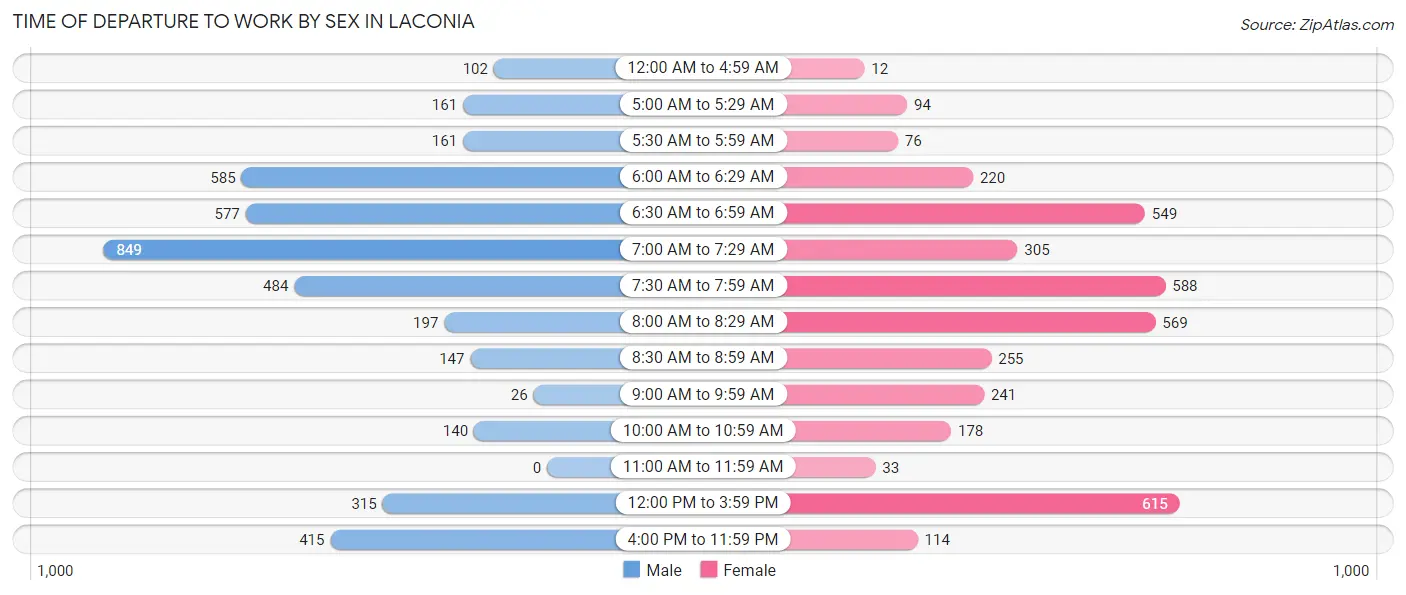
| Time of Departure | Male | Female |
| 12:00 AM to 4:59 AM | 102 (2.5%) | 12 (0.3%) |
| 5:00 AM to 5:29 AM | 161 (3.9%) | 94 (2.4%) |
| 5:30 AM to 5:59 AM | 161 (3.9%) | 76 (2.0%) |
| 6:00 AM to 6:29 AM | 585 (14.1%) | 220 (5.7%) |
| 6:30 AM to 6:59 AM | 577 (13.9%) | 549 (14.3%) |
| 7:00 AM to 7:29 AM | 849 (20.4%) | 305 (7.9%) |
| 7:30 AM to 7:59 AM | 484 (11.6%) | 588 (15.3%) |
| 8:00 AM to 8:29 AM | 197 (4.7%) | 569 (14.8%) |
| 8:30 AM to 8:59 AM | 147 (3.5%) | 255 (6.6%) |
| 9:00 AM to 9:59 AM | 26 (0.6%) | 241 (6.3%) |
| 10:00 AM to 10:59 AM | 140 (3.4%) | 178 (4.6%) |
| 11:00 AM to 11:59 AM | 0 (0.0%) | 33 (0.9%) |
| 12:00 PM to 3:59 PM | 315 (7.6%) | 615 (16.0%) |
| 4:00 PM to 11:59 PM | 415 (10.0%) | 114 (3.0%) |
| Total | 4,159 (100.0%) | 3,849 (100.0%) |
Housing Occupancy in Laconia
Occupancy by Ownership in Laconia
Of the total 6,965 dwellings in Laconia, owner-occupied units account for 4,095 (58.8%), while renter-occupied units make up 2,870 (41.2%).
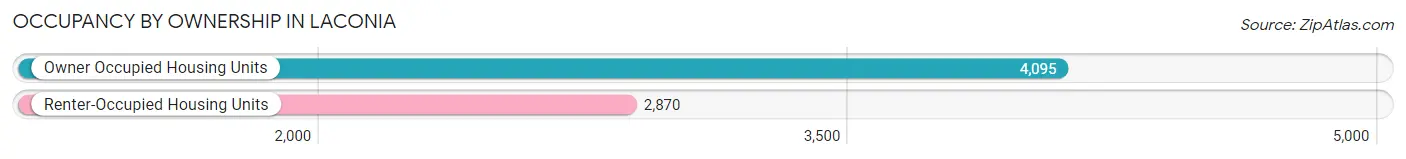
| Occupancy | # Housing Units | % Housing Units |
| Owner Occupied Housing Units | 4,095 | 58.8% |
| Renter-Occupied Housing Units | 2,870 | 41.2% |
| Total Occupied Housing Units | 6,965 | 100.0% |
Occupancy by Household Size in Laconia
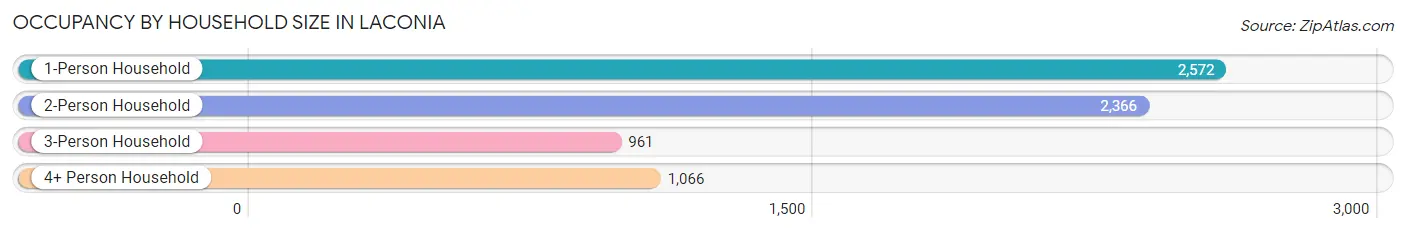
| Household Size | # Housing Units | % Housing Units |
| 1-Person Household | 2,572 | 36.9% |
| 2-Person Household | 2,366 | 34.0% |
| 3-Person Household | 961 | 13.8% |
| 4+ Person Household | 1,066 | 15.3% |
| Total Housing Units | 6,965 | 100.0% |
Occupancy by Ownership by Household Size in Laconia
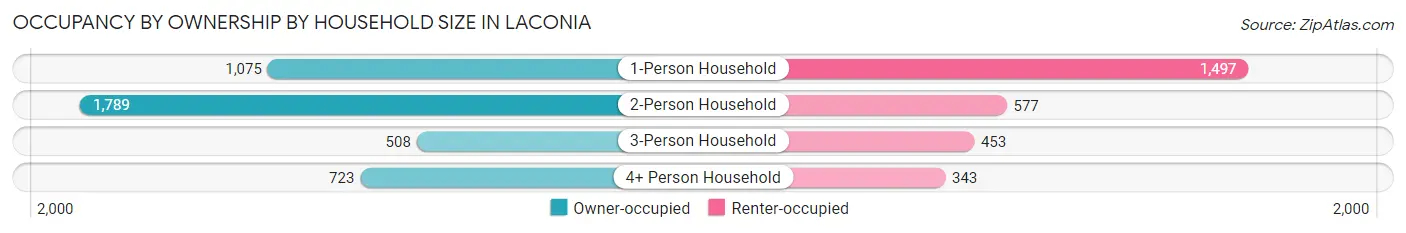
| Household Size | Owner-occupied | Renter-occupied |
| 1-Person Household | 1,075 (41.8%) | 1,497 (58.2%) |
| 2-Person Household | 1,789 (75.6%) | 577 (24.4%) |
| 3-Person Household | 508 (52.9%) | 453 (47.1%) |
| 4+ Person Household | 723 (67.8%) | 343 (32.2%) |
| Total Housing Units | 4,095 (58.8%) | 2,870 (41.2%) |
Occupancy by Educational Attainment in Laconia
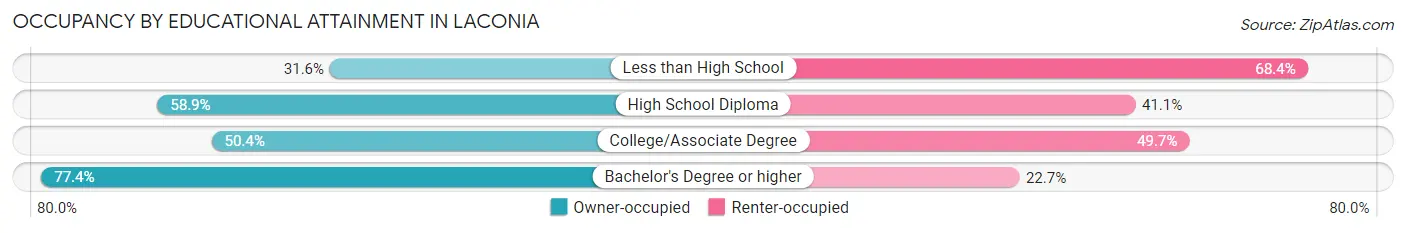
| Household Size | Owner-occupied | Renter-occupied |
| Less than High School | 162 (31.6%) | 351 (68.4%) |
| High School Diploma | 1,055 (58.9%) | 735 (41.1%) |
| College/Associate Degree | 1,358 (50.3%) | 1,339 (49.6%) |
| Bachelor's Degree or higher | 1,520 (77.3%) | 445 (22.7%) |
Occupancy by Age of Householder in Laconia
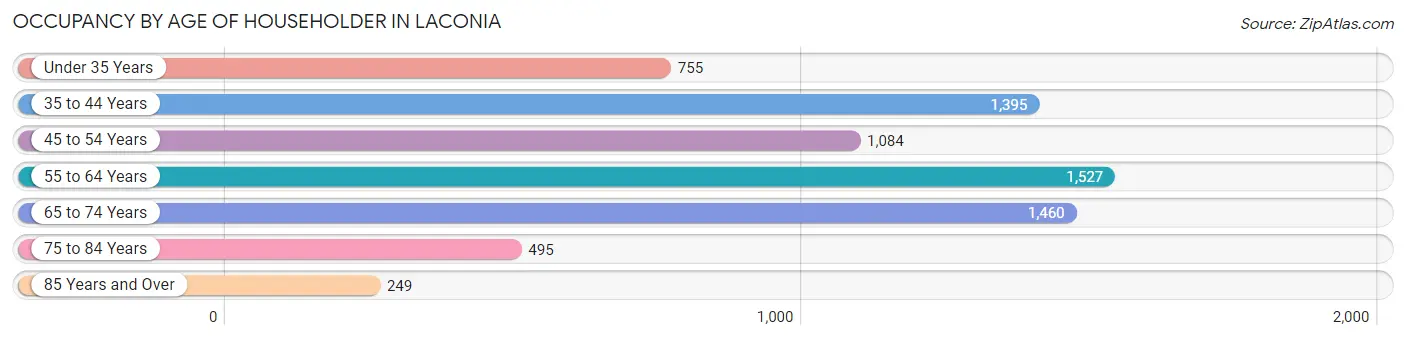
| Age Bracket | # Households | % Households |
| Under 35 Years | 755 | 10.8% |
| 35 to 44 Years | 1,395 | 20.0% |
| 45 to 54 Years | 1,084 | 15.6% |
| 55 to 64 Years | 1,527 | 21.9% |
| 65 to 74 Years | 1,460 | 21.0% |
| 75 to 84 Years | 495 | 7.1% |
| 85 Years and Over | 249 | 3.6% |
| Total | 6,965 | 100.0% |
Housing Finances in Laconia
Median Income by Occupancy in Laconia
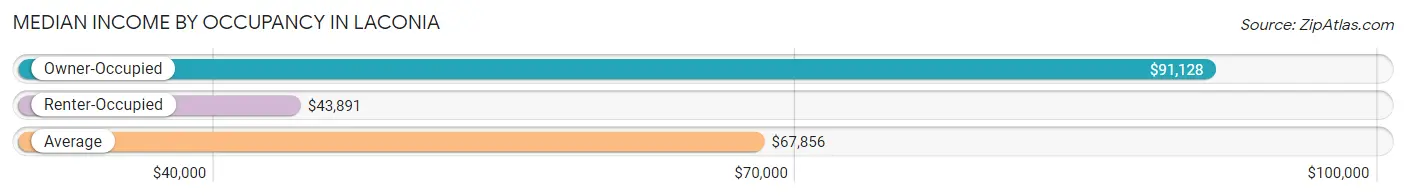
| Occupancy Type | # Households | Median Income |
| Owner-Occupied | 4,095 (58.8%) | $91,128 |
| Renter-Occupied | 2,870 (41.2%) | $43,891 |
| Average | 6,965 (100.0%) | $67,856 |
Occupancy by Householder Income Bracket in Laconia
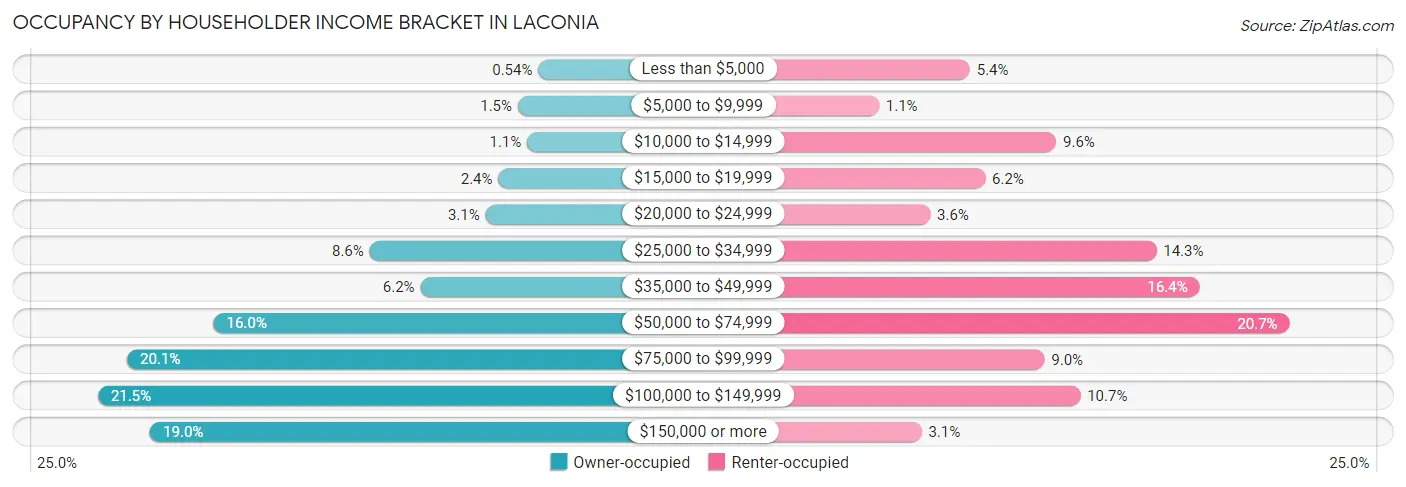
| Income Bracket | Owner-occupied | Renter-occupied |
| Less than $5,000 | 22 (0.5%) | 156 (5.4%) |
| $5,000 to $9,999 | 62 (1.5%) | 32 (1.1%) |
| $10,000 to $14,999 | 44 (1.1%) | 274 (9.6%) |
| $15,000 to $19,999 | 100 (2.4%) | 177 (6.2%) |
| $20,000 to $24,999 | 125 (3.0%) | 102 (3.5%) |
| $25,000 to $34,999 | 351 (8.6%) | 411 (14.3%) |
| $35,000 to $49,999 | 252 (6.1%) | 470 (16.4%) |
| $50,000 to $74,999 | 655 (16.0%) | 593 (20.7%) |
| $75,000 to $99,999 | 824 (20.1%) | 258 (9.0%) |
| $100,000 to $149,999 | 881 (21.5%) | 307 (10.7%) |
| $150,000 or more | 779 (19.0%) | 90 (3.1%) |
| Total | 4,095 (100.0%) | 2,870 (100.0%) |
Monthly Housing Cost Tiers in Laconia
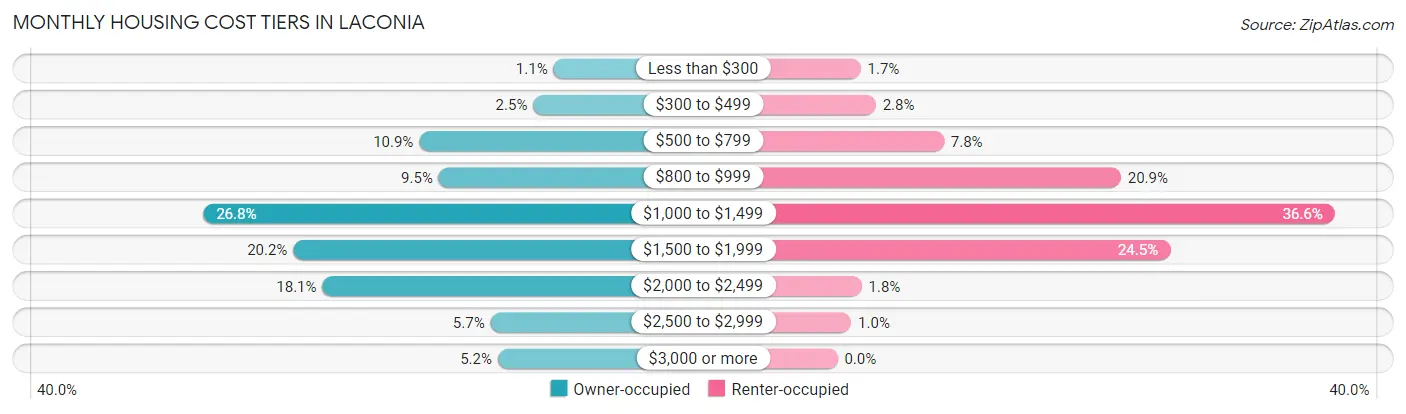
| Monthly Cost | Owner-occupied | Renter-occupied |
| Less than $300 | 43 (1.1%) | 49 (1.7%) |
| $300 to $499 | 104 (2.5%) | 81 (2.8%) |
| $500 to $799 | 448 (10.9%) | 225 (7.8%) |
| $800 to $999 | 389 (9.5%) | 599 (20.9%) |
| $1,000 to $1,499 | 1,099 (26.8%) | 1,051 (36.6%) |
| $1,500 to $1,999 | 828 (20.2%) | 703 (24.5%) |
| $2,000 to $2,499 | 740 (18.1%) | 51 (1.8%) |
| $2,500 to $2,999 | 233 (5.7%) | 29 (1.0%) |
| $3,000 or more | 211 (5.1%) | 0 (0.0%) |
| Total | 4,095 (100.0%) | 2,870 (100.0%) |
Physical Housing Characteristics in Laconia
Housing Structures in Laconia
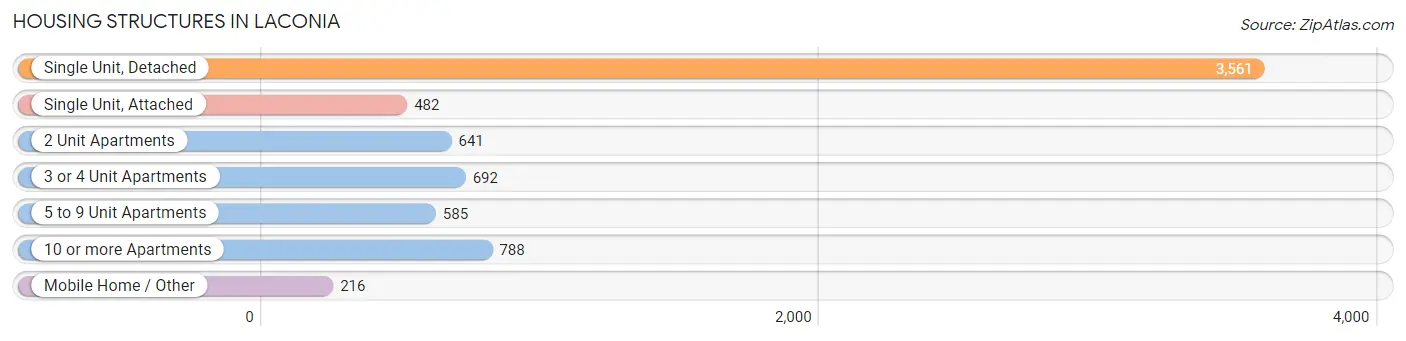
| Structure Type | # Housing Units | % Housing Units |
| Single Unit, Detached | 3,561 | 51.1% |
| Single Unit, Attached | 482 | 6.9% |
| 2 Unit Apartments | 641 | 9.2% |
| 3 or 4 Unit Apartments | 692 | 9.9% |
| 5 to 9 Unit Apartments | 585 | 8.4% |
| 10 or more Apartments | 788 | 11.3% |
| Mobile Home / Other | 216 | 3.1% |
| Total | 6,965 | 100.0% |
Housing Structures by Occupancy in Laconia
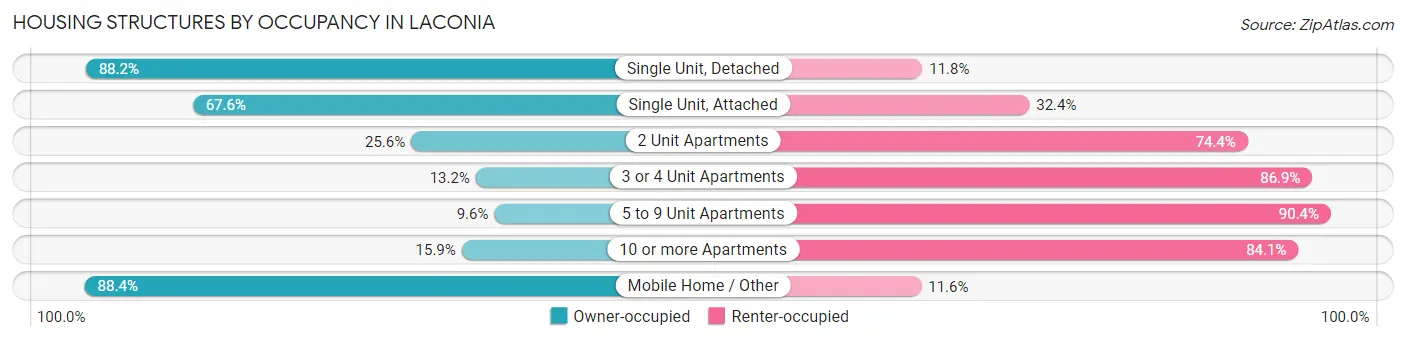
| Structure Type | Owner-occupied | Renter-occupied |
| Single Unit, Detached | 3,142 (88.2%) | 419 (11.8%) |
| Single Unit, Attached | 326 (67.6%) | 156 (32.4%) |
| 2 Unit Apartments | 164 (25.6%) | 477 (74.4%) |
| 3 or 4 Unit Apartments | 91 (13.2%) | 601 (86.9%) |
| 5 to 9 Unit Apartments | 56 (9.6%) | 529 (90.4%) |
| 10 or more Apartments | 125 (15.9%) | 663 (84.1%) |
| Mobile Home / Other | 191 (88.4%) | 25 (11.6%) |
| Total | 4,095 (58.8%) | 2,870 (41.2%) |
Housing Structures by Number of Rooms in Laconia
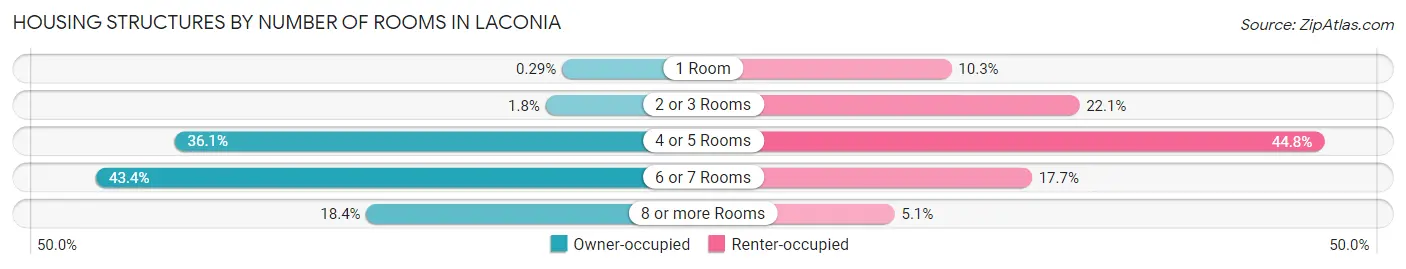
| Number of Rooms | Owner-occupied | Renter-occupied |
| 1 Room | 12 (0.3%) | 296 (10.3%) |
| 2 or 3 Rooms | 74 (1.8%) | 635 (22.1%) |
| 4 or 5 Rooms | 1,479 (36.1%) | 1,285 (44.8%) |
| 6 or 7 Rooms | 1,777 (43.4%) | 509 (17.7%) |
| 8 or more Rooms | 753 (18.4%) | 145 (5.1%) |
| Total | 4,095 (100.0%) | 2,870 (100.0%) |
Housing Structure by Heating Type in Laconia
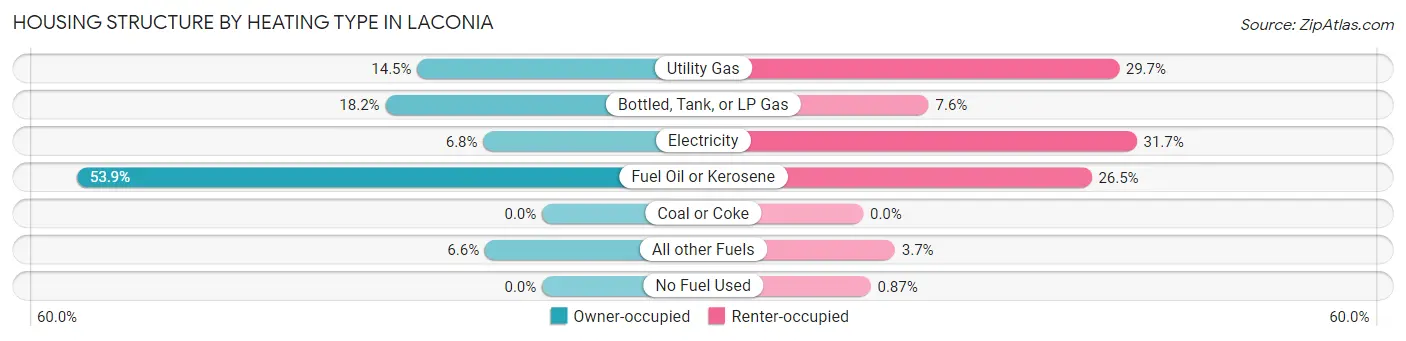
| Heating Type | Owner-occupied | Renter-occupied |
| Utility Gas | 592 (14.5%) | 851 (29.6%) |
| Bottled, Tank, or LP Gas | 744 (18.2%) | 218 (7.6%) |
| Electricity | 279 (6.8%) | 910 (31.7%) |
| Fuel Oil or Kerosene | 2,209 (53.9%) | 760 (26.5%) |
| Coal or Coke | 0 (0.0%) | 0 (0.0%) |
| All other Fuels | 271 (6.6%) | 106 (3.7%) |
| No Fuel Used | 0 (0.0%) | 25 (0.9%) |
| Total | 4,095 (100.0%) | 2,870 (100.0%) |
Household Vehicle Usage in Laconia
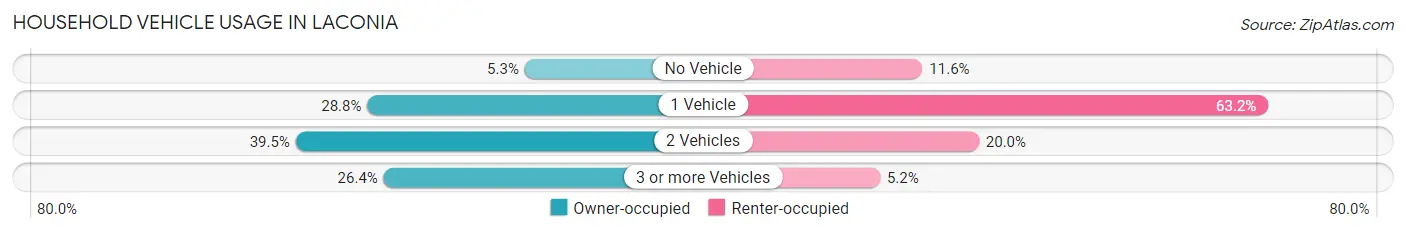
| Vehicles per Household | Owner-occupied | Renter-occupied |
| No Vehicle | 217 (5.3%) | 332 (11.6%) |
| 1 Vehicle | 1,180 (28.8%) | 1,814 (63.2%) |
| 2 Vehicles | 1,618 (39.5%) | 574 (20.0%) |
| 3 or more Vehicles | 1,080 (26.4%) | 150 (5.2%) |
| Total | 4,095 (100.0%) | 2,870 (100.0%) |
Real Estate & Mortgages in Laconia
Real Estate and Mortgage Overview in Laconia
| Characteristic | Without Mortgage | With Mortgage |
| Housing Units | 1,527 | 2,568 |
| Median Property Value | $304,000 | $235,600 |
| Median Household Income | $62,391 | $531 |
| Monthly Housing Costs | $944 | $189 |
| Real Estate Taxes | $4,620 | $0 |
Property Value by Mortgage Status in Laconia
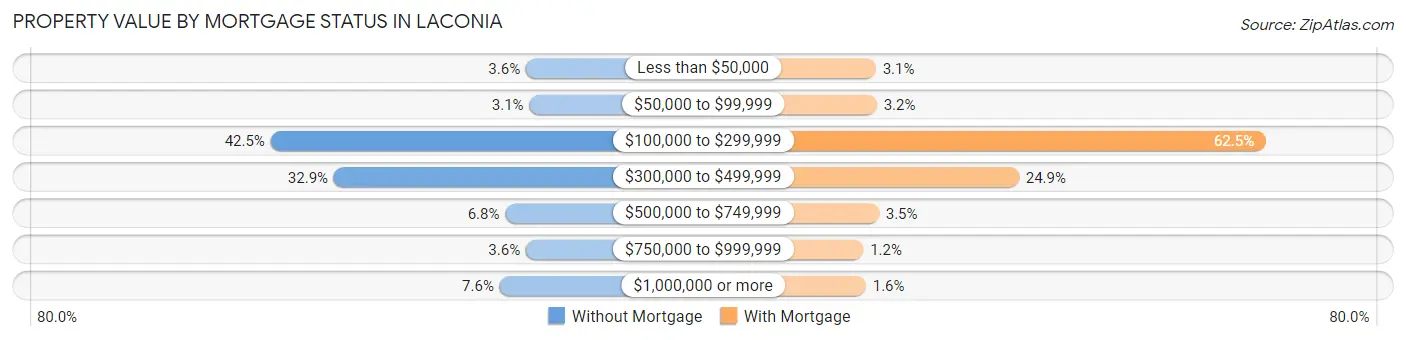
| Property Value | Without Mortgage | With Mortgage |
| Less than $50,000 | 55 (3.6%) | 79 (3.1%) |
| $50,000 to $99,999 | 47 (3.1%) | 83 (3.2%) |
| $100,000 to $299,999 | 649 (42.5%) | 1,606 (62.5%) |
| $300,000 to $499,999 | 502 (32.9%) | 639 (24.9%) |
| $500,000 to $749,999 | 103 (6.8%) | 91 (3.5%) |
| $750,000 to $999,999 | 55 (3.6%) | 30 (1.2%) |
| $1,000,000 or more | 116 (7.6%) | 40 (1.6%) |
| Total | 1,527 (100.0%) | 2,568 (100.0%) |
Household Income by Mortgage Status in Laconia
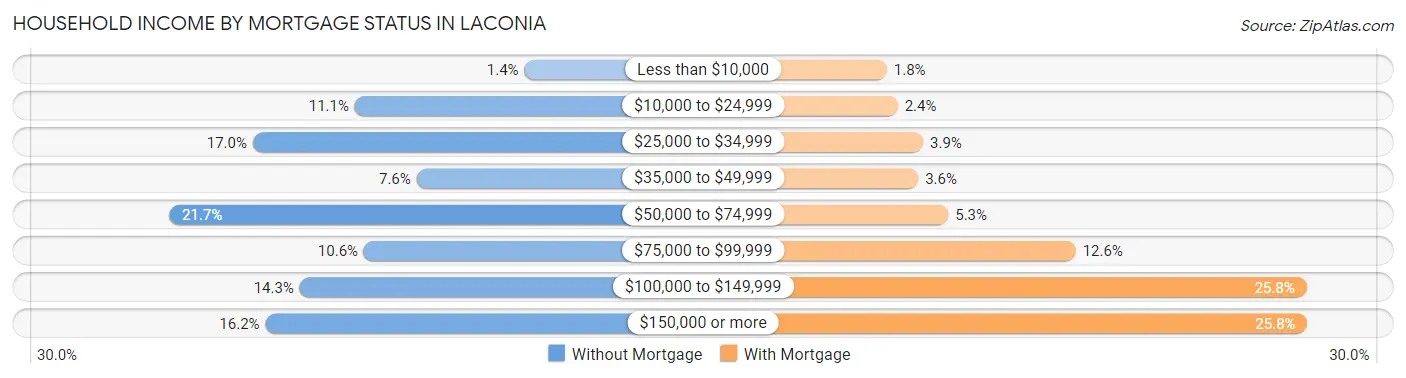
| Household Income | Without Mortgage | With Mortgage |
| Less than $10,000 | 22 (1.4%) | 46 (1.8%) |
| $10,000 to $24,999 | 170 (11.1%) | 62 (2.4%) |
| $25,000 to $34,999 | 259 (17.0%) | 99 (3.9%) |
| $35,000 to $49,999 | 116 (7.6%) | 92 (3.6%) |
| $50,000 to $74,999 | 332 (21.7%) | 136 (5.3%) |
| $75,000 to $99,999 | 162 (10.6%) | 323 (12.6%) |
| $100,000 to $149,999 | 218 (14.3%) | 662 (25.8%) |
| $150,000 or more | 248 (16.2%) | 663 (25.8%) |
| Total | 1,527 (100.0%) | 2,568 (100.0%) |
Property Value to Household Income Ratio in Laconia
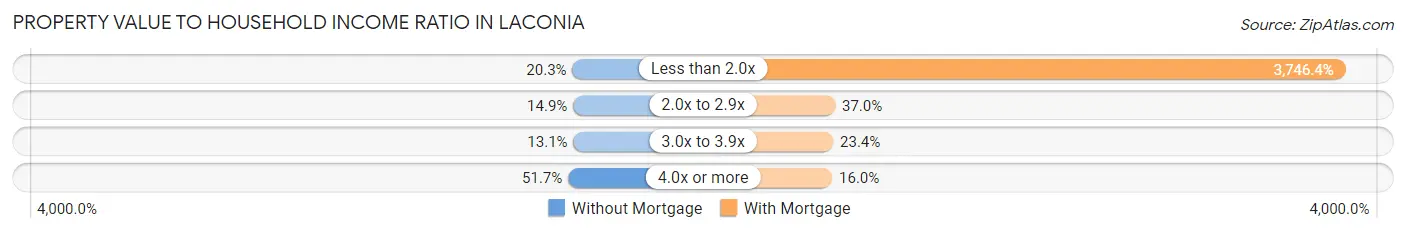
| Value-to-Income Ratio | Without Mortgage | With Mortgage |
| Less than 2.0x | 310 (20.3%) | 96,207 (3,746.4%) |
| 2.0x to 2.9x | 228 (14.9%) | 949 (36.9%) |
| 3.0x to 3.9x | 200 (13.1%) | 600 (23.4%) |
| 4.0x or more | 789 (51.7%) | 410 (16.0%) |
| Total | 1,527 (100.0%) | 2,568 (100.0%) |
Real Estate Taxes by Mortgage Status in Laconia
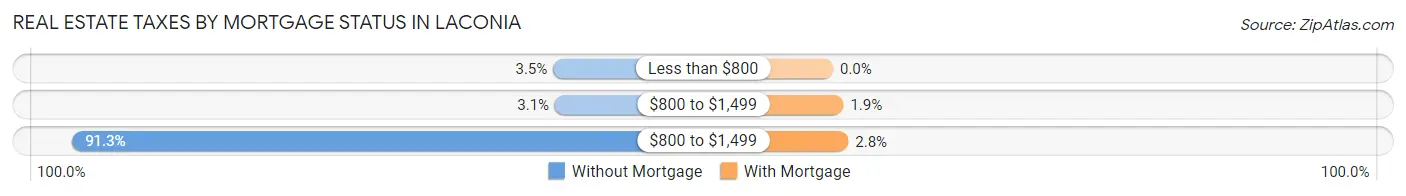
| Property Taxes | Without Mortgage | With Mortgage |
| Less than $800 | 53 (3.5%) | 0 (0.0%) |
| $800 to $1,499 | 48 (3.1%) | 49 (1.9%) |
| $800 to $1,499 | 1,394 (91.3%) | 72 (2.8%) |
| Total | 1,527 (100.0%) | 2,568 (100.0%) |
Health & Disability in Laconia
Health Insurance Coverage by Age in Laconia
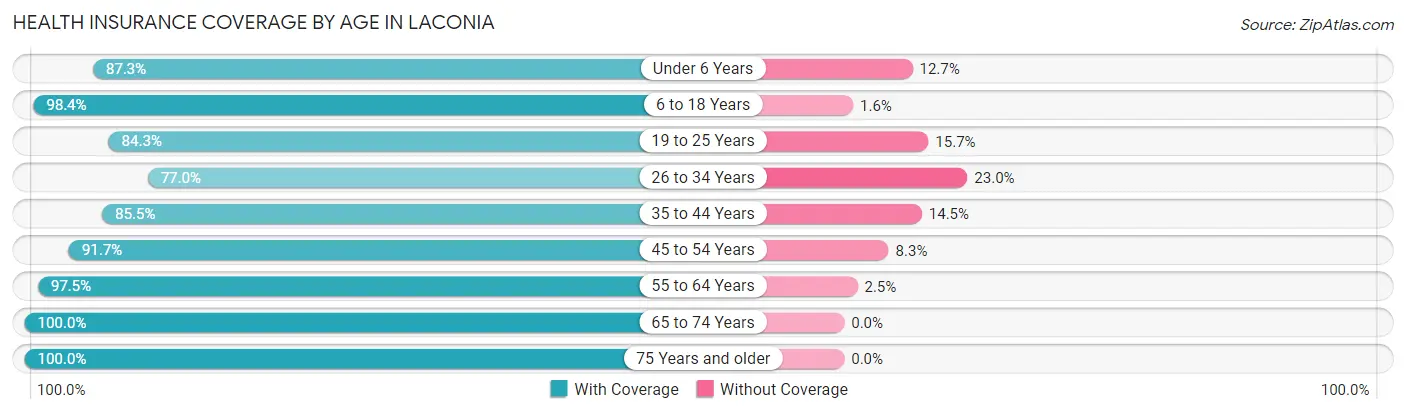
| Age Bracket | With Coverage | Without Coverage |
| Under 6 Years | 761 (87.3%) | 111 (12.7%) |
| 6 to 18 Years | 2,406 (98.4%) | 40 (1.6%) |
| 19 to 25 Years | 1,108 (84.3%) | 206 (15.7%) |
| 26 to 34 Years | 1,359 (77.0%) | 405 (23.0%) |
| 35 to 44 Years | 1,893 (85.5%) | 320 (14.5%) |
| 45 to 54 Years | 1,663 (91.7%) | 150 (8.3%) |
| 55 to 64 Years | 2,523 (97.5%) | 64 (2.5%) |
| 65 to 74 Years | 2,398 (100.0%) | 0 (0.0%) |
| 75 Years and older | 987 (100.0%) | 0 (0.0%) |
| Total | 15,098 (92.1%) | 1,296 (7.9%) |
Health Insurance Coverage by Citizenship Status in Laconia
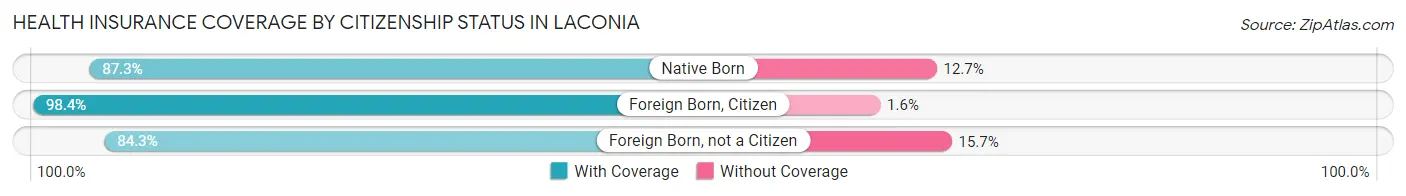
| Citizenship Status | With Coverage | Without Coverage |
| Native Born | 761 (87.3%) | 111 (12.7%) |
| Foreign Born, Citizen | 2,406 (98.4%) | 40 (1.6%) |
| Foreign Born, not a Citizen | 1,108 (84.3%) | 206 (15.7%) |
Health Insurance Coverage by Household Income in Laconia
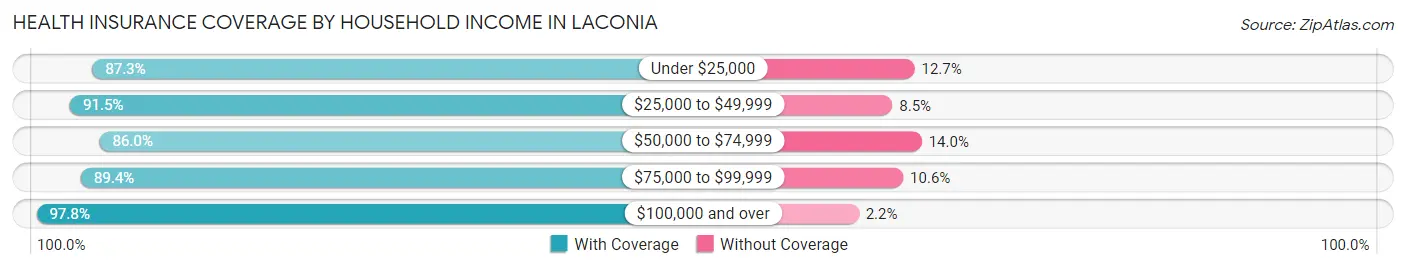
| Household Income | With Coverage | Without Coverage |
| Under $25,000 | 1,437 (87.3%) | 209 (12.7%) |
| $25,000 to $49,999 | 2,387 (91.5%) | 223 (8.5%) |
| $50,000 to $74,999 | 2,425 (86.0%) | 396 (14.0%) |
| $75,000 to $99,999 | 2,787 (89.4%) | 329 (10.6%) |
| $100,000 and over | 5,967 (97.8%) | 136 (2.2%) |
Public vs Private Health Insurance Coverage by Age in Laconia
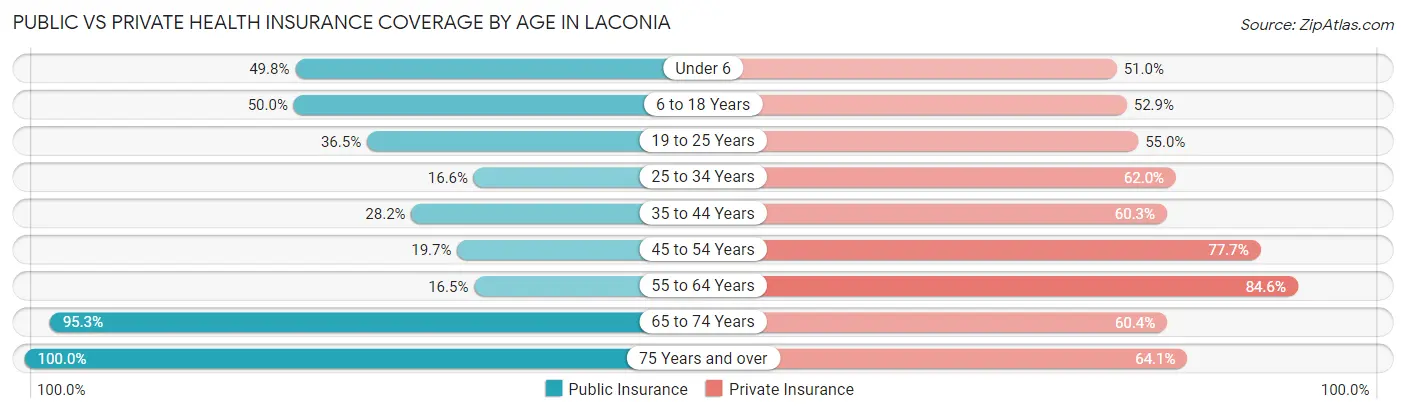
| Age Bracket | Public Insurance | Private Insurance |
| Under 6 | 434 (49.8%) | 445 (51.0%) |
| 6 to 18 Years | 1,224 (50.0%) | 1,294 (52.9%) |
| 19 to 25 Years | 479 (36.4%) | 723 (55.0%) |
| 25 to 34 Years | 293 (16.6%) | 1,094 (62.0%) |
| 35 to 44 Years | 624 (28.2%) | 1,335 (60.3%) |
| 45 to 54 Years | 357 (19.7%) | 1,409 (77.7%) |
| 55 to 64 Years | 428 (16.5%) | 2,189 (84.6%) |
| 65 to 74 Years | 2,286 (95.3%) | 1,448 (60.4%) |
| 75 Years and over | 987 (100.0%) | 633 (64.1%) |
| Total | 7,112 (43.4%) | 10,570 (64.5%) |
Disability Status by Sex by Age in Laconia
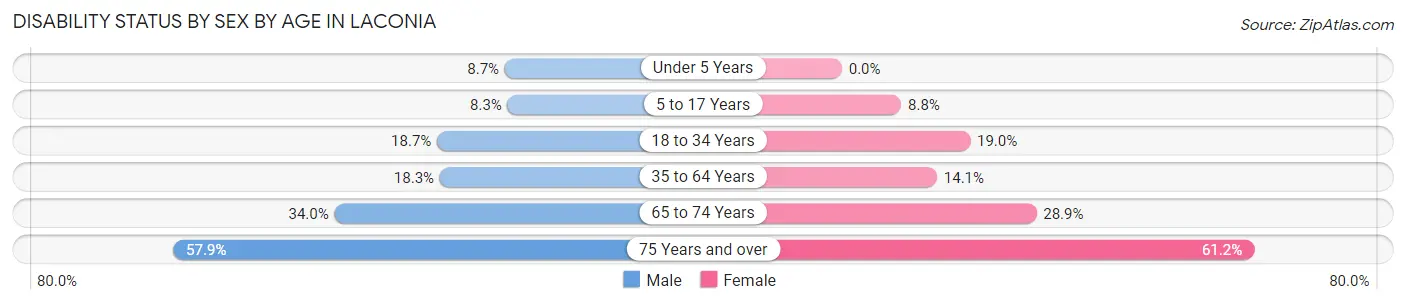
| Age Bracket | Male | Female |
| Under 5 Years | 27 (8.7%) | 0 (0.0%) |
| 5 to 17 Years | 102 (8.3%) | 100 (8.8%) |
| 18 to 34 Years | 333 (18.7%) | 290 (19.0%) |
| 35 to 64 Years | 585 (18.3%) | 483 (14.1%) |
| 65 to 74 Years | 423 (34.0%) | 333 (28.9%) |
| 75 Years and over | 197 (57.9%) | 396 (61.2%) |
Disability Class by Sex by Age in Laconia
Disability Class: Hearing Difficulty
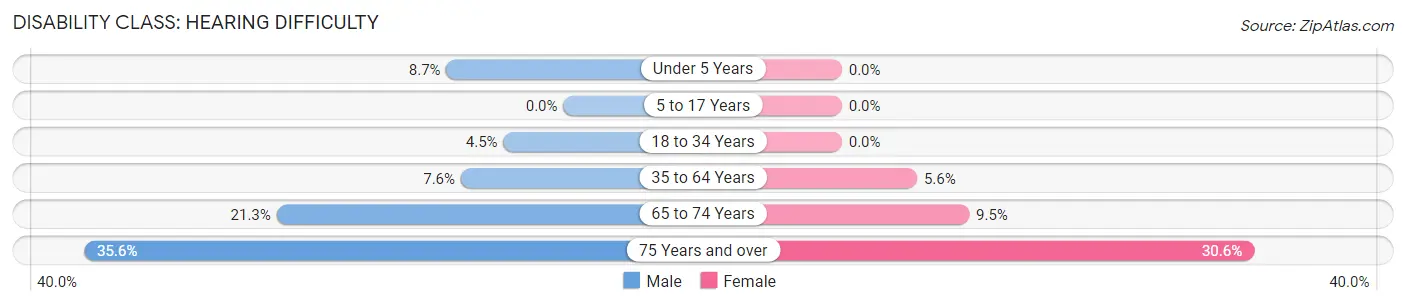
| Age Bracket | Male | Female |
| Under 5 Years | 27 (8.7%) | 0 (0.0%) |
| 5 to 17 Years | 0 (0.0%) | 0 (0.0%) |
| 18 to 34 Years | 79 (4.4%) | 0 (0.0%) |
| 35 to 64 Years | 243 (7.6%) | 191 (5.6%) |
| 65 to 74 Years | 265 (21.3%) | 109 (9.5%) |
| 75 Years and over | 121 (35.6%) | 198 (30.6%) |
Disability Class: Vision Difficulty
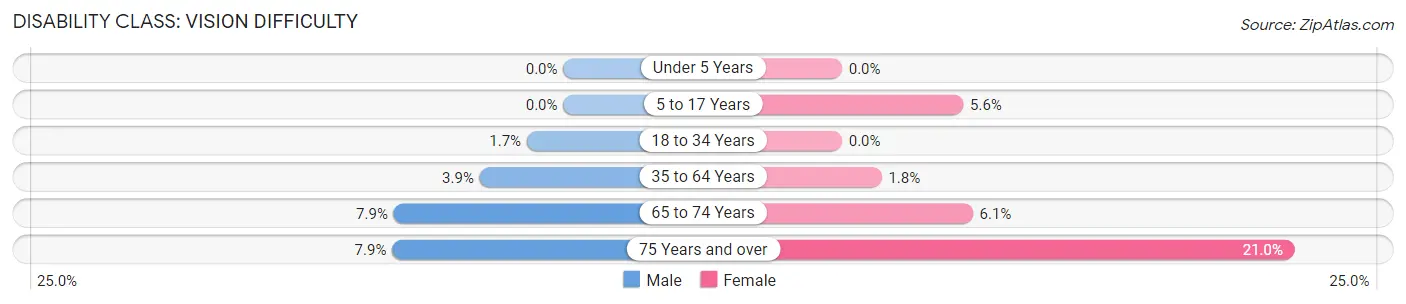
| Age Bracket | Male | Female |
| Under 5 Years | 0 (0.0%) | 0 (0.0%) |
| 5 to 17 Years | 0 (0.0%) | 64 (5.6%) |
| 18 to 34 Years | 30 (1.7%) | 0 (0.0%) |
| 35 to 64 Years | 124 (3.9%) | 63 (1.8%) |
| 65 to 74 Years | 98 (7.9%) | 70 (6.1%) |
| 75 Years and over | 27 (7.9%) | 136 (21.0%) |
Disability Class: Cognitive Difficulty
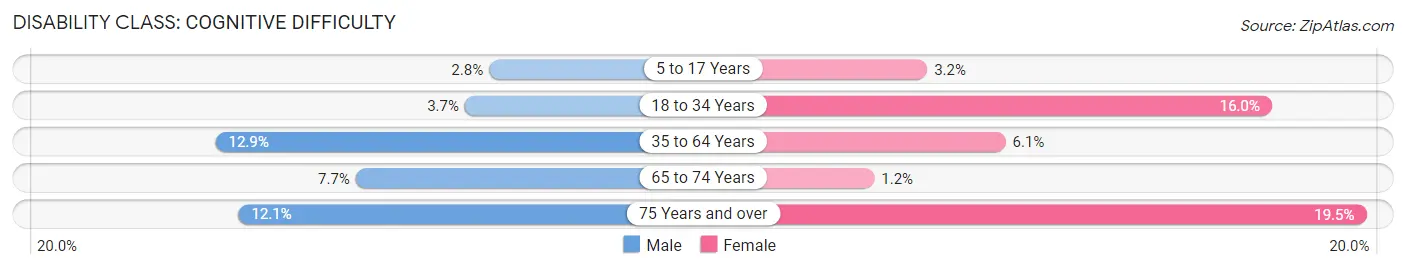
| Age Bracket | Male | Female |
| 5 to 17 Years | 34 (2.8%) | 36 (3.2%) |
| 18 to 34 Years | 65 (3.7%) | 243 (16.0%) |
| 35 to 64 Years | 412 (12.9%) | 208 (6.1%) |
| 65 to 74 Years | 96 (7.7%) | 14 (1.2%) |
| 75 Years and over | 41 (12.1%) | 126 (19.5%) |
Disability Class: Ambulatory Difficulty
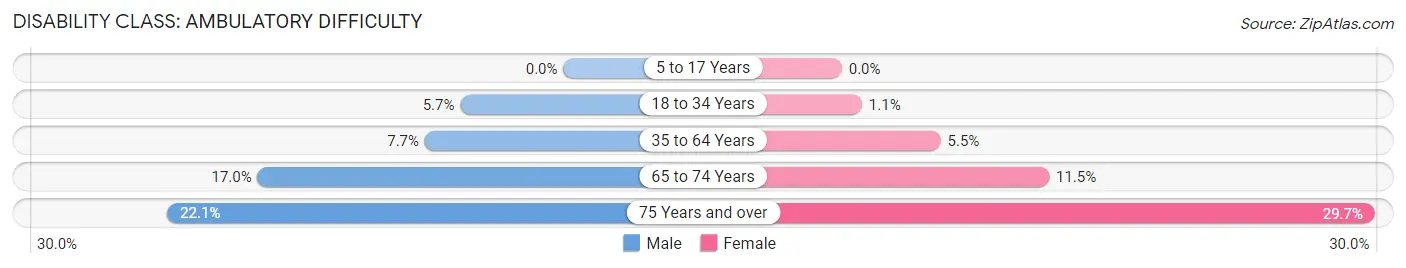
| Age Bracket | Male | Female |
| 5 to 17 Years | 0 (0.0%) | 0 (0.0%) |
| 18 to 34 Years | 102 (5.7%) | 17 (1.1%) |
| 35 to 64 Years | 246 (7.7%) | 188 (5.5%) |
| 65 to 74 Years | 212 (17.0%) | 133 (11.5%) |
| 75 Years and over | 75 (22.1%) | 192 (29.7%) |
Disability Class: Self-Care Difficulty
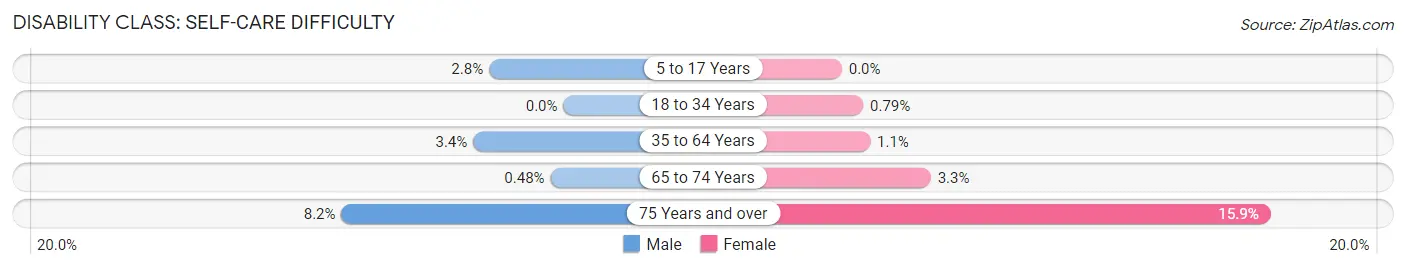
| Age Bracket | Male | Female |
| 5 to 17 Years | 34 (2.8%) | 0 (0.0%) |
| 18 to 34 Years | 0 (0.0%) | 12 (0.8%) |
| 35 to 64 Years | 107 (3.4%) | 36 (1.1%) |
| 65 to 74 Years | 6 (0.5%) | 38 (3.3%) |
| 75 Years and over | 28 (8.2%) | 103 (15.9%) |
Technology Access in Laconia
Computing Device Access in Laconia
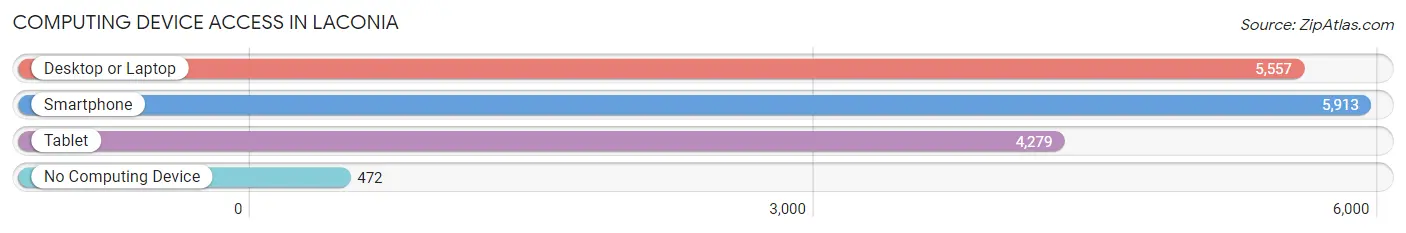
| Device Type | # Households | % Households |
| Desktop or Laptop | 5,557 | 79.8% |
| Smartphone | 5,913 | 84.9% |
| Tablet | 4,279 | 61.4% |
| No Computing Device | 472 | 6.8% |
| Total | 6,965 | 100.0% |
Internet Access in Laconia
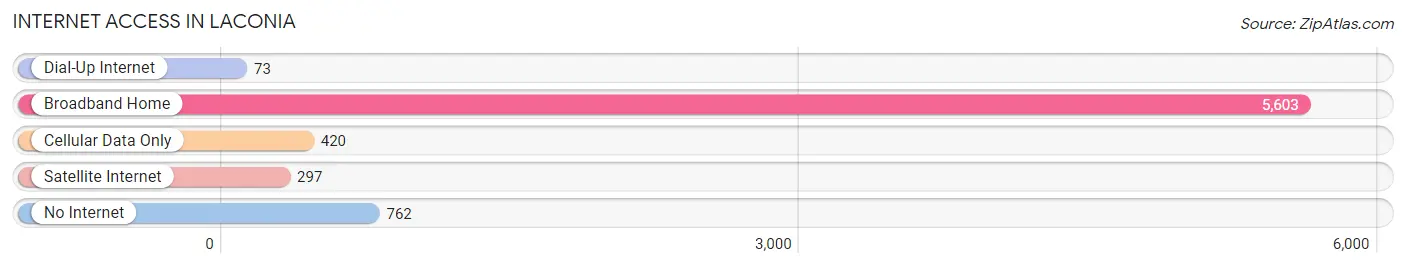
| Internet Type | # Households | % Households |
| Dial-Up Internet | 73 | 1.1% |
| Broadband Home | 5,603 | 80.4% |
| Cellular Data Only | 420 | 6.0% |
| Satellite Internet | 297 | 4.3% |
| No Internet | 762 | 10.9% |
| Total | 6,965 | 100.0% |
Laconia Summary
Laconia is a city located in Belknap County, New Hampshire, United States. The population was 15,951 at the 2010 census, and an estimated 16,470 as of 2019. It is the county seat of Belknap County. Laconia, situated between Lake Winnipesaukee and Winnisquam Lake, includes the villages of Lakeport and Weirs Beach. The city is also the site of the state's annual Pumpkin Festival since 2015.
History
The area was originally inhabited by the Pennacook and Abenaki tribes. The first European settlers arrived in the area in 1761, and the town was incorporated in 1855. The city was named after the ancient Greek city-state of Laconia, which was located in the Peloponnese region of Greece.
The city was a major industrial center in the 19th century, with several mills located along the Winnipesaukee River. The city was also a major tourist destination, with several grand hotels built in the late 19th century.
Geography
Laconia is located in central New Hampshire, in Belknap County. It is situated between Lake Winnipesaukee and Winnisquam Lake. The city is bordered by the towns of Gilford to the north, Belmont to the east, Gilmanton to the south, and Meredith to the west.
The city has a total area of 24.2 square miles, of which 22.7 square miles is land and 1.5 square miles is water. The highest point in the city is the summit of Mount Major, at an elevation of 2,037 feet above sea level.
Economy
Laconia's economy is largely based on tourism and manufacturing. The city is home to several manufacturing companies, including Laconia Motorcycle Company, which produces motorcycles and other motorized vehicles. The city is also home to several tourist attractions, including Weirs Beach, the Winnipesaukee Scenic Railroad, and the Laconia Motorcycle Week.
Demographics
As of the 2010 census, there were 15,951 people, 6,845 households, and 4,072 families residing in the city. The population density was 699.3 people per square mile. There were 7,717 housing units at an average density of 339.3 per square mile. The racial makeup of the city was 94.2% White, 1.2% African American, 0.3% Native American, 1.3% Asian, 0.1% Pacific Islander, 1.2% from other races, and 1.7% from two or more races. Hispanic or Latino of any race were 3.2% of the population.
The median age in the city was 41.7 years. 22.3% of residents were under the age of 18; 8.2% were between the ages of 18 and 24; 24.2% were from 25 to 44; 29.2% were from 45 to 64; and 16.1% were 65 years of age or older. The gender makeup of the city was 48.3% male and 51.7% female.
The median income for a household in the city was $45,945, and the median income for a family was $54,945. Males had a median income of $41,945 versus $30,945 for females. The per capita income for the city was $25,945. About 8.2% of families and 11.2% of the population were below the poverty line, including 16.2% of those under age 18 and 8.2% of those age 65 or over.
Common Questions
What is Per Capita Income in Laconia?
Per Capita income in Laconia is $39,171.
What is the Median Family Income in Laconia?
Median Family Income in Laconia is $88,464.
What is the Median Household income in Laconia?
Median Household Income in Laconia is $67,856.
What is Income or Wage Gap in Laconia?
Income or Wage Gap in Laconia is 27.0%.
Women in Laconia earn 73.0 cents for every dollar earned by a man.
What is Family Income Deficit in Laconia?
Family Income Deficit in Laconia is $6,283.
Families that are below poverty line in Laconia earn $6,283 less on average than the poverty threshold level.
What is Inequality or Gini Index in Laconia?
Inequality or Gini Index in Laconia is 0.45.
What is the Total Population of Laconia?
Total Population of Laconia is 16,898.
What is the Total Male Population of Laconia?
Total Male Population of Laconia is 8,397.
What is the Total Female Population of Laconia?
Total Female Population of Laconia is 8,501.
What is the Ratio of Males per 100 Females in Laconia?
There are 98.78 Males per 100 Females in Laconia.
What is the Ratio of Females per 100 Males in Laconia?
There are 101.24 Females per 100 Males in Laconia.
What is the Median Population Age in Laconia?
Median Population Age in Laconia is 43.7 Years.
What is the Average Family Size in Laconia
Average Family Size in Laconia is 3.0 People.
What is the Average Household Size in Laconia
Average Household Size in Laconia is 2.4 People.
How Large is the Labor Force in Laconia?
There are 9,171 People in the Labor Forcein in Laconia.
What is the Percentage of People in the Labor Force in Laconia?
64.1% of People are in the Labor Force in Laconia.
What is the Unemployment Rate in Laconia?
Unemployment Rate in Laconia is 3.1%.