Cheshire County, NH Map & Demographics
Cheshire County Map
Cheshire County Overview
$40,196
PER CAPITA INCOME
$98,415
AVG FAMILY INCOME
$76,551
AVG HOUSEHOLD INCOME
26.6%
WAGE / INCOME GAP [ % ]
73.4¢/ $1
WAGE / INCOME GAP [ $ ]
$8,349
FAMILY INCOME DEFICIT
0.43
INEQUALITY / GINI INDEX
76,610
TOTAL POPULATION
37,770
MALE POPULATION
38,840
FEMALE POPULATION
97.25
MALES / 100 FEMALES
102.83
FEMALES / 100 MALES
43.5
MEDIAN AGE
2.9
AVG FAMILY SIZE
2.4
AVG HOUSEHOLD SIZE
40,553
LABOR FORCE [ PEOPLE ]
62.9%
PERCENT IN LABOR FORCE
3.5%
UNEMPLOYMENT RATE
Cheshire County Area Codes
Income in Cheshire County
Income Overview in Cheshire County
Per Capita Income in Cheshire County is $40,196, while median incomes of families and households are $98,415 and $76,551 respectively.
| Characteristic | Number | Measure |
| Per Capita Income | 76,610 | $40,196 |
| Median Family Income | 18,716 | $98,415 |
| Mean Family Income | 18,716 | $116,028 |
| Median Household Income | 30,307 | $76,551 |
| Mean Household Income | 30,307 | $97,508 |
| Income Deficit | 18,716 | $8,349 |
| Wage / Income Gap (%) | 76,610 | 26.60% |
| Wage / Income Gap ($) | 76,610 | 73.40¢ per $1 |
| Gini / Inequality Index | 76,610 | 0.43 |
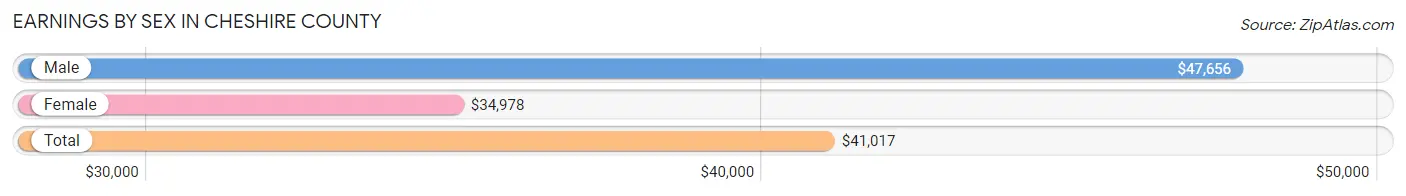
Earnings by Sex in Cheshire County
Average Earnings in Cheshire County are $41,017, $47,656 for men and $34,978 for women, a difference of 26.6%.
| Sex | Number | Average Earnings |
| Male | 23,003 (51.7%) | $47,656 |
| Female | 21,498 (48.3%) | $34,978 |
| Total | 44,501 (100.0%) | $41,017 |
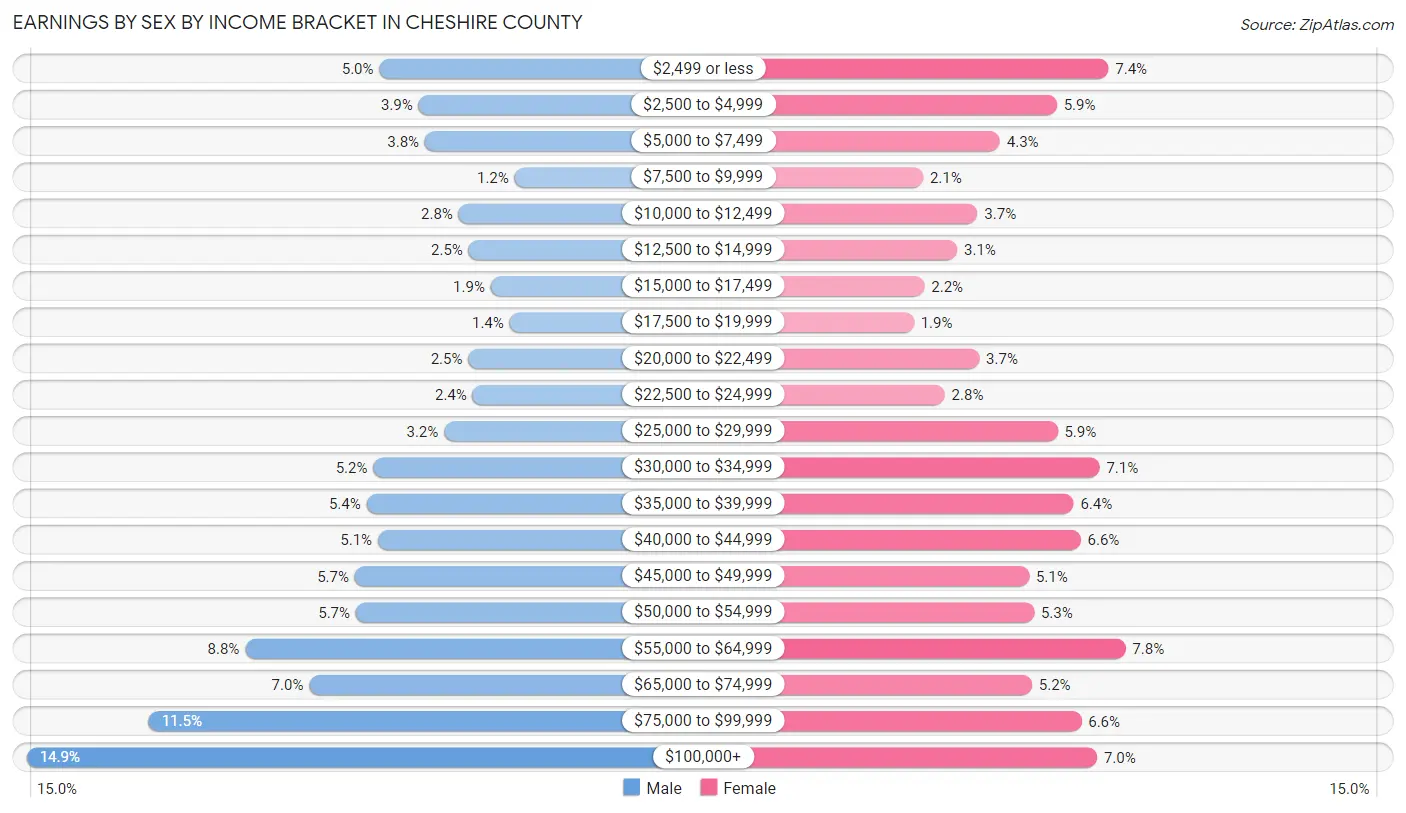
Earnings by Sex by Income Bracket in Cheshire County
The most common earnings brackets in Cheshire County are $100,000+ for men (3,436 | 14.9%) and $55,000 to $64,999 for women (1,684 | 7.8%).
| Income | Male | Female |
| $2,499 or less | 1,156 (5.0%) | 1,580 (7.3%) |
| $2,500 to $4,999 | 904 (3.9%) | 1,269 (5.9%) |
| $5,000 to $7,499 | 863 (3.7%) | 925 (4.3%) |
| $7,500 to $9,999 | 283 (1.2%) | 460 (2.1%) |
| $10,000 to $12,499 | 644 (2.8%) | 789 (3.7%) |
| $12,500 to $14,999 | 579 (2.5%) | 667 (3.1%) |
| $15,000 to $17,499 | 438 (1.9%) | 469 (2.2%) |
| $17,500 to $19,999 | 315 (1.4%) | 405 (1.9%) |
| $20,000 to $22,499 | 582 (2.5%) | 800 (3.7%) |
| $22,500 to $24,999 | 554 (2.4%) | 592 (2.8%) |
| $25,000 to $29,999 | 738 (3.2%) | 1,273 (5.9%) |
| $30,000 to $34,999 | 1,196 (5.2%) | 1,526 (7.1%) |
| $35,000 to $39,999 | 1,239 (5.4%) | 1,370 (6.4%) |
| $40,000 to $44,999 | 1,167 (5.1%) | 1,413 (6.6%) |
| $45,000 to $49,999 | 1,316 (5.7%) | 1,100 (5.1%) |
| $50,000 to $54,999 | 1,310 (5.7%) | 1,130 (5.3%) |
| $55,000 to $64,999 | 2,025 (8.8%) | 1,684 (7.8%) |
| $65,000 to $74,999 | 1,610 (7.0%) | 1,118 (5.2%) |
| $75,000 to $99,999 | 2,648 (11.5%) | 1,417 (6.6%) |
| $100,000+ | 3,436 (14.9%) | 1,511 (7.0%) |
| Total | 23,003 (100.0%) | 21,498 (100.0%) |
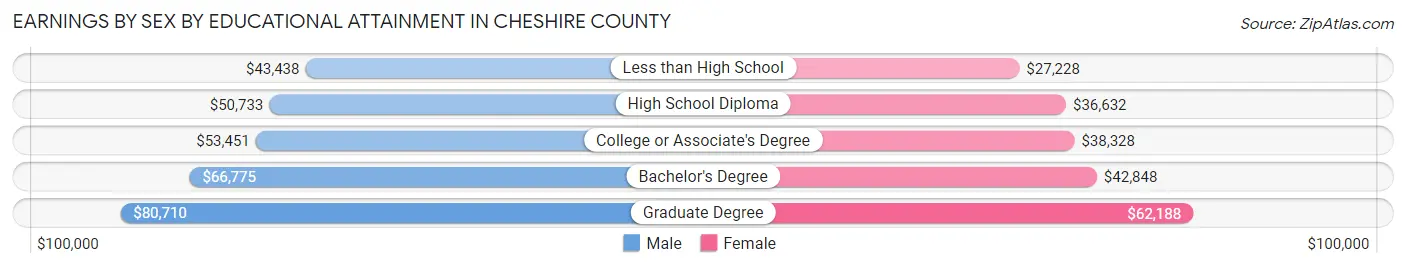
Earnings by Sex by Educational Attainment in Cheshire County
Average earnings in Cheshire County are $55,147 for men and $41,419 for women, a difference of 24.9%. Men with an educational attainment of graduate degree enjoy the highest average annual earnings of $80,710, while those with less than high school education earn the least with $43,438. Women with an educational attainment of graduate degree earn the most with the average annual earnings of $62,188, while those with less than high school education have the smallest earnings of $27,228.
| Educational Attainment | Male Income | Female Income |
| Less than High School | $43,438 | $27,228 |
| High School Diploma | $50,733 | $36,632 |
| College or Associate's Degree | $53,451 | $38,328 |
| Bachelor's Degree | $66,775 | $42,848 |
| Graduate Degree | $80,710 | $62,188 |
| Total | $55,147 | $41,419 |
Family Income in Cheshire County
Family Income Brackets in Cheshire County
According to the Cheshire County family income data, there are 4,960 families falling into the $100,000 to $149,999 income range, which is the most common income bracket and makes up 26.5% of all families. Conversely, the $10,000 to $14,999 income bracket is the least frequent group with only 168 families (0.9%) belonging to this category.
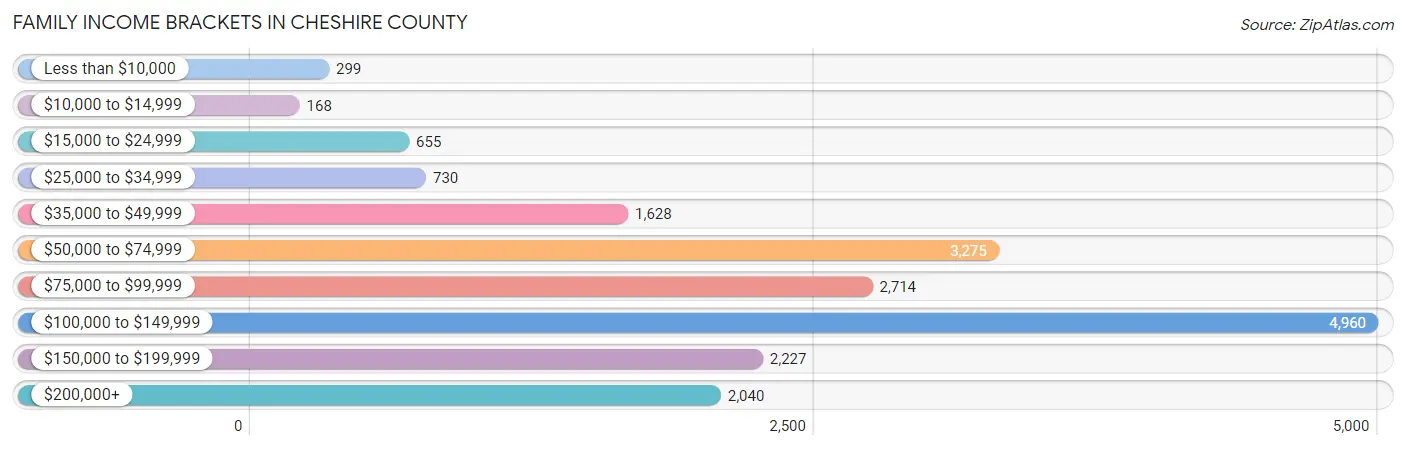
| Income Bracket | # Families | % Families |
| Less than $10,000 | 299 | 1.6% |
| $10,000 to $14,999 | 168 | 0.9% |
| $15,000 to $24,999 | 655 | 3.5% |
| $25,000 to $34,999 | 730 | 3.9% |
| $35,000 to $49,999 | 1,628 | 8.7% |
| $50,000 to $74,999 | 3,275 | 17.5% |
| $75,000 to $99,999 | 2,714 | 14.5% |
| $100,000 to $149,999 | 4,960 | 26.5% |
| $150,000 to $199,999 | 2,227 | 11.9% |
| $200,000+ | 2,040 | 10.9% |
Family Income by Famaliy Size in Cheshire County
5-person families (1,015 | 5.4%) account for the highest median family income in Cheshire County with $126,712 per family, while 2-person families (10,849 | 58.0%) have the highest median income of $44,040 per family member.
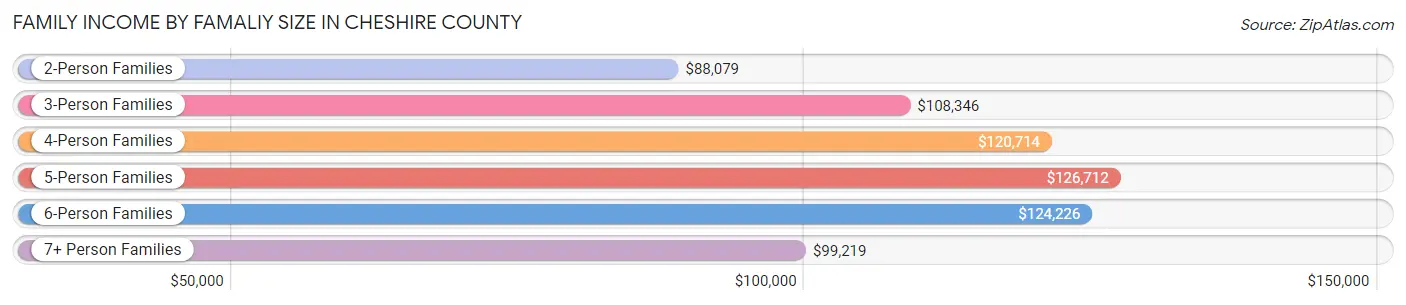
| Income Bracket | # Families | Median Income |
| 2-Person Families | 10,849 (58.0%) | $88,079 |
| 3-Person Families | 3,662 (19.6%) | $108,346 |
| 4-Person Families | 2,484 (13.3%) | $120,714 |
| 5-Person Families | 1,015 (5.4%) | $126,712 |
| 6-Person Families | 539 (2.9%) | $124,226 |
| 7+ Person Families | 167 (0.9%) | $99,219 |
| Total | 18,716 (100.0%) | $98,415 |
Family Income by Number of Earners in Cheshire County
The median family income in Cheshire County is $98,415, with families comprising 3+ earners (1,837) having the highest median family income of $144,375, while families with no earners (3,021) have the lowest median family income of $56,759, accounting for 9.8% and 16.1% of families, respectively.
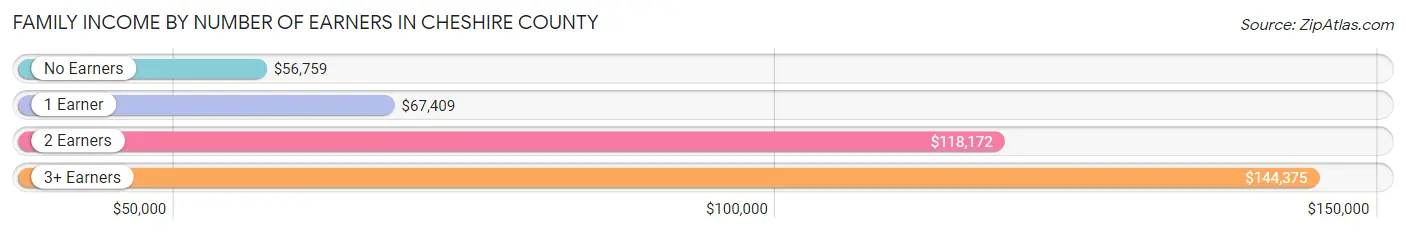
| Number of Earners | # Families | Median Income |
| No Earners | 3,021 (16.1%) | $56,759 |
| 1 Earner | 5,521 (29.5%) | $67,409 |
| 2 Earners | 8,337 (44.5%) | $118,172 |
| 3+ Earners | 1,837 (9.8%) | $144,375 |
| Total | 18,716 (100.0%) | $98,415 |
Household Income in Cheshire County
Household Income Brackets in Cheshire County
With 6,364 households falling in the category, the $100,000 to $149,999 income range is the most frequent in Cheshire County, accounting for 21.0% of all households. In contrast, only 849 households (2.8%) fall into the less than $10,000 income bracket, making it the least populous group.
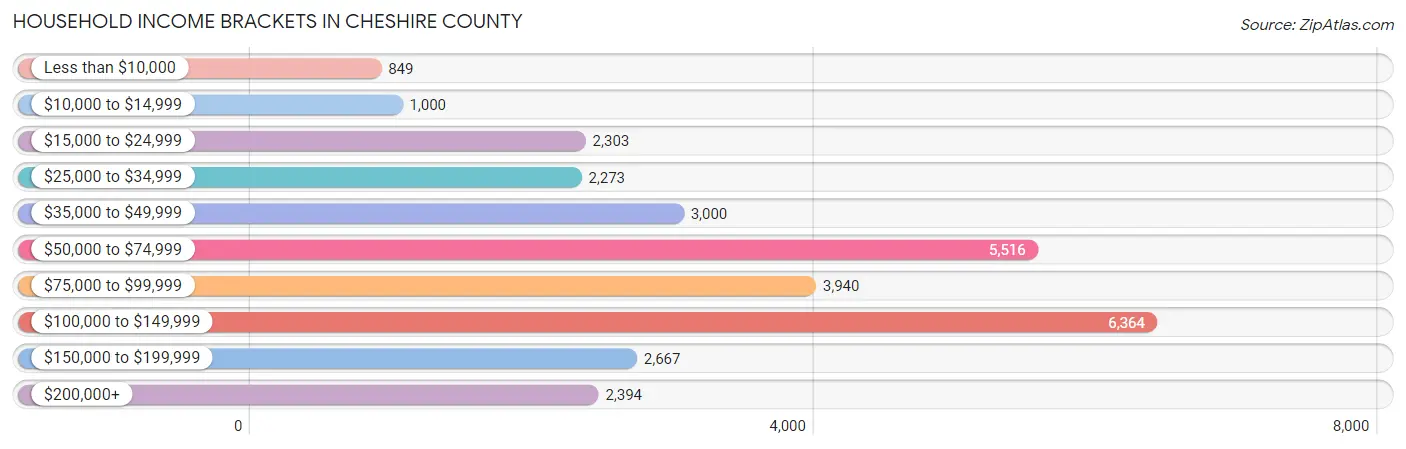
| Income Bracket | # Households | % Households |
| Less than $10,000 | 849 | 2.8% |
| $10,000 to $14,999 | 1,000 | 3.3% |
| $15,000 to $24,999 | 2,303 | 7.6% |
| $25,000 to $34,999 | 2,273 | 7.5% |
| $35,000 to $49,999 | 3,000 | 9.9% |
| $50,000 to $74,999 | 5,516 | 18.2% |
| $75,000 to $99,999 | 3,940 | 13.0% |
| $100,000 to $149,999 | 6,364 | 21.0% |
| $150,000 to $199,999 | 2,667 | 8.8% |
| $200,000+ | 2,394 | 7.9% |
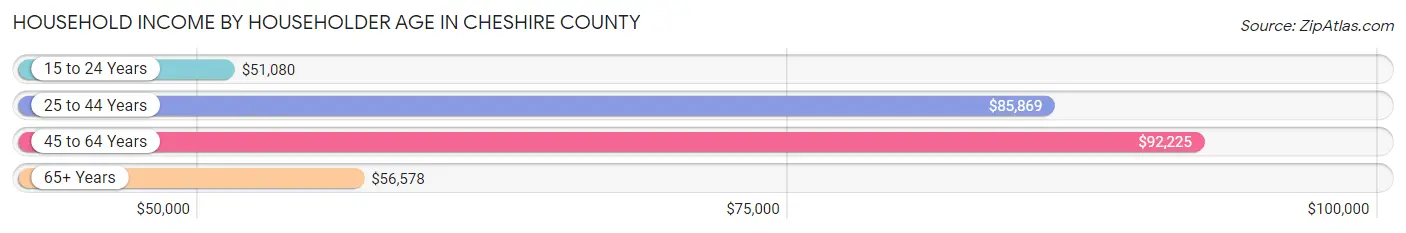
Household Income by Householder Age in Cheshire County
The median household income in Cheshire County is $76,551, with the highest median household income of $92,225 found in the 45 to 64 years age bracket for the primary householder. A total of 11,625 households (38.4%) fall into this category. Meanwhile, the 15 to 24 years age bracket for the primary householder has the lowest median household income of $51,080, with 997 households (3.3%) in this group.
| Income Bracket | # Households | Median Income |
| 15 to 24 Years | 997 (3.3%) | $51,080 |
| 25 to 44 Years | 7,977 (26.3%) | $85,869 |
| 45 to 64 Years | 11,625 (38.4%) | $92,225 |
| 65+ Years | 9,708 (32.0%) | $56,578 |
| Total | 30,307 (100.0%) | $76,551 |
Poverty in Cheshire County
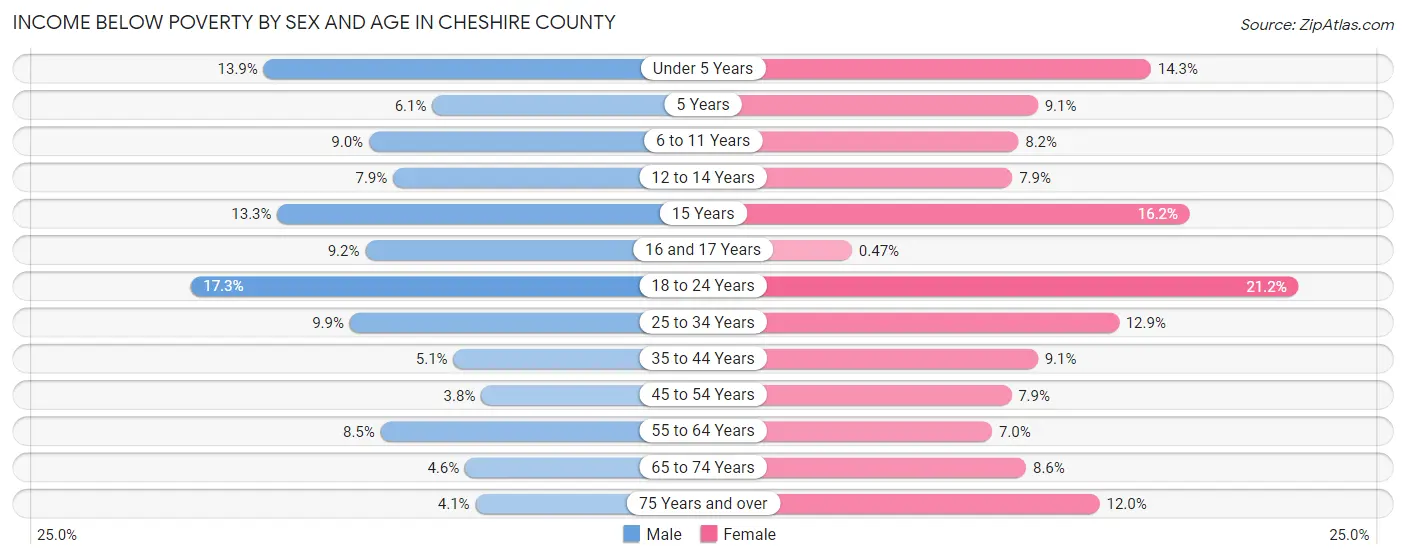
Income Below Poverty by Sex and Age in Cheshire County
With 7.8% poverty level for males and 10.2% for females among the residents of Cheshire County, 18 to 24 year old males and 18 to 24 year old females are the most vulnerable to poverty, with 473 males (17.3%) and 540 females (21.2%) in their respective age groups living below the poverty level.
| Age Bracket | Male | Female |
| Under 5 Years | 242 (13.9%) | 241 (14.3%) |
| 5 Years | 27 (6.1%) | 30 (9.1%) |
| 6 to 11 Years | 200 (9.0%) | 172 (8.2%) |
| 12 to 14 Years | 95 (7.9%) | 102 (7.9%) |
| 15 Years | 39 (13.3%) | 94 (16.2%) |
| 16 and 17 Years | 84 (9.2%) | 3 (0.5%) |
| 18 to 24 Years | 473 (17.3%) | 540 (21.2%) |
| 25 to 34 Years | 449 (9.9%) | 561 (12.9%) |
| 35 to 44 Years | 210 (5.1%) | 378 (9.1%) |
| 45 to 54 Years | 176 (3.8%) | 355 (7.9%) |
| 55 to 64 Years | 493 (8.5%) | 419 (7.0%) |
| 65 to 74 Years | 216 (4.6%) | 429 (8.6%) |
| 75 Years and over | 107 (4.1%) | 403 (12.0%) |
| Total | 2,811 (7.8%) | 3,727 (10.2%) |
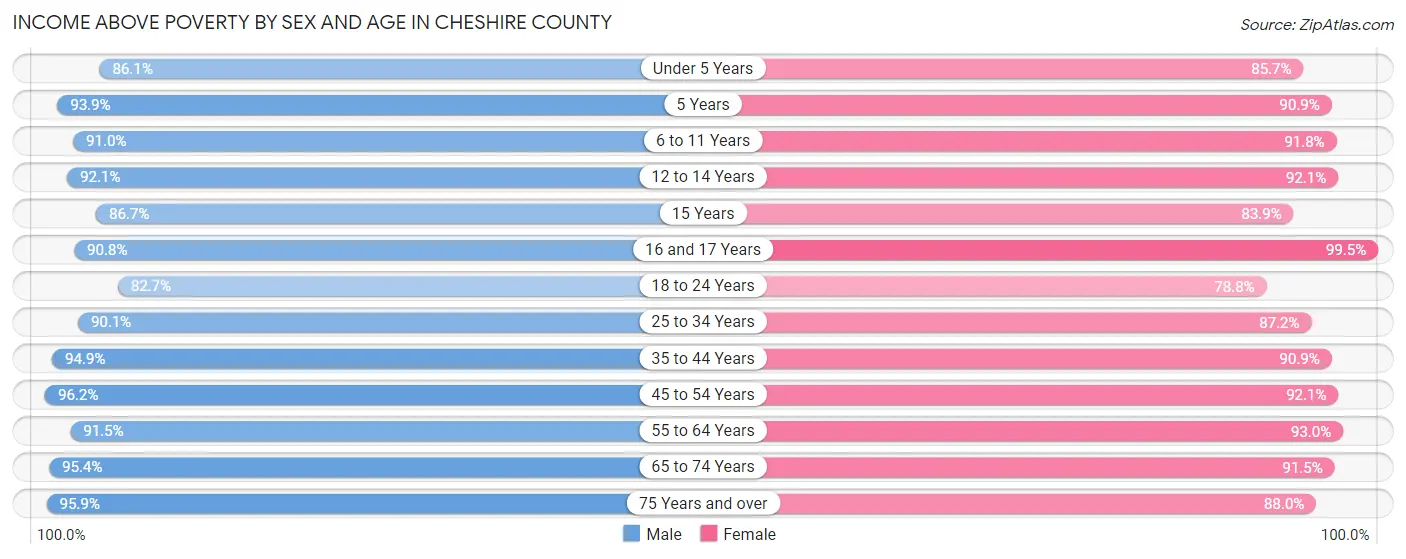
Income Above Poverty by Sex and Age in Cheshire County
According to the poverty statistics in Cheshire County, males aged 45 to 54 years and females aged 16 and 17 years are the age groups that are most secure financially, with 96.2% of males and 99.5% of females in these age groups living above the poverty line.
| Age Bracket | Male | Female |
| Under 5 Years | 1,498 (86.1%) | 1,440 (85.7%) |
| 5 Years | 417 (93.9%) | 300 (90.9%) |
| 6 to 11 Years | 2,018 (91.0%) | 1,929 (91.8%) |
| 12 to 14 Years | 1,108 (92.1%) | 1,187 (92.1%) |
| 15 Years | 255 (86.7%) | 488 (83.9%) |
| 16 and 17 Years | 830 (90.8%) | 640 (99.5%) |
| 18 to 24 Years | 2,259 (82.7%) | 2,008 (78.8%) |
| 25 to 34 Years | 4,083 (90.1%) | 3,805 (87.2%) |
| 35 to 44 Years | 3,910 (94.9%) | 3,780 (90.9%) |
| 45 to 54 Years | 4,445 (96.2%) | 4,163 (92.1%) |
| 55 to 64 Years | 5,318 (91.5%) | 5,596 (93.0%) |
| 65 to 74 Years | 4,525 (95.4%) | 4,591 (91.4%) |
| 75 Years and over | 2,518 (95.9%) | 2,966 (88.0%) |
| Total | 33,184 (92.2%) | 32,893 (89.8%) |
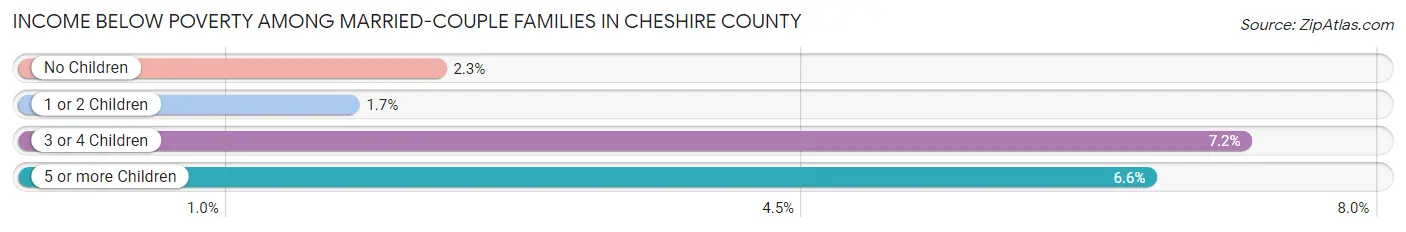
Income Below Poverty Among Married-Couple Families in Cheshire County
The poverty statistics for married-couple families in Cheshire County show that 2.5% or 382 of the total 15,234 families live below the poverty line. Families with 3 or 4 children have the highest poverty rate of 7.2%, comprising of 75 families. On the other hand, families with 1 or 2 children have the lowest poverty rate of 1.7%, which includes 64 families.
| Children | Above Poverty | Below Poverty |
| No Children | 10,173 (97.7%) | 236 (2.3%) |
| 1 or 2 Children | 3,611 (98.3%) | 64 (1.7%) |
| 3 or 4 Children | 969 (92.8%) | 75 (7.2%) |
| 5 or more Children | 99 (93.4%) | 7 (6.6%) |
| Total | 14,852 (97.5%) | 382 (2.5%) |
Income Below Poverty Among Single-Parent Households in Cheshire County
According to the poverty data in Cheshire County, 10.3% or 108 single-father households and 20.2% or 491 single-mother households are living below the poverty line. Among single-father households, those with 3 or 4 children have the highest poverty rate, with 10 households (25.0%) experiencing poverty. Likewise, among single-mother households, those with 3 or 4 children have the highest poverty rate, with 128 households (58.5%) falling below the poverty line.
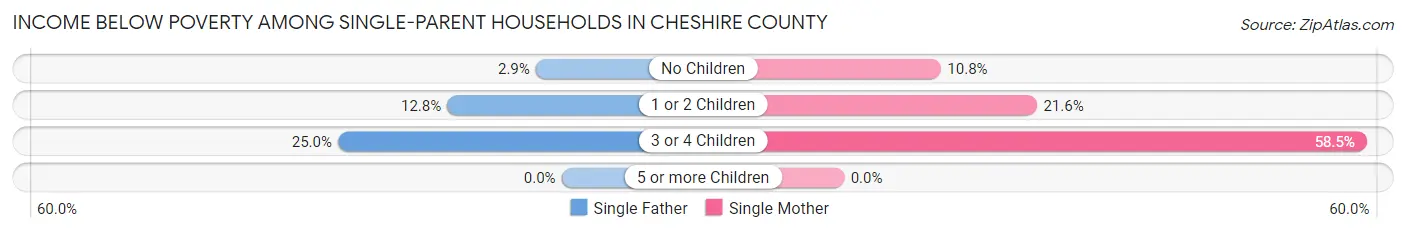
| Children | Single Father | Single Mother |
| No Children | 9 (2.9%) | 110 (10.8%) |
| 1 or 2 Children | 89 (12.8%) | 253 (21.5%) |
| 3 or 4 Children | 10 (25.0%) | 128 (58.5%) |
| 5 or more Children | 0 (0.0%) | 0 (0.0%) |
| Total | 108 (10.3%) | 491 (20.2%) |
Income Below Poverty Among Married-Couple vs Single-Parent Households in Cheshire County
The poverty data for Cheshire County shows that 382 of the married-couple family households (2.5%) and 599 of the single-parent households (17.2%) are living below the poverty level. Within the married-couple family households, those with 3 or 4 children have the highest poverty rate, with 75 households (7.2%) falling below the poverty line. Among the single-parent households, those with 3 or 4 children have the highest poverty rate, with 138 household (53.3%) living below poverty.
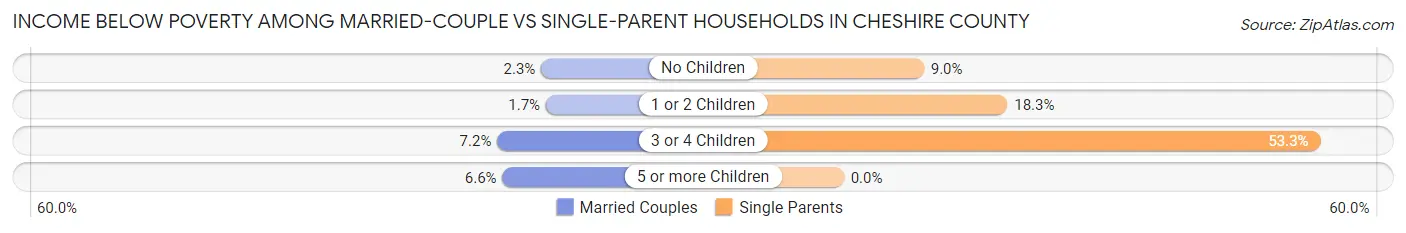
| Children | Married-Couple Families | Single-Parent Households |
| No Children | 236 (2.3%) | 119 (8.9%) |
| 1 or 2 Children | 64 (1.7%) | 342 (18.3%) |
| 3 or 4 Children | 75 (7.2%) | 138 (53.3%) |
| 5 or more Children | 7 (6.6%) | 0 (0.0%) |
| Total | 382 (2.5%) | 599 (17.2%) |
Race in Cheshire County
The most populous races in Cheshire County are White / Caucasian (71,795 | 93.7%), Two or more Races (3,138 | 4.1%), and Hispanic or Latino (1,662 | 2.2%).
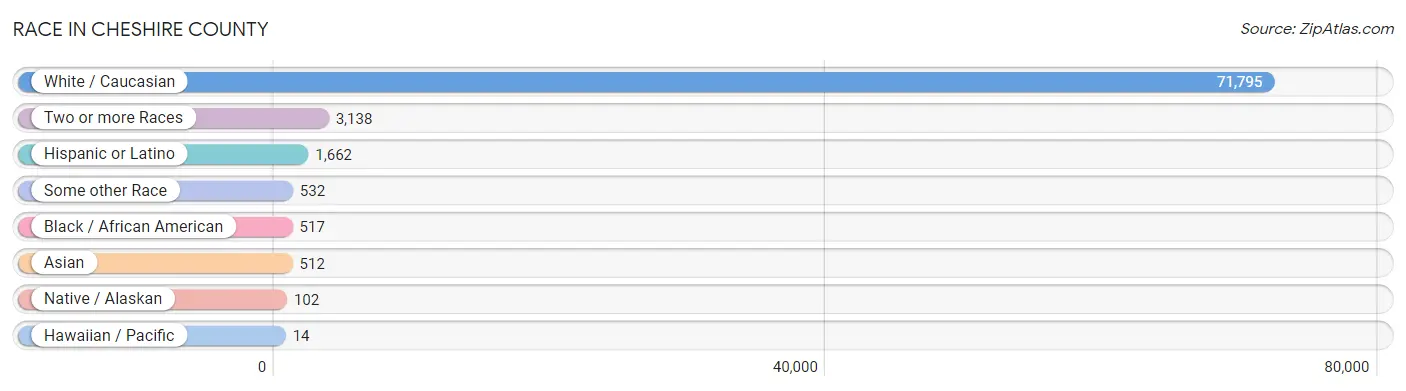
| Race | # Population | % Population |
| Asian | 512 | 0.7% |
| Black / African American | 517 | 0.7% |
| Hawaiian / Pacific | 14 | 0.0% |
| Hispanic or Latino | 1,662 | 2.2% |
| Native / Alaskan | 102 | 0.1% |
| White / Caucasian | 71,795 | 93.7% |
| Two or more Races | 3,138 | 4.1% |
| Some other Race | 532 | 0.7% |
| Total | 76,610 | 100.0% |
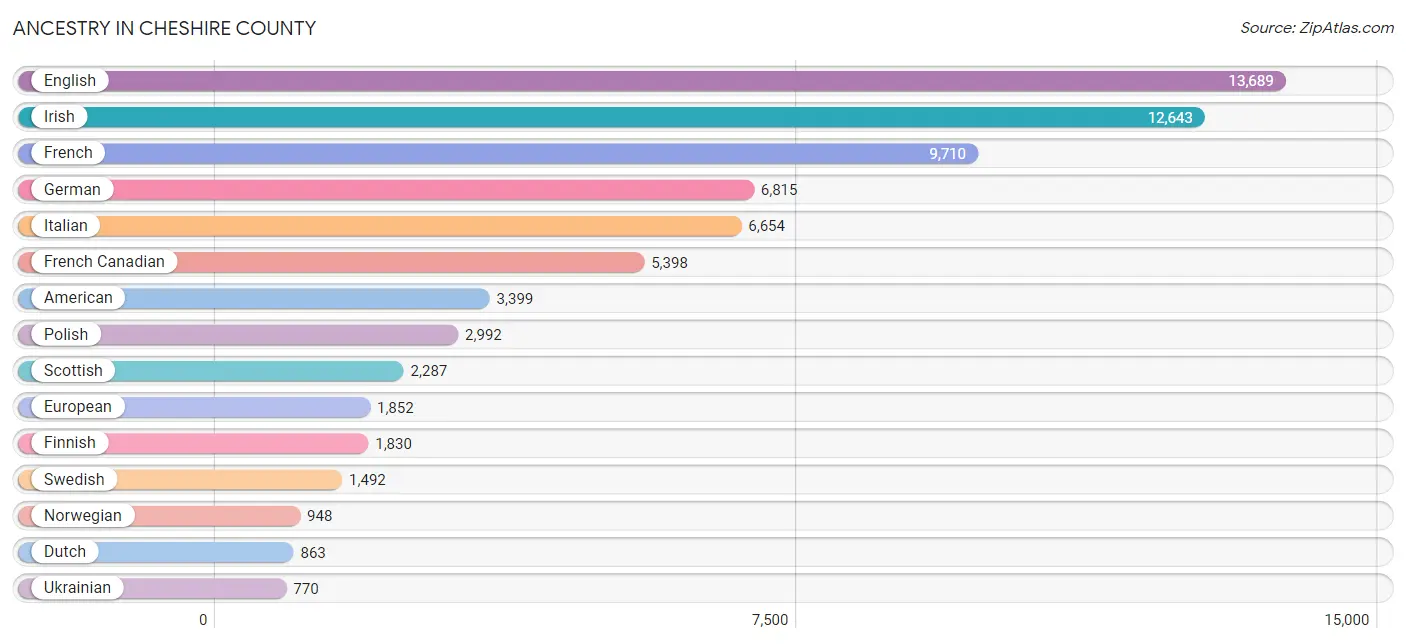
Ancestry in Cheshire County
The most populous ancestries reported in Cheshire County are English (13,689 | 17.9%), Irish (12,643 | 16.5%), French (9,710 | 12.7%), German (6,815 | 8.9%), and Italian (6,654 | 8.7%), together accounting for 64.6% of all Cheshire County residents.
| Ancestry | # Population | % Population |
| African | 194 | 0.3% |
| Alaska Native | 45 | 0.1% |
| Albanian | 30 | 0.0% |
| American | 3,399 | 4.4% |
| Apache | 7 | 0.0% |
| Arab | 153 | 0.2% |
| Argentinean | 16 | 0.0% |
| Armenian | 105 | 0.1% |
| Australian | 19 | 0.0% |
| Austrian | 359 | 0.5% |
| Bahamian | 1 | 0.0% |
| Basque | 4 | 0.0% |
| Belgian | 149 | 0.2% |
| Bhutanese | 80 | 0.1% |
| Blackfeet | 13 | 0.0% |
| Brazilian | 6 | 0.0% |
| British | 563 | 0.7% |
| Bulgarian | 9 | 0.0% |
| Burmese | 100 | 0.1% |
| Cajun | 13 | 0.0% |
| Canadian | 706 | 0.9% |
| Celtic | 8 | 0.0% |
| Central American | 122 | 0.2% |
| Central American Indian | 1 | 0.0% |
| Cherokee | 120 | 0.2% |
| Choctaw | 30 | 0.0% |
| Colombian | 18 | 0.0% |
| Comanche | 3 | 0.0% |
| Costa Rican | 36 | 0.1% |
| Creek | 6 | 0.0% |
| Croatian | 56 | 0.1% |
| Cuban | 143 | 0.2% |
| Czech | 145 | 0.2% |
| Czechoslovakian | 9 | 0.0% |
| Danish | 126 | 0.2% |
| Dominican | 74 | 0.1% |
| Dutch | 863 | 1.1% |
| Eastern European | 249 | 0.3% |
| Ecuadorian | 58 | 0.1% |
| English | 13,689 | 17.9% |
| Estonian | 3 | 0.0% |
| Ethiopian | 36 | 0.1% |
| European | 1,852 | 2.4% |
| Finnish | 1,830 | 2.4% |
| French | 9,710 | 12.7% |
| French American Indian | 15 | 0.0% |
| French Canadian | 5,398 | 7.0% |
| German | 6,815 | 8.9% |
| Greek | 441 | 0.6% |
| Guatemalan | 13 | 0.0% |
| Haitian | 2 | 0.0% |
| Honduran | 41 | 0.1% |
| Hungarian | 212 | 0.3% |
| Indian (Asian) | 530 | 0.7% |
| Inupiat | 2 | 0.0% |
| Iranian | 17 | 0.0% |
| Irish | 12,643 | 16.5% |
| Iroquois | 42 | 0.1% |
| Italian | 6,654 | 8.7% |
| Jamaican | 33 | 0.0% |
| Japanese | 78 | 0.1% |
| Kenyan | 29 | 0.0% |
| Korean | 239 | 0.3% |
| Laotian | 5 | 0.0% |
| Latvian | 31 | 0.0% |
| Lebanese | 137 | 0.2% |
| Lithuanian | 265 | 0.4% |
| Malaysian | 72 | 0.1% |
| Mexican | 297 | 0.4% |
| Native Hawaiian | 32 | 0.0% |
| Navajo | 1 | 0.0% |
| Nicaraguan | 6 | 0.0% |
| Nigerian | 38 | 0.1% |
| Northern European | 134 | 0.2% |
| Norwegian | 948 | 1.2% |
| Pakistani | 10 | 0.0% |
| Pennsylvania German | 8 | 0.0% |
| Peruvian | 145 | 0.2% |
| Polish | 2,992 | 3.9% |
| Portuguese | 359 | 0.5% |
| Puerto Rican | 642 | 0.8% |
| Romanian | 22 | 0.0% |
| Russian | 738 | 1.0% |
| Salvadoran | 26 | 0.0% |
| Scandinavian | 320 | 0.4% |
| Scotch-Irish | 555 | 0.7% |
| Scottish | 2,287 | 3.0% |
| Serbian | 3 | 0.0% |
| Sioux | 10 | 0.0% |
| Slavic | 100 | 0.1% |
| Slovak | 80 | 0.1% |
| Slovene | 5 | 0.0% |
| South African | 9 | 0.0% |
| South American | 250 | 0.3% |
| Spaniard | 91 | 0.1% |
| Spanish | 21 | 0.0% |
| Sri Lankan | 24 | 0.0% |
| Subsaharan African | 367 | 0.5% |
| Sudanese | 98 | 0.1% |
| Swedish | 1,492 | 1.9% |
| Swiss | 98 | 0.1% |
| Syrian | 11 | 0.0% |
| Thai | 87 | 0.1% |
| Trinidadian and Tobagonian | 2 | 0.0% |
| Turkish | 31 | 0.0% |
| Ukrainian | 770 | 1.0% |
| Uruguayan | 13 | 0.0% |
| Welsh | 269 | 0.4% |
| West Indian | 22 | 0.0% |
| Yuman | 32 | 0.0% | View All 110 Rows |
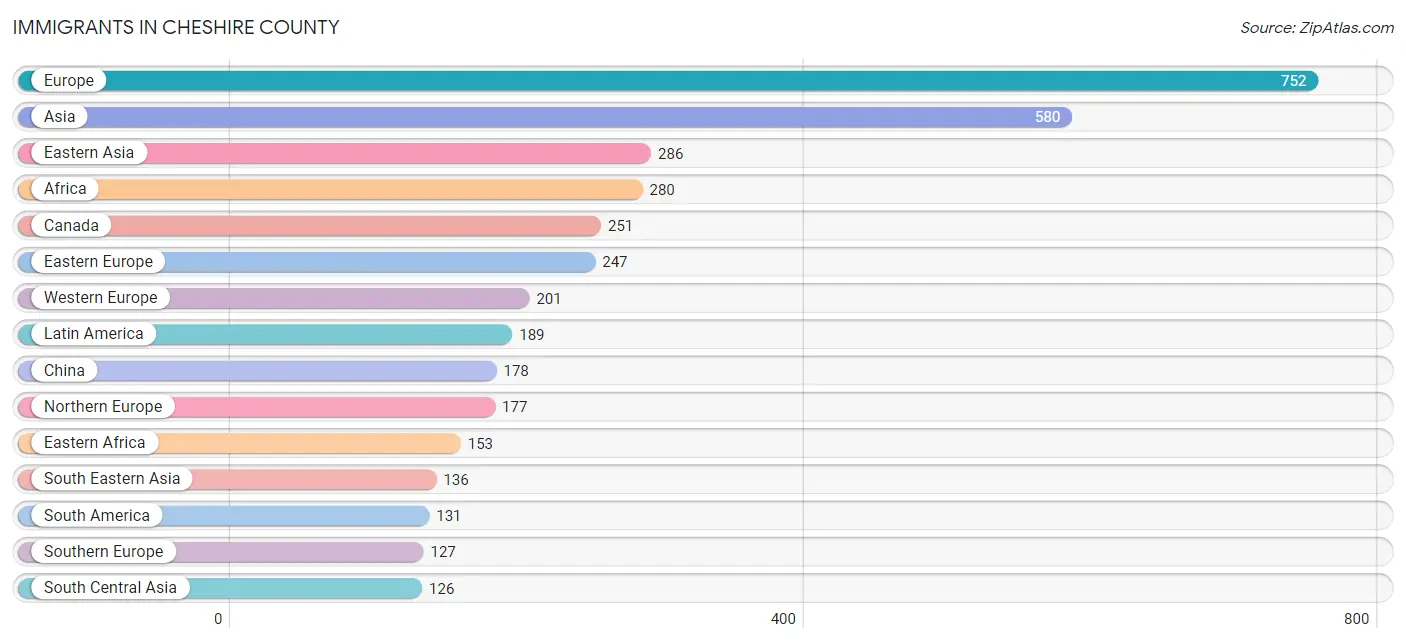
Immigrants in Cheshire County
The most numerous immigrant groups reported in Cheshire County came from Europe (752 | 1.0%), Asia (580 | 0.8%), Eastern Asia (286 | 0.4%), Africa (280 | 0.4%), and Canada (251 | 0.3%), together accounting for 2.8% of all Cheshire County residents.
| Immigration Origin | # Population | % Population |
| Africa | 280 | 0.4% |
| Argentina | 1 | 0.0% |
| Asia | 580 | 0.8% |
| Australia | 13 | 0.0% |
| Austria | 34 | 0.0% |
| Bahamas | 1 | 0.0% |
| Belgium | 2 | 0.0% |
| Brazil | 6 | 0.0% |
| Bulgaria | 9 | 0.0% |
| Cambodia | 25 | 0.0% |
| Canada | 251 | 0.3% |
| Caribbean | 9 | 0.0% |
| Central America | 49 | 0.1% |
| China | 178 | 0.2% |
| Colombia | 18 | 0.0% |
| Czechoslovakia | 7 | 0.0% |
| Dominican Republic | 6 | 0.0% |
| Eastern Africa | 153 | 0.2% |
| Eastern Asia | 286 | 0.4% |
| Eastern Europe | 247 | 0.3% |
| Ecuador | 25 | 0.0% |
| Egypt | 25 | 0.0% |
| England | 62 | 0.1% |
| Ethiopia | 30 | 0.0% |
| Europe | 752 | 1.0% |
| France | 7 | 0.0% |
| Germany | 119 | 0.2% |
| Ghana | 4 | 0.0% |
| Greece | 53 | 0.1% |
| Guatemala | 13 | 0.0% |
| Haiti | 2 | 0.0% |
| Hungary | 50 | 0.1% |
| India | 56 | 0.1% |
| Indonesia | 1 | 0.0% |
| Iran | 17 | 0.0% |
| Ireland | 3 | 0.0% |
| Italy | 43 | 0.1% |
| Japan | 35 | 0.1% |
| Kazakhstan | 7 | 0.0% |
| Kenya | 38 | 0.1% |
| Korea | 73 | 0.1% |
| Latin America | 189 | 0.3% |
| Latvia | 2 | 0.0% |
| Lithuania | 4 | 0.0% |
| Malaysia | 30 | 0.0% |
| Mexico | 36 | 0.1% |
| Middle Africa | 29 | 0.0% |
| Netherlands | 36 | 0.1% |
| Nigeria | 38 | 0.1% |
| Northern Africa | 25 | 0.0% |
| Northern Europe | 177 | 0.2% |
| Oceania | 14 | 0.0% |
| Pakistan | 6 | 0.0% |
| Peru | 81 | 0.1% |
| Philippines | 70 | 0.1% |
| Poland | 47 | 0.1% |
| Romania | 10 | 0.0% |
| Russia | 34 | 0.0% |
| Scotland | 27 | 0.0% |
| South Africa | 16 | 0.0% |
| South America | 131 | 0.2% |
| South Central Asia | 126 | 0.2% |
| South Eastern Asia | 136 | 0.2% |
| Southern Europe | 127 | 0.2% |
| Spain | 31 | 0.0% |
| Sweden | 11 | 0.0% |
| Switzerland | 3 | 0.0% |
| Taiwan | 14 | 0.0% |
| Ukraine | 84 | 0.1% |
| Vietnam | 10 | 0.0% |
| Western Africa | 57 | 0.1% |
| Western Asia | 32 | 0.0% |
| Western Europe | 201 | 0.3% |
| Zaire | 29 | 0.0% |
| Zimbabwe | 40 | 0.1% | View All 75 Rows |
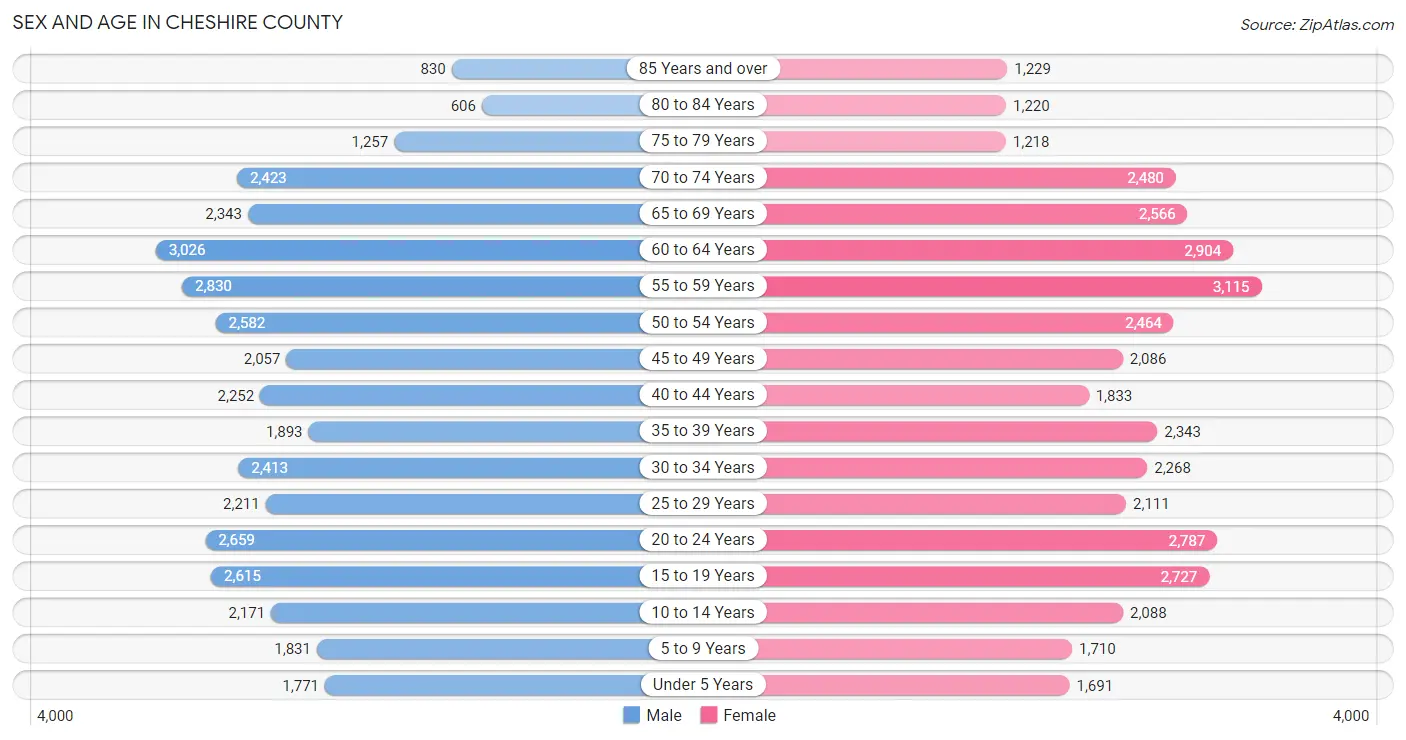
Sex and Age in Cheshire County
Sex and Age in Cheshire County
The most populous age groups in Cheshire County are 60 to 64 Years (3,026 | 8.0%) for men and 55 to 59 Years (3,115 | 8.0%) for women.
| Age Bracket | Male | Female |
| Under 5 Years | 1,771 (4.7%) | 1,691 (4.3%) |
| 5 to 9 Years | 1,831 (4.9%) | 1,710 (4.4%) |
| 10 to 14 Years | 2,171 (5.8%) | 2,088 (5.4%) |
| 15 to 19 Years | 2,615 (6.9%) | 2,727 (7.0%) |
| 20 to 24 Years | 2,659 (7.0%) | 2,787 (7.2%) |
| 25 to 29 Years | 2,211 (5.9%) | 2,111 (5.4%) |
| 30 to 34 Years | 2,413 (6.4%) | 2,268 (5.8%) |
| 35 to 39 Years | 1,893 (5.0%) | 2,343 (6.0%) |
| 40 to 44 Years | 2,252 (6.0%) | 1,833 (4.7%) |
| 45 to 49 Years | 2,057 (5.4%) | 2,086 (5.4%) |
| 50 to 54 Years | 2,582 (6.8%) | 2,464 (6.3%) |
| 55 to 59 Years | 2,830 (7.5%) | 3,115 (8.0%) |
| 60 to 64 Years | 3,026 (8.0%) | 2,904 (7.5%) |
| 65 to 69 Years | 2,343 (6.2%) | 2,566 (6.6%) |
| 70 to 74 Years | 2,423 (6.4%) | 2,480 (6.4%) |
| 75 to 79 Years | 1,257 (3.3%) | 1,218 (3.1%) |
| 80 to 84 Years | 606 (1.6%) | 1,220 (3.1%) |
| 85 Years and over | 830 (2.2%) | 1,229 (3.2%) |
| Total | 37,770 (100.0%) | 38,840 (100.0%) |
Families and Households in Cheshire County
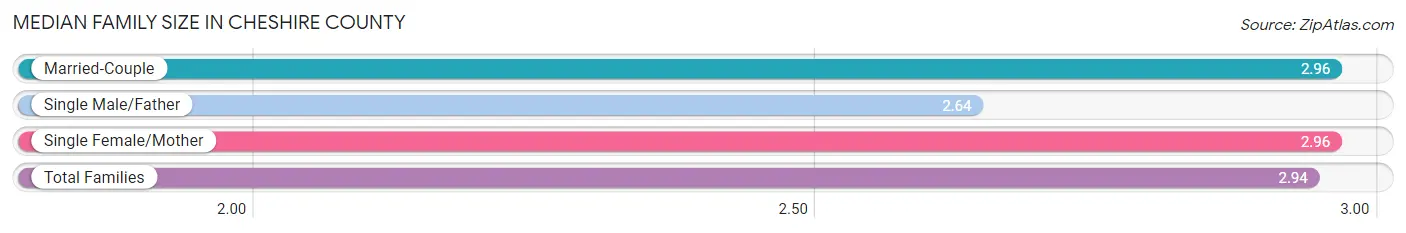
Median Family Size in Cheshire County
The median family size in Cheshire County is 2.94 persons per family, with married-couple families (15,234 | 81.4%) accounting for the largest median family size of 2.96 persons per family. On the other hand, single male/father families (1,047 | 5.6%) represent the smallest median family size with 2.64 persons per family.
| Family Type | # Families | Family Size |
| Married-Couple | 15,234 (81.4%) | 2.96 |
| Single Male/Father | 1,047 (5.6%) | 2.64 |
| Single Female/Mother | 2,435 (13.0%) | 2.96 |
| Total Families | 18,716 (100.0%) | 2.94 |
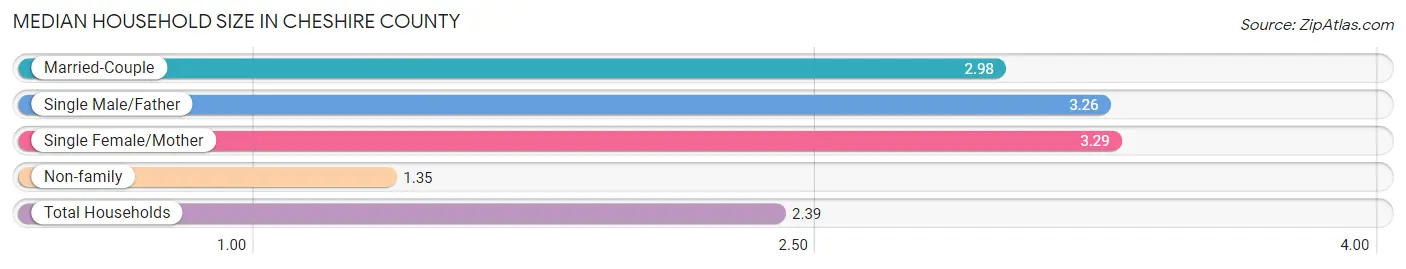
Median Household Size in Cheshire County
The median household size in Cheshire County is 2.39 persons per household, with single female/mother households (2,435 | 8.0%) accounting for the largest median household size of 3.29 persons per household. non-family households (11,591 | 38.3%) represent the smallest median household size with 1.35 persons per household.
| Household Type | # Households | Household Size |
| Married-Couple | 15,234 (50.3%) | 2.98 |
| Single Male/Father | 1,047 (3.5%) | 3.26 |
| Single Female/Mother | 2,435 (8.0%) | 3.29 |
| Non-family | 11,591 (38.3%) | 1.35 |
| Total Households | 30,307 (100.0%) | 2.39 |
Household Size by Marriage Status in Cheshire County
Out of a total of 30,307 households in Cheshire County, 18,716 (61.8%) are family households, while 11,591 (38.3%) are nonfamily households. The most numerous type of family households are 2-person households, comprising 10,023, and the most common type of nonfamily households are 1-person households, comprising 8,781.
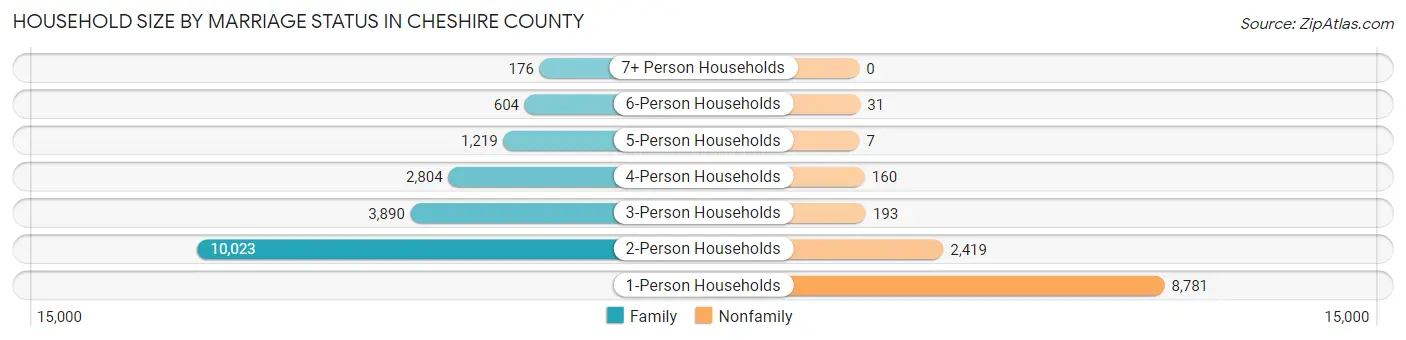
| Household Size | Family Households | Nonfamily Households |
| 1-Person Households | - | 8,781 (29.0%) |
| 2-Person Households | 10,023 (33.1%) | 2,419 (8.0%) |
| 3-Person Households | 3,890 (12.8%) | 193 (0.6%) |
| 4-Person Households | 2,804 (9.2%) | 160 (0.5%) |
| 5-Person Households | 1,219 (4.0%) | 7 (0.0%) |
| 6-Person Households | 604 (2.0%) | 31 (0.1%) |
| 7+ Person Households | 176 (0.6%) | 0 (0.0%) |
| Total | 18,716 (61.8%) | 11,591 (38.3%) |
Female Fertility in Cheshire County
Fertility by Age in Cheshire County
Average fertility rate in Cheshire County is 33.0 births per 1,000 women. Women in the age bracket of 20 to 34 years have the highest fertility rate with 60.0 births per 1,000 women. Women in the age bracket of 20 to 34 years acount for 78.5% of all women with births.
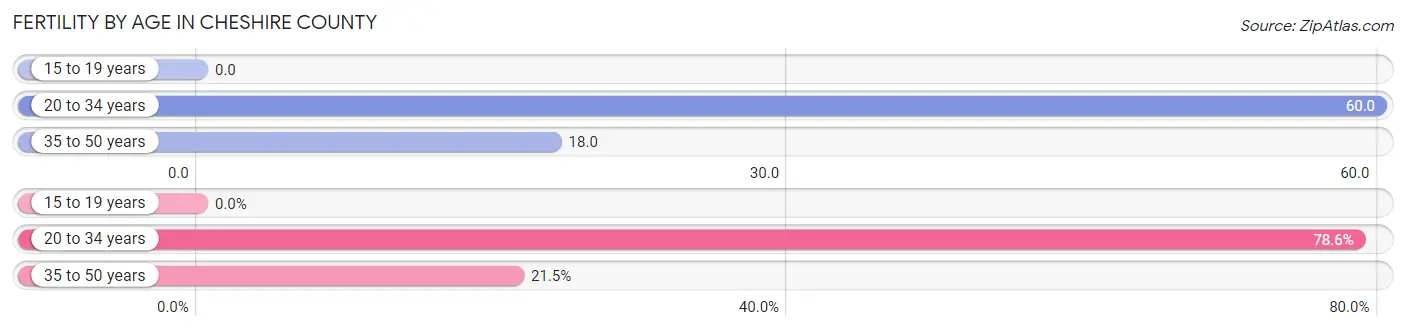
| Age Bracket | Women with Births | Births / 1,000 Women |
| 15 to 19 years | 0 (0.0%) | 0.0 |
| 20 to 34 years | 432 (78.5%) | 60.0 |
| 35 to 50 years | 118 (21.4%) | 18.0 |
| Total | 550 (100.0%) | 33.0 |
Fertility by Age by Marriage Status in Cheshire County
74.9% of women with births (550) in Cheshire County are married. The highest percentage of unmarried women with births falls into 20 to 34 years age bracket with 28.0% of them unmarried at the time of birth, while the lowest percentage of unmarried women with births belong to 35 to 50 years age bracket with 14.4% of them unmarried.
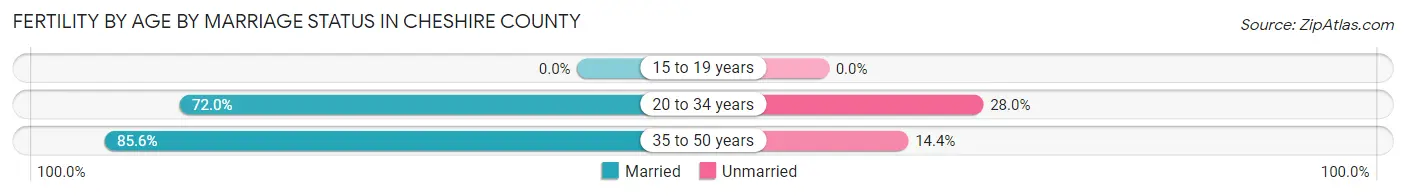
| Age Bracket | Married | Unmarried |
| 15 to 19 years | 0 (0.0%) | 0 (0.0%) |
| 20 to 34 years | 311 (72.0%) | 121 (28.0%) |
| 35 to 50 years | 101 (85.6%) | 17 (14.4%) |
| Total | 412 (74.9%) | 138 (25.1%) |
Fertility by Education in Cheshire County
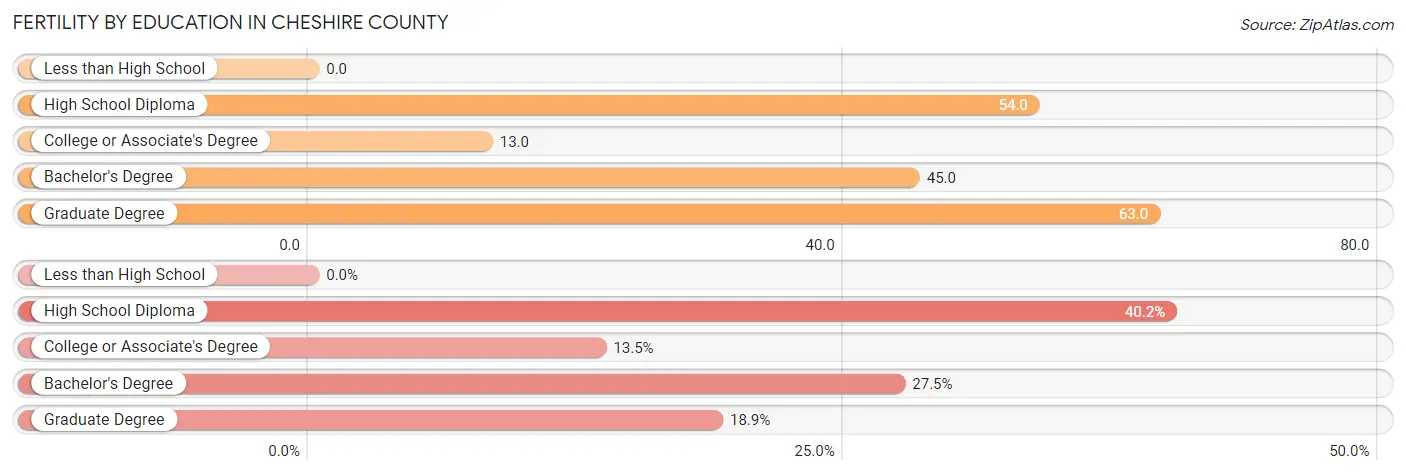
| Educational Attainment | Women with Births | Births / 1,000 Women |
| Less than High School | 0 (0.0%) | 0.0 |
| High School Diploma | 221 (40.2%) | 54.0 |
| College or Associate's Degree | 74 (13.5%) | 13.0 |
| Bachelor's Degree | 151 (27.5%) | 45.0 |
| Graduate Degree | 104 (18.9%) | 63.0 |
| Total | 550 (100.0%) | 33.0 |
Fertility by Education by Marriage Status in Cheshire County
25.1% of women with births in Cheshire County are unmarried. Women with the educational attainment of graduate degree are most likely to be married with 100.0% of them married at childbirth, while women with the educational attainment of bachelor's degree are least likely to be married with 41.1% of them unmarried at childbirth.
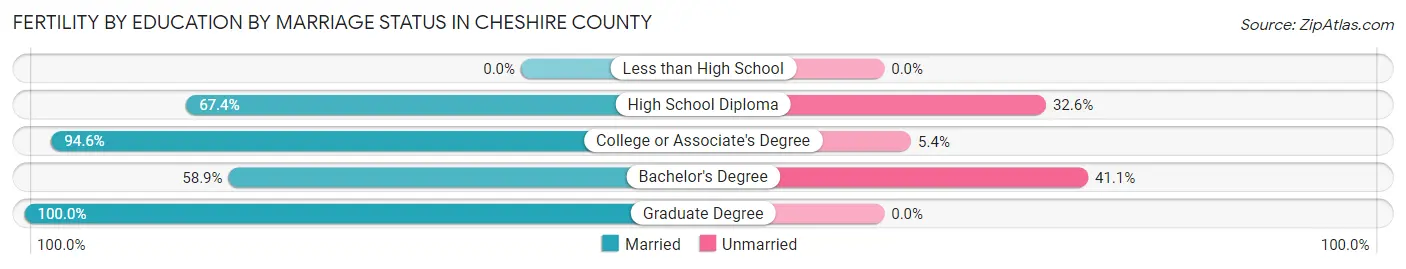
| Educational Attainment | Married | Unmarried |
| Less than High School | 0 (0.0%) | 0 (0.0%) |
| High School Diploma | 149 (67.4%) | 72 (32.6%) |
| College or Associate's Degree | 70 (94.6%) | 4 (5.4%) |
| Bachelor's Degree | 89 (58.9%) | 62 (41.1%) |
| Graduate Degree | 104 (100.0%) | 0 (0.0%) |
| Total | 412 (74.9%) | 138 (25.1%) |
Employment Characteristics in Cheshire County
Employment by Class of Employer in Cheshire County
Among the 38,344 employed individuals in Cheshire County, private company employees (23,933 | 62.4%), not-for-profit organizations (4,605 | 12.0%), and local government employees (3,551 | 9.3%) make up the most common classes of employment.
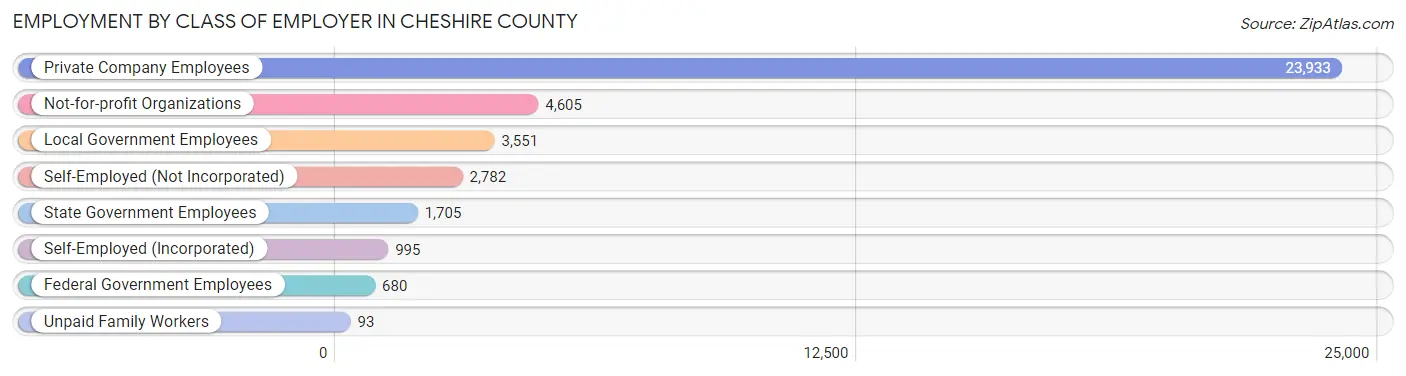
| Employer Class | # Employees | % Employees |
| Private Company Employees | 23,933 | 62.4% |
| Self-Employed (Incorporated) | 995 | 2.6% |
| Self-Employed (Not Incorporated) | 2,782 | 7.3% |
| Not-for-profit Organizations | 4,605 | 12.0% |
| Local Government Employees | 3,551 | 9.3% |
| State Government Employees | 1,705 | 4.4% |
| Federal Government Employees | 680 | 1.8% |
| Unpaid Family Workers | 93 | 0.2% |
| Total | 38,344 | 100.0% |
Employment Status by Age in Cheshire County
According to the labor force statistics for Cheshire County, out of the total population over 16 years of age (64,472), 62.9% or 40,553 individuals are in the labor force, with 3.5% or 1,419 of them unemployed. The age group with the highest labor force participation rate is 35 to 44 years, with 89.1% or 7,414 individuals in the labor force. Within the labor force, the 25 to 29 years age range has the highest percentage of unemployed individuals, with 6.2% or 235 of them being unemployed.
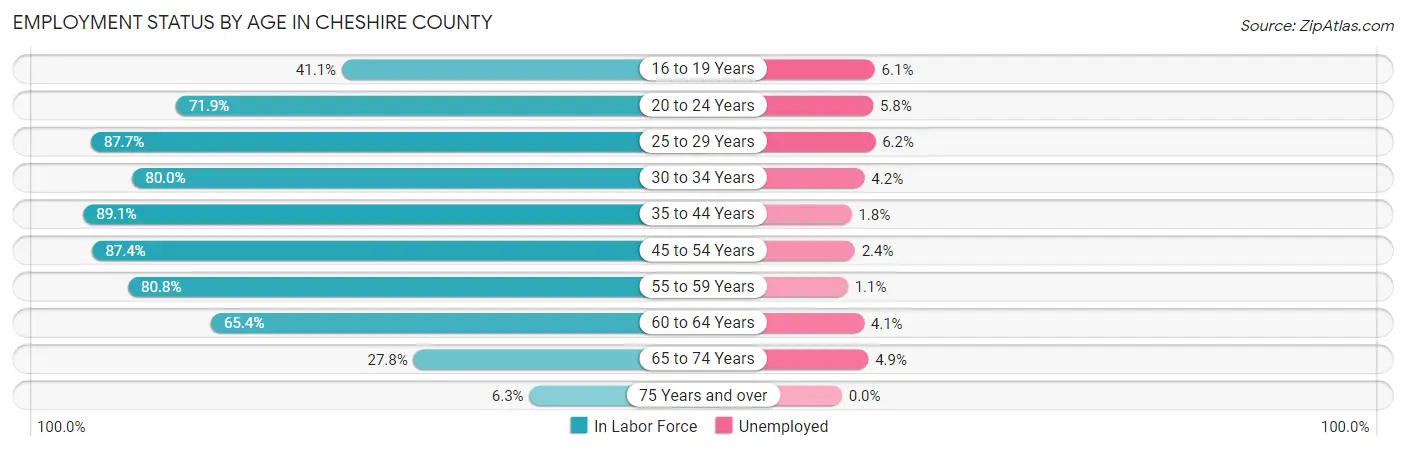
| Age Bracket | In Labor Force | Unemployed |
| 16 to 19 Years | 1,836 (41.1%) | 112 (6.1%) |
| 20 to 24 Years | 3,916 (71.9%) | 227 (5.8%) |
| 25 to 29 Years | 3,790 (87.7%) | 235 (6.2%) |
| 30 to 34 Years | 3,745 (80.0%) | 157 (4.2%) |
| 35 to 44 Years | 7,414 (89.1%) | 133 (1.8%) |
| 45 to 54 Years | 8,031 (87.4%) | 193 (2.4%) |
| 55 to 59 Years | 4,804 (80.8%) | 53 (1.1%) |
| 60 to 64 Years | 3,878 (65.4%) | 159 (4.1%) |
| 65 to 74 Years | 2,728 (27.8%) | 134 (4.9%) |
| 75 Years and over | 401 (6.3%) | 0 (0.0%) |
| Total | 40,553 (62.9%) | 1,419 (3.5%) |
Employment Status by Educational Attainment in Cheshire County
According to labor force statistics for Cheshire County, 82.5% of individuals (31,670) out of the total population between 25 and 64 years of age (38,388) are in the labor force, with 2.9% or 918 of them being unemployed. The group with the highest labor force participation rate are those with the educational attainment of bachelor's degree or higher, with 87.5% or 11,189 individuals in the labor force. Within the labor force, individuals with less than high school education have the highest percentage of unemployment, with 10.8% or 162 of them being unemployed.
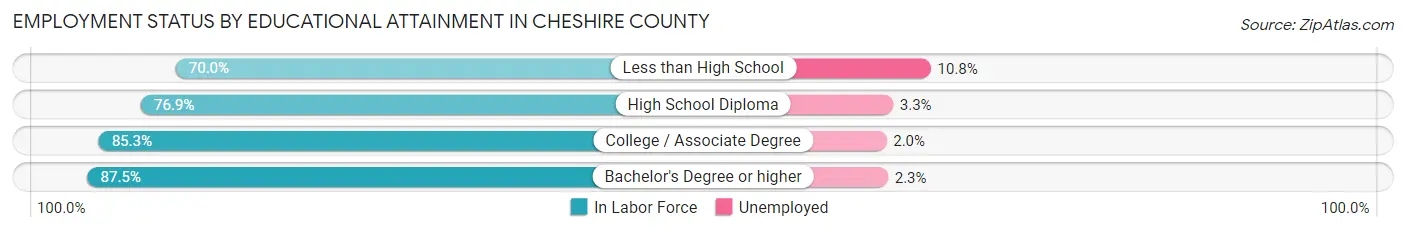
| Educational Attainment | In Labor Force | Unemployed |
| Less than High School | 1,504 (70.0%) | 232 (10.8%) |
| High School Diploma | 9,439 (76.9%) | 405 (3.3%) |
| College / Associate Degree | 9,536 (85.3%) | 224 (2.0%) |
| Bachelor's Degree or higher | 11,189 (87.5%) | 294 (2.3%) |
| Total | 31,670 (82.5%) | 1,113 (2.9%) |
Employment Occupations by Sex in Cheshire County
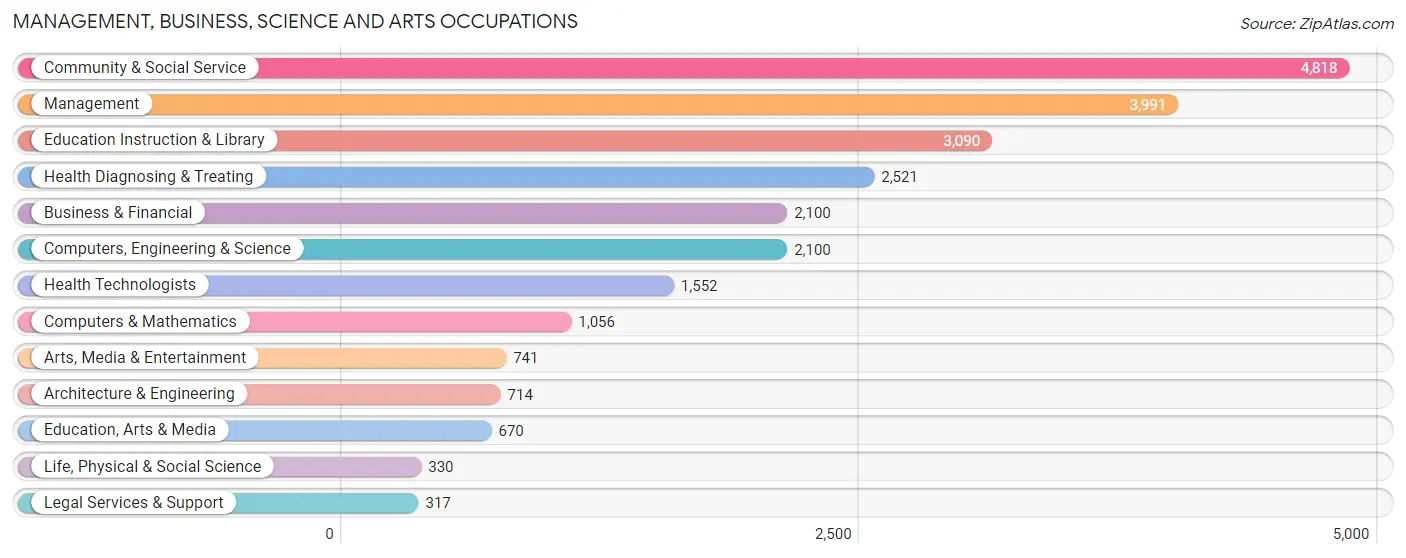
Management, Business, Science and Arts Occupations
The most common Management, Business, Science and Arts occupations in Cheshire County are Community & Social Service (4,818 | 12.3%), Management (3,991 | 10.2%), Education Instruction & Library (3,090 | 7.9%), Health Diagnosing & Treating (2,521 | 6.5%), and Business & Financial (2,100 | 5.4%).
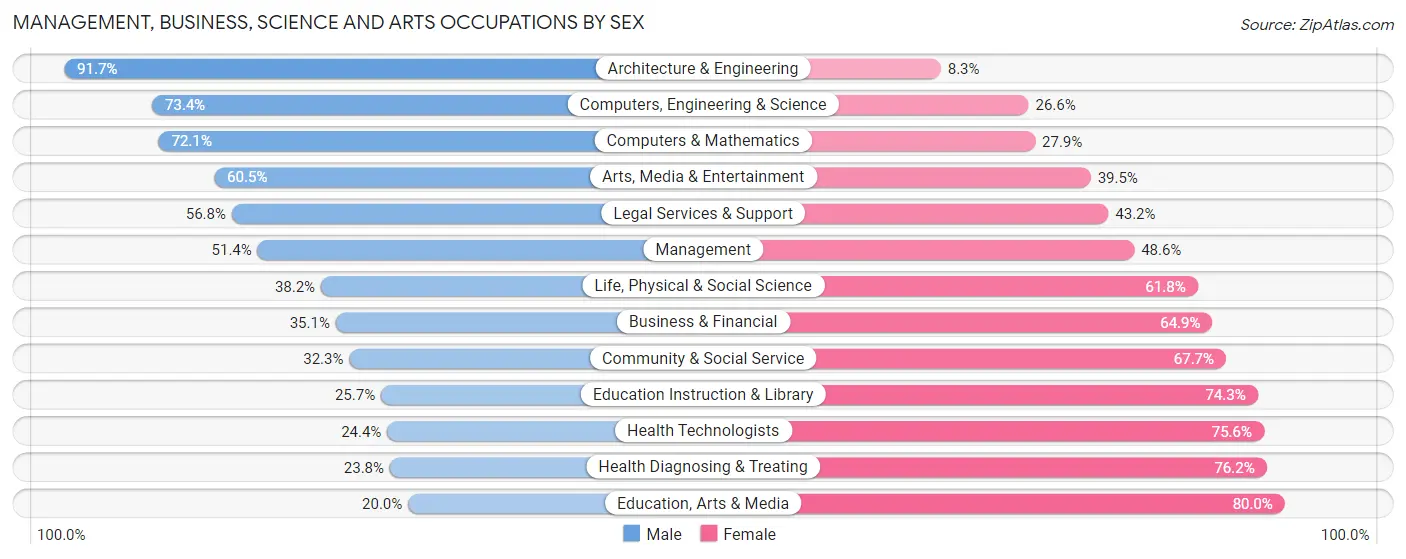
Management, Business, Science and Arts Occupations by Sex
Within the Management, Business, Science and Arts occupations in Cheshire County, the most male-oriented occupations are Architecture & Engineering (91.7%), Computers, Engineering & Science (73.4%), and Computers & Mathematics (72.1%), while the most female-oriented occupations are Education, Arts & Media (80.0%), Health Diagnosing & Treating (76.2%), and Health Technologists (75.6%).
| Occupation | Male | Female |
| Management | 2,051 (51.4%) | 1,940 (48.6%) |
| Business & Financial | 737 (35.1%) | 1,363 (64.9%) |
| Computers, Engineering & Science | 1,542 (73.4%) | 558 (26.6%) |
| Computers & Mathematics | 761 (72.1%) | 295 (27.9%) |
| Architecture & Engineering | 655 (91.7%) | 59 (8.3%) |
| Life, Physical & Social Science | 126 (38.2%) | 204 (61.8%) |
| Community & Social Service | 1,555 (32.3%) | 3,263 (67.7%) |
| Education, Arts & Media | 134 (20.0%) | 536 (80.0%) |
| Legal Services & Support | 180 (56.8%) | 137 (43.2%) |
| Education Instruction & Library | 793 (25.7%) | 2,297 (74.3%) |
| Arts, Media & Entertainment | 448 (60.5%) | 293 (39.5%) |
| Health Diagnosing & Treating | 600 (23.8%) | 1,921 (76.2%) |
| Health Technologists | 378 (24.4%) | 1,174 (75.6%) |
| Total (Category) | 6,485 (41.8%) | 9,045 (58.2%) |
| Total (Overall) | 20,231 (51.7%) | 18,878 (48.3%) |
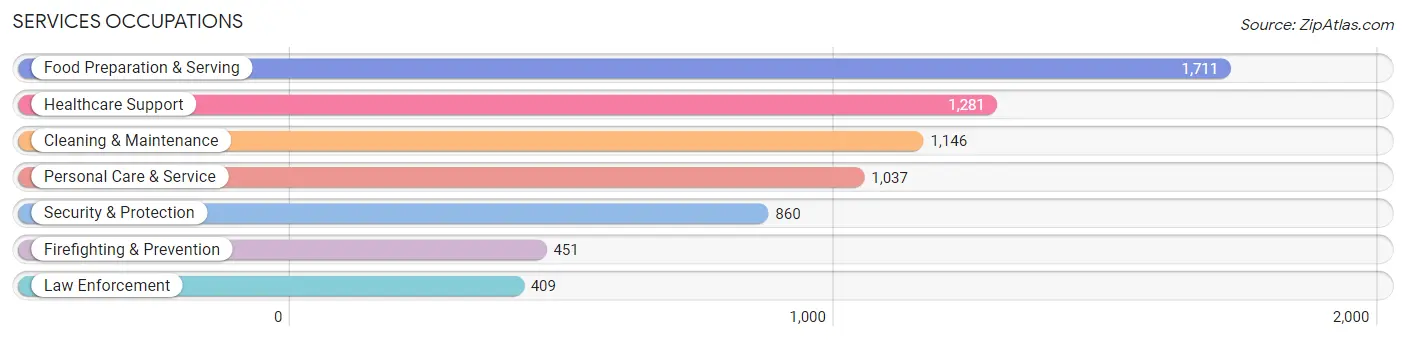
Services Occupations
The most common Services occupations in Cheshire County are Food Preparation & Serving (1,711 | 4.4%), Healthcare Support (1,281 | 3.3%), Cleaning & Maintenance (1,146 | 2.9%), Personal Care & Service (1,037 | 2.6%), and Security & Protection (860 | 2.2%).
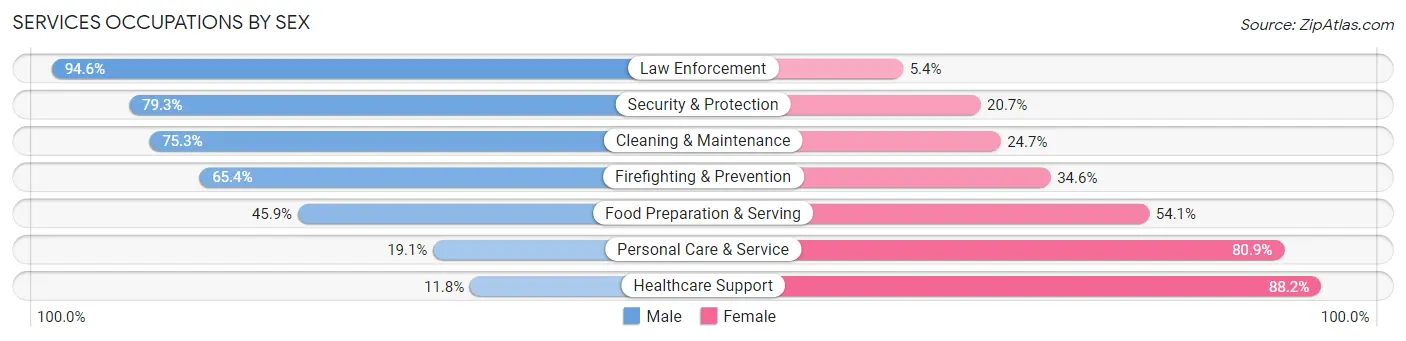
Services Occupations by Sex
Within the Services occupations in Cheshire County, the most male-oriented occupations are Law Enforcement (94.6%), Security & Protection (79.3%), and Cleaning & Maintenance (75.3%), while the most female-oriented occupations are Healthcare Support (88.2%), Personal Care & Service (80.9%), and Food Preparation & Serving (54.1%).
| Occupation | Male | Female |
| Healthcare Support | 151 (11.8%) | 1,130 (88.2%) |
| Security & Protection | 682 (79.3%) | 178 (20.7%) |
| Firefighting & Prevention | 295 (65.4%) | 156 (34.6%) |
| Law Enforcement | 387 (94.6%) | 22 (5.4%) |
| Food Preparation & Serving | 785 (45.9%) | 926 (54.1%) |
| Cleaning & Maintenance | 863 (75.3%) | 283 (24.7%) |
| Personal Care & Service | 198 (19.1%) | 839 (80.9%) |
| Total (Category) | 2,679 (44.4%) | 3,356 (55.6%) |
| Total (Overall) | 20,231 (51.7%) | 18,878 (48.3%) |
Sales and Office Occupations
The most common Sales and Office occupations in Cheshire County are Sales & Related (4,090 | 10.5%), and Office & Administration (3,945 | 10.1%).

Sales and Office Occupations by Sex
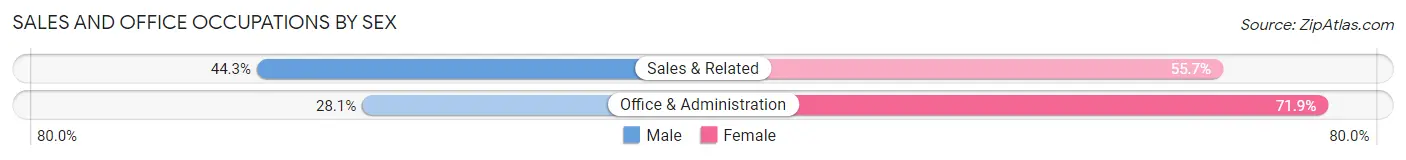
| Occupation | Male | Female |
| Sales & Related | 1,811 (44.3%) | 2,279 (55.7%) |
| Office & Administration | 1,108 (28.1%) | 2,837 (71.9%) |
| Total (Category) | 2,919 (36.3%) | 5,116 (63.7%) |
| Total (Overall) | 20,231 (51.7%) | 18,878 (48.3%) |
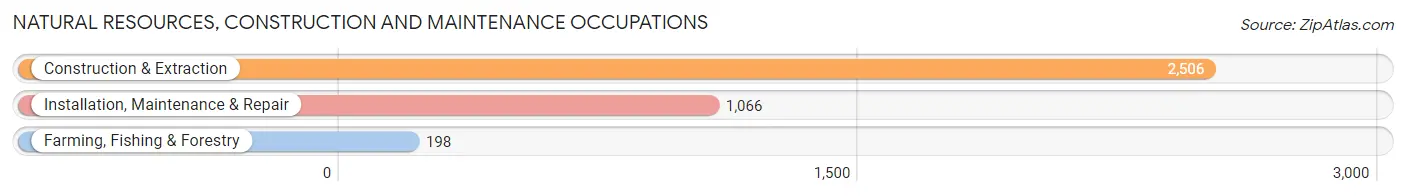
Natural Resources, Construction and Maintenance Occupations
The most common Natural Resources, Construction and Maintenance occupations in Cheshire County are Construction & Extraction (2,506 | 6.4%), Installation, Maintenance & Repair (1,066 | 2.7%), and Farming, Fishing & Forestry (198 | 0.5%).
Natural Resources, Construction and Maintenance Occupations by Sex
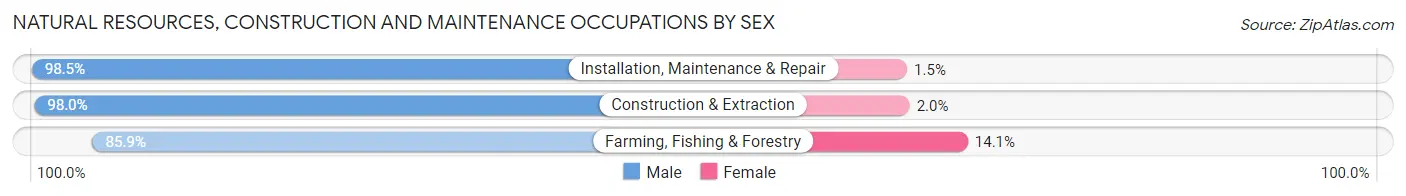
| Occupation | Male | Female |
| Farming, Fishing & Forestry | 170 (85.9%) | 28 (14.1%) |
| Construction & Extraction | 2,455 (98.0%) | 51 (2.0%) |
| Installation, Maintenance & Repair | 1,050 (98.5%) | 16 (1.5%) |
| Total (Category) | 3,675 (97.5%) | 95 (2.5%) |
| Total (Overall) | 20,231 (51.7%) | 18,878 (48.3%) |
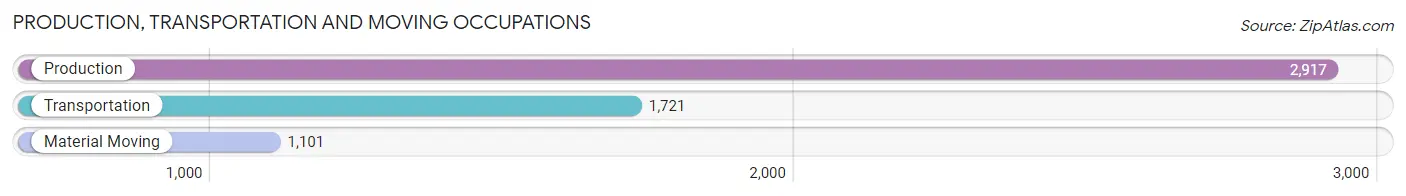
Production, Transportation and Moving Occupations
The most common Production, Transportation and Moving occupations in Cheshire County are Production (2,917 | 7.5%), Transportation (1,721 | 4.4%), and Material Moving (1,101 | 2.8%).
Production, Transportation and Moving Occupations by Sex
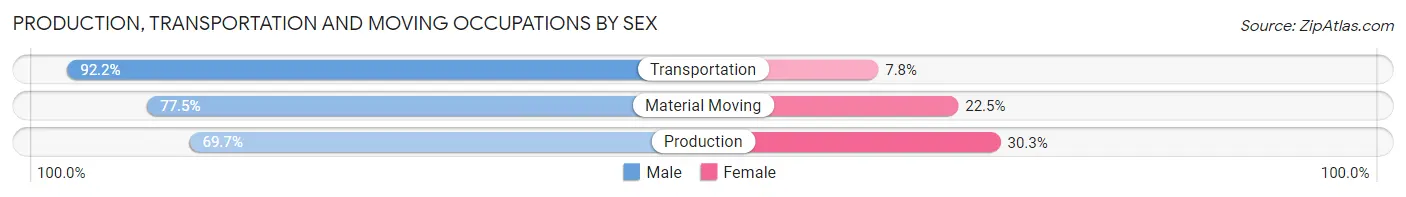
| Occupation | Male | Female |
| Production | 2,034 (69.7%) | 883 (30.3%) |
| Transportation | 1,586 (92.2%) | 135 (7.8%) |
| Material Moving | 853 (77.5%) | 248 (22.5%) |
| Total (Category) | 4,473 (77.9%) | 1,266 (22.1%) |
| Total (Overall) | 20,231 (51.7%) | 18,878 (48.3%) |
Employment Industries by Sex in Cheshire County
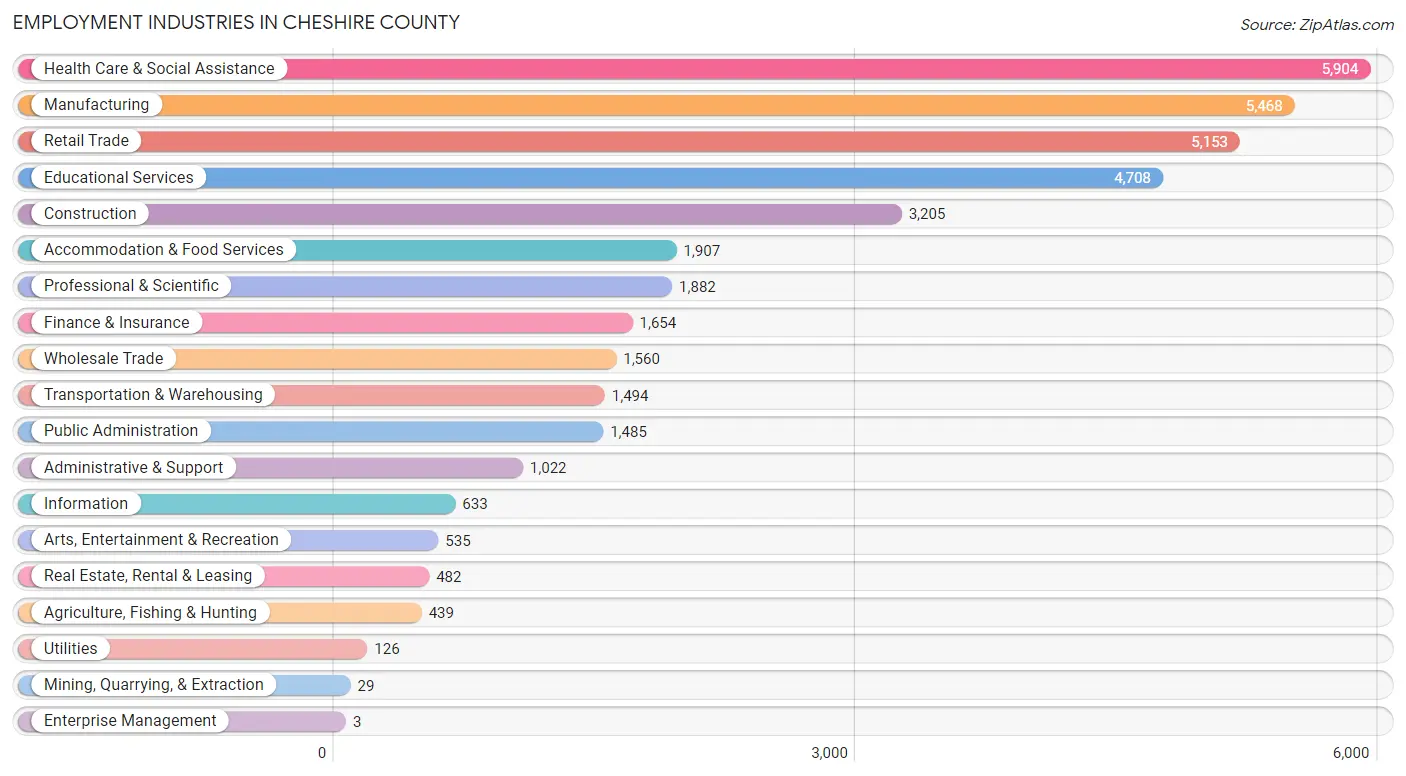
Employment Industries in Cheshire County
The major employment industries in Cheshire County include Health Care & Social Assistance (5,904 | 15.1%), Manufacturing (5,468 | 14.0%), Retail Trade (5,153 | 13.2%), Educational Services (4,708 | 12.0%), and Construction (3,205 | 8.2%).
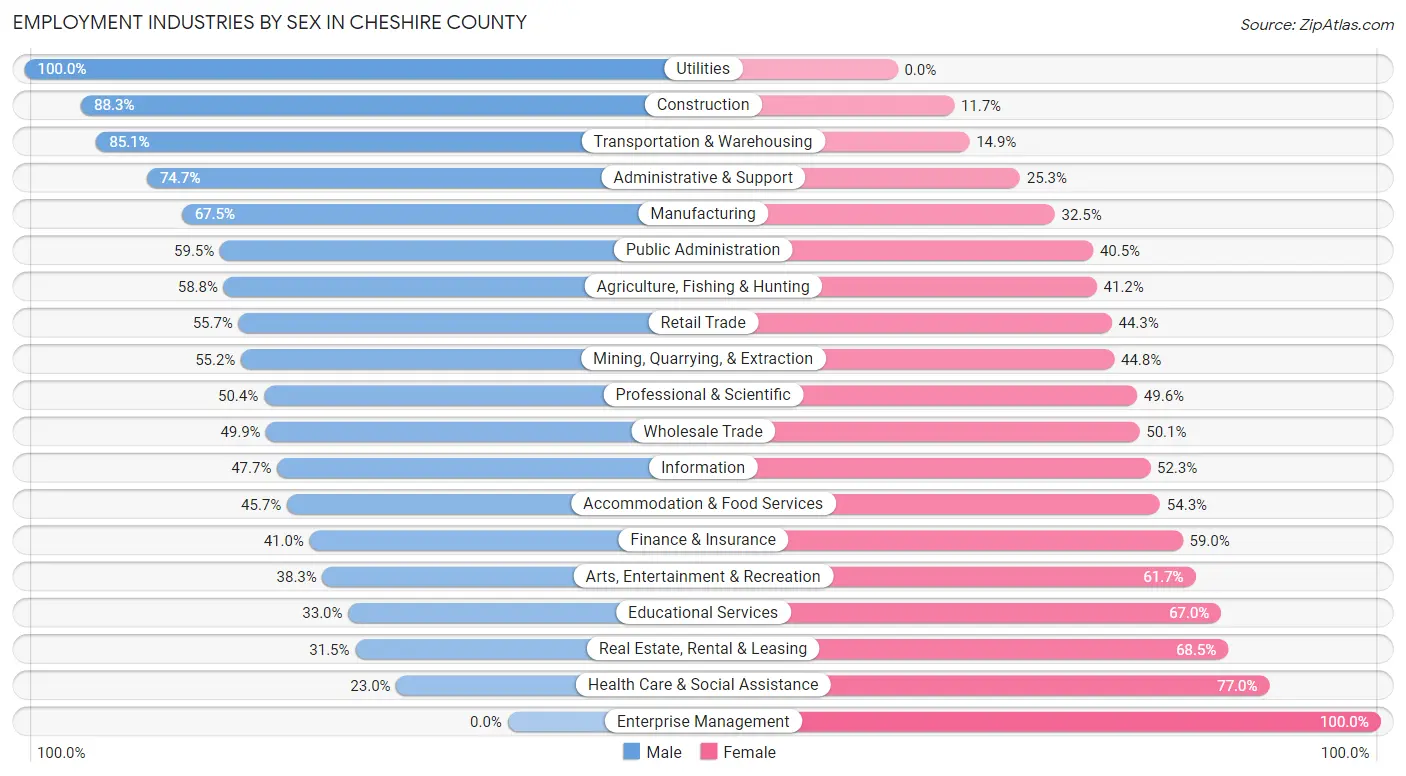
Employment Industries by Sex in Cheshire County
The Cheshire County industries that see more men than women are Utilities (100.0%), Construction (88.3%), and Transportation & Warehousing (85.1%), whereas the industries that tend to have a higher number of women are Enterprise Management (100.0%), Health Care & Social Assistance (77.0%), and Real Estate, Rental & Leasing (68.5%).
| Industry | Male | Female |
| Agriculture, Fishing & Hunting | 258 (58.8%) | 181 (41.2%) |
| Mining, Quarrying, & Extraction | 16 (55.2%) | 13 (44.8%) |
| Construction | 2,830 (88.3%) | 375 (11.7%) |
| Manufacturing | 3,690 (67.5%) | 1,778 (32.5%) |
| Wholesale Trade | 779 (49.9%) | 781 (50.1%) |
| Retail Trade | 2,869 (55.7%) | 2,284 (44.3%) |
| Transportation & Warehousing | 1,272 (85.1%) | 222 (14.9%) |
| Utilities | 126 (100.0%) | 0 (0.0%) |
| Information | 302 (47.7%) | 331 (52.3%) |
| Finance & Insurance | 678 (41.0%) | 976 (59.0%) |
| Real Estate, Rental & Leasing | 152 (31.5%) | 330 (68.5%) |
| Professional & Scientific | 949 (50.4%) | 933 (49.6%) |
| Enterprise Management | 0 (0.0%) | 3 (100.0%) |
| Administrative & Support | 763 (74.7%) | 259 (25.3%) |
| Educational Services | 1,553 (33.0%) | 3,155 (67.0%) |
| Health Care & Social Assistance | 1,360 (23.0%) | 4,544 (77.0%) |
| Arts, Entertainment & Recreation | 205 (38.3%) | 330 (61.7%) |
| Accommodation & Food Services | 871 (45.7%) | 1,036 (54.3%) |
| Public Administration | 884 (59.5%) | 601 (40.5%) |
| Total | 20,231 (51.7%) | 18,878 (48.3%) |
Education in Cheshire County
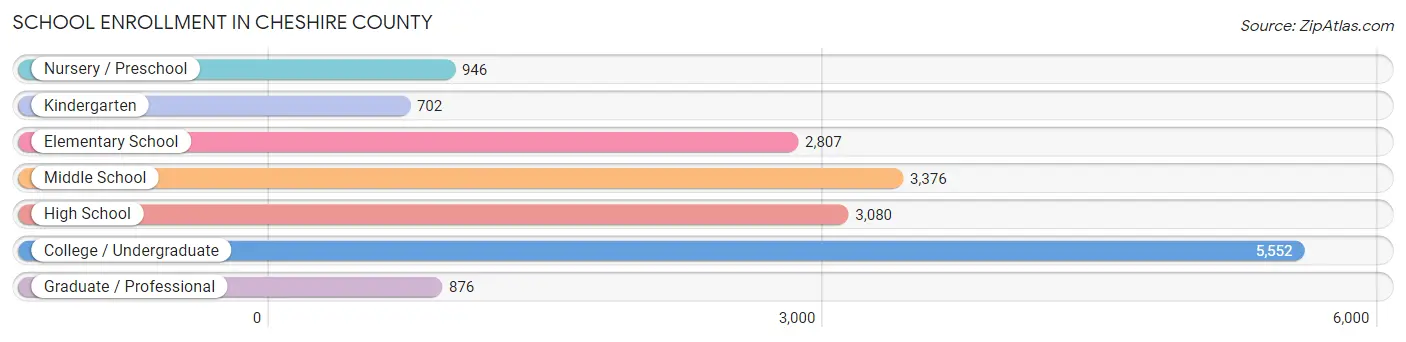
School Enrollment in Cheshire County
The most common levels of schooling among the 17,339 students in Cheshire County are college / undergraduate (5,552 | 32.0%), middle school (3,376 | 19.5%), and high school (3,080 | 17.8%).
| School Level | # Students | % Students |
| Nursery / Preschool | 946 | 5.5% |
| Kindergarten | 702 | 4.1% |
| Elementary School | 2,807 | 16.2% |
| Middle School | 3,376 | 19.5% |
| High School | 3,080 | 17.8% |
| College / Undergraduate | 5,552 | 32.0% |
| Graduate / Professional | 876 | 5.1% |
| Total | 17,339 | 100.0% |
School Enrollment by Age by Funding Source in Cheshire County
Out of a total of 17,339 students who are enrolled in schools in Cheshire County, 4,179 (24.1%) attend a private institution, while the remaining 13,160 (75.9%) are enrolled in public schools. The age group of 3 to 4 year olds has the highest likelihood of being enrolled in private schools, with 505 (68.6% in the age bracket) enrolled. Conversely, the age group of 10 to 14 year olds has the lowest likelihood of being enrolled in a private school, with 3,549 (88.7% in the age bracket) attending a public institution.
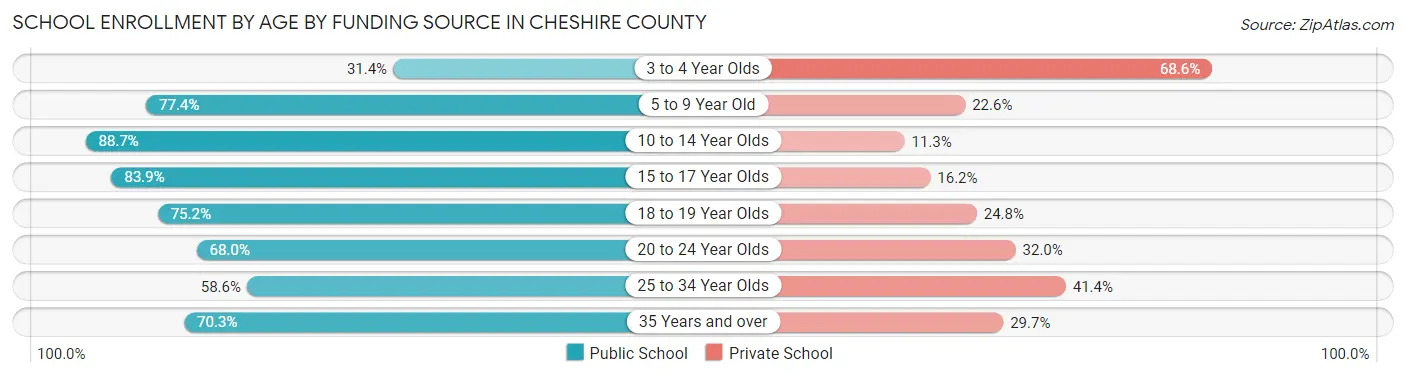
| Age Bracket | Public School | Private School |
| 3 to 4 Year Olds | 231 (31.4%) | 505 (68.6%) |
| 5 to 9 Year Old | 2,601 (77.4%) | 761 (22.6%) |
| 10 to 14 Year Olds | 3,549 (88.7%) | 454 (11.3%) |
| 15 to 17 Year Olds | 1,973 (83.9%) | 380 (16.2%) |
| 18 to 19 Year Olds | 1,838 (75.2%) | 606 (24.8%) |
| 20 to 24 Year Olds | 1,797 (68.0%) | 847 (32.0%) |
| 25 to 34 Year Olds | 432 (58.6%) | 305 (41.4%) |
| 35 Years and over | 745 (70.3%) | 315 (29.7%) |
| Total | 13,160 (75.9%) | 4,179 (24.1%) |
Educational Attainment by Field of Study in Cheshire County
Education (3,177 | 15.4%), business (2,700 | 13.1%), science & technology (1,874 | 9.1%), bio, nature & agricultural (1,600 | 7.7%), and psychology (1,589 | 7.7%) are the most common fields of study among 20,684 individuals in Cheshire County who have obtained a bachelor's degree or higher.
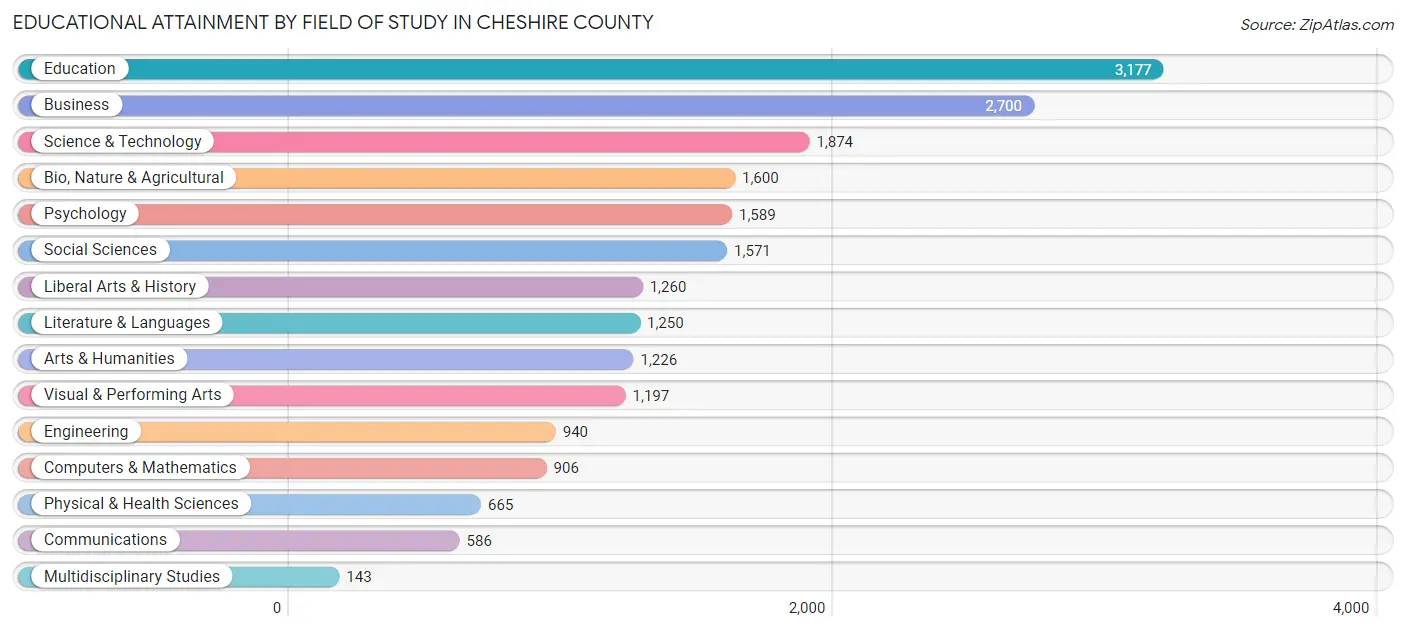
| Field of Study | # Graduates | % Graduates |
| Computers & Mathematics | 906 | 4.4% |
| Bio, Nature & Agricultural | 1,600 | 7.7% |
| Physical & Health Sciences | 665 | 3.2% |
| Psychology | 1,589 | 7.7% |
| Social Sciences | 1,571 | 7.6% |
| Engineering | 940 | 4.5% |
| Multidisciplinary Studies | 143 | 0.7% |
| Science & Technology | 1,874 | 9.1% |
| Business | 2,700 | 13.1% |
| Education | 3,177 | 15.4% |
| Literature & Languages | 1,250 | 6.0% |
| Liberal Arts & History | 1,260 | 6.1% |
| Visual & Performing Arts | 1,197 | 5.8% |
| Communications | 586 | 2.8% |
| Arts & Humanities | 1,226 | 5.9% |
| Total | 20,684 | 100.0% |
Transportation & Commute in Cheshire County
Vehicle Availability by Sex in Cheshire County
The most prevalent vehicle ownership categories in Cheshire County are males with 2 vehicles (8,623, accounting for 44.4%) and females with 2 vehicles (7,732, making up 48.7%).
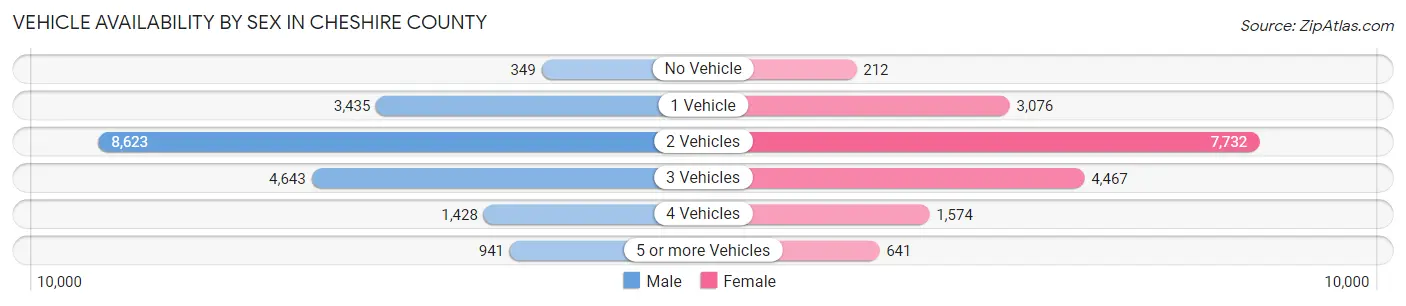
| Vehicles Available | Male | Female |
| No Vehicle | 349 (1.8%) | 212 (1.2%) |
| 1 Vehicle | 3,435 (17.7%) | 3,076 (17.4%) |
| 2 Vehicles | 8,623 (44.4%) | 7,732 (43.7%) |
| 3 Vehicles | 4,643 (23.9%) | 4,467 (25.2%) |
| 4 Vehicles | 1,428 (7.3%) | 1,574 (8.9%) |
| 5 or more Vehicles | 941 (4.9%) | 641 (3.6%) |
| Total | 19,419 (100.0%) | 17,702 (100.0%) |
Commute Time in Cheshire County
The most frequently occuring commute durations in Cheshire County are 10 to 14 minutes (5,576 commuters, 16.4%), 5 to 9 minutes (5,235 commuters, 15.4%), and 15 to 19 minutes (4,884 commuters, 14.3%).
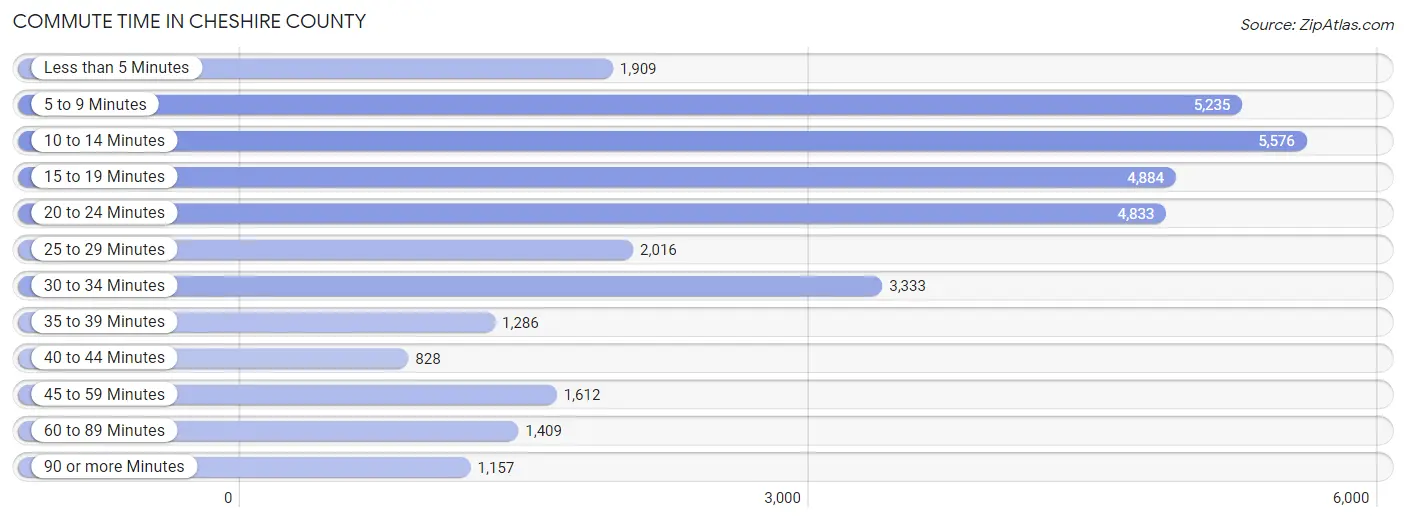
| Commute Time | # Commuters | % Commuters |
| Less than 5 Minutes | 1,909 | 5.6% |
| 5 to 9 Minutes | 5,235 | 15.4% |
| 10 to 14 Minutes | 5,576 | 16.4% |
| 15 to 19 Minutes | 4,884 | 14.3% |
| 20 to 24 Minutes | 4,833 | 14.2% |
| 25 to 29 Minutes | 2,016 | 5.9% |
| 30 to 34 Minutes | 3,333 | 9.8% |
| 35 to 39 Minutes | 1,286 | 3.8% |
| 40 to 44 Minutes | 828 | 2.4% |
| 45 to 59 Minutes | 1,612 | 4.7% |
| 60 to 89 Minutes | 1,409 | 4.1% |
| 90 or more Minutes | 1,157 | 3.4% |
Commute Time by Sex in Cheshire County
The most common commute times in Cheshire County are 5 to 9 minutes (2,871 commuters, 16.1%) for males and 10 to 14 minutes (2,901 commuters, 17.9%) for females.
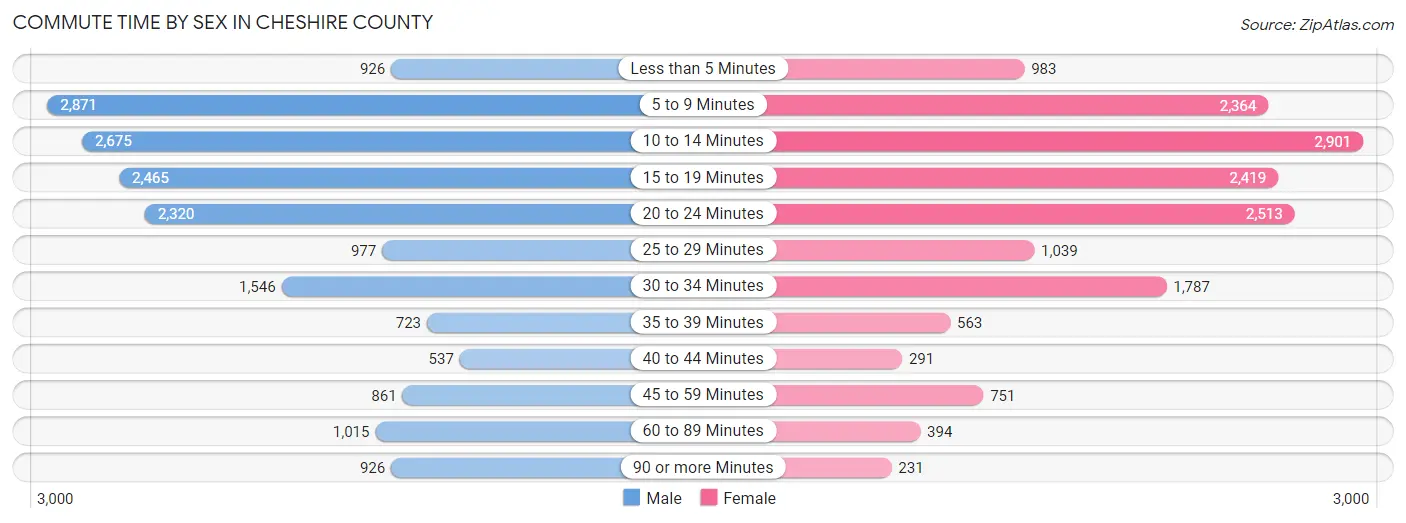
| Commute Time | Male | Female |
| Less than 5 Minutes | 926 (5.2%) | 983 (6.0%) |
| 5 to 9 Minutes | 2,871 (16.1%) | 2,364 (14.6%) |
| 10 to 14 Minutes | 2,675 (15.0%) | 2,901 (17.9%) |
| 15 to 19 Minutes | 2,465 (13.8%) | 2,419 (14.9%) |
| 20 to 24 Minutes | 2,320 (13.0%) | 2,513 (15.5%) |
| 25 to 29 Minutes | 977 (5.5%) | 1,039 (6.4%) |
| 30 to 34 Minutes | 1,546 (8.7%) | 1,787 (11.0%) |
| 35 to 39 Minutes | 723 (4.1%) | 563 (3.5%) |
| 40 to 44 Minutes | 537 (3.0%) | 291 (1.8%) |
| 45 to 59 Minutes | 861 (4.8%) | 751 (4.6%) |
| 60 to 89 Minutes | 1,015 (5.7%) | 394 (2.4%) |
| 90 or more Minutes | 926 (5.2%) | 231 (1.4%) |
Time of Departure to Work by Sex in Cheshire County
The most frequent times of departure to work in Cheshire County are 7:00 AM to 7:29 AM (2,368, 13.3%) for males and 7:30 AM to 7:59 AM (3,030, 18.7%) for females.
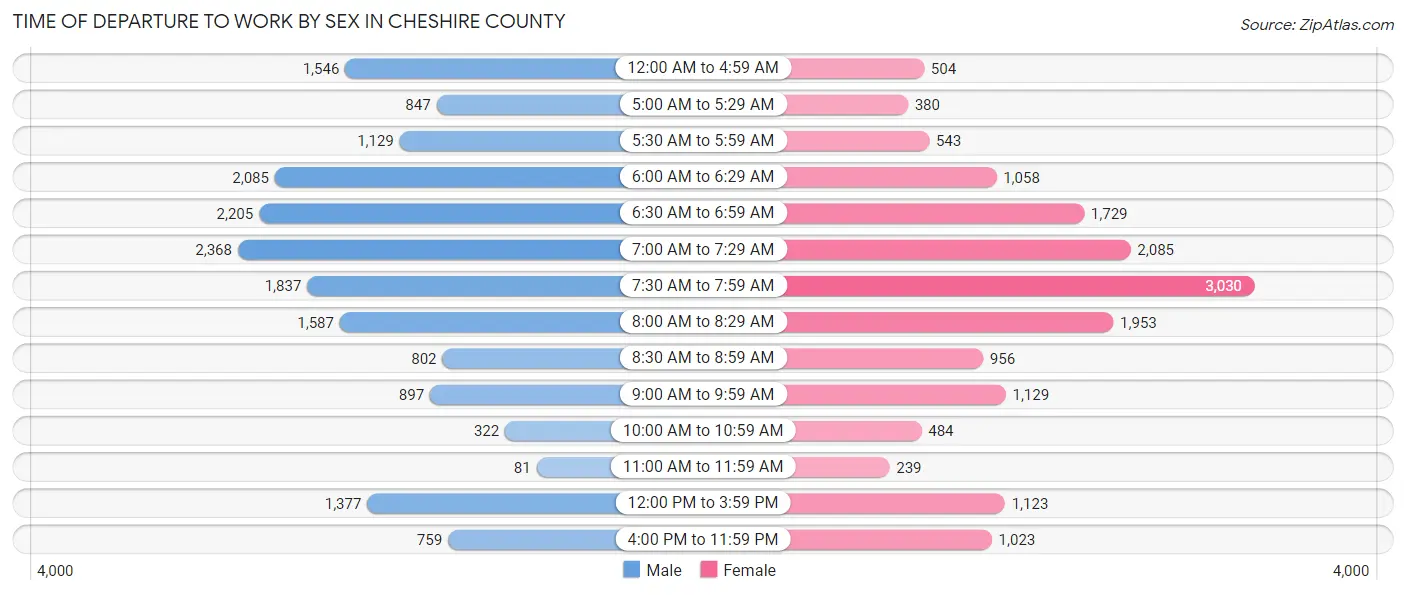
| Time of Departure | Male | Female |
| 12:00 AM to 4:59 AM | 1,546 (8.7%) | 504 (3.1%) |
| 5:00 AM to 5:29 AM | 847 (4.8%) | 380 (2.3%) |
| 5:30 AM to 5:59 AM | 1,129 (6.3%) | 543 (3.3%) |
| 6:00 AM to 6:29 AM | 2,085 (11.7%) | 1,058 (6.5%) |
| 6:30 AM to 6:59 AM | 2,205 (12.4%) | 1,729 (10.6%) |
| 7:00 AM to 7:29 AM | 2,368 (13.3%) | 2,085 (12.8%) |
| 7:30 AM to 7:59 AM | 1,837 (10.3%) | 3,030 (18.7%) |
| 8:00 AM to 8:29 AM | 1,587 (8.9%) | 1,953 (12.0%) |
| 8:30 AM to 8:59 AM | 802 (4.5%) | 956 (5.9%) |
| 9:00 AM to 9:59 AM | 897 (5.0%) | 1,129 (7.0%) |
| 10:00 AM to 10:59 AM | 322 (1.8%) | 484 (3.0%) |
| 11:00 AM to 11:59 AM | 81 (0.4%) | 239 (1.5%) |
| 12:00 PM to 3:59 PM | 1,377 (7.7%) | 1,123 (6.9%) |
| 4:00 PM to 11:59 PM | 759 (4.3%) | 1,023 (6.3%) |
| Total | 17,842 (100.0%) | 16,236 (100.0%) |
Housing Occupancy in Cheshire County
Occupancy by Ownership in Cheshire County
Of the total 30,307 dwellings in Cheshire County, owner-occupied units account for 21,422 (70.7%), while renter-occupied units make up 8,885 (29.3%).
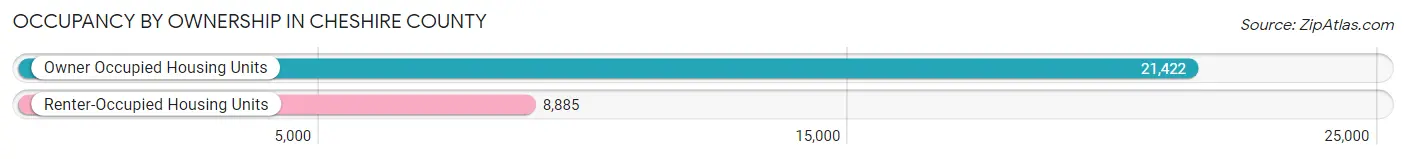
| Occupancy | # Housing Units | % Housing Units |
| Owner Occupied Housing Units | 21,422 | 70.7% |
| Renter-Occupied Housing Units | 8,885 | 29.3% |
| Total Occupied Housing Units | 30,307 | 100.0% |
Occupancy by Household Size in Cheshire County
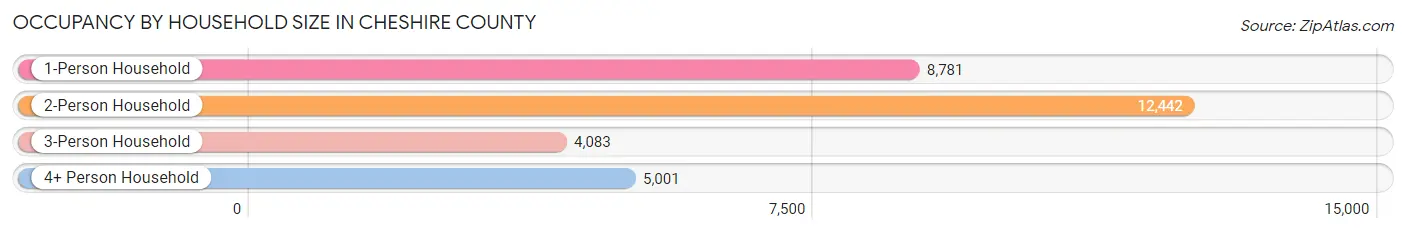
| Household Size | # Housing Units | % Housing Units |
| 1-Person Household | 8,781 | 29.0% |
| 2-Person Household | 12,442 | 41.0% |
| 3-Person Household | 4,083 | 13.5% |
| 4+ Person Household | 5,001 | 16.5% |
| Total Housing Units | 30,307 | 100.0% |
Occupancy by Ownership by Household Size in Cheshire County
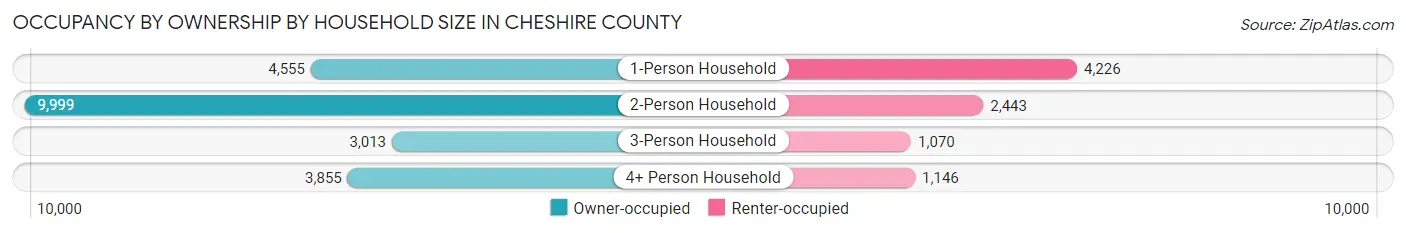
| Household Size | Owner-occupied | Renter-occupied |
| 1-Person Household | 4,555 (51.9%) | 4,226 (48.1%) |
| 2-Person Household | 9,999 (80.4%) | 2,443 (19.6%) |
| 3-Person Household | 3,013 (73.8%) | 1,070 (26.2%) |
| 4+ Person Household | 3,855 (77.1%) | 1,146 (22.9%) |
| Total Housing Units | 21,422 (70.7%) | 8,885 (29.3%) |
Occupancy by Educational Attainment in Cheshire County
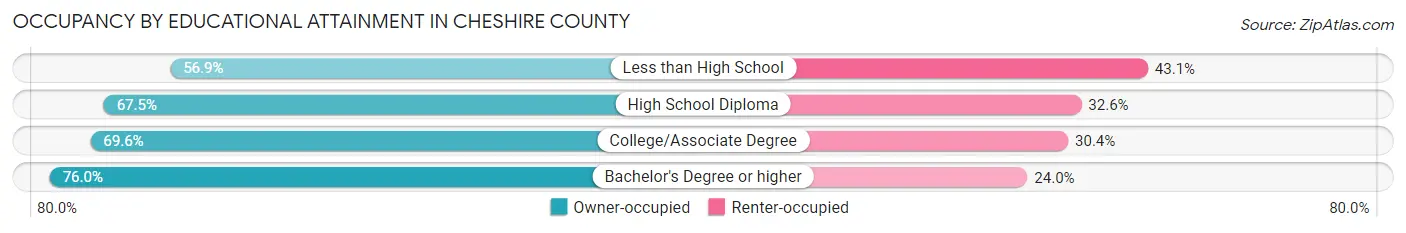
| Household Size | Owner-occupied | Renter-occupied |
| Less than High School | 948 (56.9%) | 718 (43.1%) |
| High School Diploma | 5,705 (67.4%) | 2,753 (32.6%) |
| College/Associate Degree | 6,170 (69.6%) | 2,700 (30.4%) |
| Bachelor's Degree or higher | 8,599 (76.0%) | 2,714 (24.0%) |
Occupancy by Age of Householder in Cheshire County
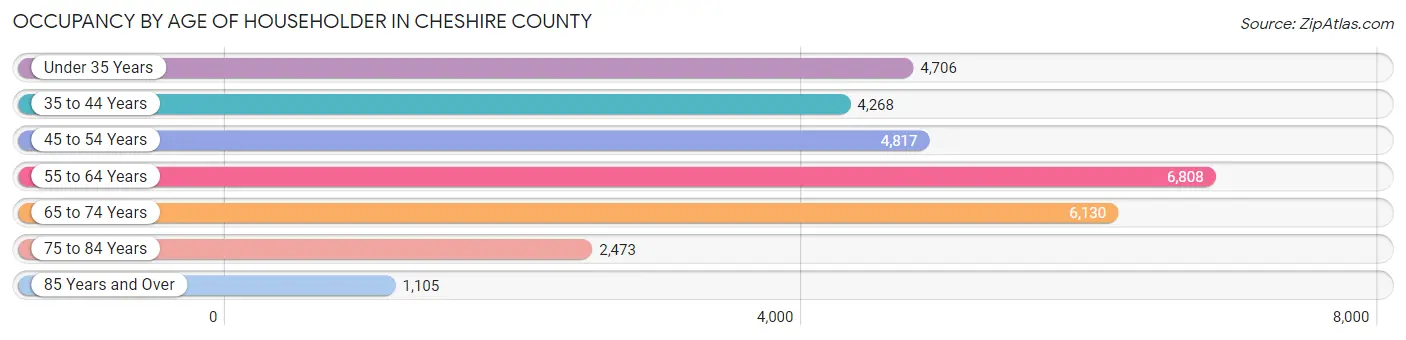
| Age Bracket | # Households | % Households |
| Under 35 Years | 4,706 | 15.5% |
| 35 to 44 Years | 4,268 | 14.1% |
| 45 to 54 Years | 4,817 | 15.9% |
| 55 to 64 Years | 6,808 | 22.5% |
| 65 to 74 Years | 6,130 | 20.2% |
| 75 to 84 Years | 2,473 | 8.2% |
| 85 Years and Over | 1,105 | 3.6% |
| Total | 30,307 | 100.0% |
Housing Finances in Cheshire County
Median Income by Occupancy in Cheshire County
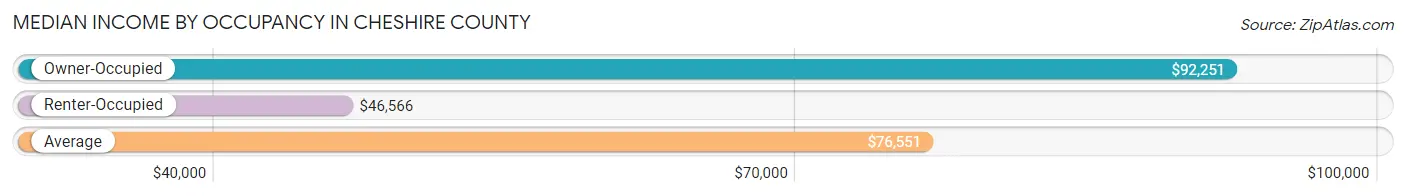
| Occupancy Type | # Households | Median Income |
| Owner-Occupied | 21,422 (70.7%) | $92,251 |
| Renter-Occupied | 8,885 (29.3%) | $46,566 |
| Average | 30,307 (100.0%) | $76,551 |
Occupancy by Householder Income Bracket in Cheshire County
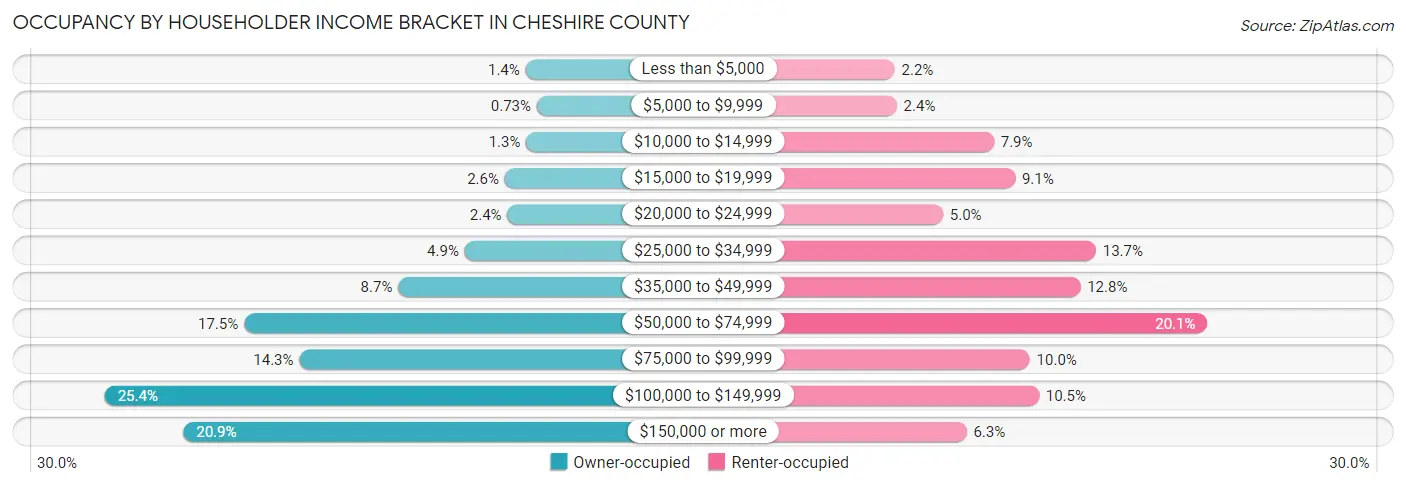
| Income Bracket | Owner-occupied | Renter-occupied |
| Less than $5,000 | 294 (1.4%) | 198 (2.2%) |
| $5,000 to $9,999 | 157 (0.7%) | 209 (2.4%) |
| $10,000 to $14,999 | 284 (1.3%) | 702 (7.9%) |
| $15,000 to $19,999 | 548 (2.6%) | 809 (9.1%) |
| $20,000 to $24,999 | 516 (2.4%) | 443 (5.0%) |
| $25,000 to $34,999 | 1,038 (4.9%) | 1,220 (13.7%) |
| $35,000 to $49,999 | 1,852 (8.6%) | 1,141 (12.8%) |
| $50,000 to $74,999 | 3,740 (17.5%) | 1,786 (20.1%) |
| $75,000 to $99,999 | 3,064 (14.3%) | 884 (10.0%) |
| $100,000 to $149,999 | 5,445 (25.4%) | 930 (10.5%) |
| $150,000 or more | 4,484 (20.9%) | 563 (6.3%) |
| Total | 21,422 (100.0%) | 8,885 (100.0%) |
Monthly Housing Cost Tiers in Cheshire County
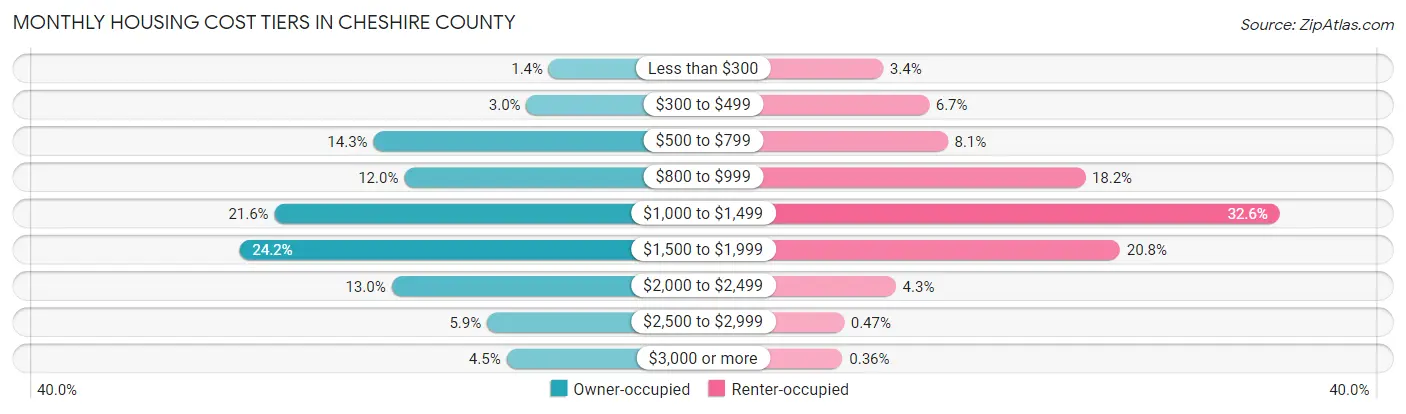
| Monthly Cost | Owner-occupied | Renter-occupied |
| Less than $300 | 297 (1.4%) | 298 (3.4%) |
| $300 to $499 | 652 (3.0%) | 598 (6.7%) |
| $500 to $799 | 3,066 (14.3%) | 721 (8.1%) |
| $800 to $999 | 2,579 (12.0%) | 1,620 (18.2%) |
| $1,000 to $1,499 | 4,628 (21.6%) | 2,894 (32.6%) |
| $1,500 to $1,999 | 5,180 (24.2%) | 1,848 (20.8%) |
| $2,000 to $2,499 | 2,780 (13.0%) | 381 (4.3%) |
| $2,500 to $2,999 | 1,273 (5.9%) | 42 (0.5%) |
| $3,000 or more | 967 (4.5%) | 32 (0.4%) |
| Total | 21,422 (100.0%) | 8,885 (100.0%) |
Physical Housing Characteristics in Cheshire County
Housing Structures in Cheshire County
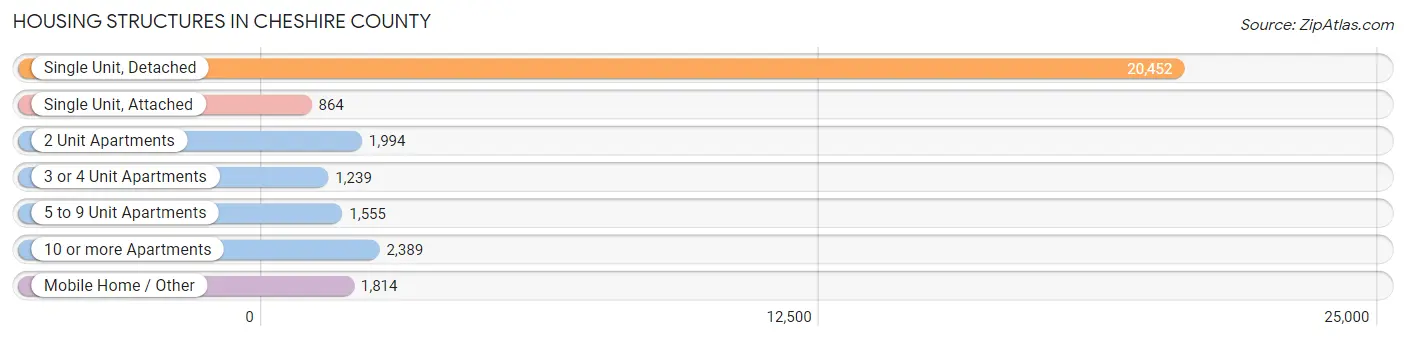
| Structure Type | # Housing Units | % Housing Units |
| Single Unit, Detached | 20,452 | 67.5% |
| Single Unit, Attached | 864 | 2.9% |
| 2 Unit Apartments | 1,994 | 6.6% |
| 3 or 4 Unit Apartments | 1,239 | 4.1% |
| 5 to 9 Unit Apartments | 1,555 | 5.1% |
| 10 or more Apartments | 2,389 | 7.9% |
| Mobile Home / Other | 1,814 | 6.0% |
| Total | 30,307 | 100.0% |
Housing Structures by Occupancy in Cheshire County
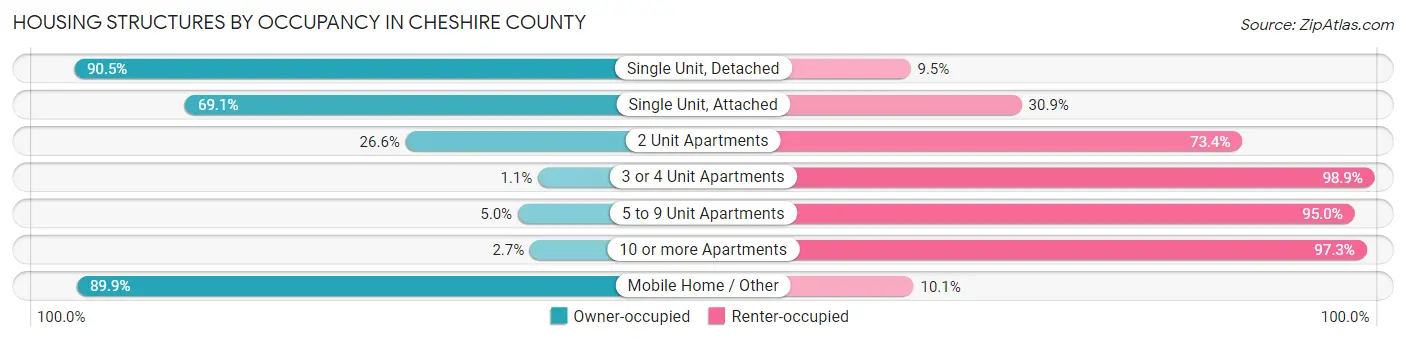
| Structure Type | Owner-occupied | Renter-occupied |
| Single Unit, Detached | 18,507 (90.5%) | 1,945 (9.5%) |
| Single Unit, Attached | 597 (69.1%) | 267 (30.9%) |
| 2 Unit Apartments | 531 (26.6%) | 1,463 (73.4%) |
| 3 or 4 Unit Apartments | 14 (1.1%) | 1,225 (98.9%) |
| 5 to 9 Unit Apartments | 78 (5.0%) | 1,477 (95.0%) |
| 10 or more Apartments | 64 (2.7%) | 2,325 (97.3%) |
| Mobile Home / Other | 1,631 (89.9%) | 183 (10.1%) |
| Total | 21,422 (70.7%) | 8,885 (29.3%) |
Housing Structures by Number of Rooms in Cheshire County
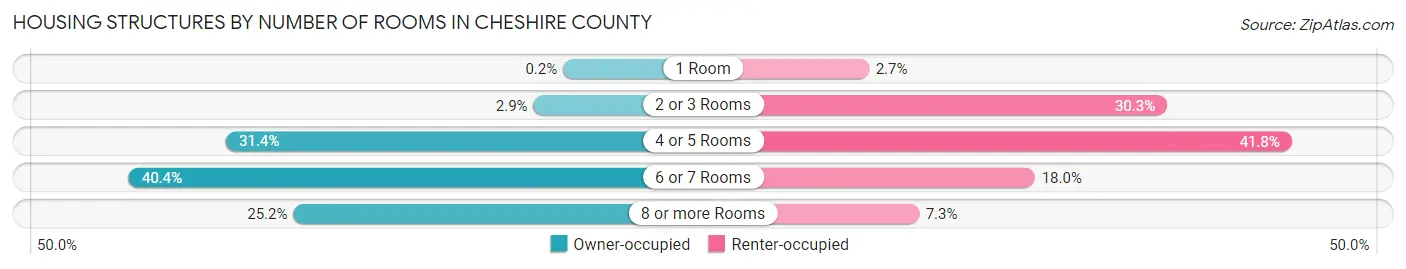
| Number of Rooms | Owner-occupied | Renter-occupied |
| 1 Room | 43 (0.2%) | 236 (2.7%) |
| 2 or 3 Rooms | 630 (2.9%) | 2,688 (30.2%) |
| 4 or 5 Rooms | 6,717 (31.4%) | 3,712 (41.8%) |
| 6 or 7 Rooms | 8,645 (40.4%) | 1,601 (18.0%) |
| 8 or more Rooms | 5,387 (25.2%) | 648 (7.3%) |
| Total | 21,422 (100.0%) | 8,885 (100.0%) |
Housing Structure by Heating Type in Cheshire County
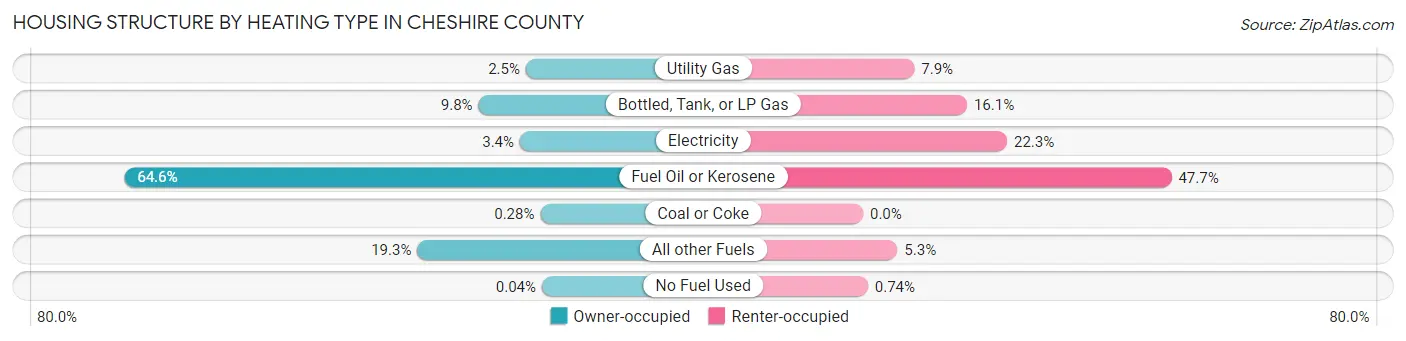
| Heating Type | Owner-occupied | Renter-occupied |
| Utility Gas | 540 (2.5%) | 705 (7.9%) |
| Bottled, Tank, or LP Gas | 2,107 (9.8%) | 1,428 (16.1%) |
| Electricity | 736 (3.4%) | 1,978 (22.3%) |
| Fuel Oil or Kerosene | 13,834 (64.6%) | 4,236 (47.7%) |
| Coal or Coke | 61 (0.3%) | 0 (0.0%) |
| All other Fuels | 4,135 (19.3%) | 472 (5.3%) |
| No Fuel Used | 9 (0.0%) | 66 (0.7%) |
| Total | 21,422 (100.0%) | 8,885 (100.0%) |
Household Vehicle Usage in Cheshire County
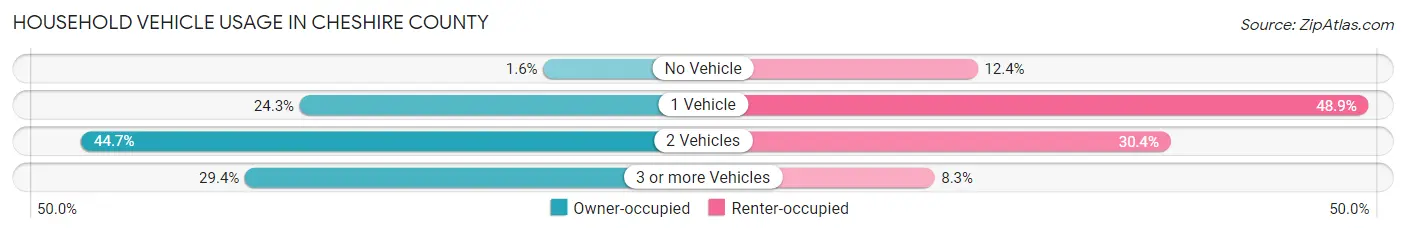
| Vehicles per Household | Owner-occupied | Renter-occupied |
| No Vehicle | 337 (1.6%) | 1,099 (12.4%) |
| 1 Vehicle | 5,206 (24.3%) | 4,342 (48.9%) |
| 2 Vehicles | 9,579 (44.7%) | 2,703 (30.4%) |
| 3 or more Vehicles | 6,300 (29.4%) | 741 (8.3%) |
| Total | 21,422 (100.0%) | 8,885 (100.0%) |
Real Estate & Mortgages in Cheshire County
Real Estate and Mortgage Overview in Cheshire County
| Characteristic | Without Mortgage | With Mortgage |
| Housing Units | 8,644 | 12,778 |
| Median Property Value | $228,200 | $244,400 |
| Median Household Income | $71,250 | $3,027 |
| Monthly Housing Costs | $852 | $939 |
| Real Estate Taxes | $5,781 | $66 |
Property Value by Mortgage Status in Cheshire County
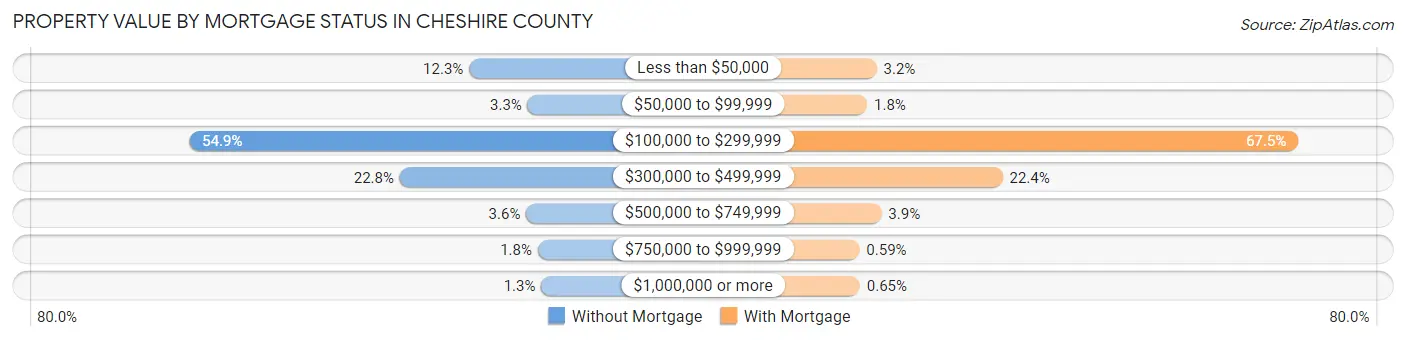
| Property Value | Without Mortgage | With Mortgage |
| Less than $50,000 | 1,060 (12.3%) | 410 (3.2%) |
| $50,000 to $99,999 | 289 (3.3%) | 225 (1.8%) |
| $100,000 to $299,999 | 4,748 (54.9%) | 8,619 (67.4%) |
| $300,000 to $499,999 | 1,973 (22.8%) | 2,862 (22.4%) |
| $500,000 to $749,999 | 308 (3.6%) | 504 (3.9%) |
| $750,000 to $999,999 | 156 (1.8%) | 75 (0.6%) |
| $1,000,000 or more | 110 (1.3%) | 83 (0.6%) |
| Total | 8,644 (100.0%) | 12,778 (100.0%) |
Household Income by Mortgage Status in Cheshire County
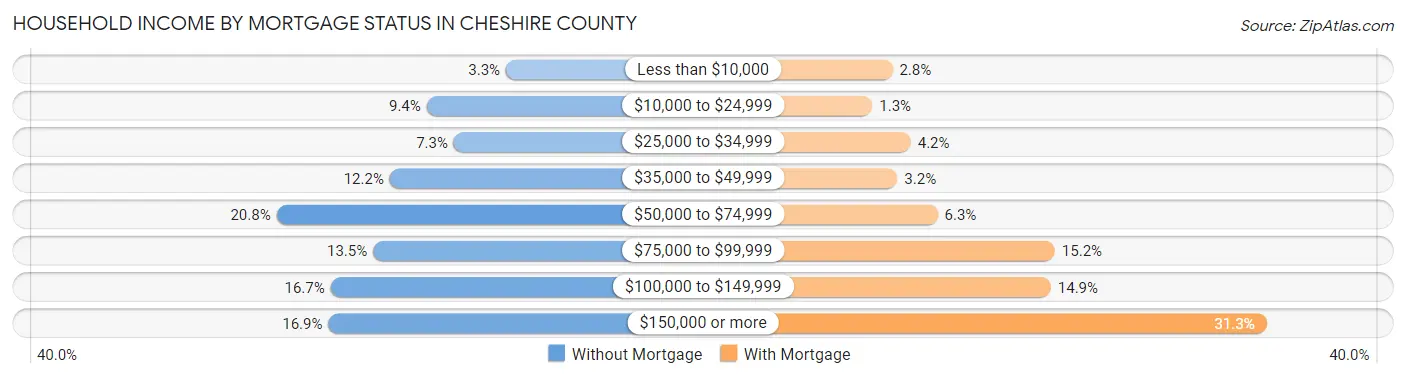
| Household Income | Without Mortgage | With Mortgage |
| Less than $10,000 | 288 (3.3%) | 359 (2.8%) |
| $10,000 to $24,999 | 810 (9.4%) | 163 (1.3%) |
| $25,000 to $34,999 | 631 (7.3%) | 538 (4.2%) |
| $35,000 to $49,999 | 1,053 (12.2%) | 407 (3.2%) |
| $50,000 to $74,999 | 1,799 (20.8%) | 799 (6.2%) |
| $75,000 to $99,999 | 1,163 (13.5%) | 1,941 (15.2%) |
| $100,000 to $149,999 | 1,443 (16.7%) | 1,901 (14.9%) |
| $150,000 or more | 1,457 (16.9%) | 4,002 (31.3%) |
| Total | 8,644 (100.0%) | 12,778 (100.0%) |
Property Value to Household Income Ratio in Cheshire County
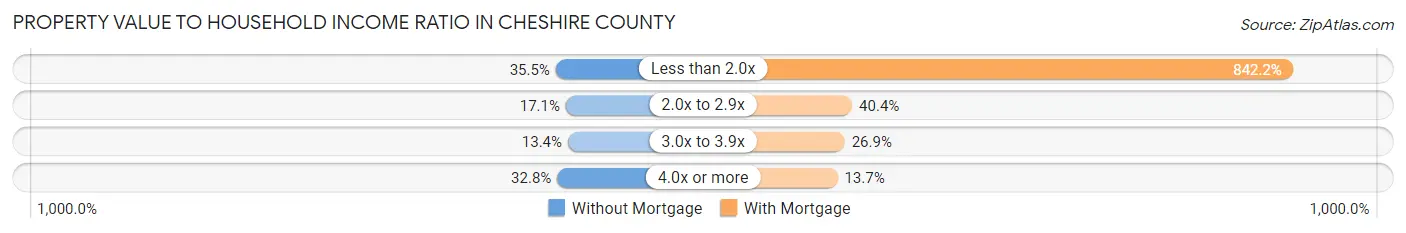
| Value-to-Income Ratio | Without Mortgage | With Mortgage |
| Less than 2.0x | 3,068 (35.5%) | 107,619 (842.2%) |
| 2.0x to 2.9x | 1,478 (17.1%) | 5,166 (40.4%) |
| 3.0x to 3.9x | 1,154 (13.4%) | 3,439 (26.9%) |
| 4.0x or more | 2,839 (32.8%) | 1,751 (13.7%) |
| Total | 8,644 (100.0%) | 12,778 (100.0%) |
Real Estate Taxes by Mortgage Status in Cheshire County
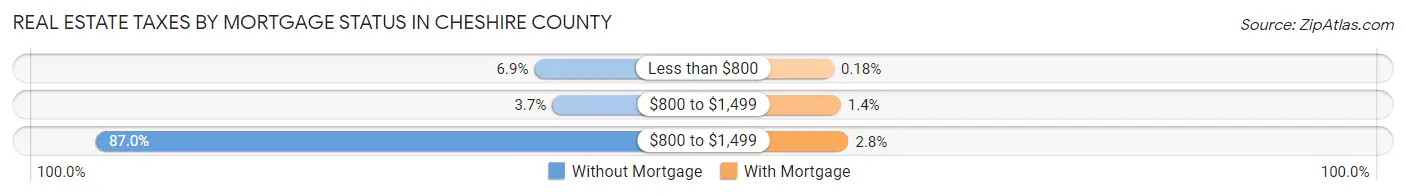
| Property Taxes | Without Mortgage | With Mortgage |
| Less than $800 | 597 (6.9%) | 23 (0.2%) |
| $800 to $1,499 | 316 (3.7%) | 181 (1.4%) |
| $800 to $1,499 | 7,517 (87.0%) | 361 (2.8%) |
| Total | 8,644 (100.0%) | 12,778 (100.0%) |
Health & Disability in Cheshire County
Health Insurance Coverage by Age in Cheshire County
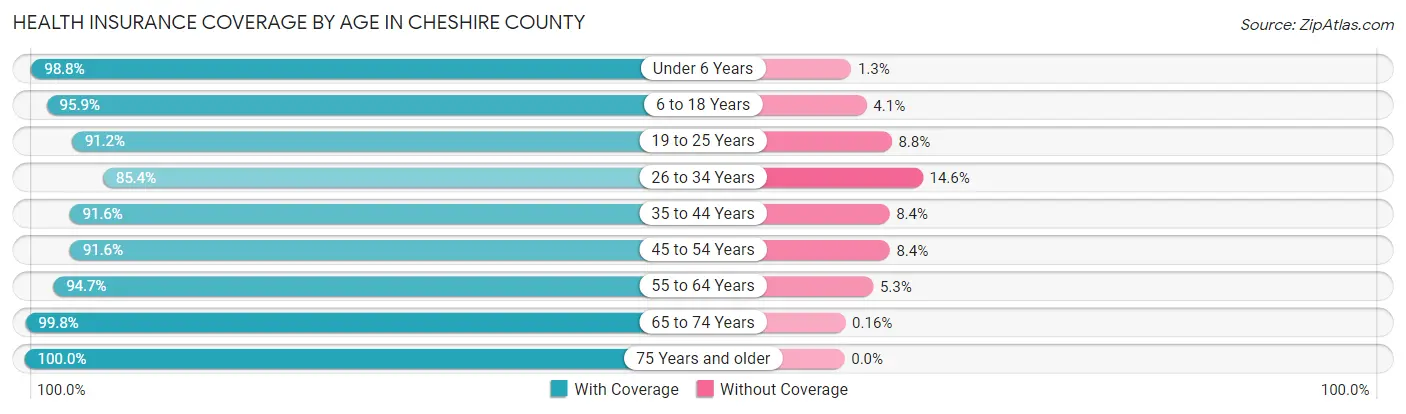
| Age Bracket | With Coverage | Without Coverage |
| Under 6 Years | 4,190 (98.8%) | 53 (1.3%) |
| 6 to 18 Years | 10,093 (95.9%) | 434 (4.1%) |
| 19 to 25 Years | 7,502 (91.2%) | 723 (8.8%) |
| 26 to 34 Years | 6,762 (85.4%) | 1,155 (14.6%) |
| 35 to 44 Years | 7,585 (91.6%) | 693 (8.4%) |
| 45 to 54 Years | 8,369 (91.6%) | 770 (8.4%) |
| 55 to 64 Years | 11,195 (94.7%) | 631 (5.3%) |
| 65 to 74 Years | 9,745 (99.8%) | 16 (0.2%) |
| 75 Years and older | 5,994 (100.0%) | 0 (0.0%) |
| Total | 71,435 (94.1%) | 4,475 (5.9%) |
Health Insurance Coverage by Citizenship Status in Cheshire County
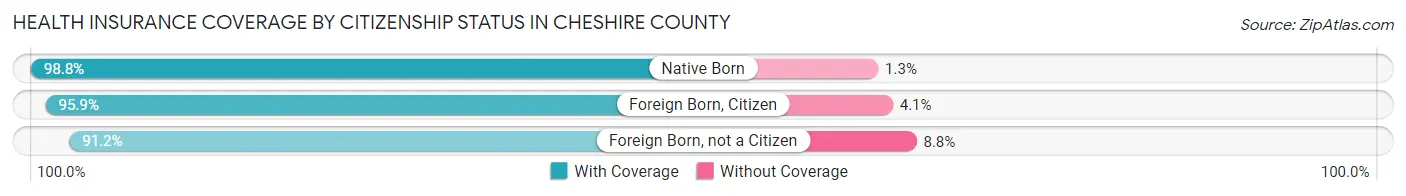
| Citizenship Status | With Coverage | Without Coverage |
| Native Born | 4,190 (98.8%) | 53 (1.3%) |
| Foreign Born, Citizen | 10,093 (95.9%) | 434 (4.1%) |
| Foreign Born, not a Citizen | 7,502 (91.2%) | 723 (8.8%) |
Health Insurance Coverage by Household Income in Cheshire County
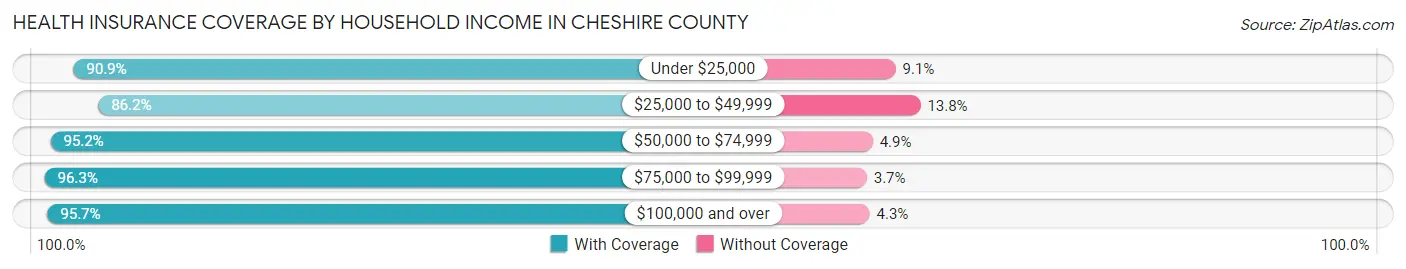
| Household Income | With Coverage | Without Coverage |
| Under $25,000 | 5,460 (90.9%) | 549 (9.1%) |
| $25,000 to $49,999 | 8,153 (86.2%) | 1,305 (13.8%) |
| $50,000 to $74,999 | 11,538 (95.2%) | 588 (4.9%) |
| $75,000 to $99,999 | 9,517 (96.3%) | 370 (3.7%) |
| $100,000 and over | 33,569 (95.7%) | 1,499 (4.3%) |
Public vs Private Health Insurance Coverage by Age in Cheshire County
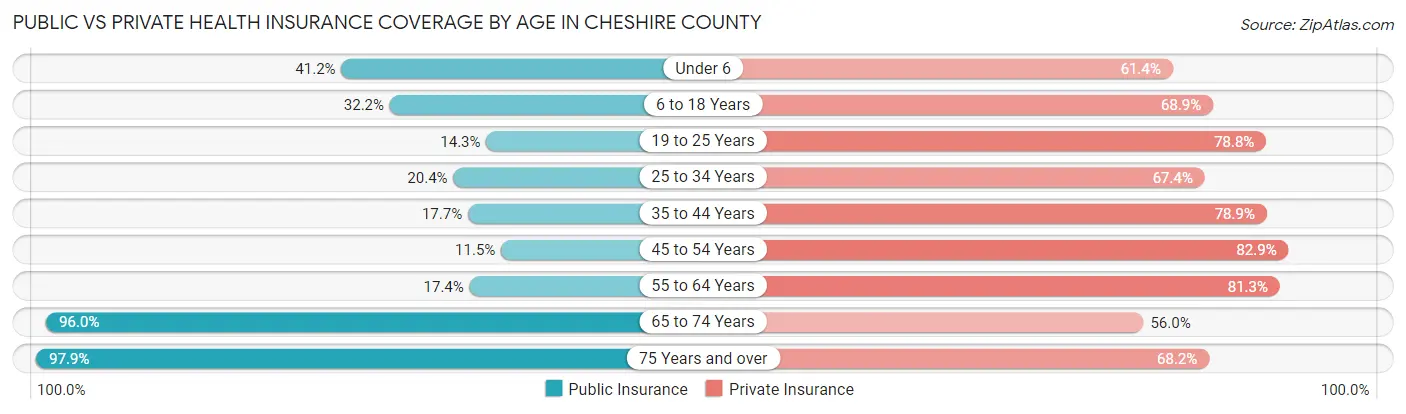
| Age Bracket | Public Insurance | Private Insurance |
| Under 6 | 1,748 (41.2%) | 2,606 (61.4%) |
| 6 to 18 Years | 3,390 (32.2%) | 7,254 (68.9%) |
| 19 to 25 Years | 1,175 (14.3%) | 6,479 (78.8%) |
| 25 to 34 Years | 1,616 (20.4%) | 5,333 (67.4%) |
| 35 to 44 Years | 1,465 (17.7%) | 6,529 (78.9%) |
| 45 to 54 Years | 1,055 (11.5%) | 7,577 (82.9%) |
| 55 to 64 Years | 2,058 (17.4%) | 9,614 (81.3%) |
| 65 to 74 Years | 9,373 (96.0%) | 5,466 (56.0%) |
| 75 Years and over | 5,866 (97.9%) | 4,087 (68.2%) |
| Total | 27,746 (36.5%) | 54,945 (72.4%) |
Disability Status by Sex by Age in Cheshire County
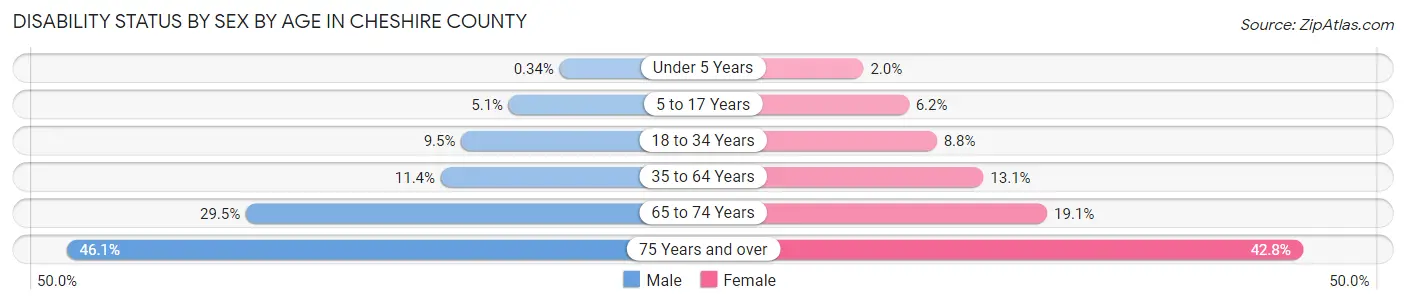
| Age Bracket | Male | Female |
| Under 5 Years | 6 (0.3%) | 34 (2.0%) |
| 5 to 17 Years | 263 (5.1%) | 312 (6.2%) |
| 18 to 34 Years | 811 (9.5%) | 762 (8.8%) |
| 35 to 64 Years | 1,655 (11.4%) | 1,930 (13.1%) |
| 65 to 74 Years | 1,396 (29.4%) | 957 (19.1%) |
| 75 Years and over | 1,210 (46.1%) | 1,441 (42.8%) |
Disability Class by Sex by Age in Cheshire County
Disability Class: Hearing Difficulty
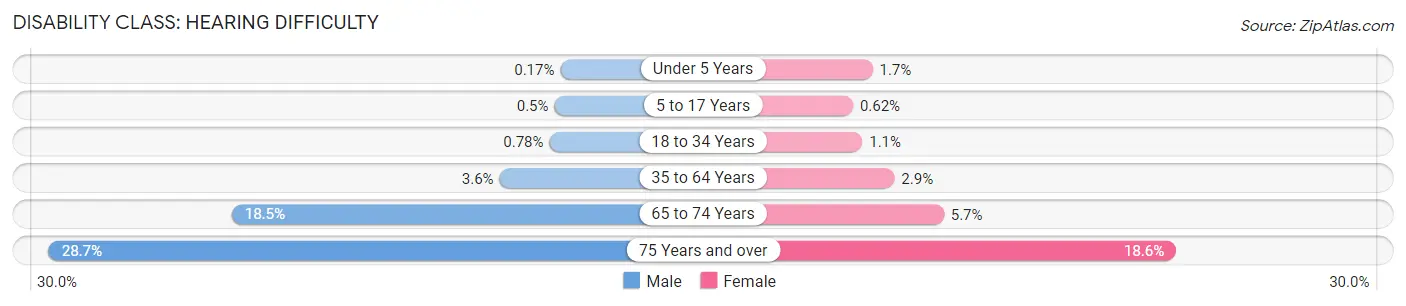
| Age Bracket | Male | Female |
| Under 5 Years | 3 (0.2%) | 29 (1.7%) |
| 5 to 17 Years | 26 (0.5%) | 31 (0.6%) |
| 18 to 34 Years | 67 (0.8%) | 99 (1.1%) |
| 35 to 64 Years | 518 (3.6%) | 431 (2.9%) |
| 65 to 74 Years | 875 (18.5%) | 285 (5.7%) |
| 75 Years and over | 752 (28.6%) | 627 (18.6%) |
Disability Class: Vision Difficulty
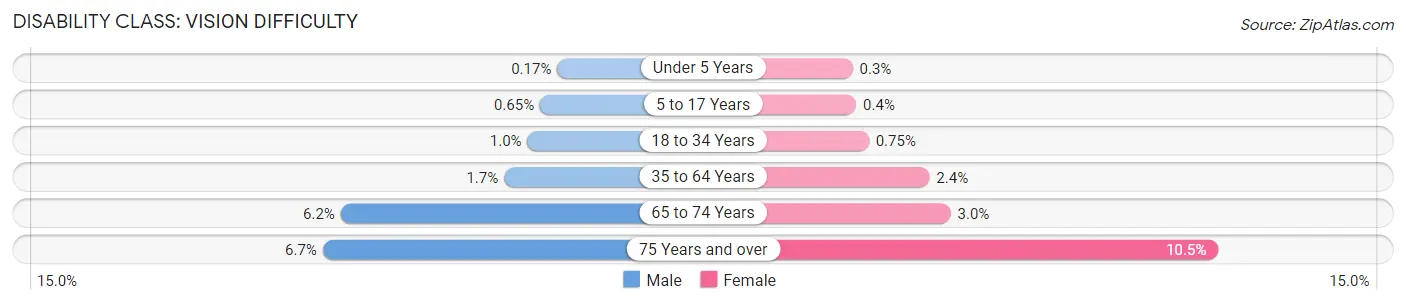
| Age Bracket | Male | Female |
| Under 5 Years | 3 (0.2%) | 5 (0.3%) |
| 5 to 17 Years | 34 (0.6%) | 20 (0.4%) |
| 18 to 34 Years | 86 (1.0%) | 65 (0.7%) |
| 35 to 64 Years | 240 (1.7%) | 359 (2.4%) |
| 65 to 74 Years | 294 (6.2%) | 152 (3.0%) |
| 75 Years and over | 176 (6.7%) | 353 (10.5%) |
Disability Class: Cognitive Difficulty
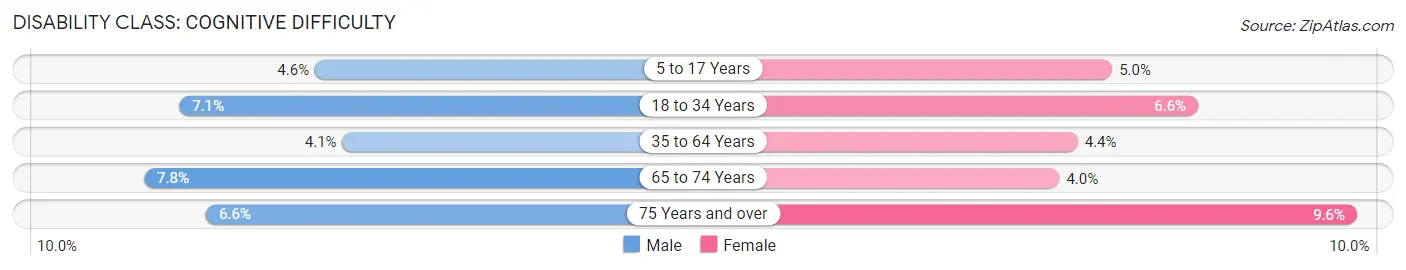
| Age Bracket | Male | Female |
| 5 to 17 Years | 240 (4.6%) | 252 (5.0%) |
| 18 to 34 Years | 611 (7.1%) | 572 (6.6%) |
| 35 to 64 Years | 597 (4.1%) | 643 (4.4%) |
| 65 to 74 Years | 369 (7.8%) | 203 (4.0%) |
| 75 Years and over | 174 (6.6%) | 322 (9.6%) |
Disability Class: Ambulatory Difficulty
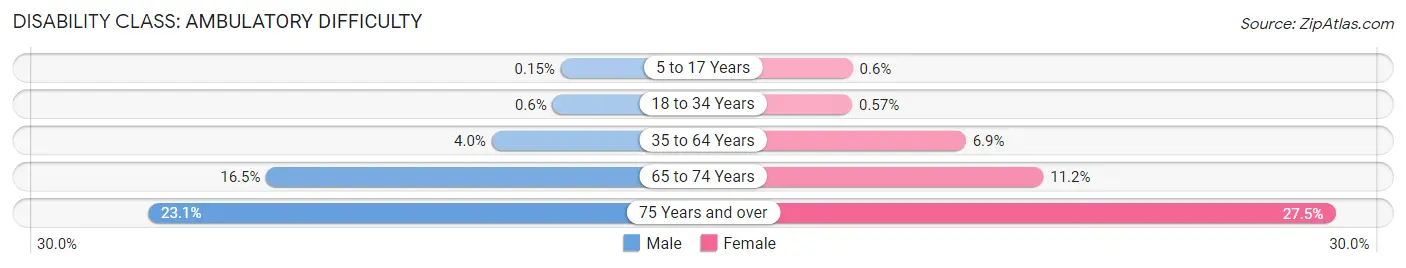
| Age Bracket | Male | Female |
| 5 to 17 Years | 8 (0.2%) | 30 (0.6%) |
| 18 to 34 Years | 51 (0.6%) | 49 (0.6%) |
| 35 to 64 Years | 581 (4.0%) | 1,013 (6.9%) |
| 65 to 74 Years | 784 (16.5%) | 563 (11.2%) |
| 75 Years and over | 607 (23.1%) | 925 (27.5%) |
Disability Class: Self-Care Difficulty
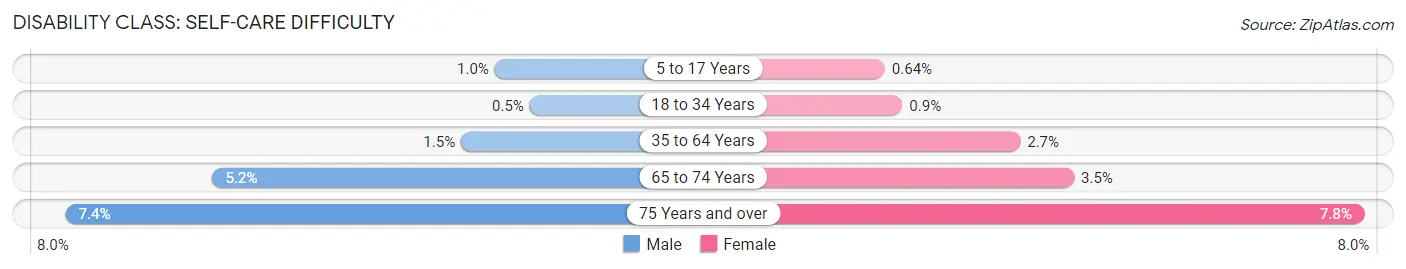
| Age Bracket | Male | Female |
| 5 to 17 Years | 53 (1.0%) | 32 (0.6%) |
| 18 to 34 Years | 43 (0.5%) | 78 (0.9%) |
| 35 to 64 Years | 221 (1.5%) | 389 (2.6%) |
| 65 to 74 Years | 247 (5.2%) | 173 (3.5%) |
| 75 Years and over | 194 (7.4%) | 261 (7.7%) |
Technology Access in Cheshire County
Computing Device Access in Cheshire County
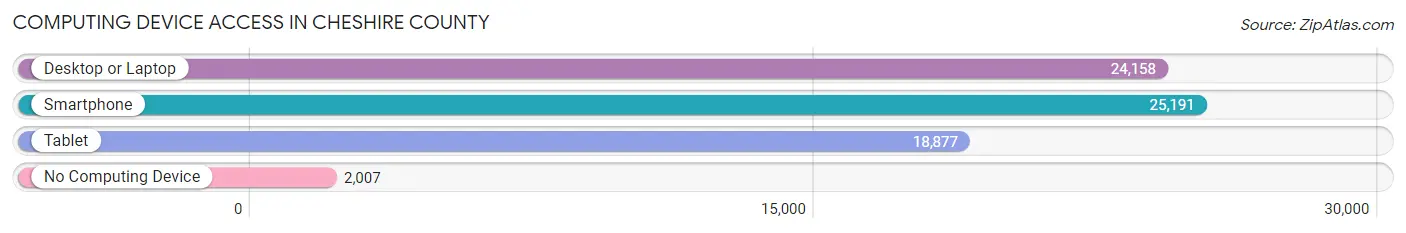
| Device Type | # Households | % Households |
| Desktop or Laptop | 24,158 | 79.7% |
| Smartphone | 25,191 | 83.1% |
| Tablet | 18,877 | 62.3% |
| No Computing Device | 2,007 | 6.6% |
| Total | 30,307 | 100.0% |
Internet Access in Cheshire County
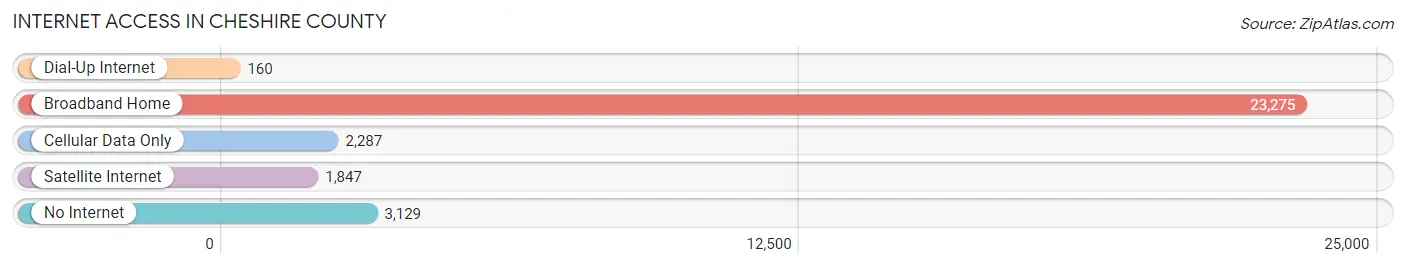
| Internet Type | # Households | % Households |
| Dial-Up Internet | 160 | 0.5% |
| Broadband Home | 23,275 | 76.8% |
| Cellular Data Only | 2,287 | 7.5% |
| Satellite Internet | 1,847 | 6.1% |
| No Internet | 3,129 | 10.3% |
| Total | 30,307 | 100.0% |
Cheshire County Summary
Cheshire County is located in the southwestern corner of New Hampshire, and is bordered by Massachusetts, Vermont, and Sullivan County. It is the second largest county in the state, with an area of 845 square miles. The county seat is the city of Keene.
History
Cheshire County was established in 1771, and was named after the English county of Cheshire. The county was originally part of the Province of Massachusetts Bay, and was part of the original land grant given to the Masonian Proprietors in 1749. The county was divided into townships in 1752, and the first town, Hinsdale, was incorporated in 1753.
The county was an important center of the Revolutionary War, and was the site of several battles. The Battle of Bennington, which was fought in 1777, was a major victory for the American forces. The county was also the site of the Battle of Cheshire, which was fought in 1781.
Geography
Cheshire County is located in the southwestern corner of New Hampshire, and is bordered by Massachusetts, Vermont, and Sullivan County. It is the second largest county in the state, with an area of 845 square miles. The county is mostly rural, with a few small towns and villages scattered throughout. The highest point in the county is Mount Monadnock, which is 3,165 feet above sea level.
The county is home to several rivers, including the Ashuelot, Contoocook, and Connecticut Rivers. The Ashuelot River is the longest river in the county, and is a popular destination for fishing and canoeing. The county also contains several lakes, including Lake Monomonac, Lake Potanipo, and Lake Massasecum.
Economy
Cheshire County has a diverse economy, with a mix of manufacturing, agriculture, and tourism. The county is home to several large manufacturing companies, including BAE Systems, which produces military and aerospace products. The county is also home to several small businesses, including craft breweries, wineries, and distilleries.
Agriculture is an important part of the county’s economy, and the county is home to several dairy farms, as well as apple orchards and vegetable farms. The county is also home to several tourist attractions, including the Cheshire County Historical Society, the Cheshire County Fair, and the Cheshire County Music Festival.
Demographics
As of the 2010 census, Cheshire County had a population of 77,117. The population is mostly white (94.2%), with small percentages of African American (1.3%), Asian (1.2%), and Native American (0.4%) residents. The median household income is $56,945, and the median age is 42.
Cheshire County is home to several colleges and universities, including Keene State College, Franklin Pierce University, and Antioch University New England. The county is also home to several museums, including the Cheshire County Historical Society, the Cheshire County Museum, and the Cheshire County Arts Council.
Common Questions
What is Per Capita Income in Cheshire County?
Per Capita income in Cheshire County is $40,196.
What is the Median Family Income in Cheshire County?
Median Family Income in Cheshire County is $98,415.
What is the Median Household income in Cheshire County?
Median Household Income in Cheshire County is $76,551.
What is Income or Wage Gap in Cheshire County?
Income or Wage Gap in Cheshire County is 26.6%.
Women in Cheshire County earn 73.4 cents for every dollar earned by a man.
What is Family Income Deficit in Cheshire County?
Family Income Deficit in Cheshire County is $8,349.
Families that are below poverty line in Cheshire County earn $8,349 less on average than the poverty threshold level.
What is Inequality or Gini Index in Cheshire County?
Inequality or Gini Index in Cheshire County is 0.43.
What is the Total Population of Cheshire County?
Total Population of Cheshire County is 76,610.
What is the Total Male Population of Cheshire County?
Total Male Population of Cheshire County is 37,770.
What is the Total Female Population of Cheshire County?
Total Female Population of Cheshire County is 38,840.
What is the Ratio of Males per 100 Females in Cheshire County?
There are 97.25 Males per 100 Females in Cheshire County.
What is the Ratio of Females per 100 Males in Cheshire County?
There are 102.83 Females per 100 Males in Cheshire County.
What is the Median Population Age in Cheshire County?
Median Population Age in Cheshire County is 43.5 Years.
What is the Average Family Size in Cheshire County
Average Family Size in Cheshire County is 2.9 People.
What is the Average Household Size in Cheshire County
Average Household Size in Cheshire County is 2.4 People.
How Large is the Labor Force in Cheshire County?
There are 40,553 People in the Labor Forcein in Cheshire County.
What is the Percentage of People in the Labor Force in Cheshire County?
62.9% of People are in the Labor Force in Cheshire County.
What is the Unemployment Rate in Cheshire County?
Unemployment Rate in Cheshire County is 3.5%.