Franklin, TN Map & Demographics
Franklin Map
Franklin Overview
$54,946
PER CAPITA INCOME
$132,795
AVG FAMILY INCOME
$106,592
AVG HOUSEHOLD INCOME
40.0%
WAGE / INCOME GAP [ % ]
60.0¢/ $1
WAGE / INCOME GAP [ $ ]
0.42
INEQUALITY / GINI INDEX
83,630
TOTAL POPULATION
39,784
MALE POPULATION
43,846
FEMALE POPULATION
90.74
MALES / 100 FEMALES
110.21
FEMALES / 100 MALES
37.8
MEDIAN AGE
3.1
AVG FAMILY SIZE
2.5
AVG HOUSEHOLD SIZE
45,904
LABOR FORCE [ PEOPLE ]
70.2%
PERCENT IN LABOR FORCE
2.6%
UNEMPLOYMENT RATE
Franklin Area Codes
Income in Franklin
Income Overview in Franklin
Per Capita Income in Franklin is $54,946, while median incomes of families and households are $132,795 and $106,592 respectively.
| Characteristic | Number | Measure |
| Per Capita Income | 83,630 | $54,946 |
| Median Family Income | 22,634 | $132,795 |
| Mean Family Income | 22,634 | $162,569 |
| Median Household Income | 32,770 | $106,592 |
| Mean Household Income | 32,770 | $137,418 |
| Income Deficit | 22,634 | $0 |
| Wage / Income Gap (%) | 83,630 | 40.02% |
| Wage / Income Gap ($) | 83,630 | 59.98¢ per $1 |
| Gini / Inequality Index | 83,630 | 0.42 |
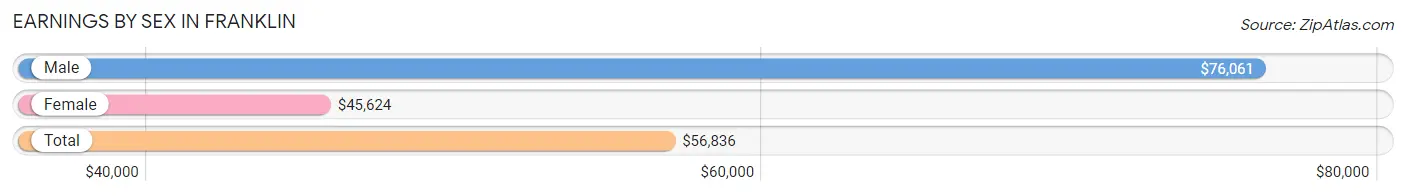
Earnings by Sex in Franklin
Average Earnings in Franklin are $56,836, $76,061 for men and $45,624 for women, a difference of 40.0%.
| Sex | Number | Average Earnings |
| Male | 24,777 (51.4%) | $76,061 |
| Female | 23,461 (48.6%) | $45,624 |
| Total | 48,238 (100.0%) | $56,836 |
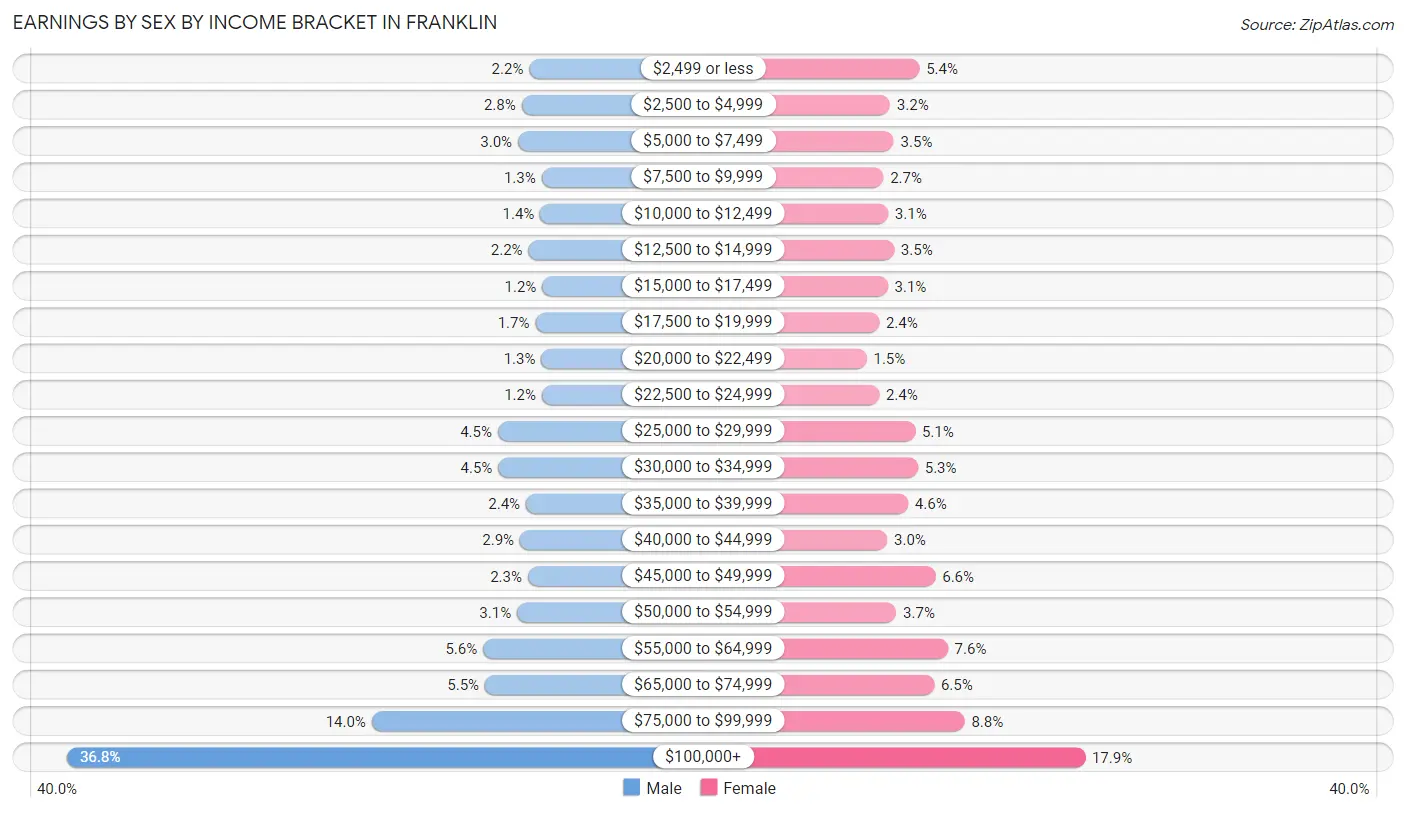
Earnings by Sex by Income Bracket in Franklin
The most common earnings brackets in Franklin are $100,000+ for men (9,124 | 36.8%) and $100,000+ for women (4,188 | 17.8%).
| Income | Male | Female |
| $2,499 or less | 540 (2.2%) | 1,274 (5.4%) |
| $2,500 to $4,999 | 685 (2.8%) | 758 (3.2%) |
| $5,000 to $7,499 | 750 (3.0%) | 823 (3.5%) |
| $7,500 to $9,999 | 313 (1.3%) | 641 (2.7%) |
| $10,000 to $12,499 | 337 (1.4%) | 722 (3.1%) |
| $12,500 to $14,999 | 556 (2.2%) | 829 (3.5%) |
| $15,000 to $17,499 | 301 (1.2%) | 718 (3.1%) |
| $17,500 to $19,999 | 429 (1.7%) | 566 (2.4%) |
| $20,000 to $22,499 | 317 (1.3%) | 347 (1.5%) |
| $22,500 to $24,999 | 306 (1.2%) | 566 (2.4%) |
| $25,000 to $29,999 | 1,125 (4.5%) | 1,199 (5.1%) |
| $30,000 to $34,999 | 1,118 (4.5%) | 1,247 (5.3%) |
| $35,000 to $39,999 | 601 (2.4%) | 1,075 (4.6%) |
| $40,000 to $44,999 | 713 (2.9%) | 708 (3.0%) |
| $45,000 to $49,999 | 567 (2.3%) | 1,555 (6.6%) |
| $50,000 to $54,999 | 767 (3.1%) | 869 (3.7%) |
| $55,000 to $64,999 | 1,398 (5.6%) | 1,773 (7.6%) |
| $65,000 to $74,999 | 1,363 (5.5%) | 1,533 (6.5%) |
| $75,000 to $99,999 | 3,467 (14.0%) | 2,070 (8.8%) |
| $100,000+ | 9,124 (36.8%) | 4,188 (17.8%) |
| Total | 24,777 (100.0%) | 23,461 (100.0%) |
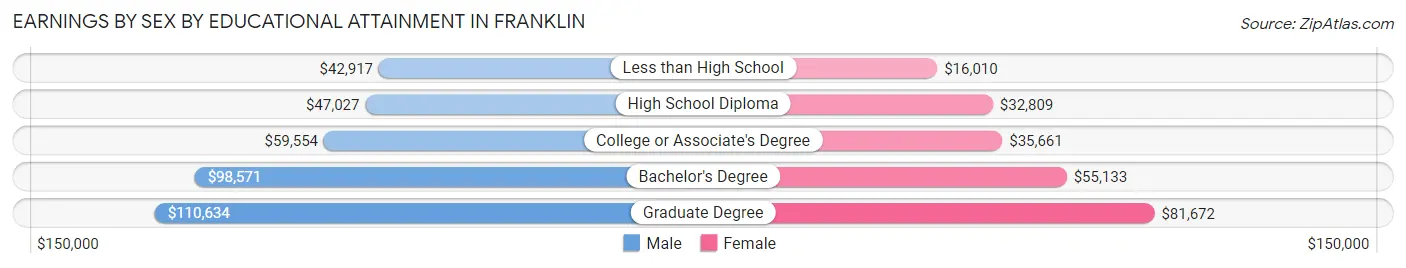
Earnings by Sex by Educational Attainment in Franklin
Average earnings in Franklin are $86,036 for men and $52,643 for women, a difference of 38.8%. Men with an educational attainment of graduate degree enjoy the highest average annual earnings of $110,634, while those with less than high school education earn the least with $42,917. Women with an educational attainment of graduate degree earn the most with the average annual earnings of $81,672, while those with less than high school education have the smallest earnings of $16,010.
| Educational Attainment | Male Income | Female Income |
| Less than High School | $42,917 | $16,010 |
| High School Diploma | $47,027 | $32,809 |
| College or Associate's Degree | $59,554 | $35,661 |
| Bachelor's Degree | $98,571 | $55,133 |
| Graduate Degree | $110,634 | $81,672 |
| Total | $86,036 | $52,643 |
Family Income in Franklin
Family Income Brackets in Franklin
According to the Franklin family income data, there are 6,111 families falling into the $200,000+ income range, which is the most common income bracket and makes up 27.0% of all families. Conversely, the less than $10,000 income bracket is the least frequent group with only 158 families (0.7%) belonging to this category.
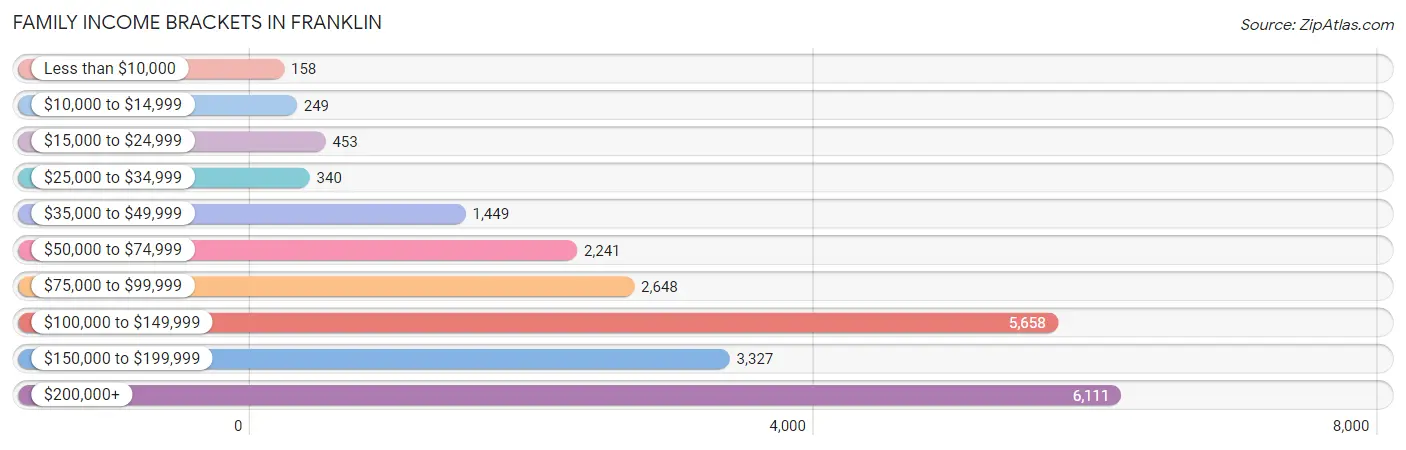
| Income Bracket | # Families | % Families |
| Less than $10,000 | 158 | 0.7% |
| $10,000 to $14,999 | 249 | 1.1% |
| $15,000 to $24,999 | 453 | 2.0% |
| $25,000 to $34,999 | 340 | 1.5% |
| $35,000 to $49,999 | 1,449 | 6.4% |
| $50,000 to $74,999 | 2,241 | 9.9% |
| $75,000 to $99,999 | 2,648 | 11.7% |
| $100,000 to $149,999 | 5,658 | 25.0% |
| $150,000 to $199,999 | 3,327 | 14.7% |
| $200,000+ | 6,111 | 27.0% |
Family Income by Famaliy Size in Franklin
7+ person families (52 | 0.2%) account for the highest median family income in Franklin with $246,250 per family, while 2-person families (10,801 | 47.7%) have the highest median income of $57,144 per family member.
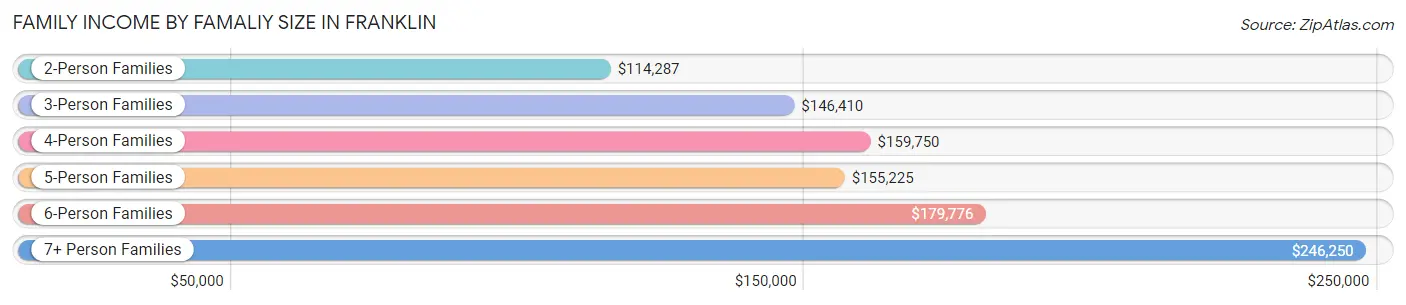
| Income Bracket | # Families | Median Income |
| 2-Person Families | 10,801 (47.7%) | $114,287 |
| 3-Person Families | 4,555 (20.1%) | $146,410 |
| 4-Person Families | 4,963 (21.9%) | $159,750 |
| 5-Person Families | 1,823 (8.1%) | $155,225 |
| 6-Person Families | 440 (1.9%) | $179,776 |
| 7+ Person Families | 52 (0.2%) | $246,250 |
| Total | 22,634 (100.0%) | $132,795 |
Family Income by Number of Earners in Franklin
The median family income in Franklin is $132,795, with families comprising 3+ earners (2,175) having the highest median family income of $188,750, while families with no earners (2,166) have the lowest median family income of $71,270, accounting for 9.6% and 9.6% of families, respectively.
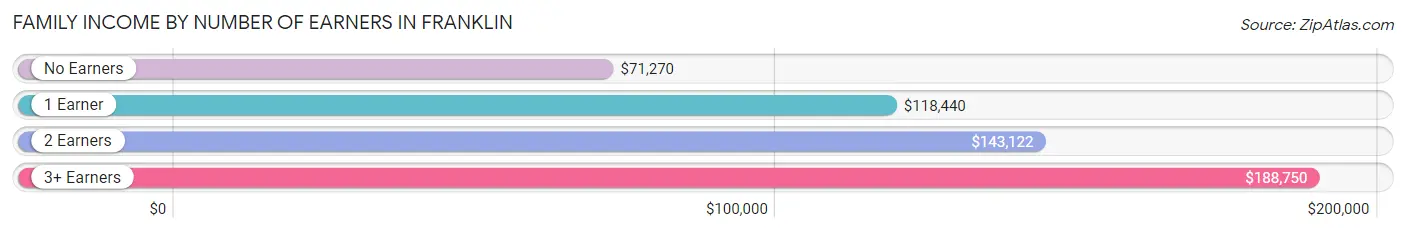
| Number of Earners | # Families | Median Income |
| No Earners | 2,166 (9.6%) | $71,270 |
| 1 Earner | 7,081 (31.3%) | $118,440 |
| 2 Earners | 11,212 (49.5%) | $143,122 |
| 3+ Earners | 2,175 (9.6%) | $188,750 |
| Total | 22,634 (100.0%) | $132,795 |
Household Income in Franklin
Household Income Brackets in Franklin
With 6,947 households falling in the category, the $100,000 to $149,999 income range is the most frequent in Franklin, accounting for 21.2% of all households. In contrast, only 426 households (1.3%) fall into the $10,000 to $14,999 income bracket, making it the least populous group.
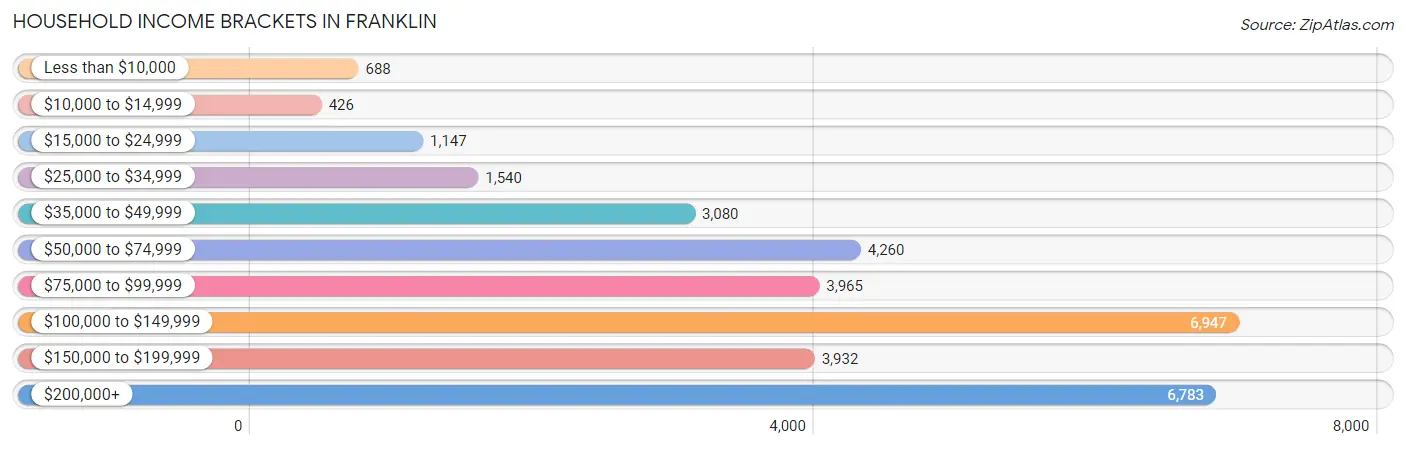
| Income Bracket | # Households | % Households |
| Less than $10,000 | 688 | 2.1% |
| $10,000 to $14,999 | 426 | 1.3% |
| $15,000 to $24,999 | 1,147 | 3.5% |
| $25,000 to $34,999 | 1,540 | 4.7% |
| $35,000 to $49,999 | 3,080 | 9.4% |
| $50,000 to $74,999 | 4,260 | 13.0% |
| $75,000 to $99,999 | 3,965 | 12.1% |
| $100,000 to $149,999 | 6,947 | 21.2% |
| $150,000 to $199,999 | 3,932 | 12.0% |
| $200,000+ | 6,783 | 20.7% |
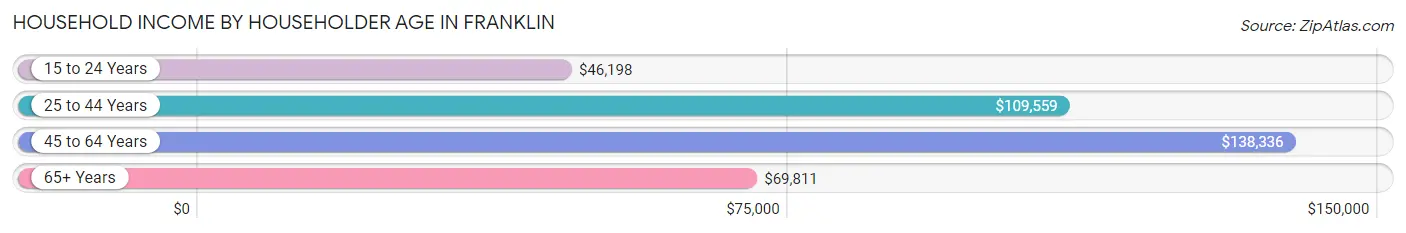
Household Income by Householder Age in Franklin
The median household income in Franklin is $106,592, with the highest median household income of $138,336 found in the 45 to 64 years age bracket for the primary householder. A total of 11,943 households (36.4%) fall into this category. Meanwhile, the 15 to 24 years age bracket for the primary householder has the lowest median household income of $46,198, with 1,023 households (3.1%) in this group.
| Income Bracket | # Households | Median Income |
| 15 to 24 Years | 1,023 (3.1%) | $46,198 |
| 25 to 44 Years | 12,649 (38.6%) | $109,559 |
| 45 to 64 Years | 11,943 (36.4%) | $138,336 |
| 65+ Years | 7,155 (21.8%) | $69,811 |
| Total | 32,770 (100.0%) | $106,592 |
Poverty in Franklin
Income Below Poverty by Sex and Age in Franklin
With 3.4% poverty level for males and 6.7% for females among the residents of Franklin, 18 to 24 year old males and 18 to 24 year old females are the most vulnerable to poverty, with 407 males (12.0%) and 817 females (22.2%) in their respective age groups living below the poverty level.
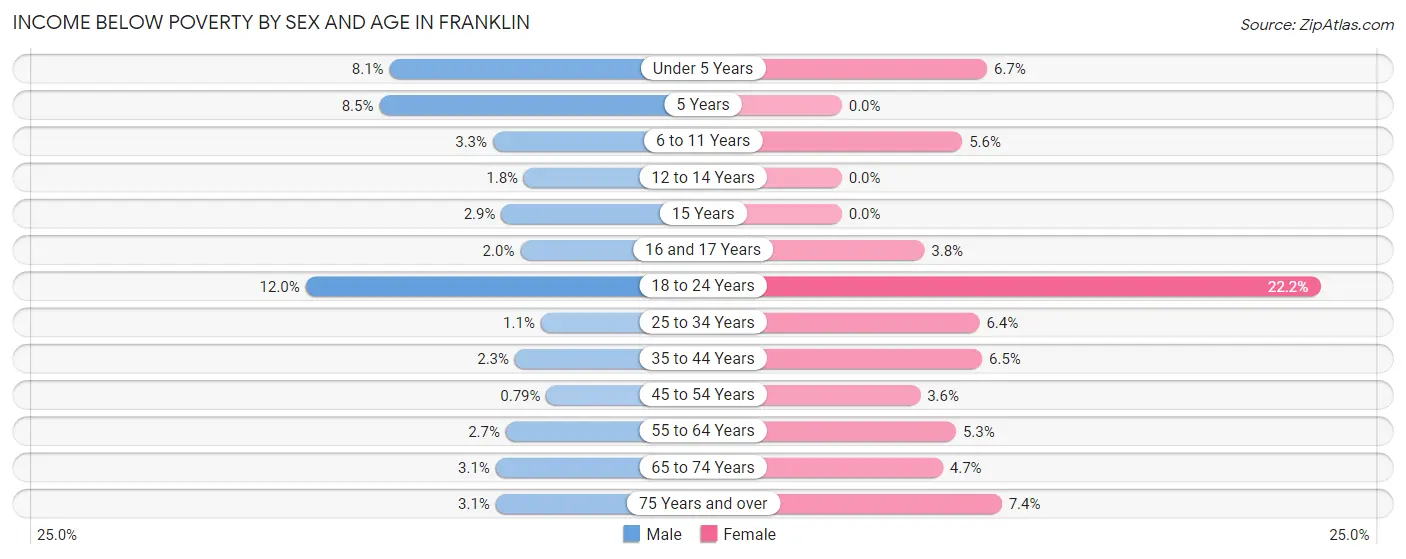
| Age Bracket | Male | Female |
| Under 5 Years | 223 (8.1%) | 185 (6.7%) |
| 5 Years | 21 (8.5%) | 0 (0.0%) |
| 6 to 11 Years | 109 (3.3%) | 178 (5.6%) |
| 12 to 14 Years | 40 (1.8%) | 0 (0.0%) |
| 15 Years | 23 (2.9%) | 0 (0.0%) |
| 16 and 17 Years | 16 (2.0%) | 54 (3.8%) |
| 18 to 24 Years | 407 (12.0%) | 817 (22.2%) |
| 25 to 34 Years | 49 (1.1%) | 370 (6.4%) |
| 35 to 44 Years | 149 (2.2%) | 414 (6.5%) |
| 45 to 54 Years | 43 (0.8%) | 217 (3.6%) |
| 55 to 64 Years | 118 (2.7%) | 271 (5.3%) |
| 65 to 74 Years | 82 (3.1%) | 156 (4.7%) |
| 75 Years and over | 68 (3.1%) | 237 (7.4%) |
| Total | 1,348 (3.4%) | 2,899 (6.7%) |
Income Above Poverty by Sex and Age in Franklin
According to the poverty statistics in Franklin, males aged 45 to 54 years and females aged 5 years are the age groups that are most secure financially, with 99.2% of males and 100.0% of females in these age groups living above the poverty line.
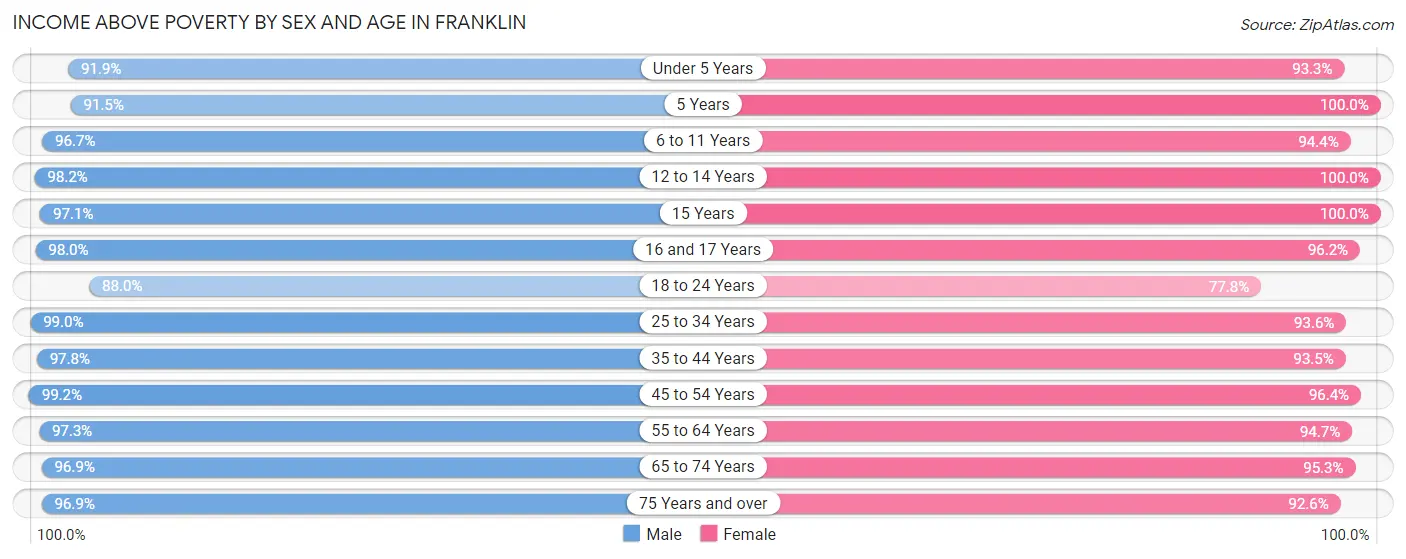
| Age Bracket | Male | Female |
| Under 5 Years | 2,540 (91.9%) | 2,558 (93.3%) |
| 5 Years | 225 (91.5%) | 558 (100.0%) |
| 6 to 11 Years | 3,229 (96.7%) | 3,009 (94.4%) |
| 12 to 14 Years | 2,149 (98.2%) | 1,669 (100.0%) |
| 15 Years | 777 (97.1%) | 581 (100.0%) |
| 16 and 17 Years | 784 (98.0%) | 1,356 (96.2%) |
| 18 to 24 Years | 2,996 (88.0%) | 2,865 (77.8%) |
| 25 to 34 Years | 4,597 (99.0%) | 5,417 (93.6%) |
| 35 to 44 Years | 6,479 (97.8%) | 5,942 (93.5%) |
| 45 to 54 Years | 5,412 (99.2%) | 5,751 (96.4%) |
| 55 to 64 Years | 4,298 (97.3%) | 4,844 (94.7%) |
| 65 to 74 Years | 2,526 (96.9%) | 3,171 (95.3%) |
| 75 Years and over | 2,095 (96.9%) | 2,956 (92.6%) |
| Total | 38,107 (96.6%) | 40,677 (93.3%) |
Income Below Poverty Among Married-Couple Families in Franklin
The poverty statistics for married-couple families in Franklin show that 1.4% or 273 of the total 18,936 families live below the poverty line. Families with 3 or 4 children have the highest poverty rate of 3.4%, comprising of 55 families. On the other hand, families with 5 or more children have the lowest poverty rate of 0.0%, which includes 0 families.
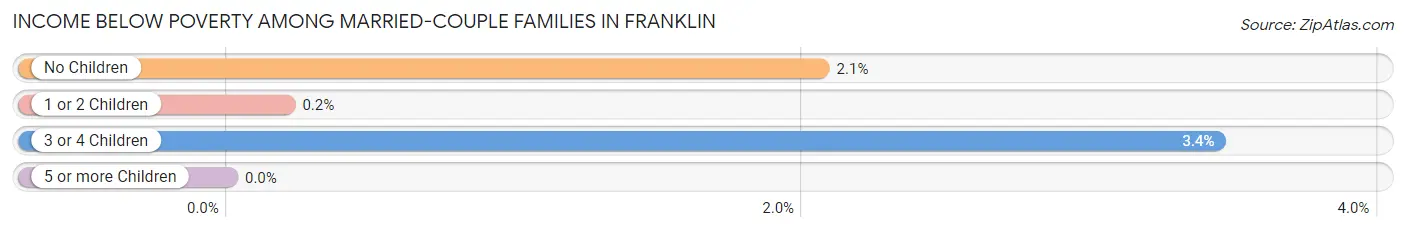
| Children | Above Poverty | Below Poverty |
| No Children | 9,628 (97.9%) | 203 (2.1%) |
| 1 or 2 Children | 7,451 (99.8%) | 15 (0.2%) |
| 3 or 4 Children | 1,544 (96.6%) | 55 (3.4%) |
| 5 or more Children | 40 (100.0%) | 0 (0.0%) |
| Total | 18,663 (98.6%) | 273 (1.4%) |
Income Below Poverty Among Single-Parent Households in Franklin
According to the poverty data in Franklin, 1.1% or 8 single-father households and 14.3% or 422 single-mother households are living below the poverty line. Among single-father households, those with 1 or 2 children have the highest poverty rate, with 8 households (2.1%) experiencing poverty. Likewise, among single-mother households, those with 3 or 4 children have the highest poverty rate, with 36 households (25.5%) falling below the poverty line.
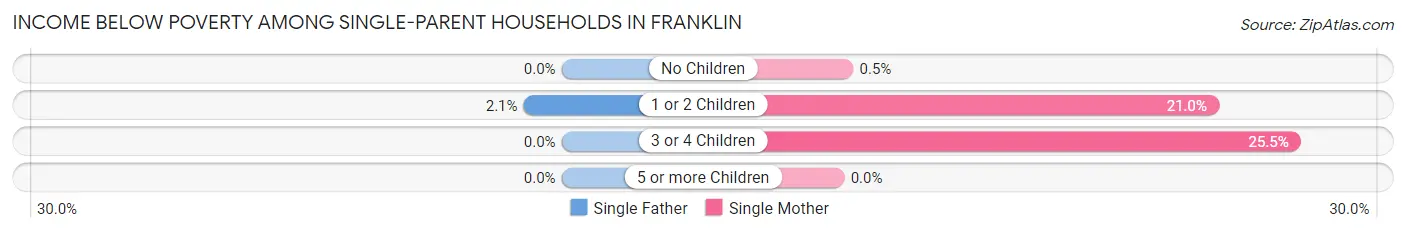
| Children | Single Father | Single Mother |
| No Children | 0 (0.0%) | 5 (0.5%) |
| 1 or 2 Children | 8 (2.1%) | 381 (21.0%) |
| 3 or 4 Children | 0 (0.0%) | 36 (25.5%) |
| 5 or more Children | 0 (0.0%) | 0 (0.0%) |
| Total | 8 (1.1%) | 422 (14.3%) |
Income Below Poverty Among Married-Couple vs Single-Parent Households in Franklin
The poverty data for Franklin shows that 273 of the married-couple family households (1.4%) and 430 of the single-parent households (11.6%) are living below the poverty level. Within the married-couple family households, those with 3 or 4 children have the highest poverty rate, with 55 households (3.4%) falling below the poverty line. Among the single-parent households, those with 3 or 4 children have the highest poverty rate, with 36 household (22.9%) living below poverty.
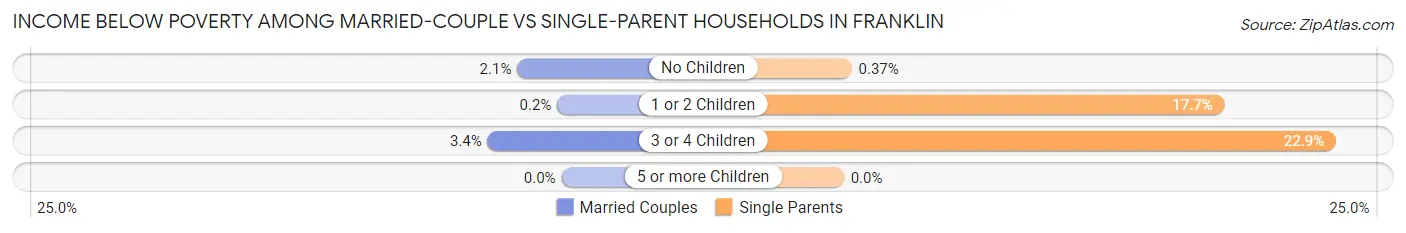
| Children | Married-Couple Families | Single-Parent Households |
| No Children | 203 (2.1%) | 5 (0.4%) |
| 1 or 2 Children | 15 (0.2%) | 389 (17.7%) |
| 3 or 4 Children | 55 (3.4%) | 36 (22.9%) |
| 5 or more Children | 0 (0.0%) | 0 (0.0%) |
| Total | 273 (1.4%) | 430 (11.6%) |
Race in Franklin
The most populous races in Franklin are White / Caucasian (65,091 | 77.8%), Asian (7,372 | 8.8%), and Black / African American (5,290 | 6.3%).
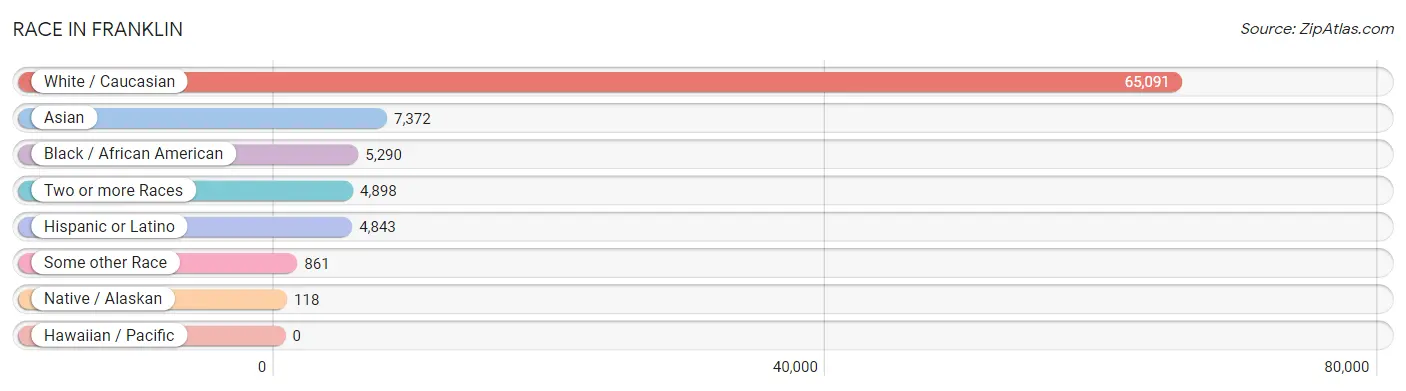
| Race | # Population | % Population |
| Asian | 7,372 | 8.8% |
| Black / African American | 5,290 | 6.3% |
| Hawaiian / Pacific | 0 | 0.0% |
| Hispanic or Latino | 4,843 | 5.8% |
| Native / Alaskan | 118 | 0.1% |
| White / Caucasian | 65,091 | 77.8% |
| Two or more Races | 4,898 | 5.9% |
| Some other Race | 861 | 1.0% |
| Total | 83,630 | 100.0% |
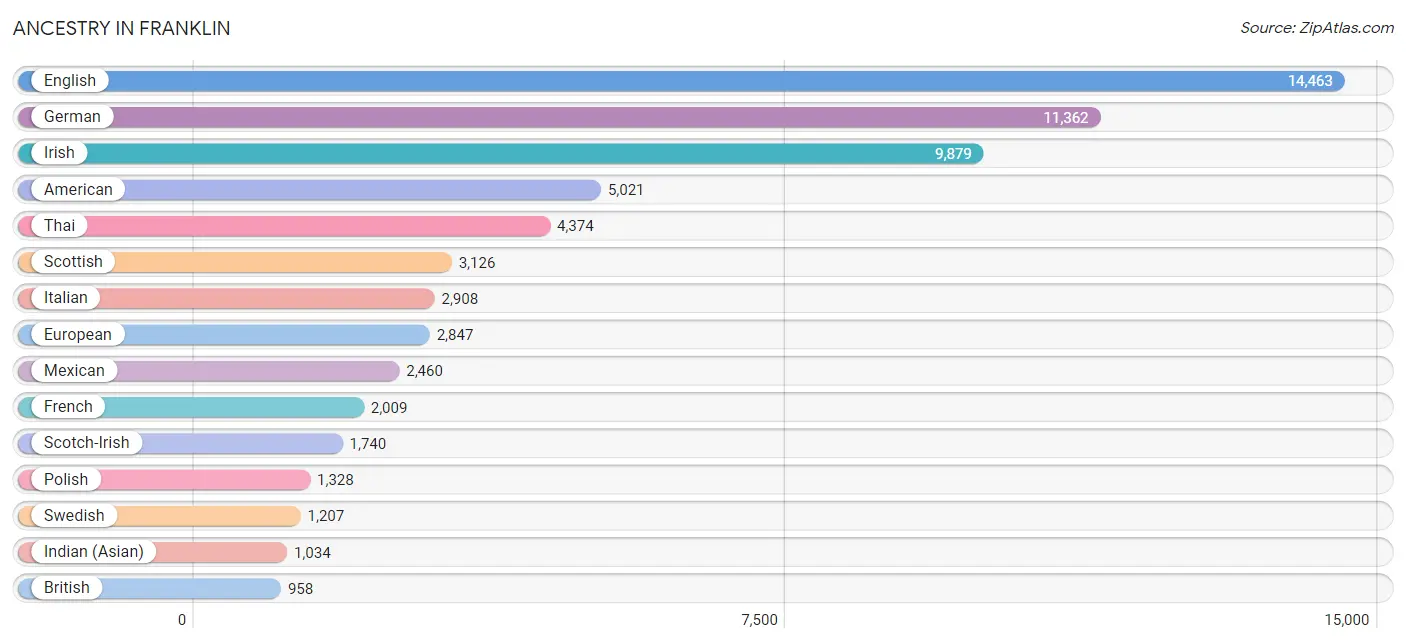
Ancestry in Franklin
The most populous ancestries reported in Franklin are English (14,463 | 17.3%), German (11,362 | 13.6%), Irish (9,879 | 11.8%), American (5,021 | 6.0%), and Thai (4,374 | 5.2%), together accounting for 53.9% of all Franklin residents.
| Ancestry | # Population | % Population |
| African | 265 | 0.3% |
| Albanian | 71 | 0.1% |
| American | 5,021 | 6.0% |
| Arab | 146 | 0.2% |
| Armenian | 157 | 0.2% |
| Australian | 11 | 0.0% |
| Austrian | 124 | 0.2% |
| Belgian | 210 | 0.3% |
| Bhutanese | 484 | 0.6% |
| Bolivian | 6 | 0.0% |
| Brazilian | 100 | 0.1% |
| British | 958 | 1.1% |
| British West Indian | 56 | 0.1% |
| Bulgarian | 49 | 0.1% |
| Burmese | 767 | 0.9% |
| Cajun | 48 | 0.1% |
| Canadian | 189 | 0.2% |
| Central American | 901 | 1.1% |
| Cherokee | 266 | 0.3% |
| Chilean | 31 | 0.0% |
| Choctaw | 26 | 0.0% |
| Colombian | 71 | 0.1% |
| Costa Rican | 4 | 0.0% |
| Croatian | 44 | 0.1% |
| Cuban | 282 | 0.3% |
| Czech | 203 | 0.2% |
| Czechoslovakian | 33 | 0.0% |
| Danish | 314 | 0.4% |
| Dominican | 71 | 0.1% |
| Dutch | 711 | 0.9% |
| Eastern European | 228 | 0.3% |
| Egyptian | 17 | 0.0% |
| English | 14,463 | 17.3% |
| Estonian | 16 | 0.0% |
| European | 2,847 | 3.4% |
| Filipino | 58 | 0.1% |
| Finnish | 59 | 0.1% |
| French | 2,009 | 2.4% |
| French Canadian | 188 | 0.2% |
| German | 11,362 | 13.6% |
| Greek | 253 | 0.3% |
| Guatemalan | 97 | 0.1% |
| Haitian | 56 | 0.1% |
| Honduran | 499 | 0.6% |
| Hungarian | 257 | 0.3% |
| Icelander | 17 | 0.0% |
| Indian (Asian) | 1,034 | 1.2% |
| Iranian | 320 | 0.4% |
| Irish | 9,879 | 11.8% |
| Italian | 2,908 | 3.5% |
| Korean | 774 | 0.9% |
| Laotian | 16 | 0.0% |
| Latvian | 74 | 0.1% |
| Lebanese | 80 | 0.1% |
| Lithuanian | 250 | 0.3% |
| Luxembourger | 15 | 0.0% |
| Maltese | 43 | 0.1% |
| Mexican | 2,460 | 2.9% |
| Mexican American Indian | 59 | 0.1% |
| Mongolian | 179 | 0.2% |
| Native Hawaiian | 17 | 0.0% |
| New Zealander | 26 | 0.0% |
| Nicaraguan | 188 | 0.2% |
| Nigerian | 10 | 0.0% |
| Northern European | 47 | 0.1% |
| Norwegian | 652 | 0.8% |
| Okinawan | 5 | 0.0% |
| Pakistani | 21 | 0.0% |
| Panamanian | 88 | 0.1% |
| Peruvian | 61 | 0.1% |
| Polish | 1,328 | 1.6% |
| Portuguese | 117 | 0.1% |
| Potawatomi | 13 | 0.0% |
| Puerto Rican | 294 | 0.4% |
| Romanian | 81 | 0.1% |
| Russian | 503 | 0.6% |
| Salvadoran | 25 | 0.0% |
| Scandinavian | 289 | 0.4% |
| Scotch-Irish | 1,740 | 2.1% |
| Scottish | 3,126 | 3.7% |
| Serbian | 9 | 0.0% |
| Slovak | 101 | 0.1% |
| Slovene | 21 | 0.0% |
| South African | 52 | 0.1% |
| South American | 599 | 0.7% |
| Spaniard | 81 | 0.1% |
| Spanish | 111 | 0.1% |
| Sri Lankan | 322 | 0.4% |
| Subsaharan African | 327 | 0.4% |
| Swedish | 1,207 | 1.4% |
| Swiss | 202 | 0.2% |
| Syrian | 49 | 0.1% |
| Thai | 4,374 | 5.2% |
| Turkish | 63 | 0.1% |
| Ukrainian | 253 | 0.3% |
| Venezuelan | 430 | 0.5% |
| Welsh | 886 | 1.1% |
| Yugoslavian | 19 | 0.0% | View All 98 Rows |
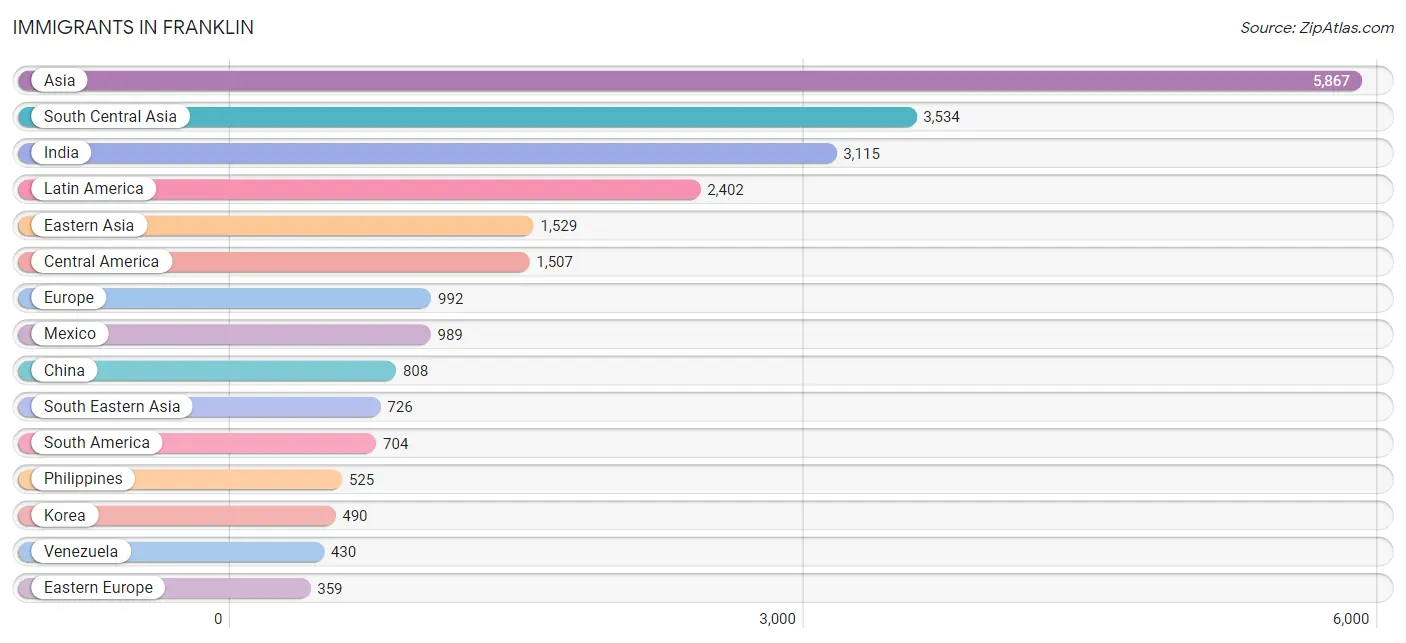
Immigrants in Franklin
The most numerous immigrant groups reported in Franklin came from Asia (5,867 | 7.0%), South Central Asia (3,534 | 4.2%), India (3,115 | 3.7%), Latin America (2,402 | 2.9%), and Eastern Asia (1,529 | 1.8%), together accounting for 19.7% of all Franklin residents.
| Immigration Origin | # Population | % Population |
| Africa | 143 | 0.2% |
| Albania | 25 | 0.0% |
| Asia | 5,867 | 7.0% |
| Australia | 14 | 0.0% |
| Austria | 31 | 0.0% |
| Bosnia and Herzegovina | 19 | 0.0% |
| Brazil | 94 | 0.1% |
| Bulgaria | 25 | 0.0% |
| Canada | 300 | 0.4% |
| Caribbean | 191 | 0.2% |
| Central America | 1,507 | 1.8% |
| Chile | 37 | 0.0% |
| China | 808 | 1.0% |
| Colombia | 71 | 0.1% |
| Costa Rica | 92 | 0.1% |
| Cuba | 56 | 0.1% |
| Czechoslovakia | 17 | 0.0% |
| Dominican Republic | 23 | 0.0% |
| Eastern Asia | 1,529 | 1.8% |
| Eastern Europe | 359 | 0.4% |
| Egypt | 17 | 0.0% |
| El Salvador | 58 | 0.1% |
| England | 90 | 0.1% |
| Europe | 992 | 1.2% |
| France | 133 | 0.2% |
| Germany | 67 | 0.1% |
| Greece | 8 | 0.0% |
| Guatemala | 48 | 0.1% |
| Haiti | 56 | 0.1% |
| Honduras | 320 | 0.4% |
| Hong Kong | 12 | 0.0% |
| Hungary | 14 | 0.0% |
| India | 3,115 | 3.7% |
| Indonesia | 16 | 0.0% |
| Iran | 261 | 0.3% |
| Ireland | 36 | 0.0% |
| Italy | 107 | 0.1% |
| Japan | 231 | 0.3% |
| Kazakhstan | 6 | 0.0% |
| Korea | 490 | 0.6% |
| Latin America | 2,402 | 2.9% |
| Mexico | 989 | 1.2% |
| Middle Africa | 8 | 0.0% |
| Nepal | 152 | 0.2% |
| Netherlands | 10 | 0.0% |
| Nigeria | 10 | 0.0% |
| Northern Africa | 17 | 0.0% |
| Northern Europe | 239 | 0.3% |
| Oceania | 41 | 0.1% |
| Peru | 63 | 0.1% |
| Philippines | 525 | 0.6% |
| Poland | 70 | 0.1% |
| Portugal | 38 | 0.1% |
| Romania | 28 | 0.0% |
| Russia | 109 | 0.1% |
| Scotland | 23 | 0.0% |
| Serbia | 20 | 0.0% |
| Singapore | 5 | 0.0% |
| South Africa | 108 | 0.1% |
| South America | 704 | 0.8% |
| South Central Asia | 3,534 | 4.2% |
| South Eastern Asia | 726 | 0.9% |
| Southern Europe | 153 | 0.2% |
| Taiwan | 60 | 0.1% |
| Turkey | 41 | 0.1% |
| Ukraine | 32 | 0.0% |
| Venezuela | 430 | 0.5% |
| Vietnam | 180 | 0.2% |
| Western Africa | 10 | 0.0% |
| Western Asia | 78 | 0.1% |
| Western Europe | 241 | 0.3% |
| Zaire | 8 | 0.0% | View All 72 Rows |
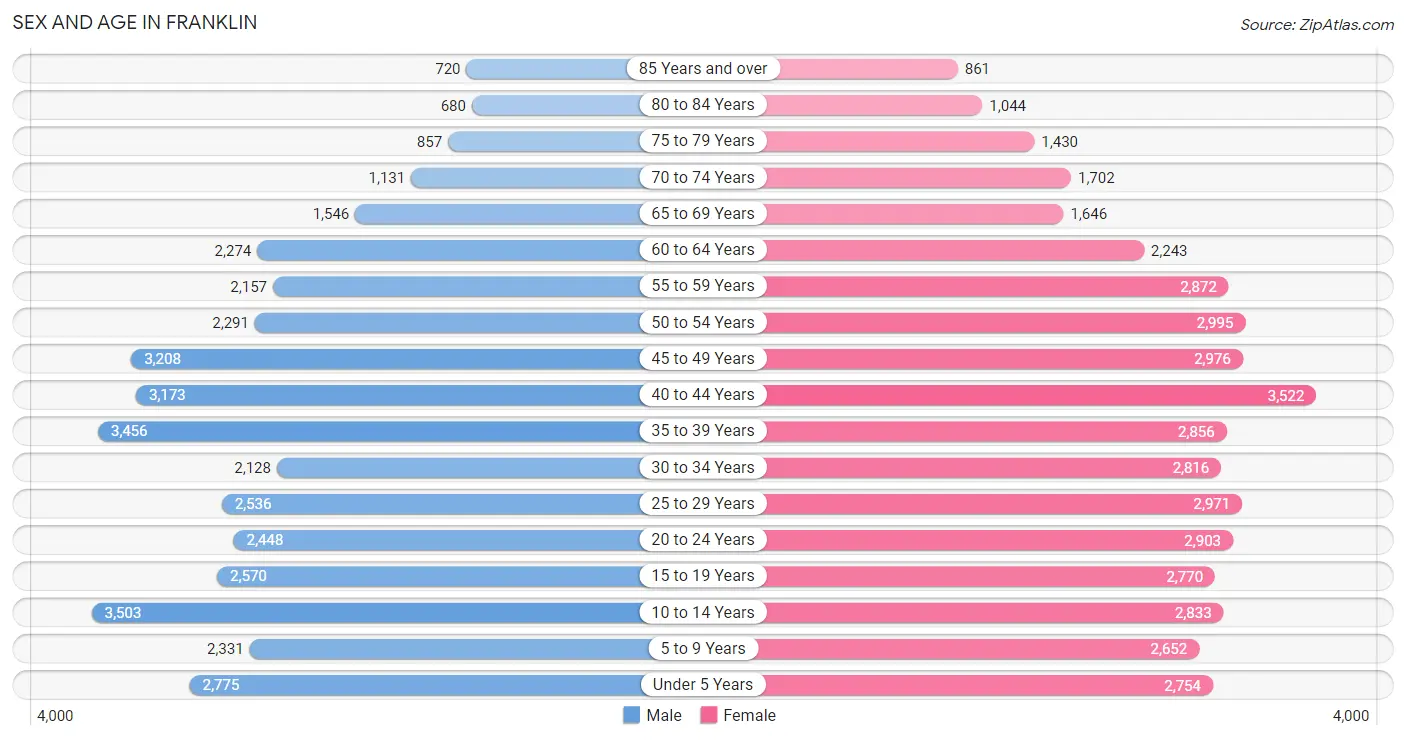
Sex and Age in Franklin
Sex and Age in Franklin
The most populous age groups in Franklin are 10 to 14 Years (3,503 | 8.8%) for men and 40 to 44 Years (3,522 | 8.0%) for women.
| Age Bracket | Male | Female |
| Under 5 Years | 2,775 (7.0%) | 2,754 (6.3%) |
| 5 to 9 Years | 2,331 (5.9%) | 2,652 (6.0%) |
| 10 to 14 Years | 3,503 (8.8%) | 2,833 (6.5%) |
| 15 to 19 Years | 2,570 (6.5%) | 2,770 (6.3%) |
| 20 to 24 Years | 2,448 (6.1%) | 2,903 (6.6%) |
| 25 to 29 Years | 2,536 (6.4%) | 2,971 (6.8%) |
| 30 to 34 Years | 2,128 (5.3%) | 2,816 (6.4%) |
| 35 to 39 Years | 3,456 (8.7%) | 2,856 (6.5%) |
| 40 to 44 Years | 3,173 (8.0%) | 3,522 (8.0%) |
| 45 to 49 Years | 3,208 (8.1%) | 2,976 (6.8%) |
| 50 to 54 Years | 2,291 (5.8%) | 2,995 (6.8%) |
| 55 to 59 Years | 2,157 (5.4%) | 2,872 (6.6%) |
| 60 to 64 Years | 2,274 (5.7%) | 2,243 (5.1%) |
| 65 to 69 Years | 1,546 (3.9%) | 1,646 (3.7%) |
| 70 to 74 Years | 1,131 (2.8%) | 1,702 (3.9%) |
| 75 to 79 Years | 857 (2.1%) | 1,430 (3.3%) |
| 80 to 84 Years | 680 (1.7%) | 1,044 (2.4%) |
| 85 Years and over | 720 (1.8%) | 861 (2.0%) |
| Total | 39,784 (100.0%) | 43,846 (100.0%) |
Families and Households in Franklin
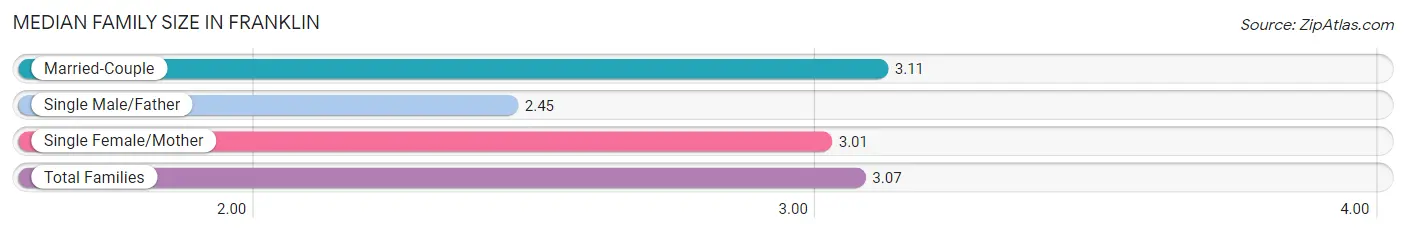
Median Family Size in Franklin
The median family size in Franklin is 3.07 persons per family, with married-couple families (18,936 | 83.7%) accounting for the largest median family size of 3.11 persons per family. On the other hand, single male/father families (739 | 3.3%) represent the smallest median family size with 2.45 persons per family.
| Family Type | # Families | Family Size |
| Married-Couple | 18,936 (83.7%) | 3.11 |
| Single Male/Father | 739 (3.3%) | 2.45 |
| Single Female/Mother | 2,959 (13.1%) | 3.01 |
| Total Families | 22,634 (100.0%) | 3.07 |
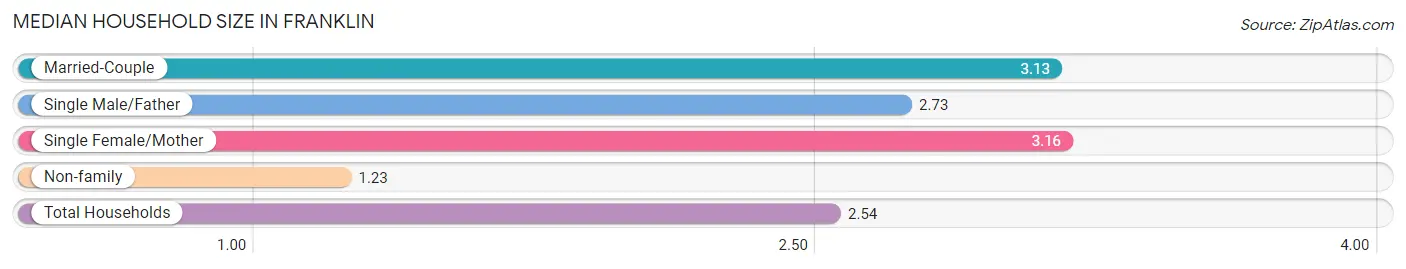
Median Household Size in Franklin
The median household size in Franklin is 2.54 persons per household, with single female/mother households (2,959 | 9.0%) accounting for the largest median household size of 3.16 persons per household. non-family households (10,136 | 30.9%) represent the smallest median household size with 1.23 persons per household.
| Household Type | # Households | Household Size |
| Married-Couple | 18,936 (57.8%) | 3.13 |
| Single Male/Father | 739 (2.3%) | 2.73 |
| Single Female/Mother | 2,959 (9.0%) | 3.16 |
| Non-family | 10,136 (30.9%) | 1.23 |
| Total Households | 32,770 (100.0%) | 2.54 |
Household Size by Marriage Status in Franklin
Out of a total of 32,770 households in Franklin, 22,634 (69.1%) are family households, while 10,136 (30.9%) are nonfamily households. The most numerous type of family households are 2-person households, comprising 10,294, and the most common type of nonfamily households are 1-person households, comprising 8,280.
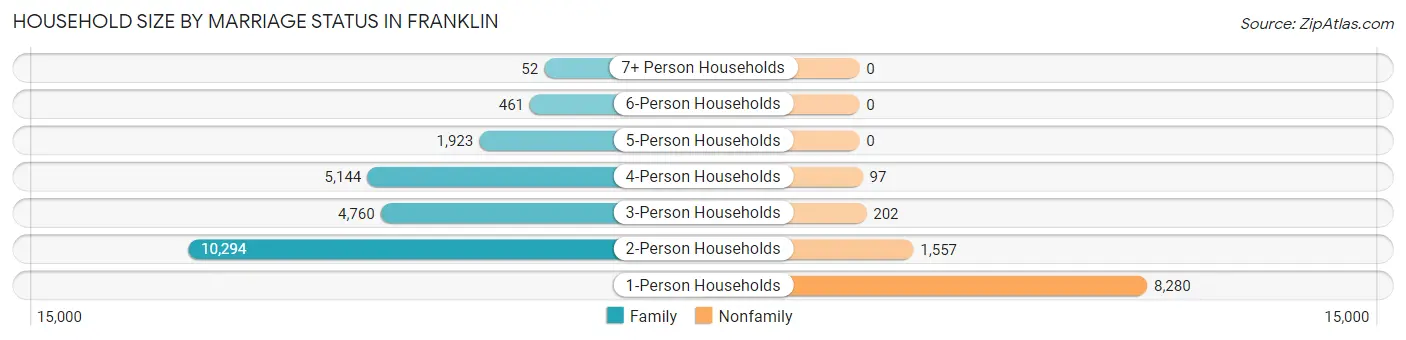
| Household Size | Family Households | Nonfamily Households |
| 1-Person Households | - | 8,280 (25.3%) |
| 2-Person Households | 10,294 (31.4%) | 1,557 (4.8%) |
| 3-Person Households | 4,760 (14.5%) | 202 (0.6%) |
| 4-Person Households | 5,144 (15.7%) | 97 (0.3%) |
| 5-Person Households | 1,923 (5.9%) | 0 (0.0%) |
| 6-Person Households | 461 (1.4%) | 0 (0.0%) |
| 7+ Person Households | 52 (0.2%) | 0 (0.0%) |
| Total | 22,634 (69.1%) | 10,136 (30.9%) |
Female Fertility in Franklin
Fertility by Age in Franklin
Average fertility rate in Franklin is 53.0 births per 1,000 women. Women in the age bracket of 20 to 34 years have the highest fertility rate with 109.0 births per 1,000 women. Women in the age bracket of 20 to 34 years acount for 83.8% of all women with births.
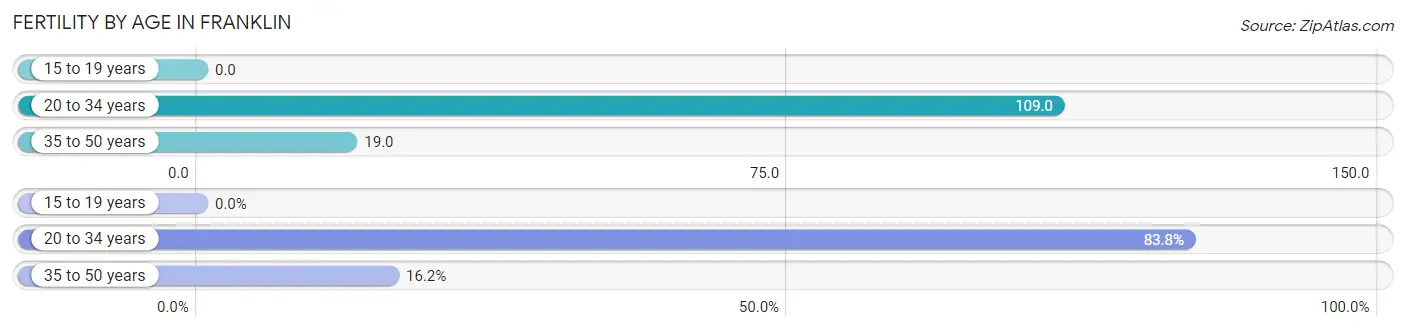
| Age Bracket | Women with Births | Births / 1,000 Women |
| 15 to 19 years | 0 (0.0%) | 0.0 |
| 20 to 34 years | 951 (83.8%) | 109.0 |
| 35 to 50 years | 184 (16.2%) | 19.0 |
| Total | 1,135 (100.0%) | 53.0 |
Fertility by Age by Marriage Status in Franklin
83.0% of women with births (1,135) in Franklin are married. The highest percentage of unmarried women with births falls into 20 to 34 years age bracket with 20.3% of them unmarried at the time of birth, while the lowest percentage of unmarried women with births belong to 35 to 50 years age bracket with 0.0% of them unmarried.
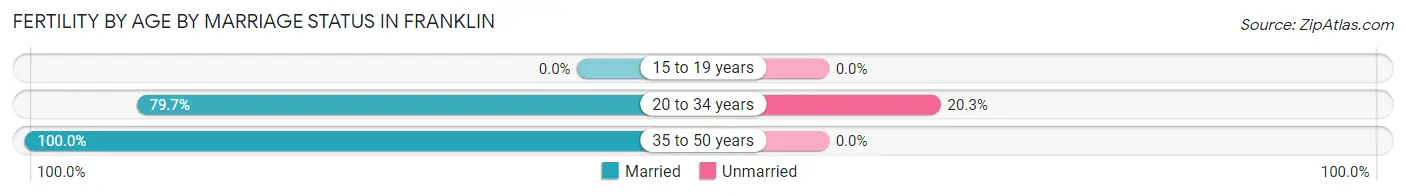
| Age Bracket | Married | Unmarried |
| 15 to 19 years | 0 (0.0%) | 0 (0.0%) |
| 20 to 34 years | 758 (79.7%) | 193 (20.3%) |
| 35 to 50 years | 184 (100.0%) | 0 (0.0%) |
| Total | 942 (83.0%) | 193 (17.0%) |
Fertility by Education in Franklin
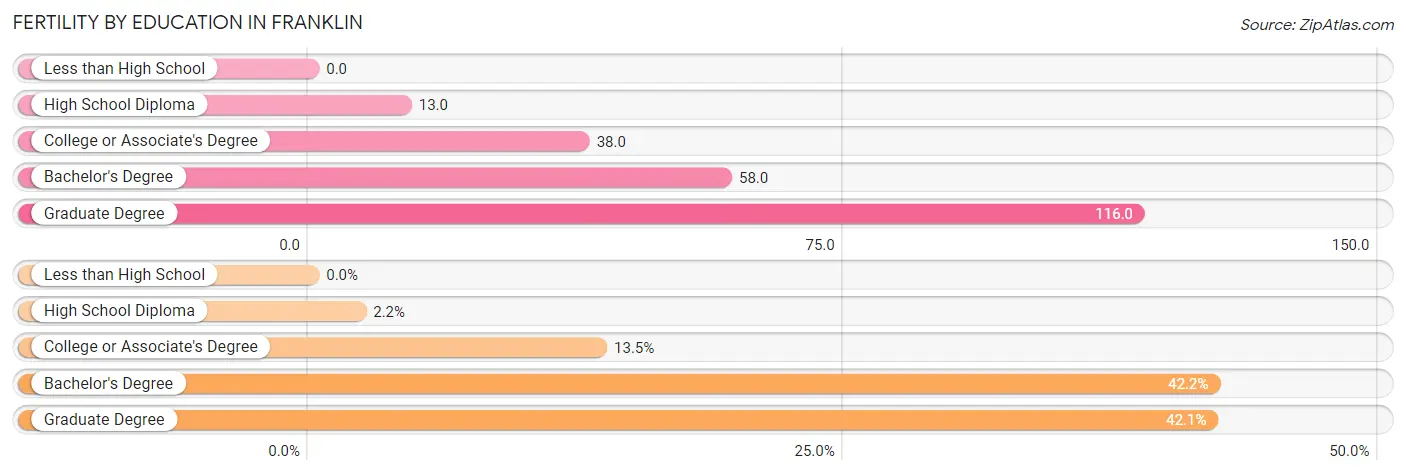
| Educational Attainment | Women with Births | Births / 1,000 Women |
| Less than High School | 0 (0.0%) | 0.0 |
| High School Diploma | 25 (2.2%) | 13.0 |
| College or Associate's Degree | 153 (13.5%) | 38.0 |
| Bachelor's Degree | 479 (42.2%) | 58.0 |
| Graduate Degree | 478 (42.1%) | 116.0 |
| Total | 1,135 (100.0%) | 53.0 |
Fertility by Education by Marriage Status in Franklin
17.0% of women with births in Franklin are unmarried. Women with the educational attainment of bachelor's degree are most likely to be married with 95.0% of them married at childbirth, while women with the educational attainment of high school diploma are least likely to be married with 100.0% of them unmarried at childbirth.
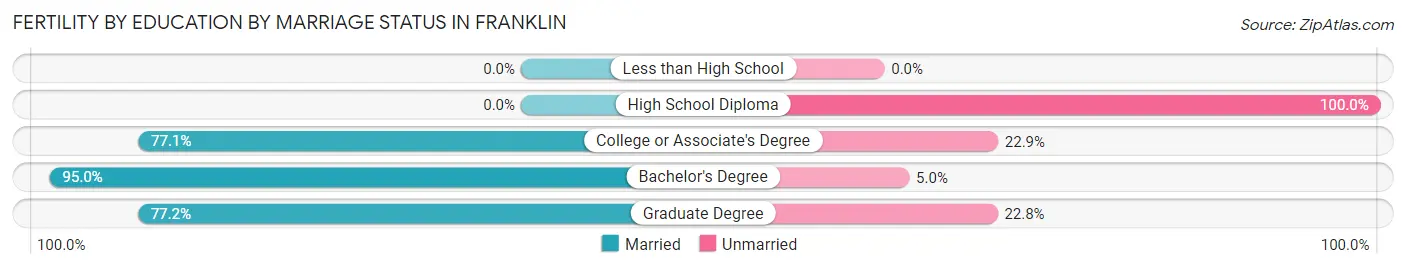
| Educational Attainment | Married | Unmarried |
| Less than High School | 0 (0.0%) | 0 (0.0%) |
| High School Diploma | 0 (0.0%) | 25 (100.0%) |
| College or Associate's Degree | 118 (77.1%) | 35 (22.9%) |
| Bachelor's Degree | 455 (95.0%) | 24 (5.0%) |
| Graduate Degree | 369 (77.2%) | 109 (22.8%) |
| Total | 942 (83.0%) | 193 (17.0%) |
Employment Characteristics in Franklin
Employment by Class of Employer in Franklin
Among the 44,399 employed individuals in Franklin, private company employees (30,323 | 68.3%), not-for-profit organizations (4,363 | 9.8%), and self-employed (not incorporated) (3,475 | 7.8%) make up the most common classes of employment.
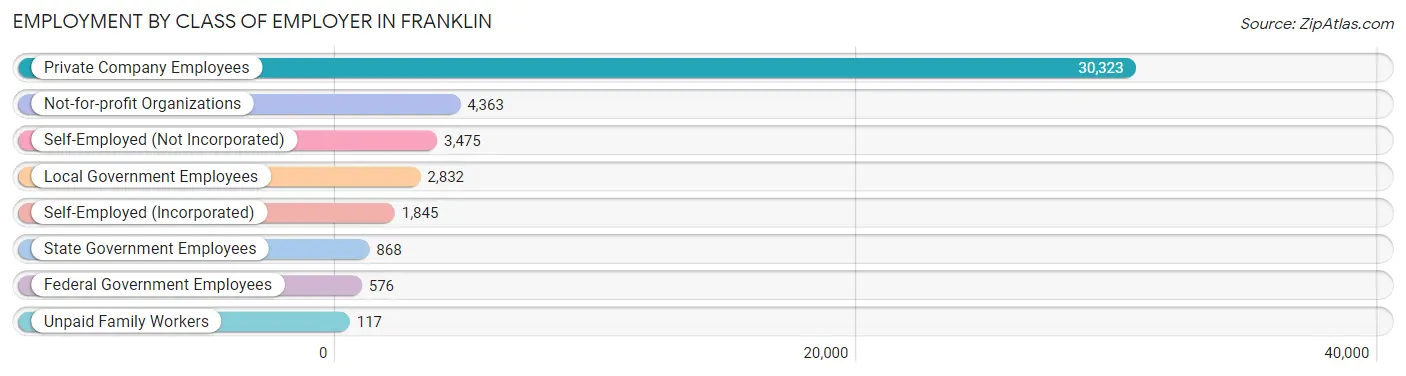
| Employer Class | # Employees | % Employees |
| Private Company Employees | 30,323 | 68.3% |
| Self-Employed (Incorporated) | 1,845 | 4.2% |
| Self-Employed (Not Incorporated) | 3,475 | 7.8% |
| Not-for-profit Organizations | 4,363 | 9.8% |
| Local Government Employees | 2,832 | 6.4% |
| State Government Employees | 868 | 1.9% |
| Federal Government Employees | 576 | 1.3% |
| Unpaid Family Workers | 117 | 0.3% |
| Total | 44,399 | 100.0% |
Employment Status by Age in Franklin
According to the labor force statistics for Franklin, out of the total population over 16 years of age (65,390), 70.2% or 45,904 individuals are in the labor force, with 2.6% or 1,194 of them unemployed. The age group with the highest labor force participation rate is 25 to 29 years, with 91.1% or 5,017 individuals in the labor force. Within the labor force, the 16 to 19 years age range has the highest percentage of unemployed individuals, with 11.6% or 187 of them being unemployed.
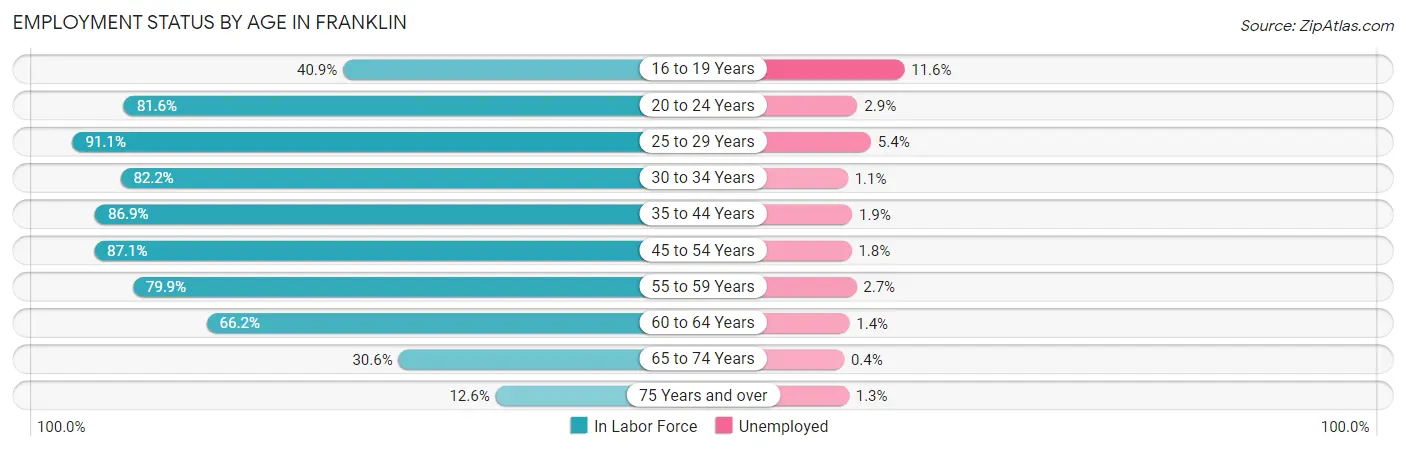
| Age Bracket | In Labor Force | Unemployed |
| 16 to 19 Years | 1,615 (40.9%) | 187 (11.6%) |
| 20 to 24 Years | 4,366 (81.6%) | 127 (2.9%) |
| 25 to 29 Years | 5,017 (91.1%) | 271 (5.4%) |
| 30 to 34 Years | 4,064 (82.2%) | 45 (1.1%) |
| 35 to 44 Years | 11,303 (86.9%) | 215 (1.9%) |
| 45 to 54 Years | 9,990 (87.1%) | 180 (1.8%) |
| 55 to 59 Years | 4,018 (79.9%) | 108 (2.7%) |
| 60 to 64 Years | 2,990 (66.2%) | 42 (1.4%) |
| 65 to 74 Years | 1,844 (30.6%) | 7 (0.4%) |
| 75 Years and over | 705 (12.6%) | 9 (1.3%) |
| Total | 45,904 (70.2%) | 1,194 (2.6%) |
Employment Status by Educational Attainment in Franklin
According to labor force statistics for Franklin, 84.0% of individuals (37,358) out of the total population between 25 and 64 years of age (44,474) are in the labor force, with 2.3% or 859 of them being unemployed. The group with the highest labor force participation rate are those with the educational attainment of bachelor's degree or higher, with 86.8% or 26,225 individuals in the labor force. Within the labor force, individuals with less than high school education have the highest percentage of unemployment, with 7.5% or 67 of them being unemployed.
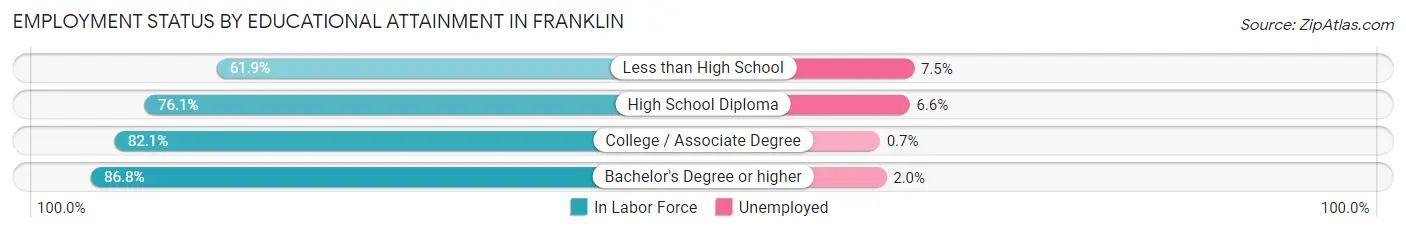
| Educational Attainment | In Labor Force | Unemployed |
| Less than High School | 898 (61.9%) | 109 (7.5%) |
| High School Diploma | 3,230 (76.1%) | 280 (6.6%) |
| College / Associate Degree | 7,034 (82.1%) | 60 (0.7%) |
| Bachelor's Degree or higher | 26,225 (86.8%) | 604 (2.0%) |
| Total | 37,358 (84.0%) | 1,023 (2.3%) |
Employment Occupations by Sex in Franklin
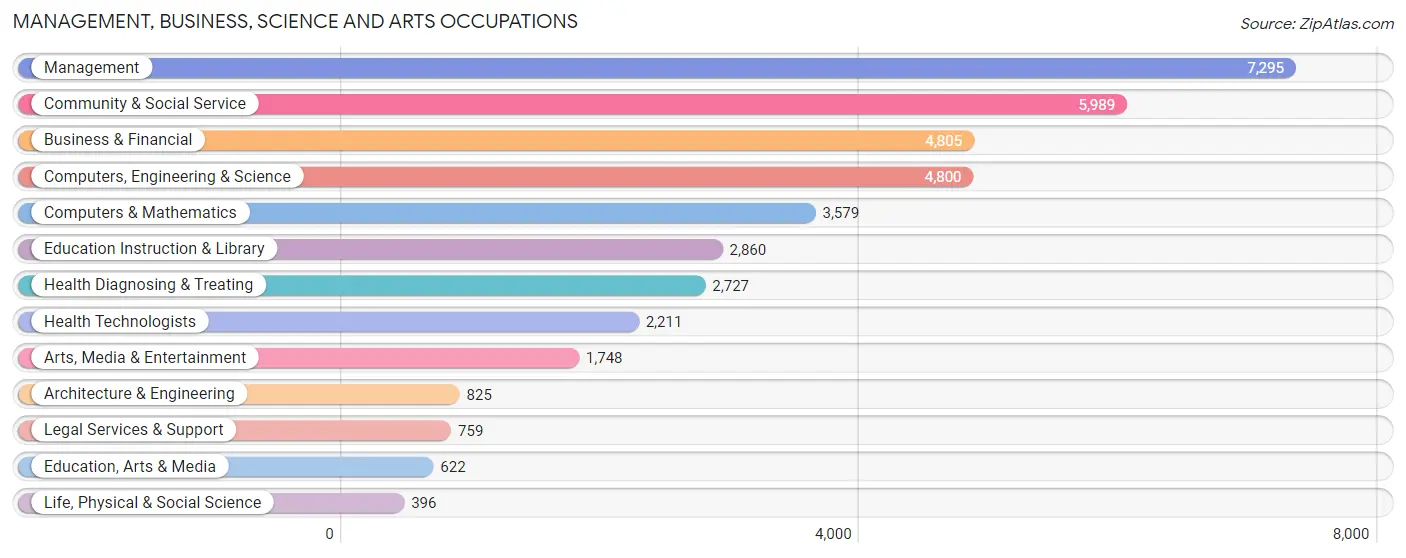
Management, Business, Science and Arts Occupations
The most common Management, Business, Science and Arts occupations in Franklin are Management (7,295 | 16.3%), Community & Social Service (5,989 | 13.4%), Business & Financial (4,805 | 10.7%), Computers, Engineering & Science (4,800 | 10.7%), and Computers & Mathematics (3,579 | 8.0%).
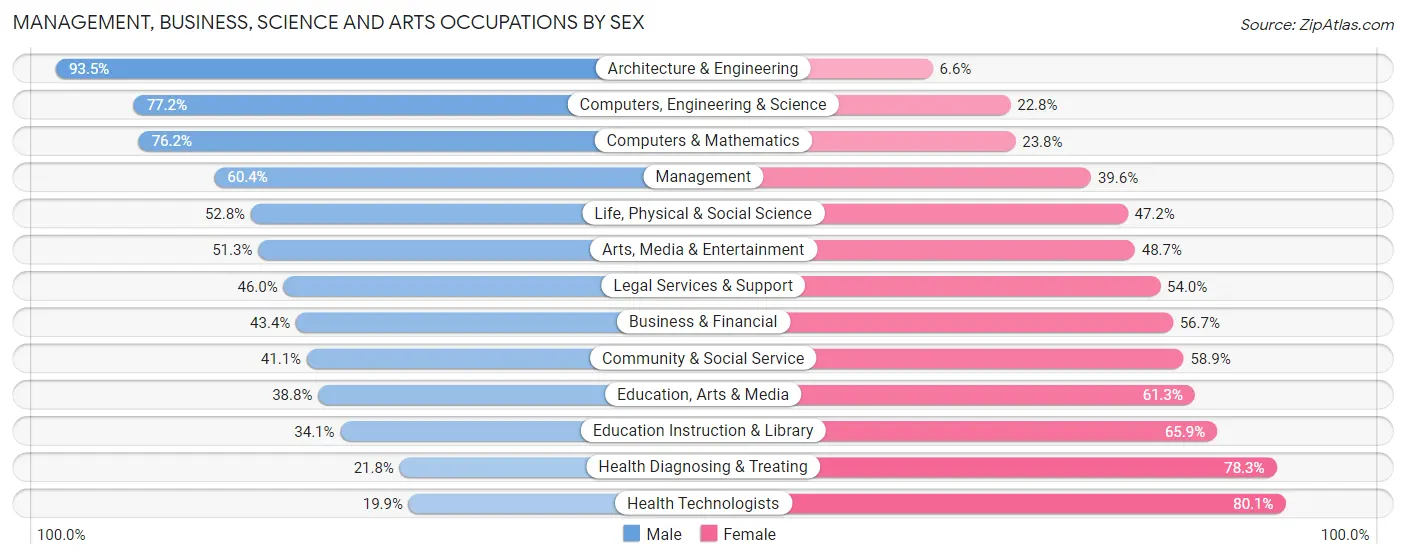
Management, Business, Science and Arts Occupations by Sex
Within the Management, Business, Science and Arts occupations in Franklin, the most male-oriented occupations are Architecture & Engineering (93.4%), Computers, Engineering & Science (77.2%), and Computers & Mathematics (76.2%), while the most female-oriented occupations are Health Technologists (80.1%), Health Diagnosing & Treating (78.2%), and Education Instruction & Library (65.9%).
| Occupation | Male | Female |
| Management | 4,406 (60.4%) | 2,889 (39.6%) |
| Business & Financial | 2,083 (43.3%) | 2,722 (56.7%) |
| Computers, Engineering & Science | 3,707 (77.2%) | 1,093 (22.8%) |
| Computers & Mathematics | 2,727 (76.2%) | 852 (23.8%) |
| Architecture & Engineering | 771 (93.4%) | 54 (6.6%) |
| Life, Physical & Social Science | 209 (52.8%) | 187 (47.2%) |
| Community & Social Service | 2,462 (41.1%) | 3,527 (58.9%) |
| Education, Arts & Media | 241 (38.8%) | 381 (61.3%) |
| Legal Services & Support | 349 (46.0%) | 410 (54.0%) |
| Education Instruction & Library | 976 (34.1%) | 1,884 (65.9%) |
| Arts, Media & Entertainment | 896 (51.3%) | 852 (48.7%) |
| Health Diagnosing & Treating | 593 (21.7%) | 2,134 (78.2%) |
| Health Technologists | 439 (19.9%) | 1,772 (80.1%) |
| Total (Category) | 13,251 (51.7%) | 12,365 (48.3%) |
| Total (Overall) | 23,215 (51.9%) | 21,511 (48.1%) |
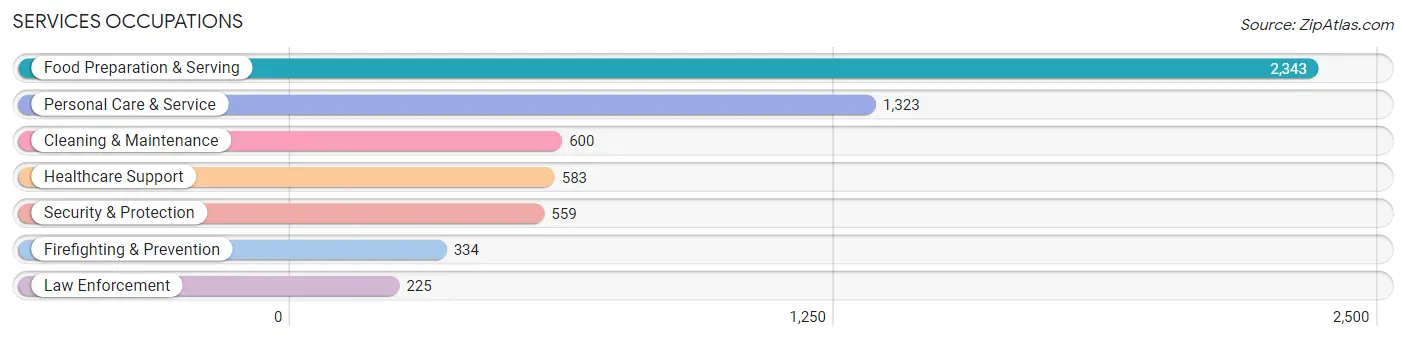
Services Occupations
The most common Services occupations in Franklin are Food Preparation & Serving (2,343 | 5.2%), Personal Care & Service (1,323 | 3.0%), Cleaning & Maintenance (600 | 1.3%), Healthcare Support (583 | 1.3%), and Security & Protection (559 | 1.3%).
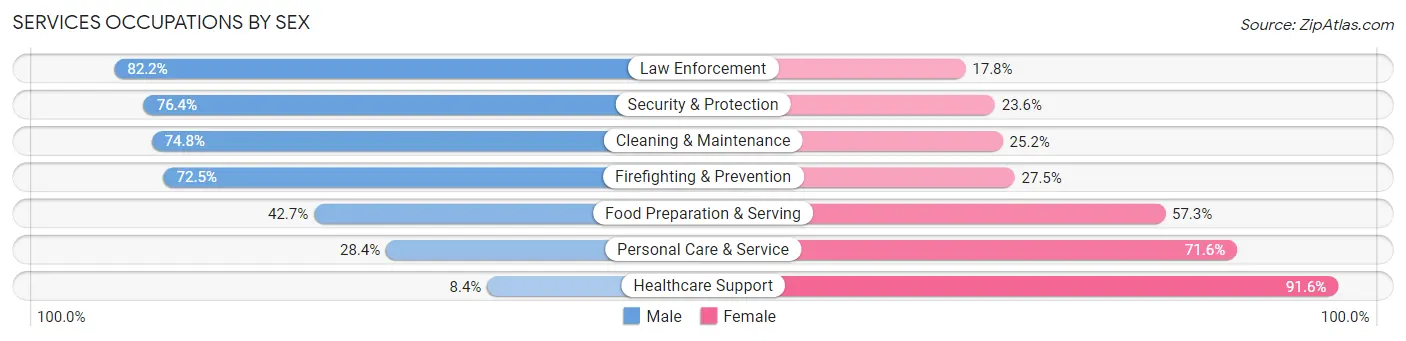
Services Occupations by Sex
Within the Services occupations in Franklin, the most male-oriented occupations are Law Enforcement (82.2%), Security & Protection (76.4%), and Cleaning & Maintenance (74.8%), while the most female-oriented occupations are Healthcare Support (91.6%), Personal Care & Service (71.6%), and Food Preparation & Serving (57.3%).
| Occupation | Male | Female |
| Healthcare Support | 49 (8.4%) | 534 (91.6%) |
| Security & Protection | 427 (76.4%) | 132 (23.6%) |
| Firefighting & Prevention | 242 (72.5%) | 92 (27.5%) |
| Law Enforcement | 185 (82.2%) | 40 (17.8%) |
| Food Preparation & Serving | 1,000 (42.7%) | 1,343 (57.3%) |
| Cleaning & Maintenance | 449 (74.8%) | 151 (25.2%) |
| Personal Care & Service | 376 (28.4%) | 947 (71.6%) |
| Total (Category) | 2,301 (42.5%) | 3,107 (57.5%) |
| Total (Overall) | 23,215 (51.9%) | 21,511 (48.1%) |
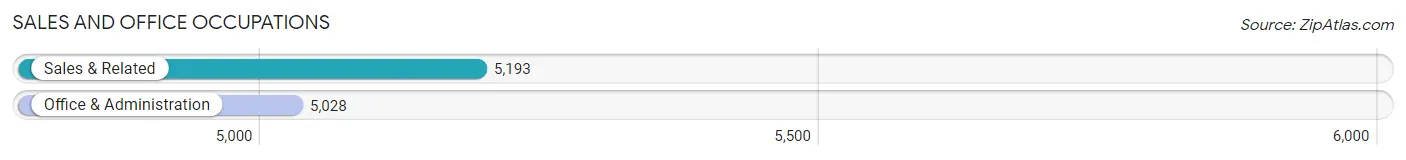
Sales and Office Occupations
The most common Sales and Office occupations in Franklin are Sales & Related (5,193 | 11.6%), and Office & Administration (5,028 | 11.2%).
Sales and Office Occupations by Sex
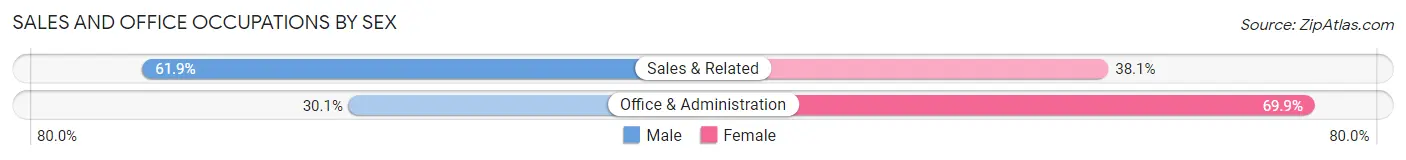
| Occupation | Male | Female |
| Sales & Related | 3,214 (61.9%) | 1,979 (38.1%) |
| Office & Administration | 1,515 (30.1%) | 3,513 (69.9%) |
| Total (Category) | 4,729 (46.3%) | 5,492 (53.7%) |
| Total (Overall) | 23,215 (51.9%) | 21,511 (48.1%) |
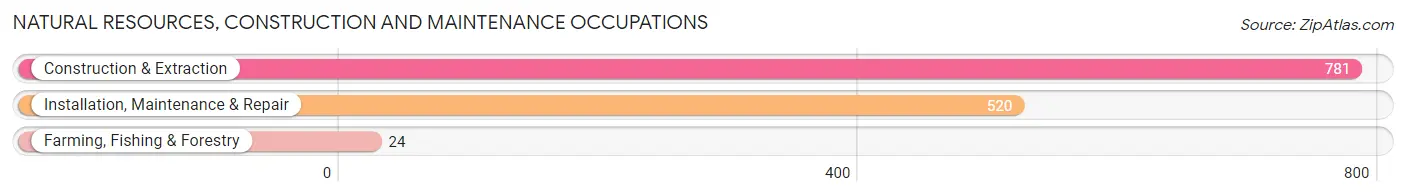
Natural Resources, Construction and Maintenance Occupations
The most common Natural Resources, Construction and Maintenance occupations in Franklin are Construction & Extraction (781 | 1.8%), Installation, Maintenance & Repair (520 | 1.2%), and Farming, Fishing & Forestry (24 | 0.1%).
Natural Resources, Construction and Maintenance Occupations by Sex
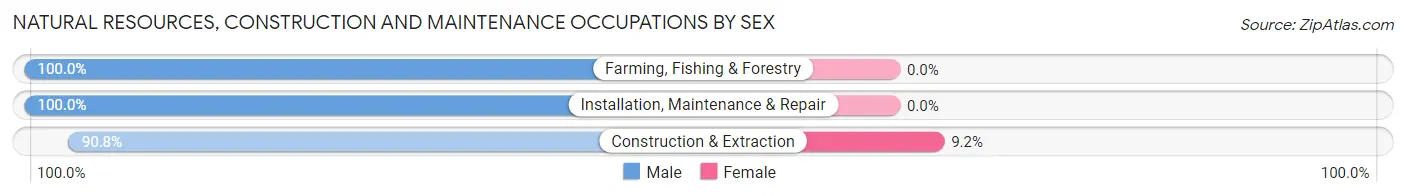
| Occupation | Male | Female |
| Farming, Fishing & Forestry | 24 (100.0%) | 0 (0.0%) |
| Construction & Extraction | 709 (90.8%) | 72 (9.2%) |
| Installation, Maintenance & Repair | 520 (100.0%) | 0 (0.0%) |
| Total (Category) | 1,253 (94.6%) | 72 (5.4%) |
| Total (Overall) | 23,215 (51.9%) | 21,511 (48.1%) |
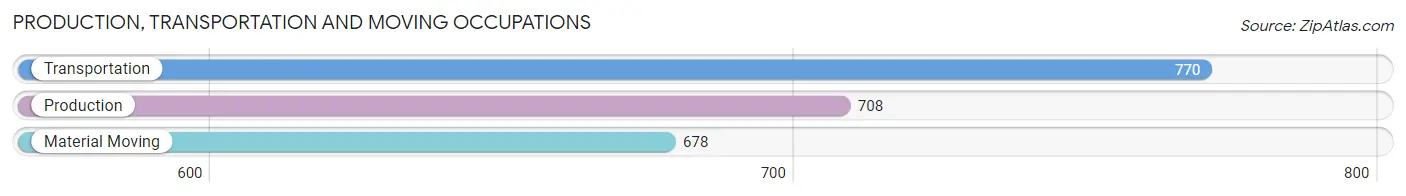
Production, Transportation and Moving Occupations
The most common Production, Transportation and Moving occupations in Franklin are Transportation (770 | 1.7%), Production (708 | 1.6%), and Material Moving (678 | 1.5%).
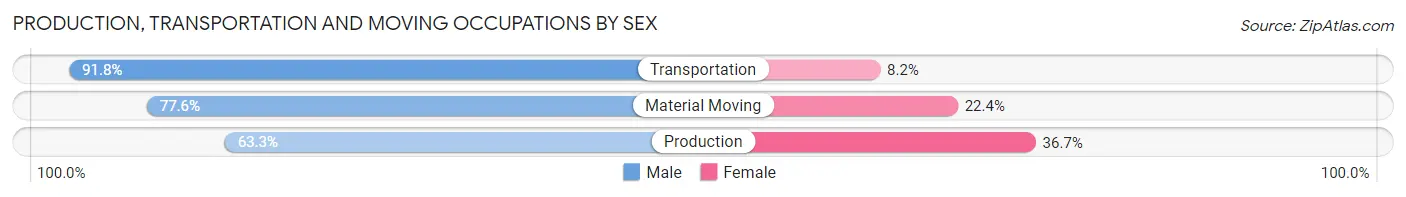
Production, Transportation and Moving Occupations by Sex
| Occupation | Male | Female |
| Production | 448 (63.3%) | 260 (36.7%) |
| Transportation | 707 (91.8%) | 63 (8.2%) |
| Material Moving | 526 (77.6%) | 152 (22.4%) |
| Total (Category) | 1,681 (78.0%) | 475 (22.0%) |
| Total (Overall) | 23,215 (51.9%) | 21,511 (48.1%) |
Employment Industries by Sex in Franklin
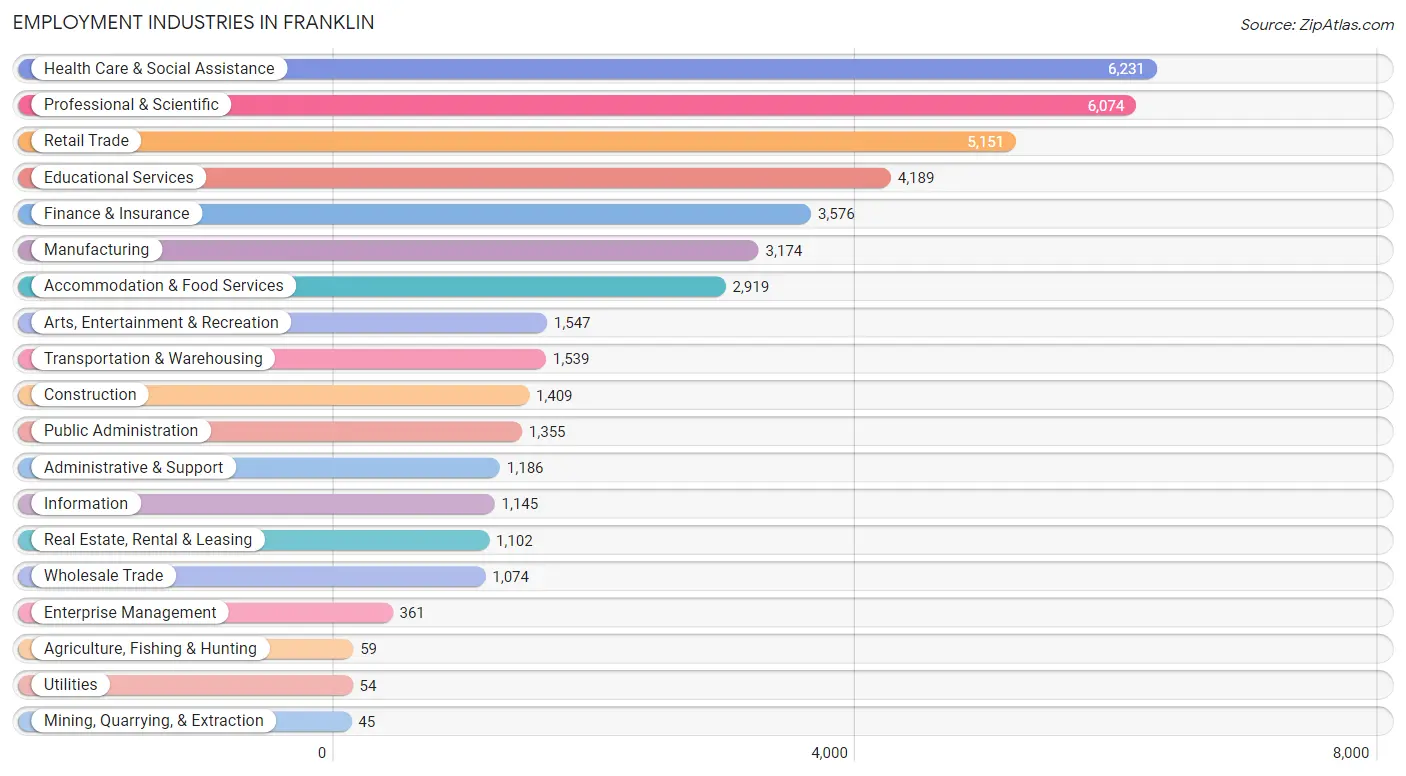
Employment Industries in Franklin
The major employment industries in Franklin include Health Care & Social Assistance (6,231 | 13.9%), Professional & Scientific (6,074 | 13.6%), Retail Trade (5,151 | 11.5%), Educational Services (4,189 | 9.4%), and Finance & Insurance (3,576 | 8.0%).
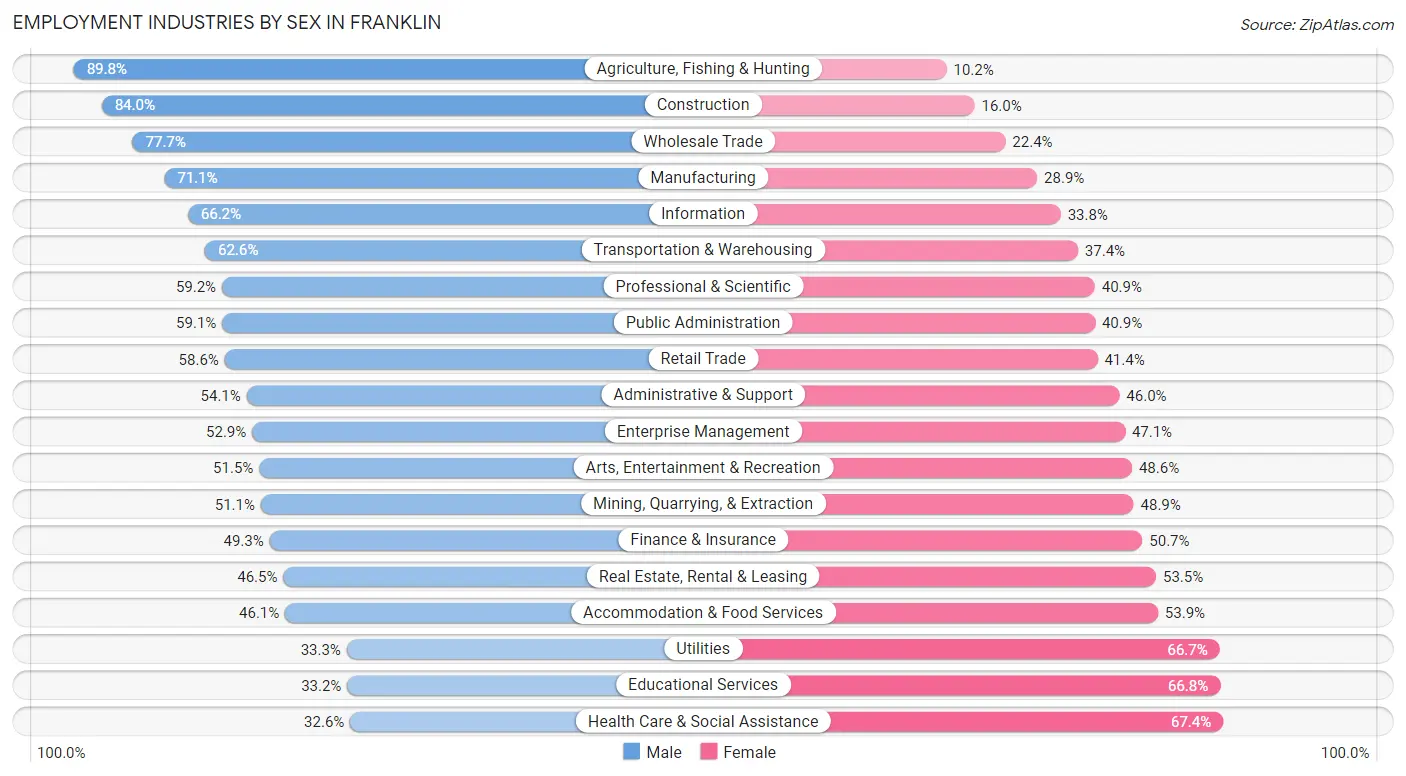
Employment Industries by Sex in Franklin
The Franklin industries that see more men than women are Agriculture, Fishing & Hunting (89.8%), Construction (84.0%), and Wholesale Trade (77.6%), whereas the industries that tend to have a higher number of women are Health Care & Social Assistance (67.4%), Educational Services (66.8%), and Utilities (66.7%).
| Industry | Male | Female |
| Agriculture, Fishing & Hunting | 53 (89.8%) | 6 (10.2%) |
| Mining, Quarrying, & Extraction | 23 (51.1%) | 22 (48.9%) |
| Construction | 1,184 (84.0%) | 225 (16.0%) |
| Manufacturing | 2,256 (71.1%) | 918 (28.9%) |
| Wholesale Trade | 834 (77.6%) | 240 (22.4%) |
| Retail Trade | 3,018 (58.6%) | 2,133 (41.4%) |
| Transportation & Warehousing | 964 (62.6%) | 575 (37.4%) |
| Utilities | 18 (33.3%) | 36 (66.7%) |
| Information | 758 (66.2%) | 387 (33.8%) |
| Finance & Insurance | 1,763 (49.3%) | 1,813 (50.7%) |
| Real Estate, Rental & Leasing | 512 (46.5%) | 590 (53.5%) |
| Professional & Scientific | 3,593 (59.2%) | 2,481 (40.8%) |
| Enterprise Management | 191 (52.9%) | 170 (47.1%) |
| Administrative & Support | 641 (54.0%) | 545 (46.0%) |
| Educational Services | 1,392 (33.2%) | 2,797 (66.8%) |
| Health Care & Social Assistance | 2,032 (32.6%) | 4,199 (67.4%) |
| Arts, Entertainment & Recreation | 796 (51.4%) | 751 (48.5%) |
| Accommodation & Food Services | 1,345 (46.1%) | 1,574 (53.9%) |
| Public Administration | 801 (59.1%) | 554 (40.9%) |
| Total | 23,215 (51.9%) | 21,511 (48.1%) |
Education in Franklin
School Enrollment in Franklin
The most common levels of schooling among the 21,070 students in Franklin are middle school (5,067 | 24.0%), high school (4,821 | 22.9%), and elementary school (4,431 | 21.0%).
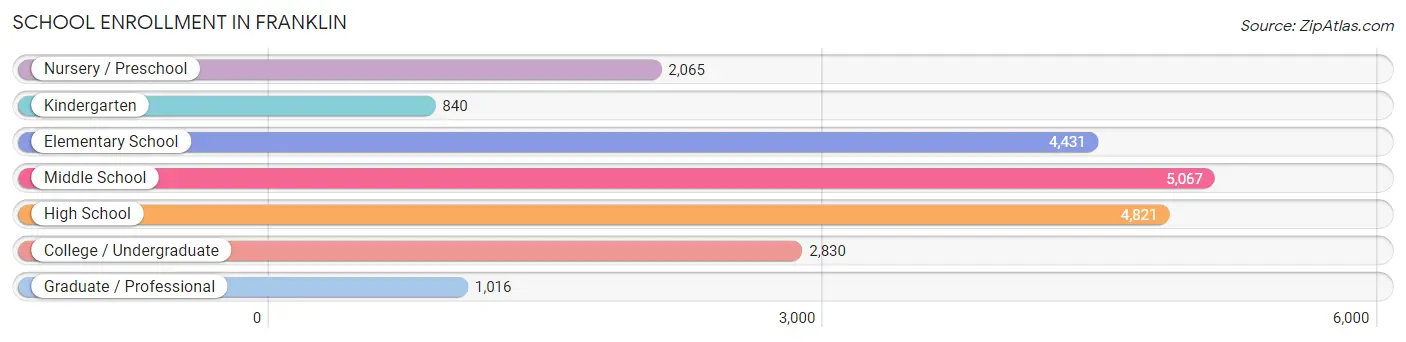
| School Level | # Students | % Students |
| Nursery / Preschool | 2,065 | 9.8% |
| Kindergarten | 840 | 4.0% |
| Elementary School | 4,431 | 21.0% |
| Middle School | 5,067 | 24.0% |
| High School | 4,821 | 22.9% |
| College / Undergraduate | 2,830 | 13.4% |
| Graduate / Professional | 1,016 | 4.8% |
| Total | 21,070 | 100.0% |
School Enrollment by Age by Funding Source in Franklin
Out of a total of 21,070 students who are enrolled in schools in Franklin, 4,888 (23.2%) attend a private institution, while the remaining 16,182 (76.8%) are enrolled in public schools. The age group of 3 to 4 year olds has the highest likelihood of being enrolled in private schools, with 837 (48.0% in the age bracket) enrolled. Conversely, the age group of 18 to 19 year olds has the lowest likelihood of being enrolled in a private school, with 1,162 (85.1% in the age bracket) attending a public institution.
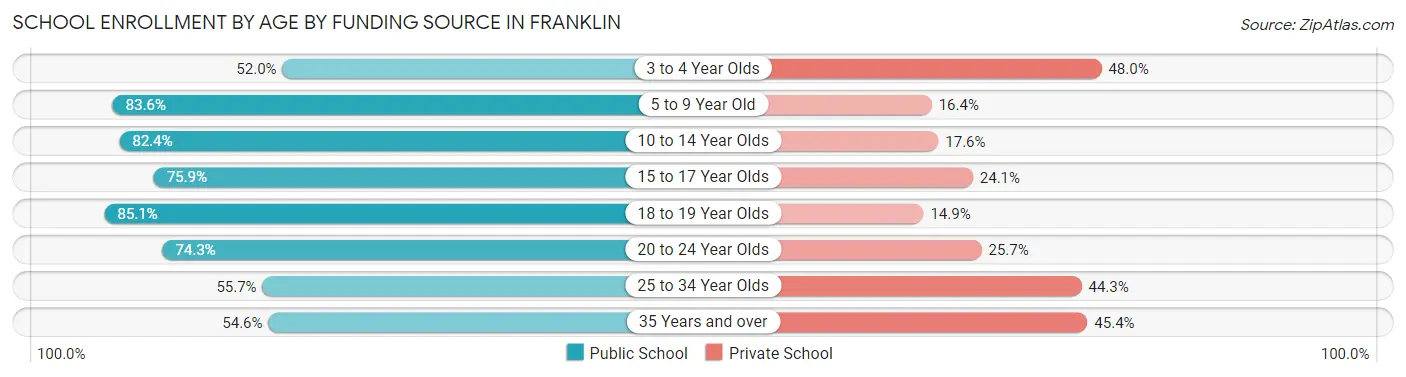
| Age Bracket | Public School | Private School |
| 3 to 4 Year Olds | 906 (52.0%) | 837 (48.0%) |
| 5 to 9 Year Old | 4,026 (83.6%) | 790 (16.4%) |
| 10 to 14 Year Olds | 5,173 (82.4%) | 1,108 (17.6%) |
| 15 to 17 Year Olds | 2,692 (75.9%) | 853 (24.1%) |
| 18 to 19 Year Olds | 1,162 (85.1%) | 203 (14.9%) |
| 20 to 24 Year Olds | 1,540 (74.3%) | 532 (25.7%) |
| 25 to 34 Year Olds | 332 (55.7%) | 264 (44.3%) |
| 35 Years and over | 356 (54.6%) | 296 (45.4%) |
| Total | 16,182 (76.8%) | 4,888 (23.2%) |
Educational Attainment by Field of Study in Franklin
Business (10,362 | 27.0%), science & technology (3,881 | 10.1%), education (3,040 | 7.9%), engineering (2,858 | 7.4%), and social sciences (2,391 | 6.2%) are the most common fields of study among 38,451 individuals in Franklin who have obtained a bachelor's degree or higher.
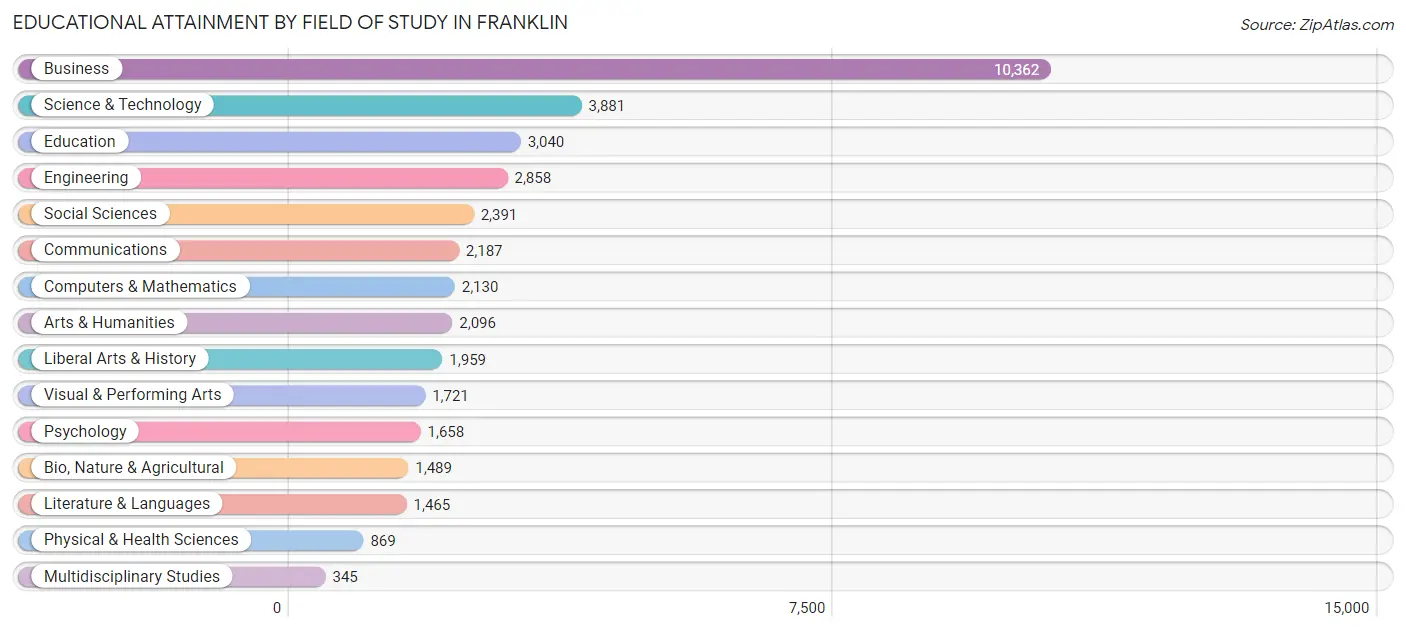
| Field of Study | # Graduates | % Graduates |
| Computers & Mathematics | 2,130 | 5.5% |
| Bio, Nature & Agricultural | 1,489 | 3.9% |
| Physical & Health Sciences | 869 | 2.3% |
| Psychology | 1,658 | 4.3% |
| Social Sciences | 2,391 | 6.2% |
| Engineering | 2,858 | 7.4% |
| Multidisciplinary Studies | 345 | 0.9% |
| Science & Technology | 3,881 | 10.1% |
| Business | 10,362 | 27.0% |
| Education | 3,040 | 7.9% |
| Literature & Languages | 1,465 | 3.8% |
| Liberal Arts & History | 1,959 | 5.1% |
| Visual & Performing Arts | 1,721 | 4.5% |
| Communications | 2,187 | 5.7% |
| Arts & Humanities | 2,096 | 5.4% |
| Total | 38,451 | 100.0% |
Transportation & Commute in Franklin
Vehicle Availability by Sex in Franklin
The most prevalent vehicle ownership categories in Franklin are males with 2 vehicles (12,828, accounting for 55.4%) and females with 2 vehicles (9,880, making up 60.4%).
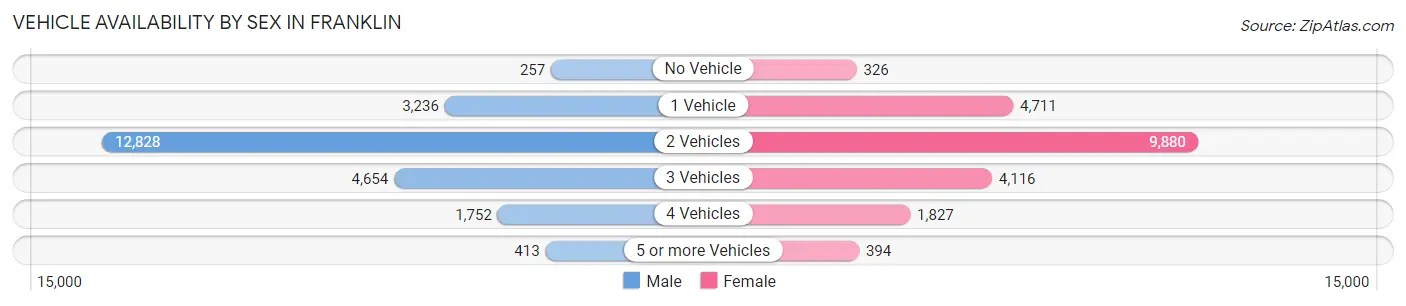
| Vehicles Available | Male | Female |
| No Vehicle | 257 (1.1%) | 326 (1.5%) |
| 1 Vehicle | 3,236 (14.0%) | 4,711 (22.2%) |
| 2 Vehicles | 12,828 (55.4%) | 9,880 (46.5%) |
| 3 Vehicles | 4,654 (20.1%) | 4,116 (19.4%) |
| 4 Vehicles | 1,752 (7.6%) | 1,827 (8.6%) |
| 5 or more Vehicles | 413 (1.8%) | 394 (1.8%) |
| Total | 23,140 (100.0%) | 21,254 (100.0%) |
Commute Time in Franklin
The most frequently occuring commute durations in Franklin are 15 to 19 minutes (5,496 commuters, 16.4%), 10 to 14 minutes (5,258 commuters, 15.7%), and 30 to 34 minutes (4,479 commuters, 13.4%).
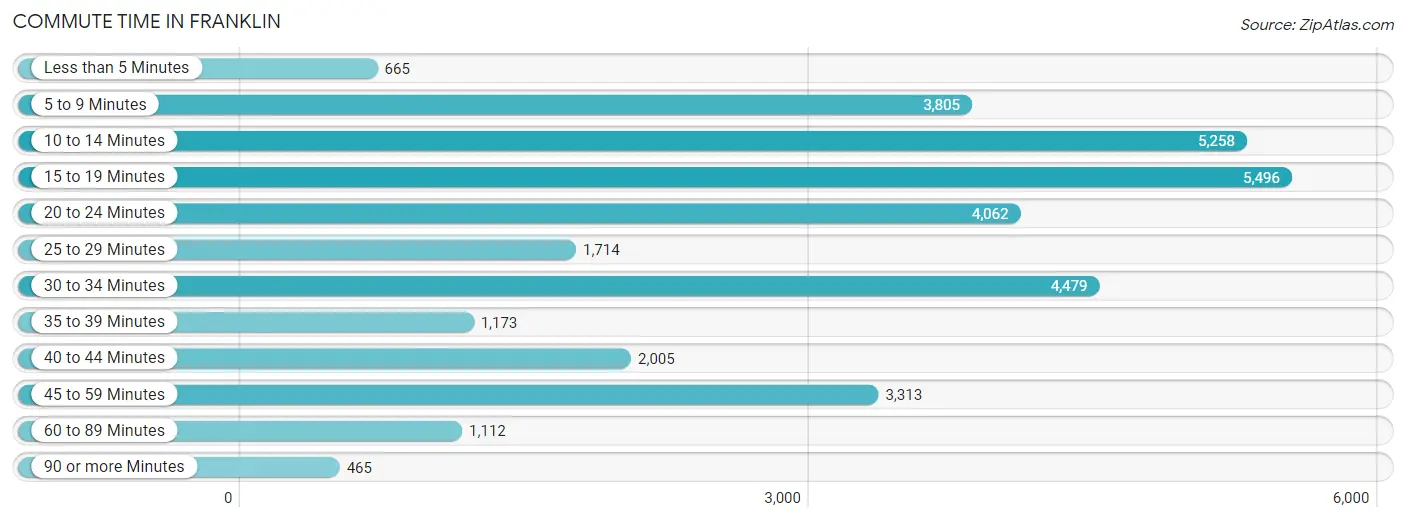
| Commute Time | # Commuters | % Commuters |
| Less than 5 Minutes | 665 | 2.0% |
| 5 to 9 Minutes | 3,805 | 11.3% |
| 10 to 14 Minutes | 5,258 | 15.7% |
| 15 to 19 Minutes | 5,496 | 16.4% |
| 20 to 24 Minutes | 4,062 | 12.1% |
| 25 to 29 Minutes | 1,714 | 5.1% |
| 30 to 34 Minutes | 4,479 | 13.4% |
| 35 to 39 Minutes | 1,173 | 3.5% |
| 40 to 44 Minutes | 2,005 | 6.0% |
| 45 to 59 Minutes | 3,313 | 9.9% |
| 60 to 89 Minutes | 1,112 | 3.3% |
| 90 or more Minutes | 465 | 1.4% |
Commute Time by Sex in Franklin
The most common commute times in Franklin are 10 to 14 minutes (2,613 commuters, 15.1%) for males and 15 to 19 minutes (3,020 commuters, 18.6%) for females.
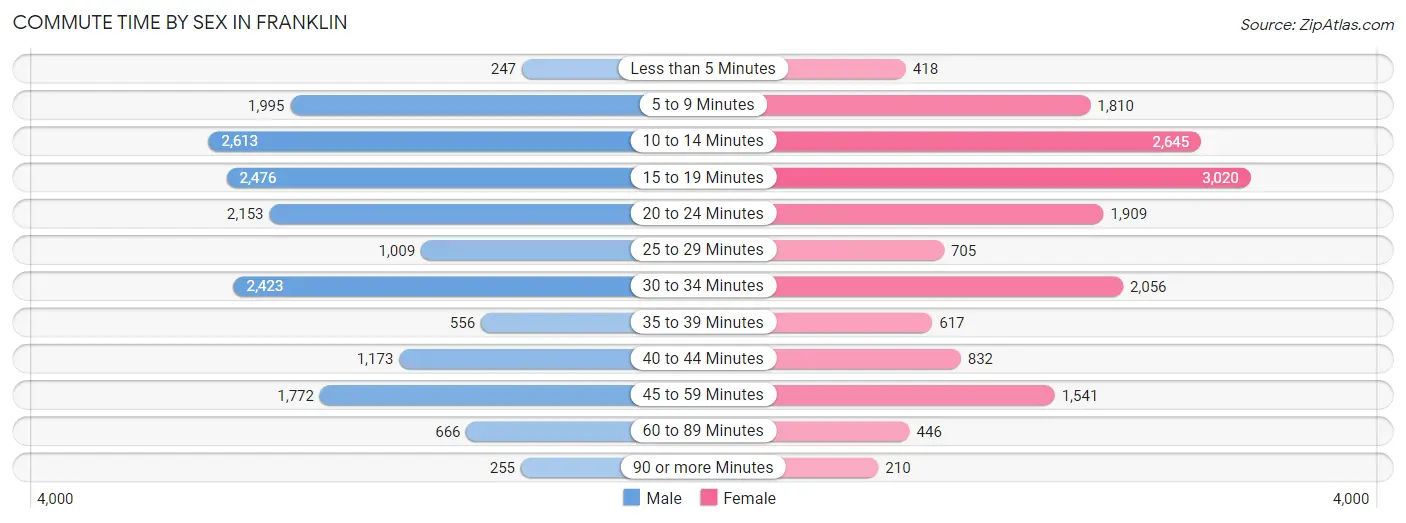
| Commute Time | Male | Female |
| Less than 5 Minutes | 247 (1.4%) | 418 (2.6%) |
| 5 to 9 Minutes | 1,995 (11.5%) | 1,810 (11.2%) |
| 10 to 14 Minutes | 2,613 (15.1%) | 2,645 (16.3%) |
| 15 to 19 Minutes | 2,476 (14.3%) | 3,020 (18.6%) |
| 20 to 24 Minutes | 2,153 (12.4%) | 1,909 (11.8%) |
| 25 to 29 Minutes | 1,009 (5.8%) | 705 (4.3%) |
| 30 to 34 Minutes | 2,423 (14.0%) | 2,056 (12.7%) |
| 35 to 39 Minutes | 556 (3.2%) | 617 (3.8%) |
| 40 to 44 Minutes | 1,173 (6.8%) | 832 (5.1%) |
| 45 to 59 Minutes | 1,772 (10.2%) | 1,541 (9.5%) |
| 60 to 89 Minutes | 666 (3.8%) | 446 (2.8%) |
| 90 or more Minutes | 255 (1.5%) | 210 (1.3%) |
Time of Departure to Work by Sex in Franklin
The most frequent times of departure to work in Franklin are 7:00 AM to 7:29 AM (2,911, 16.8%) for males and 7:00 AM to 7:29 AM (2,670, 16.5%) for females.
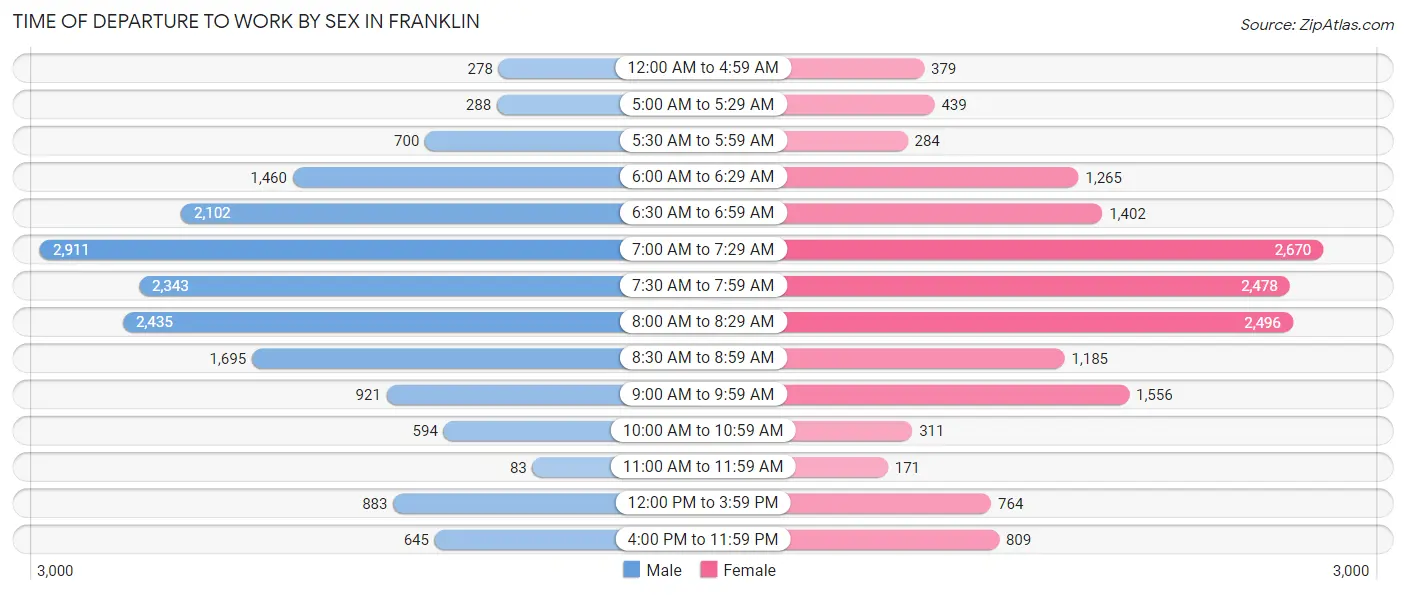
| Time of Departure | Male | Female |
| 12:00 AM to 4:59 AM | 278 (1.6%) | 379 (2.3%) |
| 5:00 AM to 5:29 AM | 288 (1.7%) | 439 (2.7%) |
| 5:30 AM to 5:59 AM | 700 (4.0%) | 284 (1.8%) |
| 6:00 AM to 6:29 AM | 1,460 (8.4%) | 1,265 (7.8%) |
| 6:30 AM to 6:59 AM | 2,102 (12.1%) | 1,402 (8.6%) |
| 7:00 AM to 7:29 AM | 2,911 (16.8%) | 2,670 (16.5%) |
| 7:30 AM to 7:59 AM | 2,343 (13.5%) | 2,478 (15.3%) |
| 8:00 AM to 8:29 AM | 2,435 (14.0%) | 2,496 (15.4%) |
| 8:30 AM to 8:59 AM | 1,695 (9.8%) | 1,185 (7.3%) |
| 9:00 AM to 9:59 AM | 921 (5.3%) | 1,556 (9.6%) |
| 10:00 AM to 10:59 AM | 594 (3.4%) | 311 (1.9%) |
| 11:00 AM to 11:59 AM | 83 (0.5%) | 171 (1.1%) |
| 12:00 PM to 3:59 PM | 883 (5.1%) | 764 (4.7%) |
| 4:00 PM to 11:59 PM | 645 (3.7%) | 809 (5.0%) |
| Total | 17,338 (100.0%) | 16,209 (100.0%) |
Housing Occupancy in Franklin
Occupancy by Ownership in Franklin
Of the total 32,770 dwellings in Franklin, owner-occupied units account for 20,908 (63.8%), while renter-occupied units make up 11,862 (36.2%).
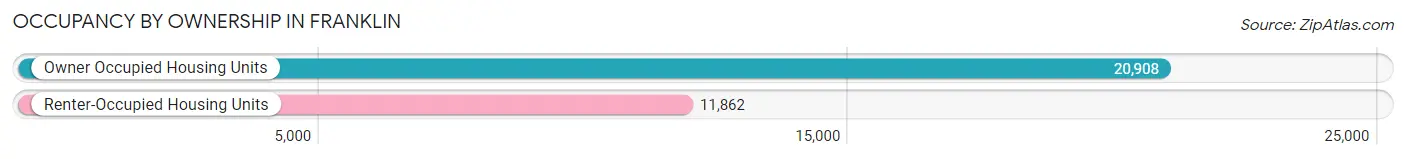
| Occupancy | # Housing Units | % Housing Units |
| Owner Occupied Housing Units | 20,908 | 63.8% |
| Renter-Occupied Housing Units | 11,862 | 36.2% |
| Total Occupied Housing Units | 32,770 | 100.0% |
Occupancy by Household Size in Franklin
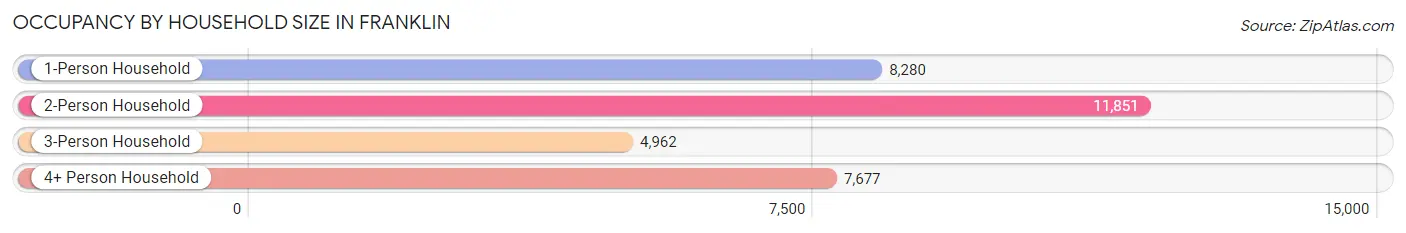
| Household Size | # Housing Units | % Housing Units |
| 1-Person Household | 8,280 | 25.3% |
| 2-Person Household | 11,851 | 36.2% |
| 3-Person Household | 4,962 | 15.1% |
| 4+ Person Household | 7,677 | 23.4% |
| Total Housing Units | 32,770 | 100.0% |
Occupancy by Ownership by Household Size in Franklin
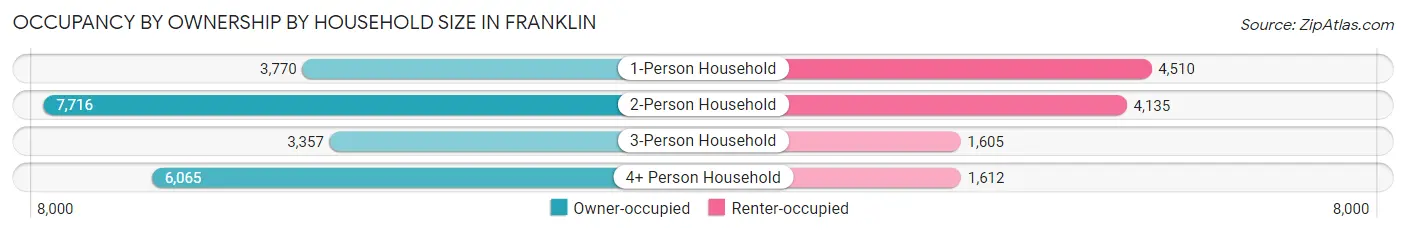
| Household Size | Owner-occupied | Renter-occupied |
| 1-Person Household | 3,770 (45.5%) | 4,510 (54.5%) |
| 2-Person Household | 7,716 (65.1%) | 4,135 (34.9%) |
| 3-Person Household | 3,357 (67.6%) | 1,605 (32.4%) |
| 4+ Person Household | 6,065 (79.0%) | 1,612 (21.0%) |
| Total Housing Units | 20,908 (63.8%) | 11,862 (36.2%) |
Occupancy by Educational Attainment in Franklin
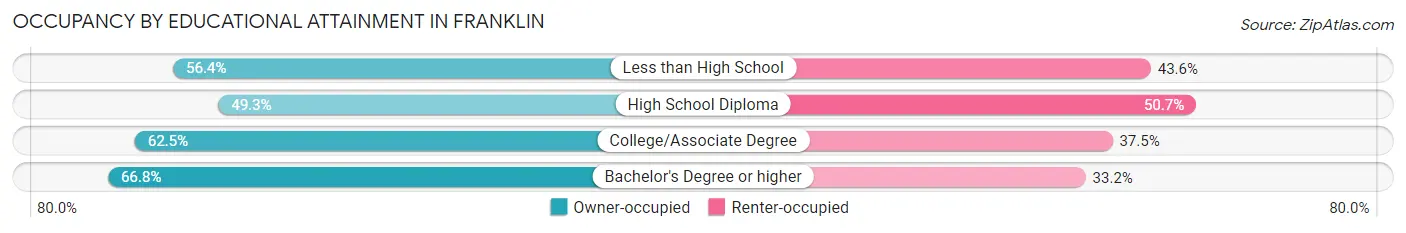
| Household Size | Owner-occupied | Renter-occupied |
| Less than High School | 609 (56.4%) | 470 (43.6%) |
| High School Diploma | 1,618 (49.3%) | 1,666 (50.7%) |
| College/Associate Degree | 4,205 (62.5%) | 2,521 (37.5%) |
| Bachelor's Degree or higher | 14,476 (66.8%) | 7,205 (33.2%) |
Occupancy by Age of Householder in Franklin
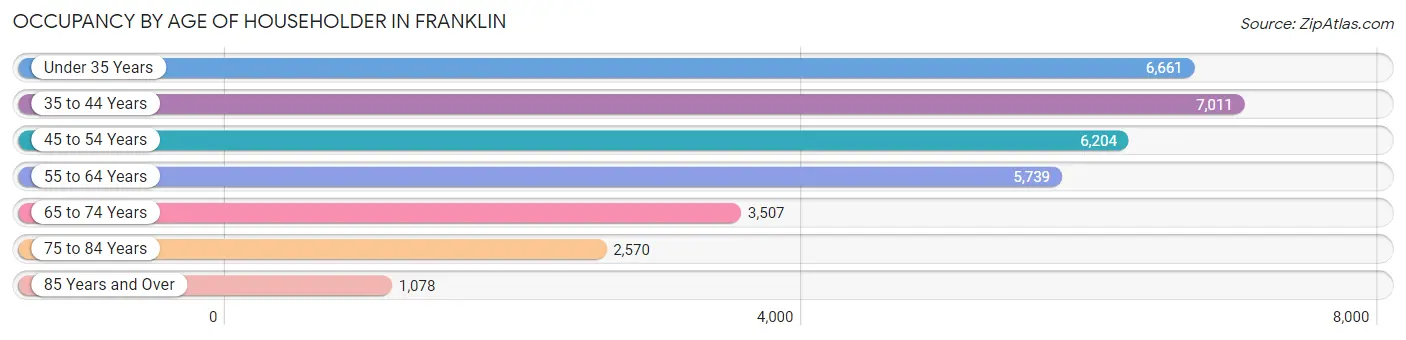
| Age Bracket | # Households | % Households |
| Under 35 Years | 6,661 | 20.3% |
| 35 to 44 Years | 7,011 | 21.4% |
| 45 to 54 Years | 6,204 | 18.9% |
| 55 to 64 Years | 5,739 | 17.5% |
| 65 to 74 Years | 3,507 | 10.7% |
| 75 to 84 Years | 2,570 | 7.8% |
| 85 Years and Over | 1,078 | 3.3% |
| Total | 32,770 | 100.0% |
Housing Finances in Franklin
Median Income by Occupancy in Franklin
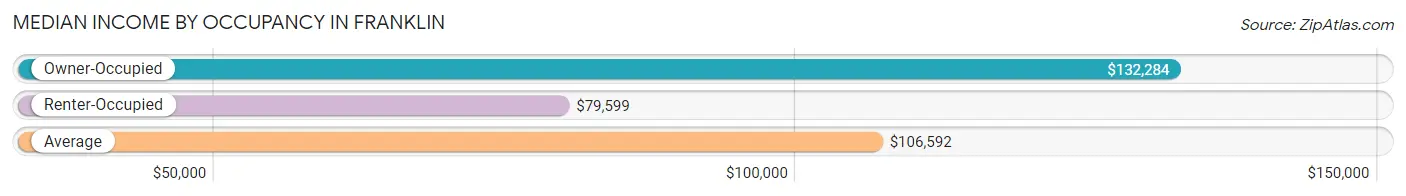
| Occupancy Type | # Households | Median Income |
| Owner-Occupied | 20,908 (63.8%) | $132,284 |
| Renter-Occupied | 11,862 (36.2%) | $79,599 |
| Average | 32,770 (100.0%) | $106,592 |
Occupancy by Householder Income Bracket in Franklin
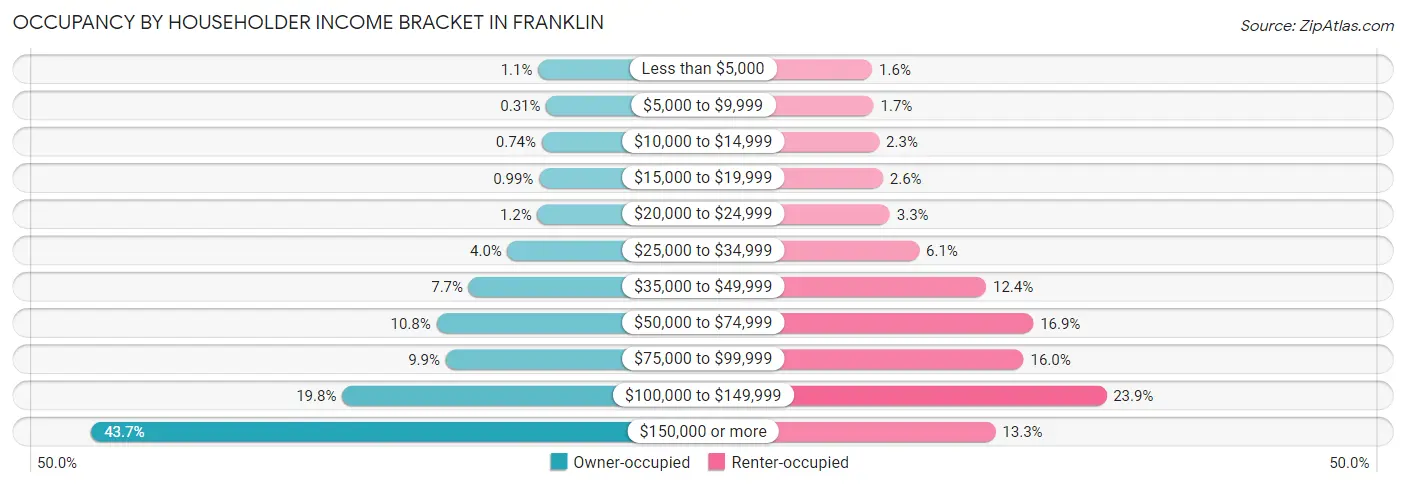
| Income Bracket | Owner-occupied | Renter-occupied |
| Less than $5,000 | 225 (1.1%) | 187 (1.6%) |
| $5,000 to $9,999 | 65 (0.3%) | 204 (1.7%) |
| $10,000 to $14,999 | 154 (0.7%) | 267 (2.2%) |
| $15,000 to $19,999 | 206 (1.0%) | 308 (2.6%) |
| $20,000 to $24,999 | 240 (1.1%) | 388 (3.3%) |
| $25,000 to $34,999 | 834 (4.0%) | 718 (6.0%) |
| $35,000 to $49,999 | 1,608 (7.7%) | 1,474 (12.4%) |
| $50,000 to $74,999 | 2,252 (10.8%) | 2,007 (16.9%) |
| $75,000 to $99,999 | 2,067 (9.9%) | 1,898 (16.0%) |
| $100,000 to $149,999 | 4,130 (19.8%) | 2,831 (23.9%) |
| $150,000 or more | 9,127 (43.6%) | 1,580 (13.3%) |
| Total | 20,908 (100.0%) | 11,862 (100.0%) |
Monthly Housing Cost Tiers in Franklin
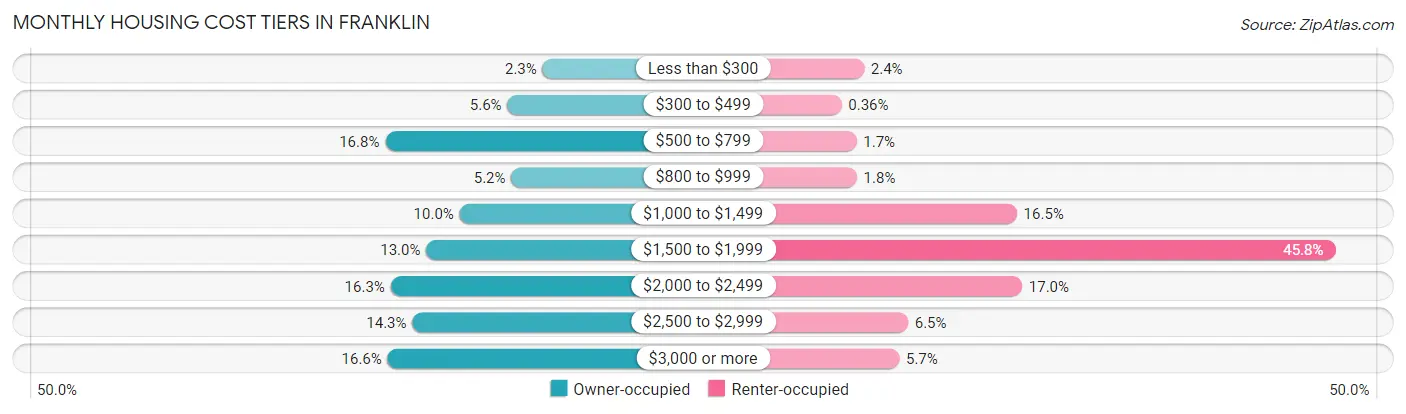
| Monthly Cost | Owner-occupied | Renter-occupied |
| Less than $300 | 483 (2.3%) | 288 (2.4%) |
| $300 to $499 | 1,161 (5.6%) | 43 (0.4%) |
| $500 to $799 | 3,513 (16.8%) | 206 (1.7%) |
| $800 to $999 | 1,085 (5.2%) | 210 (1.8%) |
| $1,000 to $1,499 | 2,080 (10.0%) | 1,957 (16.5%) |
| $1,500 to $1,999 | 2,722 (13.0%) | 5,436 (45.8%) |
| $2,000 to $2,499 | 3,409 (16.3%) | 2,014 (17.0%) |
| $2,500 to $2,999 | 2,989 (14.3%) | 769 (6.5%) |
| $3,000 or more | 3,466 (16.6%) | 672 (5.7%) |
| Total | 20,908 (100.0%) | 11,862 (100.0%) |
Physical Housing Characteristics in Franklin
Housing Structures in Franklin
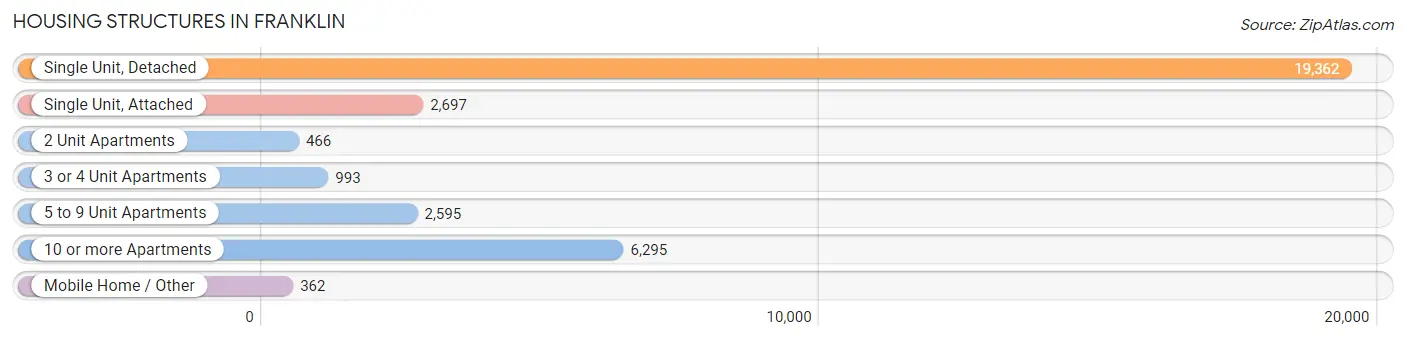
| Structure Type | # Housing Units | % Housing Units |
| Single Unit, Detached | 19,362 | 59.1% |
| Single Unit, Attached | 2,697 | 8.2% |
| 2 Unit Apartments | 466 | 1.4% |
| 3 or 4 Unit Apartments | 993 | 3.0% |
| 5 to 9 Unit Apartments | 2,595 | 7.9% |
| 10 or more Apartments | 6,295 | 19.2% |
| Mobile Home / Other | 362 | 1.1% |
| Total | 32,770 | 100.0% |
Housing Structures by Occupancy in Franklin
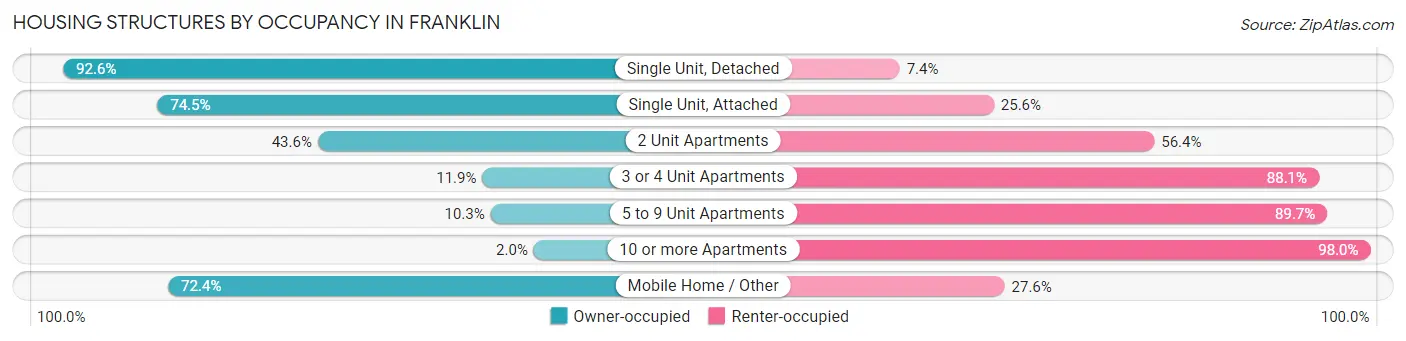
| Structure Type | Owner-occupied | Renter-occupied |
| Single Unit, Detached | 17,926 (92.6%) | 1,436 (7.4%) |
| Single Unit, Attached | 2,008 (74.5%) | 689 (25.6%) |
| 2 Unit Apartments | 203 (43.6%) | 263 (56.4%) |
| 3 or 4 Unit Apartments | 118 (11.9%) | 875 (88.1%) |
| 5 to 9 Unit Apartments | 267 (10.3%) | 2,328 (89.7%) |
| 10 or more Apartments | 124 (2.0%) | 6,171 (98.0%) |
| Mobile Home / Other | 262 (72.4%) | 100 (27.6%) |
| Total | 20,908 (63.8%) | 11,862 (36.2%) |
Housing Structures by Number of Rooms in Franklin
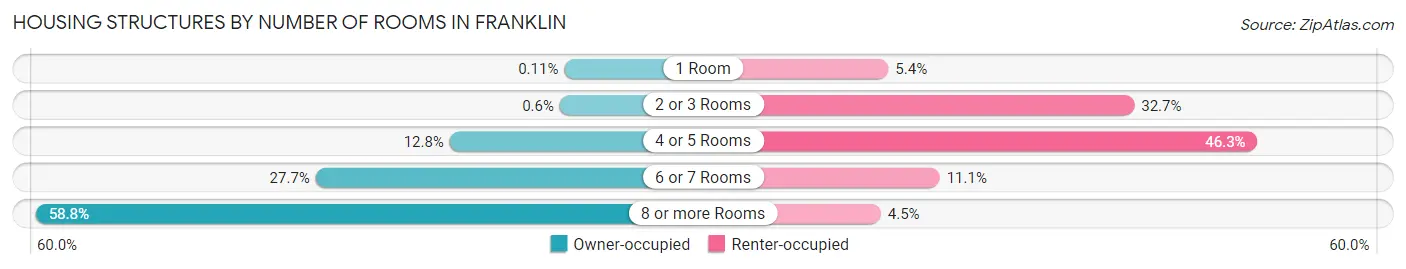
| Number of Rooms | Owner-occupied | Renter-occupied |
| 1 Room | 24 (0.1%) | 638 (5.4%) |
| 2 or 3 Rooms | 126 (0.6%) | 3,875 (32.7%) |
| 4 or 5 Rooms | 2,681 (12.8%) | 5,496 (46.3%) |
| 6 or 7 Rooms | 5,791 (27.7%) | 1,314 (11.1%) |
| 8 or more Rooms | 12,286 (58.8%) | 539 (4.5%) |
| Total | 20,908 (100.0%) | 11,862 (100.0%) |
Housing Structure by Heating Type in Franklin
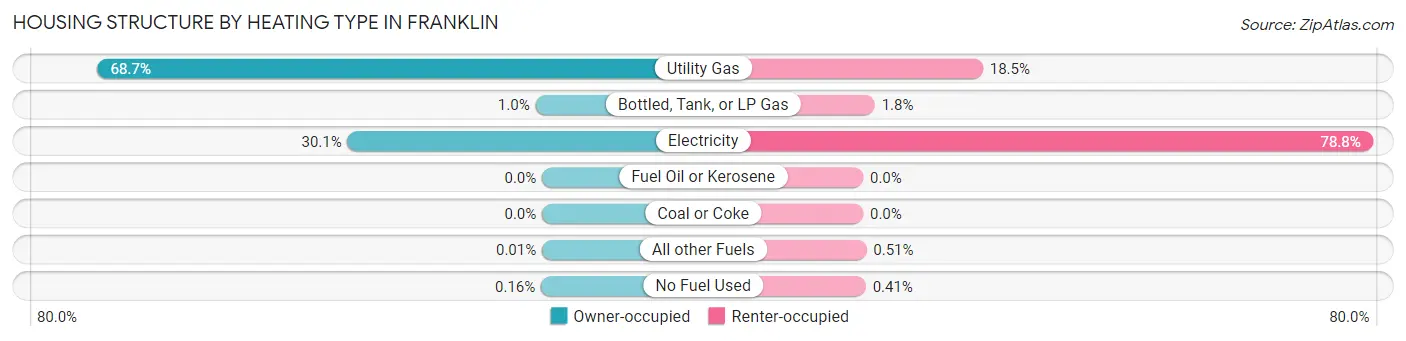
| Heating Type | Owner-occupied | Renter-occupied |
| Utility Gas | 14,371 (68.7%) | 2,196 (18.5%) |
| Bottled, Tank, or LP Gas | 213 (1.0%) | 213 (1.8%) |
| Electricity | 6,287 (30.1%) | 9,344 (78.8%) |
| Fuel Oil or Kerosene | 0 (0.0%) | 0 (0.0%) |
| Coal or Coke | 0 (0.0%) | 0 (0.0%) |
| All other Fuels | 3 (0.0%) | 60 (0.5%) |
| No Fuel Used | 34 (0.2%) | 49 (0.4%) |
| Total | 20,908 (100.0%) | 11,862 (100.0%) |
Household Vehicle Usage in Franklin
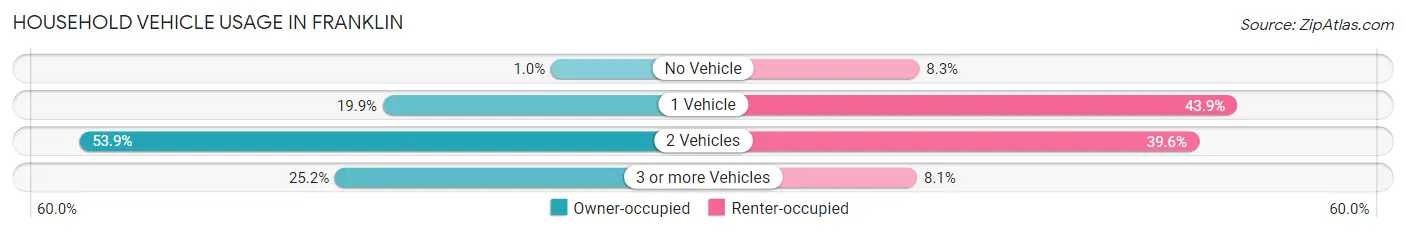
| Vehicles per Household | Owner-occupied | Renter-occupied |
| No Vehicle | 215 (1.0%) | 989 (8.3%) |
| 1 Vehicle | 4,153 (19.9%) | 5,212 (43.9%) |
| 2 Vehicles | 11,265 (53.9%) | 4,702 (39.6%) |
| 3 or more Vehicles | 5,275 (25.2%) | 959 (8.1%) |
| Total | 20,908 (100.0%) | 11,862 (100.0%) |
Real Estate & Mortgages in Franklin
Real Estate and Mortgage Overview in Franklin
| Characteristic | Without Mortgage | With Mortgage |
| Housing Units | 6,308 | 14,600 |
| Median Property Value | $533,100 | $587,500 |
| Median Household Income | $89,148 | $7,352 |
| Monthly Housing Costs | $658 | $3,440 |
| Real Estate Taxes | $2,726 | $140 |
Property Value by Mortgage Status in Franklin
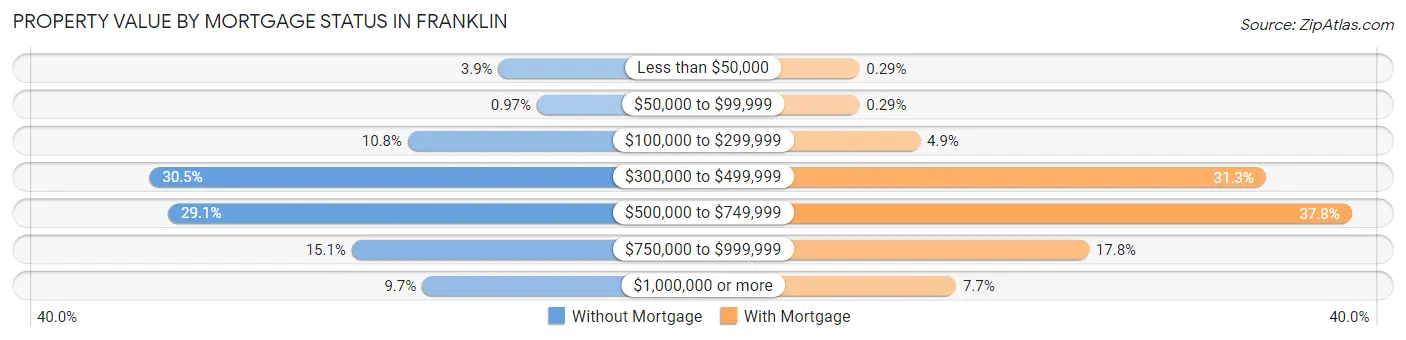
| Property Value | Without Mortgage | With Mortgage |
| Less than $50,000 | 246 (3.9%) | 43 (0.3%) |
| $50,000 to $99,999 | 61 (1.0%) | 42 (0.3%) |
| $100,000 to $299,999 | 681 (10.8%) | 719 (4.9%) |
| $300,000 to $499,999 | 1,923 (30.5%) | 4,564 (31.3%) |
| $500,000 to $749,999 | 1,833 (29.1%) | 5,519 (37.8%) |
| $750,000 to $999,999 | 951 (15.1%) | 2,596 (17.8%) |
| $1,000,000 or more | 613 (9.7%) | 1,117 (7.6%) |
| Total | 6,308 (100.0%) | 14,600 (100.0%) |
Household Income by Mortgage Status in Franklin
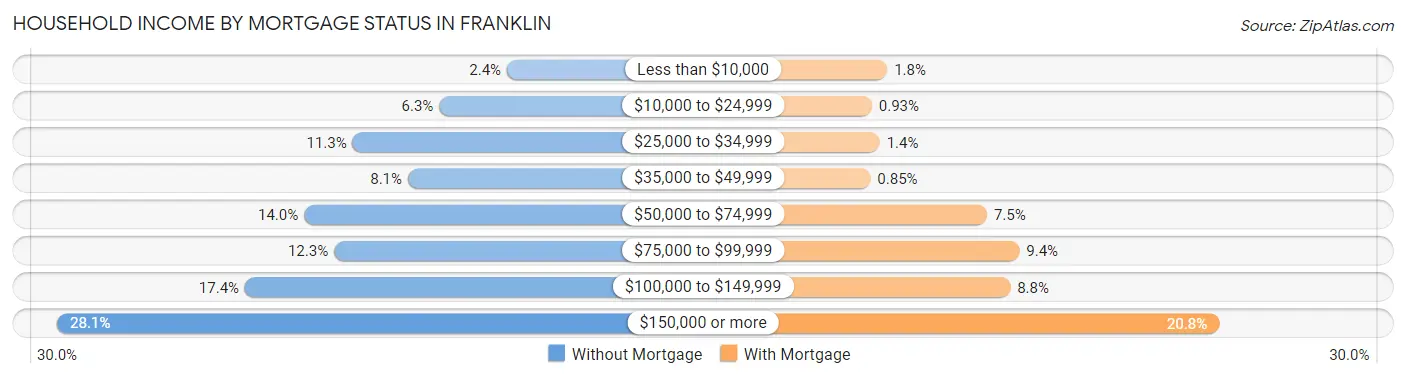
| Household Income | Without Mortgage | With Mortgage |
| Less than $10,000 | 154 (2.4%) | 264 (1.8%) |
| $10,000 to $24,999 | 398 (6.3%) | 136 (0.9%) |
| $25,000 to $34,999 | 710 (11.3%) | 202 (1.4%) |
| $35,000 to $49,999 | 511 (8.1%) | 124 (0.9%) |
| $50,000 to $74,999 | 885 (14.0%) | 1,097 (7.5%) |
| $75,000 to $99,999 | 777 (12.3%) | 1,367 (9.4%) |
| $100,000 to $149,999 | 1,098 (17.4%) | 1,290 (8.8%) |
| $150,000 or more | 1,775 (28.1%) | 3,032 (20.8%) |
| Total | 6,308 (100.0%) | 14,600 (100.0%) |
Property Value to Household Income Ratio in Franklin
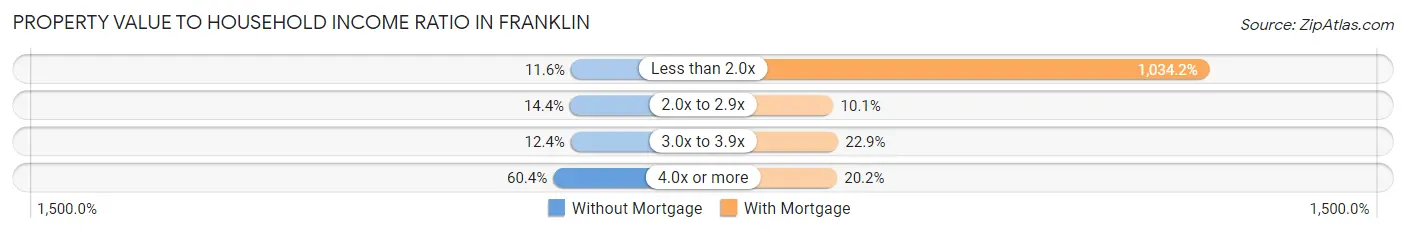
| Value-to-Income Ratio | Without Mortgage | With Mortgage |
| Less than 2.0x | 732 (11.6%) | 150,992 (1,034.2%) |
| 2.0x to 2.9x | 906 (14.4%) | 1,474 (10.1%) |
| 3.0x to 3.9x | 784 (12.4%) | 3,349 (22.9%) |
| 4.0x or more | 3,807 (60.4%) | 2,949 (20.2%) |
| Total | 6,308 (100.0%) | 14,600 (100.0%) |
Real Estate Taxes by Mortgage Status in Franklin
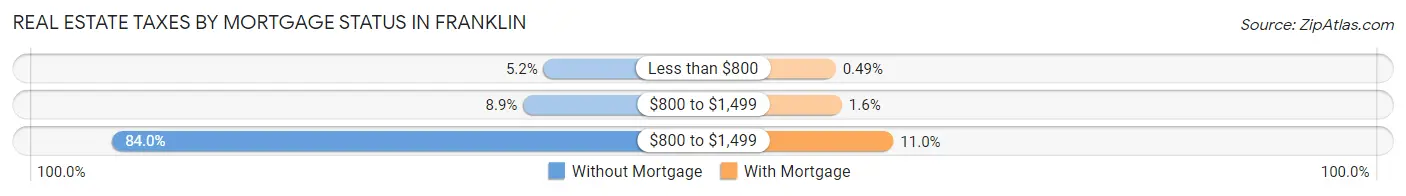
| Property Taxes | Without Mortgage | With Mortgage |
| Less than $800 | 329 (5.2%) | 71 (0.5%) |
| $800 to $1,499 | 563 (8.9%) | 237 (1.6%) |
| $800 to $1,499 | 5,298 (84.0%) | 1,609 (11.0%) |
| Total | 6,308 (100.0%) | 14,600 (100.0%) |
Health & Disability in Franklin
Health Insurance Coverage by Age in Franklin
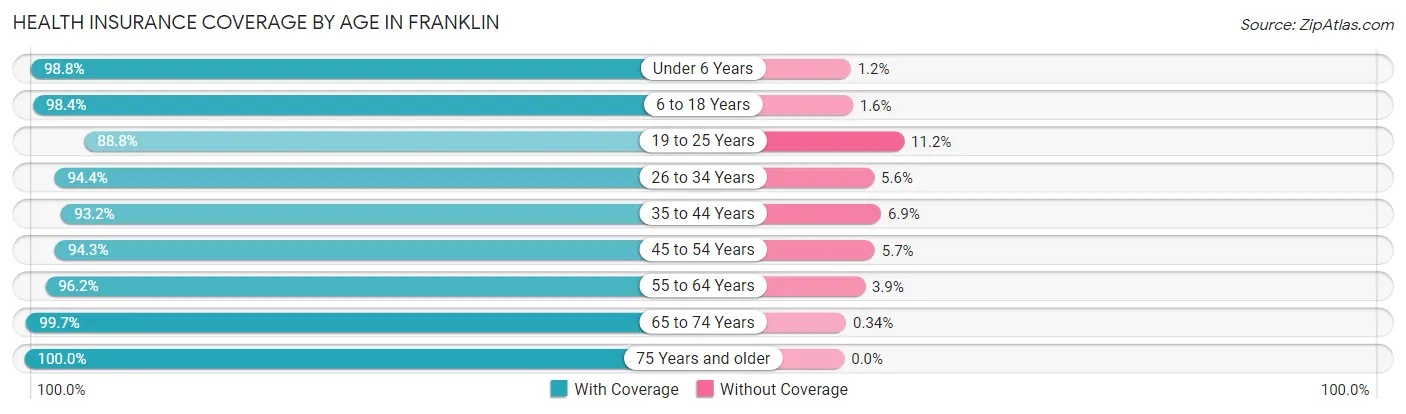
| Age Bracket | With Coverage | Without Coverage |
| Under 6 Years | 6,257 (98.8%) | 76 (1.2%) |
| 6 to 18 Years | 14,840 (98.4%) | 238 (1.6%) |
| 19 to 25 Years | 6,403 (88.8%) | 804 (11.2%) |
| 26 to 34 Years | 8,819 (94.4%) | 520 (5.6%) |
| 35 to 44 Years | 12,094 (93.1%) | 890 (6.9%) |
| 45 to 54 Years | 10,773 (94.3%) | 650 (5.7%) |
| 55 to 64 Years | 9,164 (96.2%) | 367 (3.8%) |
| 65 to 74 Years | 5,915 (99.7%) | 20 (0.3%) |
| 75 Years and older | 5,356 (100.0%) | 0 (0.0%) |
| Total | 79,621 (95.7%) | 3,565 (4.3%) |
Health Insurance Coverage by Citizenship Status in Franklin
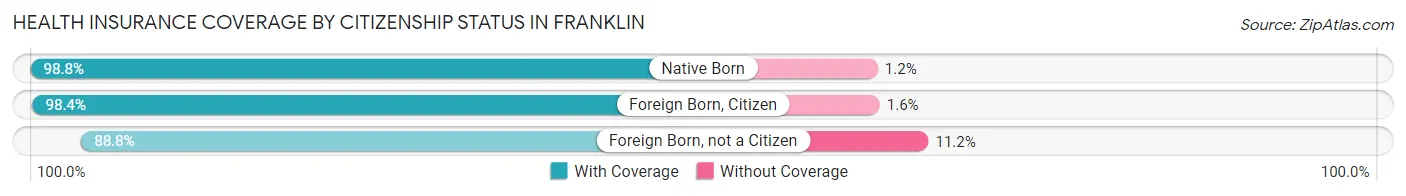
| Citizenship Status | With Coverage | Without Coverage |
| Native Born | 6,257 (98.8%) | 76 (1.2%) |
| Foreign Born, Citizen | 14,840 (98.4%) | 238 (1.6%) |
| Foreign Born, not a Citizen | 6,403 (88.8%) | 804 (11.2%) |
Health Insurance Coverage by Household Income in Franklin
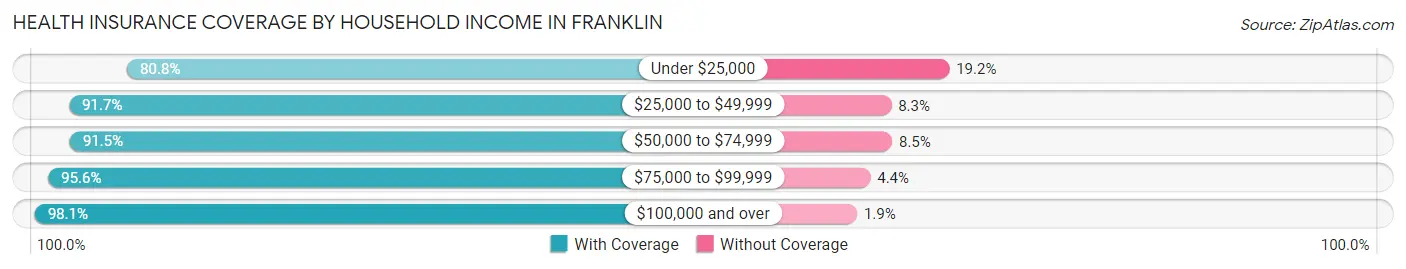
| Household Income | With Coverage | Without Coverage |
| Under $25,000 | 2,982 (80.8%) | 708 (19.2%) |
| $25,000 to $49,999 | 7,509 (91.7%) | 681 (8.3%) |
| $50,000 to $74,999 | 8,065 (91.5%) | 747 (8.5%) |
| $75,000 to $99,999 | 9,187 (95.6%) | 423 (4.4%) |
| $100,000 and over | 51,868 (98.1%) | 1,006 (1.9%) |
Public vs Private Health Insurance Coverage by Age in Franklin
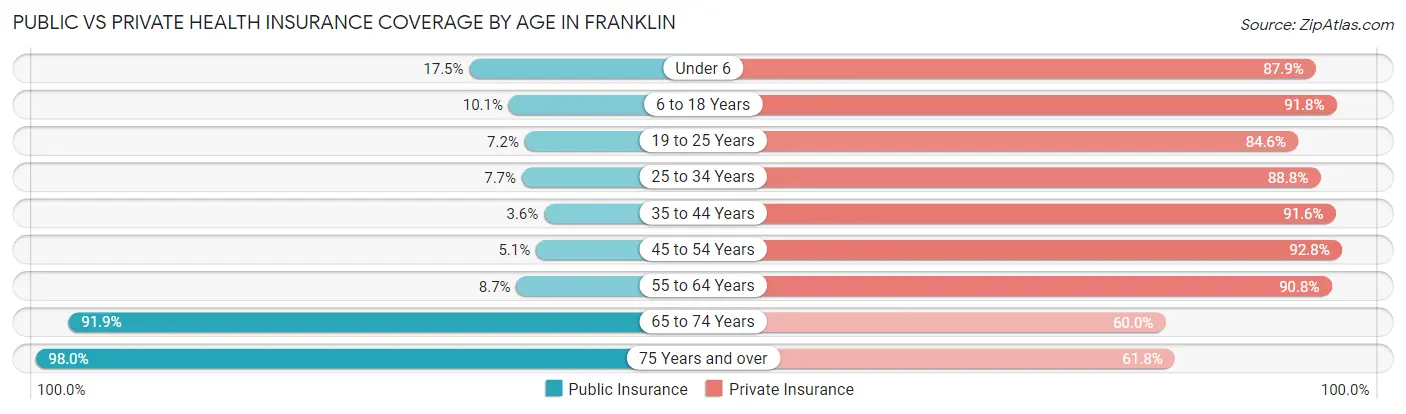
| Age Bracket | Public Insurance | Private Insurance |
| Under 6 | 1,105 (17.4%) | 5,568 (87.9%) |
| 6 to 18 Years | 1,528 (10.1%) | 13,838 (91.8%) |
| 19 to 25 Years | 517 (7.2%) | 6,100 (84.6%) |
| 25 to 34 Years | 719 (7.7%) | 8,288 (88.7%) |
| 35 to 44 Years | 464 (3.6%) | 11,895 (91.6%) |
| 45 to 54 Years | 579 (5.1%) | 10,596 (92.8%) |
| 55 to 64 Years | 830 (8.7%) | 8,658 (90.8%) |
| 65 to 74 Years | 5,453 (91.9%) | 3,562 (60.0%) |
| 75 Years and over | 5,249 (98.0%) | 3,309 (61.8%) |
| Total | 16,444 (19.8%) | 71,814 (86.3%) |
Disability Status by Sex by Age in Franklin
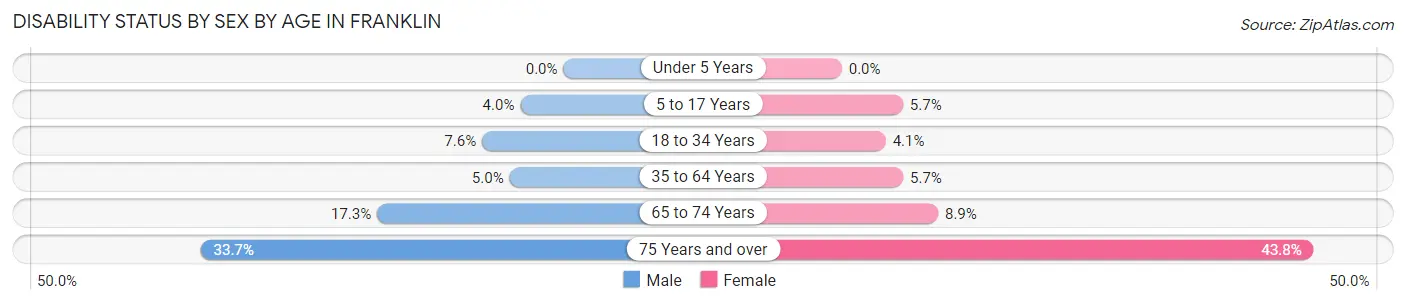
| Age Bracket | Male | Female |
| Under 5 Years | 0 (0.0%) | 0 (0.0%) |
| 5 to 17 Years | 297 (4.0%) | 424 (5.7%) |
| 18 to 34 Years | 608 (7.5%) | 386 (4.1%) |
| 35 to 64 Years | 825 (5.0%) | 993 (5.7%) |
| 65 to 74 Years | 451 (17.3%) | 297 (8.9%) |
| 75 Years and over | 728 (33.7%) | 1,398 (43.8%) |
Disability Class by Sex by Age in Franklin
Disability Class: Hearing Difficulty
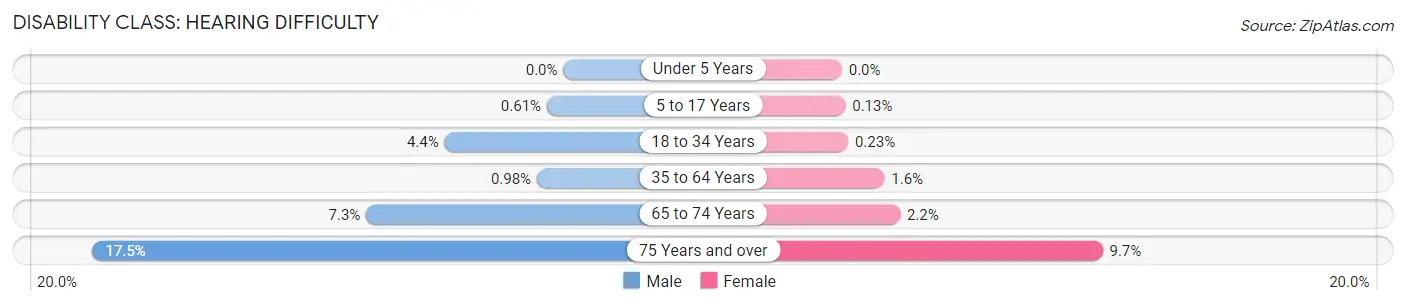
| Age Bracket | Male | Female |
| Under 5 Years | 0 (0.0%) | 0 (0.0%) |
| 5 to 17 Years | 45 (0.6%) | 10 (0.1%) |
| 18 to 34 Years | 355 (4.4%) | 22 (0.2%) |
| 35 to 64 Years | 162 (1.0%) | 276 (1.6%) |
| 65 to 74 Years | 191 (7.3%) | 72 (2.2%) |
| 75 Years and over | 378 (17.5%) | 309 (9.7%) |
Disability Class: Vision Difficulty
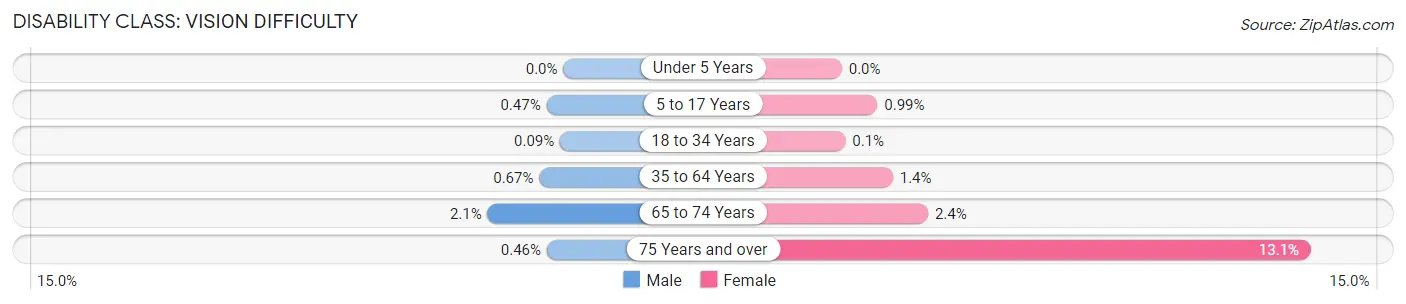
| Age Bracket | Male | Female |
| Under 5 Years | 0 (0.0%) | 0 (0.0%) |
| 5 to 17 Years | 35 (0.5%) | 74 (1.0%) |
| 18 to 34 Years | 7 (0.1%) | 9 (0.1%) |
| 35 to 64 Years | 111 (0.7%) | 247 (1.4%) |
| 65 to 74 Years | 55 (2.1%) | 80 (2.4%) |
| 75 Years and over | 10 (0.5%) | 417 (13.1%) |
Disability Class: Cognitive Difficulty
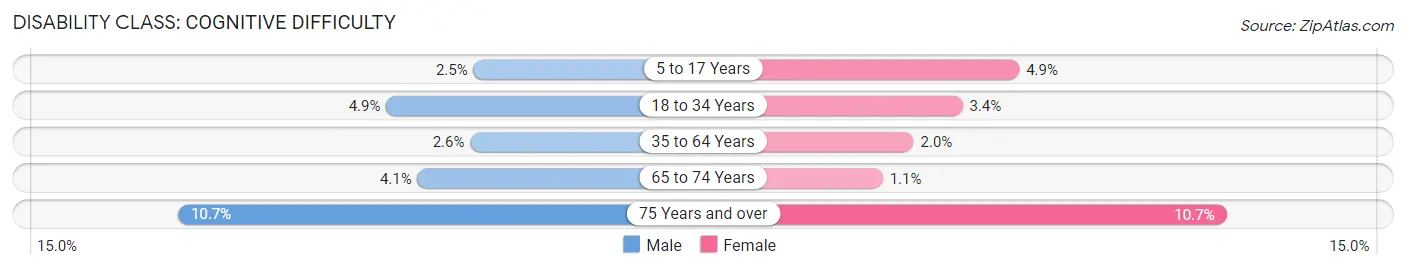
| Age Bracket | Male | Female |
| 5 to 17 Years | 186 (2.5%) | 369 (4.9%) |
| 18 to 34 Years | 397 (4.9%) | 318 (3.4%) |
| 35 to 64 Years | 428 (2.6%) | 349 (2.0%) |
| 65 to 74 Years | 106 (4.1%) | 38 (1.1%) |
| 75 Years and over | 232 (10.7%) | 342 (10.7%) |
Disability Class: Ambulatory Difficulty
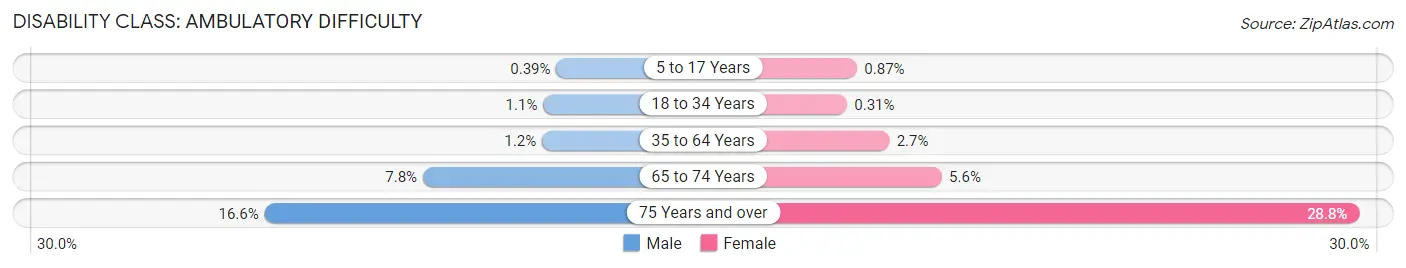
| Age Bracket | Male | Female |
| 5 to 17 Years | 29 (0.4%) | 65 (0.9%) |
| 18 to 34 Years | 90 (1.1%) | 29 (0.3%) |
| 35 to 64 Years | 197 (1.2%) | 466 (2.7%) |
| 65 to 74 Years | 204 (7.8%) | 186 (5.6%) |
| 75 Years and over | 360 (16.6%) | 920 (28.8%) |
Disability Class: Self-Care Difficulty
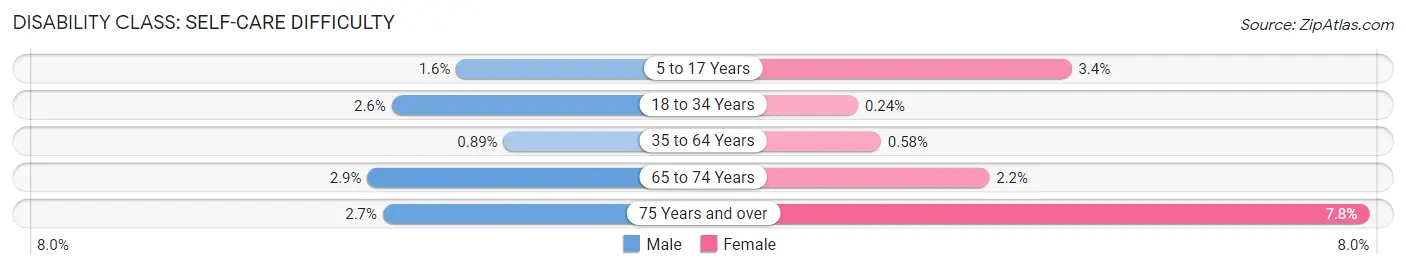
| Age Bracket | Male | Female |
| 5 to 17 Years | 118 (1.6%) | 255 (3.4%) |
| 18 to 34 Years | 205 (2.5%) | 23 (0.2%) |
| 35 to 64 Years | 147 (0.9%) | 102 (0.6%) |
| 65 to 74 Years | 76 (2.9%) | 73 (2.2%) |
| 75 Years and over | 58 (2.7%) | 250 (7.8%) |
Technology Access in Franklin
Computing Device Access in Franklin
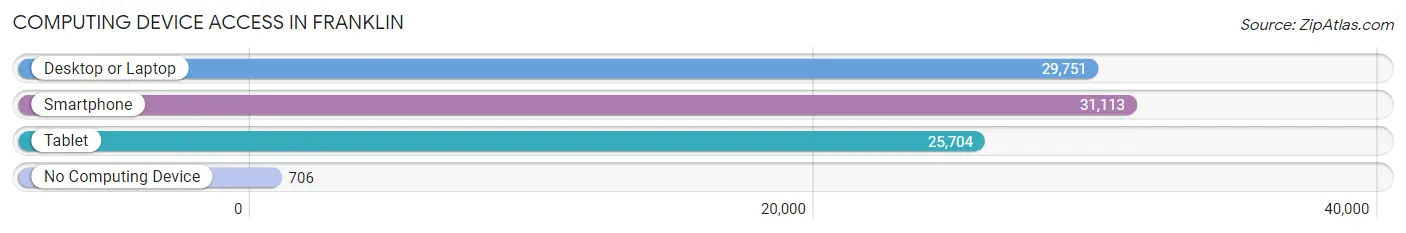
| Device Type | # Households | % Households |
| Desktop or Laptop | 29,751 | 90.8% |
| Smartphone | 31,113 | 94.9% |
| Tablet | 25,704 | 78.4% |
| No Computing Device | 706 | 2.1% |
| Total | 32,770 | 100.0% |
Internet Access in Franklin
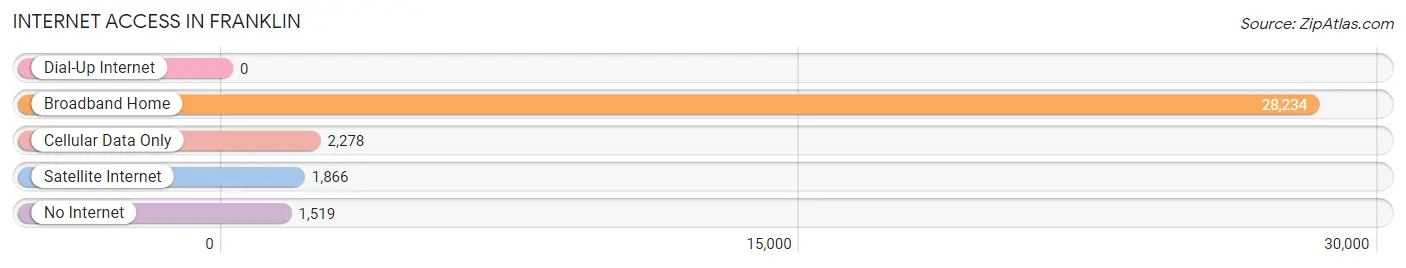
| Internet Type | # Households | % Households |
| Dial-Up Internet | 0 | 0.0% |
| Broadband Home | 28,234 | 86.2% |
| Cellular Data Only | 2,278 | 7.0% |
| Satellite Internet | 1,866 | 5.7% |
| No Internet | 1,519 | 4.6% |
| Total | 32,770 | 100.0% |
Franklin Summary
Franklin, Tennessee is a city located in Williamson County, Tennessee, United States. It is part of the Nashville metropolitan area and is located about 21 miles south of downtown Nashville. The population of Franklin was 62,487 as of the 2019 census, making it the seventh-largest city in Tennessee.
History
The area now known as Franklin was first settled by Europeans in 1799, when Dr. Hugh Williamson of North Carolina purchased land from the local Native Americans. The town was named after Benjamin Franklin, and was officially incorporated in 1807. During the Civil War, Franklin was the site of a major battle in November 1864, known as the Battle of Franklin. The Confederate Army was defeated, and the town was occupied by Union forces for the remainder of the war.
After the war, Franklin experienced a period of growth and prosperity. The town was connected to Nashville by the Nashville and Decatur Railroad in 1871, and the city was incorporated in 1887. In the early 20th century, Franklin became a popular destination for tourists, and the city's population grew rapidly.
Geography
Franklin is located in central Tennessee, about 21 miles south of downtown Nashville. The city is situated on the Harpeth River, and is surrounded by rolling hills and forests. The city has a total area of 33.3 square miles, of which 33.2 square miles is land and 0.1 square miles is water.
Economy
Franklin is a major economic center in the Nashville metropolitan area. The city is home to several large companies, including Nissan North America, Community Health Systems, and Mars Petcare. The city is also home to several major shopping centers, including CoolSprings Galleria and The Factory at Franklin.
Franklin is also home to several major educational institutions, including O'More College of Design, Belmont University, and Columbia State Community College. The city is also home to several major healthcare facilities, including Williamson Medical Center and Vanderbilt University Medical Center.
Demographics
As of the 2019 census, the population of Franklin was 62,487. The racial makeup of the city was 81.2% White, 11.3% African American, 0.3% Native American, 3.2% Asian, 0.1% Pacific Islander, 1.7% from other races, and 2.4% from two or more races. Hispanic or Latino of any race were 5.2% of the population.
The median income for a household in Franklin was $76,845, and the median income for a family was $90,945. The per capita income for the city was $37,945. About 8.2% of families and 10.3% of the population were below the poverty line, including 14.2% of those under age 18 and 6.2% of those age 65 or over.
Common Questions
What is Per Capita Income in Franklin?
Per Capita income in Franklin is $54,946.
What is the Median Family Income in Franklin?
Median Family Income in Franklin is $132,795.
What is the Median Household income in Franklin?
Median Household Income in Franklin is $106,592.
What is Income or Wage Gap in Franklin?
Income or Wage Gap in Franklin is 40.0%.
Women in Franklin earn 60.0 cents for every dollar earned by a man.
What is Inequality or Gini Index in Franklin?
Inequality or Gini Index in Franklin is 0.42.
What is the Total Population of Franklin?
Total Population of Franklin is 83,630.
What is the Total Male Population of Franklin?
Total Male Population of Franklin is 39,784.
What is the Total Female Population of Franklin?
Total Female Population of Franklin is 43,846.
What is the Ratio of Males per 100 Females in Franklin?
There are 90.74 Males per 100 Females in Franklin.
What is the Ratio of Females per 100 Males in Franklin?
There are 110.21 Females per 100 Males in Franklin.
What is the Median Population Age in Franklin?
Median Population Age in Franklin is 37.8 Years.
What is the Average Family Size in Franklin
Average Family Size in Franklin is 3.1 People.
What is the Average Household Size in Franklin
Average Household Size in Franklin is 2.5 People.
How Large is the Labor Force in Franklin?
There are 45,904 People in the Labor Forcein in Franklin.
What is the Percentage of People in the Labor Force in Franklin?
70.2% of People are in the Labor Force in Franklin.
What is the Unemployment Rate in Franklin?
Unemployment Rate in Franklin is 2.6%.