South Jordan, UT Map & Demographics
South Jordan Map
South Jordan Overview
$47,443
PER CAPITA INCOME
$134,155
AVG FAMILY INCOME
$119,822
AVG HOUSEHOLD INCOME
45.4%
WAGE / INCOME GAP [ % ]
54.6¢/ $1
WAGE / INCOME GAP [ $ ]
$9,398
FAMILY INCOME DEFICIT
0.38
INEQUALITY / GINI INDEX
78,118
TOTAL POPULATION
37,724
MALE POPULATION
40,394
FEMALE POPULATION
93.39
MALES / 100 FEMALES
107.08
FEMALES / 100 MALES
34.4
MEDIAN AGE
3.6
AVG FAMILY SIZE
3.2
AVG HOUSEHOLD SIZE
40,461
LABOR FORCE [ PEOPLE ]
70.9%
PERCENT IN LABOR FORCE
2.5%
UNEMPLOYMENT RATE
Income in South Jordan
Income Overview in South Jordan
Per Capita Income in South Jordan is $47,443, while median incomes of families and households are $134,155 and $119,822 respectively.
| Characteristic | Number | Measure |
| Per Capita Income | 78,118 | $47,443 |
| Median Family Income | 19,293 | $134,155 |
| Mean Family Income | 19,293 | $165,609 |
| Median Household Income | 24,429 | $119,822 |
| Mean Household Income | 24,429 | $149,113 |
| Income Deficit | 19,293 | $9,398 |
| Wage / Income Gap (%) | 78,118 | 45.42% |
| Wage / Income Gap ($) | 78,118 | 54.58¢ per $1 |
| Gini / Inequality Index | 78,118 | 0.38 |
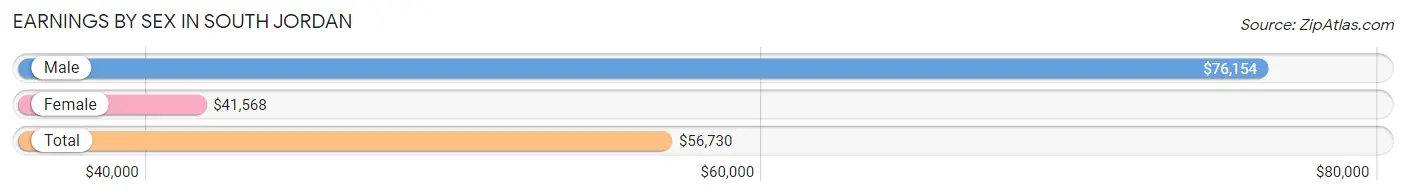
Earnings by Sex in South Jordan
Average Earnings in South Jordan are $56,730, $76,154 for men and $41,568 for women, a difference of 45.4%.
| Sex | Number | Average Earnings |
| Male | 22,799 (54.1%) | $76,154 |
| Female | 19,337 (45.9%) | $41,568 |
| Total | 42,136 (100.0%) | $56,730 |
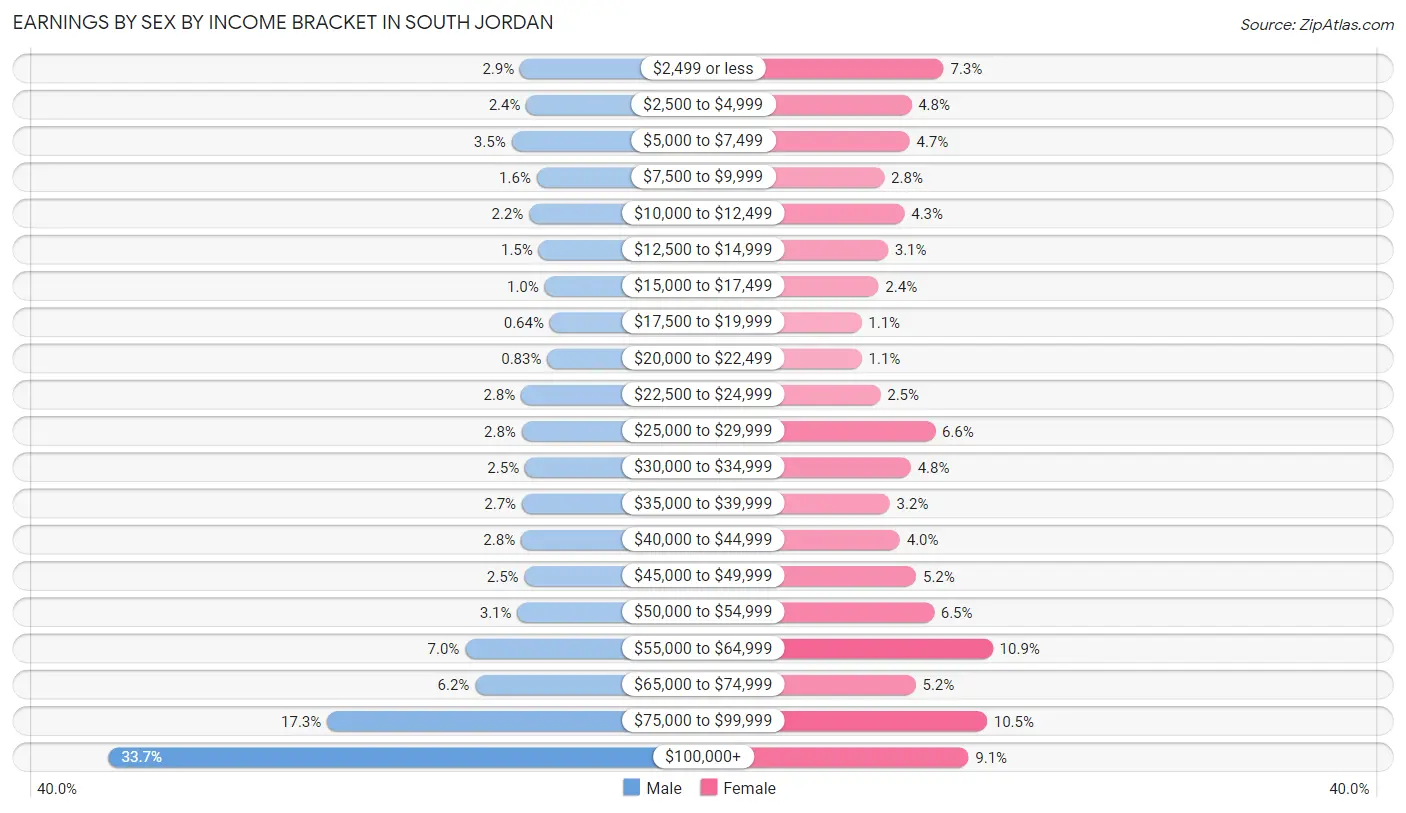
Earnings by Sex by Income Bracket in South Jordan
The most common earnings brackets in South Jordan are $100,000+ for men (7,684 | 33.7%) and $55,000 to $64,999 for women (2,113 | 10.9%).
| Income | Male | Female |
| $2,499 or less | 654 (2.9%) | 1,401 (7.2%) |
| $2,500 to $4,999 | 548 (2.4%) | 934 (4.8%) |
| $5,000 to $7,499 | 801 (3.5%) | 908 (4.7%) |
| $7,500 to $9,999 | 370 (1.6%) | 542 (2.8%) |
| $10,000 to $12,499 | 499 (2.2%) | 833 (4.3%) |
| $12,500 to $14,999 | 338 (1.5%) | 593 (3.1%) |
| $15,000 to $17,499 | 235 (1.0%) | 459 (2.4%) |
| $17,500 to $19,999 | 147 (0.6%) | 211 (1.1%) |
| $20,000 to $22,499 | 189 (0.8%) | 214 (1.1%) |
| $22,500 to $24,999 | 637 (2.8%) | 485 (2.5%) |
| $25,000 to $29,999 | 626 (2.8%) | 1,279 (6.6%) |
| $30,000 to $34,999 | 570 (2.5%) | 927 (4.8%) |
| $35,000 to $39,999 | 623 (2.7%) | 621 (3.2%) |
| $40,000 to $44,999 | 638 (2.8%) | 767 (4.0%) |
| $45,000 to $49,999 | 580 (2.5%) | 1,003 (5.2%) |
| $50,000 to $54,999 | 699 (3.1%) | 1,261 (6.5%) |
| $55,000 to $64,999 | 1,591 (7.0%) | 2,113 (10.9%) |
| $65,000 to $74,999 | 1,420 (6.2%) | 996 (5.1%) |
| $75,000 to $99,999 | 3,950 (17.3%) | 2,028 (10.5%) |
| $100,000+ | 7,684 (33.7%) | 1,762 (9.1%) |
| Total | 22,799 (100.0%) | 19,337 (100.0%) |
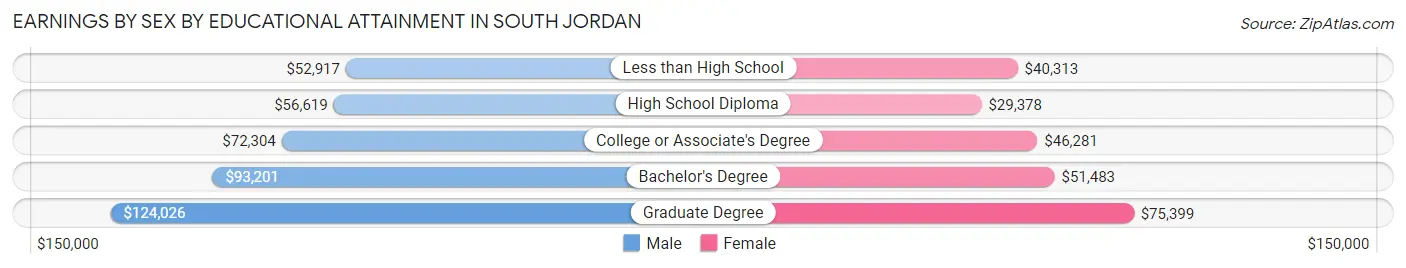
Earnings by Sex by Educational Attainment in South Jordan
Average earnings in South Jordan are $85,589 for men and $49,658 for women, a difference of 42.0%. Men with an educational attainment of graduate degree enjoy the highest average annual earnings of $124,026, while those with less than high school education earn the least with $52,917. Women with an educational attainment of graduate degree earn the most with the average annual earnings of $75,399, while those with high school diploma education have the smallest earnings of $29,378.
| Educational Attainment | Male Income | Female Income |
| Less than High School | $52,917 | $40,313 |
| High School Diploma | $56,619 | $29,378 |
| College or Associate's Degree | $72,304 | $46,281 |
| Bachelor's Degree | $93,201 | $51,483 |
| Graduate Degree | $124,026 | $75,399 |
| Total | $85,589 | $49,658 |
Family Income in South Jordan
Family Income Brackets in South Jordan
According to the South Jordan family income data, there are 5,460 families falling into the $100,000 to $149,999 income range, which is the most common income bracket and makes up 28.3% of all families. Conversely, the $10,000 to $14,999 income bracket is the least frequent group with only 58 families (0.3%) belonging to this category.
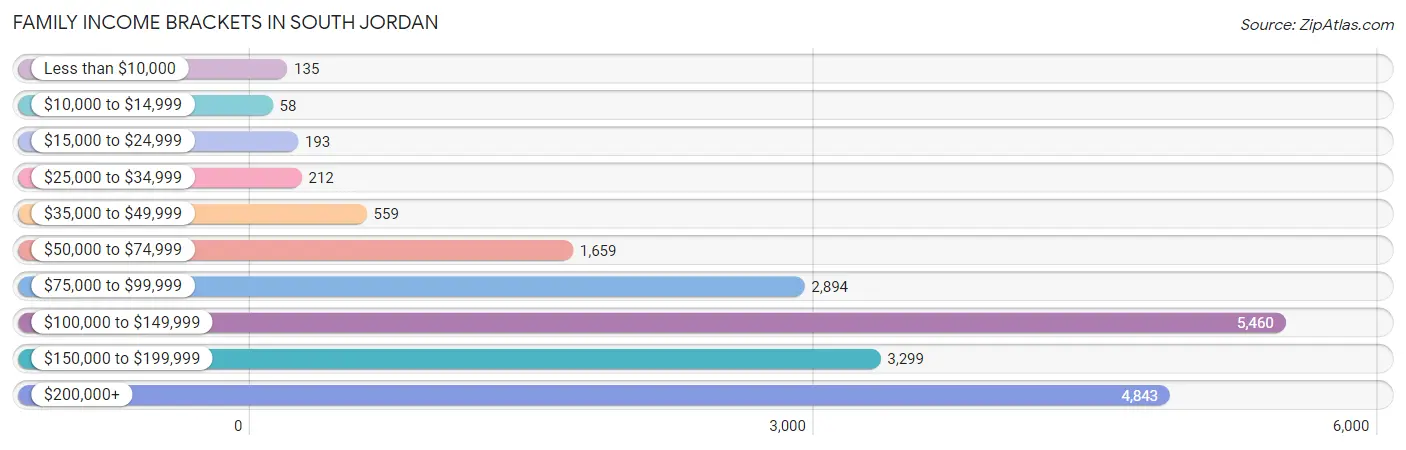
| Income Bracket | # Families | % Families |
| Less than $10,000 | 135 | 0.7% |
| $10,000 to $14,999 | 58 | 0.3% |
| $15,000 to $24,999 | 193 | 1.0% |
| $25,000 to $34,999 | 212 | 1.1% |
| $35,000 to $49,999 | 559 | 2.9% |
| $50,000 to $74,999 | 1,659 | 8.6% |
| $75,000 to $99,999 | 2,894 | 15.0% |
| $100,000 to $149,999 | 5,460 | 28.3% |
| $150,000 to $199,999 | 3,299 | 17.1% |
| $200,000+ | 4,843 | 25.1% |
Family Income by Famaliy Size in South Jordan
7+ person families (969 | 5.0%) account for the highest median family income in South Jordan with $187,552 per family, while 2-person families (6,994 | 36.2%) have the highest median income of $53,869 per family member.
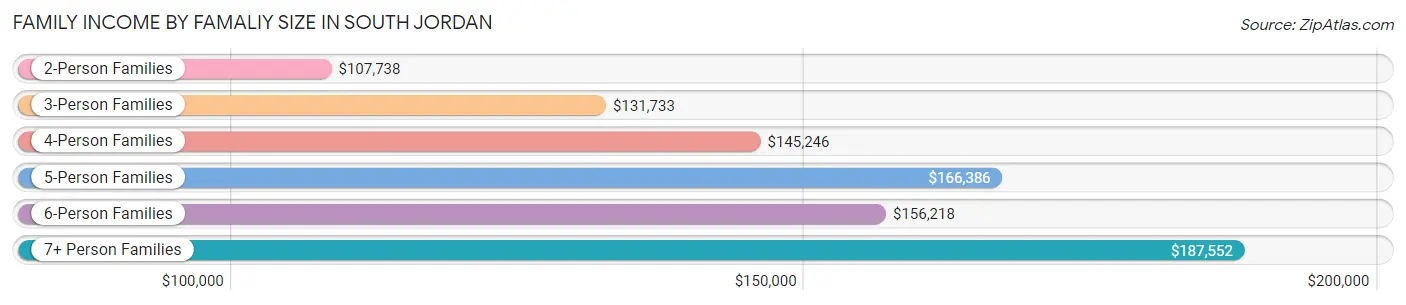
| Income Bracket | # Families | Median Income |
| 2-Person Families | 6,994 (36.2%) | $107,738 |
| 3-Person Families | 3,365 (17.4%) | $131,733 |
| 4-Person Families | 3,858 (20.0%) | $145,246 |
| 5-Person Families | 2,666 (13.8%) | $166,386 |
| 6-Person Families | 1,441 (7.5%) | $156,218 |
| 7+ Person Families | 969 (5.0%) | $187,552 |
| Total | 19,293 (100.0%) | $134,155 |
Family Income by Number of Earners in South Jordan
The median family income in South Jordan is $134,155, with families comprising 3+ earners (3,865) having the highest median family income of $183,958, while families with no earners (1,748) have the lowest median family income of $75,161, accounting for 20.0% and 9.1% of families, respectively.
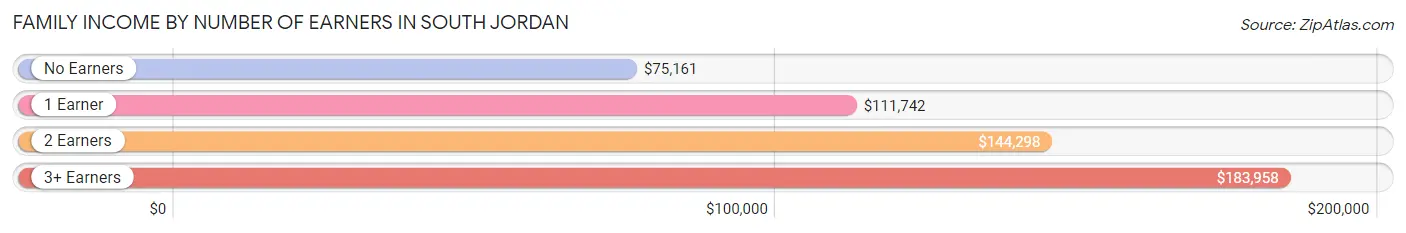
| Number of Earners | # Families | Median Income |
| No Earners | 1,748 (9.1%) | $75,161 |
| 1 Earner | 5,161 (26.8%) | $111,742 |
| 2 Earners | 8,519 (44.2%) | $144,298 |
| 3+ Earners | 3,865 (20.0%) | $183,958 |
| Total | 19,293 (100.0%) | $134,155 |
Household Income in South Jordan
Household Income Brackets in South Jordan
With 6,303 households falling in the category, the $100,000 to $149,999 income range is the most frequent in South Jordan, accounting for 25.8% of all households. In contrast, only 122 households (0.5%) fall into the $10,000 to $14,999 income bracket, making it the least populous group.
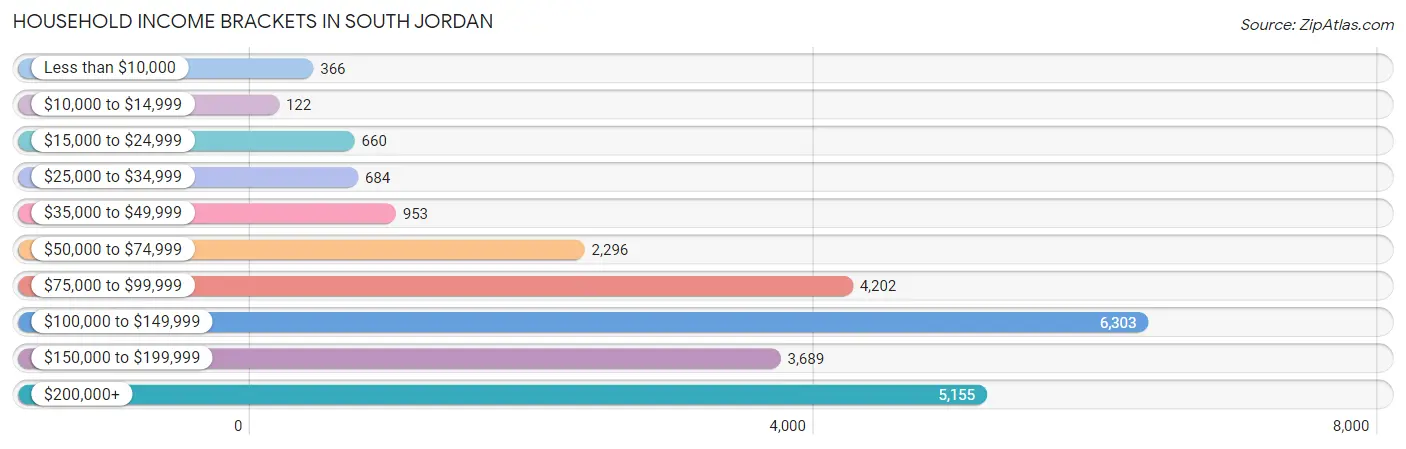
| Income Bracket | # Households | % Households |
| Less than $10,000 | 366 | 1.5% |
| $10,000 to $14,999 | 122 | 0.5% |
| $15,000 to $24,999 | 660 | 2.7% |
| $25,000 to $34,999 | 684 | 2.8% |
| $35,000 to $49,999 | 953 | 3.9% |
| $50,000 to $74,999 | 2,296 | 9.4% |
| $75,000 to $99,999 | 4,202 | 17.2% |
| $100,000 to $149,999 | 6,303 | 25.8% |
| $150,000 to $199,999 | 3,689 | 15.1% |
| $200,000+ | 5,155 | 21.1% |
Household Income by Householder Age in South Jordan
The median household income in South Jordan is $119,822, with the highest median household income of $149,871 found in the 45 to 64 years age bracket for the primary householder. A total of 8,861 households (36.3%) fall into this category. Meanwhile, the 15 to 24 years age bracket for the primary householder has the lowest median household income of $76,563, with 413 households (1.7%) in this group.
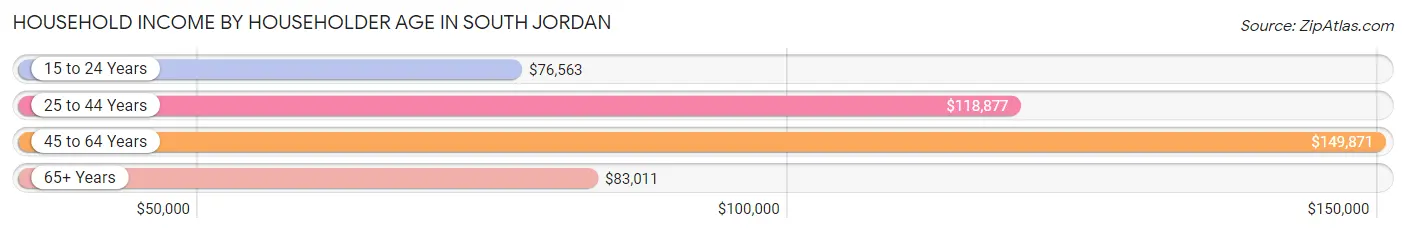
| Income Bracket | # Households | Median Income |
| 15 to 24 Years | 413 (1.7%) | $76,563 |
| 25 to 44 Years | 9,556 (39.1%) | $118,877 |
| 45 to 64 Years | 8,861 (36.3%) | $149,871 |
| 65+ Years | 5,599 (22.9%) | $83,011 |
| Total | 24,429 (100.0%) | $119,822 |
Poverty in South Jordan
Income Below Poverty by Sex and Age in South Jordan
With 2.0% poverty level for males and 3.2% for females among the residents of South Jordan, 5 year old males and 16 and 17 year old females are the most vulnerable to poverty, with 26 males (5.0%) and 152 females (10.7%) in their respective age groups living below the poverty level.
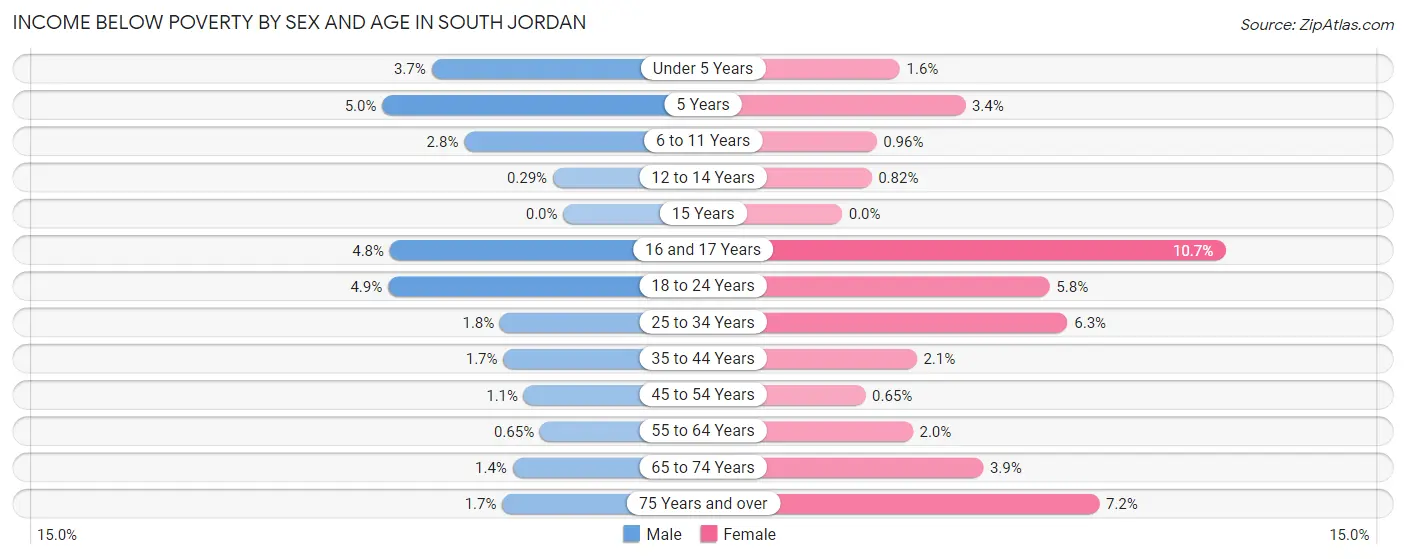
| Age Bracket | Male | Female |
| Under 5 Years | 87 (3.7%) | 52 (1.6%) |
| 5 Years | 26 (5.0%) | 29 (3.4%) |
| 6 to 11 Years | 111 (2.8%) | 42 (1.0%) |
| 12 to 14 Years | 6 (0.3%) | 16 (0.8%) |
| 15 Years | 0 (0.0%) | 0 (0.0%) |
| 16 and 17 Years | 64 (4.8%) | 152 (10.7%) |
| 18 to 24 Years | 131 (4.9%) | 148 (5.8%) |
| 25 to 34 Years | 90 (1.8%) | 348 (6.3%) |
| 35 to 44 Years | 91 (1.7%) | 126 (2.1%) |
| 45 to 54 Years | 55 (1.1%) | 32 (0.6%) |
| 55 to 64 Years | 24 (0.6%) | 69 (2.0%) |
| 65 to 74 Years | 46 (1.4%) | 133 (3.9%) |
| 75 Years and over | 23 (1.7%) | 125 (7.2%) |
| Total | 754 (2.0%) | 1,272 (3.2%) |
Income Above Poverty by Sex and Age in South Jordan
According to the poverty statistics in South Jordan, males aged 15 years and females aged 15 years are the age groups that are most secure financially, with 100.0% of males and 100.0% of females in these age groups living above the poverty line.
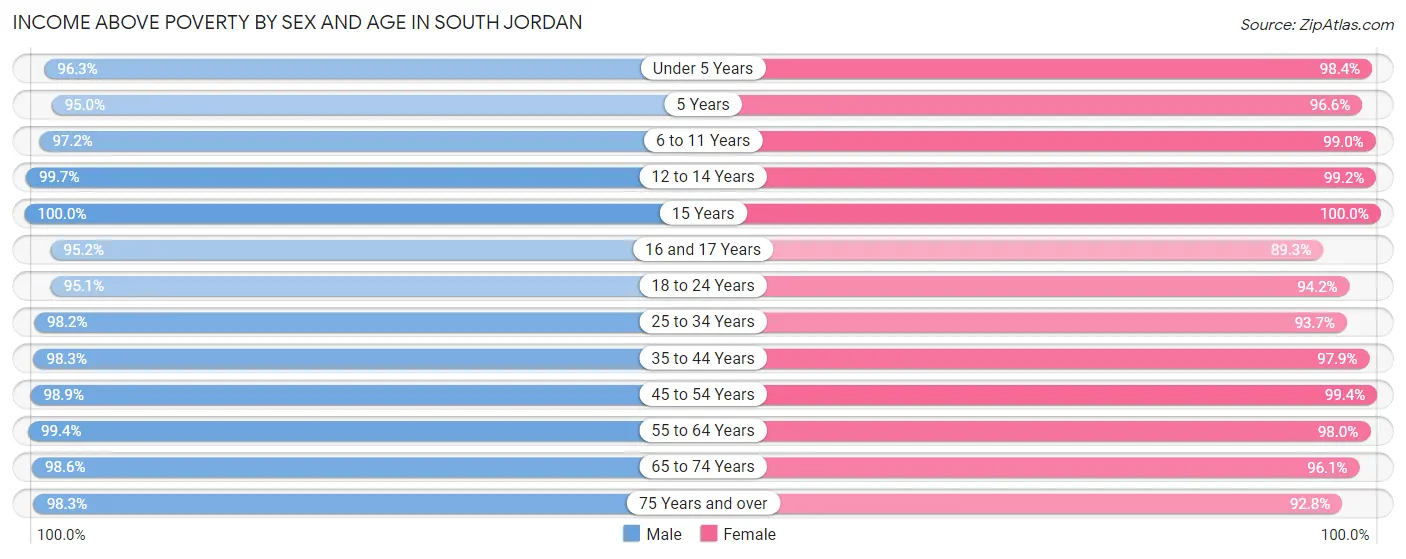
| Age Bracket | Male | Female |
| Under 5 Years | 2,285 (96.3%) | 3,169 (98.4%) |
| 5 Years | 490 (95.0%) | 816 (96.6%) |
| 6 to 11 Years | 3,916 (97.2%) | 4,345 (99.0%) |
| 12 to 14 Years | 2,069 (99.7%) | 1,940 (99.2%) |
| 15 Years | 730 (100.0%) | 791 (100.0%) |
| 16 and 17 Years | 1,261 (95.2%) | 1,273 (89.3%) |
| 18 to 24 Years | 2,551 (95.1%) | 2,413 (94.2%) |
| 25 to 34 Years | 5,031 (98.2%) | 5,193 (93.7%) |
| 35 to 44 Years | 5,367 (98.3%) | 5,926 (97.9%) |
| 45 to 54 Years | 4,956 (98.9%) | 4,868 (99.4%) |
| 55 to 64 Years | 3,656 (99.4%) | 3,434 (98.0%) |
| 65 to 74 Years | 3,218 (98.6%) | 3,255 (96.1%) |
| 75 Years and over | 1,328 (98.3%) | 1,622 (92.8%) |
| Total | 36,858 (98.0%) | 39,045 (96.9%) |
Income Below Poverty Among Married-Couple Families in South Jordan
The poverty statistics for married-couple families in South Jordan show that 1.1% or 192 of the total 16,965 families live below the poverty line. Families with 1 or 2 children have the highest poverty rate of 1.9%, comprising of 101 families. On the other hand, families with 5 or more children have the lowest poverty rate of 0.0%, which includes 0 families.
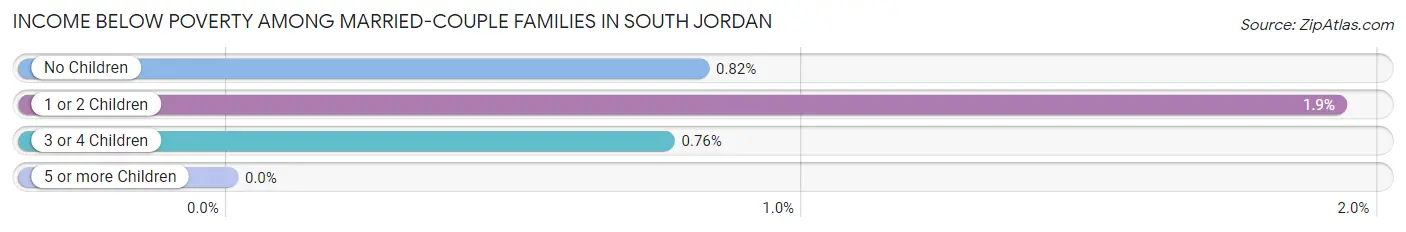
| Children | Above Poverty | Below Poverty |
| No Children | 8,015 (99.2%) | 66 (0.8%) |
| 1 or 2 Children | 5,131 (98.1%) | 101 (1.9%) |
| 3 or 4 Children | 3,271 (99.2%) | 25 (0.8%) |
| 5 or more Children | 356 (100.0%) | 0 (0.0%) |
| Total | 16,773 (98.9%) | 192 (1.1%) |
Income Below Poverty Among Single-Parent Households in South Jordan
According to the poverty data in South Jordan, 7.3% or 49 single-father households and 5.1% or 85 single-mother households are living below the poverty line. Among single-father households, those with 3 or 4 children have the highest poverty rate, with 13 households (21.0%) experiencing poverty. Likewise, among single-mother households, those with 1 or 2 children have the highest poverty rate, with 61 households (7.1%) falling below the poverty line.
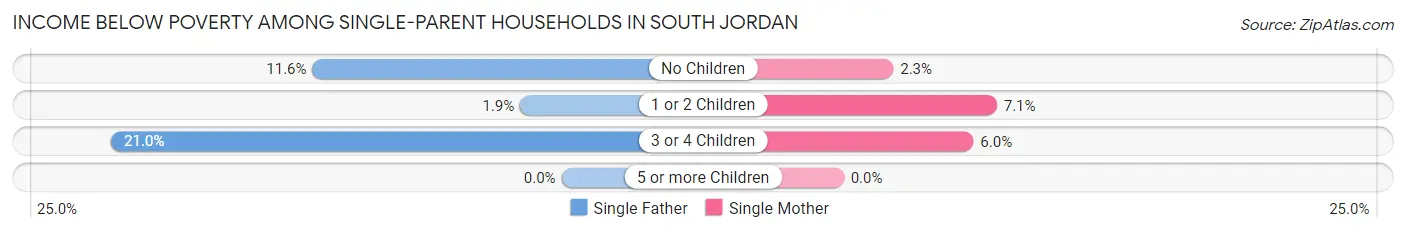
| Children | Single Father | Single Mother |
| No Children | 29 (11.6%) | 15 (2.3%) |
| 1 or 2 Children | 7 (1.9%) | 61 (7.1%) |
| 3 or 4 Children | 13 (21.0%) | 9 (6.0%) |
| 5 or more Children | 0 (0.0%) | 0 (0.0%) |
| Total | 49 (7.3%) | 85 (5.1%) |
Income Below Poverty Among Married-Couple vs Single-Parent Households in South Jordan
The poverty data for South Jordan shows that 192 of the married-couple family households (1.1%) and 134 of the single-parent households (5.8%) are living below the poverty level. Within the married-couple family households, those with 1 or 2 children have the highest poverty rate, with 101 households (1.9%) falling below the poverty line. Among the single-parent households, those with 3 or 4 children have the highest poverty rate, with 22 household (10.4%) living below poverty.
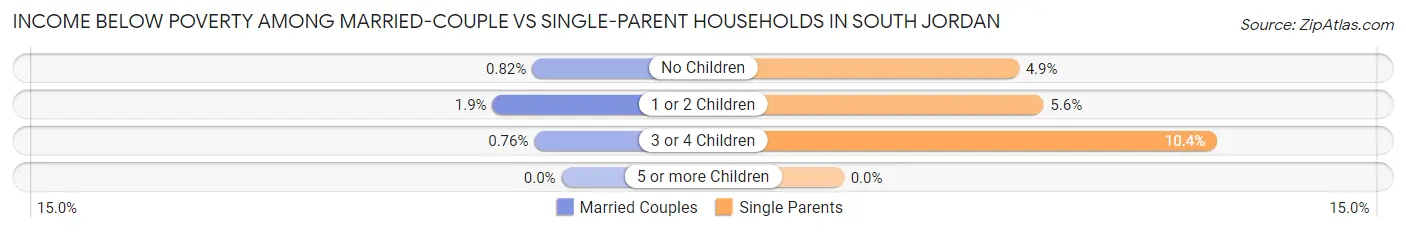
| Children | Married-Couple Families | Single-Parent Households |
| No Children | 66 (0.8%) | 44 (4.9%) |
| 1 or 2 Children | 101 (1.9%) | 68 (5.6%) |
| 3 or 4 Children | 25 (0.8%) | 22 (10.4%) |
| 5 or more Children | 0 (0.0%) | 0 (0.0%) |
| Total | 192 (1.1%) | 134 (5.8%) |
Race in South Jordan
The most populous races in South Jordan are White / Caucasian (66,650 | 85.3%), Hispanic or Latino (6,085 | 7.8%), and Two or more Races (4,158 | 5.3%).
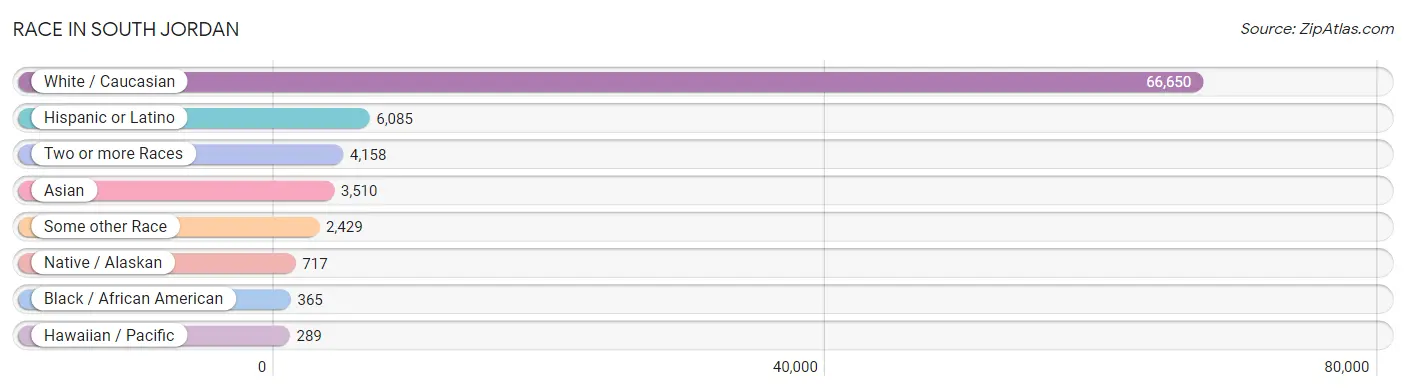
| Race | # Population | % Population |
| Asian | 3,510 | 4.5% |
| Black / African American | 365 | 0.5% |
| Hawaiian / Pacific | 289 | 0.4% |
| Hispanic or Latino | 6,085 | 7.8% |
| Native / Alaskan | 717 | 0.9% |
| White / Caucasian | 66,650 | 85.3% |
| Two or more Races | 4,158 | 5.3% |
| Some other Race | 2,429 | 3.1% |
| Total | 78,118 | 100.0% |
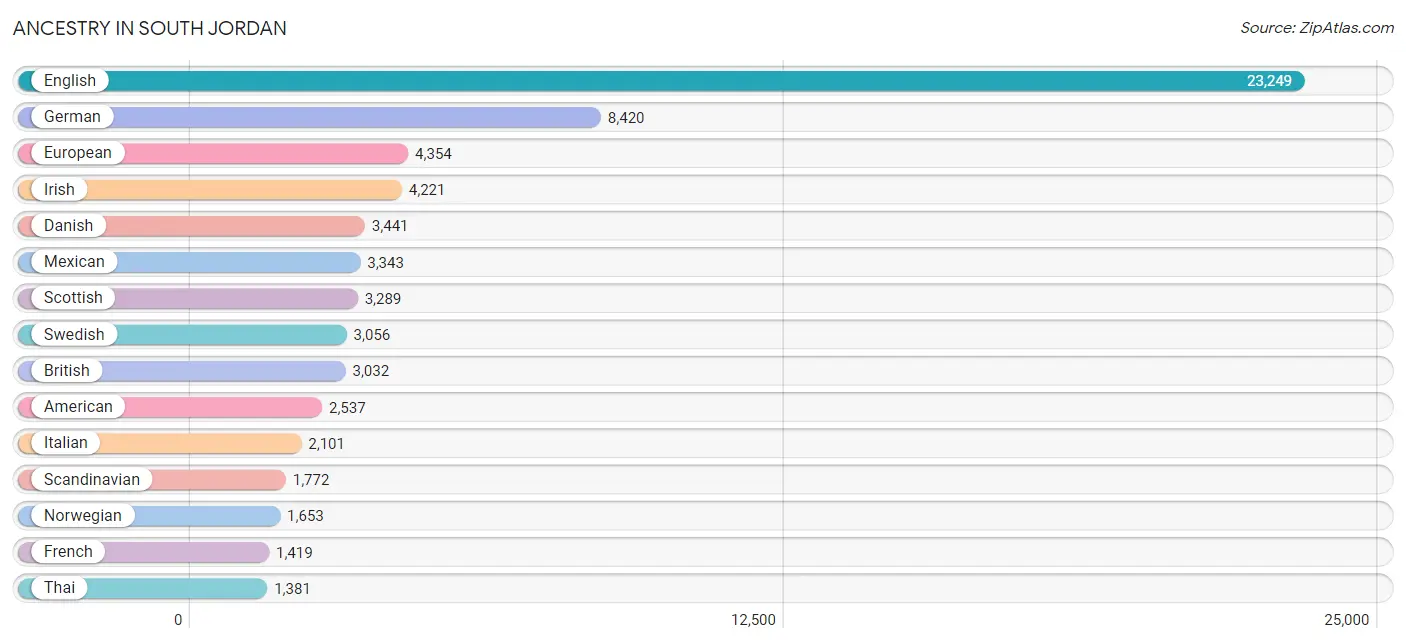
Ancestry in South Jordan
The most populous ancestries reported in South Jordan are English (23,249 | 29.8%), German (8,420 | 10.8%), European (4,354 | 5.6%), Irish (4,221 | 5.4%), and Danish (3,441 | 4.4%), together accounting for 55.9% of all South Jordan residents.
| Ancestry | # Population | % Population |
| American | 2,537 | 3.3% |
| Apache | 32 | 0.0% |
| Arab | 136 | 0.2% |
| Argentinean | 18 | 0.0% |
| Armenian | 173 | 0.2% |
| Australian | 56 | 0.1% |
| Austrian | 160 | 0.2% |
| Basque | 47 | 0.1% |
| Belgian | 63 | 0.1% |
| Belizean | 21 | 0.0% |
| Bhutanese | 300 | 0.4% |
| Blackfeet | 9 | 0.0% |
| Brazilian | 183 | 0.2% |
| British | 3,032 | 3.9% |
| Bulgarian | 8 | 0.0% |
| Burmese | 537 | 0.7% |
| Canadian | 178 | 0.2% |
| Central American | 614 | 0.8% |
| Cherokee | 178 | 0.2% |
| Cheyenne | 7 | 0.0% |
| Chilean | 54 | 0.1% |
| Colombian | 55 | 0.1% |
| Costa Rican | 163 | 0.2% |
| Croatian | 21 | 0.0% |
| Cuban | 105 | 0.1% |
| Czech | 111 | 0.1% |
| Czechoslovakian | 52 | 0.1% |
| Danish | 3,441 | 4.4% |
| Dominican | 83 | 0.1% |
| Dutch | 1,068 | 1.4% |
| Eastern European | 110 | 0.1% |
| Ecuadorian | 136 | 0.2% |
| English | 23,249 | 29.8% |
| European | 4,354 | 5.6% |
| Fijian | 32 | 0.0% |
| Filipino | 83 | 0.1% |
| Finnish | 266 | 0.3% |
| French | 1,419 | 1.8% |
| French Canadian | 50 | 0.1% |
| German | 8,420 | 10.8% |
| Greek | 258 | 0.3% |
| Guatemalan | 286 | 0.4% |
| Hungarian | 24 | 0.0% |
| Icelander | 37 | 0.1% |
| Indian (Asian) | 607 | 0.8% |
| Inupiat | 168 | 0.2% |
| Iranian | 37 | 0.1% |
| Irish | 4,221 | 5.4% |
| Iroquois | 10 | 0.0% |
| Israeli | 19 | 0.0% |
| Italian | 2,101 | 2.7% |
| Japanese | 163 | 0.2% |
| Korean | 468 | 0.6% |
| Laotian | 7 | 0.0% |
| Lebanese | 41 | 0.1% |
| Lithuanian | 10 | 0.0% |
| Malaysian | 272 | 0.4% |
| Mexican | 3,343 | 4.3% |
| Mexican American Indian | 310 | 0.4% |
| Native Hawaiian | 414 | 0.5% |
| Navajo | 212 | 0.3% |
| New Zealander | 68 | 0.1% |
| Nicaraguan | 40 | 0.1% |
| Nigerian | 76 | 0.1% |
| Northern European | 100 | 0.1% |
| Norwegian | 1,653 | 2.1% |
| Pakistani | 111 | 0.1% |
| Palestinian | 54 | 0.1% |
| Peruvian | 374 | 0.5% |
| Polish | 640 | 0.8% |
| Portuguese | 121 | 0.2% |
| Pueblo | 7 | 0.0% |
| Puerto Rican | 91 | 0.1% |
| Romanian | 17 | 0.0% |
| Russian | 270 | 0.4% |
| Salvadoran | 125 | 0.2% |
| Samoan | 238 | 0.3% |
| Scandinavian | 1,772 | 2.3% |
| Scotch-Irish | 738 | 0.9% |
| Scottish | 3,289 | 4.2% |
| Sioux | 59 | 0.1% |
| Slavic | 66 | 0.1% |
| Slovak | 21 | 0.0% |
| Somali | 13 | 0.0% |
| South African | 32 | 0.0% |
| South American | 1,198 | 1.5% |
| South American Indian | 66 | 0.1% |
| Spaniard | 312 | 0.4% |
| Spanish | 218 | 0.3% |
| Spanish American | 16 | 0.0% |
| Sri Lankan | 377 | 0.5% |
| Subsaharan African | 160 | 0.2% |
| Sudanese | 39 | 0.1% |
| Swedish | 3,056 | 3.9% |
| Swiss | 995 | 1.3% |
| Thai | 1,381 | 1.8% |
| Tongan | 65 | 0.1% |
| Ukrainian | 46 | 0.1% |
| Uruguayan | 132 | 0.2% |
| Ute | 18 | 0.0% |
| Venezuelan | 429 | 0.5% |
| Welsh | 1,276 | 1.6% |
| Yakama | 86 | 0.1% |
| Yugoslavian | 15 | 0.0% |
| Yuman | 17 | 0.0% | View All 105 Rows |
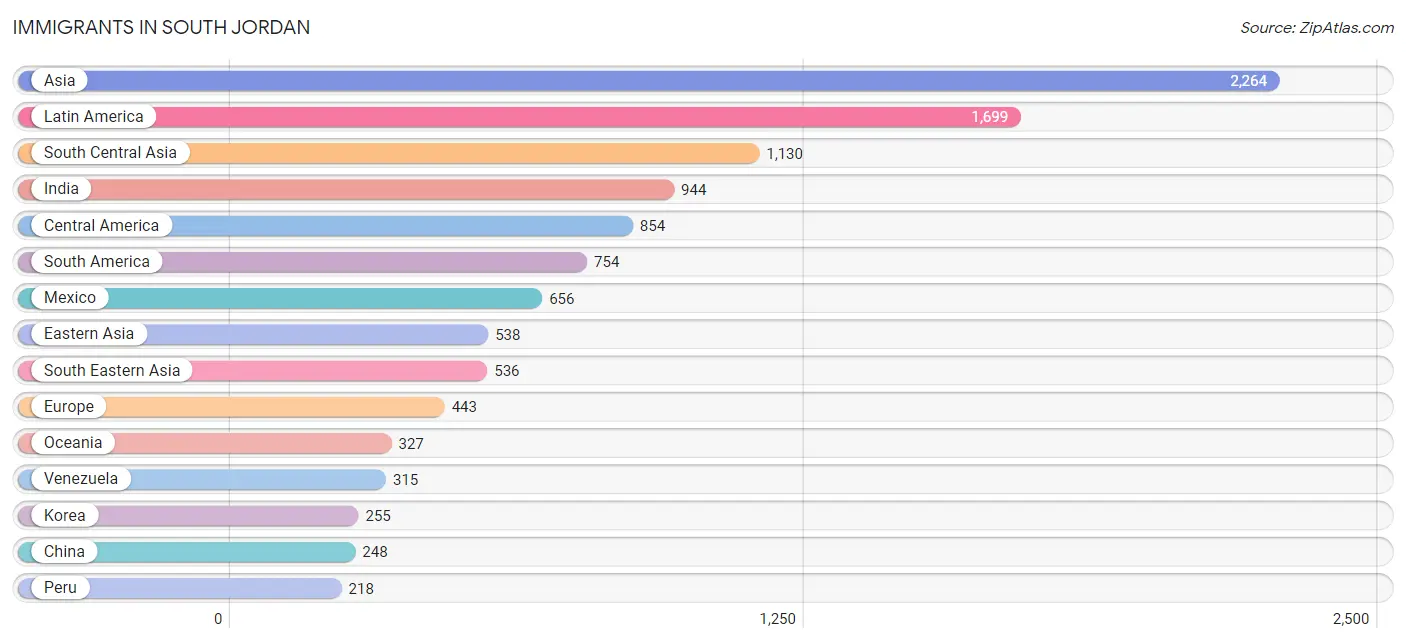
Immigrants in South Jordan
The most numerous immigrant groups reported in South Jordan came from Asia (2,264 | 2.9%), Latin America (1,699 | 2.2%), South Central Asia (1,130 | 1.5%), India (944 | 1.2%), and Central America (854 | 1.1%), together accounting for 8.8% of all South Jordan residents.
| Immigration Origin | # Population | % Population |
| Africa | 12 | 0.0% |
| Argentina | 41 | 0.1% |
| Asia | 2,264 | 2.9% |
| Australia | 61 | 0.1% |
| Brazil | 99 | 0.1% |
| Cambodia | 54 | 0.1% |
| Canada | 212 | 0.3% |
| Caribbean | 91 | 0.1% |
| Central America | 854 | 1.1% |
| Chile | 11 | 0.0% |
| China | 248 | 0.3% |
| Colombia | 22 | 0.0% |
| Cuba | 91 | 0.1% |
| Eastern Asia | 538 | 0.7% |
| Eastern Europe | 205 | 0.3% |
| Ecuador | 42 | 0.1% |
| El Salvador | 22 | 0.0% |
| England | 60 | 0.1% |
| Europe | 443 | 0.6% |
| Germany | 30 | 0.0% |
| Greece | 10 | 0.0% |
| Guatemala | 176 | 0.2% |
| Hong Kong | 39 | 0.1% |
| India | 944 | 1.2% |
| Indonesia | 7 | 0.0% |
| Iran | 30 | 0.0% |
| Israel | 31 | 0.0% |
| Italy | 13 | 0.0% |
| Japan | 35 | 0.0% |
| Korea | 255 | 0.3% |
| Laos | 76 | 0.1% |
| Latin America | 1,699 | 2.2% |
| Latvia | 9 | 0.0% |
| Lebanon | 16 | 0.0% |
| Malaysia | 11 | 0.0% |
| Mexico | 656 | 0.8% |
| Nepal | 29 | 0.0% |
| Netherlands | 45 | 0.1% |
| Northern Africa | 12 | 0.0% |
| Northern Europe | 99 | 0.1% |
| Norway | 18 | 0.0% |
| Oceania | 327 | 0.4% |
| Pakistan | 86 | 0.1% |
| Peru | 218 | 0.3% |
| Philippines | 93 | 0.1% |
| Poland | 93 | 0.1% |
| Romania | 17 | 0.0% |
| Russia | 86 | 0.1% |
| Saudi Arabia | 13 | 0.0% |
| Singapore | 85 | 0.1% |
| South America | 754 | 1.0% |
| South Central Asia | 1,130 | 1.5% |
| South Eastern Asia | 536 | 0.7% |
| Southern Europe | 64 | 0.1% |
| Spain | 41 | 0.1% |
| Sri Lanka | 41 | 0.1% |
| Sudan | 12 | 0.0% |
| Taiwan | 8 | 0.0% |
| Thailand | 64 | 0.1% |
| Uruguay | 6 | 0.0% |
| Venezuela | 315 | 0.4% |
| Vietnam | 146 | 0.2% |
| Western Asia | 60 | 0.1% |
| Western Europe | 75 | 0.1% | View All 64 Rows |
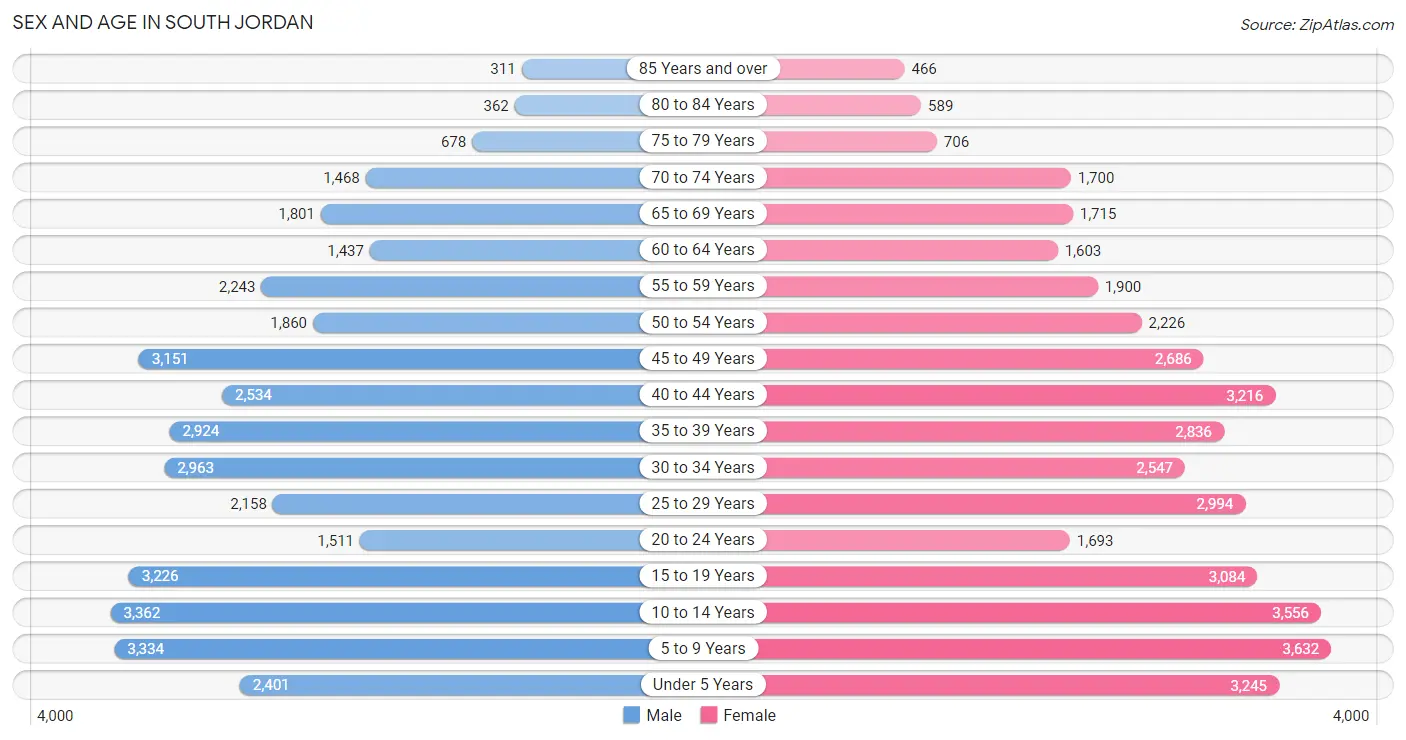
Sex and Age in South Jordan
Sex and Age in South Jordan
The most populous age groups in South Jordan are 10 to 14 Years (3,362 | 8.9%) for men and 5 to 9 Years (3,632 | 9.0%) for women.
| Age Bracket | Male | Female |
| Under 5 Years | 2,401 (6.4%) | 3,245 (8.0%) |
| 5 to 9 Years | 3,334 (8.8%) | 3,632 (9.0%) |
| 10 to 14 Years | 3,362 (8.9%) | 3,556 (8.8%) |
| 15 to 19 Years | 3,226 (8.6%) | 3,084 (7.6%) |
| 20 to 24 Years | 1,511 (4.0%) | 1,693 (4.2%) |
| 25 to 29 Years | 2,158 (5.7%) | 2,994 (7.4%) |
| 30 to 34 Years | 2,963 (7.9%) | 2,547 (6.3%) |
| 35 to 39 Years | 2,924 (7.7%) | 2,836 (7.0%) |
| 40 to 44 Years | 2,534 (6.7%) | 3,216 (8.0%) |
| 45 to 49 Years | 3,151 (8.4%) | 2,686 (6.7%) |
| 50 to 54 Years | 1,860 (4.9%) | 2,226 (5.5%) |
| 55 to 59 Years | 2,243 (5.9%) | 1,900 (4.7%) |
| 60 to 64 Years | 1,437 (3.8%) | 1,603 (4.0%) |
| 65 to 69 Years | 1,801 (4.8%) | 1,715 (4.3%) |
| 70 to 74 Years | 1,468 (3.9%) | 1,700 (4.2%) |
| 75 to 79 Years | 678 (1.8%) | 706 (1.8%) |
| 80 to 84 Years | 362 (1.0%) | 589 (1.5%) |
| 85 Years and over | 311 (0.8%) | 466 (1.1%) |
| Total | 37,724 (100.0%) | 40,394 (100.0%) |
Families and Households in South Jordan
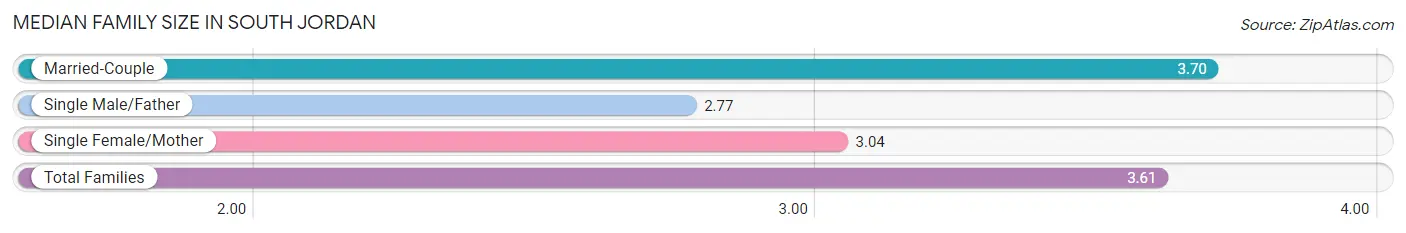
Median Family Size in South Jordan
The median family size in South Jordan is 3.61 persons per family, with married-couple families (16,965 | 87.9%) accounting for the largest median family size of 3.7 persons per family. On the other hand, single male/father families (674 | 3.5%) represent the smallest median family size with 2.77 persons per family.
| Family Type | # Families | Family Size |
| Married-Couple | 16,965 (87.9%) | 3.70 |
| Single Male/Father | 674 (3.5%) | 2.77 |
| Single Female/Mother | 1,654 (8.6%) | 3.04 |
| Total Families | 19,293 (100.0%) | 3.61 |
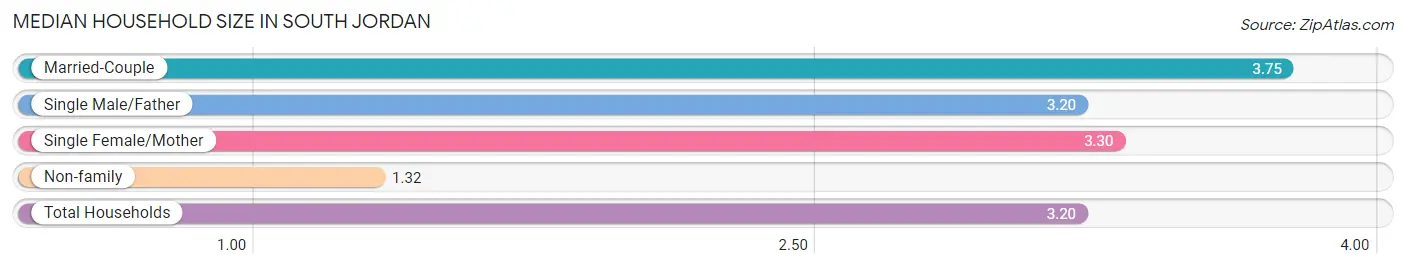
Median Household Size in South Jordan
The median household size in South Jordan is 3.20 persons per household, with married-couple households (16,965 | 69.5%) accounting for the largest median household size of 3.75 persons per household. non-family households (5,136 | 21.0%) represent the smallest median household size with 1.32 persons per household.
| Household Type | # Households | Household Size |
| Married-Couple | 16,965 (69.5%) | 3.75 |
| Single Male/Father | 674 (2.8%) | 3.20 |
| Single Female/Mother | 1,654 (6.8%) | 3.30 |
| Non-family | 5,136 (21.0%) | 1.32 |
| Total Households | 24,429 (100.0%) | 3.20 |
Household Size by Marriage Status in South Jordan
Out of a total of 24,429 households in South Jordan, 19,293 (79.0%) are family households, while 5,136 (21.0%) are nonfamily households. The most numerous type of family households are 2-person households, comprising 6,500, and the most common type of nonfamily households are 1-person households, comprising 4,104.
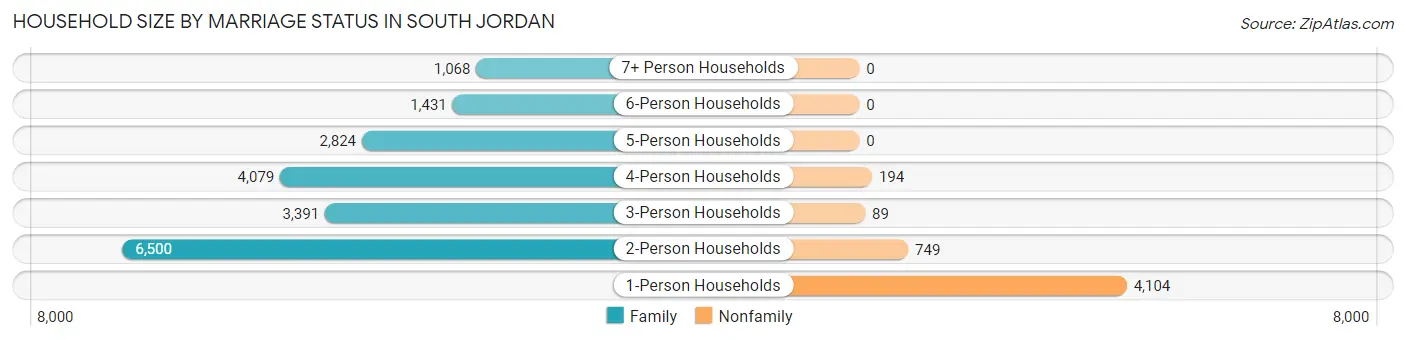
| Household Size | Family Households | Nonfamily Households |
| 1-Person Households | - | 4,104 (16.8%) |
| 2-Person Households | 6,500 (26.6%) | 749 (3.1%) |
| 3-Person Households | 3,391 (13.9%) | 89 (0.4%) |
| 4-Person Households | 4,079 (16.7%) | 194 (0.8%) |
| 5-Person Households | 2,824 (11.6%) | 0 (0.0%) |
| 6-Person Households | 1,431 (5.9%) | 0 (0.0%) |
| 7+ Person Households | 1,068 (4.4%) | 0 (0.0%) |
| Total | 19,293 (79.0%) | 5,136 (21.0%) |
Female Fertility in South Jordan
Fertility by Age in South Jordan
Average fertility rate in South Jordan is 50.0 births per 1,000 women. Women in the age bracket of 20 to 34 years have the highest fertility rate with 106.0 births per 1,000 women. Women in the age bracket of 20 to 34 years acount for 78.1% of all women with births.
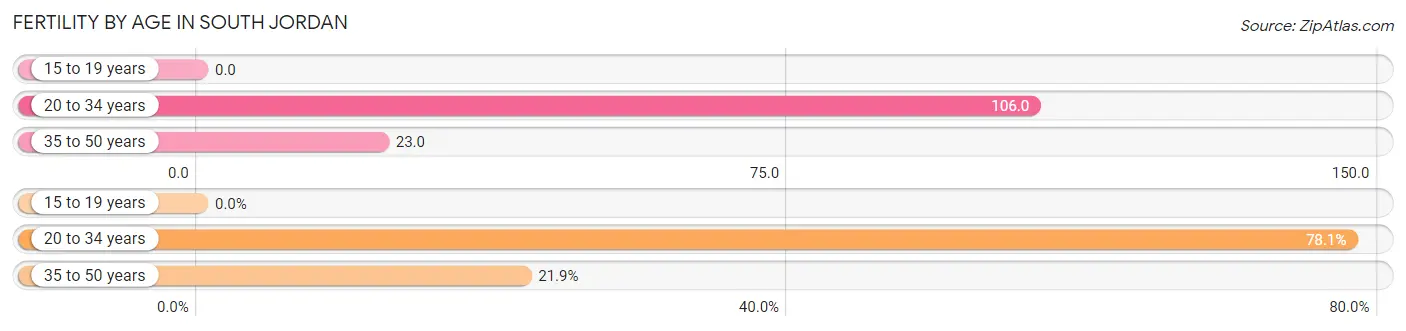
| Age Bracket | Women with Births | Births / 1,000 Women |
| 15 to 19 years | 0 (0.0%) | 0.0 |
| 20 to 34 years | 765 (78.1%) | 106.0 |
| 35 to 50 years | 215 (21.9%) | 23.0 |
| Total | 980 (100.0%) | 50.0 |
Fertility by Age by Marriage Status in South Jordan
96.0% of women with births (980) in South Jordan are married. The highest percentage of unmarried women with births falls into 20 to 34 years age bracket with 5.1% of them unmarried at the time of birth, while the lowest percentage of unmarried women with births belong to 35 to 50 years age bracket with 0.0% of them unmarried.
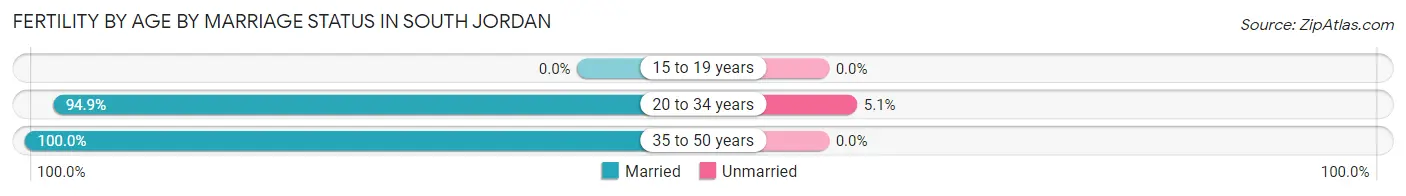
| Age Bracket | Married | Unmarried |
| 15 to 19 years | 0 (0.0%) | 0 (0.0%) |
| 20 to 34 years | 726 (94.9%) | 39 (5.1%) |
| 35 to 50 years | 215 (100.0%) | 0 (0.0%) |
| Total | 941 (96.0%) | 39 (4.0%) |
Fertility by Education in South Jordan
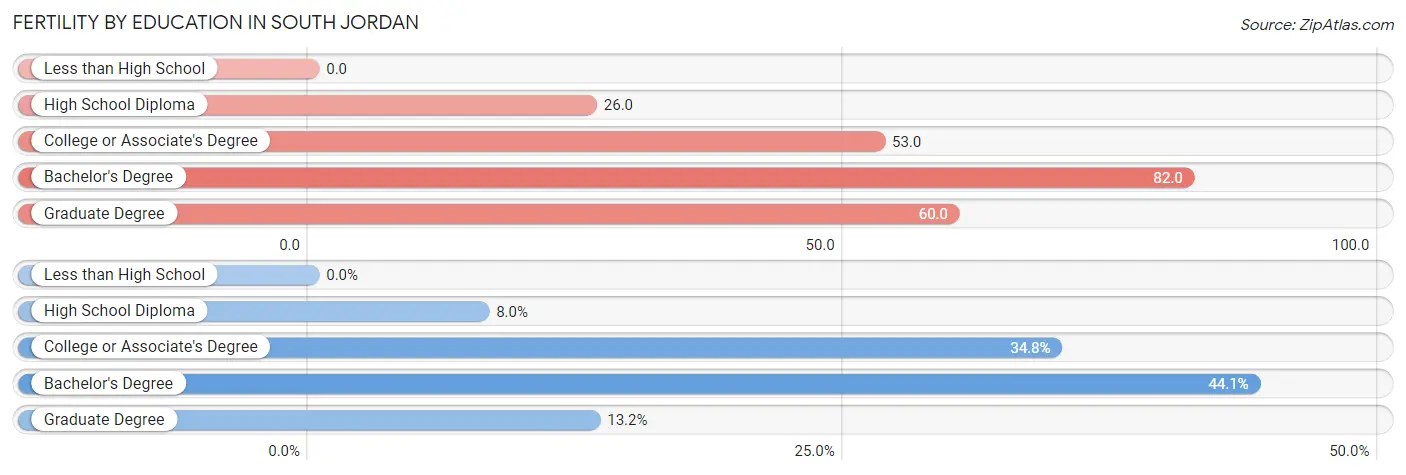
| Educational Attainment | Women with Births | Births / 1,000 Women |
| Less than High School | 0 (0.0%) | 0.0 |
| High School Diploma | 78 (8.0%) | 26.0 |
| College or Associate's Degree | 341 (34.8%) | 53.0 |
| Bachelor's Degree | 432 (44.1%) | 82.0 |
| Graduate Degree | 129 (13.2%) | 60.0 |
| Total | 980 (100.0%) | 50.0 |
Fertility by Education by Marriage Status in South Jordan
4.0% of women with births in South Jordan are unmarried. Women with the educational attainment of bachelor's degree are most likely to be married with 100.0% of them married at childbirth, while women with the educational attainment of high school diploma are least likely to be married with 37.2% of them unmarried at childbirth.
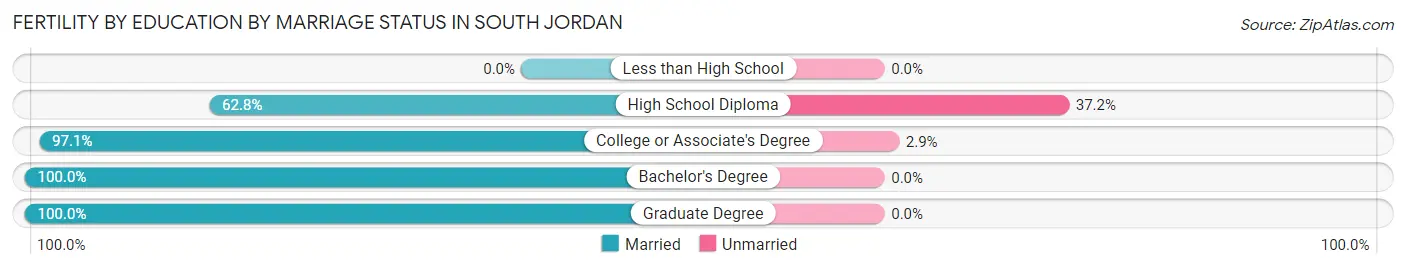
| Educational Attainment | Married | Unmarried |
| Less than High School | 0 (0.0%) | 0 (0.0%) |
| High School Diploma | 49 (62.8%) | 29 (37.2%) |
| College or Associate's Degree | 331 (97.1%) | 10 (2.9%) |
| Bachelor's Degree | 432 (100.0%) | 0 (0.0%) |
| Graduate Degree | 129 (100.0%) | 0 (0.0%) |
| Total | 941 (96.0%) | 39 (4.0%) |
Employment Characteristics in South Jordan
Employment by Class of Employer in South Jordan
Among the 38,966 employed individuals in South Jordan, private company employees (26,700 | 68.5%), self-employed (incorporated) (2,783 | 7.1%), and local government employees (2,569 | 6.6%) make up the most common classes of employment.
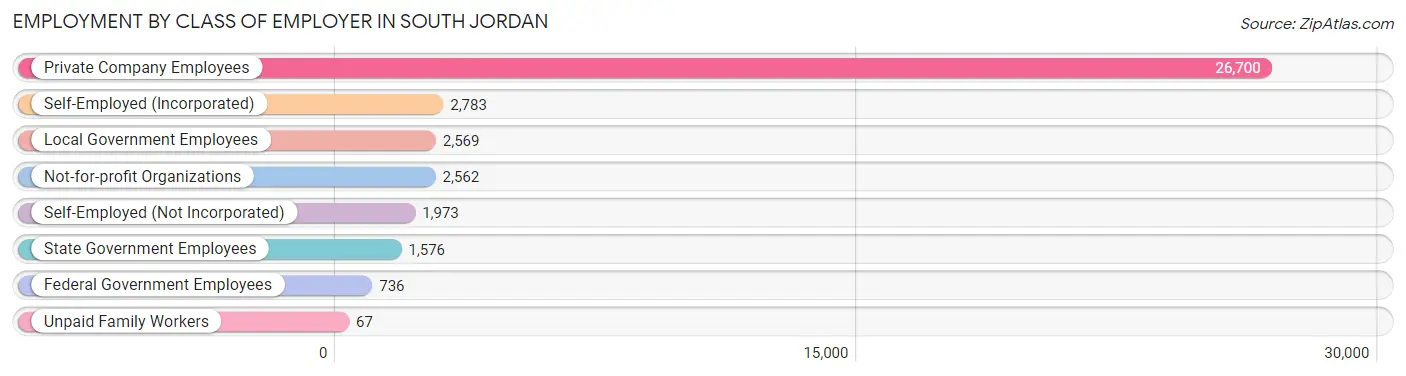
| Employer Class | # Employees | % Employees |
| Private Company Employees | 26,700 | 68.5% |
| Self-Employed (Incorporated) | 2,783 | 7.1% |
| Self-Employed (Not Incorporated) | 1,973 | 5.1% |
| Not-for-profit Organizations | 2,562 | 6.6% |
| Local Government Employees | 2,569 | 6.6% |
| State Government Employees | 1,576 | 4.0% |
| Federal Government Employees | 736 | 1.9% |
| Unpaid Family Workers | 67 | 0.2% |
| Total | 38,966 | 100.0% |
Employment Status by Age in South Jordan
According to the labor force statistics for South Jordan, out of the total population over 16 years of age (57,067), 70.9% or 40,461 individuals are in the labor force, with 2.5% or 1,012 of them unemployed. The age group with the highest labor force participation rate is 20 to 24 years, with 88.9% or 2,848 individuals in the labor force. Within the labor force, the 16 to 19 years age range has the highest percentage of unemployed individuals, with 6.4% or 191 of them being unemployed.
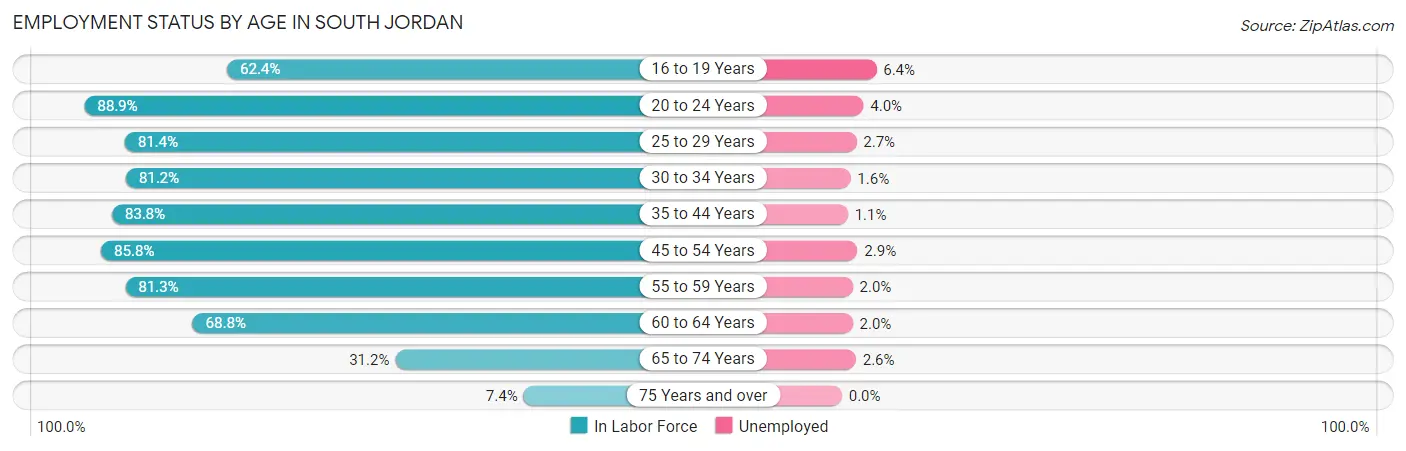
| Age Bracket | In Labor Force | Unemployed |
| 16 to 19 Years | 2,988 (62.4%) | 191 (6.4%) |
| 20 to 24 Years | 2,848 (88.9%) | 114 (4.0%) |
| 25 to 29 Years | 4,194 (81.4%) | 113 (2.7%) |
| 30 to 34 Years | 4,474 (81.2%) | 72 (1.6%) |
| 35 to 44 Years | 9,645 (83.8%) | 106 (1.1%) |
| 45 to 54 Years | 8,514 (85.8%) | 247 (2.9%) |
| 55 to 59 Years | 3,368 (81.3%) | 67 (2.0%) |
| 60 to 64 Years | 2,092 (68.8%) | 42 (2.0%) |
| 65 to 74 Years | 2,085 (31.2%) | 54 (2.6%) |
| 75 Years and over | 230 (7.4%) | 0 (0.0%) |
| Total | 40,461 (70.9%) | 1,012 (2.5%) |
Employment Status by Educational Attainment in South Jordan
According to labor force statistics for South Jordan, 82.2% of individuals (32,287) out of the total population between 25 and 64 years of age (39,278) are in the labor force, with 2.0% or 646 of them being unemployed. The group with the highest labor force participation rate are those with the educational attainment of bachelor's degree or higher, with 85.6% or 16,240 individuals in the labor force. Within the labor force, individuals with high school diploma education have the highest percentage of unemployment, with 2.8% or 124 of them being unemployed.
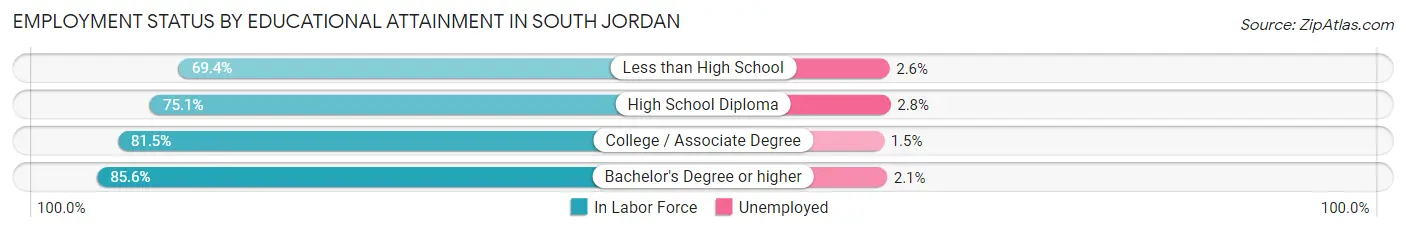
| Educational Attainment | In Labor Force | Unemployed |
| Less than High School | 655 (69.4%) | 25 (2.6%) |
| High School Diploma | 4,431 (75.1%) | 165 (2.8%) |
| College / Associate Degree | 10,972 (81.5%) | 202 (1.5%) |
| Bachelor's Degree or higher | 16,240 (85.6%) | 398 (2.1%) |
| Total | 32,287 (82.2%) | 786 (2.0%) |
Employment Occupations by Sex in South Jordan
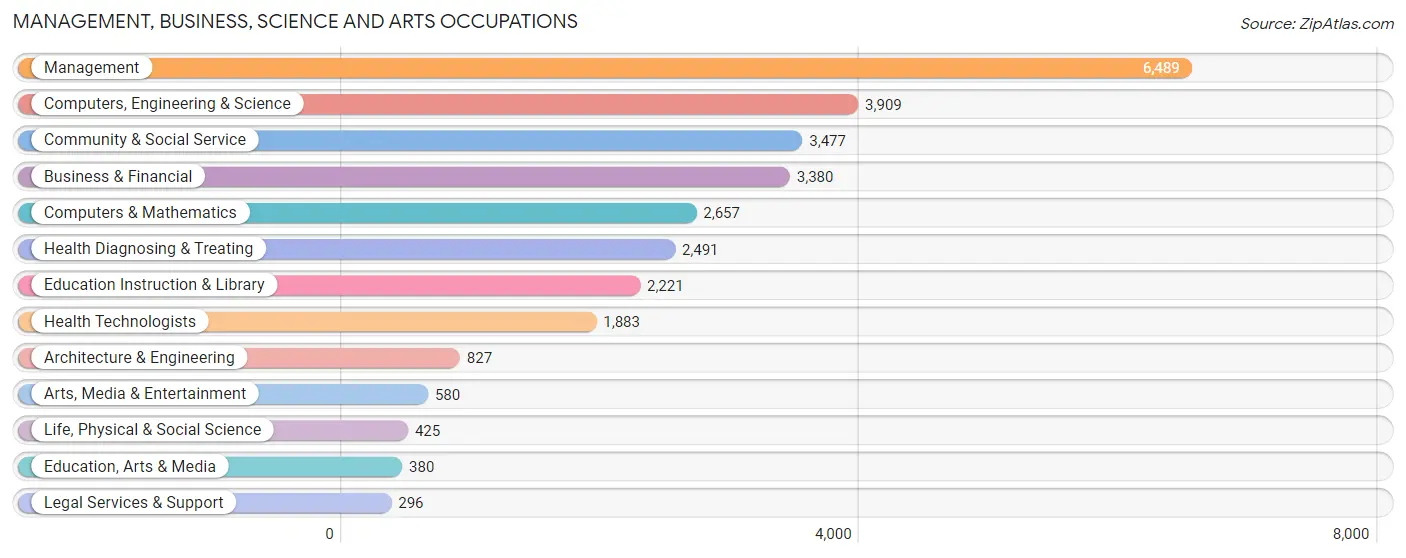
Management, Business, Science and Arts Occupations
The most common Management, Business, Science and Arts occupations in South Jordan are Management (6,489 | 16.5%), Computers, Engineering & Science (3,909 | 9.9%), Community & Social Service (3,477 | 8.8%), Business & Financial (3,380 | 8.6%), and Computers & Mathematics (2,657 | 6.7%).
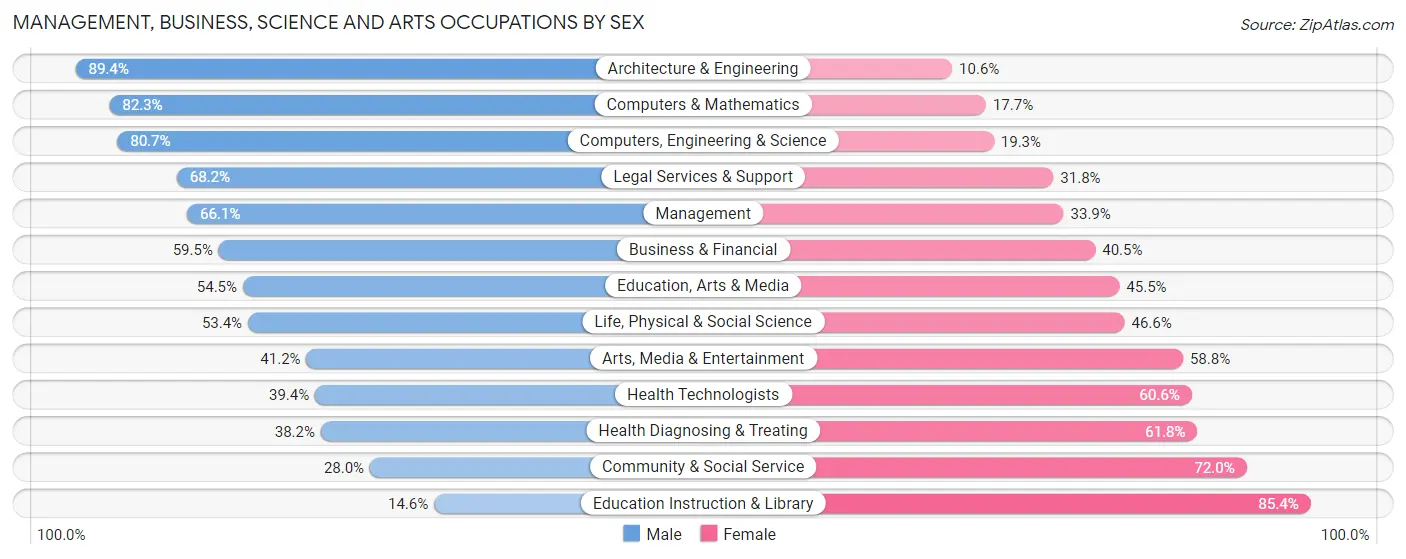
Management, Business, Science and Arts Occupations by Sex
Within the Management, Business, Science and Arts occupations in South Jordan, the most male-oriented occupations are Architecture & Engineering (89.4%), Computers & Mathematics (82.3%), and Computers, Engineering & Science (80.7%), while the most female-oriented occupations are Education Instruction & Library (85.4%), Community & Social Service (72.0%), and Health Diagnosing & Treating (61.8%).
| Occupation | Male | Female |
| Management | 4,290 (66.1%) | 2,199 (33.9%) |
| Business & Financial | 2,011 (59.5%) | 1,369 (40.5%) |
| Computers, Engineering & Science | 3,153 (80.7%) | 756 (19.3%) |
| Computers & Mathematics | 2,187 (82.3%) | 470 (17.7%) |
| Architecture & Engineering | 739 (89.4%) | 88 (10.6%) |
| Life, Physical & Social Science | 227 (53.4%) | 198 (46.6%) |
| Community & Social Service | 972 (28.0%) | 2,505 (72.0%) |
| Education, Arts & Media | 207 (54.5%) | 173 (45.5%) |
| Legal Services & Support | 202 (68.2%) | 94 (31.8%) |
| Education Instruction & Library | 324 (14.6%) | 1,897 (85.4%) |
| Arts, Media & Entertainment | 239 (41.2%) | 341 (58.8%) |
| Health Diagnosing & Treating | 952 (38.2%) | 1,539 (61.8%) |
| Health Technologists | 742 (39.4%) | 1,141 (60.6%) |
| Total (Category) | 11,378 (57.6%) | 8,368 (42.4%) |
| Total (Overall) | 21,610 (54.8%) | 17,804 (45.2%) |
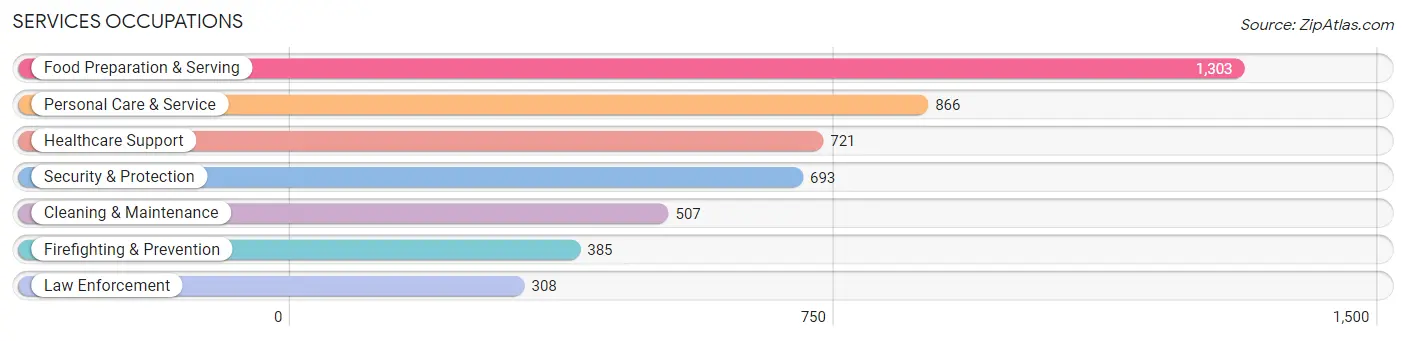
Services Occupations
The most common Services occupations in South Jordan are Food Preparation & Serving (1,303 | 3.3%), Personal Care & Service (866 | 2.2%), Healthcare Support (721 | 1.8%), Security & Protection (693 | 1.8%), and Cleaning & Maintenance (507 | 1.3%).
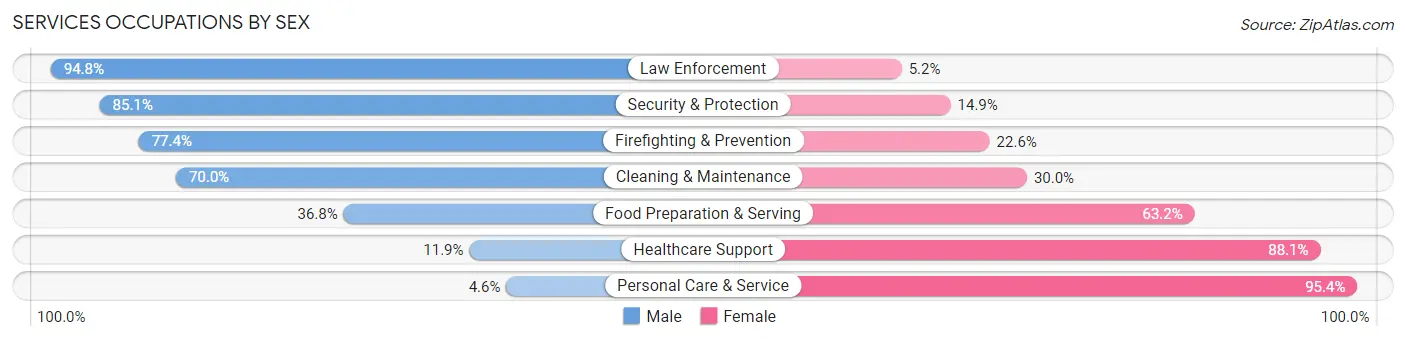
Services Occupations by Sex
Within the Services occupations in South Jordan, the most male-oriented occupations are Law Enforcement (94.8%), Security & Protection (85.1%), and Firefighting & Prevention (77.4%), while the most female-oriented occupations are Personal Care & Service (95.4%), Healthcare Support (88.1%), and Food Preparation & Serving (63.2%).
| Occupation | Male | Female |
| Healthcare Support | 86 (11.9%) | 635 (88.1%) |
| Security & Protection | 590 (85.1%) | 103 (14.9%) |
| Firefighting & Prevention | 298 (77.4%) | 87 (22.6%) |
| Law Enforcement | 292 (94.8%) | 16 (5.2%) |
| Food Preparation & Serving | 480 (36.8%) | 823 (63.2%) |
| Cleaning & Maintenance | 355 (70.0%) | 152 (30.0%) |
| Personal Care & Service | 40 (4.6%) | 826 (95.4%) |
| Total (Category) | 1,551 (37.9%) | 2,539 (62.1%) |
| Total (Overall) | 21,610 (54.8%) | 17,804 (45.2%) |
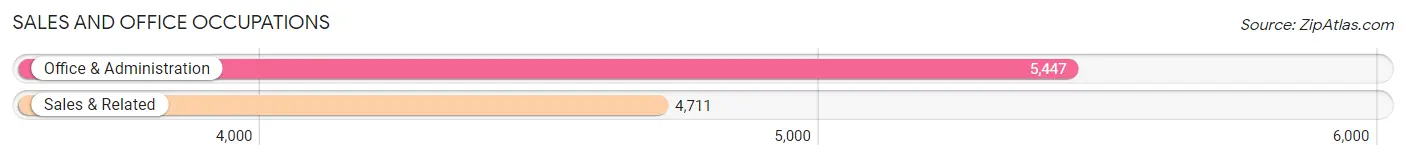
Sales and Office Occupations
The most common Sales and Office occupations in South Jordan are Office & Administration (5,447 | 13.8%), and Sales & Related (4,711 | 11.9%).
Sales and Office Occupations by Sex
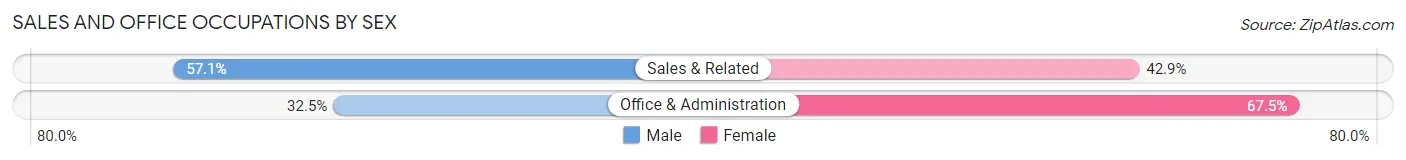
| Occupation | Male | Female |
| Sales & Related | 2,691 (57.1%) | 2,020 (42.9%) |
| Office & Administration | 1,772 (32.5%) | 3,675 (67.5%) |
| Total (Category) | 4,463 (43.9%) | 5,695 (56.1%) |
| Total (Overall) | 21,610 (54.8%) | 17,804 (45.2%) |
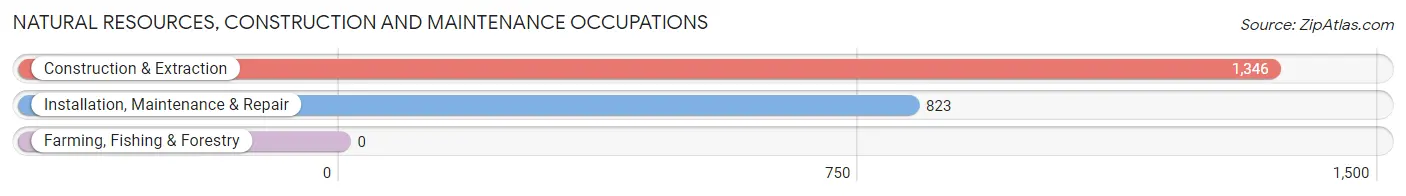
Natural Resources, Construction and Maintenance Occupations
The most common Natural Resources, Construction and Maintenance occupations in South Jordan are Construction & Extraction (1,346 | 3.4%), and Installation, Maintenance & Repair (823 | 2.1%).
Natural Resources, Construction and Maintenance Occupations by Sex
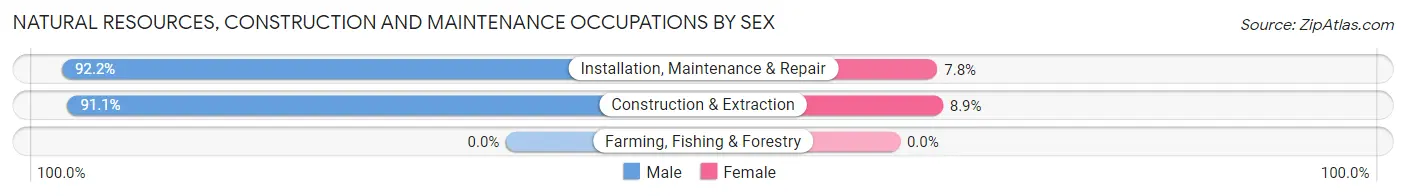
| Occupation | Male | Female |
| Farming, Fishing & Forestry | 0 (0.0%) | 0 (0.0%) |
| Construction & Extraction | 1,226 (91.1%) | 120 (8.9%) |
| Installation, Maintenance & Repair | 759 (92.2%) | 64 (7.8%) |
| Total (Category) | 1,985 (91.5%) | 184 (8.5%) |
| Total (Overall) | 21,610 (54.8%) | 17,804 (45.2%) |
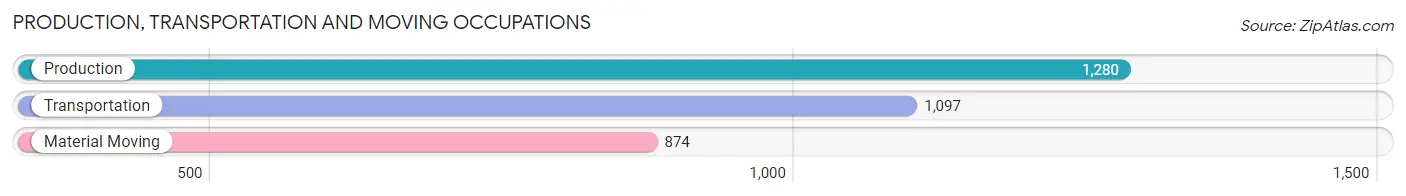
Production, Transportation and Moving Occupations
The most common Production, Transportation and Moving occupations in South Jordan are Production (1,280 | 3.3%), Transportation (1,097 | 2.8%), and Material Moving (874 | 2.2%).
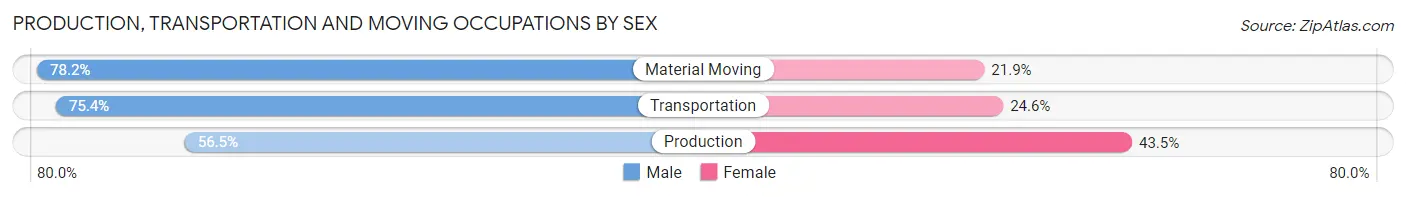
Production, Transportation and Moving Occupations by Sex
| Occupation | Male | Female |
| Production | 723 (56.5%) | 557 (43.5%) |
| Transportation | 827 (75.4%) | 270 (24.6%) |
| Material Moving | 683 (78.1%) | 191 (21.8%) |
| Total (Category) | 2,233 (68.7%) | 1,018 (31.3%) |
| Total (Overall) | 21,610 (54.8%) | 17,804 (45.2%) |
Employment Industries by Sex in South Jordan
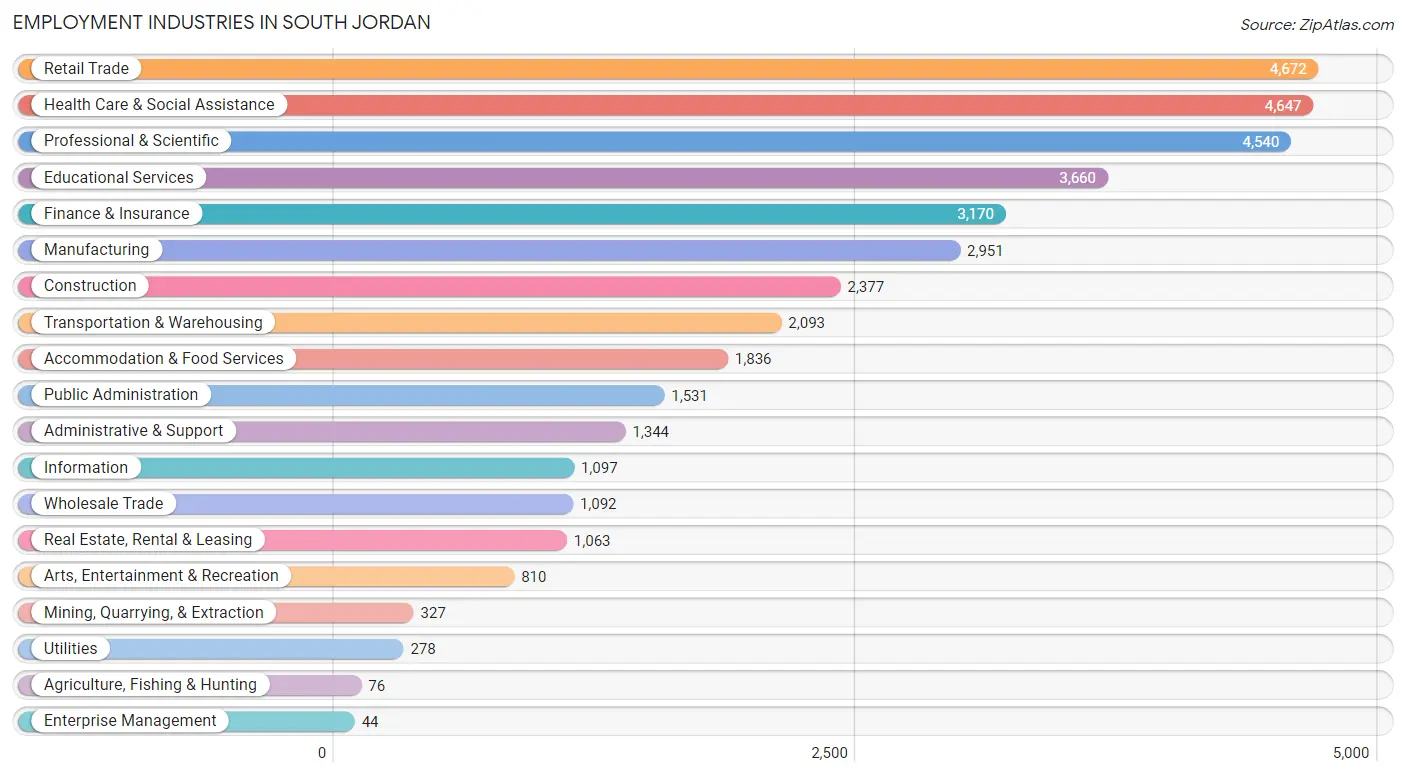
Employment Industries in South Jordan
The major employment industries in South Jordan include Retail Trade (4,672 | 11.8%), Health Care & Social Assistance (4,647 | 11.8%), Professional & Scientific (4,540 | 11.5%), Educational Services (3,660 | 9.3%), and Finance & Insurance (3,170 | 8.0%).
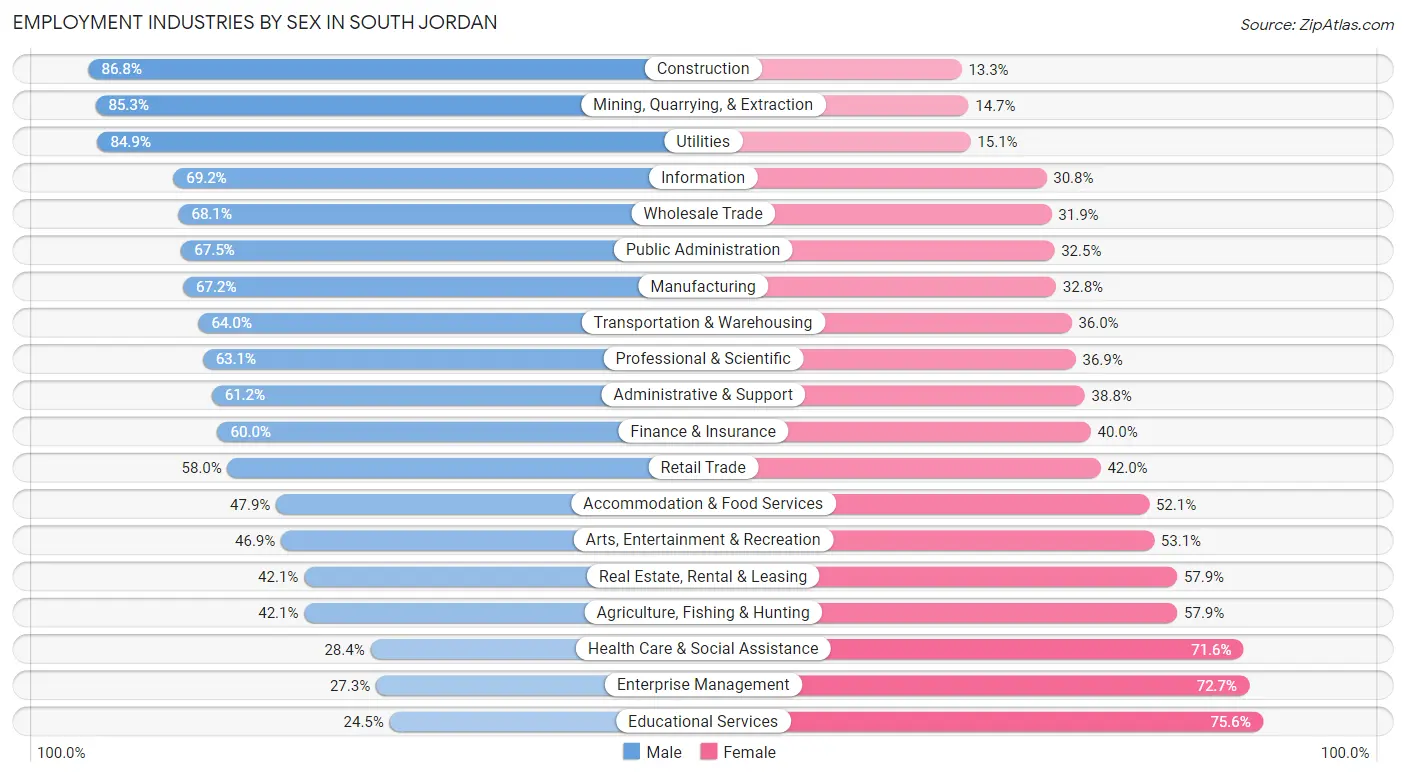
Employment Industries by Sex in South Jordan
The South Jordan industries that see more men than women are Construction (86.8%), Mining, Quarrying, & Extraction (85.3%), and Utilities (84.9%), whereas the industries that tend to have a higher number of women are Educational Services (75.5%), Enterprise Management (72.7%), and Health Care & Social Assistance (71.6%).
| Industry | Male | Female |
| Agriculture, Fishing & Hunting | 32 (42.1%) | 44 (57.9%) |
| Mining, Quarrying, & Extraction | 279 (85.3%) | 48 (14.7%) |
| Construction | 2,062 (86.8%) | 315 (13.3%) |
| Manufacturing | 1,983 (67.2%) | 968 (32.8%) |
| Wholesale Trade | 744 (68.1%) | 348 (31.9%) |
| Retail Trade | 2,709 (58.0%) | 1,963 (42.0%) |
| Transportation & Warehousing | 1,339 (64.0%) | 754 (36.0%) |
| Utilities | 236 (84.9%) | 42 (15.1%) |
| Information | 759 (69.2%) | 338 (30.8%) |
| Finance & Insurance | 1,903 (60.0%) | 1,267 (40.0%) |
| Real Estate, Rental & Leasing | 448 (42.1%) | 615 (57.9%) |
| Professional & Scientific | 2,866 (63.1%) | 1,674 (36.9%) |
| Enterprise Management | 12 (27.3%) | 32 (72.7%) |
| Administrative & Support | 823 (61.2%) | 521 (38.8%) |
| Educational Services | 895 (24.4%) | 2,765 (75.5%) |
| Health Care & Social Assistance | 1,320 (28.4%) | 3,327 (71.6%) |
| Arts, Entertainment & Recreation | 380 (46.9%) | 430 (53.1%) |
| Accommodation & Food Services | 880 (47.9%) | 956 (52.1%) |
| Public Administration | 1,034 (67.5%) | 497 (32.5%) |
| Total | 21,610 (54.8%) | 17,804 (45.2%) |
Education in South Jordan
School Enrollment in South Jordan
The most common levels of schooling among the 24,126 students in South Jordan are high school (5,724 | 23.7%), middle school (5,538 | 23.0%), and elementary school (5,352 | 22.2%).
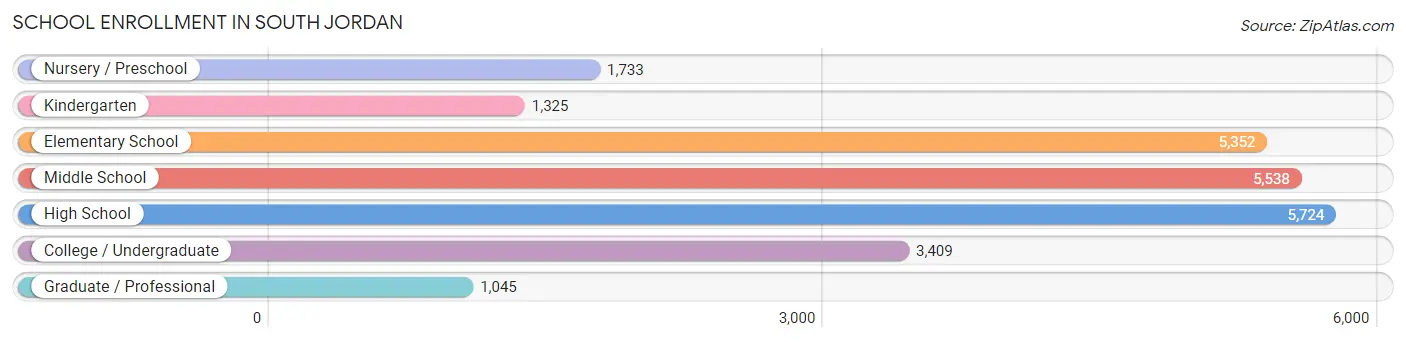
| School Level | # Students | % Students |
| Nursery / Preschool | 1,733 | 7.2% |
| Kindergarten | 1,325 | 5.5% |
| Elementary School | 5,352 | 22.2% |
| Middle School | 5,538 | 23.0% |
| High School | 5,724 | 23.7% |
| College / Undergraduate | 3,409 | 14.1% |
| Graduate / Professional | 1,045 | 4.3% |
| Total | 24,126 | 100.0% |
School Enrollment by Age by Funding Source in South Jordan
Out of a total of 24,126 students who are enrolled in schools in South Jordan, 3,257 (13.5%) attend a private institution, while the remaining 20,869 (86.5%) are enrolled in public schools. The age group of 3 to 4 year olds has the highest likelihood of being enrolled in private schools, with 758 (56.0% in the age bracket) enrolled. Conversely, the age group of 15 to 17 year olds has the lowest likelihood of being enrolled in a private school, with 4,121 (97.2% in the age bracket) attending a public institution.
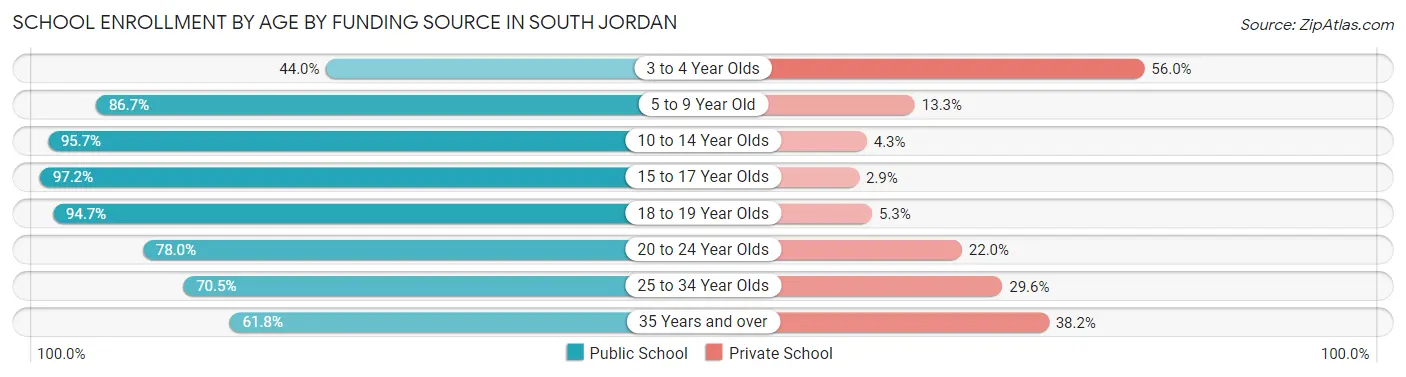
| Age Bracket | Public School | Private School |
| 3 to 4 Year Olds | 595 (44.0%) | 758 (56.0%) |
| 5 to 9 Year Old | 5,604 (86.7%) | 857 (13.3%) |
| 10 to 14 Year Olds | 6,524 (95.7%) | 294 (4.3%) |
| 15 to 17 Year Olds | 4,121 (97.2%) | 121 (2.9%) |
| 18 to 19 Year Olds | 1,239 (94.7%) | 69 (5.3%) |
| 20 to 24 Year Olds | 1,126 (78.0%) | 318 (22.0%) |
| 25 to 34 Year Olds | 968 (70.5%) | 406 (29.5%) |
| 35 Years and over | 696 (61.8%) | 430 (38.2%) |
| Total | 20,869 (86.5%) | 3,257 (13.5%) |
Educational Attainment by Field of Study in South Jordan
Business (5,500 | 22.7%), science & technology (2,724 | 11.2%), education (2,579 | 10.6%), computers & mathematics (1,877 | 7.7%), and social sciences (1,761 | 7.3%) are the most common fields of study among 24,234 individuals in South Jordan who have obtained a bachelor's degree or higher.
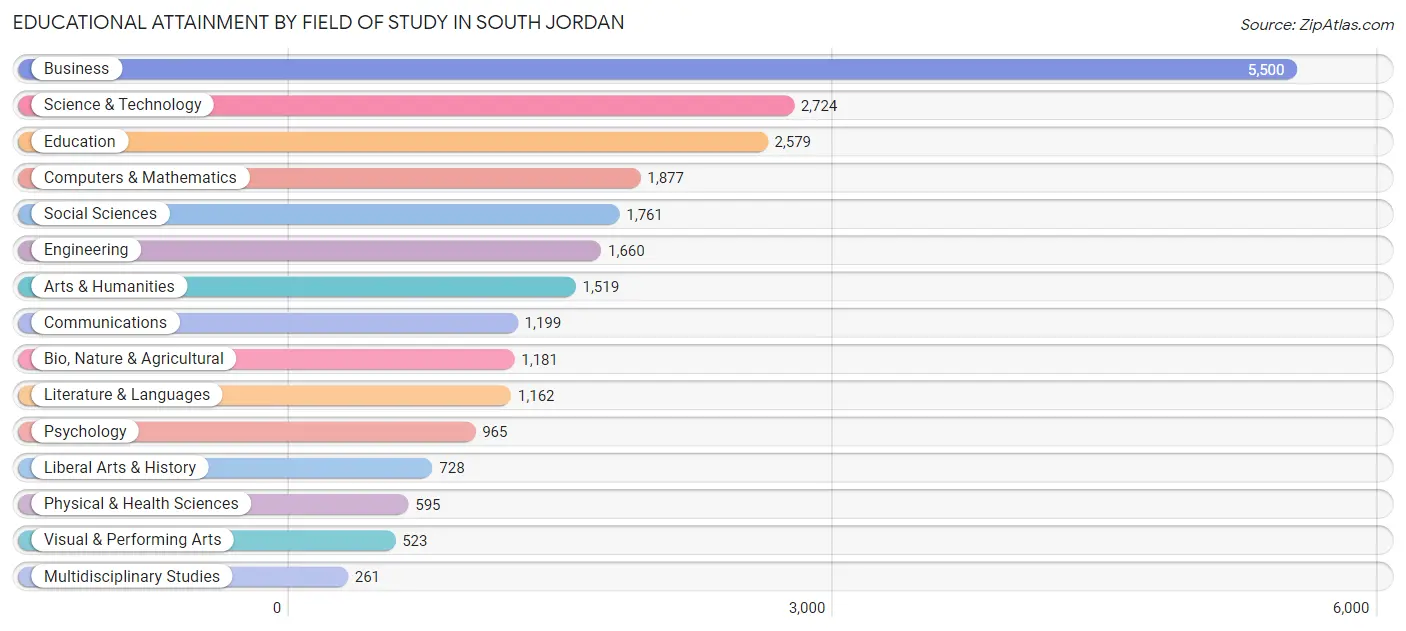
| Field of Study | # Graduates | % Graduates |
| Computers & Mathematics | 1,877 | 7.7% |
| Bio, Nature & Agricultural | 1,181 | 4.9% |
| Physical & Health Sciences | 595 | 2.5% |
| Psychology | 965 | 4.0% |
| Social Sciences | 1,761 | 7.3% |
| Engineering | 1,660 | 6.9% |
| Multidisciplinary Studies | 261 | 1.1% |
| Science & Technology | 2,724 | 11.2% |
| Business | 5,500 | 22.7% |
| Education | 2,579 | 10.6% |
| Literature & Languages | 1,162 | 4.8% |
| Liberal Arts & History | 728 | 3.0% |
| Visual & Performing Arts | 523 | 2.2% |
| Communications | 1,199 | 5.0% |
| Arts & Humanities | 1,519 | 6.3% |
| Total | 24,234 | 100.0% |
Transportation & Commute in South Jordan
Vehicle Availability by Sex in South Jordan
The most prevalent vehicle ownership categories in South Jordan are males with 2 vehicles (8,341, accounting for 38.9%) and females with 2 vehicles (5,988, making up 47.5%).
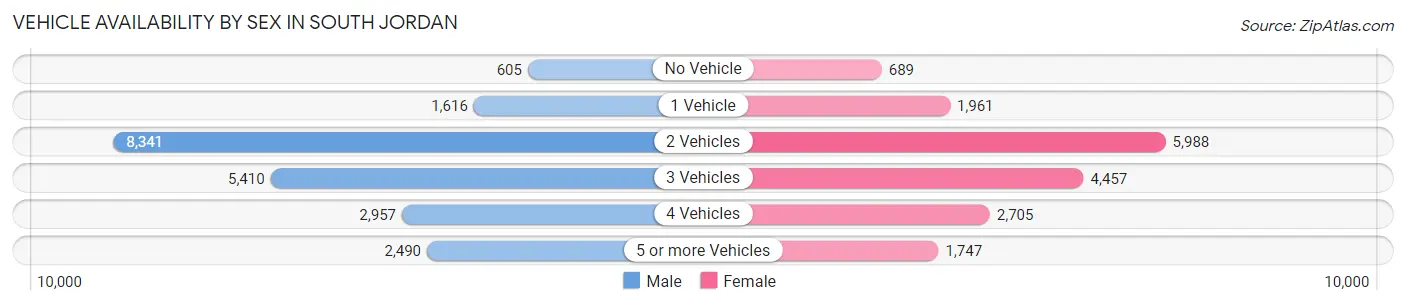
| Vehicles Available | Male | Female |
| No Vehicle | 605 (2.8%) | 689 (3.9%) |
| 1 Vehicle | 1,616 (7.5%) | 1,961 (11.2%) |
| 2 Vehicles | 8,341 (38.9%) | 5,988 (34.1%) |
| 3 Vehicles | 5,410 (25.3%) | 4,457 (25.4%) |
| 4 Vehicles | 2,957 (13.8%) | 2,705 (15.4%) |
| 5 or more Vehicles | 2,490 (11.6%) | 1,747 (10.0%) |
| Total | 21,419 (100.0%) | 17,547 (100.0%) |
Commute Time in South Jordan
The most frequently occuring commute durations in South Jordan are 15 to 19 minutes (5,729 commuters, 18.0%), 20 to 24 minutes (5,471 commuters, 17.2%), and 30 to 34 minutes (4,146 commuters, 13.0%).
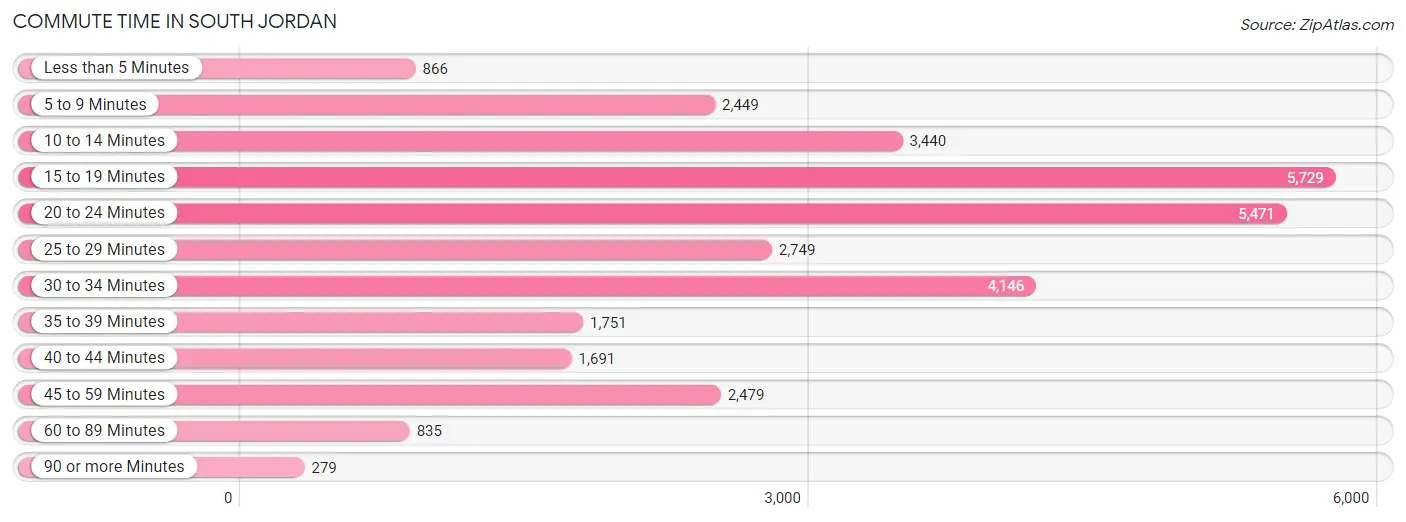
| Commute Time | # Commuters | % Commuters |
| Less than 5 Minutes | 866 | 2.7% |
| 5 to 9 Minutes | 2,449 | 7.7% |
| 10 to 14 Minutes | 3,440 | 10.8% |
| 15 to 19 Minutes | 5,729 | 18.0% |
| 20 to 24 Minutes | 5,471 | 17.2% |
| 25 to 29 Minutes | 2,749 | 8.6% |
| 30 to 34 Minutes | 4,146 | 13.0% |
| 35 to 39 Minutes | 1,751 | 5.5% |
| 40 to 44 Minutes | 1,691 | 5.3% |
| 45 to 59 Minutes | 2,479 | 7.8% |
| 60 to 89 Minutes | 835 | 2.6% |
| 90 or more Minutes | 279 | 0.9% |
Commute Time by Sex in South Jordan
The most common commute times in South Jordan are 15 to 19 minutes (3,196 commuters, 18.0%) for males and 15 to 19 minutes (2,533 commuters, 17.9%) for females.
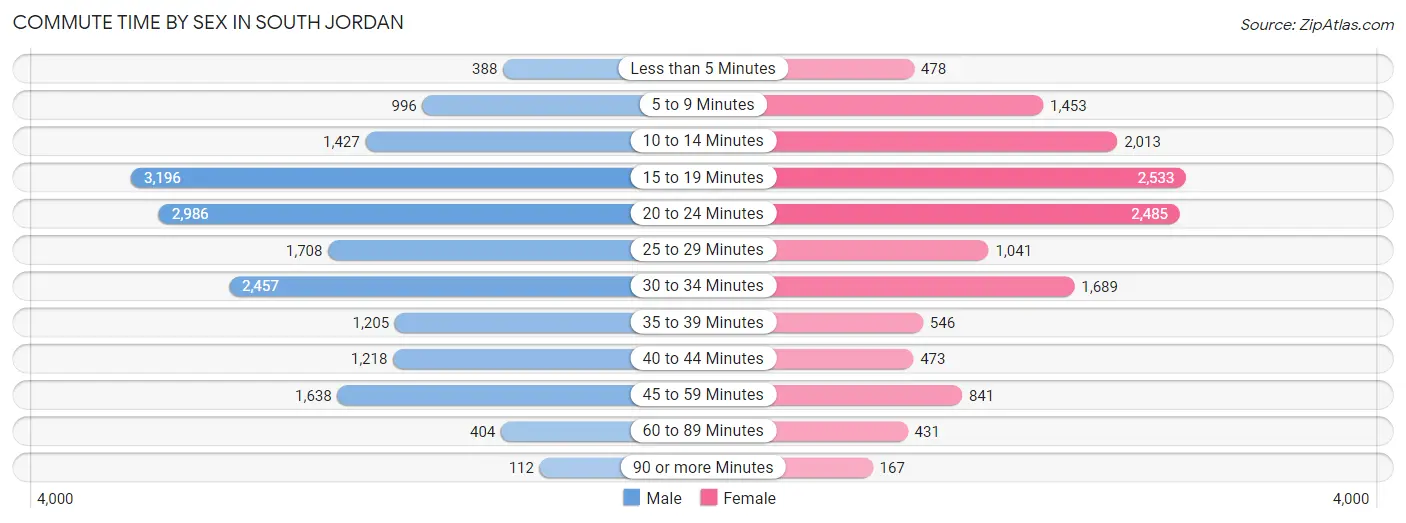
| Commute Time | Male | Female |
| Less than 5 Minutes | 388 (2.2%) | 478 (3.4%) |
| 5 to 9 Minutes | 996 (5.6%) | 1,453 (10.3%) |
| 10 to 14 Minutes | 1,427 (8.1%) | 2,013 (14.2%) |
| 15 to 19 Minutes | 3,196 (18.0%) | 2,533 (17.9%) |
| 20 to 24 Minutes | 2,986 (16.8%) | 2,485 (17.6%) |
| 25 to 29 Minutes | 1,708 (9.6%) | 1,041 (7.4%) |
| 30 to 34 Minutes | 2,457 (13.9%) | 1,689 (11.9%) |
| 35 to 39 Minutes | 1,205 (6.8%) | 546 (3.9%) |
| 40 to 44 Minutes | 1,218 (6.9%) | 473 (3.3%) |
| 45 to 59 Minutes | 1,638 (9.2%) | 841 (5.9%) |
| 60 to 89 Minutes | 404 (2.3%) | 431 (3.0%) |
| 90 or more Minutes | 112 (0.6%) | 167 (1.2%) |
Time of Departure to Work by Sex in South Jordan
The most frequent times of departure to work in South Jordan are 8:00 AM to 8:29 AM (3,143, 17.7%) for males and 8:00 AM to 8:29 AM (2,193, 15.5%) for females.
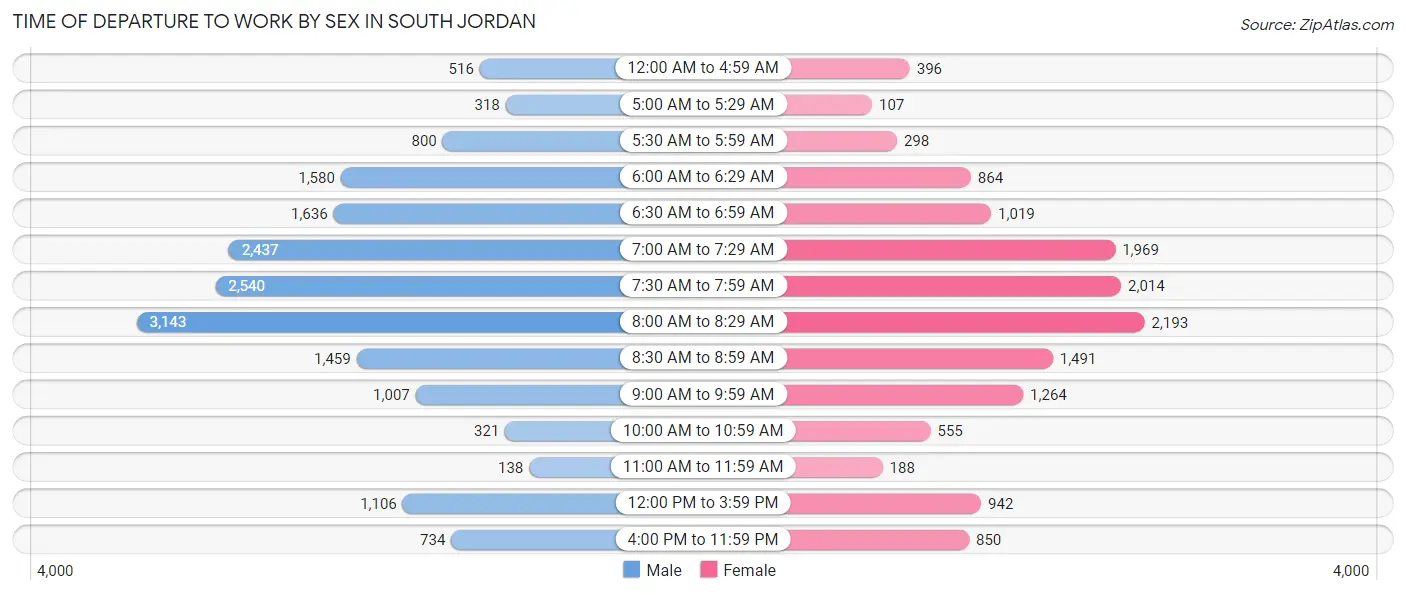
| Time of Departure | Male | Female |
| 12:00 AM to 4:59 AM | 516 (2.9%) | 396 (2.8%) |
| 5:00 AM to 5:29 AM | 318 (1.8%) | 107 (0.8%) |
| 5:30 AM to 5:59 AM | 800 (4.5%) | 298 (2.1%) |
| 6:00 AM to 6:29 AM | 1,580 (8.9%) | 864 (6.1%) |
| 6:30 AM to 6:59 AM | 1,636 (9.2%) | 1,019 (7.2%) |
| 7:00 AM to 7:29 AM | 2,437 (13.7%) | 1,969 (13.9%) |
| 7:30 AM to 7:59 AM | 2,540 (14.3%) | 2,014 (14.2%) |
| 8:00 AM to 8:29 AM | 3,143 (17.7%) | 2,193 (15.5%) |
| 8:30 AM to 8:59 AM | 1,459 (8.2%) | 1,491 (10.5%) |
| 9:00 AM to 9:59 AM | 1,007 (5.7%) | 1,264 (8.9%) |
| 10:00 AM to 10:59 AM | 321 (1.8%) | 555 (3.9%) |
| 11:00 AM to 11:59 AM | 138 (0.8%) | 188 (1.3%) |
| 12:00 PM to 3:59 PM | 1,106 (6.2%) | 942 (6.7%) |
| 4:00 PM to 11:59 PM | 734 (4.1%) | 850 (6.0%) |
| Total | 17,735 (100.0%) | 14,150 (100.0%) |
Housing Occupancy in South Jordan
Occupancy by Ownership in South Jordan
Of the total 24,429 dwellings in South Jordan, owner-occupied units account for 20,574 (84.2%), while renter-occupied units make up 3,855 (15.8%).
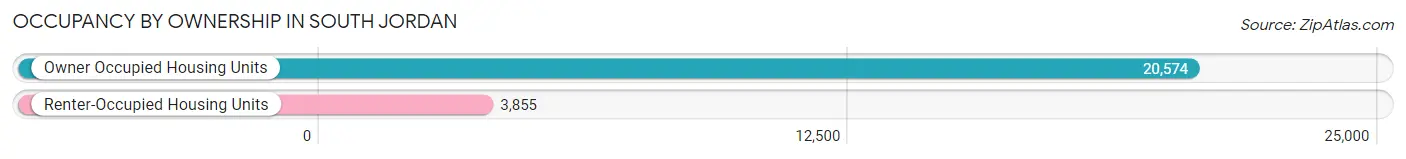
| Occupancy | # Housing Units | % Housing Units |
| Owner Occupied Housing Units | 20,574 | 84.2% |
| Renter-Occupied Housing Units | 3,855 | 15.8% |
| Total Occupied Housing Units | 24,429 | 100.0% |
Occupancy by Household Size in South Jordan
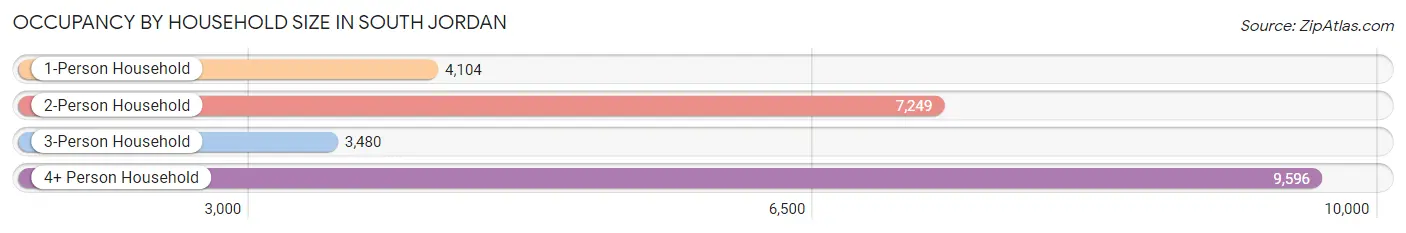
| Household Size | # Housing Units | % Housing Units |
| 1-Person Household | 4,104 | 16.8% |
| 2-Person Household | 7,249 | 29.7% |
| 3-Person Household | 3,480 | 14.2% |
| 4+ Person Household | 9,596 | 39.3% |
| Total Housing Units | 24,429 | 100.0% |
Occupancy by Ownership by Household Size in South Jordan
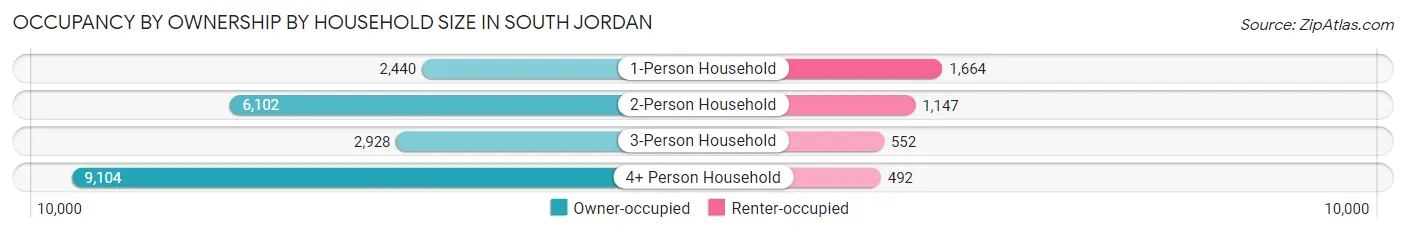
| Household Size | Owner-occupied | Renter-occupied |
| 1-Person Household | 2,440 (59.5%) | 1,664 (40.6%) |
| 2-Person Household | 6,102 (84.2%) | 1,147 (15.8%) |
| 3-Person Household | 2,928 (84.1%) | 552 (15.9%) |
| 4+ Person Household | 9,104 (94.9%) | 492 (5.1%) |
| Total Housing Units | 20,574 (84.2%) | 3,855 (15.8%) |
Occupancy by Educational Attainment in South Jordan
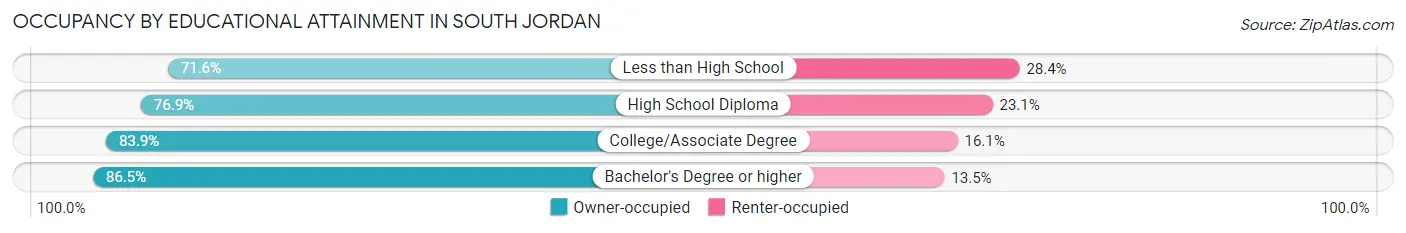
| Household Size | Owner-occupied | Renter-occupied |
| Less than High School | 247 (71.6%) | 98 (28.4%) |
| High School Diploma | 2,211 (76.9%) | 663 (23.1%) |
| College/Associate Degree | 7,182 (83.9%) | 1,382 (16.1%) |
| Bachelor's Degree or higher | 10,934 (86.5%) | 1,712 (13.5%) |
Occupancy by Age of Householder in South Jordan
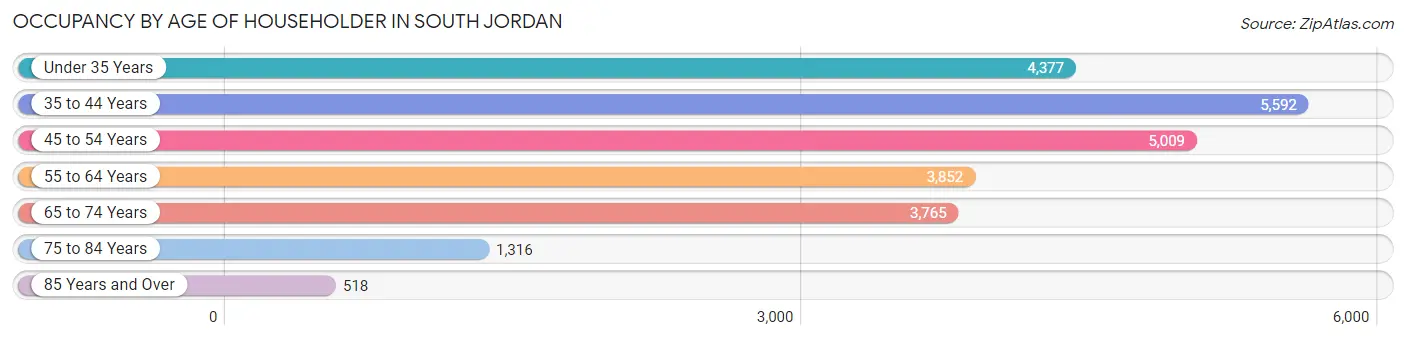
| Age Bracket | # Households | % Households |
| Under 35 Years | 4,377 | 17.9% |
| 35 to 44 Years | 5,592 | 22.9% |
| 45 to 54 Years | 5,009 | 20.5% |
| 55 to 64 Years | 3,852 | 15.8% |
| 65 to 74 Years | 3,765 | 15.4% |
| 75 to 84 Years | 1,316 | 5.4% |
| 85 Years and Over | 518 | 2.1% |
| Total | 24,429 | 100.0% |
Housing Finances in South Jordan
Median Income by Occupancy in South Jordan
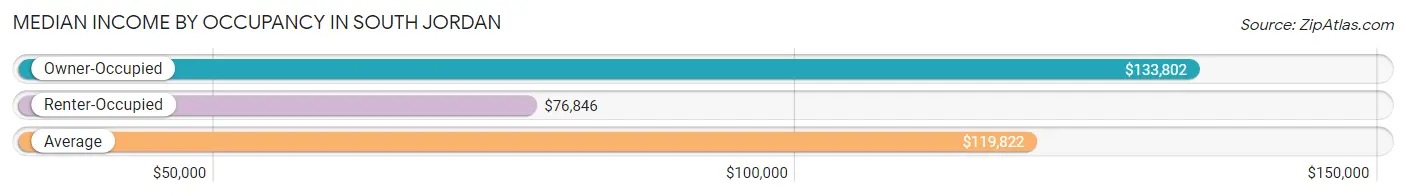
| Occupancy Type | # Households | Median Income |
| Owner-Occupied | 20,574 (84.2%) | $133,802 |
| Renter-Occupied | 3,855 (15.8%) | $76,846 |
| Average | 24,429 (100.0%) | $119,822 |
Occupancy by Householder Income Bracket in South Jordan
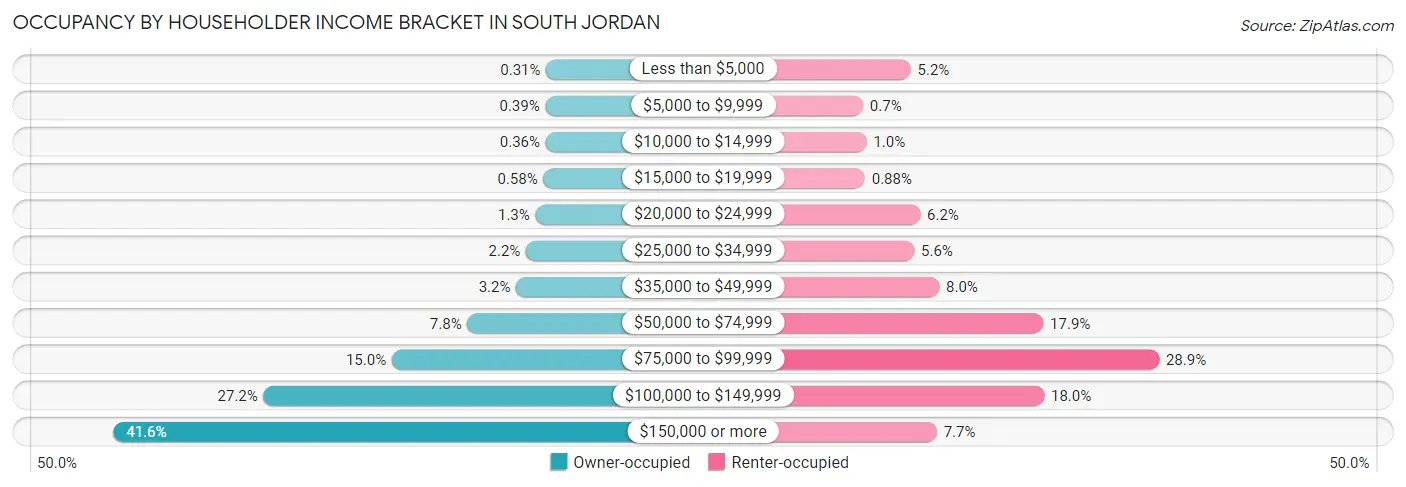
| Income Bracket | Owner-occupied | Renter-occupied |
| Less than $5,000 | 63 (0.3%) | 202 (5.2%) |
| $5,000 to $9,999 | 81 (0.4%) | 27 (0.7%) |
| $10,000 to $14,999 | 75 (0.4%) | 40 (1.0%) |
| $15,000 to $19,999 | 120 (0.6%) | 34 (0.9%) |
| $20,000 to $24,999 | 274 (1.3%) | 237 (6.1%) |
| $25,000 to $34,999 | 459 (2.2%) | 215 (5.6%) |
| $35,000 to $49,999 | 653 (3.2%) | 307 (8.0%) |
| $50,000 to $74,999 | 1,608 (7.8%) | 689 (17.9%) |
| $75,000 to $99,999 | 3,089 (15.0%) | 1,114 (28.9%) |
| $100,000 to $149,999 | 5,604 (27.2%) | 692 (17.9%) |
| $150,000 or more | 8,548 (41.5%) | 298 (7.7%) |
| Total | 20,574 (100.0%) | 3,855 (100.0%) |
Monthly Housing Cost Tiers in South Jordan
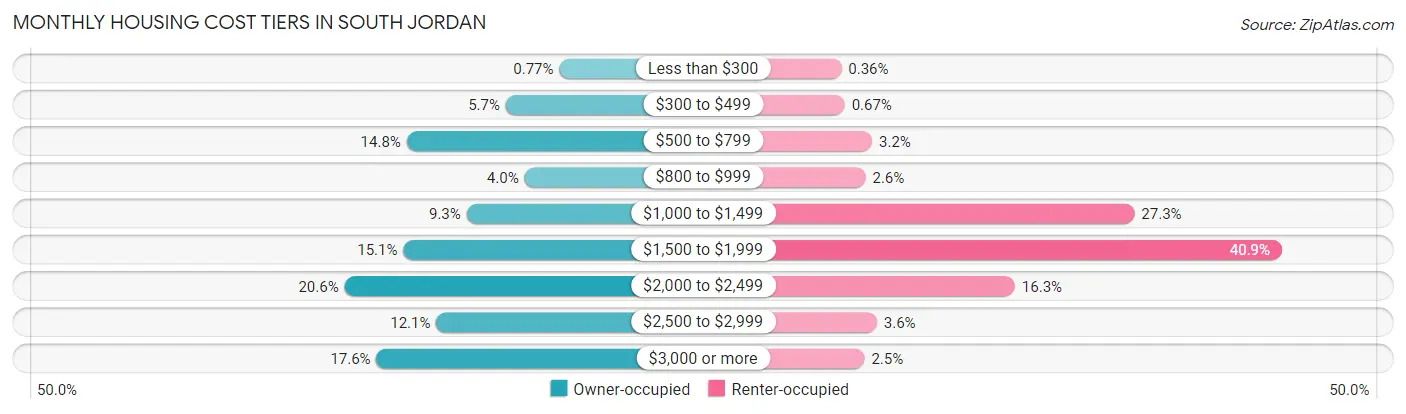
| Monthly Cost | Owner-occupied | Renter-occupied |
| Less than $300 | 159 (0.8%) | 14 (0.4%) |
| $300 to $499 | 1,173 (5.7%) | 26 (0.7%) |
| $500 to $799 | 3,051 (14.8%) | 123 (3.2%) |
| $800 to $999 | 819 (4.0%) | 100 (2.6%) |
| $1,000 to $1,499 | 1,916 (9.3%) | 1,054 (27.3%) |
| $1,500 to $1,999 | 3,115 (15.1%) | 1,577 (40.9%) |
| $2,000 to $2,499 | 4,227 (20.5%) | 630 (16.3%) |
| $2,500 to $2,999 | 2,490 (12.1%) | 140 (3.6%) |
| $3,000 or more | 3,624 (17.6%) | 96 (2.5%) |
| Total | 20,574 (100.0%) | 3,855 (100.0%) |
Physical Housing Characteristics in South Jordan
Housing Structures in South Jordan
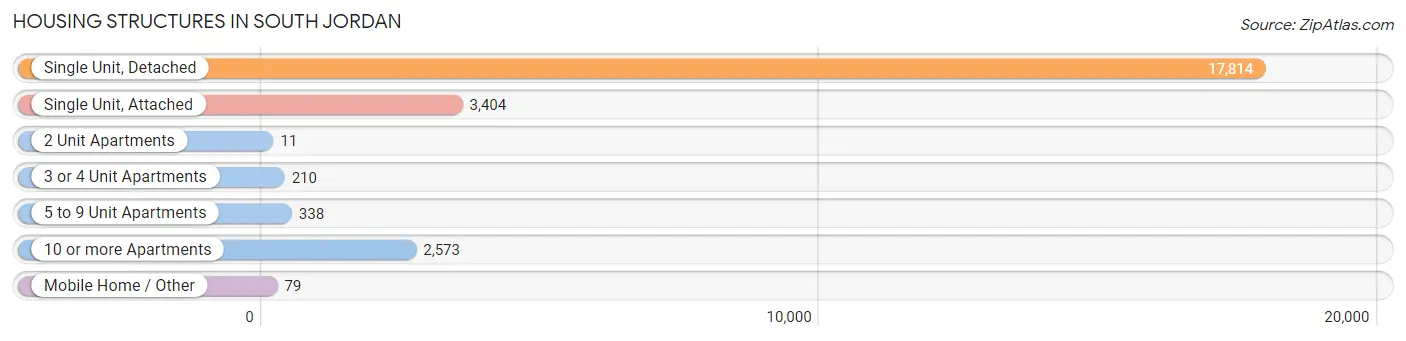
| Structure Type | # Housing Units | % Housing Units |
| Single Unit, Detached | 17,814 | 72.9% |
| Single Unit, Attached | 3,404 | 13.9% |
| 2 Unit Apartments | 11 | 0.1% |
| 3 or 4 Unit Apartments | 210 | 0.9% |
| 5 to 9 Unit Apartments | 338 | 1.4% |
| 10 or more Apartments | 2,573 | 10.5% |
| Mobile Home / Other | 79 | 0.3% |
| Total | 24,429 | 100.0% |
Housing Structures by Occupancy in South Jordan
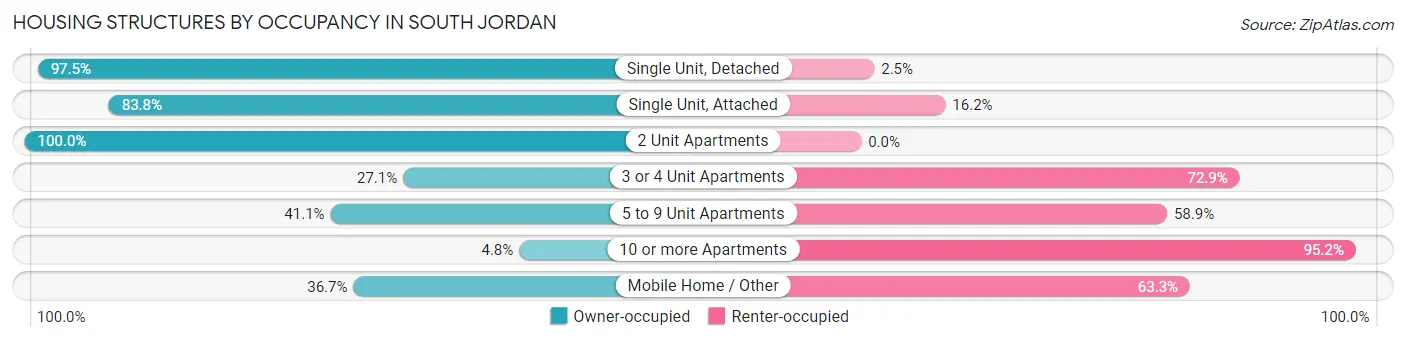
| Structure Type | Owner-occupied | Renter-occupied |
| Single Unit, Detached | 17,363 (97.5%) | 451 (2.5%) |
| Single Unit, Attached | 2,852 (83.8%) | 552 (16.2%) |
| 2 Unit Apartments | 11 (100.0%) | 0 (0.0%) |
| 3 or 4 Unit Apartments | 57 (27.1%) | 153 (72.9%) |
| 5 to 9 Unit Apartments | 139 (41.1%) | 199 (58.9%) |
| 10 or more Apartments | 123 (4.8%) | 2,450 (95.2%) |
| Mobile Home / Other | 29 (36.7%) | 50 (63.3%) |
| Total | 20,574 (84.2%) | 3,855 (15.8%) |
Housing Structures by Number of Rooms in South Jordan
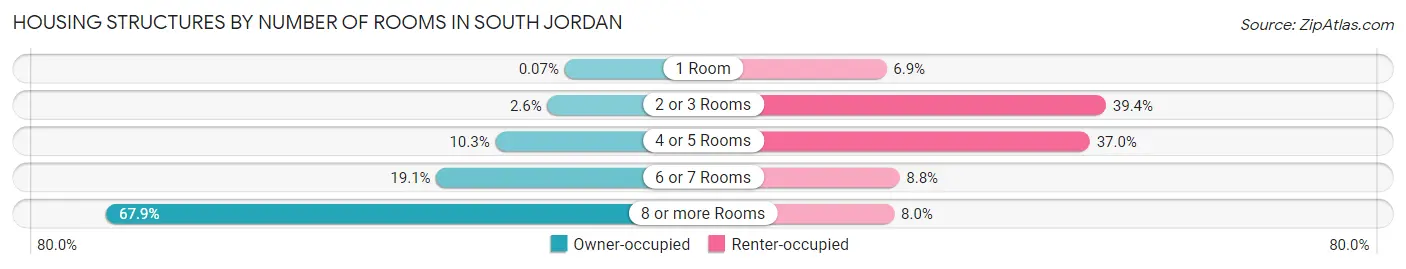
| Number of Rooms | Owner-occupied | Renter-occupied |
| 1 Room | 14 (0.1%) | 265 (6.9%) |
| 2 or 3 Rooms | 538 (2.6%) | 1,517 (39.4%) |
| 4 or 5 Rooms | 2,123 (10.3%) | 1,425 (37.0%) |
| 6 or 7 Rooms | 3,922 (19.1%) | 339 (8.8%) |
| 8 or more Rooms | 13,977 (67.9%) | 309 (8.0%) |
| Total | 20,574 (100.0%) | 3,855 (100.0%) |
Housing Structure by Heating Type in South Jordan
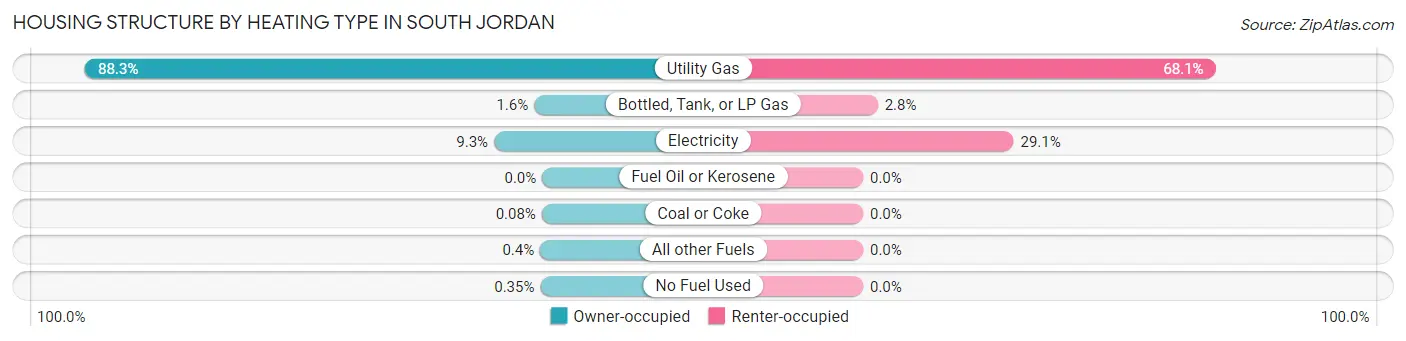
| Heating Type | Owner-occupied | Renter-occupied |
| Utility Gas | 18,168 (88.3%) | 2,625 (68.1%) |
| Bottled, Tank, or LP Gas | 320 (1.6%) | 109 (2.8%) |
| Electricity | 1,914 (9.3%) | 1,121 (29.1%) |
| Fuel Oil or Kerosene | 0 (0.0%) | 0 (0.0%) |
| Coal or Coke | 17 (0.1%) | 0 (0.0%) |
| All other Fuels | 82 (0.4%) | 0 (0.0%) |
| No Fuel Used | 73 (0.4%) | 0 (0.0%) |
| Total | 20,574 (100.0%) | 3,855 (100.0%) |
Household Vehicle Usage in South Jordan
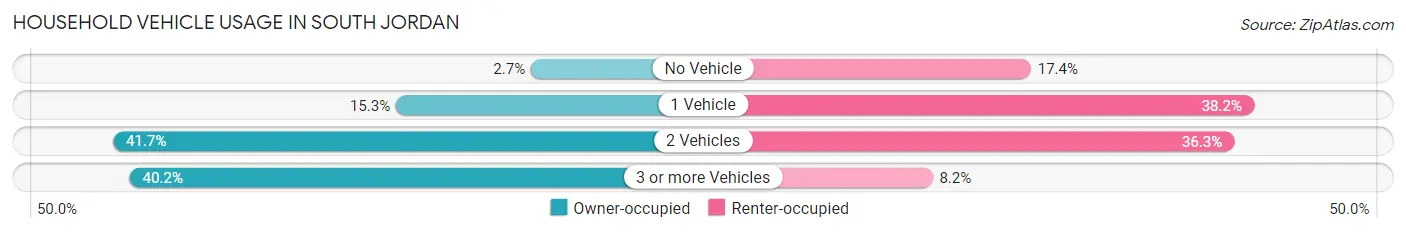
| Vehicles per Household | Owner-occupied | Renter-occupied |
| No Vehicle | 562 (2.7%) | 669 (17.3%) |
| 1 Vehicle | 3,154 (15.3%) | 1,471 (38.2%) |
| 2 Vehicles | 8,587 (41.7%) | 1,400 (36.3%) |
| 3 or more Vehicles | 8,271 (40.2%) | 315 (8.2%) |
| Total | 20,574 (100.0%) | 3,855 (100.0%) |
Real Estate & Mortgages in South Jordan
Real Estate and Mortgage Overview in South Jordan
| Characteristic | Without Mortgage | With Mortgage |
| Housing Units | 5,192 | 15,382 |
| Median Property Value | $571,100 | $555,700 |
| Median Household Income | $108,929 | $6,874 |
| Monthly Housing Costs | $620 | $3,624 |
| Real Estate Taxes | $2,913 | $261 |
Property Value by Mortgage Status in South Jordan
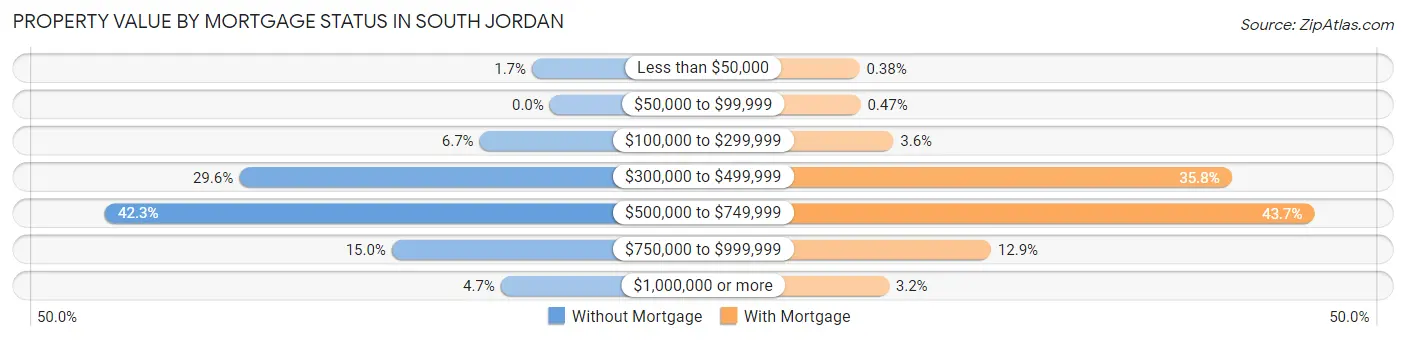
| Property Value | Without Mortgage | With Mortgage |
| Less than $50,000 | 88 (1.7%) | 59 (0.4%) |
| $50,000 to $99,999 | 0 (0.0%) | 73 (0.5%) |
| $100,000 to $299,999 | 347 (6.7%) | 554 (3.6%) |
| $300,000 to $499,999 | 1,536 (29.6%) | 5,507 (35.8%) |
| $500,000 to $749,999 | 2,198 (42.3%) | 6,720 (43.7%) |
| $750,000 to $999,999 | 781 (15.0%) | 1,982 (12.9%) |
| $1,000,000 or more | 242 (4.7%) | 487 (3.2%) |
| Total | 5,192 (100.0%) | 15,382 (100.0%) |
Household Income by Mortgage Status in South Jordan
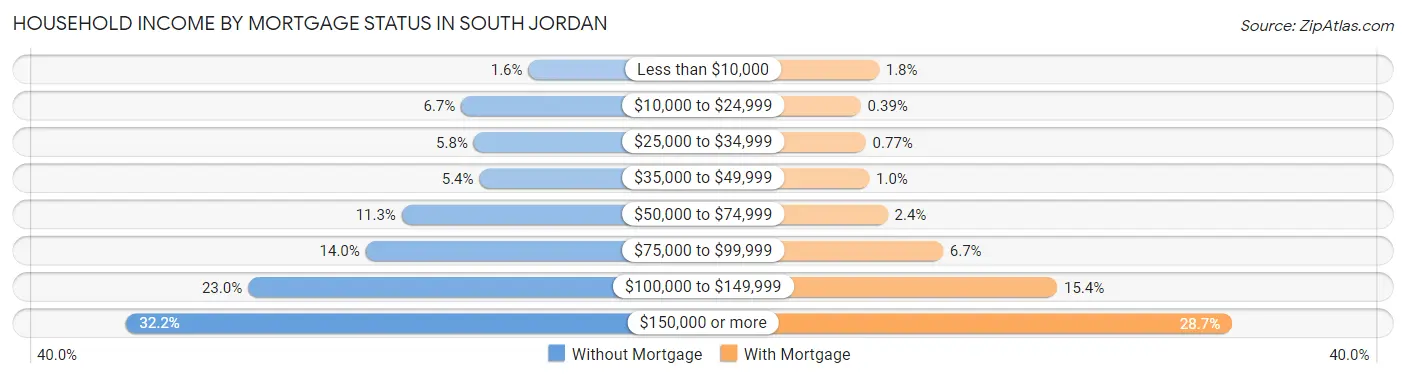
| Household Income | Without Mortgage | With Mortgage |
| Less than $10,000 | 84 (1.6%) | 272 (1.8%) |
| $10,000 to $24,999 | 350 (6.7%) | 60 (0.4%) |
| $25,000 to $34,999 | 300 (5.8%) | 119 (0.8%) |
| $35,000 to $49,999 | 278 (5.3%) | 159 (1.0%) |
| $50,000 to $74,999 | 585 (11.3%) | 375 (2.4%) |
| $75,000 to $99,999 | 728 (14.0%) | 1,023 (6.7%) |
| $100,000 to $149,999 | 1,193 (23.0%) | 2,361 (15.3%) |
| $150,000 or more | 1,674 (32.2%) | 4,411 (28.7%) |
| Total | 5,192 (100.0%) | 15,382 (100.0%) |
Property Value to Household Income Ratio in South Jordan
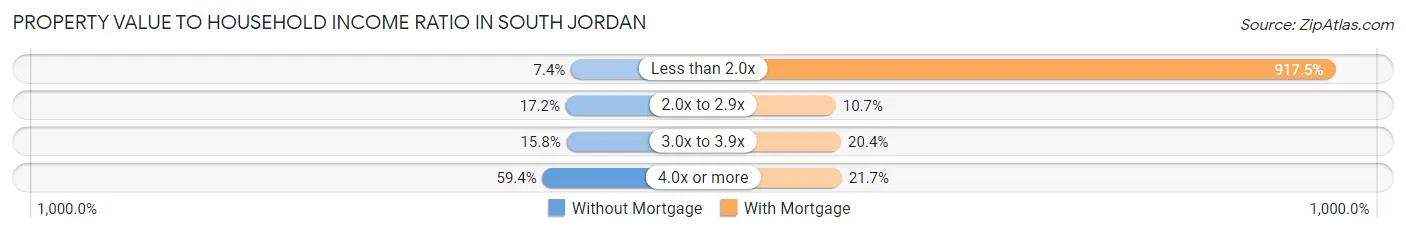
| Value-to-Income Ratio | Without Mortgage | With Mortgage |
| Less than 2.0x | 384 (7.4%) | 141,129 (917.5%) |
| 2.0x to 2.9x | 891 (17.2%) | 1,642 (10.7%) |
| 3.0x to 3.9x | 822 (15.8%) | 3,142 (20.4%) |
| 4.0x or more | 3,082 (59.4%) | 3,338 (21.7%) |
| Total | 5,192 (100.0%) | 15,382 (100.0%) |
Real Estate Taxes by Mortgage Status in South Jordan
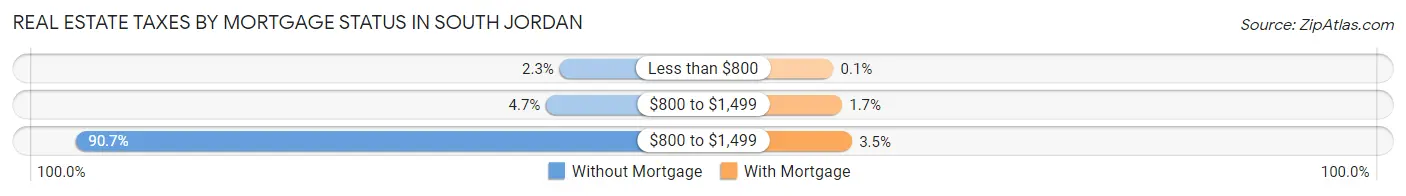
| Property Taxes | Without Mortgage | With Mortgage |
| Less than $800 | 118 (2.3%) | 15 (0.1%) |
| $800 to $1,499 | 246 (4.7%) | 260 (1.7%) |
| $800 to $1,499 | 4,711 (90.7%) | 540 (3.5%) |
| Total | 5,192 (100.0%) | 15,382 (100.0%) |
Health & Disability in South Jordan
Health Insurance Coverage by Age in South Jordan
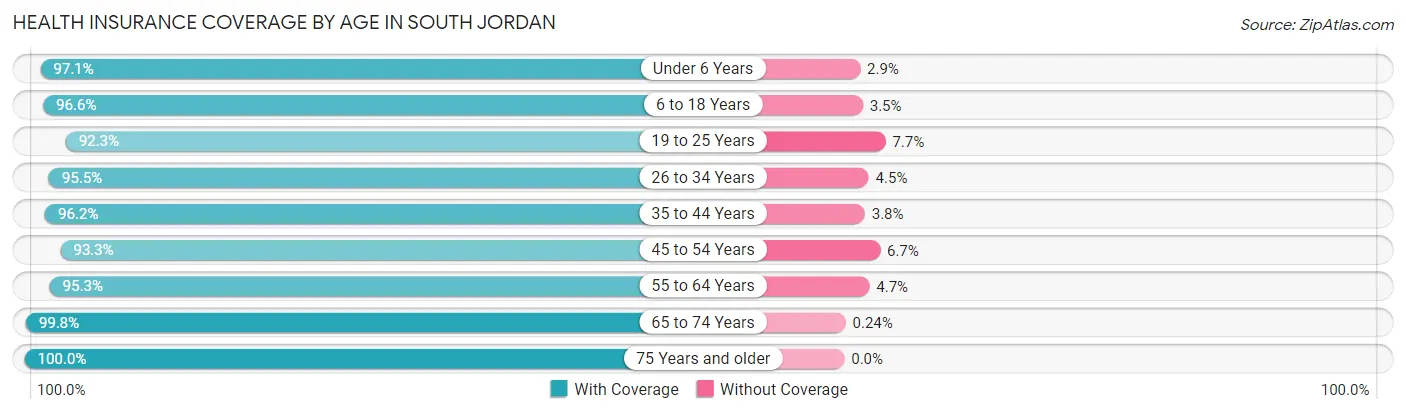
| Age Bracket | With Coverage | Without Coverage |
| Under 6 Years | 6,801 (97.1%) | 206 (2.9%) |
| 6 to 18 Years | 17,088 (96.6%) | 611 (3.5%) |
| 19 to 25 Years | 5,083 (92.3%) | 423 (7.7%) |
| 26 to 34 Years | 9,063 (95.5%) | 431 (4.5%) |
| 35 to 44 Years | 11,051 (96.2%) | 439 (3.8%) |
| 45 to 54 Years | 9,251 (93.3%) | 660 (6.7%) |
| 55 to 64 Years | 6,847 (95.3%) | 336 (4.7%) |
| 65 to 74 Years | 6,636 (99.8%) | 16 (0.2%) |
| 75 Years and older | 3,098 (100.0%) | 0 (0.0%) |
| Total | 74,918 (96.0%) | 3,122 (4.0%) |
Health Insurance Coverage by Citizenship Status in South Jordan
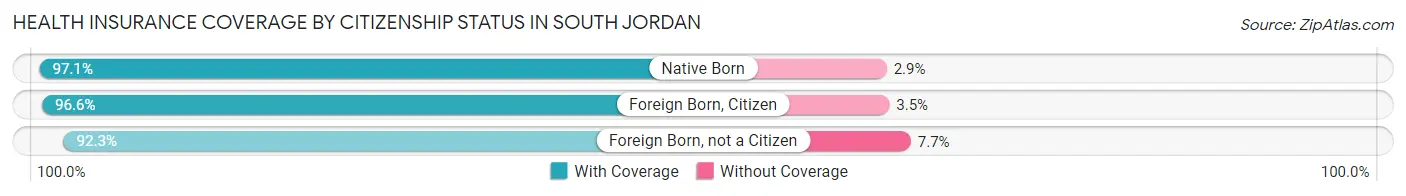
| Citizenship Status | With Coverage | Without Coverage |
| Native Born | 6,801 (97.1%) | 206 (2.9%) |
| Foreign Born, Citizen | 17,088 (96.6%) | 611 (3.5%) |
| Foreign Born, not a Citizen | 5,083 (92.3%) | 423 (7.7%) |
Health Insurance Coverage by Household Income in South Jordan
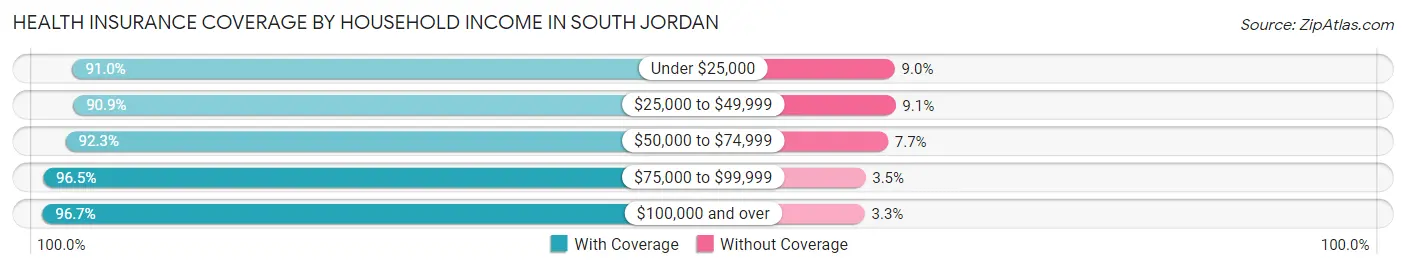
| Household Income | With Coverage | Without Coverage |
| Under $25,000 | 1,562 (91.0%) | 154 (9.0%) |
| $25,000 to $49,999 | 2,792 (90.9%) | 280 (9.1%) |
| $50,000 to $74,999 | 4,970 (92.3%) | 414 (7.7%) |
| $75,000 to $99,999 | 10,362 (96.5%) | 371 (3.5%) |
| $100,000 and over | 55,230 (96.7%) | 1,903 (3.3%) |
Public vs Private Health Insurance Coverage by Age in South Jordan
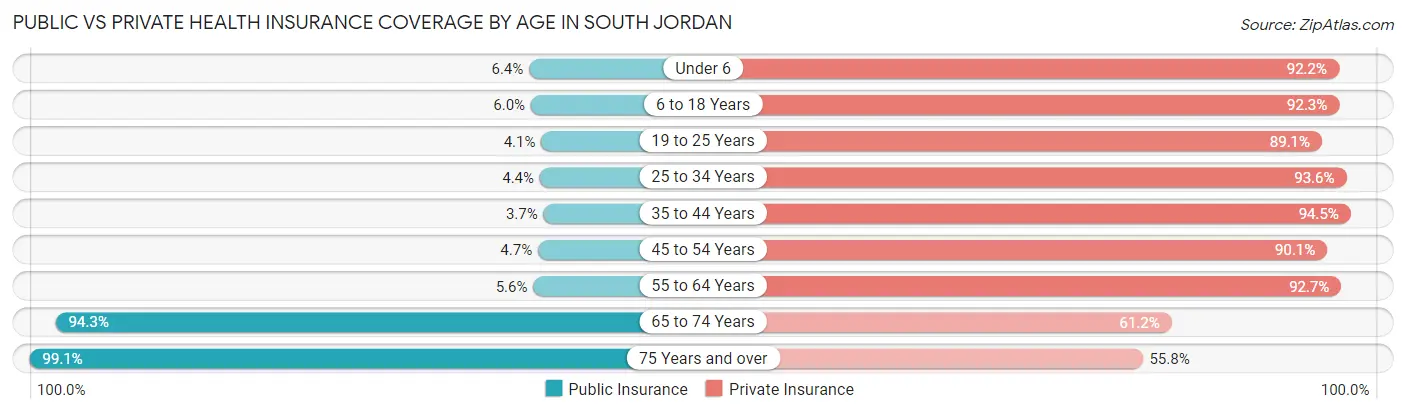
| Age Bracket | Public Insurance | Private Insurance |
| Under 6 | 445 (6.4%) | 6,463 (92.2%) |
| 6 to 18 Years | 1,065 (6.0%) | 16,336 (92.3%) |
| 19 to 25 Years | 226 (4.1%) | 4,906 (89.1%) |
| 25 to 34 Years | 414 (4.4%) | 8,890 (93.6%) |
| 35 to 44 Years | 422 (3.7%) | 10,852 (94.5%) |
| 45 to 54 Years | 467 (4.7%) | 8,928 (90.1%) |
| 55 to 64 Years | 401 (5.6%) | 6,658 (92.7%) |
| 65 to 74 Years | 6,270 (94.3%) | 4,072 (61.2%) |
| 75 Years and over | 3,070 (99.1%) | 1,729 (55.8%) |
| Total | 12,780 (16.4%) | 68,834 (88.2%) |
Disability Status by Sex by Age in South Jordan
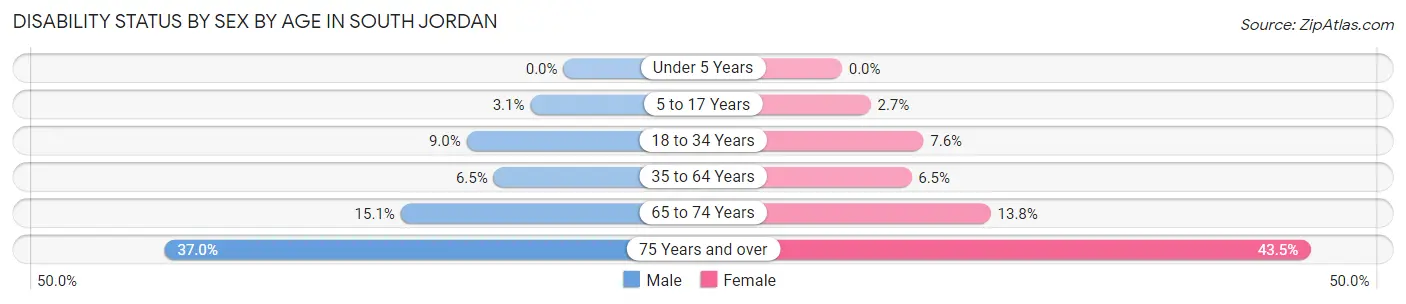
| Age Bracket | Male | Female |
| Under 5 Years | 0 (0.0%) | 0 (0.0%) |
| 5 to 17 Years | 269 (3.1%) | 251 (2.7%) |
| 18 to 34 Years | 701 (9.0%) | 613 (7.6%) |
| 35 to 64 Years | 915 (6.5%) | 932 (6.5%) |
| 65 to 74 Years | 493 (15.1%) | 468 (13.8%) |
| 75 Years and over | 500 (37.0%) | 759 (43.4%) |
Disability Class by Sex by Age in South Jordan
Disability Class: Hearing Difficulty
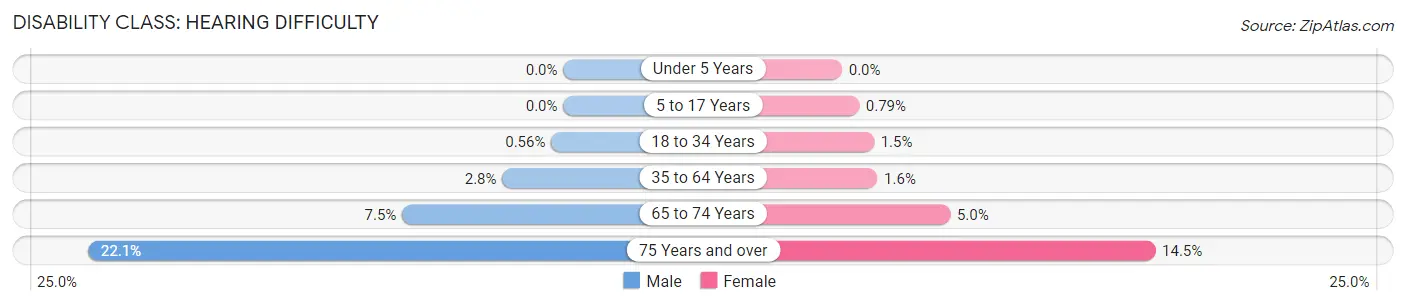
| Age Bracket | Male | Female |
| Under 5 Years | 0 (0.0%) | 0 (0.0%) |
| 5 to 17 Years | 0 (0.0%) | 74 (0.8%) |
| 18 to 34 Years | 44 (0.6%) | 120 (1.5%) |
| 35 to 64 Years | 400 (2.8%) | 237 (1.6%) |
| 65 to 74 Years | 244 (7.5%) | 170 (5.0%) |
| 75 Years and over | 298 (22.1%) | 254 (14.5%) |
Disability Class: Vision Difficulty
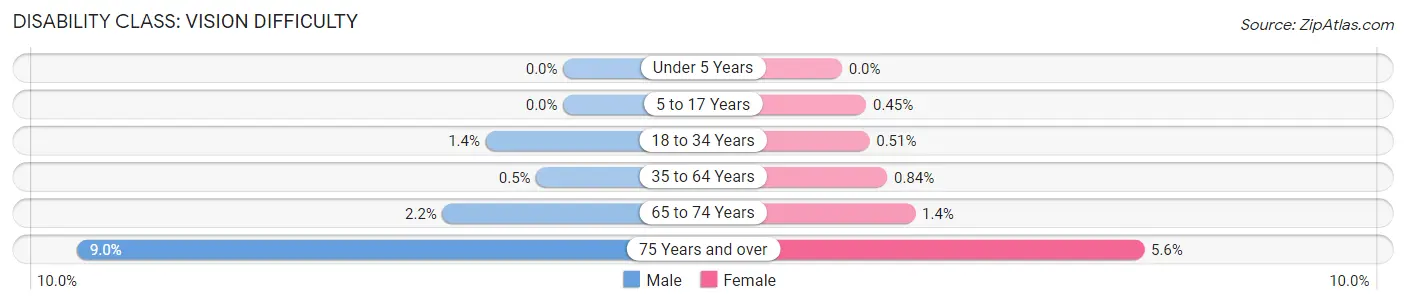
| Age Bracket | Male | Female |
| Under 5 Years | 0 (0.0%) | 0 (0.0%) |
| 5 to 17 Years | 0 (0.0%) | 42 (0.4%) |
| 18 to 34 Years | 112 (1.4%) | 41 (0.5%) |
| 35 to 64 Years | 70 (0.5%) | 122 (0.8%) |
| 65 to 74 Years | 73 (2.2%) | 46 (1.4%) |
| 75 Years and over | 122 (9.0%) | 98 (5.6%) |
Disability Class: Cognitive Difficulty
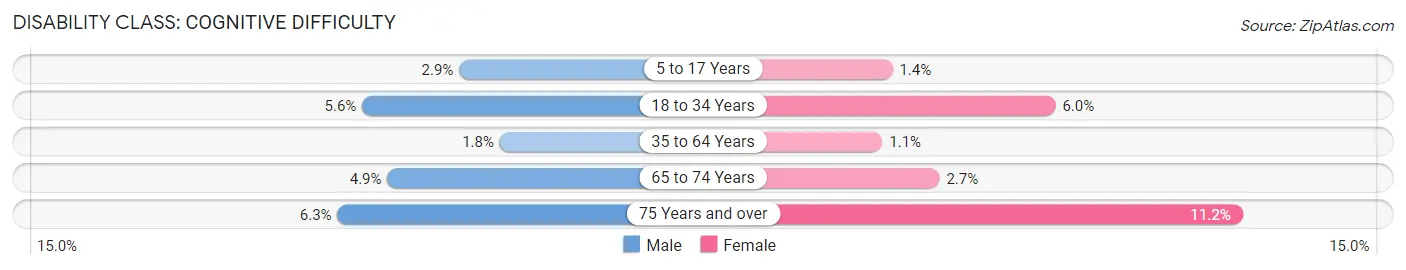
| Age Bracket | Male | Female |
| 5 to 17 Years | 254 (2.9%) | 133 (1.4%) |
| 18 to 34 Years | 437 (5.6%) | 482 (5.9%) |
| 35 to 64 Years | 250 (1.8%) | 164 (1.1%) |
| 65 to 74 Years | 160 (4.9%) | 92 (2.7%) |
| 75 Years and over | 85 (6.3%) | 195 (11.2%) |
Disability Class: Ambulatory Difficulty
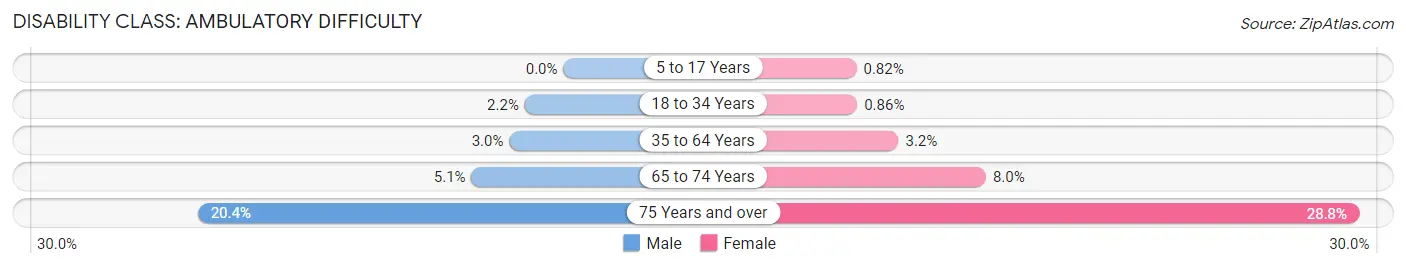
| Age Bracket | Male | Female |
| 5 to 17 Years | 0 (0.0%) | 77 (0.8%) |
| 18 to 34 Years | 168 (2.1%) | 70 (0.9%) |
| 35 to 64 Years | 425 (3.0%) | 457 (3.2%) |
| 65 to 74 Years | 167 (5.1%) | 272 (8.0%) |
| 75 Years and over | 275 (20.4%) | 503 (28.8%) |
Disability Class: Self-Care Difficulty
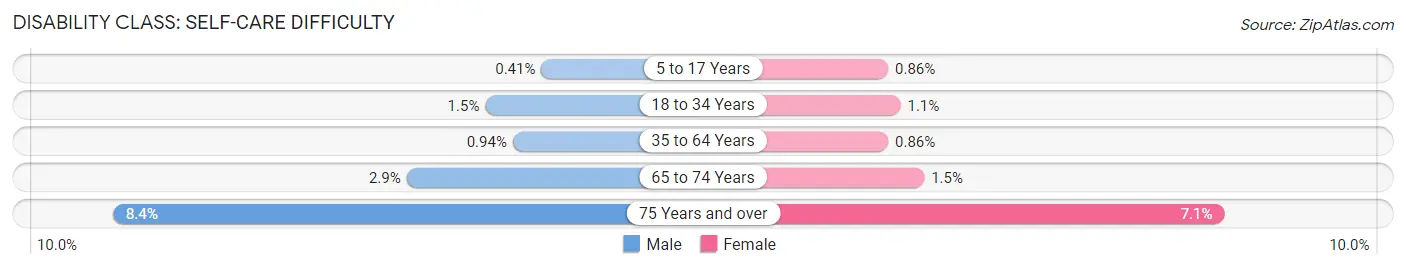
| Age Bracket | Male | Female |
| 5 to 17 Years | 36 (0.4%) | 81 (0.9%) |
| 18 to 34 Years | 113 (1.5%) | 88 (1.1%) |
| 35 to 64 Years | 133 (0.9%) | 125 (0.9%) |
| 65 to 74 Years | 95 (2.9%) | 52 (1.5%) |
| 75 Years and over | 113 (8.4%) | 124 (7.1%) |
Technology Access in South Jordan
Computing Device Access in South Jordan
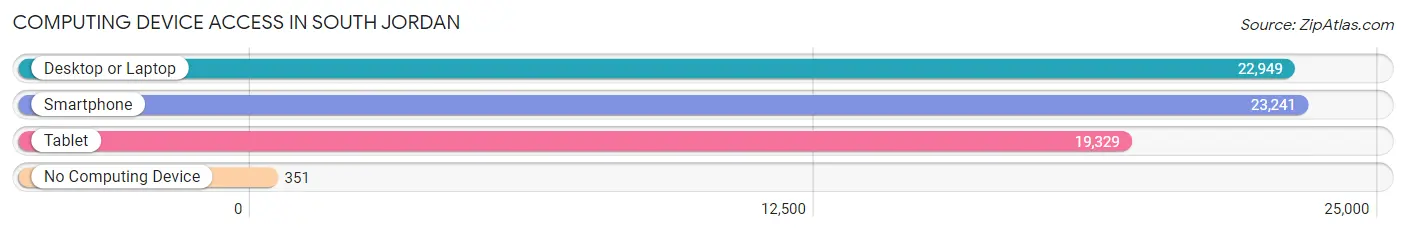
| Device Type | # Households | % Households |
| Desktop or Laptop | 22,949 | 93.9% |
| Smartphone | 23,241 | 95.1% |
| Tablet | 19,329 | 79.1% |
| No Computing Device | 351 | 1.4% |
| Total | 24,429 | 100.0% |
Internet Access in South Jordan
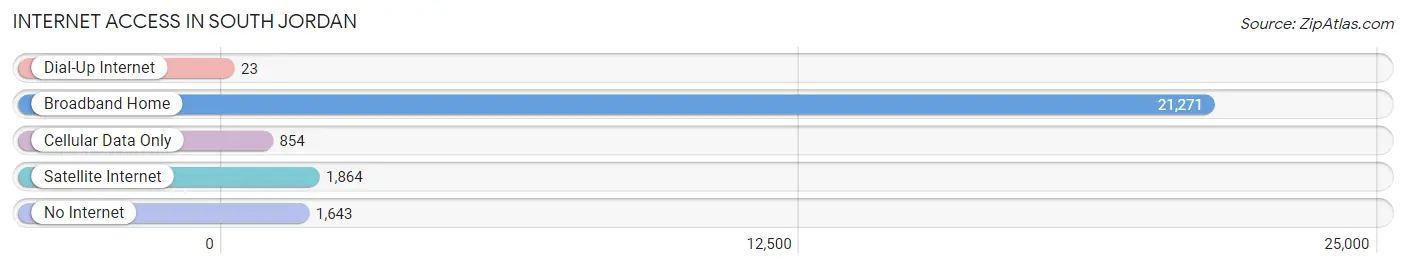
| Internet Type | # Households | % Households |
| Dial-Up Internet | 23 | 0.1% |
| Broadband Home | 21,271 | 87.1% |
| Cellular Data Only | 854 | 3.5% |
| Satellite Internet | 1,864 | 7.6% |
| No Internet | 1,643 | 6.7% |
| Total | 24,429 | 100.0% |
South Jordan Summary
History
South Jordan, Utah is a city located in Salt Lake County, Utah. It is part of the Salt Lake City metropolitan area and is located about 20 miles south of downtown Salt Lake City. The city was first settled in 1859 by Mormon pioneers and was originally known as South Jordan River. The city was officially incorporated in 1935 and has since grown to become one of the largest cities in the state of Utah.
The area was originally inhabited by the Ute Native American tribe and was later settled by Mormon pioneers in 1859. The city was named after the South Jordan River, which runs through the city. The first settlers were primarily farmers and ranchers, and the city was largely agricultural until the 1950s. In the 1950s, the city began to experience rapid growth due to the development of the nearby Jordan Landing shopping center. This development spurred the growth of the city and led to the construction of many new homes and businesses.
Geography
South Jordan is located in the Salt Lake Valley, which is part of the Great Basin region of the western United States. The city is situated at an elevation of 4,400 feet and is bordered by the cities of West Jordan to the north, Riverton to the east, Herriman to the south, and West Valley City to the west. The city covers an area of approximately 25 square miles and is located about 20 miles south of downtown Salt Lake City.
The city is located in a semi-arid climate zone and experiences hot summers and cold winters. The average annual temperature is around 50 degrees Fahrenheit and the average annual precipitation is around 15 inches. The city is located in the Wasatch Front region of Utah, which is known for its beautiful mountain scenery and outdoor recreational opportunities.
Economy
South Jordan is a rapidly growing city and is home to a diverse economy. The city is home to a number of large employers, including the Jordan Landing shopping center, the South Jordan Technology Park, and the South Jordan Medical Center. The city is also home to a number of smaller businesses, including retail stores, restaurants, and professional services.
The city is also home to a number of educational institutions, including the University of Utah, Salt Lake Community College, and the Salt Lake School District. The city is also home to a number of parks and recreational facilities, including the South Jordan Recreation Center, the South Jordan Golf Course, and the South Jordan River Trail.
Demographics
As of the 2020 census, South Jordan had a population of 66,845. The city has a population density of 2,637 people per square mile and a median age of 33.7 years. The racial makeup of the city is 79.2% White, 5.3% Hispanic or Latino, 4.2% Asian, 3.2% African American, 0.7% Native American, and 7.4% other.
The median household income in South Jordan is $90,845 and the median family income is $103,945. The city has a poverty rate of 5.3% and a high school graduation rate of 91.3%. The city is home to a number of religious institutions, including the Church of Jesus Christ of Latter-day Saints, the Catholic Church, and the Episcopal Church.
Common Questions
What is Per Capita Income in South Jordan?
Per Capita income in South Jordan is $47,443.
What is the Median Family Income in South Jordan?
Median Family Income in South Jordan is $134,155.
What is the Median Household income in South Jordan?
Median Household Income in South Jordan is $119,822.
What is Income or Wage Gap in South Jordan?
Income or Wage Gap in South Jordan is 45.4%.
Women in South Jordan earn 54.6 cents for every dollar earned by a man.
What is Family Income Deficit in South Jordan?
Family Income Deficit in South Jordan is $9,398.
Families that are below poverty line in South Jordan earn $9,398 less on average than the poverty threshold level.
What is Inequality or Gini Index in South Jordan?
Inequality or Gini Index in South Jordan is 0.38.
What is the Total Population of South Jordan?
Total Population of South Jordan is 78,118.
What is the Total Male Population of South Jordan?
Total Male Population of South Jordan is 37,724.
What is the Total Female Population of South Jordan?
Total Female Population of South Jordan is 40,394.
What is the Ratio of Males per 100 Females in South Jordan?
There are 93.39 Males per 100 Females in South Jordan.
What is the Ratio of Females per 100 Males in South Jordan?
There are 107.08 Females per 100 Males in South Jordan.
What is the Median Population Age in South Jordan?
Median Population Age in South Jordan is 34.4 Years.
What is the Average Family Size in South Jordan
Average Family Size in South Jordan is 3.6 People.
What is the Average Household Size in South Jordan
Average Household Size in South Jordan is 3.2 People.
How Large is the Labor Force in South Jordan?
There are 40,461 People in the Labor Forcein in South Jordan.
What is the Percentage of People in the Labor Force in South Jordan?
70.9% of People are in the Labor Force in South Jordan.
What is the Unemployment Rate in South Jordan?
Unemployment Rate in South Jordan is 2.5%.