Norco, CA Map & Demographics
Norco Map
Norco Overview
$40,311
PER CAPITA INCOME
$133,199
AVG FAMILY INCOME
$120,636
AVG HOUSEHOLD INCOME
42.8%
WAGE / INCOME GAP [ % ]
57.2¢/ $1
WAGE / INCOME GAP [ $ ]
0.39
INEQUALITY / GINI INDEX
25,328
TOTAL POPULATION
14,004
MALE POPULATION
11,324
FEMALE POPULATION
123.67
MALES / 100 FEMALES
80.86
FEMALES / 100 MALES
41.4
MEDIAN AGE
3.6
AVG FAMILY SIZE
3.3
AVG HOUSEHOLD SIZE
12,010
LABOR FORCE [ PEOPLE ]
56.6%
PERCENT IN LABOR FORCE
3.8%
UNEMPLOYMENT RATE
Norco Zip Codes
Income in Norco
Income Overview in Norco
Per Capita Income in Norco is $40,311, while median incomes of families and households are $133,199 and $120,636 respectively.
| Characteristic | Number | Measure |
| Per Capita Income | 25,328 | $40,311 |
| Median Family Income | 5,719 | $133,199 |
| Mean Family Income | 5,719 | $145,457 |
| Median Household Income | 6,935 | $120,636 |
| Mean Household Income | 6,935 | $140,733 |
| Income Deficit | 5,719 | $0 |
| Wage / Income Gap (%) | 25,328 | 42.84% |
| Wage / Income Gap ($) | 25,328 | 57.16¢ per $1 |
| Gini / Inequality Index | 25,328 | 0.39 |
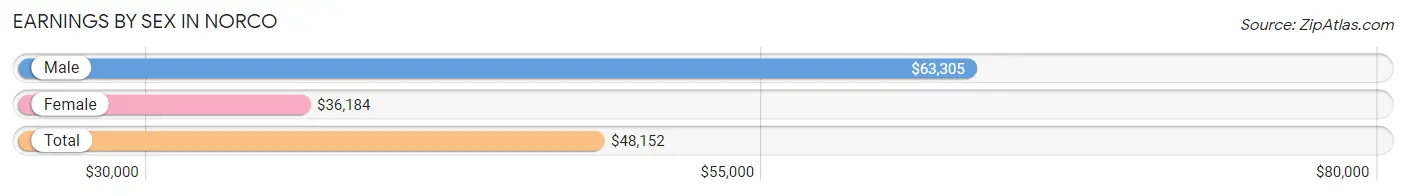
Earnings by Sex in Norco
Average Earnings in Norco are $48,152, $63,305 for men and $36,184 for women, a difference of 42.8%.
| Sex | Number | Average Earnings |
| Male | 6,912 (55.4%) | $63,305 |
| Female | 5,563 (44.6%) | $36,184 |
| Total | 12,475 (100.0%) | $48,152 |
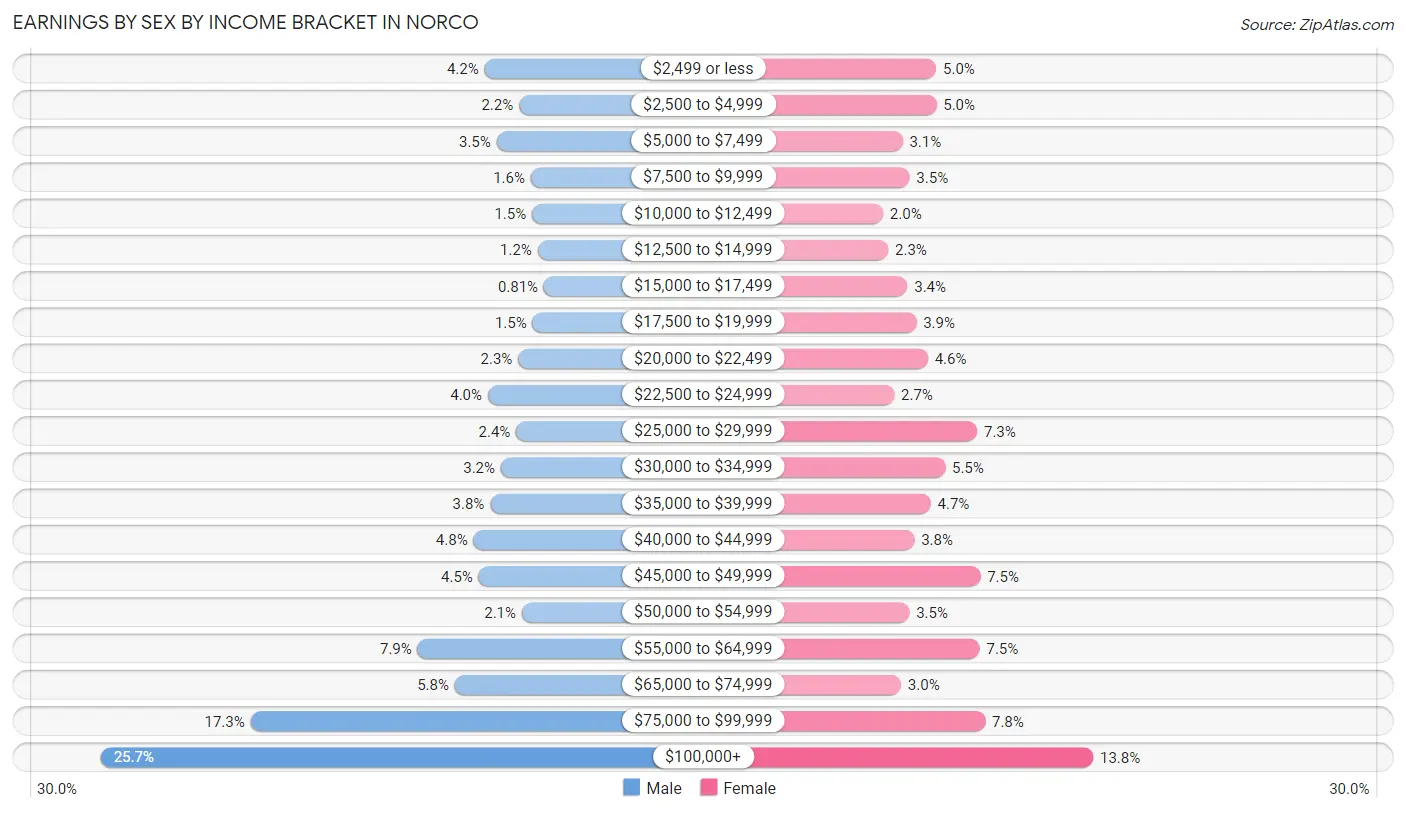
Earnings by Sex by Income Bracket in Norco
The most common earnings brackets in Norco are $100,000+ for men (1,778 | 25.7%) and $100,000+ for women (770 | 13.8%).
| Income | Male | Female |
| $2,499 or less | 287 (4.2%) | 279 (5.0%) |
| $2,500 to $4,999 | 153 (2.2%) | 280 (5.0%) |
| $5,000 to $7,499 | 240 (3.5%) | 174 (3.1%) |
| $7,500 to $9,999 | 107 (1.5%) | 196 (3.5%) |
| $10,000 to $12,499 | 102 (1.5%) | 113 (2.0%) |
| $12,500 to $14,999 | 80 (1.2%) | 129 (2.3%) |
| $15,000 to $17,499 | 56 (0.8%) | 189 (3.4%) |
| $17,500 to $19,999 | 100 (1.5%) | 217 (3.9%) |
| $20,000 to $22,499 | 156 (2.3%) | 253 (4.5%) |
| $22,500 to $24,999 | 274 (4.0%) | 148 (2.7%) |
| $25,000 to $29,999 | 164 (2.4%) | 407 (7.3%) |
| $30,000 to $34,999 | 223 (3.2%) | 307 (5.5%) |
| $35,000 to $39,999 | 265 (3.8%) | 262 (4.7%) |
| $40,000 to $44,999 | 330 (4.8%) | 211 (3.8%) |
| $45,000 to $49,999 | 310 (4.5%) | 417 (7.5%) |
| $50,000 to $54,999 | 142 (2.1%) | 195 (3.5%) |
| $55,000 to $64,999 | 547 (7.9%) | 415 (7.5%) |
| $65,000 to $74,999 | 402 (5.8%) | 169 (3.0%) |
| $75,000 to $99,999 | 1,196 (17.3%) | 432 (7.8%) |
| $100,000+ | 1,778 (25.7%) | 770 (13.8%) |
| Total | 6,912 (100.0%) | 5,563 (100.0%) |
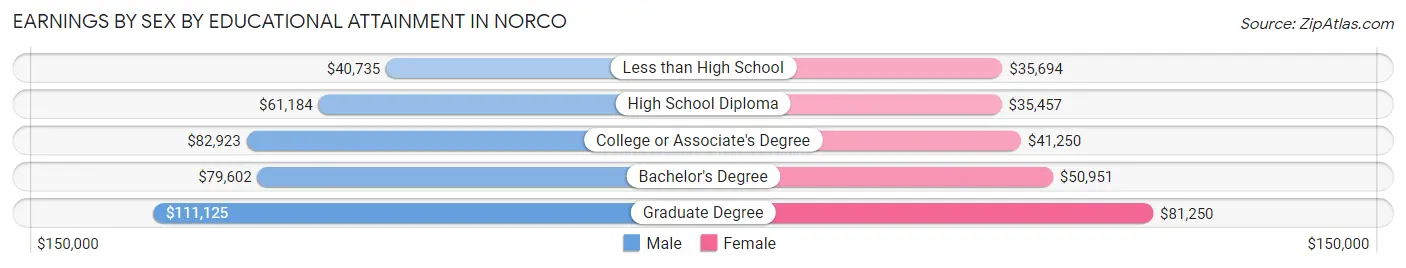
Earnings by Sex by Educational Attainment in Norco
Average earnings in Norco are $72,412 for men and $43,829 for women, a difference of 39.5%. Men with an educational attainment of graduate degree enjoy the highest average annual earnings of $111,125, while those with less than high school education earn the least with $40,735. Women with an educational attainment of graduate degree earn the most with the average annual earnings of $81,250, while those with high school diploma education have the smallest earnings of $35,457.
| Educational Attainment | Male Income | Female Income |
| Less than High School | $40,735 | $35,694 |
| High School Diploma | $61,184 | $35,457 |
| College or Associate's Degree | $82,923 | $41,250 |
| Bachelor's Degree | $79,602 | $50,951 |
| Graduate Degree | $111,125 | $81,250 |
| Total | $72,412 | $43,829 |
Family Income in Norco
Family Income Brackets in Norco
According to the Norco family income data, there are 1,487 families falling into the $100,000 to $149,999 income range, which is the most common income bracket and makes up 26.0% of all families. Conversely, the $10,000 to $14,999 income bracket is the least frequent group with only 11 families (0.2%) belonging to this category.
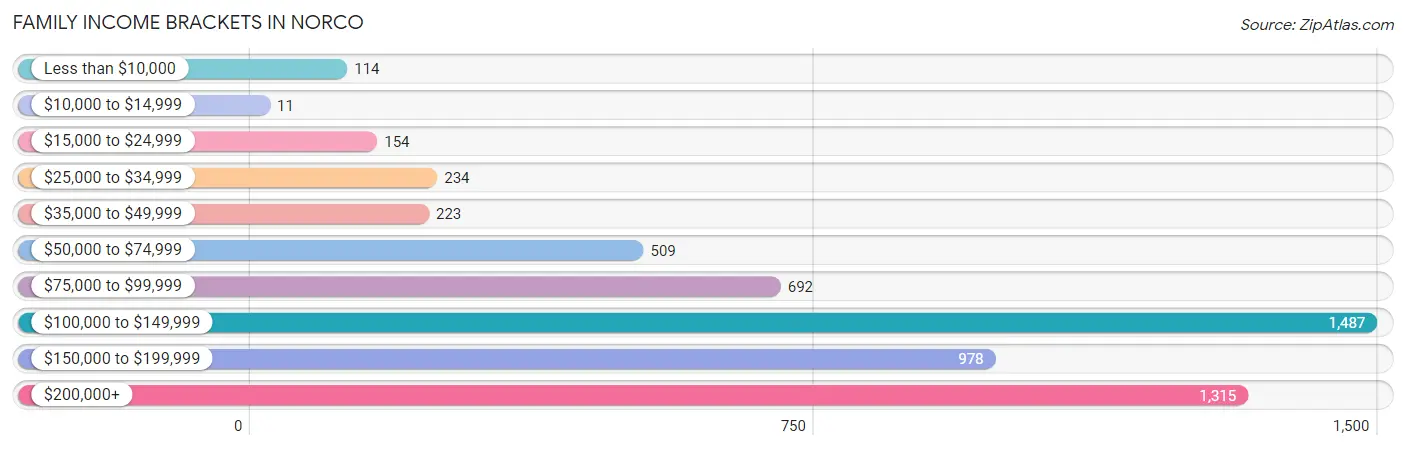
| Income Bracket | # Families | % Families |
| Less than $10,000 | 114 | 2.0% |
| $10,000 to $14,999 | 11 | 0.2% |
| $15,000 to $24,999 | 154 | 2.7% |
| $25,000 to $34,999 | 234 | 4.1% |
| $35,000 to $49,999 | 223 | 3.9% |
| $50,000 to $74,999 | 509 | 8.9% |
| $75,000 to $99,999 | 692 | 12.1% |
| $100,000 to $149,999 | 1,487 | 26.0% |
| $150,000 to $199,999 | 978 | 17.1% |
| $200,000+ | 1,315 | 23.0% |
Family Income by Famaliy Size in Norco
5-person families (623 | 10.9%) account for the highest median family income in Norco with $192,159 per family, while 2-person families (2,197 | 38.4%) have the highest median income of $54,506 per family member.
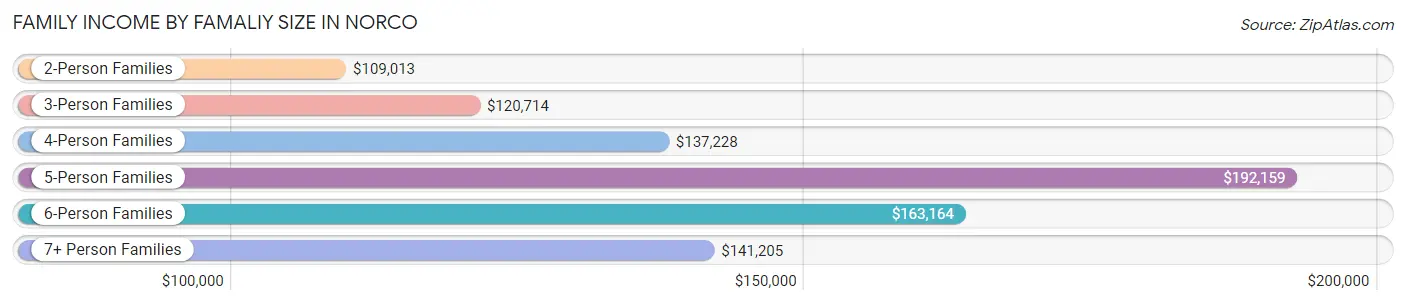
| Income Bracket | # Families | Median Income |
| 2-Person Families | 2,197 (38.4%) | $109,013 |
| 3-Person Families | 1,282 (22.4%) | $120,714 |
| 4-Person Families | 1,182 (20.7%) | $137,228 |
| 5-Person Families | 623 (10.9%) | $192,159 |
| 6-Person Families | 263 (4.6%) | $163,164 |
| 7+ Person Families | 172 (3.0%) | $141,205 |
| Total | 5,719 (100.0%) | $133,199 |
Family Income by Number of Earners in Norco
The median family income in Norco is $133,199, with families comprising 3+ earners (1,075) having the highest median family income of $166,435, while families with no earners (653) have the lowest median family income of $61,006, accounting for 18.8% and 11.4% of families, respectively.
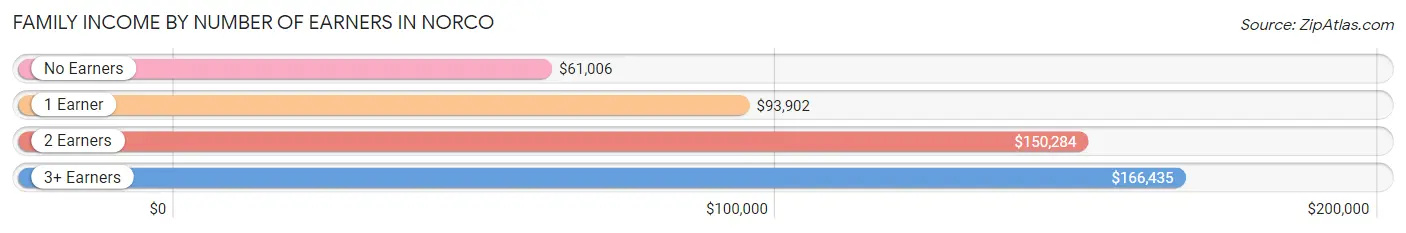
| Number of Earners | # Families | Median Income |
| No Earners | 653 (11.4%) | $61,006 |
| 1 Earner | 1,558 (27.2%) | $93,902 |
| 2 Earners | 2,433 (42.5%) | $150,284 |
| 3+ Earners | 1,075 (18.8%) | $166,435 |
| Total | 5,719 (100.0%) | $133,199 |
Household Income in Norco
Household Income Brackets in Norco
With 1,706 households falling in the category, the $100,000 to $149,999 income range is the most frequent in Norco, accounting for 24.6% of all households. In contrast, only 35 households (0.5%) fall into the $10,000 to $14,999 income bracket, making it the least populous group.
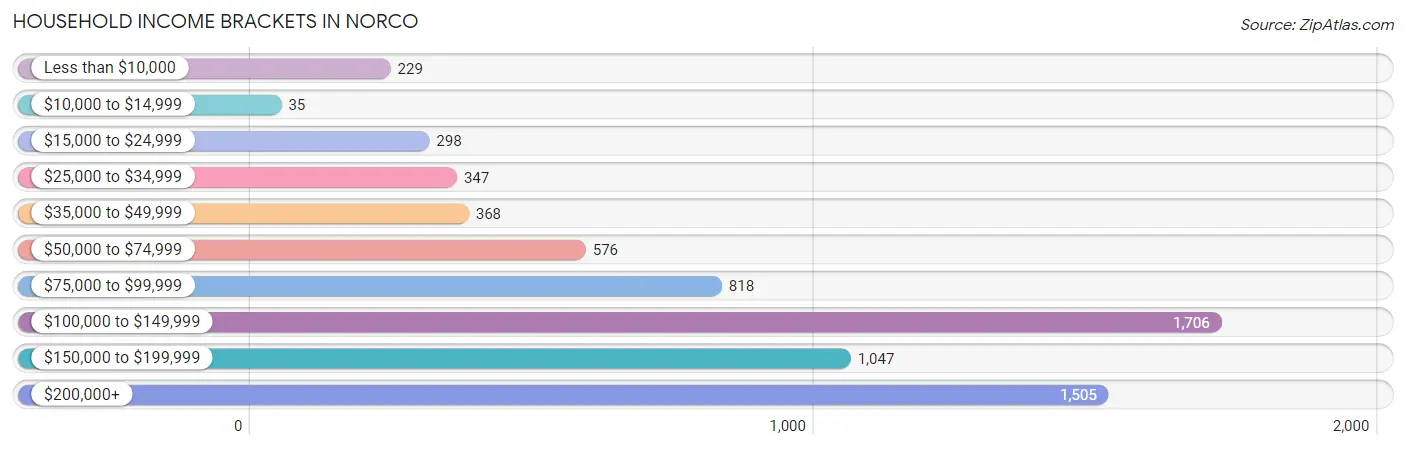
| Income Bracket | # Households | % Households |
| Less than $10,000 | 229 | 3.3% |
| $10,000 to $14,999 | 35 | 0.5% |
| $15,000 to $24,999 | 298 | 4.3% |
| $25,000 to $34,999 | 347 | 5.0% |
| $35,000 to $49,999 | 368 | 5.3% |
| $50,000 to $74,999 | 576 | 8.3% |
| $75,000 to $99,999 | 818 | 11.8% |
| $100,000 to $149,999 | 1,706 | 24.6% |
| $150,000 to $199,999 | 1,047 | 15.1% |
| $200,000+ | 1,505 | 21.7% |
Household Income by Householder Age in Norco
The median household income in Norco is $120,636, with the highest median household income of $144,550 found in the 45 to 64 years age bracket for the primary householder. A total of 3,559 households (51.3%) fall into this category. Meanwhile, the 15 to 24 years age bracket for the primary householder has the lowest median household income of $0, with 37 households (0.5%) in this group.
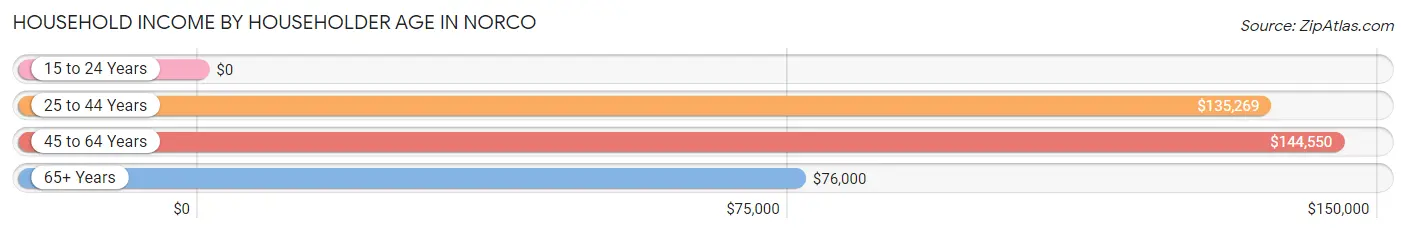
| Income Bracket | # Households | Median Income |
| 15 to 24 Years | 37 (0.5%) | $0 |
| 25 to 44 Years | 1,471 (21.2%) | $135,269 |
| 45 to 64 Years | 3,559 (51.3%) | $144,550 |
| 65+ Years | 1,868 (26.9%) | $76,000 |
| Total | 6,935 (100.0%) | $120,636 |
Poverty in Norco
Income Below Poverty by Sex and Age in Norco
With 4.3% poverty level for males and 6.7% for females among the residents of Norco, 15 year old males and 15 year old females are the most vulnerable to poverty, with 10 males (14.1%) and 23 females (18.5%) in their respective age groups living below the poverty level.
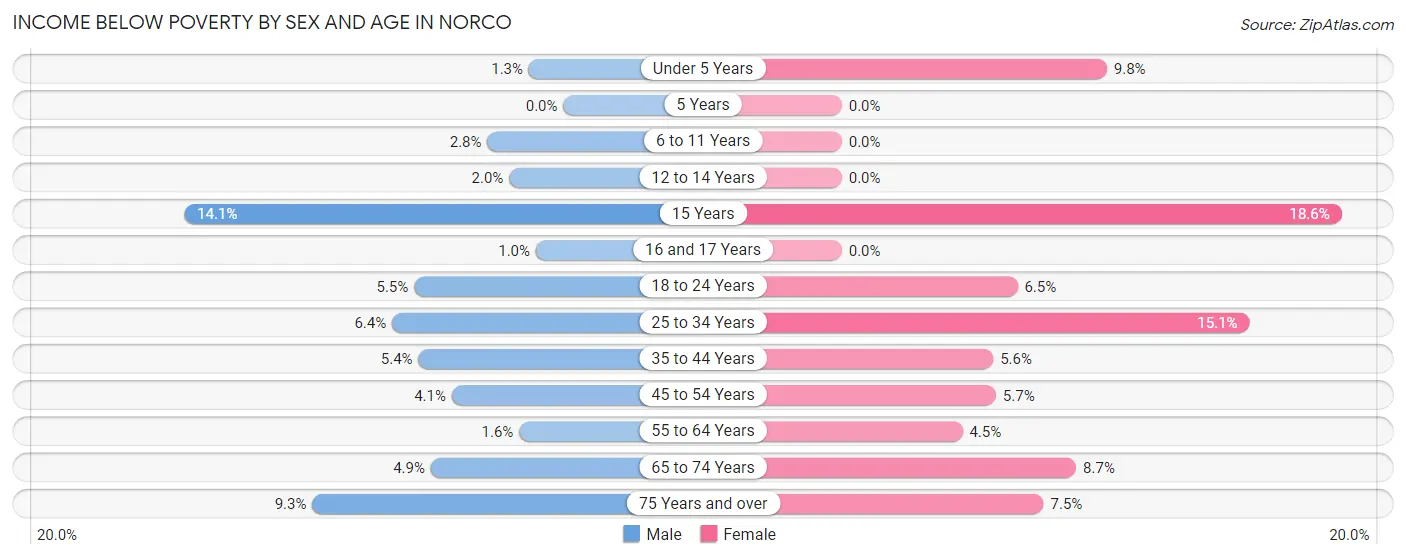
| Age Bracket | Male | Female |
| Under 5 Years | 8 (1.3%) | 43 (9.8%) |
| 5 Years | 0 (0.0%) | 0 (0.0%) |
| 6 to 11 Years | 22 (2.8%) | 0 (0.0%) |
| 12 to 14 Years | 10 (2.0%) | 0 (0.0%) |
| 15 Years | 10 (14.1%) | 23 (18.5%) |
| 16 and 17 Years | 3 (1.0%) | 0 (0.0%) |
| 18 to 24 Years | 54 (5.5%) | 61 (6.5%) |
| 25 to 34 Years | 81 (6.4%) | 215 (15.1%) |
| 35 to 44 Years | 81 (5.4%) | 72 (5.6%) |
| 45 to 54 Years | 66 (4.1%) | 109 (5.7%) |
| 55 to 64 Years | 30 (1.6%) | 74 (4.5%) |
| 65 to 74 Years | 51 (4.9%) | 98 (8.7%) |
| 75 Years and over | 77 (9.3%) | 67 (7.5%) |
| Total | 493 (4.3%) | 762 (6.7%) |
Income Above Poverty by Sex and Age in Norco
According to the poverty statistics in Norco, males aged 5 years and females aged 5 years are the age groups that are most secure financially, with 100.0% of males and 100.0% of females in these age groups living above the poverty line.
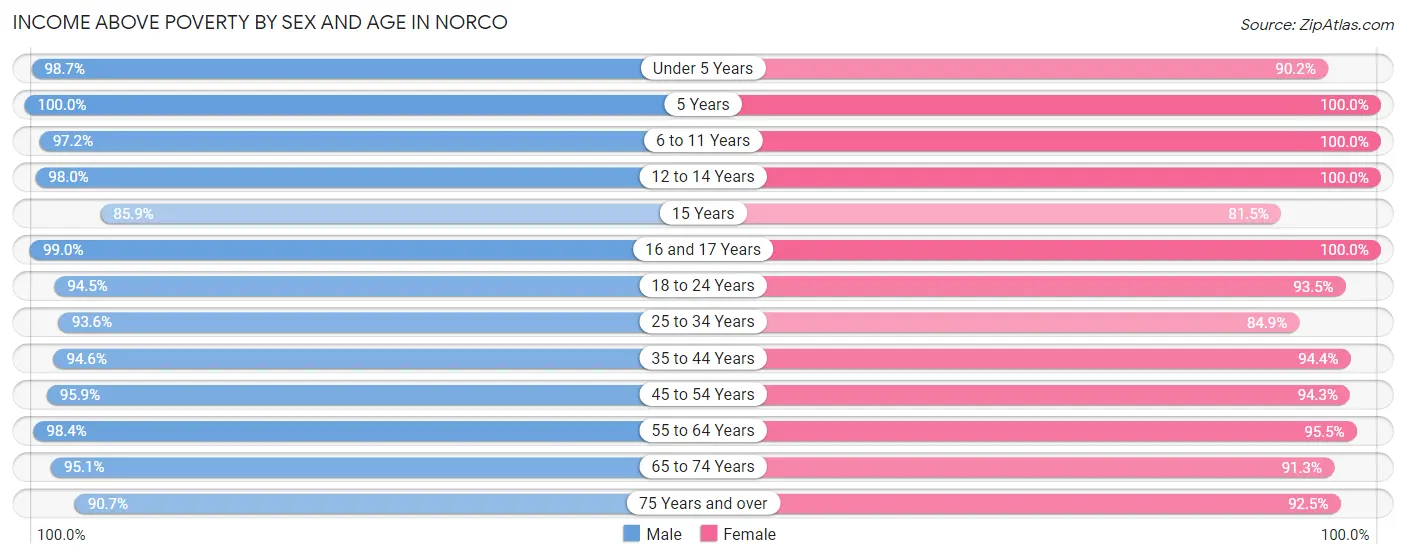
| Age Bracket | Male | Female |
| Under 5 Years | 617 (98.7%) | 394 (90.2%) |
| 5 Years | 148 (100.0%) | 140 (100.0%) |
| 6 to 11 Years | 759 (97.2%) | 643 (100.0%) |
| 12 to 14 Years | 488 (98.0%) | 565 (100.0%) |
| 15 Years | 61 (85.9%) | 101 (81.5%) |
| 16 and 17 Years | 291 (99.0%) | 179 (100.0%) |
| 18 to 24 Years | 920 (94.5%) | 874 (93.5%) |
| 25 to 34 Years | 1,192 (93.6%) | 1,206 (84.9%) |
| 35 to 44 Years | 1,424 (94.6%) | 1,210 (94.4%) |
| 45 to 54 Years | 1,528 (95.9%) | 1,798 (94.3%) |
| 55 to 64 Years | 1,799 (98.4%) | 1,577 (95.5%) |
| 65 to 74 Years | 985 (95.1%) | 1,029 (91.3%) |
| 75 Years and over | 749 (90.7%) | 828 (92.5%) |
| Total | 10,961 (95.7%) | 10,544 (93.3%) |
Income Below Poverty Among Married-Couple Families in Norco
The poverty statistics for married-couple families in Norco show that 3.3% or 151 of the total 4,628 families live below the poverty line. Families with 1 or 2 children have the highest poverty rate of 3.8%, comprising of 53 families. On the other hand, families with 3 or 4 children have the lowest poverty rate of 0.0%, which includes 0 families.
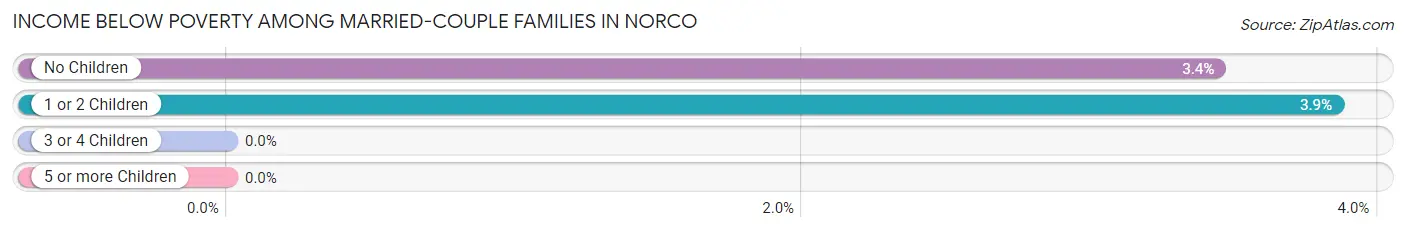
| Children | Above Poverty | Below Poverty |
| No Children | 2,751 (96.6%) | 98 (3.4%) |
| 1 or 2 Children | 1,322 (96.2%) | 53 (3.8%) |
| 3 or 4 Children | 388 (100.0%) | 0 (0.0%) |
| 5 or more Children | 16 (100.0%) | 0 (0.0%) |
| Total | 4,477 (96.7%) | 151 (3.3%) |
Income Below Poverty Among Single-Parent Households in Norco
According to the poverty data in Norco, 2.6% or 11 single-father households and 7.5% or 50 single-mother households are living below the poverty line. Among single-father households, those with no children have the highest poverty rate, with 8 households (3.1%) experiencing poverty. Likewise, among single-mother households, those with 3 or 4 children have the highest poverty rate, with 10 households (100.0%) falling below the poverty line.
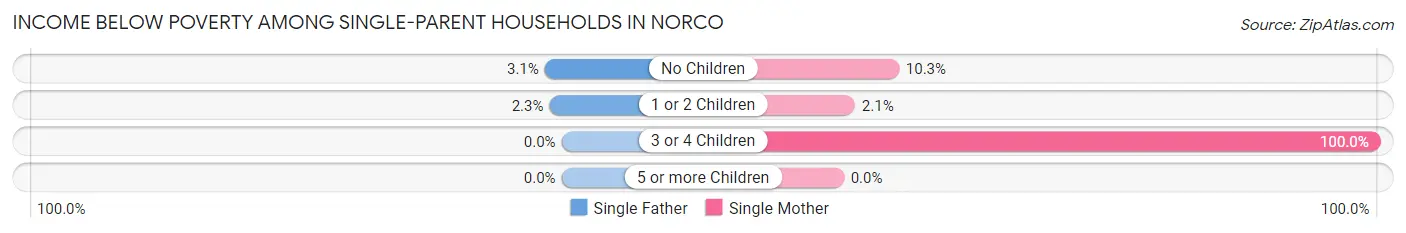
| Children | Single Father | Single Mother |
| No Children | 8 (3.1%) | 33 (10.3%) |
| 1 or 2 Children | 3 (2.3%) | 7 (2.1%) |
| 3 or 4 Children | 0 (0.0%) | 10 (100.0%) |
| 5 or more Children | 0 (0.0%) | 0 (0.0%) |
| Total | 11 (2.6%) | 50 (7.5%) |
Income Below Poverty Among Married-Couple vs Single-Parent Households in Norco
The poverty data for Norco shows that 151 of the married-couple family households (3.3%) and 61 of the single-parent households (5.6%) are living below the poverty level. Within the married-couple family households, those with 1 or 2 children have the highest poverty rate, with 53 households (3.8%) falling below the poverty line. Among the single-parent households, those with 3 or 4 children have the highest poverty rate, with 10 household (20.8%) living below poverty.
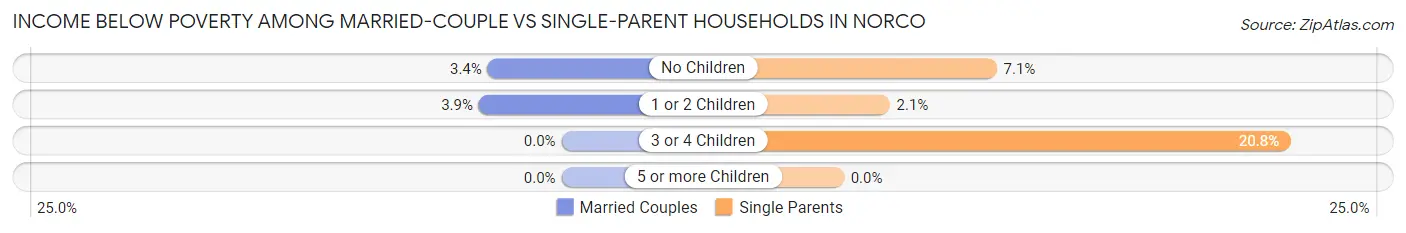
| Children | Married-Couple Families | Single-Parent Households |
| No Children | 98 (3.4%) | 41 (7.1%) |
| 1 or 2 Children | 53 (3.8%) | 10 (2.1%) |
| 3 or 4 Children | 0 (0.0%) | 10 (20.8%) |
| 5 or more Children | 0 (0.0%) | 0 (0.0%) |
| Total | 151 (3.3%) | 61 (5.6%) |
Race in Norco
The most populous races in Norco are White / Caucasian (15,977 | 63.1%), Hispanic or Latino (9,809 | 38.7%), and Some other Race (4,601 | 18.2%).
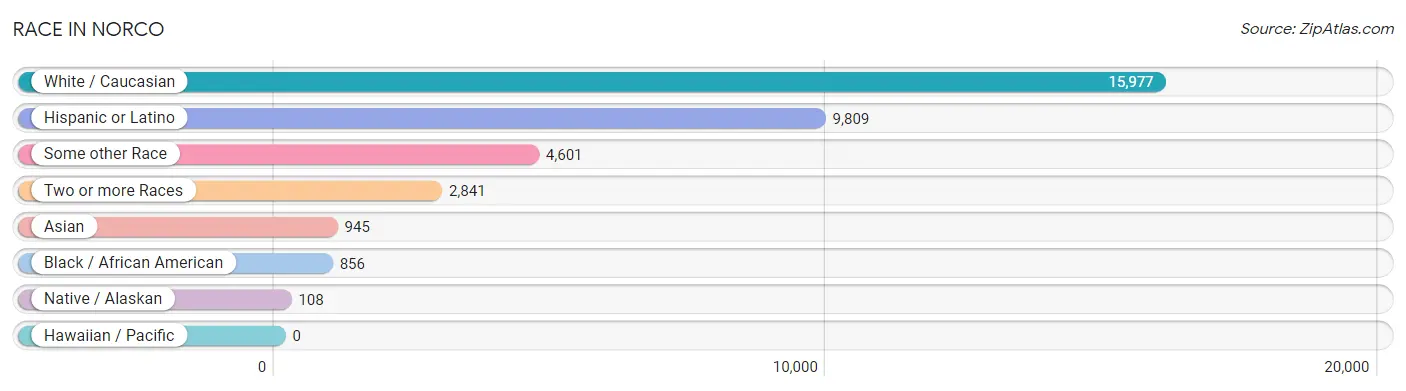
| Race | # Population | % Population |
| Asian | 945 | 3.7% |
| Black / African American | 856 | 3.4% |
| Hawaiian / Pacific | 0 | 0.0% |
| Hispanic or Latino | 9,809 | 38.7% |
| Native / Alaskan | 108 | 0.4% |
| White / Caucasian | 15,977 | 63.1% |
| Two or more Races | 2,841 | 11.2% |
| Some other Race | 4,601 | 18.2% |
| Total | 25,328 | 100.0% |
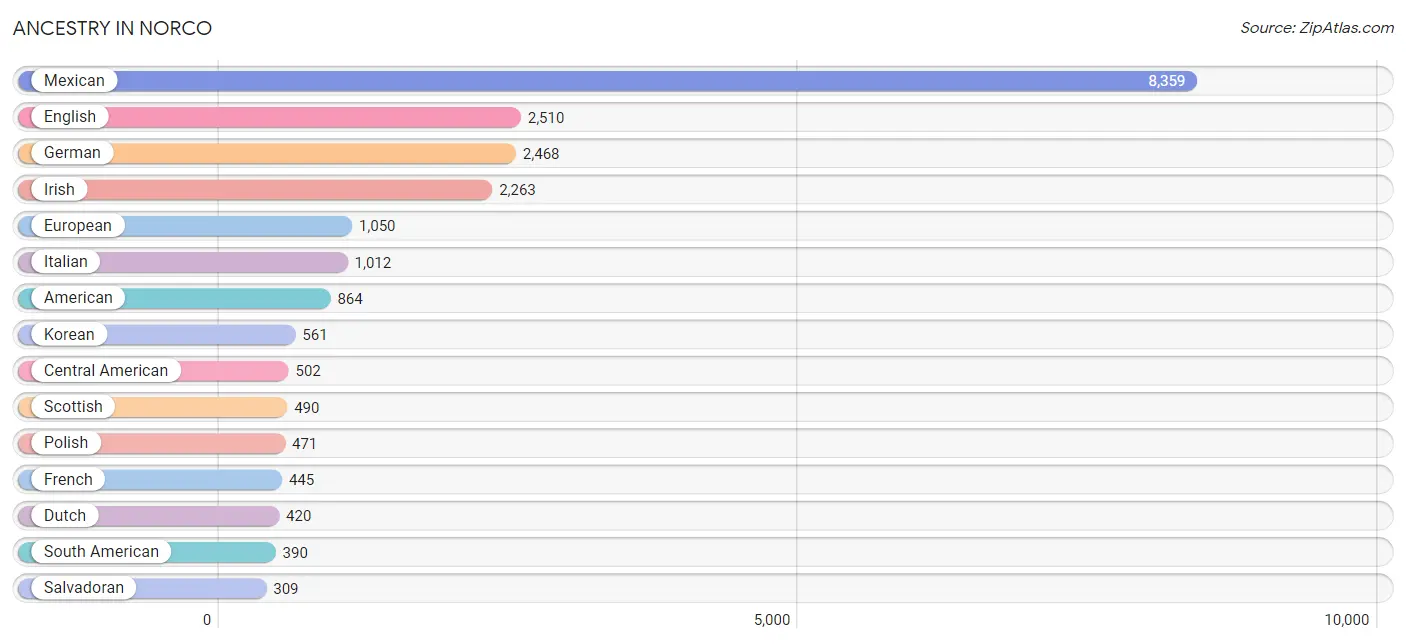
Ancestry in Norco
The most populous ancestries reported in Norco are Mexican (8,359 | 33.0%), English (2,510 | 9.9%), German (2,468 | 9.7%), Irish (2,263 | 8.9%), and European (1,050 | 4.2%), together accounting for 65.7% of all Norco residents.
| Ancestry | # Population | % Population |
| African | 52 | 0.2% |
| Alaskan Athabascan | 4 | 0.0% |
| Aleut | 4 | 0.0% |
| American | 864 | 3.4% |
| Apache | 27 | 0.1% |
| Arab | 137 | 0.5% |
| Argentinean | 33 | 0.1% |
| Armenian | 13 | 0.1% |
| Australian | 26 | 0.1% |
| Austrian | 27 | 0.1% |
| Bangladeshi | 6 | 0.0% |
| Bhutanese | 174 | 0.7% |
| Blackfeet | 6 | 0.0% |
| Bolivian | 67 | 0.3% |
| British | 154 | 0.6% |
| Burmese | 133 | 0.5% |
| Canadian | 93 | 0.4% |
| Central American | 502 | 2.0% |
| Central American Indian | 13 | 0.1% |
| Cherokee | 76 | 0.3% |
| Chippewa | 8 | 0.0% |
| Choctaw | 73 | 0.3% |
| Colombian | 127 | 0.5% |
| Cree | 16 | 0.1% |
| Creek | 11 | 0.0% |
| Croatian | 6 | 0.0% |
| Cuban | 115 | 0.4% |
| Czech | 37 | 0.2% |
| Czechoslovakian | 5 | 0.0% |
| Danish | 77 | 0.3% |
| Delaware | 10 | 0.0% |
| Dutch | 420 | 1.7% |
| Eastern European | 28 | 0.1% |
| Ecuadorian | 9 | 0.0% |
| English | 2,510 | 9.9% |
| Ethiopian | 7 | 0.0% |
| European | 1,050 | 4.2% |
| Filipino | 41 | 0.2% |
| Finnish | 64 | 0.3% |
| French | 445 | 1.8% |
| French Canadian | 85 | 0.3% |
| German | 2,468 | 9.7% |
| Greek | 54 | 0.2% |
| Guatemalan | 102 | 0.4% |
| Guyanese | 5 | 0.0% |
| Honduran | 16 | 0.1% |
| Hungarian | 62 | 0.2% |
| Indian (Asian) | 112 | 0.4% |
| Iraqi | 6 | 0.0% |
| Irish | 2,263 | 8.9% |
| Iroquois | 7 | 0.0% |
| Italian | 1,012 | 4.0% |
| Jamaican | 34 | 0.1% |
| Japanese | 18 | 0.1% |
| Korean | 561 | 2.2% |
| Latvian | 4 | 0.0% |
| Lebanese | 23 | 0.1% |
| Lithuanian | 5 | 0.0% |
| Malaysian | 5 | 0.0% |
| Maltese | 11 | 0.0% |
| Mexican | 8,359 | 33.0% |
| Mexican American Indian | 49 | 0.2% |
| Native Hawaiian | 127 | 0.5% |
| Navajo | 19 | 0.1% |
| Nicaraguan | 71 | 0.3% |
| Northern European | 10 | 0.0% |
| Norwegian | 256 | 1.0% |
| Pakistani | 74 | 0.3% |
| Panamanian | 4 | 0.0% |
| Peruvian | 135 | 0.5% |
| Polish | 471 | 1.9% |
| Portuguese | 152 | 0.6% |
| Pueblo | 8 | 0.0% |
| Puerto Rican | 41 | 0.2% |
| Romanian | 6 | 0.0% |
| Russian | 164 | 0.6% |
| Salvadoran | 309 | 1.2% |
| Samoan | 4 | 0.0% |
| Scandinavian | 212 | 0.8% |
| Scotch-Irish | 137 | 0.5% |
| Scottish | 490 | 1.9% |
| Seminole | 11 | 0.0% |
| Sioux | 10 | 0.0% |
| Slavic | 9 | 0.0% |
| Slovak | 45 | 0.2% |
| South American | 390 | 1.5% |
| Spaniard | 87 | 0.3% |
| Spanish | 248 | 1.0% |
| Sri Lankan | 165 | 0.6% |
| Subsaharan African | 59 | 0.2% |
| Swedish | 269 | 1.1% |
| Swiss | 43 | 0.2% |
| Syrian | 58 | 0.2% |
| Thai | 48 | 0.2% |
| Ukrainian | 8 | 0.0% |
| Venezuelan | 19 | 0.1% |
| Welsh | 104 | 0.4% |
| Yaqui | 8 | 0.0% |
| Yugoslavian | 9 | 0.0% | View All 99 Rows |
Immigrants in Norco
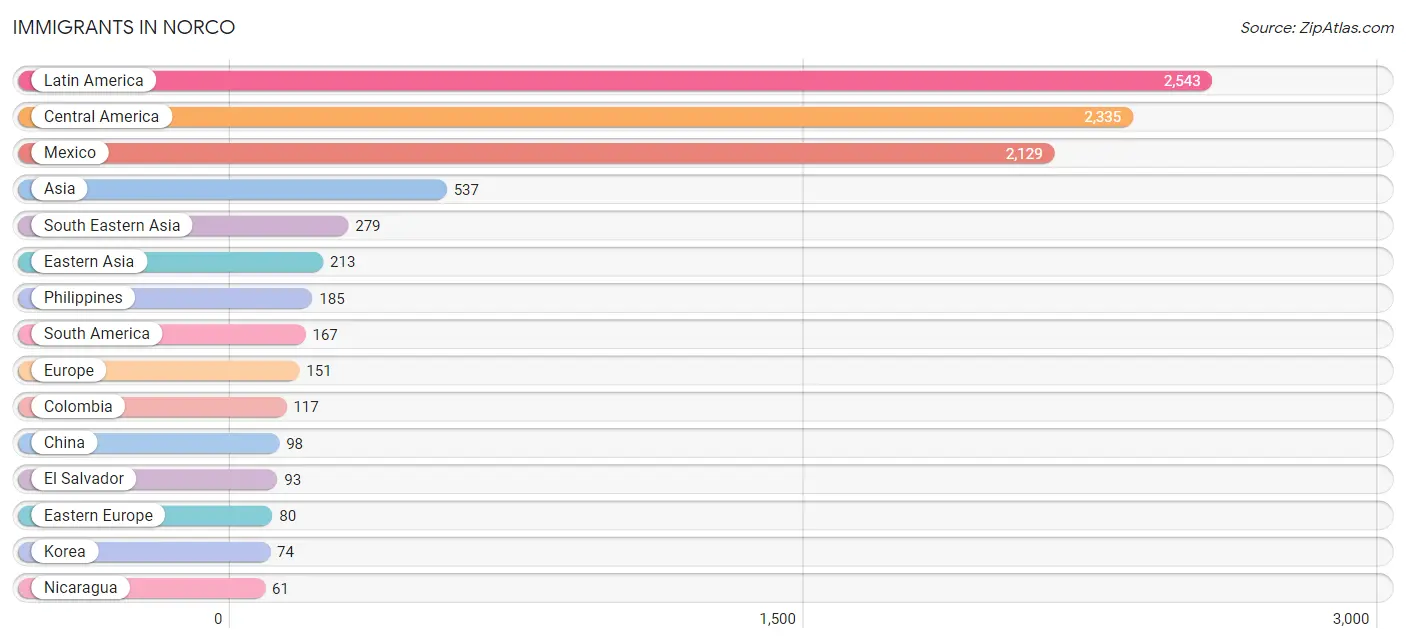
The most numerous immigrant groups reported in Norco came from Latin America (2,543 | 10.0%), Central America (2,335 | 9.2%), Mexico (2,129 | 8.4%), Asia (537 | 2.1%), and South Eastern Asia (279 | 1.1%), together accounting for 30.9% of all Norco residents.
| Immigration Origin | # Population | % Population |
| Africa | 15 | 0.1% |
| Argentina | 21 | 0.1% |
| Asia | 537 | 2.1% |
| Austria | 6 | 0.0% |
| Cambodia | 11 | 0.0% |
| Canada | 35 | 0.1% |
| Caribbean | 41 | 0.2% |
| Central America | 2,335 | 9.2% |
| Chile | 7 | 0.0% |
| China | 98 | 0.4% |
| Colombia | 117 | 0.5% |
| Cuba | 23 | 0.1% |
| Denmark | 7 | 0.0% |
| Eastern Asia | 213 | 0.8% |
| Eastern Europe | 80 | 0.3% |
| Egypt | 15 | 0.1% |
| El Salvador | 93 | 0.4% |
| England | 11 | 0.0% |
| Europe | 151 | 0.6% |
| Germany | 11 | 0.0% |
| Greece | 6 | 0.0% |
| Guatemala | 52 | 0.2% |
| Guyana | 5 | 0.0% |
| Hong Kong | 29 | 0.1% |
| India | 14 | 0.1% |
| Iran | 7 | 0.0% |
| Iraq | 6 | 0.0% |
| Jamaica | 18 | 0.1% |
| Japan | 41 | 0.2% |
| Jordan | 4 | 0.0% |
| Korea | 74 | 0.3% |
| Laos | 11 | 0.0% |
| Latin America | 2,543 | 10.0% |
| Lebanon | 8 | 0.0% |
| Mexico | 2,129 | 8.4% |
| Netherlands | 10 | 0.0% |
| Nicaragua | 61 | 0.2% |
| Northern Africa | 15 | 0.1% |
| Northern Europe | 38 | 0.2% |
| Peru | 9 | 0.0% |
| Philippines | 185 | 0.7% |
| Russia | 33 | 0.1% |
| Scotland | 5 | 0.0% |
| South America | 167 | 0.7% |
| South Central Asia | 27 | 0.1% |
| South Eastern Asia | 279 | 1.1% |
| Southern Europe | 6 | 0.0% |
| Sweden | 7 | 0.0% |
| Taiwan | 41 | 0.2% |
| Thailand | 32 | 0.1% |
| Ukraine | 14 | 0.1% |
| Venezuela | 8 | 0.0% |
| Vietnam | 40 | 0.2% |
| Western Asia | 18 | 0.1% |
| Western Europe | 27 | 0.1% | View All 55 Rows |
Sex and Age in Norco
Sex and Age in Norco
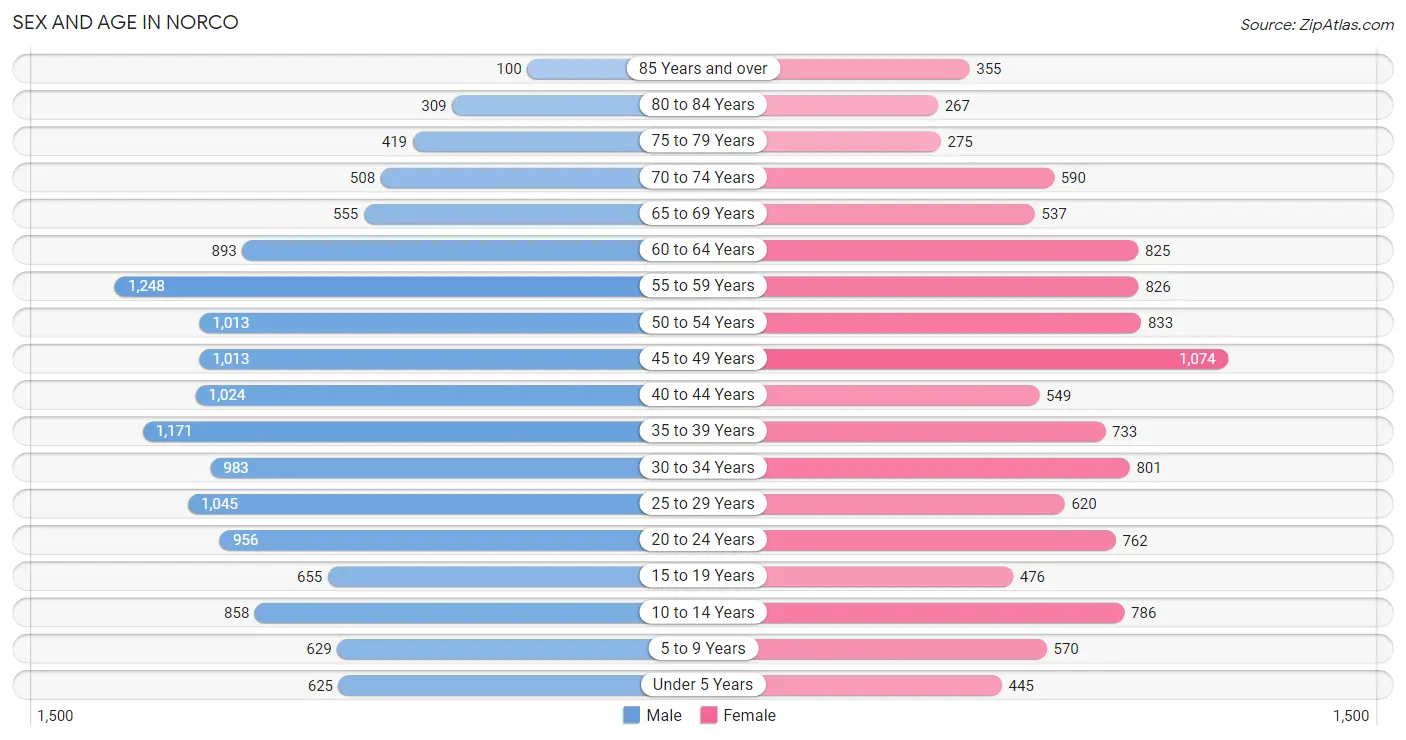
The most populous age groups in Norco are 55 to 59 Years (1,248 | 8.9%) for men and 45 to 49 Years (1,074 | 9.5%) for women.
| Age Bracket | Male | Female |
| Under 5 Years | 625 (4.5%) | 445 (3.9%) |
| 5 to 9 Years | 629 (4.5%) | 570 (5.0%) |
| 10 to 14 Years | 858 (6.1%) | 786 (6.9%) |
| 15 to 19 Years | 655 (4.7%) | 476 (4.2%) |
| 20 to 24 Years | 956 (6.8%) | 762 (6.7%) |
| 25 to 29 Years | 1,045 (7.5%) | 620 (5.5%) |
| 30 to 34 Years | 983 (7.0%) | 801 (7.1%) |
| 35 to 39 Years | 1,171 (8.4%) | 733 (6.5%) |
| 40 to 44 Years | 1,024 (7.3%) | 549 (4.9%) |
| 45 to 49 Years | 1,013 (7.2%) | 1,074 (9.5%) |
| 50 to 54 Years | 1,013 (7.2%) | 833 (7.4%) |
| 55 to 59 Years | 1,248 (8.9%) | 826 (7.3%) |
| 60 to 64 Years | 893 (6.4%) | 825 (7.3%) |
| 65 to 69 Years | 555 (4.0%) | 537 (4.7%) |
| 70 to 74 Years | 508 (3.6%) | 590 (5.2%) |
| 75 to 79 Years | 419 (3.0%) | 275 (2.4%) |
| 80 to 84 Years | 309 (2.2%) | 267 (2.4%) |
| 85 Years and over | 100 (0.7%) | 355 (3.1%) |
| Total | 14,004 (100.0%) | 11,324 (100.0%) |
Families and Households in Norco
Median Family Size in Norco
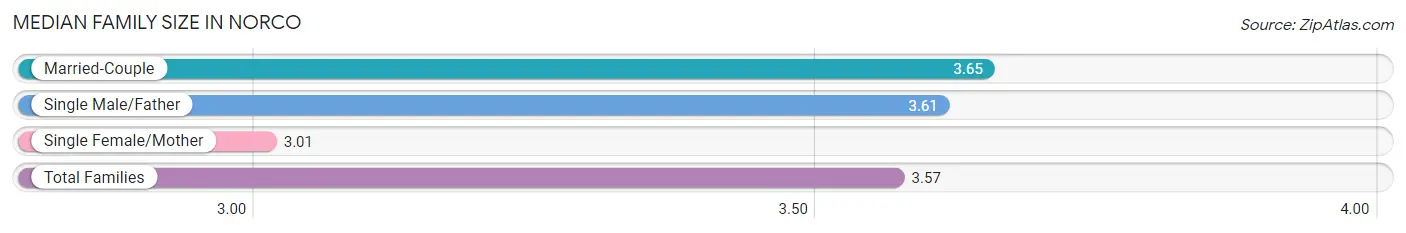
The median family size in Norco is 3.57 persons per family, with married-couple families (4,628 | 80.9%) accounting for the largest median family size of 3.65 persons per family. On the other hand, single female/mother families (666 | 11.7%) represent the smallest median family size with 3.01 persons per family.
| Family Type | # Families | Family Size |
| Married-Couple | 4,628 (80.9%) | 3.65 |
| Single Male/Father | 425 (7.4%) | 3.61 |
| Single Female/Mother | 666 (11.7%) | 3.01 |
| Total Families | 5,719 (100.0%) | 3.57 |
Median Household Size in Norco
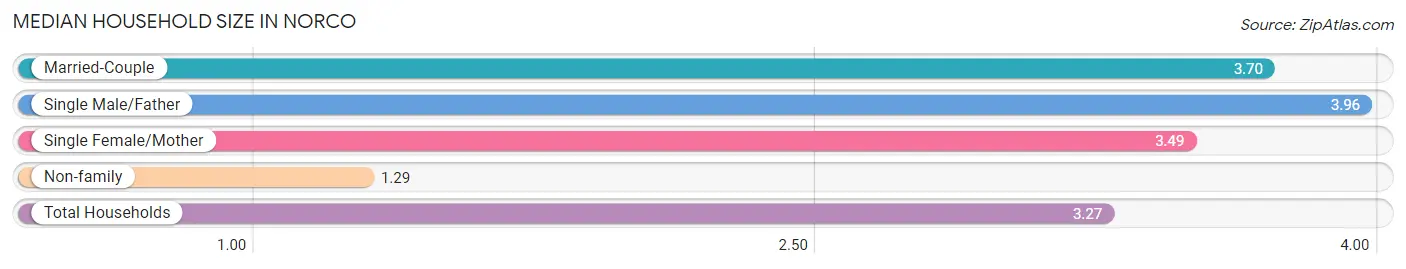
The median household size in Norco is 3.27 persons per household, with single male/father households (425 | 6.1%) accounting for the largest median household size of 3.96 persons per household. non-family households (1,216 | 17.5%) represent the smallest median household size with 1.29 persons per household.
| Household Type | # Households | Household Size |
| Married-Couple | 4,628 (66.7%) | 3.70 |
| Single Male/Father | 425 (6.1%) | 3.96 |
| Single Female/Mother | 666 (9.6%) | 3.49 |
| Non-family | 1,216 (17.5%) | 1.29 |
| Total Households | 6,935 (100.0%) | 3.27 |
Household Size by Marriage Status in Norco
Out of a total of 6,935 households in Norco, 5,719 (82.5%) are family households, while 1,216 (17.5%) are nonfamily households. The most numerous type of family households are 2-person households, comprising 2,002, and the most common type of nonfamily households are 1-person households, comprising 923.
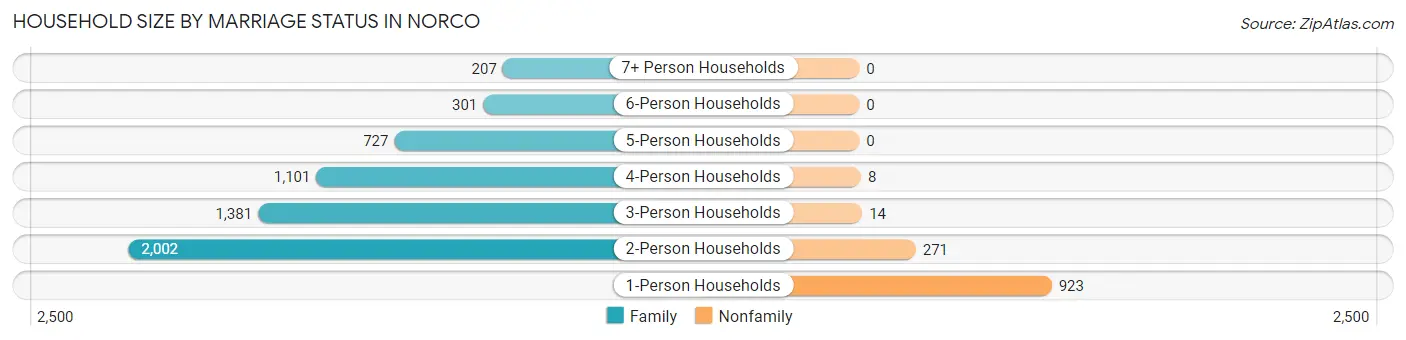
| Household Size | Family Households | Nonfamily Households |
| 1-Person Households | - | 923 (13.3%) |
| 2-Person Households | 2,002 (28.9%) | 271 (3.9%) |
| 3-Person Households | 1,381 (19.9%) | 14 (0.2%) |
| 4-Person Households | 1,101 (15.9%) | 8 (0.1%) |
| 5-Person Households | 727 (10.5%) | 0 (0.0%) |
| 6-Person Households | 301 (4.3%) | 0 (0.0%) |
| 7+ Person Households | 207 (3.0%) | 0 (0.0%) |
| Total | 5,719 (82.5%) | 1,216 (17.5%) |
Female Fertility in Norco
Fertility by Age in Norco
Average fertility rate in Norco is 52.0 births per 1,000 women. Women in the age bracket of 35 to 50 years have the highest fertility rate with 65.0 births per 1,000 women. Women in the age bracket of 35 to 50 years acount for 60.3% of all women with births.
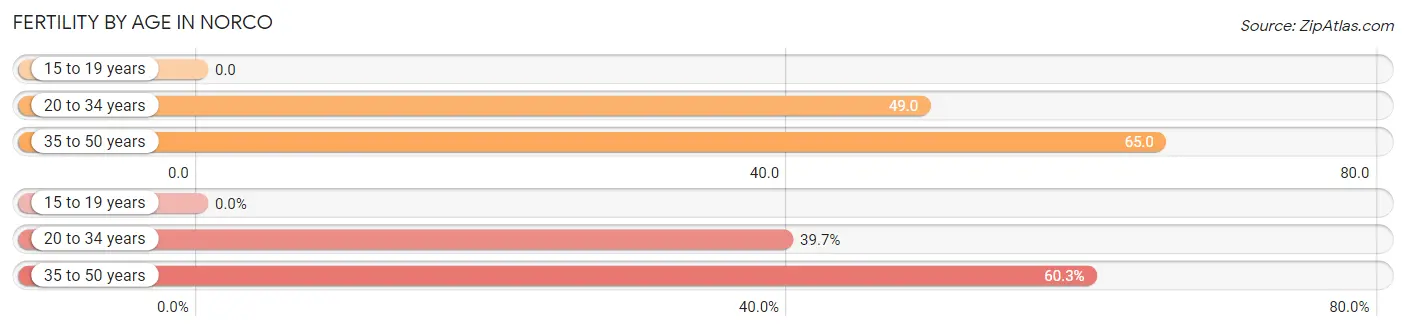
| Age Bracket | Women with Births | Births / 1,000 Women |
| 15 to 19 years | 0 (0.0%) | 0.0 |
| 20 to 34 years | 108 (39.7%) | 49.0 |
| 35 to 50 years | 164 (60.3%) | 65.0 |
| Total | 272 (100.0%) | 52.0 |
Fertility by Age by Marriage Status in Norco
55.1% of women with births (272) in Norco are married. The highest percentage of unmarried women with births falls into 20 to 34 years age bracket with 53.7% of them unmarried at the time of birth, while the lowest percentage of unmarried women with births belong to 35 to 50 years age bracket with 39.0% of them unmarried.
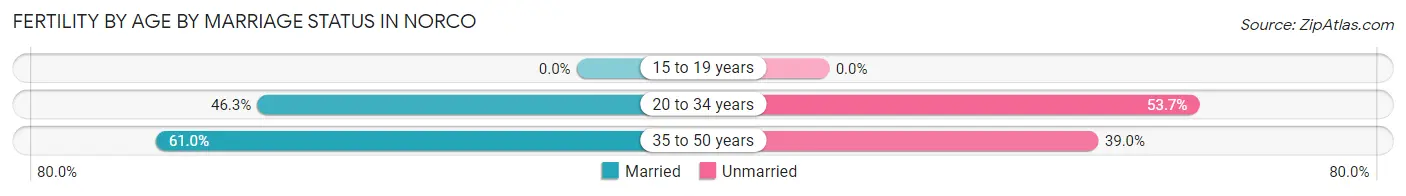
| Age Bracket | Married | Unmarried |
| 15 to 19 years | 0 (0.0%) | 0 (0.0%) |
| 20 to 34 years | 50 (46.3%) | 58 (53.7%) |
| 35 to 50 years | 100 (61.0%) | 64 (39.0%) |
| Total | 150 (55.1%) | 122 (44.9%) |
Fertility by Education in Norco
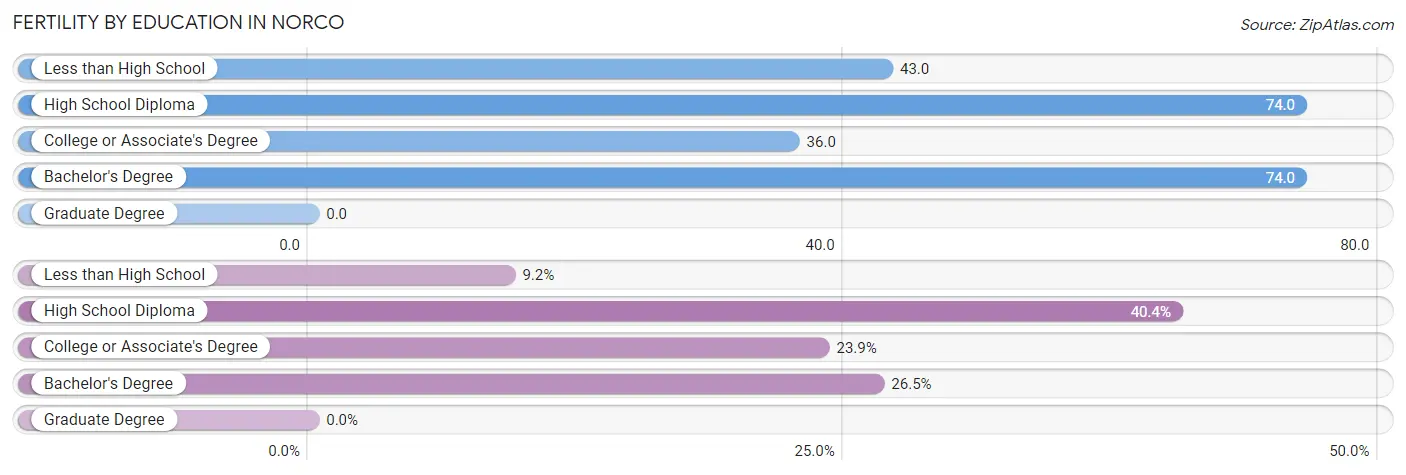
| Educational Attainment | Women with Births | Births / 1,000 Women |
| Less than High School | 25 (9.2%) | 43.0 |
| High School Diploma | 110 (40.4%) | 74.0 |
| College or Associate's Degree | 65 (23.9%) | 36.0 |
| Bachelor's Degree | 72 (26.5%) | 74.0 |
| Graduate Degree | 0 (0.0%) | 0.0 |
| Total | 272 (100.0%) | 52.0 |
Fertility by Education by Marriage Status in Norco
44.9% of women with births in Norco are unmarried. Women with the educational attainment of bachelor's degree are most likely to be married with 79.2% of them married at childbirth, while women with the educational attainment of less than high school are least likely to be married with 76.0% of them unmarried at childbirth.
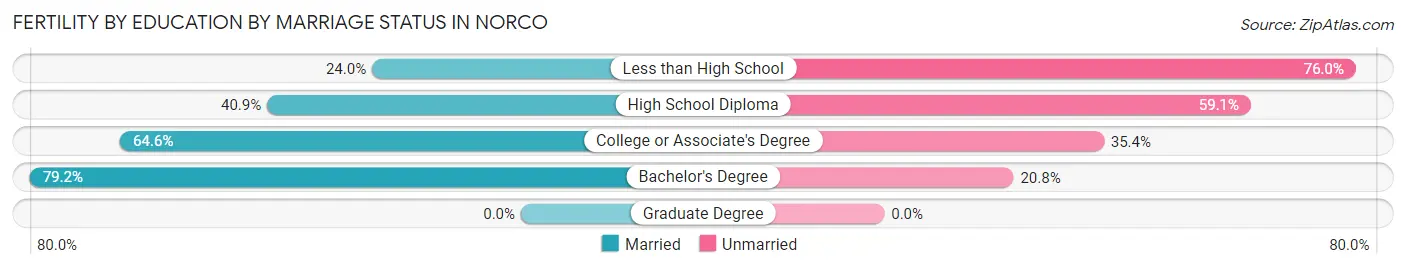
| Educational Attainment | Married | Unmarried |
| Less than High School | 6 (24.0%) | 19 (76.0%) |
| High School Diploma | 45 (40.9%) | 65 (59.1%) |
| College or Associate's Degree | 42 (64.6%) | 23 (35.4%) |
| Bachelor's Degree | 57 (79.2%) | 15 (20.8%) |
| Graduate Degree | 0 (0.0%) | 0 (0.0%) |
| Total | 150 (55.1%) | 122 (44.9%) |
Employment Characteristics in Norco
Employment by Class of Employer in Norco
Among the 11,308 employed individuals in Norco, private company employees (7,691 | 68.0%), local government employees (1,041 | 9.2%), and self-employed (not incorporated) (822 | 7.3%) make up the most common classes of employment.
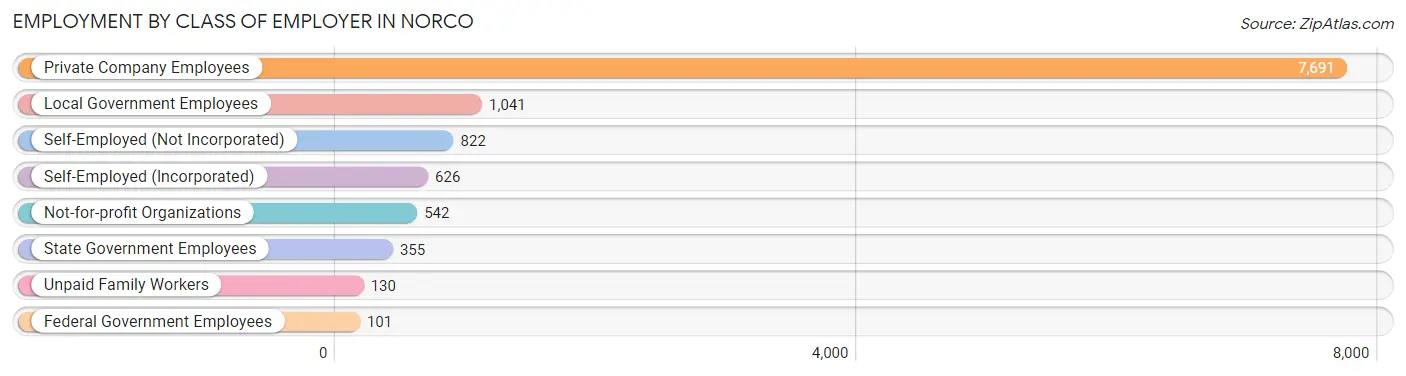
| Employer Class | # Employees | % Employees |
| Private Company Employees | 7,691 | 68.0% |
| Self-Employed (Incorporated) | 626 | 5.5% |
| Self-Employed (Not Incorporated) | 822 | 7.3% |
| Not-for-profit Organizations | 542 | 4.8% |
| Local Government Employees | 1,041 | 9.2% |
| State Government Employees | 355 | 3.1% |
| Federal Government Employees | 101 | 0.9% |
| Unpaid Family Workers | 130 | 1.1% |
| Total | 11,308 | 100.0% |
Employment Status by Age in Norco
According to the labor force statistics for Norco, out of the total population over 16 years of age (21,219), 56.6% or 12,010 individuals are in the labor force, with 3.8% or 456 of them unemployed. The age group with the highest labor force participation rate is 45 to 54 years, with 71.4% or 2,808 individuals in the labor force. Within the labor force, the 30 to 34 years age range has the highest percentage of unemployed individuals, with 12.4% or 142 of them being unemployed.
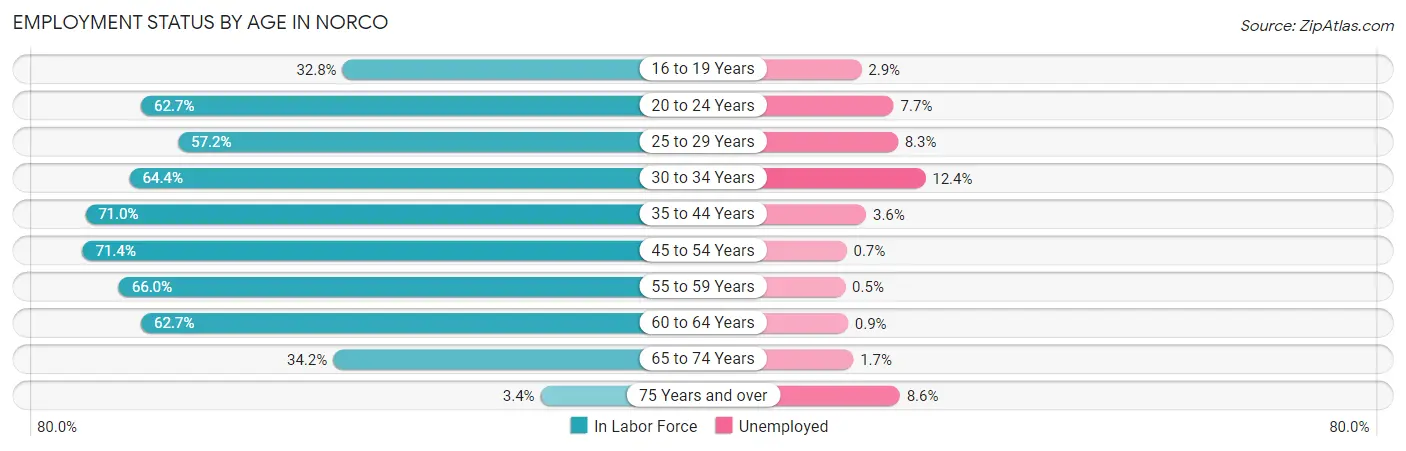
| Age Bracket | In Labor Force | Unemployed |
| 16 to 19 Years | 307 (32.8%) | 9 (2.9%) |
| 20 to 24 Years | 1,077 (62.7%) | 83 (7.7%) |
| 25 to 29 Years | 952 (57.2%) | 79 (8.3%) |
| 30 to 34 Years | 1,149 (64.4%) | 142 (12.4%) |
| 35 to 44 Years | 2,469 (71.0%) | 89 (3.6%) |
| 45 to 54 Years | 2,808 (71.4%) | 20 (0.7%) |
| 55 to 59 Years | 1,369 (66.0%) | 7 (0.5%) |
| 60 to 64 Years | 1,077 (62.7%) | 10 (0.9%) |
| 65 to 74 Years | 749 (34.2%) | 13 (1.7%) |
| 75 Years and over | 59 (3.4%) | 5 (8.6%) |
| Total | 12,010 (56.6%) | 456 (3.8%) |
Employment Status by Educational Attainment in Norco
According to labor force statistics for Norco, 67.1% of individuals (9,831) out of the total population between 25 and 64 years of age (14,651) are in the labor force, with 3.5% or 344 of them being unemployed. The group with the highest labor force participation rate are those with the educational attainment of bachelor's degree or higher, with 89.2% or 2,631 individuals in the labor force. Within the labor force, individuals with college / associate degree education have the highest percentage of unemployment, with 5.0% or 166 of them being unemployed.
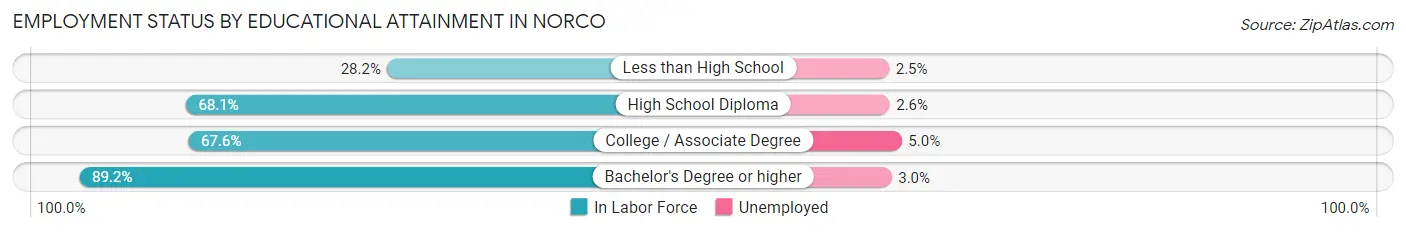
| Educational Attainment | In Labor Force | Unemployed |
| Less than High School | 530 (28.2%) | 47 (2.5%) |
| High School Diploma | 3,349 (68.1%) | 128 (2.6%) |
| College / Associate Degree | 3,316 (67.6%) | 245 (5.0%) |
| Bachelor's Degree or higher | 2,631 (89.2%) | 88 (3.0%) |
| Total | 9,831 (67.1%) | 513 (3.5%) |
Employment Occupations by Sex in Norco
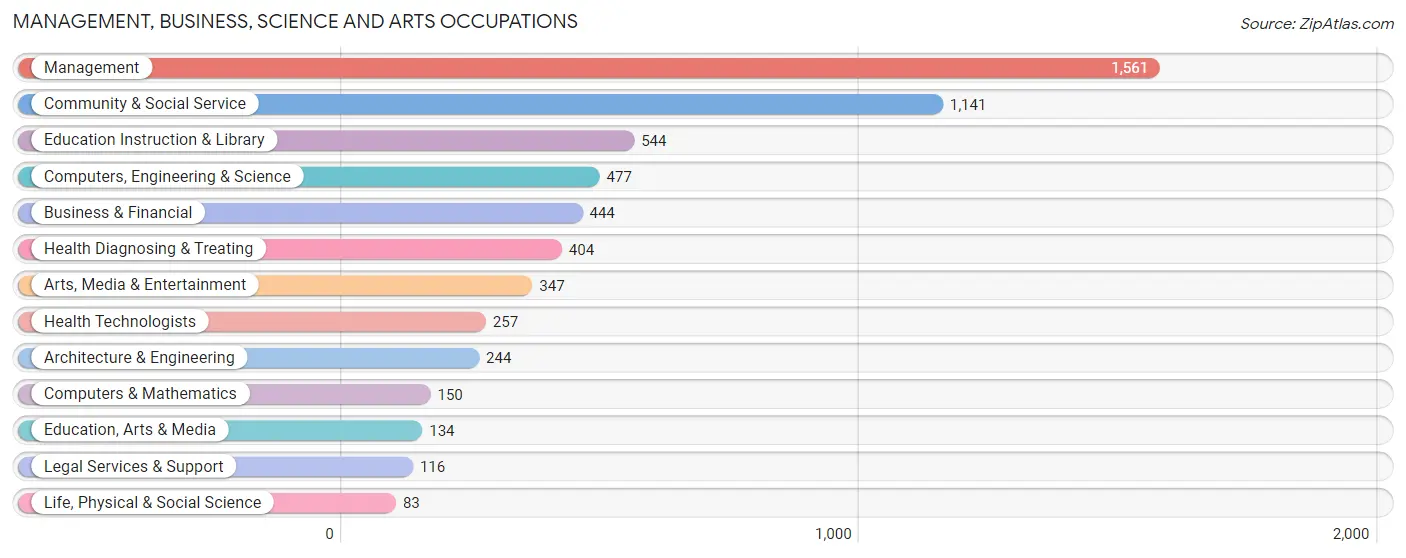
Management, Business, Science and Arts Occupations
The most common Management, Business, Science and Arts occupations in Norco are Management (1,561 | 13.5%), Community & Social Service (1,141 | 9.9%), Education Instruction & Library (544 | 4.7%), Computers, Engineering & Science (477 | 4.1%), and Business & Financial (444 | 3.8%).
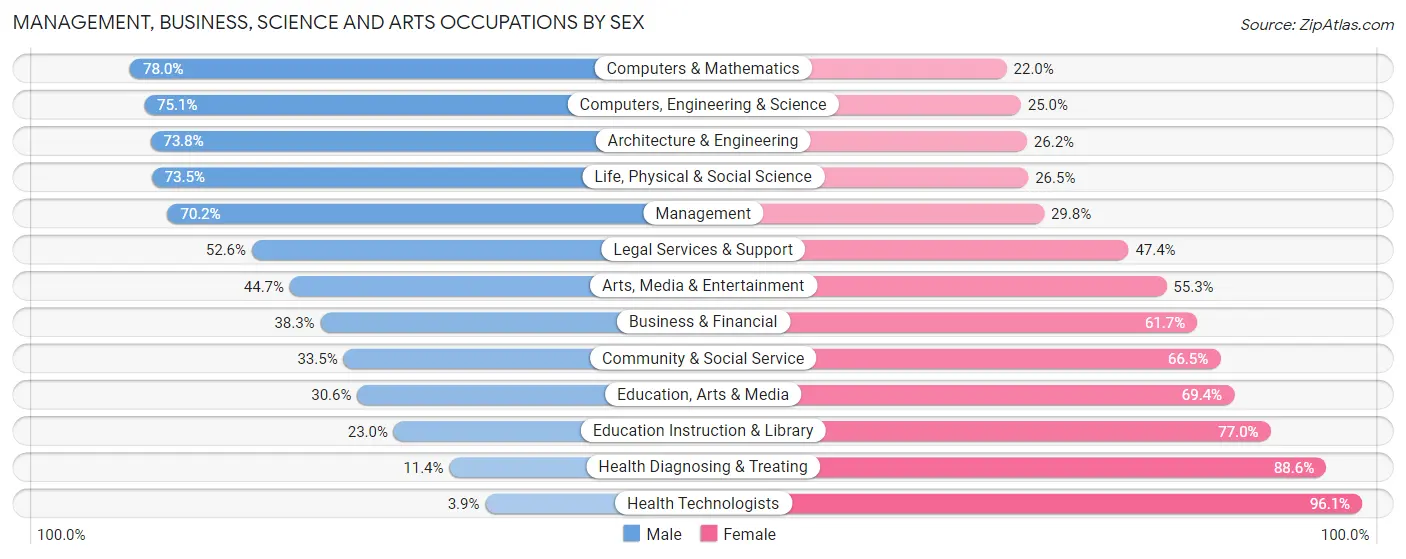
Management, Business, Science and Arts Occupations by Sex
Within the Management, Business, Science and Arts occupations in Norco, the most male-oriented occupations are Computers & Mathematics (78.0%), Computers, Engineering & Science (75.0%), and Architecture & Engineering (73.8%), while the most female-oriented occupations are Health Technologists (96.1%), Health Diagnosing & Treating (88.6%), and Education Instruction & Library (77.0%).
| Occupation | Male | Female |
| Management | 1,096 (70.2%) | 465 (29.8%) |
| Business & Financial | 170 (38.3%) | 274 (61.7%) |
| Computers, Engineering & Science | 358 (75.0%) | 119 (24.9%) |
| Computers & Mathematics | 117 (78.0%) | 33 (22.0%) |
| Architecture & Engineering | 180 (73.8%) | 64 (26.2%) |
| Life, Physical & Social Science | 61 (73.5%) | 22 (26.5%) |
| Community & Social Service | 382 (33.5%) | 759 (66.5%) |
| Education, Arts & Media | 41 (30.6%) | 93 (69.4%) |
| Legal Services & Support | 61 (52.6%) | 55 (47.4%) |
| Education Instruction & Library | 125 (23.0%) | 419 (77.0%) |
| Arts, Media & Entertainment | 155 (44.7%) | 192 (55.3%) |
| Health Diagnosing & Treating | 46 (11.4%) | 358 (88.6%) |
| Health Technologists | 10 (3.9%) | 247 (96.1%) |
| Total (Category) | 2,052 (51.0%) | 1,975 (49.0%) |
| Total (Overall) | 6,278 (54.3%) | 5,273 (45.7%) |
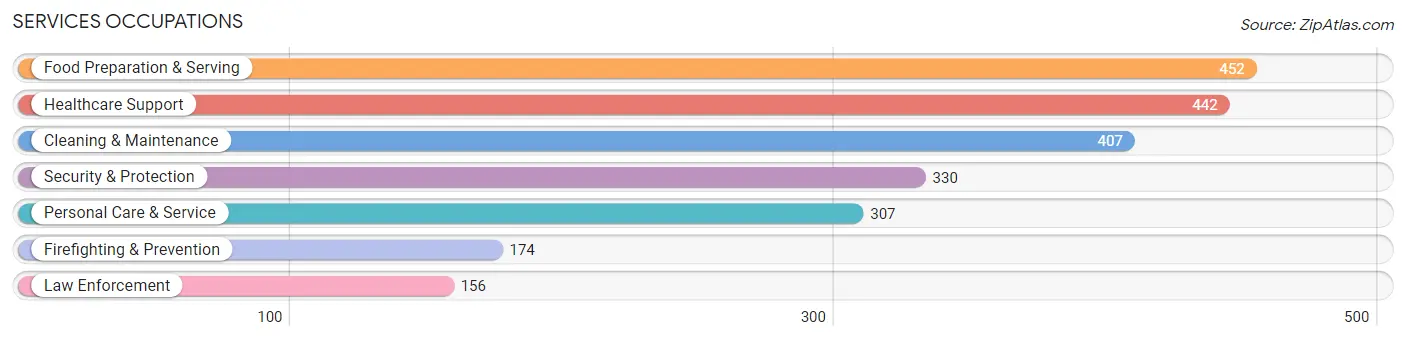
Services Occupations
The most common Services occupations in Norco are Food Preparation & Serving (452 | 3.9%), Healthcare Support (442 | 3.8%), Cleaning & Maintenance (407 | 3.5%), Security & Protection (330 | 2.9%), and Personal Care & Service (307 | 2.7%).
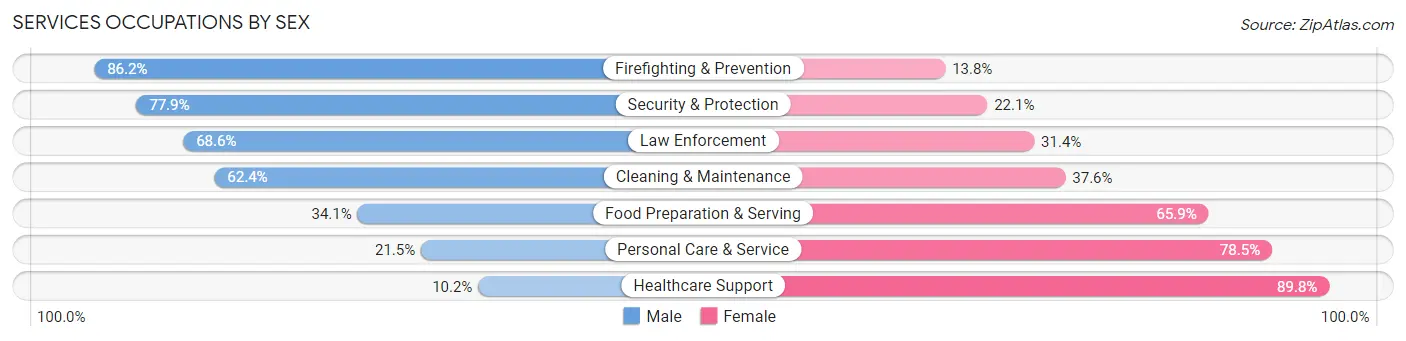
Services Occupations by Sex
Within the Services occupations in Norco, the most male-oriented occupations are Firefighting & Prevention (86.2%), Security & Protection (77.9%), and Law Enforcement (68.6%), while the most female-oriented occupations are Healthcare Support (89.8%), Personal Care & Service (78.5%), and Food Preparation & Serving (65.9%).
| Occupation | Male | Female |
| Healthcare Support | 45 (10.2%) | 397 (89.8%) |
| Security & Protection | 257 (77.9%) | 73 (22.1%) |
| Firefighting & Prevention | 150 (86.2%) | 24 (13.8%) |
| Law Enforcement | 107 (68.6%) | 49 (31.4%) |
| Food Preparation & Serving | 154 (34.1%) | 298 (65.9%) |
| Cleaning & Maintenance | 254 (62.4%) | 153 (37.6%) |
| Personal Care & Service | 66 (21.5%) | 241 (78.5%) |
| Total (Category) | 776 (40.0%) | 1,162 (60.0%) |
| Total (Overall) | 6,278 (54.3%) | 5,273 (45.7%) |
Sales and Office Occupations
The most common Sales and Office occupations in Norco are Sales & Related (1,355 | 11.7%), and Office & Administration (1,355 | 11.7%).
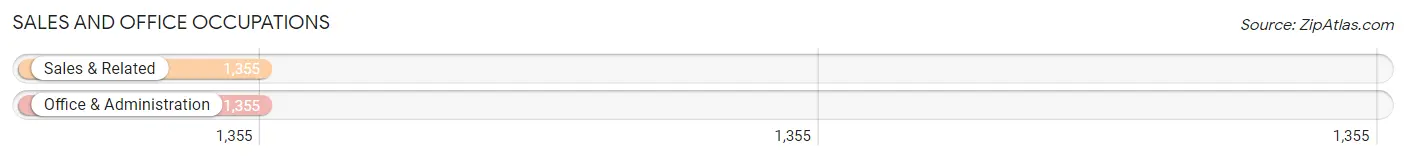
Sales and Office Occupations by Sex
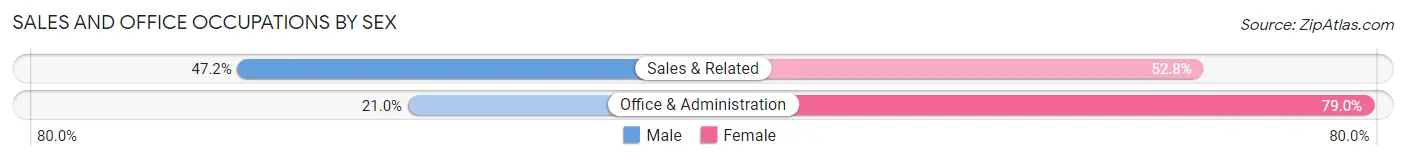
| Occupation | Male | Female |
| Sales & Related | 640 (47.2%) | 715 (52.8%) |
| Office & Administration | 285 (21.0%) | 1,070 (79.0%) |
| Total (Category) | 925 (34.1%) | 1,785 (65.9%) |
| Total (Overall) | 6,278 (54.3%) | 5,273 (45.7%) |
Natural Resources, Construction and Maintenance Occupations
The most common Natural Resources, Construction and Maintenance occupations in Norco are Construction & Extraction (795 | 6.9%), Installation, Maintenance & Repair (431 | 3.7%), and Farming, Fishing & Forestry (45 | 0.4%).
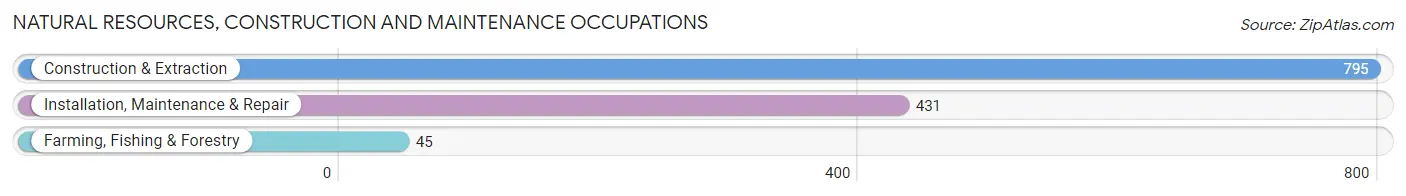
Natural Resources, Construction and Maintenance Occupations by Sex
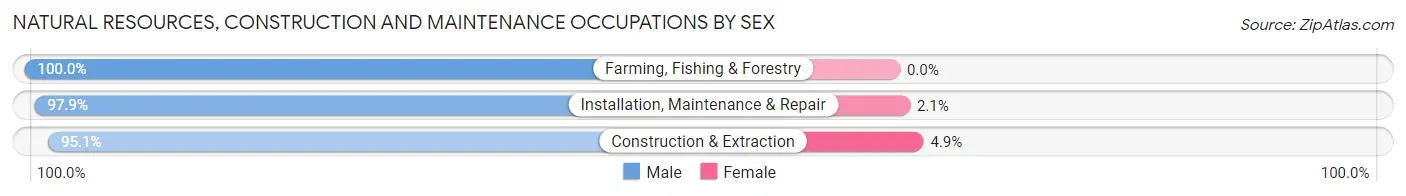
| Occupation | Male | Female |
| Farming, Fishing & Forestry | 45 (100.0%) | 0 (0.0%) |
| Construction & Extraction | 756 (95.1%) | 39 (4.9%) |
| Installation, Maintenance & Repair | 422 (97.9%) | 9 (2.1%) |
| Total (Category) | 1,223 (96.2%) | 48 (3.8%) |
| Total (Overall) | 6,278 (54.3%) | 5,273 (45.7%) |
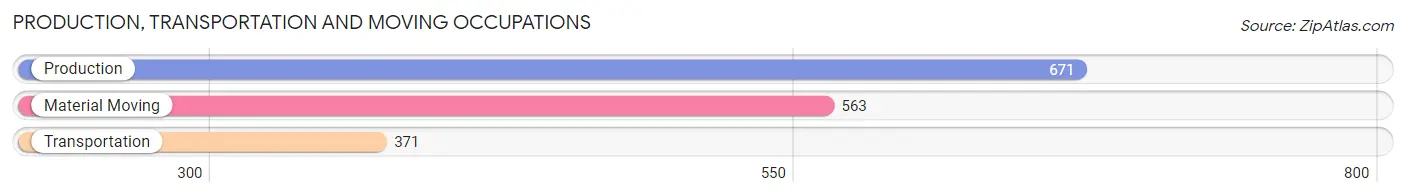
Production, Transportation and Moving Occupations
The most common Production, Transportation and Moving occupations in Norco are Production (671 | 5.8%), Material Moving (563 | 4.9%), and Transportation (371 | 3.2%).
Production, Transportation and Moving Occupations by Sex
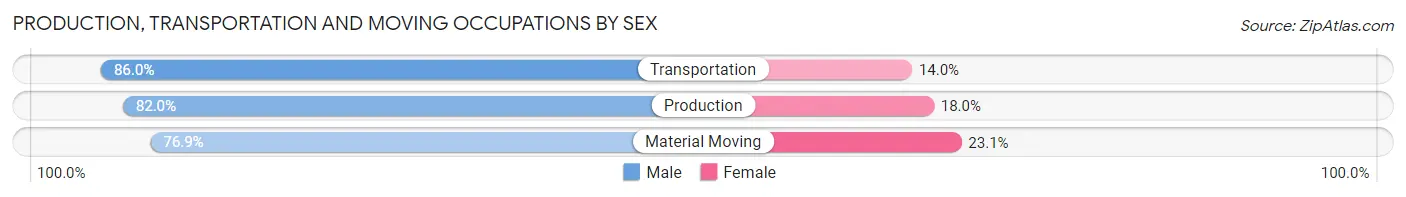
| Occupation | Male | Female |
| Production | 550 (82.0%) | 121 (18.0%) |
| Transportation | 319 (86.0%) | 52 (14.0%) |
| Material Moving | 433 (76.9%) | 130 (23.1%) |
| Total (Category) | 1,302 (81.1%) | 303 (18.9%) |
| Total (Overall) | 6,278 (54.3%) | 5,273 (45.7%) |
Employment Industries by Sex in Norco
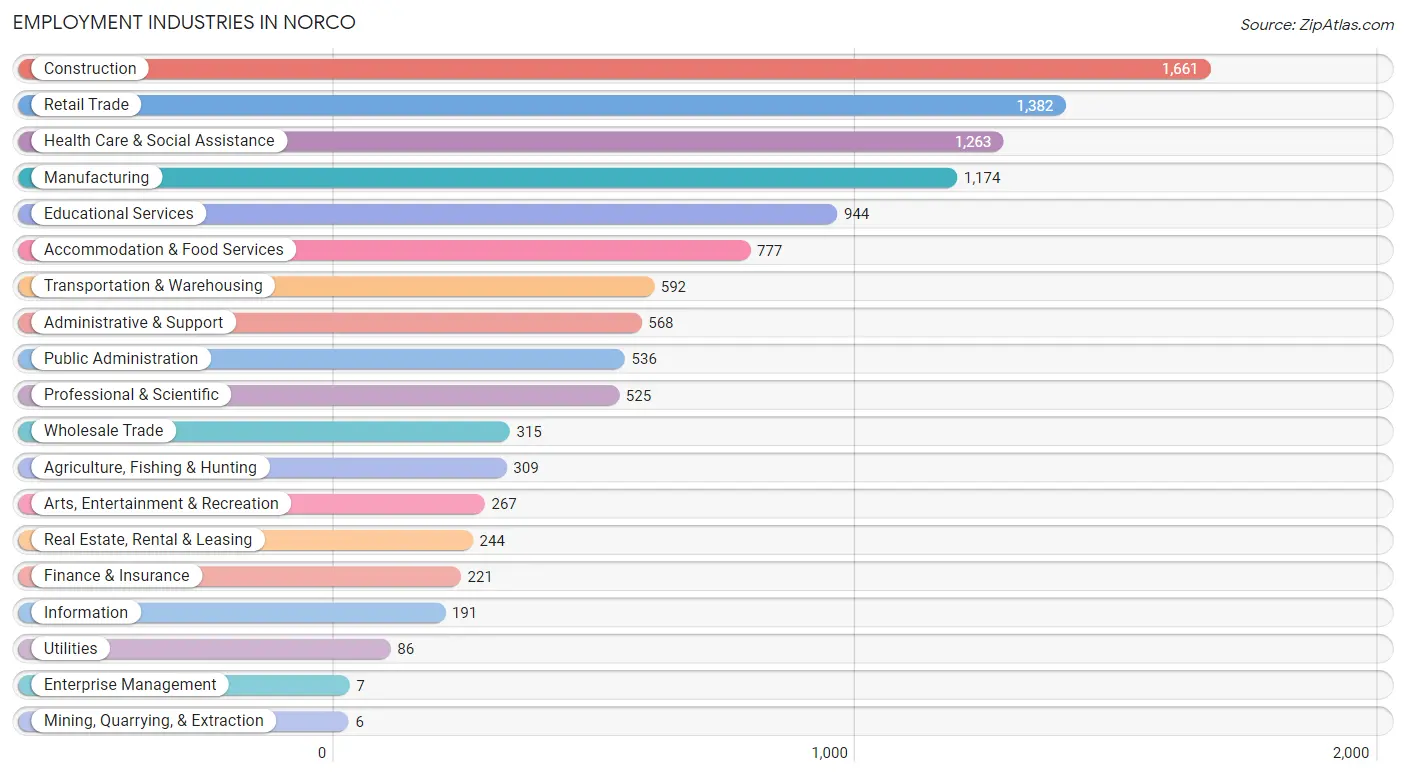
Employment Industries in Norco
The major employment industries in Norco include Construction (1,661 | 14.4%), Retail Trade (1,382 | 12.0%), Health Care & Social Assistance (1,263 | 10.9%), Manufacturing (1,174 | 10.2%), and Educational Services (944 | 8.2%).
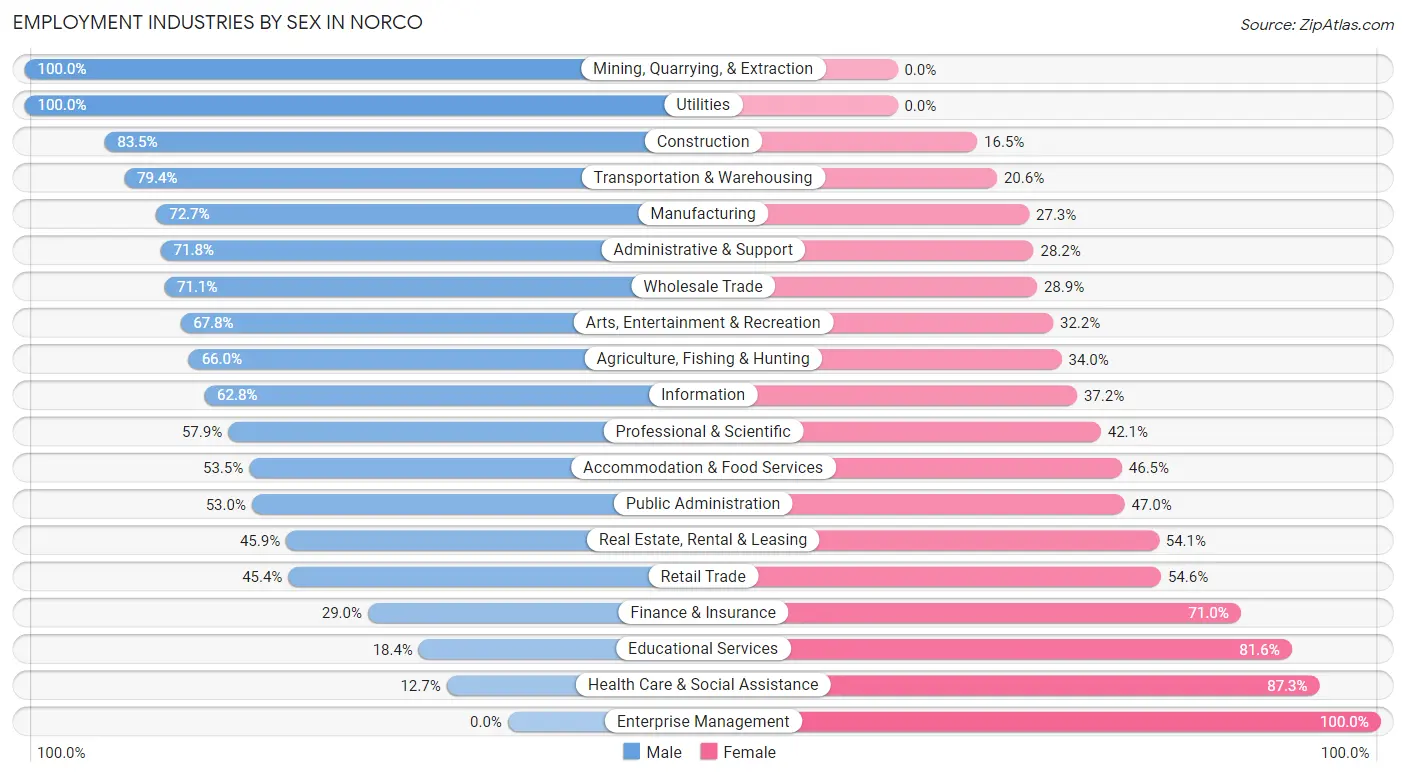
Employment Industries by Sex in Norco
The Norco industries that see more men than women are Mining, Quarrying, & Extraction (100.0%), Utilities (100.0%), and Construction (83.5%), whereas the industries that tend to have a higher number of women are Enterprise Management (100.0%), Health Care & Social Assistance (87.3%), and Educational Services (81.6%).
| Industry | Male | Female |
| Agriculture, Fishing & Hunting | 204 (66.0%) | 105 (34.0%) |
| Mining, Quarrying, & Extraction | 6 (100.0%) | 0 (0.0%) |
| Construction | 1,387 (83.5%) | 274 (16.5%) |
| Manufacturing | 854 (72.7%) | 320 (27.3%) |
| Wholesale Trade | 224 (71.1%) | 91 (28.9%) |
| Retail Trade | 628 (45.4%) | 754 (54.6%) |
| Transportation & Warehousing | 470 (79.4%) | 122 (20.6%) |
| Utilities | 86 (100.0%) | 0 (0.0%) |
| Information | 120 (62.8%) | 71 (37.2%) |
| Finance & Insurance | 64 (29.0%) | 157 (71.0%) |
| Real Estate, Rental & Leasing | 112 (45.9%) | 132 (54.1%) |
| Professional & Scientific | 304 (57.9%) | 221 (42.1%) |
| Enterprise Management | 0 (0.0%) | 7 (100.0%) |
| Administrative & Support | 408 (71.8%) | 160 (28.2%) |
| Educational Services | 174 (18.4%) | 770 (81.6%) |
| Health Care & Social Assistance | 160 (12.7%) | 1,103 (87.3%) |
| Arts, Entertainment & Recreation | 181 (67.8%) | 86 (32.2%) |
| Accommodation & Food Services | 416 (53.5%) | 361 (46.5%) |
| Public Administration | 284 (53.0%) | 252 (47.0%) |
| Total | 6,278 (54.3%) | 5,273 (45.7%) |
Education in Norco
School Enrollment in Norco
The most common levels of schooling among the 6,034 students in Norco are college / undergraduate (1,692 | 28.0%), high school (1,418 | 23.5%), and middle school (1,236 | 20.5%).
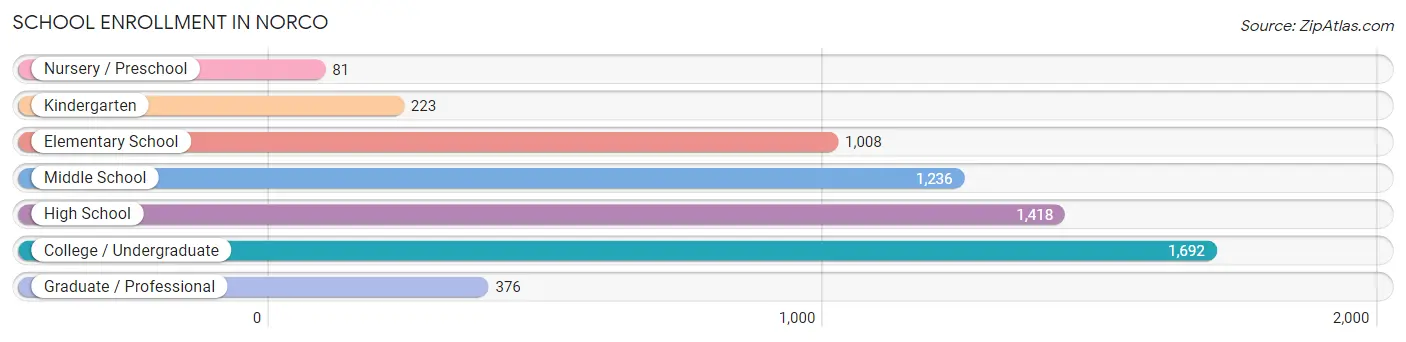
| School Level | # Students | % Students |
| Nursery / Preschool | 81 | 1.3% |
| Kindergarten | 223 | 3.7% |
| Elementary School | 1,008 | 16.7% |
| Middle School | 1,236 | 20.5% |
| High School | 1,418 | 23.5% |
| College / Undergraduate | 1,692 | 28.0% |
| Graduate / Professional | 376 | 6.2% |
| Total | 6,034 | 100.0% |
School Enrollment by Age by Funding Source in Norco
Out of a total of 6,034 students who are enrolled in schools in Norco, 778 (12.9%) attend a private institution, while the remaining 5,256 (87.1%) are enrolled in public schools. The age group of 3 to 4 year olds has the highest likelihood of being enrolled in private schools, with 38 (62.3% in the age bracket) enrolled. Conversely, the age group of 15 to 17 year olds has the lowest likelihood of being enrolled in a private school, with 617 (96.4% in the age bracket) attending a public institution.
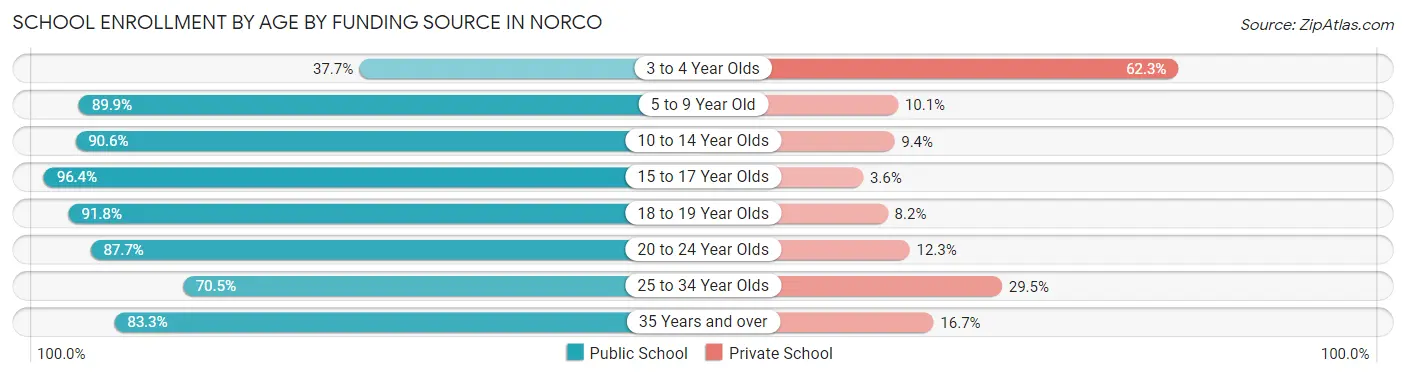
| Age Bracket | Public School | Private School |
| 3 to 4 Year Olds | 23 (37.7%) | 38 (62.3%) |
| 5 to 9 Year Old | 951 (89.9%) | 107 (10.1%) |
| 10 to 14 Year Olds | 1,489 (90.6%) | 155 (9.4%) |
| 15 to 17 Year Olds | 617 (96.4%) | 23 (3.6%) |
| 18 to 19 Year Olds | 314 (91.8%) | 28 (8.2%) |
| 20 to 24 Year Olds | 729 (87.7%) | 102 (12.3%) |
| 25 to 34 Year Olds | 467 (70.5%) | 195 (29.5%) |
| 35 Years and over | 663 (83.3%) | 133 (16.7%) |
| Total | 5,256 (87.1%) | 778 (12.9%) |
Educational Attainment by Field of Study in Norco
Business (819 | 20.0%), education (448 | 10.9%), engineering (413 | 10.1%), social sciences (401 | 9.8%), and science & technology (331 | 8.1%) are the most common fields of study among 4,101 individuals in Norco who have obtained a bachelor's degree or higher.
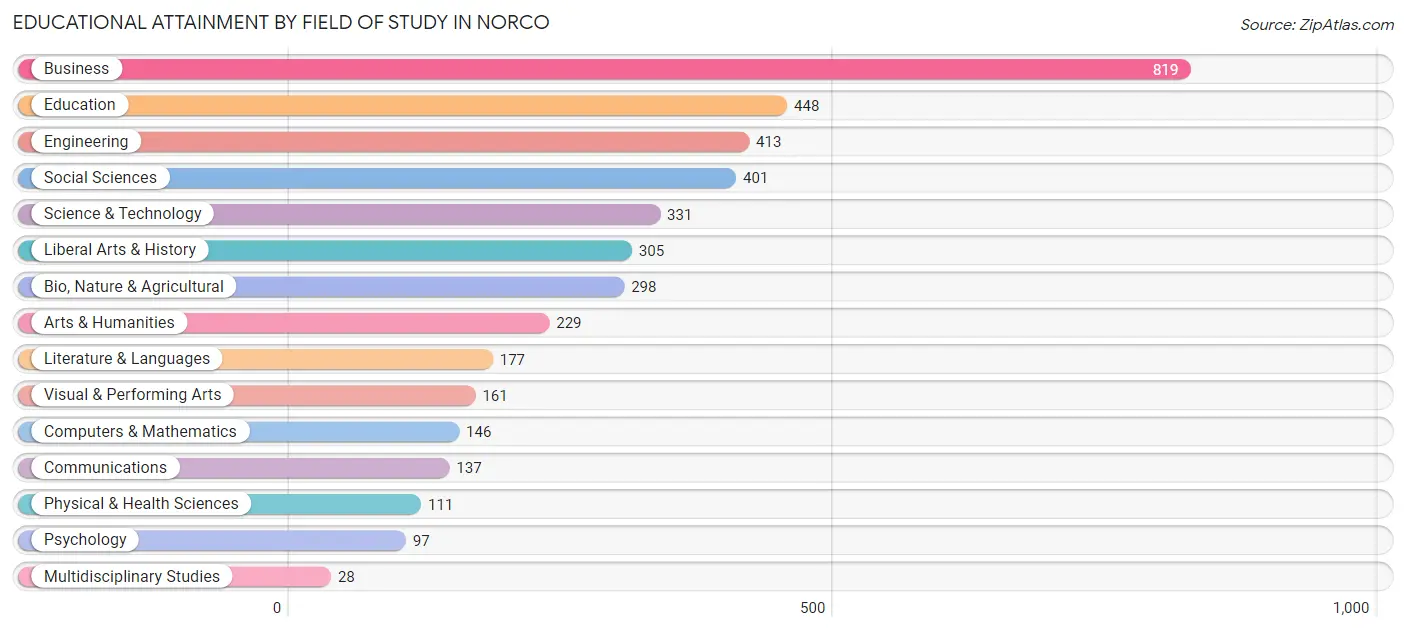
| Field of Study | # Graduates | % Graduates |
| Computers & Mathematics | 146 | 3.6% |
| Bio, Nature & Agricultural | 298 | 7.3% |
| Physical & Health Sciences | 111 | 2.7% |
| Psychology | 97 | 2.4% |
| Social Sciences | 401 | 9.8% |
| Engineering | 413 | 10.1% |
| Multidisciplinary Studies | 28 | 0.7% |
| Science & Technology | 331 | 8.1% |
| Business | 819 | 20.0% |
| Education | 448 | 10.9% |
| Literature & Languages | 177 | 4.3% |
| Liberal Arts & History | 305 | 7.4% |
| Visual & Performing Arts | 161 | 3.9% |
| Communications | 137 | 3.3% |
| Arts & Humanities | 229 | 5.6% |
| Total | 4,101 | 100.0% |
Transportation & Commute in Norco
Vehicle Availability by Sex in Norco
The most prevalent vehicle ownership categories in Norco are males with 3 vehicles (1,692, accounting for 27.4%) and females with 3 vehicles (1,388, making up 33.4%).
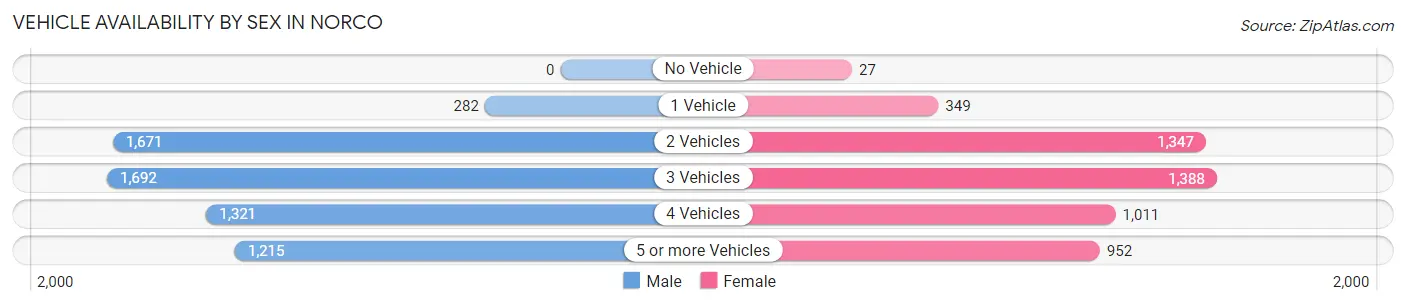
| Vehicles Available | Male | Female |
| No Vehicle | 0 (0.0%) | 27 (0.5%) |
| 1 Vehicle | 282 (4.6%) | 349 (6.9%) |
| 2 Vehicles | 1,671 (27.0%) | 1,347 (26.6%) |
| 3 Vehicles | 1,692 (27.4%) | 1,388 (27.4%) |
| 4 Vehicles | 1,321 (21.4%) | 1,011 (19.9%) |
| 5 or more Vehicles | 1,215 (19.7%) | 952 (18.8%) |
| Total | 6,181 (100.0%) | 5,074 (100.0%) |
Commute Time in Norco
The most frequently occuring commute durations in Norco are 15 to 19 minutes (1,330 commuters, 13.1%), 60 to 89 minutes (1,315 commuters, 13.0%), and 30 to 34 minutes (1,298 commuters, 12.8%).
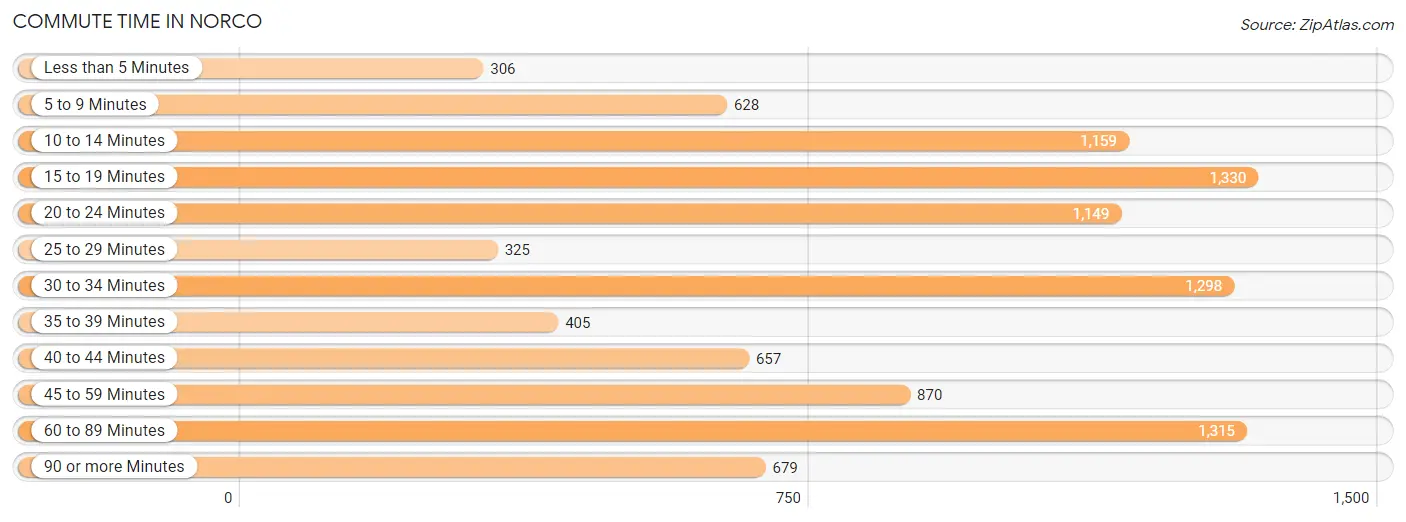
| Commute Time | # Commuters | % Commuters |
| Less than 5 Minutes | 306 | 3.0% |
| 5 to 9 Minutes | 628 | 6.2% |
| 10 to 14 Minutes | 1,159 | 11.5% |
| 15 to 19 Minutes | 1,330 | 13.1% |
| 20 to 24 Minutes | 1,149 | 11.4% |
| 25 to 29 Minutes | 325 | 3.2% |
| 30 to 34 Minutes | 1,298 | 12.8% |
| 35 to 39 Minutes | 405 | 4.0% |
| 40 to 44 Minutes | 657 | 6.5% |
| 45 to 59 Minutes | 870 | 8.6% |
| 60 to 89 Minutes | 1,315 | 13.0% |
| 90 or more Minutes | 679 | 6.7% |
Commute Time by Sex in Norco
The most common commute times in Norco are 60 to 89 minutes (787 commuters, 14.0%) for males and 10 to 14 minutes (716 commuters, 15.9%) for females.
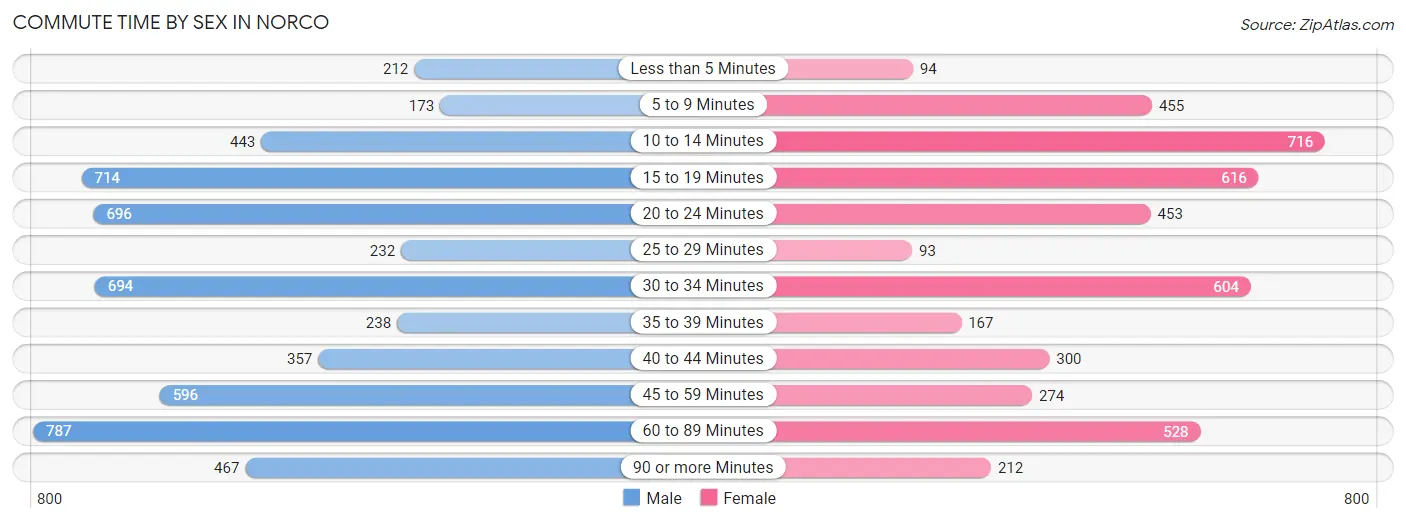
| Commute Time | Male | Female |
| Less than 5 Minutes | 212 (3.8%) | 94 (2.1%) |
| 5 to 9 Minutes | 173 (3.1%) | 455 (10.1%) |
| 10 to 14 Minutes | 443 (7.9%) | 716 (15.9%) |
| 15 to 19 Minutes | 714 (12.7%) | 616 (13.7%) |
| 20 to 24 Minutes | 696 (12.4%) | 453 (10.0%) |
| 25 to 29 Minutes | 232 (4.1%) | 93 (2.1%) |
| 30 to 34 Minutes | 694 (12.4%) | 604 (13.4%) |
| 35 to 39 Minutes | 238 (4.2%) | 167 (3.7%) |
| 40 to 44 Minutes | 357 (6.4%) | 300 (6.7%) |
| 45 to 59 Minutes | 596 (10.6%) | 274 (6.1%) |
| 60 to 89 Minutes | 787 (14.0%) | 528 (11.7%) |
| 90 or more Minutes | 467 (8.3%) | 212 (4.7%) |
Time of Departure to Work by Sex in Norco
The most frequent times of departure to work in Norco are 12:00 AM to 4:59 AM (1,230, 21.9%) for males and 7:00 AM to 7:29 AM (674, 14.9%) for females.
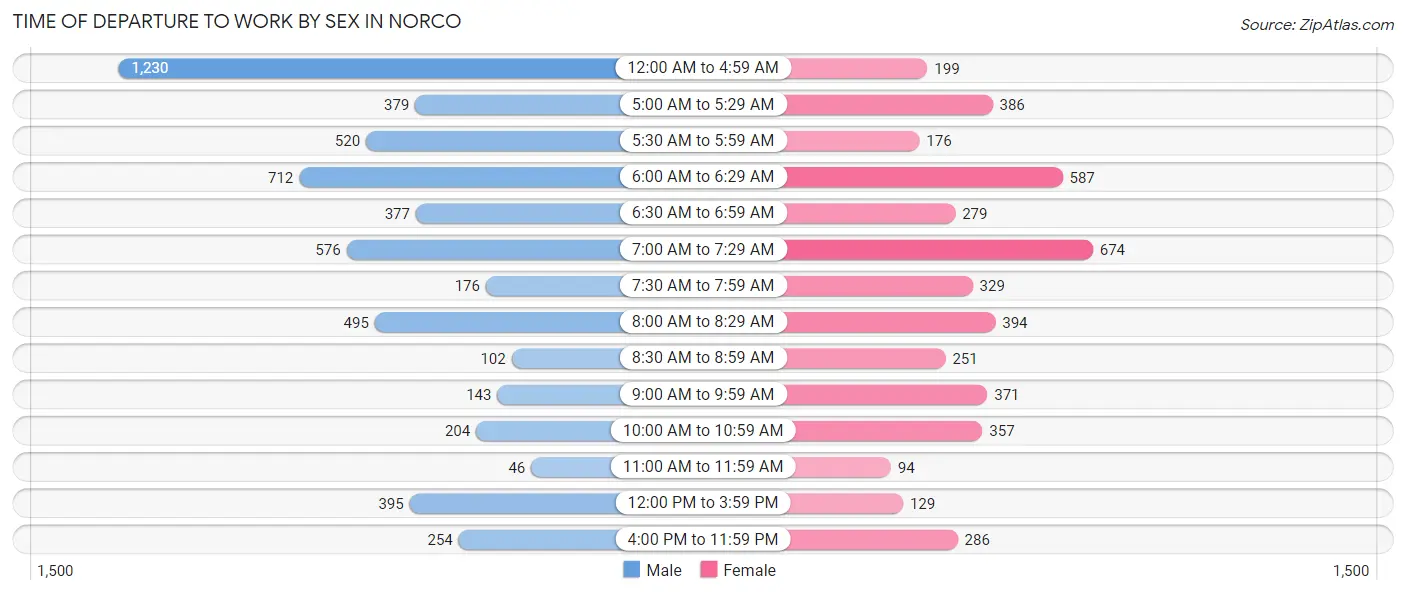
| Time of Departure | Male | Female |
| 12:00 AM to 4:59 AM | 1,230 (21.9%) | 199 (4.4%) |
| 5:00 AM to 5:29 AM | 379 (6.8%) | 386 (8.6%) |
| 5:30 AM to 5:59 AM | 520 (9.3%) | 176 (3.9%) |
| 6:00 AM to 6:29 AM | 712 (12.7%) | 587 (13.0%) |
| 6:30 AM to 6:59 AM | 377 (6.7%) | 279 (6.2%) |
| 7:00 AM to 7:29 AM | 576 (10.3%) | 674 (14.9%) |
| 7:30 AM to 7:59 AM | 176 (3.1%) | 329 (7.3%) |
| 8:00 AM to 8:29 AM | 495 (8.8%) | 394 (8.7%) |
| 8:30 AM to 8:59 AM | 102 (1.8%) | 251 (5.6%) |
| 9:00 AM to 9:59 AM | 143 (2.5%) | 371 (8.2%) |
| 10:00 AM to 10:59 AM | 204 (3.6%) | 357 (7.9%) |
| 11:00 AM to 11:59 AM | 46 (0.8%) | 94 (2.1%) |
| 12:00 PM to 3:59 PM | 395 (7.0%) | 129 (2.9%) |
| 4:00 PM to 11:59 PM | 254 (4.5%) | 286 (6.3%) |
| Total | 5,609 (100.0%) | 4,512 (100.0%) |
Housing Occupancy in Norco
Occupancy by Ownership in Norco
Of the total 6,935 dwellings in Norco, owner-occupied units account for 5,735 (82.7%), while renter-occupied units make up 1,200 (17.3%).
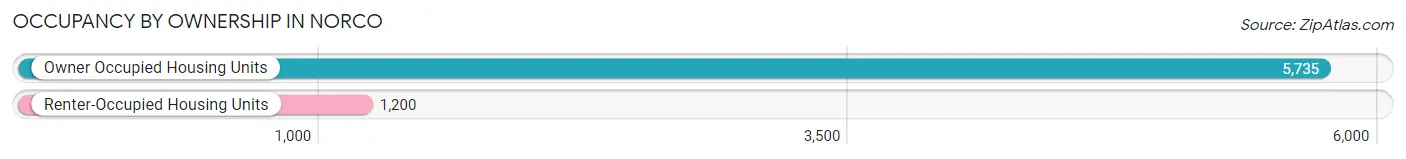
| Occupancy | # Housing Units | % Housing Units |
| Owner Occupied Housing Units | 5,735 | 82.7% |
| Renter-Occupied Housing Units | 1,200 | 17.3% |
| Total Occupied Housing Units | 6,935 | 100.0% |
Occupancy by Household Size in Norco
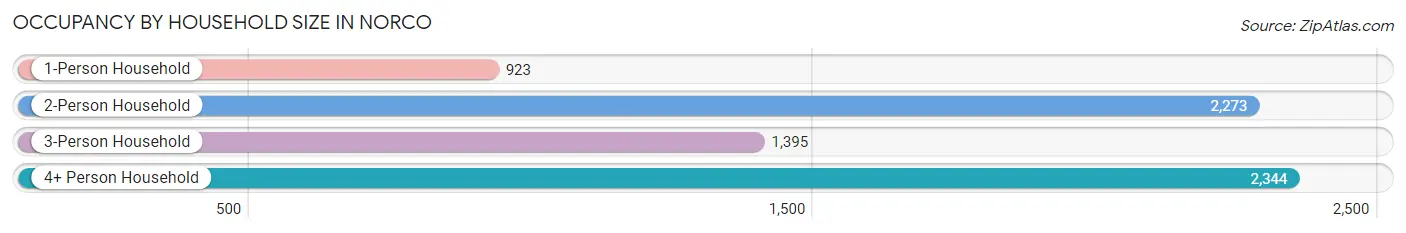
| Household Size | # Housing Units | % Housing Units |
| 1-Person Household | 923 | 13.3% |
| 2-Person Household | 2,273 | 32.8% |
| 3-Person Household | 1,395 | 20.1% |
| 4+ Person Household | 2,344 | 33.8% |
| Total Housing Units | 6,935 | 100.0% |
Occupancy by Ownership by Household Size in Norco
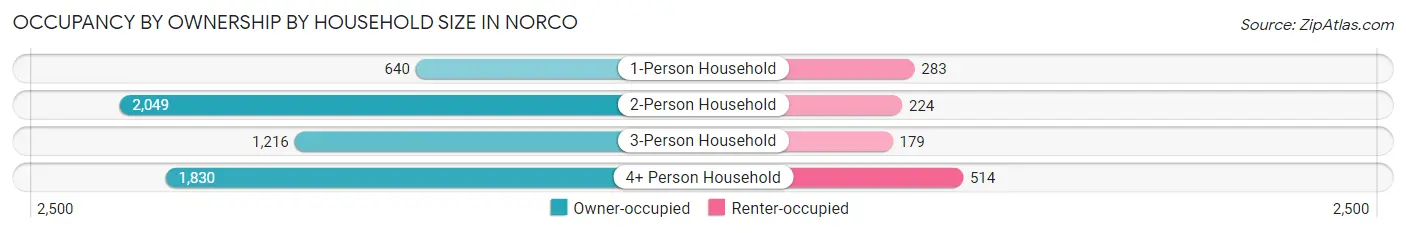
| Household Size | Owner-occupied | Renter-occupied |
| 1-Person Household | 640 (69.3%) | 283 (30.7%) |
| 2-Person Household | 2,049 (90.1%) | 224 (9.9%) |
| 3-Person Household | 1,216 (87.2%) | 179 (12.8%) |
| 4+ Person Household | 1,830 (78.1%) | 514 (21.9%) |
| Total Housing Units | 5,735 (82.7%) | 1,200 (17.3%) |
Occupancy by Educational Attainment in Norco
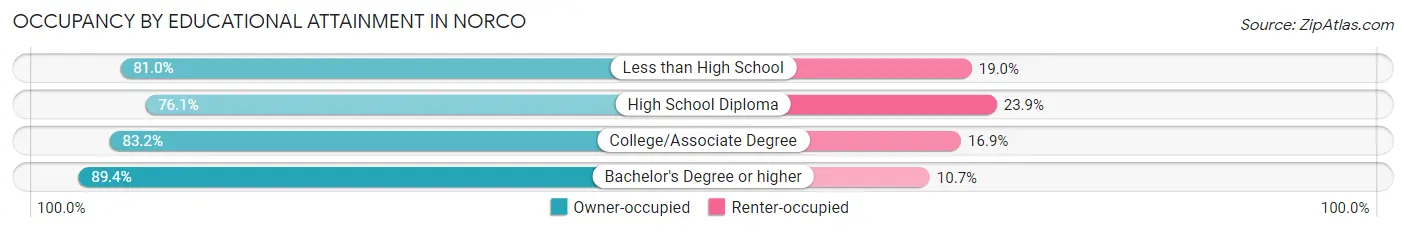
| Household Size | Owner-occupied | Renter-occupied |
| Less than High School | 423 (81.0%) | 99 (19.0%) |
| High School Diploma | 1,517 (76.1%) | 477 (23.9%) |
| College/Associate Degree | 2,058 (83.2%) | 417 (16.9%) |
| Bachelor's Degree or higher | 1,737 (89.3%) | 207 (10.6%) |
Occupancy by Age of Householder in Norco
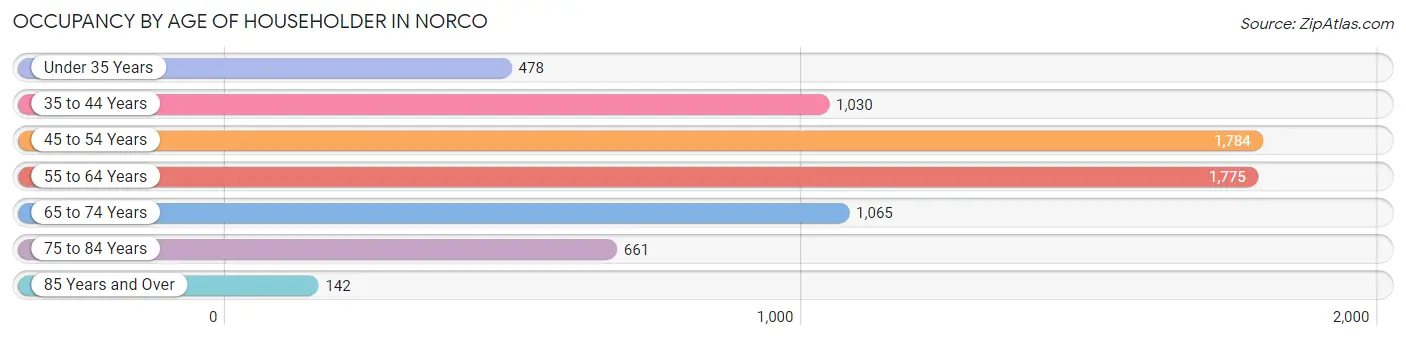
| Age Bracket | # Households | % Households |
| Under 35 Years | 478 | 6.9% |
| 35 to 44 Years | 1,030 | 14.8% |
| 45 to 54 Years | 1,784 | 25.7% |
| 55 to 64 Years | 1,775 | 25.6% |
| 65 to 74 Years | 1,065 | 15.4% |
| 75 to 84 Years | 661 | 9.5% |
| 85 Years and Over | 142 | 2.1% |
| Total | 6,935 | 100.0% |
Housing Finances in Norco
Median Income by Occupancy in Norco
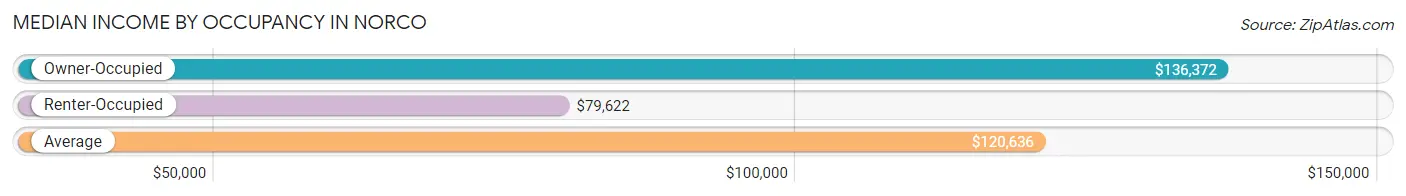
| Occupancy Type | # Households | Median Income |
| Owner-Occupied | 5,735 (82.7%) | $136,372 |
| Renter-Occupied | 1,200 (17.3%) | $79,622 |
| Average | 6,935 (100.0%) | $120,636 |
Occupancy by Householder Income Bracket in Norco
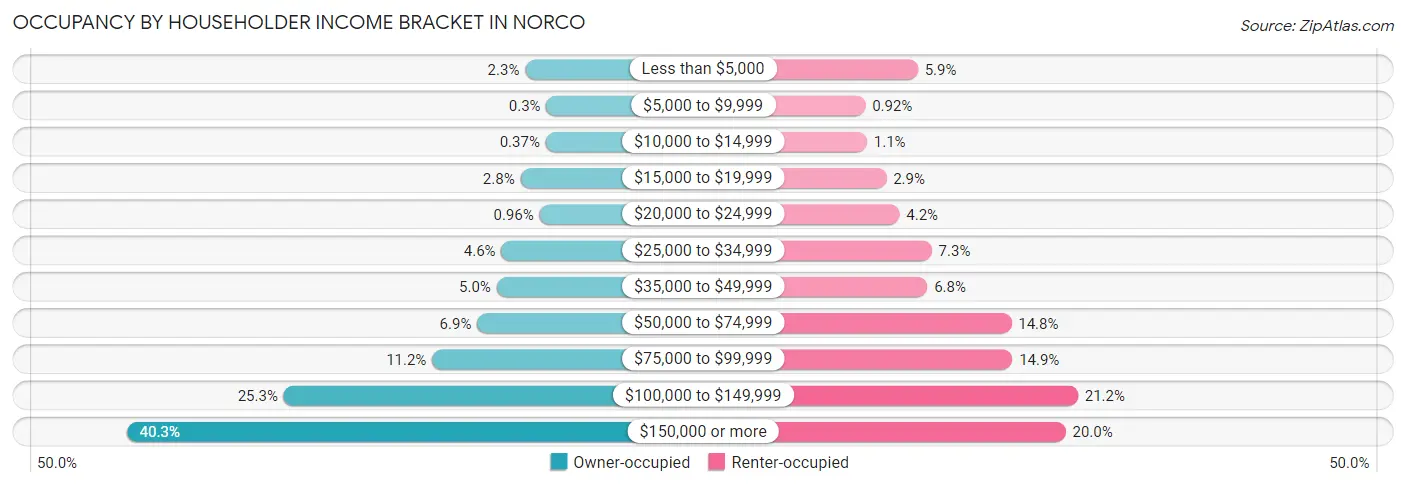
| Income Bracket | Owner-occupied | Renter-occupied |
| Less than $5,000 | 133 (2.3%) | 71 (5.9%) |
| $5,000 to $9,999 | 17 (0.3%) | 11 (0.9%) |
| $10,000 to $14,999 | 21 (0.4%) | 13 (1.1%) |
| $15,000 to $19,999 | 159 (2.8%) | 35 (2.9%) |
| $20,000 to $24,999 | 55 (1.0%) | 50 (4.2%) |
| $25,000 to $34,999 | 263 (4.6%) | 87 (7.2%) |
| $35,000 to $49,999 | 289 (5.0%) | 82 (6.8%) |
| $50,000 to $74,999 | 395 (6.9%) | 178 (14.8%) |
| $75,000 to $99,999 | 641 (11.2%) | 179 (14.9%) |
| $100,000 to $149,999 | 1,452 (25.3%) | 254 (21.2%) |
| $150,000 or more | 2,310 (40.3%) | 240 (20.0%) |
| Total | 5,735 (100.0%) | 1,200 (100.0%) |
Monthly Housing Cost Tiers in Norco
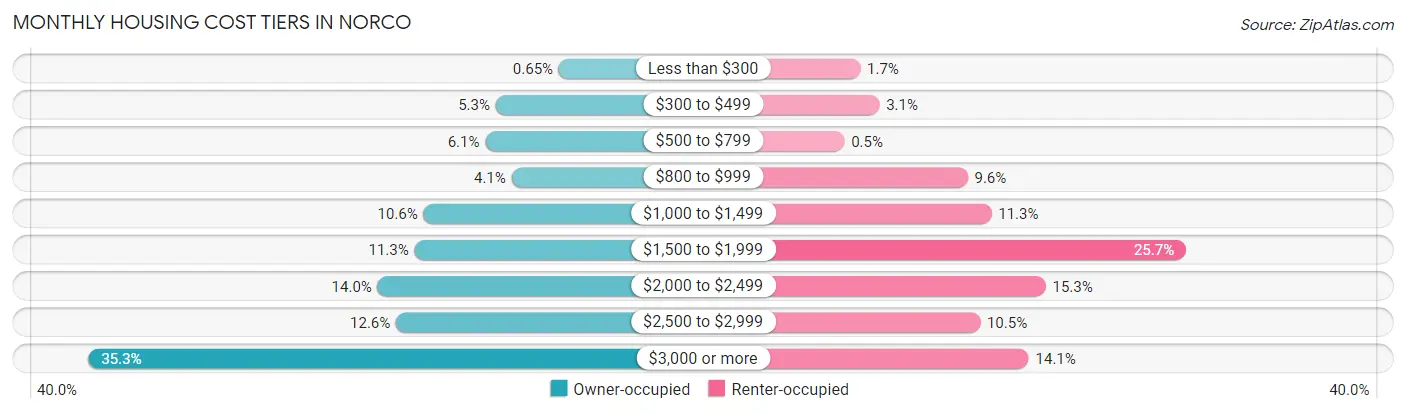
| Monthly Cost | Owner-occupied | Renter-occupied |
| Less than $300 | 37 (0.6%) | 20 (1.7%) |
| $300 to $499 | 304 (5.3%) | 37 (3.1%) |
| $500 to $799 | 348 (6.1%) | 6 (0.5%) |
| $800 to $999 | 237 (4.1%) | 115 (9.6%) |
| $1,000 to $1,499 | 609 (10.6%) | 136 (11.3%) |
| $1,500 to $1,999 | 647 (11.3%) | 308 (25.7%) |
| $2,000 to $2,499 | 803 (14.0%) | 184 (15.3%) |
| $2,500 to $2,999 | 725 (12.6%) | 126 (10.5%) |
| $3,000 or more | 2,025 (35.3%) | 169 (14.1%) |
| Total | 5,735 (100.0%) | 1,200 (100.0%) |
Physical Housing Characteristics in Norco
Housing Structures in Norco
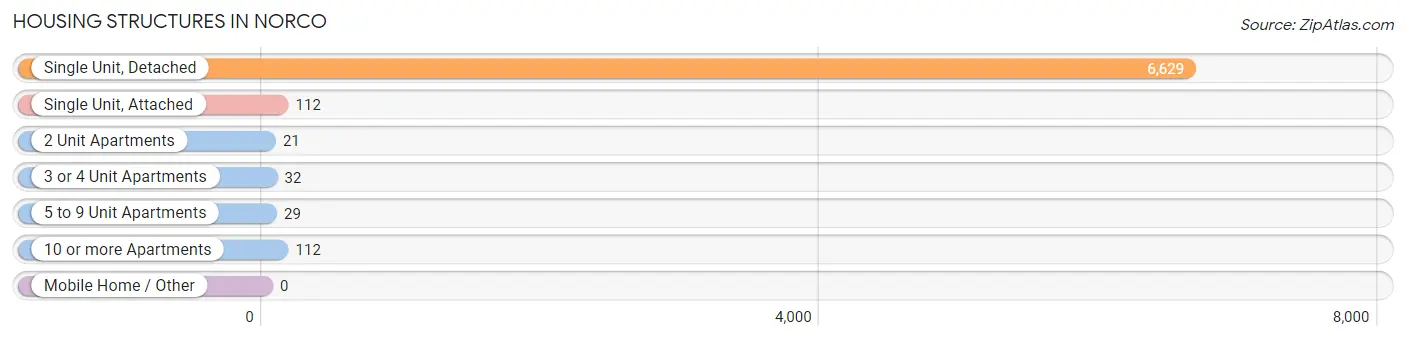
| Structure Type | # Housing Units | % Housing Units |
| Single Unit, Detached | 6,629 | 95.6% |
| Single Unit, Attached | 112 | 1.6% |
| 2 Unit Apartments | 21 | 0.3% |
| 3 or 4 Unit Apartments | 32 | 0.5% |
| 5 to 9 Unit Apartments | 29 | 0.4% |
| 10 or more Apartments | 112 | 1.6% |
| Mobile Home / Other | 0 | 0.0% |
| Total | 6,935 | 100.0% |
Housing Structures by Occupancy in Norco
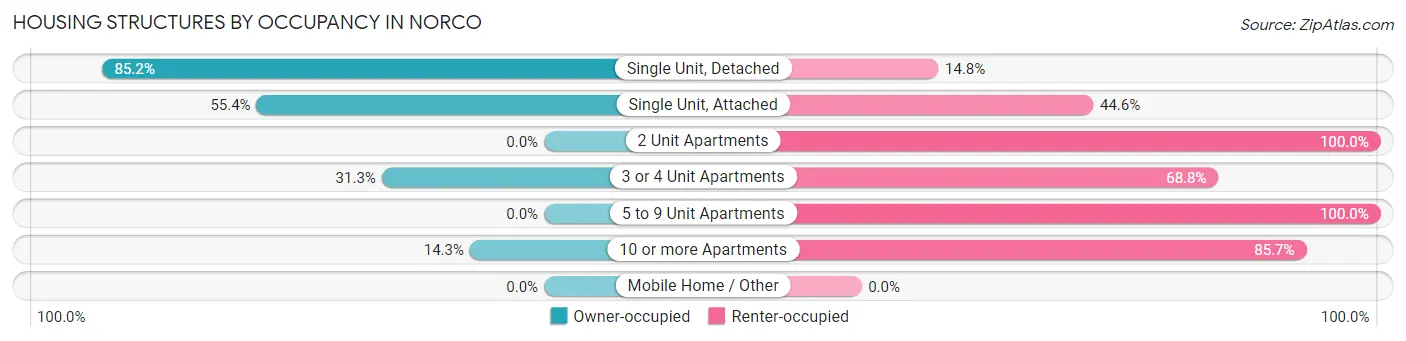
| Structure Type | Owner-occupied | Renter-occupied |
| Single Unit, Detached | 5,647 (85.2%) | 982 (14.8%) |
| Single Unit, Attached | 62 (55.4%) | 50 (44.6%) |
| 2 Unit Apartments | 0 (0.0%) | 21 (100.0%) |
| 3 or 4 Unit Apartments | 10 (31.2%) | 22 (68.8%) |
| 5 to 9 Unit Apartments | 0 (0.0%) | 29 (100.0%) |
| 10 or more Apartments | 16 (14.3%) | 96 (85.7%) |
| Mobile Home / Other | 0 (0.0%) | 0 (0.0%) |
| Total | 5,735 (82.7%) | 1,200 (17.3%) |
Housing Structures by Number of Rooms in Norco
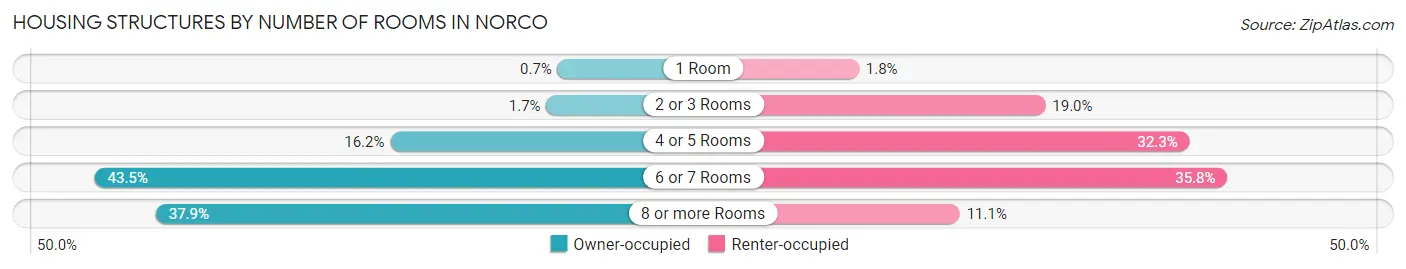
| Number of Rooms | Owner-occupied | Renter-occupied |
| 1 Room | 40 (0.7%) | 21 (1.8%) |
| 2 or 3 Rooms | 100 (1.7%) | 228 (19.0%) |
| 4 or 5 Rooms | 928 (16.2%) | 388 (32.3%) |
| 6 or 7 Rooms | 2,496 (43.5%) | 430 (35.8%) |
| 8 or more Rooms | 2,171 (37.9%) | 133 (11.1%) |
| Total | 5,735 (100.0%) | 1,200 (100.0%) |
Housing Structure by Heating Type in Norco
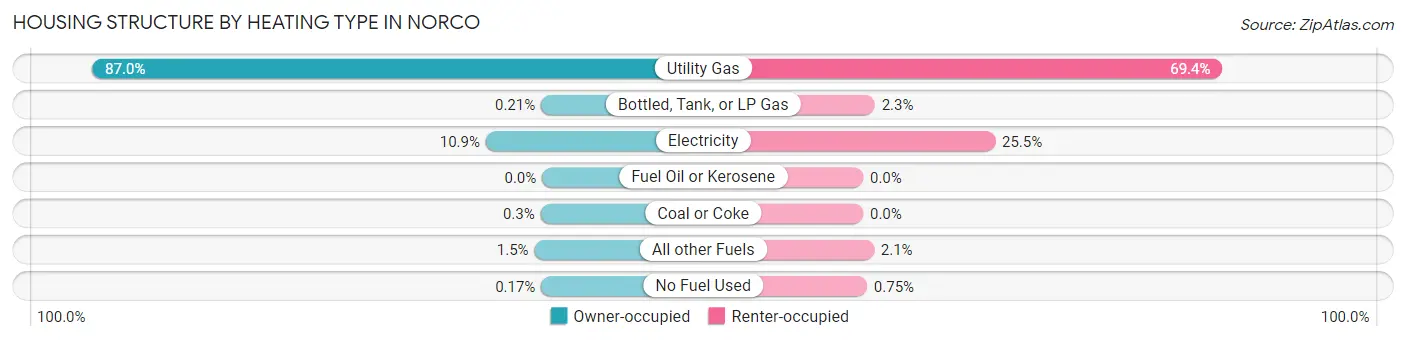
| Heating Type | Owner-occupied | Renter-occupied |
| Utility Gas | 4,987 (87.0%) | 833 (69.4%) |
| Bottled, Tank, or LP Gas | 12 (0.2%) | 27 (2.2%) |
| Electricity | 624 (10.9%) | 306 (25.5%) |
| Fuel Oil or Kerosene | 0 (0.0%) | 0 (0.0%) |
| Coal or Coke | 17 (0.3%) | 0 (0.0%) |
| All other Fuels | 85 (1.5%) | 25 (2.1%) |
| No Fuel Used | 10 (0.2%) | 9 (0.7%) |
| Total | 5,735 (100.0%) | 1,200 (100.0%) |
Household Vehicle Usage in Norco
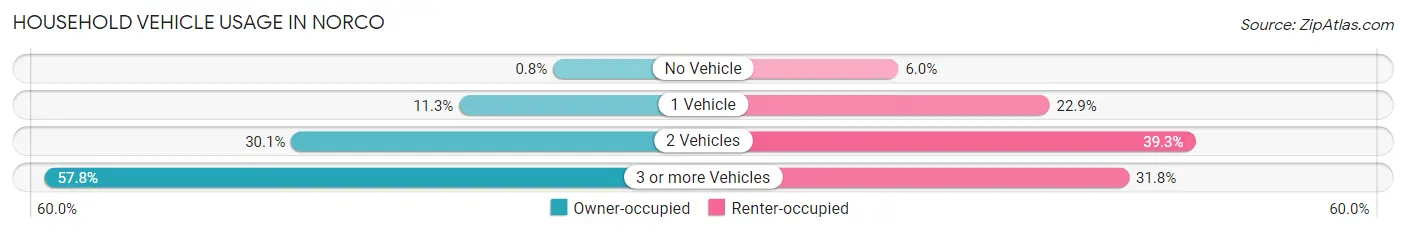
| Vehicles per Household | Owner-occupied | Renter-occupied |
| No Vehicle | 46 (0.8%) | 72 (6.0%) |
| 1 Vehicle | 649 (11.3%) | 275 (22.9%) |
| 2 Vehicles | 1,728 (30.1%) | 471 (39.3%) |
| 3 or more Vehicles | 3,312 (57.8%) | 382 (31.8%) |
| Total | 5,735 (100.0%) | 1,200 (100.0%) |
Real Estate & Mortgages in Norco
Real Estate and Mortgage Overview in Norco
| Characteristic | Without Mortgage | With Mortgage |
| Housing Units | 1,291 | 4,444 |
| Median Property Value | $696,900 | $680,000 |
| Median Household Income | $85,703 | $1,953 |
| Monthly Housing Costs | $796 | $2,025 |
| Real Estate Taxes | $3,526 | $42 |
Property Value by Mortgage Status in Norco
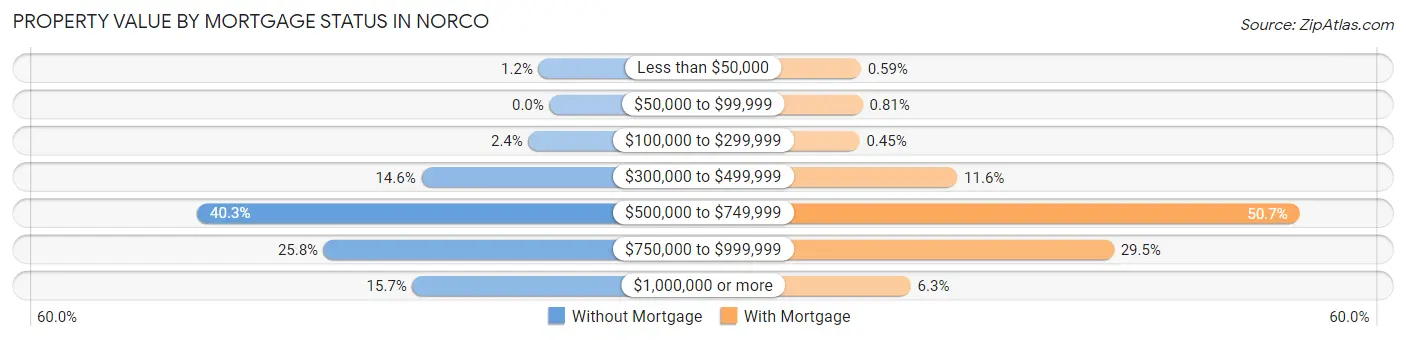
| Property Value | Without Mortgage | With Mortgage |
| Less than $50,000 | 16 (1.2%) | 26 (0.6%) |
| $50,000 to $99,999 | 0 (0.0%) | 36 (0.8%) |
| $100,000 to $299,999 | 31 (2.4%) | 20 (0.4%) |
| $300,000 to $499,999 | 189 (14.6%) | 516 (11.6%) |
| $500,000 to $749,999 | 520 (40.3%) | 2,255 (50.7%) |
| $750,000 to $999,999 | 333 (25.8%) | 1,311 (29.5%) |
| $1,000,000 or more | 202 (15.7%) | 280 (6.3%) |
| Total | 1,291 (100.0%) | 4,444 (100.0%) |
Household Income by Mortgage Status in Norco
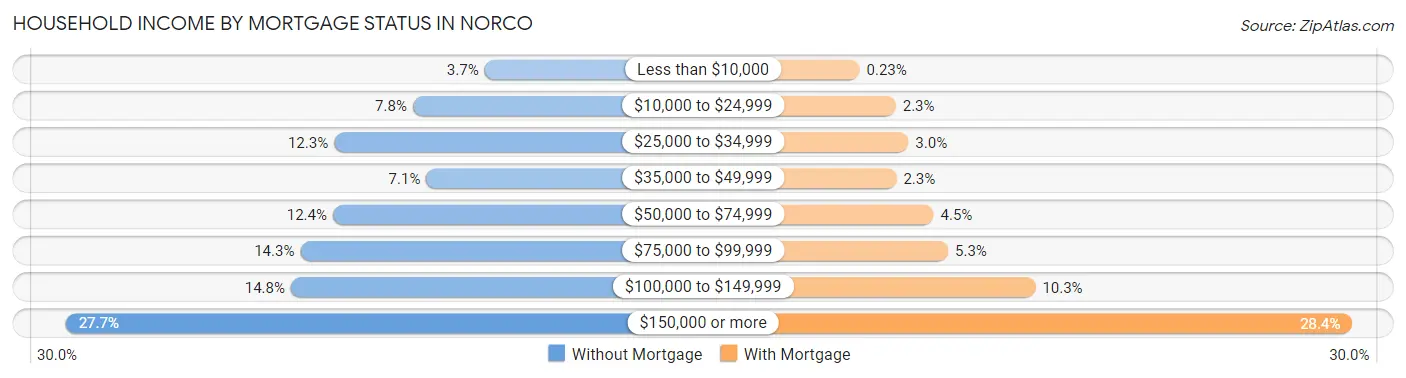
| Household Income | Without Mortgage | With Mortgage |
| Less than $10,000 | 48 (3.7%) | 10 (0.2%) |
| $10,000 to $24,999 | 101 (7.8%) | 102 (2.3%) |
| $25,000 to $34,999 | 159 (12.3%) | 134 (3.0%) |
| $35,000 to $49,999 | 91 (7.0%) | 104 (2.3%) |
| $50,000 to $74,999 | 160 (12.4%) | 198 (4.5%) |
| $75,000 to $99,999 | 184 (14.2%) | 235 (5.3%) |
| $100,000 to $149,999 | 191 (14.8%) | 457 (10.3%) |
| $150,000 or more | 357 (27.7%) | 1,261 (28.4%) |
| Total | 1,291 (100.0%) | 4,444 (100.0%) |
Property Value to Household Income Ratio in Norco
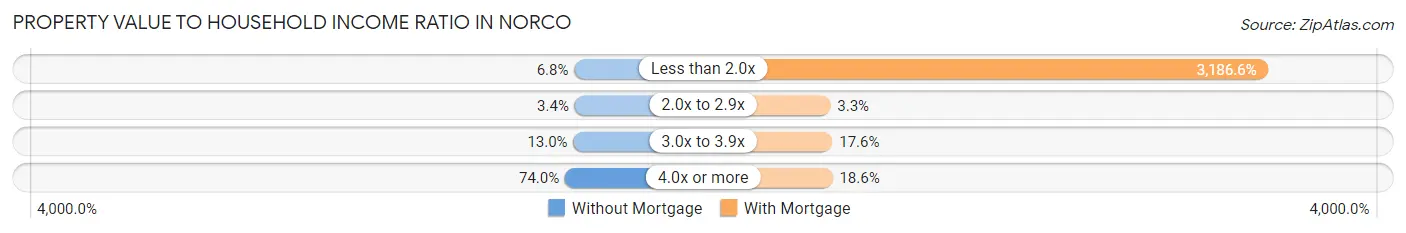
| Value-to-Income Ratio | Without Mortgage | With Mortgage |
| Less than 2.0x | 88 (6.8%) | 141,613 (3,186.6%) |
| 2.0x to 2.9x | 44 (3.4%) | 146 (3.3%) |
| 3.0x to 3.9x | 168 (13.0%) | 780 (17.5%) |
| 4.0x or more | 955 (74.0%) | 827 (18.6%) |
| Total | 1,291 (100.0%) | 4,444 (100.0%) |
Real Estate Taxes by Mortgage Status in Norco
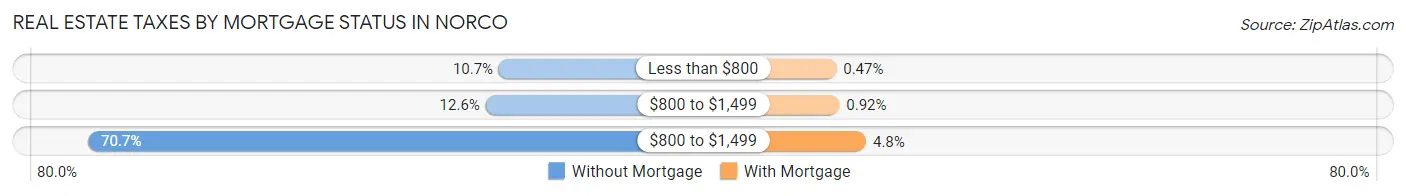
| Property Taxes | Without Mortgage | With Mortgage |
| Less than $800 | 138 (10.7%) | 21 (0.5%) |
| $800 to $1,499 | 163 (12.6%) | 41 (0.9%) |
| $800 to $1,499 | 913 (70.7%) | 214 (4.8%) |
| Total | 1,291 (100.0%) | 4,444 (100.0%) |
Health & Disability in Norco
Health Insurance Coverage by Age in Norco
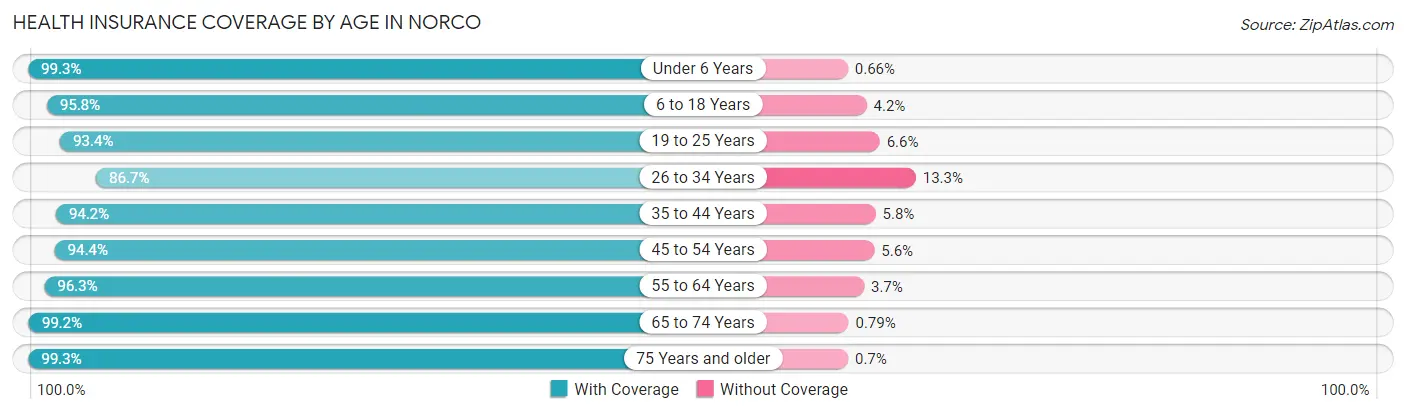
| Age Bracket | With Coverage | Without Coverage |
| Under 6 Years | 1,349 (99.3%) | 9 (0.7%) |
| 6 to 18 Years | 3,362 (95.8%) | 146 (4.2%) |
| 19 to 25 Years | 1,740 (93.4%) | 123 (6.6%) |
| 26 to 34 Years | 2,125 (86.7%) | 327 (13.3%) |
| 35 to 44 Years | 2,614 (94.2%) | 162 (5.8%) |
| 45 to 54 Years | 3,305 (94.4%) | 196 (5.6%) |
| 55 to 64 Years | 3,352 (96.3%) | 128 (3.7%) |
| 65 to 74 Years | 2,146 (99.2%) | 17 (0.8%) |
| 75 Years and older | 1,709 (99.3%) | 12 (0.7%) |
| Total | 21,702 (95.1%) | 1,120 (4.9%) |
Health Insurance Coverage by Citizenship Status in Norco
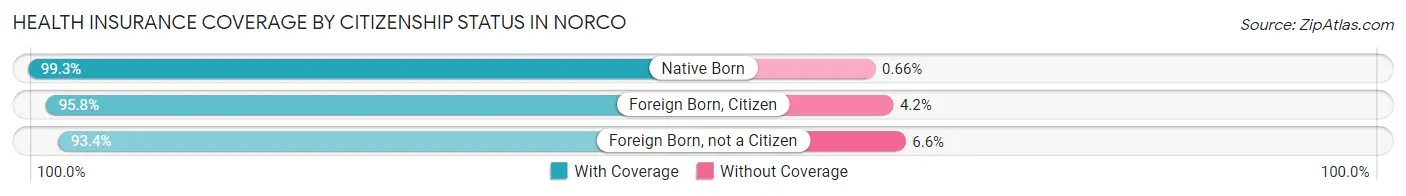
| Citizenship Status | With Coverage | Without Coverage |
| Native Born | 1,349 (99.3%) | 9 (0.7%) |
| Foreign Born, Citizen | 3,362 (95.8%) | 146 (4.2%) |
| Foreign Born, not a Citizen | 1,740 (93.4%) | 123 (6.6%) |
Health Insurance Coverage by Household Income in Norco
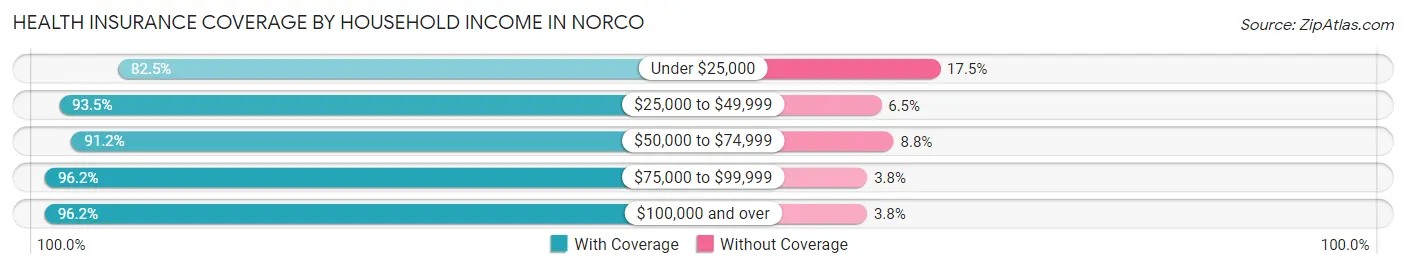
| Household Income | With Coverage | Without Coverage |
| Under $25,000 | 816 (82.5%) | 173 (17.5%) |
| $25,000 to $49,999 | 1,448 (93.5%) | 100 (6.5%) |
| $50,000 to $74,999 | 1,487 (91.2%) | 143 (8.8%) |
| $75,000 to $99,999 | 2,260 (96.2%) | 90 (3.8%) |
| $100,000 and over | 15,544 (96.2%) | 610 (3.8%) |
Public vs Private Health Insurance Coverage by Age in Norco
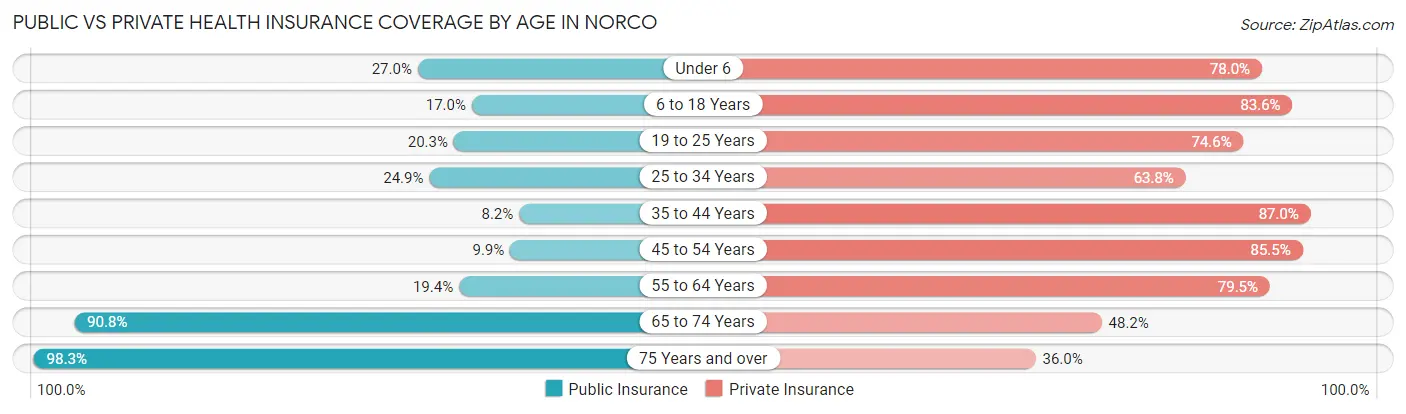
| Age Bracket | Public Insurance | Private Insurance |
| Under 6 | 367 (27.0%) | 1,059 (78.0%) |
| 6 to 18 Years | 596 (17.0%) | 2,934 (83.6%) |
| 19 to 25 Years | 379 (20.3%) | 1,389 (74.6%) |
| 25 to 34 Years | 610 (24.9%) | 1,565 (63.8%) |
| 35 to 44 Years | 228 (8.2%) | 2,416 (87.0%) |
| 45 to 54 Years | 346 (9.9%) | 2,994 (85.5%) |
| 55 to 64 Years | 674 (19.4%) | 2,765 (79.4%) |
| 65 to 74 Years | 1,964 (90.8%) | 1,043 (48.2%) |
| 75 Years and over | 1,692 (98.3%) | 619 (36.0%) |
| Total | 6,856 (30.0%) | 16,784 (73.5%) |
Disability Status by Sex by Age in Norco
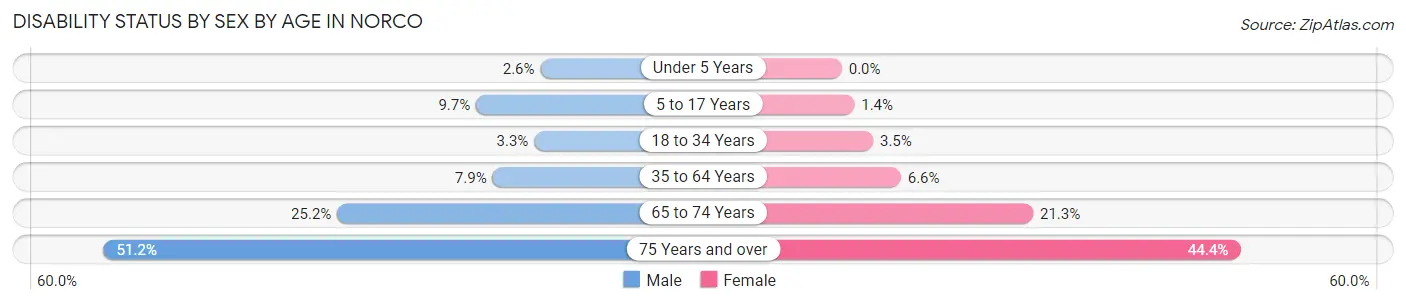
| Age Bracket | Male | Female |
| Under 5 Years | 16 (2.6%) | 0 (0.0%) |
| 5 to 17 Years | 180 (9.7%) | 23 (1.4%) |
| 18 to 34 Years | 73 (3.3%) | 82 (3.5%) |
| 35 to 64 Years | 388 (7.9%) | 318 (6.6%) |
| 65 to 74 Years | 261 (25.2%) | 240 (21.3%) |
| 75 Years and over | 423 (51.2%) | 397 (44.4%) |
Disability Class by Sex by Age in Norco
Disability Class: Hearing Difficulty
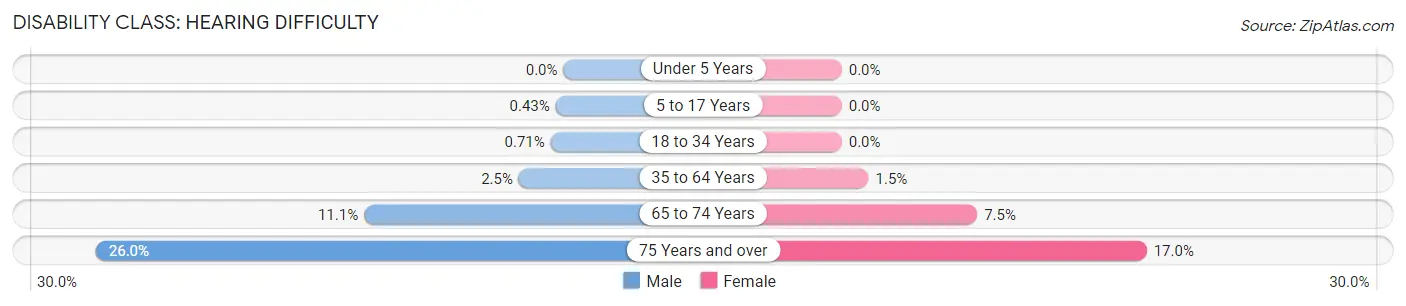
| Age Bracket | Male | Female |
| Under 5 Years | 0 (0.0%) | 0 (0.0%) |
| 5 to 17 Years | 8 (0.4%) | 0 (0.0%) |
| 18 to 34 Years | 16 (0.7%) | 0 (0.0%) |
| 35 to 64 Years | 122 (2.5%) | 72 (1.5%) |
| 65 to 74 Years | 115 (11.1%) | 85 (7.5%) |
| 75 Years and over | 215 (26.0%) | 152 (17.0%) |
Disability Class: Vision Difficulty
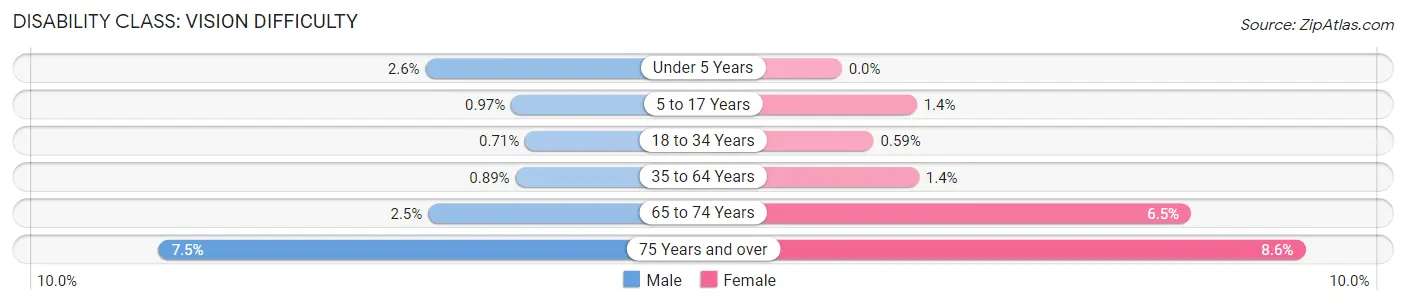
| Age Bracket | Male | Female |
| Under 5 Years | 16 (2.6%) | 0 (0.0%) |
| 5 to 17 Years | 18 (1.0%) | 23 (1.4%) |
| 18 to 34 Years | 16 (0.7%) | 14 (0.6%) |
| 35 to 64 Years | 44 (0.9%) | 69 (1.4%) |
| 65 to 74 Years | 26 (2.5%) | 73 (6.5%) |
| 75 Years and over | 62 (7.5%) | 77 (8.6%) |
Disability Class: Cognitive Difficulty
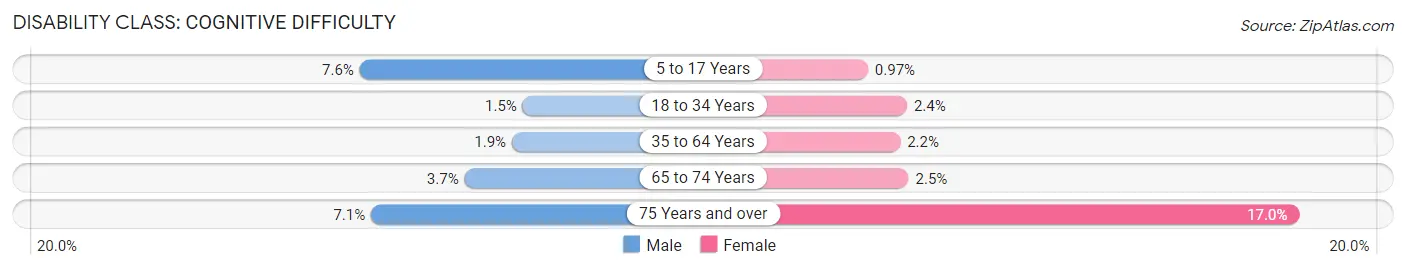
| Age Bracket | Male | Female |
| 5 to 17 Years | 140 (7.6%) | 16 (1.0%) |
| 18 to 34 Years | 34 (1.5%) | 57 (2.4%) |
| 35 to 64 Years | 94 (1.9%) | 105 (2.2%) |
| 65 to 74 Years | 38 (3.7%) | 28 (2.5%) |
| 75 Years and over | 59 (7.1%) | 152 (17.0%) |
Disability Class: Ambulatory Difficulty
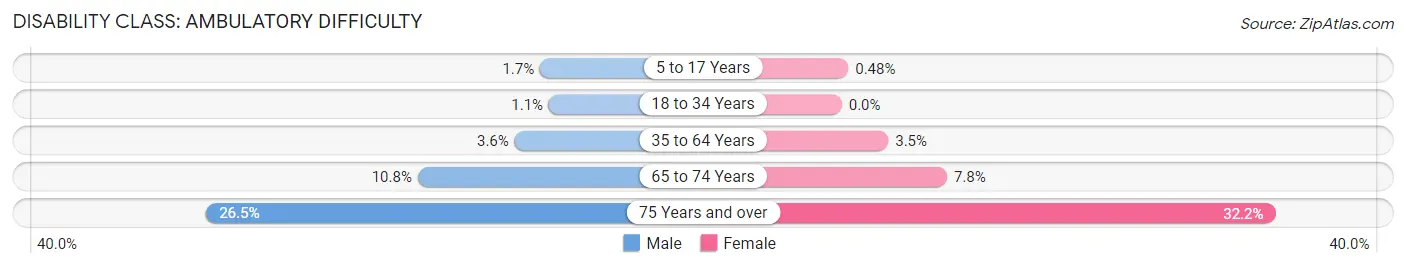
| Age Bracket | Male | Female |
| 5 to 17 Years | 32 (1.7%) | 8 (0.5%) |
| 18 to 34 Years | 24 (1.1%) | 0 (0.0%) |
| 35 to 64 Years | 178 (3.6%) | 167 (3.5%) |
| 65 to 74 Years | 112 (10.8%) | 88 (7.8%) |
| 75 Years and over | 219 (26.5%) | 288 (32.2%) |
Disability Class: Self-Care Difficulty
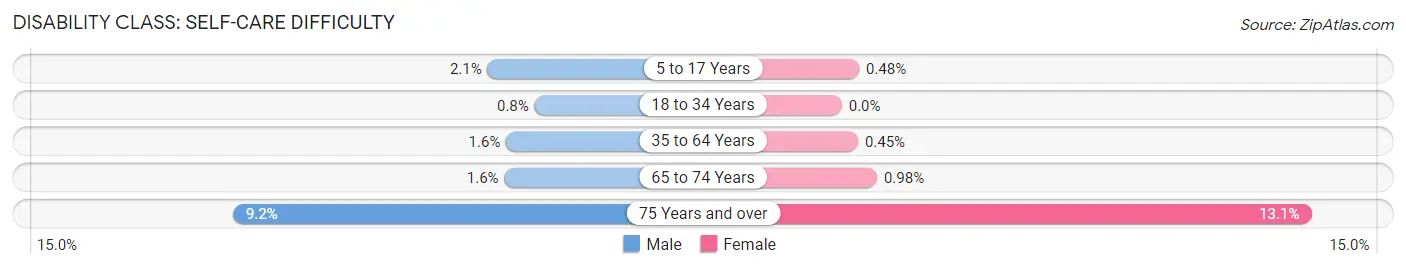
| Age Bracket | Male | Female |
| 5 to 17 Years | 39 (2.1%) | 8 (0.5%) |
| 18 to 34 Years | 18 (0.8%) | 0 (0.0%) |
| 35 to 64 Years | 78 (1.6%) | 22 (0.4%) |
| 65 to 74 Years | 17 (1.6%) | 11 (1.0%) |
| 75 Years and over | 76 (9.2%) | 117 (13.1%) |
Technology Access in Norco
Computing Device Access in Norco
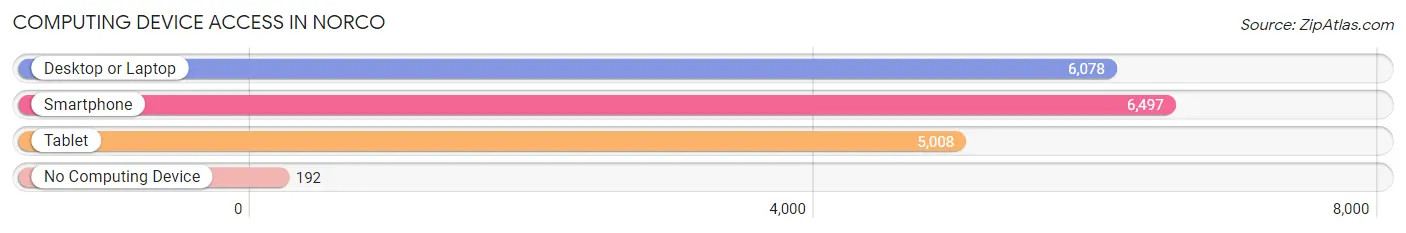
| Device Type | # Households | % Households |
| Desktop or Laptop | 6,078 | 87.6% |
| Smartphone | 6,497 | 93.7% |
| Tablet | 5,008 | 72.2% |
| No Computing Device | 192 | 2.8% |
| Total | 6,935 | 100.0% |
Internet Access in Norco
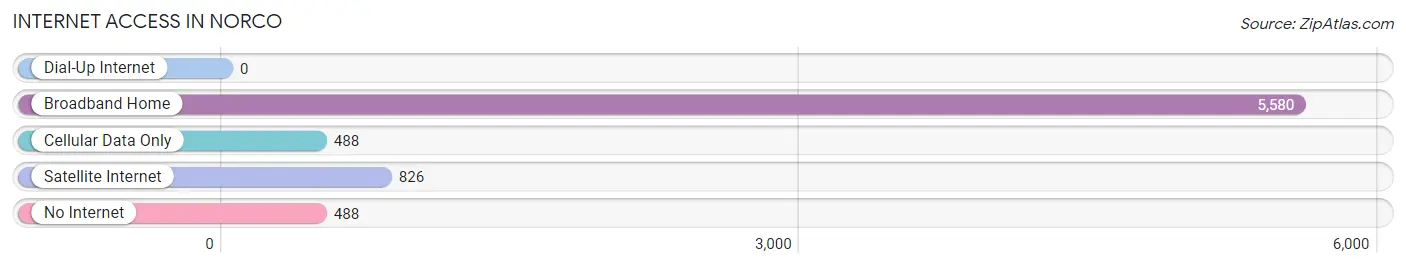
| Internet Type | # Households | % Households |
| Dial-Up Internet | 0 | 0.0% |
| Broadband Home | 5,580 | 80.5% |
| Cellular Data Only | 488 | 7.0% |
| Satellite Internet | 826 | 11.9% |
| No Internet | 488 | 7.0% |
| Total | 6,935 | 100.0% |
Norco Summary
History
The city of Norco, California is located in Riverside County, approximately 30 miles east of Los Angeles. The city was founded in 1887 by the Norco Land and Water Company, which was established to develop the area for agricultural purposes. The company purchased land from the Santa Ana River and built a reservoir to provide water for the area. The area was originally known as “North Corona”, but the name was changed to Norco in 1923.
The city of Norco was incorporated in 1964 and has since grown to a population of over 25,000. The city is known for its rural atmosphere and is home to many horse ranches and farms. The city is also home to the Norco Hills, which are a popular destination for hikers and mountain bikers.
Geography
Norco is located in Riverside County, California, approximately 30 miles east of Los Angeles. The city is situated in the Santa Ana River Valley and is surrounded by the Santa Ana Mountains to the north and the San Jacinto Mountains to the south. The city covers an area of 8.3 square miles and has an elevation of 1,000 feet.
The climate in Norco is classified as a Mediterranean climate, with hot, dry summers and mild, wet winters. The average high temperature in the summer is around 90 degrees Fahrenheit, while the average low temperature in the winter is around 50 degrees Fahrenheit.
Economy
The economy of Norco is largely based on agriculture and light manufacturing. The city is home to several large horse ranches and farms, as well as several light manufacturing companies. The city is also home to several retail stores, restaurants, and other businesses.
The city is also home to the Norco College, which is a two-year community college that offers a variety of academic and vocational programs. The college is part of the Riverside Community College District.
Demographics
As of the 2010 census, the population of Norco was 25,063. The racial makeup of the city was 75.3% White, 1.3% African American, 0.7% Native American, 1.2% Asian, 0.2% Pacific Islander, 17.7% from other races, and 3.7% from two or more races. Hispanic or Latino of any race were 33.2% of the population.
The median household income in Norco was $63,945, and the median family income was $71,945. The per capita income for the city was $25,945. About 8.3% of families and 10.7% of the population were below the poverty line, including 14.2% of those under age 18 and 6.2% of those age 65 or over.
Common Questions
What is Per Capita Income in Norco?
Per Capita income in Norco is $40,311.
What is the Median Family Income in Norco?
Median Family Income in Norco is $133,199.
What is the Median Household income in Norco?
Median Household Income in Norco is $120,636.
What is Income or Wage Gap in Norco?
Income or Wage Gap in Norco is 42.8%.
Women in Norco earn 57.2 cents for every dollar earned by a man.
What is Inequality or Gini Index in Norco?
Inequality or Gini Index in Norco is 0.39.
What is the Total Population of Norco?
Total Population of Norco is 25,328.
What is the Total Male Population of Norco?
Total Male Population of Norco is 14,004.
What is the Total Female Population of Norco?
Total Female Population of Norco is 11,324.
What is the Ratio of Males per 100 Females in Norco?
There are 123.67 Males per 100 Females in Norco.
What is the Ratio of Females per 100 Males in Norco?
There are 80.86 Females per 100 Males in Norco.
What is the Median Population Age in Norco?
Median Population Age in Norco is 41.4 Years.
What is the Average Family Size in Norco
Average Family Size in Norco is 3.6 People.
What is the Average Household Size in Norco
Average Household Size in Norco is 3.3 People.
How Large is the Labor Force in Norco?
There are 12,010 People in the Labor Forcein in Norco.
What is the Percentage of People in the Labor Force in Norco?
56.6% of People are in the Labor Force in Norco.
What is the Unemployment Rate in Norco?
Unemployment Rate in Norco is 3.8%.