Roy, UT Map & Demographics
Roy Map
Roy Overview
$32,241
PER CAPITA INCOME
$89,616
AVG FAMILY INCOME
$83,959
AVG HOUSEHOLD INCOME
39.1%
WAGE / INCOME GAP [ % ]
60.9¢/ $1
WAGE / INCOME GAP [ $ ]
0.32
INEQUALITY / GINI INDEX
39,064
TOTAL POPULATION
19,975
MALE POPULATION
19,089
FEMALE POPULATION
104.64
MALES / 100 FEMALES
95.56
FEMALES / 100 MALES
32.7
MEDIAN AGE
3.4
AVG FAMILY SIZE
3.0
AVG HOUSEHOLD SIZE
20,956
LABOR FORCE [ PEOPLE ]
72.4%
PERCENT IN LABOR FORCE
2.6%
UNEMPLOYMENT RATE
Roy Zip Codes
Income in Roy
Income Overview in Roy
Per Capita Income in Roy is $32,241, while median incomes of families and households are $89,616 and $83,959 respectively.
| Characteristic | Number | Measure |
| Per Capita Income | 39,064 | $32,241 |
| Median Family Income | 9,859 | $89,616 |
| Mean Family Income | 9,859 | $100,101 |
| Median Household Income | 12,886 | $83,959 |
| Mean Household Income | 12,886 | $94,358 |
| Income Deficit | 9,859 | $0 |
| Wage / Income Gap (%) | 39,064 | 39.14% |
| Wage / Income Gap ($) | 39,064 | 60.86¢ per $1 |
| Gini / Inequality Index | 39,064 | 0.32 |
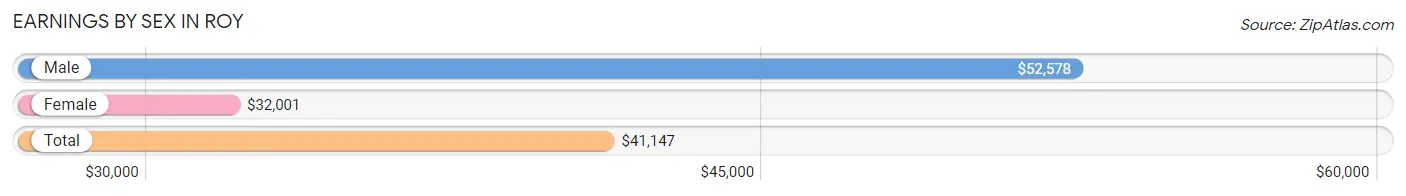
Earnings by Sex in Roy
Average Earnings in Roy are $41,147, $52,578 for men and $32,001 for women, a difference of 39.1%.
| Sex | Number | Average Earnings |
| Male | 12,020 (55.5%) | $52,578 |
| Female | 9,620 (44.5%) | $32,001 |
| Total | 21,640 (100.0%) | $41,147 |
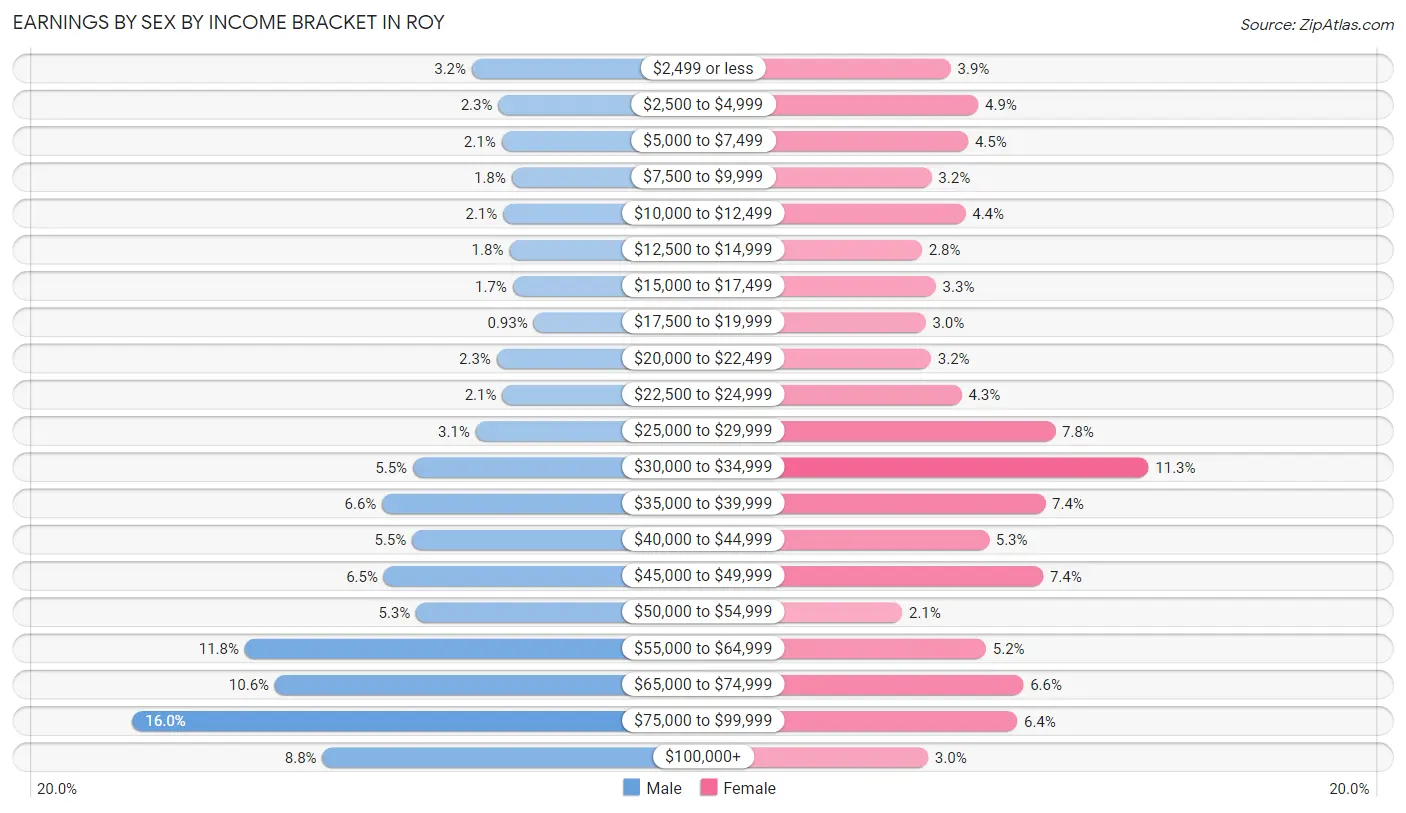
Earnings by Sex by Income Bracket in Roy
The most common earnings brackets in Roy are $75,000 to $99,999 for men (1,918 | 16.0%) and $30,000 to $34,999 for women (1,087 | 11.3%).
| Income | Male | Female |
| $2,499 or less | 390 (3.2%) | 374 (3.9%) |
| $2,500 to $4,999 | 270 (2.2%) | 473 (4.9%) |
| $5,000 to $7,499 | 256 (2.1%) | 437 (4.5%) |
| $7,500 to $9,999 | 210 (1.8%) | 305 (3.2%) |
| $10,000 to $12,499 | 249 (2.1%) | 427 (4.4%) |
| $12,500 to $14,999 | 221 (1.8%) | 270 (2.8%) |
| $15,000 to $17,499 | 206 (1.7%) | 320 (3.3%) |
| $17,500 to $19,999 | 112 (0.9%) | 284 (2.9%) |
| $20,000 to $22,499 | 278 (2.3%) | 303 (3.2%) |
| $22,500 to $24,999 | 253 (2.1%) | 414 (4.3%) |
| $25,000 to $29,999 | 373 (3.1%) | 750 (7.8%) |
| $30,000 to $34,999 | 655 (5.4%) | 1,087 (11.3%) |
| $35,000 to $39,999 | 793 (6.6%) | 715 (7.4%) |
| $40,000 to $44,999 | 659 (5.5%) | 512 (5.3%) |
| $45,000 to $49,999 | 786 (6.5%) | 707 (7.3%) |
| $50,000 to $54,999 | 641 (5.3%) | 199 (2.1%) |
| $55,000 to $64,999 | 1,412 (11.7%) | 501 (5.2%) |
| $65,000 to $74,999 | 1,276 (10.6%) | 636 (6.6%) |
| $75,000 to $99,999 | 1,918 (16.0%) | 614 (6.4%) |
| $100,000+ | 1,062 (8.8%) | 292 (3.0%) |
| Total | 12,020 (100.0%) | 9,620 (100.0%) |
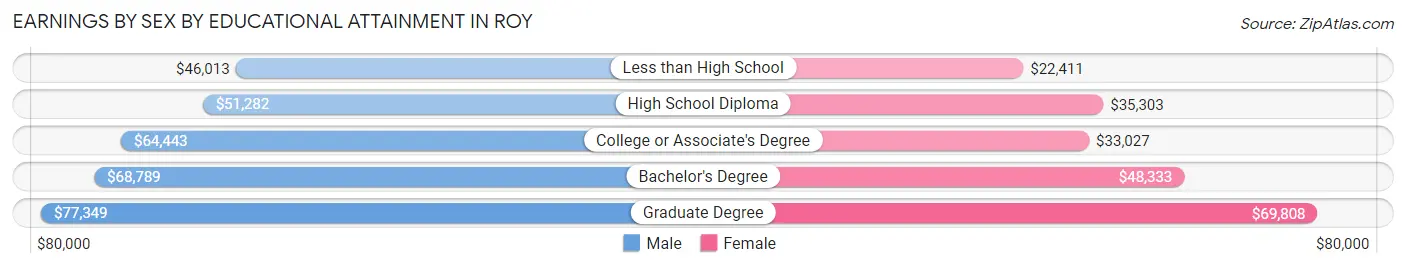
Earnings by Sex by Educational Attainment in Roy
Average earnings in Roy are $60,458 for men and $35,076 for women, a difference of 42.0%. Men with an educational attainment of graduate degree enjoy the highest average annual earnings of $77,349, while those with less than high school education earn the least with $46,013. Women with an educational attainment of graduate degree earn the most with the average annual earnings of $69,808, while those with less than high school education have the smallest earnings of $22,411.
| Educational Attainment | Male Income | Female Income |
| Less than High School | $46,013 | $22,411 |
| High School Diploma | $51,282 | $35,303 |
| College or Associate's Degree | $64,443 | $33,027 |
| Bachelor's Degree | $68,789 | $48,333 |
| Graduate Degree | $77,349 | $69,808 |
| Total | $60,458 | $35,076 |
Family Income in Roy
Family Income Brackets in Roy
According to the Roy family income data, there are 2,593 families falling into the $100,000 to $149,999 income range, which is the most common income bracket and makes up 26.3% of all families.
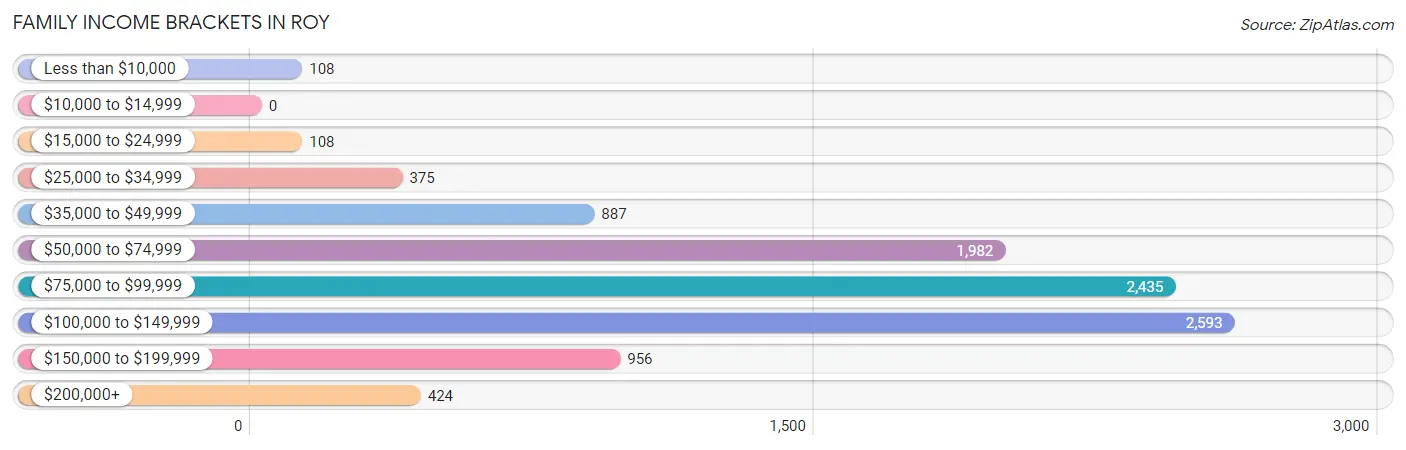
| Income Bracket | # Families | % Families |
| Less than $10,000 | 108 | 1.1% |
| $10,000 to $14,999 | 0 | 0.0% |
| $15,000 to $24,999 | 108 | 1.1% |
| $25,000 to $34,999 | 375 | 3.8% |
| $35,000 to $49,999 | 887 | 9.0% |
| $50,000 to $74,999 | 1,982 | 20.1% |
| $75,000 to $99,999 | 2,435 | 24.7% |
| $100,000 to $149,999 | 2,593 | 26.3% |
| $150,000 to $199,999 | 956 | 9.7% |
| $200,000+ | 424 | 4.3% |
Family Income by Famaliy Size in Roy
7+ person families (309 | 3.1%) account for the highest median family income in Roy with $133,438 per family, while 2-person families (3,618 | 36.7%) have the highest median income of $44,473 per family member.
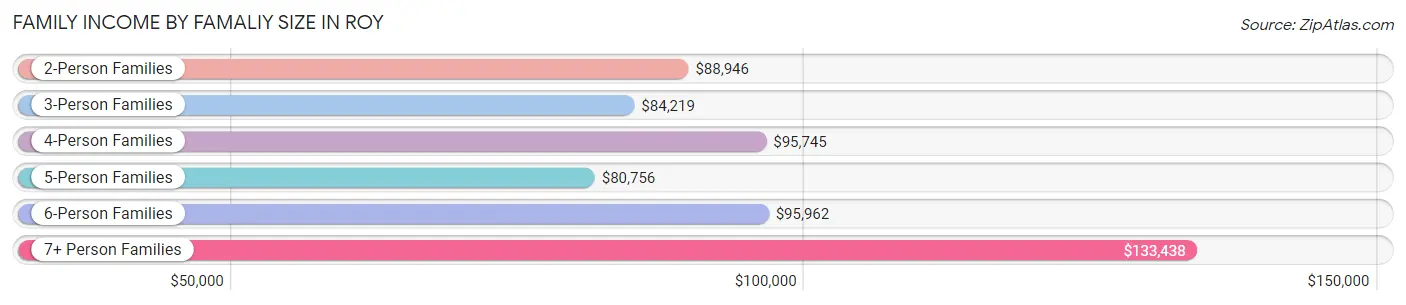
| Income Bracket | # Families | Median Income |
| 2-Person Families | 3,618 (36.7%) | $88,946 |
| 3-Person Families | 2,395 (24.3%) | $84,219 |
| 4-Person Families | 2,049 (20.8%) | $95,745 |
| 5-Person Families | 1,042 (10.6%) | $80,756 |
| 6-Person Families | 446 (4.5%) | $95,962 |
| 7+ Person Families | 309 (3.1%) | $133,438 |
| Total | 9,859 (100.0%) | $89,616 |
Family Income by Number of Earners in Roy
The median family income in Roy is $89,616, with families comprising 3+ earners (1,789) having the highest median family income of $129,671, while families with no earners (959) have the lowest median family income of $59,375, accounting for 18.1% and 9.7% of families, respectively.
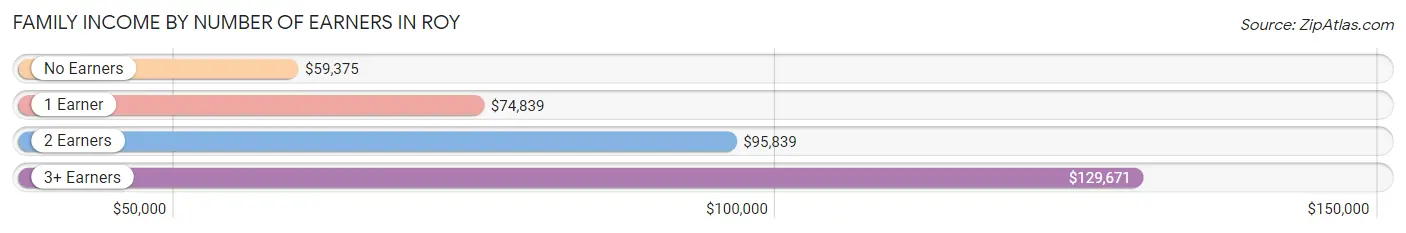
| Number of Earners | # Families | Median Income |
| No Earners | 959 (9.7%) | $59,375 |
| 1 Earner | 3,078 (31.2%) | $74,839 |
| 2 Earners | 4,033 (40.9%) | $95,839 |
| 3+ Earners | 1,789 (18.1%) | $129,671 |
| Total | 9,859 (100.0%) | $89,616 |
Household Income in Roy
Household Income Brackets in Roy
With 3,312 households falling in the category, the $100,000 to $149,999 income range is the most frequent in Roy, accounting for 25.7% of all households. In contrast, only 206 households (1.6%) fall into the $10,000 to $14,999 income bracket, making it the least populous group.
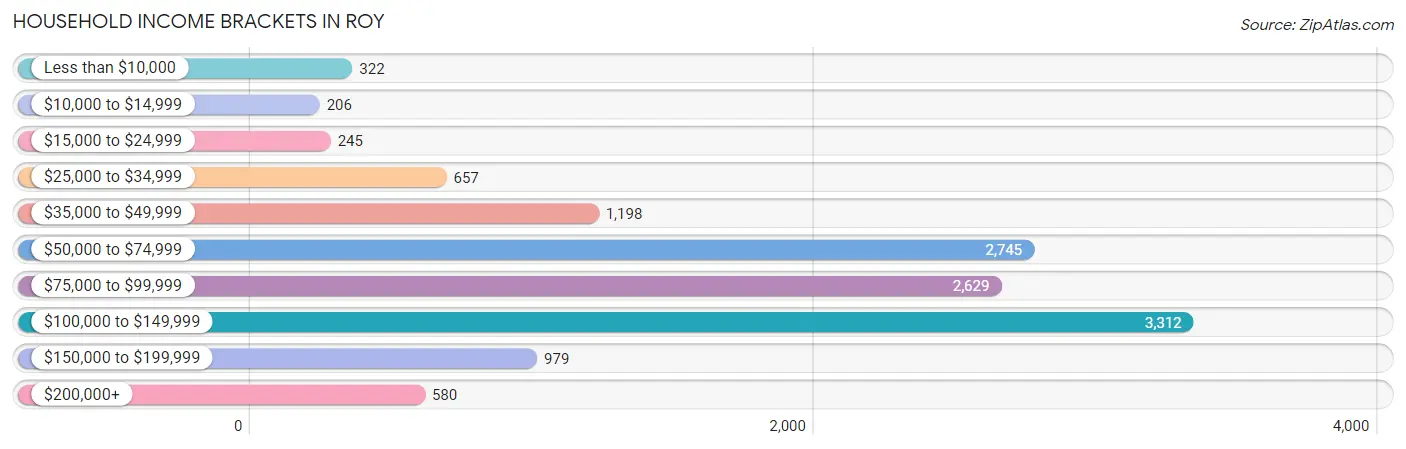
| Income Bracket | # Households | % Households |
| Less than $10,000 | 322 | 2.5% |
| $10,000 to $14,999 | 206 | 1.6% |
| $15,000 to $24,999 | 245 | 1.9% |
| $25,000 to $34,999 | 657 | 5.1% |
| $35,000 to $49,999 | 1,198 | 9.3% |
| $50,000 to $74,999 | 2,745 | 21.3% |
| $75,000 to $99,999 | 2,629 | 20.4% |
| $100,000 to $149,999 | 3,312 | 25.7% |
| $150,000 to $199,999 | 979 | 7.6% |
| $200,000+ | 580 | 4.5% |
Household Income by Householder Age in Roy
The median household income in Roy is $83,959, with the highest median household income of $98,305 found in the 45 to 64 years age bracket for the primary householder. A total of 4,209 households (32.7%) fall into this category. Meanwhile, the 15 to 24 years age bracket for the primary householder has the lowest median household income of $56,413, with 480 households (3.7%) in this group.
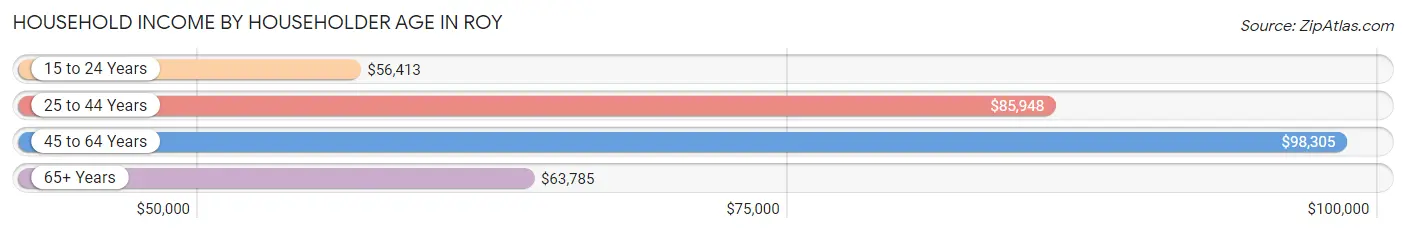
| Income Bracket | # Households | Median Income |
| 15 to 24 Years | 480 (3.7%) | $56,413 |
| 25 to 44 Years | 5,507 (42.7%) | $85,948 |
| 45 to 64 Years | 4,209 (32.7%) | $98,305 |
| 65+ Years | 2,690 (20.9%) | $63,785 |
| Total | 12,886 (100.0%) | $83,959 |
Poverty in Roy
Income Below Poverty by Sex and Age in Roy
With 5.6% poverty level for males and 5.5% for females among the residents of Roy, 6 to 11 year old males and 75 year old and over females are the most vulnerable to poverty, with 391 males (20.0%) and 72 females (10.0%) in their respective age groups living below the poverty level.
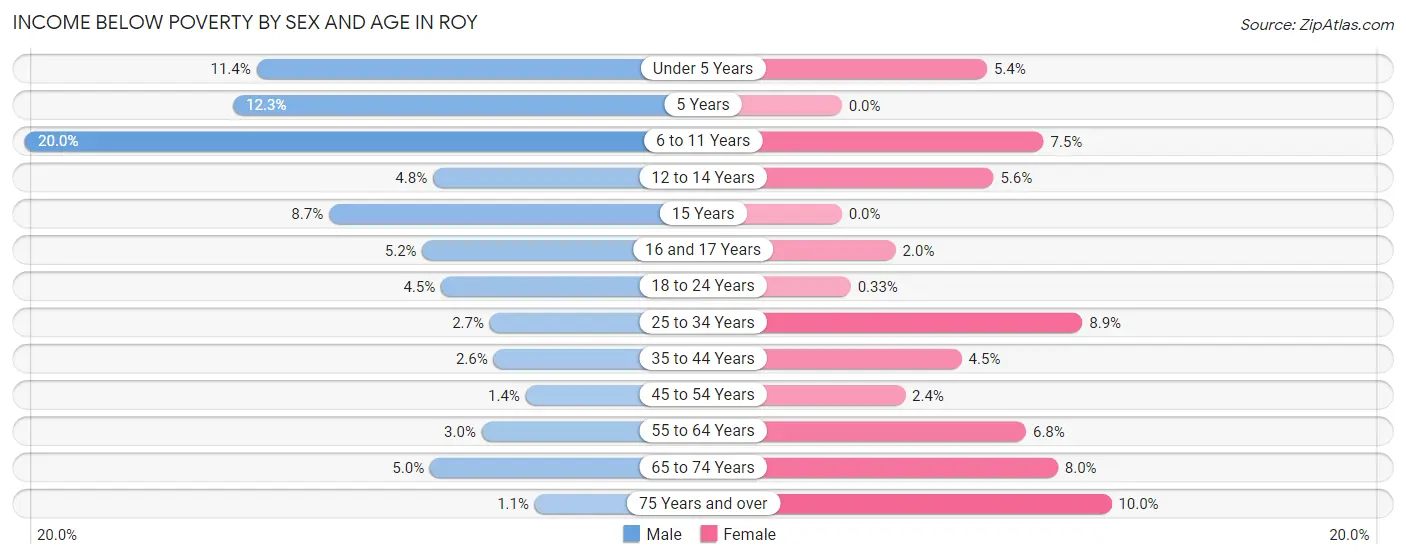
| Age Bracket | Male | Female |
| Under 5 Years | 152 (11.4%) | 87 (5.4%) |
| 5 Years | 38 (12.3%) | 0 (0.0%) |
| 6 to 11 Years | 391 (20.0%) | 124 (7.5%) |
| 12 to 14 Years | 48 (4.8%) | 61 (5.6%) |
| 15 Years | 26 (8.7%) | 0 (0.0%) |
| 16 and 17 Years | 25 (5.2%) | 10 (2.0%) |
| 18 to 24 Years | 90 (4.5%) | 5 (0.3%) |
| 25 to 34 Years | 92 (2.7%) | 265 (8.9%) |
| 35 to 44 Years | 81 (2.6%) | 126 (4.4%) |
| 45 to 54 Years | 26 (1.4%) | 45 (2.4%) |
| 55 to 64 Years | 59 (3.0%) | 139 (6.8%) |
| 65 to 74 Years | 61 (5.0%) | 120 (8.0%) |
| 75 Years and over | 9 (1.1%) | 72 (10.0%) |
| Total | 1,098 (5.6%) | 1,054 (5.5%) |
Income Above Poverty by Sex and Age in Roy
According to the poverty statistics in Roy, males aged 75 years and over and females aged 5 years are the age groups that are most secure financially, with 98.9% of males and 100.0% of females in these age groups living above the poverty line.
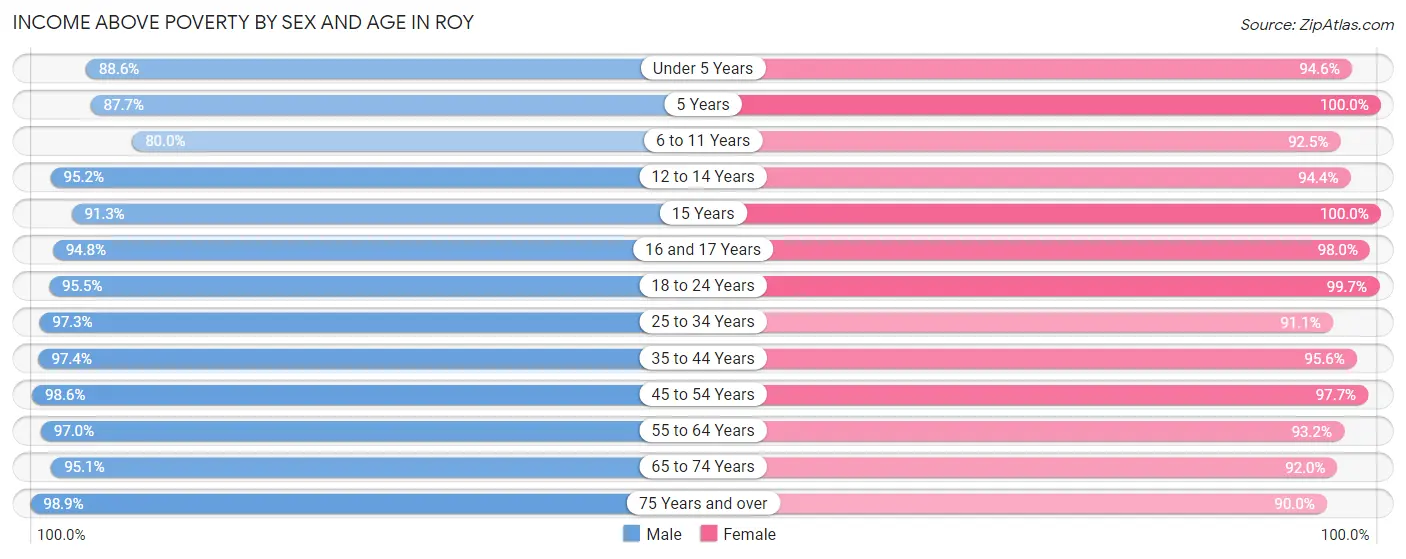
| Age Bracket | Male | Female |
| Under 5 Years | 1,183 (88.6%) | 1,527 (94.6%) |
| 5 Years | 272 (87.7%) | 460 (100.0%) |
| 6 to 11 Years | 1,566 (80.0%) | 1,531 (92.5%) |
| 12 to 14 Years | 944 (95.2%) | 1,023 (94.4%) |
| 15 Years | 273 (91.3%) | 244 (100.0%) |
| 16 and 17 Years | 453 (94.8%) | 490 (98.0%) |
| 18 to 24 Years | 1,891 (95.5%) | 1,511 (99.7%) |
| 25 to 34 Years | 3,284 (97.3%) | 2,701 (91.1%) |
| 35 to 44 Years | 3,047 (97.4%) | 2,706 (95.6%) |
| 45 to 54 Years | 1,834 (98.6%) | 1,867 (97.7%) |
| 55 to 64 Years | 1,887 (97.0%) | 1,893 (93.2%) |
| 65 to 74 Years | 1,172 (95.1%) | 1,376 (92.0%) |
| 75 Years and over | 843 (98.9%) | 647 (90.0%) |
| Total | 18,649 (94.4%) | 17,976 (94.5%) |
Income Below Poverty Among Married-Couple Families in Roy
The poverty statistics for married-couple families in Roy show that 1.5% or 112 of the total 7,351 families live below the poverty line. Families with 5 or more children have the highest poverty rate of 29.0%, comprising of 31 families. On the other hand, families with 1 or 2 children have the lowest poverty rate of 0.0%, which includes 0 families.
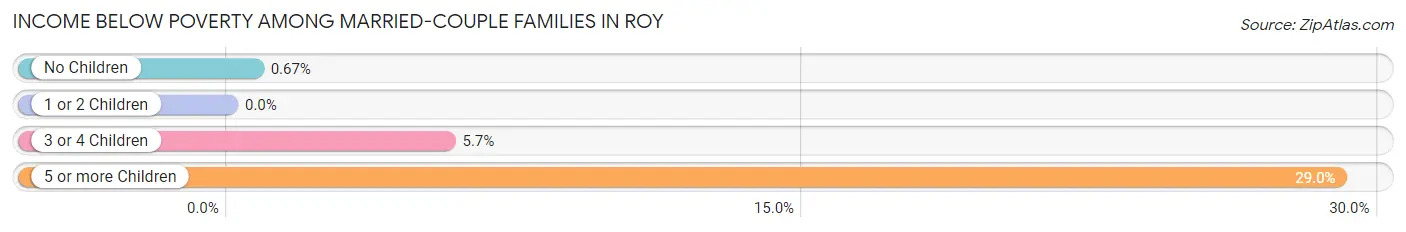
| Children | Above Poverty | Below Poverty |
| No Children | 3,561 (99.3%) | 24 (0.7%) |
| 1 or 2 Children | 2,655 (100.0%) | 0 (0.0%) |
| 3 or 4 Children | 947 (94.3%) | 57 (5.7%) |
| 5 or more Children | 76 (71.0%) | 31 (29.0%) |
| Total | 7,239 (98.5%) | 112 (1.5%) |
Income Below Poverty Among Single-Parent Households in Roy
According to the poverty data in Roy, 2.1% or 24 single-father households and 15.2% or 207 single-mother households are living below the poverty line. Among single-father households, those with 3 or 4 children have the highest poverty rate, with 18 households (19.4%) experiencing poverty. Likewise, among single-mother households, those with 3 or 4 children have the highest poverty rate, with 108 households (41.7%) falling below the poverty line.
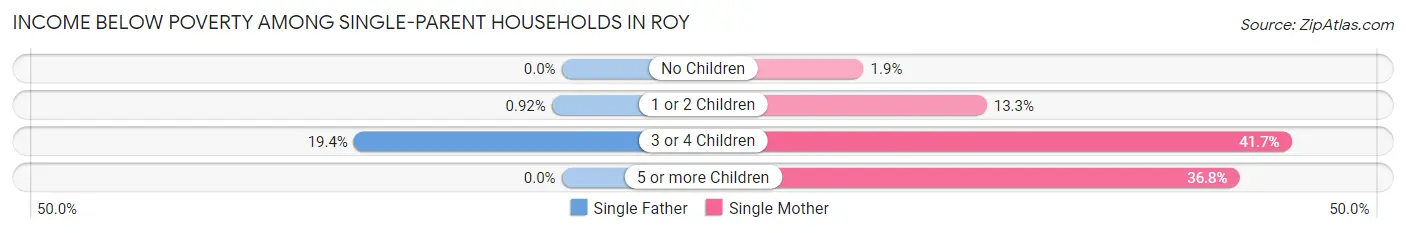
| Children | Single Father | Single Mother |
| No Children | 0 (0.0%) | 10 (1.9%) |
| 1 or 2 Children | 6 (0.9%) | 68 (13.3%) |
| 3 or 4 Children | 18 (19.4%) | 108 (41.7%) |
| 5 or more Children | 0 (0.0%) | 21 (36.8%) |
| Total | 24 (2.1%) | 207 (15.2%) |
Income Below Poverty Among Married-Couple vs Single-Parent Households in Roy
The poverty data for Roy shows that 112 of the married-couple family households (1.5%) and 231 of the single-parent households (9.2%) are living below the poverty level. Within the married-couple family households, those with 5 or more children have the highest poverty rate, with 31 households (29.0%) falling below the poverty line. Among the single-parent households, those with 3 or 4 children have the highest poverty rate, with 126 household (35.8%) living below poverty.
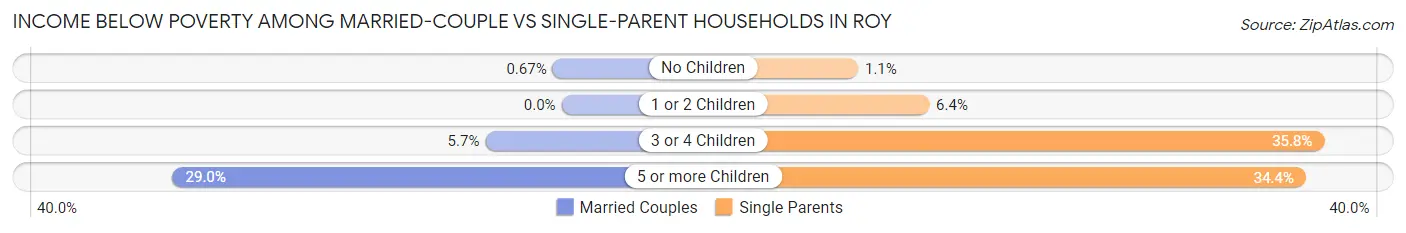
| Children | Married-Couple Families | Single-Parent Households |
| No Children | 24 (0.7%) | 10 (1.1%) |
| 1 or 2 Children | 0 (0.0%) | 74 (6.4%) |
| 3 or 4 Children | 57 (5.7%) | 126 (35.8%) |
| 5 or more Children | 31 (29.0%) | 21 (34.4%) |
| Total | 112 (1.5%) | 231 (9.2%) |
Race in Roy
The most populous races in Roy are White / Caucasian (31,922 | 81.7%), Hispanic or Latino (7,868 | 20.1%), and Some other Race (3,140 | 8.0%).
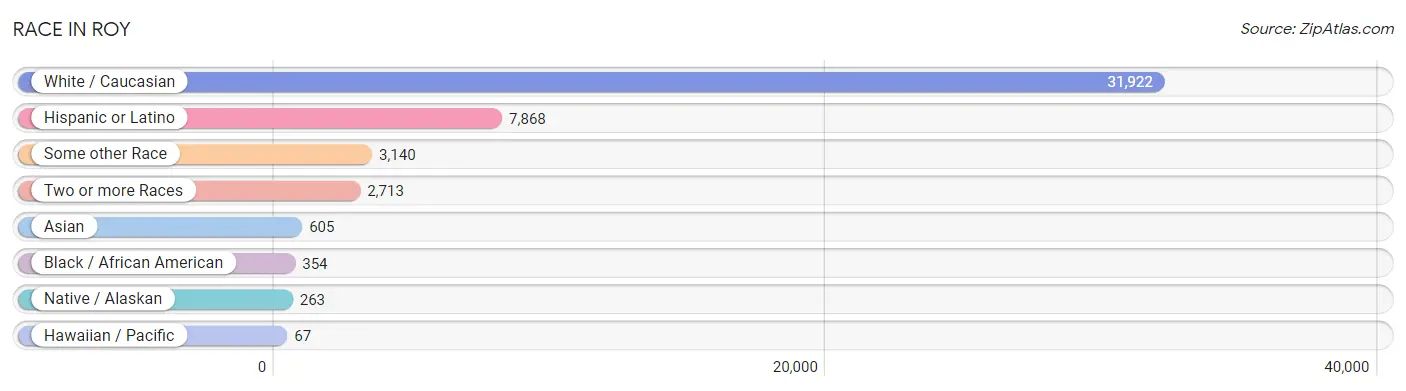
| Race | # Population | % Population |
| Asian | 605 | 1.5% |
| Black / African American | 354 | 0.9% |
| Hawaiian / Pacific | 67 | 0.2% |
| Hispanic or Latino | 7,868 | 20.1% |
| Native / Alaskan | 263 | 0.7% |
| White / Caucasian | 31,922 | 81.7% |
| Two or more Races | 2,713 | 7.0% |
| Some other Race | 3,140 | 8.0% |
| Total | 39,064 | 100.0% |
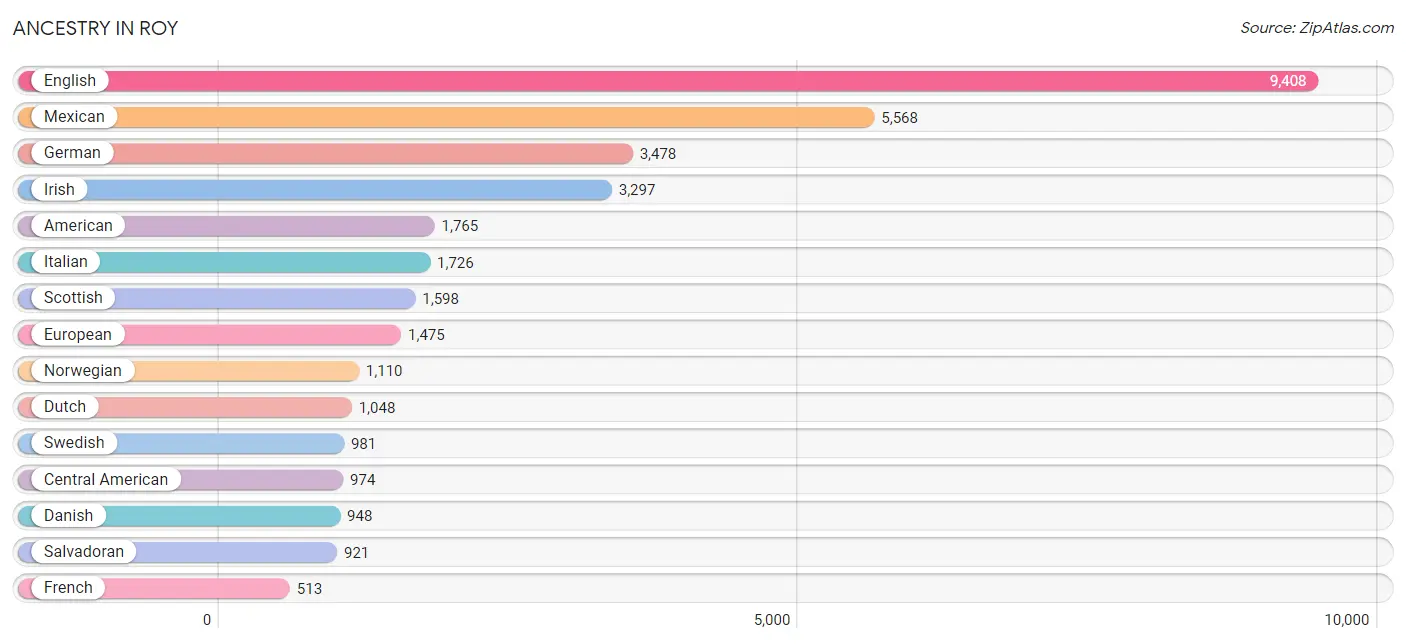
Ancestry in Roy
The most populous ancestries reported in Roy are English (9,408 | 24.1%), Mexican (5,568 | 14.2%), German (3,478 | 8.9%), Irish (3,297 | 8.4%), and American (1,765 | 4.5%), together accounting for 60.2% of all Roy residents.
| Ancestry | # Population | % Population |
| African | 53 | 0.1% |
| Aleut | 28 | 0.1% |
| American | 1,765 | 4.5% |
| Apache | 19 | 0.1% |
| Arab | 52 | 0.1% |
| Austrian | 32 | 0.1% |
| Belgian | 5 | 0.0% |
| Bhutanese | 126 | 0.3% |
| Blackfeet | 98 | 0.3% |
| British | 429 | 1.1% |
| Burmese | 258 | 0.7% |
| Celtic | 12 | 0.0% |
| Central American | 974 | 2.5% |
| Cherokee | 55 | 0.1% |
| Chickasaw | 7 | 0.0% |
| Chilean | 20 | 0.1% |
| Choctaw | 30 | 0.1% |
| Colombian | 2 | 0.0% |
| Creek | 45 | 0.1% |
| Croatian | 16 | 0.0% |
| Cuban | 24 | 0.1% |
| Czech | 20 | 0.1% |
| Czechoslovakian | 13 | 0.0% |
| Danish | 948 | 2.4% |
| Dominican | 20 | 0.1% |
| Dutch | 1,048 | 2.7% |
| Eastern European | 52 | 0.1% |
| English | 9,408 | 24.1% |
| European | 1,475 | 3.8% |
| Finnish | 70 | 0.2% |
| French | 513 | 1.3% |
| French Canadian | 12 | 0.0% |
| German | 3,478 | 8.9% |
| Greek | 67 | 0.2% |
| Guatemalan | 35 | 0.1% |
| Hopi | 54 | 0.1% |
| Hungarian | 5 | 0.0% |
| Indian (Asian) | 152 | 0.4% |
| Inupiat | 9 | 0.0% |
| Irish | 3,297 | 8.4% |
| Italian | 1,726 | 4.4% |
| Jamaican | 11 | 0.0% |
| Japanese | 34 | 0.1% |
| Korean | 428 | 1.1% |
| Laotian | 10 | 0.0% |
| Lebanese | 22 | 0.1% |
| Lithuanian | 17 | 0.0% |
| Malaysian | 48 | 0.1% |
| Mexican | 5,568 | 14.2% |
| Mexican American Indian | 97 | 0.3% |
| Native Hawaiian | 58 | 0.2% |
| Navajo | 80 | 0.2% |
| Northern European | 3 | 0.0% |
| Norwegian | 1,110 | 2.8% |
| Pakistani | 181 | 0.5% |
| Peruvian | 67 | 0.2% |
| Polish | 327 | 0.8% |
| Portuguese | 89 | 0.2% |
| Potawatomi | 14 | 0.0% |
| Pueblo | 10 | 0.0% |
| Puerto Rican | 150 | 0.4% |
| Puget Sound Salish | 40 | 0.1% |
| Russian | 35 | 0.1% |
| Salvadoran | 921 | 2.4% |
| Samoan | 176 | 0.4% |
| Scandinavian | 487 | 1.3% |
| Scotch-Irish | 230 | 0.6% |
| Scottish | 1,598 | 4.1% |
| Serbian | 10 | 0.0% |
| South American | 278 | 0.7% |
| South American Indian | 25 | 0.1% |
| Spaniard | 204 | 0.5% |
| Spanish | 350 | 0.9% |
| Spanish American | 23 | 0.1% |
| Sri Lankan | 43 | 0.1% |
| Subsaharan African | 53 | 0.1% |
| Swedish | 981 | 2.5% |
| Swiss | 282 | 0.7% |
| Syrian | 24 | 0.1% |
| Thai | 36 | 0.1% |
| Ukrainian | 47 | 0.1% |
| Venezuelan | 10 | 0.0% |
| Welsh | 312 | 0.8% |
| Yugoslavian | 19 | 0.1% | View All 84 Rows |
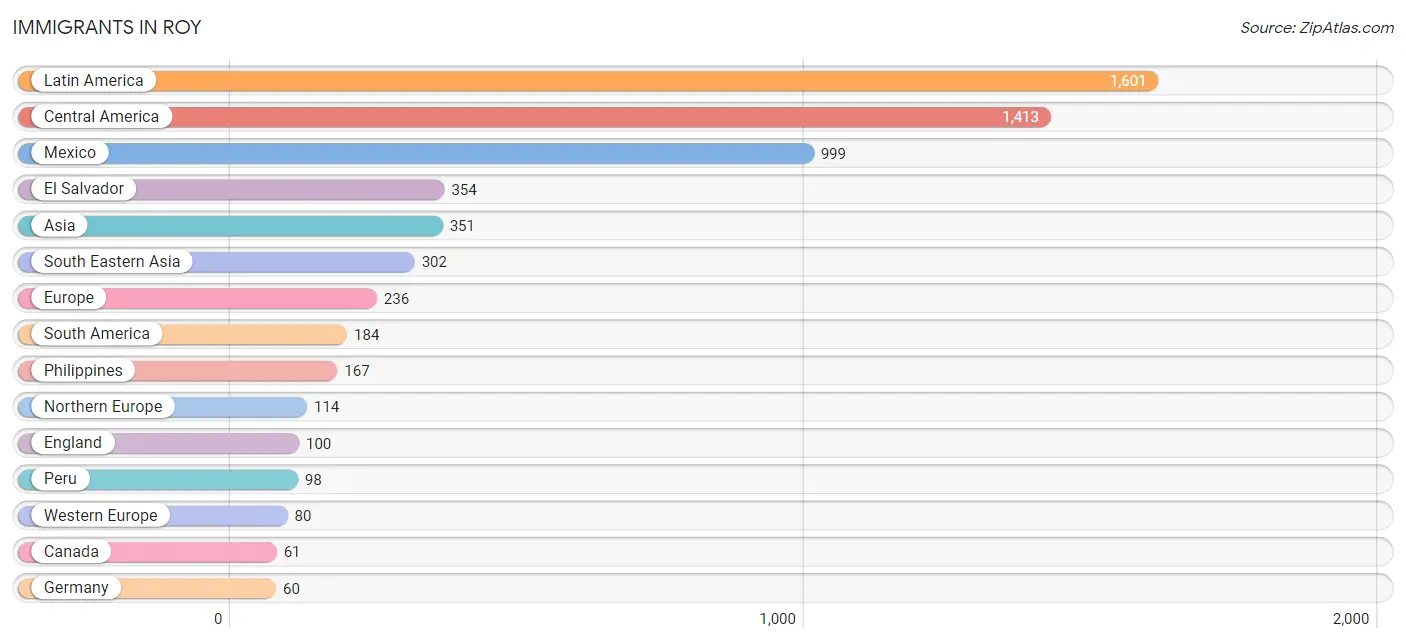
Immigrants in Roy
The most numerous immigrant groups reported in Roy came from Latin America (1,601 | 4.1%), Central America (1,413 | 3.6%), Mexico (999 | 2.6%), El Salvador (354 | 0.9%), and Asia (351 | 0.9%), together accounting for 12.1% of all Roy residents.
| Immigration Origin | # Population | % Population |
| Africa | 23 | 0.1% |
| Asia | 351 | 0.9% |
| Azores | 6 | 0.0% |
| Brazil | 45 | 0.1% |
| Cambodia | 34 | 0.1% |
| Canada | 61 | 0.2% |
| Caribbean | 4 | 0.0% |
| Central America | 1,413 | 3.6% |
| Chile | 20 | 0.1% |
| China | 4 | 0.0% |
| Colombia | 2 | 0.0% |
| Czechoslovakia | 11 | 0.0% |
| Dominican Republic | 4 | 0.0% |
| Eastern Asia | 49 | 0.1% |
| Eastern Europe | 30 | 0.1% |
| Ecuador | 19 | 0.1% |
| El Salvador | 354 | 0.9% |
| England | 100 | 0.3% |
| Europe | 236 | 0.6% |
| Germany | 60 | 0.2% |
| Ghana | 15 | 0.0% |
| Guatemala | 60 | 0.2% |
| Hungary | 5 | 0.0% |
| Japan | 21 | 0.1% |
| Korea | 24 | 0.1% |
| Laos | 12 | 0.0% |
| Latin America | 1,601 | 4.1% |
| Mexico | 999 | 2.6% |
| Netherlands | 20 | 0.1% |
| Northern Europe | 114 | 0.3% |
| Oceania | 29 | 0.1% |
| Peru | 98 | 0.3% |
| Philippines | 167 | 0.4% |
| Portugal | 6 | 0.0% |
| Russia | 14 | 0.0% |
| South Africa | 8 | 0.0% |
| South America | 184 | 0.5% |
| South Eastern Asia | 302 | 0.8% |
| Southern Europe | 12 | 0.0% |
| Spain | 6 | 0.0% |
| Thailand | 54 | 0.1% |
| Vietnam | 35 | 0.1% |
| Western Africa | 15 | 0.0% |
| Western Europe | 80 | 0.2% | View All 44 Rows |
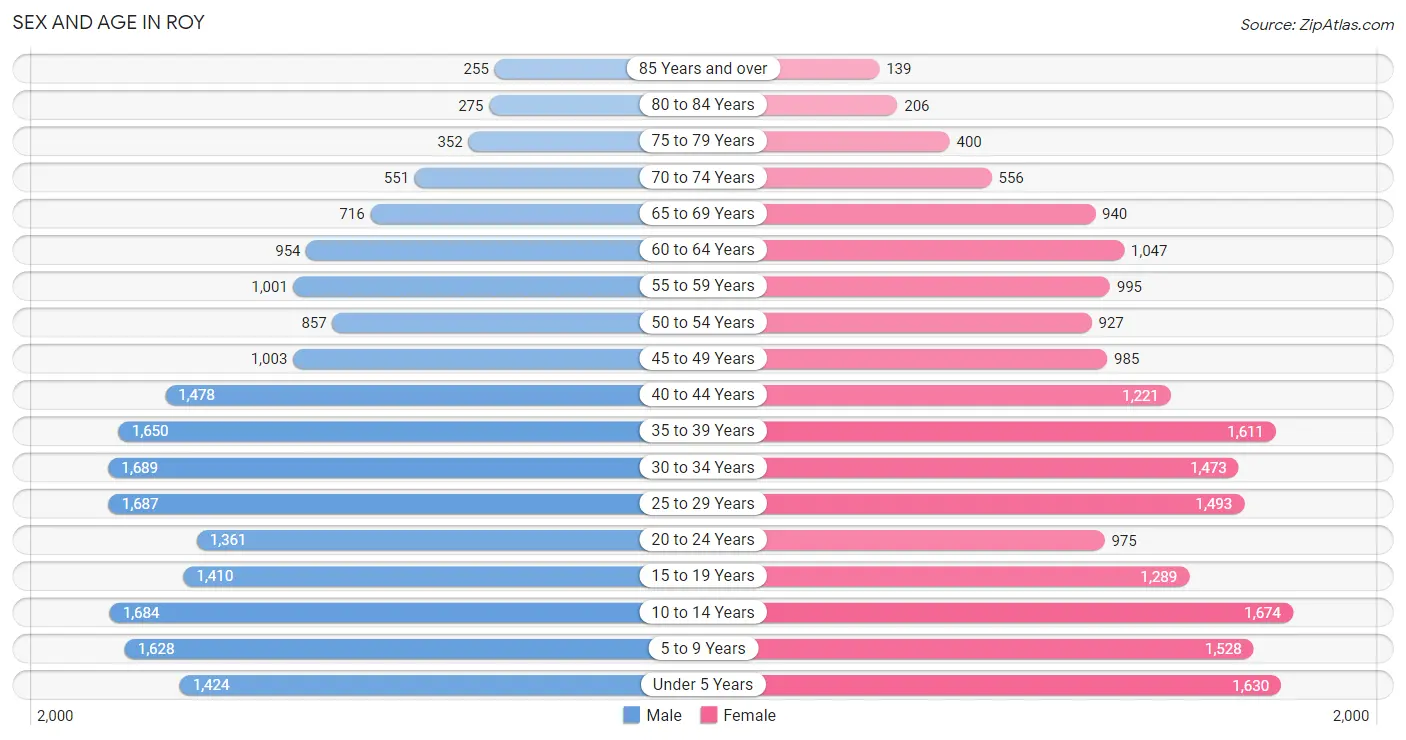
Sex and Age in Roy
Sex and Age in Roy
The most populous age groups in Roy are 30 to 34 Years (1,689 | 8.5%) for men and 10 to 14 Years (1,674 | 8.8%) for women.
| Age Bracket | Male | Female |
| Under 5 Years | 1,424 (7.1%) | 1,630 (8.5%) |
| 5 to 9 Years | 1,628 (8.2%) | 1,528 (8.0%) |
| 10 to 14 Years | 1,684 (8.4%) | 1,674 (8.8%) |
| 15 to 19 Years | 1,410 (7.1%) | 1,289 (6.8%) |
| 20 to 24 Years | 1,361 (6.8%) | 975 (5.1%) |
| 25 to 29 Years | 1,687 (8.5%) | 1,493 (7.8%) |
| 30 to 34 Years | 1,689 (8.5%) | 1,473 (7.7%) |
| 35 to 39 Years | 1,650 (8.3%) | 1,611 (8.4%) |
| 40 to 44 Years | 1,478 (7.4%) | 1,221 (6.4%) |
| 45 to 49 Years | 1,003 (5.0%) | 985 (5.2%) |
| 50 to 54 Years | 857 (4.3%) | 927 (4.9%) |
| 55 to 59 Years | 1,001 (5.0%) | 995 (5.2%) |
| 60 to 64 Years | 954 (4.8%) | 1,047 (5.5%) |
| 65 to 69 Years | 716 (3.6%) | 940 (4.9%) |
| 70 to 74 Years | 551 (2.8%) | 556 (2.9%) |
| 75 to 79 Years | 352 (1.8%) | 400 (2.1%) |
| 80 to 84 Years | 275 (1.4%) | 206 (1.1%) |
| 85 Years and over | 255 (1.3%) | 139 (0.7%) |
| Total | 19,975 (100.0%) | 19,089 (100.0%) |
Families and Households in Roy
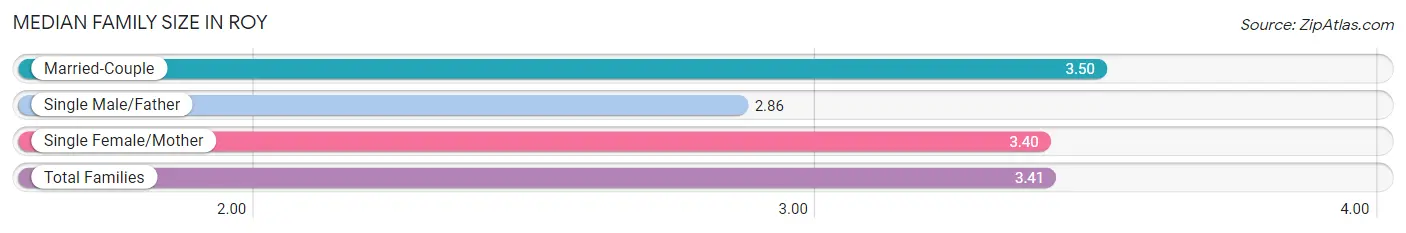
Median Family Size in Roy
The median family size in Roy is 3.41 persons per family, with married-couple families (7,351 | 74.6%) accounting for the largest median family size of 3.5 persons per family. On the other hand, single male/father families (1,143 | 11.6%) represent the smallest median family size with 2.86 persons per family.
| Family Type | # Families | Family Size |
| Married-Couple | 7,351 (74.6%) | 3.50 |
| Single Male/Father | 1,143 (11.6%) | 2.86 |
| Single Female/Mother | 1,365 (13.9%) | 3.40 |
| Total Families | 9,859 (100.0%) | 3.41 |
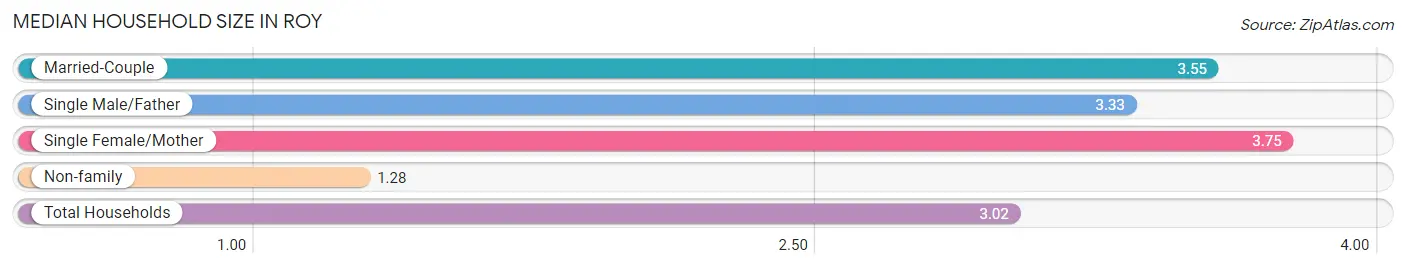
Median Household Size in Roy
The median household size in Roy is 3.02 persons per household, with single female/mother households (1,365 | 10.6%) accounting for the largest median household size of 3.75 persons per household. non-family households (3,027 | 23.5%) represent the smallest median household size with 1.28 persons per household.
| Household Type | # Households | Household Size |
| Married-Couple | 7,351 (57.1%) | 3.55 |
| Single Male/Father | 1,143 (8.9%) | 3.33 |
| Single Female/Mother | 1,365 (10.6%) | 3.75 |
| Non-family | 3,027 (23.5%) | 1.28 |
| Total Households | 12,886 (100.0%) | 3.02 |
Household Size by Marriage Status in Roy
Out of a total of 12,886 households in Roy, 9,859 (76.5%) are family households, while 3,027 (23.5%) are nonfamily households. The most numerous type of family households are 2-person households, comprising 3,368, and the most common type of nonfamily households are 1-person households, comprising 2,528.
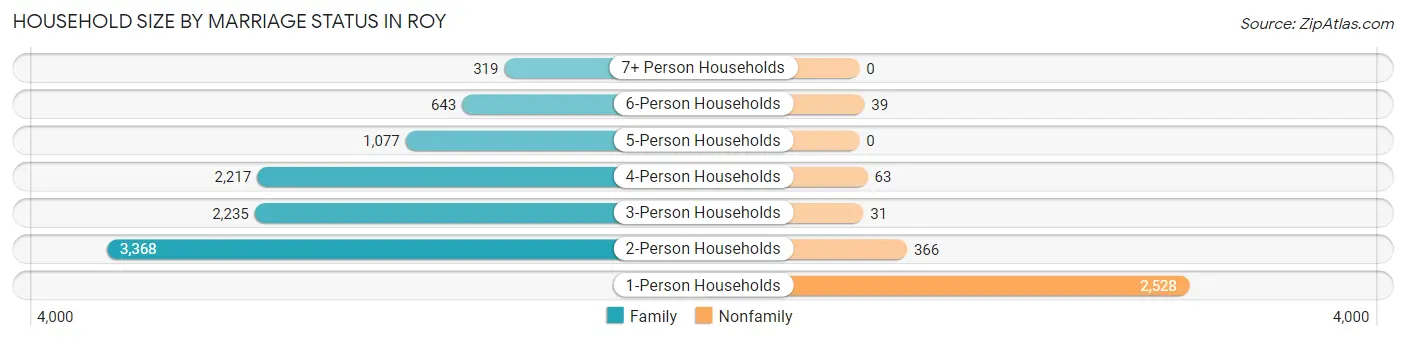
| Household Size | Family Households | Nonfamily Households |
| 1-Person Households | - | 2,528 (19.6%) |
| 2-Person Households | 3,368 (26.1%) | 366 (2.8%) |
| 3-Person Households | 2,235 (17.3%) | 31 (0.2%) |
| 4-Person Households | 2,217 (17.2%) | 63 (0.5%) |
| 5-Person Households | 1,077 (8.4%) | 0 (0.0%) |
| 6-Person Households | 643 (5.0%) | 39 (0.3%) |
| 7+ Person Households | 319 (2.5%) | 0 (0.0%) |
| Total | 9,859 (76.5%) | 3,027 (23.5%) |
Female Fertility in Roy
Fertility by Age in Roy
Average fertility rate in Roy is 108.0 births per 1,000 women. Women in the age bracket of 20 to 34 years have the highest fertility rate with 164.0 births per 1,000 women. Women in the age bracket of 20 to 34 years acount for 64.8% of all women with births.
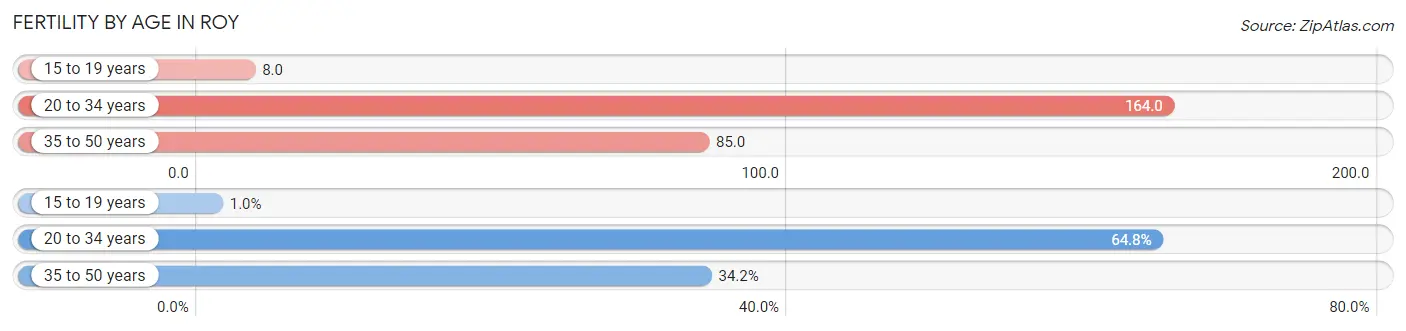
| Age Bracket | Women with Births | Births / 1,000 Women |
| 15 to 19 years | 10 (1.0%) | 8.0 |
| 20 to 34 years | 647 (64.8%) | 164.0 |
| 35 to 50 years | 341 (34.2%) | 85.0 |
| Total | 998 (100.0%) | 108.0 |
Fertility by Age by Marriage Status in Roy
66.7% of women with births (998) in Roy are married. The highest percentage of unmarried women with births falls into 15 to 19 years age bracket with 100.0% of them unmarried at the time of birth, while the lowest percentage of unmarried women with births belong to 20 to 34 years age bracket with 16.7% of them unmarried.
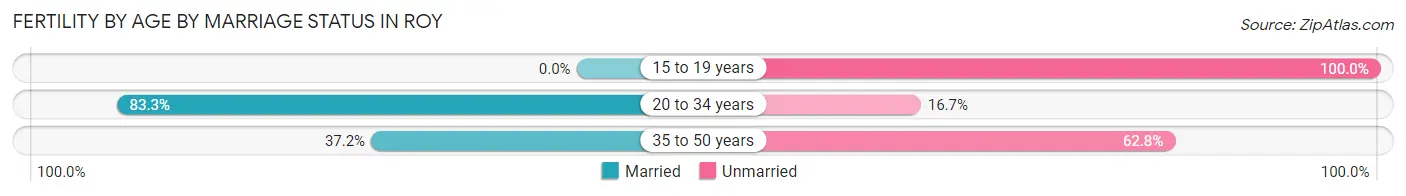
| Age Bracket | Married | Unmarried |
| 15 to 19 years | 0 (0.0%) | 10 (100.0%) |
| 20 to 34 years | 539 (83.3%) | 108 (16.7%) |
| 35 to 50 years | 127 (37.2%) | 214 (62.8%) |
| Total | 666 (66.7%) | 332 (33.3%) |
Fertility by Education in Roy
Average fertility rate in Roy is 108.0 births per 1,000 women. Women with the education attainment of bachelor's degree have the highest fertility rate of 169.0 births per 1,000 women, while women with the education attainment of graduate degree have the lowest fertility at 37.0 births per 1,000 women. Women with the education attainment of high school diploma represent 39.6% of all women with births.
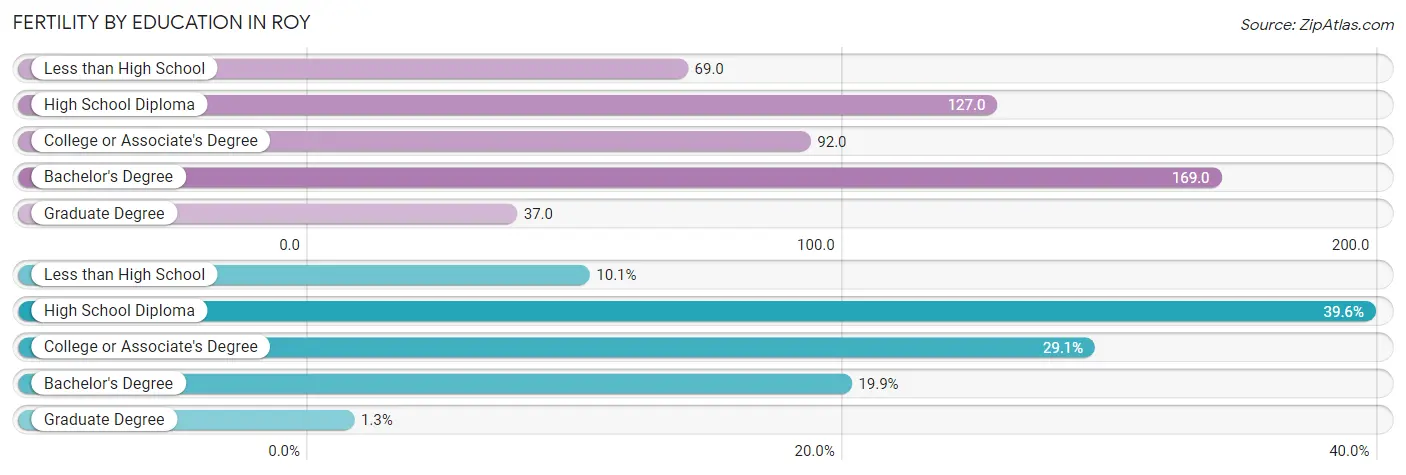
| Educational Attainment | Women with Births | Births / 1,000 Women |
| Less than High School | 101 (10.1%) | 69.0 |
| High School Diploma | 395 (39.6%) | 127.0 |
| College or Associate's Degree | 290 (29.1%) | 92.0 |
| Bachelor's Degree | 199 (19.9%) | 169.0 |
| Graduate Degree | 13 (1.3%) | 37.0 |
| Total | 998 (100.0%) | 108.0 |
Fertility by Education by Marriage Status in Roy
33.3% of women with births in Roy are unmarried. Women with the educational attainment of less than high school are most likely to be married with 100.0% of them married at childbirth, while women with the educational attainment of high school diploma are least likely to be married with 59.5% of them unmarried at childbirth.
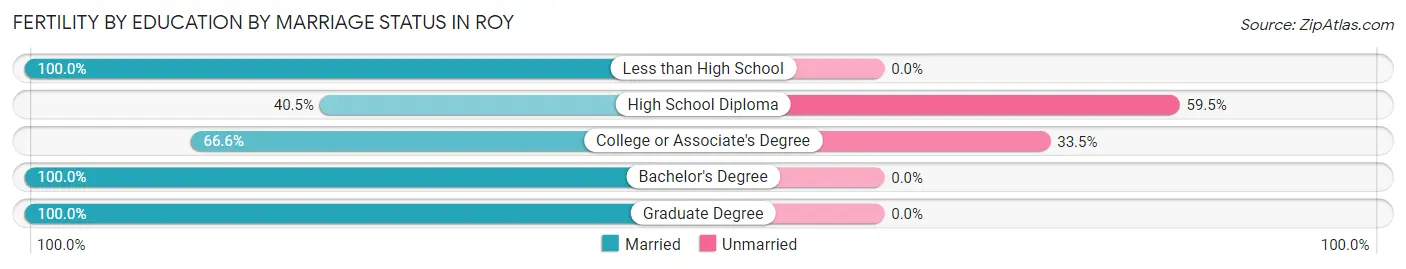
| Educational Attainment | Married | Unmarried |
| Less than High School | 101 (100.0%) | 0 (0.0%) |
| High School Diploma | 160 (40.5%) | 235 (59.5%) |
| College or Associate's Degree | 193 (66.5%) | 97 (33.5%) |
| Bachelor's Degree | 199 (100.0%) | 0 (0.0%) |
| Graduate Degree | 13 (100.0%) | 0 (0.0%) |
| Total | 666 (66.7%) | 332 (33.3%) |
Employment Characteristics in Roy
Employment by Class of Employer in Roy
Among the 20,120 employed individuals in Roy, private company employees (13,688 | 68.0%), federal government employees (2,533 | 12.6%), and not-for-profit organizations (924 | 4.6%) make up the most common classes of employment.
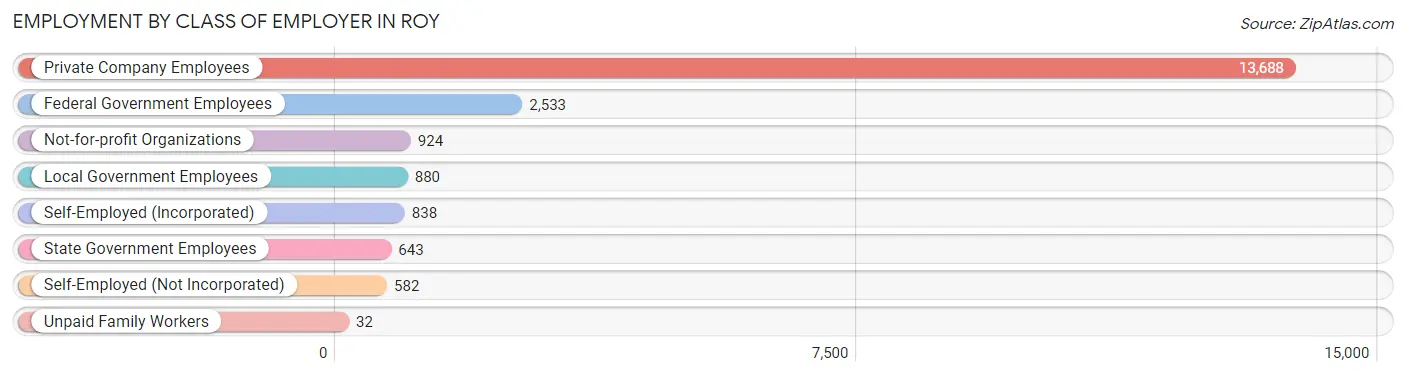
| Employer Class | # Employees | % Employees |
| Private Company Employees | 13,688 | 68.0% |
| Self-Employed (Incorporated) | 838 | 4.2% |
| Self-Employed (Not Incorporated) | 582 | 2.9% |
| Not-for-profit Organizations | 924 | 4.6% |
| Local Government Employees | 880 | 4.4% |
| State Government Employees | 643 | 3.2% |
| Federal Government Employees | 2,533 | 12.6% |
| Unpaid Family Workers | 32 | 0.2% |
| Total | 20,120 | 100.0% |
Employment Status by Age in Roy
According to the labor force statistics for Roy, out of the total population over 16 years of age (28,945), 72.4% or 20,956 individuals are in the labor force, with 2.6% or 545 of them unemployed. The age group with the highest labor force participation rate is 35 to 44 years, with 90.4% or 5,388 individuals in the labor force. Within the labor force, the 20 to 24 years age range has the highest percentage of unemployed individuals, with 7.6% or 160 of them being unemployed.
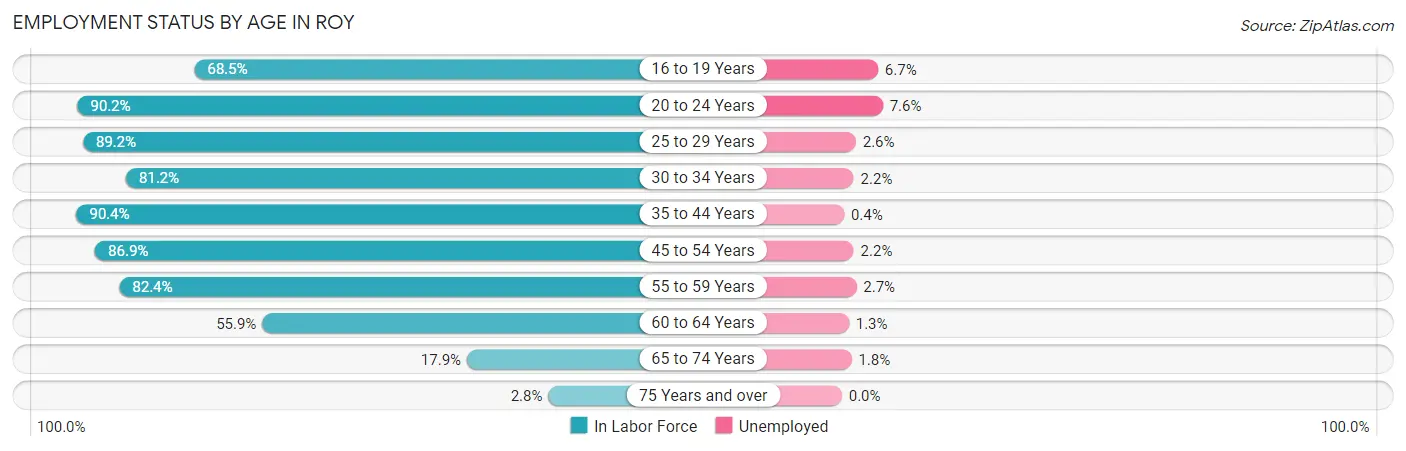
| Age Bracket | In Labor Force | Unemployed |
| 16 to 19 Years | 1,471 (68.5%) | 99 (6.7%) |
| 20 to 24 Years | 2,107 (90.2%) | 160 (7.6%) |
| 25 to 29 Years | 2,837 (89.2%) | 74 (2.6%) |
| 30 to 34 Years | 2,568 (81.2%) | 56 (2.2%) |
| 35 to 44 Years | 5,388 (90.4%) | 22 (0.4%) |
| 45 to 54 Years | 3,278 (86.9%) | 72 (2.2%) |
| 55 to 59 Years | 1,645 (82.4%) | 44 (2.7%) |
| 60 to 64 Years | 1,119 (55.9%) | 15 (1.3%) |
| 65 to 74 Years | 495 (17.9%) | 9 (1.8%) |
| 75 Years and over | 46 (2.8%) | 0 (0.0%) |
| Total | 20,956 (72.4%) | 545 (2.6%) |
Employment Status by Educational Attainment in Roy
According to labor force statistics for Roy, 83.9% of individuals (16,840) out of the total population between 25 and 64 years of age (20,071) are in the labor force, with 1.7% or 286 of them being unemployed. The group with the highest labor force participation rate are those with the educational attainment of bachelor's degree or higher, with 89.6% or 3,817 individuals in the labor force. Within the labor force, individuals with less than high school education have the highest percentage of unemployment, with 5.1% or 65 of them being unemployed.
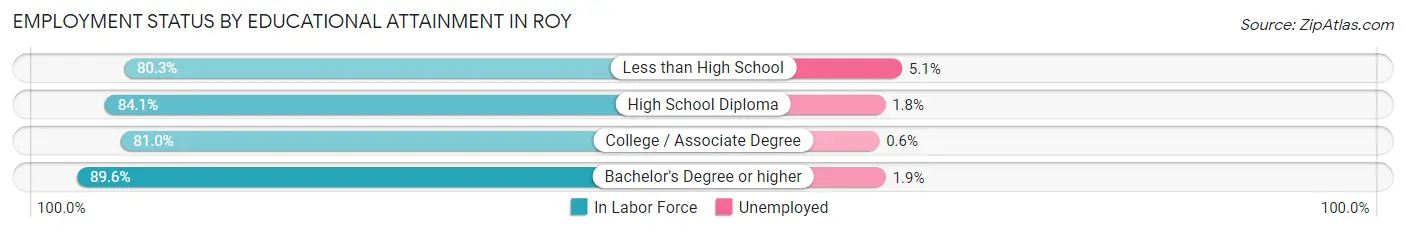
| Educational Attainment | In Labor Force | Unemployed |
| Less than High School | 1,268 (80.3%) | 81 (5.1%) |
| High School Diploma | 6,006 (84.1%) | 129 (1.8%) |
| College / Associate Degree | 5,743 (81.0%) | 43 (0.6%) |
| Bachelor's Degree or higher | 3,817 (89.6%) | 81 (1.9%) |
| Total | 16,840 (83.9%) | 341 (1.7%) |
Employment Occupations by Sex in Roy
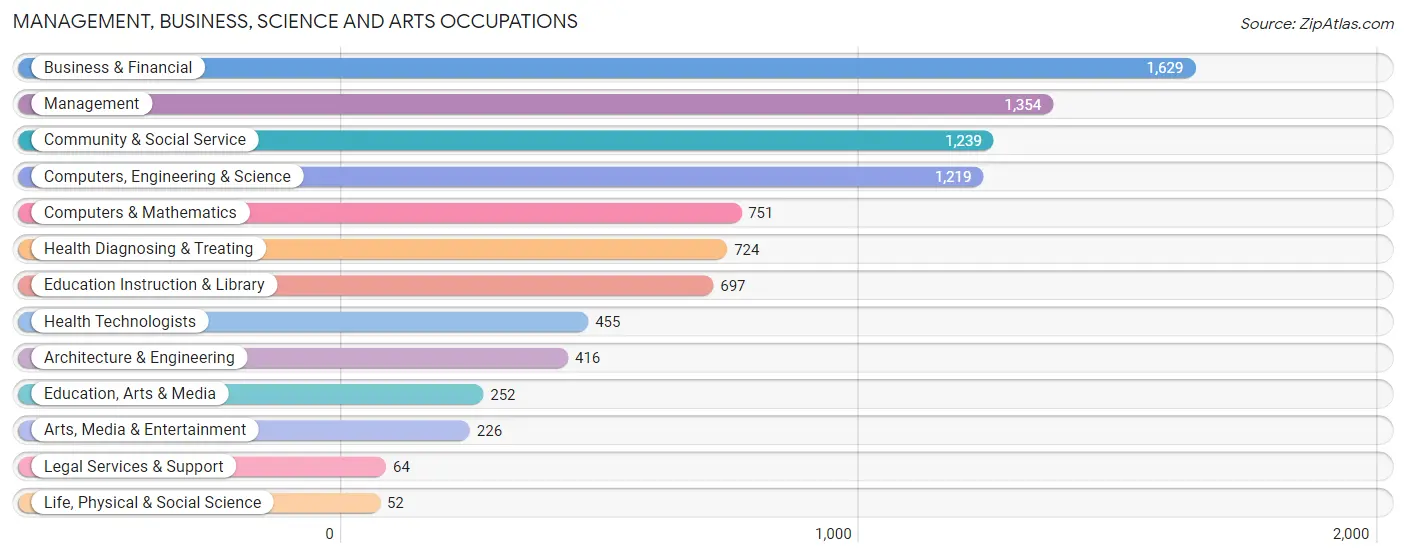
Management, Business, Science and Arts Occupations
The most common Management, Business, Science and Arts occupations in Roy are Business & Financial (1,629 | 8.1%), Management (1,354 | 6.7%), Community & Social Service (1,239 | 6.1%), Computers, Engineering & Science (1,219 | 6.0%), and Computers & Mathematics (751 | 3.7%).
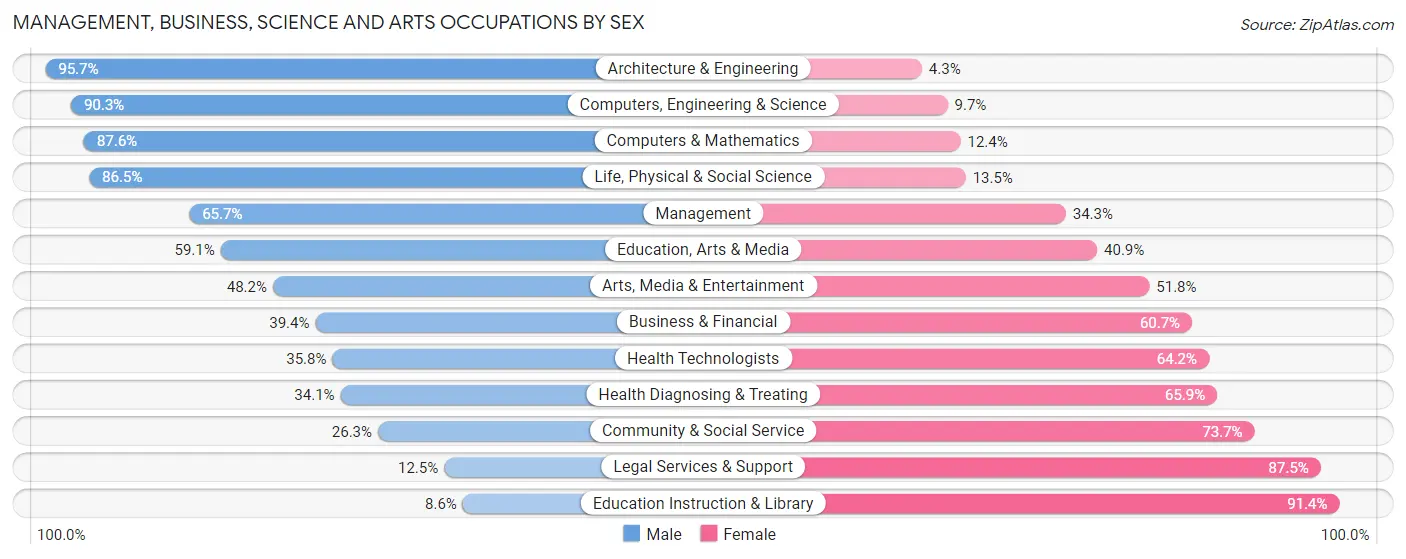
Management, Business, Science and Arts Occupations by Sex
Within the Management, Business, Science and Arts occupations in Roy, the most male-oriented occupations are Architecture & Engineering (95.7%), Computers, Engineering & Science (90.3%), and Computers & Mathematics (87.6%), while the most female-oriented occupations are Education Instruction & Library (91.4%), Legal Services & Support (87.5%), and Community & Social Service (73.7%).
| Occupation | Male | Female |
| Management | 889 (65.7%) | 465 (34.3%) |
| Business & Financial | 641 (39.4%) | 988 (60.7%) |
| Computers, Engineering & Science | 1,101 (90.3%) | 118 (9.7%) |
| Computers & Mathematics | 658 (87.6%) | 93 (12.4%) |
| Architecture & Engineering | 398 (95.7%) | 18 (4.3%) |
| Life, Physical & Social Science | 45 (86.5%) | 7 (13.5%) |
| Community & Social Service | 326 (26.3%) | 913 (73.7%) |
| Education, Arts & Media | 149 (59.1%) | 103 (40.9%) |
| Legal Services & Support | 8 (12.5%) | 56 (87.5%) |
| Education Instruction & Library | 60 (8.6%) | 637 (91.4%) |
| Arts, Media & Entertainment | 109 (48.2%) | 117 (51.8%) |
| Health Diagnosing & Treating | 247 (34.1%) | 477 (65.9%) |
| Health Technologists | 163 (35.8%) | 292 (64.2%) |
| Total (Category) | 3,204 (52.0%) | 2,961 (48.0%) |
| Total (Overall) | 11,143 (55.3%) | 9,002 (44.7%) |
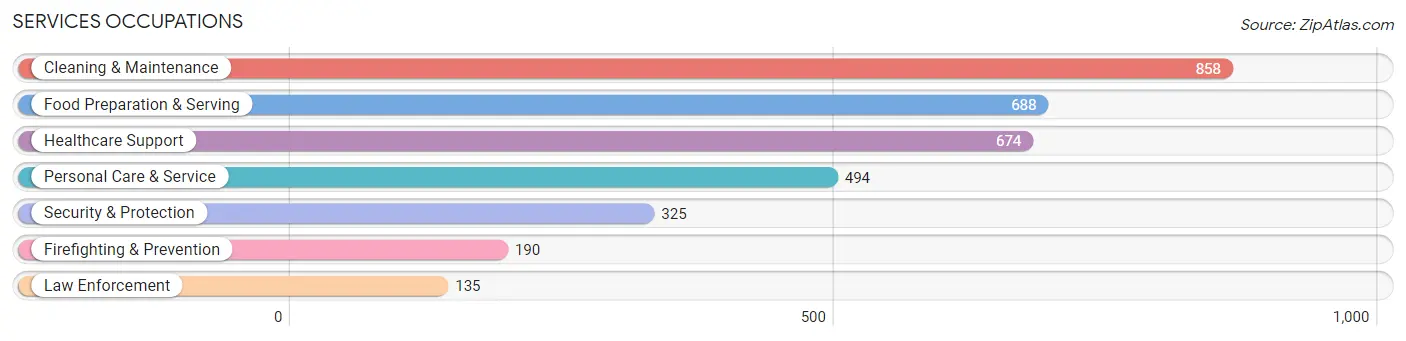
Services Occupations
The most common Services occupations in Roy are Cleaning & Maintenance (858 | 4.3%), Food Preparation & Serving (688 | 3.4%), Healthcare Support (674 | 3.4%), Personal Care & Service (494 | 2.5%), and Security & Protection (325 | 1.6%).
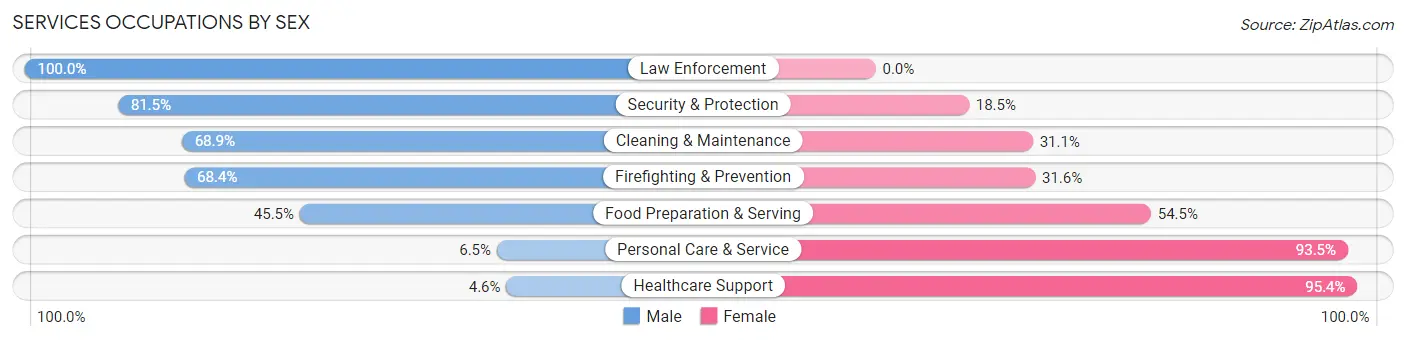
Services Occupations by Sex
Within the Services occupations in Roy, the most male-oriented occupations are Law Enforcement (100.0%), Security & Protection (81.5%), and Cleaning & Maintenance (68.9%), while the most female-oriented occupations are Healthcare Support (95.4%), Personal Care & Service (93.5%), and Food Preparation & Serving (54.5%).
| Occupation | Male | Female |
| Healthcare Support | 31 (4.6%) | 643 (95.4%) |
| Security & Protection | 265 (81.5%) | 60 (18.5%) |
| Firefighting & Prevention | 130 (68.4%) | 60 (31.6%) |
| Law Enforcement | 135 (100.0%) | 0 (0.0%) |
| Food Preparation & Serving | 313 (45.5%) | 375 (54.5%) |
| Cleaning & Maintenance | 591 (68.9%) | 267 (31.1%) |
| Personal Care & Service | 32 (6.5%) | 462 (93.5%) |
| Total (Category) | 1,232 (40.5%) | 1,807 (59.5%) |
| Total (Overall) | 11,143 (55.3%) | 9,002 (44.7%) |
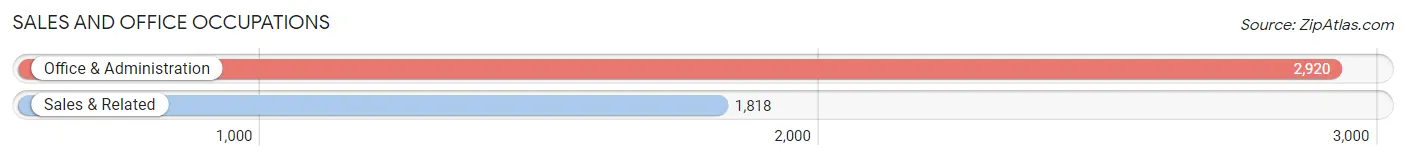
Sales and Office Occupations
The most common Sales and Office occupations in Roy are Office & Administration (2,920 | 14.5%), and Sales & Related (1,818 | 9.0%).
Sales and Office Occupations by Sex
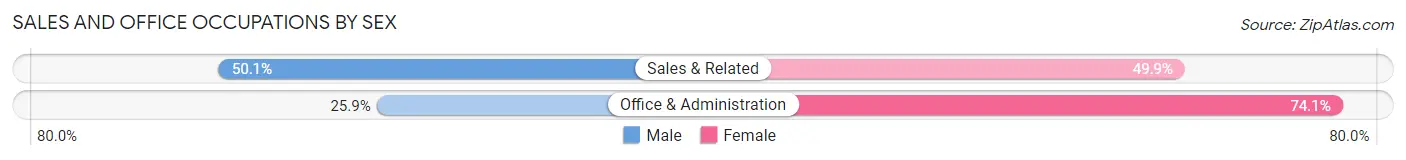
| Occupation | Male | Female |
| Sales & Related | 911 (50.1%) | 907 (49.9%) |
| Office & Administration | 755 (25.9%) | 2,165 (74.1%) |
| Total (Category) | 1,666 (35.2%) | 3,072 (64.8%) |
| Total (Overall) | 11,143 (55.3%) | 9,002 (44.7%) |
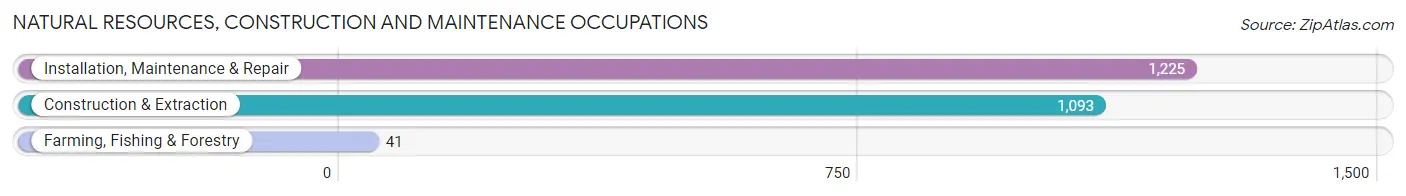
Natural Resources, Construction and Maintenance Occupations
The most common Natural Resources, Construction and Maintenance occupations in Roy are Installation, Maintenance & Repair (1,225 | 6.1%), Construction & Extraction (1,093 | 5.4%), and Farming, Fishing & Forestry (41 | 0.2%).
Natural Resources, Construction and Maintenance Occupations by Sex
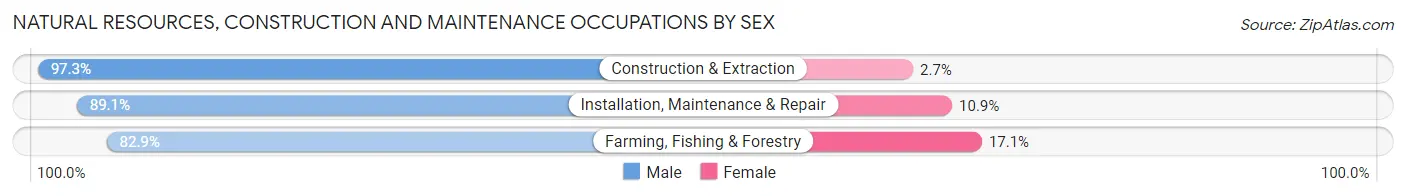
| Occupation | Male | Female |
| Farming, Fishing & Forestry | 34 (82.9%) | 7 (17.1%) |
| Construction & Extraction | 1,063 (97.3%) | 30 (2.7%) |
| Installation, Maintenance & Repair | 1,092 (89.1%) | 133 (10.9%) |
| Total (Category) | 2,189 (92.8%) | 170 (7.2%) |
| Total (Overall) | 11,143 (55.3%) | 9,002 (44.7%) |
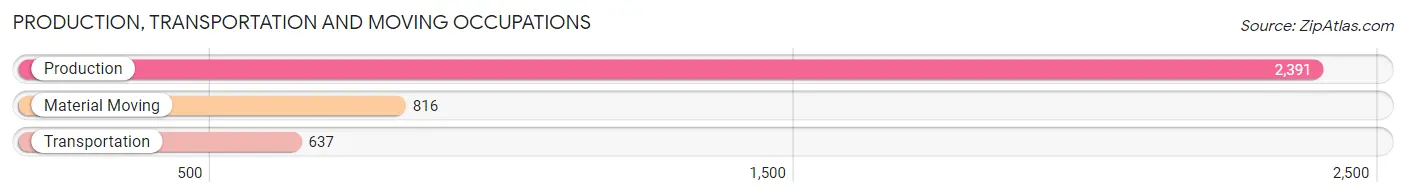
Production, Transportation and Moving Occupations
The most common Production, Transportation and Moving occupations in Roy are Production (2,391 | 11.9%), Material Moving (816 | 4.1%), and Transportation (637 | 3.2%).
Production, Transportation and Moving Occupations by Sex
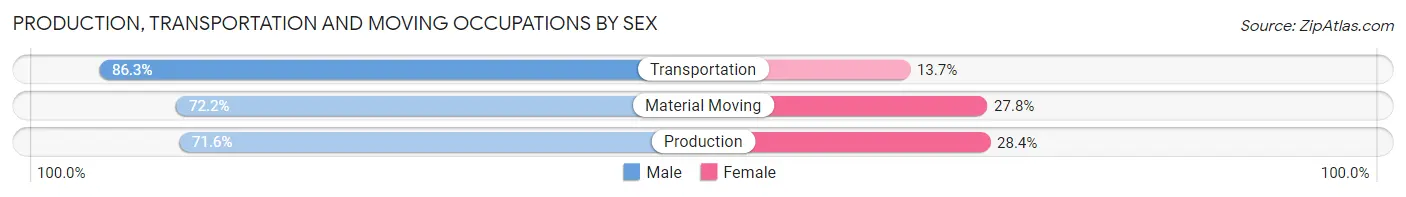
| Occupation | Male | Female |
| Production | 1,713 (71.6%) | 678 (28.4%) |
| Transportation | 550 (86.3%) | 87 (13.7%) |
| Material Moving | 589 (72.2%) | 227 (27.8%) |
| Total (Category) | 2,852 (74.2%) | 992 (25.8%) |
| Total (Overall) | 11,143 (55.3%) | 9,002 (44.7%) |
Employment Industries by Sex in Roy
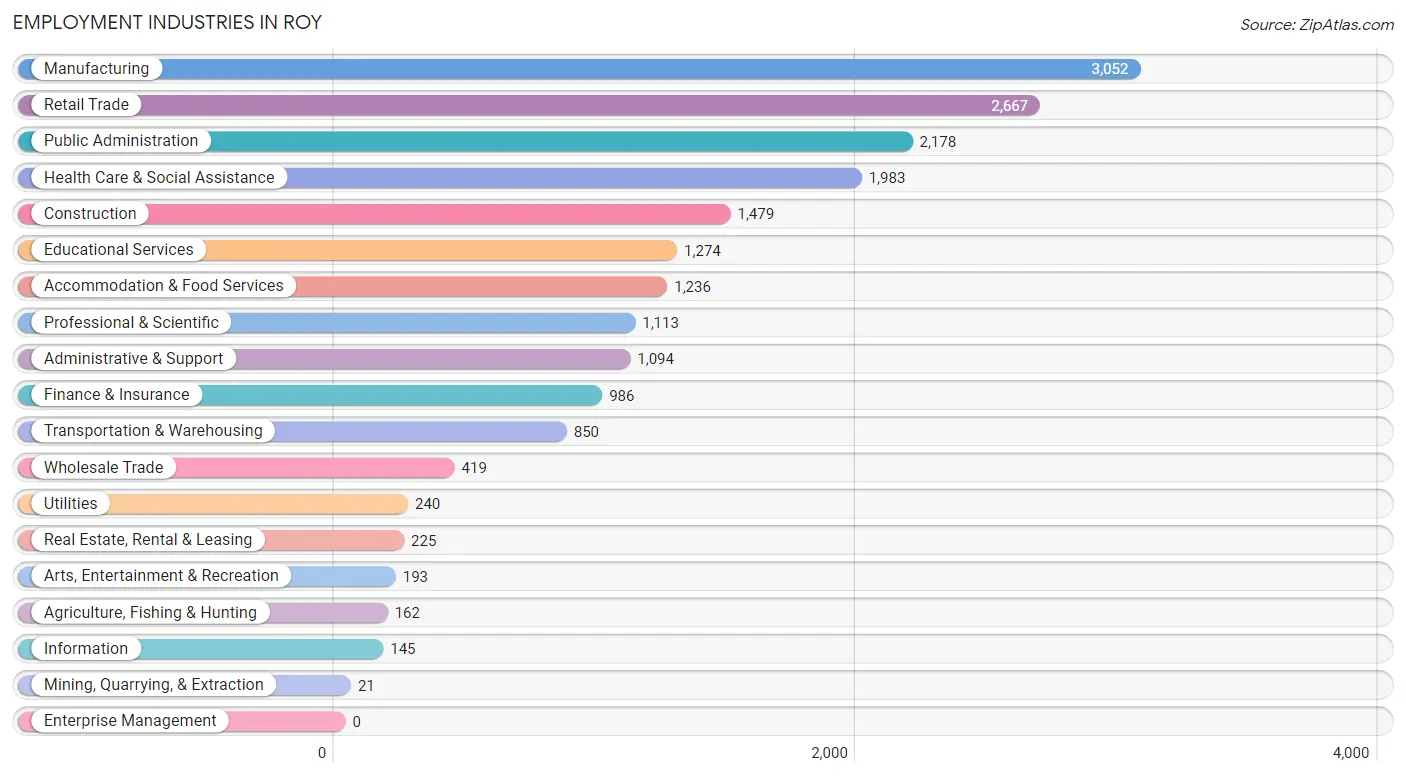
Employment Industries in Roy
The major employment industries in Roy include Manufacturing (3,052 | 15.1%), Retail Trade (2,667 | 13.2%), Public Administration (2,178 | 10.8%), Health Care & Social Assistance (1,983 | 9.8%), and Construction (1,479 | 7.3%).
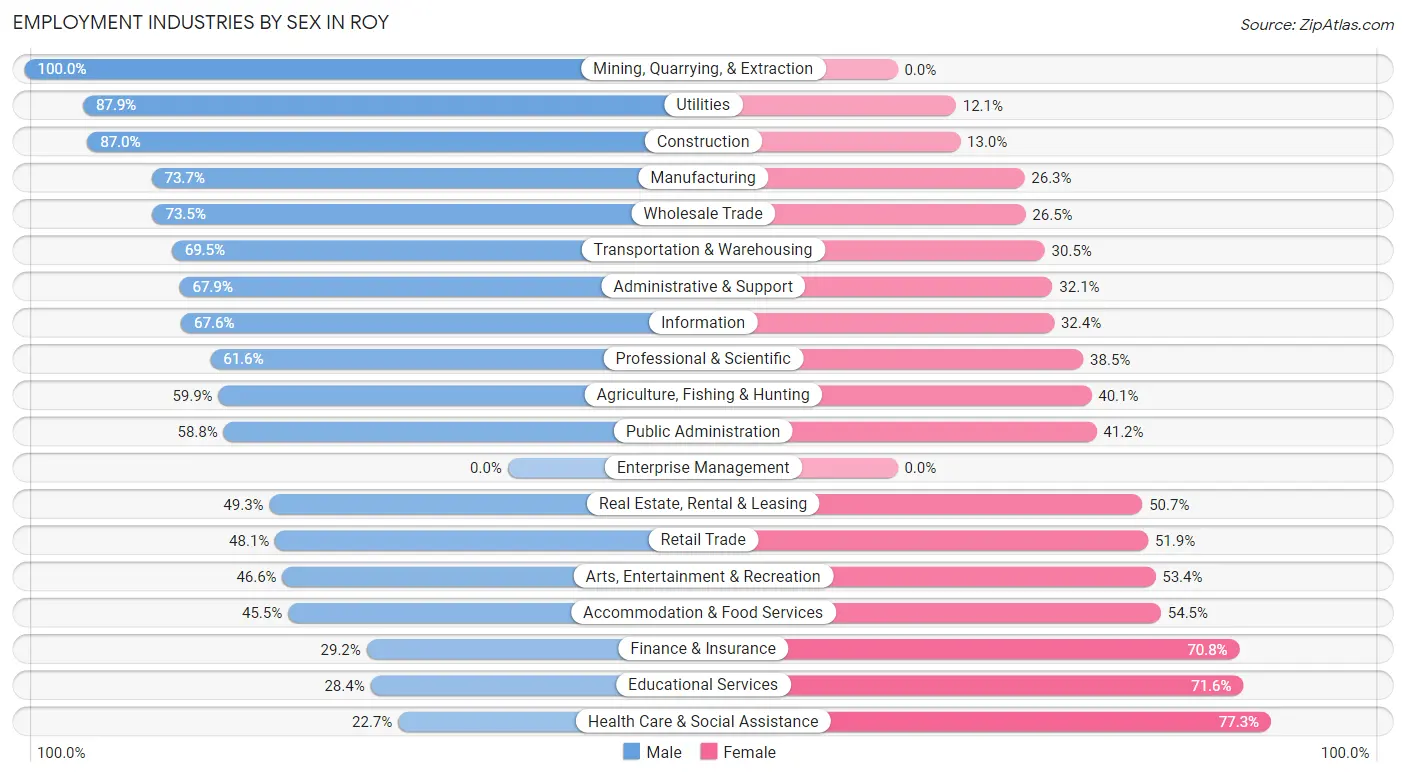
Employment Industries by Sex in Roy
The Roy industries that see more men than women are Mining, Quarrying, & Extraction (100.0%), Utilities (87.9%), and Construction (87.0%), whereas the industries that tend to have a higher number of women are Health Care & Social Assistance (77.3%), Educational Services (71.6%), and Finance & Insurance (70.8%).
| Industry | Male | Female |
| Agriculture, Fishing & Hunting | 97 (59.9%) | 65 (40.1%) |
| Mining, Quarrying, & Extraction | 21 (100.0%) | 0 (0.0%) |
| Construction | 1,287 (87.0%) | 192 (13.0%) |
| Manufacturing | 2,250 (73.7%) | 802 (26.3%) |
| Wholesale Trade | 308 (73.5%) | 111 (26.5%) |
| Retail Trade | 1,284 (48.1%) | 1,383 (51.9%) |
| Transportation & Warehousing | 591 (69.5%) | 259 (30.5%) |
| Utilities | 211 (87.9%) | 29 (12.1%) |
| Information | 98 (67.6%) | 47 (32.4%) |
| Finance & Insurance | 288 (29.2%) | 698 (70.8%) |
| Real Estate, Rental & Leasing | 111 (49.3%) | 114 (50.7%) |
| Professional & Scientific | 685 (61.6%) | 428 (38.5%) |
| Enterprise Management | 0 (0.0%) | 0 (0.0%) |
| Administrative & Support | 743 (67.9%) | 351 (32.1%) |
| Educational Services | 362 (28.4%) | 912 (71.6%) |
| Health Care & Social Assistance | 450 (22.7%) | 1,533 (77.3%) |
| Arts, Entertainment & Recreation | 90 (46.6%) | 103 (53.4%) |
| Accommodation & Food Services | 562 (45.5%) | 674 (54.5%) |
| Public Administration | 1,281 (58.8%) | 897 (41.2%) |
| Total | 11,143 (55.3%) | 9,002 (44.7%) |
Education in Roy
School Enrollment in Roy
The most common levels of schooling among the 10,164 students in Roy are middle school (2,719 | 26.8%), elementary school (2,310 | 22.7%), and high school (2,273 | 22.4%).
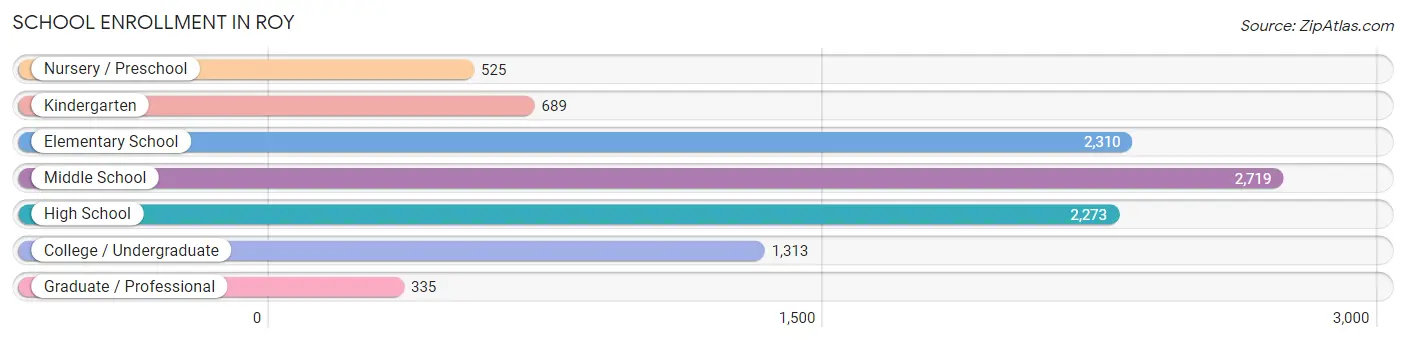
| School Level | # Students | % Students |
| Nursery / Preschool | 525 | 5.2% |
| Kindergarten | 689 | 6.8% |
| Elementary School | 2,310 | 22.7% |
| Middle School | 2,719 | 26.8% |
| High School | 2,273 | 22.4% |
| College / Undergraduate | 1,313 | 12.9% |
| Graduate / Professional | 335 | 3.3% |
| Total | 10,164 | 100.0% |
School Enrollment by Age by Funding Source in Roy
Out of a total of 10,164 students who are enrolled in schools in Roy, 813 (8.0%) attend a private institution, while the remaining 9,351 (92.0%) are enrolled in public schools. The age group of 3 to 4 year olds has the highest likelihood of being enrolled in private schools, with 162 (42.6% in the age bracket) enrolled. Conversely, the age group of 18 to 19 year olds has the lowest likelihood of being enrolled in a private school, with 582 (100.0% in the age bracket) attending a public institution.
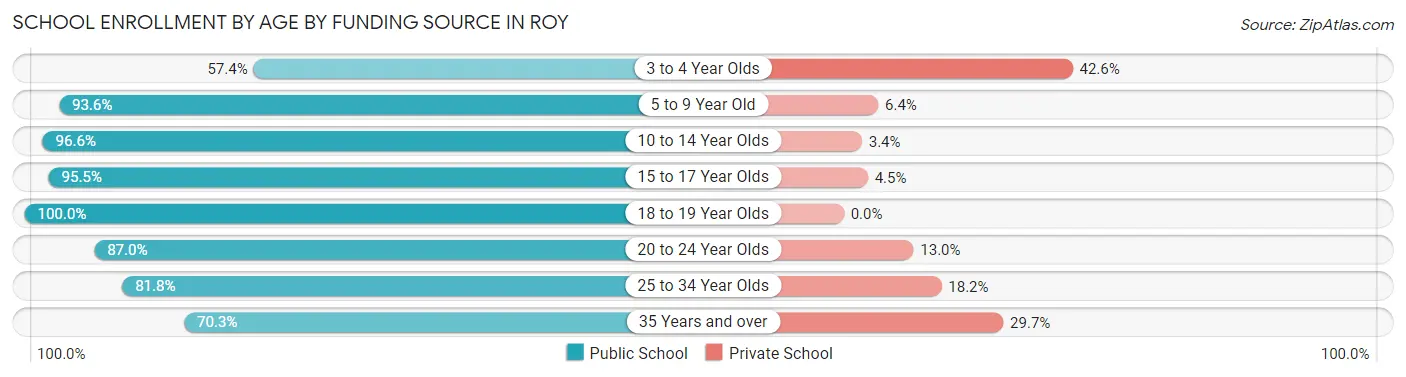
| Age Bracket | Public School | Private School |
| 3 to 4 Year Olds | 218 (57.4%) | 162 (42.6%) |
| 5 to 9 Year Old | 2,768 (93.6%) | 190 (6.4%) |
| 10 to 14 Year Olds | 3,128 (96.6%) | 109 (3.4%) |
| 15 to 17 Year Olds | 1,451 (95.5%) | 68 (4.5%) |
| 18 to 19 Year Olds | 582 (100.0%) | 0 (0.0%) |
| 20 to 24 Year Olds | 382 (87.0%) | 57 (13.0%) |
| 25 to 34 Year Olds | 580 (81.8%) | 129 (18.2%) |
| 35 Years and over | 239 (70.3%) | 101 (29.7%) |
| Total | 9,351 (92.0%) | 813 (8.0%) |
Educational Attainment by Field of Study in Roy
Business (1,289 | 23.7%), education (787 | 14.4%), arts & humanities (746 | 13.7%), science & technology (601 | 11.0%), and engineering (401 | 7.4%) are the most common fields of study among 5,449 individuals in Roy who have obtained a bachelor's degree or higher.
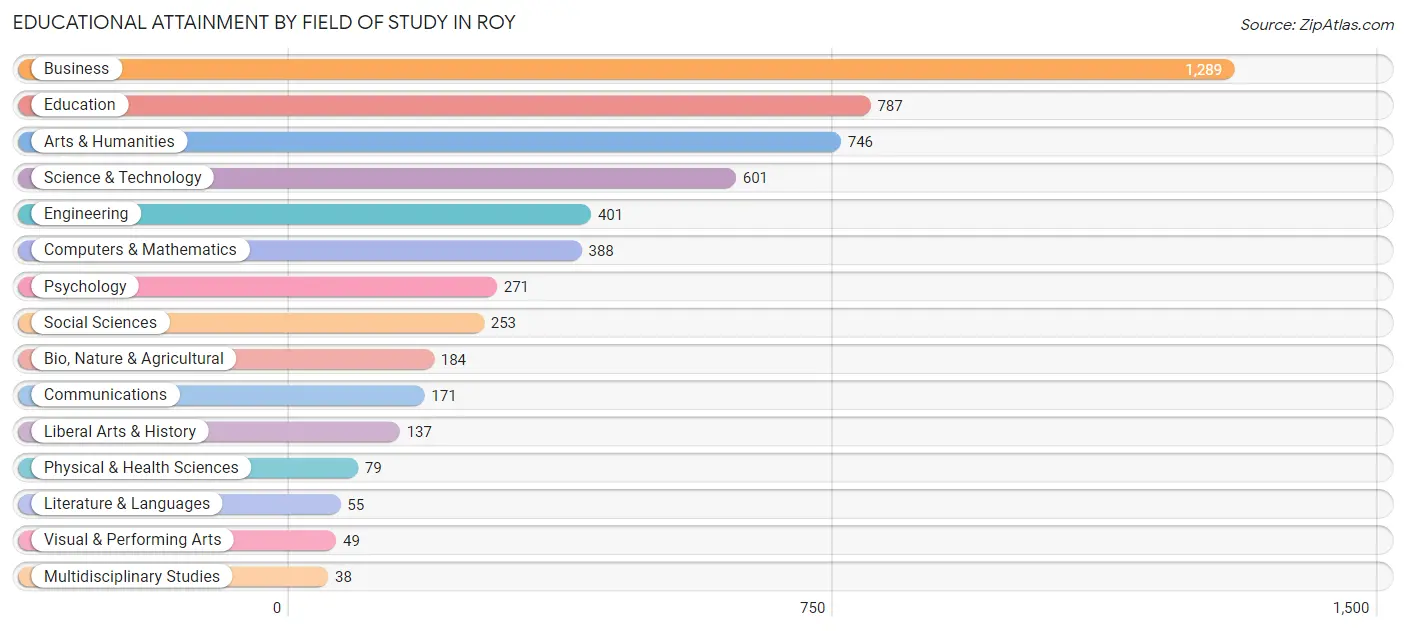
| Field of Study | # Graduates | % Graduates |
| Computers & Mathematics | 388 | 7.1% |
| Bio, Nature & Agricultural | 184 | 3.4% |
| Physical & Health Sciences | 79 | 1.5% |
| Psychology | 271 | 5.0% |
| Social Sciences | 253 | 4.6% |
| Engineering | 401 | 7.4% |
| Multidisciplinary Studies | 38 | 0.7% |
| Science & Technology | 601 | 11.0% |
| Business | 1,289 | 23.7% |
| Education | 787 | 14.4% |
| Literature & Languages | 55 | 1.0% |
| Liberal Arts & History | 137 | 2.5% |
| Visual & Performing Arts | 49 | 0.9% |
| Communications | 171 | 3.1% |
| Arts & Humanities | 746 | 13.7% |
| Total | 5,449 | 100.0% |
Transportation & Commute in Roy
Vehicle Availability by Sex in Roy
The most prevalent vehicle ownership categories in Roy are males with 2 vehicles (4,082, accounting for 36.3%) and females with 2 vehicles (3,041, making up 46.1%).
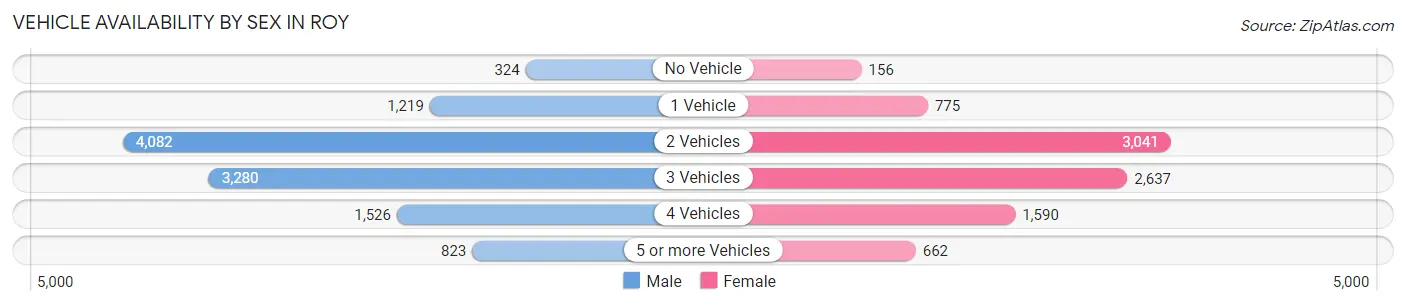
| Vehicles Available | Male | Female |
| No Vehicle | 324 (2.9%) | 156 (1.8%) |
| 1 Vehicle | 1,219 (10.8%) | 775 (8.7%) |
| 2 Vehicles | 4,082 (36.3%) | 3,041 (34.3%) |
| 3 Vehicles | 3,280 (29.1%) | 2,637 (29.8%) |
| 4 Vehicles | 1,526 (13.6%) | 1,590 (17.9%) |
| 5 or more Vehicles | 823 (7.3%) | 662 (7.5%) |
| Total | 11,254 (100.0%) | 8,861 (100.0%) |
Commute Time in Roy
The most frequently occuring commute durations in Roy are 20 to 24 minutes (3,953 commuters, 22.7%), 15 to 19 minutes (3,769 commuters, 21.6%), and 10 to 14 minutes (2,384 commuters, 13.7%).
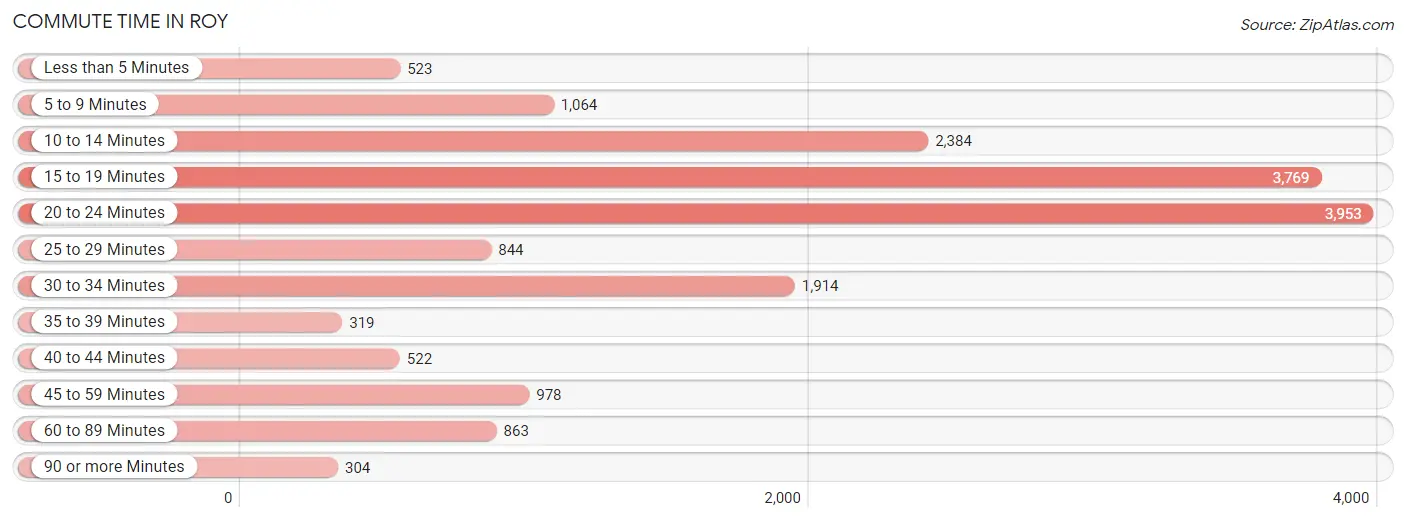
| Commute Time | # Commuters | % Commuters |
| Less than 5 Minutes | 523 | 3.0% |
| 5 to 9 Minutes | 1,064 | 6.1% |
| 10 to 14 Minutes | 2,384 | 13.7% |
| 15 to 19 Minutes | 3,769 | 21.6% |
| 20 to 24 Minutes | 3,953 | 22.7% |
| 25 to 29 Minutes | 844 | 4.8% |
| 30 to 34 Minutes | 1,914 | 11.0% |
| 35 to 39 Minutes | 319 | 1.8% |
| 40 to 44 Minutes | 522 | 3.0% |
| 45 to 59 Minutes | 978 | 5.6% |
| 60 to 89 Minutes | 863 | 5.0% |
| 90 or more Minutes | 304 | 1.7% |
Commute Time by Sex in Roy
The most common commute times in Roy are 20 to 24 minutes (2,353 commuters, 23.3%) for males and 15 to 19 minutes (1,687 commuters, 23.1%) for females.
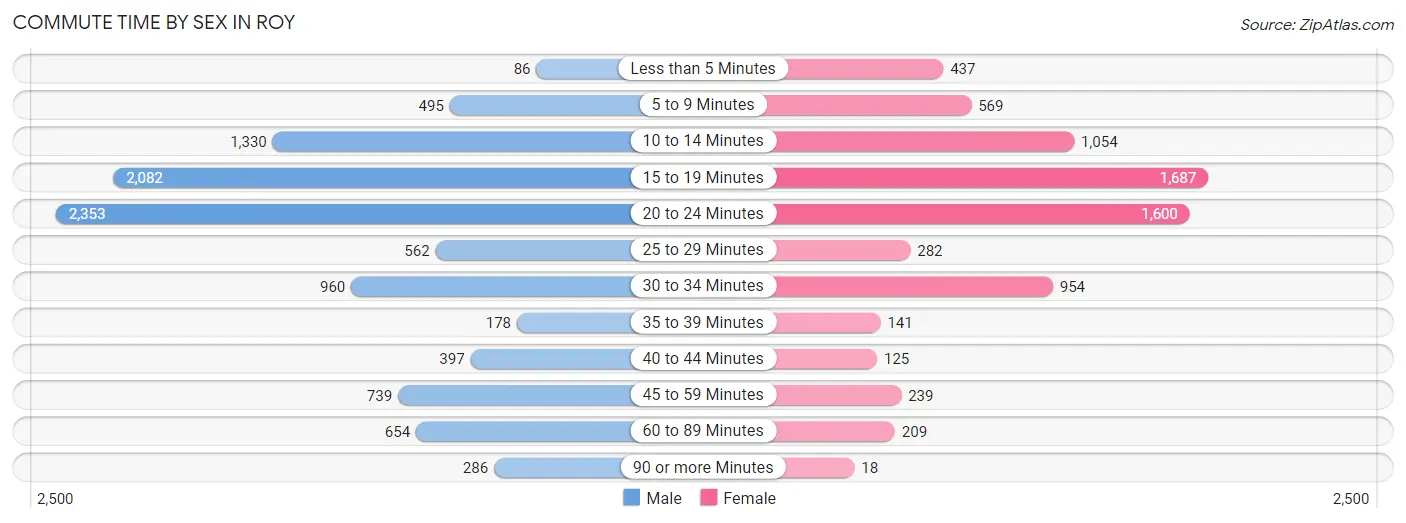
| Commute Time | Male | Female |
| Less than 5 Minutes | 86 (0.9%) | 437 (6.0%) |
| 5 to 9 Minutes | 495 (4.9%) | 569 (7.8%) |
| 10 to 14 Minutes | 1,330 (13.1%) | 1,054 (14.4%) |
| 15 to 19 Minutes | 2,082 (20.6%) | 1,687 (23.1%) |
| 20 to 24 Minutes | 2,353 (23.3%) | 1,600 (21.9%) |
| 25 to 29 Minutes | 562 (5.6%) | 282 (3.9%) |
| 30 to 34 Minutes | 960 (9.5%) | 954 (13.0%) |
| 35 to 39 Minutes | 178 (1.8%) | 141 (1.9%) |
| 40 to 44 Minutes | 397 (3.9%) | 125 (1.7%) |
| 45 to 59 Minutes | 739 (7.3%) | 239 (3.3%) |
| 60 to 89 Minutes | 654 (6.5%) | 209 (2.9%) |
| 90 or more Minutes | 286 (2.8%) | 18 (0.3%) |
Time of Departure to Work by Sex in Roy
The most frequent times of departure to work in Roy are 7:00 AM to 7:29 AM (1,296, 12.8%) for males and 7:00 AM to 7:29 AM (1,173, 16.0%) for females.
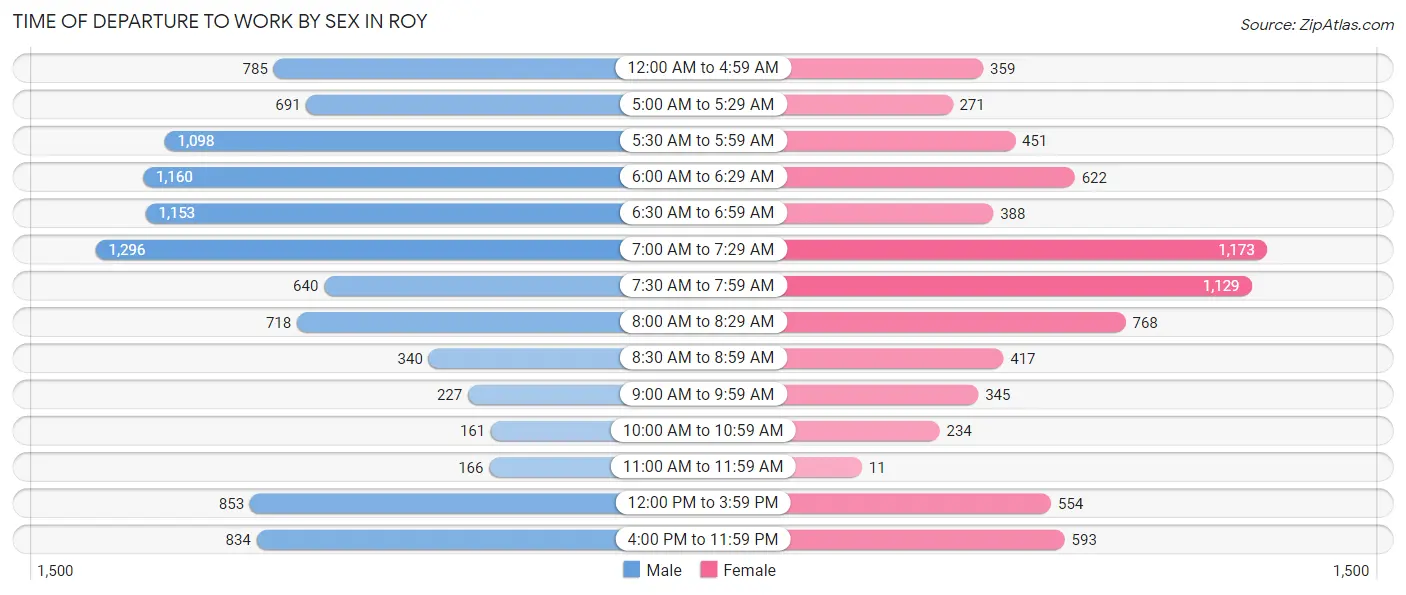
| Time of Departure | Male | Female |
| 12:00 AM to 4:59 AM | 785 (7.8%) | 359 (4.9%) |
| 5:00 AM to 5:29 AM | 691 (6.8%) | 271 (3.7%) |
| 5:30 AM to 5:59 AM | 1,098 (10.8%) | 451 (6.2%) |
| 6:00 AM to 6:29 AM | 1,160 (11.5%) | 622 (8.5%) |
| 6:30 AM to 6:59 AM | 1,153 (11.4%) | 388 (5.3%) |
| 7:00 AM to 7:29 AM | 1,296 (12.8%) | 1,173 (16.0%) |
| 7:30 AM to 7:59 AM | 640 (6.3%) | 1,129 (15.4%) |
| 8:00 AM to 8:29 AM | 718 (7.1%) | 768 (10.5%) |
| 8:30 AM to 8:59 AM | 340 (3.4%) | 417 (5.7%) |
| 9:00 AM to 9:59 AM | 227 (2.2%) | 345 (4.7%) |
| 10:00 AM to 10:59 AM | 161 (1.6%) | 234 (3.2%) |
| 11:00 AM to 11:59 AM | 166 (1.6%) | 11 (0.2%) |
| 12:00 PM to 3:59 PM | 853 (8.4%) | 554 (7.6%) |
| 4:00 PM to 11:59 PM | 834 (8.2%) | 593 (8.1%) |
| Total | 10,122 (100.0%) | 7,315 (100.0%) |
Housing Occupancy in Roy
Occupancy by Ownership in Roy
Of the total 12,886 dwellings in Roy, owner-occupied units account for 11,046 (85.7%), while renter-occupied units make up 1,840 (14.3%).
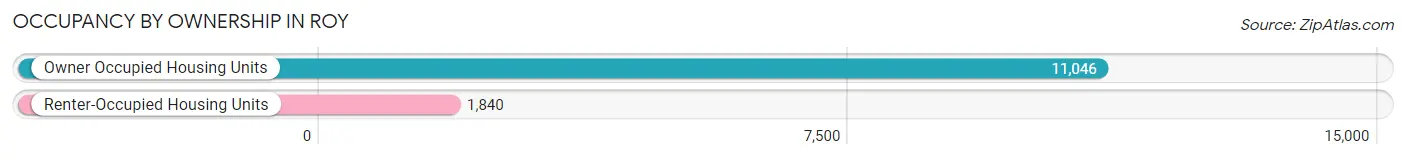
| Occupancy | # Housing Units | % Housing Units |
| Owner Occupied Housing Units | 11,046 | 85.7% |
| Renter-Occupied Housing Units | 1,840 | 14.3% |
| Total Occupied Housing Units | 12,886 | 100.0% |
Occupancy by Household Size in Roy
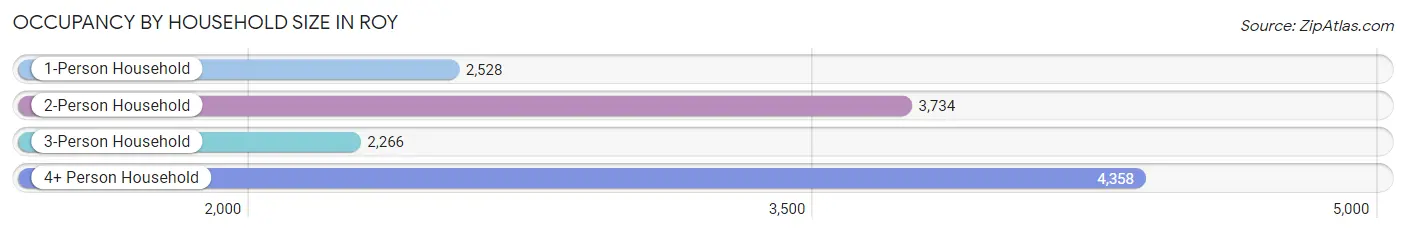
| Household Size | # Housing Units | % Housing Units |
| 1-Person Household | 2,528 | 19.6% |
| 2-Person Household | 3,734 | 29.0% |
| 3-Person Household | 2,266 | 17.6% |
| 4+ Person Household | 4,358 | 33.8% |
| Total Housing Units | 12,886 | 100.0% |
Occupancy by Ownership by Household Size in Roy
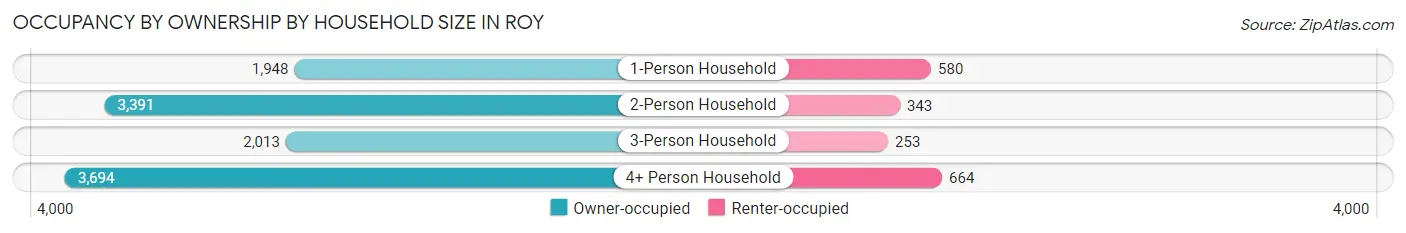
| Household Size | Owner-occupied | Renter-occupied |
| 1-Person Household | 1,948 (77.1%) | 580 (22.9%) |
| 2-Person Household | 3,391 (90.8%) | 343 (9.2%) |
| 3-Person Household | 2,013 (88.8%) | 253 (11.2%) |
| 4+ Person Household | 3,694 (84.8%) | 664 (15.2%) |
| Total Housing Units | 11,046 (85.7%) | 1,840 (14.3%) |
Occupancy by Educational Attainment in Roy
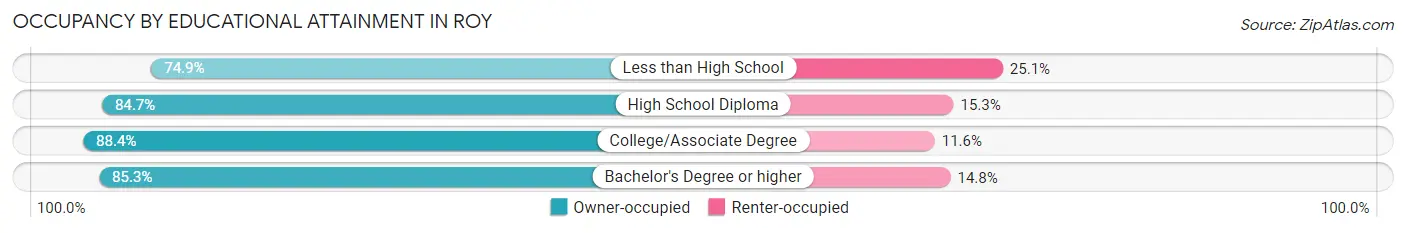
| Household Size | Owner-occupied | Renter-occupied |
| Less than High School | 557 (74.9%) | 187 (25.1%) |
| High School Diploma | 3,355 (84.7%) | 608 (15.3%) |
| College/Associate Degree | 4,563 (88.4%) | 600 (11.6%) |
| Bachelor's Degree or higher | 2,571 (85.3%) | 445 (14.7%) |
Occupancy by Age of Householder in Roy
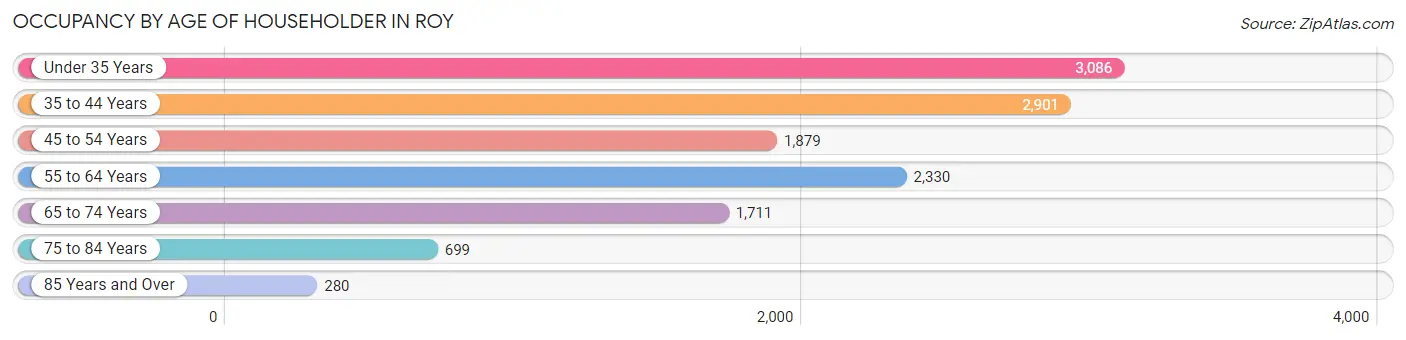
| Age Bracket | # Households | % Households |
| Under 35 Years | 3,086 | 23.9% |
| 35 to 44 Years | 2,901 | 22.5% |
| 45 to 54 Years | 1,879 | 14.6% |
| 55 to 64 Years | 2,330 | 18.1% |
| 65 to 74 Years | 1,711 | 13.3% |
| 75 to 84 Years | 699 | 5.4% |
| 85 Years and Over | 280 | 2.2% |
| Total | 12,886 | 100.0% |
Housing Finances in Roy
Median Income by Occupancy in Roy
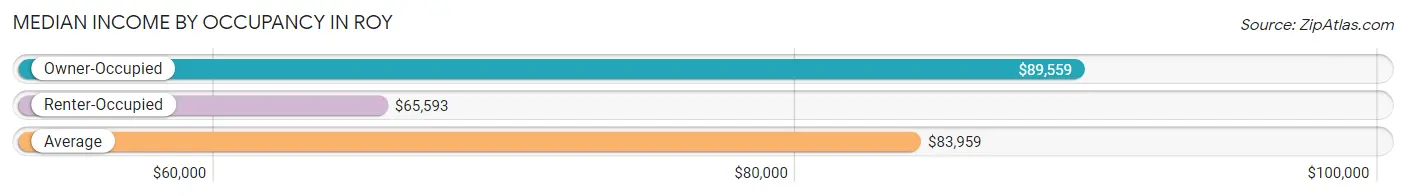
| Occupancy Type | # Households | Median Income |
| Owner-Occupied | 11,046 (85.7%) | $89,559 |
| Renter-Occupied | 1,840 (14.3%) | $65,593 |
| Average | 12,886 (100.0%) | $83,959 |
Occupancy by Householder Income Bracket in Roy
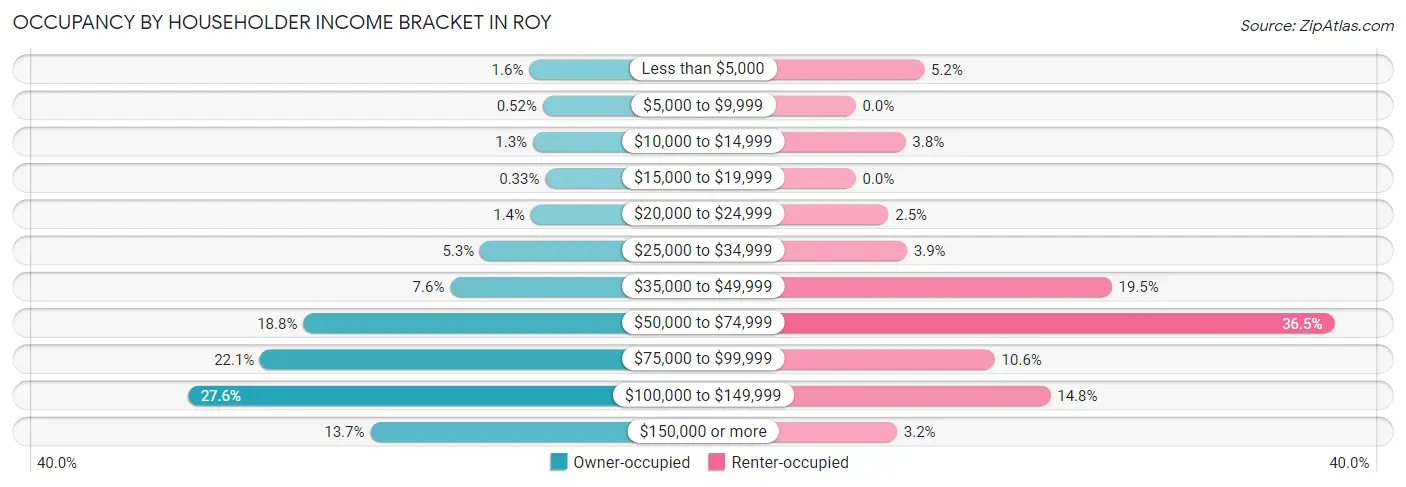
| Income Bracket | Owner-occupied | Renter-occupied |
| Less than $5,000 | 171 (1.5%) | 96 (5.2%) |
| $5,000 to $9,999 | 57 (0.5%) | 0 (0.0%) |
| $10,000 to $14,999 | 140 (1.3%) | 70 (3.8%) |
| $15,000 to $19,999 | 36 (0.3%) | 0 (0.0%) |
| $20,000 to $24,999 | 158 (1.4%) | 46 (2.5%) |
| $25,000 to $34,999 | 585 (5.3%) | 72 (3.9%) |
| $35,000 to $49,999 | 836 (7.6%) | 359 (19.5%) |
| $50,000 to $74,999 | 2,073 (18.8%) | 671 (36.5%) |
| $75,000 to $99,999 | 2,436 (22.1%) | 195 (10.6%) |
| $100,000 to $149,999 | 3,045 (27.6%) | 273 (14.8%) |
| $150,000 or more | 1,509 (13.7%) | 58 (3.2%) |
| Total | 11,046 (100.0%) | 1,840 (100.0%) |
Monthly Housing Cost Tiers in Roy
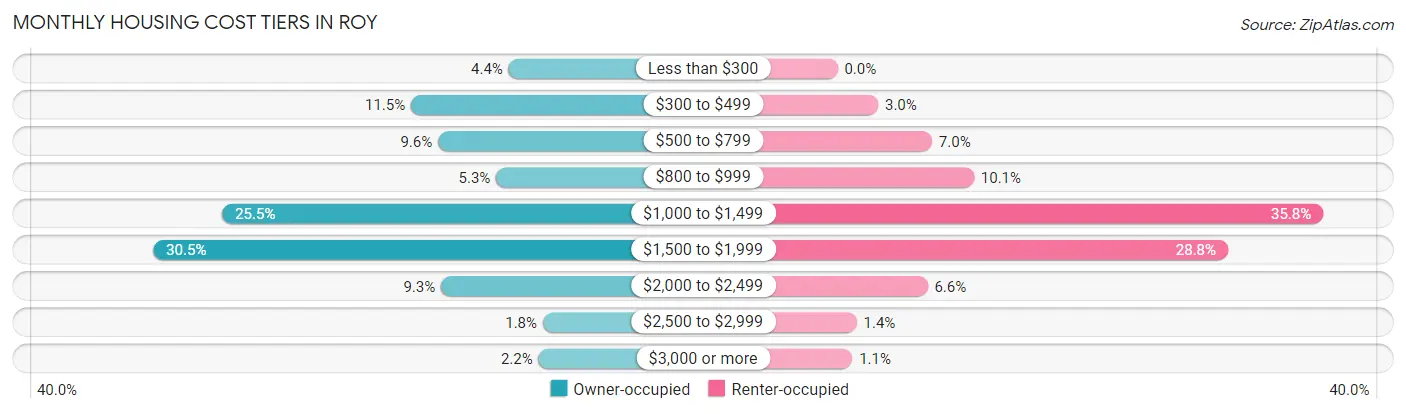
| Monthly Cost | Owner-occupied | Renter-occupied |
| Less than $300 | 480 (4.3%) | 0 (0.0%) |
| $300 to $499 | 1,275 (11.5%) | 55 (3.0%) |
| $500 to $799 | 1,055 (9.6%) | 128 (7.0%) |
| $800 to $999 | 582 (5.3%) | 185 (10.1%) |
| $1,000 to $1,499 | 2,812 (25.5%) | 658 (35.8%) |
| $1,500 to $1,999 | 3,372 (30.5%) | 529 (28.7%) |
| $2,000 to $2,499 | 1,031 (9.3%) | 122 (6.6%) |
| $2,500 to $2,999 | 202 (1.8%) | 26 (1.4%) |
| $3,000 or more | 237 (2.1%) | 20 (1.1%) |
| Total | 11,046 (100.0%) | 1,840 (100.0%) |
Physical Housing Characteristics in Roy
Housing Structures in Roy
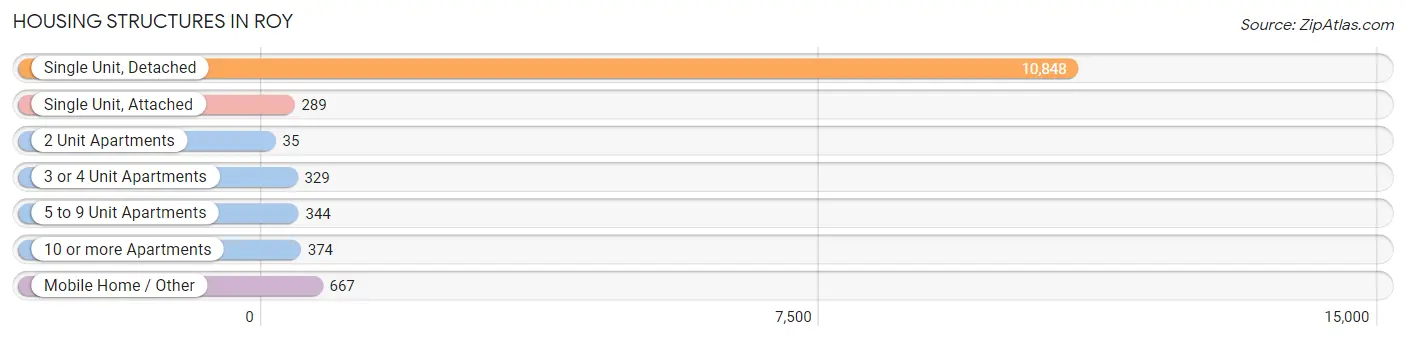
| Structure Type | # Housing Units | % Housing Units |
| Single Unit, Detached | 10,848 | 84.2% |
| Single Unit, Attached | 289 | 2.2% |
| 2 Unit Apartments | 35 | 0.3% |
| 3 or 4 Unit Apartments | 329 | 2.5% |
| 5 to 9 Unit Apartments | 344 | 2.7% |
| 10 or more Apartments | 374 | 2.9% |
| Mobile Home / Other | 667 | 5.2% |
| Total | 12,886 | 100.0% |
Housing Structures by Occupancy in Roy
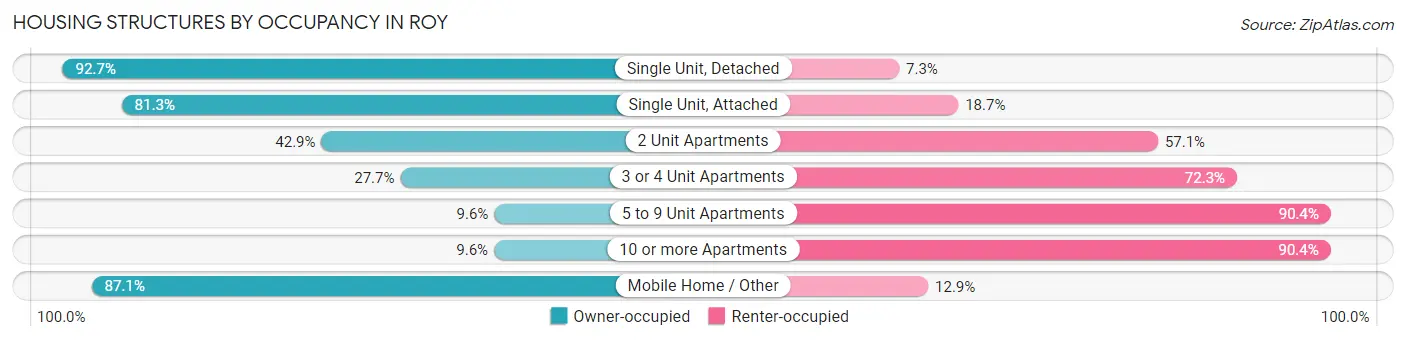
| Structure Type | Owner-occupied | Renter-occupied |
| Single Unit, Detached | 10,055 (92.7%) | 793 (7.3%) |
| Single Unit, Attached | 235 (81.3%) | 54 (18.7%) |
| 2 Unit Apartments | 15 (42.9%) | 20 (57.1%) |
| 3 or 4 Unit Apartments | 91 (27.7%) | 238 (72.3%) |
| 5 to 9 Unit Apartments | 33 (9.6%) | 311 (90.4%) |
| 10 or more Apartments | 36 (9.6%) | 338 (90.4%) |
| Mobile Home / Other | 581 (87.1%) | 86 (12.9%) |
| Total | 11,046 (85.7%) | 1,840 (14.3%) |
Housing Structures by Number of Rooms in Roy
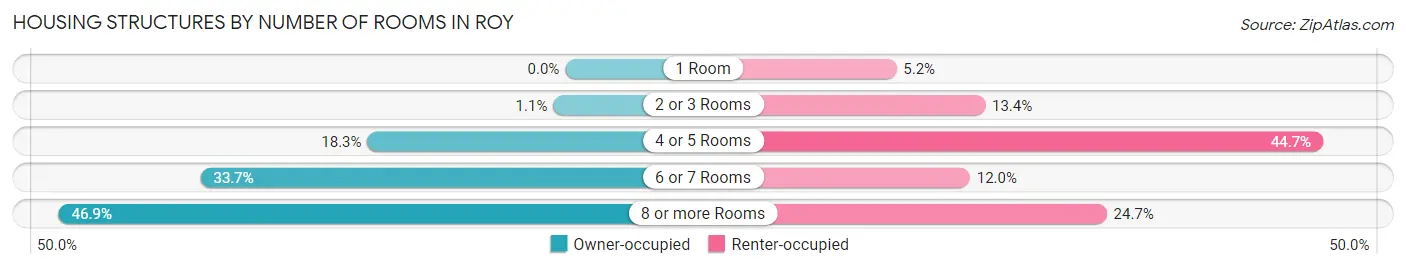
| Number of Rooms | Owner-occupied | Renter-occupied |
| 1 Room | 0 (0.0%) | 96 (5.2%) |
| 2 or 3 Rooms | 123 (1.1%) | 247 (13.4%) |
| 4 or 5 Rooms | 2,021 (18.3%) | 822 (44.7%) |
| 6 or 7 Rooms | 3,727 (33.7%) | 221 (12.0%) |
| 8 or more Rooms | 5,175 (46.9%) | 454 (24.7%) |
| Total | 11,046 (100.0%) | 1,840 (100.0%) |
Housing Structure by Heating Type in Roy
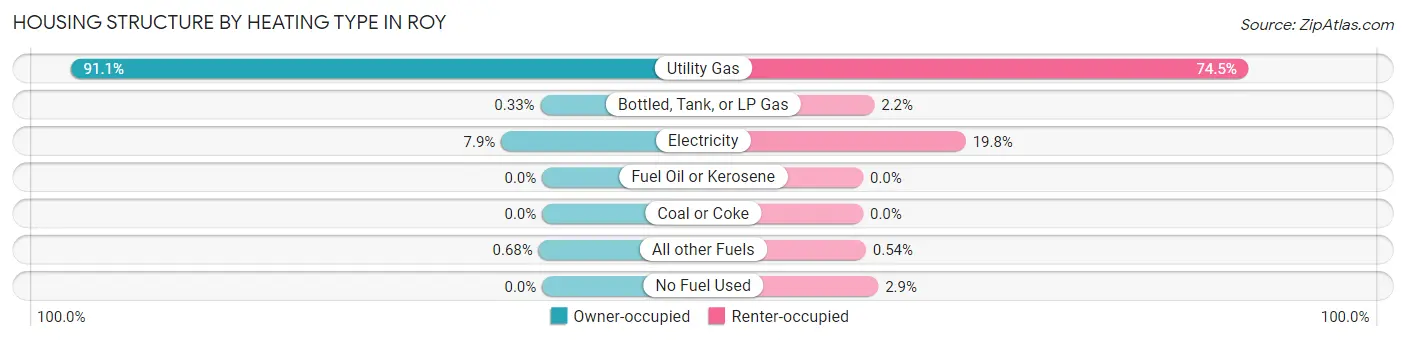
| Heating Type | Owner-occupied | Renter-occupied |
| Utility Gas | 10,062 (91.1%) | 1,371 (74.5%) |
| Bottled, Tank, or LP Gas | 36 (0.3%) | 40 (2.2%) |
| Electricity | 873 (7.9%) | 365 (19.8%) |
| Fuel Oil or Kerosene | 0 (0.0%) | 0 (0.0%) |
| Coal or Coke | 0 (0.0%) | 0 (0.0%) |
| All other Fuels | 75 (0.7%) | 10 (0.5%) |
| No Fuel Used | 0 (0.0%) | 54 (2.9%) |
| Total | 11,046 (100.0%) | 1,840 (100.0%) |
Household Vehicle Usage in Roy
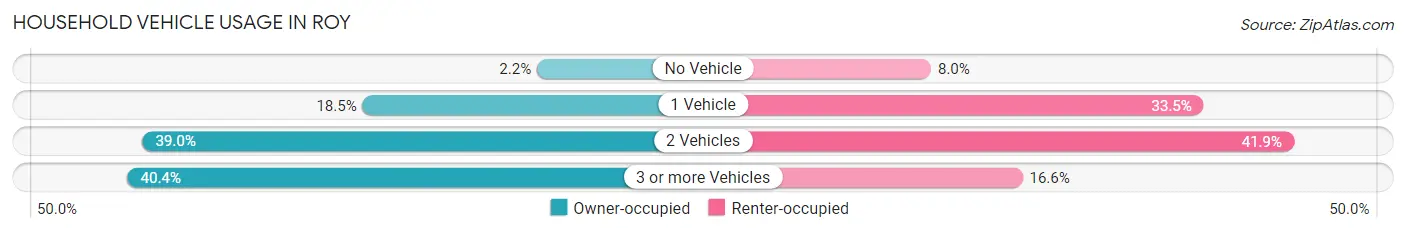
| Vehicles per Household | Owner-occupied | Renter-occupied |
| No Vehicle | 240 (2.2%) | 148 (8.0%) |
| 1 Vehicle | 2,039 (18.5%) | 616 (33.5%) |
| 2 Vehicles | 4,307 (39.0%) | 771 (41.9%) |
| 3 or more Vehicles | 4,460 (40.4%) | 305 (16.6%) |
| Total | 11,046 (100.0%) | 1,840 (100.0%) |
Real Estate & Mortgages in Roy
Real Estate and Mortgage Overview in Roy
| Characteristic | Without Mortgage | With Mortgage |
| Housing Units | 2,704 | 8,342 |
| Median Property Value | $274,500 | $316,600 |
| Median Household Income | $72,596 | $1,155 |
| Monthly Housing Costs | $459 | $211 |
| Real Estate Taxes | $1,973 | $207 |
Property Value by Mortgage Status in Roy
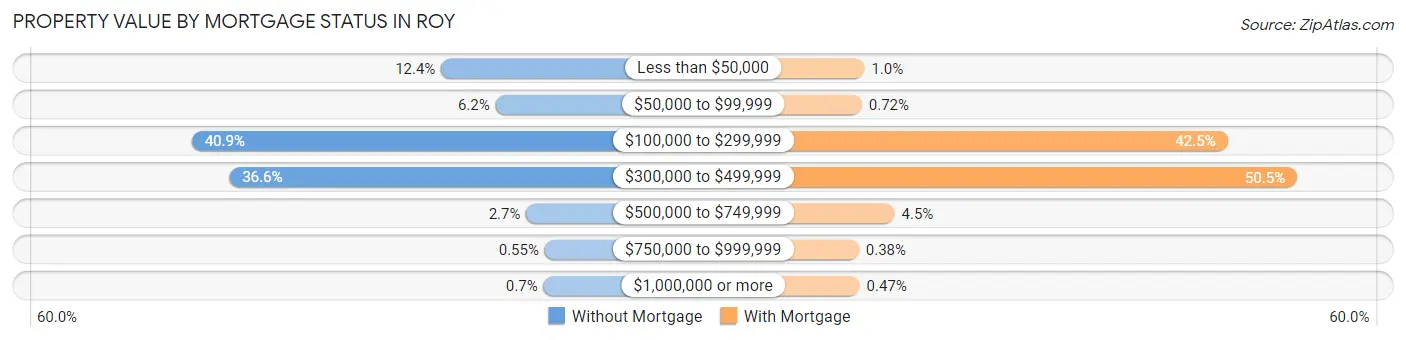
| Property Value | Without Mortgage | With Mortgage |
| Less than $50,000 | 335 (12.4%) | 85 (1.0%) |
| $50,000 to $99,999 | 167 (6.2%) | 60 (0.7%) |
| $100,000 to $299,999 | 1,106 (40.9%) | 3,545 (42.5%) |
| $300,000 to $499,999 | 990 (36.6%) | 4,209 (50.5%) |
| $500,000 to $749,999 | 72 (2.7%) | 372 (4.5%) |
| $750,000 to $999,999 | 15 (0.5%) | 32 (0.4%) |
| $1,000,000 or more | 19 (0.7%) | 39 (0.5%) |
| Total | 2,704 (100.0%) | 8,342 (100.0%) |
Household Income by Mortgage Status in Roy
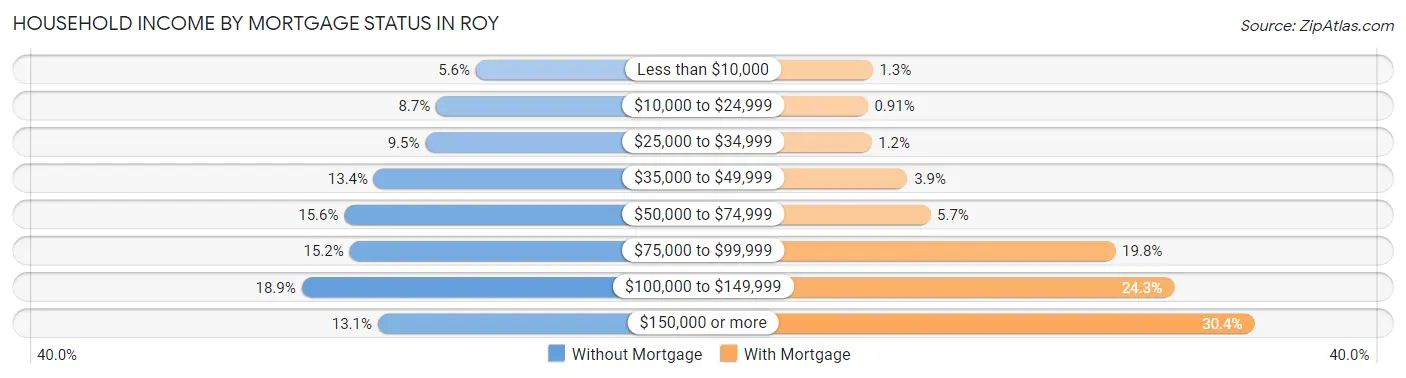
| Household Income | Without Mortgage | With Mortgage |
| Less than $10,000 | 152 (5.6%) | 108 (1.3%) |
| $10,000 to $24,999 | 234 (8.6%) | 76 (0.9%) |
| $25,000 to $34,999 | 256 (9.5%) | 100 (1.2%) |
| $35,000 to $49,999 | 362 (13.4%) | 329 (3.9%) |
| $50,000 to $74,999 | 423 (15.6%) | 474 (5.7%) |
| $75,000 to $99,999 | 412 (15.2%) | 1,650 (19.8%) |
| $100,000 to $149,999 | 511 (18.9%) | 2,024 (24.3%) |
| $150,000 or more | 354 (13.1%) | 2,534 (30.4%) |
| Total | 2,704 (100.0%) | 8,342 (100.0%) |
Property Value to Household Income Ratio in Roy
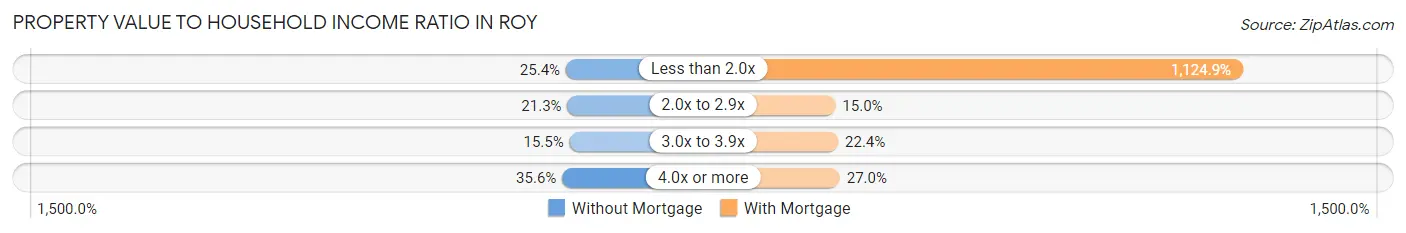
| Value-to-Income Ratio | Without Mortgage | With Mortgage |
| Less than 2.0x | 686 (25.4%) | 93,840 (1,124.9%) |
| 2.0x to 2.9x | 576 (21.3%) | 1,250 (15.0%) |
| 3.0x to 3.9x | 419 (15.5%) | 1,866 (22.4%) |
| 4.0x or more | 962 (35.6%) | 2,254 (27.0%) |
| Total | 2,704 (100.0%) | 8,342 (100.0%) |
Real Estate Taxes by Mortgage Status in Roy
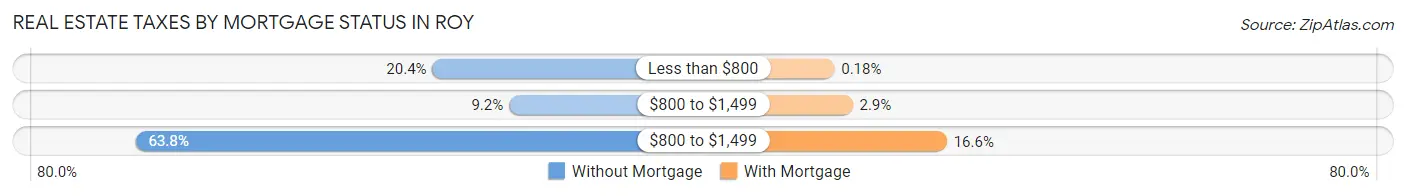
| Property Taxes | Without Mortgage | With Mortgage |
| Less than $800 | 552 (20.4%) | 15 (0.2%) |
| $800 to $1,499 | 249 (9.2%) | 238 (2.9%) |
| $800 to $1,499 | 1,725 (63.8%) | 1,386 (16.6%) |
| Total | 2,704 (100.0%) | 8,342 (100.0%) |
Health & Disability in Roy
Health Insurance Coverage by Age in Roy
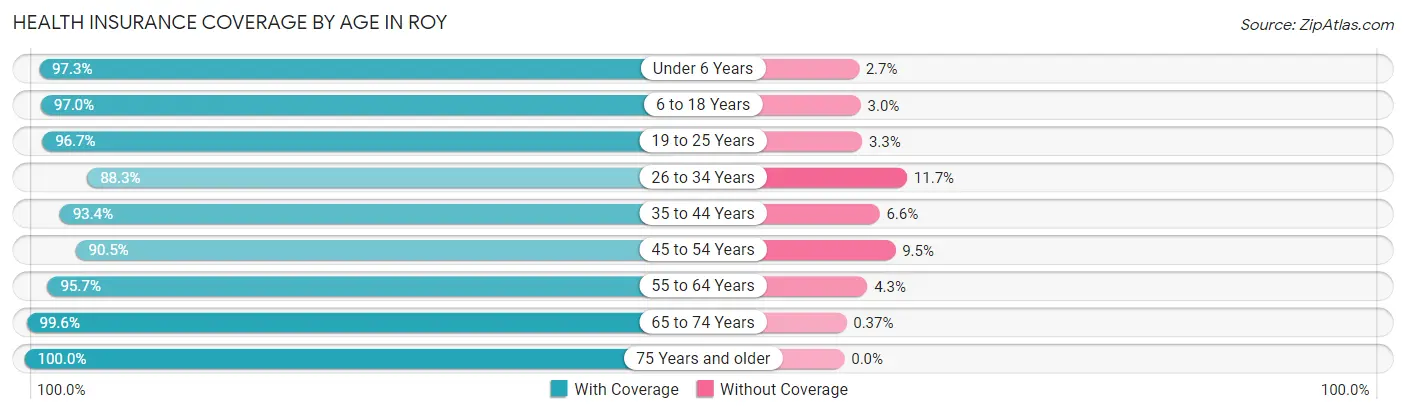
| Age Bracket | With Coverage | Without Coverage |
| Under 6 Years | 3,721 (97.3%) | 103 (2.7%) |
| 6 to 18 Years | 7,622 (97.0%) | 239 (3.0%) |
| 19 to 25 Years | 3,321 (96.7%) | 113 (3.3%) |
| 26 to 34 Years | 4,974 (88.3%) | 658 (11.7%) |
| 35 to 44 Years | 5,484 (93.4%) | 385 (6.6%) |
| 45 to 54 Years | 3,414 (90.5%) | 358 (9.5%) |
| 55 to 64 Years | 3,808 (95.7%) | 170 (4.3%) |
| 65 to 74 Years | 2,719 (99.6%) | 10 (0.4%) |
| 75 Years and older | 1,571 (100.0%) | 0 (0.0%) |
| Total | 36,634 (94.7%) | 2,036 (5.3%) |
Health Insurance Coverage by Citizenship Status in Roy
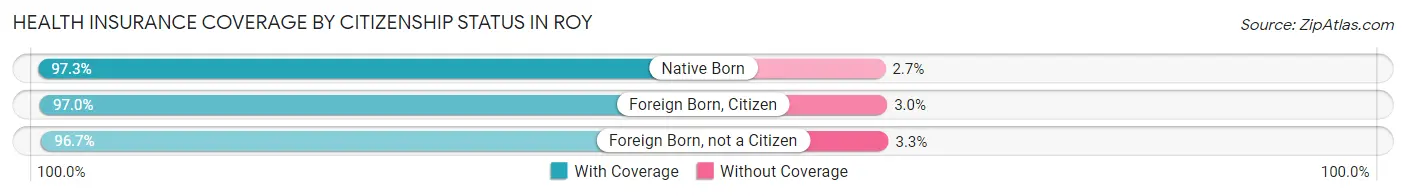
| Citizenship Status | With Coverage | Without Coverage |
| Native Born | 3,721 (97.3%) | 103 (2.7%) |
| Foreign Born, Citizen | 7,622 (97.0%) | 239 (3.0%) |
| Foreign Born, not a Citizen | 3,321 (96.7%) | 113 (3.3%) |
Health Insurance Coverage by Household Income in Roy
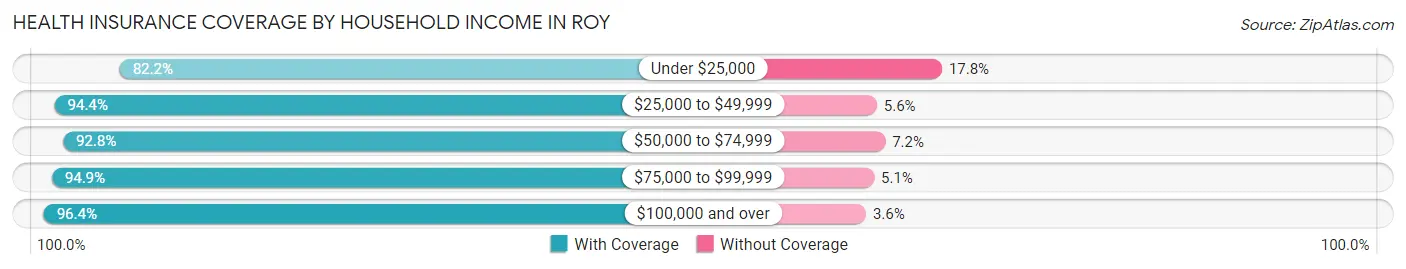
| Household Income | With Coverage | Without Coverage |
| Under $25,000 | 991 (82.2%) | 215 (17.8%) |
| $25,000 to $49,999 | 3,773 (94.4%) | 225 (5.6%) |
| $50,000 to $74,999 | 6,944 (92.8%) | 539 (7.2%) |
| $75,000 to $99,999 | 7,519 (94.9%) | 405 (5.1%) |
| $100,000 and over | 17,380 (96.4%) | 647 (3.6%) |
Public vs Private Health Insurance Coverage by Age in Roy
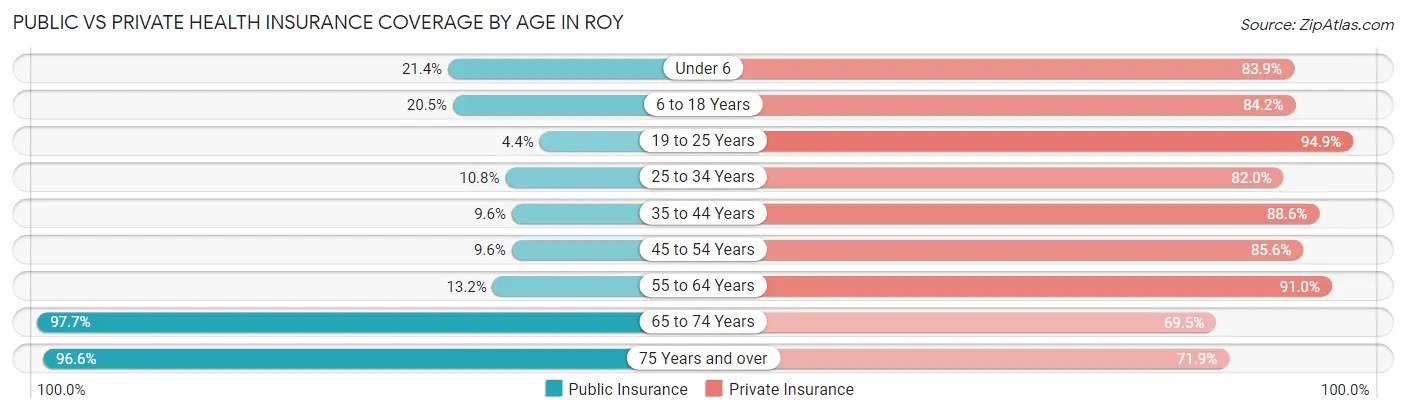
| Age Bracket | Public Insurance | Private Insurance |
| Under 6 | 819 (21.4%) | 3,208 (83.9%) |
| 6 to 18 Years | 1,612 (20.5%) | 6,616 (84.2%) |
| 19 to 25 Years | 152 (4.4%) | 3,259 (94.9%) |
| 25 to 34 Years | 607 (10.8%) | 4,618 (82.0%) |
| 35 to 44 Years | 561 (9.6%) | 5,200 (88.6%) |
| 45 to 54 Years | 363 (9.6%) | 3,229 (85.6%) |
| 55 to 64 Years | 523 (13.2%) | 3,618 (90.9%) |
| 65 to 74 Years | 2,665 (97.7%) | 1,896 (69.5%) |
| 75 Years and over | 1,517 (96.6%) | 1,129 (71.9%) |
| Total | 8,819 (22.8%) | 32,773 (84.8%) |
Disability Status by Sex by Age in Roy
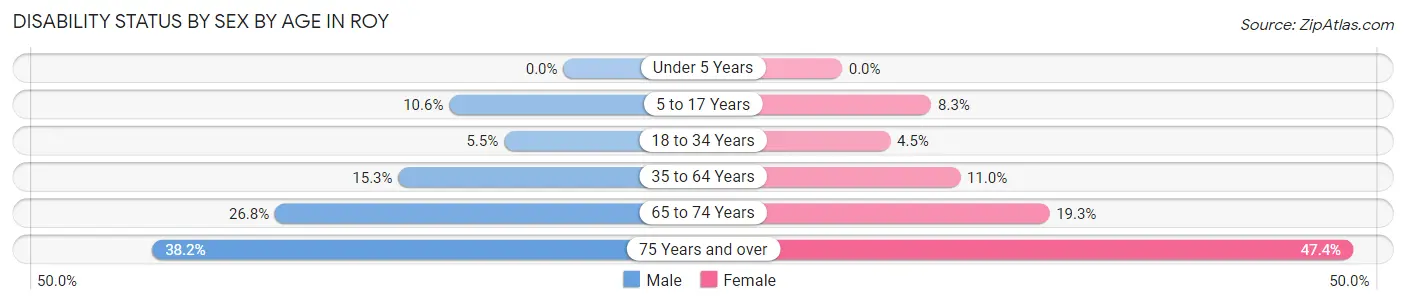
| Age Bracket | Male | Female |
| Under 5 Years | 0 (0.0%) | 0 (0.0%) |
| 5 to 17 Years | 433 (10.6%) | 327 (8.3%) |
| 18 to 34 Years | 285 (5.5%) | 201 (4.5%) |
| 35 to 64 Years | 1,054 (15.3%) | 739 (11.0%) |
| 65 to 74 Years | 330 (26.8%) | 288 (19.3%) |
| 75 Years and over | 325 (38.2%) | 341 (47.4%) |
Disability Class by Sex by Age in Roy
Disability Class: Hearing Difficulty
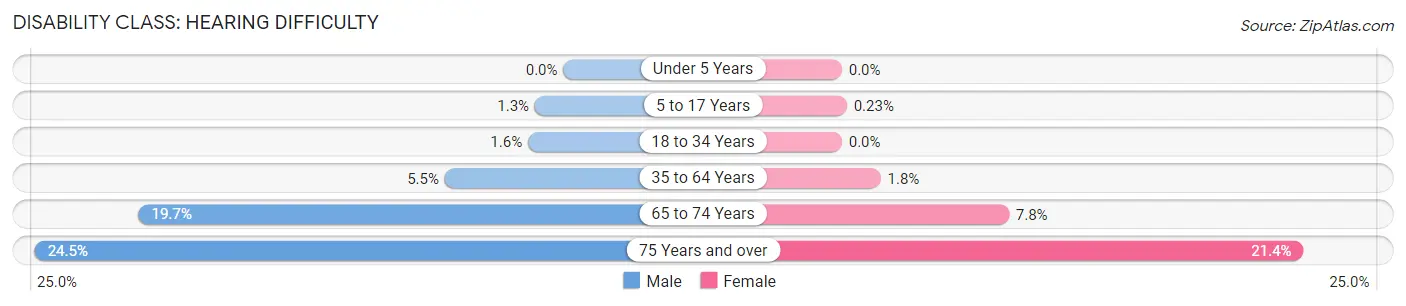
| Age Bracket | Male | Female |
| Under 5 Years | 0 (0.0%) | 0 (0.0%) |
| 5 to 17 Years | 54 (1.3%) | 9 (0.2%) |
| 18 to 34 Years | 85 (1.6%) | 0 (0.0%) |
| 35 to 64 Years | 379 (5.5%) | 121 (1.8%) |
| 65 to 74 Years | 243 (19.7%) | 116 (7.7%) |
| 75 Years and over | 209 (24.5%) | 154 (21.4%) |
Disability Class: Vision Difficulty
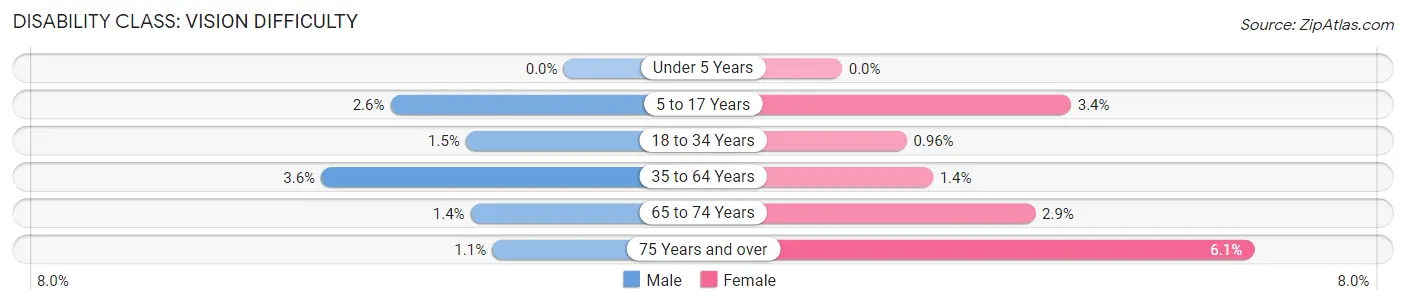
| Age Bracket | Male | Female |
| Under 5 Years | 0 (0.0%) | 0 (0.0%) |
| 5 to 17 Years | 105 (2.6%) | 134 (3.4%) |
| 18 to 34 Years | 75 (1.5%) | 43 (1.0%) |
| 35 to 64 Years | 248 (3.6%) | 91 (1.3%) |
| 65 to 74 Years | 17 (1.4%) | 43 (2.9%) |
| 75 Years and over | 9 (1.1%) | 44 (6.1%) |
Disability Class: Cognitive Difficulty
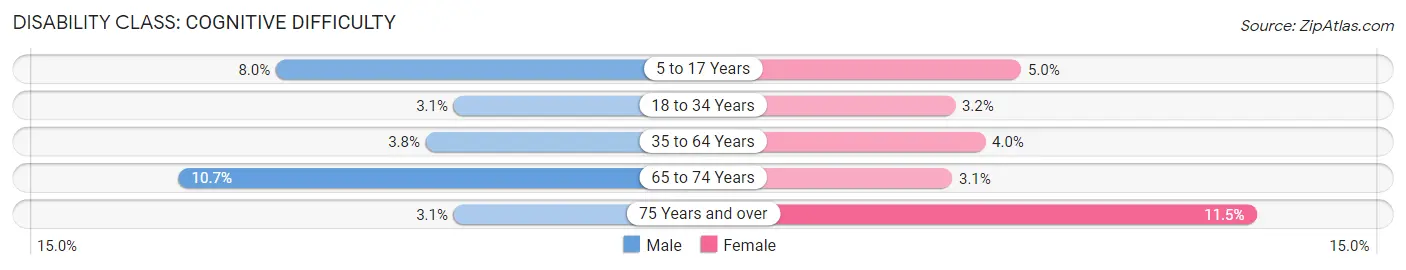
| Age Bracket | Male | Female |
| 5 to 17 Years | 327 (8.0%) | 197 (5.0%) |
| 18 to 34 Years | 158 (3.0%) | 141 (3.2%) |
| 35 to 64 Years | 264 (3.8%) | 269 (4.0%) |
| 65 to 74 Years | 132 (10.7%) | 46 (3.1%) |
| 75 Years and over | 26 (3.0%) | 83 (11.5%) |
Disability Class: Ambulatory Difficulty
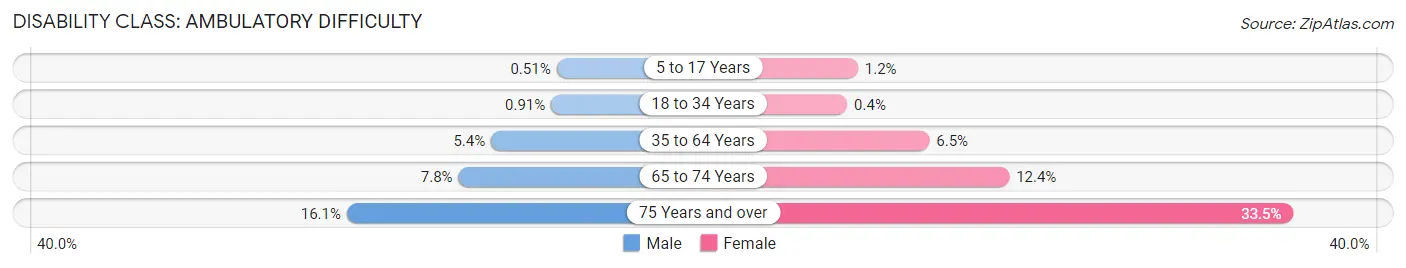
| Age Bracket | Male | Female |
| 5 to 17 Years | 21 (0.5%) | 47 (1.2%) |
| 18 to 34 Years | 47 (0.9%) | 18 (0.4%) |
| 35 to 64 Years | 370 (5.4%) | 438 (6.5%) |
| 65 to 74 Years | 96 (7.8%) | 186 (12.4%) |
| 75 Years and over | 137 (16.1%) | 241 (33.5%) |
Disability Class: Self-Care Difficulty
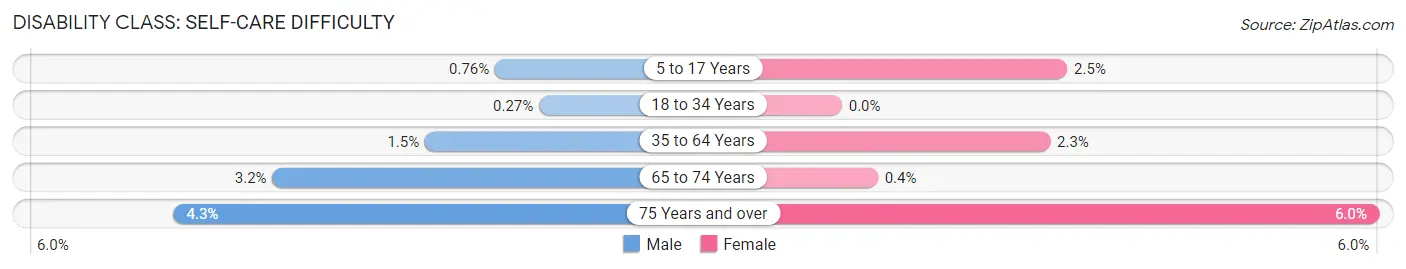
| Age Bracket | Male | Female |
| 5 to 17 Years | 31 (0.8%) | 99 (2.5%) |
| 18 to 34 Years | 14 (0.3%) | 0 (0.0%) |
| 35 to 64 Years | 106 (1.5%) | 156 (2.3%) |
| 65 to 74 Years | 40 (3.2%) | 6 (0.4%) |
| 75 Years and over | 37 (4.3%) | 43 (6.0%) |
Technology Access in Roy
Computing Device Access in Roy
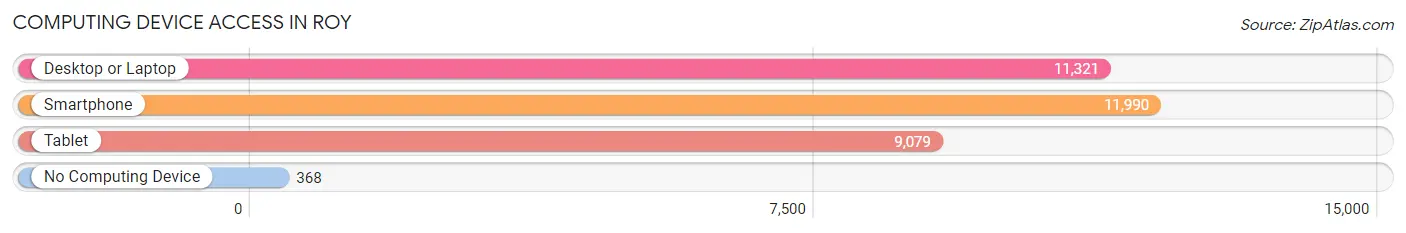
| Device Type | # Households | % Households |
| Desktop or Laptop | 11,321 | 87.9% |
| Smartphone | 11,990 | 93.0% |
| Tablet | 9,079 | 70.5% |
| No Computing Device | 368 | 2.9% |
| Total | 12,886 | 100.0% |
Internet Access in Roy
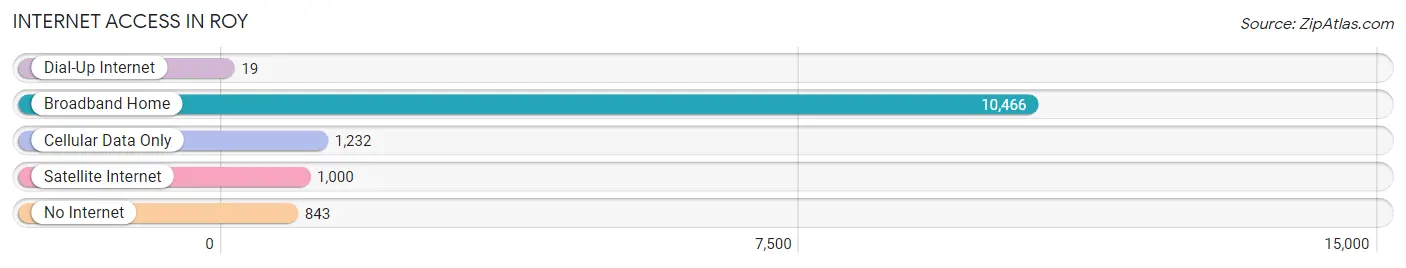
| Internet Type | # Households | % Households |
| Dial-Up Internet | 19 | 0.2% |
| Broadband Home | 10,466 | 81.2% |
| Cellular Data Only | 1,232 | 9.6% |
| Satellite Internet | 1,000 | 7.8% |
| No Internet | 843 | 6.5% |
| Total | 12,886 | 100.0% |
Roy Summary
The state of Utah is located in the western United States and is bordered by Idaho, Wyoming, Colorado, Arizona, and Nevada. It is the 13th largest state in the United States and the 11th most populous. Utah is known for its diverse geography, ranging from the Great Salt Lake in the north to the red rock canyons of the south. It is also home to the highest point in the contiguous United States, Kings Peak, which stands at 13,534 feet.
Geography
Utah is divided into three distinct geographic regions: the Great Basin, the Colorado Plateau, and the Rocky Mountains. The Great Basin is located in the western part of the state and is characterized by its arid climate and vast salt flats. The Colorado Plateau is located in the central and southeastern parts of the state and is characterized by its red rock canyons and mesas. The Rocky Mountains are located in the northeastern part of the state and are characterized by their high elevation and snow-capped peaks.
Economy
Utah’s economy is largely driven by its tourism industry, which is the largest in the state. Tourism is responsible for over $7 billion in economic activity each year. Other major industries in the state include mining, manufacturing, and agriculture. Mining is the largest industry in the state, accounting for over $2 billion in economic activity each year. Manufacturing is the second largest industry in the state, accounting for over $1 billion in economic activity each year. Agriculture is the third largest industry in the state, accounting for over $500 million in economic activity each year.
Demographics
As of 2020, the population of Utah was estimated to be 3.2 million. The majority of the population is white (78.2%), followed by Hispanic or Latino (13.2%), and Asian (2.7%). The median age in the state is 30.7 years, and the median household income is $68,824. The largest cities in the state are Salt Lake City, West Valley City, Provo, West Jordan, and Orem.
Conclusion
Utah is a state with a diverse geography, economy, and population. It is home to the highest point in the contiguous United States, and its economy is largely driven by its tourism industry. The population of the state is largely white, with a median age of 30.7 years and a median household income of $68,824. Utah is a unique and beautiful state with much to offer its residents and visitors alike.
Common Questions
What is Per Capita Income in Roy?
Per Capita income in Roy is $32,241.
What is the Median Family Income in Roy?
Median Family Income in Roy is $89,616.
What is the Median Household income in Roy?
Median Household Income in Roy is $83,959.
What is Income or Wage Gap in Roy?
Income or Wage Gap in Roy is 39.1%.
Women in Roy earn 60.9 cents for every dollar earned by a man.
What is Inequality or Gini Index in Roy?
Inequality or Gini Index in Roy is 0.32.
What is the Total Population of Roy?
Total Population of Roy is 39,064.
What is the Total Male Population of Roy?
Total Male Population of Roy is 19,975.
What is the Total Female Population of Roy?
Total Female Population of Roy is 19,089.
What is the Ratio of Males per 100 Females in Roy?
There are 104.64 Males per 100 Females in Roy.
What is the Ratio of Females per 100 Males in Roy?
There are 95.56 Females per 100 Males in Roy.
What is the Median Population Age in Roy?
Median Population Age in Roy is 32.7 Years.
What is the Average Family Size in Roy
Average Family Size in Roy is 3.4 People.
What is the Average Household Size in Roy
Average Household Size in Roy is 3.0 People.
How Large is the Labor Force in Roy?
There are 20,956 People in the Labor Forcein in Roy.
What is the Percentage of People in the Labor Force in Roy?
72.4% of People are in the Labor Force in Roy.
What is the Unemployment Rate in Roy?
Unemployment Rate in Roy is 2.6%.