Norfolk, NE Map & Demographics
Norfolk Map
Norfolk Overview
$35,657
PER CAPITA INCOME
$85,107
AVG FAMILY INCOME
$57,479
AVG HOUSEHOLD INCOME
29.7%
WAGE / INCOME GAP [ % ]
70.3¢/ $1
WAGE / INCOME GAP [ $ ]
$12,039
FAMILY INCOME DEFICIT
0.49
INEQUALITY / GINI INDEX
25,883
TOTAL POPULATION
12,832
MALE POPULATION
13,051
FEMALE POPULATION
98.32
MALES / 100 FEMALES
101.71
FEMALES / 100 MALES
36.8
MEDIAN AGE
3.2
AVG FAMILY SIZE
2.4
AVG HOUSEHOLD SIZE
13,770
LABOR FORCE [ PEOPLE ]
68.1%
PERCENT IN LABOR FORCE
2.6%
UNEMPLOYMENT RATE
Norfolk Zip Codes
Norfolk Area Codes
Income in Norfolk
Income Overview in Norfolk
Per Capita Income in Norfolk is $35,657, while median incomes of families and households are $85,107 and $57,479 respectively.
| Characteristic | Number | Measure |
| Per Capita Income | 25,883 | $35,657 |
| Median Family Income | 6,038 | $85,107 |
| Mean Family Income | 6,038 | $107,215 |
| Median Household Income | 10,660 | $57,479 |
| Mean Household Income | 10,660 | $82,758 |
| Income Deficit | 6,038 | $12,039 |
| Wage / Income Gap (%) | 25,883 | 29.67% |
| Wage / Income Gap ($) | 25,883 | 70.33¢ per $1 |
| Gini / Inequality Index | 25,883 | 0.49 |
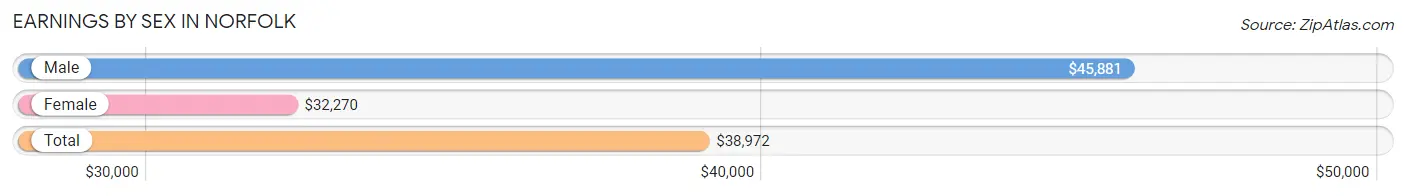
Earnings by Sex in Norfolk
Average Earnings in Norfolk are $38,972, $45,881 for men and $32,270 for women, a difference of 29.7%.
| Sex | Number | Average Earnings |
| Male | 7,391 (51.5%) | $45,881 |
| Female | 6,971 (48.5%) | $32,270 |
| Total | 14,362 (100.0%) | $38,972 |
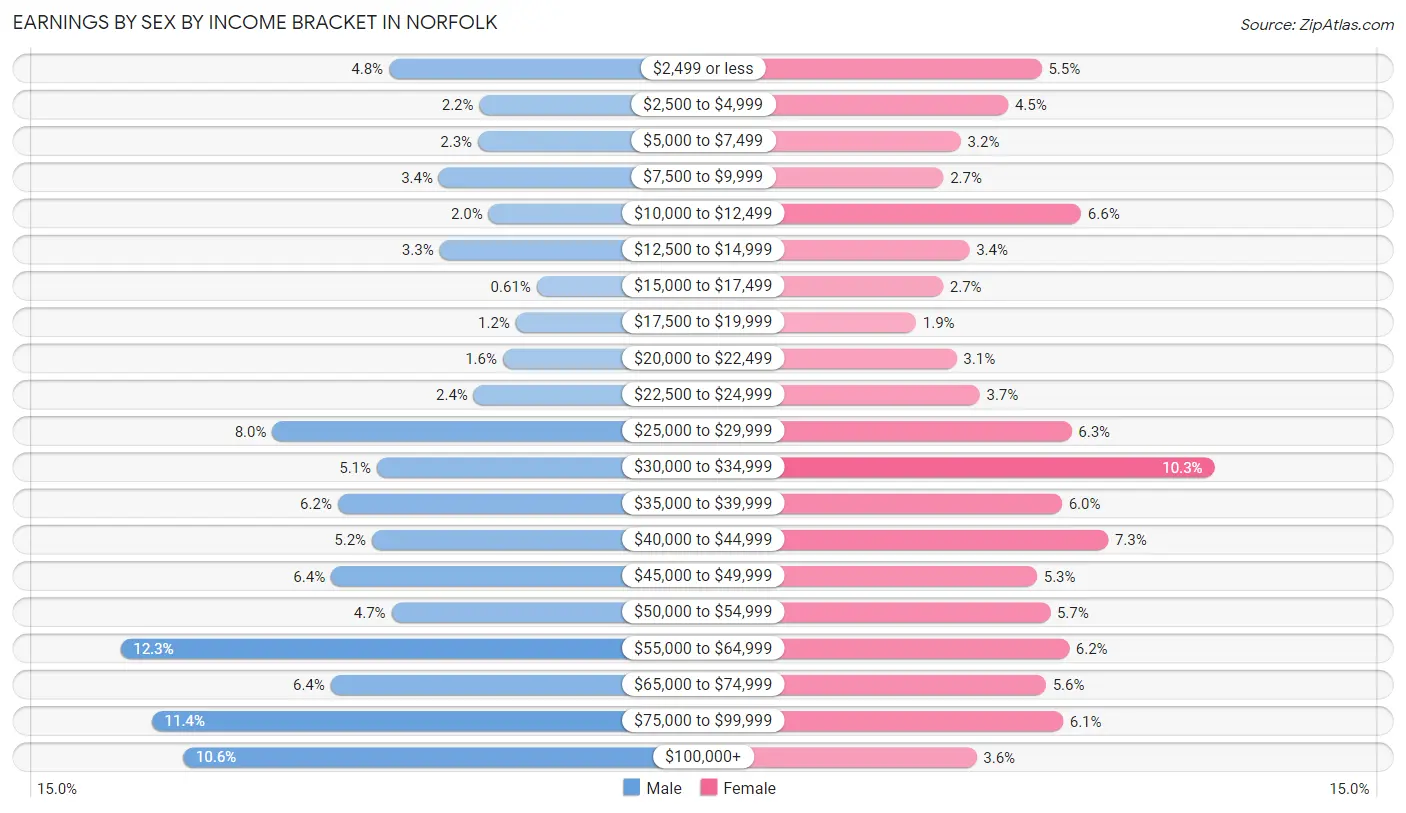
Earnings by Sex by Income Bracket in Norfolk
The most common earnings brackets in Norfolk are $55,000 to $64,999 for men (910 | 12.3%) and $30,000 to $34,999 for women (720 | 10.3%).
| Income | Male | Female |
| $2,499 or less | 352 (4.8%) | 381 (5.5%) |
| $2,500 to $4,999 | 164 (2.2%) | 316 (4.5%) |
| $5,000 to $7,499 | 167 (2.3%) | 223 (3.2%) |
| $7,500 to $9,999 | 248 (3.4%) | 189 (2.7%) |
| $10,000 to $12,499 | 145 (2.0%) | 459 (6.6%) |
| $12,500 to $14,999 | 247 (3.3%) | 240 (3.4%) |
| $15,000 to $17,499 | 45 (0.6%) | 188 (2.7%) |
| $17,500 to $19,999 | 89 (1.2%) | 135 (1.9%) |
| $20,000 to $22,499 | 115 (1.6%) | 215 (3.1%) |
| $22,500 to $24,999 | 176 (2.4%) | 260 (3.7%) |
| $25,000 to $29,999 | 594 (8.0%) | 440 (6.3%) |
| $30,000 to $34,999 | 377 (5.1%) | 720 (10.3%) |
| $35,000 to $39,999 | 458 (6.2%) | 421 (6.0%) |
| $40,000 to $44,999 | 387 (5.2%) | 512 (7.3%) |
| $45,000 to $49,999 | 472 (6.4%) | 372 (5.3%) |
| $50,000 to $54,999 | 347 (4.7%) | 398 (5.7%) |
| $55,000 to $64,999 | 910 (12.3%) | 435 (6.2%) |
| $65,000 to $74,999 | 473 (6.4%) | 390 (5.6%) |
| $75,000 to $99,999 | 845 (11.4%) | 423 (6.1%) |
| $100,000+ | 780 (10.5%) | 254 (3.6%) |
| Total | 7,391 (100.0%) | 6,971 (100.0%) |
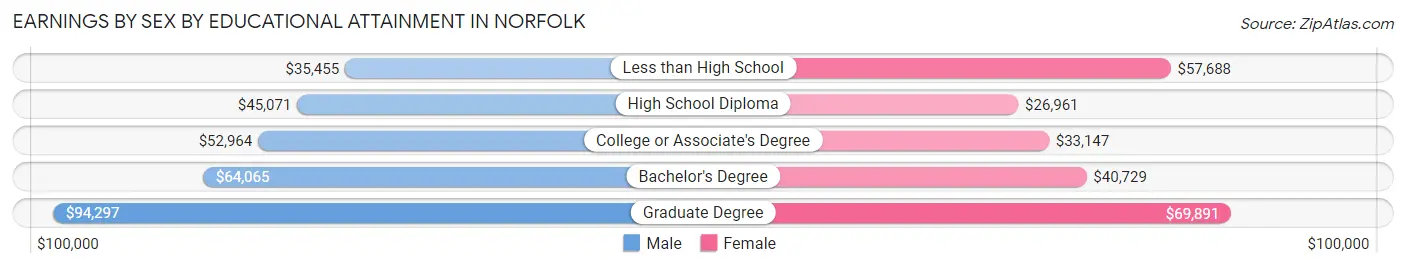
Earnings by Sex by Educational Attainment in Norfolk
Average earnings in Norfolk are $52,384 for men and $37,642 for women, a difference of 28.1%. Men with an educational attainment of graduate degree enjoy the highest average annual earnings of $94,297, while those with less than high school education earn the least with $35,455. Women with an educational attainment of graduate degree earn the most with the average annual earnings of $69,891, while those with high school diploma education have the smallest earnings of $26,961.
| Educational Attainment | Male Income | Female Income |
| Less than High School | $35,455 | $57,688 |
| High School Diploma | $45,071 | $26,961 |
| College or Associate's Degree | $52,964 | $33,147 |
| Bachelor's Degree | $64,065 | $40,729 |
| Graduate Degree | $94,297 | $69,891 |
| Total | $52,384 | $37,642 |
Family Income in Norfolk
Family Income Brackets in Norfolk
According to the Norfolk family income data, there are 1,473 families falling into the $100,000 to $149,999 income range, which is the most common income bracket and makes up 24.4% of all families. Conversely, the $10,000 to $14,999 income bracket is the least frequent group with only 42 families (0.7%) belonging to this category.
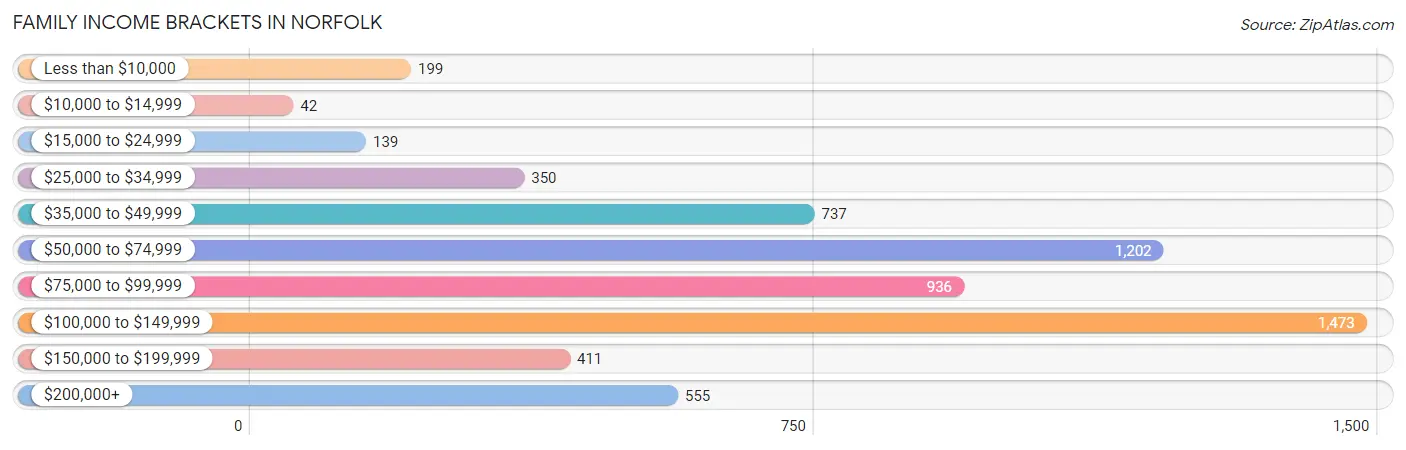
| Income Bracket | # Families | % Families |
| Less than $10,000 | 199 | 3.3% |
| $10,000 to $14,999 | 42 | 0.7% |
| $15,000 to $24,999 | 139 | 2.3% |
| $25,000 to $34,999 | 350 | 5.8% |
| $35,000 to $49,999 | 737 | 12.2% |
| $50,000 to $74,999 | 1,202 | 19.9% |
| $75,000 to $99,999 | 936 | 15.5% |
| $100,000 to $149,999 | 1,473 | 24.4% |
| $150,000 to $199,999 | 411 | 6.8% |
| $200,000+ | 555 | 9.2% |
Family Income by Famaliy Size in Norfolk
6-person families (163 | 2.7%) account for the highest median family income in Norfolk with $142,969 per family, while 2-person families (3,328 | 55.1%) have the highest median income of $38,654 per family member.
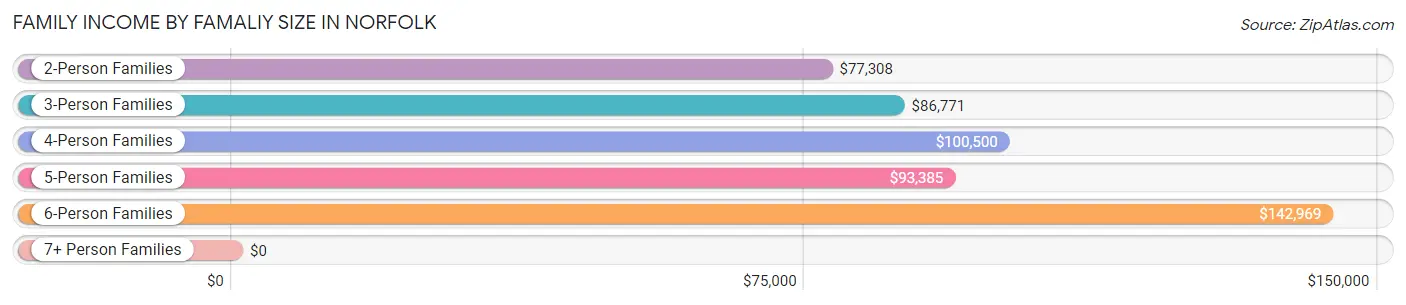
| Income Bracket | # Families | Median Income |
| 2-Person Families | 3,328 (55.1%) | $77,308 |
| 3-Person Families | 973 (16.1%) | $86,771 |
| 4-Person Families | 960 (15.9%) | $100,500 |
| 5-Person Families | 607 (10.1%) | $93,385 |
| 6-Person Families | 163 (2.7%) | $142,969 |
| 7+ Person Families | 7 (0.1%) | $0 |
| Total | 6,038 (100.0%) | $85,107 |
Family Income by Number of Earners in Norfolk
The median family income in Norfolk is $85,107, with families comprising 3+ earners (446) having the highest median family income of $123,971, while families with no earners (789) have the lowest median family income of $44,815, accounting for 7.4% and 13.1% of families, respectively.
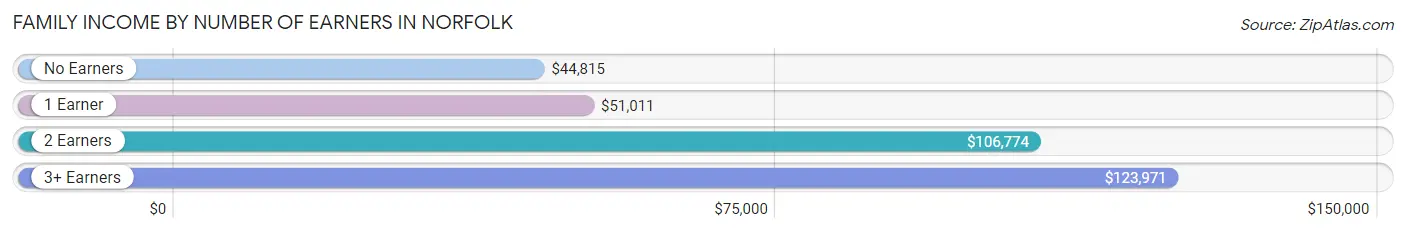
| Number of Earners | # Families | Median Income |
| No Earners | 789 (13.1%) | $44,815 |
| 1 Earner | 1,664 (27.6%) | $51,011 |
| 2 Earners | 3,139 (52.0%) | $106,774 |
| 3+ Earners | 446 (7.4%) | $123,971 |
| Total | 6,038 (100.0%) | $85,107 |
Household Income in Norfolk
Household Income Brackets in Norfolk
With 2,004 households falling in the category, the $50,000 to $74,999 income range is the most frequent in Norfolk, accounting for 18.8% of all households. In contrast, only 448 households (4.2%) fall into the $10,000 to $14,999 income bracket, making it the least populous group.
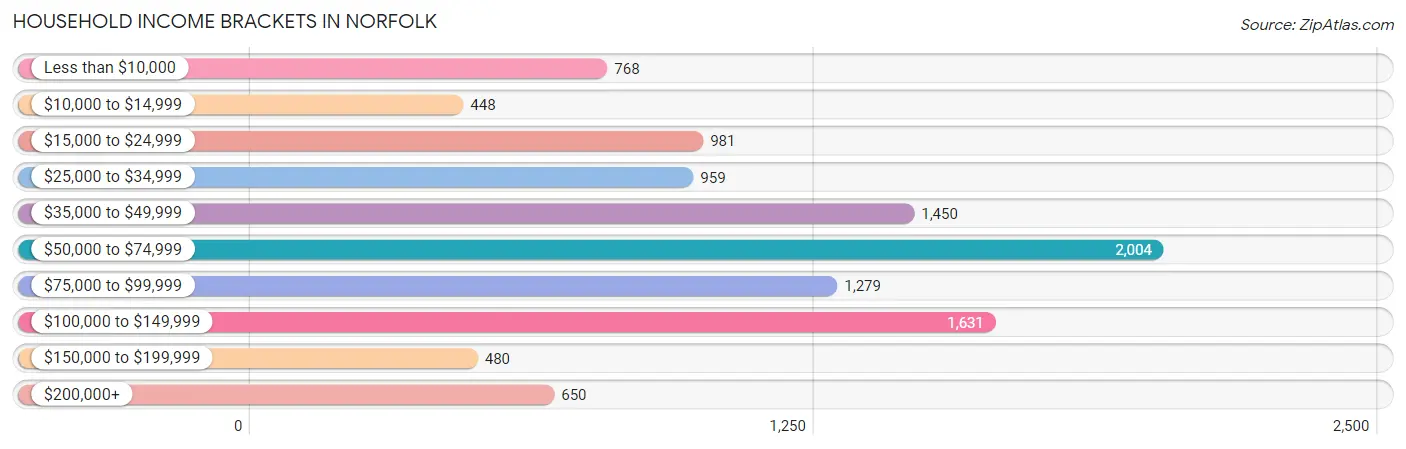
| Income Bracket | # Households | % Households |
| Less than $10,000 | 768 | 7.2% |
| $10,000 to $14,999 | 448 | 4.2% |
| $15,000 to $24,999 | 981 | 9.2% |
| $25,000 to $34,999 | 959 | 9.0% |
| $35,000 to $49,999 | 1,450 | 13.6% |
| $50,000 to $74,999 | 2,004 | 18.8% |
| $75,000 to $99,999 | 1,279 | 12.0% |
| $100,000 to $149,999 | 1,631 | 15.3% |
| $150,000 to $199,999 | 480 | 4.5% |
| $200,000+ | 650 | 6.1% |
Household Income by Householder Age in Norfolk
The median household income in Norfolk is $57,479, with the highest median household income of $70,299 found in the 25 to 44 years age bracket for the primary householder. A total of 3,324 households (31.2%) fall into this category. Meanwhile, the 15 to 24 years age bracket for the primary householder has the lowest median household income of $34,524, with 1,062 households (10.0%) in this group.
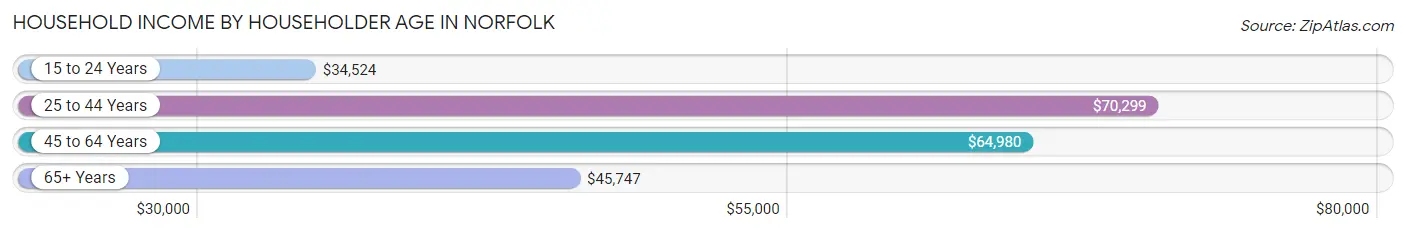
| Income Bracket | # Households | Median Income |
| 15 to 24 Years | 1,062 (10.0%) | $34,524 |
| 25 to 44 Years | 3,324 (31.2%) | $70,299 |
| 45 to 64 Years | 3,729 (35.0%) | $64,980 |
| 65+ Years | 2,545 (23.9%) | $45,747 |
| Total | 10,660 (100.0%) | $57,479 |
Poverty in Norfolk
Income Below Poverty by Sex and Age in Norfolk
With 12.5% poverty level for males and 13.3% for females among the residents of Norfolk, 5 year old males and 15 year old females are the most vulnerable to poverty, with 142 males (42.9%) and 48 females (27.4%) in their respective age groups living below the poverty level.
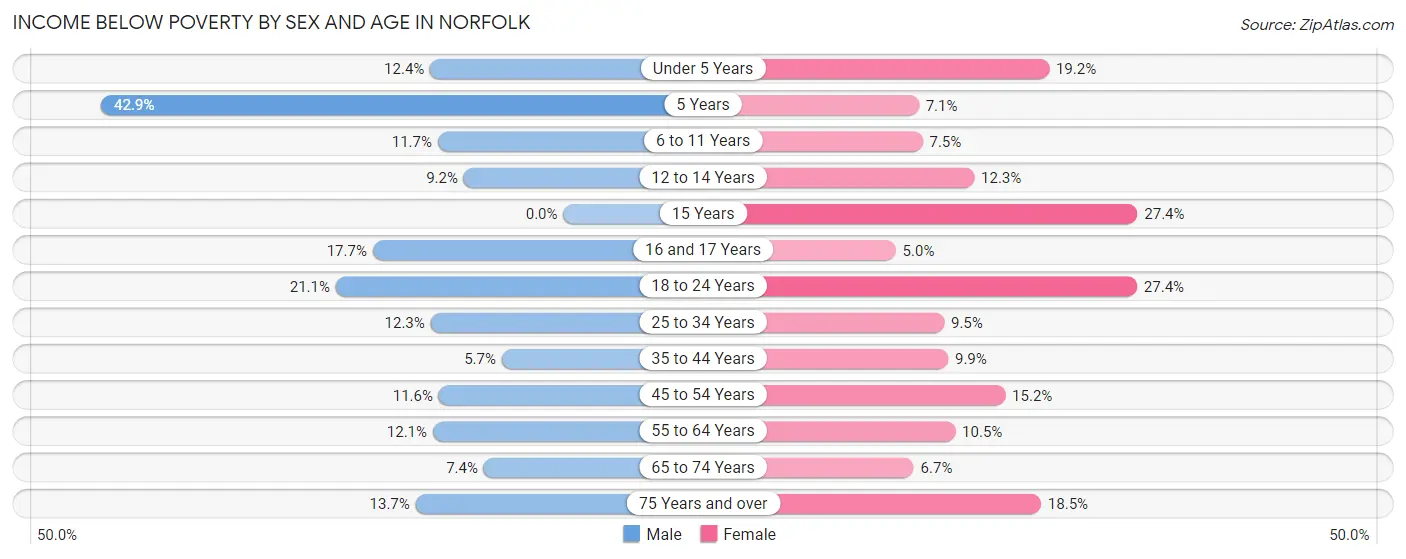
| Age Bracket | Male | Female |
| Under 5 Years | 111 (12.4%) | 169 (19.2%) |
| 5 Years | 142 (42.9%) | 13 (7.1%) |
| 6 to 11 Years | 101 (11.7%) | 81 (7.5%) |
| 12 to 14 Years | 55 (9.2%) | 57 (12.3%) |
| 15 Years | 0 (0.0%) | 48 (27.4%) |
| 16 and 17 Years | 52 (17.7%) | 14 (5.0%) |
| 18 to 24 Years | 245 (21.1%) | 347 (27.4%) |
| 25 to 34 Years | 211 (12.3%) | 154 (9.5%) |
| 35 to 44 Years | 90 (5.7%) | 146 (9.9%) |
| 45 to 54 Years | 161 (11.6%) | 209 (15.2%) |
| 55 to 64 Years | 228 (12.1%) | 177 (10.5%) |
| 65 to 74 Years | 72 (7.4%) | 76 (6.7%) |
| 75 Years and over | 89 (13.7%) | 197 (18.5%) |
| Total | 1,557 (12.5%) | 1,688 (13.3%) |
Income Above Poverty by Sex and Age in Norfolk
According to the poverty statistics in Norfolk, males aged 15 years and females aged 16 and 17 years are the age groups that are most secure financially, with 100.0% of males and 95.0% of females in these age groups living above the poverty line.
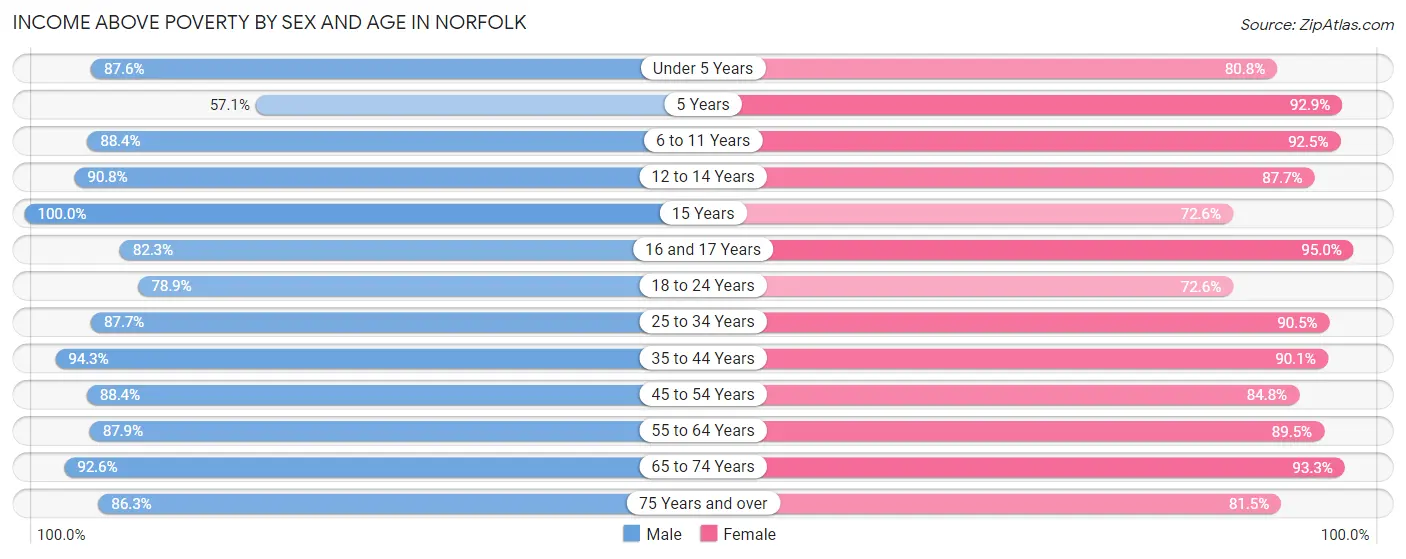
| Age Bracket | Male | Female |
| Under 5 Years | 787 (87.6%) | 710 (80.8%) |
| 5 Years | 189 (57.1%) | 169 (92.9%) |
| 6 to 11 Years | 766 (88.3%) | 1,001 (92.5%) |
| 12 to 14 Years | 540 (90.8%) | 407 (87.7%) |
| 15 Years | 115 (100.0%) | 127 (72.6%) |
| 16 and 17 Years | 242 (82.3%) | 266 (95.0%) |
| 18 to 24 Years | 915 (78.9%) | 920 (72.6%) |
| 25 to 34 Years | 1,501 (87.7%) | 1,468 (90.5%) |
| 35 to 44 Years | 1,486 (94.3%) | 1,335 (90.1%) |
| 45 to 54 Years | 1,232 (88.4%) | 1,170 (84.8%) |
| 55 to 64 Years | 1,654 (87.9%) | 1,505 (89.5%) |
| 65 to 74 Years | 903 (92.6%) | 1,063 (93.3%) |
| 75 Years and over | 560 (86.3%) | 869 (81.5%) |
| Total | 10,890 (87.5%) | 11,010 (86.7%) |
Income Below Poverty Among Married-Couple Families in Norfolk
The poverty statistics for married-couple families in Norfolk show that 2.9% or 135 of the total 4,651 families live below the poverty line. Families with 3 or 4 children have the highest poverty rate of 4.2%, comprising of 24 families. On the other hand, families with 5 or more children have the lowest poverty rate of 0.0%, which includes 0 families.
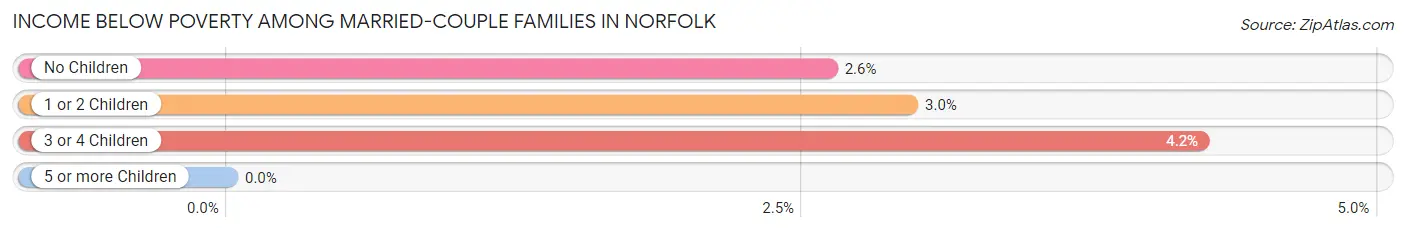
| Children | Above Poverty | Below Poverty |
| No Children | 2,757 (97.4%) | 74 (2.6%) |
| 1 or 2 Children | 1,212 (97.0%) | 37 (3.0%) |
| 3 or 4 Children | 544 (95.8%) | 24 (4.2%) |
| 5 or more Children | 3 (100.0%) | 0 (0.0%) |
| Total | 4,516 (97.1%) | 135 (2.9%) |
Income Below Poverty Among Single-Parent Households in Norfolk
According to the poverty data in Norfolk, 9.0% or 29 single-father households and 22.0% or 234 single-mother households are living below the poverty line. Among single-father households, those with no children have the highest poverty rate, with 26 households (16.6%) experiencing poverty. Likewise, among single-mother households, those with 3 or 4 children have the highest poverty rate, with 110 households (46.6%) falling below the poverty line.
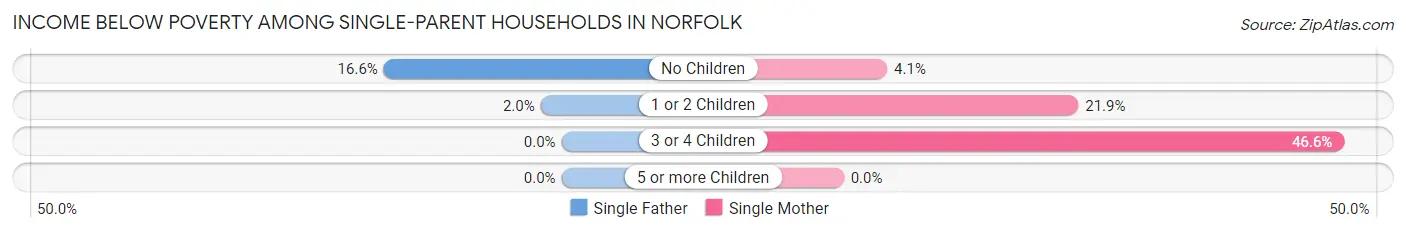
| Children | Single Father | Single Mother |
| No Children | 26 (16.6%) | 13 (4.1%) |
| 1 or 2 Children | 3 (1.9%) | 111 (21.8%) |
| 3 or 4 Children | 0 (0.0%) | 110 (46.6%) |
| 5 or more Children | 0 (0.0%) | 0 (0.0%) |
| Total | 29 (9.0%) | 234 (22.0%) |
Income Below Poverty Among Married-Couple vs Single-Parent Households in Norfolk
The poverty data for Norfolk shows that 135 of the married-couple family households (2.9%) and 263 of the single-parent households (19.0%) are living below the poverty level. Within the married-couple family households, those with 3 or 4 children have the highest poverty rate, with 24 households (4.2%) falling below the poverty line. Among the single-parent households, those with 3 or 4 children have the highest poverty rate, with 110 household (44.5%) living below poverty.
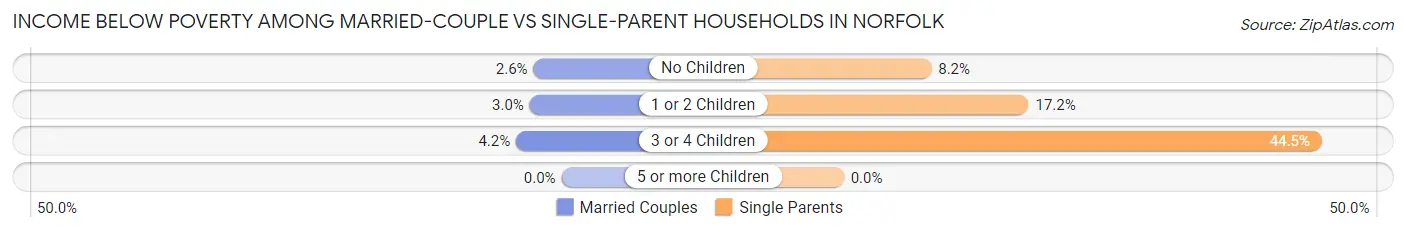
| Children | Married-Couple Families | Single-Parent Households |
| No Children | 74 (2.6%) | 39 (8.2%) |
| 1 or 2 Children | 37 (3.0%) | 114 (17.2%) |
| 3 or 4 Children | 24 (4.2%) | 110 (44.5%) |
| 5 or more Children | 0 (0.0%) | 0 (0.0%) |
| Total | 135 (2.9%) | 263 (19.0%) |
Race in Norfolk
The most populous races in Norfolk are White / Caucasian (21,833 | 84.4%), Hispanic or Latino (3,690 | 14.3%), and Two or more Races (2,165 | 8.4%).
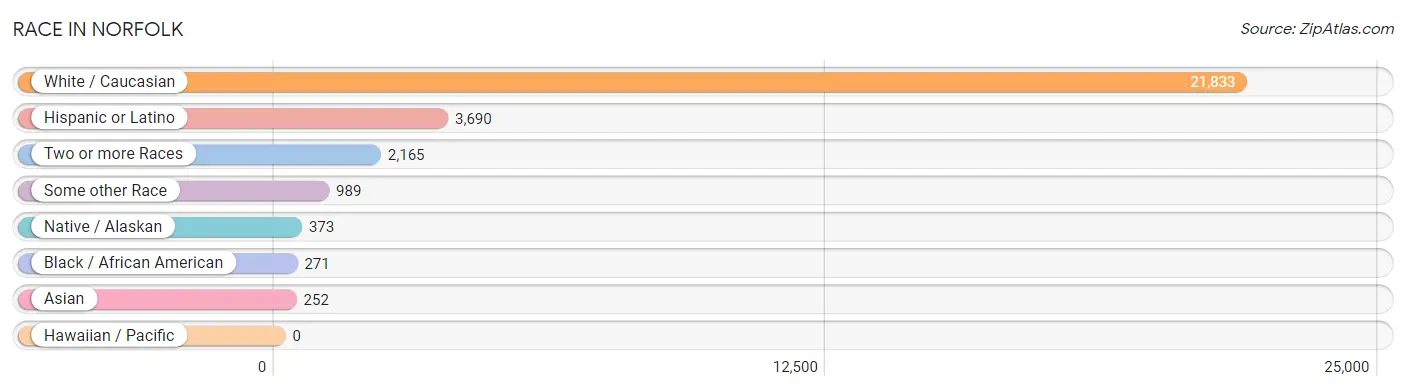
| Race | # Population | % Population |
| Asian | 252 | 1.0% |
| Black / African American | 271 | 1.1% |
| Hawaiian / Pacific | 0 | 0.0% |
| Hispanic or Latino | 3,690 | 14.3% |
| Native / Alaskan | 373 | 1.4% |
| White / Caucasian | 21,833 | 84.4% |
| Two or more Races | 2,165 | 8.4% |
| Some other Race | 989 | 3.8% |
| Total | 25,883 | 100.0% |
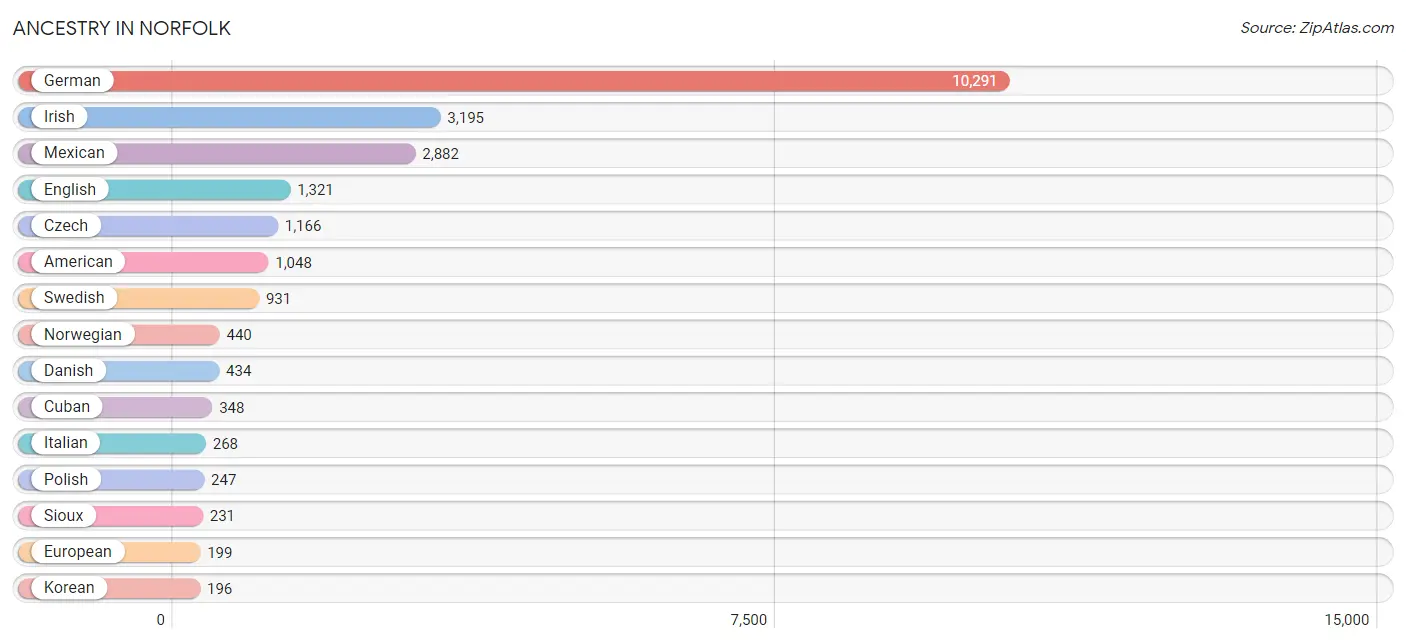
Ancestry in Norfolk
The most populous ancestries reported in Norfolk are German (10,291 | 39.8%), Irish (3,195 | 12.3%), Mexican (2,882 | 11.1%), English (1,321 | 5.1%), and Czech (1,166 | 4.5%), together accounting for 72.8% of all Norfolk residents.
| Ancestry | # Population | % Population |
| African | 37 | 0.1% |
| American | 1,048 | 4.1% |
| Arab | 66 | 0.3% |
| Armenian | 7 | 0.0% |
| Austrian | 21 | 0.1% |
| Belgian | 6 | 0.0% |
| British | 84 | 0.3% |
| Burmese | 144 | 0.6% |
| Central American | 105 | 0.4% |
| Cherokee | 14 | 0.1% |
| Colombian | 18 | 0.1% |
| Cuban | 348 | 1.3% |
| Czech | 1,166 | 4.5% |
| Czechoslovakian | 108 | 0.4% |
| Danish | 434 | 1.7% |
| Dominican | 91 | 0.4% |
| Dutch | 119 | 0.5% |
| Eastern European | 14 | 0.1% |
| English | 1,321 | 5.1% |
| European | 199 | 0.8% |
| French | 178 | 0.7% |
| French Canadian | 64 | 0.3% |
| German | 10,291 | 39.8% |
| Greek | 56 | 0.2% |
| Guatemalan | 21 | 0.1% |
| Haitian | 50 | 0.2% |
| Hungarian | 29 | 0.1% |
| Indian (Asian) | 79 | 0.3% |
| Indonesian | 93 | 0.4% |
| Irish | 3,195 | 12.3% |
| Israeli | 11 | 0.0% |
| Italian | 268 | 1.0% |
| Jamaican | 9 | 0.0% |
| Kenyan | 9 | 0.0% |
| Korean | 196 | 0.8% |
| Laotian | 30 | 0.1% |
| Lebanese | 66 | 0.3% |
| Lithuanian | 100 | 0.4% |
| Mexican | 2,882 | 11.1% |
| Norwegian | 440 | 1.7% |
| Panamanian | 30 | 0.1% |
| Pennsylvania German | 18 | 0.1% |
| Polish | 247 | 0.9% |
| Puerto Rican | 47 | 0.2% |
| Russian | 125 | 0.5% |
| Salvadoran | 54 | 0.2% |
| Samoan | 116 | 0.4% |
| Scandinavian | 75 | 0.3% |
| Scotch-Irish | 107 | 0.4% |
| Scottish | 165 | 0.6% |
| Serbian | 13 | 0.1% |
| Sioux | 231 | 0.9% |
| Slavic | 23 | 0.1% |
| South American | 36 | 0.1% |
| Spaniard | 2 | 0.0% |
| Spanish | 6 | 0.0% |
| Sri Lankan | 47 | 0.2% |
| Subsaharan African | 42 | 0.2% |
| Sudanese | 5 | 0.0% |
| Swedish | 931 | 3.6% |
| Swiss | 70 | 0.3% |
| Thai | 11 | 0.0% |
| Ukrainian | 91 | 0.4% |
| Venezuelan | 18 | 0.1% |
| Welsh | 44 | 0.2% |
| Yugoslavian | 65 | 0.3% | View All 66 Rows |
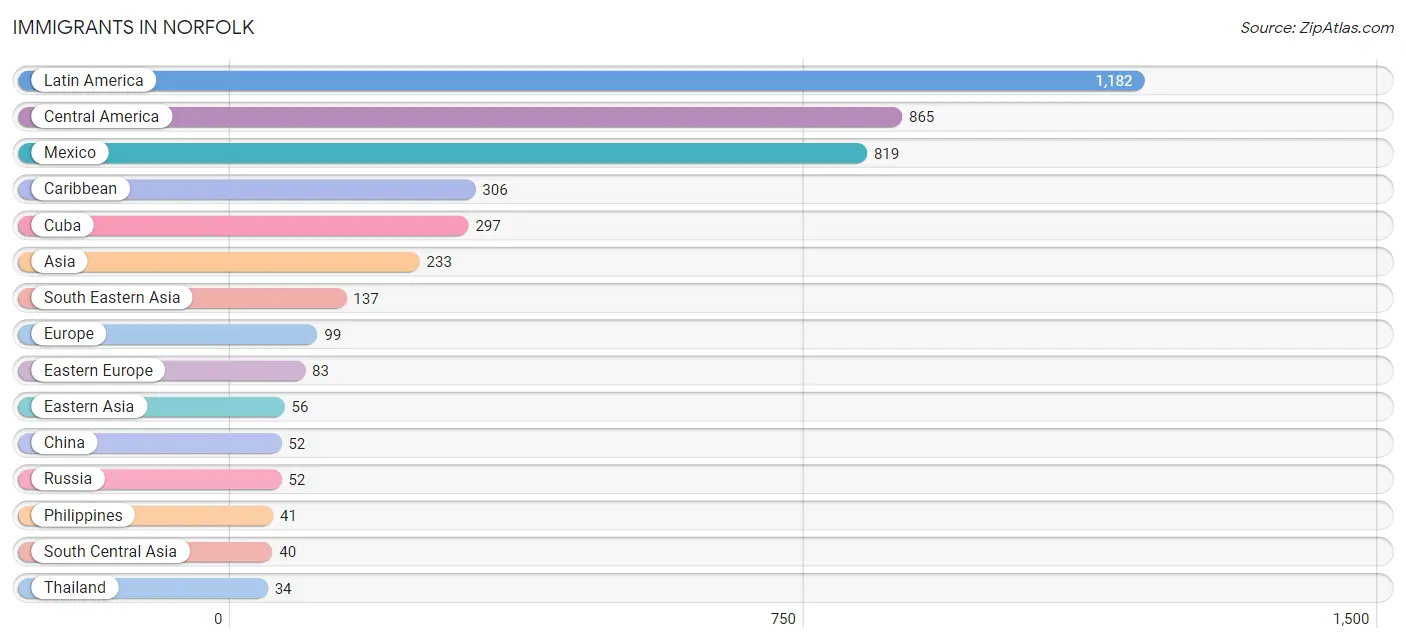
Immigrants in Norfolk
The most numerous immigrant groups reported in Norfolk came from Latin America (1,182 | 4.6%), Central America (865 | 3.3%), Mexico (819 | 3.2%), Caribbean (306 | 1.2%), and Cuba (297 | 1.1%), together accounting for 13.4% of all Norfolk residents.
| Immigration Origin | # Population | % Population |
| Africa | 16 | 0.1% |
| Asia | 233 | 0.9% |
| Bahamas | 9 | 0.0% |
| Bosnia and Herzegovina | 12 | 0.1% |
| Canada | 13 | 0.1% |
| Caribbean | 306 | 1.2% |
| Central America | 865 | 3.3% |
| China | 52 | 0.2% |
| Cuba | 297 | 1.1% |
| Eastern Africa | 9 | 0.0% |
| Eastern Asia | 56 | 0.2% |
| Eastern Europe | 83 | 0.3% |
| Europe | 99 | 0.4% |
| Germany | 14 | 0.1% |
| Guatemala | 21 | 0.1% |
| Hong Kong | 20 | 0.1% |
| India | 33 | 0.1% |
| Indonesia | 30 | 0.1% |
| Kenya | 9 | 0.0% |
| Korea | 4 | 0.0% |
| Latin America | 1,182 | 4.6% |
| Mexico | 819 | 3.2% |
| Nepal | 7 | 0.0% |
| Nicaragua | 17 | 0.1% |
| Northern Africa | 5 | 0.0% |
| Panama | 8 | 0.0% |
| Philippines | 41 | 0.2% |
| Russia | 52 | 0.2% |
| Serbia | 5 | 0.0% |
| South America | 11 | 0.0% |
| South Central Asia | 40 | 0.2% |
| South Eastern Asia | 137 | 0.5% |
| Southern Europe | 2 | 0.0% |
| Spain | 2 | 0.0% |
| Sudan | 5 | 0.0% |
| Thailand | 34 | 0.1% |
| Ukraine | 14 | 0.1% |
| Venezuela | 11 | 0.0% |
| Vietnam | 14 | 0.1% |
| Western Europe | 14 | 0.1% | View All 40 Rows |
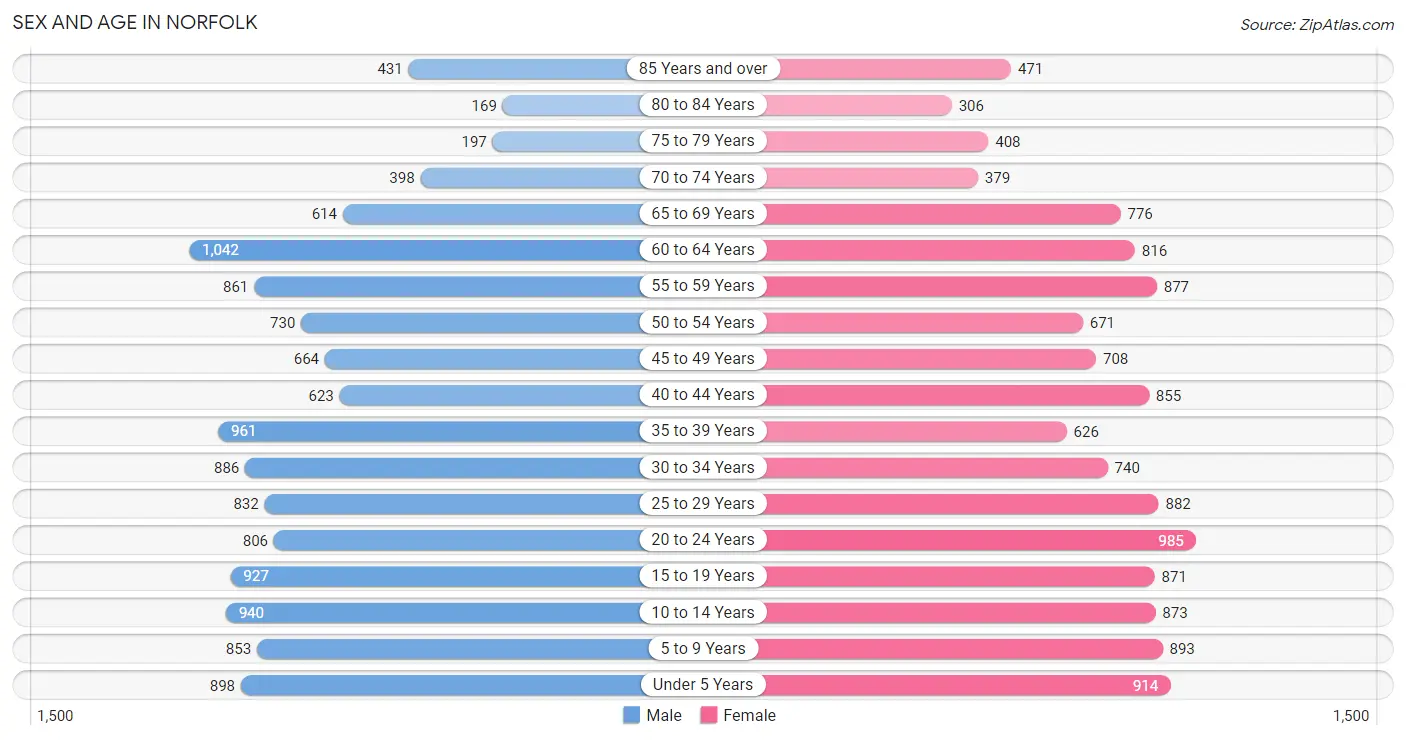
Sex and Age in Norfolk
Sex and Age in Norfolk
The most populous age groups in Norfolk are 60 to 64 Years (1,042 | 8.1%) for men and 20 to 24 Years (985 | 7.5%) for women.
| Age Bracket | Male | Female |
| Under 5 Years | 898 (7.0%) | 914 (7.0%) |
| 5 to 9 Years | 853 (6.7%) | 893 (6.8%) |
| 10 to 14 Years | 940 (7.3%) | 873 (6.7%) |
| 15 to 19 Years | 927 (7.2%) | 871 (6.7%) |
| 20 to 24 Years | 806 (6.3%) | 985 (7.5%) |
| 25 to 29 Years | 832 (6.5%) | 882 (6.8%) |
| 30 to 34 Years | 886 (6.9%) | 740 (5.7%) |
| 35 to 39 Years | 961 (7.5%) | 626 (4.8%) |
| 40 to 44 Years | 623 (4.9%) | 855 (6.6%) |
| 45 to 49 Years | 664 (5.2%) | 708 (5.4%) |
| 50 to 54 Years | 730 (5.7%) | 671 (5.1%) |
| 55 to 59 Years | 861 (6.7%) | 877 (6.7%) |
| 60 to 64 Years | 1,042 (8.1%) | 816 (6.2%) |
| 65 to 69 Years | 614 (4.8%) | 776 (5.9%) |
| 70 to 74 Years | 398 (3.1%) | 379 (2.9%) |
| 75 to 79 Years | 197 (1.5%) | 408 (3.1%) |
| 80 to 84 Years | 169 (1.3%) | 306 (2.3%) |
| 85 Years and over | 431 (3.4%) | 471 (3.6%) |
| Total | 12,832 (100.0%) | 13,051 (100.0%) |
Families and Households in Norfolk
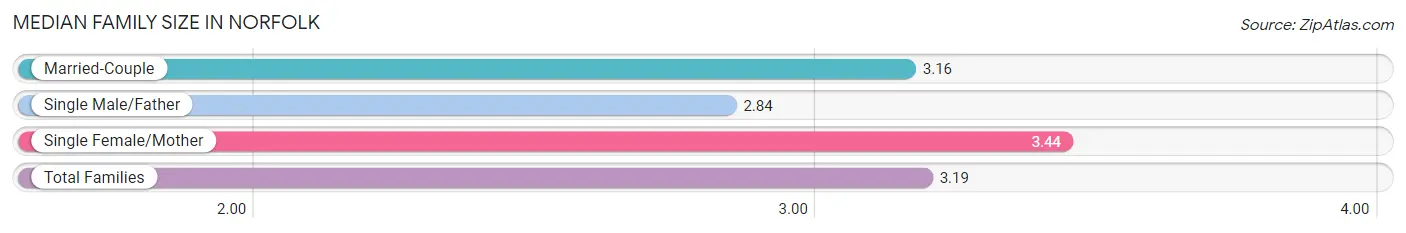
Median Family Size in Norfolk
The median family size in Norfolk is 3.19 persons per family, with single female/mother families (1,065 | 17.6%) accounting for the largest median family size of 3.44 persons per family. On the other hand, single male/father families (322 | 5.3%) represent the smallest median family size with 2.84 persons per family.
| Family Type | # Families | Family Size |
| Married-Couple | 4,651 (77.0%) | 3.16 |
| Single Male/Father | 322 (5.3%) | 2.84 |
| Single Female/Mother | 1,065 (17.6%) | 3.44 |
| Total Families | 6,038 (100.0%) | 3.19 |
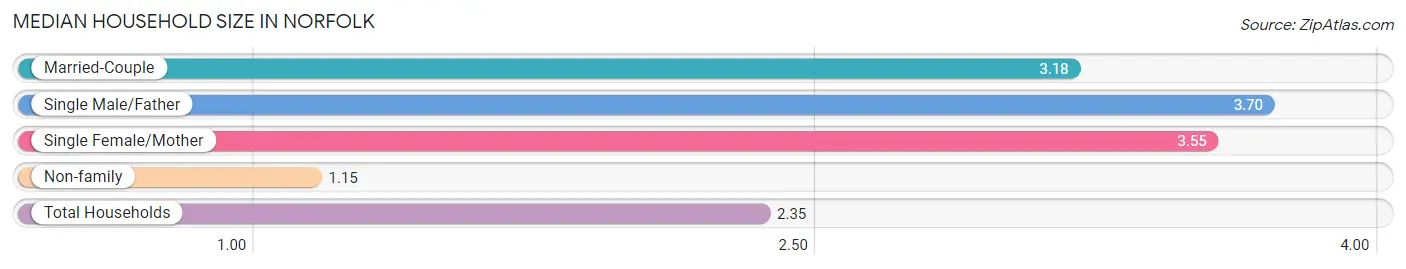
Median Household Size in Norfolk
The median household size in Norfolk is 2.35 persons per household, with single male/father households (322 | 3.0%) accounting for the largest median household size of 3.7 persons per household. non-family households (4,622 | 43.4%) represent the smallest median household size with 1.15 persons per household.
| Household Type | # Households | Household Size |
| Married-Couple | 4,651 (43.6%) | 3.18 |
| Single Male/Father | 322 (3.0%) | 3.70 |
| Single Female/Mother | 1,065 (10.0%) | 3.55 |
| Non-family | 4,622 (43.4%) | 1.15 |
| Total Households | 10,660 (100.0%) | 2.35 |
Household Size by Marriage Status in Norfolk
Out of a total of 10,660 households in Norfolk, 6,038 (56.6%) are family households, while 4,622 (43.4%) are nonfamily households. The most numerous type of family households are 2-person households, comprising 3,176, and the most common type of nonfamily households are 1-person households, comprising 4,114.
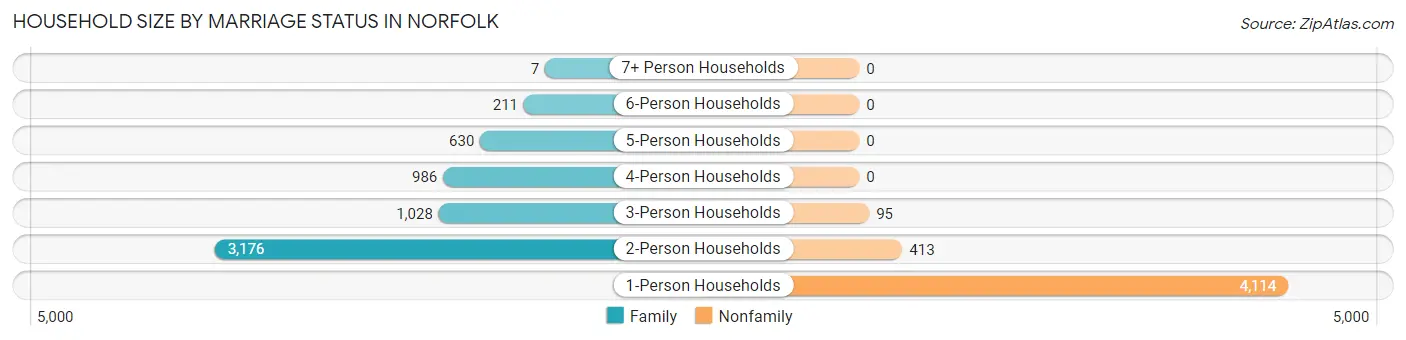
| Household Size | Family Households | Nonfamily Households |
| 1-Person Households | - | 4,114 (38.6%) |
| 2-Person Households | 3,176 (29.8%) | 413 (3.9%) |
| 3-Person Households | 1,028 (9.6%) | 95 (0.9%) |
| 4-Person Households | 986 (9.2%) | 0 (0.0%) |
| 5-Person Households | 630 (5.9%) | 0 (0.0%) |
| 6-Person Households | 211 (2.0%) | 0 (0.0%) |
| 7+ Person Households | 7 (0.1%) | 0 (0.0%) |
| Total | 6,038 (56.6%) | 4,622 (43.4%) |
Female Fertility in Norfolk
Fertility by Age in Norfolk
Average fertility rate in Norfolk is 48.0 births per 1,000 women. Women in the age bracket of 20 to 34 years have the highest fertility rate with 79.0 births per 1,000 women. Women in the age bracket of 20 to 34 years acount for 73.8% of all women with births.
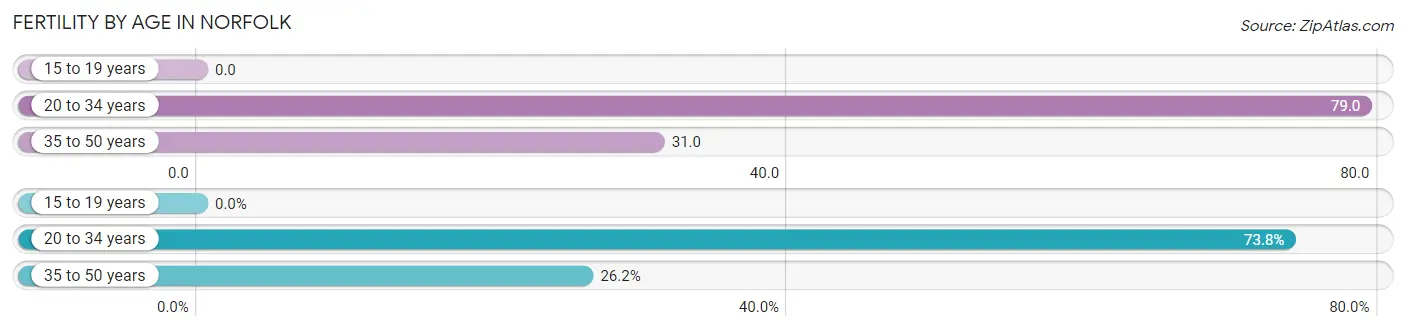
| Age Bracket | Women with Births | Births / 1,000 Women |
| 15 to 19 years | 0 (0.0%) | 0.0 |
| 20 to 34 years | 206 (73.8%) | 79.0 |
| 35 to 50 years | 73 (26.2%) | 31.0 |
| Total | 279 (100.0%) | 48.0 |
Fertility by Age by Marriage Status in Norfolk
46.2% of women with births (279) in Norfolk are married. The highest percentage of unmarried women with births falls into 20 to 34 years age bracket with 55.3% of them unmarried at the time of birth, while the lowest percentage of unmarried women with births belong to 35 to 50 years age bracket with 49.3% of them unmarried.
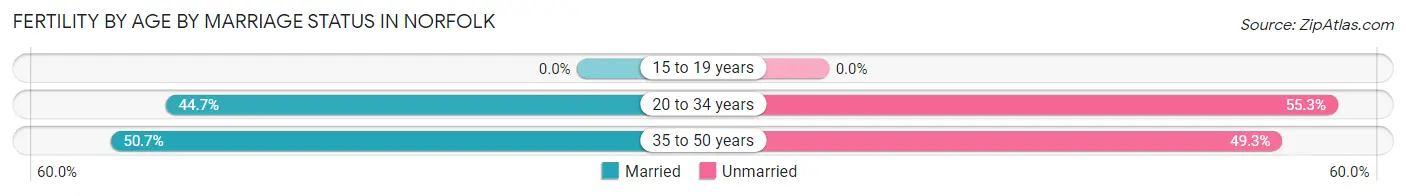
| Age Bracket | Married | Unmarried |
| 15 to 19 years | 0 (0.0%) | 0 (0.0%) |
| 20 to 34 years | 92 (44.7%) | 114 (55.3%) |
| 35 to 50 years | 37 (50.7%) | 36 (49.3%) |
| Total | 129 (46.2%) | 150 (53.8%) |
Fertility by Education in Norfolk
Average fertility rate in Norfolk is 48.0 births per 1,000 women. Women with the education attainment of high school diploma have the highest fertility rate of 67.0 births per 1,000 women, while women with the education attainment of bachelor's degree have the lowest fertility at 16.0 births per 1,000 women. Women with the education attainment of high school diploma represent 38.4% of all women with births.
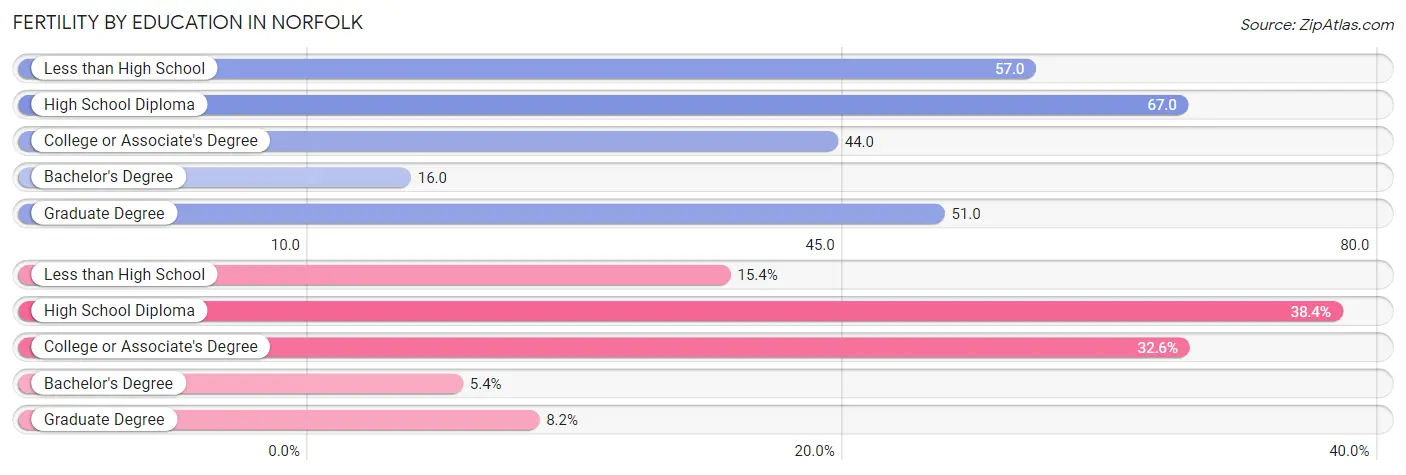
| Educational Attainment | Women with Births | Births / 1,000 Women |
| Less than High School | 43 (15.4%) | 57.0 |
| High School Diploma | 107 (38.4%) | 67.0 |
| College or Associate's Degree | 91 (32.6%) | 44.0 |
| Bachelor's Degree | 15 (5.4%) | 16.0 |
| Graduate Degree | 23 (8.2%) | 51.0 |
| Total | 279 (100.0%) | 48.0 |
Fertility by Education by Marriage Status in Norfolk
53.8% of women with births in Norfolk are unmarried. Women with the educational attainment of bachelor's degree are most likely to be married with 100.0% of them married at childbirth, while women with the educational attainment of high school diploma are least likely to be married with 85.1% of them unmarried at childbirth.
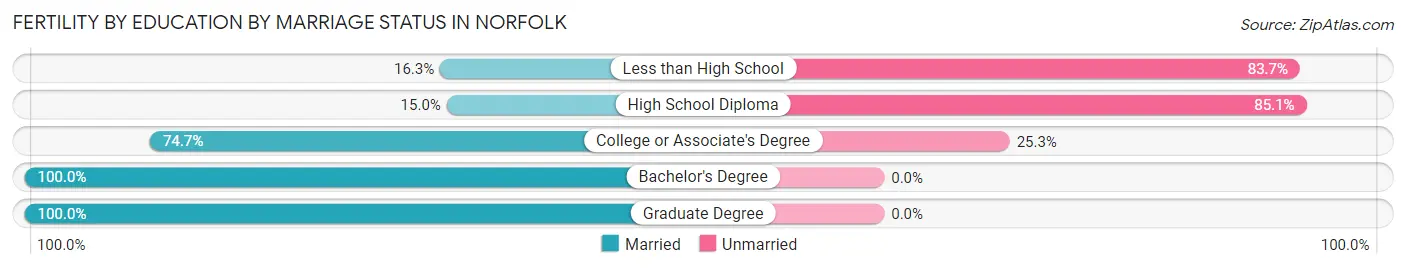
| Educational Attainment | Married | Unmarried |
| Less than High School | 7 (16.3%) | 36 (83.7%) |
| High School Diploma | 16 (14.9%) | 91 (85.1%) |
| College or Associate's Degree | 68 (74.7%) | 23 (25.3%) |
| Bachelor's Degree | 15 (100.0%) | 0 (0.0%) |
| Graduate Degree | 23 (100.0%) | 0 (0.0%) |
| Total | 129 (46.2%) | 150 (53.8%) |
Employment Characteristics in Norfolk
Employment by Class of Employer in Norfolk
Among the 13,288 employed individuals in Norfolk, private company employees (8,989 | 67.6%), not-for-profit organizations (1,244 | 9.4%), and state government employees (891 | 6.7%) make up the most common classes of employment.
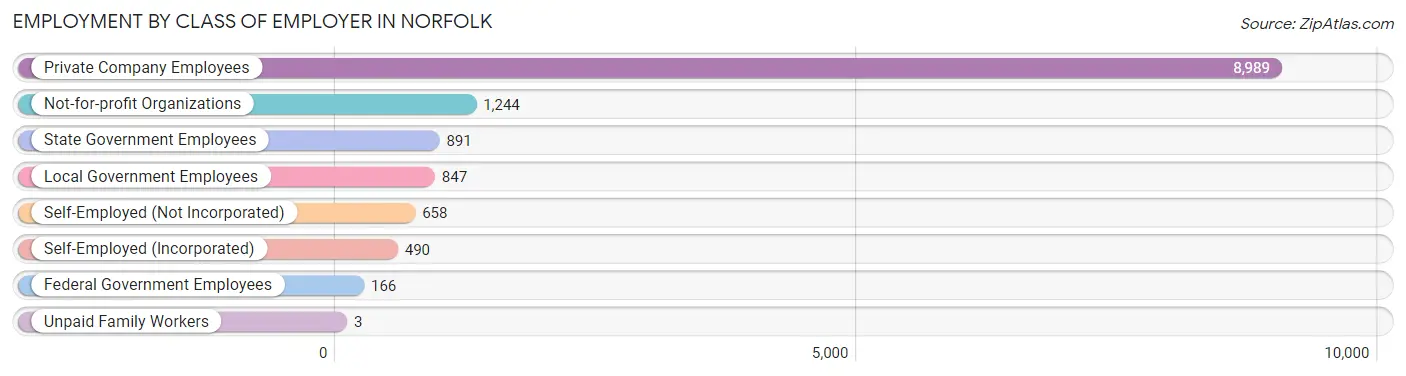
| Employer Class | # Employees | % Employees |
| Private Company Employees | 8,989 | 67.6% |
| Self-Employed (Incorporated) | 490 | 3.7% |
| Self-Employed (Not Incorporated) | 658 | 5.0% |
| Not-for-profit Organizations | 1,244 | 9.4% |
| Local Government Employees | 847 | 6.4% |
| State Government Employees | 891 | 6.7% |
| Federal Government Employees | 166 | 1.3% |
| Unpaid Family Workers | 3 | 0.0% |
| Total | 13,288 | 100.0% |
Employment Status by Age in Norfolk
According to the labor force statistics for Norfolk, out of the total population over 16 years of age (20,220), 68.1% or 13,770 individuals are in the labor force, with 2.6% or 358 of them unemployed. The age group with the highest labor force participation rate is 25 to 29 years, with 96.6% or 1,656 individuals in the labor force. Within the labor force, the 16 to 19 years age range has the highest percentage of unemployed individuals, with 13.1% or 115 of them being unemployed.
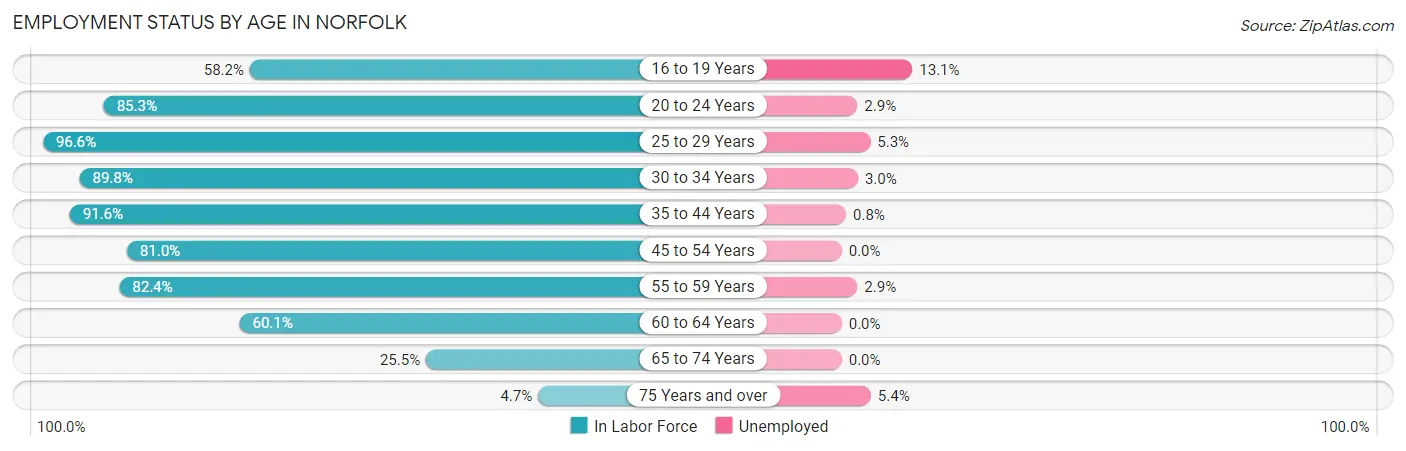
| Age Bracket | In Labor Force | Unemployed |
| 16 to 19 Years | 876 (58.2%) | 115 (13.1%) |
| 20 to 24 Years | 1,528 (85.3%) | 44 (2.9%) |
| 25 to 29 Years | 1,656 (96.6%) | 88 (5.3%) |
| 30 to 34 Years | 1,460 (89.8%) | 44 (3.0%) |
| 35 to 44 Years | 2,808 (91.6%) | 22 (0.8%) |
| 45 to 54 Years | 2,246 (81.0%) | 0 (0.0%) |
| 55 to 59 Years | 1,432 (82.4%) | 42 (2.9%) |
| 60 to 64 Years | 1,117 (60.1%) | 0 (0.0%) |
| 65 to 74 Years | 553 (25.5%) | 0 (0.0%) |
| 75 Years and over | 93 (4.7%) | 5 (5.4%) |
| Total | 13,770 (68.1%) | 358 (2.6%) |
Employment Status by Educational Attainment in Norfolk
According to labor force statistics for Norfolk, 83.9% of individuals (10,717) out of the total population between 25 and 64 years of age (12,774) are in the labor force, with 1.8% or 193 of them being unemployed. The group with the highest labor force participation rate are those with the educational attainment of bachelor's degree or higher, with 90.9% or 3,184 individuals in the labor force. Within the labor force, individuals with less than high school education have the highest percentage of unemployment, with 4.5% or 17 of them being unemployed.
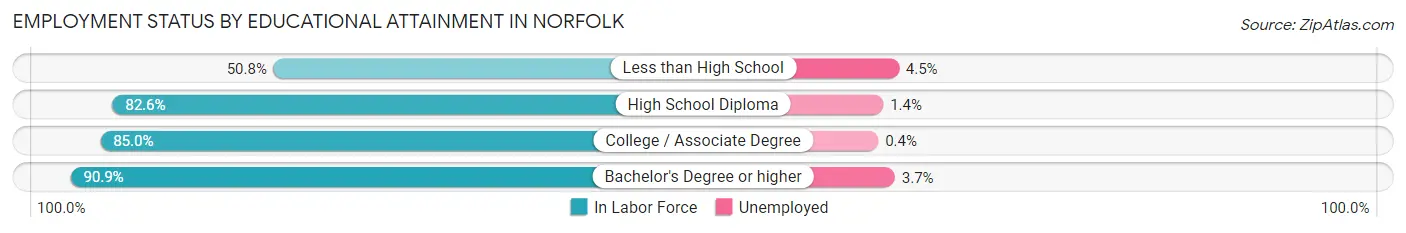
| Educational Attainment | In Labor Force | Unemployed |
| Less than High School | 380 (50.8%) | 34 (4.5%) |
| High School Diploma | 3,070 (82.6%) | 52 (1.4%) |
| College / Associate Degree | 4,085 (85.0%) | 19 (0.4%) |
| Bachelor's Degree or higher | 3,184 (90.9%) | 130 (3.7%) |
| Total | 10,717 (83.9%) | 230 (1.8%) |
Employment Occupations by Sex in Norfolk
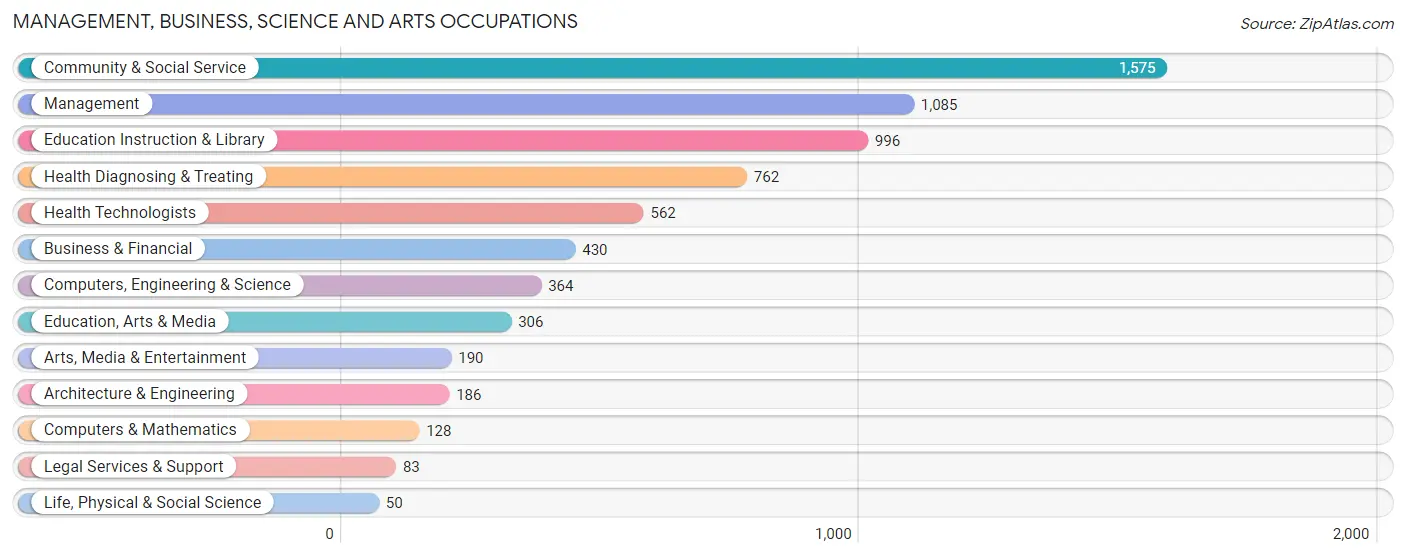
Management, Business, Science and Arts Occupations
The most common Management, Business, Science and Arts occupations in Norfolk are Community & Social Service (1,575 | 11.8%), Management (1,085 | 8.1%), Education Instruction & Library (996 | 7.4%), Health Diagnosing & Treating (762 | 5.7%), and Health Technologists (562 | 4.2%).
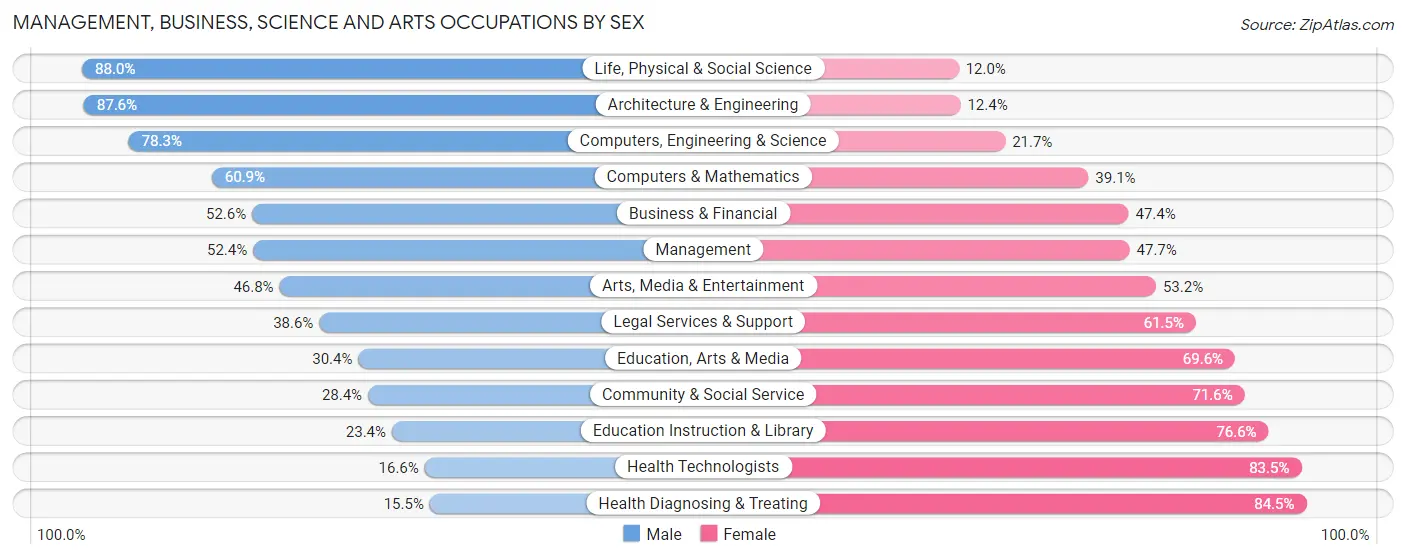
Management, Business, Science and Arts Occupations by Sex
Within the Management, Business, Science and Arts occupations in Norfolk, the most male-oriented occupations are Life, Physical & Social Science (88.0%), Architecture & Engineering (87.6%), and Computers, Engineering & Science (78.3%), while the most female-oriented occupations are Health Diagnosing & Treating (84.5%), Health Technologists (83.5%), and Education Instruction & Library (76.6%).
| Occupation | Male | Female |
| Management | 568 (52.3%) | 517 (47.6%) |
| Business & Financial | 226 (52.6%) | 204 (47.4%) |
| Computers, Engineering & Science | 285 (78.3%) | 79 (21.7%) |
| Computers & Mathematics | 78 (60.9%) | 50 (39.1%) |
| Architecture & Engineering | 163 (87.6%) | 23 (12.4%) |
| Life, Physical & Social Science | 44 (88.0%) | 6 (12.0%) |
| Community & Social Service | 447 (28.4%) | 1,128 (71.6%) |
| Education, Arts & Media | 93 (30.4%) | 213 (69.6%) |
| Legal Services & Support | 32 (38.6%) | 51 (61.5%) |
| Education Instruction & Library | 233 (23.4%) | 763 (76.6%) |
| Arts, Media & Entertainment | 89 (46.8%) | 101 (53.2%) |
| Health Diagnosing & Treating | 118 (15.5%) | 644 (84.5%) |
| Health Technologists | 93 (16.6%) | 469 (83.5%) |
| Total (Category) | 1,644 (39.0%) | 2,572 (61.0%) |
| Total (Overall) | 6,736 (50.4%) | 6,629 (49.6%) |
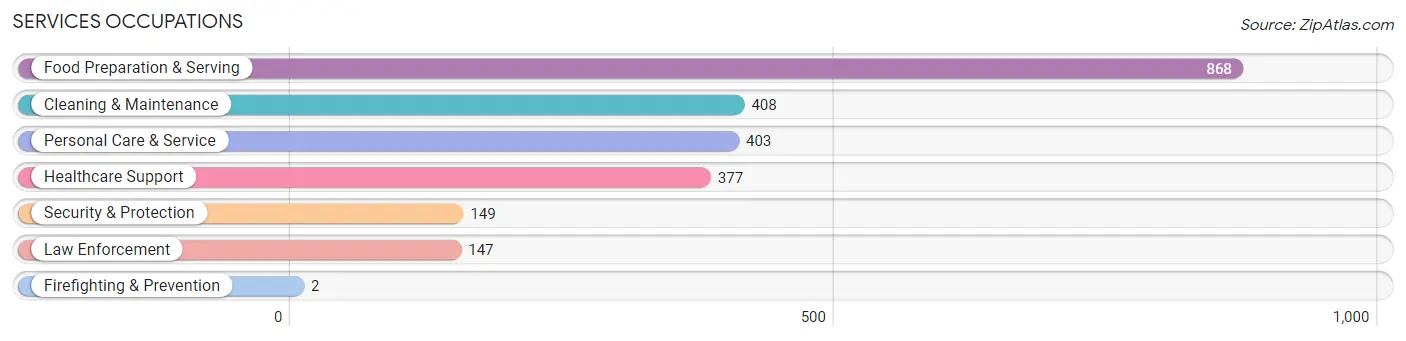
Services Occupations
The most common Services occupations in Norfolk are Food Preparation & Serving (868 | 6.5%), Cleaning & Maintenance (408 | 3.0%), Personal Care & Service (403 | 3.0%), Healthcare Support (377 | 2.8%), and Security & Protection (149 | 1.1%).
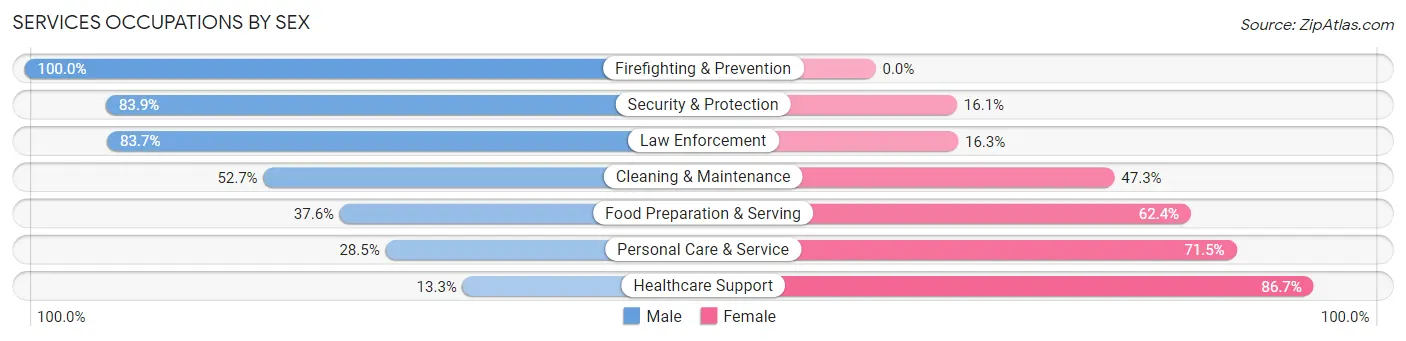
Services Occupations by Sex
Within the Services occupations in Norfolk, the most male-oriented occupations are Firefighting & Prevention (100.0%), Security & Protection (83.9%), and Law Enforcement (83.7%), while the most female-oriented occupations are Healthcare Support (86.7%), Personal Care & Service (71.5%), and Food Preparation & Serving (62.4%).
| Occupation | Male | Female |
| Healthcare Support | 50 (13.3%) | 327 (86.7%) |
| Security & Protection | 125 (83.9%) | 24 (16.1%) |
| Firefighting & Prevention | 2 (100.0%) | 0 (0.0%) |
| Law Enforcement | 123 (83.7%) | 24 (16.3%) |
| Food Preparation & Serving | 326 (37.6%) | 542 (62.4%) |
| Cleaning & Maintenance | 215 (52.7%) | 193 (47.3%) |
| Personal Care & Service | 115 (28.5%) | 288 (71.5%) |
| Total (Category) | 831 (37.7%) | 1,374 (62.3%) |
| Total (Overall) | 6,736 (50.4%) | 6,629 (49.6%) |
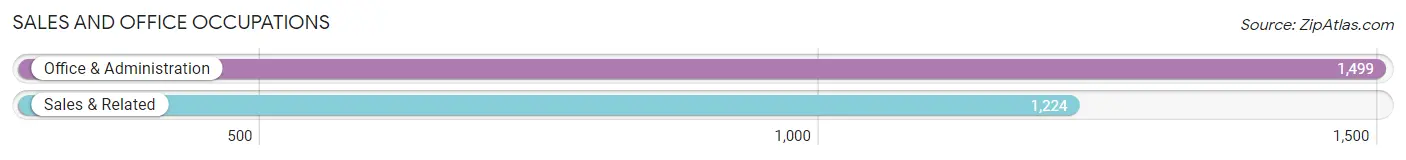
Sales and Office Occupations
The most common Sales and Office occupations in Norfolk are Office & Administration (1,499 | 11.2%), and Sales & Related (1,224 | 9.2%).
Sales and Office Occupations by Sex
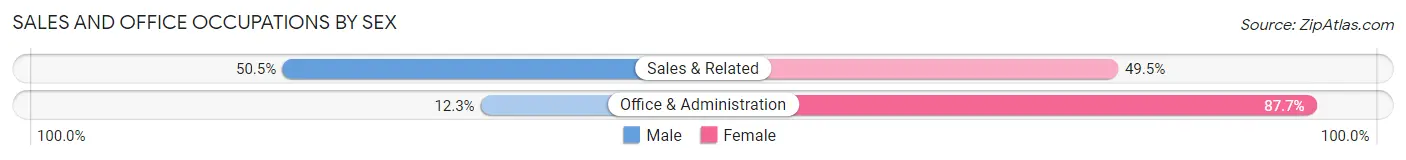
| Occupation | Male | Female |
| Sales & Related | 618 (50.5%) | 606 (49.5%) |
| Office & Administration | 185 (12.3%) | 1,314 (87.7%) |
| Total (Category) | 803 (29.5%) | 1,920 (70.5%) |
| Total (Overall) | 6,736 (50.4%) | 6,629 (49.6%) |
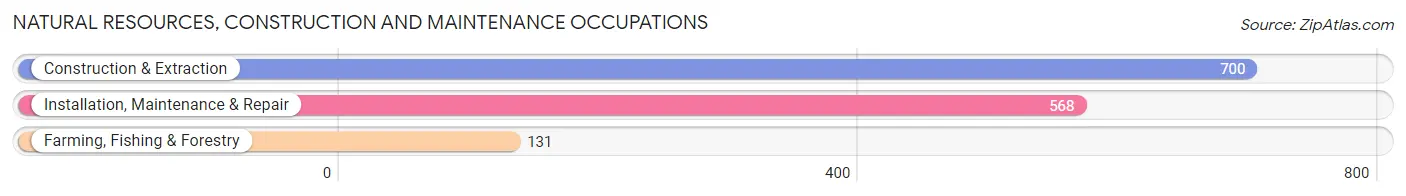
Natural Resources, Construction and Maintenance Occupations
The most common Natural Resources, Construction and Maintenance occupations in Norfolk are Construction & Extraction (700 | 5.2%), Installation, Maintenance & Repair (568 | 4.3%), and Farming, Fishing & Forestry (131 | 1.0%).
Natural Resources, Construction and Maintenance Occupations by Sex
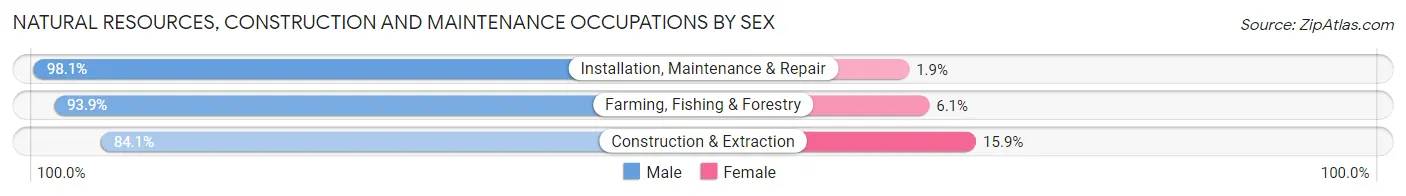
| Occupation | Male | Female |
| Farming, Fishing & Forestry | 123 (93.9%) | 8 (6.1%) |
| Construction & Extraction | 589 (84.1%) | 111 (15.9%) |
| Installation, Maintenance & Repair | 557 (98.1%) | 11 (1.9%) |
| Total (Category) | 1,269 (90.7%) | 130 (9.3%) |
| Total (Overall) | 6,736 (50.4%) | 6,629 (49.6%) |
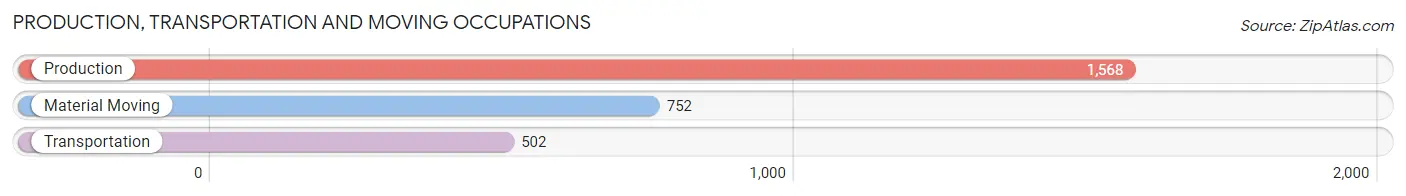
Production, Transportation and Moving Occupations
The most common Production, Transportation and Moving occupations in Norfolk are Production (1,568 | 11.7%), Material Moving (752 | 5.6%), and Transportation (502 | 3.8%).
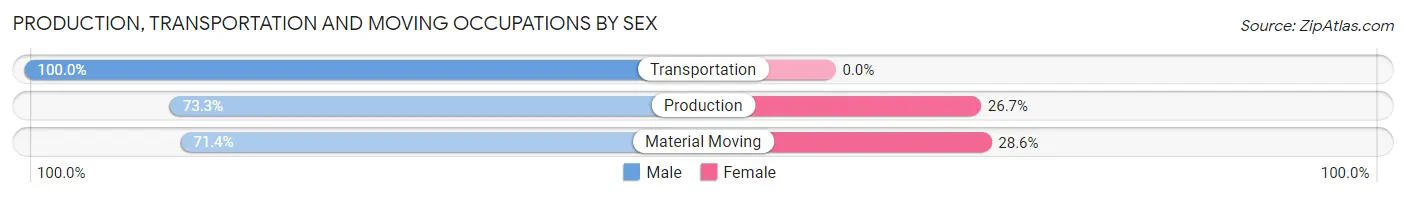
Production, Transportation and Moving Occupations by Sex
| Occupation | Male | Female |
| Production | 1,150 (73.3%) | 418 (26.7%) |
| Transportation | 502 (100.0%) | 0 (0.0%) |
| Material Moving | 537 (71.4%) | 215 (28.6%) |
| Total (Category) | 2,189 (77.6%) | 633 (22.4%) |
| Total (Overall) | 6,736 (50.4%) | 6,629 (49.6%) |
Employment Industries by Sex in Norfolk
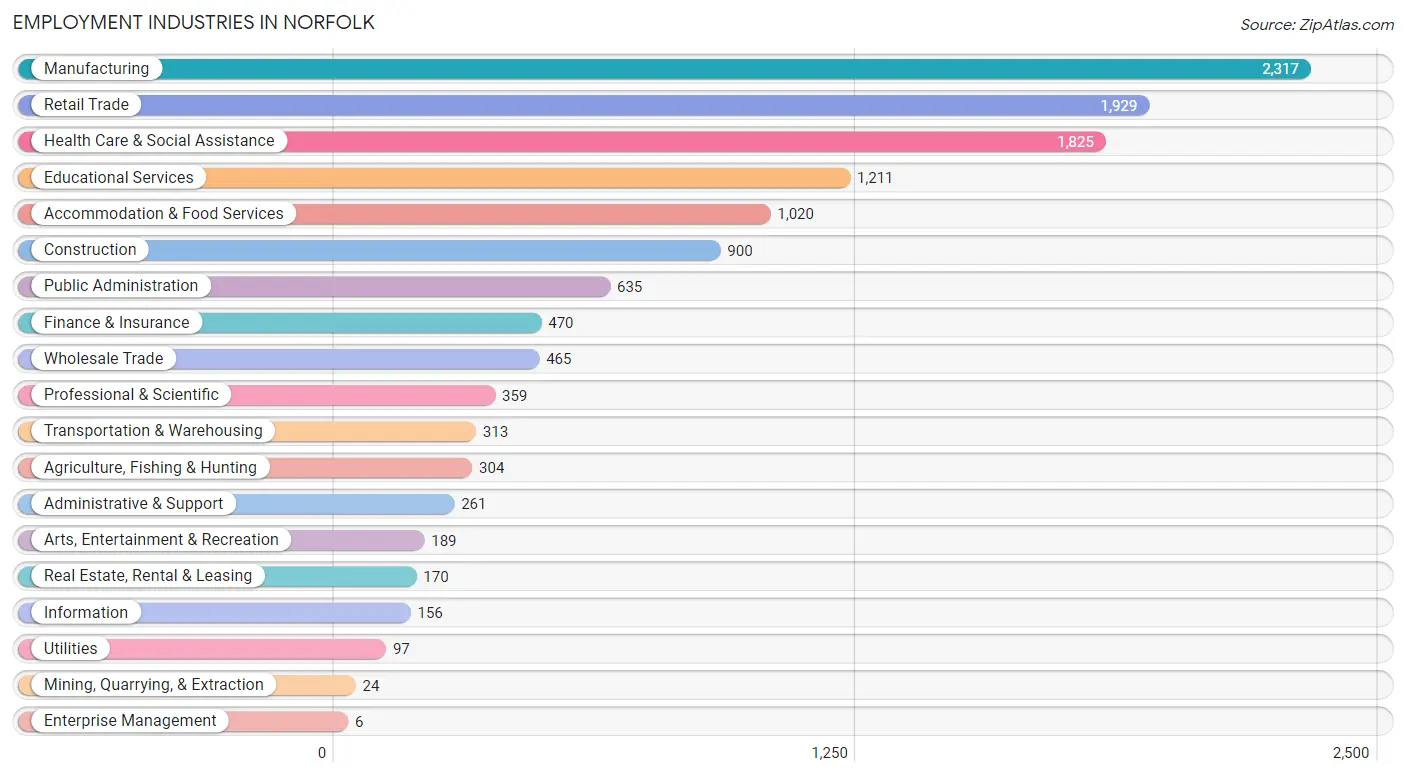
Employment Industries in Norfolk
The major employment industries in Norfolk include Manufacturing (2,317 | 17.3%), Retail Trade (1,929 | 14.4%), Health Care & Social Assistance (1,825 | 13.7%), Educational Services (1,211 | 9.1%), and Accommodation & Food Services (1,020 | 7.6%).
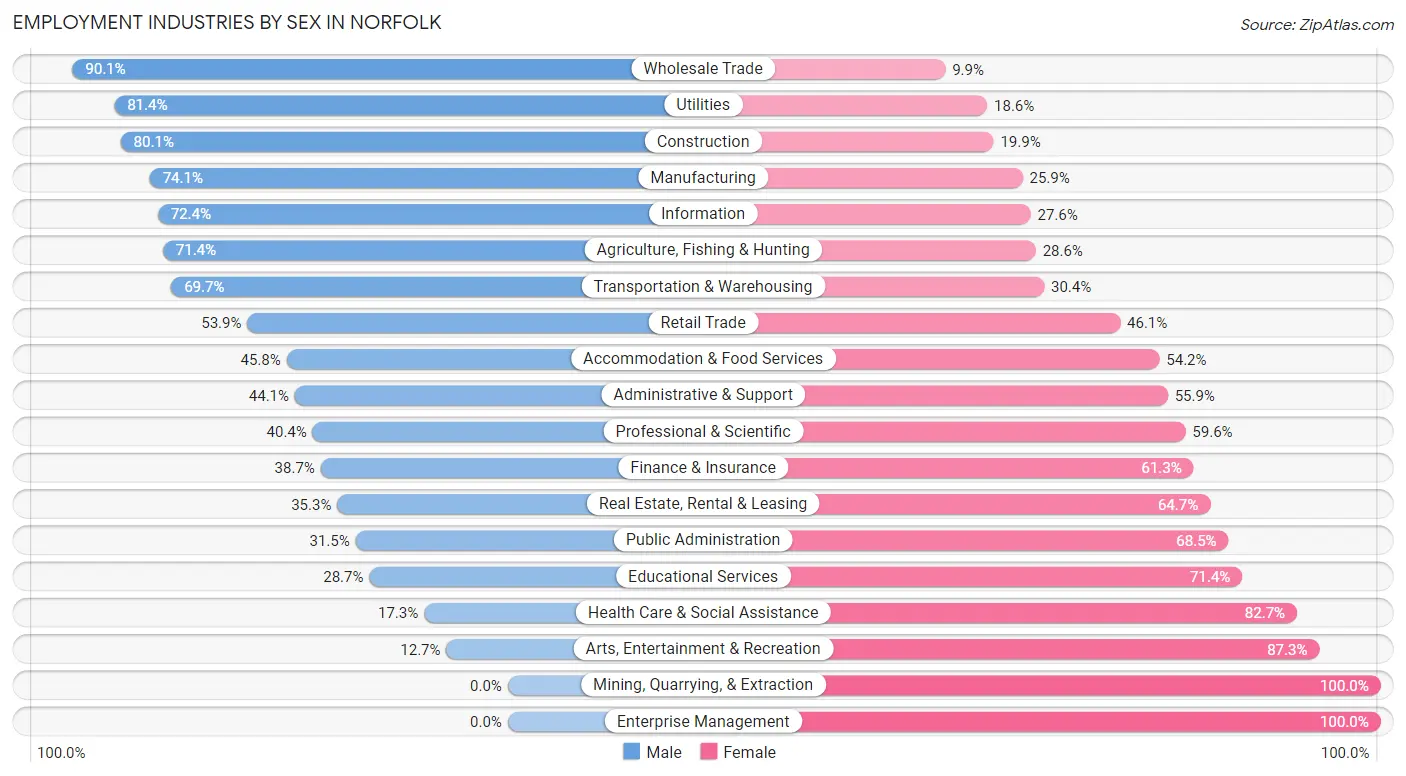
Employment Industries by Sex in Norfolk
The Norfolk industries that see more men than women are Wholesale Trade (90.1%), Utilities (81.4%), and Construction (80.1%), whereas the industries that tend to have a higher number of women are Mining, Quarrying, & Extraction (100.0%), Enterprise Management (100.0%), and Arts, Entertainment & Recreation (87.3%).
| Industry | Male | Female |
| Agriculture, Fishing & Hunting | 217 (71.4%) | 87 (28.6%) |
| Mining, Quarrying, & Extraction | 0 (0.0%) | 24 (100.0%) |
| Construction | 721 (80.1%) | 179 (19.9%) |
| Manufacturing | 1,717 (74.1%) | 600 (25.9%) |
| Wholesale Trade | 419 (90.1%) | 46 (9.9%) |
| Retail Trade | 1,040 (53.9%) | 889 (46.1%) |
| Transportation & Warehousing | 218 (69.7%) | 95 (30.3%) |
| Utilities | 79 (81.4%) | 18 (18.6%) |
| Information | 113 (72.4%) | 43 (27.6%) |
| Finance & Insurance | 182 (38.7%) | 288 (61.3%) |
| Real Estate, Rental & Leasing | 60 (35.3%) | 110 (64.7%) |
| Professional & Scientific | 145 (40.4%) | 214 (59.6%) |
| Enterprise Management | 0 (0.0%) | 6 (100.0%) |
| Administrative & Support | 115 (44.1%) | 146 (55.9%) |
| Educational Services | 347 (28.6%) | 864 (71.4%) |
| Health Care & Social Assistance | 316 (17.3%) | 1,509 (82.7%) |
| Arts, Entertainment & Recreation | 24 (12.7%) | 165 (87.3%) |
| Accommodation & Food Services | 467 (45.8%) | 553 (54.2%) |
| Public Administration | 200 (31.5%) | 435 (68.5%) |
| Total | 6,736 (50.4%) | 6,629 (49.6%) |
Education in Norfolk
School Enrollment in Norfolk
The most common levels of schooling among the 6,365 students in Norfolk are middle school (1,337 | 21.0%), high school (1,296 | 20.4%), and elementary school (1,272 | 20.0%).
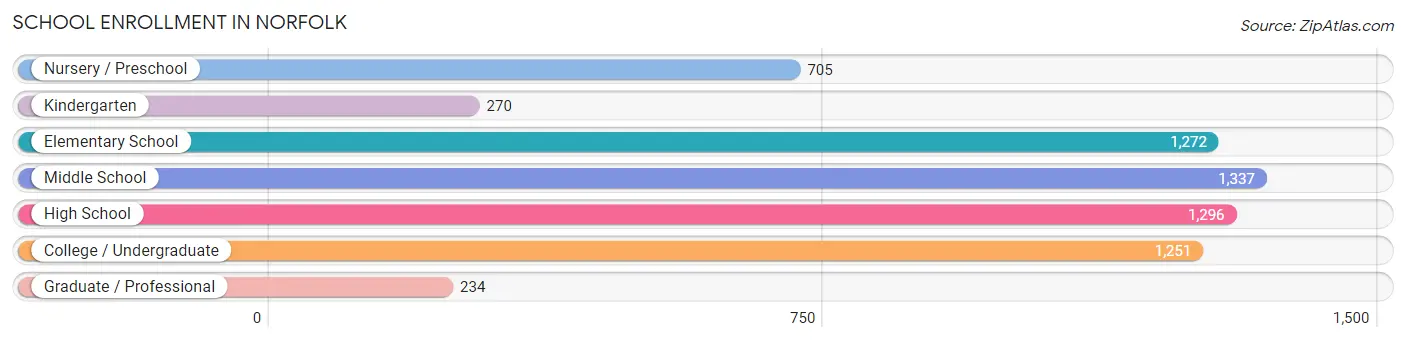
| School Level | # Students | % Students |
| Nursery / Preschool | 705 | 11.1% |
| Kindergarten | 270 | 4.2% |
| Elementary School | 1,272 | 20.0% |
| Middle School | 1,337 | 21.0% |
| High School | 1,296 | 20.4% |
| College / Undergraduate | 1,251 | 19.7% |
| Graduate / Professional | 234 | 3.7% |
| Total | 6,365 | 100.0% |
School Enrollment by Age by Funding Source in Norfolk
Out of a total of 6,365 students who are enrolled in schools in Norfolk, 1,318 (20.7%) attend a private institution, while the remaining 5,047 (79.3%) are enrolled in public schools. The age group of 3 to 4 year olds has the highest likelihood of being enrolled in private schools, with 190 (42.9% in the age bracket) enrolled. Conversely, the age group of 35 years and over has the lowest likelihood of being enrolled in a private school, with 209 (96.3% in the age bracket) attending a public institution.
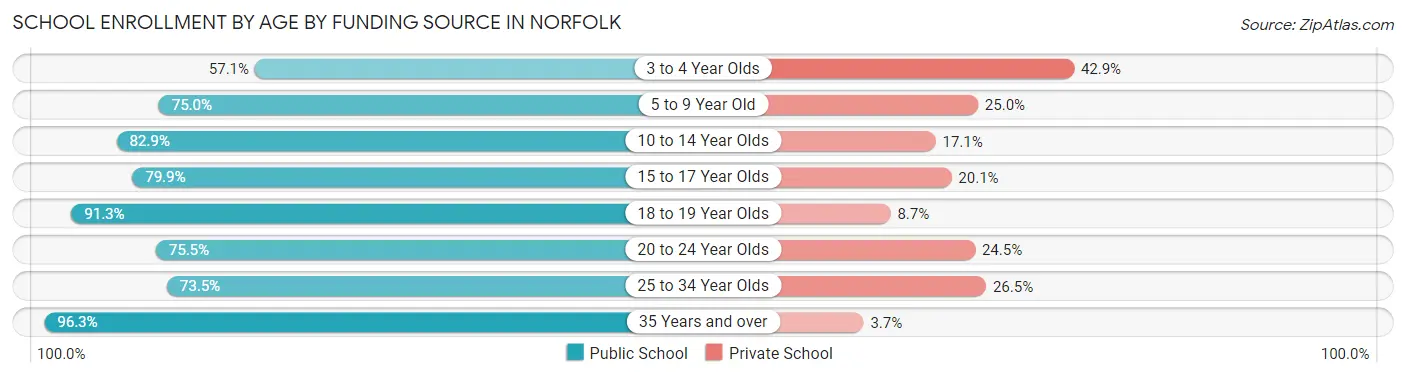
| Age Bracket | Public School | Private School |
| 3 to 4 Year Olds | 253 (57.1%) | 190 (42.9%) |
| 5 to 9 Year Old | 1,191 (75.0%) | 397 (25.0%) |
| 10 to 14 Year Olds | 1,462 (82.9%) | 302 (17.1%) |
| 15 to 17 Year Olds | 705 (79.9%) | 177 (20.1%) |
| 18 to 19 Year Olds | 670 (91.3%) | 64 (8.7%) |
| 20 to 24 Year Olds | 494 (75.5%) | 160 (24.5%) |
| 25 to 34 Year Olds | 61 (73.5%) | 22 (26.5%) |
| 35 Years and over | 209 (96.3%) | 8 (3.7%) |
| Total | 5,047 (79.3%) | 1,318 (20.7%) |
Educational Attainment by Field of Study in Norfolk
Business (1,087 | 23.4%), education (1,039 | 22.4%), science & technology (651 | 14.1%), arts & humanities (405 | 8.7%), and bio, nature & agricultural (317 | 6.8%) are the most common fields of study among 4,635 individuals in Norfolk who have obtained a bachelor's degree or higher.
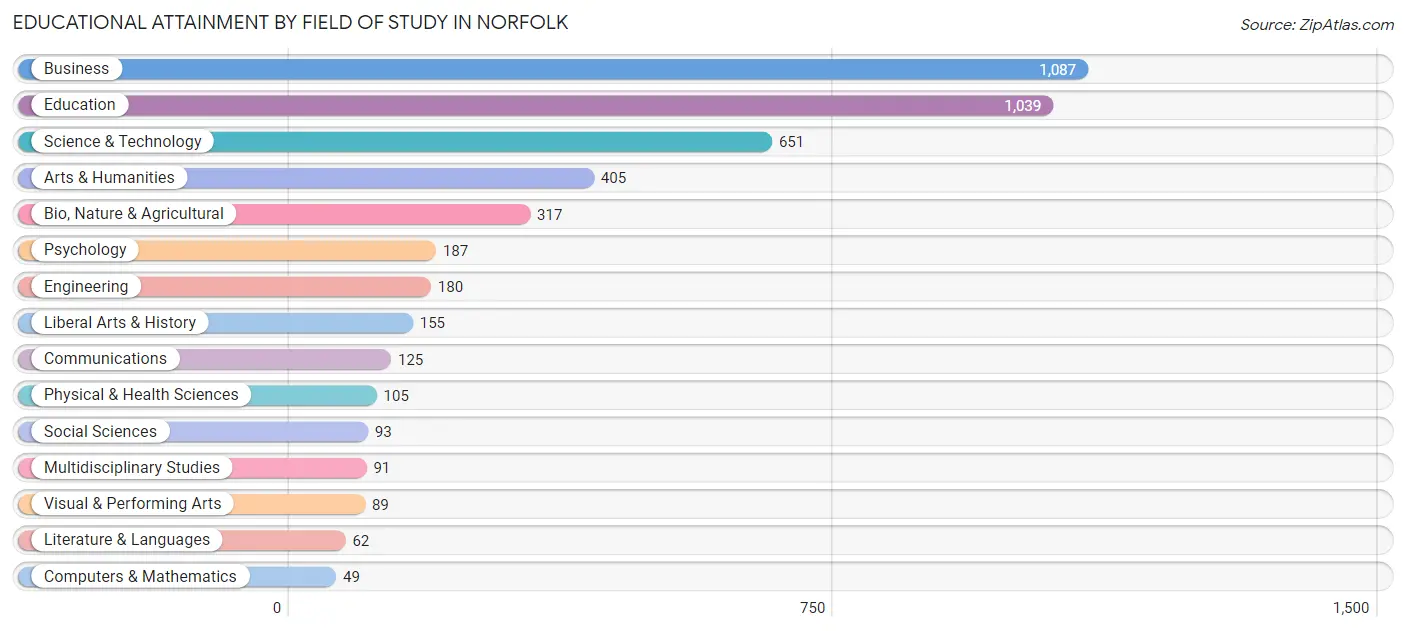
| Field of Study | # Graduates | % Graduates |
| Computers & Mathematics | 49 | 1.1% |
| Bio, Nature & Agricultural | 317 | 6.8% |
| Physical & Health Sciences | 105 | 2.3% |
| Psychology | 187 | 4.0% |
| Social Sciences | 93 | 2.0% |
| Engineering | 180 | 3.9% |
| Multidisciplinary Studies | 91 | 2.0% |
| Science & Technology | 651 | 14.1% |
| Business | 1,087 | 23.4% |
| Education | 1,039 | 22.4% |
| Literature & Languages | 62 | 1.3% |
| Liberal Arts & History | 155 | 3.3% |
| Visual & Performing Arts | 89 | 1.9% |
| Communications | 125 | 2.7% |
| Arts & Humanities | 405 | 8.7% |
| Total | 4,635 | 100.0% |
Transportation & Commute in Norfolk
Vehicle Availability by Sex in Norfolk
The most prevalent vehicle ownership categories in Norfolk are males with 2 vehicles (3,121, accounting for 47.2%) and females with 2 vehicles (3,100, making up 47.8%).
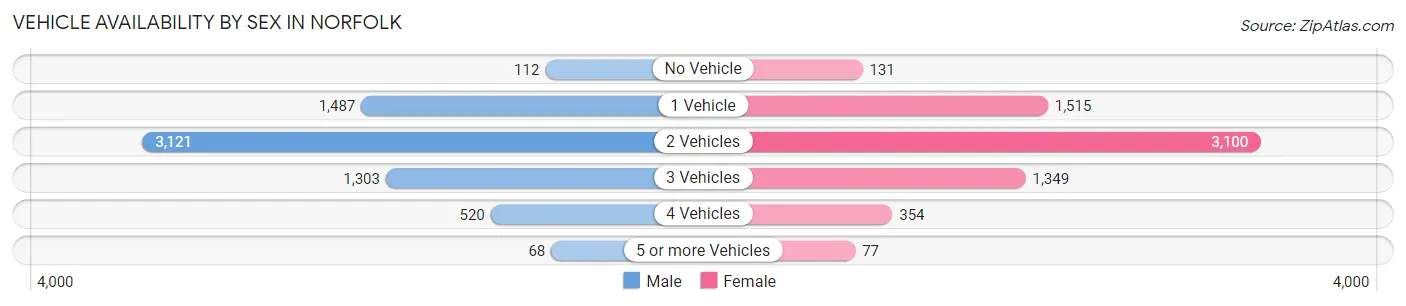
| Vehicles Available | Male | Female |
| No Vehicle | 112 (1.7%) | 131 (2.0%) |
| 1 Vehicle | 1,487 (22.5%) | 1,515 (23.2%) |
| 2 Vehicles | 3,121 (47.2%) | 3,100 (47.5%) |
| 3 Vehicles | 1,303 (19.7%) | 1,349 (20.7%) |
| 4 Vehicles | 520 (7.9%) | 354 (5.4%) |
| 5 or more Vehicles | 68 (1.0%) | 77 (1.2%) |
| Total | 6,611 (100.0%) | 6,526 (100.0%) |
Commute Time in Norfolk
The most frequently occuring commute durations in Norfolk are 5 to 9 minutes (4,251 commuters, 33.2%), 10 to 14 minutes (4,035 commuters, 31.5%), and 15 to 19 minutes (1,427 commuters, 11.1%).
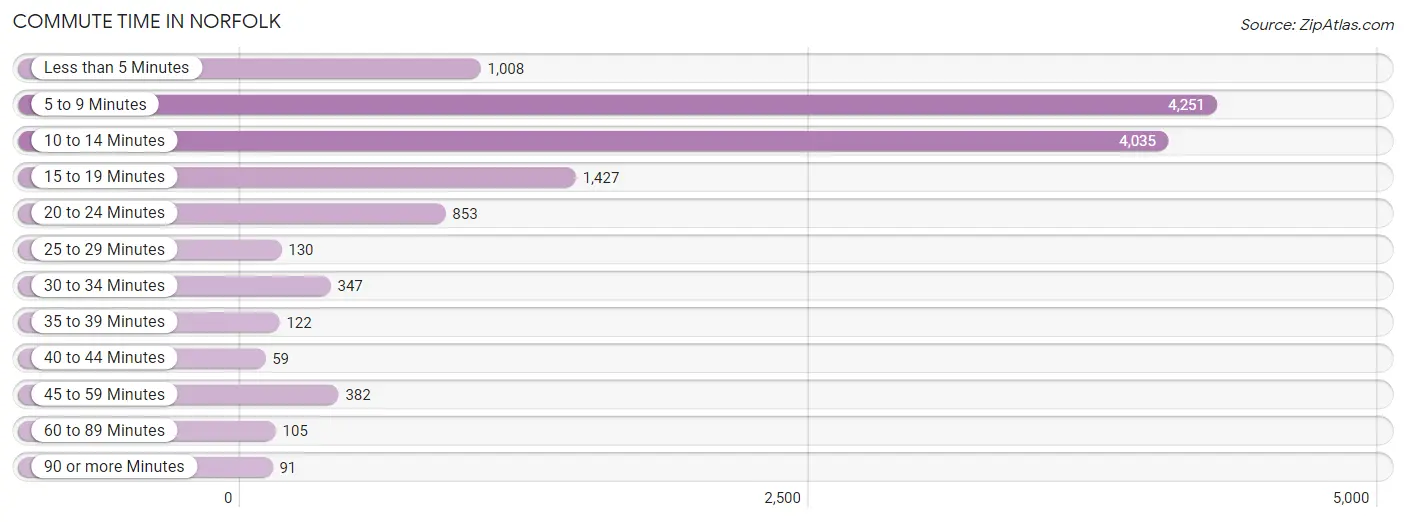
| Commute Time | # Commuters | % Commuters |
| Less than 5 Minutes | 1,008 | 7.9% |
| 5 to 9 Minutes | 4,251 | 33.2% |
| 10 to 14 Minutes | 4,035 | 31.5% |
| 15 to 19 Minutes | 1,427 | 11.1% |
| 20 to 24 Minutes | 853 | 6.7% |
| 25 to 29 Minutes | 130 | 1.0% |
| 30 to 34 Minutes | 347 | 2.7% |
| 35 to 39 Minutes | 122 | 0.9% |
| 40 to 44 Minutes | 59 | 0.5% |
| 45 to 59 Minutes | 382 | 3.0% |
| 60 to 89 Minutes | 105 | 0.8% |
| 90 or more Minutes | 91 | 0.7% |
Commute Time by Sex in Norfolk
The most common commute times in Norfolk are 5 to 9 minutes (2,014 commuters, 30.6%) for males and 10 to 14 minutes (2,263 commuters, 36.3%) for females.
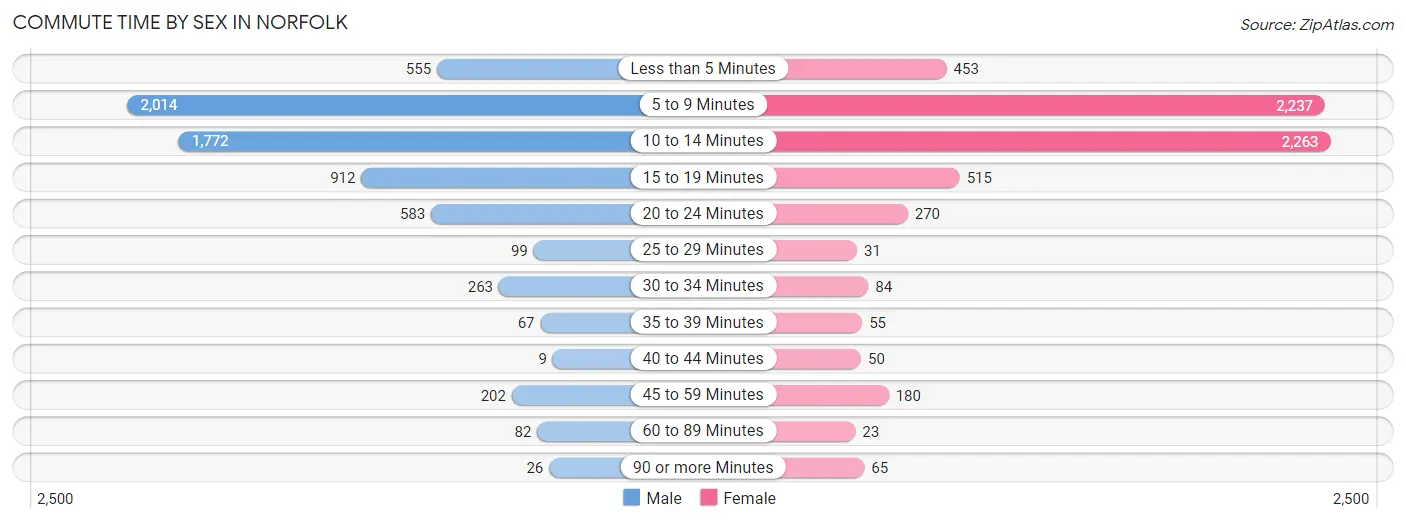
| Commute Time | Male | Female |
| Less than 5 Minutes | 555 (8.4%) | 453 (7.3%) |
| 5 to 9 Minutes | 2,014 (30.6%) | 2,237 (35.9%) |
| 10 to 14 Minutes | 1,772 (26.9%) | 2,263 (36.3%) |
| 15 to 19 Minutes | 912 (13.9%) | 515 (8.3%) |
| 20 to 24 Minutes | 583 (8.8%) | 270 (4.3%) |
| 25 to 29 Minutes | 99 (1.5%) | 31 (0.5%) |
| 30 to 34 Minutes | 263 (4.0%) | 84 (1.3%) |
| 35 to 39 Minutes | 67 (1.0%) | 55 (0.9%) |
| 40 to 44 Minutes | 9 (0.1%) | 50 (0.8%) |
| 45 to 59 Minutes | 202 (3.1%) | 180 (2.9%) |
| 60 to 89 Minutes | 82 (1.3%) | 23 (0.4%) |
| 90 or more Minutes | 26 (0.4%) | 65 (1.0%) |
Time of Departure to Work by Sex in Norfolk
The most frequent times of departure to work in Norfolk are 7:30 AM to 7:59 AM (1,048, 15.9%) for males and 7:30 AM to 7:59 AM (1,872, 30.1%) for females.
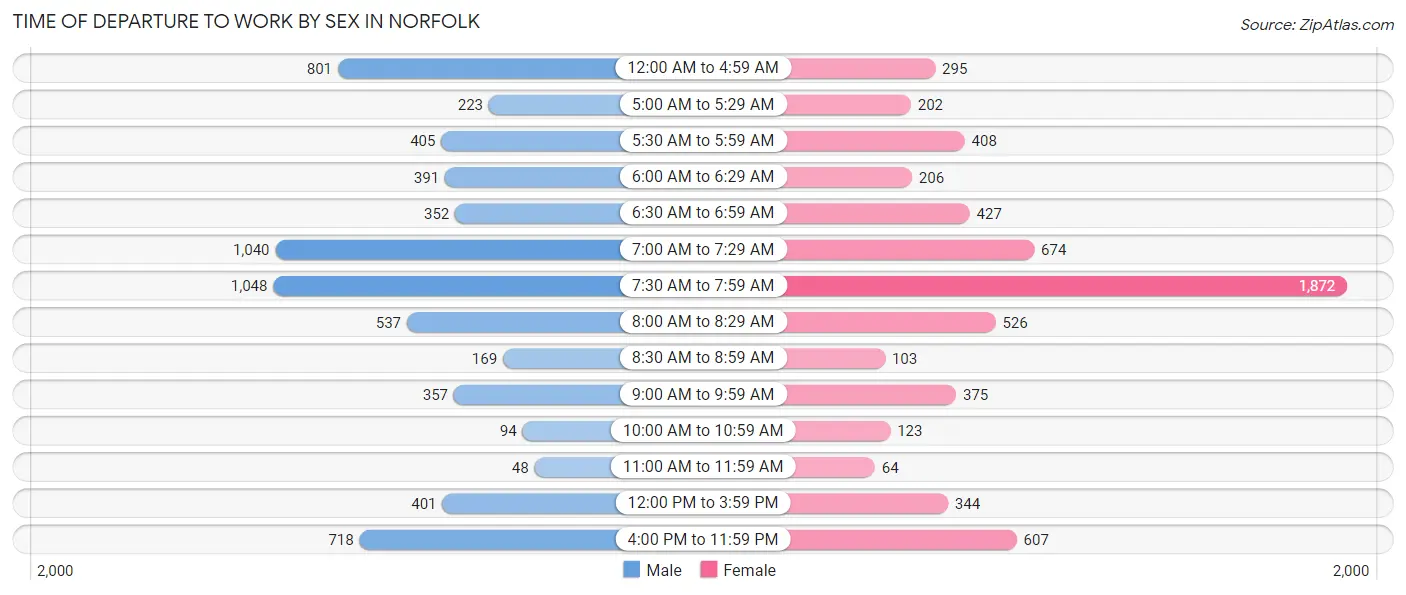
| Time of Departure | Male | Female |
| 12:00 AM to 4:59 AM | 801 (12.2%) | 295 (4.7%) |
| 5:00 AM to 5:29 AM | 223 (3.4%) | 202 (3.2%) |
| 5:30 AM to 5:59 AM | 405 (6.1%) | 408 (6.6%) |
| 6:00 AM to 6:29 AM | 391 (5.9%) | 206 (3.3%) |
| 6:30 AM to 6:59 AM | 352 (5.3%) | 427 (6.9%) |
| 7:00 AM to 7:29 AM | 1,040 (15.8%) | 674 (10.8%) |
| 7:30 AM to 7:59 AM | 1,048 (15.9%) | 1,872 (30.1%) |
| 8:00 AM to 8:29 AM | 537 (8.2%) | 526 (8.5%) |
| 8:30 AM to 8:59 AM | 169 (2.6%) | 103 (1.7%) |
| 9:00 AM to 9:59 AM | 357 (5.4%) | 375 (6.0%) |
| 10:00 AM to 10:59 AM | 94 (1.4%) | 123 (2.0%) |
| 11:00 AM to 11:59 AM | 48 (0.7%) | 64 (1.0%) |
| 12:00 PM to 3:59 PM | 401 (6.1%) | 344 (5.5%) |
| 4:00 PM to 11:59 PM | 718 (10.9%) | 607 (9.8%) |
| Total | 6,584 (100.0%) | 6,226 (100.0%) |
Housing Occupancy in Norfolk
Occupancy by Ownership in Norfolk
Of the total 10,660 dwellings in Norfolk, owner-occupied units account for 6,641 (62.3%), while renter-occupied units make up 4,019 (37.7%).
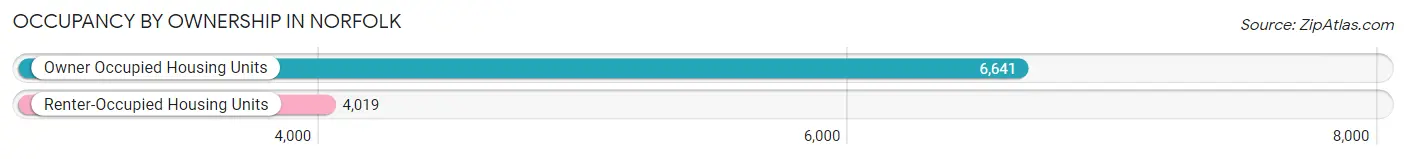
| Occupancy | # Housing Units | % Housing Units |
| Owner Occupied Housing Units | 6,641 | 62.3% |
| Renter-Occupied Housing Units | 4,019 | 37.7% |
| Total Occupied Housing Units | 10,660 | 100.0% |
Occupancy by Household Size in Norfolk
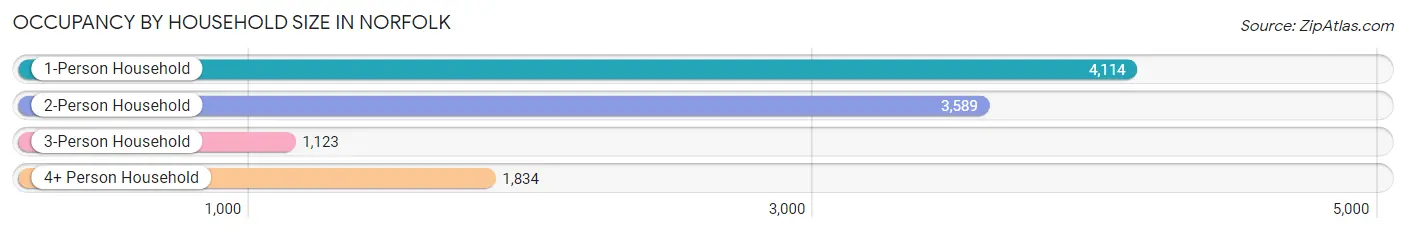
| Household Size | # Housing Units | % Housing Units |
| 1-Person Household | 4,114 | 38.6% |
| 2-Person Household | 3,589 | 33.7% |
| 3-Person Household | 1,123 | 10.5% |
| 4+ Person Household | 1,834 | 17.2% |
| Total Housing Units | 10,660 | 100.0% |
Occupancy by Ownership by Household Size in Norfolk
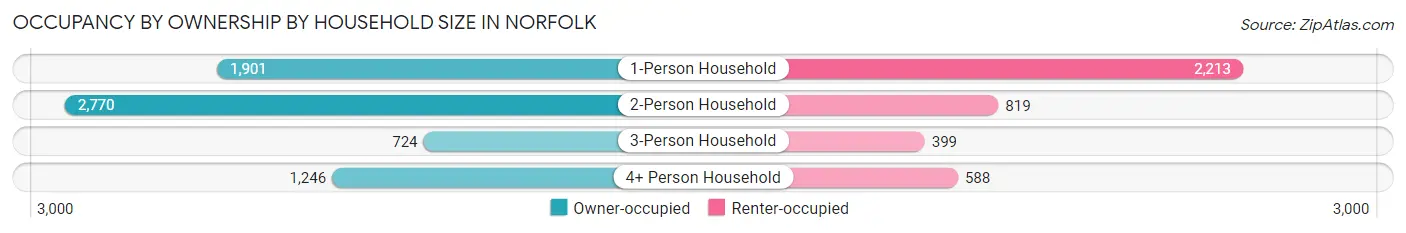
| Household Size | Owner-occupied | Renter-occupied |
| 1-Person Household | 1,901 (46.2%) | 2,213 (53.8%) |
| 2-Person Household | 2,770 (77.2%) | 819 (22.8%) |
| 3-Person Household | 724 (64.5%) | 399 (35.5%) |
| 4+ Person Household | 1,246 (67.9%) | 588 (32.1%) |
| Total Housing Units | 6,641 (62.3%) | 4,019 (37.7%) |
Occupancy by Educational Attainment in Norfolk
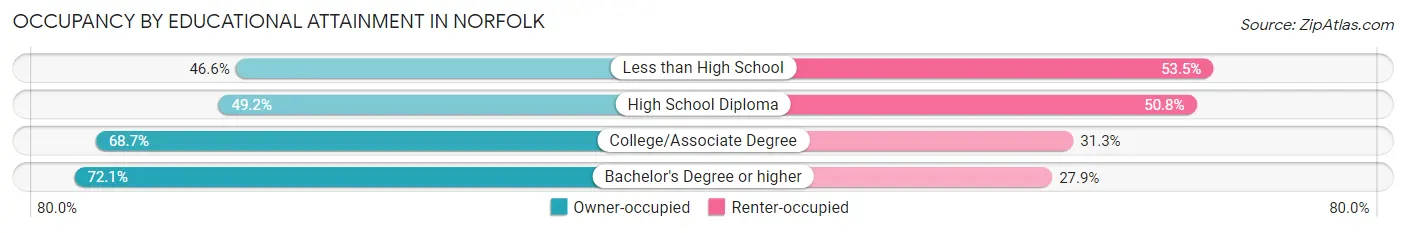
| Household Size | Owner-occupied | Renter-occupied |
| Less than High School | 250 (46.6%) | 287 (53.4%) |
| High School Diploma | 1,661 (49.2%) | 1,713 (50.8%) |
| College/Associate Degree | 2,755 (68.7%) | 1,254 (31.3%) |
| Bachelor's Degree or higher | 1,975 (72.1%) | 765 (27.9%) |
Occupancy by Age of Householder in Norfolk
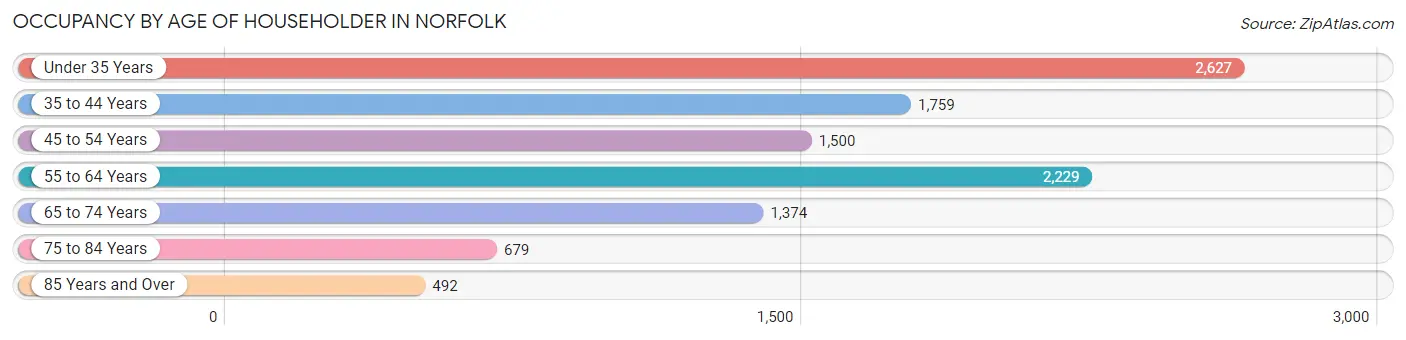
| Age Bracket | # Households | % Households |
| Under 35 Years | 2,627 | 24.6% |
| 35 to 44 Years | 1,759 | 16.5% |
| 45 to 54 Years | 1,500 | 14.1% |
| 55 to 64 Years | 2,229 | 20.9% |
| 65 to 74 Years | 1,374 | 12.9% |
| 75 to 84 Years | 679 | 6.4% |
| 85 Years and Over | 492 | 4.6% |
| Total | 10,660 | 100.0% |
Housing Finances in Norfolk
Median Income by Occupancy in Norfolk
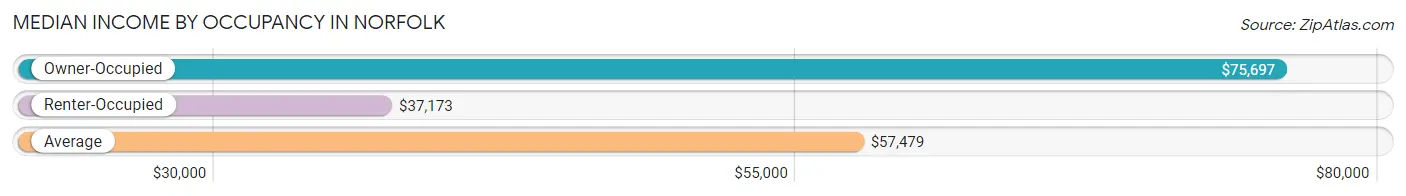
| Occupancy Type | # Households | Median Income |
| Owner-Occupied | 6,641 (62.3%) | $75,697 |
| Renter-Occupied | 4,019 (37.7%) | $37,173 |
| Average | 10,660 (100.0%) | $57,479 |
Occupancy by Householder Income Bracket in Norfolk
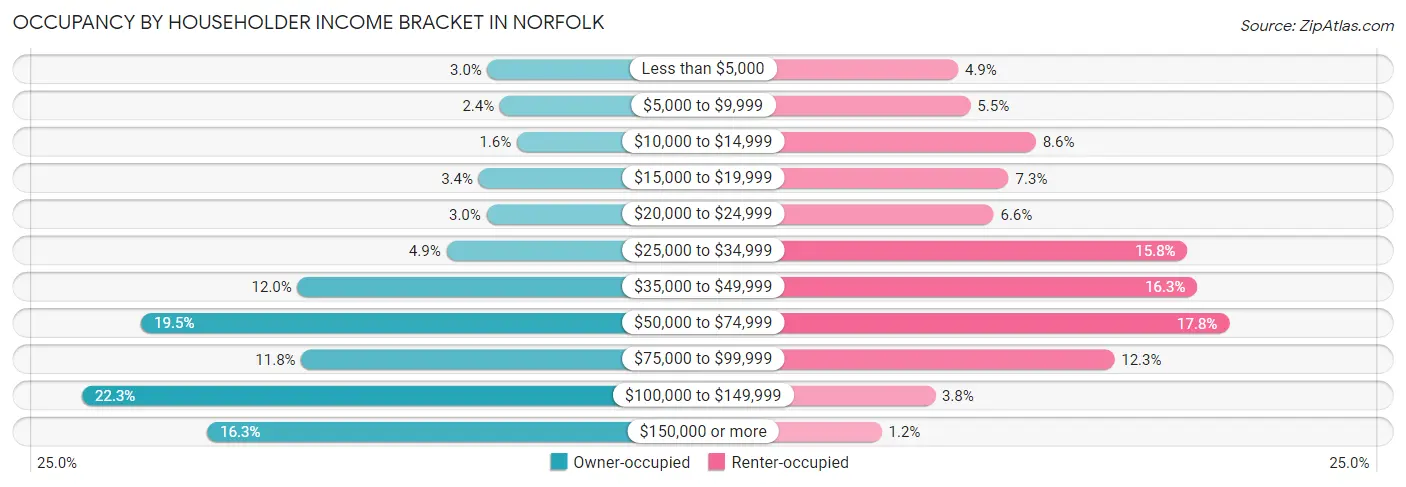
| Income Bracket | Owner-occupied | Renter-occupied |
| Less than $5,000 | 196 (2.9%) | 196 (4.9%) |
| $5,000 to $9,999 | 157 (2.4%) | 220 (5.5%) |
| $10,000 to $14,999 | 103 (1.5%) | 345 (8.6%) |
| $15,000 to $19,999 | 224 (3.4%) | 293 (7.3%) |
| $20,000 to $24,999 | 199 (3.0%) | 264 (6.6%) |
| $25,000 to $34,999 | 326 (4.9%) | 635 (15.8%) |
| $35,000 to $49,999 | 797 (12.0%) | 654 (16.3%) |
| $50,000 to $74,999 | 1,292 (19.5%) | 715 (17.8%) |
| $75,000 to $99,999 | 785 (11.8%) | 495 (12.3%) |
| $100,000 to $149,999 | 1,479 (22.3%) | 152 (3.8%) |
| $150,000 or more | 1,083 (16.3%) | 50 (1.2%) |
| Total | 6,641 (100.0%) | 4,019 (100.0%) |
Monthly Housing Cost Tiers in Norfolk
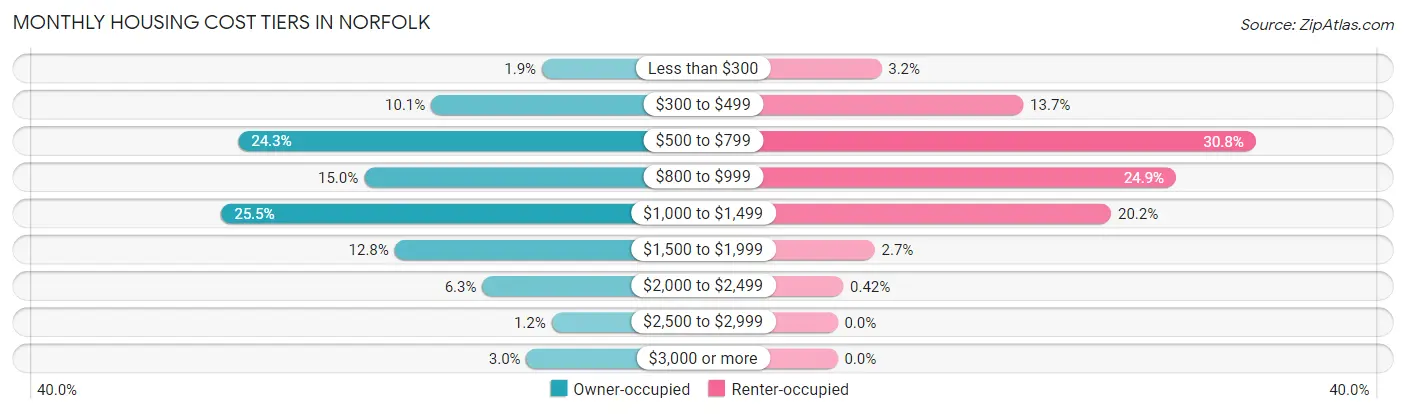
| Monthly Cost | Owner-occupied | Renter-occupied |
| Less than $300 | 126 (1.9%) | 130 (3.2%) |
| $300 to $499 | 668 (10.1%) | 550 (13.7%) |
| $500 to $799 | 1,611 (24.3%) | 1,238 (30.8%) |
| $800 to $999 | 996 (15.0%) | 1,002 (24.9%) |
| $1,000 to $1,499 | 1,694 (25.5%) | 810 (20.2%) |
| $1,500 to $1,999 | 847 (12.8%) | 110 (2.7%) |
| $2,000 to $2,499 | 418 (6.3%) | 17 (0.4%) |
| $2,500 to $2,999 | 79 (1.2%) | 0 (0.0%) |
| $3,000 or more | 202 (3.0%) | 0 (0.0%) |
| Total | 6,641 (100.0%) | 4,019 (100.0%) |
Physical Housing Characteristics in Norfolk
Housing Structures in Norfolk
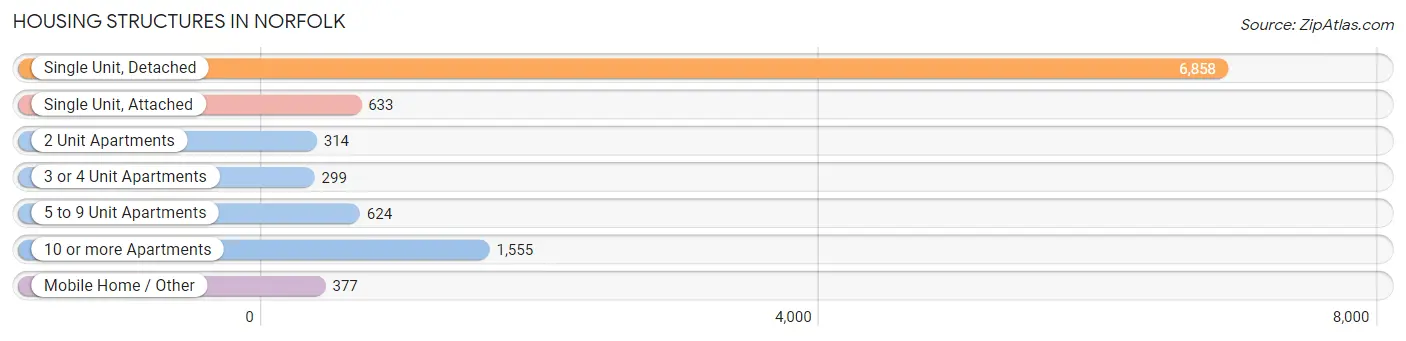
| Structure Type | # Housing Units | % Housing Units |
| Single Unit, Detached | 6,858 | 64.3% |
| Single Unit, Attached | 633 | 5.9% |
| 2 Unit Apartments | 314 | 2.9% |
| 3 or 4 Unit Apartments | 299 | 2.8% |
| 5 to 9 Unit Apartments | 624 | 5.9% |
| 10 or more Apartments | 1,555 | 14.6% |
| Mobile Home / Other | 377 | 3.5% |
| Total | 10,660 | 100.0% |
Housing Structures by Occupancy in Norfolk
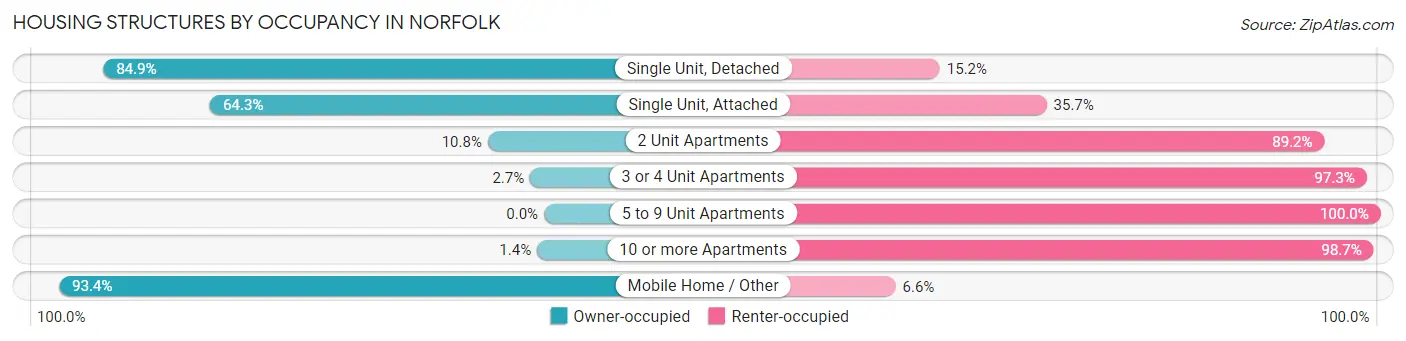
| Structure Type | Owner-occupied | Renter-occupied |
| Single Unit, Detached | 5,819 (84.9%) | 1,039 (15.1%) |
| Single Unit, Attached | 407 (64.3%) | 226 (35.7%) |
| 2 Unit Apartments | 34 (10.8%) | 280 (89.2%) |
| 3 or 4 Unit Apartments | 8 (2.7%) | 291 (97.3%) |
| 5 to 9 Unit Apartments | 0 (0.0%) | 624 (100.0%) |
| 10 or more Apartments | 21 (1.3%) | 1,534 (98.7%) |
| Mobile Home / Other | 352 (93.4%) | 25 (6.6%) |
| Total | 6,641 (62.3%) | 4,019 (37.7%) |
Housing Structures by Number of Rooms in Norfolk
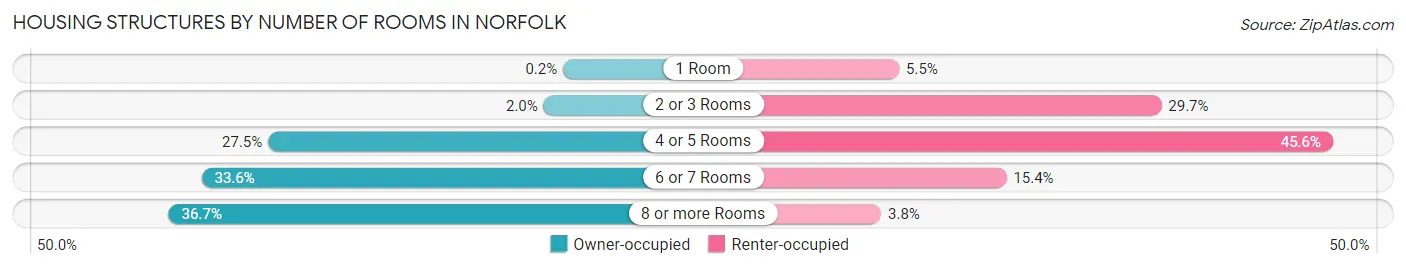
| Number of Rooms | Owner-occupied | Renter-occupied |
| 1 Room | 13 (0.2%) | 220 (5.5%) |
| 2 or 3 Rooms | 133 (2.0%) | 1,195 (29.7%) |
| 4 or 5 Rooms | 1,825 (27.5%) | 1,832 (45.6%) |
| 6 or 7 Rooms | 2,234 (33.6%) | 619 (15.4%) |
| 8 or more Rooms | 2,436 (36.7%) | 153 (3.8%) |
| Total | 6,641 (100.0%) | 4,019 (100.0%) |
Housing Structure by Heating Type in Norfolk
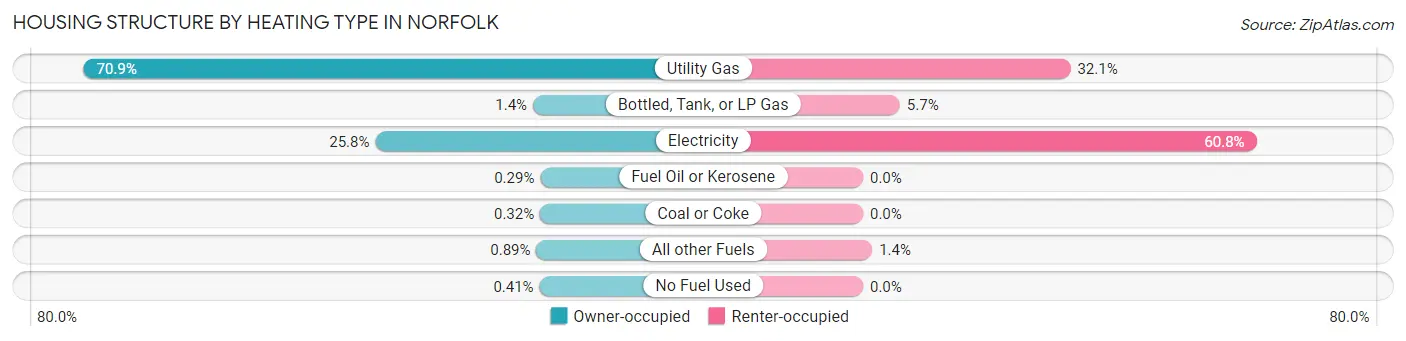
| Heating Type | Owner-occupied | Renter-occupied |
| Utility Gas | 4,708 (70.9%) | 1,289 (32.1%) |
| Bottled, Tank, or LP Gas | 94 (1.4%) | 229 (5.7%) |
| Electricity | 1,713 (25.8%) | 2,444 (60.8%) |
| Fuel Oil or Kerosene | 19 (0.3%) | 0 (0.0%) |
| Coal or Coke | 21 (0.3%) | 0 (0.0%) |
| All other Fuels | 59 (0.9%) | 57 (1.4%) |
| No Fuel Used | 27 (0.4%) | 0 (0.0%) |
| Total | 6,641 (100.0%) | 4,019 (100.0%) |
Household Vehicle Usage in Norfolk
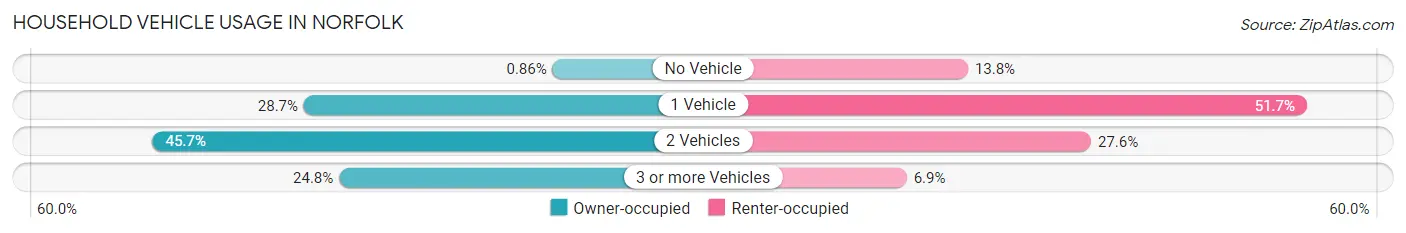
| Vehicles per Household | Owner-occupied | Renter-occupied |
| No Vehicle | 57 (0.9%) | 554 (13.8%) |
| 1 Vehicle | 1,907 (28.7%) | 2,079 (51.7%) |
| 2 Vehicles | 3,032 (45.7%) | 1,108 (27.6%) |
| 3 or more Vehicles | 1,645 (24.8%) | 278 (6.9%) |
| Total | 6,641 (100.0%) | 4,019 (100.0%) |
Real Estate & Mortgages in Norfolk
Real Estate and Mortgage Overview in Norfolk
| Characteristic | Without Mortgage | With Mortgage |
| Housing Units | 3,008 | 3,633 |
| Median Property Value | $204,000 | $187,600 |
| Median Household Income | $59,430 | $705 |
| Monthly Housing Costs | $628 | $202 |
| Real Estate Taxes | $3,003 | $134 |
Property Value by Mortgage Status in Norfolk
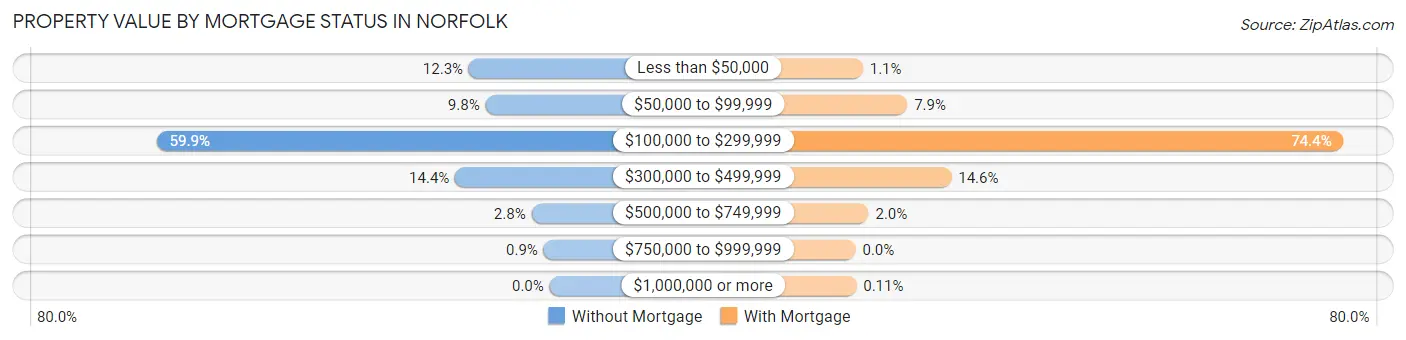
| Property Value | Without Mortgage | With Mortgage |
| Less than $50,000 | 370 (12.3%) | 40 (1.1%) |
| $50,000 to $99,999 | 294 (9.8%) | 286 (7.9%) |
| $100,000 to $299,999 | 1,801 (59.9%) | 2,701 (74.4%) |
| $300,000 to $499,999 | 433 (14.4%) | 530 (14.6%) |
| $500,000 to $749,999 | 83 (2.8%) | 72 (2.0%) |
| $750,000 to $999,999 | 27 (0.9%) | 0 (0.0%) |
| $1,000,000 or more | 0 (0.0%) | 4 (0.1%) |
| Total | 3,008 (100.0%) | 3,633 (100.0%) |
Household Income by Mortgage Status in Norfolk
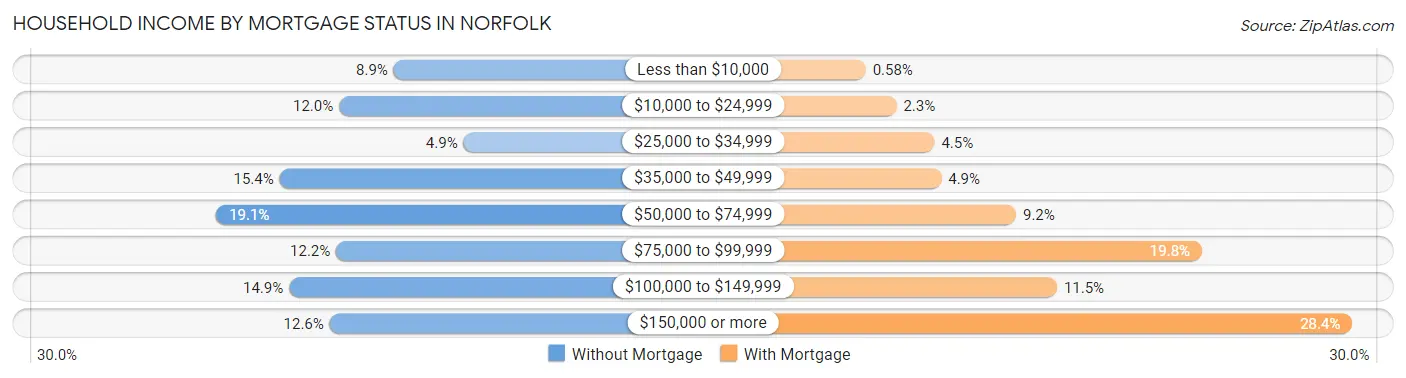
| Household Income | Without Mortgage | With Mortgage |
| Less than $10,000 | 268 (8.9%) | 21 (0.6%) |
| $10,000 to $24,999 | 362 (12.0%) | 85 (2.3%) |
| $25,000 to $34,999 | 148 (4.9%) | 164 (4.5%) |
| $35,000 to $49,999 | 464 (15.4%) | 178 (4.9%) |
| $50,000 to $74,999 | 573 (19.1%) | 333 (9.2%) |
| $75,000 to $99,999 | 367 (12.2%) | 719 (19.8%) |
| $100,000 to $149,999 | 448 (14.9%) | 418 (11.5%) |
| $150,000 or more | 378 (12.6%) | 1,031 (28.4%) |
| Total | 3,008 (100.0%) | 3,633 (100.0%) |
Property Value to Household Income Ratio in Norfolk
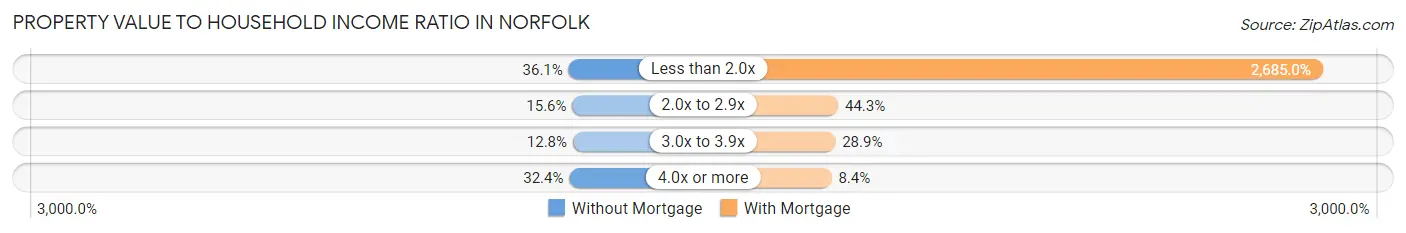
| Value-to-Income Ratio | Without Mortgage | With Mortgage |
| Less than 2.0x | 1,086 (36.1%) | 97,546 (2,685.0%) |
| 2.0x to 2.9x | 470 (15.6%) | 1,608 (44.3%) |
| 3.0x to 3.9x | 385 (12.8%) | 1,048 (28.8%) |
| 4.0x or more | 975 (32.4%) | 306 (8.4%) |
| Total | 3,008 (100.0%) | 3,633 (100.0%) |
Real Estate Taxes by Mortgage Status in Norfolk
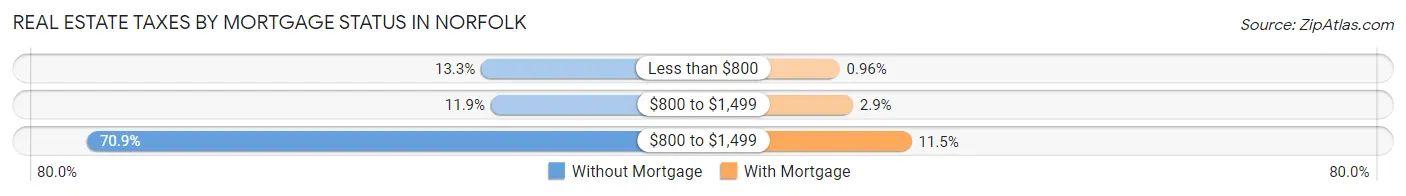
| Property Taxes | Without Mortgage | With Mortgage |
| Less than $800 | 400 (13.3%) | 35 (1.0%) |
| $800 to $1,499 | 357 (11.9%) | 105 (2.9%) |
| $800 to $1,499 | 2,132 (70.9%) | 417 (11.5%) |
| Total | 3,008 (100.0%) | 3,633 (100.0%) |
Health & Disability in Norfolk
Health Insurance Coverage by Age in Norfolk
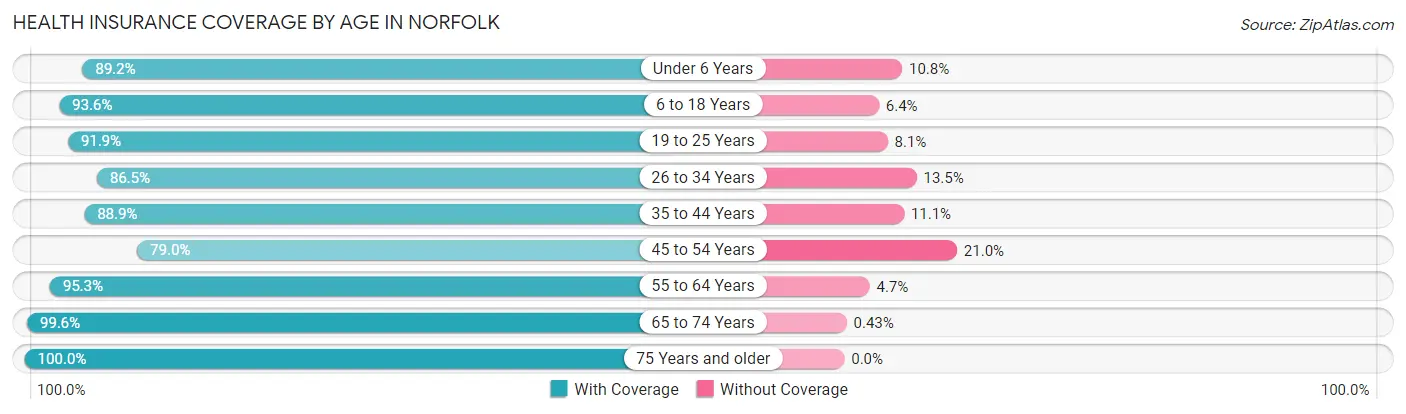
| Age Bracket | With Coverage | Without Coverage |
| Under 6 Years | 2,104 (89.2%) | 254 (10.8%) |
| 6 to 18 Years | 4,079 (93.6%) | 281 (6.4%) |
| 19 to 25 Years | 2,346 (91.9%) | 206 (8.1%) |
| 26 to 34 Years | 2,569 (86.5%) | 400 (13.5%) |
| 35 to 44 Years | 2,717 (88.9%) | 340 (11.1%) |
| 45 to 54 Years | 2,190 (79.0%) | 582 (21.0%) |
| 55 to 64 Years | 3,396 (95.3%) | 168 (4.7%) |
| 65 to 74 Years | 2,105 (99.6%) | 9 (0.4%) |
| 75 Years and older | 1,715 (100.0%) | 0 (0.0%) |
| Total | 23,221 (91.2%) | 2,240 (8.8%) |
Health Insurance Coverage by Citizenship Status in Norfolk
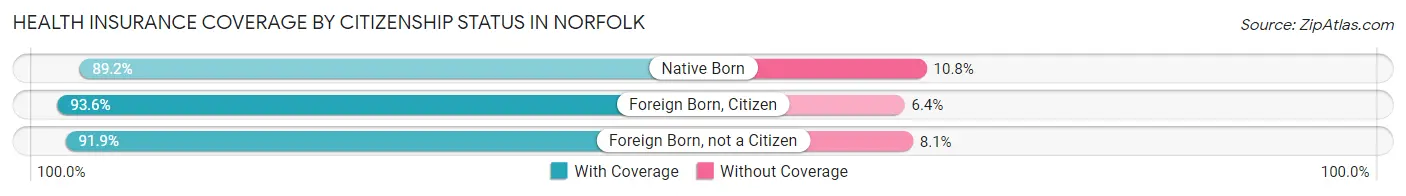
| Citizenship Status | With Coverage | Without Coverage |
| Native Born | 2,104 (89.2%) | 254 (10.8%) |
| Foreign Born, Citizen | 4,079 (93.6%) | 281 (6.4%) |
| Foreign Born, not a Citizen | 2,346 (91.9%) | 206 (8.1%) |
Health Insurance Coverage by Household Income in Norfolk
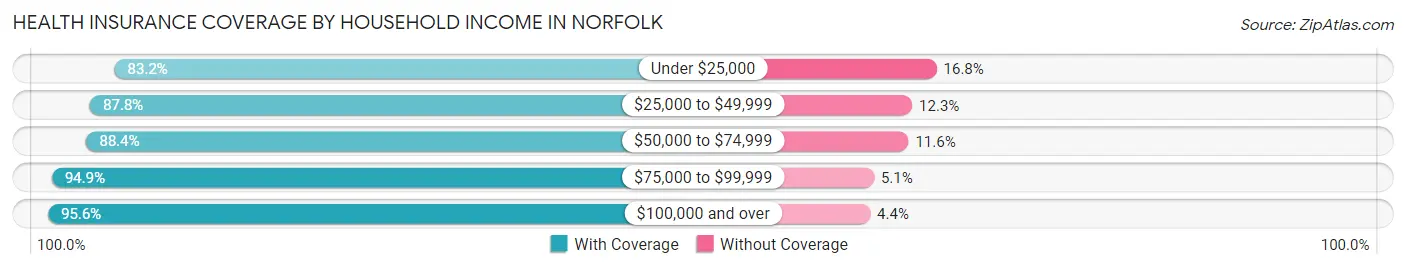
| Household Income | With Coverage | Without Coverage |
| Under $25,000 | 2,451 (83.2%) | 496 (16.8%) |
| $25,000 to $49,999 | 4,170 (87.7%) | 582 (12.2%) |
| $50,000 to $74,999 | 4,338 (88.4%) | 567 (11.6%) |
| $75,000 to $99,999 | 2,985 (94.9%) | 160 (5.1%) |
| $100,000 and over | 8,861 (95.6%) | 406 (4.4%) |
Public vs Private Health Insurance Coverage by Age in Norfolk
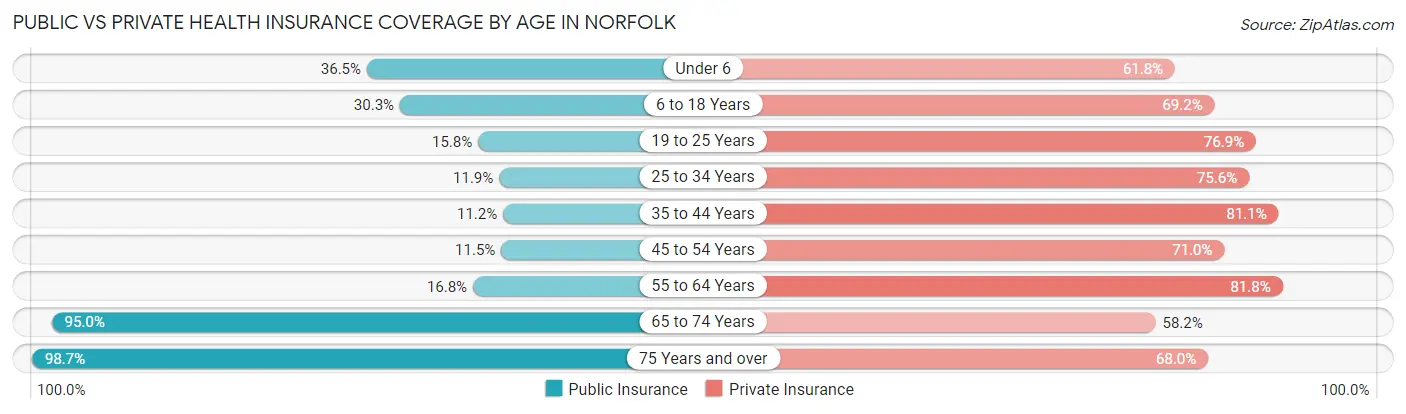
| Age Bracket | Public Insurance | Private Insurance |
| Under 6 | 860 (36.5%) | 1,458 (61.8%) |
| 6 to 18 Years | 1,323 (30.3%) | 3,016 (69.2%) |
| 19 to 25 Years | 404 (15.8%) | 1,962 (76.9%) |
| 25 to 34 Years | 354 (11.9%) | 2,244 (75.6%) |
| 35 to 44 Years | 342 (11.2%) | 2,478 (81.1%) |
| 45 to 54 Years | 320 (11.5%) | 1,968 (71.0%) |
| 55 to 64 Years | 598 (16.8%) | 2,915 (81.8%) |
| 65 to 74 Years | 2,008 (95.0%) | 1,231 (58.2%) |
| 75 Years and over | 1,692 (98.7%) | 1,166 (68.0%) |
| Total | 7,901 (31.0%) | 18,438 (72.4%) |
Disability Status by Sex by Age in Norfolk
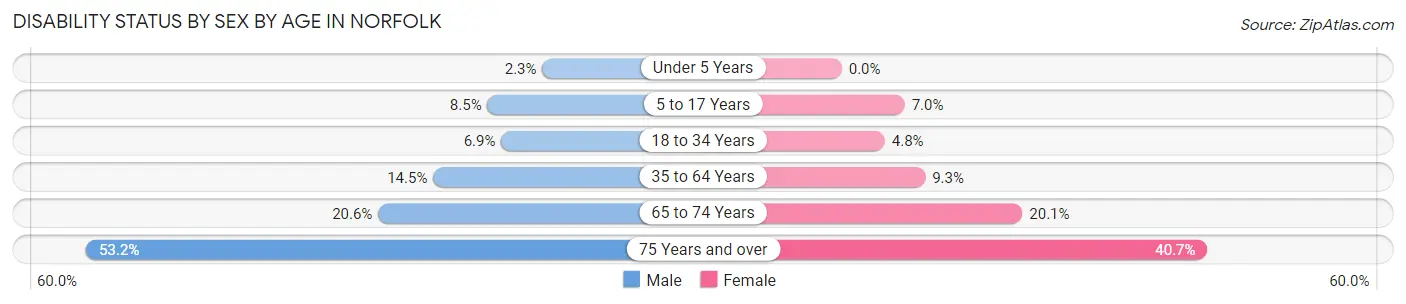
| Age Bracket | Male | Female |
| Under 5 Years | 21 (2.3%) | 0 (0.0%) |
| 5 to 17 Years | 186 (8.5%) | 156 (7.0%) |
| 18 to 34 Years | 210 (6.9%) | 142 (4.8%) |
| 35 to 64 Years | 703 (14.5%) | 422 (9.3%) |
| 65 to 74 Years | 201 (20.6%) | 229 (20.1%) |
| 75 Years and over | 345 (53.2%) | 434 (40.7%) |
Disability Class by Sex by Age in Norfolk
Disability Class: Hearing Difficulty
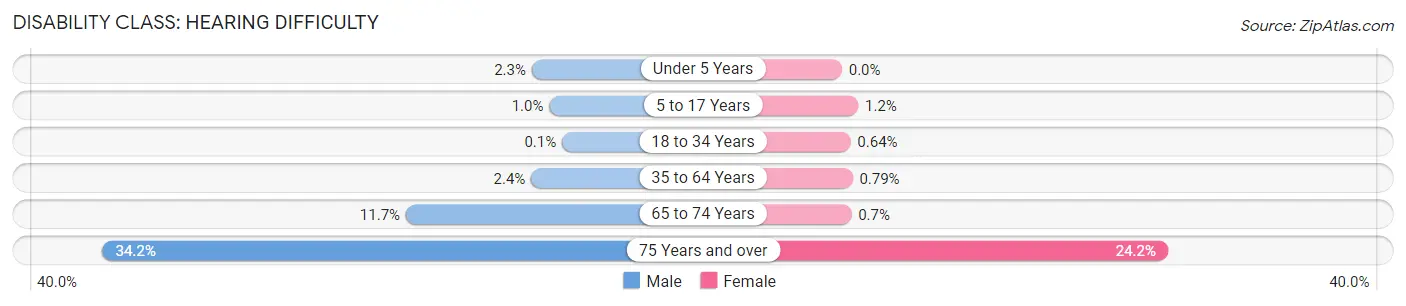
| Age Bracket | Male | Female |
| Under 5 Years | 21 (2.3%) | 0 (0.0%) |
| 5 to 17 Years | 23 (1.0%) | 27 (1.2%) |
| 18 to 34 Years | 3 (0.1%) | 19 (0.6%) |
| 35 to 64 Years | 116 (2.4%) | 36 (0.8%) |
| 65 to 74 Years | 114 (11.7%) | 8 (0.7%) |
| 75 Years and over | 222 (34.2%) | 258 (24.2%) |
Disability Class: Vision Difficulty
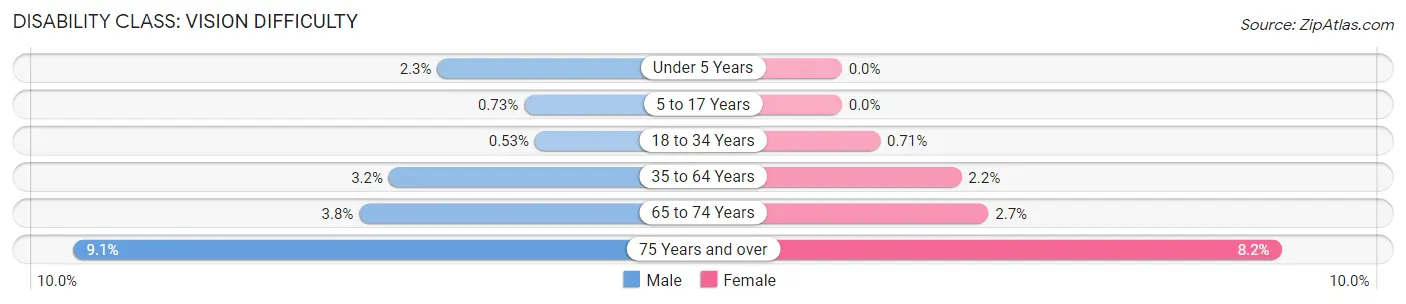
| Age Bracket | Male | Female |
| Under 5 Years | 21 (2.3%) | 0 (0.0%) |
| 5 to 17 Years | 16 (0.7%) | 0 (0.0%) |
| 18 to 34 Years | 16 (0.5%) | 21 (0.7%) |
| 35 to 64 Years | 157 (3.2%) | 101 (2.2%) |
| 65 to 74 Years | 37 (3.8%) | 31 (2.7%) |
| 75 Years and over | 59 (9.1%) | 87 (8.2%) |
Disability Class: Cognitive Difficulty
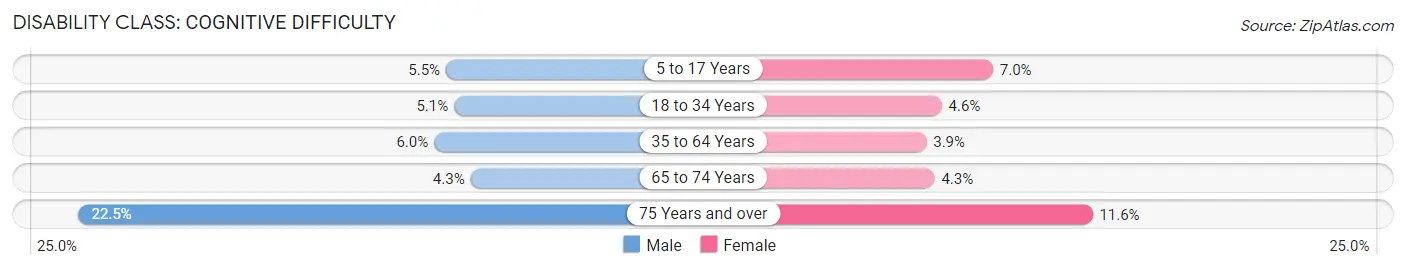
| Age Bracket | Male | Female |
| 5 to 17 Years | 120 (5.4%) | 156 (7.0%) |
| 18 to 34 Years | 154 (5.1%) | 137 (4.6%) |
| 35 to 64 Years | 291 (6.0%) | 178 (3.9%) |
| 65 to 74 Years | 42 (4.3%) | 49 (4.3%) |
| 75 Years and over | 146 (22.5%) | 124 (11.6%) |
Disability Class: Ambulatory Difficulty
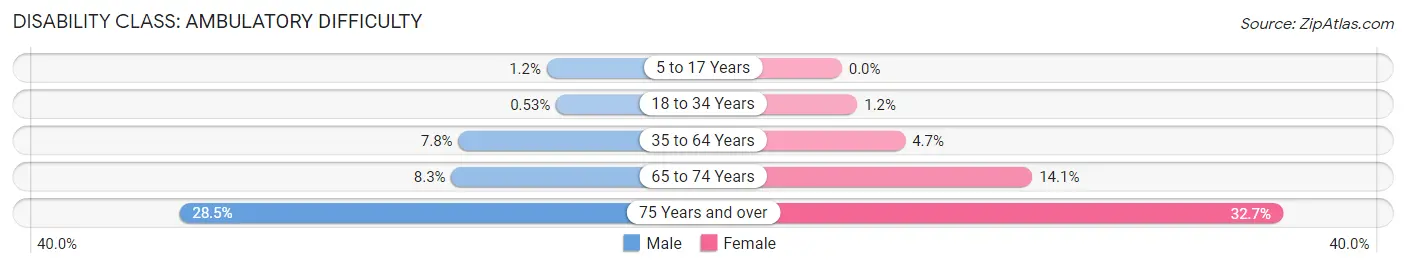
| Age Bracket | Male | Female |
| 5 to 17 Years | 27 (1.2%) | 0 (0.0%) |
| 18 to 34 Years | 16 (0.5%) | 34 (1.1%) |
| 35 to 64 Years | 378 (7.8%) | 214 (4.7%) |
| 65 to 74 Years | 81 (8.3%) | 161 (14.1%) |
| 75 Years and over | 185 (28.5%) | 349 (32.7%) |
Disability Class: Self-Care Difficulty
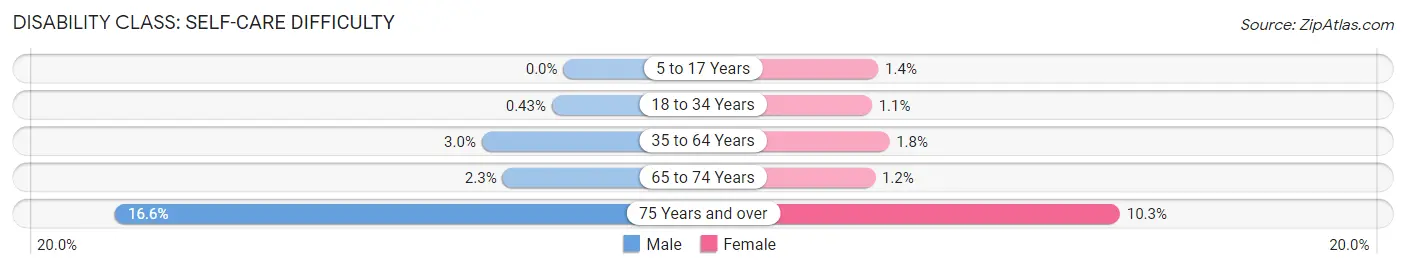
| Age Bracket | Male | Female |
| 5 to 17 Years | 0 (0.0%) | 30 (1.3%) |
| 18 to 34 Years | 13 (0.4%) | 33 (1.1%) |
| 35 to 64 Years | 147 (3.0%) | 80 (1.8%) |
| 65 to 74 Years | 22 (2.3%) | 14 (1.2%) |
| 75 Years and over | 108 (16.6%) | 110 (10.3%) |
Technology Access in Norfolk
Computing Device Access in Norfolk
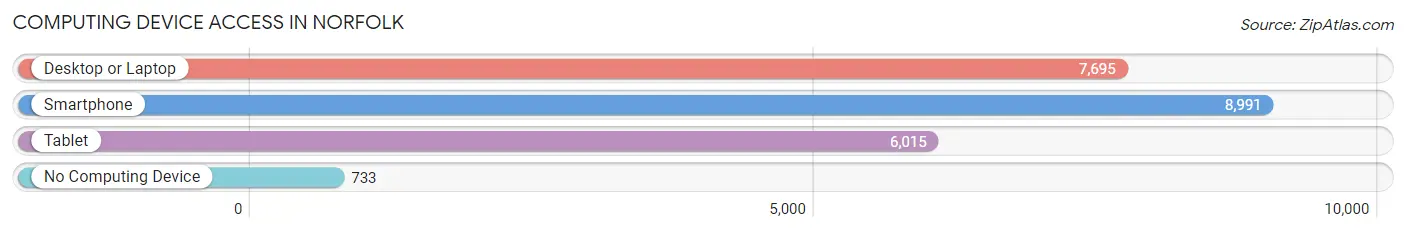
| Device Type | # Households | % Households |
| Desktop or Laptop | 7,695 | 72.2% |
| Smartphone | 8,991 | 84.3% |
| Tablet | 6,015 | 56.4% |
| No Computing Device | 733 | 6.9% |
| Total | 10,660 | 100.0% |
Internet Access in Norfolk
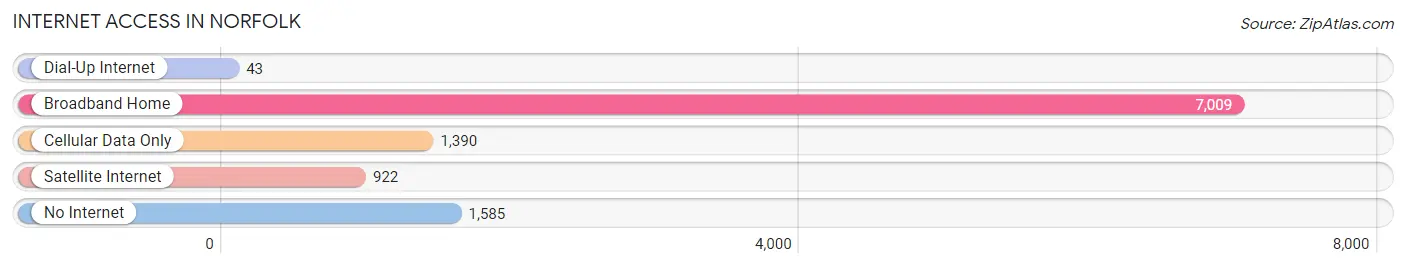
| Internet Type | # Households | % Households |
| Dial-Up Internet | 43 | 0.4% |
| Broadband Home | 7,009 | 65.7% |
| Cellular Data Only | 1,390 | 13.0% |
| Satellite Internet | 922 | 8.6% |
| No Internet | 1,585 | 14.9% |
| Total | 10,660 | 100.0% |
Norfolk Summary
Norfolk, Nebraska is a city located in Madison County in the northeastern part of the state. It is the county seat and the largest city in the county. The city is located on the Elkhorn River and is part of the Norfolk Micropolitan Statistical Area. As of the 2010 census, the population of Norfolk was 24,210, making it the ninth-largest city in Nebraska.
History
The area that is now Norfolk was first settled in 1866 by a group of settlers from Ohio. The city was originally named “Madison” after the county in which it was located. In 1883, the name was changed to “Norfolk” after the city of Norfolk, Virginia. The city was officially incorporated in 1884.
In the late 19th century, Norfolk was a major railroad hub, with the Chicago, Burlington & Quincy Railroad running through the city. This allowed the city to become a major shipping center for the region. The city also became a major agricultural center, with the surrounding area producing a variety of crops, including corn, wheat, and soybeans.
In the early 20th century, Norfolk became a major industrial center, with the establishment of several factories, including a sugar beet processing plant, a flour mill, and a meat packing plant. The city also became a major center for the production of agricultural equipment.
Geography
Norfolk is located in northeastern Nebraska, in Madison County. The city is situated on the Elkhorn River, which flows through the city from north to south. The city is located approximately 90 miles northwest of Omaha and 130 miles northeast of Lincoln.
The city has a total area of 11.2 square miles, of which 11.1 square miles is land and 0.1 square miles is water. The city is located in the Central Plains region of the United States, and has a humid continental climate, with hot summers and cold winters.
Economy
Norfolk’s economy is largely based on agriculture and manufacturing. The city is home to several major employers, including the Norfolk Iron & Metal Company, the Norfolk Daily News, and the Norfolk Public Schools. The city is also home to several smaller businesses, including retail stores, restaurants, and service providers.
The city is also home to several major industries, including food processing, metal fabrication, and agricultural equipment manufacturing. The city is also home to several major employers in the healthcare industry, including Faith Regional Health Services and the Norfolk VA Medical Center.
Demographics
As of the 2010 census, the population of Norfolk was 24,210. The racial makeup of the city was 90.2% White, 4.2% African American, 0.7% Native American, 1.2% Asian, 0.1% Pacific Islander, 1.7% from other races, and 1.9% from two or more races. Hispanic or Latino of any race were 4.3% of the population.
The median income for a household in the city was $41,945, and the median income for a family was $50,945. The per capita income for the city was $20,945. About 8.2% of families and 10.7% of the population were below the poverty line, including 14.2% of those under age 18 and 8.2% of those age 65 or over.
Common Questions
What is Per Capita Income in Norfolk?
Per Capita income in Norfolk is $35,657.
What is the Median Family Income in Norfolk?
Median Family Income in Norfolk is $85,107.
What is the Median Household income in Norfolk?
Median Household Income in Norfolk is $57,479.
What is Income or Wage Gap in Norfolk?
Income or Wage Gap in Norfolk is 29.7%.
Women in Norfolk earn 70.3 cents for every dollar earned by a man.
What is Family Income Deficit in Norfolk?
Family Income Deficit in Norfolk is $12,039.
Families that are below poverty line in Norfolk earn $12,039 less on average than the poverty threshold level.
What is Inequality or Gini Index in Norfolk?
Inequality or Gini Index in Norfolk is 0.49.
What is the Total Population of Norfolk?
Total Population of Norfolk is 25,883.
What is the Total Male Population of Norfolk?
Total Male Population of Norfolk is 12,832.
What is the Total Female Population of Norfolk?
Total Female Population of Norfolk is 13,051.
What is the Ratio of Males per 100 Females in Norfolk?
There are 98.32 Males per 100 Females in Norfolk.
What is the Ratio of Females per 100 Males in Norfolk?
There are 101.71 Females per 100 Males in Norfolk.
What is the Median Population Age in Norfolk?
Median Population Age in Norfolk is 36.8 Years.
What is the Average Family Size in Norfolk
Average Family Size in Norfolk is 3.2 People.
What is the Average Household Size in Norfolk
Average Household Size in Norfolk is 2.4 People.
How Large is the Labor Force in Norfolk?
There are 13,770 People in the Labor Forcein in Norfolk.
What is the Percentage of People in the Labor Force in Norfolk?
68.1% of People are in the Labor Force in Norfolk.
What is the Unemployment Rate in Norfolk?
Unemployment Rate in Norfolk is 2.6%.