La Vergne, TN Map & Demographics
La Vergne Map
La Vergne Overview
$30,519
PER CAPITA INCOME
$81,626
AVG FAMILY INCOME
$77,531
AVG HOUSEHOLD INCOME
17.1%
WAGE / INCOME GAP [ % ]
82.9¢/ $1
WAGE / INCOME GAP [ $ ]
0.38
INEQUALITY / GINI INDEX
38,553
TOTAL POPULATION
19,227
MALE POPULATION
19,326
FEMALE POPULATION
99.49
MALES / 100 FEMALES
100.51
FEMALES / 100 MALES
32.8
MEDIAN AGE
3.4
AVG FAMILY SIZE
3.0
AVG HOUSEHOLD SIZE
21,310
LABOR FORCE [ PEOPLE ]
74.4%
PERCENT IN LABOR FORCE
4.0%
UNEMPLOYMENT RATE
La Vergne Zip Codes
La Vergne Area Codes
Income in La Vergne
Income Overview in La Vergne
Per Capita Income in La Vergne is $30,519, while median incomes of families and households are $81,626 and $77,531 respectively.
| Characteristic | Number | Measure |
| Per Capita Income | 38,553 | $30,519 |
| Median Family Income | 10,063 | $81,626 |
| Mean Family Income | 10,063 | $91,504 |
| Median Household Income | 12,980 | $77,531 |
| Mean Household Income | 12,980 | $88,675 |
| Income Deficit | 10,063 | $0 |
| Wage / Income Gap (%) | 38,553 | 17.05% |
| Wage / Income Gap ($) | 38,553 | 82.95¢ per $1 |
| Gini / Inequality Index | 38,553 | 0.38 |
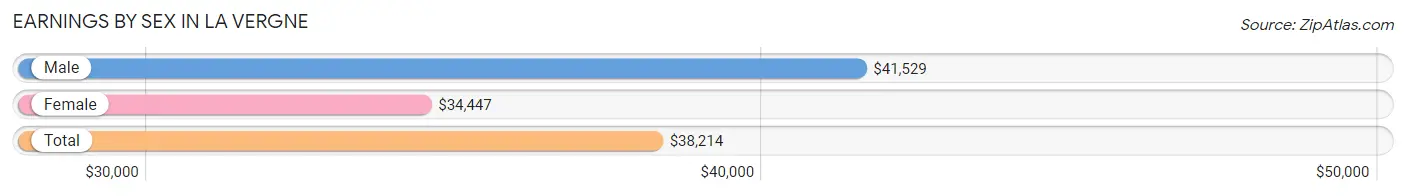
Earnings by Sex in La Vergne
Average Earnings in La Vergne are $38,214, $41,529 for men and $34,447 for women, a difference of 17.1%.
| Sex | Number | Average Earnings |
| Male | 12,026 (54.8%) | $41,529 |
| Female | 9,924 (45.2%) | $34,447 |
| Total | 21,950 (100.0%) | $38,214 |
Earnings by Sex by Income Bracket in La Vergne
The most common earnings brackets in La Vergne are $75,000 to $99,999 for men (1,583 | 13.2%) and $45,000 to $49,999 for women (935 | 9.4%).
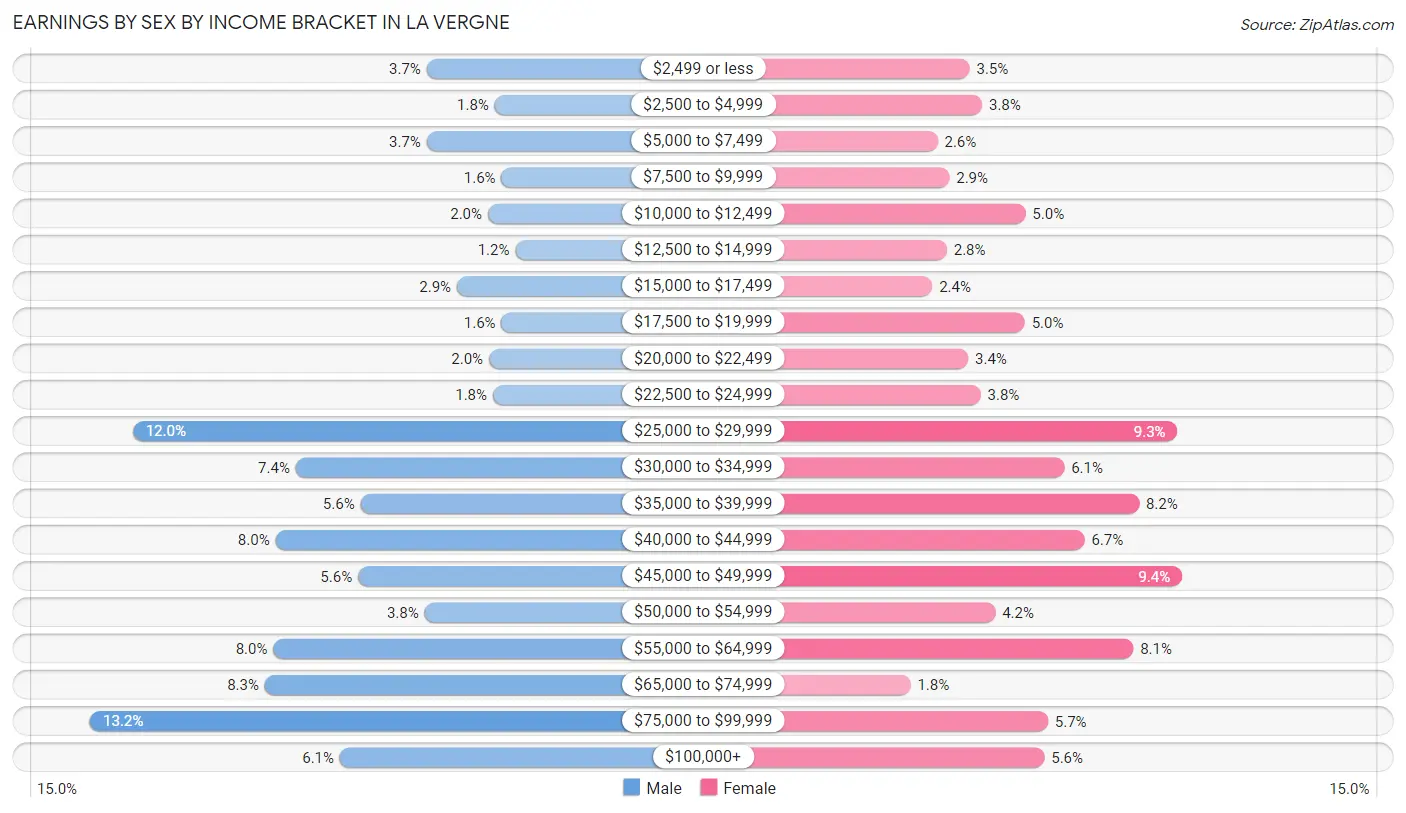
| Income | Male | Female |
| $2,499 or less | 445 (3.7%) | 342 (3.5%) |
| $2,500 to $4,999 | 215 (1.8%) | 377 (3.8%) |
| $5,000 to $7,499 | 445 (3.7%) | 253 (2.5%) |
| $7,500 to $9,999 | 192 (1.6%) | 286 (2.9%) |
| $10,000 to $12,499 | 238 (2.0%) | 498 (5.0%) |
| $12,500 to $14,999 | 145 (1.2%) | 279 (2.8%) |
| $15,000 to $17,499 | 343 (2.9%) | 238 (2.4%) |
| $17,500 to $19,999 | 193 (1.6%) | 496 (5.0%) |
| $20,000 to $22,499 | 234 (1.9%) | 338 (3.4%) |
| $22,500 to $24,999 | 221 (1.8%) | 373 (3.8%) |
| $25,000 to $29,999 | 1,438 (12.0%) | 922 (9.3%) |
| $30,000 to $34,999 | 887 (7.4%) | 606 (6.1%) |
| $35,000 to $39,999 | 669 (5.6%) | 815 (8.2%) |
| $40,000 to $44,999 | 956 (8.0%) | 663 (6.7%) |
| $45,000 to $49,999 | 677 (5.6%) | 935 (9.4%) |
| $50,000 to $54,999 | 452 (3.8%) | 414 (4.2%) |
| $55,000 to $64,999 | 963 (8.0%) | 799 (8.1%) |
| $65,000 to $74,999 | 992 (8.3%) | 178 (1.8%) |
| $75,000 to $99,999 | 1,583 (13.2%) | 561 (5.7%) |
| $100,000+ | 738 (6.1%) | 551 (5.6%) |
| Total | 12,026 (100.0%) | 9,924 (100.0%) |
Earnings by Sex by Educational Attainment in La Vergne
Average earnings in La Vergne are $45,196 for men and $39,626 for women, a difference of 12.3%. Men with an educational attainment of graduate degree enjoy the highest average annual earnings of $70,792, while those with less than high school education earn the least with $37,566. Women with an educational attainment of graduate degree earn the most with the average annual earnings of $58,800, while those with less than high school education have the smallest earnings of $31,326.
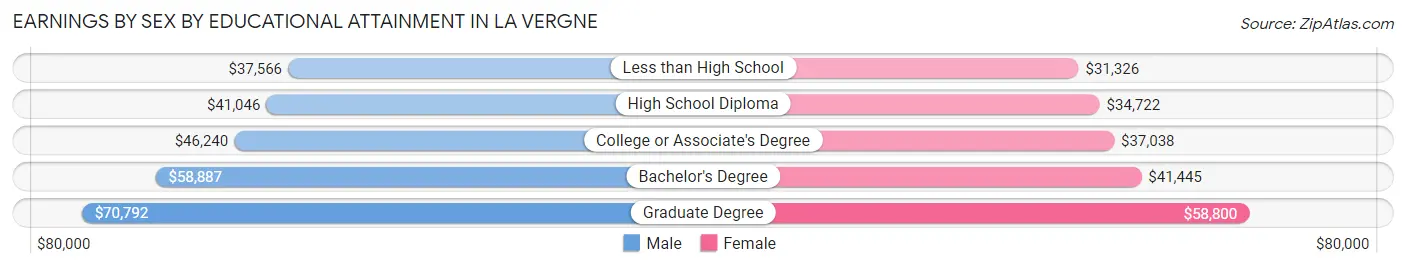
| Educational Attainment | Male Income | Female Income |
| Less than High School | $37,566 | $31,326 |
| High School Diploma | $41,046 | $34,722 |
| College or Associate's Degree | $46,240 | $37,038 |
| Bachelor's Degree | $58,887 | $41,445 |
| Graduate Degree | $70,792 | $58,800 |
| Total | $45,196 | $39,626 |
Family Income in La Vergne
Family Income Brackets in La Vergne
According to the La Vergne family income data, there are 2,405 families falling into the $100,000 to $149,999 income range, which is the most common income bracket and makes up 23.9% of all families. Conversely, the $10,000 to $14,999 income bracket is the least frequent group with only 81 families (0.8%) belonging to this category.
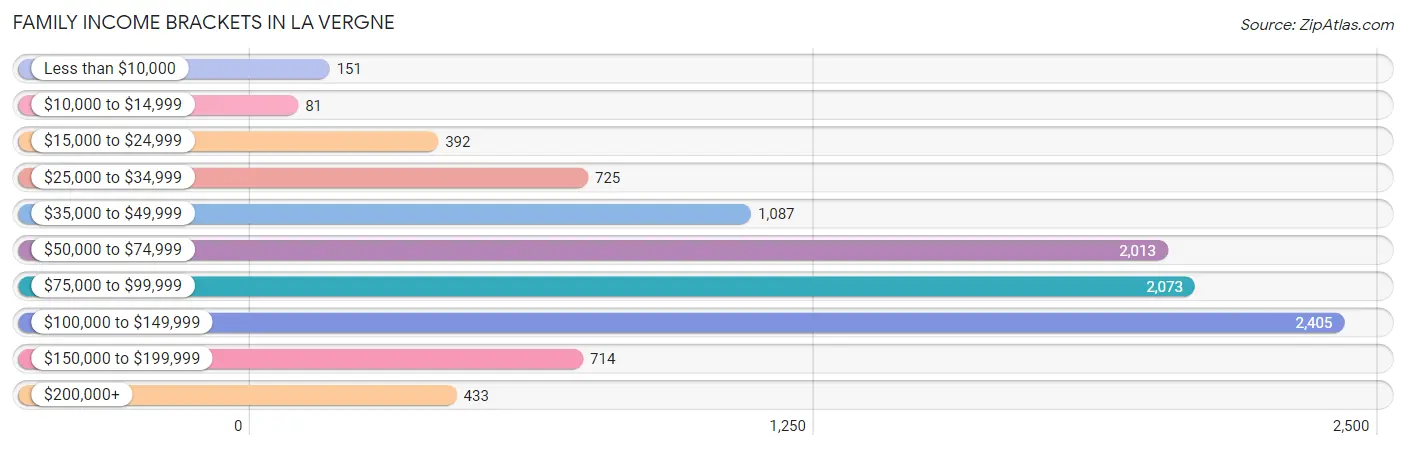
| Income Bracket | # Families | % Families |
| Less than $10,000 | 151 | 1.5% |
| $10,000 to $14,999 | 81 | 0.8% |
| $15,000 to $24,999 | 392 | 3.9% |
| $25,000 to $34,999 | 725 | 7.2% |
| $35,000 to $49,999 | 1,087 | 10.8% |
| $50,000 to $74,999 | 2,013 | 20.0% |
| $75,000 to $99,999 | 2,073 | 20.6% |
| $100,000 to $149,999 | 2,405 | 23.9% |
| $150,000 to $199,999 | 714 | 7.1% |
| $200,000+ | 433 | 4.3% |
Family Income by Famaliy Size in La Vergne
7+ person families (226 | 2.2%) account for the highest median family income in La Vergne with $119,274 per family, while 2-person families (4,013 | 39.9%) have the highest median income of $40,946 per family member.
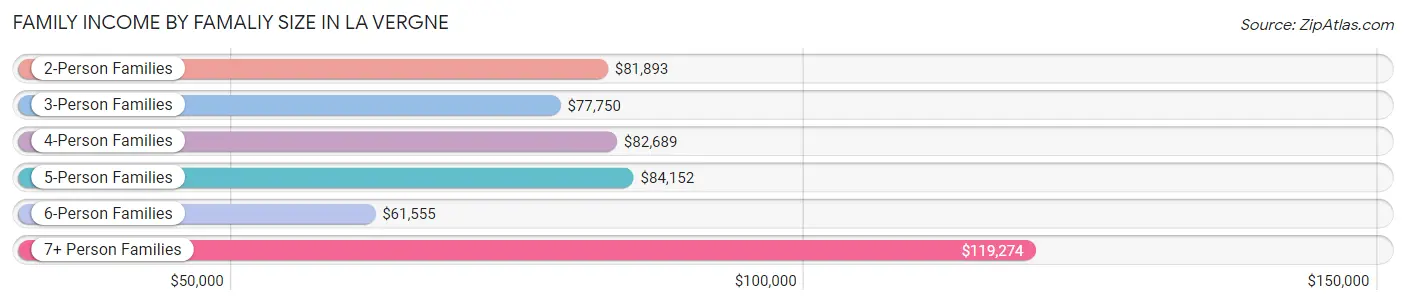
| Income Bracket | # Families | Median Income |
| 2-Person Families | 4,013 (39.9%) | $81,893 |
| 3-Person Families | 2,205 (21.9%) | $77,750 |
| 4-Person Families | 2,056 (20.4%) | $82,689 |
| 5-Person Families | 1,086 (10.8%) | $84,152 |
| 6-Person Families | 477 (4.7%) | $61,555 |
| 7+ Person Families | 226 (2.2%) | $119,274 |
| Total | 10,063 (100.0%) | $81,626 |
Family Income by Number of Earners in La Vergne
The median family income in La Vergne is $81,626, with families comprising 3+ earners (1,479) having the highest median family income of $119,930, while families with no earners (530) have the lowest median family income of $44,643, accounting for 14.7% and 5.3% of families, respectively.
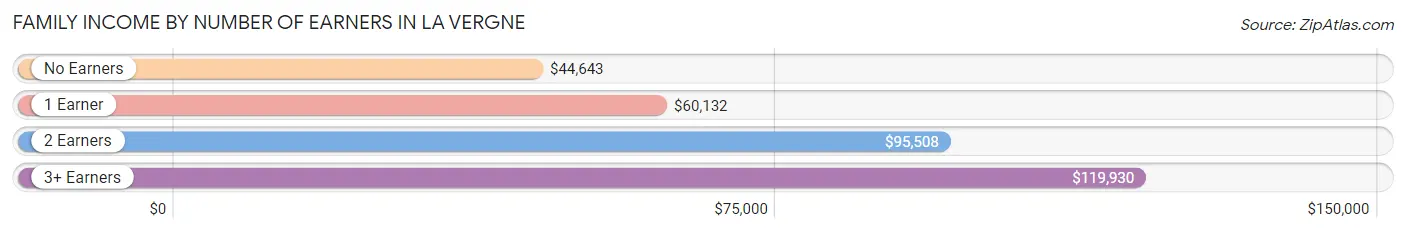
| Number of Earners | # Families | Median Income |
| No Earners | 530 (5.3%) | $44,643 |
| 1 Earner | 3,225 (32.1%) | $60,132 |
| 2 Earners | 4,829 (48.0%) | $95,508 |
| 3+ Earners | 1,479 (14.7%) | $119,930 |
| Total | 10,063 (100.0%) | $81,626 |
Household Income in La Vergne
Household Income Brackets in La Vergne
With 2,869 households falling in the category, the $100,000 to $149,999 income range is the most frequent in La Vergne, accounting for 22.1% of all households. In contrast, only 169 households (1.3%) fall into the $10,000 to $14,999 income bracket, making it the least populous group.
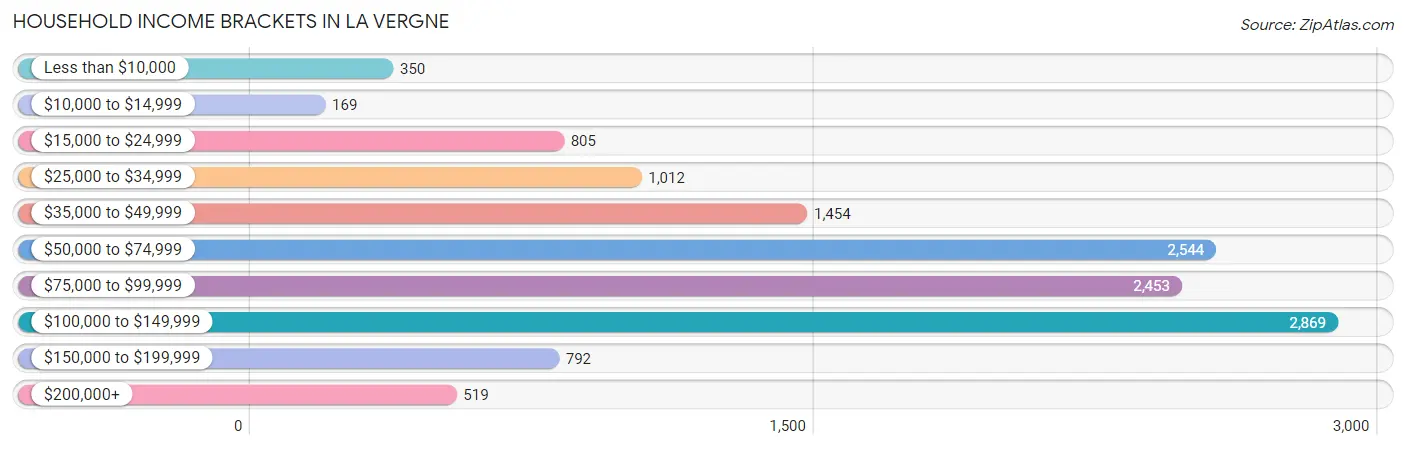
| Income Bracket | # Households | % Households |
| Less than $10,000 | 350 | 2.7% |
| $10,000 to $14,999 | 169 | 1.3% |
| $15,000 to $24,999 | 805 | 6.2% |
| $25,000 to $34,999 | 1,012 | 7.8% |
| $35,000 to $49,999 | 1,454 | 11.2% |
| $50,000 to $74,999 | 2,544 | 19.6% |
| $75,000 to $99,999 | 2,453 | 18.9% |
| $100,000 to $149,999 | 2,869 | 22.1% |
| $150,000 to $199,999 | 792 | 6.1% |
| $200,000+ | 519 | 4.0% |
Household Income by Householder Age in La Vergne
The median household income in La Vergne is $77,531, with the highest median household income of $81,839 found in the 45 to 64 years age bracket for the primary householder. A total of 5,180 households (39.9%) fall into this category. Meanwhile, the 15 to 24 years age bracket for the primary householder has the lowest median household income of $0, with 623 households (4.8%) in this group.
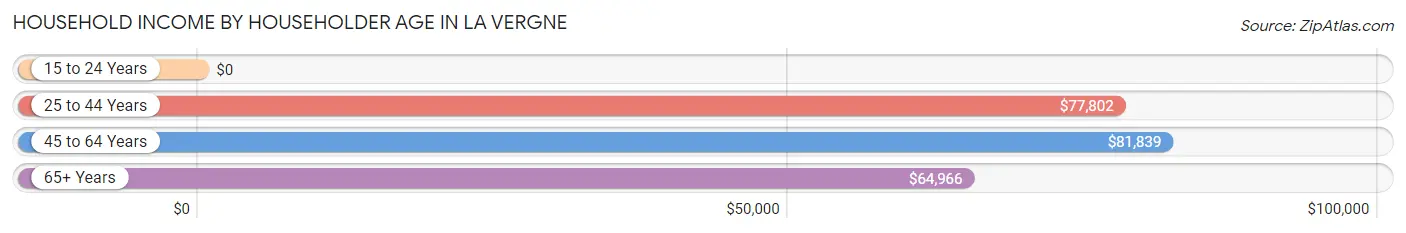
| Income Bracket | # Households | Median Income |
| 15 to 24 Years | 623 (4.8%) | $0 |
| 25 to 44 Years | 5,362 (41.3%) | $77,802 |
| 45 to 64 Years | 5,180 (39.9%) | $81,839 |
| 65+ Years | 1,815 (14.0%) | $64,966 |
| Total | 12,980 (100.0%) | $77,531 |
Poverty in La Vergne
Income Below Poverty by Sex and Age in La Vergne
With 7.4% poverty level for males and 12.7% for females among the residents of La Vergne, 6 to 11 year old males and 5 year old females are the most vulnerable to poverty, with 312 males (18.9%) and 132 females (49.1%) in their respective age groups living below the poverty level.
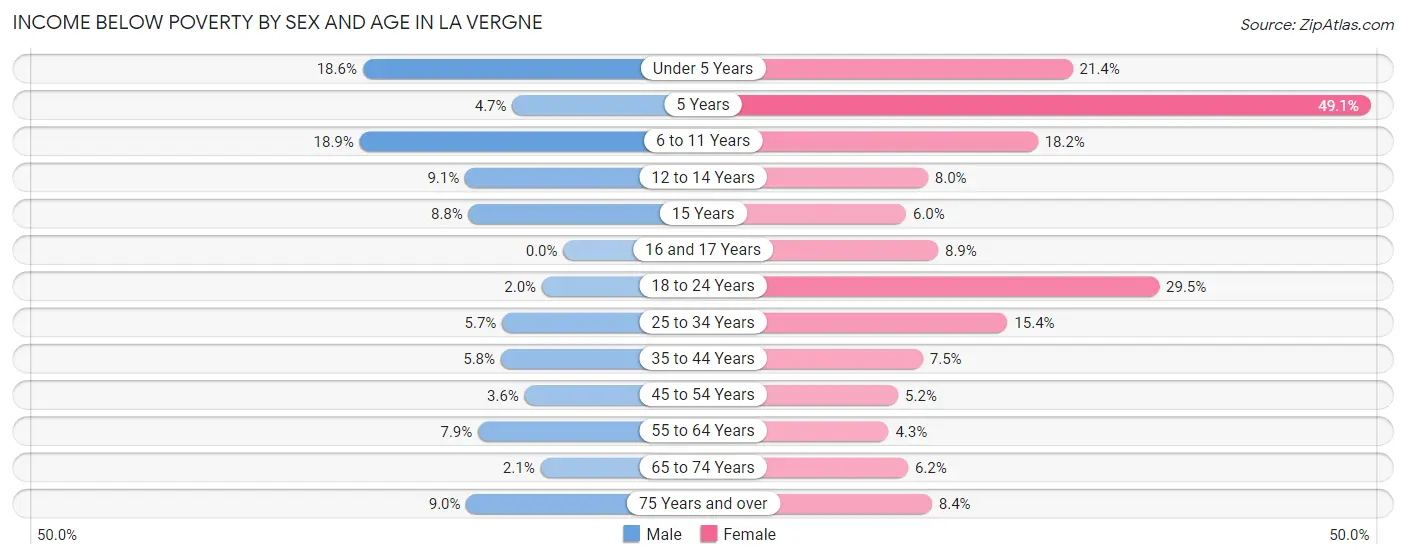
| Age Bracket | Male | Female |
| Under 5 Years | 269 (18.6%) | 263 (21.4%) |
| 5 Years | 7 (4.7%) | 132 (49.1%) |
| 6 to 11 Years | 312 (18.9%) | 357 (18.2%) |
| 12 to 14 Years | 108 (9.1%) | 93 (8.0%) |
| 15 Years | 27 (8.8%) | 26 (6.0%) |
| 16 and 17 Years | 0 (0.0%) | 50 (8.9%) |
| 18 to 24 Years | 36 (2.0%) | 562 (29.4%) |
| 25 to 34 Years | 167 (5.7%) | 425 (15.4%) |
| 35 to 44 Years | 173 (5.8%) | 208 (7.5%) |
| 45 to 54 Years | 95 (3.6%) | 135 (5.2%) |
| 55 to 64 Years | 168 (7.9%) | 88 (4.3%) |
| 65 to 74 Years | 23 (2.1%) | 63 (6.1%) |
| 75 Years and over | 27 (9.0%) | 49 (8.4%) |
| Total | 1,412 (7.4%) | 2,451 (12.7%) |
Income Above Poverty by Sex and Age in La Vergne
According to the poverty statistics in La Vergne, males aged 16 and 17 years and females aged 55 to 64 years are the age groups that are most secure financially, with 100.0% of males and 95.7% of females in these age groups living above the poverty line.
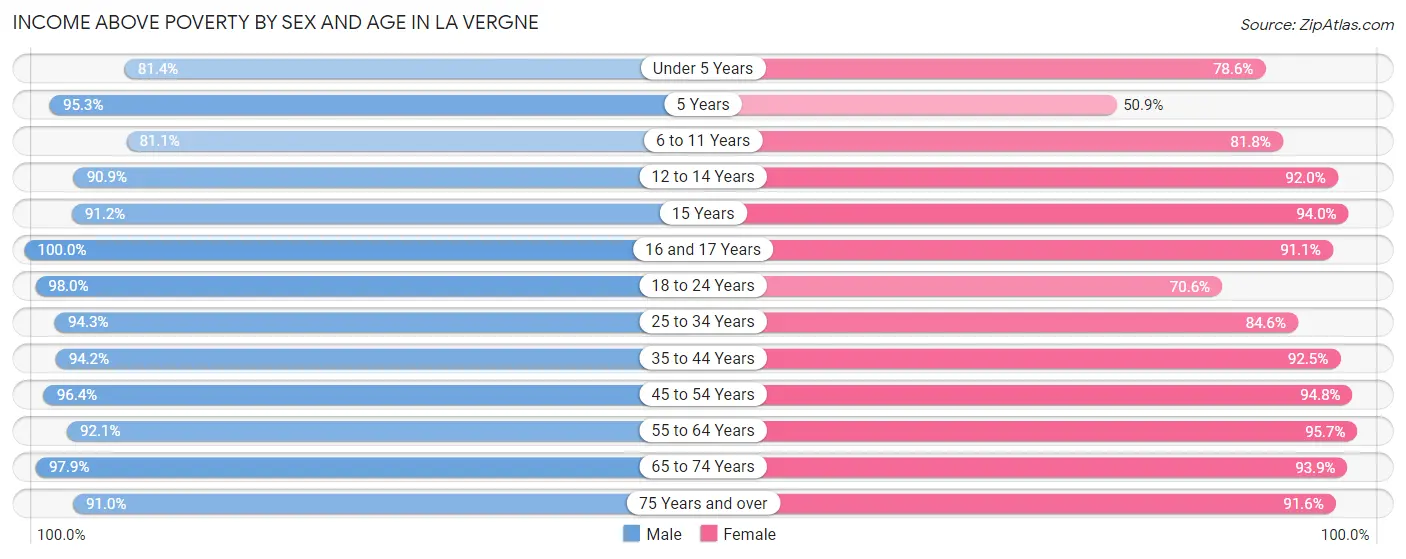
| Age Bracket | Male | Female |
| Under 5 Years | 1,176 (81.4%) | 965 (78.6%) |
| 5 Years | 141 (95.3%) | 137 (50.9%) |
| 6 to 11 Years | 1,338 (81.1%) | 1,607 (81.8%) |
| 12 to 14 Years | 1,076 (90.9%) | 1,071 (92.0%) |
| 15 Years | 280 (91.2%) | 410 (94.0%) |
| 16 and 17 Years | 520 (100.0%) | 510 (91.1%) |
| 18 to 24 Years | 1,771 (98.0%) | 1,346 (70.6%) |
| 25 to 34 Years | 2,773 (94.3%) | 2,341 (84.6%) |
| 35 to 44 Years | 2,811 (94.2%) | 2,558 (92.5%) |
| 45 to 54 Years | 2,554 (96.4%) | 2,448 (94.8%) |
| 55 to 64 Years | 1,957 (92.1%) | 1,942 (95.7%) |
| 65 to 74 Years | 1,064 (97.9%) | 961 (93.9%) |
| 75 Years and over | 273 (91.0%) | 537 (91.6%) |
| Total | 17,734 (92.6%) | 16,833 (87.3%) |
Income Below Poverty Among Married-Couple Families in La Vergne
The poverty statistics for married-couple families in La Vergne show that 5.4% or 366 of the total 6,767 families live below the poverty line. Families with 3 or 4 children have the highest poverty rate of 23.2%, comprising of 205 families. On the other hand, families with no children have the lowest poverty rate of 1.5%, which includes 45 families.
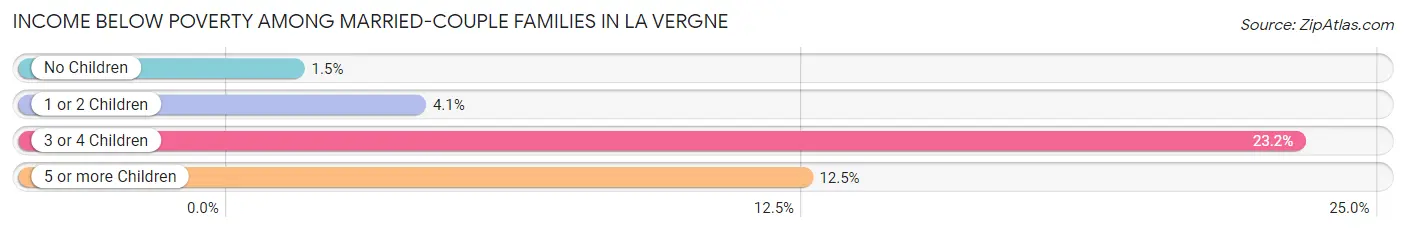
| Children | Above Poverty | Below Poverty |
| No Children | 3,067 (98.6%) | 45 (1.5%) |
| 1 or 2 Children | 2,628 (95.9%) | 112 (4.1%) |
| 3 or 4 Children | 678 (76.8%) | 205 (23.2%) |
| 5 or more Children | 28 (87.5%) | 4 (12.5%) |
| Total | 6,401 (94.6%) | 366 (5.4%) |
Income Below Poverty Among Single-Parent Households in La Vergne
According to the poverty data in La Vergne, 1.5% or 23 single-father households and 21.0% or 365 single-mother households are living below the poverty line. Among single-father households, those with 3 or 4 children have the highest poverty rate, with 16 households (13.6%) experiencing poverty. Likewise, among single-mother households, those with 3 or 4 children have the highest poverty rate, with 54 households (53.5%) falling below the poverty line.
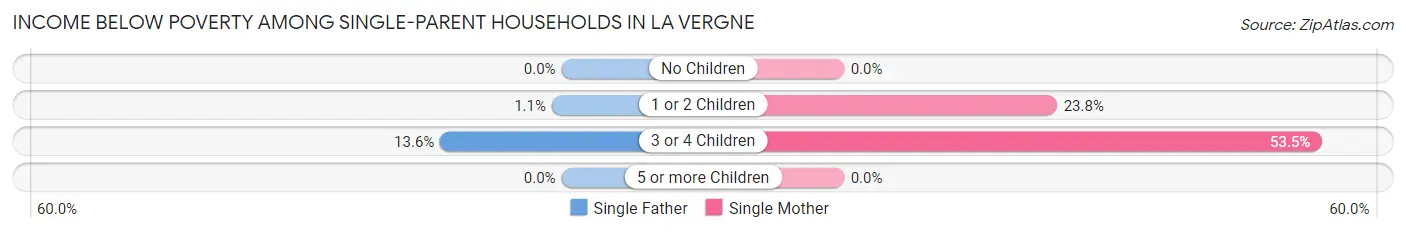
| Children | Single Father | Single Mother |
| No Children | 0 (0.0%) | 0 (0.0%) |
| 1 or 2 Children | 7 (1.1%) | 311 (23.8%) |
| 3 or 4 Children | 16 (13.6%) | 54 (53.5%) |
| 5 or more Children | 0 (0.0%) | 0 (0.0%) |
| Total | 23 (1.5%) | 365 (21.0%) |
Income Below Poverty Among Married-Couple vs Single-Parent Households in La Vergne
The poverty data for La Vergne shows that 366 of the married-couple family households (5.4%) and 388 of the single-parent households (11.8%) are living below the poverty level. Within the married-couple family households, those with 3 or 4 children have the highest poverty rate, with 205 households (23.2%) falling below the poverty line. Among the single-parent households, those with 3 or 4 children have the highest poverty rate, with 70 household (32.0%) living below poverty.
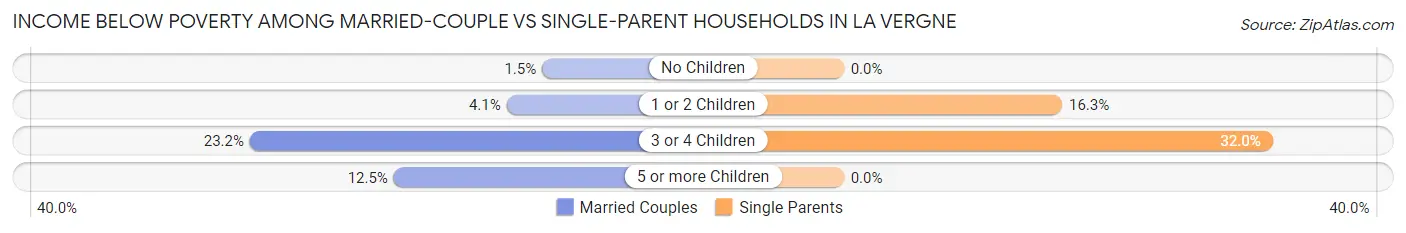
| Children | Married-Couple Families | Single-Parent Households |
| No Children | 45 (1.5%) | 0 (0.0%) |
| 1 or 2 Children | 112 (4.1%) | 318 (16.3%) |
| 3 or 4 Children | 205 (23.2%) | 70 (32.0%) |
| 5 or more Children | 4 (12.5%) | 0 (0.0%) |
| Total | 366 (5.4%) | 388 (11.8%) |
Race in La Vergne
The most populous races in La Vergne are White / Caucasian (20,671 | 53.6%), Black / African American (9,720 | 25.2%), and Hispanic or Latino (7,645 | 19.8%).
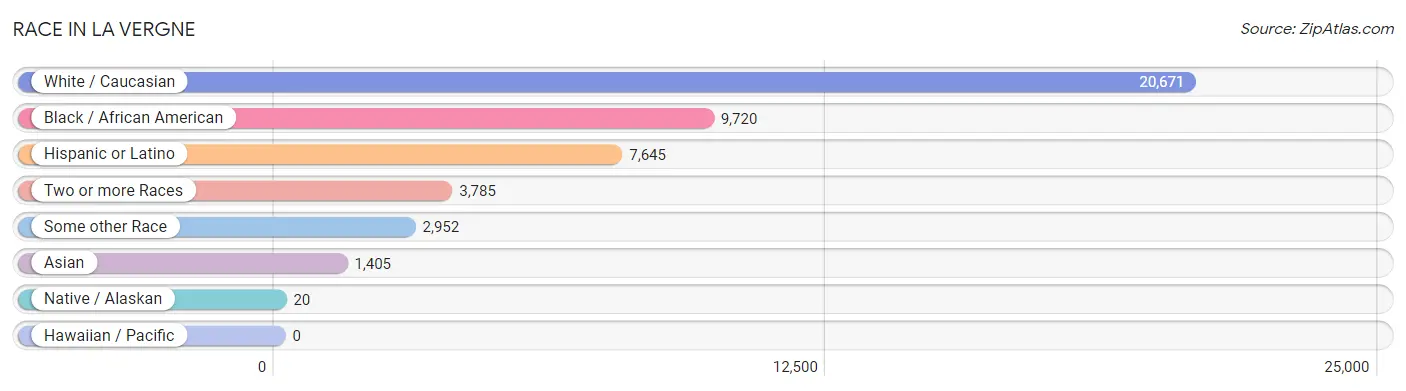
| Race | # Population | % Population |
| Asian | 1,405 | 3.6% |
| Black / African American | 9,720 | 25.2% |
| Hawaiian / Pacific | 0 | 0.0% |
| Hispanic or Latino | 7,645 | 19.8% |
| Native / Alaskan | 20 | 0.1% |
| White / Caucasian | 20,671 | 53.6% |
| Two or more Races | 3,785 | 9.8% |
| Some other Race | 2,952 | 7.7% |
| Total | 38,553 | 100.0% |
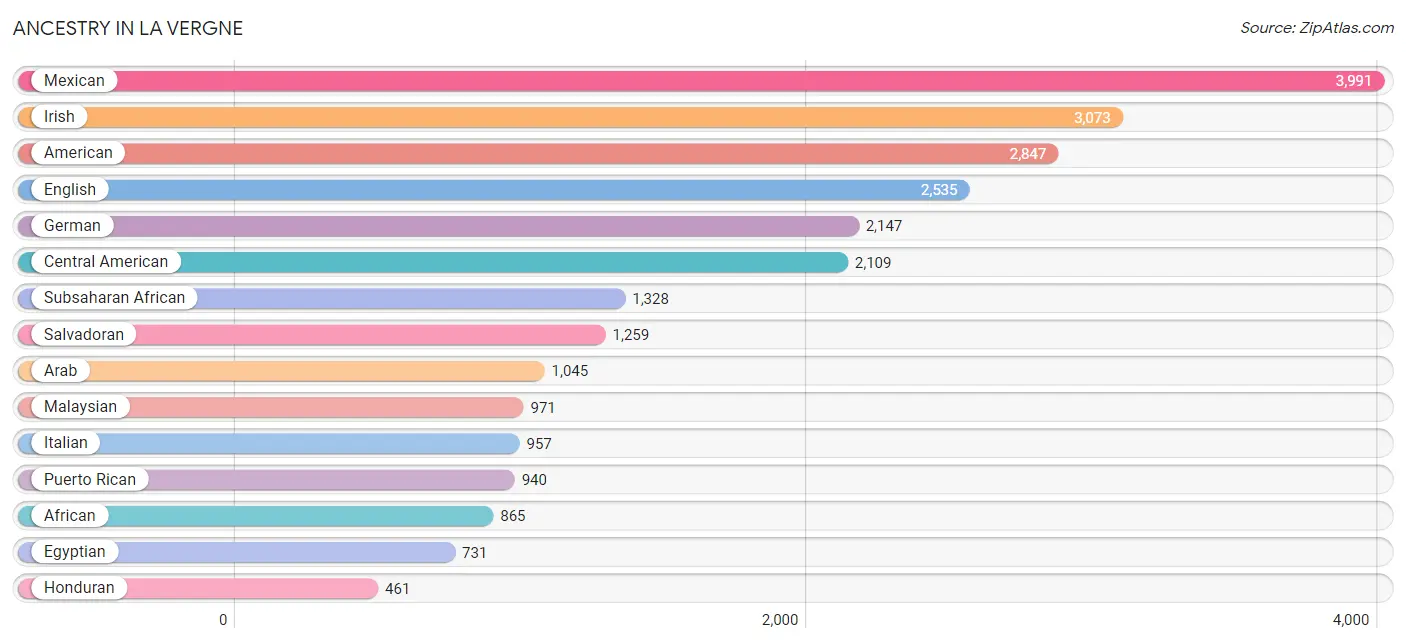
Ancestry in La Vergne
The most populous ancestries reported in La Vergne are Mexican (3,991 | 10.3%), Irish (3,073 | 8.0%), American (2,847 | 7.4%), English (2,535 | 6.6%), and German (2,147 | 5.6%), together accounting for 37.8% of all La Vergne residents.
| Ancestry | # Population | % Population |
| African | 865 | 2.2% |
| American | 2,847 | 7.4% |
| Arab | 1,045 | 2.7% |
| Austrian | 21 | 0.1% |
| Belgian | 58 | 0.2% |
| Belizean | 7 | 0.0% |
| Bhutanese | 7 | 0.0% |
| Blackfeet | 18 | 0.1% |
| Brazilian | 29 | 0.1% |
| British | 264 | 0.7% |
| Burmese | 39 | 0.1% |
| Cajun | 9 | 0.0% |
| Celtic | 18 | 0.1% |
| Central American | 2,109 | 5.5% |
| Central American Indian | 239 | 0.6% |
| Cherokee | 103 | 0.3% |
| Colombian | 137 | 0.4% |
| Costa Rican | 62 | 0.2% |
| Croatian | 3 | 0.0% |
| Cuban | 99 | 0.3% |
| Cypriot | 10 | 0.0% |
| Czech | 11 | 0.0% |
| Czechoslovakian | 17 | 0.0% |
| Danish | 36 | 0.1% |
| Dominican | 21 | 0.1% |
| Dutch | 413 | 1.1% |
| Dutch West Indian | 13 | 0.0% |
| Egyptian | 731 | 1.9% |
| English | 2,535 | 6.6% |
| Ethiopian | 112 | 0.3% |
| European | 323 | 0.8% |
| French | 460 | 1.2% |
| French Canadian | 37 | 0.1% |
| German | 2,147 | 5.6% |
| Greek | 92 | 0.2% |
| Guatemalan | 262 | 0.7% |
| Haitian | 332 | 0.9% |
| Honduran | 461 | 1.2% |
| Hungarian | 99 | 0.3% |
| Indian (Asian) | 42 | 0.1% |
| Indonesian | 196 | 0.5% |
| Irish | 3,073 | 8.0% |
| Italian | 957 | 2.5% |
| Jamaican | 12 | 0.0% |
| Japanese | 3 | 0.0% |
| Korean | 104 | 0.3% |
| Lebanese | 63 | 0.2% |
| Lithuanian | 16 | 0.0% |
| Malaysian | 971 | 2.5% |
| Mexican | 3,991 | 10.3% |
| Moroccan | 6 | 0.0% |
| Nicaraguan | 40 | 0.1% |
| Nigerian | 243 | 0.6% |
| Northern European | 48 | 0.1% |
| Norwegian | 81 | 0.2% |
| Pakistani | 7 | 0.0% |
| Panamanian | 25 | 0.1% |
| Pennsylvania German | 10 | 0.0% |
| Polish | 209 | 0.5% |
| Portuguese | 17 | 0.0% |
| Puerto Rican | 940 | 2.4% |
| Romanian | 23 | 0.1% |
| Russian | 133 | 0.3% |
| Salvadoran | 1,259 | 3.3% |
| Scandinavian | 27 | 0.1% |
| Scotch-Irish | 191 | 0.5% |
| Scottish | 357 | 0.9% |
| South African | 26 | 0.1% |
| South American | 288 | 0.7% |
| Spaniard | 15 | 0.0% |
| Spanish | 30 | 0.1% |
| Sri Lankan | 49 | 0.1% |
| Subsaharan African | 1,328 | 3.4% |
| Swedish | 271 | 0.7% |
| Swiss | 32 | 0.1% |
| Thai | 152 | 0.4% |
| Turkish | 32 | 0.1% |
| Venezuelan | 151 | 0.4% |
| Welsh | 134 | 0.4% |
| West Indian | 193 | 0.5% |
| Yugoslavian | 93 | 0.2% | View All 81 Rows |
Immigrants in La Vergne
The most numerous immigrant groups reported in La Vergne came from Latin America (3,894 | 10.1%), Central America (3,275 | 8.5%), Mexico (1,876 | 4.9%), Africa (1,245 | 3.2%), and Asia (934 | 2.4%), together accounting for 29.1% of all La Vergne residents.
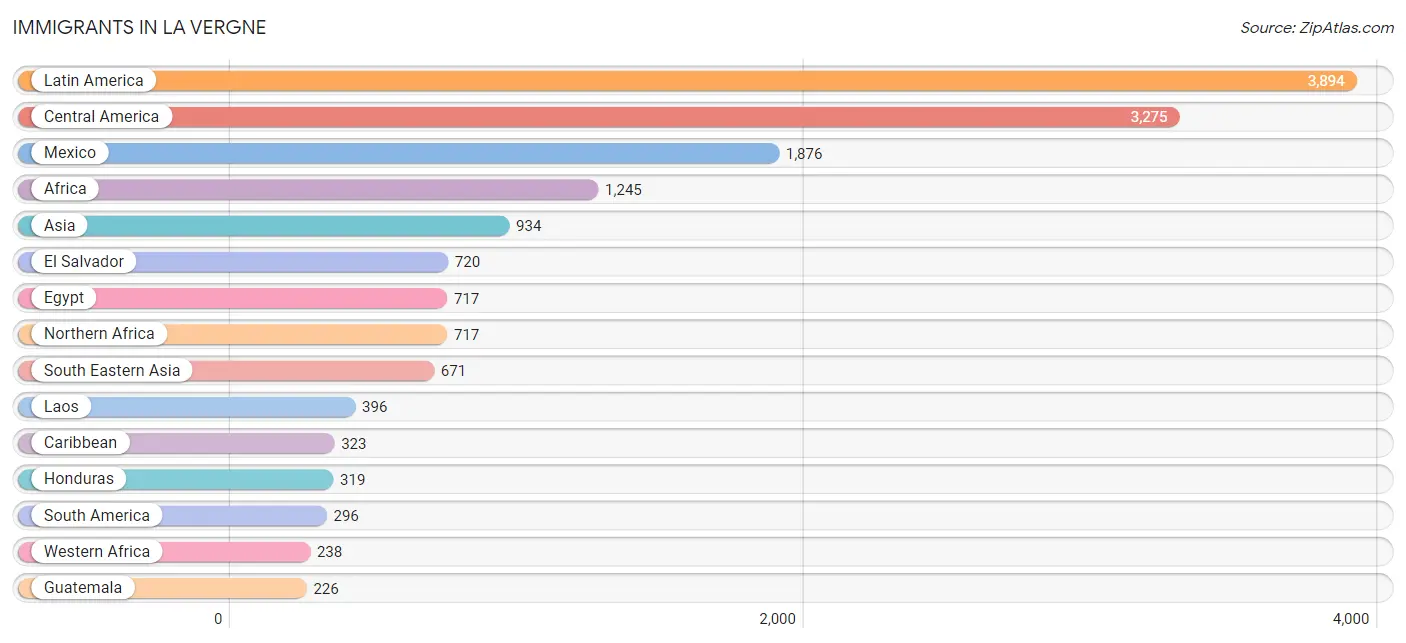
| Immigration Origin | # Population | % Population |
| Africa | 1,245 | 3.2% |
| Asia | 934 | 2.4% |
| Bahamas | 36 | 0.1% |
| Belize | 7 | 0.0% |
| Bosnia and Herzegovina | 47 | 0.1% |
| Canada | 25 | 0.1% |
| Caribbean | 323 | 0.8% |
| Central America | 3,275 | 8.5% |
| China | 27 | 0.1% |
| Colombia | 117 | 0.3% |
| Costa Rica | 38 | 0.1% |
| Cuba | 148 | 0.4% |
| Czechoslovakia | 25 | 0.1% |
| Dominican Republic | 16 | 0.0% |
| Eastern Africa | 197 | 0.5% |
| Eastern Asia | 34 | 0.1% |
| Eastern Europe | 117 | 0.3% |
| Egypt | 717 | 1.9% |
| El Salvador | 720 | 1.9% |
| England | 37 | 0.1% |
| Ethiopia | 197 | 0.5% |
| Europe | 165 | 0.4% |
| Germany | 11 | 0.0% |
| Guatemala | 226 | 0.6% |
| Haiti | 111 | 0.3% |
| Honduras | 319 | 0.8% |
| Iraq | 116 | 0.3% |
| Israel | 3 | 0.0% |
| Jamaica | 12 | 0.0% |
| Japan | 7 | 0.0% |
| Laos | 396 | 1.0% |
| Latin America | 3,894 | 10.1% |
| Malaysia | 22 | 0.1% |
| Mexico | 1,876 | 4.9% |
| Middle Africa | 67 | 0.2% |
| Nepal | 52 | 0.1% |
| Nicaragua | 75 | 0.2% |
| Nigeria | 219 | 0.6% |
| Northern Africa | 717 | 1.9% |
| Northern Europe | 37 | 0.1% |
| Panama | 14 | 0.0% |
| Philippines | 67 | 0.2% |
| Romania | 23 | 0.1% |
| Russia | 22 | 0.1% |
| South Africa | 26 | 0.1% |
| South America | 296 | 0.8% |
| South Central Asia | 52 | 0.1% |
| South Eastern Asia | 671 | 1.7% |
| Syria | 16 | 0.0% |
| Thailand | 37 | 0.1% |
| Turkey | 32 | 0.1% |
| Venezuela | 179 | 0.5% |
| Vietnam | 20 | 0.1% |
| Western Africa | 238 | 0.6% |
| Western Asia | 177 | 0.5% |
| Western Europe | 11 | 0.0% |
| Zaire | 67 | 0.2% | View All 57 Rows |
Sex and Age in La Vergne
Sex and Age in La Vergne
The most populous age groups in La Vergne are 10 to 14 Years (1,926 | 10.0%) for men and 10 to 14 Years (2,040 | 10.6%) for women.
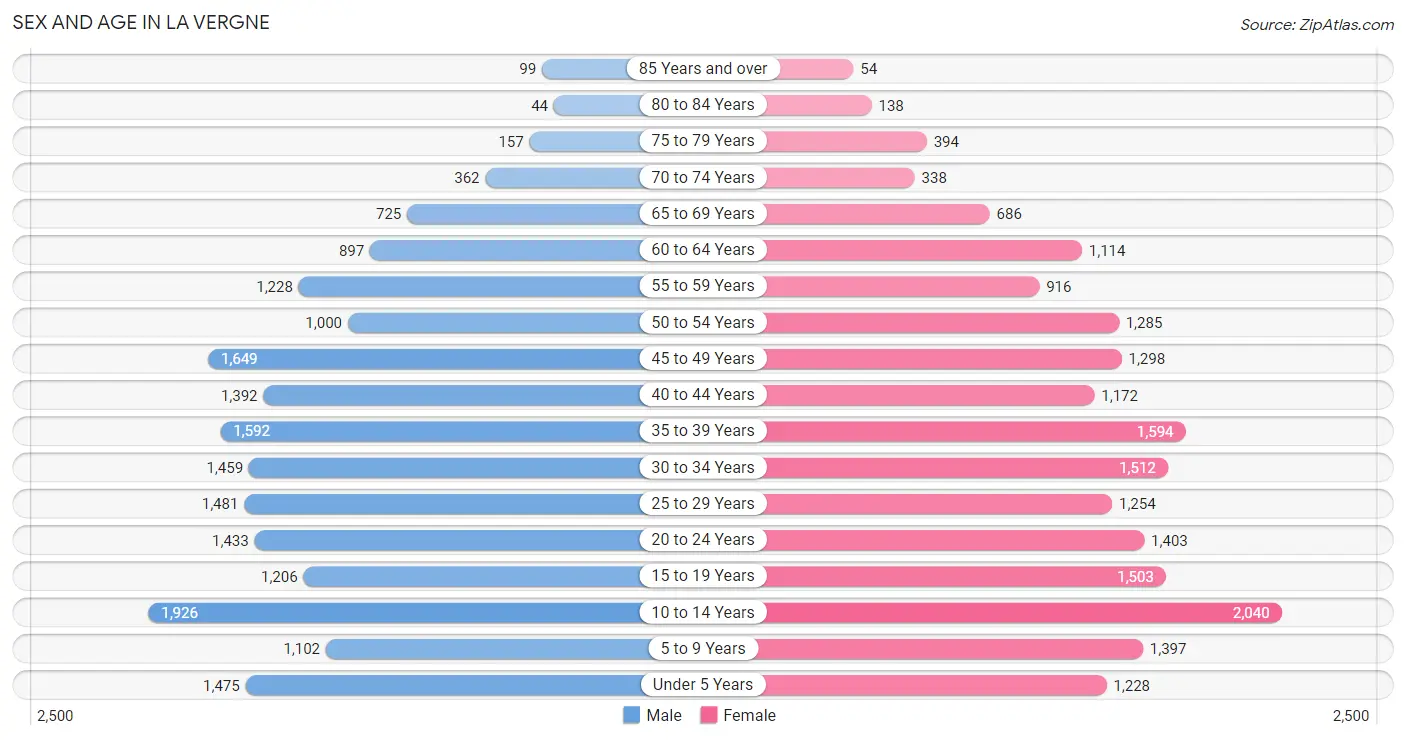
| Age Bracket | Male | Female |
| Under 5 Years | 1,475 (7.7%) | 1,228 (6.4%) |
| 5 to 9 Years | 1,102 (5.7%) | 1,397 (7.2%) |
| 10 to 14 Years | 1,926 (10.0%) | 2,040 (10.6%) |
| 15 to 19 Years | 1,206 (6.3%) | 1,503 (7.8%) |
| 20 to 24 Years | 1,433 (7.4%) | 1,403 (7.3%) |
| 25 to 29 Years | 1,481 (7.7%) | 1,254 (6.5%) |
| 30 to 34 Years | 1,459 (7.6%) | 1,512 (7.8%) |
| 35 to 39 Years | 1,592 (8.3%) | 1,594 (8.3%) |
| 40 to 44 Years | 1,392 (7.2%) | 1,172 (6.1%) |
| 45 to 49 Years | 1,649 (8.6%) | 1,298 (6.7%) |
| 50 to 54 Years | 1,000 (5.2%) | 1,285 (6.7%) |
| 55 to 59 Years | 1,228 (6.4%) | 916 (4.7%) |
| 60 to 64 Years | 897 (4.7%) | 1,114 (5.8%) |
| 65 to 69 Years | 725 (3.8%) | 686 (3.5%) |
| 70 to 74 Years | 362 (1.9%) | 338 (1.8%) |
| 75 to 79 Years | 157 (0.8%) | 394 (2.0%) |
| 80 to 84 Years | 44 (0.2%) | 138 (0.7%) |
| 85 Years and over | 99 (0.5%) | 54 (0.3%) |
| Total | 19,227 (100.0%) | 19,326 (100.0%) |
Families and Households in La Vergne
Median Family Size in La Vergne
The median family size in La Vergne is 3.36 persons per family, with married-couple families (6,767 | 67.2%) accounting for the largest median family size of 3.56 persons per family. On the other hand, single male/father families (1,559 | 15.5%) represent the smallest median family size with 2.68 persons per family.
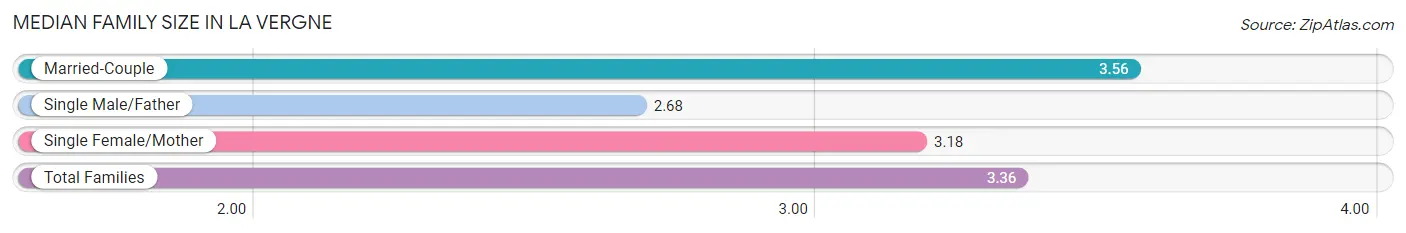
| Family Type | # Families | Family Size |
| Married-Couple | 6,767 (67.2%) | 3.56 |
| Single Male/Father | 1,559 (15.5%) | 2.68 |
| Single Female/Mother | 1,737 (17.3%) | 3.18 |
| Total Families | 10,063 (100.0%) | 3.36 |
Median Household Size in La Vergne
The median household size in La Vergne is 2.97 persons per household, with married-couple households (6,767 | 52.1%) accounting for the largest median household size of 3.59 persons per household. non-family households (2,917 | 22.5%) represent the smallest median household size with 1.28 persons per household.
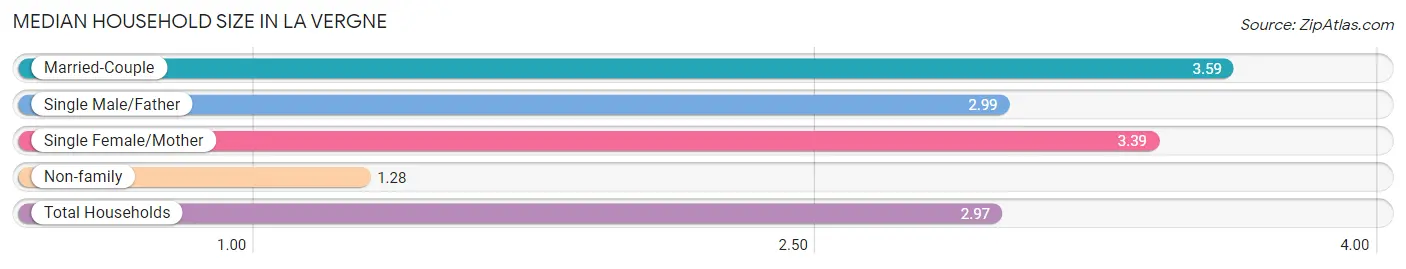
| Household Type | # Households | Household Size |
| Married-Couple | 6,767 (52.1%) | 3.59 |
| Single Male/Father | 1,559 (12.0%) | 2.99 |
| Single Female/Mother | 1,737 (13.4%) | 3.39 |
| Non-family | 2,917 (22.5%) | 1.28 |
| Total Households | 12,980 (100.0%) | 2.97 |
Household Size by Marriage Status in La Vergne
Out of a total of 12,980 households in La Vergne, 10,063 (77.5%) are family households, while 2,917 (22.5%) are nonfamily households. The most numerous type of family households are 2-person households, comprising 3,389, and the most common type of nonfamily households are 1-person households, comprising 2,189.
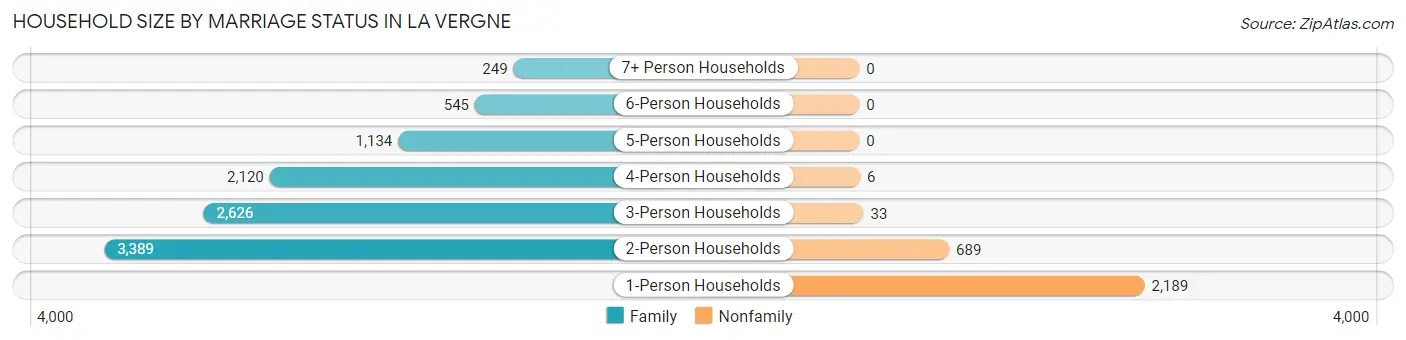
| Household Size | Family Households | Nonfamily Households |
| 1-Person Households | - | 2,189 (16.9%) |
| 2-Person Households | 3,389 (26.1%) | 689 (5.3%) |
| 3-Person Households | 2,626 (20.2%) | 33 (0.3%) |
| 4-Person Households | 2,120 (16.3%) | 6 (0.1%) |
| 5-Person Households | 1,134 (8.7%) | 0 (0.0%) |
| 6-Person Households | 545 (4.2%) | 0 (0.0%) |
| 7+ Person Households | 249 (1.9%) | 0 (0.0%) |
| Total | 10,063 (77.5%) | 2,917 (22.5%) |
Female Fertility in La Vergne
Fertility by Age in La Vergne
Average fertility rate in La Vergne is 92.0 births per 1,000 women. Women in the age bracket of 20 to 34 years have the highest fertility rate with 153.0 births per 1,000 women. Women in the age bracket of 20 to 34 years acount for 70.1% of all women with births.
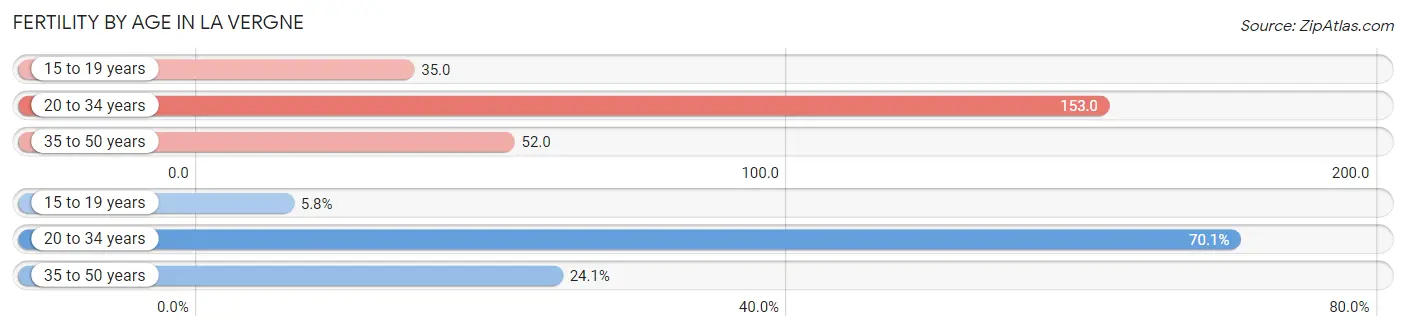
| Age Bracket | Women with Births | Births / 1,000 Women |
| 15 to 19 years | 53 (5.8%) | 35.0 |
| 20 to 34 years | 638 (70.1%) | 153.0 |
| 35 to 50 years | 219 (24.1%) | 52.0 |
| Total | 910 (100.0%) | 92.0 |
Fertility by Age by Marriage Status in La Vergne
52.1% of women with births (910) in La Vergne are married. The highest percentage of unmarried women with births falls into 15 to 19 years age bracket with 100.0% of them unmarried at the time of birth, while the lowest percentage of unmarried women with births belong to 20 to 34 years age bracket with 42.9% of them unmarried.
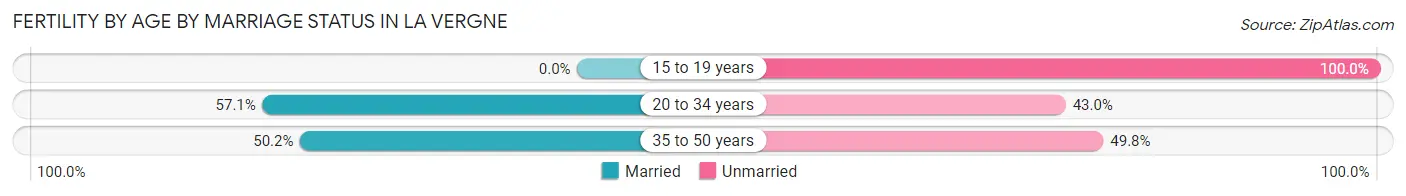
| Age Bracket | Married | Unmarried |
| 15 to 19 years | 0 (0.0%) | 53 (100.0%) |
| 20 to 34 years | 364 (57.1%) | 274 (42.9%) |
| 35 to 50 years | 110 (50.2%) | 109 (49.8%) |
| Total | 474 (52.1%) | 436 (47.9%) |
Fertility by Education in La Vergne
Average fertility rate in La Vergne is 92.0 births per 1,000 women. Women with the education attainment of high school diploma have the highest fertility rate of 138.0 births per 1,000 women, while women with the education attainment of less than high school have the lowest fertility at 22.0 births per 1,000 women. Women with the education attainment of high school diploma represent 40.7% of all women with births.
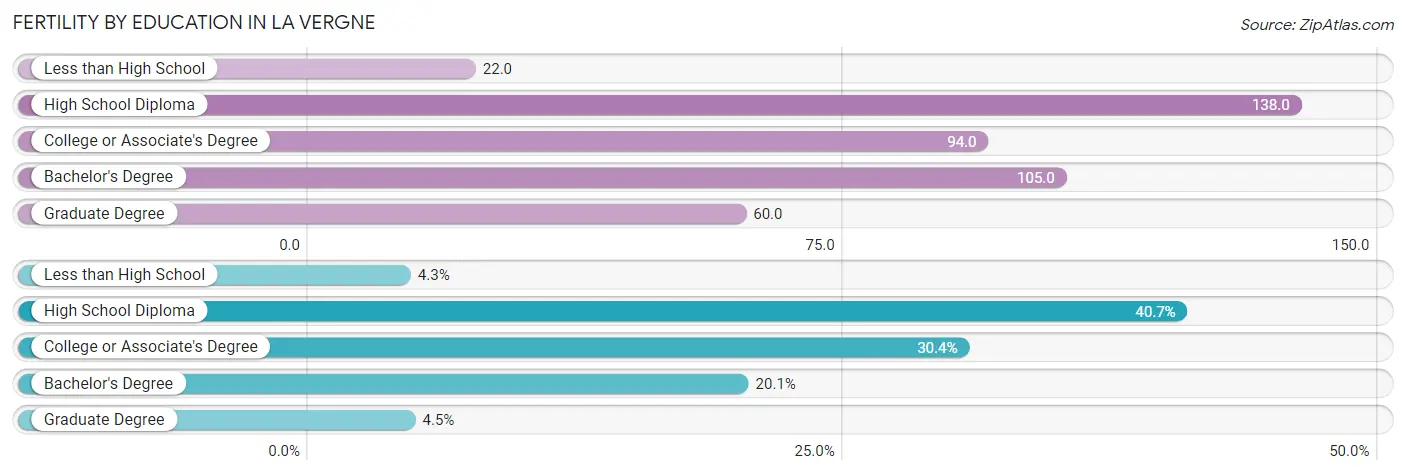
| Educational Attainment | Women with Births | Births / 1,000 Women |
| Less than High School | 39 (4.3%) | 22.0 |
| High School Diploma | 370 (40.7%) | 138.0 |
| College or Associate's Degree | 277 (30.4%) | 94.0 |
| Bachelor's Degree | 183 (20.1%) | 105.0 |
| Graduate Degree | 41 (4.5%) | 60.0 |
| Total | 910 (100.0%) | 92.0 |
Fertility by Education by Marriage Status in La Vergne
47.9% of women with births in La Vergne are unmarried. Women with the educational attainment of graduate degree are most likely to be married with 100.0% of them married at childbirth, while women with the educational attainment of college or associate's degree are least likely to be married with 55.6% of them unmarried at childbirth.
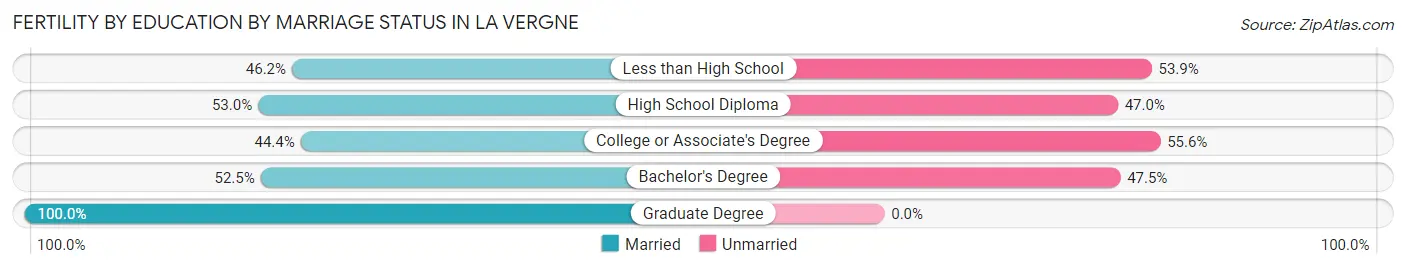
| Educational Attainment | Married | Unmarried |
| Less than High School | 18 (46.2%) | 21 (53.8%) |
| High School Diploma | 196 (53.0%) | 174 (47.0%) |
| College or Associate's Degree | 123 (44.4%) | 154 (55.6%) |
| Bachelor's Degree | 96 (52.5%) | 87 (47.5%) |
| Graduate Degree | 41 (100.0%) | 0 (0.0%) |
| Total | 474 (52.1%) | 436 (47.9%) |
Employment Characteristics in La Vergne
Employment by Class of Employer in La Vergne
Among the 20,168 employed individuals in La Vergne, private company employees (14,775 | 73.3%), self-employed (not incorporated) (1,334 | 6.6%), and not-for-profit organizations (1,034 | 5.1%) make up the most common classes of employment.
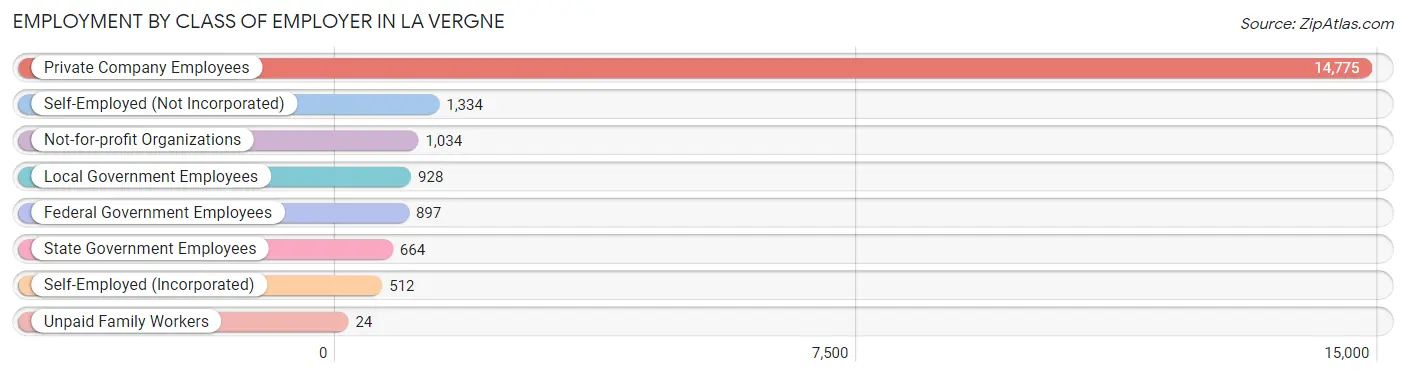
| Employer Class | # Employees | % Employees |
| Private Company Employees | 14,775 | 73.3% |
| Self-Employed (Incorporated) | 512 | 2.5% |
| Self-Employed (Not Incorporated) | 1,334 | 6.6% |
| Not-for-profit Organizations | 1,034 | 5.1% |
| Local Government Employees | 928 | 4.6% |
| State Government Employees | 664 | 3.3% |
| Federal Government Employees | 897 | 4.4% |
| Unpaid Family Workers | 24 | 0.1% |
| Total | 20,168 | 100.0% |
Employment Status by Age in La Vergne
According to the labor force statistics for La Vergne, out of the total population over 16 years of age (28,642), 74.4% or 21,310 individuals are in the labor force, with 4.0% or 852 of them unemployed. The age group with the highest labor force participation rate is 45 to 54 years, with 88.7% or 4,641 individuals in the labor force. Within the labor force, the 16 to 19 years age range has the highest percentage of unemployed individuals, with 14.0% or 125 of them being unemployed.
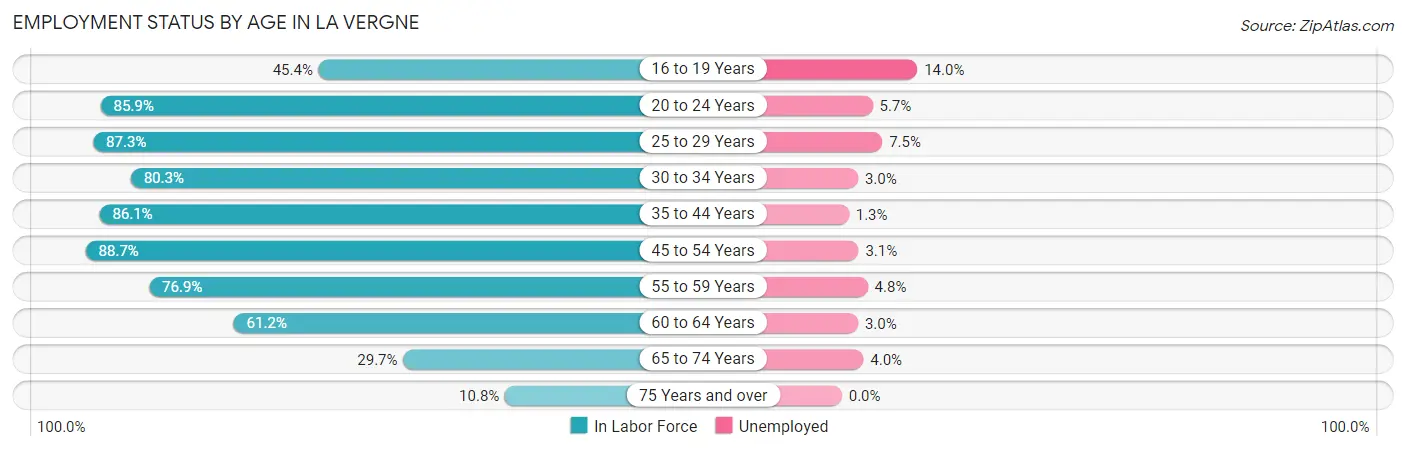
| Age Bracket | In Labor Force | Unemployed |
| 16 to 19 Years | 893 (45.4%) | 125 (14.0%) |
| 20 to 24 Years | 2,436 (85.9%) | 139 (5.7%) |
| 25 to 29 Years | 2,388 (87.3%) | 179 (7.5%) |
| 30 to 34 Years | 2,386 (80.3%) | 72 (3.0%) |
| 35 to 44 Years | 4,951 (86.1%) | 64 (1.3%) |
| 45 to 54 Years | 4,641 (88.7%) | 144 (3.1%) |
| 55 to 59 Years | 1,649 (76.9%) | 79 (4.8%) |
| 60 to 64 Years | 1,231 (61.2%) | 37 (3.0%) |
| 65 to 74 Years | 627 (29.7%) | 25 (4.0%) |
| 75 Years and over | 96 (10.8%) | 0 (0.0%) |
| Total | 21,310 (74.4%) | 852 (4.0%) |
Employment Status by Educational Attainment in La Vergne
According to labor force statistics for La Vergne, 82.7% of individuals (17,237) out of the total population between 25 and 64 years of age (20,843) are in the labor force, with 3.3% or 569 of them being unemployed. The group with the highest labor force participation rate are those with the educational attainment of bachelor's degree or higher, with 89.5% or 4,605 individuals in the labor force. Within the labor force, individuals with high school diploma education have the highest percentage of unemployment, with 4.7% or 265 of them being unemployed.
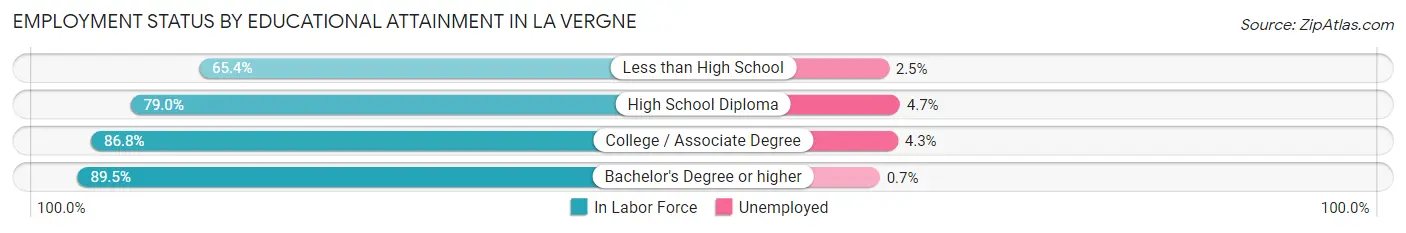
| Educational Attainment | In Labor Force | Unemployed |
| Less than High School | 1,312 (65.4%) | 50 (2.5%) |
| High School Diploma | 5,640 (79.0%) | 336 (4.7%) |
| College / Associate Degree | 5,688 (86.8%) | 282 (4.3%) |
| Bachelor's Degree or higher | 4,605 (89.5%) | 36 (0.7%) |
| Total | 17,237 (82.7%) | 688 (3.3%) |
Employment Occupations by Sex in La Vergne
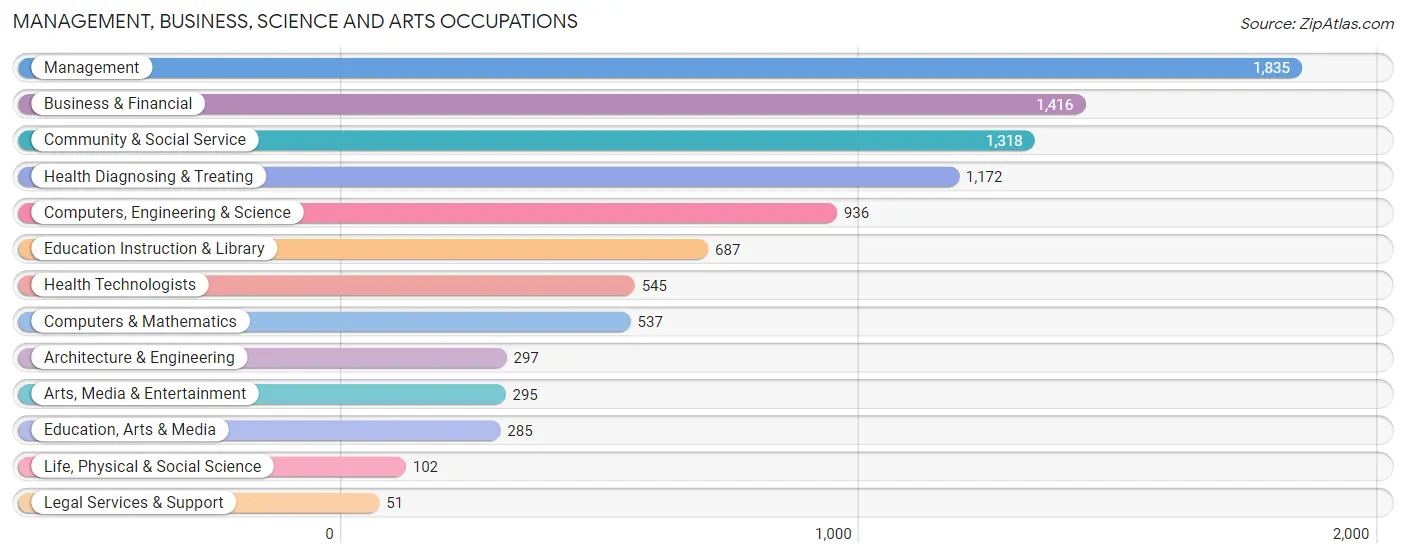
Management, Business, Science and Arts Occupations
The most common Management, Business, Science and Arts occupations in La Vergne are Management (1,835 | 9.0%), Business & Financial (1,416 | 6.9%), Community & Social Service (1,318 | 6.5%), Health Diagnosing & Treating (1,172 | 5.7%), and Computers, Engineering & Science (936 | 4.6%).
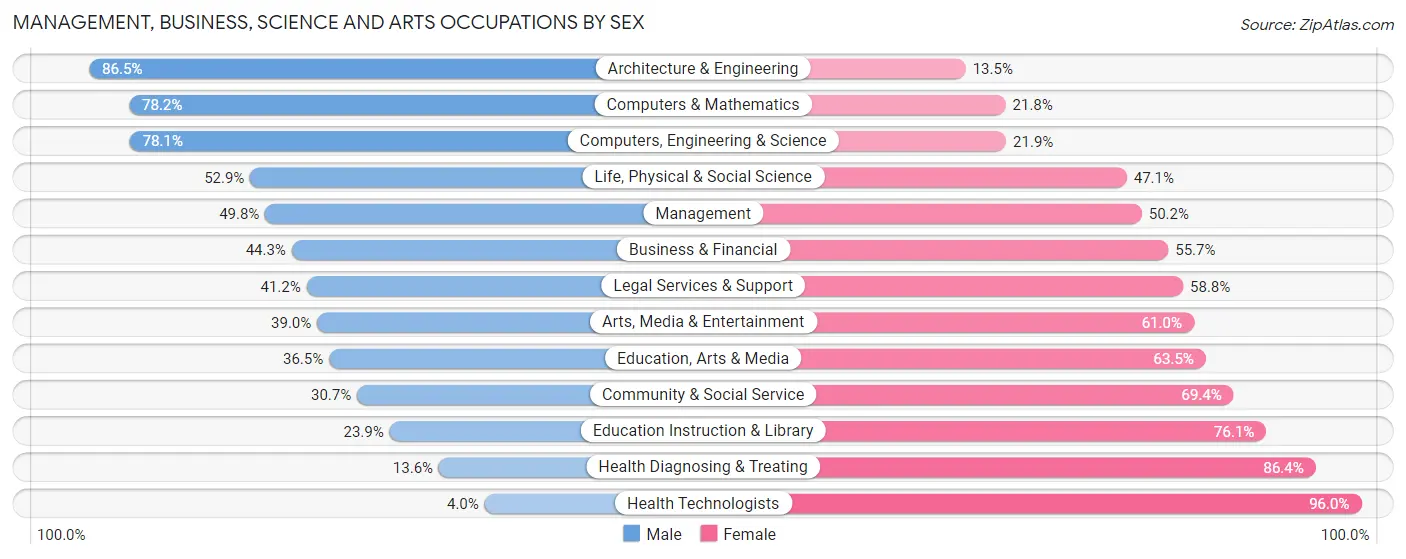
Management, Business, Science and Arts Occupations by Sex
Within the Management, Business, Science and Arts occupations in La Vergne, the most male-oriented occupations are Architecture & Engineering (86.5%), Computers & Mathematics (78.2%), and Computers, Engineering & Science (78.1%), while the most female-oriented occupations are Health Technologists (96.0%), Health Diagnosing & Treating (86.4%), and Education Instruction & Library (76.1%).
| Occupation | Male | Female |
| Management | 914 (49.8%) | 921 (50.2%) |
| Business & Financial | 627 (44.3%) | 789 (55.7%) |
| Computers, Engineering & Science | 731 (78.1%) | 205 (21.9%) |
| Computers & Mathematics | 420 (78.2%) | 117 (21.8%) |
| Architecture & Engineering | 257 (86.5%) | 40 (13.5%) |
| Life, Physical & Social Science | 54 (52.9%) | 48 (47.1%) |
| Community & Social Service | 404 (30.6%) | 914 (69.4%) |
| Education, Arts & Media | 104 (36.5%) | 181 (63.5%) |
| Legal Services & Support | 21 (41.2%) | 30 (58.8%) |
| Education Instruction & Library | 164 (23.9%) | 523 (76.1%) |
| Arts, Media & Entertainment | 115 (39.0%) | 180 (61.0%) |
| Health Diagnosing & Treating | 159 (13.6%) | 1,013 (86.4%) |
| Health Technologists | 22 (4.0%) | 523 (96.0%) |
| Total (Category) | 2,835 (42.5%) | 3,842 (57.5%) |
| Total (Overall) | 11,346 (55.5%) | 9,085 (44.5%) |
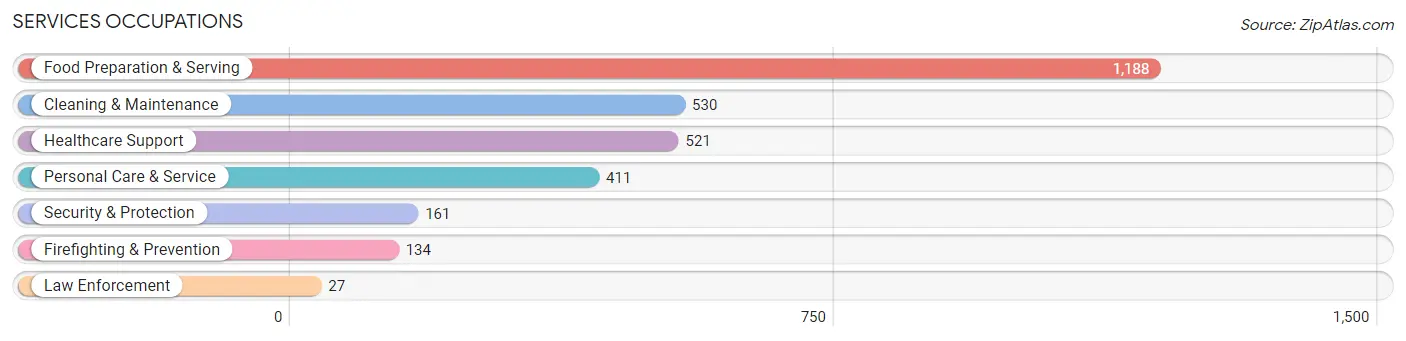
Services Occupations
The most common Services occupations in La Vergne are Food Preparation & Serving (1,188 | 5.8%), Cleaning & Maintenance (530 | 2.6%), Healthcare Support (521 | 2.5%), Personal Care & Service (411 | 2.0%), and Security & Protection (161 | 0.8%).
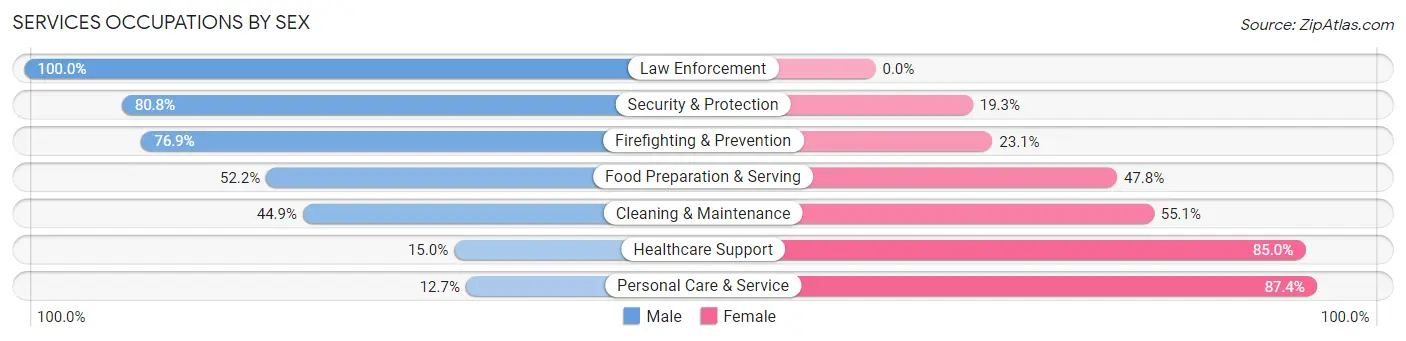
Services Occupations by Sex
Within the Services occupations in La Vergne, the most male-oriented occupations are Law Enforcement (100.0%), Security & Protection (80.7%), and Firefighting & Prevention (76.9%), while the most female-oriented occupations are Personal Care & Service (87.4%), Healthcare Support (85.0%), and Cleaning & Maintenance (55.1%).
| Occupation | Male | Female |
| Healthcare Support | 78 (15.0%) | 443 (85.0%) |
| Security & Protection | 130 (80.7%) | 31 (19.3%) |
| Firefighting & Prevention | 103 (76.9%) | 31 (23.1%) |
| Law Enforcement | 27 (100.0%) | 0 (0.0%) |
| Food Preparation & Serving | 620 (52.2%) | 568 (47.8%) |
| Cleaning & Maintenance | 238 (44.9%) | 292 (55.1%) |
| Personal Care & Service | 52 (12.7%) | 359 (87.4%) |
| Total (Category) | 1,118 (39.8%) | 1,693 (60.2%) |
| Total (Overall) | 11,346 (55.5%) | 9,085 (44.5%) |
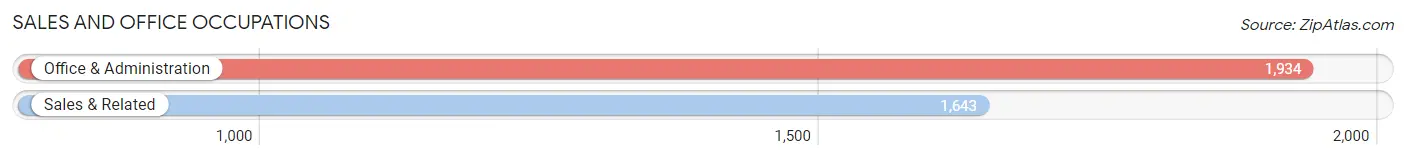
Sales and Office Occupations
The most common Sales and Office occupations in La Vergne are Office & Administration (1,934 | 9.5%), and Sales & Related (1,643 | 8.0%).
Sales and Office Occupations by Sex
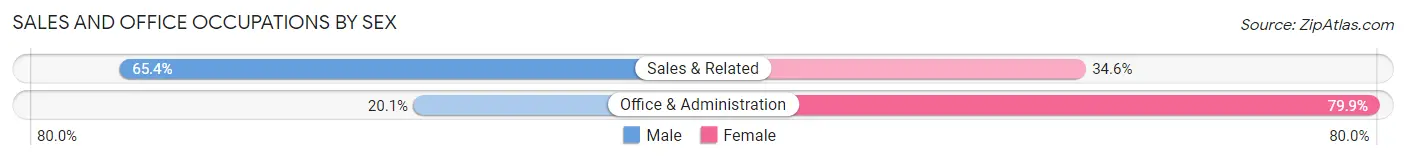
| Occupation | Male | Female |
| Sales & Related | 1,075 (65.4%) | 568 (34.6%) |
| Office & Administration | 389 (20.1%) | 1,545 (79.9%) |
| Total (Category) | 1,464 (40.9%) | 2,113 (59.1%) |
| Total (Overall) | 11,346 (55.5%) | 9,085 (44.5%) |
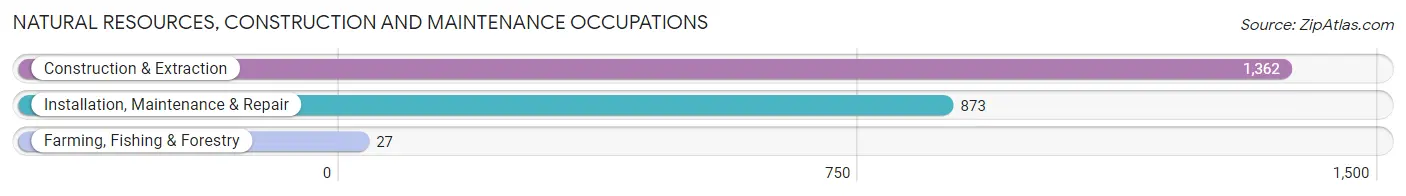
Natural Resources, Construction and Maintenance Occupations
The most common Natural Resources, Construction and Maintenance occupations in La Vergne are Construction & Extraction (1,362 | 6.7%), Installation, Maintenance & Repair (873 | 4.3%), and Farming, Fishing & Forestry (27 | 0.1%).
Natural Resources, Construction and Maintenance Occupations by Sex
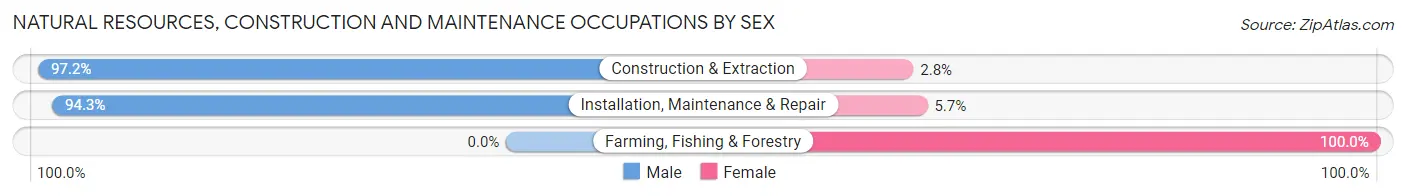
| Occupation | Male | Female |
| Farming, Fishing & Forestry | 0 (0.0%) | 27 (100.0%) |
| Construction & Extraction | 1,324 (97.2%) | 38 (2.8%) |
| Installation, Maintenance & Repair | 823 (94.3%) | 50 (5.7%) |
| Total (Category) | 2,147 (94.9%) | 115 (5.1%) |
| Total (Overall) | 11,346 (55.5%) | 9,085 (44.5%) |
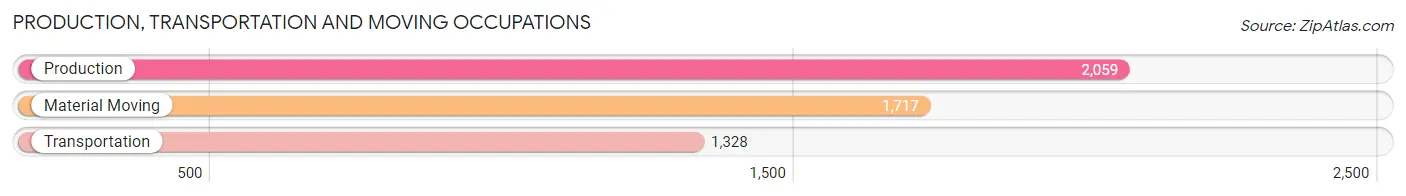
Production, Transportation and Moving Occupations
The most common Production, Transportation and Moving occupations in La Vergne are Production (2,059 | 10.1%), Material Moving (1,717 | 8.4%), and Transportation (1,328 | 6.5%).
Production, Transportation and Moving Occupations by Sex
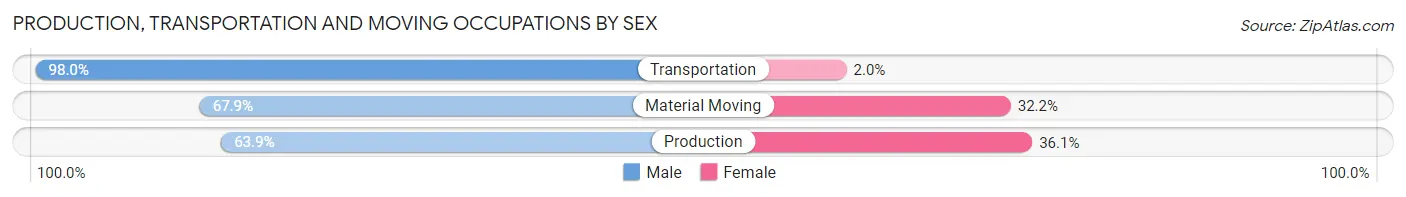
| Occupation | Male | Female |
| Production | 1,316 (63.9%) | 743 (36.1%) |
| Transportation | 1,301 (98.0%) | 27 (2.0%) |
| Material Moving | 1,165 (67.8%) | 552 (32.2%) |
| Total (Category) | 3,782 (74.1%) | 1,322 (25.9%) |
| Total (Overall) | 11,346 (55.5%) | 9,085 (44.5%) |
Employment Industries by Sex in La Vergne
Employment Industries in La Vergne
The major employment industries in La Vergne include Manufacturing (2,758 | 13.5%), Health Care & Social Assistance (2,578 | 12.6%), Retail Trade (2,233 | 10.9%), Construction (2,061 | 10.1%), and Accommodation & Food Services (1,826 | 8.9%).
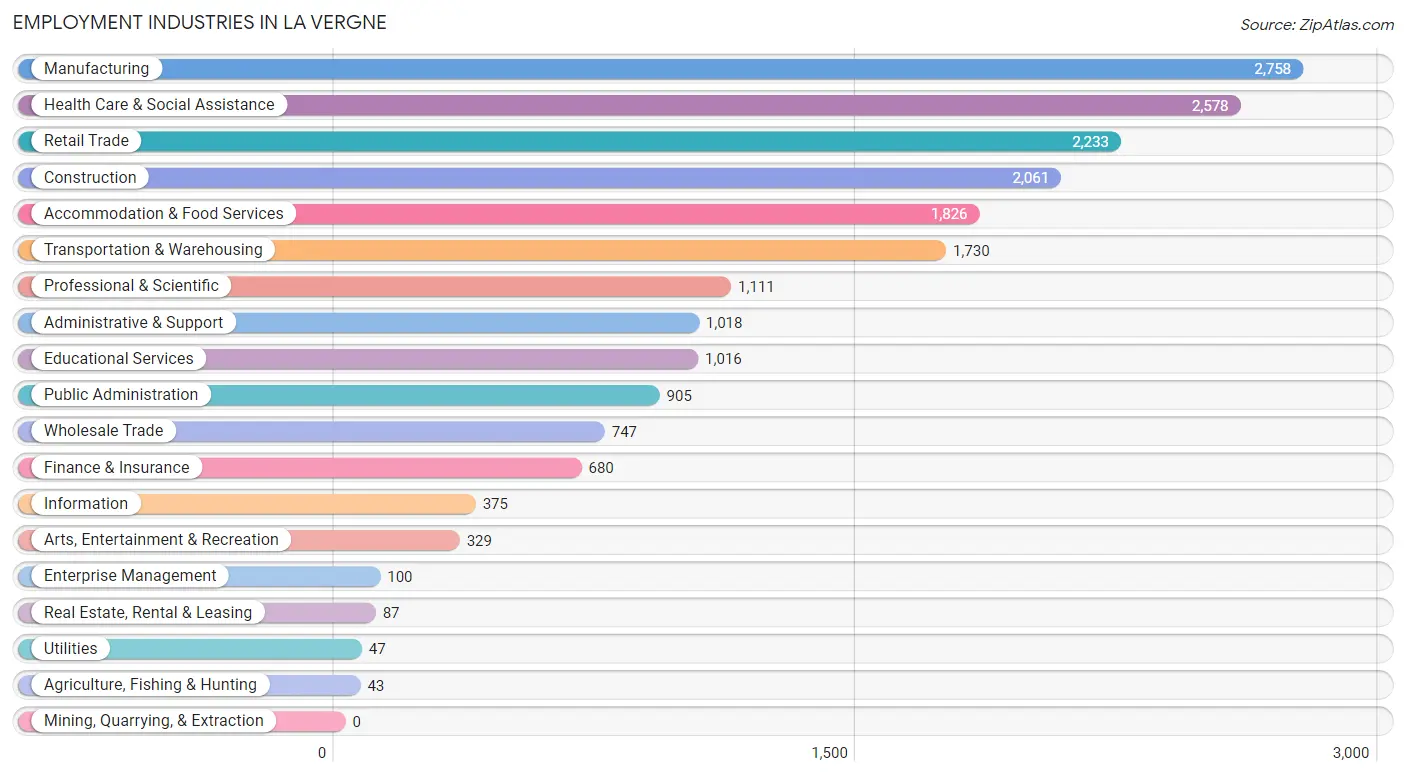
Employment Industries by Sex in La Vergne
The La Vergne industries that see more men than women are Construction (89.7%), Utilities (83.0%), and Wholesale Trade (81.4%), whereas the industries that tend to have a higher number of women are Health Care & Social Assistance (80.4%), Educational Services (73.6%), and Information (72.5%).
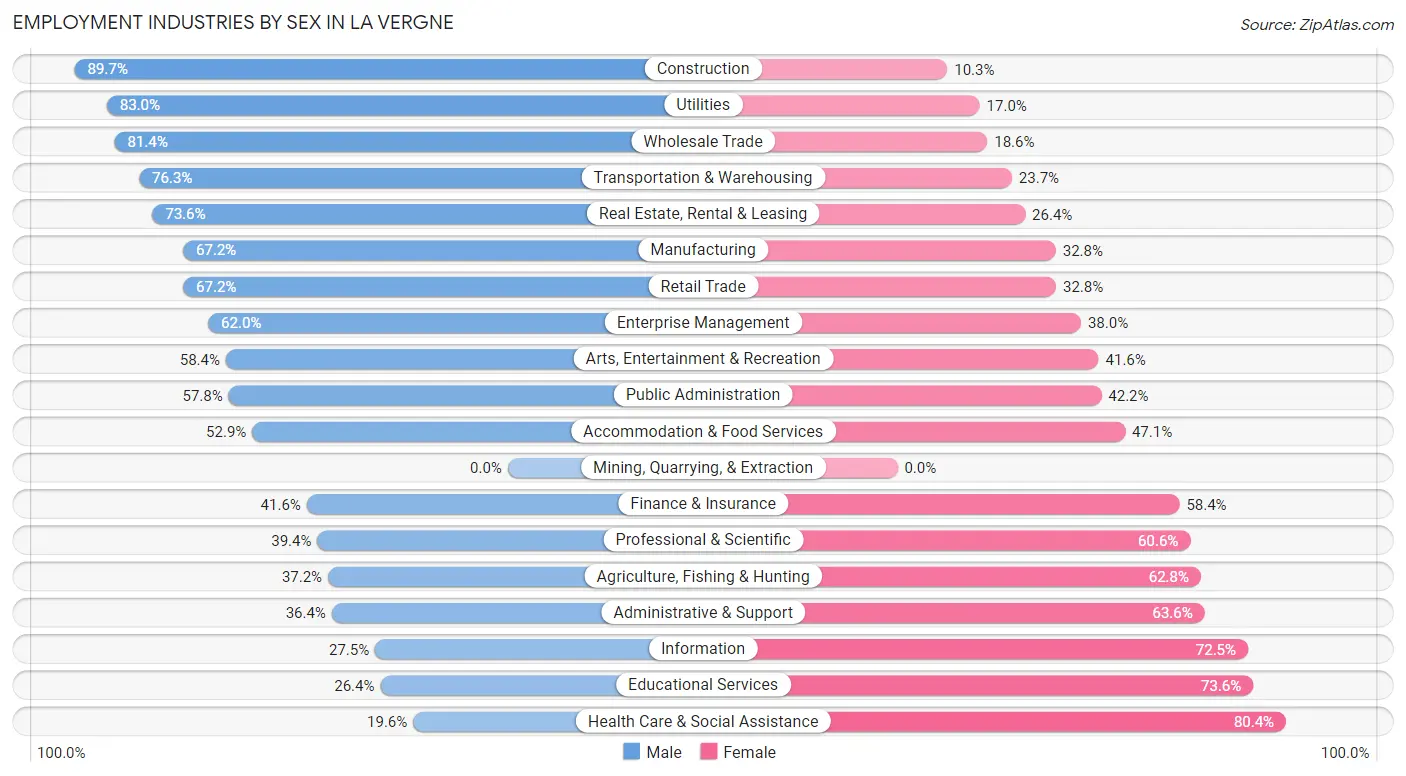
| Industry | Male | Female |
| Agriculture, Fishing & Hunting | 16 (37.2%) | 27 (62.8%) |
| Mining, Quarrying, & Extraction | 0 (0.0%) | 0 (0.0%) |
| Construction | 1,848 (89.7%) | 213 (10.3%) |
| Manufacturing | 1,854 (67.2%) | 904 (32.8%) |
| Wholesale Trade | 608 (81.4%) | 139 (18.6%) |
| Retail Trade | 1,500 (67.2%) | 733 (32.8%) |
| Transportation & Warehousing | 1,320 (76.3%) | 410 (23.7%) |
| Utilities | 39 (83.0%) | 8 (17.0%) |
| Information | 103 (27.5%) | 272 (72.5%) |
| Finance & Insurance | 283 (41.6%) | 397 (58.4%) |
| Real Estate, Rental & Leasing | 64 (73.6%) | 23 (26.4%) |
| Professional & Scientific | 438 (39.4%) | 673 (60.6%) |
| Enterprise Management | 62 (62.0%) | 38 (38.0%) |
| Administrative & Support | 371 (36.4%) | 647 (63.6%) |
| Educational Services | 268 (26.4%) | 748 (73.6%) |
| Health Care & Social Assistance | 505 (19.6%) | 2,073 (80.4%) |
| Arts, Entertainment & Recreation | 192 (58.4%) | 137 (41.6%) |
| Accommodation & Food Services | 966 (52.9%) | 860 (47.1%) |
| Public Administration | 523 (57.8%) | 382 (42.2%) |
| Total | 11,346 (55.5%) | 9,085 (44.5%) |
Education in La Vergne
School Enrollment in La Vergne
The most common levels of schooling among the 9,898 students in La Vergne are middle school (3,148 | 31.8%), high school (2,465 | 24.9%), and elementary school (2,400 | 24.2%).
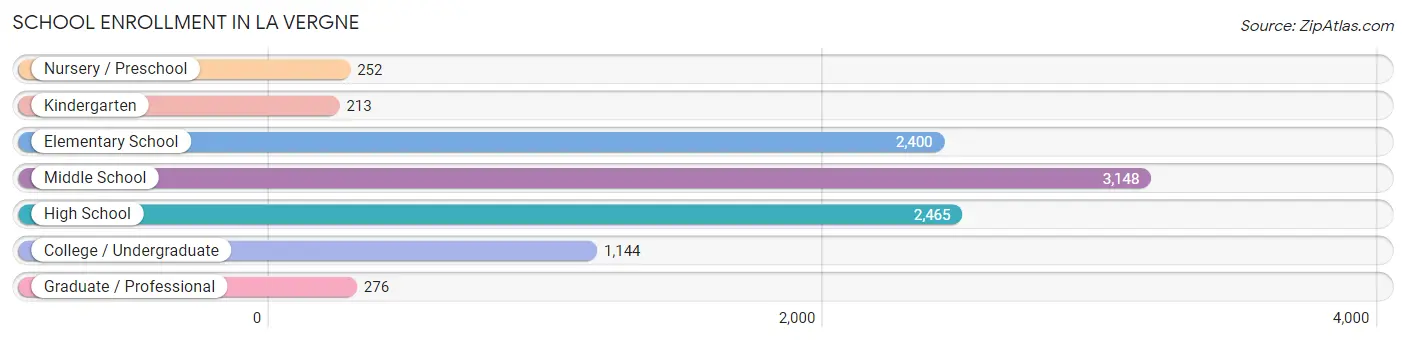
| School Level | # Students | % Students |
| Nursery / Preschool | 252 | 2.5% |
| Kindergarten | 213 | 2.1% |
| Elementary School | 2,400 | 24.2% |
| Middle School | 3,148 | 31.8% |
| High School | 2,465 | 24.9% |
| College / Undergraduate | 1,144 | 11.6% |
| Graduate / Professional | 276 | 2.8% |
| Total | 9,898 | 100.0% |
School Enrollment by Age by Funding Source in La Vergne
Out of a total of 9,898 students who are enrolled in schools in La Vergne, 990 (10.0%) attend a private institution, while the remaining 8,908 (90.0%) are enrolled in public schools. The age group of 35 years and over has the highest likelihood of being enrolled in private schools, with 174 (58.0% in the age bracket) enrolled. Conversely, the age group of 18 to 19 year olds has the lowest likelihood of being enrolled in a private school, with 579 (97.5% in the age bracket) attending a public institution.
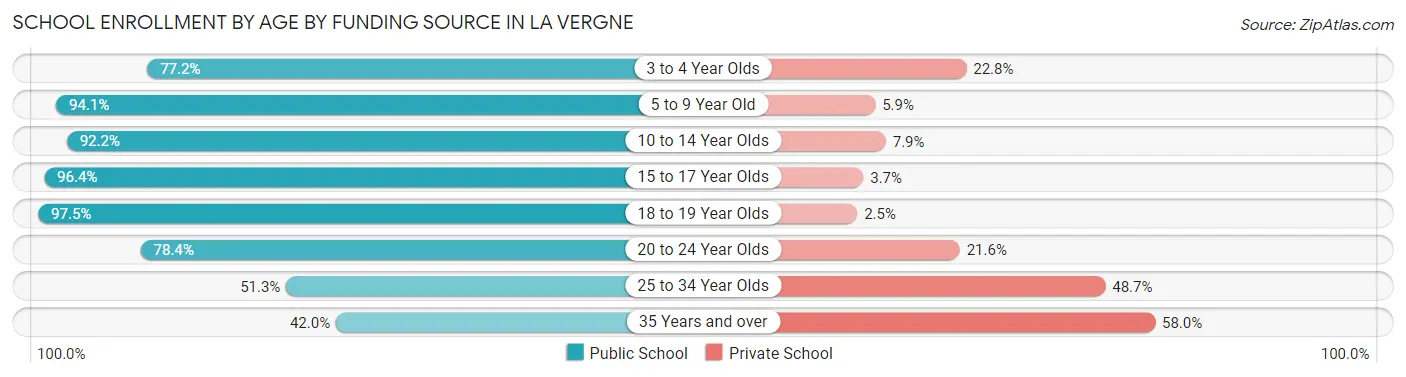
| Age Bracket | Public School | Private School |
| 3 to 4 Year Olds | 152 (77.2%) | 45 (22.8%) |
| 5 to 9 Year Old | 2,182 (94.1%) | 136 (5.9%) |
| 10 to 14 Year Olds | 3,534 (92.1%) | 301 (7.9%) |
| 15 to 17 Year Olds | 1,688 (96.4%) | 64 (3.6%) |
| 18 to 19 Year Olds | 579 (97.5%) | 15 (2.5%) |
| 20 to 24 Year Olds | 522 (78.4%) | 144 (21.6%) |
| 25 to 34 Year Olds | 121 (51.3%) | 115 (48.7%) |
| 35 Years and over | 126 (42.0%) | 174 (58.0%) |
| Total | 8,908 (90.0%) | 990 (10.0%) |
Educational Attainment by Field of Study in La Vergne
Business (1,349 | 21.9%), arts & humanities (976 | 15.8%), science & technology (669 | 10.8%), education (508 | 8.2%), and communications (465 | 7.5%) are the most common fields of study among 6,170 individuals in La Vergne who have obtained a bachelor's degree or higher.
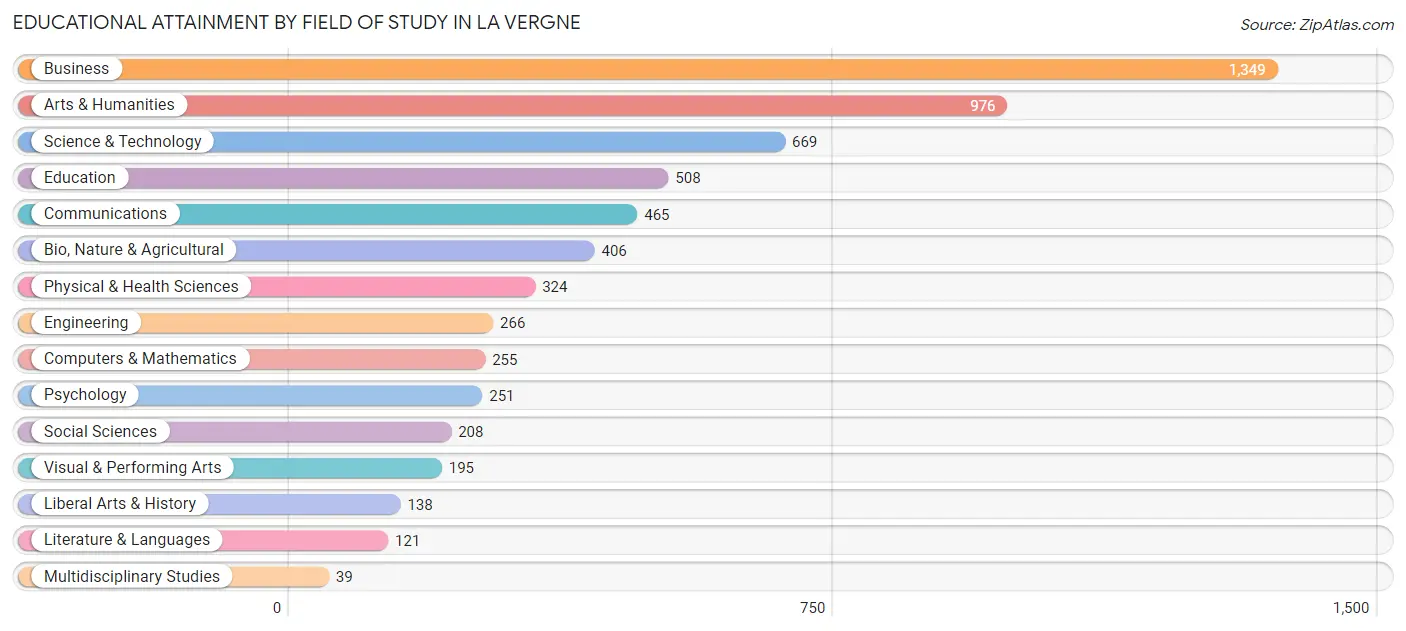
| Field of Study | # Graduates | % Graduates |
| Computers & Mathematics | 255 | 4.1% |
| Bio, Nature & Agricultural | 406 | 6.6% |
| Physical & Health Sciences | 324 | 5.2% |
| Psychology | 251 | 4.1% |
| Social Sciences | 208 | 3.4% |
| Engineering | 266 | 4.3% |
| Multidisciplinary Studies | 39 | 0.6% |
| Science & Technology | 669 | 10.8% |
| Business | 1,349 | 21.9% |
| Education | 508 | 8.2% |
| Literature & Languages | 121 | 2.0% |
| Liberal Arts & History | 138 | 2.2% |
| Visual & Performing Arts | 195 | 3.2% |
| Communications | 465 | 7.5% |
| Arts & Humanities | 976 | 15.8% |
| Total | 6,170 | 100.0% |
Transportation & Commute in La Vergne
Vehicle Availability by Sex in La Vergne
The most prevalent vehicle ownership categories in La Vergne are males with 2 vehicles (5,694, accounting for 50.6%) and females with 2 vehicles (3,989, making up 63.9%).
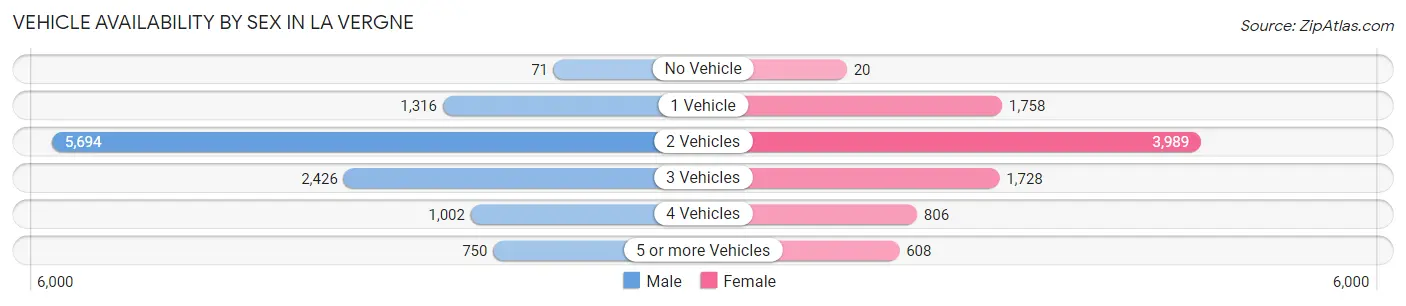
| Vehicles Available | Male | Female |
| No Vehicle | 71 (0.6%) | 20 (0.2%) |
| 1 Vehicle | 1,316 (11.7%) | 1,758 (19.7%) |
| 2 Vehicles | 5,694 (50.6%) | 3,989 (44.8%) |
| 3 Vehicles | 2,426 (21.5%) | 1,728 (19.4%) |
| 4 Vehicles | 1,002 (8.9%) | 806 (9.0%) |
| 5 or more Vehicles | 750 (6.7%) | 608 (6.8%) |
| Total | 11,259 (100.0%) | 8,909 (100.0%) |
Commute Time in La Vergne
The most frequently occuring commute durations in La Vergne are 30 to 34 minutes (3,530 commuters, 19.7%), 15 to 19 minutes (2,913 commuters, 16.3%), and 45 to 59 minutes (2,070 commuters, 11.6%).
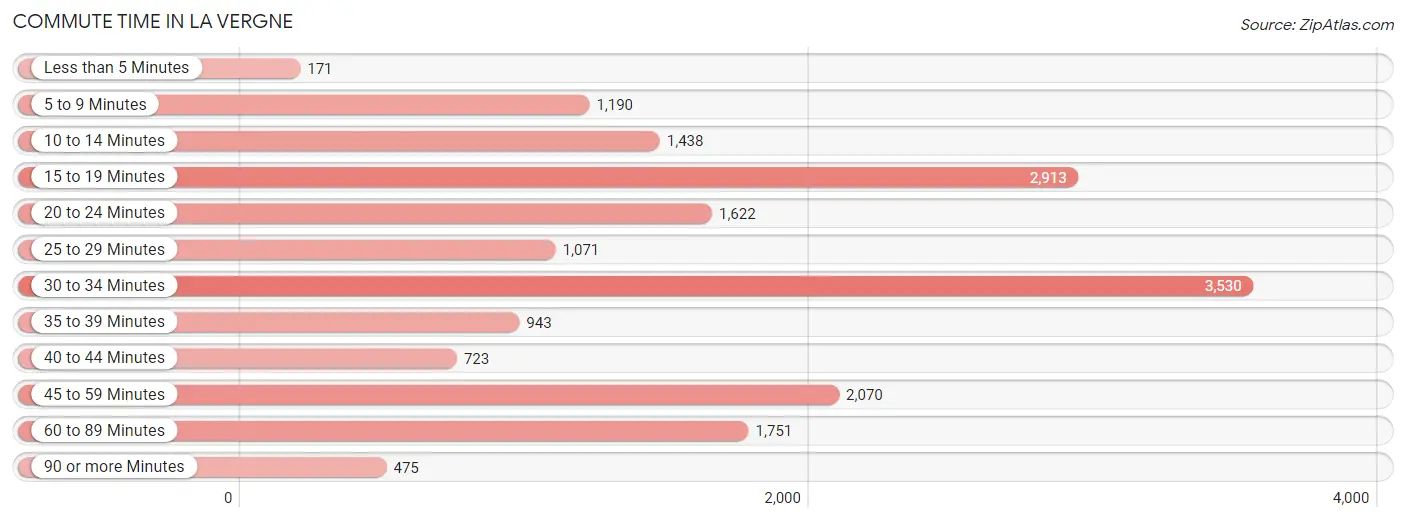
| Commute Time | # Commuters | % Commuters |
| Less than 5 Minutes | 171 | 1.0% |
| 5 to 9 Minutes | 1,190 | 6.7% |
| 10 to 14 Minutes | 1,438 | 8.0% |
| 15 to 19 Minutes | 2,913 | 16.3% |
| 20 to 24 Minutes | 1,622 | 9.1% |
| 25 to 29 Minutes | 1,071 | 6.0% |
| 30 to 34 Minutes | 3,530 | 19.7% |
| 35 to 39 Minutes | 943 | 5.3% |
| 40 to 44 Minutes | 723 | 4.0% |
| 45 to 59 Minutes | 2,070 | 11.6% |
| 60 to 89 Minutes | 1,751 | 9.8% |
| 90 or more Minutes | 475 | 2.6% |
Commute Time by Sex in La Vergne
The most common commute times in La Vergne are 30 to 34 minutes (2,175 commuters, 21.3%) for males and 30 to 34 minutes (1,355 commuters, 17.7%) for females.
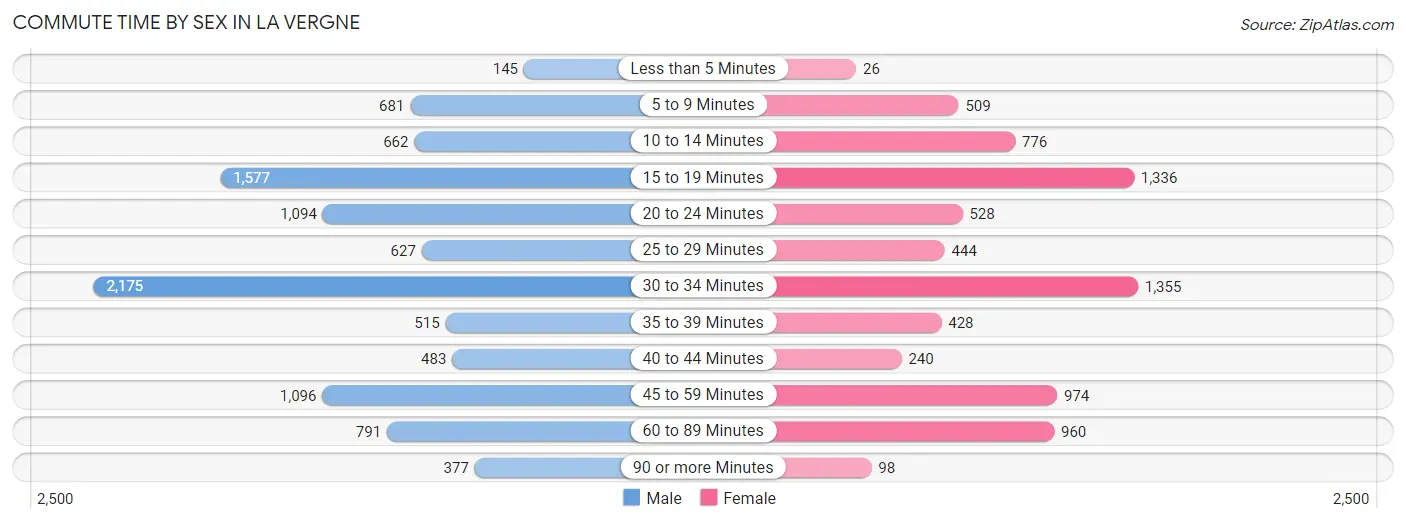
| Commute Time | Male | Female |
| Less than 5 Minutes | 145 (1.4%) | 26 (0.3%) |
| 5 to 9 Minutes | 681 (6.7%) | 509 (6.6%) |
| 10 to 14 Minutes | 662 (6.5%) | 776 (10.1%) |
| 15 to 19 Minutes | 1,577 (15.4%) | 1,336 (17.4%) |
| 20 to 24 Minutes | 1,094 (10.7%) | 528 (6.9%) |
| 25 to 29 Minutes | 627 (6.1%) | 444 (5.8%) |
| 30 to 34 Minutes | 2,175 (21.3%) | 1,355 (17.7%) |
| 35 to 39 Minutes | 515 (5.0%) | 428 (5.6%) |
| 40 to 44 Minutes | 483 (4.7%) | 240 (3.1%) |
| 45 to 59 Minutes | 1,096 (10.7%) | 974 (12.7%) |
| 60 to 89 Minutes | 791 (7.7%) | 960 (12.5%) |
| 90 or more Minutes | 377 (3.7%) | 98 (1.3%) |
Time of Departure to Work by Sex in La Vergne
The most frequent times of departure to work in La Vergne are 6:00 AM to 6:29 AM (1,511, 14.8%) for males and 7:00 AM to 7:29 AM (1,030, 13.4%) for females.
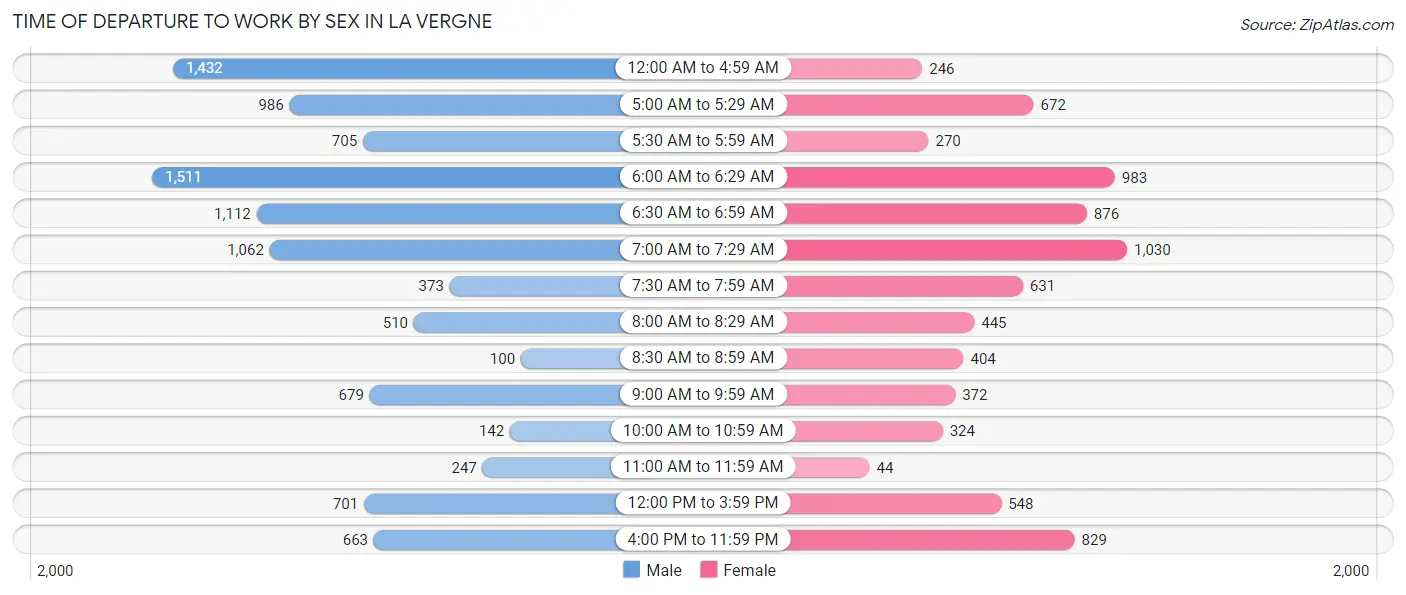
| Time of Departure | Male | Female |
| 12:00 AM to 4:59 AM | 1,432 (14.0%) | 246 (3.2%) |
| 5:00 AM to 5:29 AM | 986 (9.6%) | 672 (8.8%) |
| 5:30 AM to 5:59 AM | 705 (6.9%) | 270 (3.5%) |
| 6:00 AM to 6:29 AM | 1,511 (14.8%) | 983 (12.8%) |
| 6:30 AM to 6:59 AM | 1,112 (10.9%) | 876 (11.4%) |
| 7:00 AM to 7:29 AM | 1,062 (10.4%) | 1,030 (13.4%) |
| 7:30 AM to 7:59 AM | 373 (3.6%) | 631 (8.2%) |
| 8:00 AM to 8:29 AM | 510 (5.0%) | 445 (5.8%) |
| 8:30 AM to 8:59 AM | 100 (1.0%) | 404 (5.3%) |
| 9:00 AM to 9:59 AM | 679 (6.6%) | 372 (4.9%) |
| 10:00 AM to 10:59 AM | 142 (1.4%) | 324 (4.2%) |
| 11:00 AM to 11:59 AM | 247 (2.4%) | 44 (0.6%) |
| 12:00 PM to 3:59 PM | 701 (6.9%) | 548 (7.1%) |
| 4:00 PM to 11:59 PM | 663 (6.5%) | 829 (10.8%) |
| Total | 10,223 (100.0%) | 7,674 (100.0%) |
Housing Occupancy in La Vergne
Occupancy by Ownership in La Vergne
Of the total 12,980 dwellings in La Vergne, owner-occupied units account for 9,343 (72.0%), while renter-occupied units make up 3,637 (28.0%).
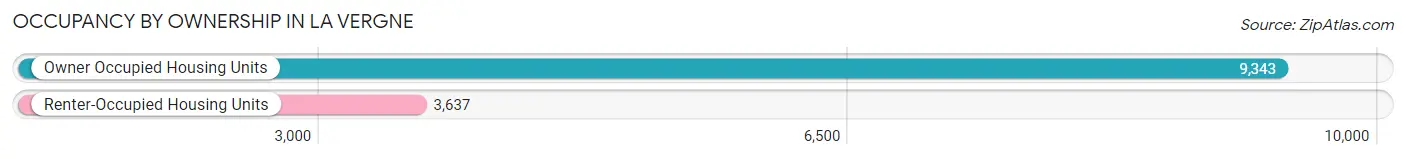
| Occupancy | # Housing Units | % Housing Units |
| Owner Occupied Housing Units | 9,343 | 72.0% |
| Renter-Occupied Housing Units | 3,637 | 28.0% |
| Total Occupied Housing Units | 12,980 | 100.0% |
Occupancy by Household Size in La Vergne
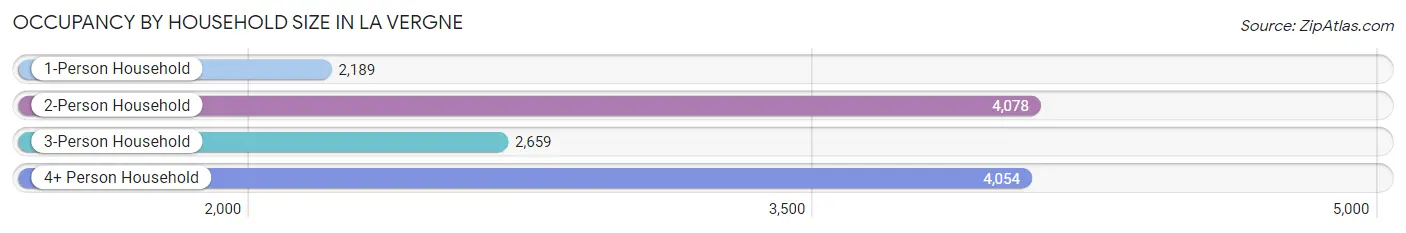
| Household Size | # Housing Units | % Housing Units |
| 1-Person Household | 2,189 | 16.9% |
| 2-Person Household | 4,078 | 31.4% |
| 3-Person Household | 2,659 | 20.5% |
| 4+ Person Household | 4,054 | 31.2% |
| Total Housing Units | 12,980 | 100.0% |
Occupancy by Ownership by Household Size in La Vergne
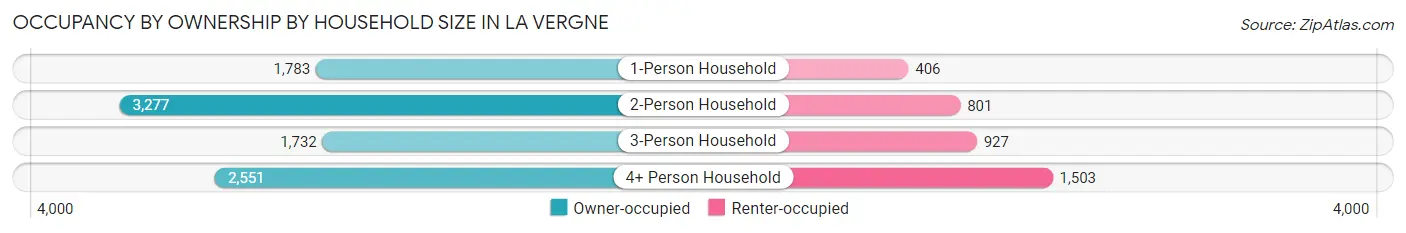
| Household Size | Owner-occupied | Renter-occupied |
| 1-Person Household | 1,783 (81.5%) | 406 (18.5%) |
| 2-Person Household | 3,277 (80.4%) | 801 (19.6%) |
| 3-Person Household | 1,732 (65.1%) | 927 (34.9%) |
| 4+ Person Household | 2,551 (62.9%) | 1,503 (37.1%) |
| Total Housing Units | 9,343 (72.0%) | 3,637 (28.0%) |
Occupancy by Educational Attainment in La Vergne
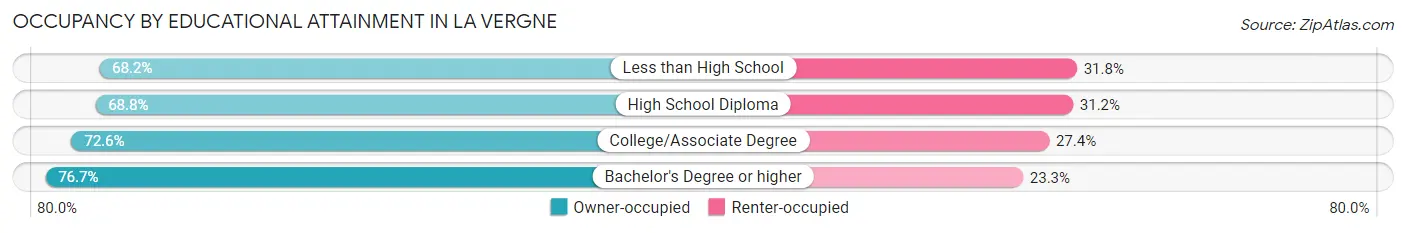
| Household Size | Owner-occupied | Renter-occupied |
| Less than High School | 673 (68.2%) | 314 (31.8%) |
| High School Diploma | 3,067 (68.8%) | 1,391 (31.2%) |
| College/Associate Degree | 3,136 (72.6%) | 1,184 (27.4%) |
| Bachelor's Degree or higher | 2,467 (76.7%) | 748 (23.3%) |
Occupancy by Age of Householder in La Vergne
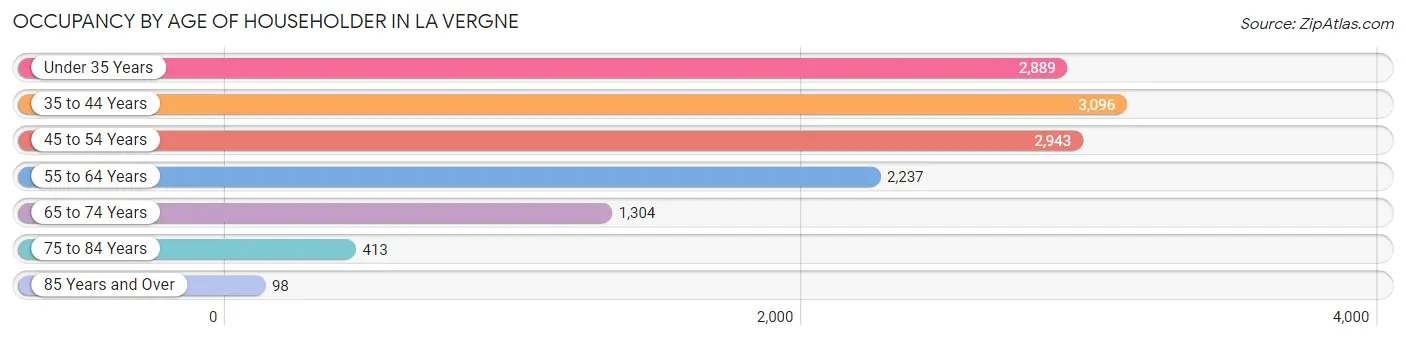
| Age Bracket | # Households | % Households |
| Under 35 Years | 2,889 | 22.3% |
| 35 to 44 Years | 3,096 | 23.8% |
| 45 to 54 Years | 2,943 | 22.7% |
| 55 to 64 Years | 2,237 | 17.2% |
| 65 to 74 Years | 1,304 | 10.1% |
| 75 to 84 Years | 413 | 3.2% |
| 85 Years and Over | 98 | 0.8% |
| Total | 12,980 | 100.0% |
Housing Finances in La Vergne
Median Income by Occupancy in La Vergne
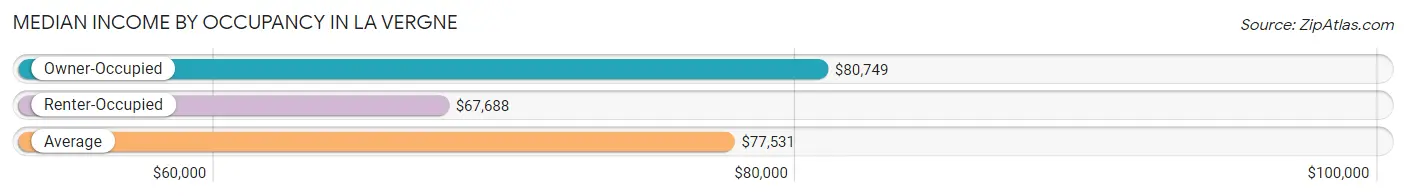
| Occupancy Type | # Households | Median Income |
| Owner-Occupied | 9,343 (72.0%) | $80,749 |
| Renter-Occupied | 3,637 (28.0%) | $67,688 |
| Average | 12,980 (100.0%) | $77,531 |
Occupancy by Householder Income Bracket in La Vergne
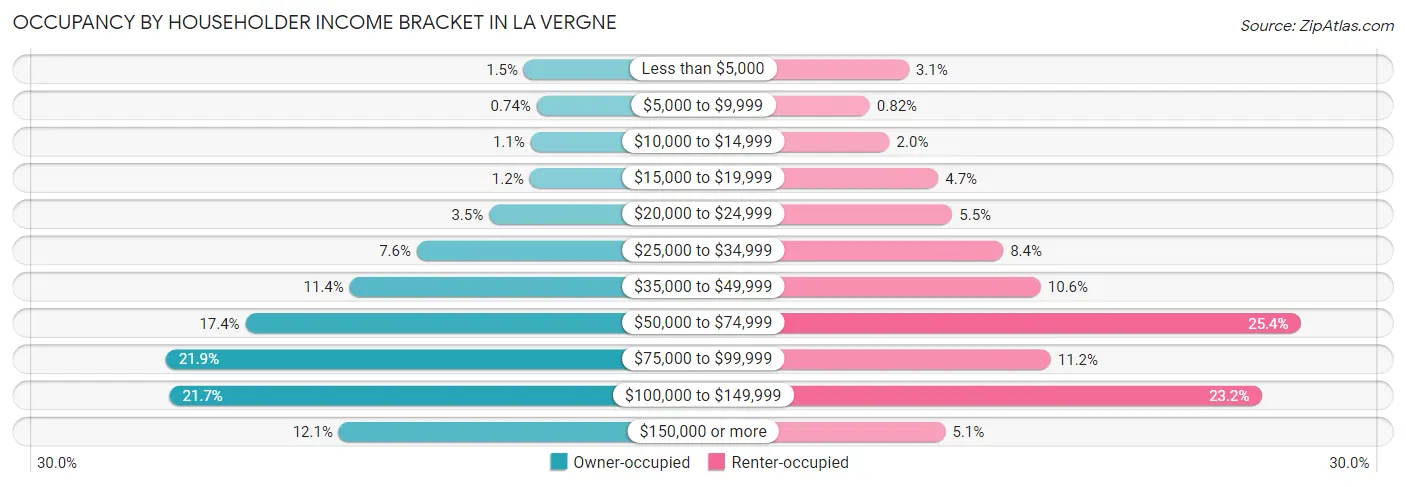
| Income Bracket | Owner-occupied | Renter-occupied |
| Less than $5,000 | 137 (1.5%) | 111 (3.0%) |
| $5,000 to $9,999 | 69 (0.7%) | 30 (0.8%) |
| $10,000 to $14,999 | 102 (1.1%) | 71 (1.9%) |
| $15,000 to $19,999 | 107 (1.1%) | 172 (4.7%) |
| $20,000 to $24,999 | 323 (3.5%) | 201 (5.5%) |
| $25,000 to $34,999 | 709 (7.6%) | 307 (8.4%) |
| $35,000 to $49,999 | 1,068 (11.4%) | 385 (10.6%) |
| $50,000 to $74,999 | 1,624 (17.4%) | 924 (25.4%) |
| $75,000 to $99,999 | 2,049 (21.9%) | 406 (11.2%) |
| $100,000 to $149,999 | 2,029 (21.7%) | 843 (23.2%) |
| $150,000 or more | 1,126 (12.0%) | 187 (5.1%) |
| Total | 9,343 (100.0%) | 3,637 (100.0%) |
Monthly Housing Cost Tiers in La Vergne
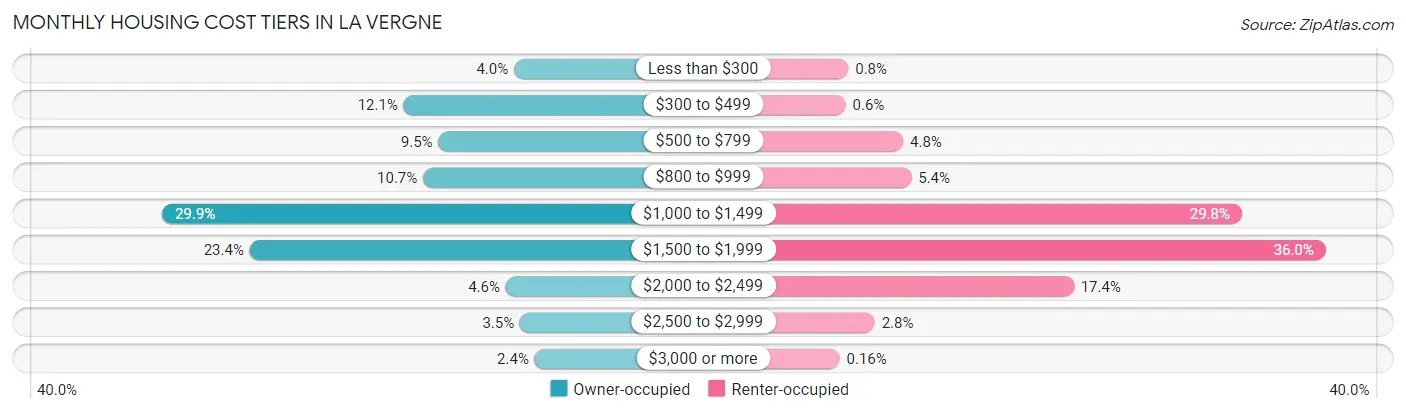
| Monthly Cost | Owner-occupied | Renter-occupied |
| Less than $300 | 369 (4.0%) | 29 (0.8%) |
| $300 to $499 | 1,129 (12.1%) | 22 (0.6%) |
| $500 to $799 | 889 (9.5%) | 176 (4.8%) |
| $800 to $999 | 995 (10.6%) | 198 (5.4%) |
| $1,000 to $1,499 | 2,792 (29.9%) | 1,083 (29.8%) |
| $1,500 to $1,999 | 2,188 (23.4%) | 1,308 (36.0%) |
| $2,000 to $2,499 | 426 (4.6%) | 633 (17.4%) |
| $2,500 to $2,999 | 328 (3.5%) | 100 (2.8%) |
| $3,000 or more | 227 (2.4%) | 6 (0.2%) |
| Total | 9,343 (100.0%) | 3,637 (100.0%) |
Physical Housing Characteristics in La Vergne
Housing Structures in La Vergne
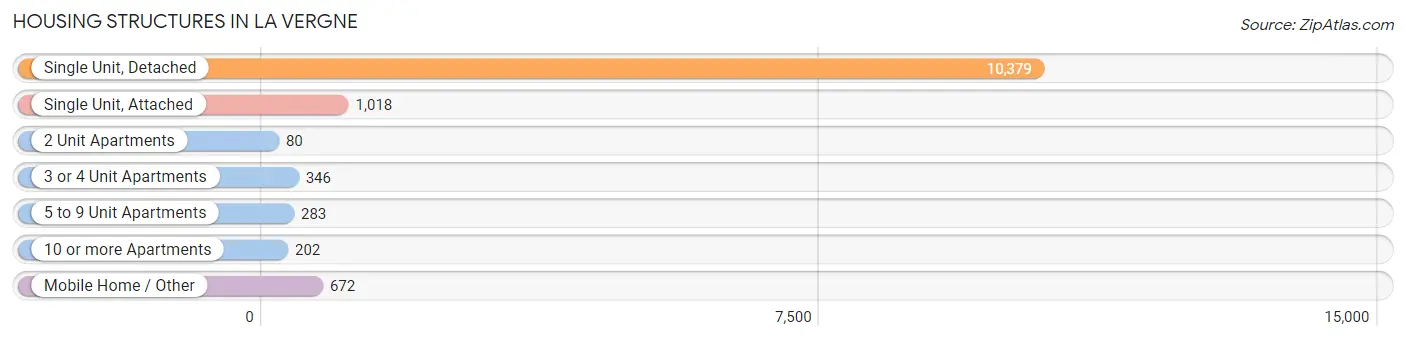
| Structure Type | # Housing Units | % Housing Units |
| Single Unit, Detached | 10,379 | 80.0% |
| Single Unit, Attached | 1,018 | 7.8% |
| 2 Unit Apartments | 80 | 0.6% |
| 3 or 4 Unit Apartments | 346 | 2.7% |
| 5 to 9 Unit Apartments | 283 | 2.2% |
| 10 or more Apartments | 202 | 1.6% |
| Mobile Home / Other | 672 | 5.2% |
| Total | 12,980 | 100.0% |
Housing Structures by Occupancy in La Vergne
| Structure Type | Owner-occupied | Renter-occupied |
| Single Unit, Detached | 7,959 (76.7%) | 2,420 (23.3%) |
| Single Unit, Attached | 753 (74.0%) | 265 (26.0%) |
| 2 Unit Apartments | 25 (31.2%) | 55 (68.8%) |
| 3 or 4 Unit Apartments | 109 (31.5%) | 237 (68.5%) |
| 5 to 9 Unit Apartments | 0 (0.0%) | 283 (100.0%) |
| 10 or more Apartments | 50 (24.7%) | 152 (75.2%) |
| Mobile Home / Other | 447 (66.5%) | 225 (33.5%) |
| Total | 9,343 (72.0%) | 3,637 (28.0%) |
Housing Structures by Number of Rooms in La Vergne
| Number of Rooms | Owner-occupied | Renter-occupied |
| 1 Room | 0 (0.0%) | 26 (0.7%) |
| 2 or 3 Rooms | 160 (1.7%) | 211 (5.8%) |
| 4 or 5 Rooms | 3,802 (40.7%) | 1,303 (35.8%) |
| 6 or 7 Rooms | 3,445 (36.9%) | 1,544 (42.4%) |
| 8 or more Rooms | 1,936 (20.7%) | 553 (15.2%) |
| Total | 9,343 (100.0%) | 3,637 (100.0%) |
Housing Structure by Heating Type in La Vergne
| Heating Type | Owner-occupied | Renter-occupied |
| Utility Gas | 1,423 (15.2%) | 456 (12.5%) |
| Bottled, Tank, or LP Gas | 143 (1.5%) | 24 (0.7%) |
| Electricity | 7,620 (81.6%) | 3,117 (85.7%) |
| Fuel Oil or Kerosene | 0 (0.0%) | 0 (0.0%) |
| Coal or Coke | 0 (0.0%) | 0 (0.0%) |
| All other Fuels | 30 (0.3%) | 7 (0.2%) |
| No Fuel Used | 127 (1.4%) | 33 (0.9%) |
| Total | 9,343 (100.0%) | 3,637 (100.0%) |
Household Vehicle Usage in La Vergne
| Vehicles per Household | Owner-occupied | Renter-occupied |
| No Vehicle | 87 (0.9%) | 96 (2.6%) |
| 1 Vehicle | 2,143 (22.9%) | 1,118 (30.7%) |
| 2 Vehicles | 4,484 (48.0%) | 1,794 (49.3%) |
| 3 or more Vehicles | 2,629 (28.1%) | 629 (17.3%) |
| Total | 9,343 (100.0%) | 3,637 (100.0%) |
Real Estate & Mortgages in La Vergne
Real Estate and Mortgage Overview in La Vergne
| Characteristic | Without Mortgage | With Mortgage |
| Housing Units | 2,407 | 6,936 |
| Median Property Value | $249,600 | $248,000 |
| Median Household Income | $66,577 | $880 |
| Monthly Housing Costs | $463 | $227 |
| Real Estate Taxes | $1,337 | $387 |
Property Value by Mortgage Status in La Vergne
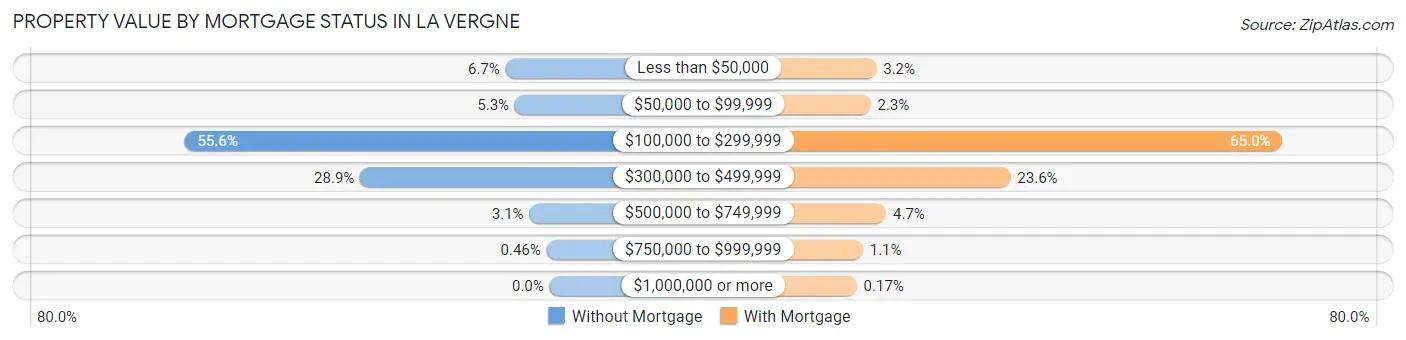
| Property Value | Without Mortgage | With Mortgage |
| Less than $50,000 | 161 (6.7%) | 219 (3.2%) |
| $50,000 to $99,999 | 127 (5.3%) | 158 (2.3%) |
| $100,000 to $299,999 | 1,339 (55.6%) | 4,511 (65.0%) |
| $300,000 to $499,999 | 695 (28.9%) | 1,637 (23.6%) |
| $500,000 to $749,999 | 74 (3.1%) | 323 (4.7%) |
| $750,000 to $999,999 | 11 (0.5%) | 76 (1.1%) |
| $1,000,000 or more | 0 (0.0%) | 12 (0.2%) |
| Total | 2,407 (100.0%) | 6,936 (100.0%) |
Household Income by Mortgage Status in La Vergne
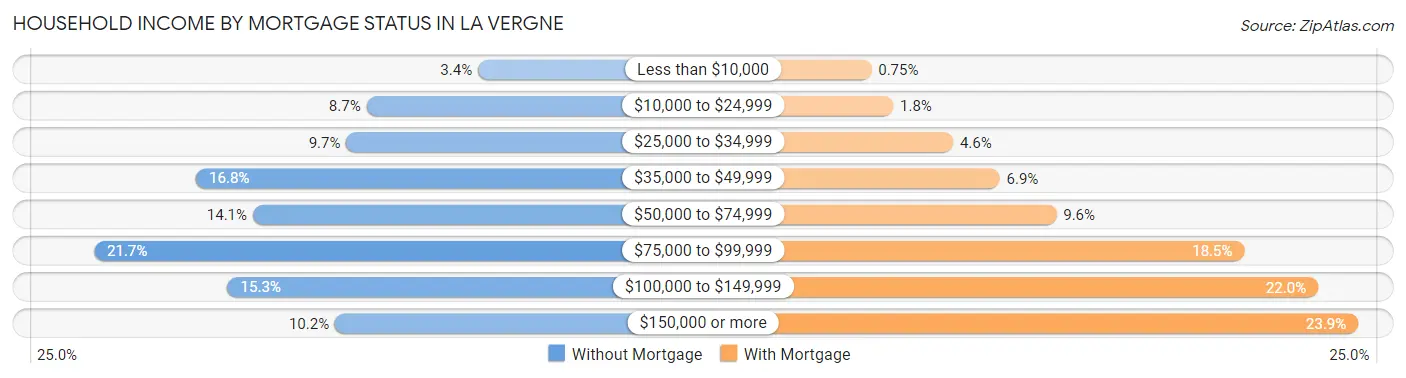
| Household Income | Without Mortgage | With Mortgage |
| Less than $10,000 | 82 (3.4%) | 52 (0.7%) |
| $10,000 to $24,999 | 210 (8.7%) | 124 (1.8%) |
| $25,000 to $34,999 | 233 (9.7%) | 322 (4.6%) |
| $35,000 to $49,999 | 405 (16.8%) | 476 (6.9%) |
| $50,000 to $74,999 | 340 (14.1%) | 663 (9.6%) |
| $75,000 to $99,999 | 522 (21.7%) | 1,284 (18.5%) |
| $100,000 to $149,999 | 369 (15.3%) | 1,527 (22.0%) |
| $150,000 or more | 246 (10.2%) | 1,660 (23.9%) |
| Total | 2,407 (100.0%) | 6,936 (100.0%) |
Property Value to Household Income Ratio in La Vergne
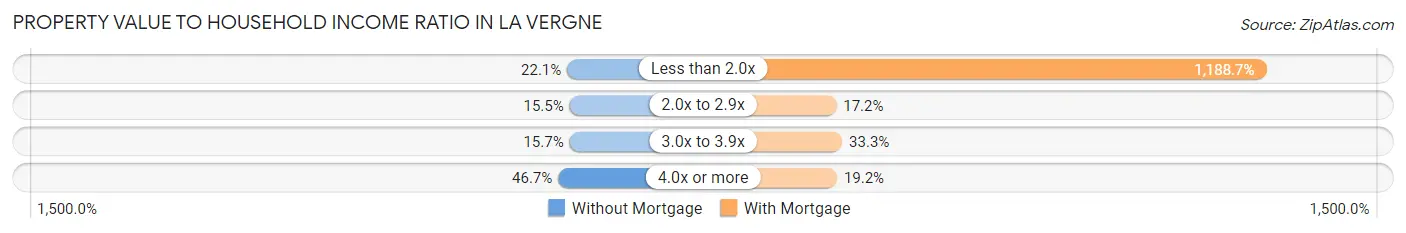
| Value-to-Income Ratio | Without Mortgage | With Mortgage |
| Less than 2.0x | 533 (22.1%) | 82,450 (1,188.7%) |
| 2.0x to 2.9x | 374 (15.5%) | 1,196 (17.2%) |
| 3.0x to 3.9x | 377 (15.7%) | 2,308 (33.3%) |
| 4.0x or more | 1,123 (46.7%) | 1,332 (19.2%) |
| Total | 2,407 (100.0%) | 6,936 (100.0%) |
Real Estate Taxes by Mortgage Status in La Vergne
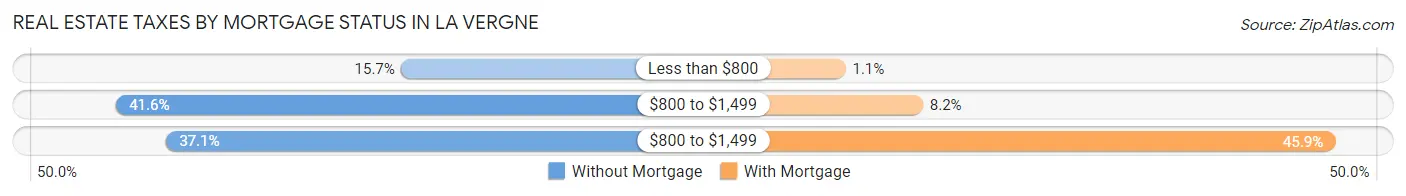
| Property Taxes | Without Mortgage | With Mortgage |
| Less than $800 | 377 (15.7%) | 79 (1.1%) |
| $800 to $1,499 | 1,002 (41.6%) | 569 (8.2%) |
| $800 to $1,499 | 892 (37.1%) | 3,180 (45.9%) |
| Total | 2,407 (100.0%) | 6,936 (100.0%) |
Health & Disability in La Vergne
Health Insurance Coverage by Age in La Vergne
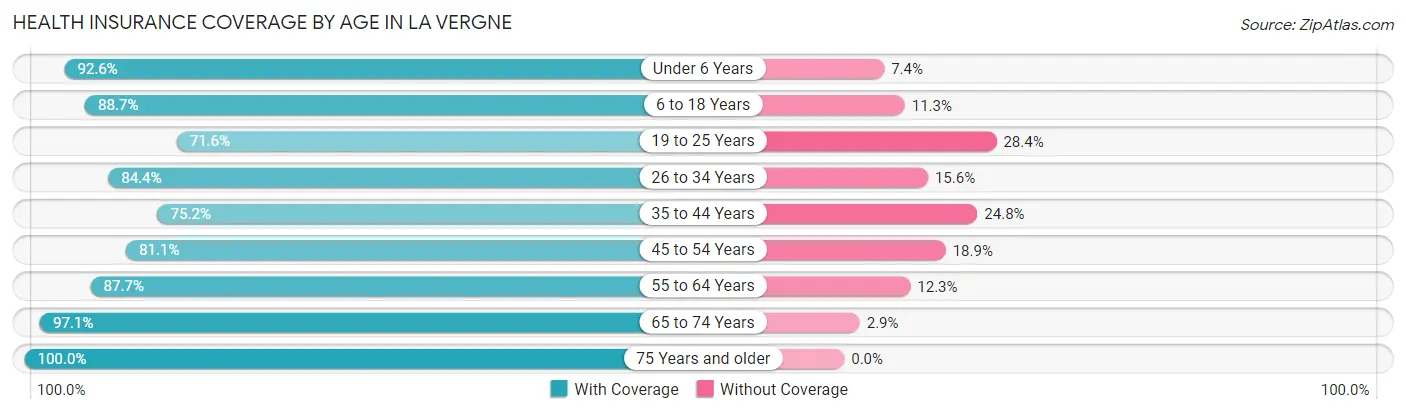
| Age Bracket | With Coverage | Without Coverage |
| Under 6 Years | 2,888 (92.6%) | 232 (7.4%) |
| 6 to 18 Years | 7,305 (88.7%) | 929 (11.3%) |
| 19 to 25 Years | 2,658 (71.6%) | 1,053 (28.4%) |
| 26 to 34 Years | 4,518 (84.4%) | 836 (15.6%) |
| 35 to 44 Years | 4,317 (75.2%) | 1,425 (24.8%) |
| 45 to 54 Years | 4,242 (81.1%) | 990 (18.9%) |
| 55 to 64 Years | 3,643 (87.7%) | 512 (12.3%) |
| 65 to 74 Years | 2,050 (97.1%) | 61 (2.9%) |
| 75 Years and older | 886 (100.0%) | 0 (0.0%) |
| Total | 32,507 (84.3%) | 6,038 (15.7%) |
Health Insurance Coverage by Citizenship Status in La Vergne
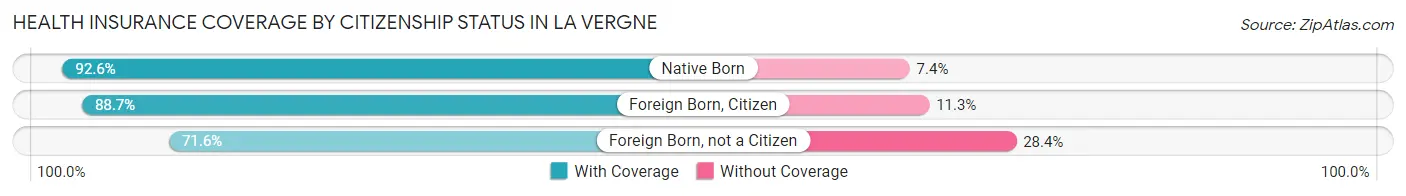
| Citizenship Status | With Coverage | Without Coverage |
| Native Born | 2,888 (92.6%) | 232 (7.4%) |
| Foreign Born, Citizen | 7,305 (88.7%) | 929 (11.3%) |
| Foreign Born, not a Citizen | 2,658 (71.6%) | 1,053 (28.4%) |
Health Insurance Coverage by Household Income in La Vergne
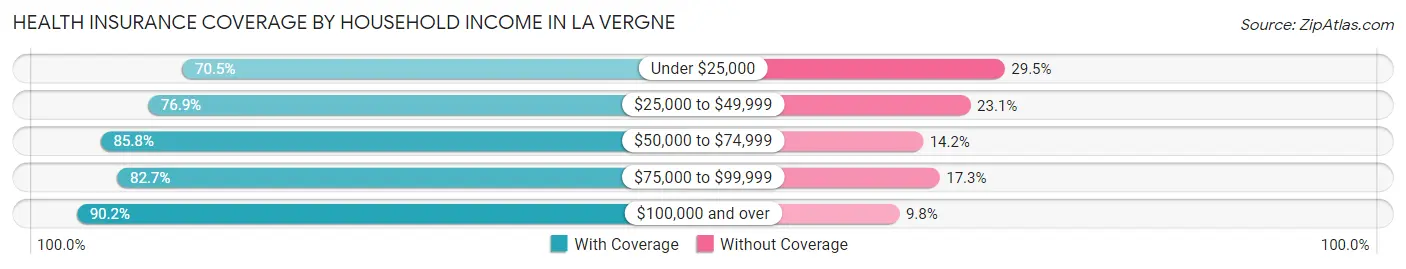
| Household Income | With Coverage | Without Coverage |
| Under $25,000 | 1,946 (70.5%) | 815 (29.5%) |
| $25,000 to $49,999 | 4,913 (76.9%) | 1,477 (23.1%) |
| $50,000 to $74,999 | 6,806 (85.8%) | 1,128 (14.2%) |
| $75,000 to $99,999 | 5,709 (82.7%) | 1,197 (17.3%) |
| $100,000 and over | 13,126 (90.2%) | 1,421 (9.8%) |
Public vs Private Health Insurance Coverage by Age in La Vergne
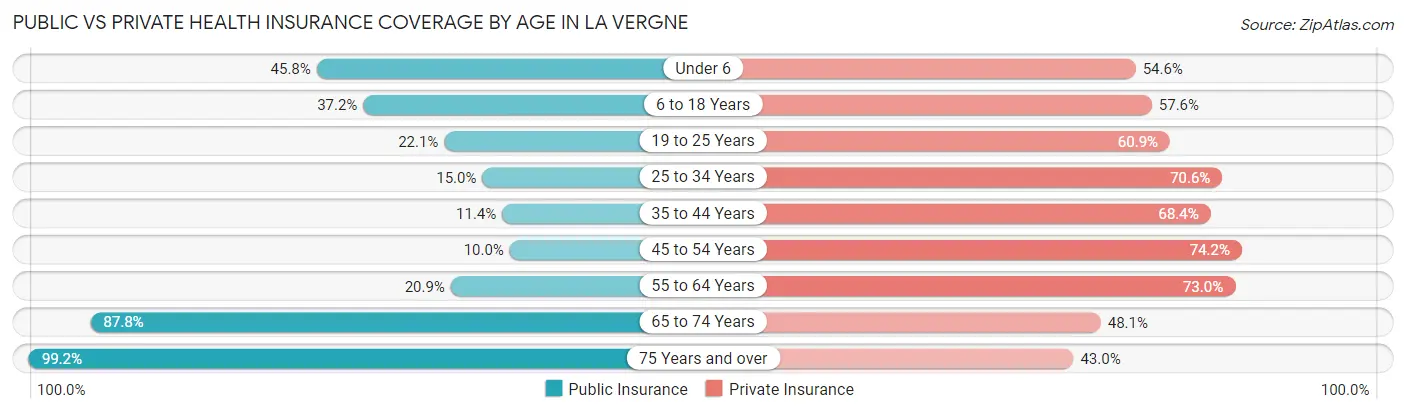
| Age Bracket | Public Insurance | Private Insurance |
| Under 6 | 1,429 (45.8%) | 1,702 (54.5%) |
| 6 to 18 Years | 3,059 (37.1%) | 4,739 (57.6%) |
| 19 to 25 Years | 821 (22.1%) | 2,260 (60.9%) |
| 25 to 34 Years | 805 (15.0%) | 3,780 (70.6%) |
| 35 to 44 Years | 653 (11.4%) | 3,930 (68.4%) |
| 45 to 54 Years | 521 (10.0%) | 3,884 (74.2%) |
| 55 to 64 Years | 869 (20.9%) | 3,032 (73.0%) |
| 65 to 74 Years | 1,853 (87.8%) | 1,015 (48.1%) |
| 75 Years and over | 879 (99.2%) | 381 (43.0%) |
| Total | 10,889 (28.2%) | 24,723 (64.1%) |
Disability Status by Sex by Age in La Vergne
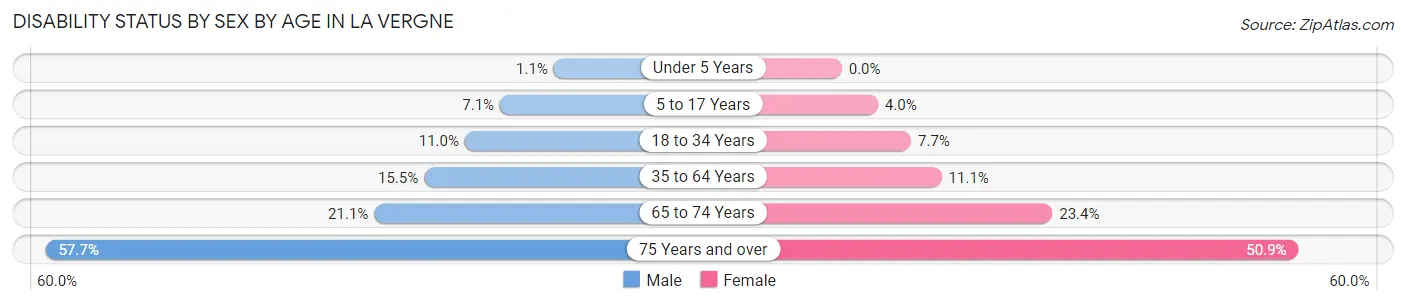
| Age Bracket | Male | Female |
| Under 5 Years | 16 (1.1%) | 0 (0.0%) |
| 5 to 17 Years | 272 (7.1%) | 178 (4.0%) |
| 18 to 34 Years | 522 (11.0%) | 361 (7.7%) |
| 35 to 64 Years | 1,203 (15.5%) | 820 (11.1%) |
| 65 to 74 Years | 229 (21.1%) | 240 (23.4%) |
| 75 Years and over | 173 (57.7%) | 298 (50.8%) |
Disability Class by Sex by Age in La Vergne
Disability Class: Hearing Difficulty
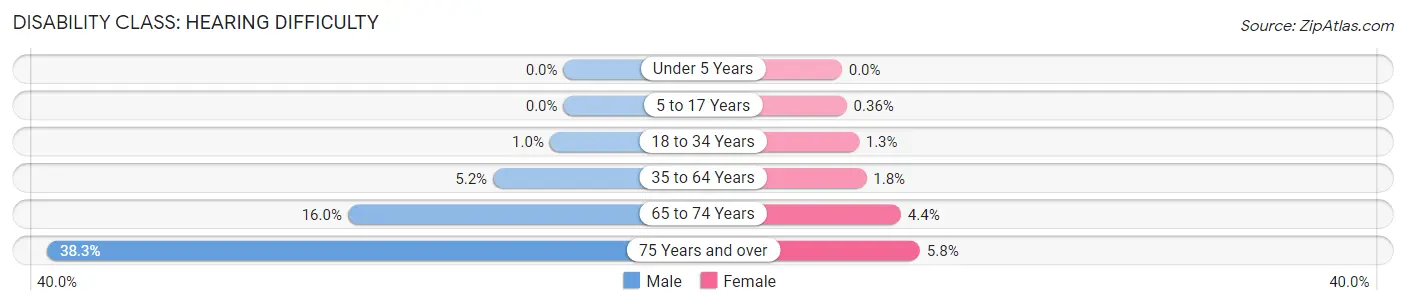
| Age Bracket | Male | Female |
| Under 5 Years | 0 (0.0%) | 0 (0.0%) |
| 5 to 17 Years | 0 (0.0%) | 16 (0.4%) |
| 18 to 34 Years | 48 (1.0%) | 59 (1.3%) |
| 35 to 64 Years | 406 (5.2%) | 134 (1.8%) |
| 65 to 74 Years | 174 (16.0%) | 45 (4.4%) |
| 75 Years and over | 115 (38.3%) | 34 (5.8%) |
Disability Class: Vision Difficulty
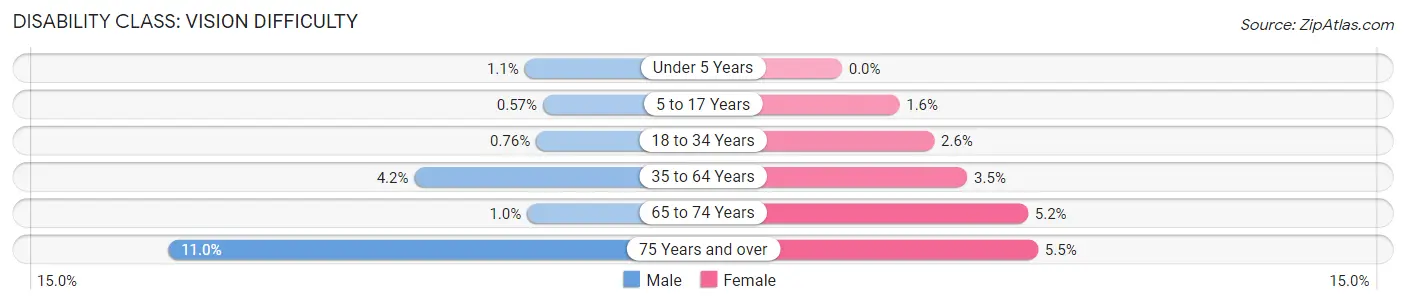
| Age Bracket | Male | Female |
| Under 5 Years | 16 (1.1%) | 0 (0.0%) |
| 5 to 17 Years | 22 (0.6%) | 71 (1.6%) |
| 18 to 34 Years | 36 (0.8%) | 120 (2.6%) |
| 35 to 64 Years | 322 (4.2%) | 257 (3.5%) |
| 65 to 74 Years | 11 (1.0%) | 53 (5.2%) |
| 75 Years and over | 33 (11.0%) | 32 (5.5%) |
Disability Class: Cognitive Difficulty
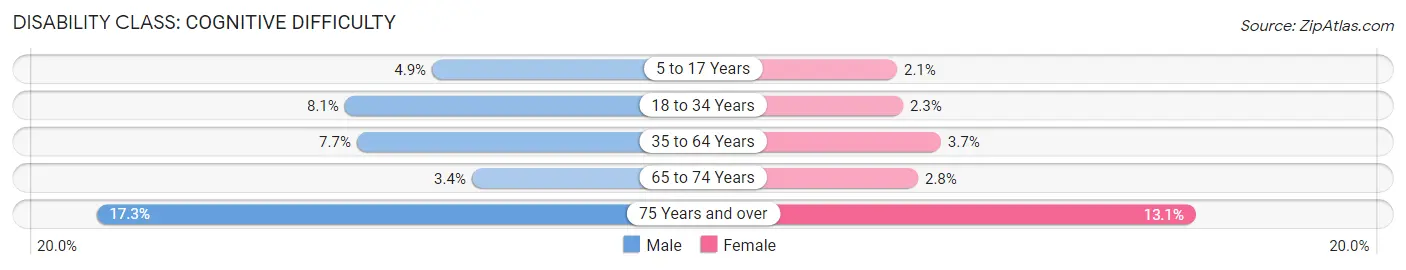
| Age Bracket | Male | Female |
| 5 to 17 Years | 188 (4.9%) | 91 (2.1%) |
| 18 to 34 Years | 386 (8.1%) | 106 (2.3%) |
| 35 to 64 Years | 595 (7.7%) | 271 (3.7%) |
| 65 to 74 Years | 37 (3.4%) | 29 (2.8%) |
| 75 Years and over | 52 (17.3%) | 77 (13.1%) |
Disability Class: Ambulatory Difficulty
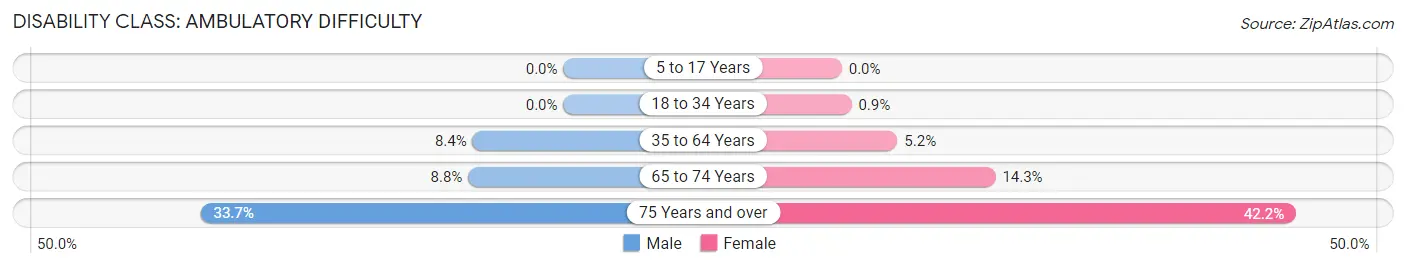
| Age Bracket | Male | Female |
| 5 to 17 Years | 0 (0.0%) | 0 (0.0%) |
| 18 to 34 Years | 0 (0.0%) | 42 (0.9%) |
| 35 to 64 Years | 654 (8.4%) | 380 (5.2%) |
| 65 to 74 Years | 96 (8.8%) | 146 (14.3%) |
| 75 Years and over | 101 (33.7%) | 247 (42.1%) |
Disability Class: Self-Care Difficulty
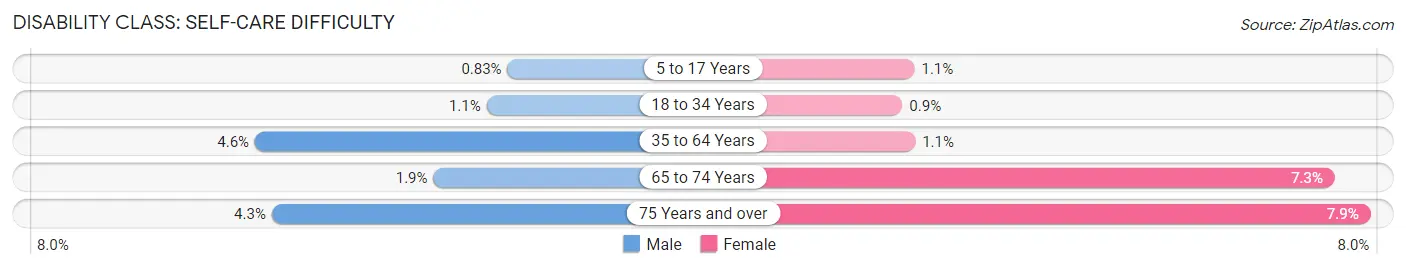
| Age Bracket | Male | Female |
| 5 to 17 Years | 32 (0.8%) | 48 (1.1%) |
| 18 to 34 Years | 54 (1.1%) | 42 (0.9%) |
| 35 to 64 Years | 355 (4.6%) | 80 (1.1%) |
| 65 to 74 Years | 21 (1.9%) | 75 (7.3%) |
| 75 Years and over | 13 (4.3%) | 46 (7.9%) |
Technology Access in La Vergne
Computing Device Access in La Vergne
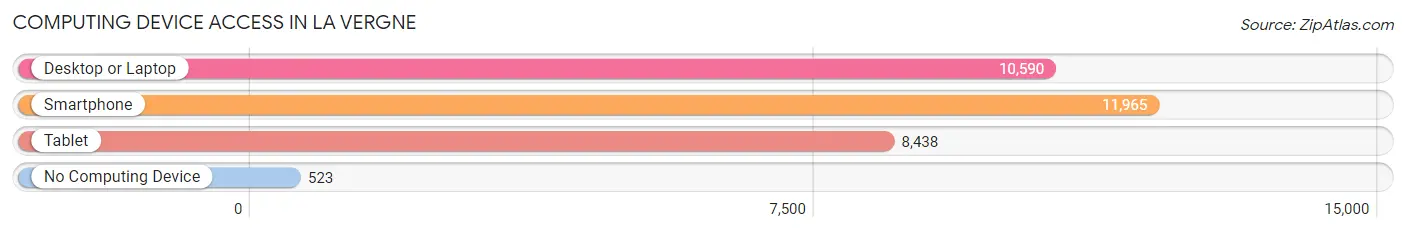
| Device Type | # Households | % Households |
| Desktop or Laptop | 10,590 | 81.6% |
| Smartphone | 11,965 | 92.2% |
| Tablet | 8,438 | 65.0% |
| No Computing Device | 523 | 4.0% |
| Total | 12,980 | 100.0% |
Internet Access in La Vergne
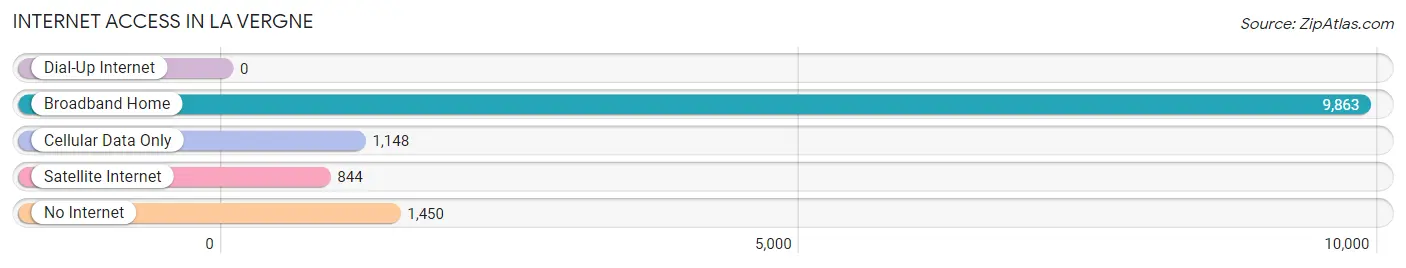
| Internet Type | # Households | % Households |
| Dial-Up Internet | 0 | 0.0% |
| Broadband Home | 9,863 | 76.0% |
| Cellular Data Only | 1,148 | 8.8% |
| Satellite Internet | 844 | 6.5% |
| No Internet | 1,450 | 11.2% |
| Total | 12,980 | 100.0% |
La Vergne Summary
La Vergne is a city located in Rutherford County, Tennessee, United States. The population was 32,588 at the 2010 census and estimated to be 37,743 in 2019. La Vergne is a suburb of Nashville and is part of the Nashville metropolitan area.
History
The area that is now La Vergne was first settled in the early 19th century by French and German immigrants. The city was named after a French immigrant, Jean Baptiste La Vergne, who purchased the land in 1808. The city was officially incorporated in 1972.
Geography
La Vergne is located at 35°52′45″N 86°35′45″W (35.879167, -86.595833). According to the United States Census Bureau, the city has a total area of 24.2 square miles (62.6 km2), of which 24.1 square miles (62.4 km2) is land and 0.1 square miles (0.2 km2) (0.41%) is water.
Economy
La Vergne is home to several major employers, including Bridgestone Americas, Ingram Barge Company, and Schneider Electric. The city also has a growing retail sector, with several large shopping centers and restaurants.
Demographics
As of the 2010 census, there were 32,588 people, 11,845 households, and 8,717 families residing in the city. The population density was 1,346.2 people per square mile (519.3/km2). There were 12,717 housing units at an average density of 527.3 per square mile (203.4/km2). The racial makeup of the city was 77.2% White, 14.3% African American, 0.5% Native American, 2.3% Asian, 0.1% Pacific Islander, 3.2% from other races, and 2.4% from two or more races. Hispanic or Latino of any race were 7.2% of the population.
There were 11,845 households, out of which 37.2% had children under the age of 18 living with them, 54.2% were married couples living together, 13.3% had a female householder with no husband present, and 27.2% were non-families. 22.2% of all households were made up of individuals, and 6.2% had someone living alone who was 65 years of age or older. The average household size was 2.71 and the average family size was 3.19.
In the city, the population was spread out, with 27.2% under the age of 18, 8.7% from 18 to 24, 33.2% from 25 to 44, 21.3% from 45 to 64, and 9.6% who were 65 years of age or older. The median age was 33 years. For every 100 females, there were 95.2 males. For every 100 females age 18 and over, there were 91.7 males.
The median income for a household in the city was $48,945, and the median income for a family was $54,945. Males had a median income of $37,945 versus $27,945 for females. The per capita income for the city was $20,945. About 6.2% of families and 8.2% of the population were below the poverty line, including 11.2% of those under age 18 and 8.2% of those age 65 or over.
Common Questions
What is Per Capita Income in La Vergne?
Per Capita income in La Vergne is $30,519.
What is the Median Family Income in La Vergne?
Median Family Income in La Vergne is $81,626.
What is the Median Household income in La Vergne?
Median Household Income in La Vergne is $77,531.
What is Income or Wage Gap in La Vergne?
Income or Wage Gap in La Vergne is 17.1%.
Women in La Vergne earn 82.9 cents for every dollar earned by a man.
What is Inequality or Gini Index in La Vergne?
Inequality or Gini Index in La Vergne is 0.38.
What is the Total Population of La Vergne?
Total Population of La Vergne is 38,553.
What is the Total Male Population of La Vergne?
Total Male Population of La Vergne is 19,227.
What is the Total Female Population of La Vergne?
Total Female Population of La Vergne is 19,326.
What is the Ratio of Males per 100 Females in La Vergne?
There are 99.49 Males per 100 Females in La Vergne.
What is the Ratio of Females per 100 Males in La Vergne?
There are 100.51 Females per 100 Males in La Vergne.
What is the Median Population Age in La Vergne?
Median Population Age in La Vergne is 32.8 Years.
What is the Average Family Size in La Vergne
Average Family Size in La Vergne is 3.4 People.
What is the Average Household Size in La Vergne
Average Household Size in La Vergne is 3.0 People.
How Large is the Labor Force in La Vergne?
There are 21,310 People in the Labor Forcein in La Vergne.
What is the Percentage of People in the Labor Force in La Vergne?
74.4% of People are in the Labor Force in La Vergne.
What is the Unemployment Rate in La Vergne?
Unemployment Rate in La Vergne is 4.0%.