Monrovia, CA Map & Demographics
Monrovia Map
Monrovia Overview
$44,566
PER CAPITA INCOME
$107,188
AVG FAMILY INCOME
$93,827
AVG HOUSEHOLD INCOME
8.7%
WAGE / INCOME GAP [ % ]
91.3¢/ $1
WAGE / INCOME GAP [ $ ]
0.44
INEQUALITY / GINI INDEX
37,656
TOTAL POPULATION
18,360
MALE POPULATION
19,296
FEMALE POPULATION
95.15
MALES / 100 FEMALES
105.10
FEMALES / 100 MALES
38.2
MEDIAN AGE
3.4
AVG FAMILY SIZE
2.8
AVG HOUSEHOLD SIZE
20,682
LABOR FORCE [ PEOPLE ]
68.0%
PERCENT IN LABOR FORCE
5.8%
UNEMPLOYMENT RATE
Monrovia Zip Codes
Monrovia Area Codes
Income in Monrovia
Income Overview in Monrovia
Per Capita Income in Monrovia is $44,566, while median incomes of families and households are $107,188 and $93,827 respectively.
| Characteristic | Number | Measure |
| Per Capita Income | 37,656 | $44,566 |
| Median Family Income | 8,915 | $107,188 |
| Mean Family Income | 8,915 | $137,332 |
| Median Household Income | 13,560 | $93,827 |
| Mean Household Income | 13,560 | $120,864 |
| Income Deficit | 8,915 | $0 |
| Wage / Income Gap (%) | 37,656 | 8.69% |
| Wage / Income Gap ($) | 37,656 | 91.31¢ per $1 |
| Gini / Inequality Index | 37,656 | 0.44 |
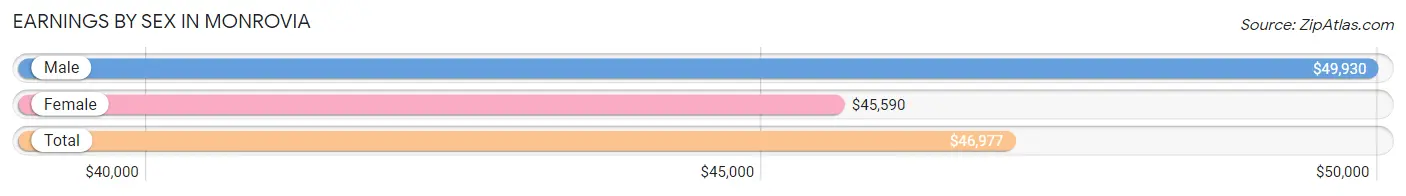
Earnings by Sex in Monrovia
Average Earnings in Monrovia are $46,977, $49,930 for men and $45,590 for women, a difference of 8.7%.
| Sex | Number | Average Earnings |
| Male | 10,605 (49.9%) | $49,930 |
| Female | 10,654 (50.1%) | $45,590 |
| Total | 21,259 (100.0%) | $46,977 |
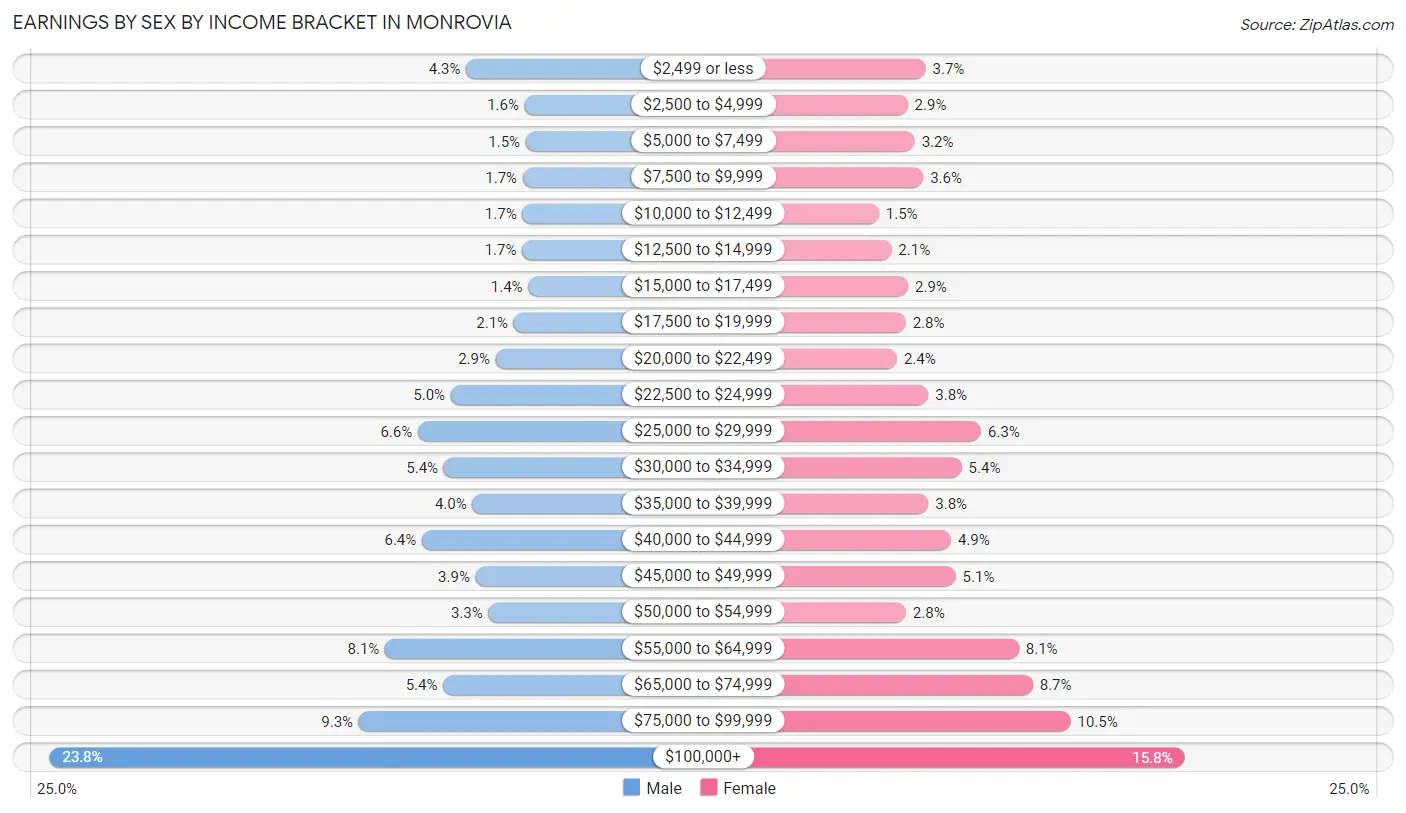
Earnings by Sex by Income Bracket in Monrovia
The most common earnings brackets in Monrovia are $100,000+ for men (2,528 | 23.8%) and $100,000+ for women (1,685 | 15.8%).
| Income | Male | Female |
| $2,499 or less | 457 (4.3%) | 393 (3.7%) |
| $2,500 to $4,999 | 166 (1.6%) | 304 (2.9%) |
| $5,000 to $7,499 | 161 (1.5%) | 339 (3.2%) |
| $7,500 to $9,999 | 176 (1.7%) | 381 (3.6%) |
| $10,000 to $12,499 | 178 (1.7%) | 160 (1.5%) |
| $12,500 to $14,999 | 179 (1.7%) | 223 (2.1%) |
| $15,000 to $17,499 | 148 (1.4%) | 306 (2.9%) |
| $17,500 to $19,999 | 221 (2.1%) | 294 (2.8%) |
| $20,000 to $22,499 | 311 (2.9%) | 250 (2.4%) |
| $22,500 to $24,999 | 533 (5.0%) | 407 (3.8%) |
| $25,000 to $29,999 | 697 (6.6%) | 670 (6.3%) |
| $30,000 to $34,999 | 568 (5.4%) | 573 (5.4%) |
| $35,000 to $39,999 | 426 (4.0%) | 407 (3.8%) |
| $40,000 to $44,999 | 677 (6.4%) | 520 (4.9%) |
| $45,000 to $49,999 | 410 (3.9%) | 543 (5.1%) |
| $50,000 to $54,999 | 347 (3.3%) | 295 (2.8%) |
| $55,000 to $64,999 | 860 (8.1%) | 859 (8.1%) |
| $65,000 to $74,999 | 572 (5.4%) | 928 (8.7%) |
| $75,000 to $99,999 | 990 (9.3%) | 1,117 (10.5%) |
| $100,000+ | 2,528 (23.8%) | 1,685 (15.8%) |
| Total | 10,605 (100.0%) | 10,654 (100.0%) |
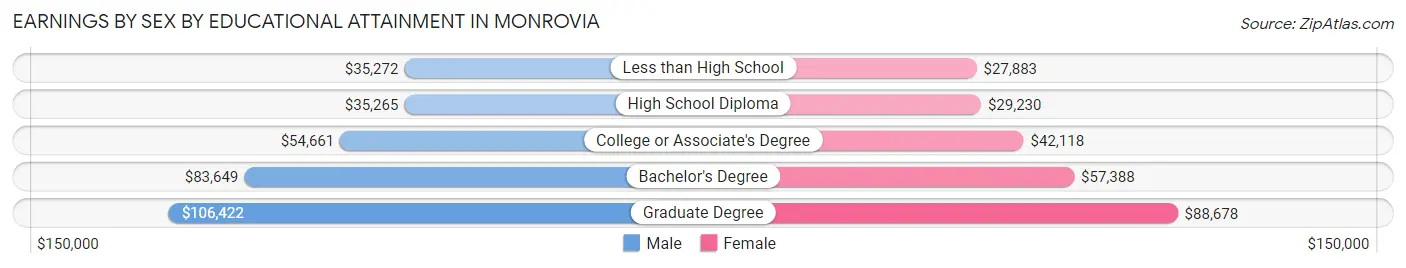
Earnings by Sex by Educational Attainment in Monrovia
Average earnings in Monrovia are $57,561 for men and $49,664 for women, a difference of 13.7%. Men with an educational attainment of graduate degree enjoy the highest average annual earnings of $106,422, while those with high school diploma education earn the least with $35,265. Women with an educational attainment of graduate degree earn the most with the average annual earnings of $88,678, while those with less than high school education have the smallest earnings of $27,883.
| Educational Attainment | Male Income | Female Income |
| Less than High School | $35,272 | $27,883 |
| High School Diploma | $35,265 | $29,230 |
| College or Associate's Degree | $54,661 | $42,118 |
| Bachelor's Degree | $83,649 | $57,388 |
| Graduate Degree | $106,422 | $88,678 |
| Total | $57,561 | $49,664 |
Family Income in Monrovia
Family Income Brackets in Monrovia
According to the Monrovia family income data, there are 1,819 families falling into the $100,000 to $149,999 income range, which is the most common income bracket and makes up 20.4% of all families. Conversely, the $10,000 to $14,999 income bracket is the least frequent group with only 18 families (0.2%) belonging to this category.
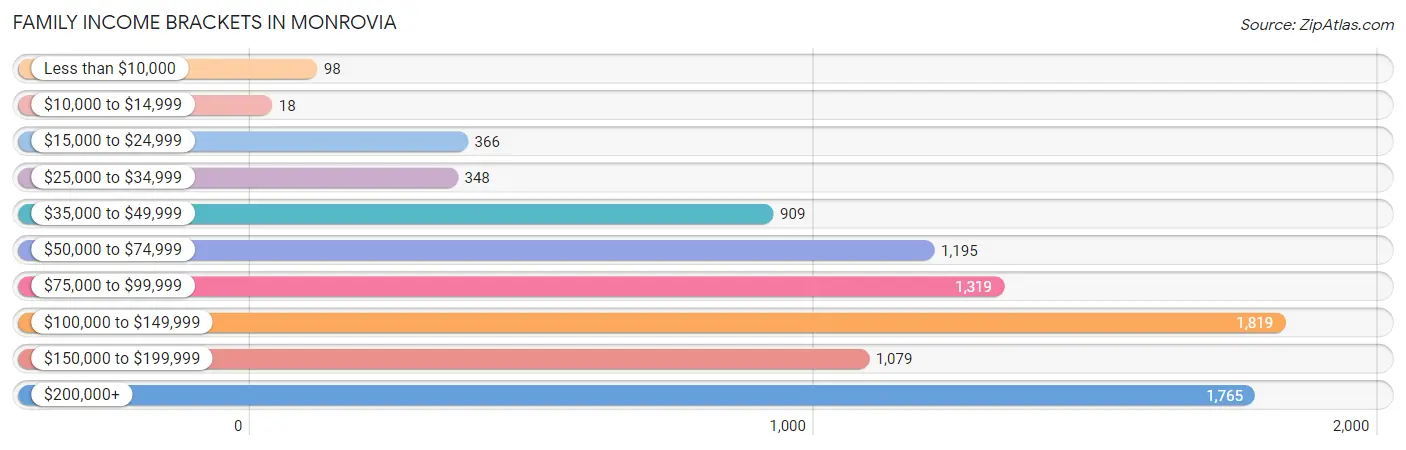
| Income Bracket | # Families | % Families |
| Less than $10,000 | 98 | 1.1% |
| $10,000 to $14,999 | 18 | 0.2% |
| $15,000 to $24,999 | 366 | 4.1% |
| $25,000 to $34,999 | 348 | 3.9% |
| $35,000 to $49,999 | 909 | 10.2% |
| $50,000 to $74,999 | 1,195 | 13.4% |
| $75,000 to $99,999 | 1,319 | 14.8% |
| $100,000 to $149,999 | 1,819 | 20.4% |
| $150,000 to $199,999 | 1,079 | 12.1% |
| $200,000+ | 1,765 | 19.8% |
Family Income by Famaliy Size in Monrovia
5-person families (789 | 8.8%) account for the highest median family income in Monrovia with $132,243 per family, while 2-person families (3,622 | 40.6%) have the highest median income of $45,164 per family member.
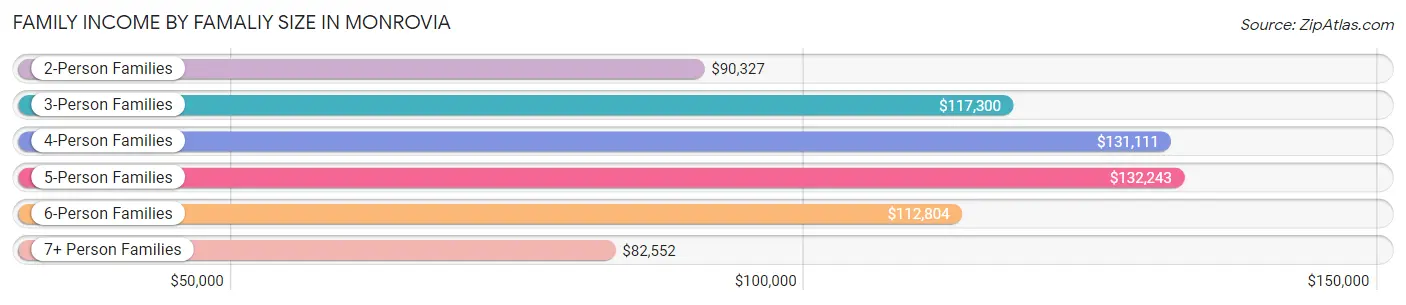
| Income Bracket | # Families | Median Income |
| 2-Person Families | 3,622 (40.6%) | $90,327 |
| 3-Person Families | 2,082 (23.4%) | $117,300 |
| 4-Person Families | 1,846 (20.7%) | $131,111 |
| 5-Person Families | 789 (8.8%) | $132,243 |
| 6-Person Families | 319 (3.6%) | $112,804 |
| 7+ Person Families | 257 (2.9%) | $82,552 |
| Total | 8,915 (100.0%) | $107,188 |
Family Income by Number of Earners in Monrovia
The median family income in Monrovia is $107,188, with families comprising 3+ earners (1,397) having the highest median family income of $147,817, while families with no earners (864) have the lowest median family income of $51,944, accounting for 15.7% and 9.7% of families, respectively.
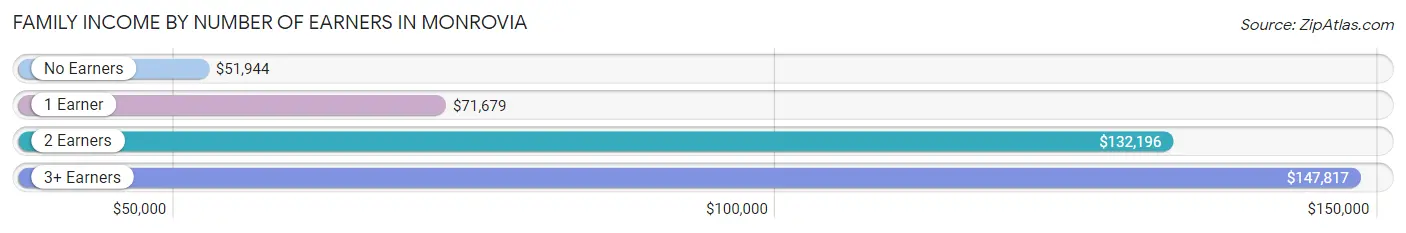
| Number of Earners | # Families | Median Income |
| No Earners | 864 (9.7%) | $51,944 |
| 1 Earner | 2,671 (30.0%) | $71,679 |
| 2 Earners | 3,983 (44.7%) | $132,196 |
| 3+ Earners | 1,397 (15.7%) | $147,817 |
| Total | 8,915 (100.0%) | $107,188 |
Household Income in Monrovia
Household Income Brackets in Monrovia
With 2,902 households falling in the category, the $100,000 to $149,999 income range is the most frequent in Monrovia, accounting for 21.4% of all households. In contrast, only 231 households (1.7%) fall into the $10,000 to $14,999 income bracket, making it the least populous group.
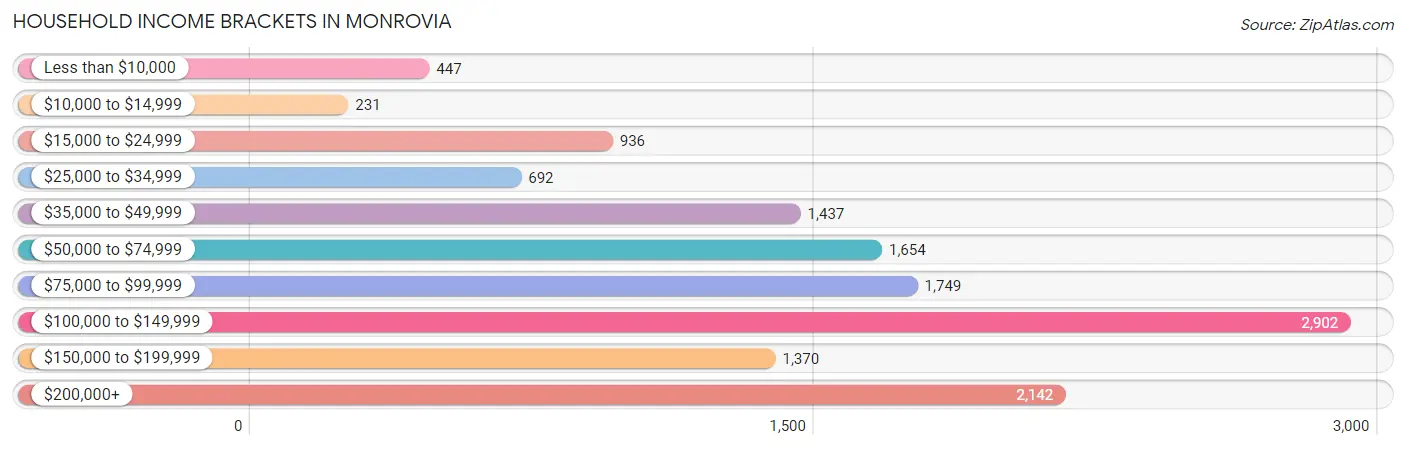
| Income Bracket | # Households | % Households |
| Less than $10,000 | 447 | 3.3% |
| $10,000 to $14,999 | 231 | 1.7% |
| $15,000 to $24,999 | 936 | 6.9% |
| $25,000 to $34,999 | 692 | 5.1% |
| $35,000 to $49,999 | 1,437 | 10.6% |
| $50,000 to $74,999 | 1,654 | 12.2% |
| $75,000 to $99,999 | 1,749 | 12.9% |
| $100,000 to $149,999 | 2,902 | 21.4% |
| $150,000 to $199,999 | 1,370 | 10.1% |
| $200,000+ | 2,142 | 15.8% |
Household Income by Householder Age in Monrovia
The median household income in Monrovia is $93,827, with the highest median household income of $112,855 found in the 25 to 44 years age bracket for the primary householder. A total of 4,616 households (34.0%) fall into this category. Meanwhile, the 65+ years age bracket for the primary householder has the lowest median household income of $53,844, with 3,016 households (22.2%) in this group.
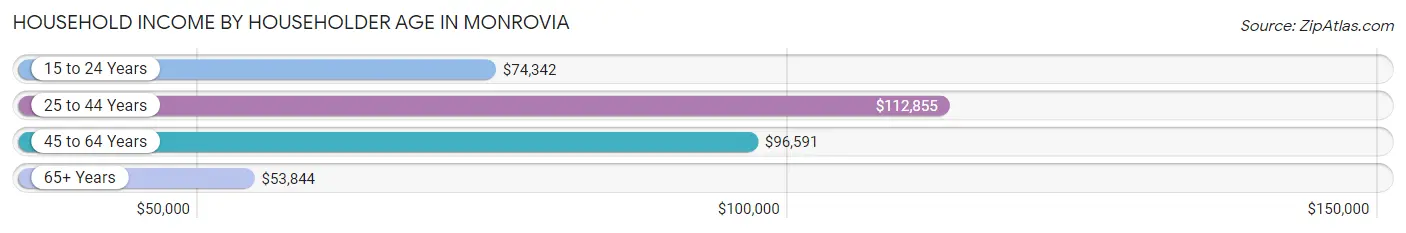
| Income Bracket | # Households | Median Income |
| 15 to 24 Years | 134 (1.0%) | $74,342 |
| 25 to 44 Years | 4,616 (34.0%) | $112,855 |
| 45 to 64 Years | 5,794 (42.7%) | $96,591 |
| 65+ Years | 3,016 (22.2%) | $53,844 |
| Total | 13,560 (100.0%) | $93,827 |
Poverty in Monrovia
Income Below Poverty by Sex and Age in Monrovia
With 9.5% poverty level for males and 10.6% for females among the residents of Monrovia, 16 and 17 year old males and 16 and 17 year old females are the most vulnerable to poverty, with 180 males (26.9%) and 71 females (21.4%) in their respective age groups living below the poverty level.
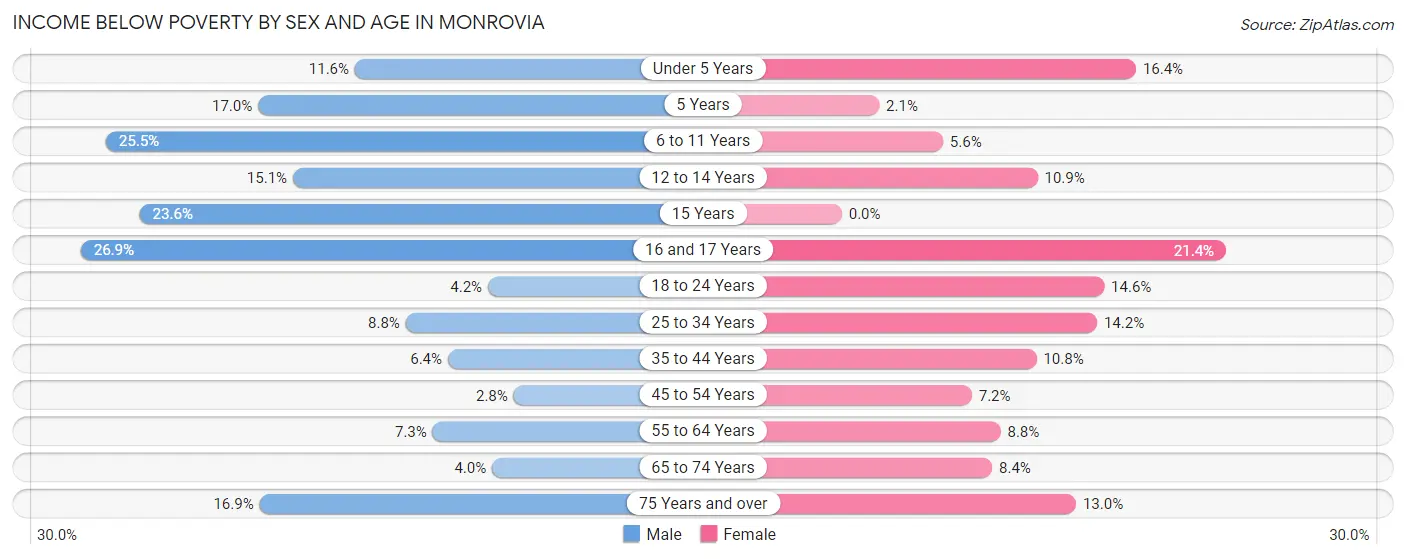
| Age Bracket | Male | Female |
| Under 5 Years | 122 (11.6%) | 154 (16.4%) |
| 5 Years | 60 (17.0%) | 5 (2.1%) |
| 6 to 11 Years | 286 (25.5%) | 67 (5.6%) |
| 12 to 14 Years | 141 (15.1%) | 90 (10.9%) |
| 15 Years | 46 (23.6%) | 0 (0.0%) |
| 16 and 17 Years | 180 (26.9%) | 71 (21.4%) |
| 18 to 24 Years | 73 (4.2%) | 175 (14.6%) |
| 25 to 34 Years | 218 (8.8%) | 411 (14.2%) |
| 35 to 44 Years | 180 (6.4%) | 336 (10.8%) |
| 45 to 54 Years | 63 (2.8%) | 184 (7.2%) |
| 55 to 64 Years | 195 (7.3%) | 259 (8.8%) |
| 65 to 74 Years | 49 (4.0%) | 126 (8.4%) |
| 75 Years and over | 121 (16.9%) | 161 (13.0%) |
| Total | 1,734 (9.5%) | 2,039 (10.6%) |
Income Above Poverty by Sex and Age in Monrovia
According to the poverty statistics in Monrovia, males aged 45 to 54 years and females aged 15 years are the age groups that are most secure financially, with 97.2% of males and 100.0% of females in these age groups living above the poverty line.
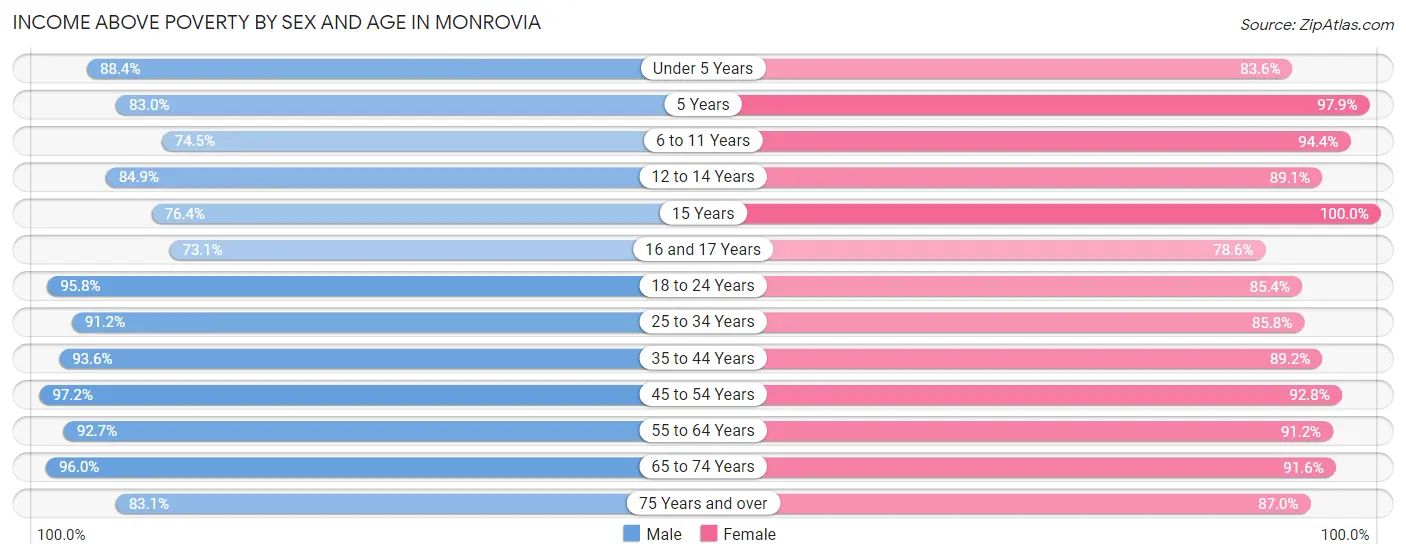
| Age Bracket | Male | Female |
| Under 5 Years | 929 (88.4%) | 786 (83.6%) |
| 5 Years | 293 (83.0%) | 235 (97.9%) |
| 6 to 11 Years | 837 (74.5%) | 1,122 (94.4%) |
| 12 to 14 Years | 795 (84.9%) | 736 (89.1%) |
| 15 Years | 149 (76.4%) | 278 (100.0%) |
| 16 and 17 Years | 490 (73.1%) | 261 (78.6%) |
| 18 to 24 Years | 1,665 (95.8%) | 1,023 (85.4%) |
| 25 to 34 Years | 2,265 (91.2%) | 2,481 (85.8%) |
| 35 to 44 Years | 2,621 (93.6%) | 2,763 (89.2%) |
| 45 to 54 Years | 2,208 (97.2%) | 2,356 (92.8%) |
| 55 to 64 Years | 2,484 (92.7%) | 2,670 (91.2%) |
| 65 to 74 Years | 1,186 (96.0%) | 1,379 (91.6%) |
| 75 Years and over | 594 (83.1%) | 1,074 (87.0%) |
| Total | 16,516 (90.5%) | 17,164 (89.4%) |
Income Below Poverty Among Married-Couple Families in Monrovia
The poverty statistics for married-couple families in Monrovia show that 5.6% or 338 of the total 6,069 families live below the poverty line. Families with 5 or more children have the highest poverty rate of 100.0%, comprising of 74 families. On the other hand, families with no children have the lowest poverty rate of 2.8%, which includes 93 families.
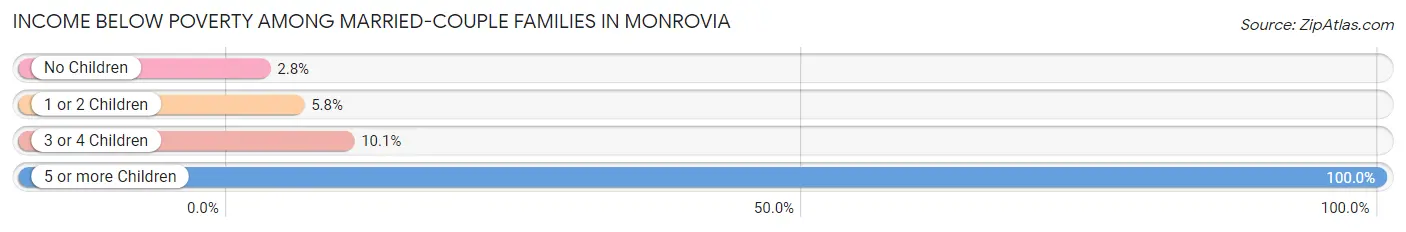
| Children | Above Poverty | Below Poverty |
| No Children | 3,218 (97.2%) | 93 (2.8%) |
| 1 or 2 Children | 2,175 (94.2%) | 133 (5.8%) |
| 3 or 4 Children | 338 (89.9%) | 38 (10.1%) |
| 5 or more Children | 0 (0.0%) | 74 (100.0%) |
| Total | 5,731 (94.4%) | 338 (5.6%) |
Income Below Poverty Among Single-Parent Households in Monrovia
According to the poverty data in Monrovia, 1.8% or 15 single-father households and 10.3% or 204 single-mother households are living below the poverty line. Among single-father households, those with no children have the highest poverty rate, with 7 households (2.4%) experiencing poverty. Likewise, among single-mother households, those with 1 or 2 children have the highest poverty rate, with 133 households (17.3%) falling below the poverty line.
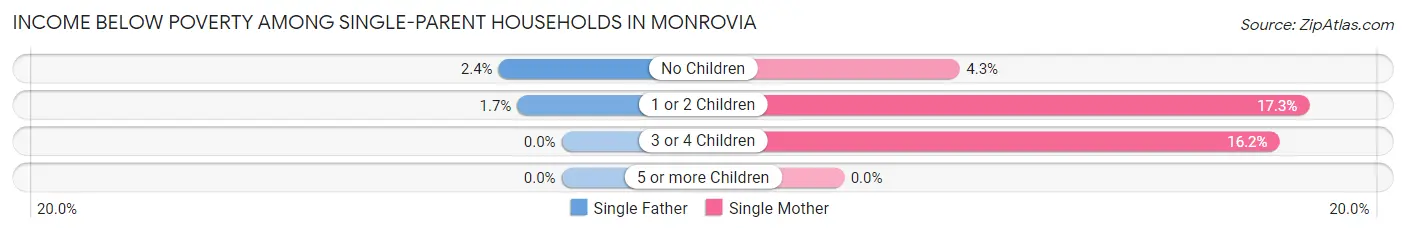
| Children | Single Father | Single Mother |
| No Children | 7 (2.4%) | 46 (4.3%) |
| 1 or 2 Children | 8 (1.7%) | 133 (17.3%) |
| 3 or 4 Children | 0 (0.0%) | 25 (16.2%) |
| 5 or more Children | 0 (0.0%) | 0 (0.0%) |
| Total | 15 (1.8%) | 204 (10.3%) |
Income Below Poverty Among Married-Couple vs Single-Parent Households in Monrovia
The poverty data for Monrovia shows that 338 of the married-couple family households (5.6%) and 219 of the single-parent households (7.7%) are living below the poverty level. Within the married-couple family households, those with 5 or more children have the highest poverty rate, with 74 households (100.0%) falling below the poverty line. Among the single-parent households, those with 1 or 2 children have the highest poverty rate, with 141 household (11.3%) living below poverty.
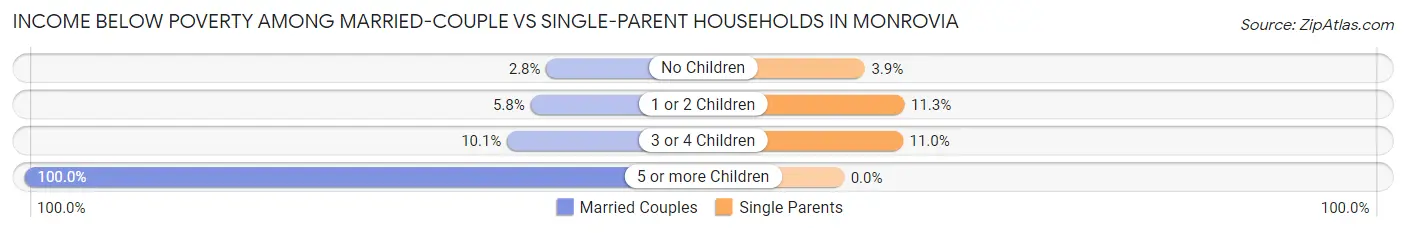
| Children | Married-Couple Families | Single-Parent Households |
| No Children | 93 (2.8%) | 53 (3.9%) |
| 1 or 2 Children | 133 (5.8%) | 141 (11.3%) |
| 3 or 4 Children | 38 (10.1%) | 25 (11.0%) |
| 5 or more Children | 74 (100.0%) | 0 (0.0%) |
| Total | 338 (5.6%) | 219 (7.7%) |
Race in Monrovia
The most populous races in Monrovia are White / Caucasian (17,144 | 45.5%), Hispanic or Latino (16,986 | 45.1%), and Two or more Races (6,957 | 18.5%).
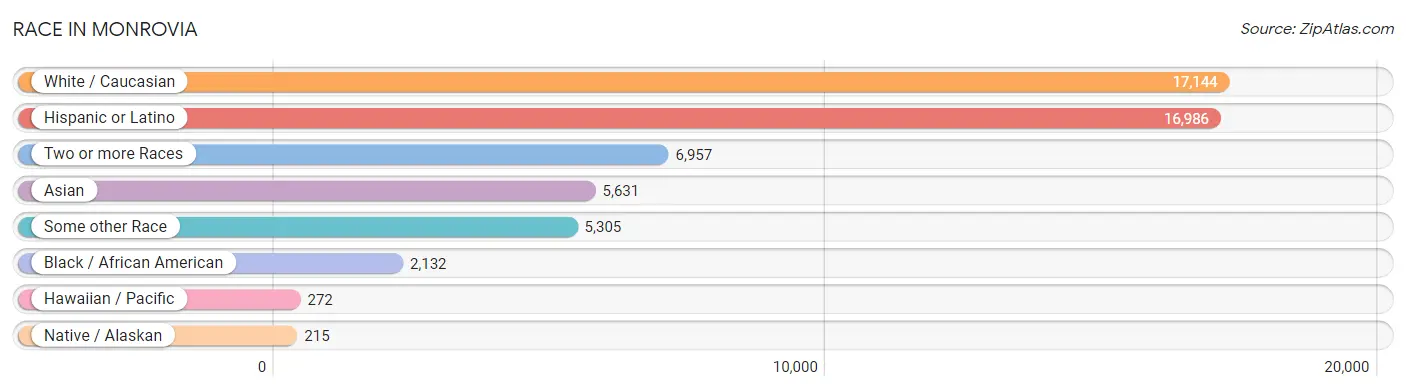
| Race | # Population | % Population |
| Asian | 5,631 | 14.9% |
| Black / African American | 2,132 | 5.7% |
| Hawaiian / Pacific | 272 | 0.7% |
| Hispanic or Latino | 16,986 | 45.1% |
| Native / Alaskan | 215 | 0.6% |
| White / Caucasian | 17,144 | 45.5% |
| Two or more Races | 6,957 | 18.5% |
| Some other Race | 5,305 | 14.1% |
| Total | 37,656 | 100.0% |
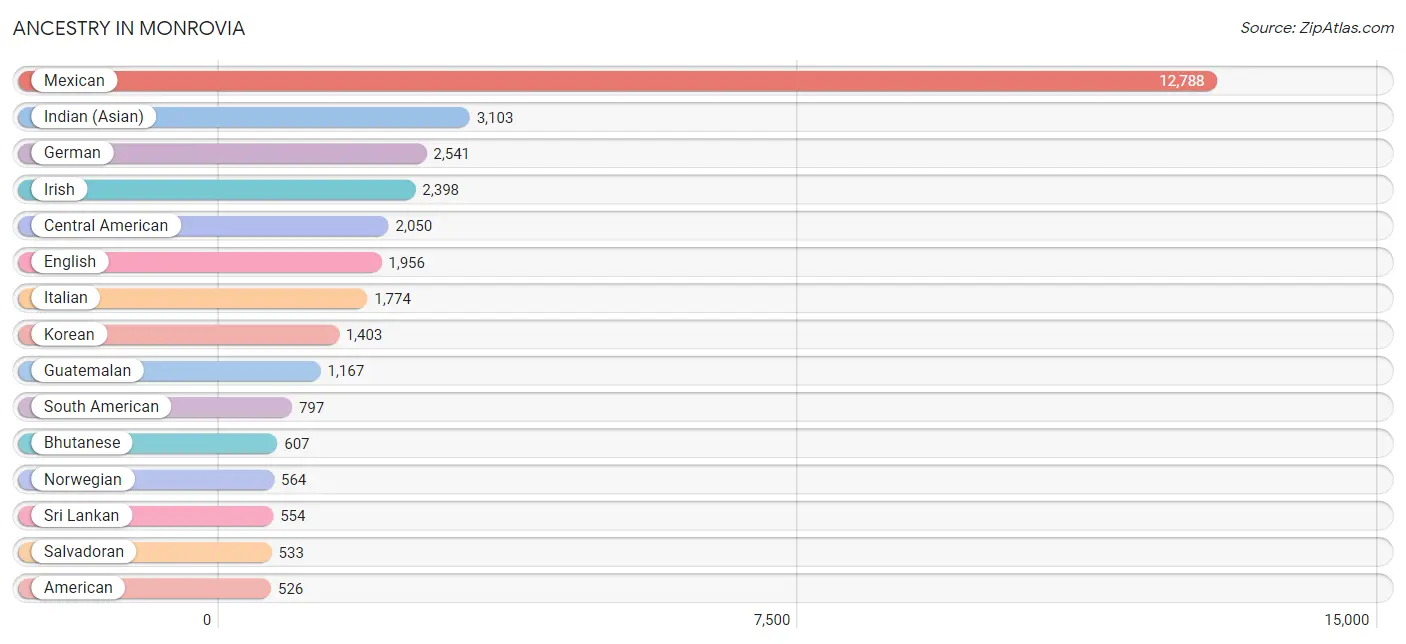
Ancestry in Monrovia
The most populous ancestries reported in Monrovia are Mexican (12,788 | 34.0%), Indian (Asian) (3,103 | 8.2%), German (2,541 | 6.8%), Irish (2,398 | 6.4%), and Central American (2,050 | 5.4%), together accounting for 60.8% of all Monrovia residents.
| Ancestry | # Population | % Population |
| African | 117 | 0.3% |
| American | 526 | 1.4% |
| Arab | 165 | 0.4% |
| Argentinean | 191 | 0.5% |
| Armenian | 232 | 0.6% |
| Australian | 55 | 0.2% |
| Austrian | 53 | 0.1% |
| Bahamian | 12 | 0.0% |
| Bangladeshi | 73 | 0.2% |
| Basque | 5 | 0.0% |
| Bhutanese | 607 | 1.6% |
| Brazilian | 57 | 0.2% |
| British | 223 | 0.6% |
| Burmese | 390 | 1.0% |
| Cajun | 20 | 0.1% |
| Canadian | 14 | 0.0% |
| Central American | 2,050 | 5.4% |
| Central American Indian | 24 | 0.1% |
| Cherokee | 86 | 0.2% |
| Chilean | 66 | 0.2% |
| Choctaw | 64 | 0.2% |
| Colombian | 190 | 0.5% |
| Costa Rican | 28 | 0.1% |
| Cuban | 255 | 0.7% |
| Czech | 131 | 0.4% |
| Czechoslovakian | 58 | 0.2% |
| Danish | 219 | 0.6% |
| Dominican | 23 | 0.1% |
| Dutch | 478 | 1.3% |
| Eastern European | 249 | 0.7% |
| Ecuadorian | 87 | 0.2% |
| Egyptian | 36 | 0.1% |
| English | 1,956 | 5.2% |
| European | 376 | 1.0% |
| Filipino | 514 | 1.4% |
| Finnish | 106 | 0.3% |
| French | 471 | 1.3% |
| French Canadian | 55 | 0.2% |
| German | 2,541 | 6.8% |
| Ghanaian | 7 | 0.0% |
| Greek | 177 | 0.5% |
| Guamanian / Chamorro | 34 | 0.1% |
| Guatemalan | 1,167 | 3.1% |
| Guyanese | 24 | 0.1% |
| Honduran | 118 | 0.3% |
| Hungarian | 266 | 0.7% |
| Indian (Asian) | 3,103 | 8.2% |
| Indonesian | 104 | 0.3% |
| Iranian | 125 | 0.3% |
| Irish | 2,398 | 6.4% |
| Israeli | 27 | 0.1% |
| Italian | 1,774 | 4.7% |
| Japanese | 43 | 0.1% |
| Korean | 1,403 | 3.7% |
| Laotian | 100 | 0.3% |
| Lebanese | 85 | 0.2% |
| Lithuanian | 71 | 0.2% |
| Maltese | 8 | 0.0% |
| Mexican | 12,788 | 34.0% |
| Mexican American Indian | 166 | 0.4% |
| Navajo | 49 | 0.1% |
| New Zealander | 5 | 0.0% |
| Nicaraguan | 46 | 0.1% |
| Northern European | 26 | 0.1% |
| Norwegian | 564 | 1.5% |
| Pakistani | 124 | 0.3% |
| Panamanian | 158 | 0.4% |
| Peruvian | 227 | 0.6% |
| Polish | 336 | 0.9% |
| Portuguese | 93 | 0.3% |
| Puerto Rican | 502 | 1.3% |
| Romanian | 88 | 0.2% |
| Russian | 273 | 0.7% |
| Salvadoran | 533 | 1.4% |
| Scandinavian | 188 | 0.5% |
| Scotch-Irish | 342 | 0.9% |
| Scottish | 441 | 1.2% |
| Serbian | 59 | 0.2% |
| Sioux | 27 | 0.1% |
| Slovak | 65 | 0.2% |
| South African | 8 | 0.0% |
| South American | 797 | 2.1% |
| South American Indian | 12 | 0.0% |
| Spaniard | 155 | 0.4% |
| Spanish | 98 | 0.3% |
| Spanish American Indian | 95 | 0.3% |
| Sri Lankan | 554 | 1.5% |
| Subsaharan African | 125 | 0.3% |
| Swedish | 384 | 1.0% |
| Swiss | 41 | 0.1% |
| Syrian | 44 | 0.1% |
| Thai | 135 | 0.4% |
| Tongan | 66 | 0.2% |
| Ukrainian | 144 | 0.4% |
| Uruguayan | 13 | 0.0% |
| Venezuelan | 18 | 0.1% |
| Welsh | 62 | 0.2% |
| West Indian | 21 | 0.1% |
| Yugoslavian | 9 | 0.0% | View All 99 Rows |
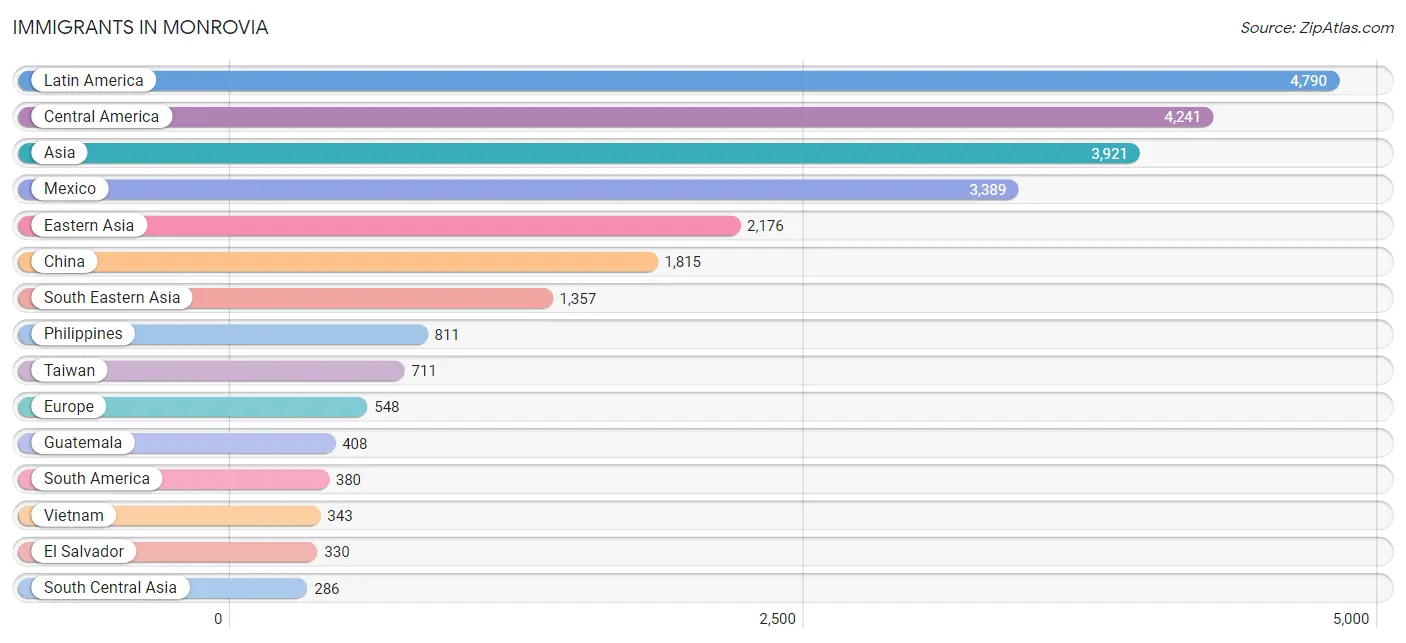
Immigrants in Monrovia
The most numerous immigrant groups reported in Monrovia came from Latin America (4,790 | 12.7%), Central America (4,241 | 11.3%), Asia (3,921 | 10.4%), Mexico (3,389 | 9.0%), and Eastern Asia (2,176 | 5.8%), together accounting for 49.2% of all Monrovia residents.
| Immigration Origin | # Population | % Population |
| Africa | 80 | 0.2% |
| Argentina | 111 | 0.3% |
| Asia | 3,921 | 10.4% |
| Australia | 25 | 0.1% |
| Austria | 23 | 0.1% |
| Bahamas | 12 | 0.0% |
| Belgium | 7 | 0.0% |
| Brazil | 84 | 0.2% |
| Cambodia | 9 | 0.0% |
| Canada | 67 | 0.2% |
| Caribbean | 169 | 0.4% |
| Central America | 4,241 | 11.3% |
| Chile | 70 | 0.2% |
| China | 1,815 | 4.8% |
| Colombia | 64 | 0.2% |
| Cuba | 127 | 0.3% |
| Czechoslovakia | 39 | 0.1% |
| Dominica | 7 | 0.0% |
| Dominican Republic | 23 | 0.1% |
| Eastern Africa | 5 | 0.0% |
| Eastern Asia | 2,176 | 5.8% |
| Eastern Europe | 120 | 0.3% |
| Ecuador | 28 | 0.1% |
| Egypt | 33 | 0.1% |
| El Salvador | 330 | 0.9% |
| England | 41 | 0.1% |
| Ethiopia | 5 | 0.0% |
| Europe | 548 | 1.5% |
| Fiji | 11 | 0.0% |
| France | 18 | 0.1% |
| Germany | 5 | 0.0% |
| Ghana | 7 | 0.0% |
| Greece | 38 | 0.1% |
| Guatemala | 408 | 1.1% |
| Honduras | 46 | 0.1% |
| Hong Kong | 120 | 0.3% |
| India | 91 | 0.2% |
| Indonesia | 87 | 0.2% |
| Iran | 170 | 0.4% |
| Israel | 8 | 0.0% |
| Italy | 24 | 0.1% |
| Japan | 86 | 0.2% |
| Korea | 275 | 0.7% |
| Laos | 10 | 0.0% |
| Latin America | 4,790 | 12.7% |
| Lebanon | 50 | 0.1% |
| Malaysia | 12 | 0.0% |
| Mexico | 3,389 | 9.0% |
| Netherlands | 93 | 0.3% |
| Nicaragua | 35 | 0.1% |
| Nigeria | 26 | 0.1% |
| Northern Africa | 33 | 0.1% |
| Northern Europe | 167 | 0.4% |
| Norway | 13 | 0.0% |
| Oceania | 90 | 0.2% |
| Pakistan | 25 | 0.1% |
| Panama | 33 | 0.1% |
| Peru | 5 | 0.0% |
| Philippines | 811 | 2.1% |
| Romania | 63 | 0.2% |
| Russia | 11 | 0.0% |
| Saudi Arabia | 11 | 0.0% |
| Scotland | 23 | 0.1% |
| South America | 380 | 1.0% |
| South Central Asia | 286 | 0.8% |
| South Eastern Asia | 1,357 | 3.6% |
| Southern Europe | 115 | 0.3% |
| Spain | 45 | 0.1% |
| Sweden | 38 | 0.1% |
| Syria | 9 | 0.0% |
| Taiwan | 711 | 1.9% |
| Thailand | 73 | 0.2% |
| Venezuela | 18 | 0.1% |
| Vietnam | 343 | 0.9% |
| Western Africa | 33 | 0.1% |
| Western Asia | 102 | 0.3% |
| Western Europe | 146 | 0.4% | View All 77 Rows |
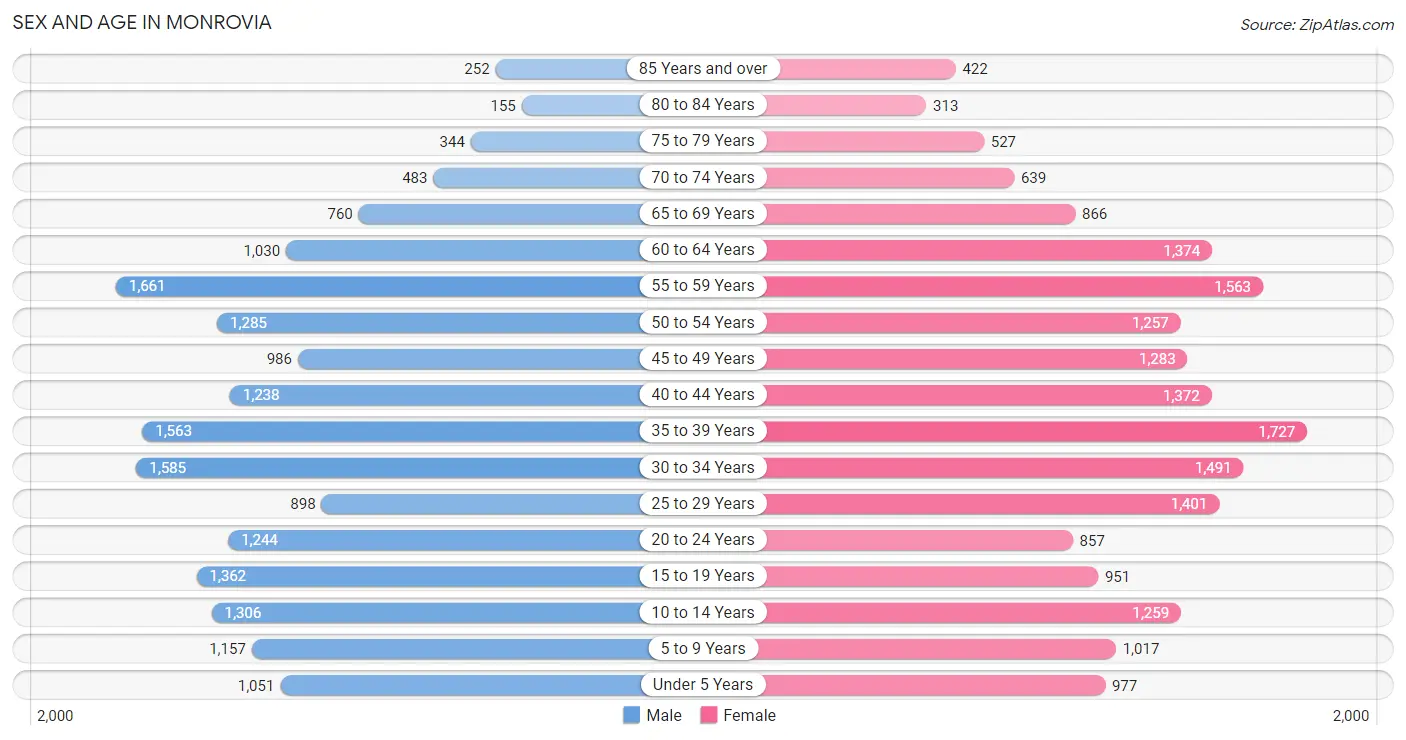
Sex and Age in Monrovia
Sex and Age in Monrovia
The most populous age groups in Monrovia are 55 to 59 Years (1,661 | 9.0%) for men and 35 to 39 Years (1,727 | 8.9%) for women.
| Age Bracket | Male | Female |
| Under 5 Years | 1,051 (5.7%) | 977 (5.1%) |
| 5 to 9 Years | 1,157 (6.3%) | 1,017 (5.3%) |
| 10 to 14 Years | 1,306 (7.1%) | 1,259 (6.5%) |
| 15 to 19 Years | 1,362 (7.4%) | 951 (4.9%) |
| 20 to 24 Years | 1,244 (6.8%) | 857 (4.4%) |
| 25 to 29 Years | 898 (4.9%) | 1,401 (7.3%) |
| 30 to 34 Years | 1,585 (8.6%) | 1,491 (7.7%) |
| 35 to 39 Years | 1,563 (8.5%) | 1,727 (8.9%) |
| 40 to 44 Years | 1,238 (6.7%) | 1,372 (7.1%) |
| 45 to 49 Years | 986 (5.4%) | 1,283 (6.7%) |
| 50 to 54 Years | 1,285 (7.0%) | 1,257 (6.5%) |
| 55 to 59 Years | 1,661 (9.0%) | 1,563 (8.1%) |
| 60 to 64 Years | 1,030 (5.6%) | 1,374 (7.1%) |
| 65 to 69 Years | 760 (4.1%) | 866 (4.5%) |
| 70 to 74 Years | 483 (2.6%) | 639 (3.3%) |
| 75 to 79 Years | 344 (1.9%) | 527 (2.7%) |
| 80 to 84 Years | 155 (0.8%) | 313 (1.6%) |
| 85 Years and over | 252 (1.4%) | 422 (2.2%) |
| Total | 18,360 (100.0%) | 19,296 (100.0%) |
Families and Households in Monrovia
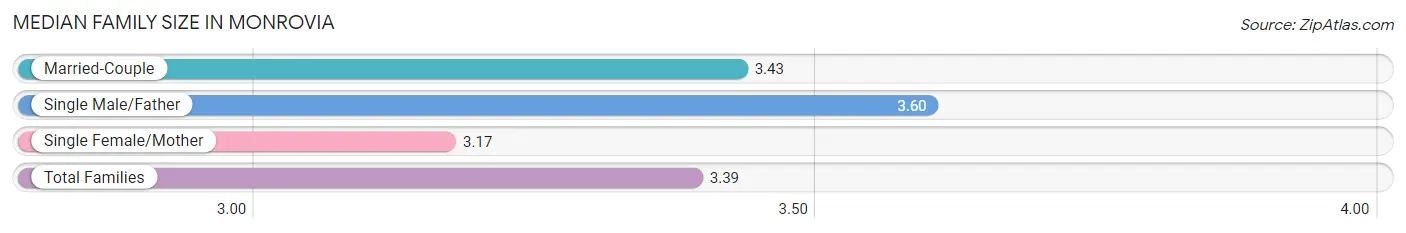
Median Family Size in Monrovia
The median family size in Monrovia is 3.39 persons per family, with single male/father families (858 | 9.6%) accounting for the largest median family size of 3.6 persons per family. On the other hand, single female/mother families (1,988 | 22.3%) represent the smallest median family size with 3.17 persons per family.
| Family Type | # Families | Family Size |
| Married-Couple | 6,069 (68.1%) | 3.43 |
| Single Male/Father | 858 (9.6%) | 3.60 |
| Single Female/Mother | 1,988 (22.3%) | 3.17 |
| Total Families | 8,915 (100.0%) | 3.39 |
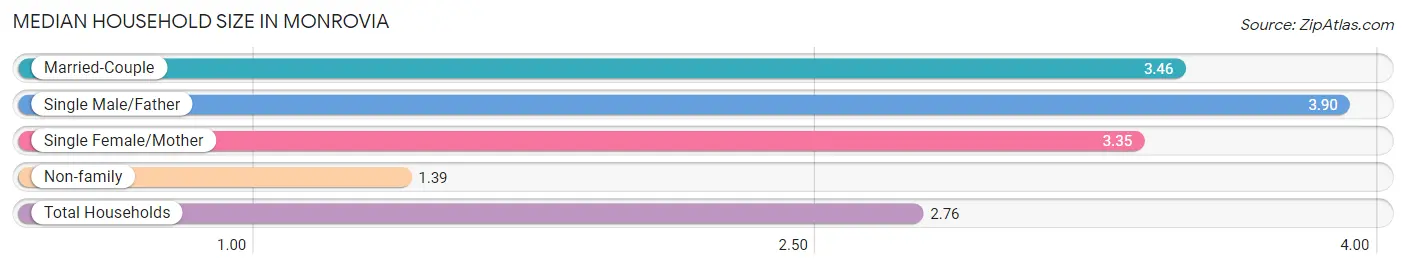
Median Household Size in Monrovia
The median household size in Monrovia is 2.76 persons per household, with single male/father households (858 | 6.3%) accounting for the largest median household size of 3.9 persons per household. non-family households (4,645 | 34.3%) represent the smallest median household size with 1.39 persons per household.
| Household Type | # Households | Household Size |
| Married-Couple | 6,069 (44.8%) | 3.46 |
| Single Male/Father | 858 (6.3%) | 3.90 |
| Single Female/Mother | 1,988 (14.7%) | 3.35 |
| Non-family | 4,645 (34.3%) | 1.39 |
| Total Households | 13,560 (100.0%) | 2.76 |
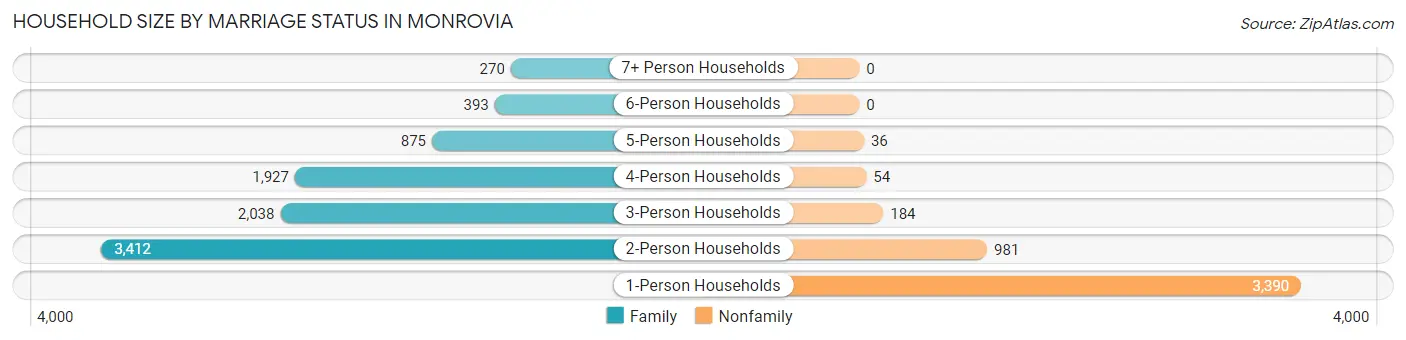
Household Size by Marriage Status in Monrovia
Out of a total of 13,560 households in Monrovia, 8,915 (65.7%) are family households, while 4,645 (34.3%) are nonfamily households. The most numerous type of family households are 2-person households, comprising 3,412, and the most common type of nonfamily households are 1-person households, comprising 3,390.
| Household Size | Family Households | Nonfamily Households |
| 1-Person Households | - | 3,390 (25.0%) |
| 2-Person Households | 3,412 (25.2%) | 981 (7.2%) |
| 3-Person Households | 2,038 (15.0%) | 184 (1.4%) |
| 4-Person Households | 1,927 (14.2%) | 54 (0.4%) |
| 5-Person Households | 875 (6.5%) | 36 (0.3%) |
| 6-Person Households | 393 (2.9%) | 0 (0.0%) |
| 7+ Person Households | 270 (2.0%) | 0 (0.0%) |
| Total | 8,915 (65.7%) | 4,645 (34.3%) |
Female Fertility in Monrovia
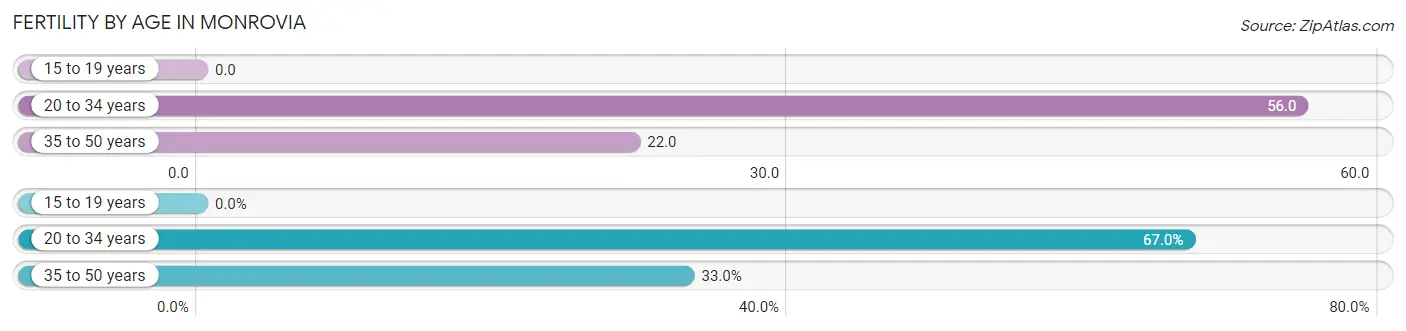
Fertility by Age in Monrovia
Average fertility rate in Monrovia is 33.0 births per 1,000 women. Women in the age bracket of 20 to 34 years have the highest fertility rate with 56.0 births per 1,000 women. Women in the age bracket of 20 to 34 years acount for 67.0% of all women with births.
| Age Bracket | Women with Births | Births / 1,000 Women |
| 15 to 19 years | 0 (0.0%) | 0.0 |
| 20 to 34 years | 211 (67.0%) | 56.0 |
| 35 to 50 years | 104 (33.0%) | 22.0 |
| Total | 315 (100.0%) | 33.0 |
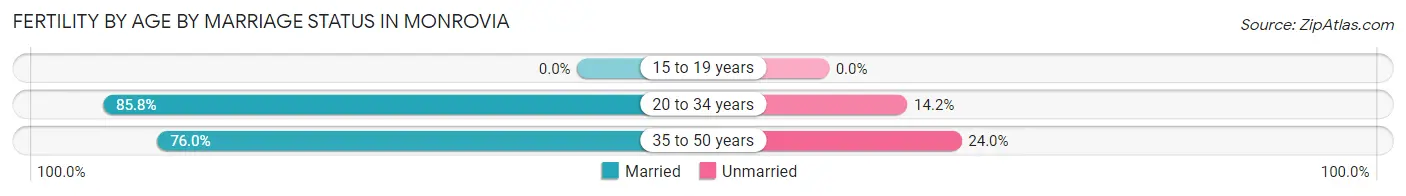
Fertility by Age by Marriage Status in Monrovia
82.5% of women with births (315) in Monrovia are married. The highest percentage of unmarried women with births falls into 35 to 50 years age bracket with 24.0% of them unmarried at the time of birth, while the lowest percentage of unmarried women with births belong to 20 to 34 years age bracket with 14.2% of them unmarried.
| Age Bracket | Married | Unmarried |
| 15 to 19 years | 0 (0.0%) | 0 (0.0%) |
| 20 to 34 years | 181 (85.8%) | 30 (14.2%) |
| 35 to 50 years | 79 (76.0%) | 25 (24.0%) |
| Total | 260 (82.5%) | 55 (17.5%) |
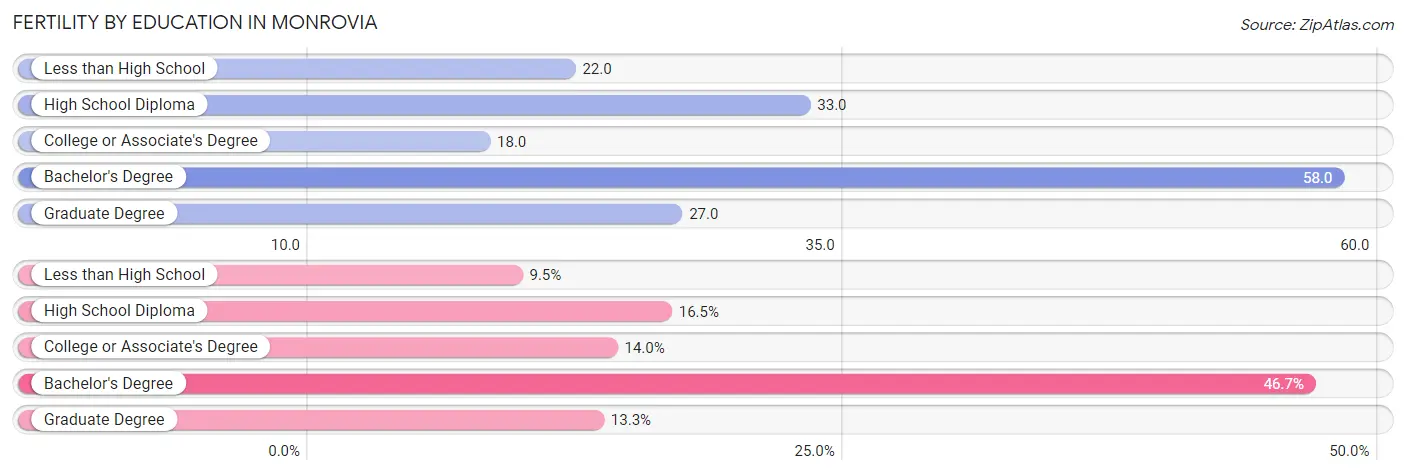
Fertility by Education in Monrovia
Average fertility rate in Monrovia is 33.0 births per 1,000 women. Women with the education attainment of bachelor's degree have the highest fertility rate of 58.0 births per 1,000 women, while women with the education attainment of college or associate's degree have the lowest fertility at 18.0 births per 1,000 women. Women with the education attainment of bachelor's degree represent 46.7% of all women with births.
| Educational Attainment | Women with Births | Births / 1,000 Women |
| Less than High School | 30 (9.5%) | 22.0 |
| High School Diploma | 52 (16.5%) | 33.0 |
| College or Associate's Degree | 44 (14.0%) | 18.0 |
| Bachelor's Degree | 147 (46.7%) | 58.0 |
| Graduate Degree | 42 (13.3%) | 27.0 |
| Total | 315 (100.0%) | 33.0 |
Fertility by Education by Marriage Status in Monrovia
17.5% of women with births in Monrovia are unmarried. Women with the educational attainment of high school diploma are most likely to be married with 100.0% of them married at childbirth, while women with the educational attainment of less than high school are least likely to be married with 100.0% of them unmarried at childbirth.
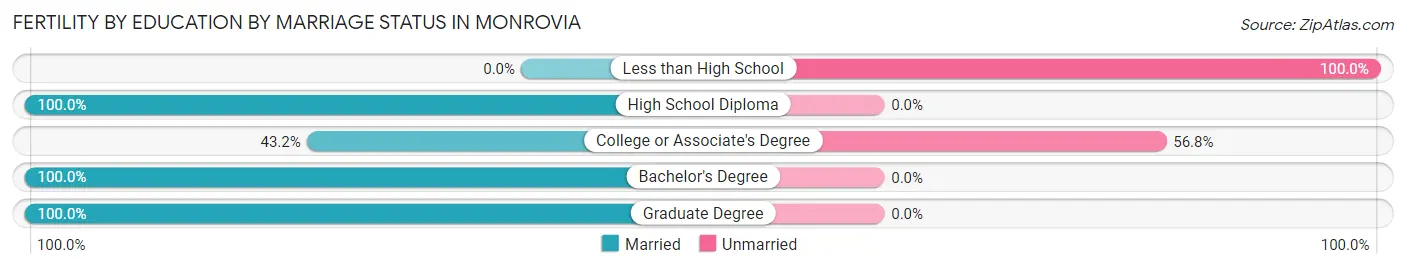
| Educational Attainment | Married | Unmarried |
| Less than High School | 0 (0.0%) | 30 (100.0%) |
| High School Diploma | 52 (100.0%) | 0 (0.0%) |
| College or Associate's Degree | 19 (43.2%) | 25 (56.8%) |
| Bachelor's Degree | 147 (100.0%) | 0 (0.0%) |
| Graduate Degree | 42 (100.0%) | 0 (0.0%) |
| Total | 260 (82.5%) | 55 (17.5%) |
Employment Characteristics in Monrovia
Employment by Class of Employer in Monrovia
Among the 19,094 employed individuals in Monrovia, private company employees (11,686 | 61.2%), not-for-profit organizations (2,257 | 11.8%), and local government employees (2,003 | 10.5%) make up the most common classes of employment.
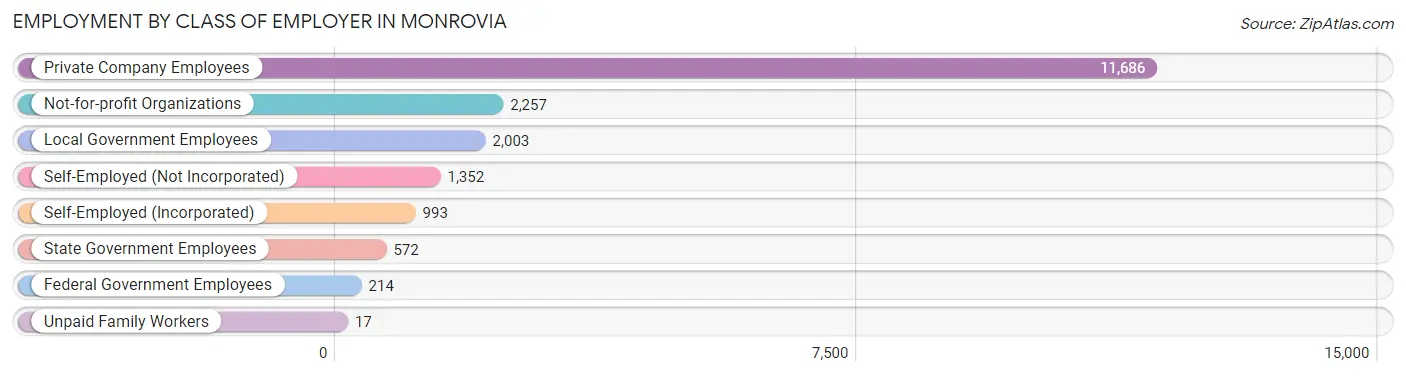
| Employer Class | # Employees | % Employees |
| Private Company Employees | 11,686 | 61.2% |
| Self-Employed (Incorporated) | 993 | 5.2% |
| Self-Employed (Not Incorporated) | 1,352 | 7.1% |
| Not-for-profit Organizations | 2,257 | 11.8% |
| Local Government Employees | 2,003 | 10.5% |
| State Government Employees | 572 | 3.0% |
| Federal Government Employees | 214 | 1.1% |
| Unpaid Family Workers | 17 | 0.1% |
| Total | 19,094 | 100.0% |
Employment Status by Age in Monrovia
According to the labor force statistics for Monrovia, out of the total population over 16 years of age (30,415), 68.0% or 20,682 individuals are in the labor force, with 5.8% or 1,200 of them unemployed. The age group with the highest labor force participation rate is 45 to 54 years, with 88.0% or 4,234 individuals in the labor force. Within the labor force, the 16 to 19 years age range has the highest percentage of unemployed individuals, with 18.3% or 94 of them being unemployed.
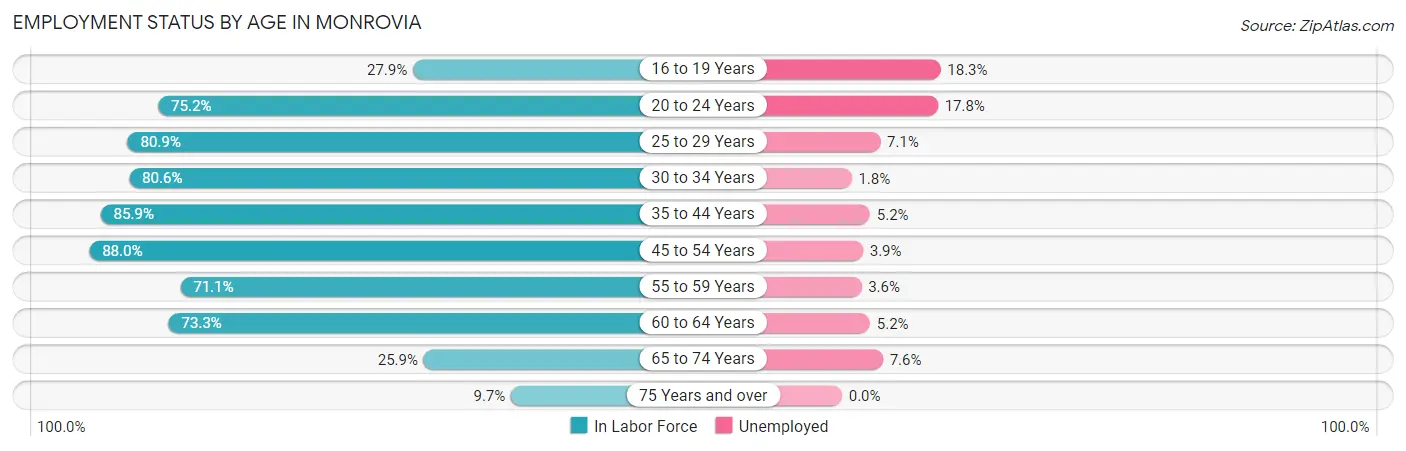
| Age Bracket | In Labor Force | Unemployed |
| 16 to 19 Years | 513 (27.9%) | 94 (18.3%) |
| 20 to 24 Years | 1,580 (75.2%) | 281 (17.8%) |
| 25 to 29 Years | 1,860 (80.9%) | 132 (7.1%) |
| 30 to 34 Years | 2,479 (80.6%) | 45 (1.8%) |
| 35 to 44 Years | 5,068 (85.9%) | 264 (5.2%) |
| 45 to 54 Years | 4,234 (88.0%) | 165 (3.9%) |
| 55 to 59 Years | 2,292 (71.1%) | 83 (3.6%) |
| 60 to 64 Years | 1,762 (73.3%) | 92 (5.2%) |
| 65 to 74 Years | 712 (25.9%) | 54 (7.6%) |
| 75 Years and over | 195 (9.7%) | 0 (0.0%) |
| Total | 20,682 (68.0%) | 1,200 (5.8%) |
Employment Status by Educational Attainment in Monrovia
According to labor force statistics for Monrovia, 81.5% of individuals (17,697) out of the total population between 25 and 64 years of age (21,714) are in the labor force, with 4.4% or 779 of them being unemployed. The group with the highest labor force participation rate are those with the educational attainment of bachelor's degree or higher, with 86.9% or 8,419 individuals in the labor force. Within the labor force, individuals with high school diploma education have the highest percentage of unemployment, with 5.3% or 154 of them being unemployed.
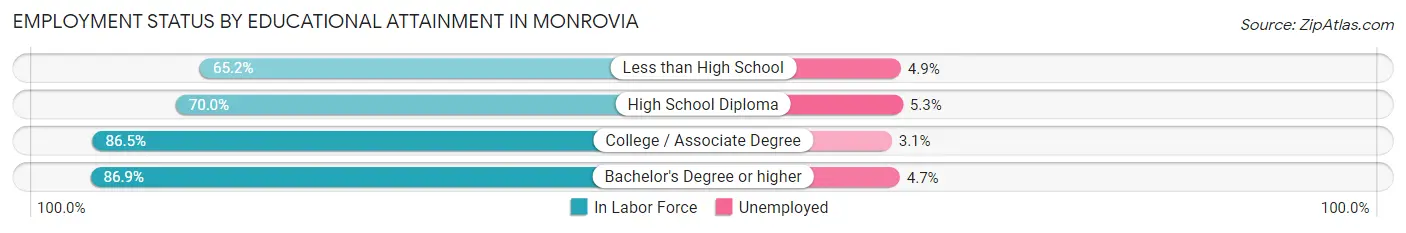
| Educational Attainment | In Labor Force | Unemployed |
| Less than High School | 1,336 (65.2%) | 100 (4.9%) |
| High School Diploma | 2,908 (70.0%) | 220 (5.3%) |
| College / Associate Degree | 5,037 (86.5%) | 181 (3.1%) |
| Bachelor's Degree or higher | 8,419 (86.9%) | 455 (4.7%) |
| Total | 17,697 (81.5%) | 955 (4.4%) |
Employment Occupations by Sex in Monrovia
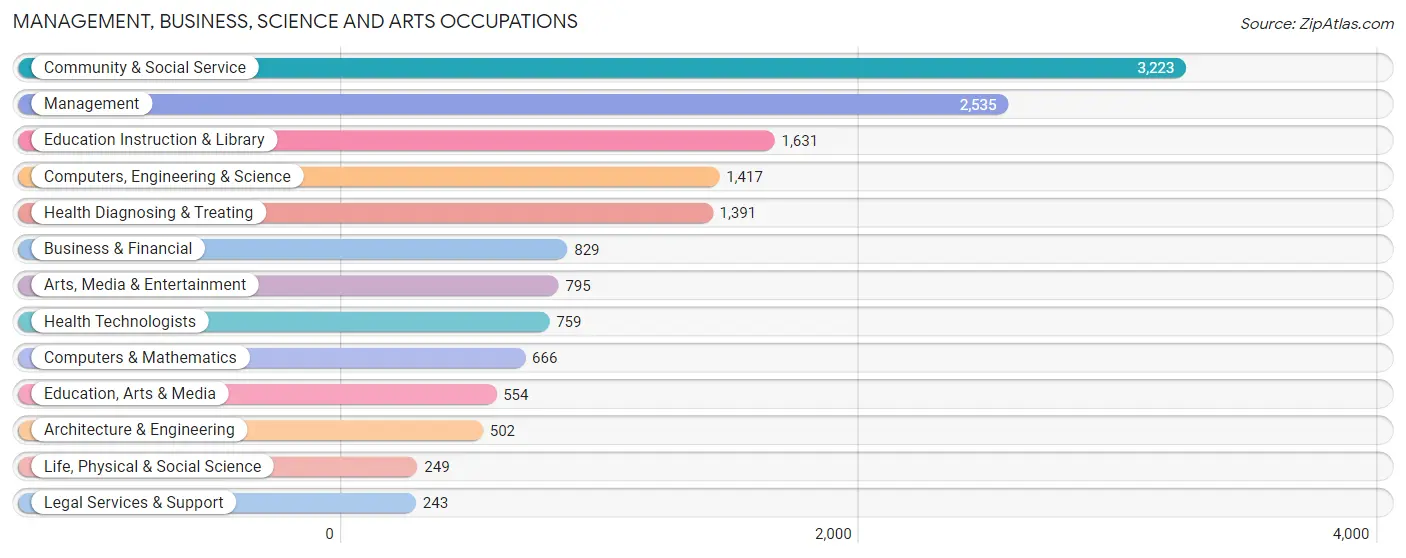
Management, Business, Science and Arts Occupations
The most common Management, Business, Science and Arts occupations in Monrovia are Community & Social Service (3,223 | 16.6%), Management (2,535 | 13.0%), Education Instruction & Library (1,631 | 8.4%), Computers, Engineering & Science (1,417 | 7.3%), and Health Diagnosing & Treating (1,391 | 7.1%).
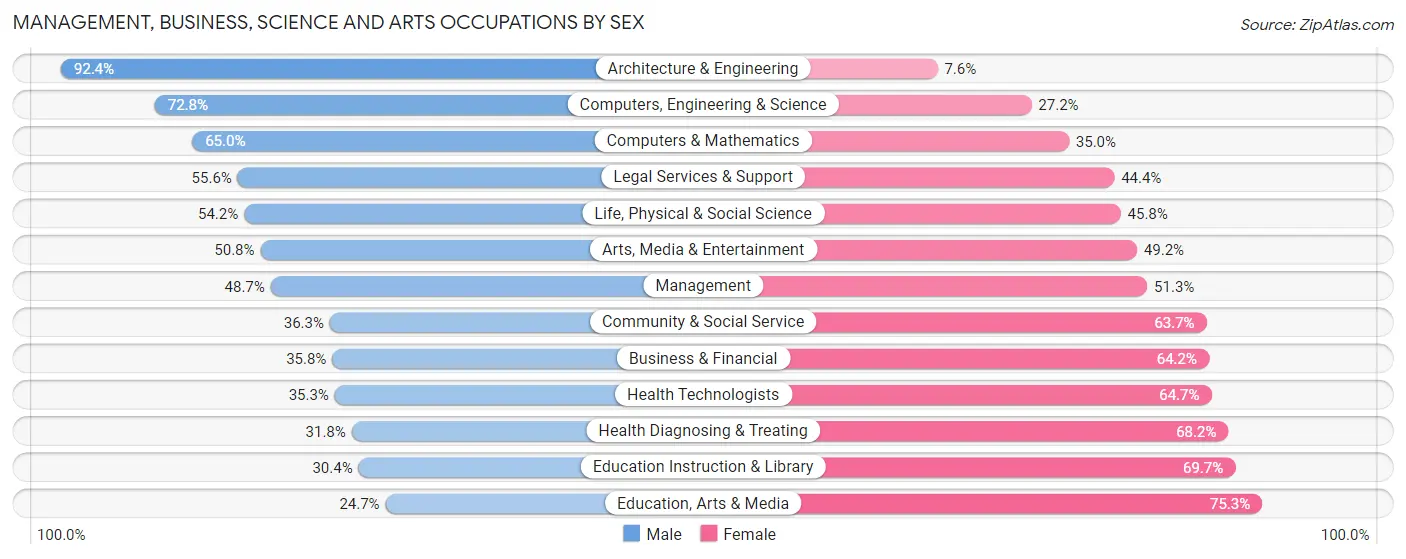
Management, Business, Science and Arts Occupations by Sex
Within the Management, Business, Science and Arts occupations in Monrovia, the most male-oriented occupations are Architecture & Engineering (92.4%), Computers, Engineering & Science (72.8%), and Computers & Mathematics (65.0%), while the most female-oriented occupations are Education, Arts & Media (75.3%), Education Instruction & Library (69.7%), and Health Diagnosing & Treating (68.2%).
| Occupation | Male | Female |
| Management | 1,234 (48.7%) | 1,301 (51.3%) |
| Business & Financial | 297 (35.8%) | 532 (64.2%) |
| Computers, Engineering & Science | 1,032 (72.8%) | 385 (27.2%) |
| Computers & Mathematics | 433 (65.0%) | 233 (35.0%) |
| Architecture & Engineering | 464 (92.4%) | 38 (7.6%) |
| Life, Physical & Social Science | 135 (54.2%) | 114 (45.8%) |
| Community & Social Service | 1,171 (36.3%) | 2,052 (63.7%) |
| Education, Arts & Media | 137 (24.7%) | 417 (75.3%) |
| Legal Services & Support | 135 (55.6%) | 108 (44.4%) |
| Education Instruction & Library | 495 (30.3%) | 1,136 (69.7%) |
| Arts, Media & Entertainment | 404 (50.8%) | 391 (49.2%) |
| Health Diagnosing & Treating | 442 (31.8%) | 949 (68.2%) |
| Health Technologists | 268 (35.3%) | 491 (64.7%) |
| Total (Category) | 4,176 (44.5%) | 5,219 (55.5%) |
| Total (Overall) | 9,721 (49.9%) | 9,754 (50.1%) |
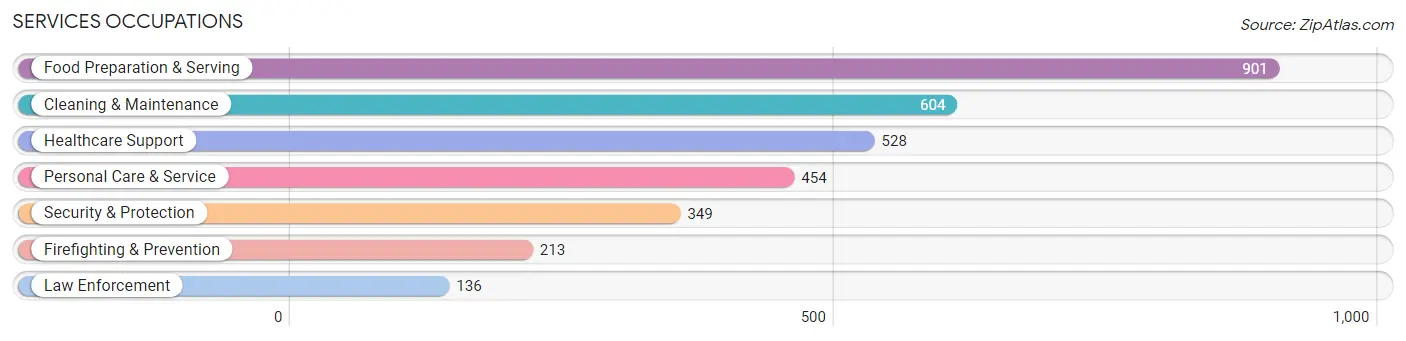
Services Occupations
The most common Services occupations in Monrovia are Food Preparation & Serving (901 | 4.6%), Cleaning & Maintenance (604 | 3.1%), Healthcare Support (528 | 2.7%), Personal Care & Service (454 | 2.3%), and Security & Protection (349 | 1.8%).
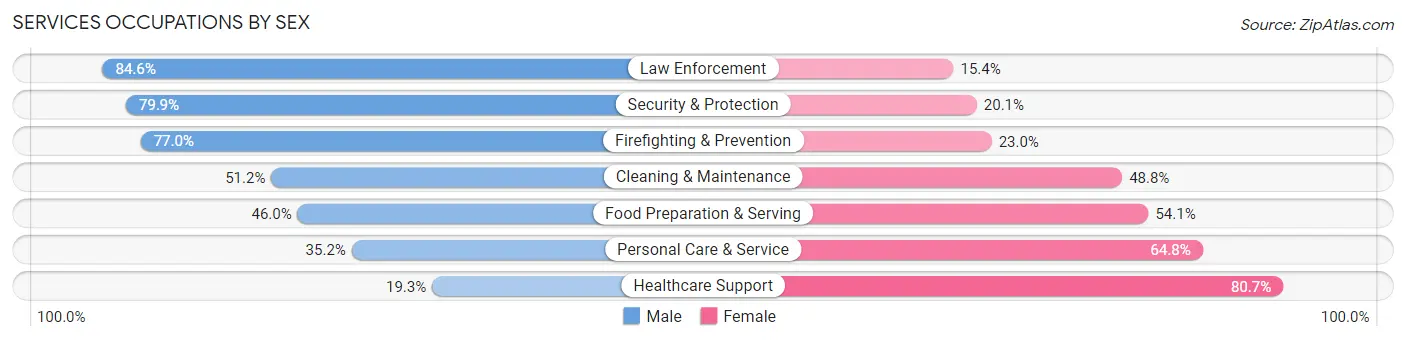
Services Occupations by Sex
Within the Services occupations in Monrovia, the most male-oriented occupations are Law Enforcement (84.6%), Security & Protection (79.9%), and Firefighting & Prevention (77.0%), while the most female-oriented occupations are Healthcare Support (80.7%), Personal Care & Service (64.8%), and Food Preparation & Serving (54.0%).
| Occupation | Male | Female |
| Healthcare Support | 102 (19.3%) | 426 (80.7%) |
| Security & Protection | 279 (79.9%) | 70 (20.1%) |
| Firefighting & Prevention | 164 (77.0%) | 49 (23.0%) |
| Law Enforcement | 115 (84.6%) | 21 (15.4%) |
| Food Preparation & Serving | 414 (46.0%) | 487 (54.0%) |
| Cleaning & Maintenance | 309 (51.2%) | 295 (48.8%) |
| Personal Care & Service | 160 (35.2%) | 294 (64.8%) |
| Total (Category) | 1,264 (44.6%) | 1,572 (55.4%) |
| Total (Overall) | 9,721 (49.9%) | 9,754 (50.1%) |
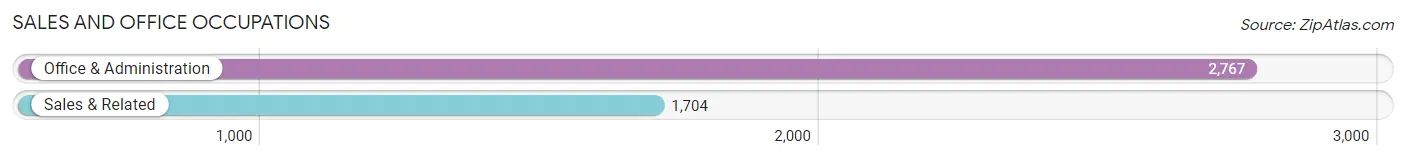
Sales and Office Occupations
The most common Sales and Office occupations in Monrovia are Office & Administration (2,767 | 14.2%), and Sales & Related (1,704 | 8.7%).
Sales and Office Occupations by Sex
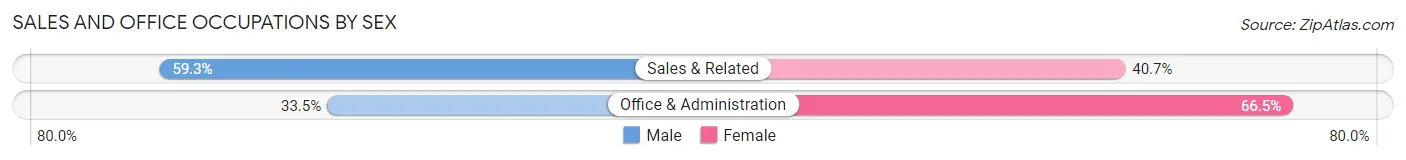
| Occupation | Male | Female |
| Sales & Related | 1,010 (59.3%) | 694 (40.7%) |
| Office & Administration | 926 (33.5%) | 1,841 (66.5%) |
| Total (Category) | 1,936 (43.3%) | 2,535 (56.7%) |
| Total (Overall) | 9,721 (49.9%) | 9,754 (50.1%) |
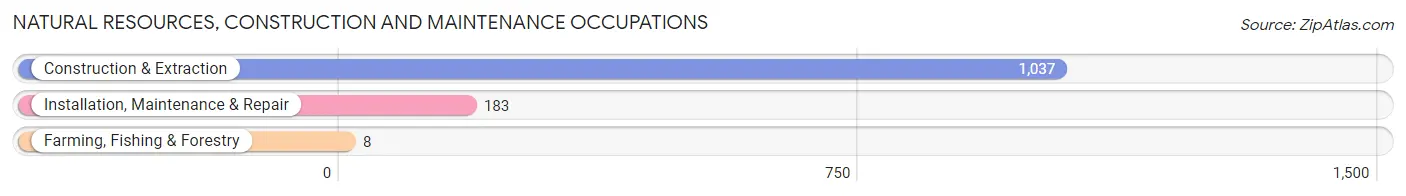
Natural Resources, Construction and Maintenance Occupations
The most common Natural Resources, Construction and Maintenance occupations in Monrovia are Construction & Extraction (1,037 | 5.3%), Installation, Maintenance & Repair (183 | 0.9%), and Farming, Fishing & Forestry (8 | 0.0%).
Natural Resources, Construction and Maintenance Occupations by Sex
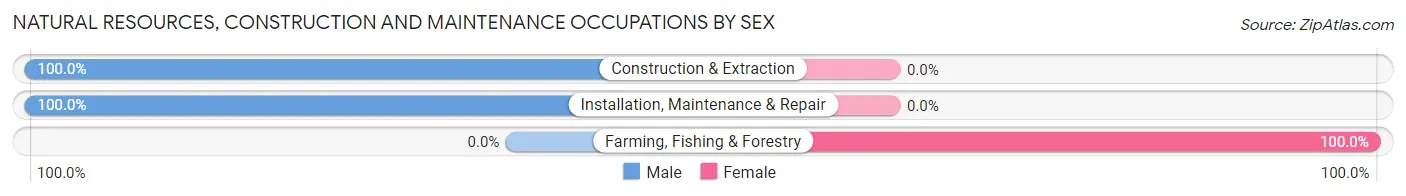
| Occupation | Male | Female |
| Farming, Fishing & Forestry | 0 (0.0%) | 8 (100.0%) |
| Construction & Extraction | 1,037 (100.0%) | 0 (0.0%) |
| Installation, Maintenance & Repair | 183 (100.0%) | 0 (0.0%) |
| Total (Category) | 1,220 (99.4%) | 8 (0.6%) |
| Total (Overall) | 9,721 (49.9%) | 9,754 (50.1%) |
Production, Transportation and Moving Occupations
The most common Production, Transportation and Moving occupations in Monrovia are Production (709 | 3.6%), Transportation (487 | 2.5%), and Material Moving (349 | 1.8%).
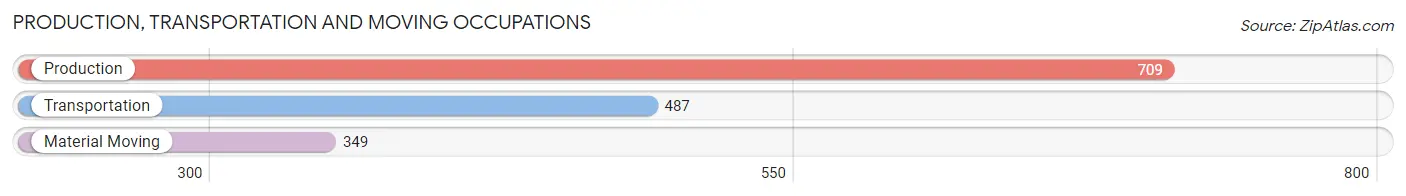
Production, Transportation and Moving Occupations by Sex
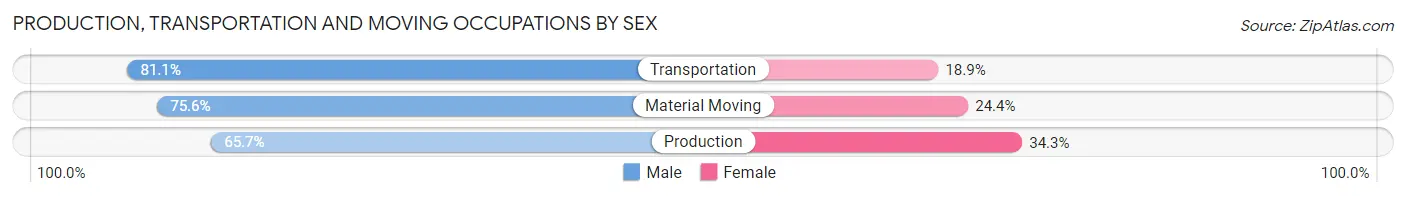
| Occupation | Male | Female |
| Production | 466 (65.7%) | 243 (34.3%) |
| Transportation | 395 (81.1%) | 92 (18.9%) |
| Material Moving | 264 (75.6%) | 85 (24.4%) |
| Total (Category) | 1,125 (72.8%) | 420 (27.2%) |
| Total (Overall) | 9,721 (49.9%) | 9,754 (50.1%) |
Employment Industries by Sex in Monrovia
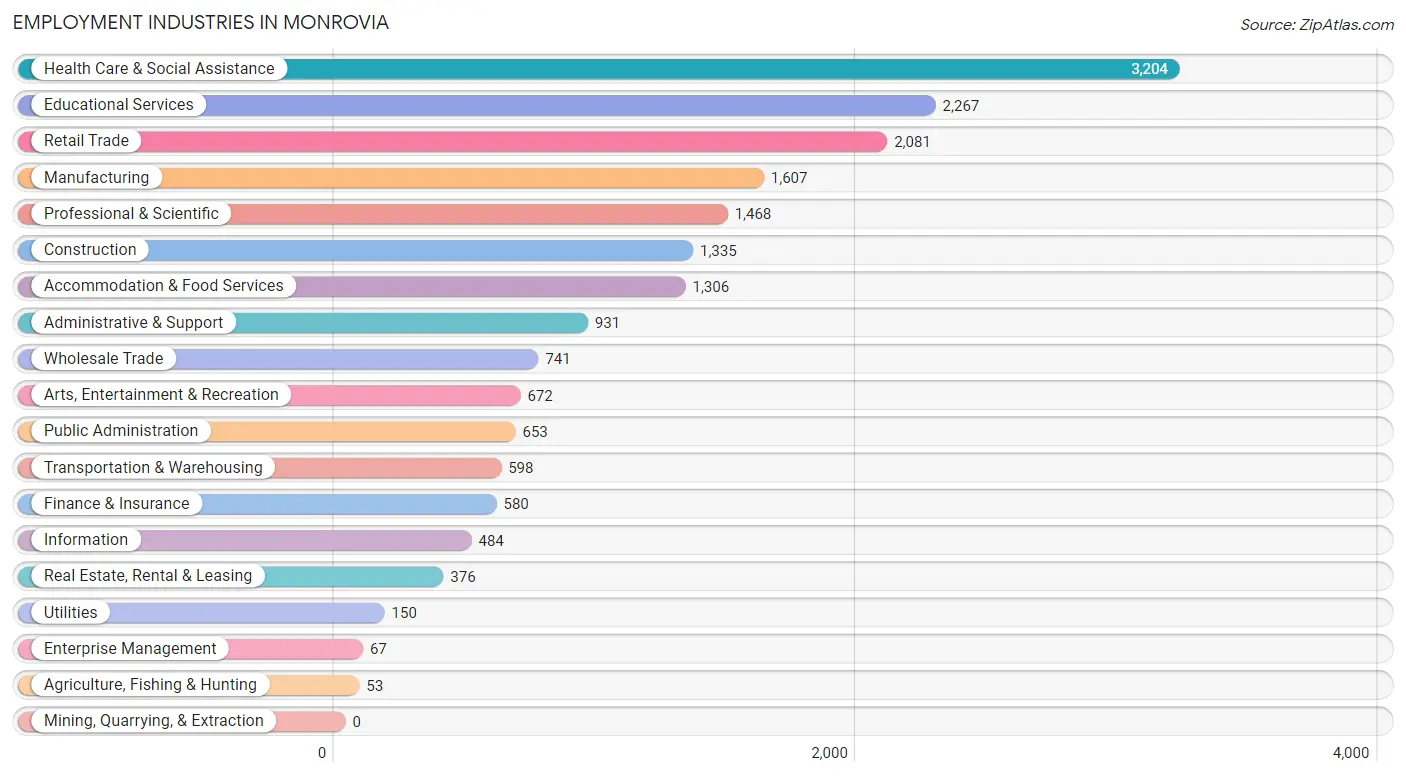
Employment Industries in Monrovia
The major employment industries in Monrovia include Health Care & Social Assistance (3,204 | 16.5%), Educational Services (2,267 | 11.6%), Retail Trade (2,081 | 10.7%), Manufacturing (1,607 | 8.3%), and Professional & Scientific (1,468 | 7.5%).
Employment Industries by Sex in Monrovia
The Monrovia industries that see more men than women are Construction (92.3%), Utilities (80.0%), and Information (76.2%), whereas the industries that tend to have a higher number of women are Health Care & Social Assistance (73.4%), Enterprise Management (65.7%), and Educational Services (65.4%).
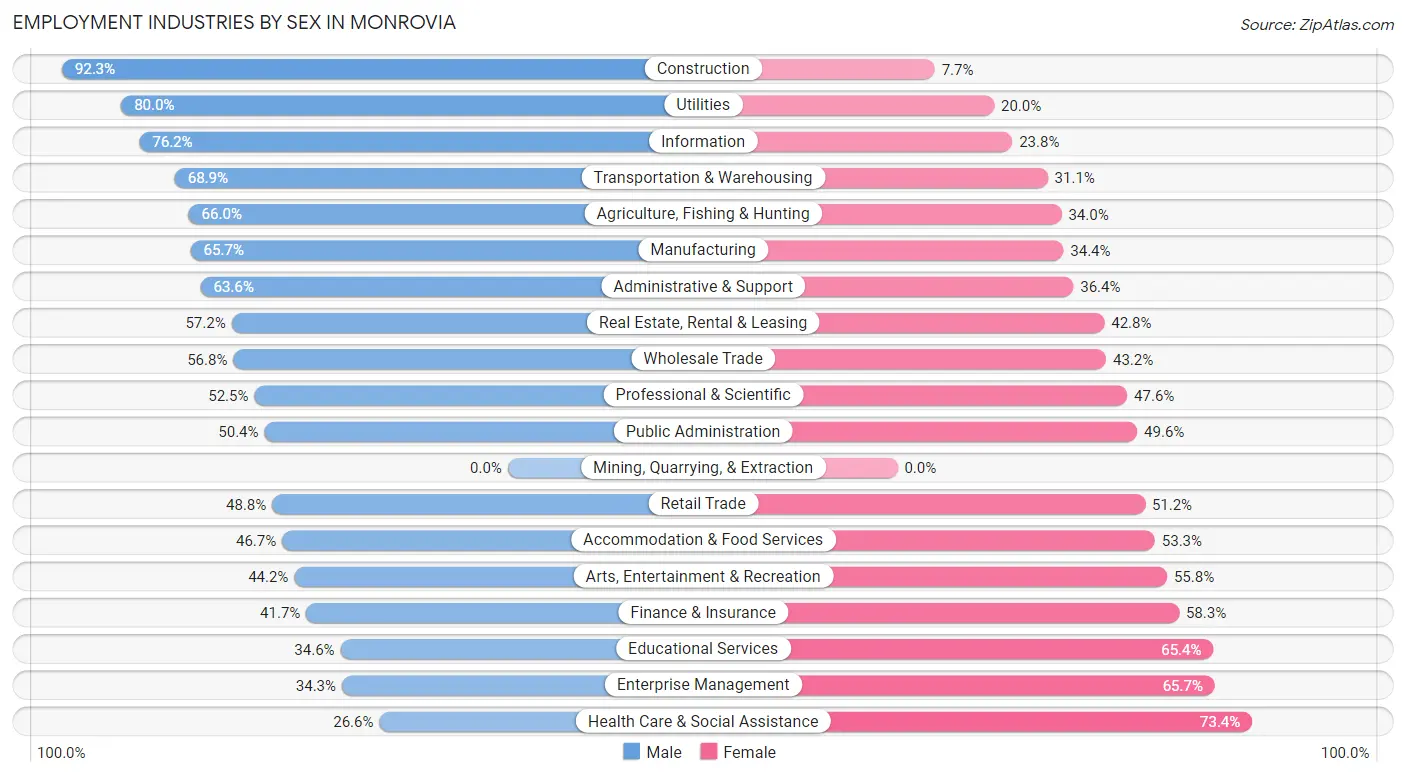
| Industry | Male | Female |
| Agriculture, Fishing & Hunting | 35 (66.0%) | 18 (34.0%) |
| Mining, Quarrying, & Extraction | 0 (0.0%) | 0 (0.0%) |
| Construction | 1,232 (92.3%) | 103 (7.7%) |
| Manufacturing | 1,055 (65.6%) | 552 (34.4%) |
| Wholesale Trade | 421 (56.8%) | 320 (43.2%) |
| Retail Trade | 1,015 (48.8%) | 1,066 (51.2%) |
| Transportation & Warehousing | 412 (68.9%) | 186 (31.1%) |
| Utilities | 120 (80.0%) | 30 (20.0%) |
| Information | 369 (76.2%) | 115 (23.8%) |
| Finance & Insurance | 242 (41.7%) | 338 (58.3%) |
| Real Estate, Rental & Leasing | 215 (57.2%) | 161 (42.8%) |
| Professional & Scientific | 770 (52.4%) | 698 (47.5%) |
| Enterprise Management | 23 (34.3%) | 44 (65.7%) |
| Administrative & Support | 592 (63.6%) | 339 (36.4%) |
| Educational Services | 785 (34.6%) | 1,482 (65.4%) |
| Health Care & Social Assistance | 852 (26.6%) | 2,352 (73.4%) |
| Arts, Entertainment & Recreation | 297 (44.2%) | 375 (55.8%) |
| Accommodation & Food Services | 610 (46.7%) | 696 (53.3%) |
| Public Administration | 329 (50.4%) | 324 (49.6%) |
| Total | 9,721 (49.9%) | 9,754 (50.1%) |
Education in Monrovia
School Enrollment in Monrovia
The most common levels of schooling among the 9,589 students in Monrovia are high school (2,063 | 21.5%), middle school (2,048 | 21.4%), and college / undergraduate (2,035 | 21.2%).
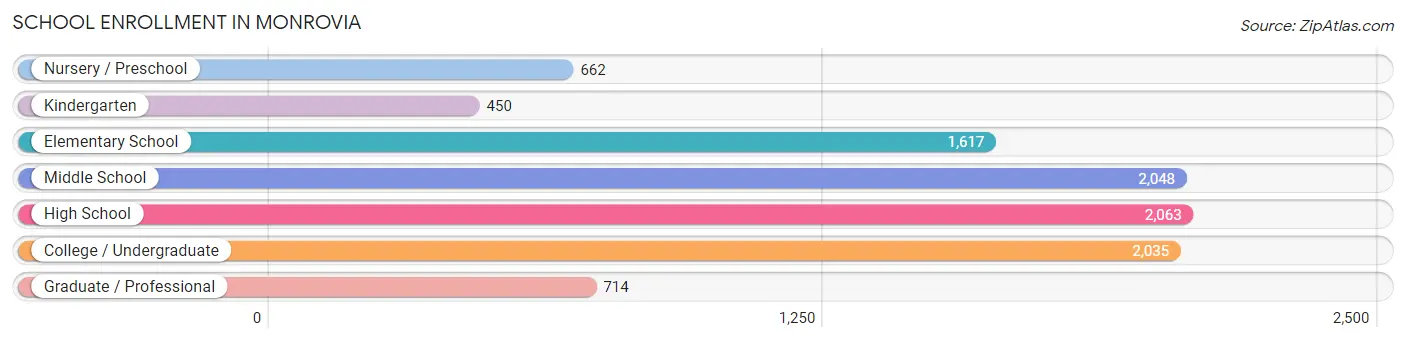
| School Level | # Students | % Students |
| Nursery / Preschool | 662 | 6.9% |
| Kindergarten | 450 | 4.7% |
| Elementary School | 1,617 | 16.9% |
| Middle School | 2,048 | 21.4% |
| High School | 2,063 | 21.5% |
| College / Undergraduate | 2,035 | 21.2% |
| Graduate / Professional | 714 | 7.4% |
| Total | 9,589 | 100.0% |
School Enrollment by Age by Funding Source in Monrovia
Out of a total of 9,589 students who are enrolled in schools in Monrovia, 1,736 (18.1%) attend a private institution, while the remaining 7,853 (81.9%) are enrolled in public schools. The age group of 3 to 4 year olds has the highest likelihood of being enrolled in private schools, with 317 (64.8% in the age bracket) enrolled. Conversely, the age group of 18 to 19 year olds has the lowest likelihood of being enrolled in a private school, with 640 (98.8% in the age bracket) attending a public institution.
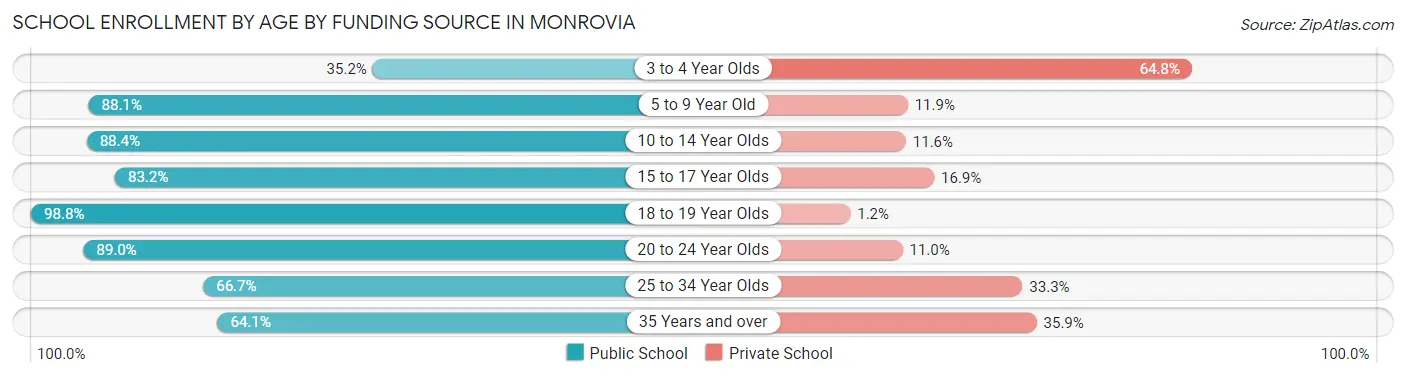
| Age Bracket | Public School | Private School |
| 3 to 4 Year Olds | 172 (35.2%) | 317 (64.8%) |
| 5 to 9 Year Old | 1,845 (88.1%) | 250 (11.9%) |
| 10 to 14 Year Olds | 2,245 (88.4%) | 294 (11.6%) |
| 15 to 17 Year Olds | 1,199 (83.2%) | 243 (16.9%) |
| 18 to 19 Year Olds | 640 (98.8%) | 8 (1.2%) |
| 20 to 24 Year Olds | 739 (89.0%) | 91 (11.0%) |
| 25 to 34 Year Olds | 493 (66.7%) | 246 (33.3%) |
| 35 Years and over | 517 (64.1%) | 290 (35.9%) |
| Total | 7,853 (81.9%) | 1,736 (18.1%) |
Educational Attainment by Field of Study in Monrovia
Business (2,485 | 20.3%), social sciences (1,351 | 11.0%), science & technology (951 | 7.7%), visual & performing arts (924 | 7.5%), and bio, nature & agricultural (881 | 7.2%) are the most common fields of study among 12,268 individuals in Monrovia who have obtained a bachelor's degree or higher.
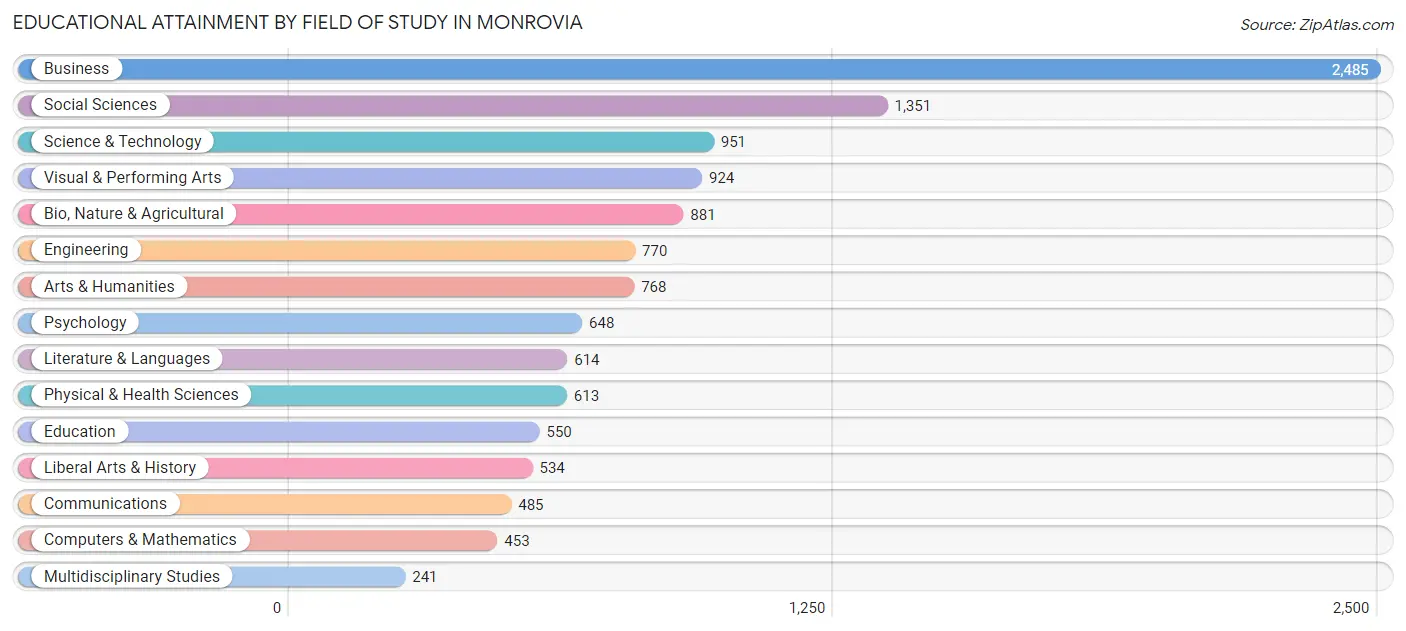
| Field of Study | # Graduates | % Graduates |
| Computers & Mathematics | 453 | 3.7% |
| Bio, Nature & Agricultural | 881 | 7.2% |
| Physical & Health Sciences | 613 | 5.0% |
| Psychology | 648 | 5.3% |
| Social Sciences | 1,351 | 11.0% |
| Engineering | 770 | 6.3% |
| Multidisciplinary Studies | 241 | 2.0% |
| Science & Technology | 951 | 7.7% |
| Business | 2,485 | 20.3% |
| Education | 550 | 4.5% |
| Literature & Languages | 614 | 5.0% |
| Liberal Arts & History | 534 | 4.3% |
| Visual & Performing Arts | 924 | 7.5% |
| Communications | 485 | 4.0% |
| Arts & Humanities | 768 | 6.3% |
| Total | 12,268 | 100.0% |
Transportation & Commute in Monrovia
Vehicle Availability by Sex in Monrovia
The most prevalent vehicle ownership categories in Monrovia are males with 2 vehicles (3,883, accounting for 40.7%) and females with 2 vehicles (3,578, making up 40.7%).
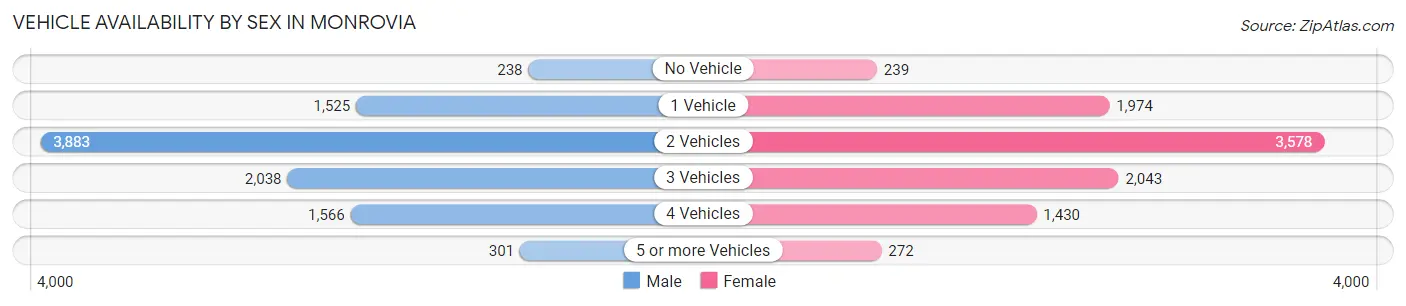
| Vehicles Available | Male | Female |
| No Vehicle | 238 (2.5%) | 239 (2.5%) |
| 1 Vehicle | 1,525 (16.0%) | 1,974 (20.7%) |
| 2 Vehicles | 3,883 (40.7%) | 3,578 (37.5%) |
| 3 Vehicles | 2,038 (21.3%) | 2,043 (21.4%) |
| 4 Vehicles | 1,566 (16.4%) | 1,430 (15.0%) |
| 5 or more Vehicles | 301 (3.2%) | 272 (2.9%) |
| Total | 9,551 (100.0%) | 9,536 (100.0%) |
Commute Time in Monrovia
The most frequently occuring commute durations in Monrovia are 30 to 34 minutes (3,432 commuters, 20.8%), 20 to 24 minutes (2,299 commuters, 14.0%), and 45 to 59 minutes (1,900 commuters, 11.5%).
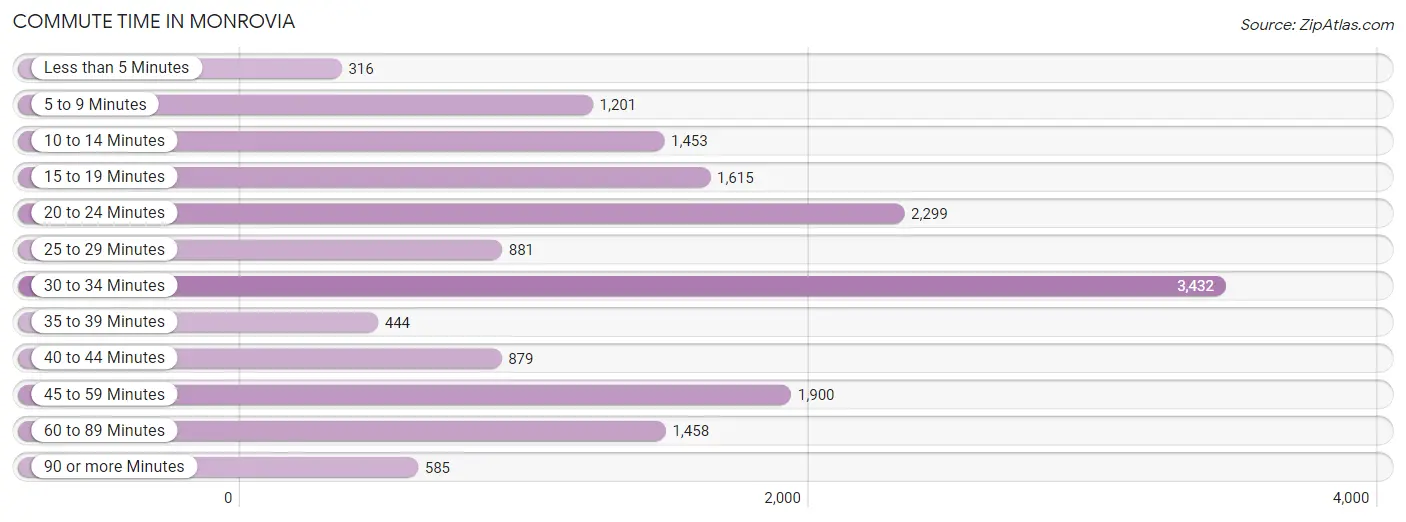
| Commute Time | # Commuters | % Commuters |
| Less than 5 Minutes | 316 | 1.9% |
| 5 to 9 Minutes | 1,201 | 7.3% |
| 10 to 14 Minutes | 1,453 | 8.8% |
| 15 to 19 Minutes | 1,615 | 9.8% |
| 20 to 24 Minutes | 2,299 | 14.0% |
| 25 to 29 Minutes | 881 | 5.3% |
| 30 to 34 Minutes | 3,432 | 20.8% |
| 35 to 39 Minutes | 444 | 2.7% |
| 40 to 44 Minutes | 879 | 5.3% |
| 45 to 59 Minutes | 1,900 | 11.5% |
| 60 to 89 Minutes | 1,458 | 8.9% |
| 90 or more Minutes | 585 | 3.5% |
Commute Time by Sex in Monrovia
The most common commute times in Monrovia are 30 to 34 minutes (1,878 commuters, 22.5%) for males and 30 to 34 minutes (1,554 commuters, 19.2%) for females.
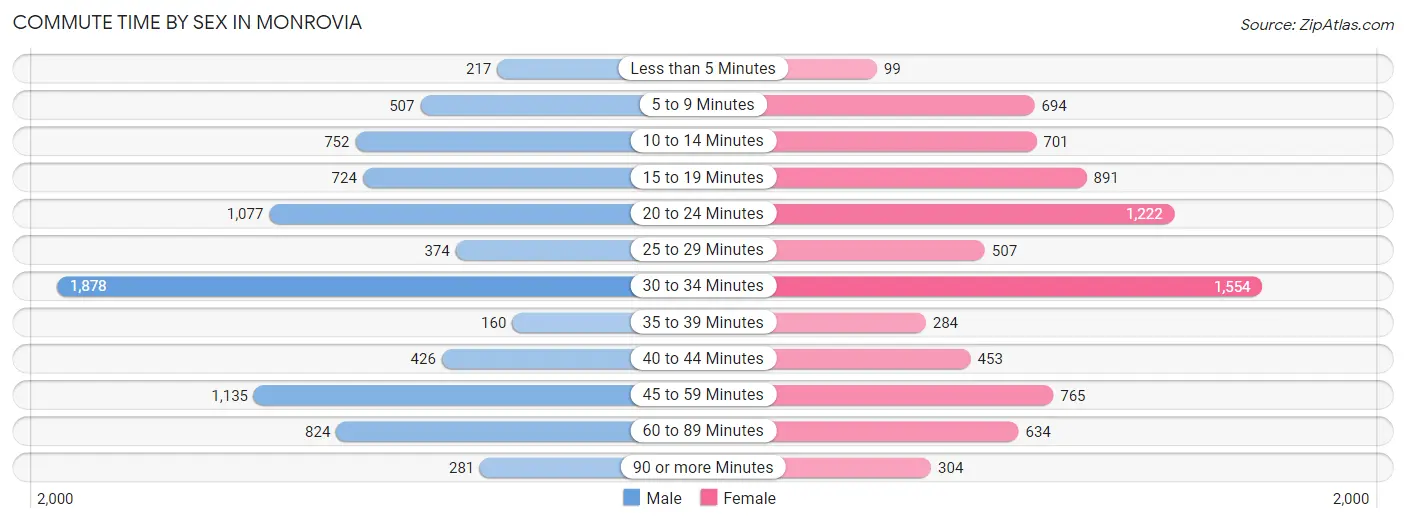
| Commute Time | Male | Female |
| Less than 5 Minutes | 217 (2.6%) | 99 (1.2%) |
| 5 to 9 Minutes | 507 (6.1%) | 694 (8.6%) |
| 10 to 14 Minutes | 752 (9.0%) | 701 (8.6%) |
| 15 to 19 Minutes | 724 (8.7%) | 891 (11.0%) |
| 20 to 24 Minutes | 1,077 (12.9%) | 1,222 (15.1%) |
| 25 to 29 Minutes | 374 (4.5%) | 507 (6.2%) |
| 30 to 34 Minutes | 1,878 (22.5%) | 1,554 (19.2%) |
| 35 to 39 Minutes | 160 (1.9%) | 284 (3.5%) |
| 40 to 44 Minutes | 426 (5.1%) | 453 (5.6%) |
| 45 to 59 Minutes | 1,135 (13.6%) | 765 (9.4%) |
| 60 to 89 Minutes | 824 (9.9%) | 634 (7.8%) |
| 90 or more Minutes | 281 (3.4%) | 304 (3.7%) |
Time of Departure to Work by Sex in Monrovia
The most frequent times of departure to work in Monrovia are 7:00 AM to 7:29 AM (1,135, 13.6%) for males and 7:00 AM to 7:29 AM (1,260, 15.5%) for females.
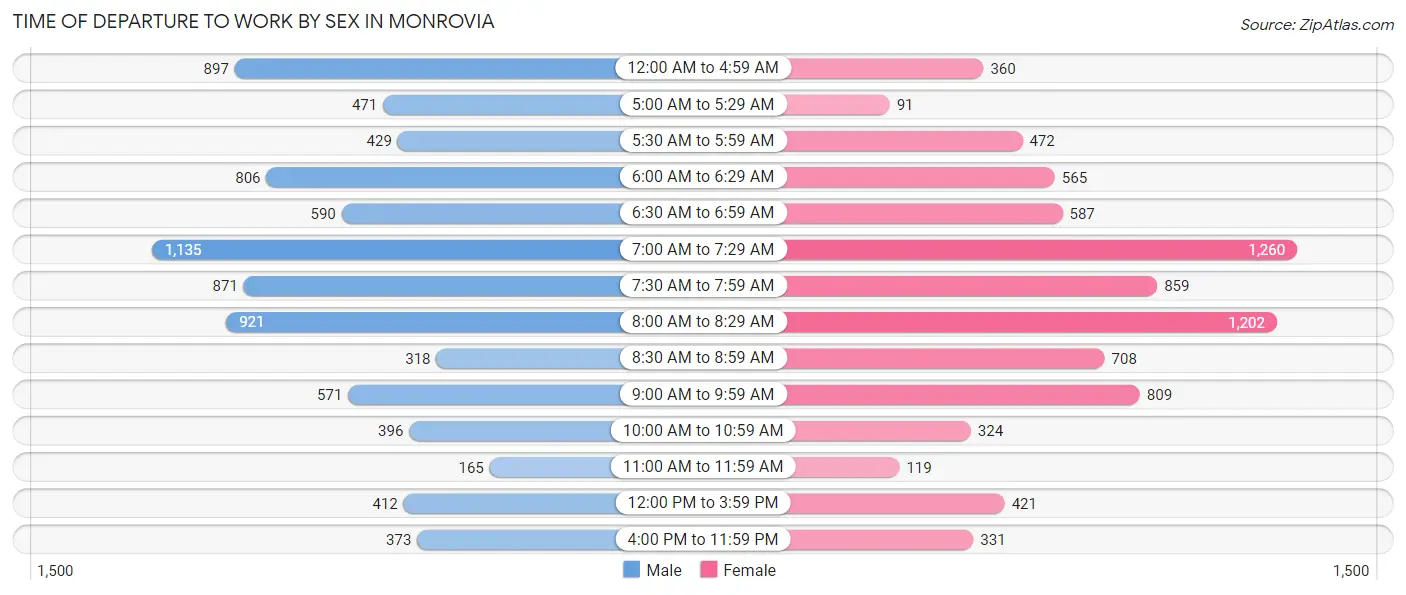
| Time of Departure | Male | Female |
| 12:00 AM to 4:59 AM | 897 (10.7%) | 360 (4.4%) |
| 5:00 AM to 5:29 AM | 471 (5.6%) | 91 (1.1%) |
| 5:30 AM to 5:59 AM | 429 (5.1%) | 472 (5.8%) |
| 6:00 AM to 6:29 AM | 806 (9.7%) | 565 (7.0%) |
| 6:30 AM to 6:59 AM | 590 (7.1%) | 587 (7.2%) |
| 7:00 AM to 7:29 AM | 1,135 (13.6%) | 1,260 (15.5%) |
| 7:30 AM to 7:59 AM | 871 (10.4%) | 859 (10.6%) |
| 8:00 AM to 8:29 AM | 921 (11.0%) | 1,202 (14.8%) |
| 8:30 AM to 8:59 AM | 318 (3.8%) | 708 (8.7%) |
| 9:00 AM to 9:59 AM | 571 (6.8%) | 809 (10.0%) |
| 10:00 AM to 10:59 AM | 396 (4.7%) | 324 (4.0%) |
| 11:00 AM to 11:59 AM | 165 (2.0%) | 119 (1.5%) |
| 12:00 PM to 3:59 PM | 412 (4.9%) | 421 (5.2%) |
| 4:00 PM to 11:59 PM | 373 (4.5%) | 331 (4.1%) |
| Total | 8,355 (100.0%) | 8,108 (100.0%) |
Housing Occupancy in Monrovia
Occupancy by Ownership in Monrovia
Of the total 13,560 dwellings in Monrovia, owner-occupied units account for 6,344 (46.8%), while renter-occupied units make up 7,216 (53.2%).
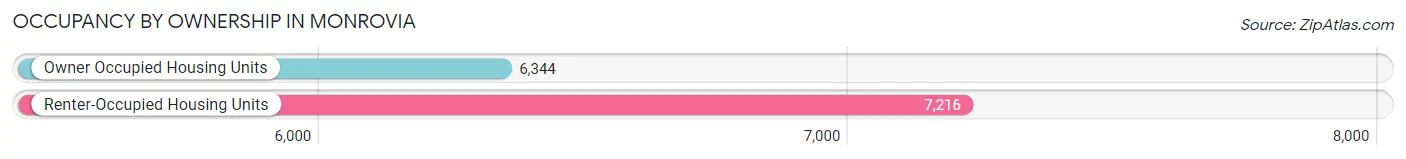
| Occupancy | # Housing Units | % Housing Units |
| Owner Occupied Housing Units | 6,344 | 46.8% |
| Renter-Occupied Housing Units | 7,216 | 53.2% |
| Total Occupied Housing Units | 13,560 | 100.0% |
Occupancy by Household Size in Monrovia
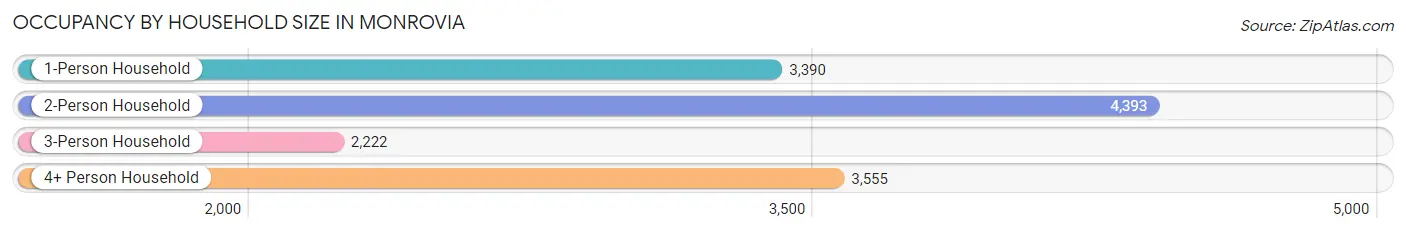
| Household Size | # Housing Units | % Housing Units |
| 1-Person Household | 3,390 | 25.0% |
| 2-Person Household | 4,393 | 32.4% |
| 3-Person Household | 2,222 | 16.4% |
| 4+ Person Household | 3,555 | 26.2% |
| Total Housing Units | 13,560 | 100.0% |
Occupancy by Ownership by Household Size in Monrovia
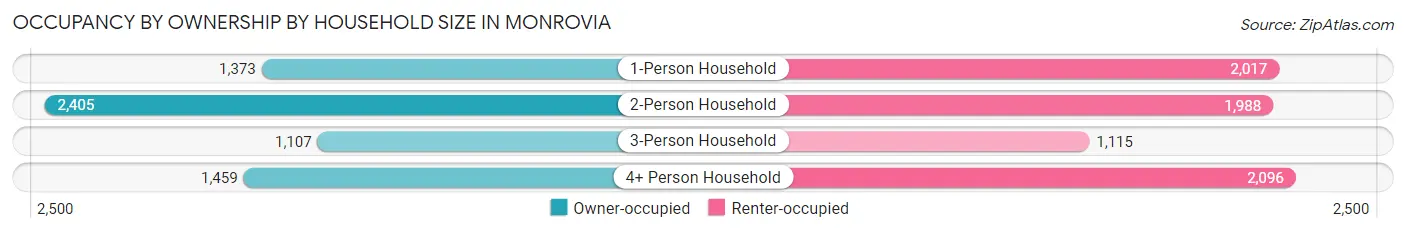
| Household Size | Owner-occupied | Renter-occupied |
| 1-Person Household | 1,373 (40.5%) | 2,017 (59.5%) |
| 2-Person Household | 2,405 (54.7%) | 1,988 (45.3%) |
| 3-Person Household | 1,107 (49.8%) | 1,115 (50.2%) |
| 4+ Person Household | 1,459 (41.0%) | 2,096 (59.0%) |
| Total Housing Units | 6,344 (46.8%) | 7,216 (53.2%) |
Occupancy by Educational Attainment in Monrovia
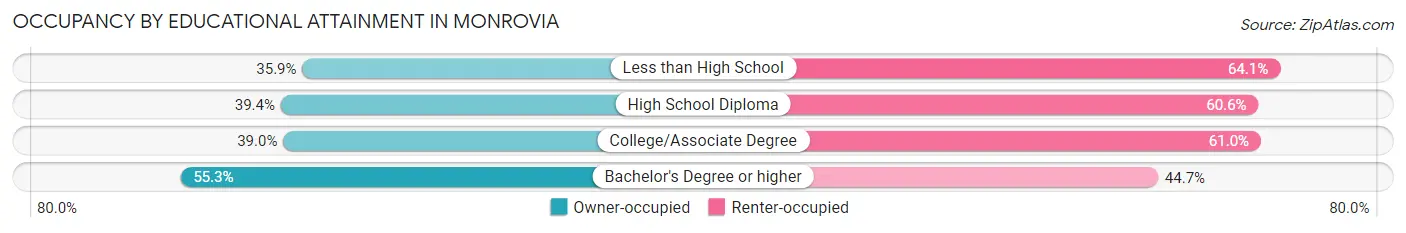
| Household Size | Owner-occupied | Renter-occupied |
| Less than High School | 405 (35.9%) | 722 (64.1%) |
| High School Diploma | 776 (39.4%) | 1,195 (60.6%) |
| College/Associate Degree | 1,489 (39.0%) | 2,331 (61.0%) |
| Bachelor's Degree or higher | 3,674 (55.3%) | 2,968 (44.7%) |
Occupancy by Age of Householder in Monrovia
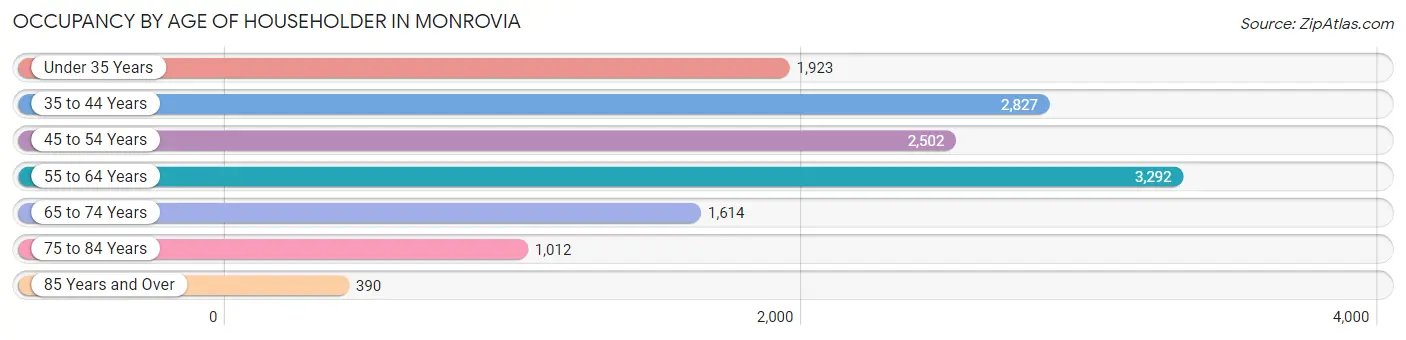
| Age Bracket | # Households | % Households |
| Under 35 Years | 1,923 | 14.2% |
| 35 to 44 Years | 2,827 | 20.8% |
| 45 to 54 Years | 2,502 | 18.4% |
| 55 to 64 Years | 3,292 | 24.3% |
| 65 to 74 Years | 1,614 | 11.9% |
| 75 to 84 Years | 1,012 | 7.5% |
| 85 Years and Over | 390 | 2.9% |
| Total | 13,560 | 100.0% |
Housing Finances in Monrovia
Median Income by Occupancy in Monrovia
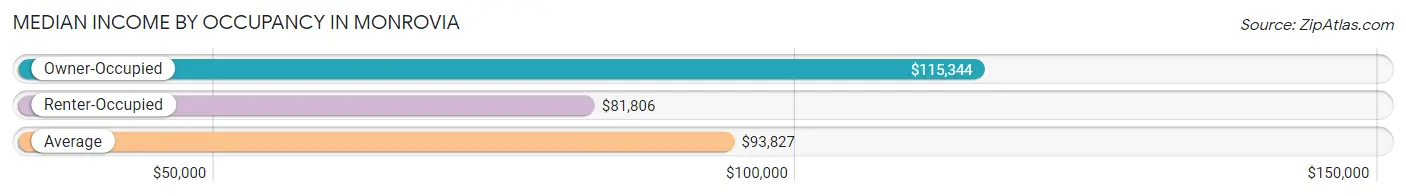
| Occupancy Type | # Households | Median Income |
| Owner-Occupied | 6,344 (46.8%) | $115,344 |
| Renter-Occupied | 7,216 (53.2%) | $81,806 |
| Average | 13,560 (100.0%) | $93,827 |
Occupancy by Householder Income Bracket in Monrovia
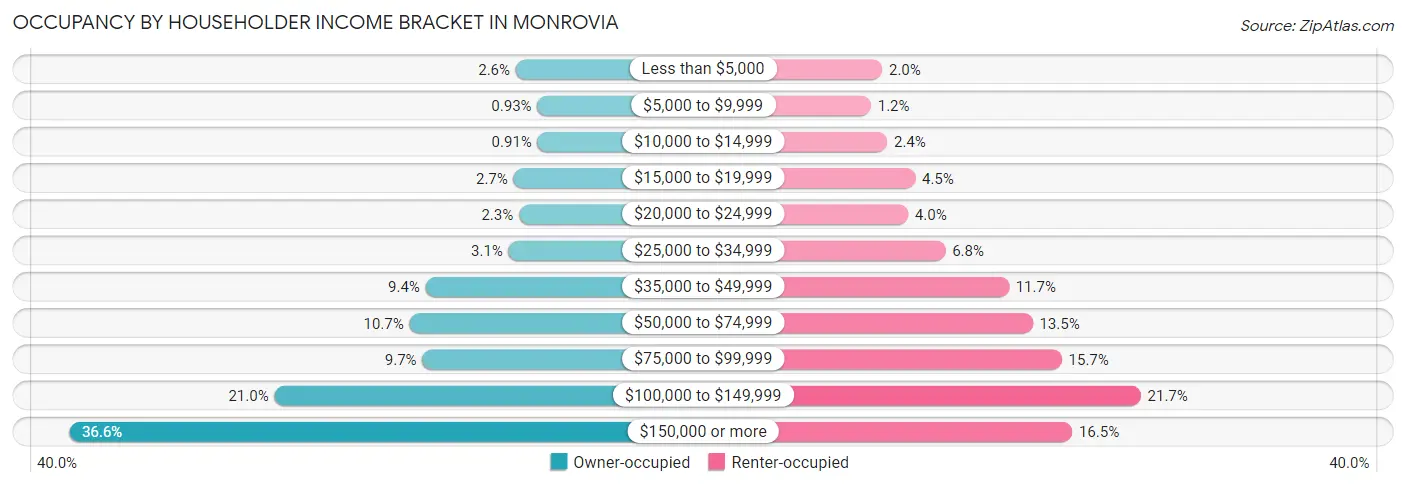
| Income Bracket | Owner-occupied | Renter-occupied |
| Less than $5,000 | 163 (2.6%) | 146 (2.0%) |
| $5,000 to $9,999 | 59 (0.9%) | 84 (1.2%) |
| $10,000 to $14,999 | 58 (0.9%) | 173 (2.4%) |
| $15,000 to $19,999 | 174 (2.7%) | 327 (4.5%) |
| $20,000 to $24,999 | 148 (2.3%) | 288 (4.0%) |
| $25,000 to $34,999 | 198 (3.1%) | 493 (6.8%) |
| $35,000 to $49,999 | 599 (9.4%) | 842 (11.7%) |
| $50,000 to $74,999 | 677 (10.7%) | 973 (13.5%) |
| $75,000 to $99,999 | 615 (9.7%) | 1,133 (15.7%) |
| $100,000 to $149,999 | 1,330 (21.0%) | 1,567 (21.7%) |
| $150,000 or more | 2,323 (36.6%) | 1,190 (16.5%) |
| Total | 6,344 (100.0%) | 7,216 (100.0%) |
Monthly Housing Cost Tiers in Monrovia
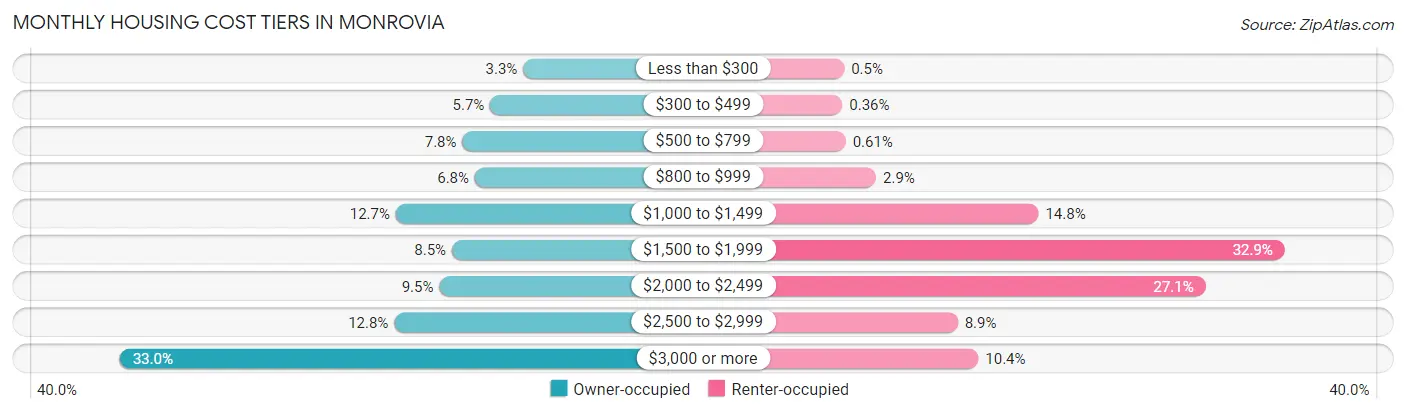
| Monthly Cost | Owner-occupied | Renter-occupied |
| Less than $300 | 208 (3.3%) | 36 (0.5%) |
| $300 to $499 | 362 (5.7%) | 26 (0.4%) |
| $500 to $799 | 492 (7.8%) | 44 (0.6%) |
| $800 to $999 | 434 (6.8%) | 206 (2.9%) |
| $1,000 to $1,499 | 803 (12.7%) | 1,069 (14.8%) |
| $1,500 to $1,999 | 541 (8.5%) | 2,377 (32.9%) |
| $2,000 to $2,499 | 600 (9.5%) | 1,956 (27.1%) |
| $2,500 to $2,999 | 811 (12.8%) | 639 (8.9%) |
| $3,000 or more | 2,093 (33.0%) | 749 (10.4%) |
| Total | 6,344 (100.0%) | 7,216 (100.0%) |
Physical Housing Characteristics in Monrovia
Housing Structures in Monrovia
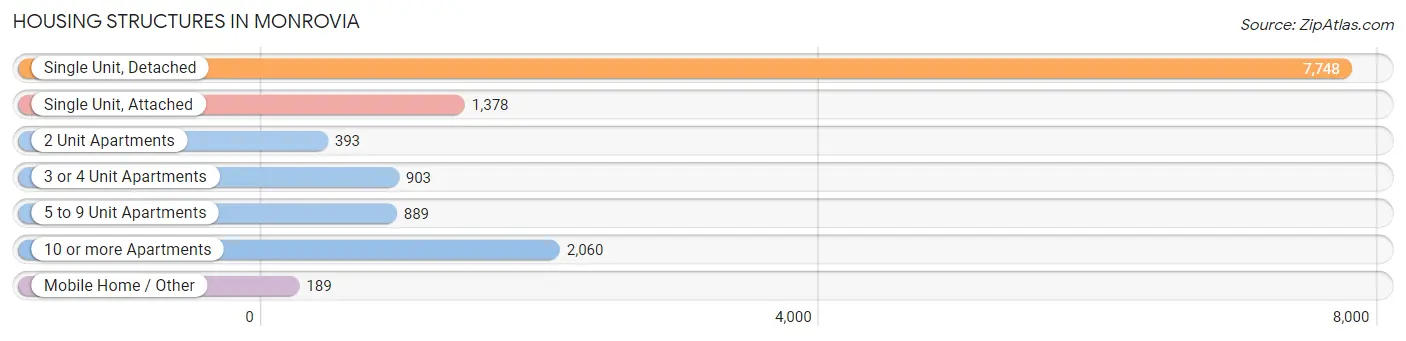
| Structure Type | # Housing Units | % Housing Units |
| Single Unit, Detached | 7,748 | 57.1% |
| Single Unit, Attached | 1,378 | 10.2% |
| 2 Unit Apartments | 393 | 2.9% |
| 3 or 4 Unit Apartments | 903 | 6.7% |
| 5 to 9 Unit Apartments | 889 | 6.6% |
| 10 or more Apartments | 2,060 | 15.2% |
| Mobile Home / Other | 189 | 1.4% |
| Total | 13,560 | 100.0% |
Housing Structures by Occupancy in Monrovia
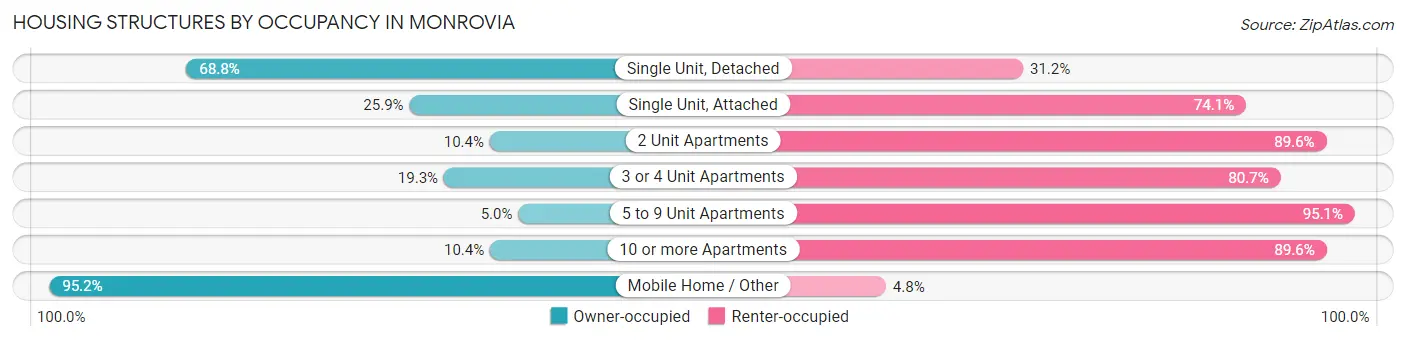
| Structure Type | Owner-occupied | Renter-occupied |
| Single Unit, Detached | 5,334 (68.8%) | 2,414 (31.2%) |
| Single Unit, Attached | 357 (25.9%) | 1,021 (74.1%) |
| 2 Unit Apartments | 41 (10.4%) | 352 (89.6%) |
| 3 or 4 Unit Apartments | 174 (19.3%) | 729 (80.7%) |
| 5 to 9 Unit Apartments | 44 (5.0%) | 845 (95.1%) |
| 10 or more Apartments | 214 (10.4%) | 1,846 (89.6%) |
| Mobile Home / Other | 180 (95.2%) | 9 (4.8%) |
| Total | 6,344 (46.8%) | 7,216 (53.2%) |
Housing Structures by Number of Rooms in Monrovia
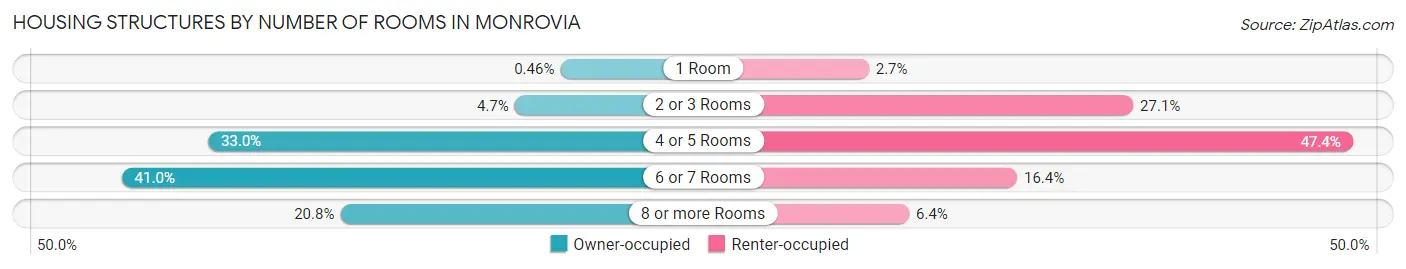
| Number of Rooms | Owner-occupied | Renter-occupied |
| 1 Room | 29 (0.5%) | 193 (2.7%) |
| 2 or 3 Rooms | 297 (4.7%) | 1,957 (27.1%) |
| 4 or 5 Rooms | 2,096 (33.0%) | 3,422 (47.4%) |
| 6 or 7 Rooms | 2,602 (41.0%) | 1,182 (16.4%) |
| 8 or more Rooms | 1,320 (20.8%) | 462 (6.4%) |
| Total | 6,344 (100.0%) | 7,216 (100.0%) |
Housing Structure by Heating Type in Monrovia
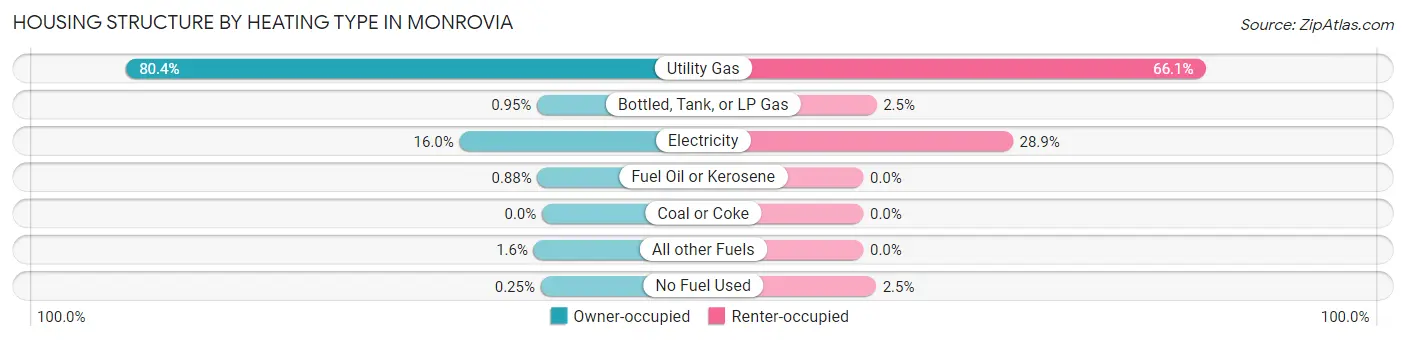
| Heating Type | Owner-occupied | Renter-occupied |
| Utility Gas | 5,098 (80.4%) | 4,771 (66.1%) |
| Bottled, Tank, or LP Gas | 60 (0.9%) | 183 (2.5%) |
| Electricity | 1,012 (16.0%) | 2,085 (28.9%) |
| Fuel Oil or Kerosene | 56 (0.9%) | 0 (0.0%) |
| Coal or Coke | 0 (0.0%) | 0 (0.0%) |
| All other Fuels | 102 (1.6%) | 0 (0.0%) |
| No Fuel Used | 16 (0.3%) | 177 (2.5%) |
| Total | 6,344 (100.0%) | 7,216 (100.0%) |
Household Vehicle Usage in Monrovia
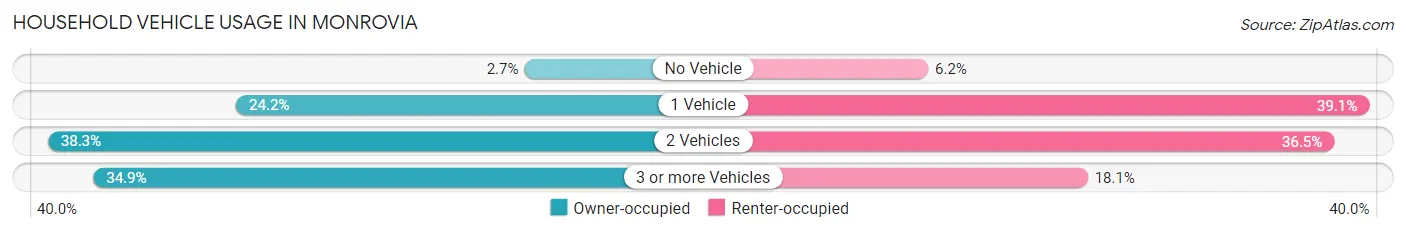
| Vehicles per Household | Owner-occupied | Renter-occupied |
| No Vehicle | 170 (2.7%) | 448 (6.2%) |
| 1 Vehicle | 1,535 (24.2%) | 2,824 (39.1%) |
| 2 Vehicles | 2,427 (38.3%) | 2,636 (36.5%) |
| 3 or more Vehicles | 2,212 (34.9%) | 1,308 (18.1%) |
| Total | 6,344 (100.0%) | 7,216 (100.0%) |
Real Estate & Mortgages in Monrovia
Real Estate and Mortgage Overview in Monrovia
| Characteristic | Without Mortgage | With Mortgage |
| Housing Units | 2,212 | 4,132 |
| Median Property Value | $841,200 | $844,700 |
| Median Household Income | $72,981 | $1,828 |
| Monthly Housing Costs | $848 | $2,049 |
| Real Estate Taxes | $3,901 | $63 |
Property Value by Mortgage Status in Monrovia
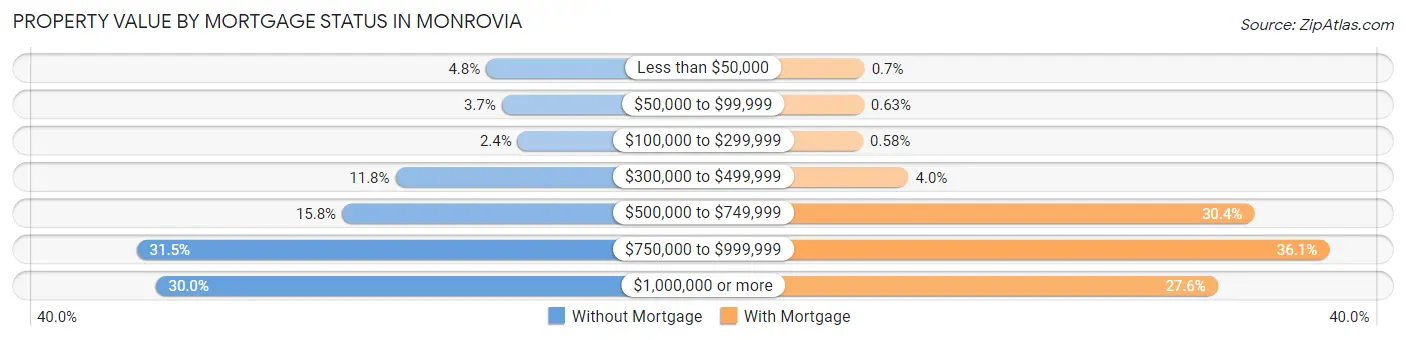
| Property Value | Without Mortgage | With Mortgage |
| Less than $50,000 | 107 (4.8%) | 29 (0.7%) |
| $50,000 to $99,999 | 81 (3.7%) | 26 (0.6%) |
| $100,000 to $299,999 | 54 (2.4%) | 24 (0.6%) |
| $300,000 to $499,999 | 260 (11.7%) | 167 (4.0%) |
| $500,000 to $749,999 | 350 (15.8%) | 1,255 (30.4%) |
| $750,000 to $999,999 | 696 (31.5%) | 1,491 (36.1%) |
| $1,000,000 or more | 664 (30.0%) | 1,140 (27.6%) |
| Total | 2,212 (100.0%) | 4,132 (100.0%) |
Household Income by Mortgage Status in Monrovia
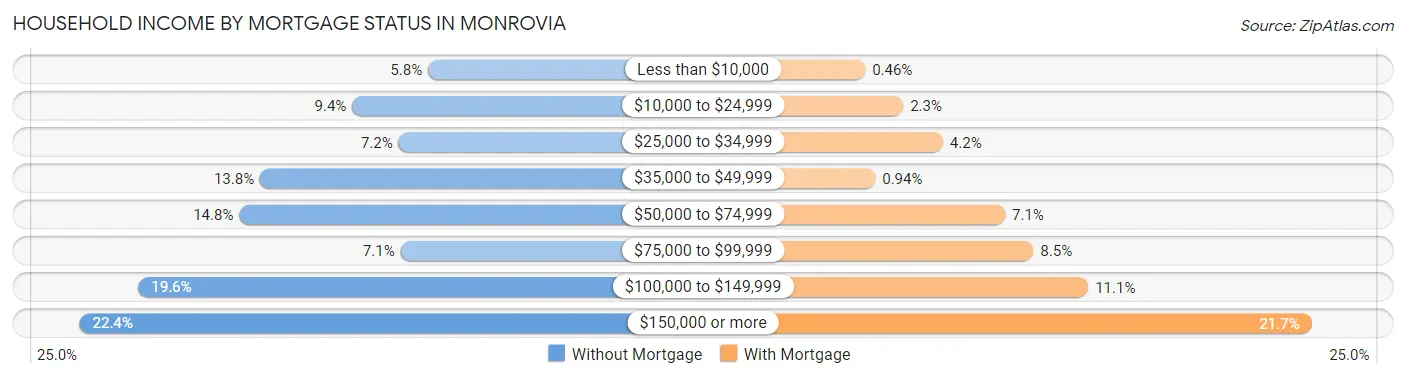
| Household Income | Without Mortgage | With Mortgage |
| Less than $10,000 | 128 (5.8%) | 19 (0.5%) |
| $10,000 to $24,999 | 208 (9.4%) | 94 (2.3%) |
| $25,000 to $34,999 | 159 (7.2%) | 172 (4.2%) |
| $35,000 to $49,999 | 305 (13.8%) | 39 (0.9%) |
| $50,000 to $74,999 | 327 (14.8%) | 294 (7.1%) |
| $75,000 to $99,999 | 157 (7.1%) | 350 (8.5%) |
| $100,000 to $149,999 | 433 (19.6%) | 458 (11.1%) |
| $150,000 or more | 495 (22.4%) | 897 (21.7%) |
| Total | 2,212 (100.0%) | 4,132 (100.0%) |
Property Value to Household Income Ratio in Monrovia
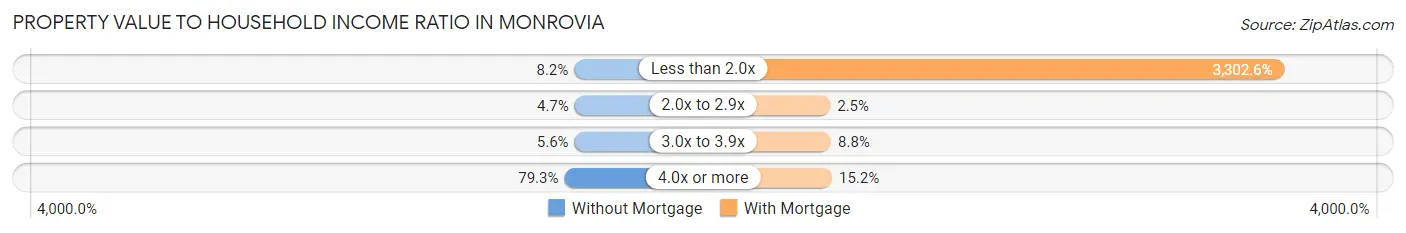
| Value-to-Income Ratio | Without Mortgage | With Mortgage |
| Less than 2.0x | 181 (8.2%) | 136,462 (3,302.6%) |
| 2.0x to 2.9x | 103 (4.7%) | 102 (2.5%) |
| 3.0x to 3.9x | 123 (5.6%) | 363 (8.8%) |
| 4.0x or more | 1,753 (79.2%) | 629 (15.2%) |
| Total | 2,212 (100.0%) | 4,132 (100.0%) |
Real Estate Taxes by Mortgage Status in Monrovia
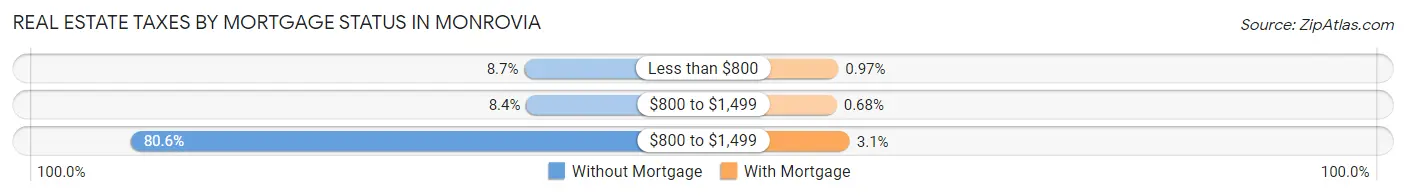
| Property Taxes | Without Mortgage | With Mortgage |
| Less than $800 | 193 (8.7%) | 40 (1.0%) |
| $800 to $1,499 | 185 (8.4%) | 28 (0.7%) |
| $800 to $1,499 | 1,783 (80.6%) | 127 (3.1%) |
| Total | 2,212 (100.0%) | 4,132 (100.0%) |
Health & Disability in Monrovia
Health Insurance Coverage by Age in Monrovia
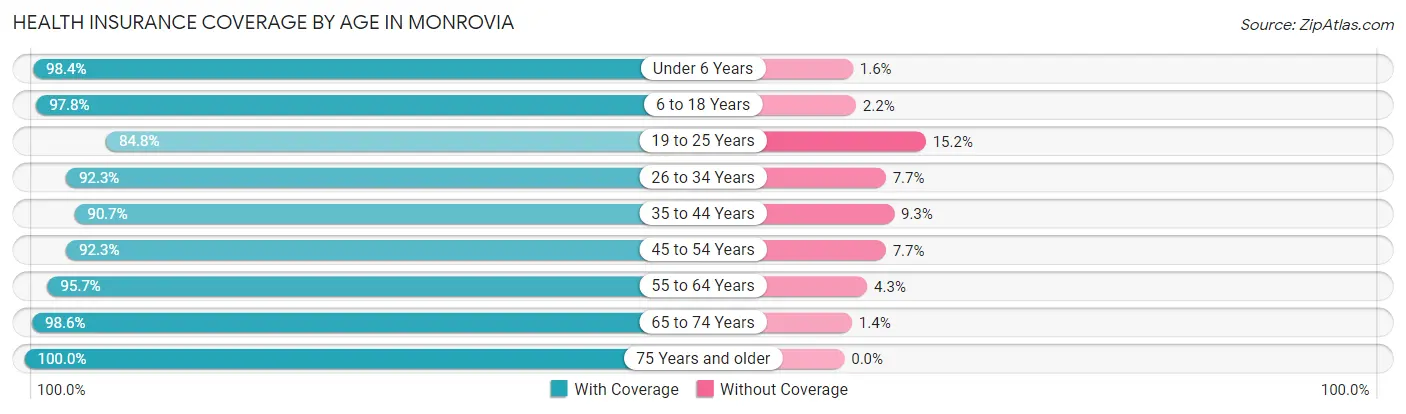
| Age Bracket | With Coverage | Without Coverage |
| Under 6 Years | 2,579 (98.4%) | 42 (1.6%) |
| 6 to 18 Years | 5,874 (97.8%) | 130 (2.2%) |
| 19 to 25 Years | 2,529 (84.8%) | 453 (15.2%) |
| 26 to 34 Years | 4,545 (92.3%) | 380 (7.7%) |
| 35 to 44 Years | 5,353 (90.7%) | 547 (9.3%) |
| 45 to 54 Years | 4,439 (92.3%) | 372 (7.7%) |
| 55 to 64 Years | 5,369 (95.7%) | 239 (4.3%) |
| 65 to 74 Years | 2,701 (98.6%) | 39 (1.4%) |
| 75 Years and older | 1,950 (100.0%) | 0 (0.0%) |
| Total | 35,339 (94.1%) | 2,202 (5.9%) |
Health Insurance Coverage by Citizenship Status in Monrovia
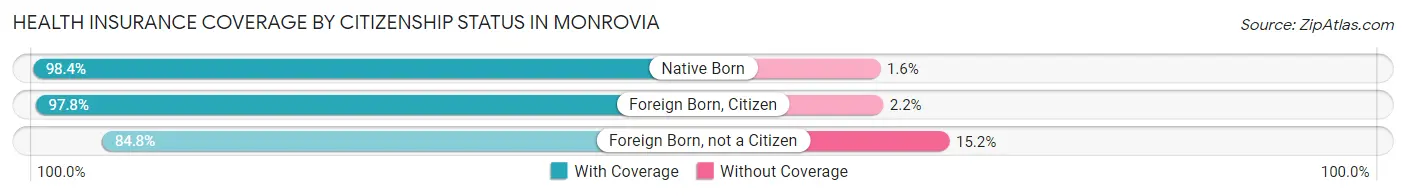
| Citizenship Status | With Coverage | Without Coverage |
| Native Born | 2,579 (98.4%) | 42 (1.6%) |
| Foreign Born, Citizen | 5,874 (97.8%) | 130 (2.2%) |
| Foreign Born, not a Citizen | 2,529 (84.8%) | 453 (15.2%) |
Health Insurance Coverage by Household Income in Monrovia
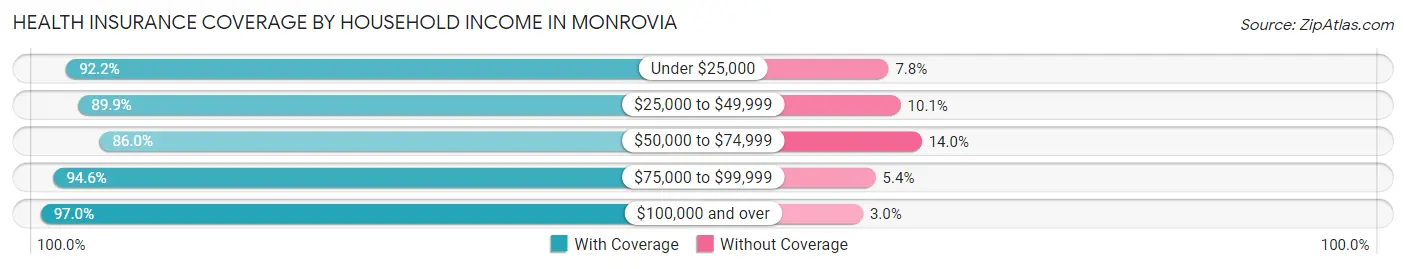
| Household Income | With Coverage | Without Coverage |
| Under $25,000 | 2,538 (92.2%) | 215 (7.8%) |
| $25,000 to $49,999 | 4,357 (89.9%) | 489 (10.1%) |
| $50,000 to $74,999 | 3,753 (86.0%) | 613 (14.0%) |
| $75,000 to $99,999 | 4,526 (94.6%) | 259 (5.4%) |
| $100,000 and over | 20,028 (97.0%) | 625 (3.0%) |
Public vs Private Health Insurance Coverage by Age in Monrovia
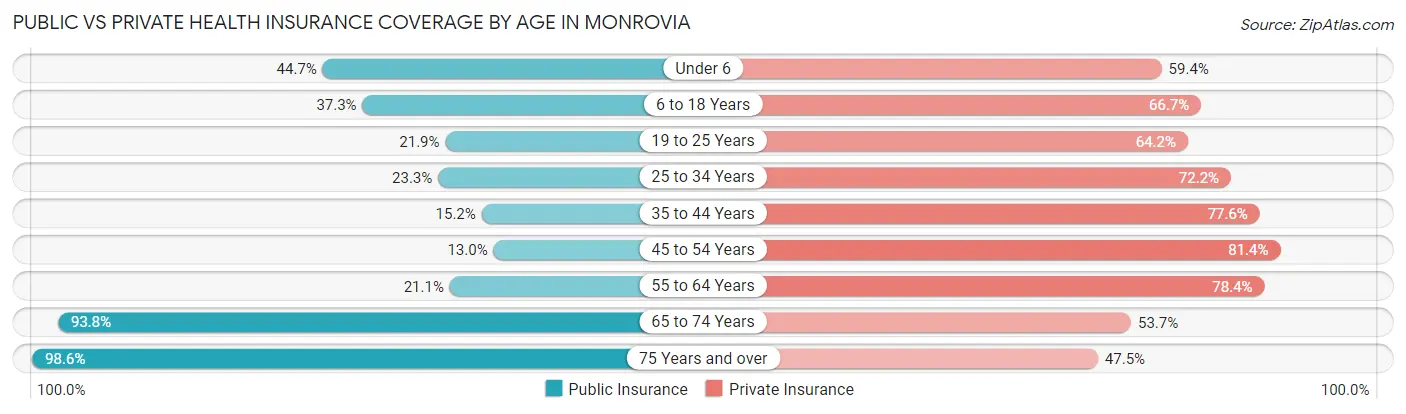
| Age Bracket | Public Insurance | Private Insurance |
| Under 6 | 1,171 (44.7%) | 1,556 (59.4%) |
| 6 to 18 Years | 2,239 (37.3%) | 4,004 (66.7%) |
| 19 to 25 Years | 653 (21.9%) | 1,915 (64.2%) |
| 25 to 34 Years | 1,145 (23.3%) | 3,557 (72.2%) |
| 35 to 44 Years | 895 (15.2%) | 4,576 (77.6%) |
| 45 to 54 Years | 624 (13.0%) | 3,915 (81.4%) |
| 55 to 64 Years | 1,183 (21.1%) | 4,399 (78.4%) |
| 65 to 74 Years | 2,571 (93.8%) | 1,471 (53.7%) |
| 75 Years and over | 1,923 (98.6%) | 927 (47.5%) |
| Total | 12,404 (33.0%) | 26,320 (70.1%) |
Disability Status by Sex by Age in Monrovia
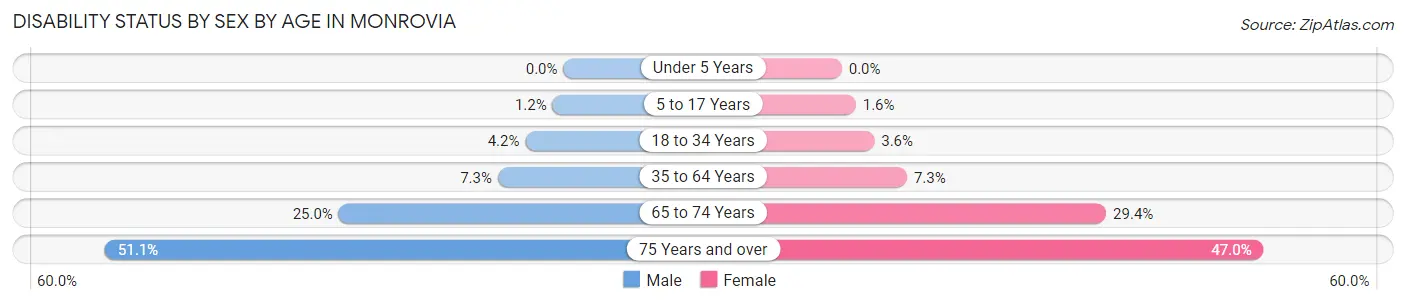
| Age Bracket | Male | Female |
| Under 5 Years | 0 (0.0%) | 0 (0.0%) |
| 5 to 17 Years | 40 (1.2%) | 45 (1.6%) |
| 18 to 34 Years | 178 (4.2%) | 148 (3.6%) |
| 35 to 64 Years | 566 (7.3%) | 622 (7.3%) |
| 65 to 74 Years | 309 (25.0%) | 443 (29.4%) |
| 75 Years and over | 365 (51.0%) | 580 (47.0%) |
Disability Class by Sex by Age in Monrovia
Disability Class: Hearing Difficulty
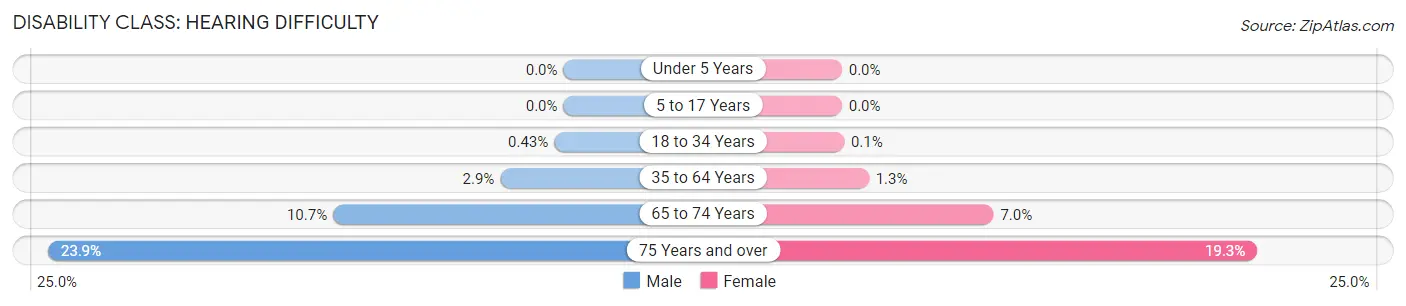
| Age Bracket | Male | Female |
| Under 5 Years | 0 (0.0%) | 0 (0.0%) |
| 5 to 17 Years | 0 (0.0%) | 0 (0.0%) |
| 18 to 34 Years | 18 (0.4%) | 4 (0.1%) |
| 35 to 64 Years | 227 (2.9%) | 107 (1.3%) |
| 65 to 74 Years | 132 (10.7%) | 106 (7.0%) |
| 75 Years and over | 171 (23.9%) | 238 (19.3%) |
Disability Class: Vision Difficulty
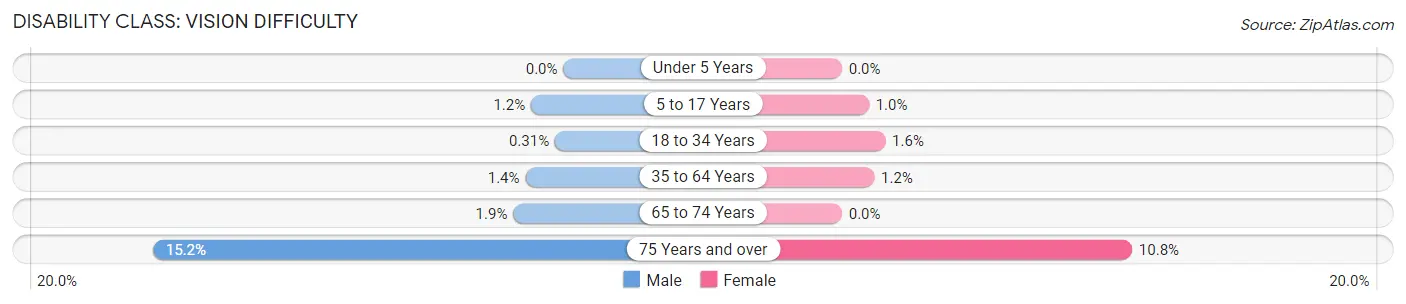
| Age Bracket | Male | Female |
| Under 5 Years | 0 (0.0%) | 0 (0.0%) |
| 5 to 17 Years | 40 (1.2%) | 29 (1.0%) |
| 18 to 34 Years | 13 (0.3%) | 66 (1.6%) |
| 35 to 64 Years | 109 (1.4%) | 103 (1.2%) |
| 65 to 74 Years | 23 (1.9%) | 0 (0.0%) |
| 75 Years and over | 109 (15.2%) | 133 (10.8%) |
Disability Class: Cognitive Difficulty
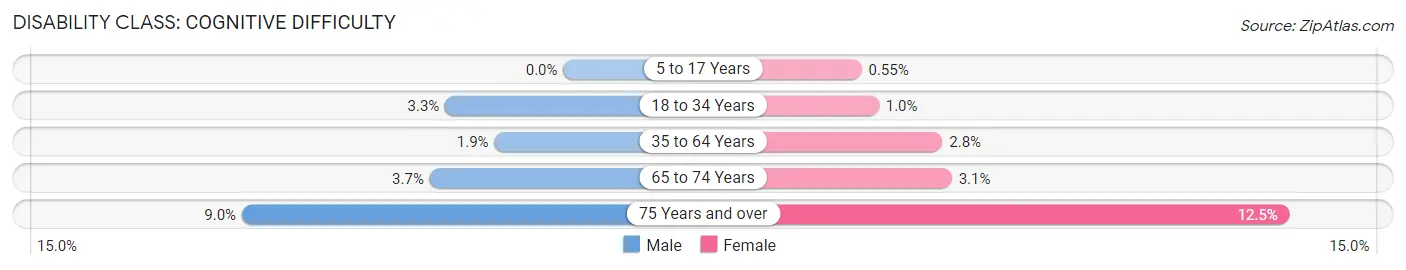
| Age Bracket | Male | Female |
| 5 to 17 Years | 0 (0.0%) | 16 (0.5%) |
| 18 to 34 Years | 138 (3.3%) | 42 (1.0%) |
| 35 to 64 Years | 149 (1.9%) | 240 (2.8%) |
| 65 to 74 Years | 46 (3.7%) | 46 (3.1%) |
| 75 Years and over | 64 (8.9%) | 154 (12.5%) |
Disability Class: Ambulatory Difficulty
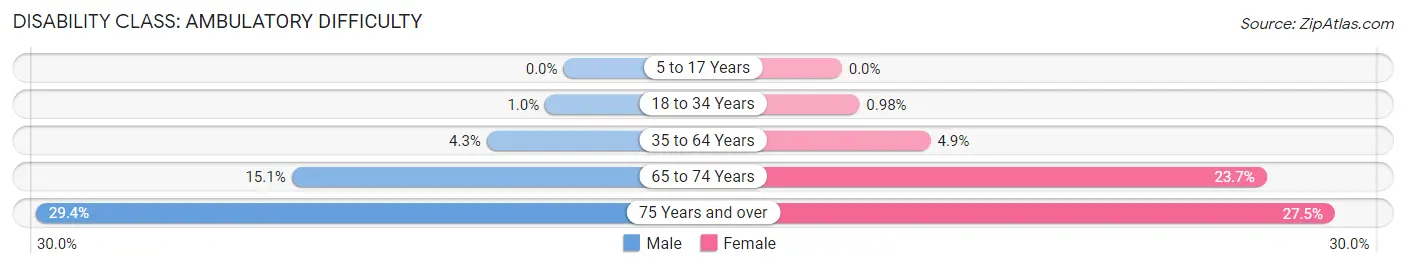
| Age Bracket | Male | Female |
| 5 to 17 Years | 0 (0.0%) | 0 (0.0%) |
| 18 to 34 Years | 43 (1.0%) | 40 (1.0%) |
| 35 to 64 Years | 331 (4.3%) | 423 (4.9%) |
| 65 to 74 Years | 187 (15.1%) | 356 (23.6%) |
| 75 Years and over | 210 (29.4%) | 339 (27.5%) |
Disability Class: Self-Care Difficulty
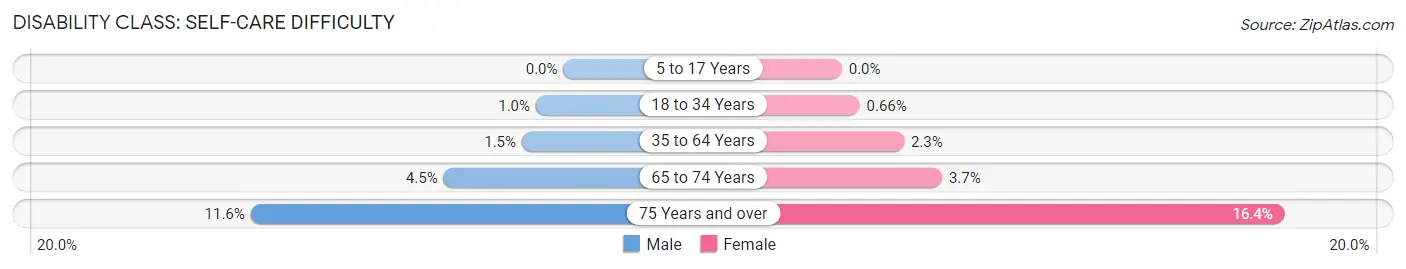
| Age Bracket | Male | Female |
| 5 to 17 Years | 0 (0.0%) | 0 (0.0%) |
| 18 to 34 Years | 43 (1.0%) | 27 (0.7%) |
| 35 to 64 Years | 119 (1.5%) | 198 (2.3%) |
| 65 to 74 Years | 55 (4.4%) | 56 (3.7%) |
| 75 Years and over | 83 (11.6%) | 203 (16.4%) |
Technology Access in Monrovia
Computing Device Access in Monrovia
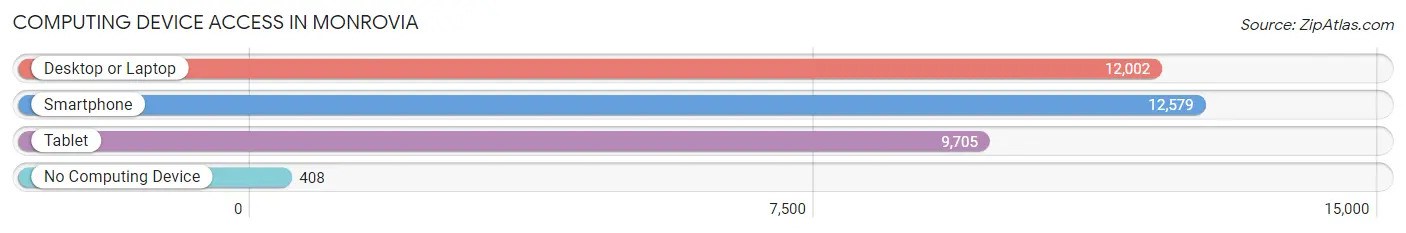
| Device Type | # Households | % Households |
| Desktop or Laptop | 12,002 | 88.5% |
| Smartphone | 12,579 | 92.8% |
| Tablet | 9,705 | 71.6% |
| No Computing Device | 408 | 3.0% |
| Total | 13,560 | 100.0% |
Internet Access in Monrovia
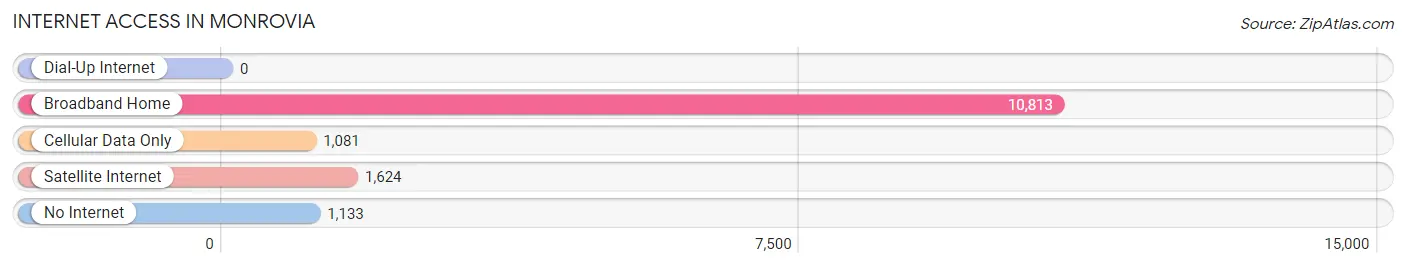
| Internet Type | # Households | % Households |
| Dial-Up Internet | 0 | 0.0% |
| Broadband Home | 10,813 | 79.7% |
| Cellular Data Only | 1,081 | 8.0% |
| Satellite Internet | 1,624 | 12.0% |
| No Internet | 1,133 | 8.4% |
| Total | 13,560 | 100.0% |
Monrovia Summary
Monrovia is a city located in the San Gabriel Valley of Los Angeles County, California. It is situated in the foothills of the San Gabriel Mountains, approximately 10 miles northeast of downtown Los Angeles. The city is home to over 37,000 people and is known for its small-town charm and historic downtown area.
History
Monrovia was founded in 1887 by two brothers, William and George Monroe, who named the city after their hometown of Monrovia, Indiana. The brothers purchased 6,600 acres of land from the Rancho Azusa de Duarte and began to develop the area. The city was incorporated in 1887 and quickly grew due to its proximity to Los Angeles. By the early 1900s, Monrovia had become a popular destination for tourists and was known for its citrus groves and beautiful mountain views.
In the 1920s, Monrovia experienced a period of rapid growth and development. The city was home to several movie studios, including the Monrovia Motion Picture Company, which produced silent films. The city also became a popular destination for celebrities, including Charlie Chaplin, who owned a home in Monrovia.
Geography
Monrovia is located in the San Gabriel Valley of Los Angeles County, California. It is situated in the foothills of the San Gabriel Mountains, approximately 10 miles northeast of downtown Los Angeles. The city covers an area of 8.7 square miles and is bordered by the cities of Arcadia, Duarte, and Bradbury.
The city is divided into several distinct neighborhoods, including Old Town Monrovia, which is the city’s historic downtown area. Other neighborhoods include Mayflower Village, Monrovia Canyon, and the Monrovia Hills.
Economy
Monrovia’s economy is largely based on the service industry, with many residents employed in retail, healthcare, and education. The city is also home to several corporate headquarters, including the headquarters of the Monrovia Unified School District and the Monrovia Fire Department.
The city is also home to several major employers, including the Monrovia Unified School District, the Monrovia Fire Department, and the Monrovia Memorial Hospital.
Demographics
As of the 2010 census, Monrovia had a population of 37,064. The racial makeup of the city was 57.2% White, 11.3% African American, 0.7% Native American, 16.3% Asian, 0.2% Pacific Islander, and 14.3% from other races. Hispanic or Latino of any race were 33.2% of the population.
The median household income in Monrovia was $60,945, and the median family income was $71,945. The per capita income for the city was $27,945.
Monrovia is a diverse city, with a variety of cultures and religions represented. The city is home to a large population of immigrants from Mexico, El Salvador, and other Latin American countries. The city also has a large population of Asian Americans, including Chinese, Filipino, and Korean Americans.
Common Questions
What is Per Capita Income in Monrovia?
Per Capita income in Monrovia is $44,566.
What is the Median Family Income in Monrovia?
Median Family Income in Monrovia is $107,188.
What is the Median Household income in Monrovia?
Median Household Income in Monrovia is $93,827.
What is Income or Wage Gap in Monrovia?
Income or Wage Gap in Monrovia is 8.7%.
Women in Monrovia earn 91.3 cents for every dollar earned by a man.
What is Inequality or Gini Index in Monrovia?
Inequality or Gini Index in Monrovia is 0.44.
What is the Total Population of Monrovia?
Total Population of Monrovia is 37,656.
What is the Total Male Population of Monrovia?
Total Male Population of Monrovia is 18,360.
What is the Total Female Population of Monrovia?
Total Female Population of Monrovia is 19,296.
What is the Ratio of Males per 100 Females in Monrovia?
There are 95.15 Males per 100 Females in Monrovia.
What is the Ratio of Females per 100 Males in Monrovia?
There are 105.10 Females per 100 Males in Monrovia.
What is the Median Population Age in Monrovia?
Median Population Age in Monrovia is 38.2 Years.
What is the Average Family Size in Monrovia
Average Family Size in Monrovia is 3.4 People.
What is the Average Household Size in Monrovia
Average Household Size in Monrovia is 2.8 People.
How Large is the Labor Force in Monrovia?
There are 20,682 People in the Labor Forcein in Monrovia.
What is the Percentage of People in the Labor Force in Monrovia?
68.0% of People are in the Labor Force in Monrovia.
What is the Unemployment Rate in Monrovia?
Unemployment Rate in Monrovia is 5.8%.