Uniondale, NY Map & Demographics
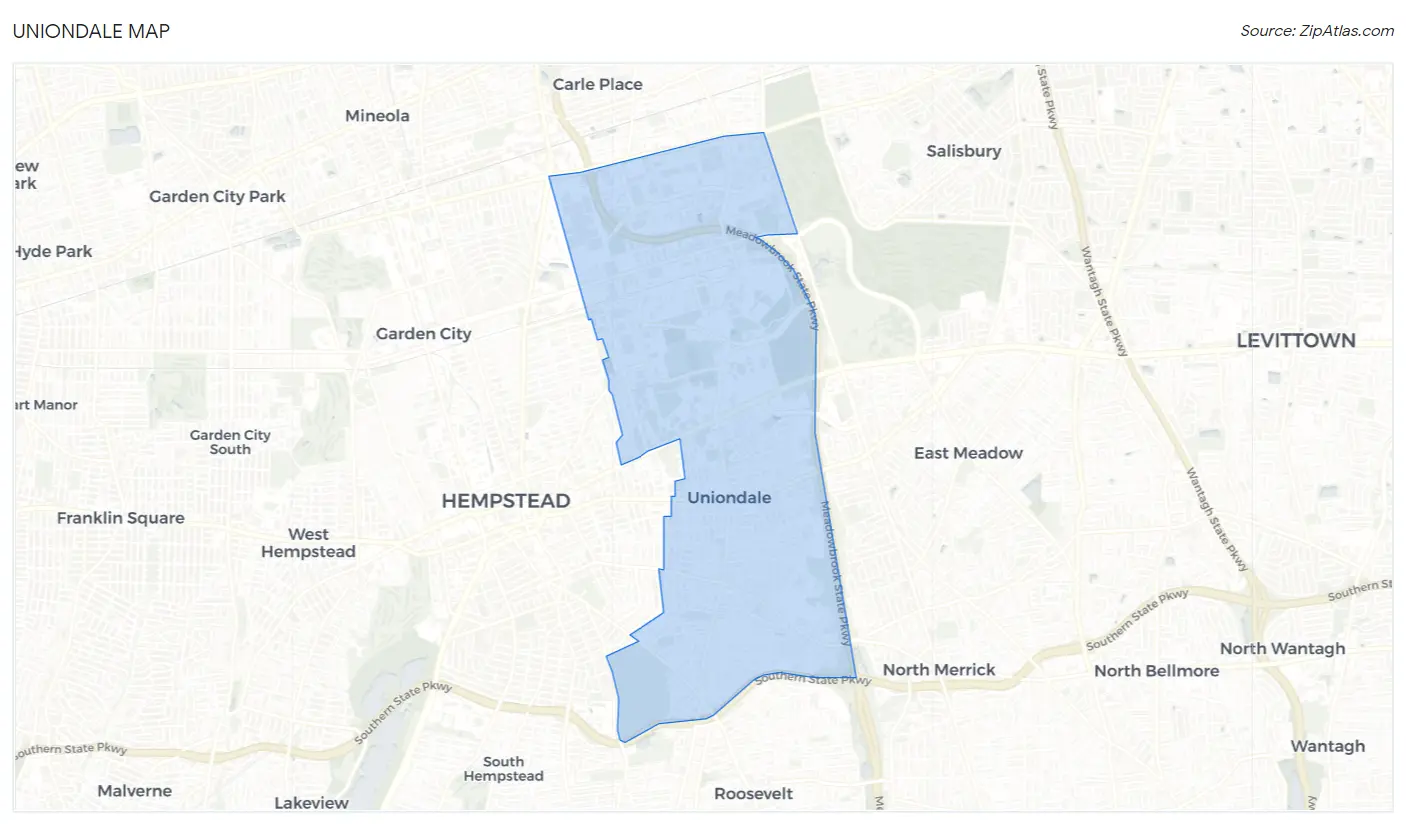
Uniondale Map
Uniondale Overview
$35,429
PER CAPITA INCOME
$114,083
AVG FAMILY INCOME
$107,885
AVG HOUSEHOLD INCOME
44.6%
WAGE / INCOME GAP [ % ]
55.4¢/ $1
WAGE / INCOME GAP [ $ ]
0.43
INEQUALITY / GINI INDEX
33,192
TOTAL POPULATION
15,841
MALE POPULATION
17,351
FEMALE POPULATION
91.30
MALES / 100 FEMALES
109.53
FEMALES / 100 MALES
34.9
MEDIAN AGE
3.7
AVG FAMILY SIZE
3.4
AVG HOUSEHOLD SIZE
16,496
LABOR FORCE [ PEOPLE ]
59.9%
PERCENT IN LABOR FORCE
6.4%
UNEMPLOYMENT RATE
Uniondale Zip Codes
Uniondale Area Codes
Income in Uniondale
Income Overview in Uniondale
Per Capita Income in Uniondale is $35,429, while median incomes of families and households are $114,083 and $107,885 respectively.
| Characteristic | Number | Measure |
| Per Capita Income | 33,192 | $35,429 |
| Median Family Income | 6,418 | $114,083 |
| Mean Family Income | 6,418 | $137,697 |
| Median Household Income | 8,696 | $107,885 |
| Mean Household Income | 8,696 | $131,189 |
| Income Deficit | 6,418 | $0 |
| Wage / Income Gap (%) | 33,192 | 44.62% |
| Wage / Income Gap ($) | 33,192 | 55.38¢ per $1 |
| Gini / Inequality Index | 33,192 | 0.43 |
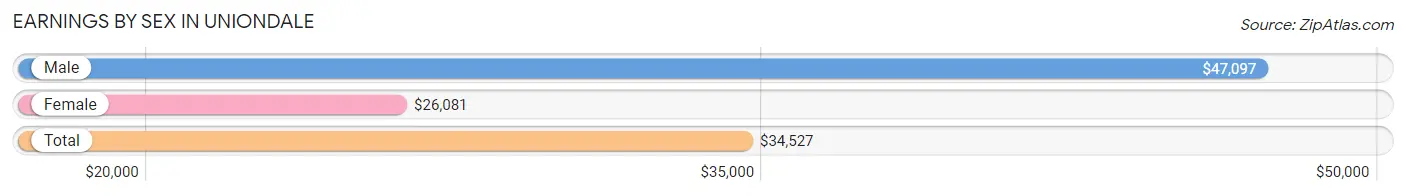
Earnings by Sex in Uniondale
Average Earnings in Uniondale are $34,527, $47,097 for men and $26,081 for women, a difference of 44.6%.
| Sex | Number | Average Earnings |
| Male | 8,982 (50.7%) | $47,097 |
| Female | 8,745 (49.3%) | $26,081 |
| Total | 17,727 (100.0%) | $34,527 |
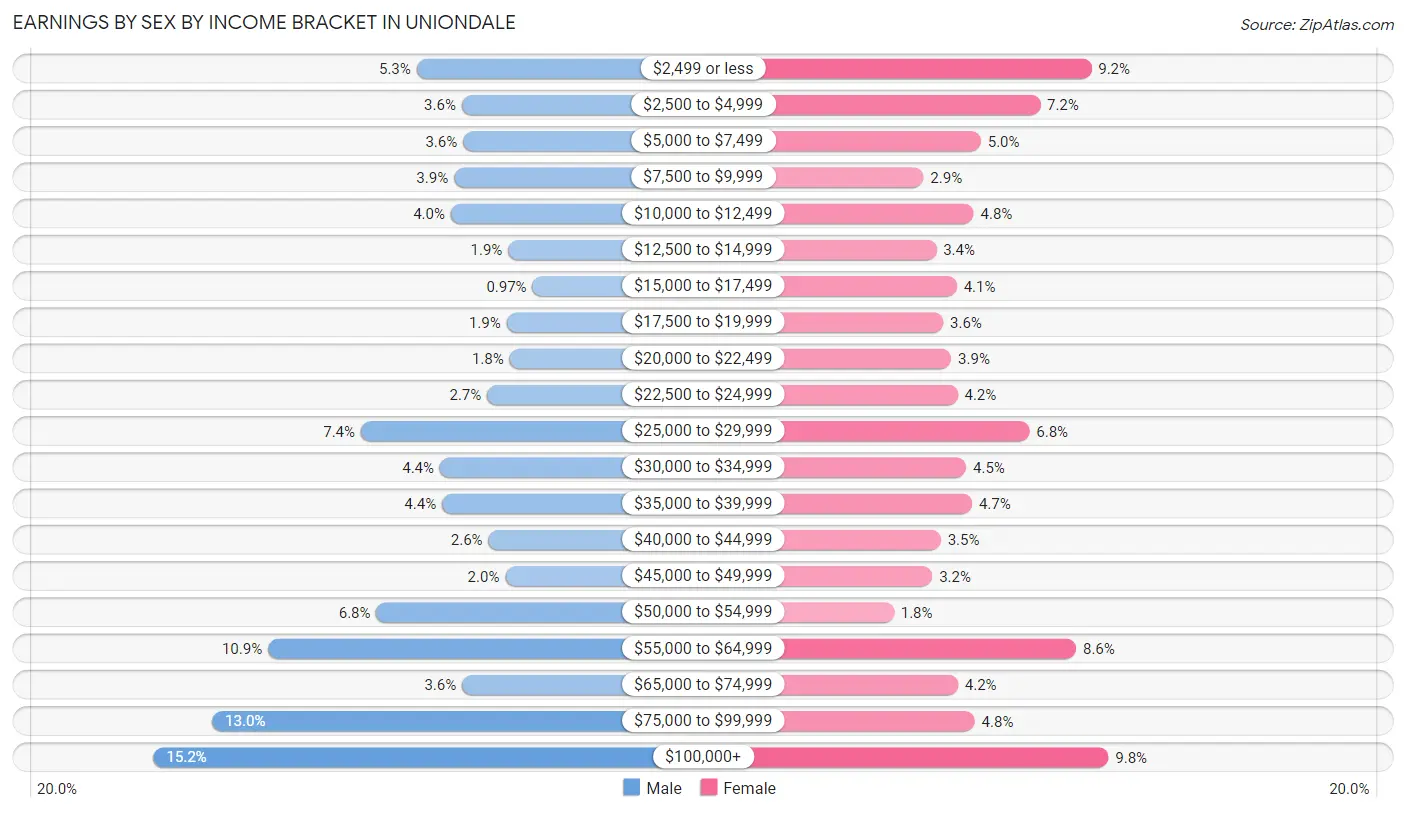
Earnings by Sex by Income Bracket in Uniondale
The most common earnings brackets in Uniondale are $100,000+ for men (1,363 | 15.2%) and $100,000+ for women (857 | 9.8%).
| Income | Male | Female |
| $2,499 or less | 477 (5.3%) | 801 (9.2%) |
| $2,500 to $4,999 | 325 (3.6%) | 633 (7.2%) |
| $5,000 to $7,499 | 321 (3.6%) | 439 (5.0%) |
| $7,500 to $9,999 | 351 (3.9%) | 251 (2.9%) |
| $10,000 to $12,499 | 362 (4.0%) | 415 (4.8%) |
| $12,500 to $14,999 | 169 (1.9%) | 293 (3.4%) |
| $15,000 to $17,499 | 87 (1.0%) | 360 (4.1%) |
| $17,500 to $19,999 | 174 (1.9%) | 316 (3.6%) |
| $20,000 to $22,499 | 164 (1.8%) | 342 (3.9%) |
| $22,500 to $24,999 | 240 (2.7%) | 363 (4.2%) |
| $25,000 to $29,999 | 665 (7.4%) | 598 (6.8%) |
| $30,000 to $34,999 | 399 (4.4%) | 391 (4.5%) |
| $35,000 to $39,999 | 392 (4.4%) | 410 (4.7%) |
| $40,000 to $44,999 | 235 (2.6%) | 308 (3.5%) |
| $45,000 to $49,999 | 179 (2.0%) | 280 (3.2%) |
| $50,000 to $54,999 | 613 (6.8%) | 154 (1.8%) |
| $55,000 to $64,999 | 977 (10.9%) | 751 (8.6%) |
| $65,000 to $74,999 | 324 (3.6%) | 364 (4.2%) |
| $75,000 to $99,999 | 1,165 (13.0%) | 419 (4.8%) |
| $100,000+ | 1,363 (15.2%) | 857 (9.8%) |
| Total | 8,982 (100.0%) | 8,745 (100.0%) |
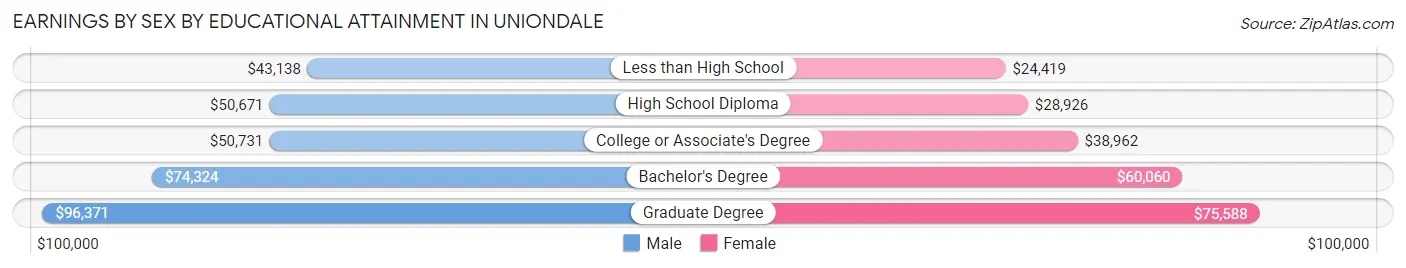
Earnings by Sex by Educational Attainment in Uniondale
Average earnings in Uniondale are $56,321 for men and $38,224 for women, a difference of 32.1%. Men with an educational attainment of graduate degree enjoy the highest average annual earnings of $96,371, while those with less than high school education earn the least with $43,138. Women with an educational attainment of graduate degree earn the most with the average annual earnings of $75,588, while those with less than high school education have the smallest earnings of $24,419.
| Educational Attainment | Male Income | Female Income |
| Less than High School | $43,138 | $24,419 |
| High School Diploma | $50,671 | $28,926 |
| College or Associate's Degree | $50,731 | $38,962 |
| Bachelor's Degree | $74,324 | $60,060 |
| Graduate Degree | $96,371 | $75,588 |
| Total | $56,321 | $38,224 |
Family Income in Uniondale
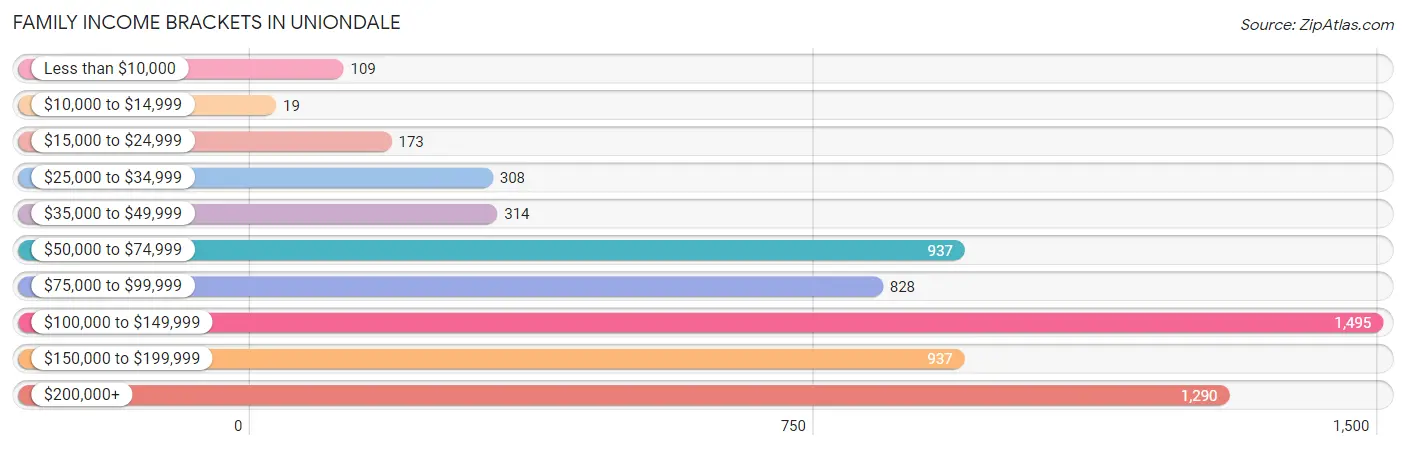
Family Income Brackets in Uniondale
According to the Uniondale family income data, there are 1,495 families falling into the $100,000 to $149,999 income range, which is the most common income bracket and makes up 23.3% of all families. Conversely, the $10,000 to $14,999 income bracket is the least frequent group with only 19 families (0.3%) belonging to this category.
| Income Bracket | # Families | % Families |
| Less than $10,000 | 109 | 1.7% |
| $10,000 to $14,999 | 19 | 0.3% |
| $15,000 to $24,999 | 173 | 2.7% |
| $25,000 to $34,999 | 308 | 4.8% |
| $35,000 to $49,999 | 314 | 4.9% |
| $50,000 to $74,999 | 937 | 14.6% |
| $75,000 to $99,999 | 828 | 12.9% |
| $100,000 to $149,999 | 1,495 | 23.3% |
| $150,000 to $199,999 | 937 | 14.6% |
| $200,000+ | 1,290 | 20.1% |
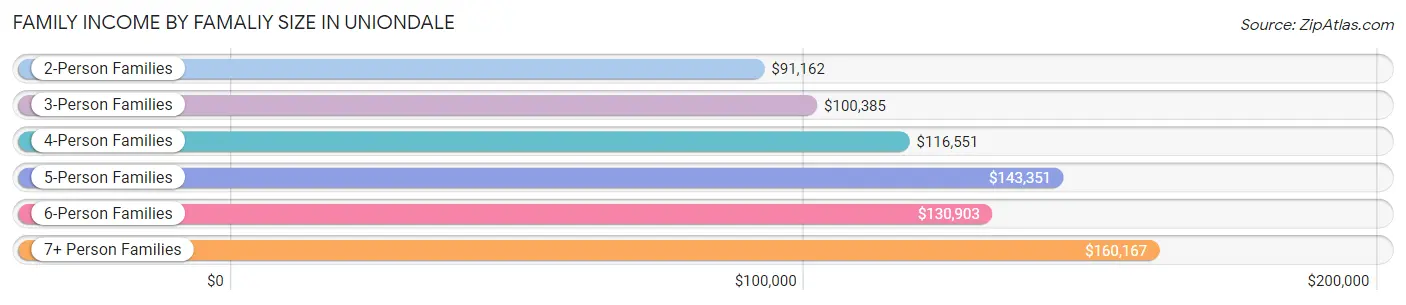
Family Income by Famaliy Size in Uniondale
7+ person families (564 | 8.8%) account for the highest median family income in Uniondale with $160,167 per family, while 2-person families (2,084 | 32.5%) have the highest median income of $45,581 per family member.
| Income Bracket | # Families | Median Income |
| 2-Person Families | 2,084 (32.5%) | $91,162 |
| 3-Person Families | 1,216 (19.0%) | $100,385 |
| 4-Person Families | 1,453 (22.6%) | $116,551 |
| 5-Person Families | 750 (11.7%) | $143,351 |
| 6-Person Families | 351 (5.5%) | $130,903 |
| 7+ Person Families | 564 (8.8%) | $160,167 |
| Total | 6,418 (100.0%) | $114,083 |
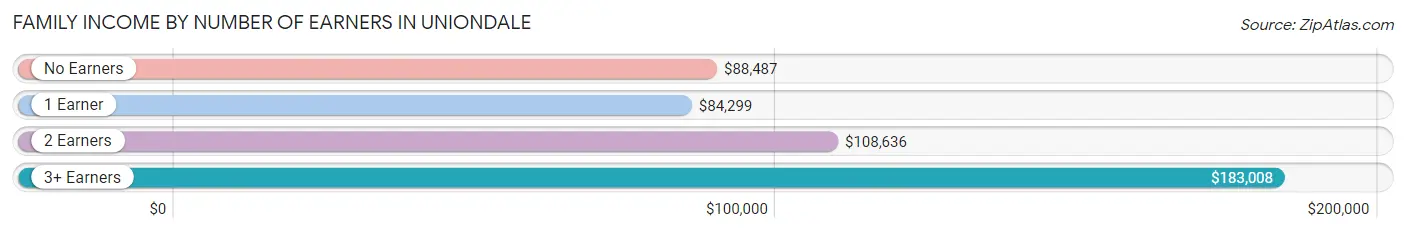
Family Income by Number of Earners in Uniondale
The median family income in Uniondale is $114,083, with families comprising 3+ earners (1,712) having the highest median family income of $183,008, while families with 1 earner (1,631) have the lowest median family income of $84,299, accounting for 26.7% and 25.4% of families, respectively.
| Number of Earners | # Families | Median Income |
| No Earners | 723 (11.3%) | $88,487 |
| 1 Earner | 1,631 (25.4%) | $84,299 |
| 2 Earners | 2,352 (36.6%) | $108,636 |
| 3+ Earners | 1,712 (26.7%) | $183,008 |
| Total | 6,418 (100.0%) | $114,083 |
Household Income in Uniondale
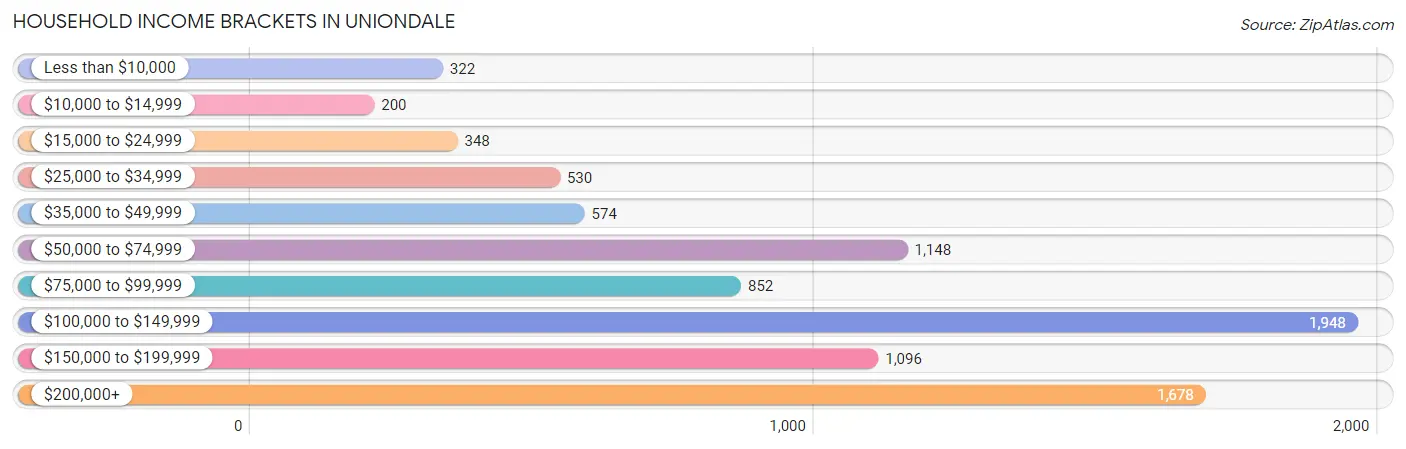
Household Income Brackets in Uniondale
With 1,948 households falling in the category, the $100,000 to $149,999 income range is the most frequent in Uniondale, accounting for 22.4% of all households. In contrast, only 200 households (2.3%) fall into the $10,000 to $14,999 income bracket, making it the least populous group.
| Income Bracket | # Households | % Households |
| Less than $10,000 | 322 | 3.7% |
| $10,000 to $14,999 | 200 | 2.3% |
| $15,000 to $24,999 | 348 | 4.0% |
| $25,000 to $34,999 | 530 | 6.1% |
| $35,000 to $49,999 | 574 | 6.6% |
| $50,000 to $74,999 | 1,148 | 13.2% |
| $75,000 to $99,999 | 852 | 9.8% |
| $100,000 to $149,999 | 1,948 | 22.4% |
| $150,000 to $199,999 | 1,096 | 12.6% |
| $200,000+ | 1,678 | 19.3% |
Household Income by Householder Age in Uniondale
The median household income in Uniondale is $107,885, with the highest median household income of $123,173 found in the 45 to 64 years age bracket for the primary householder. A total of 3,076 households (35.4%) fall into this category. Meanwhile, the 15 to 24 years age bracket for the primary householder has the lowest median household income of $40,833, with 284 households (3.3%) in this group.
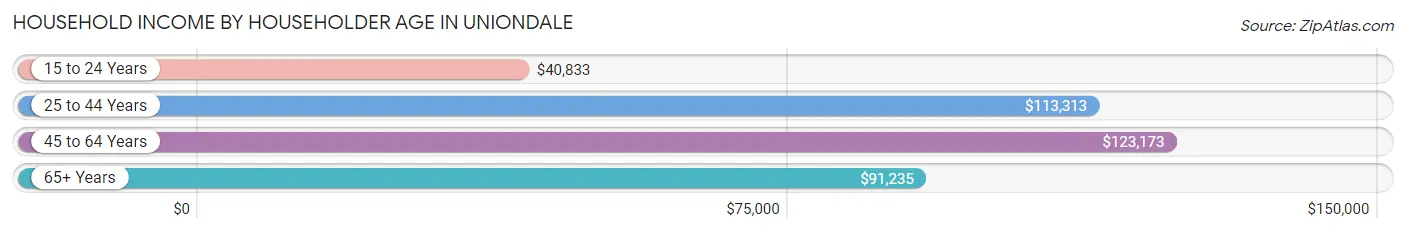
| Income Bracket | # Households | Median Income |
| 15 to 24 Years | 284 (3.3%) | $40,833 |
| 25 to 44 Years | 2,262 (26.0%) | $113,313 |
| 45 to 64 Years | 3,076 (35.4%) | $123,173 |
| 65+ Years | 3,074 (35.3%) | $91,235 |
| Total | 8,696 (100.0%) | $107,885 |
Poverty in Uniondale
Income Below Poverty by Sex and Age in Uniondale
With 8.2% poverty level for males and 10.4% for females among the residents of Uniondale, 18 to 24 year old males and 18 to 24 year old females are the most vulnerable to poverty, with 346 males (27.2%) and 434 females (28.4%) in their respective age groups living below the poverty level.
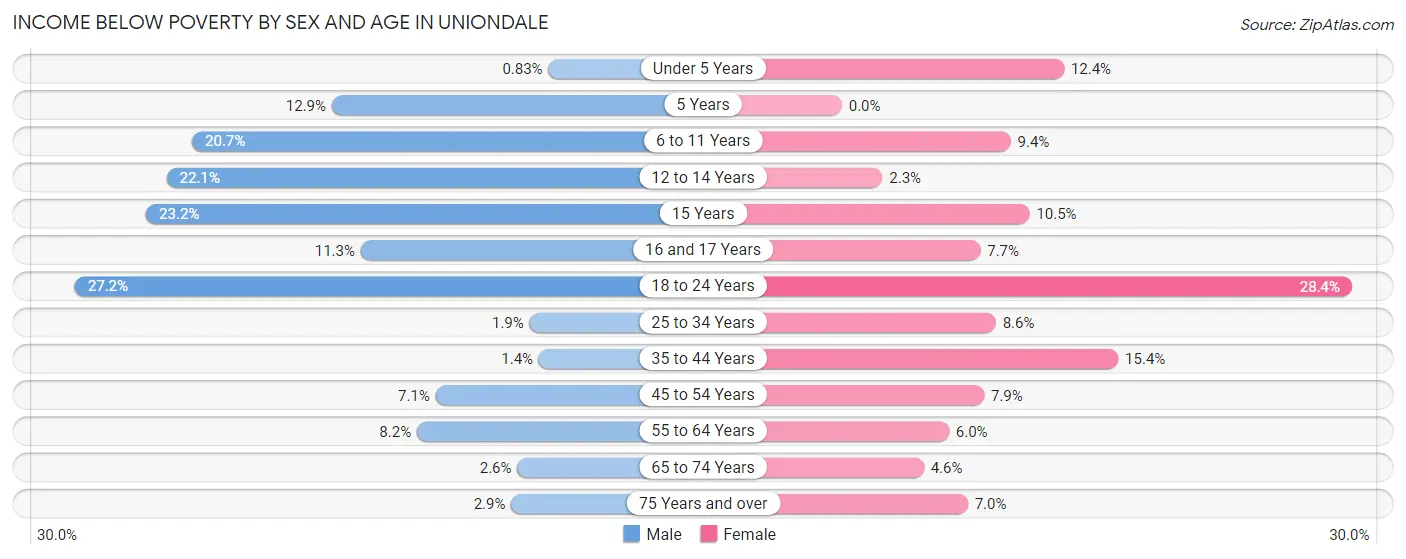
| Age Bracket | Male | Female |
| Under 5 Years | 7 (0.8%) | 108 (12.4%) |
| 5 Years | 25 (12.9%) | 0 (0.0%) |
| 6 to 11 Years | 203 (20.7%) | 80 (9.4%) |
| 12 to 14 Years | 114 (22.1%) | 10 (2.3%) |
| 15 Years | 23 (23.2%) | 7 (10.4%) |
| 16 and 17 Years | 45 (11.3%) | 32 (7.7%) |
| 18 to 24 Years | 346 (27.2%) | 434 (28.4%) |
| 25 to 34 Years | 38 (1.9%) | 197 (8.6%) |
| 35 to 44 Years | 28 (1.4%) | 258 (15.4%) |
| 45 to 54 Years | 148 (7.1%) | 134 (7.9%) |
| 55 to 64 Years | 124 (8.2%) | 100 (6.0%) |
| 65 to 74 Years | 30 (2.6%) | 80 (4.6%) |
| 75 Years and over | 25 (2.9%) | 98 (7.0%) |
| Total | 1,156 (8.2%) | 1,538 (10.4%) |
Income Above Poverty by Sex and Age in Uniondale
According to the poverty statistics in Uniondale, males aged under 5 years and females aged 5 years are the age groups that are most secure financially, with 99.2% of males and 100.0% of females in these age groups living above the poverty line.
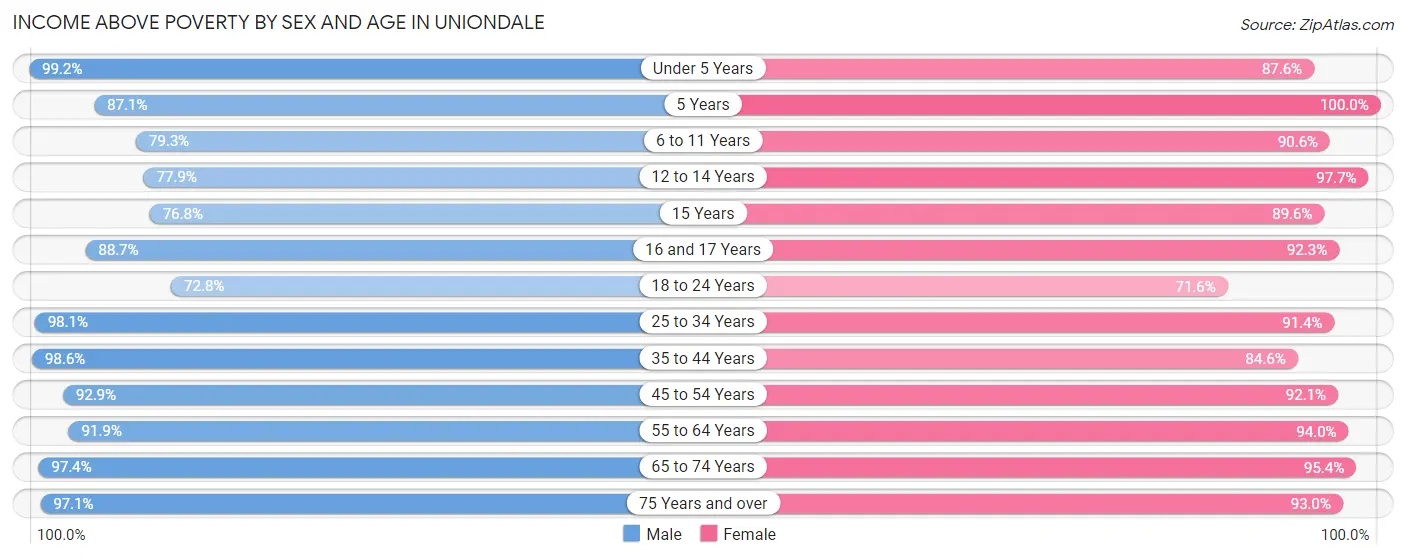
| Age Bracket | Male | Female |
| Under 5 Years | 835 (99.2%) | 765 (87.6%) |
| 5 Years | 169 (87.1%) | 98 (100.0%) |
| 6 to 11 Years | 779 (79.3%) | 771 (90.6%) |
| 12 to 14 Years | 402 (77.9%) | 432 (97.7%) |
| 15 Years | 76 (76.8%) | 60 (89.5%) |
| 16 and 17 Years | 354 (88.7%) | 383 (92.3%) |
| 18 to 24 Years | 926 (72.8%) | 1,094 (71.6%) |
| 25 to 34 Years | 1,984 (98.1%) | 2,103 (91.4%) |
| 35 to 44 Years | 2,037 (98.6%) | 1,418 (84.6%) |
| 45 to 54 Years | 1,934 (92.9%) | 1,558 (92.1%) |
| 55 to 64 Years | 1,398 (91.8%) | 1,579 (94.0%) |
| 65 to 74 Years | 1,144 (97.4%) | 1,674 (95.4%) |
| 75 Years and over | 838 (97.1%) | 1,301 (93.0%) |
| Total | 12,876 (91.8%) | 13,236 (89.6%) |
Income Below Poverty Among Married-Couple Families in Uniondale
The poverty statistics for married-couple families in Uniondale show that 1.4% or 54 of the total 3,882 families live below the poverty line. Families with 3 or 4 children have the highest poverty rate of 3.7%, comprising of 13 families. On the other hand, families with 5 or more children have the lowest poverty rate of 0.0%, which includes 0 families.
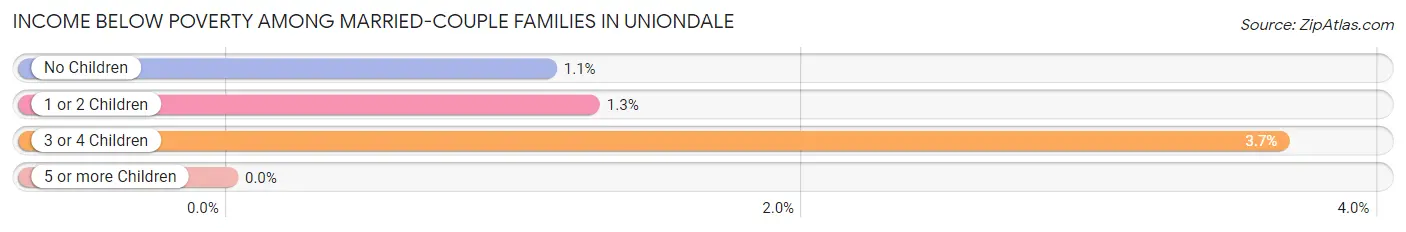
| Children | Above Poverty | Below Poverty |
| No Children | 1,965 (98.9%) | 22 (1.1%) |
| 1 or 2 Children | 1,486 (98.7%) | 19 (1.3%) |
| 3 or 4 Children | 342 (96.3%) | 13 (3.7%) |
| 5 or more Children | 35 (100.0%) | 0 (0.0%) |
| Total | 3,828 (98.6%) | 54 (1.4%) |
Income Below Poverty Among Single-Parent Households in Uniondale
According to the poverty data in Uniondale, 2.6% or 27 single-father households and 13.6% or 206 single-mother households are living below the poverty line. Among single-father households, those with no children have the highest poverty rate, with 19 households (3.3%) experiencing poverty. Likewise, among single-mother households, those with 5 or more children have the highest poverty rate, with 26 households (100.0%) falling below the poverty line.
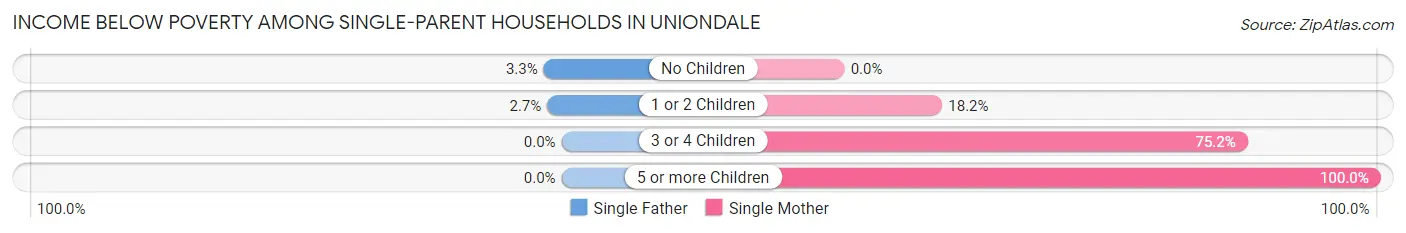
| Children | Single Father | Single Mother |
| No Children | 19 (3.3%) | 0 (0.0%) |
| 1 or 2 Children | 8 (2.7%) | 95 (18.2%) |
| 3 or 4 Children | 0 (0.0%) | 85 (75.2%) |
| 5 or more Children | 0 (0.0%) | 26 (100.0%) |
| Total | 27 (2.6%) | 206 (13.6%) |
Income Below Poverty Among Married-Couple vs Single-Parent Households in Uniondale
The poverty data for Uniondale shows that 54 of the married-couple family households (1.4%) and 233 of the single-parent households (9.2%) are living below the poverty level. Within the married-couple family households, those with 3 or 4 children have the highest poverty rate, with 13 households (3.7%) falling below the poverty line. Among the single-parent households, those with 5 or more children have the highest poverty rate, with 26 household (100.0%) living below poverty.
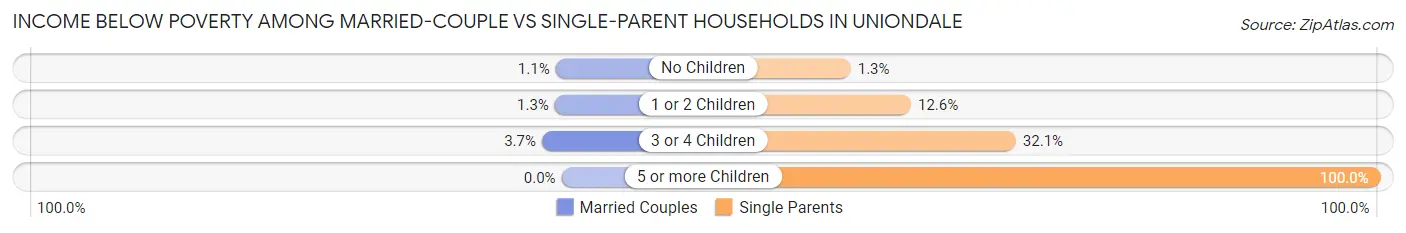
| Children | Married-Couple Families | Single-Parent Households |
| No Children | 22 (1.1%) | 19 (1.3%) |
| 1 or 2 Children | 19 (1.3%) | 103 (12.6%) |
| 3 or 4 Children | 13 (3.7%) | 85 (32.1%) |
| 5 or more Children | 0 (0.0%) | 26 (100.0%) |
| Total | 54 (1.4%) | 233 (9.2%) |
Race in Uniondale
The most populous races in Uniondale are Hispanic or Latino (13,384 | 40.3%), Black / African American (12,063 | 36.3%), and White / Caucasian (11,239 | 33.9%).
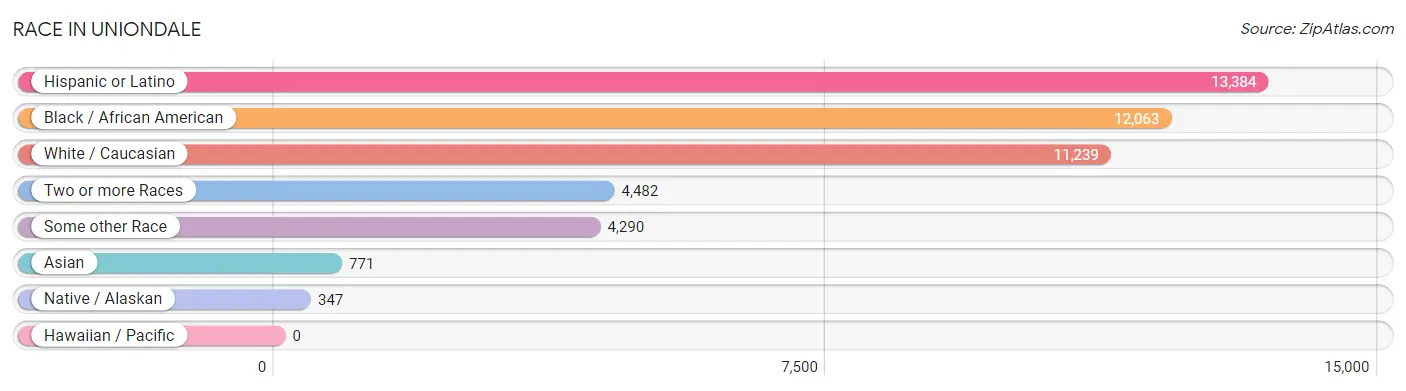
| Race | # Population | % Population |
| Asian | 771 | 2.3% |
| Black / African American | 12,063 | 36.3% |
| Hawaiian / Pacific | 0 | 0.0% |
| Hispanic or Latino | 13,384 | 40.3% |
| Native / Alaskan | 347 | 1.1% |
| White / Caucasian | 11,239 | 33.9% |
| Two or more Races | 4,482 | 13.5% |
| Some other Race | 4,290 | 12.9% |
| Total | 33,192 | 100.0% |
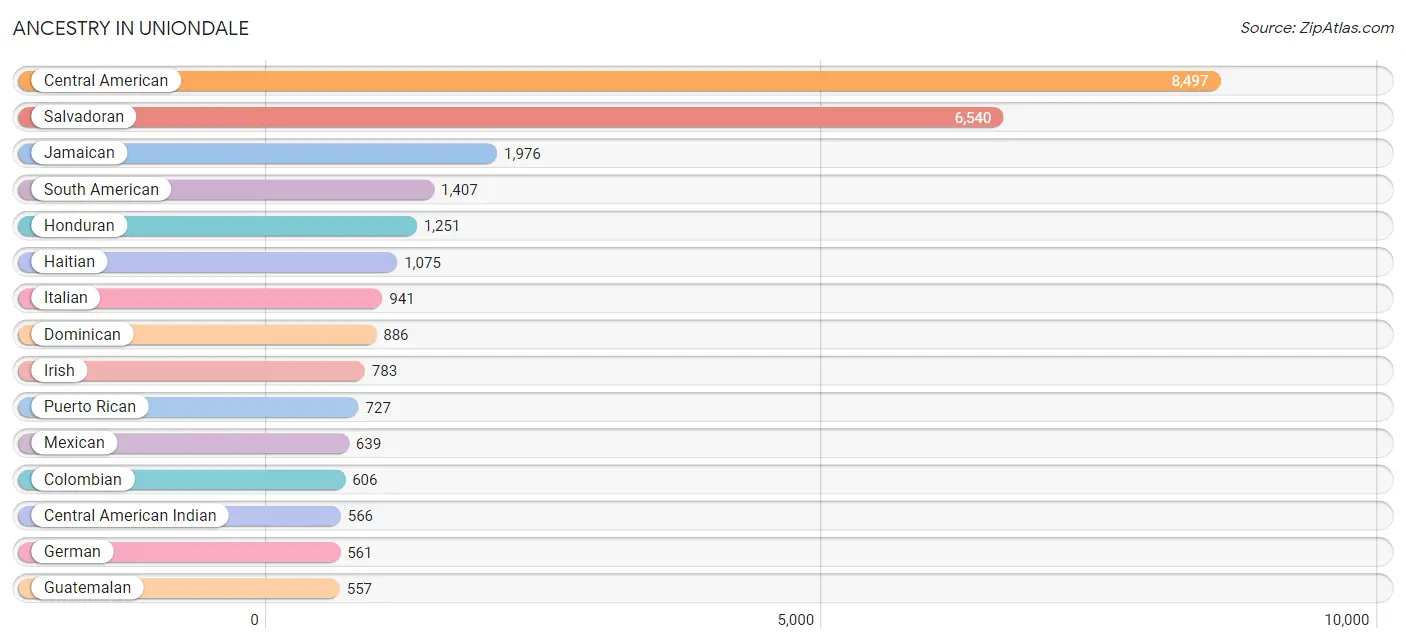
Ancestry in Uniondale
The most populous ancestries reported in Uniondale are Central American (8,497 | 25.6%), Salvadoran (6,540 | 19.7%), Jamaican (1,976 | 5.9%), South American (1,407 | 4.2%), and Honduran (1,251 | 3.8%), together accounting for 59.3% of all Uniondale residents.
| Ancestry | # Population | % Population |
| African | 118 | 0.4% |
| American | 491 | 1.5% |
| Arab | 81 | 0.2% |
| Argentinean | 16 | 0.1% |
| Armenian | 50 | 0.2% |
| Austrian | 79 | 0.2% |
| Barbadian | 40 | 0.1% |
| Belizean | 56 | 0.2% |
| Bhutanese | 80 | 0.2% |
| British West Indian | 49 | 0.2% |
| Bulgarian | 6 | 0.0% |
| Burmese | 74 | 0.2% |
| Canadian | 22 | 0.1% |
| Central American | 8,497 | 25.6% |
| Central American Indian | 566 | 1.7% |
| Cherokee | 7 | 0.0% |
| Chilean | 12 | 0.0% |
| Colombian | 606 | 1.8% |
| Cuban | 40 | 0.1% |
| Czech | 27 | 0.1% |
| Danish | 6 | 0.0% |
| Delaware | 8 | 0.0% |
| Dominican | 886 | 2.7% |
| Dutch | 68 | 0.2% |
| Dutch West Indian | 17 | 0.1% |
| Eastern European | 246 | 0.7% |
| Ecuadorian | 390 | 1.2% |
| English | 193 | 0.6% |
| European | 95 | 0.3% |
| French | 101 | 0.3% |
| French Canadian | 19 | 0.1% |
| German | 561 | 1.7% |
| Greek | 79 | 0.2% |
| Guatemalan | 557 | 1.7% |
| Guyanese | 391 | 1.2% |
| Haitian | 1,075 | 3.2% |
| Honduran | 1,251 | 3.8% |
| Hungarian | 65 | 0.2% |
| Indian (Asian) | 415 | 1.3% |
| Iranian | 35 | 0.1% |
| Irish | 783 | 2.4% |
| Israeli | 6 | 0.0% |
| Italian | 941 | 2.8% |
| Jamaican | 1,976 | 5.9% |
| Japanese | 4 | 0.0% |
| Korean | 61 | 0.2% |
| Latvian | 13 | 0.0% |
| Lebanese | 21 | 0.1% |
| Lithuanian | 23 | 0.1% |
| Lumbee | 15 | 0.1% |
| Luxembourger | 6 | 0.0% |
| Malaysian | 4 | 0.0% |
| Maltese | 4 | 0.0% |
| Mexican | 639 | 1.9% |
| Moroccan | 25 | 0.1% |
| Native Hawaiian | 15 | 0.1% |
| Nicaraguan | 7 | 0.0% |
| Nigerian | 214 | 0.6% |
| Norwegian | 46 | 0.1% |
| Pakistani | 28 | 0.1% |
| Panamanian | 72 | 0.2% |
| Peruvian | 284 | 0.9% |
| Polish | 431 | 1.3% |
| Puerto Rican | 727 | 2.2% |
| Romanian | 14 | 0.0% |
| Russian | 301 | 0.9% |
| Salvadoran | 6,540 | 19.7% |
| Scotch-Irish | 65 | 0.2% |
| Scottish | 28 | 0.1% |
| Seminole | 5 | 0.0% |
| Sierra Leonean | 7 | 0.0% |
| Slovak | 7 | 0.0% |
| South African | 12 | 0.0% |
| South American | 1,407 | 4.2% |
| South American Indian | 147 | 0.4% |
| Spaniard | 291 | 0.9% |
| Subsaharan African | 347 | 1.1% |
| Swedish | 31 | 0.1% |
| Swiss | 6 | 0.0% |
| Syrian | 22 | 0.1% |
| Thai | 253 | 0.8% |
| Trinidadian and Tobagonian | 215 | 0.6% |
| U.S. Virgin Islander | 13 | 0.0% |
| Ugandan | 7 | 0.0% |
| Ukrainian | 47 | 0.1% |
| Uruguayan | 99 | 0.3% |
| Welsh | 7 | 0.0% |
| West Indian | 330 | 1.0% | View All 88 Rows |
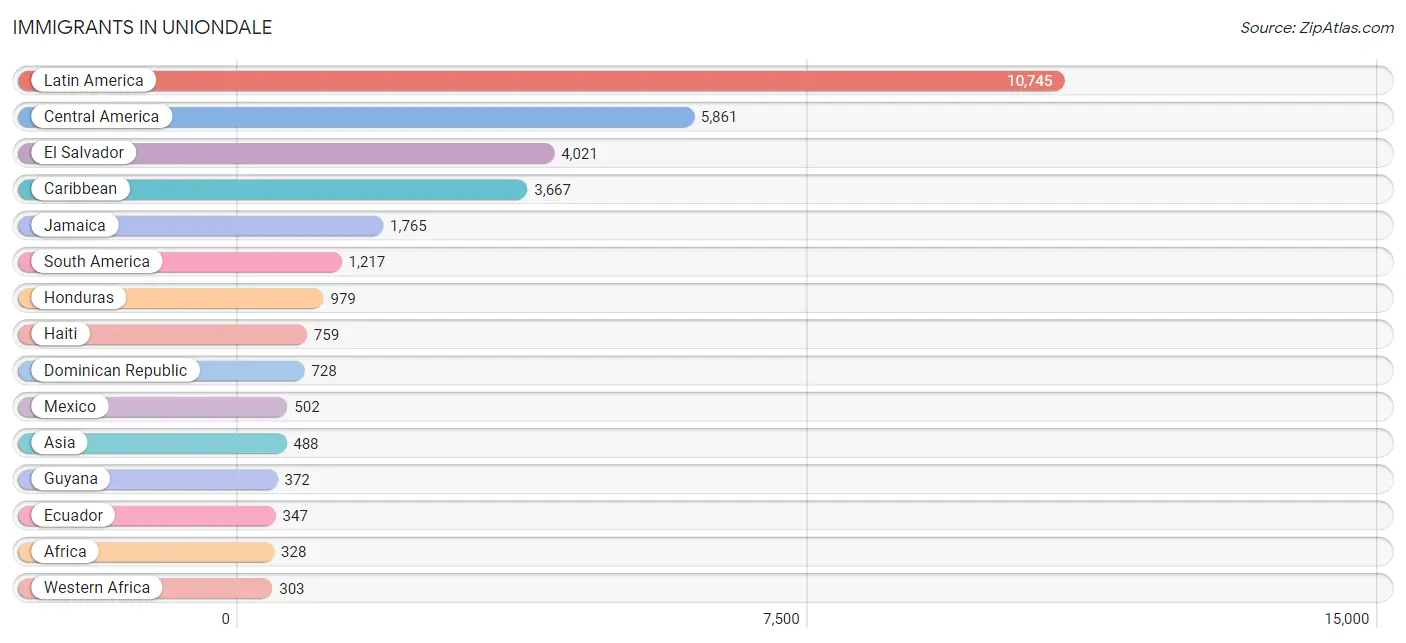
Immigrants in Uniondale
The most numerous immigrant groups reported in Uniondale came from Latin America (10,745 | 32.4%), Central America (5,861 | 17.7%), El Salvador (4,021 | 12.1%), Caribbean (3,667 | 11.1%), and Jamaica (1,765 | 5.3%), together accounting for 78.5% of all Uniondale residents.
| Immigration Origin | # Population | % Population |
| Africa | 328 | 1.0% |
| Argentina | 16 | 0.1% |
| Asia | 488 | 1.5% |
| Barbados | 42 | 0.1% |
| Belize | 68 | 0.2% |
| Canada | 8 | 0.0% |
| Caribbean | 3,667 | 11.1% |
| Central America | 5,861 | 17.7% |
| Chile | 12 | 0.0% |
| China | 173 | 0.5% |
| Colombia | 218 | 0.7% |
| Cuba | 14 | 0.0% |
| Dominican Republic | 728 | 2.2% |
| Eastern Africa | 7 | 0.0% |
| Eastern Asia | 289 | 0.9% |
| Eastern Europe | 117 | 0.4% |
| Ecuador | 347 | 1.1% |
| El Salvador | 4,021 | 12.1% |
| England | 90 | 0.3% |
| Europe | 277 | 0.8% |
| France | 13 | 0.0% |
| Ghana | 67 | 0.2% |
| Grenada | 31 | 0.1% |
| Guatemala | 279 | 0.8% |
| Guyana | 372 | 1.1% |
| Haiti | 759 | 2.3% |
| Honduras | 979 | 2.9% |
| Hungary | 21 | 0.1% |
| India | 80 | 0.2% |
| Iran | 5 | 0.0% |
| Ireland | 8 | 0.0% |
| Italy | 43 | 0.1% |
| Jamaica | 1,765 | 5.3% |
| Japan | 29 | 0.1% |
| Korea | 87 | 0.3% |
| Kuwait | 6 | 0.0% |
| Latin America | 10,745 | 32.4% |
| Mexico | 502 | 1.5% |
| Morocco | 18 | 0.1% |
| Nicaragua | 7 | 0.0% |
| Nigeria | 222 | 0.7% |
| Northern Africa | 18 | 0.1% |
| Northern Europe | 98 | 0.3% |
| Oceania | 12 | 0.0% |
| Pakistan | 11 | 0.0% |
| Panama | 5 | 0.0% |
| Peru | 199 | 0.6% |
| Philippines | 47 | 0.1% |
| Poland | 50 | 0.2% |
| Russia | 41 | 0.1% |
| Saudi Arabia | 22 | 0.1% |
| Sierra Leone | 14 | 0.0% |
| South America | 1,217 | 3.7% |
| South Central Asia | 96 | 0.3% |
| South Eastern Asia | 75 | 0.2% |
| Southern Europe | 43 | 0.1% |
| St. Vincent and the Grenadines | 31 | 0.1% |
| Taiwan | 68 | 0.2% |
| Thailand | 28 | 0.1% |
| Trinidad and Tobago | 154 | 0.5% |
| Uganda | 7 | 0.0% |
| Ukraine | 5 | 0.0% |
| West Indies | 33 | 0.1% |
| Western Africa | 303 | 0.9% |
| Western Asia | 28 | 0.1% |
| Western Europe | 19 | 0.1% | View All 66 Rows |
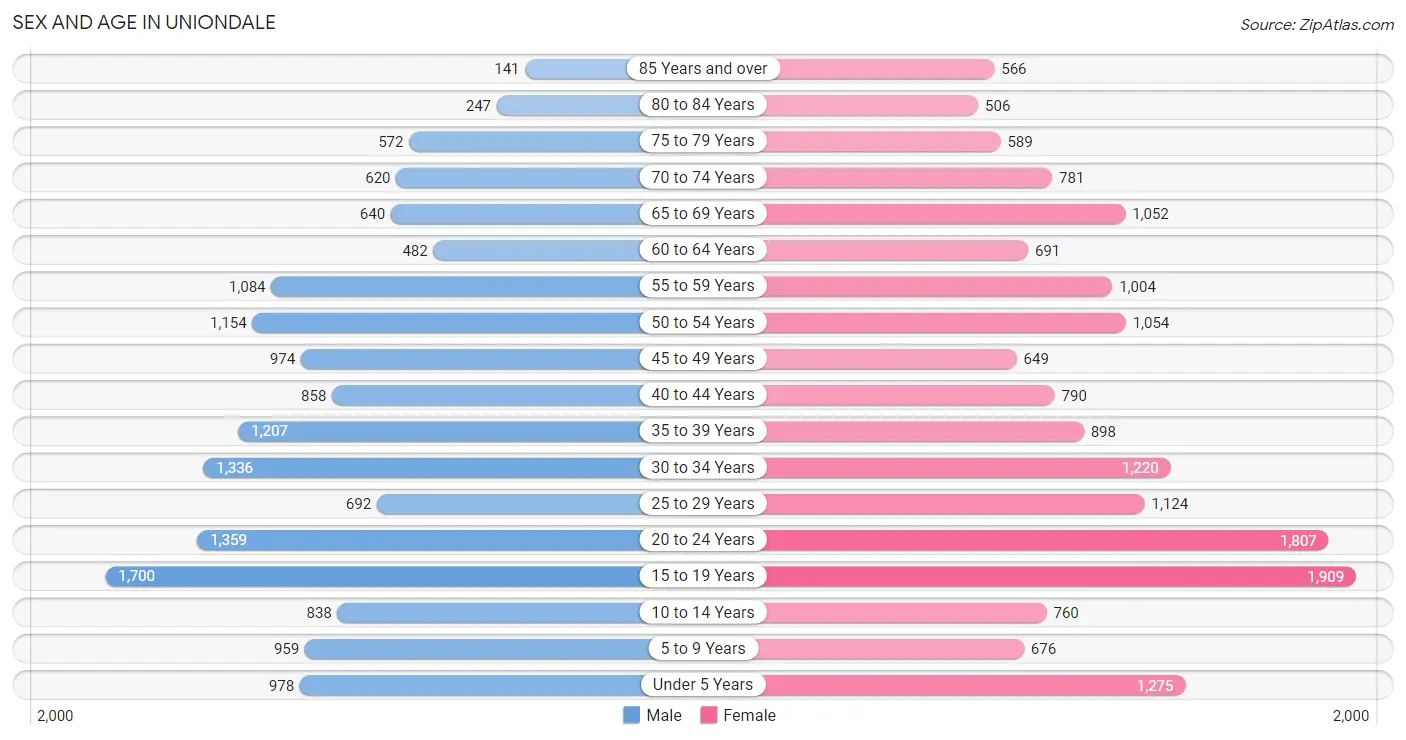
Sex and Age in Uniondale
Sex and Age in Uniondale
The most populous age groups in Uniondale are 15 to 19 Years (1,700 | 10.7%) for men and 15 to 19 Years (1,909 | 11.0%) for women.
| Age Bracket | Male | Female |
| Under 5 Years | 978 (6.2%) | 1,275 (7.3%) |
| 5 to 9 Years | 959 (6.0%) | 676 (3.9%) |
| 10 to 14 Years | 838 (5.3%) | 760 (4.4%) |
| 15 to 19 Years | 1,700 (10.7%) | 1,909 (11.0%) |
| 20 to 24 Years | 1,359 (8.6%) | 1,807 (10.4%) |
| 25 to 29 Years | 692 (4.4%) | 1,124 (6.5%) |
| 30 to 34 Years | 1,336 (8.4%) | 1,220 (7.0%) |
| 35 to 39 Years | 1,207 (7.6%) | 898 (5.2%) |
| 40 to 44 Years | 858 (5.4%) | 790 (4.5%) |
| 45 to 49 Years | 974 (6.1%) | 649 (3.7%) |
| 50 to 54 Years | 1,154 (7.3%) | 1,054 (6.1%) |
| 55 to 59 Years | 1,084 (6.8%) | 1,004 (5.8%) |
| 60 to 64 Years | 482 (3.0%) | 691 (4.0%) |
| 65 to 69 Years | 640 (4.0%) | 1,052 (6.1%) |
| 70 to 74 Years | 620 (3.9%) | 781 (4.5%) |
| 75 to 79 Years | 572 (3.6%) | 589 (3.4%) |
| 80 to 84 Years | 247 (1.6%) | 506 (2.9%) |
| 85 Years and over | 141 (0.9%) | 566 (3.3%) |
| Total | 15,841 (100.0%) | 17,351 (100.0%) |
Families and Households in Uniondale
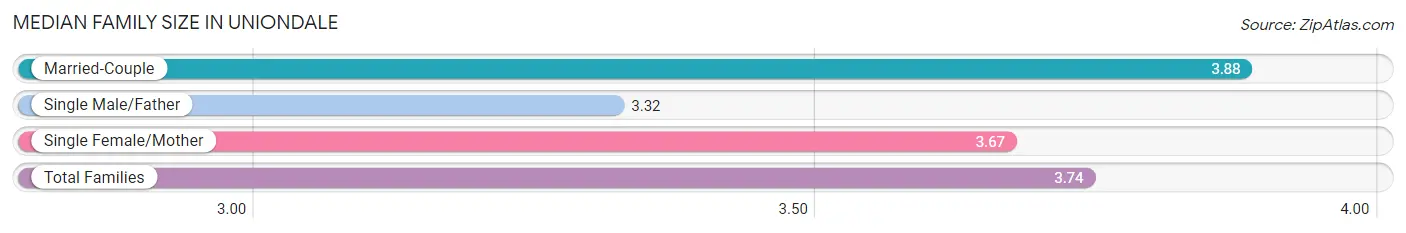
Median Family Size in Uniondale
The median family size in Uniondale is 3.74 persons per family, with married-couple families (3,882 | 60.5%) accounting for the largest median family size of 3.88 persons per family. On the other hand, single male/father families (1,020 | 15.9%) represent the smallest median family size with 3.32 persons per family.
| Family Type | # Families | Family Size |
| Married-Couple | 3,882 (60.5%) | 3.88 |
| Single Male/Father | 1,020 (15.9%) | 3.32 |
| Single Female/Mother | 1,516 (23.6%) | 3.67 |
| Total Families | 6,418 (100.0%) | 3.74 |
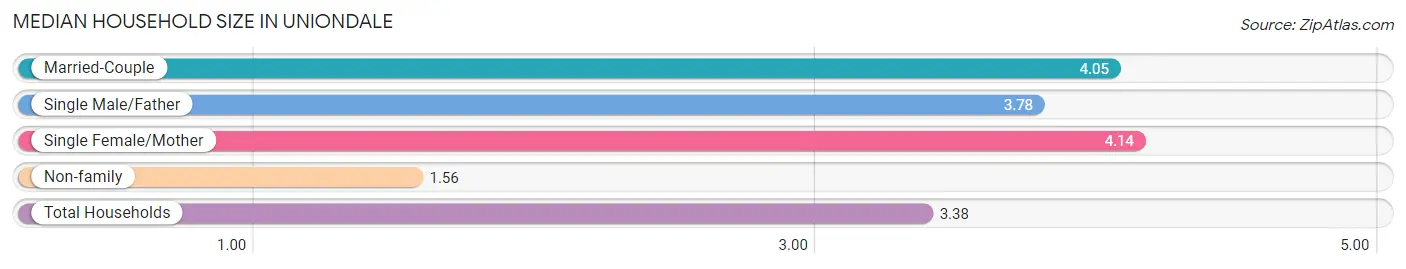
Median Household Size in Uniondale
The median household size in Uniondale is 3.38 persons per household, with single female/mother households (1,516 | 17.4%) accounting for the largest median household size of 4.14 persons per household. non-family households (2,278 | 26.2%) represent the smallest median household size with 1.56 persons per household.
| Household Type | # Households | Household Size |
| Married-Couple | 3,882 (44.6%) | 4.05 |
| Single Male/Father | 1,020 (11.7%) | 3.78 |
| Single Female/Mother | 1,516 (17.4%) | 4.14 |
| Non-family | 2,278 (26.2%) | 1.56 |
| Total Households | 8,696 (100.0%) | 3.38 |
Household Size by Marriage Status in Uniondale
Out of a total of 8,696 households in Uniondale, 6,418 (73.8%) are family households, while 2,278 (26.2%) are nonfamily households. The most numerous type of family households are 2-person households, comprising 1,632, and the most common type of nonfamily households are 1-person households, comprising 1,891.
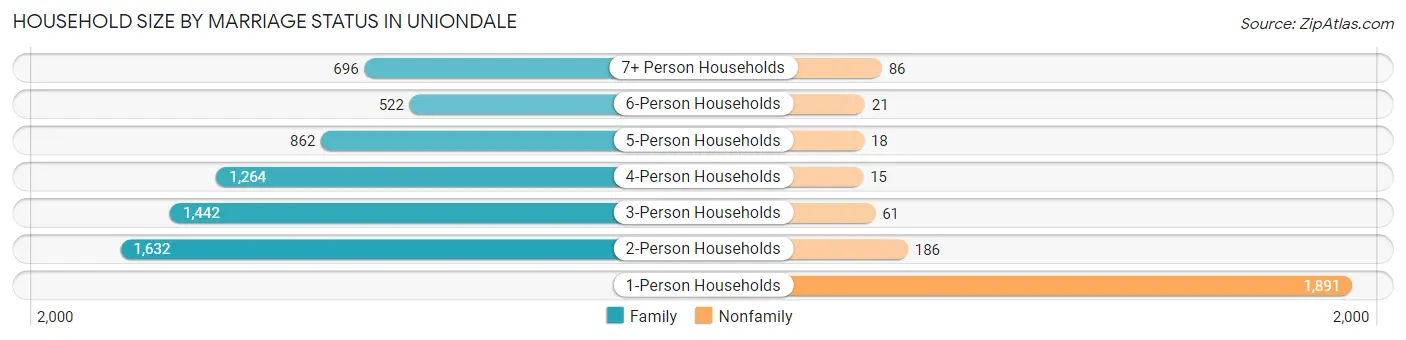
| Household Size | Family Households | Nonfamily Households |
| 1-Person Households | - | 1,891 (21.7%) |
| 2-Person Households | 1,632 (18.8%) | 186 (2.1%) |
| 3-Person Households | 1,442 (16.6%) | 61 (0.7%) |
| 4-Person Households | 1,264 (14.5%) | 15 (0.2%) |
| 5-Person Households | 862 (9.9%) | 18 (0.2%) |
| 6-Person Households | 522 (6.0%) | 21 (0.2%) |
| 7+ Person Households | 696 (8.0%) | 86 (1.0%) |
| Total | 6,418 (73.8%) | 2,278 (26.2%) |
Female Fertility in Uniondale
Fertility by Age in Uniondale
Average fertility rate in Uniondale is 86.0 births per 1,000 women. Women in the age bracket of 35 to 50 years have the highest fertility rate with 145.0 births per 1,000 women. Women in the age bracket of 35 to 50 years acount for 48.7% of all women with births.
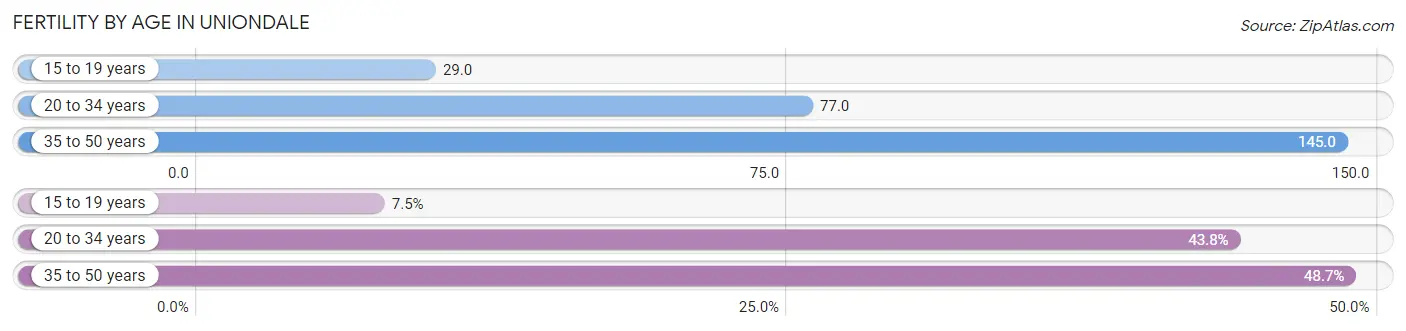
| Age Bracket | Women with Births | Births / 1,000 Women |
| 15 to 19 years | 55 (7.5%) | 29.0 |
| 20 to 34 years | 321 (43.8%) | 77.0 |
| 35 to 50 years | 357 (48.7%) | 145.0 |
| Total | 733 (100.0%) | 86.0 |
Fertility by Age by Marriage Status in Uniondale
62.5% of women with births (733) in Uniondale are married. The highest percentage of unmarried women with births falls into 15 to 19 years age bracket with 100.0% of them unmarried at the time of birth, while the lowest percentage of unmarried women with births belong to 35 to 50 years age bracket with 16.2% of them unmarried.
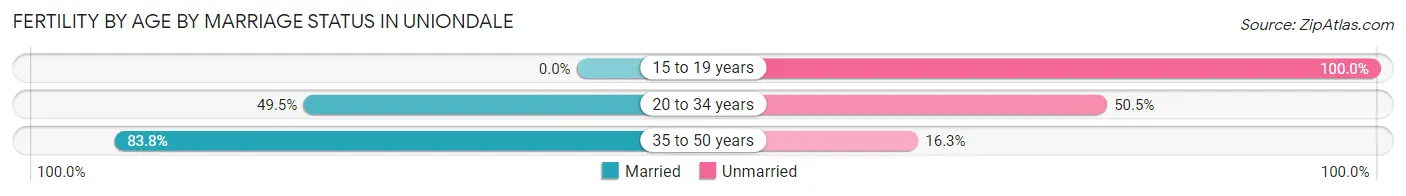
| Age Bracket | Married | Unmarried |
| 15 to 19 years | 0 (0.0%) | 55 (100.0%) |
| 20 to 34 years | 159 (49.5%) | 162 (50.5%) |
| 35 to 50 years | 299 (83.8%) | 58 (16.3%) |
| Total | 458 (62.5%) | 275 (37.5%) |
Fertility by Education in Uniondale
Average fertility rate in Uniondale is 86.0 births per 1,000 women. Women with the education attainment of graduate degree have the highest fertility rate of 161.0 births per 1,000 women, while women with the education attainment of high school diploma have the lowest fertility at 72.0 births per 1,000 women. Women with the education attainment of college or associate's degree represent 32.3% of all women with births.
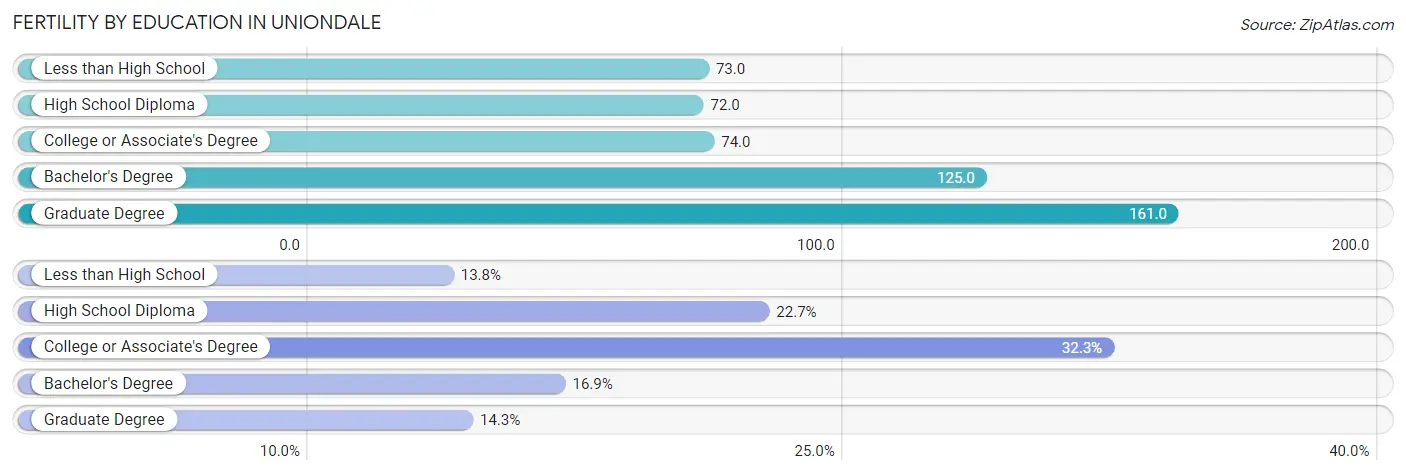
| Educational Attainment | Women with Births | Births / 1,000 Women |
| Less than High School | 101 (13.8%) | 73.0 |
| High School Diploma | 166 (22.7%) | 72.0 |
| College or Associate's Degree | 237 (32.3%) | 74.0 |
| Bachelor's Degree | 124 (16.9%) | 125.0 |
| Graduate Degree | 105 (14.3%) | 161.0 |
| Total | 733 (100.0%) | 86.0 |
Fertility by Education by Marriage Status in Uniondale
37.5% of women with births in Uniondale are unmarried. Women with the educational attainment of graduate degree are most likely to be married with 100.0% of them married at childbirth, while women with the educational attainment of college or associate's degree are least likely to be married with 75.5% of them unmarried at childbirth.
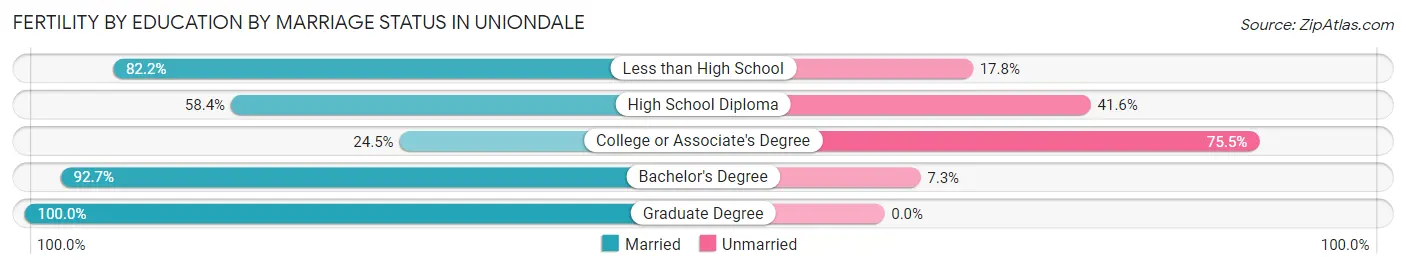
| Educational Attainment | Married | Unmarried |
| Less than High School | 83 (82.2%) | 18 (17.8%) |
| High School Diploma | 97 (58.4%) | 69 (41.6%) |
| College or Associate's Degree | 58 (24.5%) | 179 (75.5%) |
| Bachelor's Degree | 115 (92.7%) | 9 (7.3%) |
| Graduate Degree | 105 (100.0%) | 0 (0.0%) |
| Total | 458 (62.5%) | 275 (37.5%) |
Employment Characteristics in Uniondale
Employment by Class of Employer in Uniondale
Among the 15,113 employed individuals in Uniondale, private company employees (10,601 | 70.1%), local government employees (1,618 | 10.7%), and not-for-profit organizations (1,175 | 7.8%) make up the most common classes of employment.
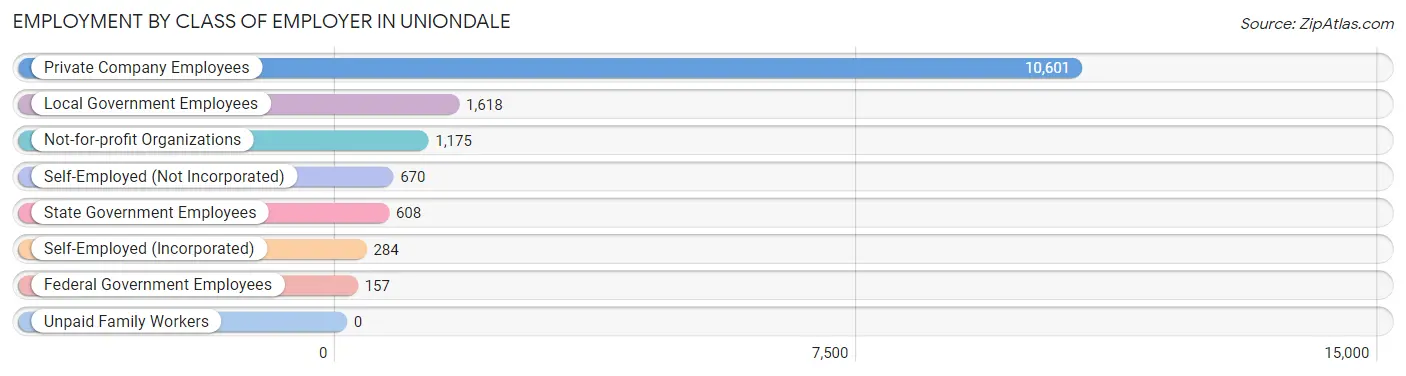
| Employer Class | # Employees | % Employees |
| Private Company Employees | 10,601 | 70.1% |
| Self-Employed (Incorporated) | 284 | 1.9% |
| Self-Employed (Not Incorporated) | 670 | 4.4% |
| Not-for-profit Organizations | 1,175 | 7.8% |
| Local Government Employees | 1,618 | 10.7% |
| State Government Employees | 608 | 4.0% |
| Federal Government Employees | 157 | 1.0% |
| Unpaid Family Workers | 0 | 0.0% |
| Total | 15,113 | 100.0% |
Employment Status by Age in Uniondale
According to the labor force statistics for Uniondale, out of the total population over 16 years of age (27,540), 59.9% or 16,496 individuals are in the labor force, with 6.4% or 1,056 of them unemployed. The age group with the highest labor force participation rate is 35 to 44 years, with 89.2% or 3,348 individuals in the labor force. Within the labor force, the 16 to 19 years age range has the highest percentage of unemployed individuals, with 14.8% or 179 of them being unemployed.
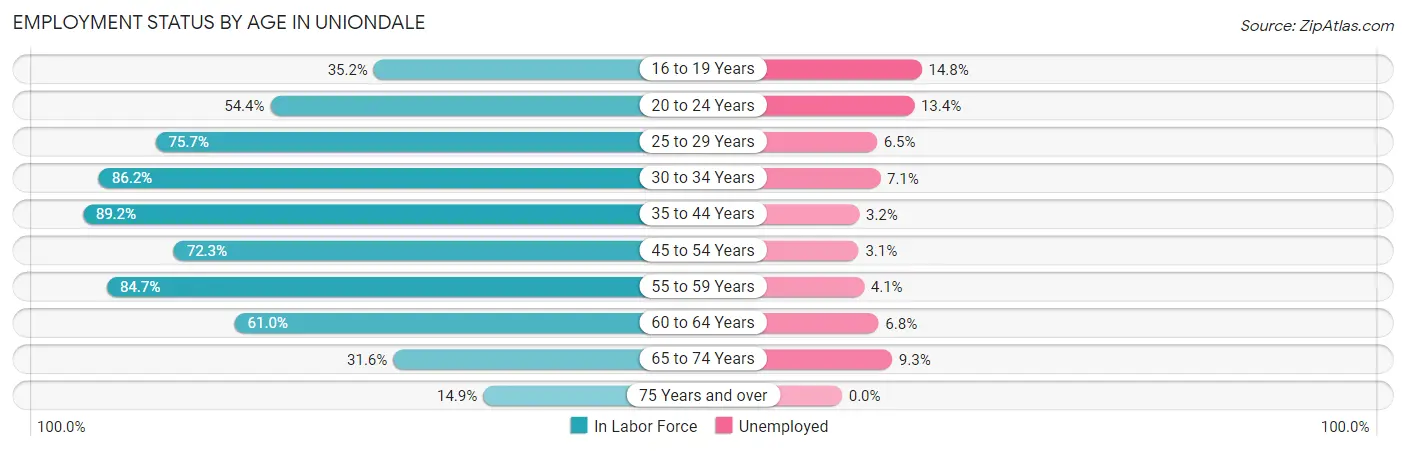
| Age Bracket | In Labor Force | Unemployed |
| 16 to 19 Years | 1,212 (35.2%) | 179 (14.8%) |
| 20 to 24 Years | 1,722 (54.4%) | 231 (13.4%) |
| 25 to 29 Years | 1,375 (75.7%) | 89 (6.5%) |
| 30 to 34 Years | 2,203 (86.2%) | 156 (7.1%) |
| 35 to 44 Years | 3,348 (89.2%) | 107 (3.2%) |
| 45 to 54 Years | 2,770 (72.3%) | 86 (3.1%) |
| 55 to 59 Years | 1,769 (84.7%) | 73 (4.1%) |
| 60 to 64 Years | 716 (61.0%) | 49 (6.8%) |
| 65 to 74 Years | 977 (31.6%) | 91 (9.3%) |
| 75 Years and over | 391 (14.9%) | 0 (0.0%) |
| Total | 16,496 (59.9%) | 1,056 (6.4%) |
Employment Status by Educational Attainment in Uniondale
According to labor force statistics for Uniondale, 80.0% of individuals (12,174) out of the total population between 25 and 64 years of age (15,217) are in the labor force, with 4.6% or 560 of them being unemployed. The group with the highest labor force participation rate are those with the educational attainment of bachelor's degree or higher, with 88.6% or 3,417 individuals in the labor force. Within the labor force, individuals with high school diploma education have the highest percentage of unemployment, with 8.3% or 290 of them being unemployed.
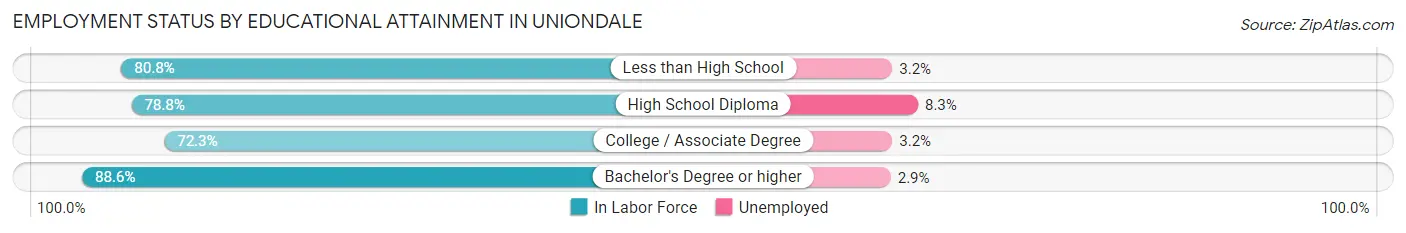
| Educational Attainment | In Labor Force | Unemployed |
| Less than High School | 2,480 (80.8%) | 98 (3.2%) |
| High School Diploma | 3,493 (78.8%) | 368 (8.3%) |
| College / Associate Degree | 2,789 (72.3%) | 123 (3.2%) |
| Bachelor's Degree or higher | 3,417 (88.6%) | 112 (2.9%) |
| Total | 12,174 (80.0%) | 700 (4.6%) |
Employment Occupations by Sex in Uniondale
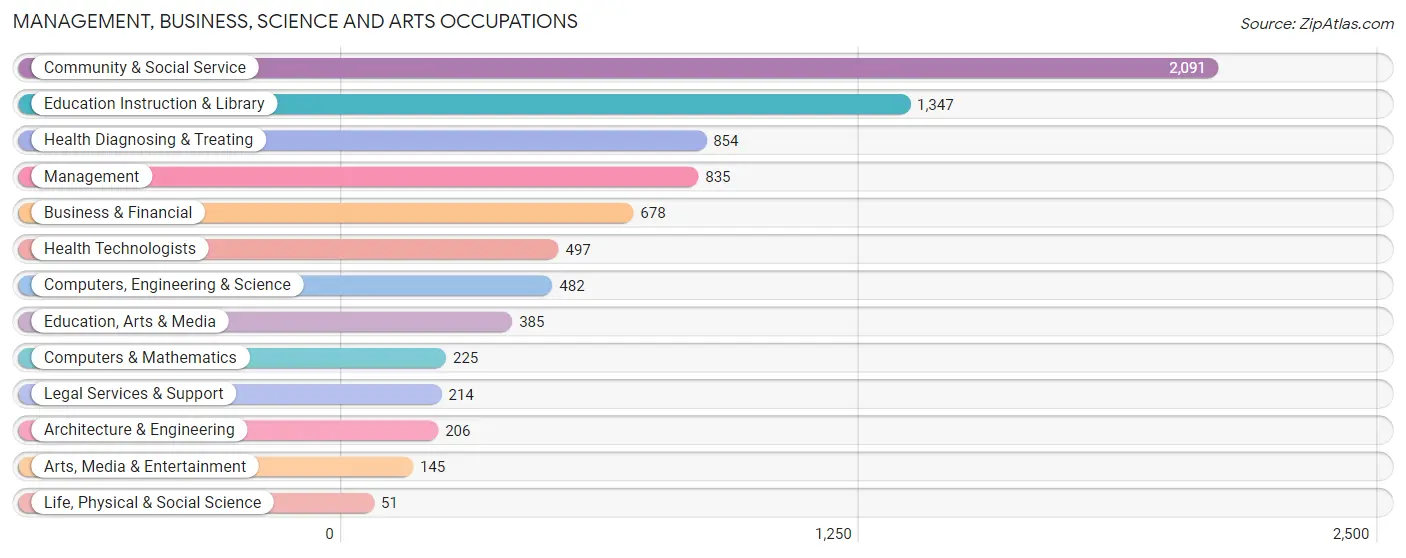
Management, Business, Science and Arts Occupations
The most common Management, Business, Science and Arts occupations in Uniondale are Community & Social Service (2,091 | 13.6%), Education Instruction & Library (1,347 | 8.7%), Health Diagnosing & Treating (854 | 5.5%), Management (835 | 5.4%), and Business & Financial (678 | 4.4%).
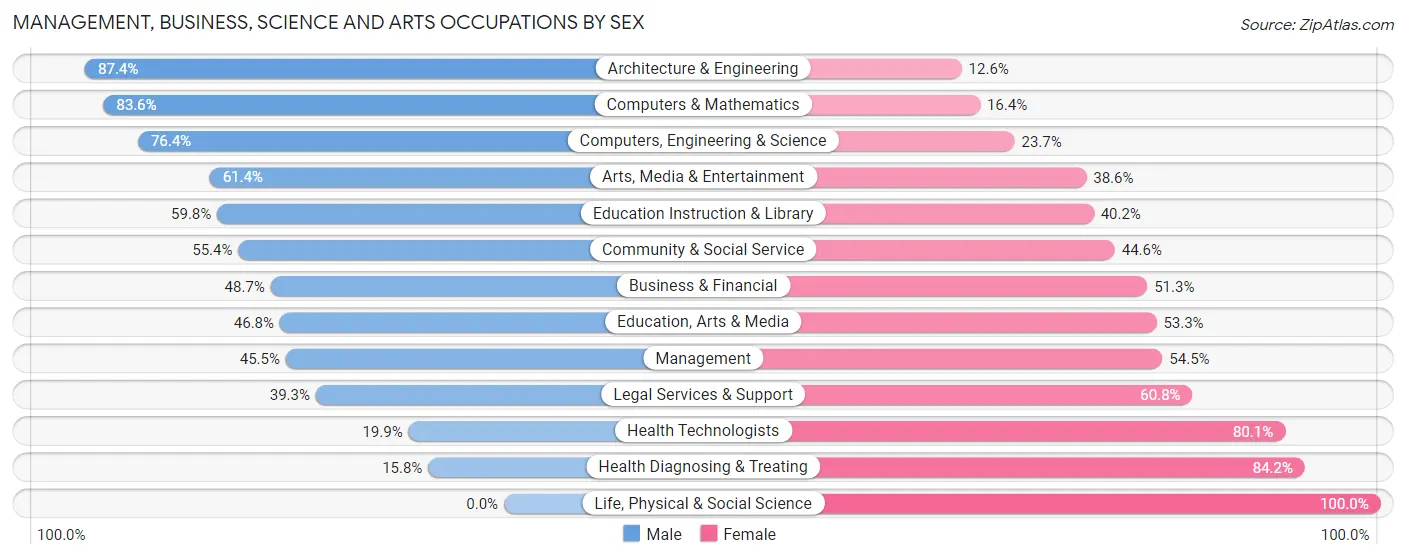
Management, Business, Science and Arts Occupations by Sex
Within the Management, Business, Science and Arts occupations in Uniondale, the most male-oriented occupations are Architecture & Engineering (87.4%), Computers & Mathematics (83.6%), and Computers, Engineering & Science (76.3%), while the most female-oriented occupations are Life, Physical & Social Science (100.0%), Health Diagnosing & Treating (84.2%), and Health Technologists (80.1%).
| Occupation | Male | Female |
| Management | 380 (45.5%) | 455 (54.5%) |
| Business & Financial | 330 (48.7%) | 348 (51.3%) |
| Computers, Engineering & Science | 368 (76.3%) | 114 (23.6%) |
| Computers & Mathematics | 188 (83.6%) | 37 (16.4%) |
| Architecture & Engineering | 180 (87.4%) | 26 (12.6%) |
| Life, Physical & Social Science | 0 (0.0%) | 51 (100.0%) |
| Community & Social Service | 1,159 (55.4%) | 932 (44.6%) |
| Education, Arts & Media | 180 (46.8%) | 205 (53.2%) |
| Legal Services & Support | 84 (39.3%) | 130 (60.8%) |
| Education Instruction & Library | 806 (59.8%) | 541 (40.2%) |
| Arts, Media & Entertainment | 89 (61.4%) | 56 (38.6%) |
| Health Diagnosing & Treating | 135 (15.8%) | 719 (84.2%) |
| Health Technologists | 99 (19.9%) | 398 (80.1%) |
| Total (Category) | 2,372 (48.0%) | 2,568 (52.0%) |
| Total (Overall) | 7,891 (51.2%) | 7,512 (48.8%) |
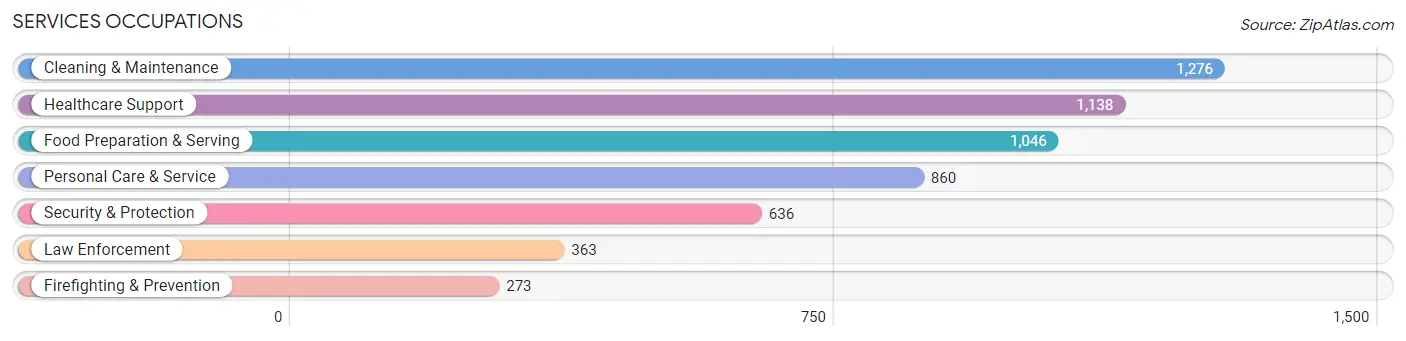
Services Occupations
The most common Services occupations in Uniondale are Cleaning & Maintenance (1,276 | 8.3%), Healthcare Support (1,138 | 7.4%), Food Preparation & Serving (1,046 | 6.8%), Personal Care & Service (860 | 5.6%), and Security & Protection (636 | 4.1%).
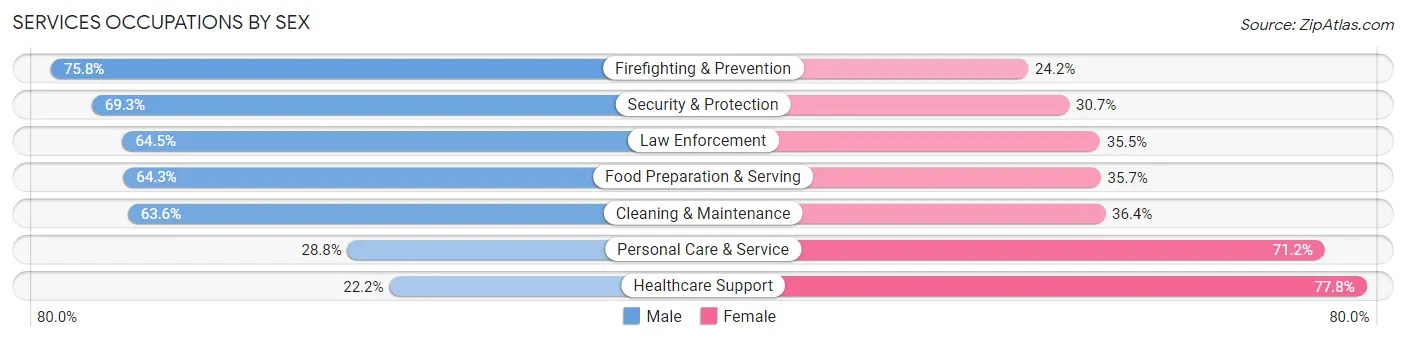
Services Occupations by Sex
Within the Services occupations in Uniondale, the most male-oriented occupations are Firefighting & Prevention (75.8%), Security & Protection (69.3%), and Law Enforcement (64.5%), while the most female-oriented occupations are Healthcare Support (77.8%), Personal Care & Service (71.2%), and Cleaning & Maintenance (36.4%).
| Occupation | Male | Female |
| Healthcare Support | 253 (22.2%) | 885 (77.8%) |
| Security & Protection | 441 (69.3%) | 195 (30.7%) |
| Firefighting & Prevention | 207 (75.8%) | 66 (24.2%) |
| Law Enforcement | 234 (64.5%) | 129 (35.5%) |
| Food Preparation & Serving | 673 (64.3%) | 373 (35.7%) |
| Cleaning & Maintenance | 812 (63.6%) | 464 (36.4%) |
| Personal Care & Service | 248 (28.8%) | 612 (71.2%) |
| Total (Category) | 2,427 (49.0%) | 2,529 (51.0%) |
| Total (Overall) | 7,891 (51.2%) | 7,512 (48.8%) |
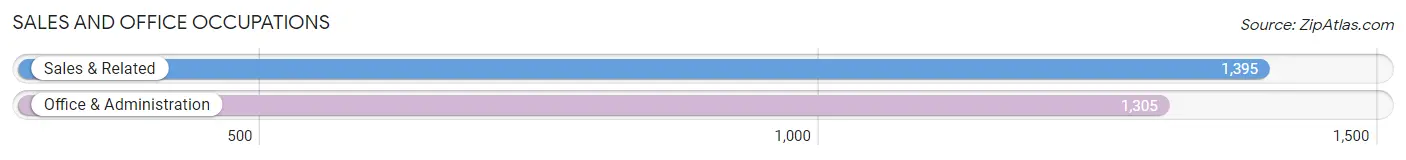
Sales and Office Occupations
The most common Sales and Office occupations in Uniondale are Sales & Related (1,395 | 9.1%), and Office & Administration (1,305 | 8.5%).
Sales and Office Occupations by Sex
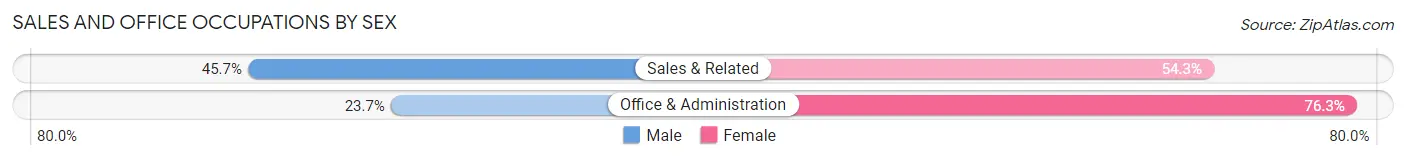
| Occupation | Male | Female |
| Sales & Related | 637 (45.7%) | 758 (54.3%) |
| Office & Administration | 309 (23.7%) | 996 (76.3%) |
| Total (Category) | 946 (35.0%) | 1,754 (65.0%) |
| Total (Overall) | 7,891 (51.2%) | 7,512 (48.8%) |
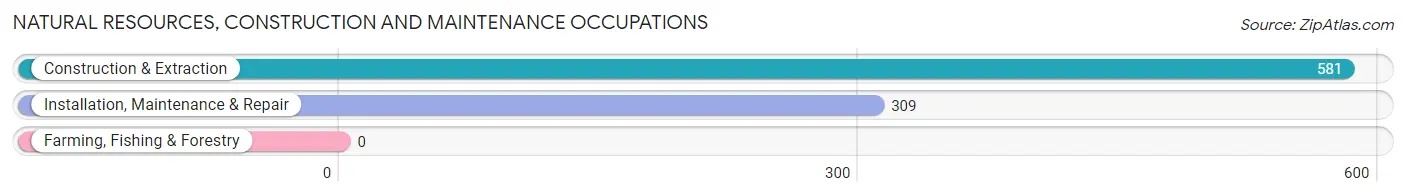
Natural Resources, Construction and Maintenance Occupations
The most common Natural Resources, Construction and Maintenance occupations in Uniondale are Construction & Extraction (581 | 3.8%), and Installation, Maintenance & Repair (309 | 2.0%).
Natural Resources, Construction and Maintenance Occupations by Sex
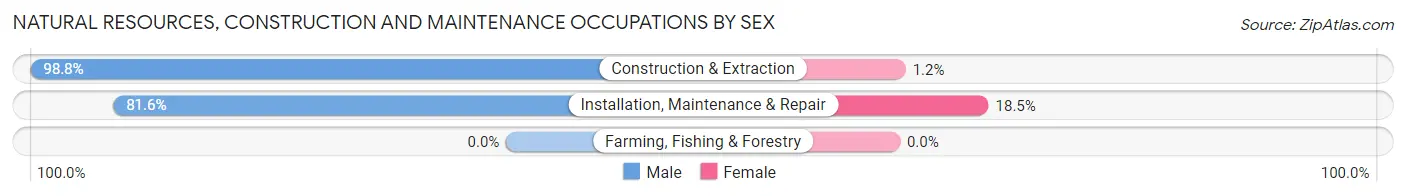
| Occupation | Male | Female |
| Farming, Fishing & Forestry | 0 (0.0%) | 0 (0.0%) |
| Construction & Extraction | 574 (98.8%) | 7 (1.2%) |
| Installation, Maintenance & Repair | 252 (81.6%) | 57 (18.4%) |
| Total (Category) | 826 (92.8%) | 64 (7.2%) |
| Total (Overall) | 7,891 (51.2%) | 7,512 (48.8%) |
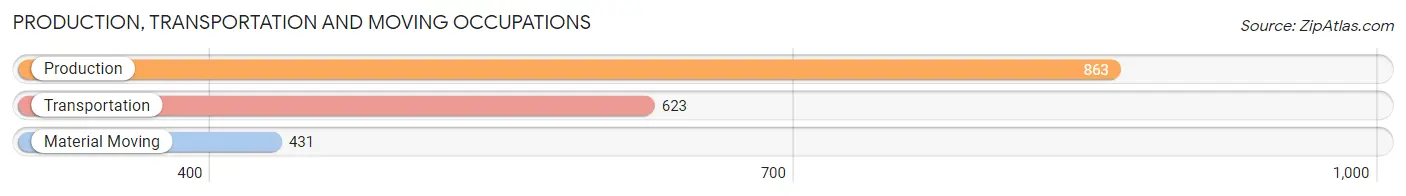
Production, Transportation and Moving Occupations
The most common Production, Transportation and Moving occupations in Uniondale are Production (863 | 5.6%), Transportation (623 | 4.0%), and Material Moving (431 | 2.8%).
Production, Transportation and Moving Occupations by Sex
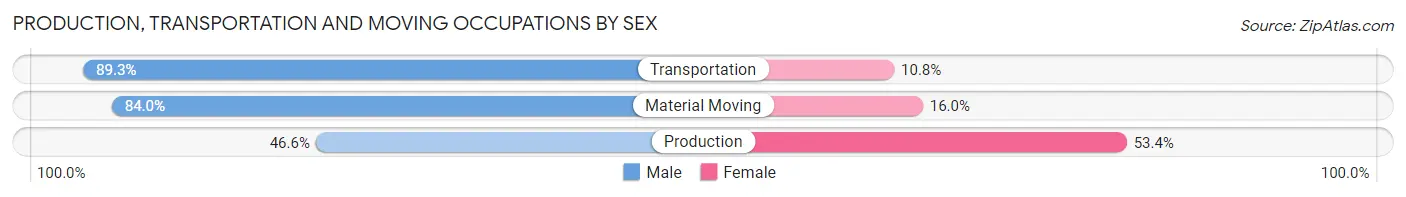
| Occupation | Male | Female |
| Production | 402 (46.6%) | 461 (53.4%) |
| Transportation | 556 (89.2%) | 67 (10.7%) |
| Material Moving | 362 (84.0%) | 69 (16.0%) |
| Total (Category) | 1,320 (68.9%) | 597 (31.1%) |
| Total (Overall) | 7,891 (51.2%) | 7,512 (48.8%) |
Employment Industries by Sex in Uniondale
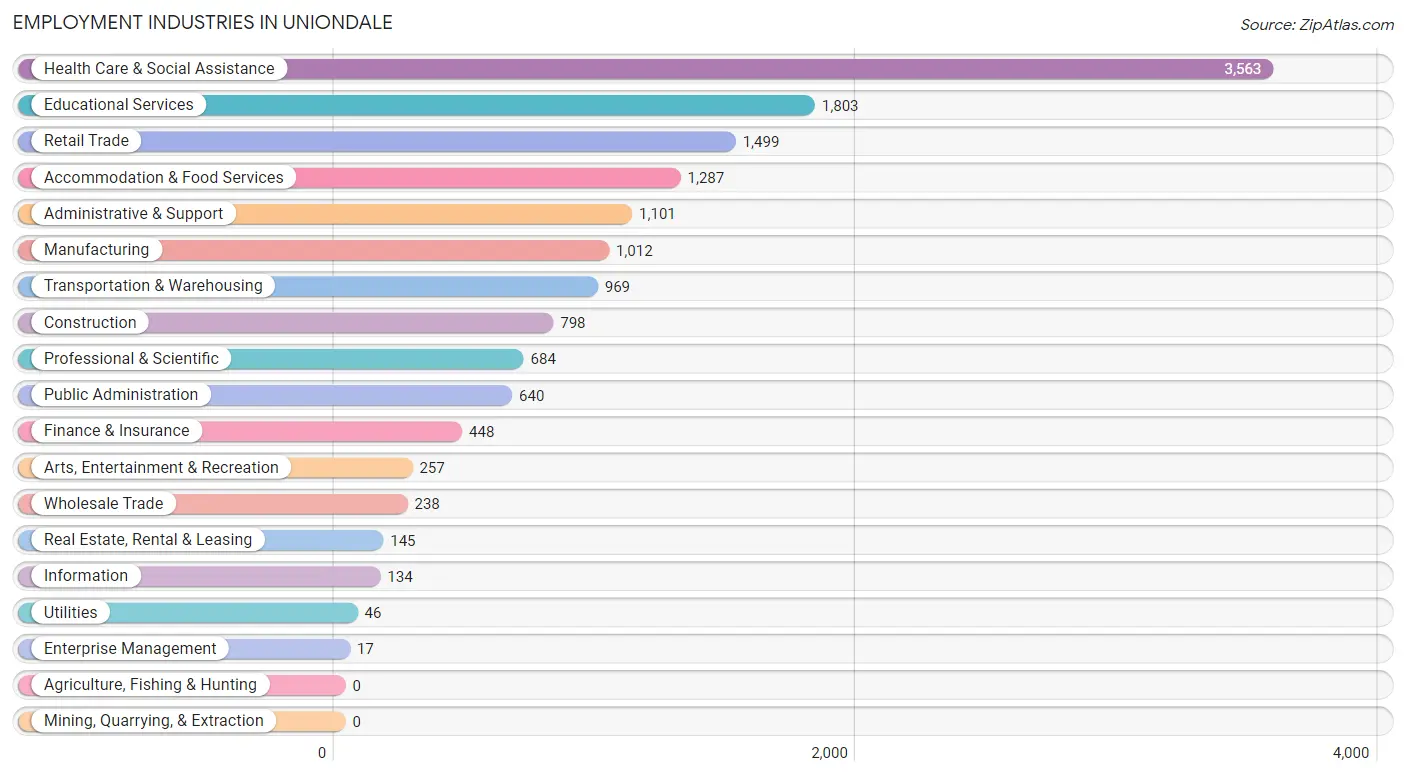
Employment Industries in Uniondale
The major employment industries in Uniondale include Health Care & Social Assistance (3,563 | 23.1%), Educational Services (1,803 | 11.7%), Retail Trade (1,499 | 9.7%), Accommodation & Food Services (1,287 | 8.4%), and Administrative & Support (1,101 | 7.1%).
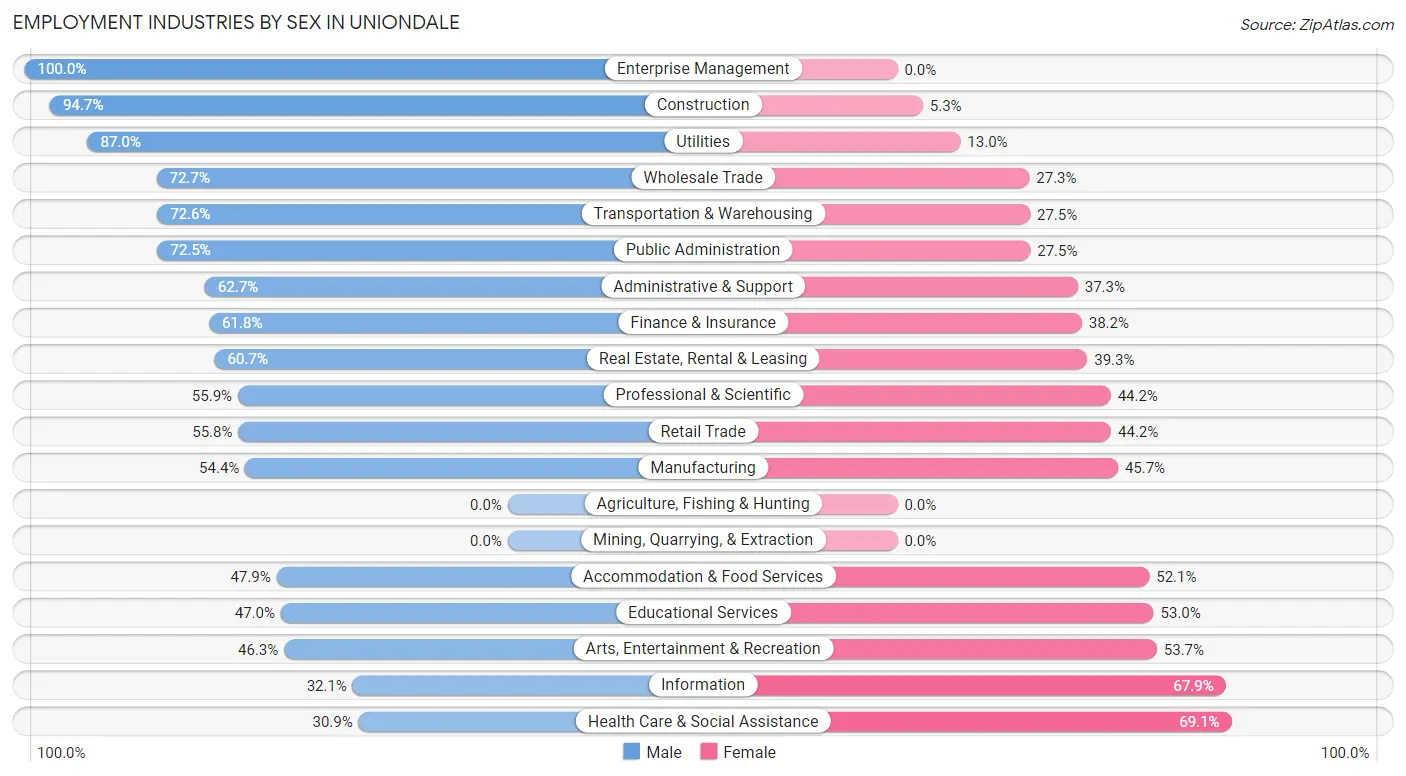
Employment Industries by Sex in Uniondale
The Uniondale industries that see more men than women are Enterprise Management (100.0%), Construction (94.7%), and Utilities (87.0%), whereas the industries that tend to have a higher number of women are Health Care & Social Assistance (69.1%), Information (67.9%), and Arts, Entertainment & Recreation (53.7%).
| Industry | Male | Female |
| Agriculture, Fishing & Hunting | 0 (0.0%) | 0 (0.0%) |
| Mining, Quarrying, & Extraction | 0 (0.0%) | 0 (0.0%) |
| Construction | 756 (94.7%) | 42 (5.3%) |
| Manufacturing | 550 (54.3%) | 462 (45.7%) |
| Wholesale Trade | 173 (72.7%) | 65 (27.3%) |
| Retail Trade | 836 (55.8%) | 663 (44.2%) |
| Transportation & Warehousing | 703 (72.6%) | 266 (27.5%) |
| Utilities | 40 (87.0%) | 6 (13.0%) |
| Information | 43 (32.1%) | 91 (67.9%) |
| Finance & Insurance | 277 (61.8%) | 171 (38.2%) |
| Real Estate, Rental & Leasing | 88 (60.7%) | 57 (39.3%) |
| Professional & Scientific | 382 (55.8%) | 302 (44.2%) |
| Enterprise Management | 17 (100.0%) | 0 (0.0%) |
| Administrative & Support | 690 (62.7%) | 411 (37.3%) |
| Educational Services | 847 (47.0%) | 956 (53.0%) |
| Health Care & Social Assistance | 1,100 (30.9%) | 2,463 (69.1%) |
| Arts, Entertainment & Recreation | 119 (46.3%) | 138 (53.7%) |
| Accommodation & Food Services | 616 (47.9%) | 671 (52.1%) |
| Public Administration | 464 (72.5%) | 176 (27.5%) |
| Total | 7,891 (51.2%) | 7,512 (48.8%) |
Education in Uniondale
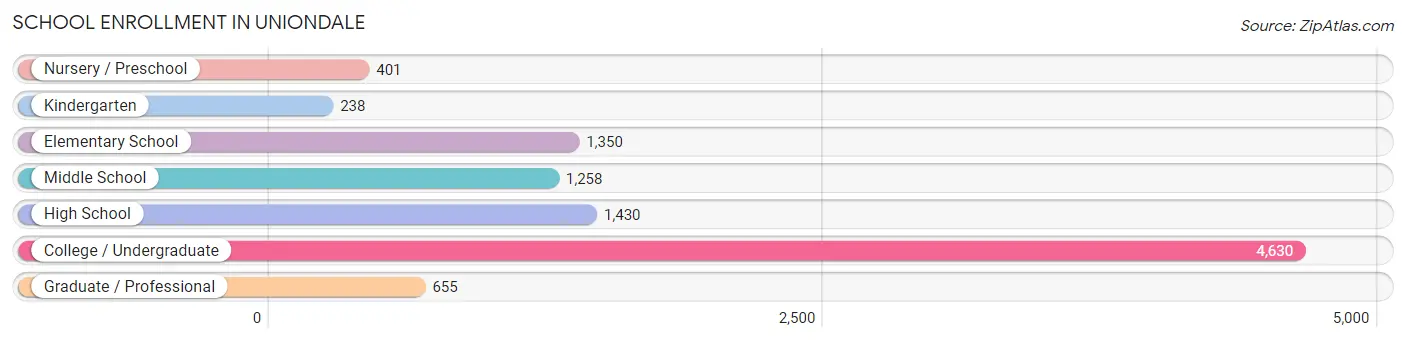
School Enrollment in Uniondale
The most common levels of schooling among the 9,962 students in Uniondale are college / undergraduate (4,630 | 46.5%), high school (1,430 | 14.3%), and elementary school (1,350 | 13.6%).
| School Level | # Students | % Students |
| Nursery / Preschool | 401 | 4.0% |
| Kindergarten | 238 | 2.4% |
| Elementary School | 1,350 | 13.6% |
| Middle School | 1,258 | 12.6% |
| High School | 1,430 | 14.3% |
| College / Undergraduate | 4,630 | 46.5% |
| Graduate / Professional | 655 | 6.6% |
| Total | 9,962 | 100.0% |
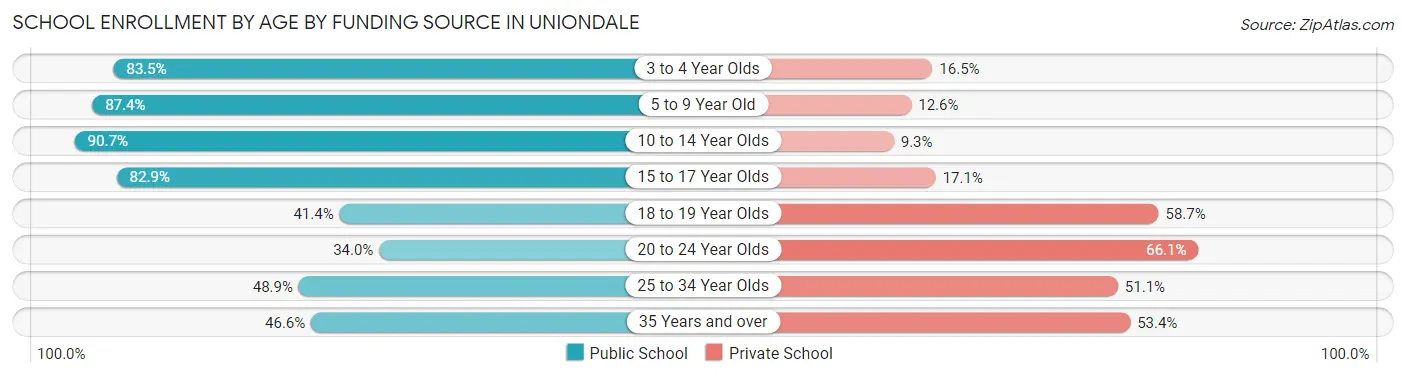
School Enrollment by Age by Funding Source in Uniondale
Out of a total of 9,962 students who are enrolled in schools in Uniondale, 3,855 (38.7%) attend a private institution, while the remaining 6,107 (61.3%) are enrolled in public schools. The age group of 20 to 24 year olds has the highest likelihood of being enrolled in private schools, with 1,488 (66.0% in the age bracket) enrolled. Conversely, the age group of 10 to 14 year olds has the lowest likelihood of being enrolled in a private school, with 1,438 (90.7% in the age bracket) attending a public institution.
| Age Bracket | Public School | Private School |
| 3 to 4 Year Olds | 313 (83.5%) | 62 (16.5%) |
| 5 to 9 Year Old | 1,353 (87.4%) | 195 (12.6%) |
| 10 to 14 Year Olds | 1,438 (90.7%) | 148 (9.3%) |
| 15 to 17 Year Olds | 870 (82.9%) | 180 (17.1%) |
| 18 to 19 Year Olds | 913 (41.3%) | 1,295 (58.7%) |
| 20 to 24 Year Olds | 765 (34.0%) | 1,488 (66.0%) |
| 25 to 34 Year Olds | 272 (48.9%) | 284 (51.1%) |
| 35 Years and over | 180 (46.6%) | 206 (53.4%) |
| Total | 6,107 (61.3%) | 3,855 (38.7%) |
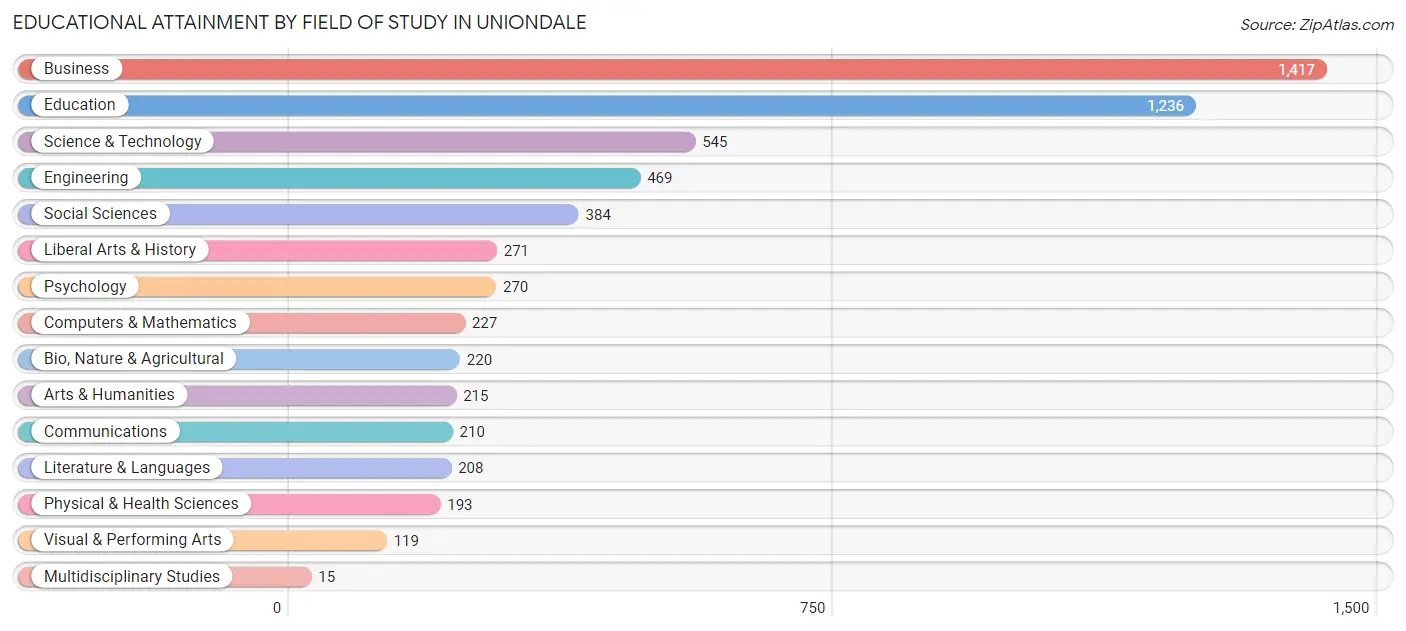
Educational Attainment by Field of Study in Uniondale
Business (1,417 | 23.6%), education (1,236 | 20.6%), science & technology (545 | 9.1%), engineering (469 | 7.8%), and social sciences (384 | 6.4%) are the most common fields of study among 5,999 individuals in Uniondale who have obtained a bachelor's degree or higher.
| Field of Study | # Graduates | % Graduates |
| Computers & Mathematics | 227 | 3.8% |
| Bio, Nature & Agricultural | 220 | 3.7% |
| Physical & Health Sciences | 193 | 3.2% |
| Psychology | 270 | 4.5% |
| Social Sciences | 384 | 6.4% |
| Engineering | 469 | 7.8% |
| Multidisciplinary Studies | 15 | 0.3% |
| Science & Technology | 545 | 9.1% |
| Business | 1,417 | 23.6% |
| Education | 1,236 | 20.6% |
| Literature & Languages | 208 | 3.5% |
| Liberal Arts & History | 271 | 4.5% |
| Visual & Performing Arts | 119 | 2.0% |
| Communications | 210 | 3.5% |
| Arts & Humanities | 215 | 3.6% |
| Total | 5,999 | 100.0% |
Transportation & Commute in Uniondale
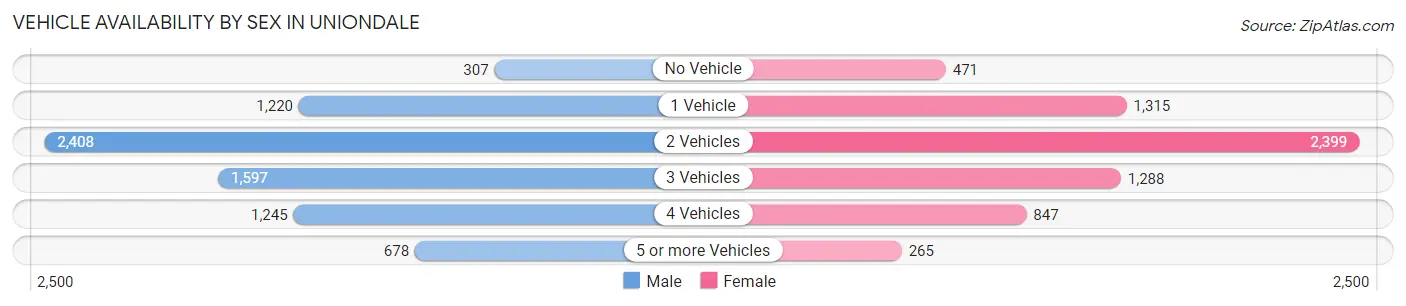
Vehicle Availability by Sex in Uniondale
The most prevalent vehicle ownership categories in Uniondale are males with 2 vehicles (2,408, accounting for 32.3%) and females with 2 vehicles (2,399, making up 36.6%).
| Vehicles Available | Male | Female |
| No Vehicle | 307 (4.1%) | 471 (7.1%) |
| 1 Vehicle | 1,220 (16.4%) | 1,315 (20.0%) |
| 2 Vehicles | 2,408 (32.3%) | 2,399 (36.4%) |
| 3 Vehicles | 1,597 (21.4%) | 1,288 (19.6%) |
| 4 Vehicles | 1,245 (16.7%) | 847 (12.9%) |
| 5 or more Vehicles | 678 (9.1%) | 265 (4.0%) |
| Total | 7,455 (100.0%) | 6,585 (100.0%) |
Commute Time in Uniondale
The most frequently occuring commute durations in Uniondale are 30 to 34 minutes (2,166 commuters, 15.5%), 15 to 19 minutes (1,963 commuters, 14.1%), and 10 to 14 minutes (1,508 commuters, 10.8%).
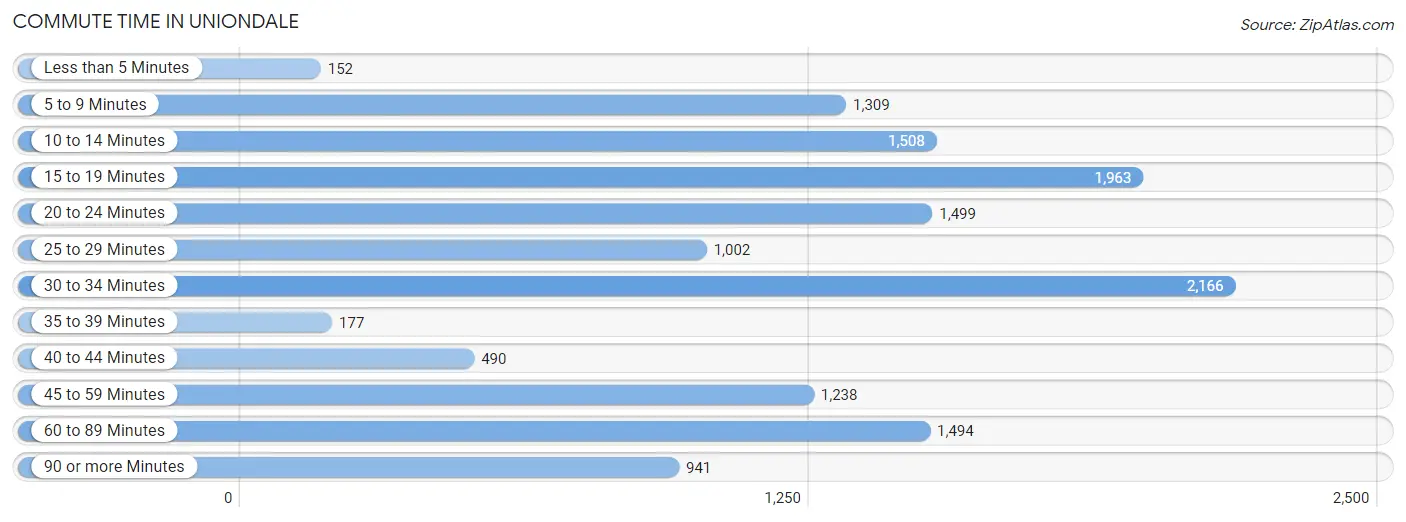
| Commute Time | # Commuters | % Commuters |
| Less than 5 Minutes | 152 | 1.1% |
| 5 to 9 Minutes | 1,309 | 9.4% |
| 10 to 14 Minutes | 1,508 | 10.8% |
| 15 to 19 Minutes | 1,963 | 14.1% |
| 20 to 24 Minutes | 1,499 | 10.7% |
| 25 to 29 Minutes | 1,002 | 7.2% |
| 30 to 34 Minutes | 2,166 | 15.5% |
| 35 to 39 Minutes | 177 | 1.3% |
| 40 to 44 Minutes | 490 | 3.5% |
| 45 to 59 Minutes | 1,238 | 8.9% |
| 60 to 89 Minutes | 1,494 | 10.7% |
| 90 or more Minutes | 941 | 6.8% |
Commute Time by Sex in Uniondale
The most common commute times in Uniondale are 30 to 34 minutes (1,192 commuters, 16.7%) for males and 15 to 19 minutes (1,225 commuters, 18.0%) for females.
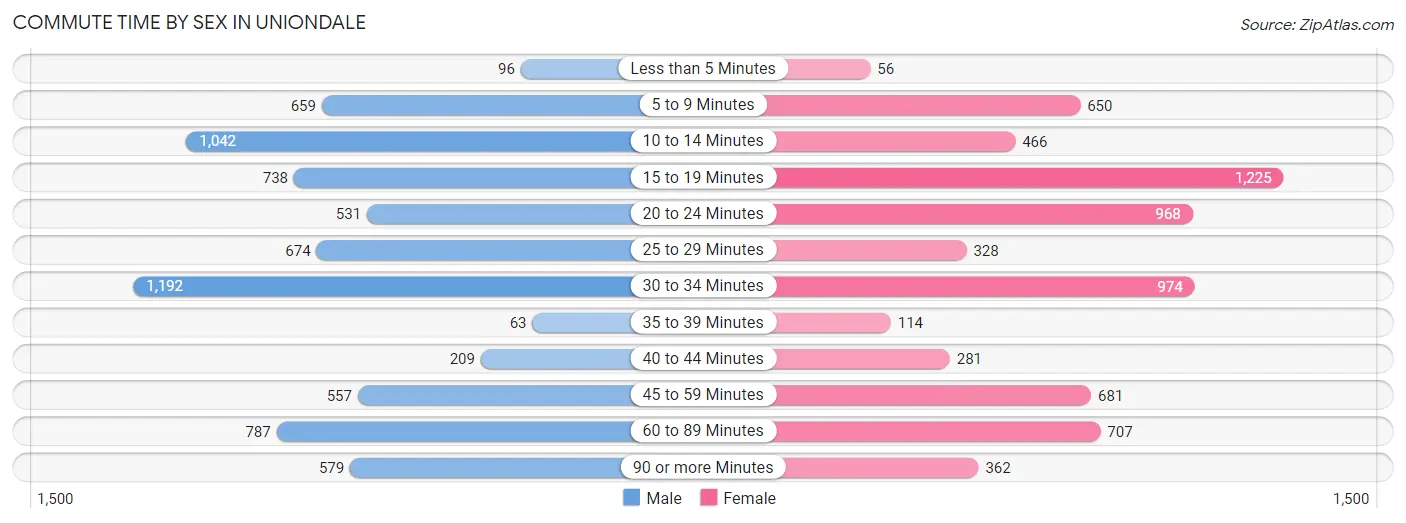
| Commute Time | Male | Female |
| Less than 5 Minutes | 96 (1.3%) | 56 (0.8%) |
| 5 to 9 Minutes | 659 (9.2%) | 650 (9.5%) |
| 10 to 14 Minutes | 1,042 (14.6%) | 466 (6.8%) |
| 15 to 19 Minutes | 738 (10.3%) | 1,225 (18.0%) |
| 20 to 24 Minutes | 531 (7.4%) | 968 (14.2%) |
| 25 to 29 Minutes | 674 (9.5%) | 328 (4.8%) |
| 30 to 34 Minutes | 1,192 (16.7%) | 974 (14.3%) |
| 35 to 39 Minutes | 63 (0.9%) | 114 (1.7%) |
| 40 to 44 Minutes | 209 (2.9%) | 281 (4.1%) |
| 45 to 59 Minutes | 557 (7.8%) | 681 (10.0%) |
| 60 to 89 Minutes | 787 (11.0%) | 707 (10.4%) |
| 90 or more Minutes | 579 (8.1%) | 362 (5.3%) |
Time of Departure to Work by Sex in Uniondale
The most frequent times of departure to work in Uniondale are 7:00 AM to 7:29 AM (1,735, 24.3%) for males and 8:00 AM to 8:29 AM (1,090, 16.0%) for females.
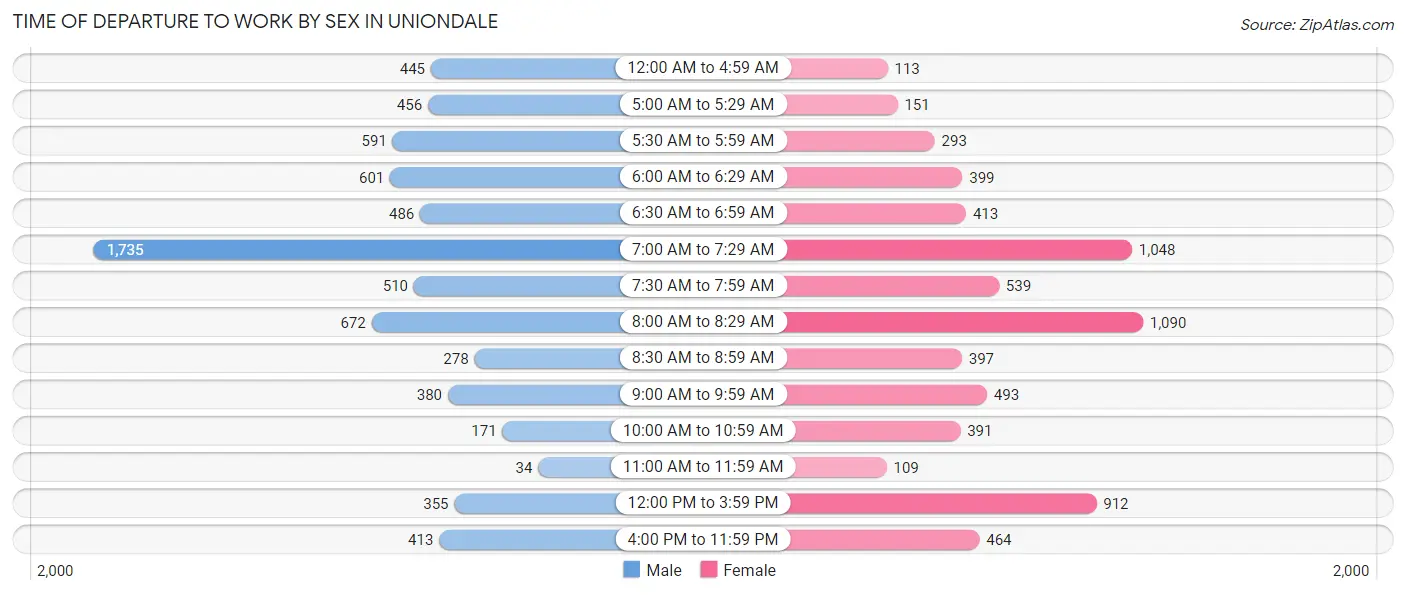
| Time of Departure | Male | Female |
| 12:00 AM to 4:59 AM | 445 (6.2%) | 113 (1.7%) |
| 5:00 AM to 5:29 AM | 456 (6.4%) | 151 (2.2%) |
| 5:30 AM to 5:59 AM | 591 (8.3%) | 293 (4.3%) |
| 6:00 AM to 6:29 AM | 601 (8.4%) | 399 (5.9%) |
| 6:30 AM to 6:59 AM | 486 (6.8%) | 413 (6.1%) |
| 7:00 AM to 7:29 AM | 1,735 (24.3%) | 1,048 (15.4%) |
| 7:30 AM to 7:59 AM | 510 (7.2%) | 539 (7.9%) |
| 8:00 AM to 8:29 AM | 672 (9.4%) | 1,090 (16.0%) |
| 8:30 AM to 8:59 AM | 278 (3.9%) | 397 (5.8%) |
| 9:00 AM to 9:59 AM | 380 (5.3%) | 493 (7.2%) |
| 10:00 AM to 10:59 AM | 171 (2.4%) | 391 (5.7%) |
| 11:00 AM to 11:59 AM | 34 (0.5%) | 109 (1.6%) |
| 12:00 PM to 3:59 PM | 355 (5.0%) | 912 (13.4%) |
| 4:00 PM to 11:59 PM | 413 (5.8%) | 464 (6.8%) |
| Total | 7,127 (100.0%) | 6,812 (100.0%) |
Housing Occupancy in Uniondale
Occupancy by Ownership in Uniondale
Of the total 8,696 dwellings in Uniondale, owner-occupied units account for 6,272 (72.1%), while renter-occupied units make up 2,424 (27.9%).
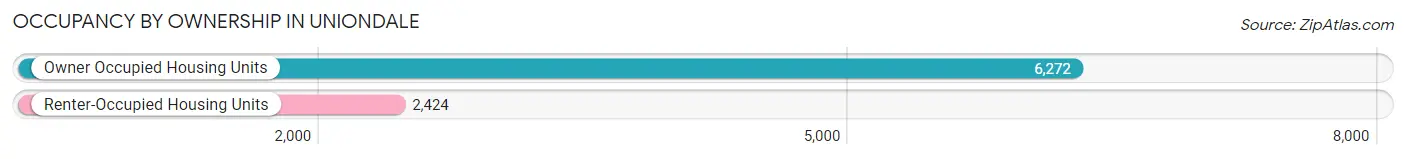
| Occupancy | # Housing Units | % Housing Units |
| Owner Occupied Housing Units | 6,272 | 72.1% |
| Renter-Occupied Housing Units | 2,424 | 27.9% |
| Total Occupied Housing Units | 8,696 | 100.0% |
Occupancy by Household Size in Uniondale
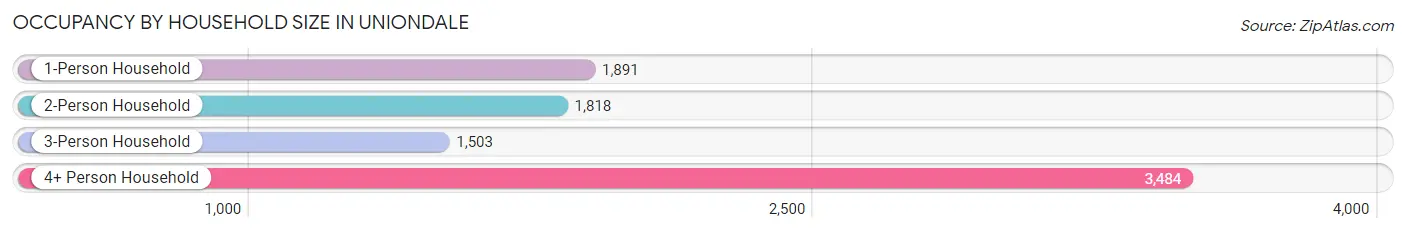
| Household Size | # Housing Units | % Housing Units |
| 1-Person Household | 1,891 | 21.7% |
| 2-Person Household | 1,818 | 20.9% |
| 3-Person Household | 1,503 | 17.3% |
| 4+ Person Household | 3,484 | 40.1% |
| Total Housing Units | 8,696 | 100.0% |
Occupancy by Ownership by Household Size in Uniondale
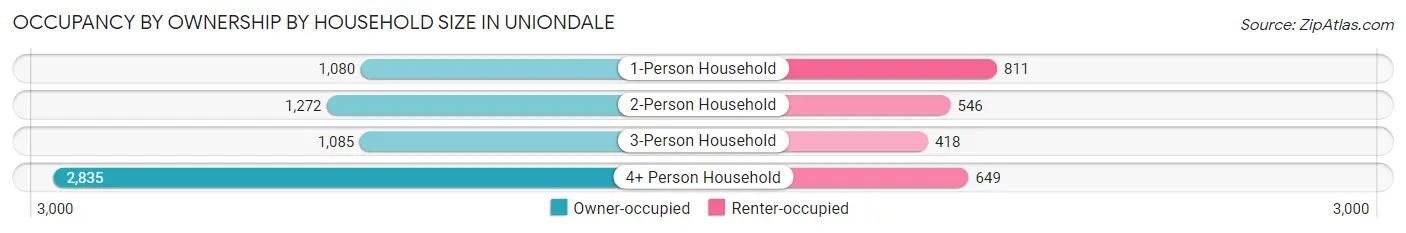
| Household Size | Owner-occupied | Renter-occupied |
| 1-Person Household | 1,080 (57.1%) | 811 (42.9%) |
| 2-Person Household | 1,272 (70.0%) | 546 (30.0%) |
| 3-Person Household | 1,085 (72.2%) | 418 (27.8%) |
| 4+ Person Household | 2,835 (81.4%) | 649 (18.6%) |
| Total Housing Units | 6,272 (72.1%) | 2,424 (27.9%) |
Occupancy by Educational Attainment in Uniondale
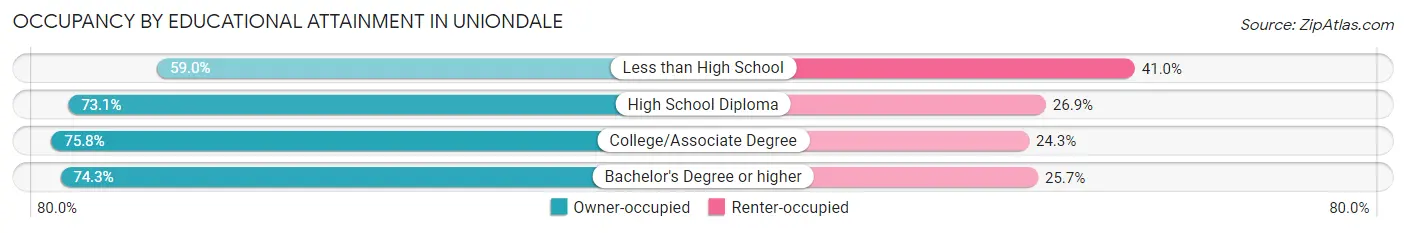
| Household Size | Owner-occupied | Renter-occupied |
| Less than High School | 720 (59.0%) | 501 (41.0%) |
| High School Diploma | 1,824 (73.1%) | 672 (26.9%) |
| College/Associate Degree | 1,446 (75.7%) | 463 (24.2%) |
| Bachelor's Degree or higher | 2,282 (74.3%) | 788 (25.7%) |
Occupancy by Age of Householder in Uniondale
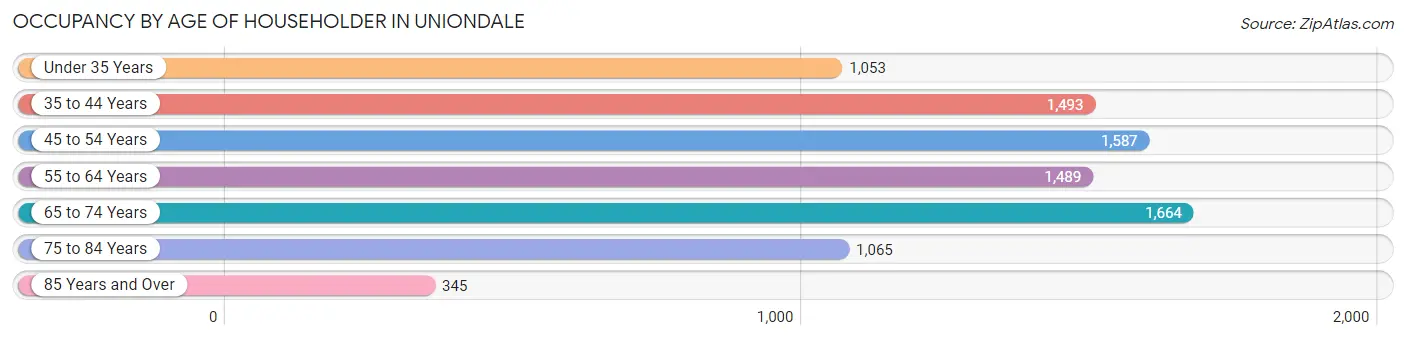
| Age Bracket | # Households | % Households |
| Under 35 Years | 1,053 | 12.1% |
| 35 to 44 Years | 1,493 | 17.2% |
| 45 to 54 Years | 1,587 | 18.2% |
| 55 to 64 Years | 1,489 | 17.1% |
| 65 to 74 Years | 1,664 | 19.1% |
| 75 to 84 Years | 1,065 | 12.2% |
| 85 Years and Over | 345 | 4.0% |
| Total | 8,696 | 100.0% |
Housing Finances in Uniondale
Median Income by Occupancy in Uniondale
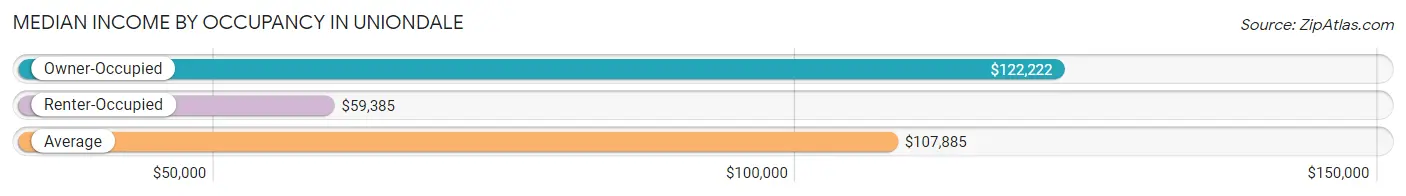
| Occupancy Type | # Households | Median Income |
| Owner-Occupied | 6,272 (72.1%) | $122,222 |
| Renter-Occupied | 2,424 (27.9%) | $59,385 |
| Average | 8,696 (100.0%) | $107,885 |
Occupancy by Householder Income Bracket in Uniondale
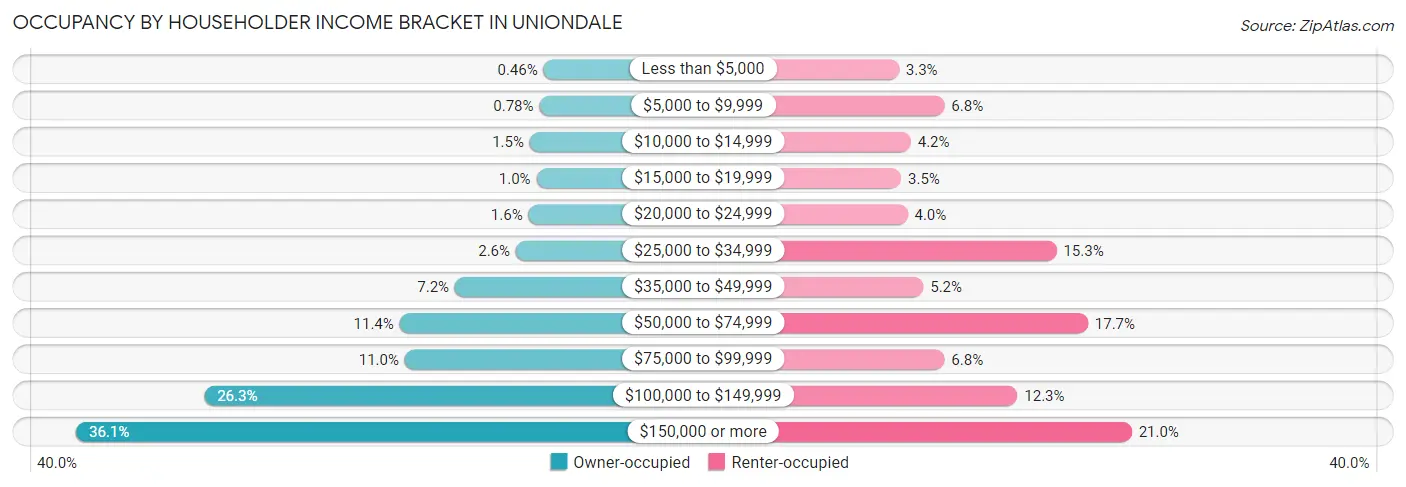
| Income Bracket | Owner-occupied | Renter-occupied |
| Less than $5,000 | 29 (0.5%) | 80 (3.3%) |
| $5,000 to $9,999 | 49 (0.8%) | 164 (6.8%) |
| $10,000 to $14,999 | 95 (1.5%) | 102 (4.2%) |
| $15,000 to $19,999 | 63 (1.0%) | 84 (3.5%) |
| $20,000 to $24,999 | 101 (1.6%) | 96 (4.0%) |
| $25,000 to $34,999 | 161 (2.6%) | 371 (15.3%) |
| $35,000 to $49,999 | 452 (7.2%) | 125 (5.2%) |
| $50,000 to $74,999 | 717 (11.4%) | 429 (17.7%) |
| $75,000 to $99,999 | 692 (11.0%) | 164 (6.8%) |
| $100,000 to $149,999 | 1,650 (26.3%) | 299 (12.3%) |
| $150,000 or more | 2,263 (36.1%) | 510 (21.0%) |
| Total | 6,272 (100.0%) | 2,424 (100.0%) |
Monthly Housing Cost Tiers in Uniondale
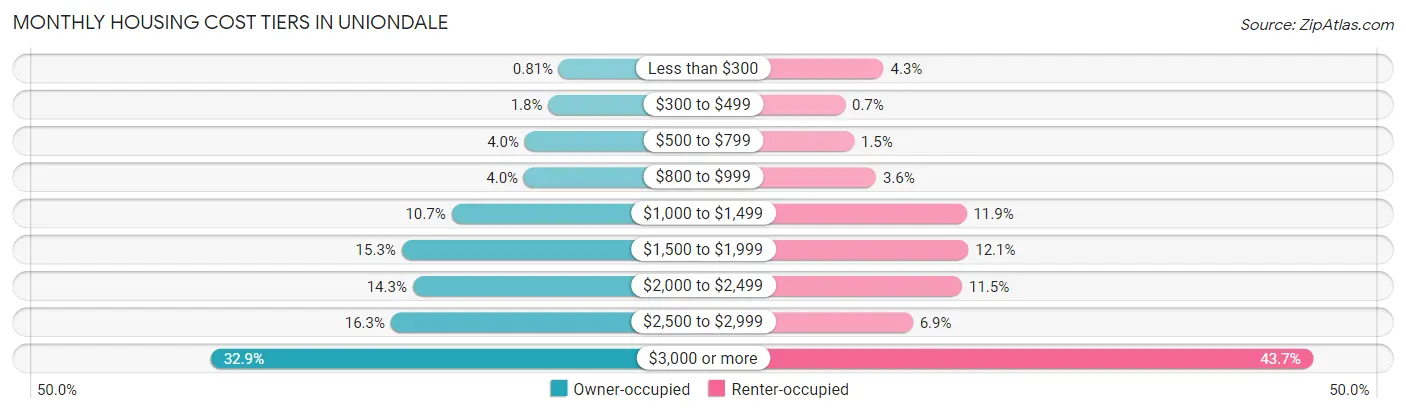
| Monthly Cost | Owner-occupied | Renter-occupied |
| Less than $300 | 51 (0.8%) | 103 (4.3%) |
| $300 to $499 | 112 (1.8%) | 17 (0.7%) |
| $500 to $799 | 248 (4.0%) | 37 (1.5%) |
| $800 to $999 | 253 (4.0%) | 86 (3.5%) |
| $1,000 to $1,499 | 671 (10.7%) | 288 (11.9%) |
| $1,500 to $1,999 | 959 (15.3%) | 292 (12.0%) |
| $2,000 to $2,499 | 895 (14.3%) | 278 (11.5%) |
| $2,500 to $2,999 | 1,022 (16.3%) | 168 (6.9%) |
| $3,000 or more | 2,061 (32.9%) | 1,060 (43.7%) |
| Total | 6,272 (100.0%) | 2,424 (100.0%) |
Physical Housing Characteristics in Uniondale
Housing Structures in Uniondale
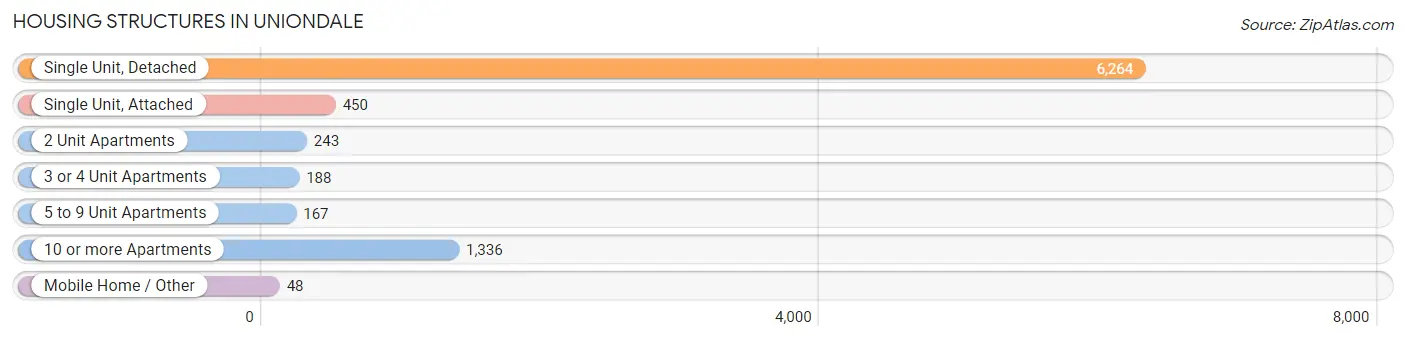
| Structure Type | # Housing Units | % Housing Units |
| Single Unit, Detached | 6,264 | 72.0% |
| Single Unit, Attached | 450 | 5.2% |
| 2 Unit Apartments | 243 | 2.8% |
| 3 or 4 Unit Apartments | 188 | 2.2% |
| 5 to 9 Unit Apartments | 167 | 1.9% |
| 10 or more Apartments | 1,336 | 15.4% |
| Mobile Home / Other | 48 | 0.5% |
| Total | 8,696 | 100.0% |
Housing Structures by Occupancy in Uniondale
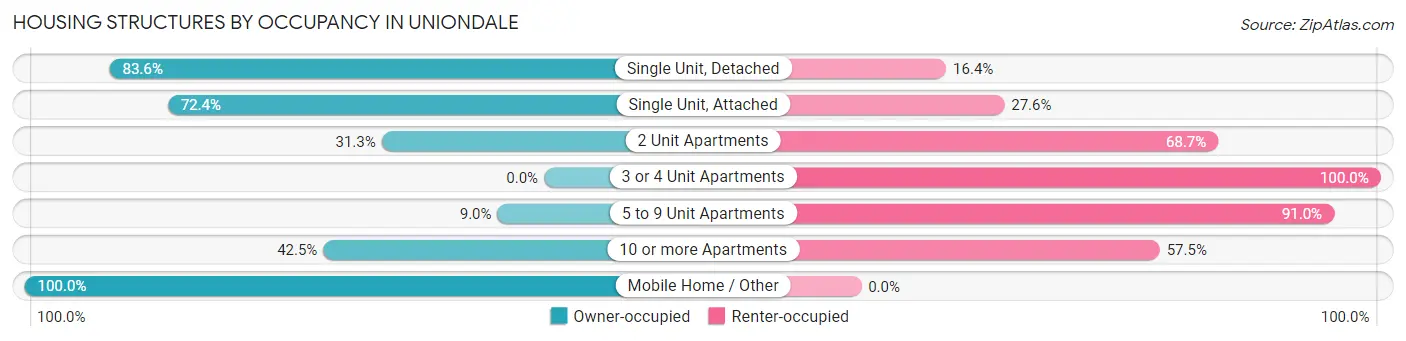
| Structure Type | Owner-occupied | Renter-occupied |
| Single Unit, Detached | 5,239 (83.6%) | 1,025 (16.4%) |
| Single Unit, Attached | 326 (72.4%) | 124 (27.6%) |
| 2 Unit Apartments | 76 (31.3%) | 167 (68.7%) |
| 3 or 4 Unit Apartments | 0 (0.0%) | 188 (100.0%) |
| 5 to 9 Unit Apartments | 15 (9.0%) | 152 (91.0%) |
| 10 or more Apartments | 568 (42.5%) | 768 (57.5%) |
| Mobile Home / Other | 48 (100.0%) | 0 (0.0%) |
| Total | 6,272 (72.1%) | 2,424 (27.9%) |
Housing Structures by Number of Rooms in Uniondale
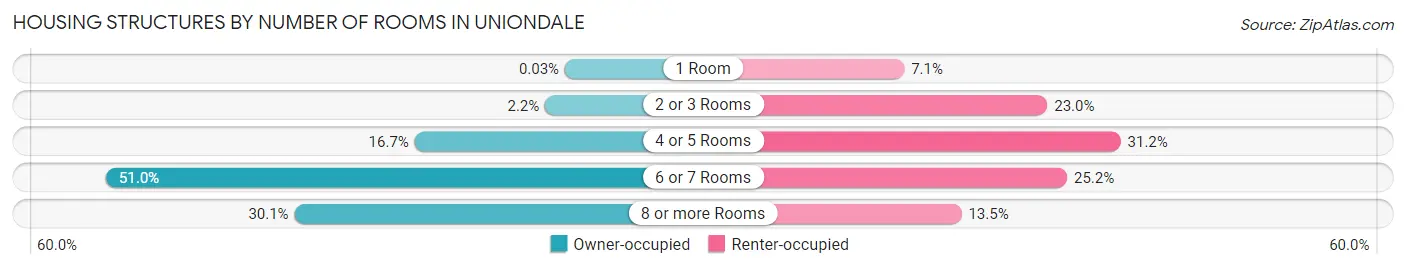
| Number of Rooms | Owner-occupied | Renter-occupied |
| 1 Room | 2 (0.0%) | 173 (7.1%) |
| 2 or 3 Rooms | 140 (2.2%) | 558 (23.0%) |
| 4 or 5 Rooms | 1,048 (16.7%) | 755 (31.1%) |
| 6 or 7 Rooms | 3,197 (51.0%) | 611 (25.2%) |
| 8 or more Rooms | 1,885 (30.0%) | 327 (13.5%) |
| Total | 6,272 (100.0%) | 2,424 (100.0%) |
Housing Structure by Heating Type in Uniondale
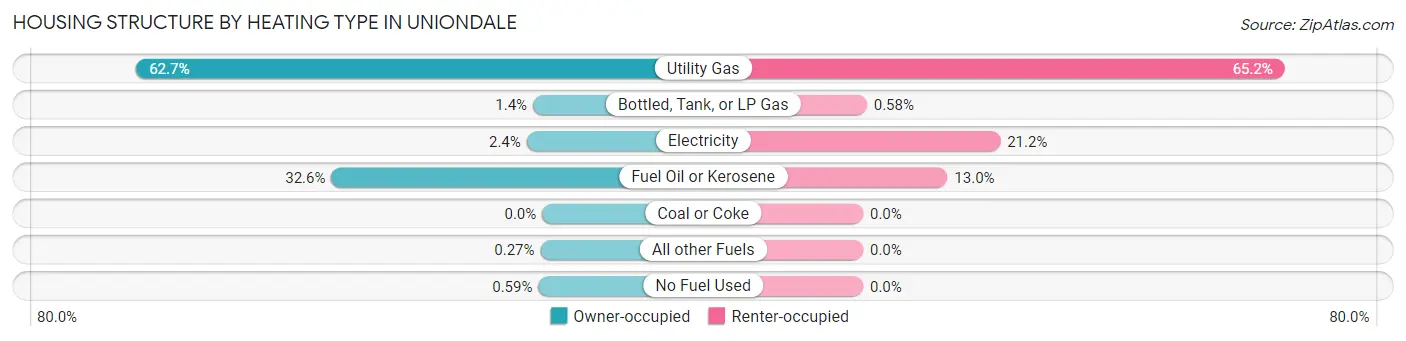
| Heating Type | Owner-occupied | Renter-occupied |
| Utility Gas | 3,935 (62.7%) | 1,580 (65.2%) |
| Bottled, Tank, or LP Gas | 89 (1.4%) | 14 (0.6%) |
| Electricity | 150 (2.4%) | 514 (21.2%) |
| Fuel Oil or Kerosene | 2,044 (32.6%) | 316 (13.0%) |
| Coal or Coke | 0 (0.0%) | 0 (0.0%) |
| All other Fuels | 17 (0.3%) | 0 (0.0%) |
| No Fuel Used | 37 (0.6%) | 0 (0.0%) |
| Total | 6,272 (100.0%) | 2,424 (100.0%) |
Household Vehicle Usage in Uniondale
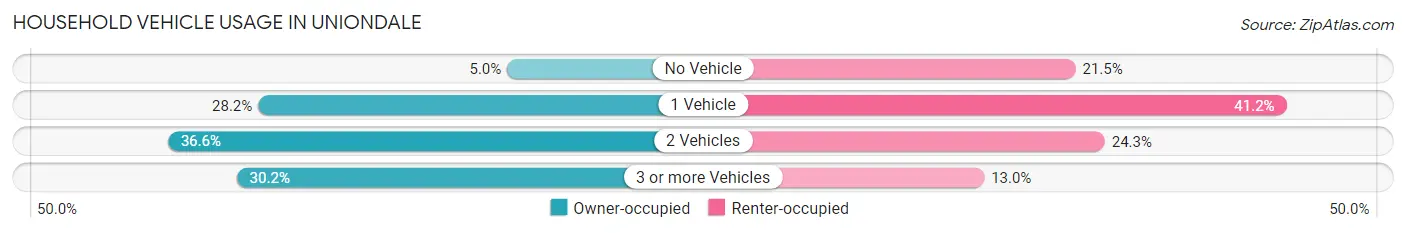
| Vehicles per Household | Owner-occupied | Renter-occupied |
| No Vehicle | 311 (5.0%) | 522 (21.5%) |
| 1 Vehicle | 1,769 (28.2%) | 999 (41.2%) |
| 2 Vehicles | 2,298 (36.6%) | 588 (24.3%) |
| 3 or more Vehicles | 1,894 (30.2%) | 315 (13.0%) |
| Total | 6,272 (100.0%) | 2,424 (100.0%) |
Real Estate & Mortgages in Uniondale
Real Estate and Mortgage Overview in Uniondale
| Characteristic | Without Mortgage | With Mortgage |
| Housing Units | 1,850 | 4,422 |
| Median Property Value | $502,200 | $459,800 |
| Median Household Income | $117,500 | $1,536 |
| Monthly Housing Costs | $1,409 | $1,990 |
| Real Estate Taxes | $9,085 | $90 |
Property Value by Mortgage Status in Uniondale
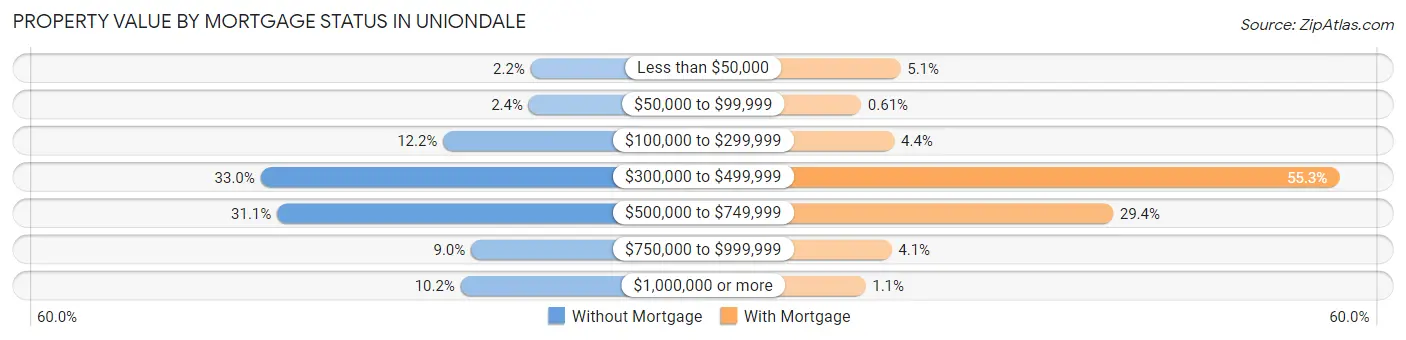
| Property Value | Without Mortgage | With Mortgage |
| Less than $50,000 | 40 (2.2%) | 226 (5.1%) |
| $50,000 to $99,999 | 44 (2.4%) | 27 (0.6%) |
| $100,000 to $299,999 | 225 (12.2%) | 195 (4.4%) |
| $300,000 to $499,999 | 611 (33.0%) | 2,444 (55.3%) |
| $500,000 to $749,999 | 576 (31.1%) | 1,300 (29.4%) |
| $750,000 to $999,999 | 166 (9.0%) | 181 (4.1%) |
| $1,000,000 or more | 188 (10.2%) | 49 (1.1%) |
| Total | 1,850 (100.0%) | 4,422 (100.0%) |
Household Income by Mortgage Status in Uniondale
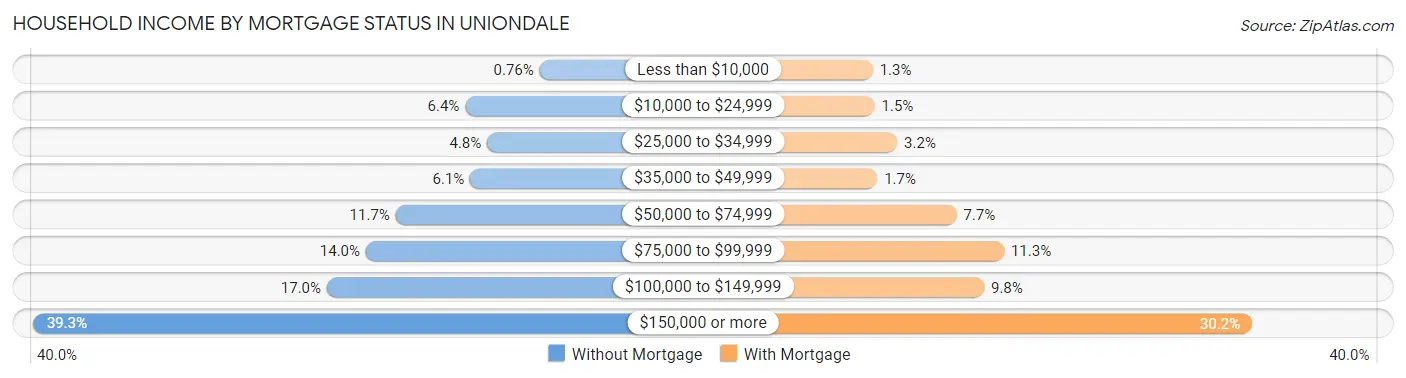
| Household Income | Without Mortgage | With Mortgage |
| Less than $10,000 | 14 (0.8%) | 58 (1.3%) |
| $10,000 to $24,999 | 119 (6.4%) | 64 (1.5%) |
| $25,000 to $34,999 | 88 (4.8%) | 140 (3.2%) |
| $35,000 to $49,999 | 112 (6.0%) | 73 (1.7%) |
| $50,000 to $74,999 | 217 (11.7%) | 340 (7.7%) |
| $75,000 to $99,999 | 259 (14.0%) | 500 (11.3%) |
| $100,000 to $149,999 | 314 (17.0%) | 433 (9.8%) |
| $150,000 or more | 727 (39.3%) | 1,336 (30.2%) |
| Total | 1,850 (100.0%) | 4,422 (100.0%) |
Property Value to Household Income Ratio in Uniondale
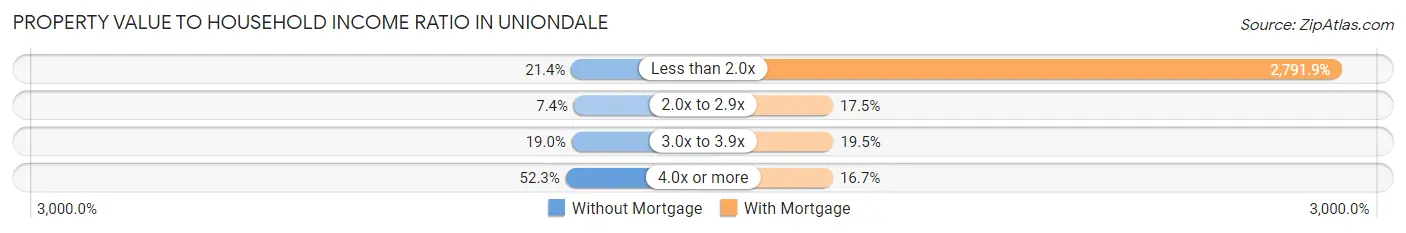
| Value-to-Income Ratio | Without Mortgage | With Mortgage |
| Less than 2.0x | 395 (21.3%) | 123,458 (2,791.9%) |
| 2.0x to 2.9x | 136 (7.3%) | 774 (17.5%) |
| 3.0x to 3.9x | 351 (19.0%) | 862 (19.5%) |
| 4.0x or more | 968 (52.3%) | 738 (16.7%) |
| Total | 1,850 (100.0%) | 4,422 (100.0%) |
Real Estate Taxes by Mortgage Status in Uniondale
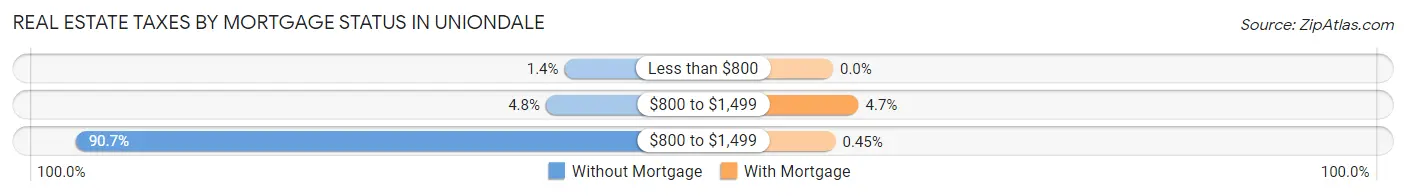
| Property Taxes | Without Mortgage | With Mortgage |
| Less than $800 | 26 (1.4%) | 0 (0.0%) |
| $800 to $1,499 | 89 (4.8%) | 206 (4.7%) |
| $800 to $1,499 | 1,677 (90.6%) | 20 (0.4%) |
| Total | 1,850 (100.0%) | 4,422 (100.0%) |
Health & Disability in Uniondale
Health Insurance Coverage by Age in Uniondale
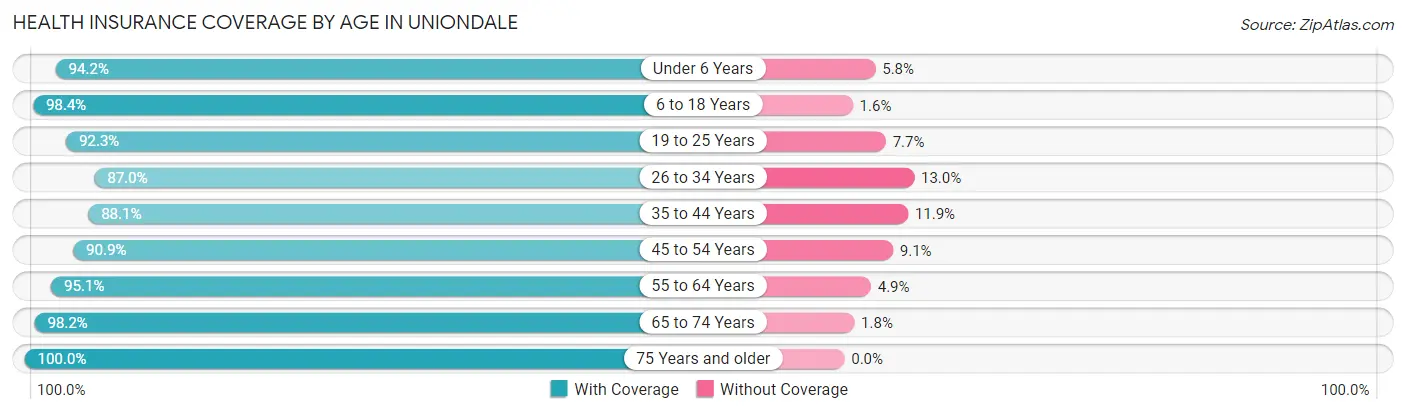
| Age Bracket | With Coverage | Without Coverage |
| Under 6 Years | 2,398 (94.2%) | 147 (5.8%) |
| 6 to 18 Years | 4,974 (98.4%) | 79 (1.6%) |
| 19 to 25 Years | 4,603 (92.3%) | 385 (7.7%) |
| 26 to 34 Years | 3,499 (87.0%) | 523 (13.0%) |
| 35 to 44 Years | 3,297 (88.1%) | 444 (11.9%) |
| 45 to 54 Years | 3,432 (90.9%) | 342 (9.1%) |
| 55 to 64 Years | 3,043 (95.1%) | 158 (4.9%) |
| 65 to 74 Years | 2,874 (98.2%) | 54 (1.8%) |
| 75 Years and older | 2,262 (100.0%) | 0 (0.0%) |
| Total | 30,382 (93.4%) | 2,132 (6.6%) |
Health Insurance Coverage by Citizenship Status in Uniondale
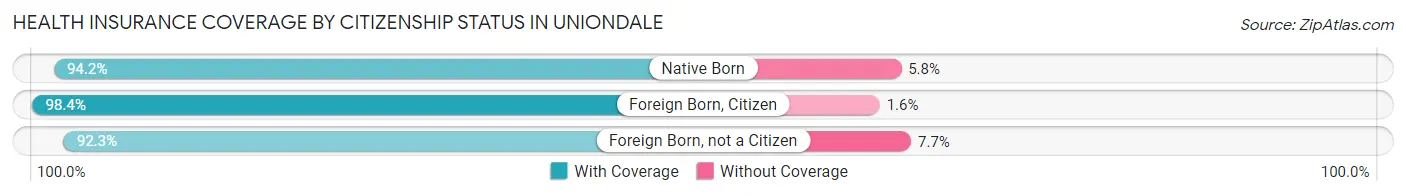
| Citizenship Status | With Coverage | Without Coverage |
| Native Born | 2,398 (94.2%) | 147 (5.8%) |
| Foreign Born, Citizen | 4,974 (98.4%) | 79 (1.6%) |
| Foreign Born, not a Citizen | 4,603 (92.3%) | 385 (7.7%) |
Health Insurance Coverage by Household Income in Uniondale
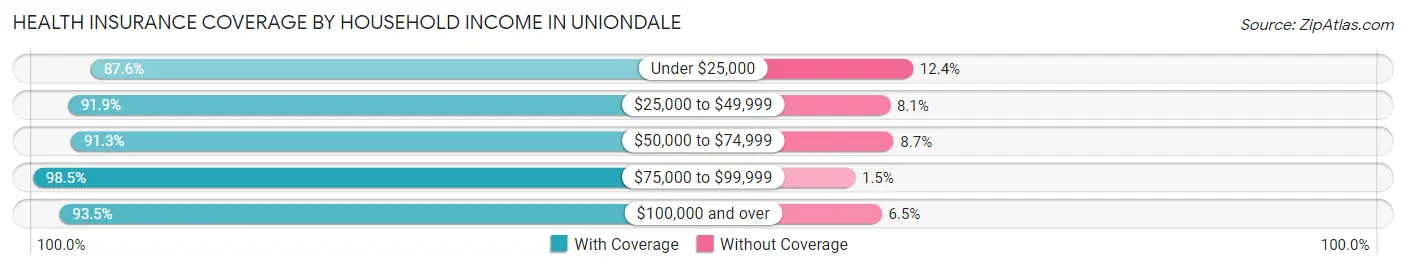
| Household Income | With Coverage | Without Coverage |
| Under $25,000 | 1,181 (87.6%) | 167 (12.4%) |
| $25,000 to $49,999 | 2,867 (91.9%) | 252 (8.1%) |
| $50,000 to $74,999 | 3,169 (91.3%) | 303 (8.7%) |
| $75,000 to $99,999 | 2,242 (98.5%) | 35 (1.5%) |
| $100,000 and over | 17,906 (93.5%) | 1,249 (6.5%) |
Public vs Private Health Insurance Coverage by Age in Uniondale
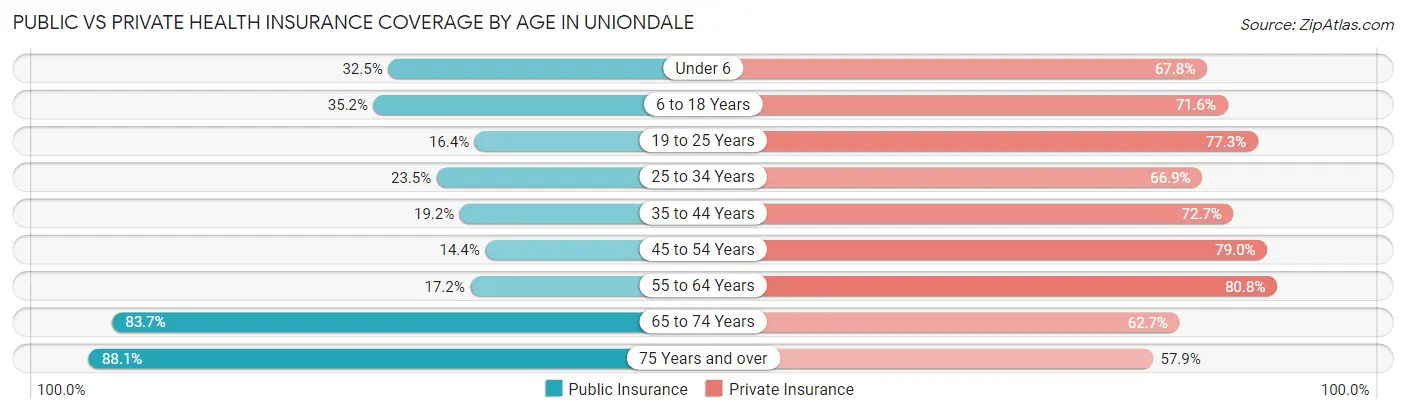
| Age Bracket | Public Insurance | Private Insurance |
| Under 6 | 826 (32.5%) | 1,725 (67.8%) |
| 6 to 18 Years | 1,777 (35.2%) | 3,619 (71.6%) |
| 19 to 25 Years | 818 (16.4%) | 3,853 (77.2%) |
| 25 to 34 Years | 943 (23.4%) | 2,692 (66.9%) |
| 35 to 44 Years | 717 (19.2%) | 2,721 (72.7%) |
| 45 to 54 Years | 545 (14.4%) | 2,981 (79.0%) |
| 55 to 64 Years | 552 (17.2%) | 2,587 (80.8%) |
| 65 to 74 Years | 2,451 (83.7%) | 1,837 (62.7%) |
| 75 Years and over | 1,992 (88.1%) | 1,309 (57.9%) |
| Total | 10,621 (32.7%) | 23,324 (71.7%) |
Disability Status by Sex by Age in Uniondale
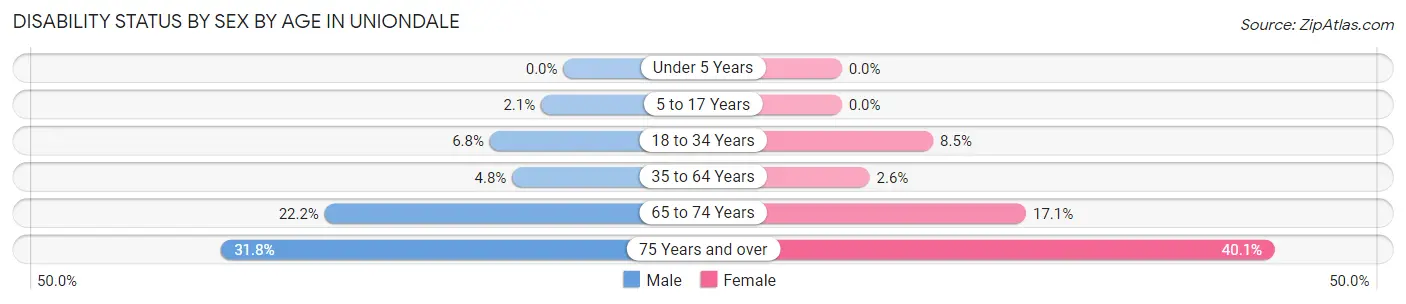
| Age Bracket | Male | Female |
| Under 5 Years | 0 (0.0%) | 0 (0.0%) |
| 5 to 17 Years | 48 (2.1%) | 0 (0.0%) |
| 18 to 34 Years | 310 (6.8%) | 469 (8.5%) |
| 35 to 64 Years | 269 (4.8%) | 130 (2.6%) |
| 65 to 74 Years | 260 (22.2%) | 300 (17.1%) |
| 75 Years and over | 274 (31.8%) | 561 (40.1%) |
Disability Class by Sex by Age in Uniondale
Disability Class: Hearing Difficulty
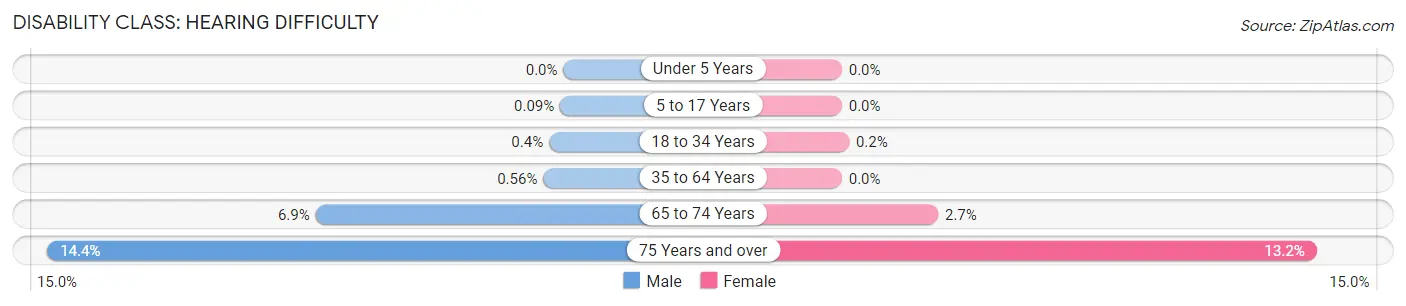
| Age Bracket | Male | Female |
| Under 5 Years | 0 (0.0%) | 0 (0.0%) |
| 5 to 17 Years | 2 (0.1%) | 0 (0.0%) |
| 18 to 34 Years | 18 (0.4%) | 11 (0.2%) |
| 35 to 64 Years | 32 (0.6%) | 0 (0.0%) |
| 65 to 74 Years | 81 (6.9%) | 47 (2.7%) |
| 75 Years and over | 124 (14.4%) | 185 (13.2%) |
Disability Class: Vision Difficulty
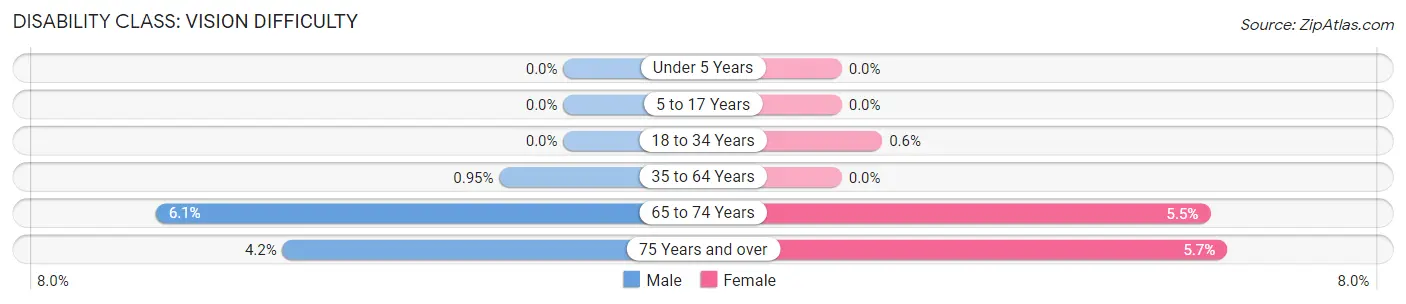
| Age Bracket | Male | Female |
| Under 5 Years | 0 (0.0%) | 0 (0.0%) |
| 5 to 17 Years | 0 (0.0%) | 0 (0.0%) |
| 18 to 34 Years | 0 (0.0%) | 33 (0.6%) |
| 35 to 64 Years | 54 (0.9%) | 0 (0.0%) |
| 65 to 74 Years | 71 (6.0%) | 96 (5.5%) |
| 75 Years and over | 36 (4.2%) | 80 (5.7%) |
Disability Class: Cognitive Difficulty
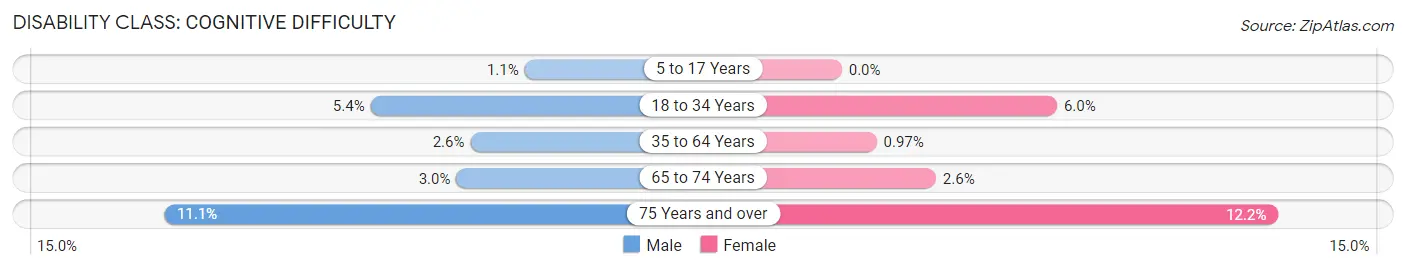
| Age Bracket | Male | Female |
| 5 to 17 Years | 25 (1.1%) | 0 (0.0%) |
| 18 to 34 Years | 244 (5.4%) | 331 (6.0%) |
| 35 to 64 Years | 147 (2.6%) | 49 (1.0%) |
| 65 to 74 Years | 35 (3.0%) | 46 (2.6%) |
| 75 Years and over | 96 (11.1%) | 170 (12.1%) |
Disability Class: Ambulatory Difficulty
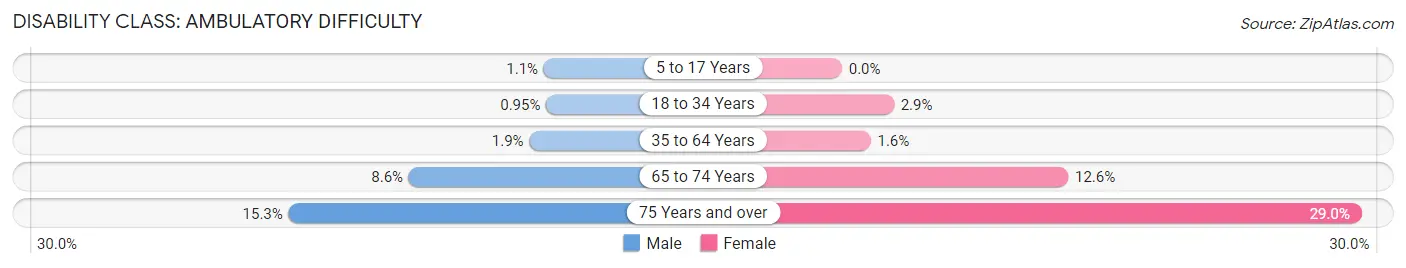
| Age Bracket | Male | Female |
| 5 to 17 Years | 25 (1.1%) | 0 (0.0%) |
| 18 to 34 Years | 43 (0.9%) | 160 (2.9%) |
| 35 to 64 Years | 107 (1.9%) | 81 (1.6%) |
| 65 to 74 Years | 101 (8.6%) | 221 (12.6%) |
| 75 Years and over | 132 (15.3%) | 405 (28.9%) |
Disability Class: Self-Care Difficulty
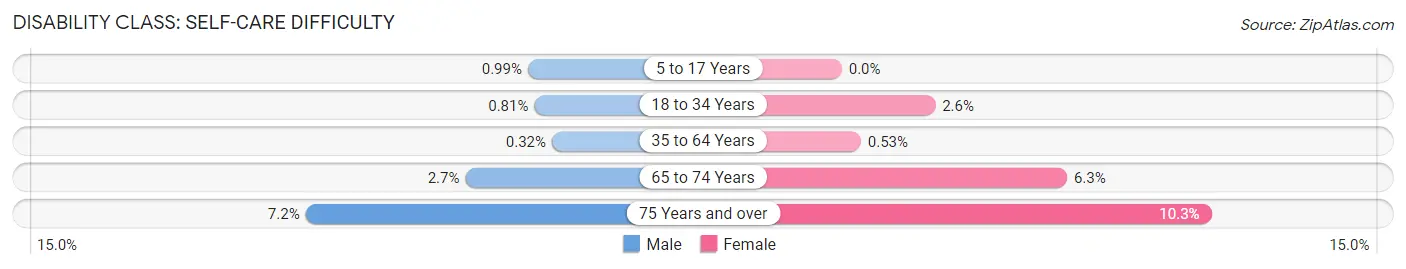
| Age Bracket | Male | Female |
| 5 to 17 Years | 23 (1.0%) | 0 (0.0%) |
| 18 to 34 Years | 37 (0.8%) | 144 (2.6%) |
| 35 to 64 Years | 18 (0.3%) | 27 (0.5%) |
| 65 to 74 Years | 32 (2.7%) | 110 (6.3%) |
| 75 Years and over | 62 (7.2%) | 144 (10.3%) |
Technology Access in Uniondale
Computing Device Access in Uniondale
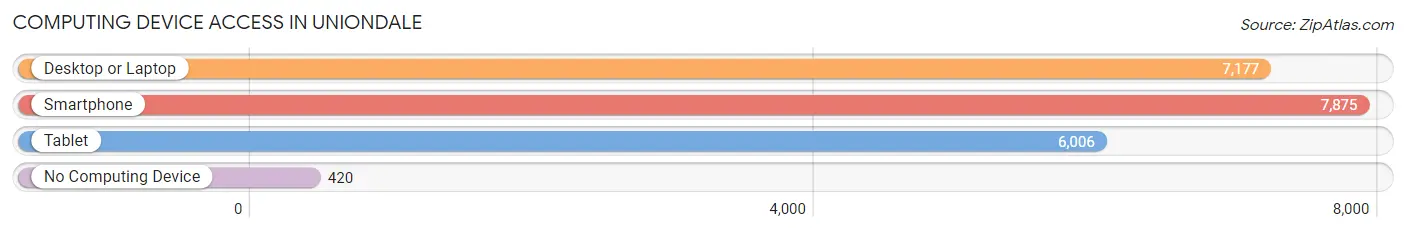
| Device Type | # Households | % Households |
| Desktop or Laptop | 7,177 | 82.5% |
| Smartphone | 7,875 | 90.6% |
| Tablet | 6,006 | 69.1% |
| No Computing Device | 420 | 4.8% |
| Total | 8,696 | 100.0% |
Internet Access in Uniondale
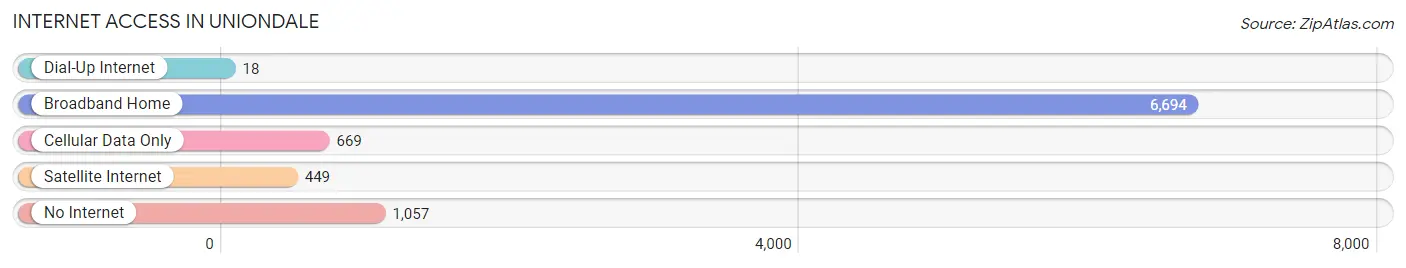
| Internet Type | # Households | % Households |
| Dial-Up Internet | 18 | 0.2% |
| Broadband Home | 6,694 | 77.0% |
| Cellular Data Only | 669 | 7.7% |
| Satellite Internet | 449 | 5.2% |
| No Internet | 1,057 | 12.2% |
| Total | 8,696 | 100.0% |
Uniondale Summary
Introduction
Uniondale is a hamlet and census-designated place (CDP) located in Nassau County, New York, United States. It is located on Long Island, approximately 20 miles east of Manhattan. The hamlet is part of the Town of Hempstead and is located in the heart of Nassau County. Uniondale is a diverse community with a population of 24,759 as of the 2010 census.
History
Uniondale was originally known as “Fosters Meadow” and was settled in 1643 by Thomas Foster. The area was renamed Uniondale in 1844 when the Union Course Race Track was built. The track was a popular destination for horse racing and attracted many visitors from New York City. The track was eventually closed in 1881 and the area was developed into residential neighborhoods.
In the early 20th century, Uniondale was a rural farming community. The area was transformed in the 1950s when the Long Island Expressway was built, connecting Uniondale to New York City. This made Uniondale a desirable place to live and the population began to grow.
Geography
Uniondale is located at 40°43'25" North, 73°35'17" West (40.723, -73.588). It is situated in the Town of Hempstead in Nassau County, New York. Uniondale is bordered by the hamlets of Hempstead, East Meadow, and Levittown.
Uniondale is located on the south shore of Long Island, approximately 20 miles east of Manhattan. The hamlet is situated between the Hempstead Plains and the Hempstead Harbor. Uniondale is located in the Nassau-Suffolk metropolitan area and is part of the New York metropolitan area.
Economy
Uniondale is home to several large businesses and corporations, including the Nassau Coliseum, Hofstra University, and the Nassau Veterans Memorial Coliseum. The hamlet is also home to several small businesses, including restaurants, retail stores, and professional services.
Uniondale is also home to several industrial parks, including the Nassau Hub, which is home to several large companies, including Canon USA, Northrop Grumman, and the New York Institute of Technology.
Demographics
As of the 2010 census, Uniondale had a population of 24,759. The racial makeup of the hamlet was 44.3% White, 33.3% African American, 0.3% Native American, 11.2% Asian, 0.1% Pacific Islander, 8.2% from other races, and 2.6% from two or more races. Hispanic or Latino of any race were 18.2% of the population.
The median income for a household in Uniondale was $60,945, and the median income for a family was $68,945. The per capita income for the hamlet was $25,945. About 11.2% of families and 13.3% of the population were below the poverty line, including 17.2% of those under age 18 and 8.2% of those age 65 or over.
Conclusion
Uniondale is a hamlet and census-designated place located in Nassau County, New York. It is located on Long Island, approximately 20 miles east of Manhattan. Uniondale is a diverse community with a population of 24,759 as of the 2010 census. The hamlet is home to several large businesses and corporations, including the Nassau Coliseum, Hofstra University, and the Nassau Veterans Memorial Coliseum. The racial makeup of the hamlet was 44.3% White, 33.3% African American, 0.3% Native American, 11.2% Asian, 0.1% Pacific Islander, 8.2% from other races, and 2.6% from two or more races. The median income for a household in Uniondale was $60,945, and the median income for a family was $68,945. Uniondale is a vibrant community with a rich history and a bright future.
Common Questions
What is Per Capita Income in Uniondale?
Per Capita income in Uniondale is $35,429.
What is the Median Family Income in Uniondale?
Median Family Income in Uniondale is $114,083.
What is the Median Household income in Uniondale?
Median Household Income in Uniondale is $107,885.
What is Income or Wage Gap in Uniondale?
Income or Wage Gap in Uniondale is 44.6%.
Women in Uniondale earn 55.4 cents for every dollar earned by a man.
What is Inequality or Gini Index in Uniondale?
Inequality or Gini Index in Uniondale is 0.43.
What is the Total Population of Uniondale?
Total Population of Uniondale is 33,192.
What is the Total Male Population of Uniondale?
Total Male Population of Uniondale is 15,841.
What is the Total Female Population of Uniondale?
Total Female Population of Uniondale is 17,351.
What is the Ratio of Males per 100 Females in Uniondale?
There are 91.30 Males per 100 Females in Uniondale.
What is the Ratio of Females per 100 Males in Uniondale?
There are 109.53 Females per 100 Males in Uniondale.
What is the Median Population Age in Uniondale?
Median Population Age in Uniondale is 34.9 Years.
What is the Average Family Size in Uniondale
Average Family Size in Uniondale is 3.7 People.
What is the Average Household Size in Uniondale
Average Household Size in Uniondale is 3.4 People.
How Large is the Labor Force in Uniondale?
There are 16,496 People in the Labor Forcein in Uniondale.
What is the Percentage of People in the Labor Force in Uniondale?
59.9% of People are in the Labor Force in Uniondale.
What is the Unemployment Rate in Uniondale?
Unemployment Rate in Uniondale is 6.4%.