Sunnyside, WA Map & Demographics
Sunnyside Map
Sunnyside Overview
$17,298
PER CAPITA INCOME
$56,438
AVG FAMILY INCOME
$49,134
AVG HOUSEHOLD INCOME
13.2%
WAGE / INCOME GAP [ % ]
86.8¢/ $1
WAGE / INCOME GAP [ $ ]
$10,433
FAMILY INCOME DEFICIT
0.38
INEQUALITY / GINI INDEX
16,329
TOTAL POPULATION
8,376
MALE POPULATION
7,953
FEMALE POPULATION
105.32
MALES / 100 FEMALES
94.95
FEMALES / 100 MALES
27.1
MEDIAN AGE
4.3
AVG FAMILY SIZE
3.6
AVG HOUSEHOLD SIZE
6,881
LABOR FORCE [ PEOPLE ]
65.2%
PERCENT IN LABOR FORCE
8.9%
UNEMPLOYMENT RATE
Sunnyside Zip Codes
Sunnyside Area Codes
Income in Sunnyside
Income Overview in Sunnyside
Per Capita Income in Sunnyside is $17,298, while median incomes of families and households are $56,438 and $49,134 respectively.
| Characteristic | Number | Measure |
| Per Capita Income | 16,329 | $17,298 |
| Median Family Income | 3,347 | $56,438 |
| Mean Family Income | 3,347 | $68,224 |
| Median Household Income | 4,429 | $49,134 |
| Mean Household Income | 4,429 | $61,953 |
| Income Deficit | 3,347 | $10,433 |
| Wage / Income Gap (%) | 16,329 | 13.22% |
| Wage / Income Gap ($) | 16,329 | 86.78¢ per $1 |
| Gini / Inequality Index | 16,329 | 0.38 |
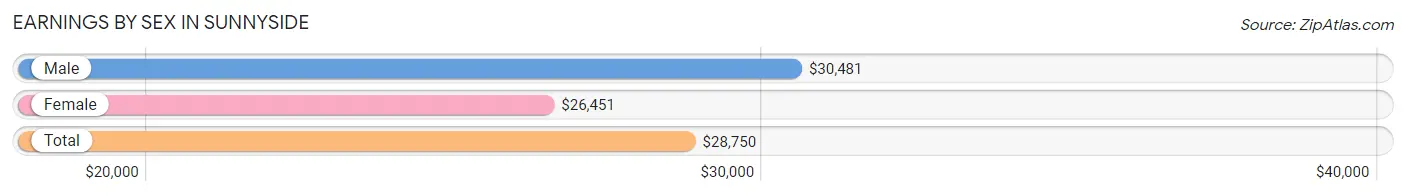
Earnings by Sex in Sunnyside
Average Earnings in Sunnyside are $28,750, $30,481 for men and $26,451 for women, a difference of 13.2%.
| Sex | Number | Average Earnings |
| Male | 3,947 (55.5%) | $30,481 |
| Female | 3,163 (44.5%) | $26,451 |
| Total | 7,110 (100.0%) | $28,750 |
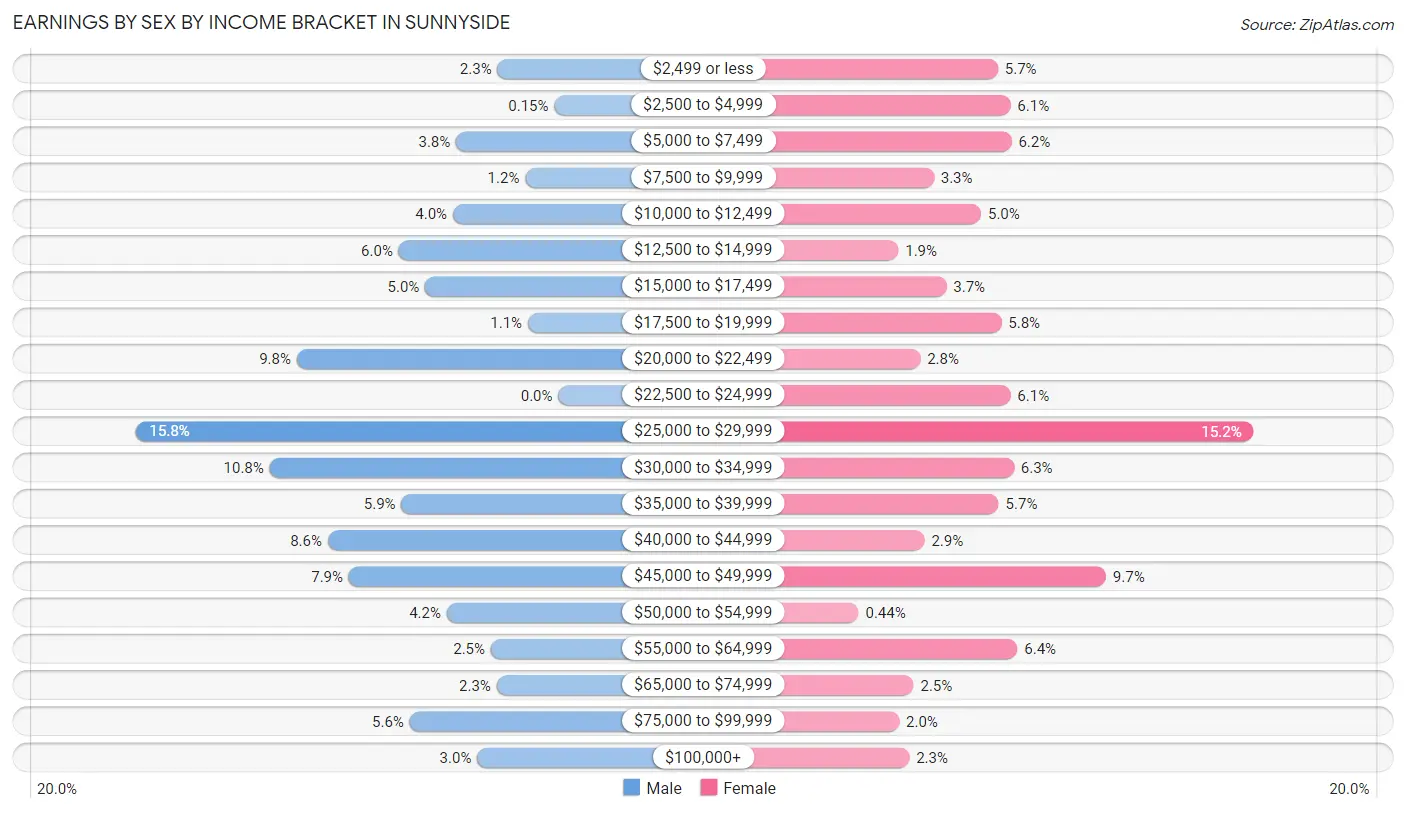
Earnings by Sex by Income Bracket in Sunnyside
The most common earnings brackets in Sunnyside are $25,000 to $29,999 for men (624 | 15.8%) and $25,000 to $29,999 for women (482 | 15.2%).
| Income | Male | Female |
| $2,499 or less | 90 (2.3%) | 179 (5.7%) |
| $2,500 to $4,999 | 6 (0.2%) | 194 (6.1%) |
| $5,000 to $7,499 | 151 (3.8%) | 195 (6.2%) |
| $7,500 to $9,999 | 49 (1.2%) | 103 (3.3%) |
| $10,000 to $12,499 | 156 (4.0%) | 159 (5.0%) |
| $12,500 to $14,999 | 236 (6.0%) | 61 (1.9%) |
| $15,000 to $17,499 | 197 (5.0%) | 118 (3.7%) |
| $17,500 to $19,999 | 45 (1.1%) | 183 (5.8%) |
| $20,000 to $22,499 | 387 (9.8%) | 87 (2.8%) |
| $22,500 to $24,999 | 0 (0.0%) | 194 (6.1%) |
| $25,000 to $29,999 | 624 (15.8%) | 482 (15.2%) |
| $30,000 to $34,999 | 427 (10.8%) | 198 (6.3%) |
| $35,000 to $39,999 | 232 (5.9%) | 180 (5.7%) |
| $40,000 to $44,999 | 341 (8.6%) | 92 (2.9%) |
| $45,000 to $49,999 | 310 (7.9%) | 307 (9.7%) |
| $50,000 to $54,999 | 165 (4.2%) | 14 (0.4%) |
| $55,000 to $64,999 | 100 (2.5%) | 202 (6.4%) |
| $65,000 to $74,999 | 91 (2.3%) | 79 (2.5%) |
| $75,000 to $99,999 | 220 (5.6%) | 62 (2.0%) |
| $100,000+ | 120 (3.0%) | 74 (2.3%) |
| Total | 3,947 (100.0%) | 3,163 (100.0%) |
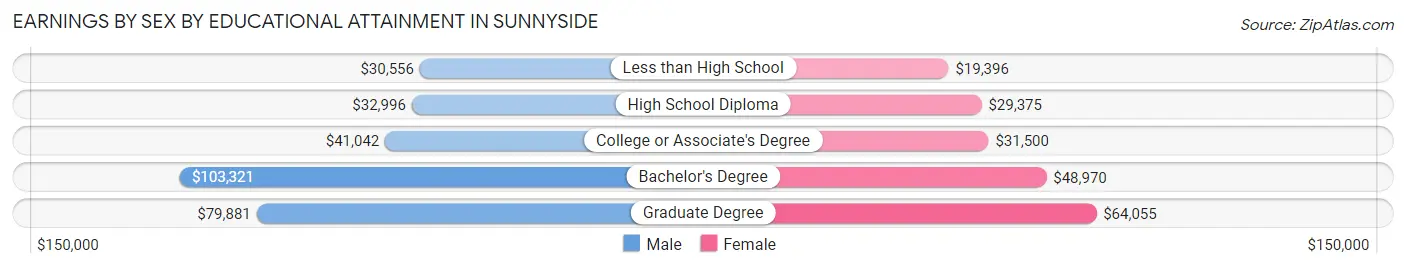
Earnings by Sex by Educational Attainment in Sunnyside
Average earnings in Sunnyside are $33,401 for men and $28,144 for women, a difference of 15.7%. Men with an educational attainment of bachelor's degree enjoy the highest average annual earnings of $103,321, while those with less than high school education earn the least with $30,556. Women with an educational attainment of graduate degree earn the most with the average annual earnings of $64,055, while those with less than high school education have the smallest earnings of $19,396.
| Educational Attainment | Male Income | Female Income |
| Less than High School | $30,556 | $19,396 |
| High School Diploma | $32,996 | $29,375 |
| College or Associate's Degree | $41,042 | $31,500 |
| Bachelor's Degree | $103,321 | $48,970 |
| Graduate Degree | $79,881 | $64,055 |
| Total | $33,401 | $28,144 |
Family Income in Sunnyside
Family Income Brackets in Sunnyside
According to the Sunnyside family income data, there are 914 families falling into the $50,000 to $74,999 income range, which is the most common income bracket and makes up 27.3% of all families. Conversely, the $10,000 to $14,999 income bracket is the least frequent group with only 47 families (1.4%) belonging to this category.
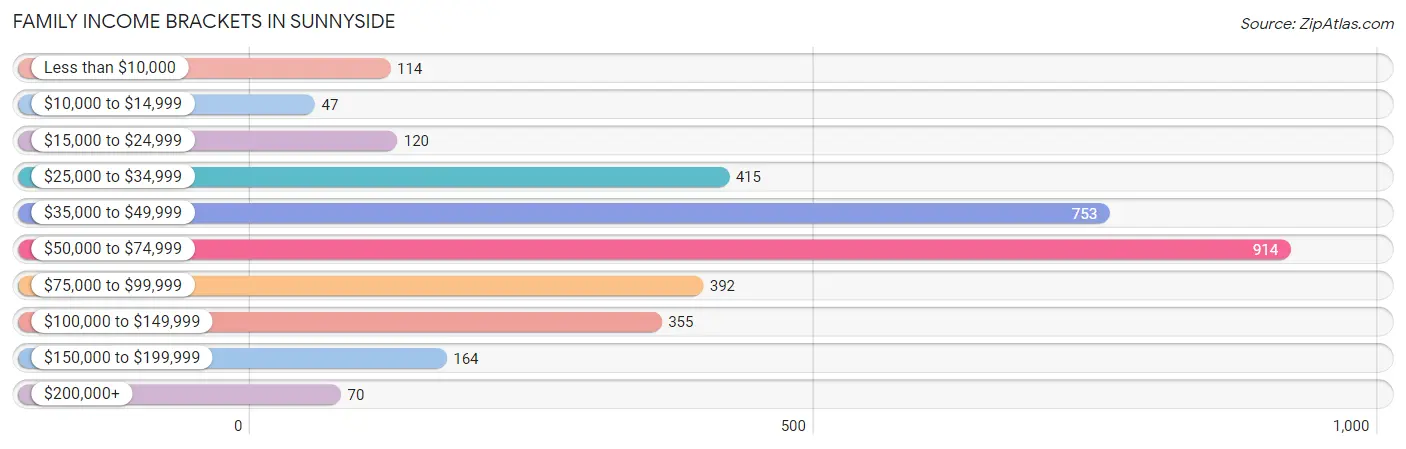
| Income Bracket | # Families | % Families |
| Less than $10,000 | 114 | 3.4% |
| $10,000 to $14,999 | 47 | 1.4% |
| $15,000 to $24,999 | 120 | 3.6% |
| $25,000 to $34,999 | 415 | 12.4% |
| $35,000 to $49,999 | 753 | 22.5% |
| $50,000 to $74,999 | 914 | 27.3% |
| $75,000 to $99,999 | 392 | 11.7% |
| $100,000 to $149,999 | 355 | 10.6% |
| $150,000 to $199,999 | 164 | 4.9% |
| $200,000+ | 70 | 2.1% |
Family Income by Famaliy Size in Sunnyside
2-person families (756 | 22.6%) account for the highest median family income in Sunnyside with $63,095 per family, while 2-person families (756 | 22.6%) have the highest median income of $31,548 per family member.
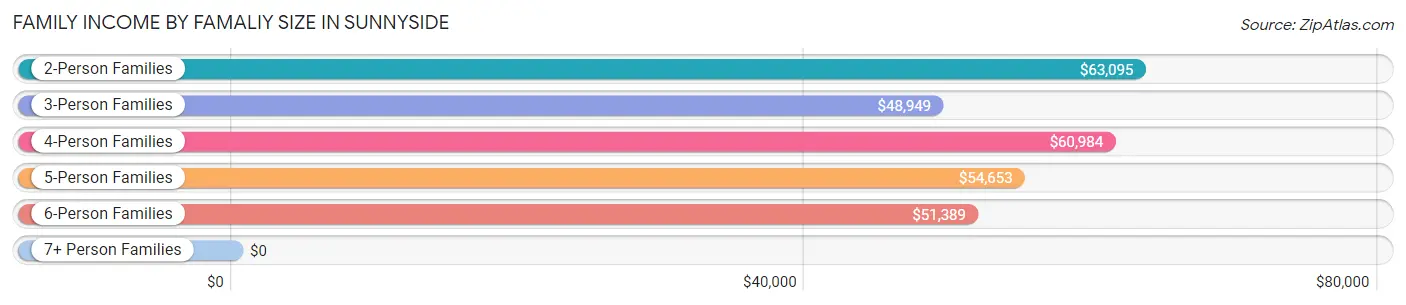
| Income Bracket | # Families | Median Income |
| 2-Person Families | 756 (22.6%) | $63,095 |
| 3-Person Families | 598 (17.9%) | $48,949 |
| 4-Person Families | 671 (20.1%) | $60,984 |
| 5-Person Families | 882 (26.4%) | $54,653 |
| 6-Person Families | 400 (11.9%) | $51,389 |
| 7+ Person Families | 40 (1.2%) | $0 |
| Total | 3,347 (100.0%) | $56,438 |
Family Income by Number of Earners in Sunnyside
The median family income in Sunnyside is $56,438, with families comprising 3+ earners (558) having the highest median family income of $96,250, while families with no earners (135) have the lowest median family income of $33,940, accounting for 16.7% and 4.0% of families, respectively.
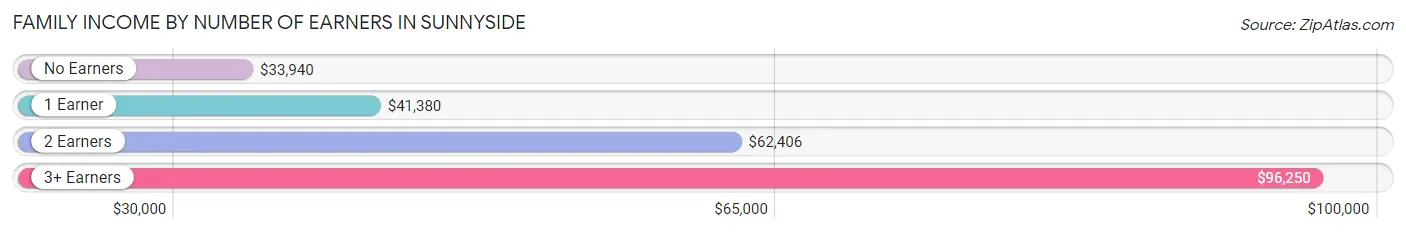
| Number of Earners | # Families | Median Income |
| No Earners | 135 (4.0%) | $33,940 |
| 1 Earner | 1,144 (34.2%) | $41,380 |
| 2 Earners | 1,510 (45.1%) | $62,406 |
| 3+ Earners | 558 (16.7%) | $96,250 |
| Total | 3,347 (100.0%) | $56,438 |
Household Income in Sunnyside
Household Income Brackets in Sunnyside
With 1,005 households falling in the category, the $50,000 to $74,999 income range is the most frequent in Sunnyside, accounting for 22.7% of all households. In contrast, only 84 households (1.9%) fall into the $200,000+ income bracket, making it the least populous group.
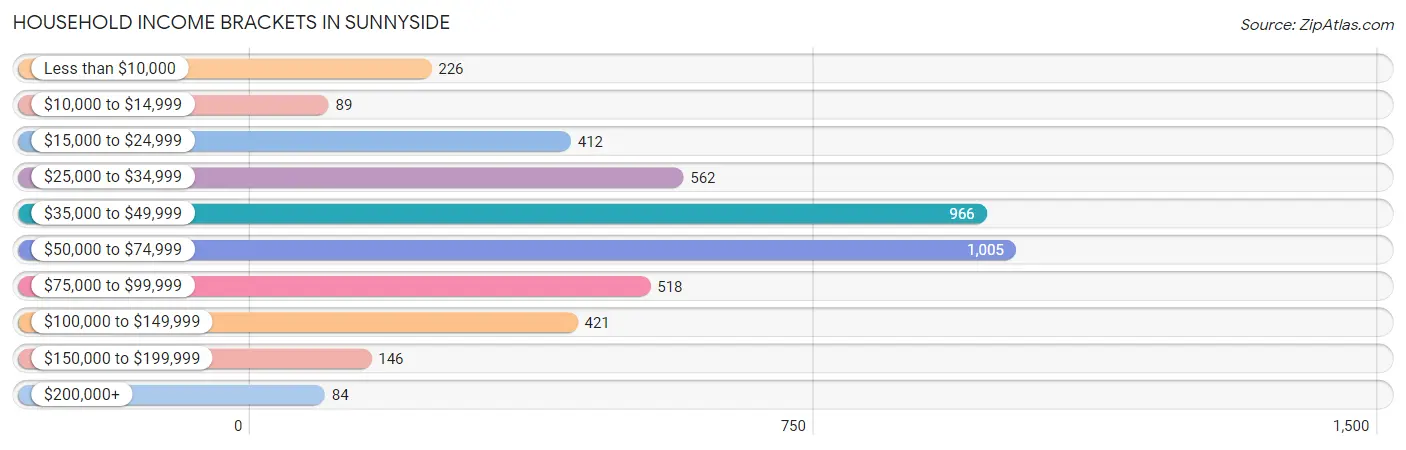
| Income Bracket | # Households | % Households |
| Less than $10,000 | 226 | 5.1% |
| $10,000 to $14,999 | 89 | 2.0% |
| $15,000 to $24,999 | 412 | 9.3% |
| $25,000 to $34,999 | 562 | 12.7% |
| $35,000 to $49,999 | 966 | 21.8% |
| $50,000 to $74,999 | 1,005 | 22.7% |
| $75,000 to $99,999 | 518 | 11.7% |
| $100,000 to $149,999 | 421 | 9.5% |
| $150,000 to $199,999 | 146 | 3.3% |
| $200,000+ | 84 | 1.9% |
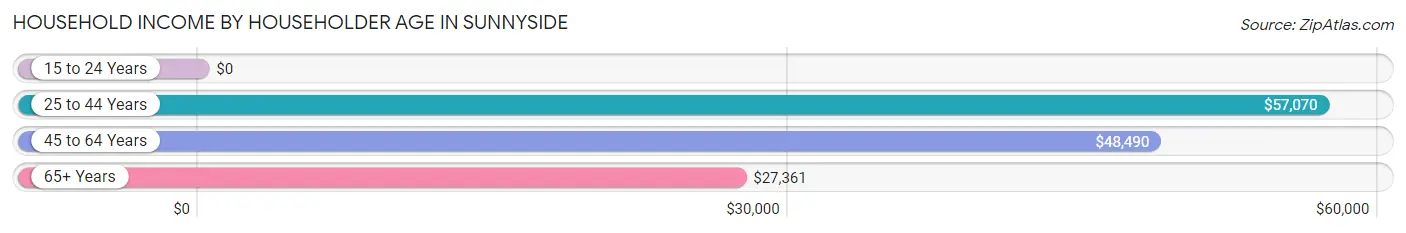
Household Income by Householder Age in Sunnyside
The median household income in Sunnyside is $49,134, with the highest median household income of $57,070 found in the 25 to 44 years age bracket for the primary householder. A total of 1,923 households (43.4%) fall into this category. Meanwhile, the 15 to 24 years age bracket for the primary householder has the lowest median household income of $0, with 157 households (3.5%) in this group.
| Income Bracket | # Households | Median Income |
| 15 to 24 Years | 157 (3.5%) | $0 |
| 25 to 44 Years | 1,923 (43.4%) | $57,070 |
| 45 to 64 Years | 1,406 (31.8%) | $48,490 |
| 65+ Years | 943 (21.3%) | $27,361 |
| Total | 4,429 (100.0%) | $49,134 |
Poverty in Sunnyside
Income Below Poverty by Sex and Age in Sunnyside
With 11.0% poverty level for males and 16.3% for females among the residents of Sunnyside, 12 to 14 year old males and 15 year old females are the most vulnerable to poverty, with 125 males (22.9%) and 33 females (36.7%) in their respective age groups living below the poverty level.
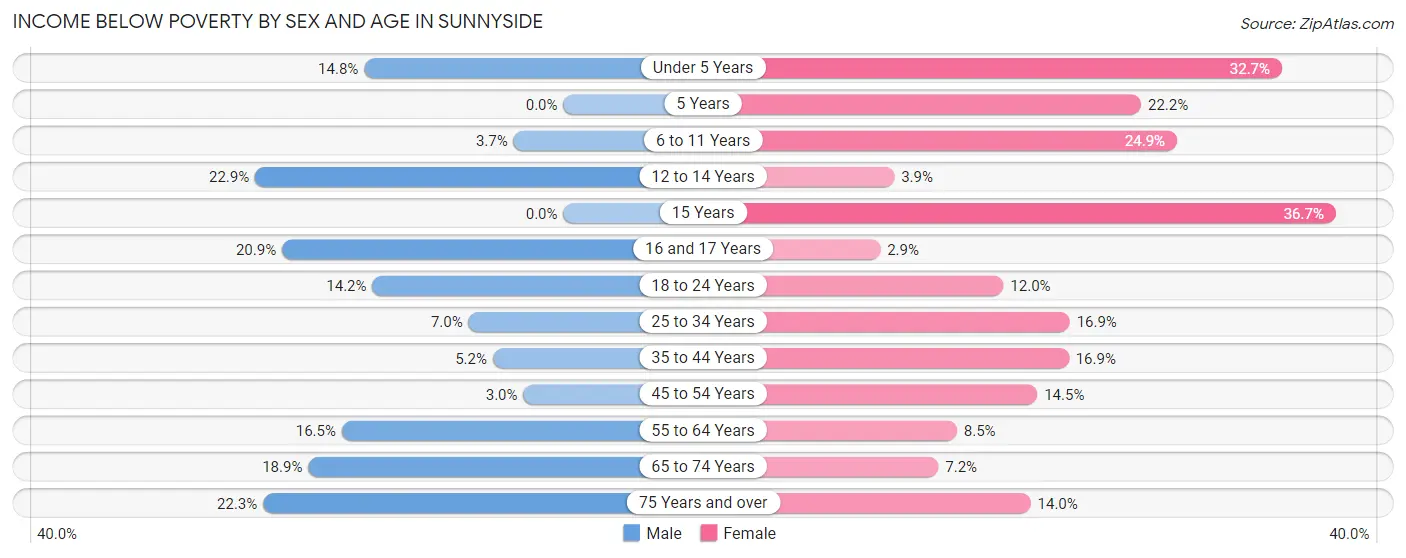
| Age Bracket | Male | Female |
| Under 5 Years | 129 (14.8%) | 198 (32.7%) |
| 5 Years | 0 (0.0%) | 22 (22.2%) |
| 6 to 11 Years | 46 (3.7%) | 323 (24.9%) |
| 12 to 14 Years | 125 (22.9%) | 26 (3.9%) |
| 15 Years | 0 (0.0%) | 33 (36.7%) |
| 16 and 17 Years | 66 (20.9%) | 8 (2.9%) |
| 18 to 24 Years | 100 (14.2%) | 72 (12.0%) |
| 25 to 34 Years | 77 (7.0%) | 214 (16.9%) |
| 35 to 44 Years | 51 (5.2%) | 141 (16.9%) |
| 45 to 54 Years | 19 (3.0%) | 92 (14.5%) |
| 55 to 64 Years | 114 (16.5%) | 62 (8.5%) |
| 65 to 74 Years | 107 (18.9%) | 20 (7.2%) |
| 75 Years and over | 78 (22.3%) | 69 (14.0%) |
| Total | 912 (11.0%) | 1,280 (16.3%) |
Income Above Poverty by Sex and Age in Sunnyside
According to the poverty statistics in Sunnyside, males aged 5 years and females aged 16 and 17 years are the age groups that are most secure financially, with 100.0% of males and 97.2% of females in these age groups living above the poverty line.
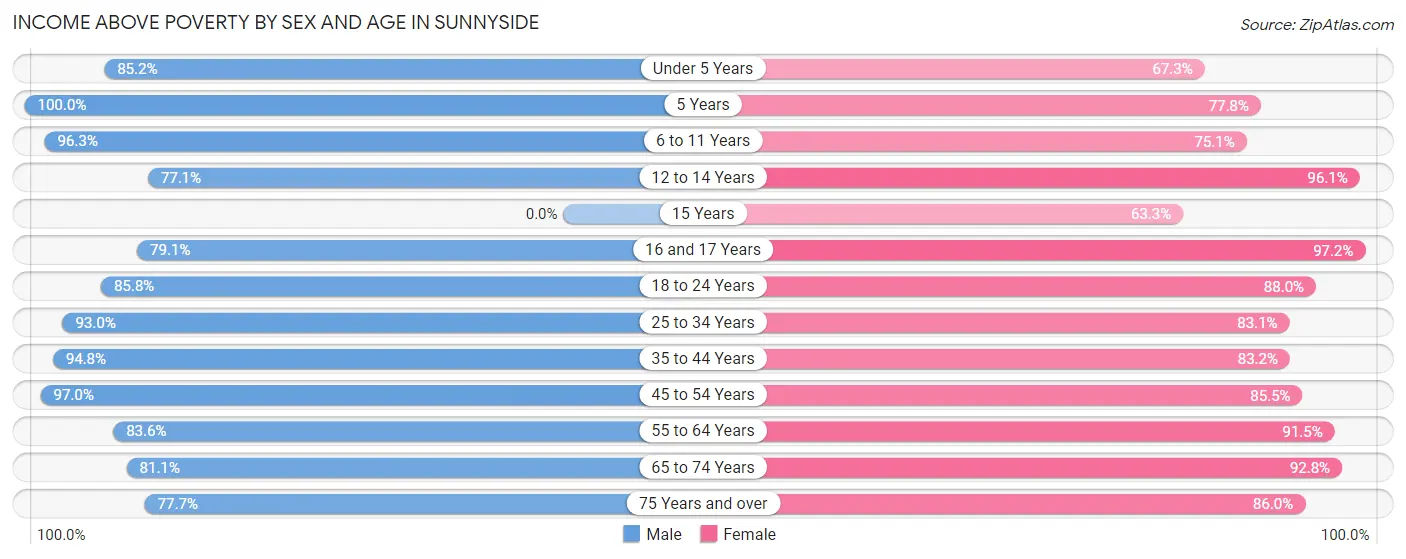
| Age Bracket | Male | Female |
| Under 5 Years | 743 (85.2%) | 408 (67.3%) |
| 5 Years | 271 (100.0%) | 77 (77.8%) |
| 6 to 11 Years | 1,197 (96.3%) | 975 (75.1%) |
| 12 to 14 Years | 421 (77.1%) | 643 (96.1%) |
| 15 Years | 0 (0.0%) | 57 (63.3%) |
| 16 and 17 Years | 250 (79.1%) | 273 (97.2%) |
| 18 to 24 Years | 605 (85.8%) | 528 (88.0%) |
| 25 to 34 Years | 1,017 (93.0%) | 1,051 (83.1%) |
| 35 to 44 Years | 923 (94.8%) | 696 (83.2%) |
| 45 to 54 Years | 621 (97.0%) | 542 (85.5%) |
| 55 to 64 Years | 579 (83.6%) | 664 (91.5%) |
| 65 to 74 Years | 458 (81.1%) | 259 (92.8%) |
| 75 Years and over | 272 (77.7%) | 423 (86.0%) |
| Total | 7,357 (89.0%) | 6,596 (83.8%) |
Income Below Poverty Among Married-Couple Families in Sunnyside
The poverty statistics for married-couple families in Sunnyside show that 4.8% or 99 of the total 2,085 families live below the poverty line. Families with 1 or 2 children have the highest poverty rate of 10.7%, comprising of 40 families. On the other hand, families with 3 or 4 children have the lowest poverty rate of 0.0%, which includes 0 families.
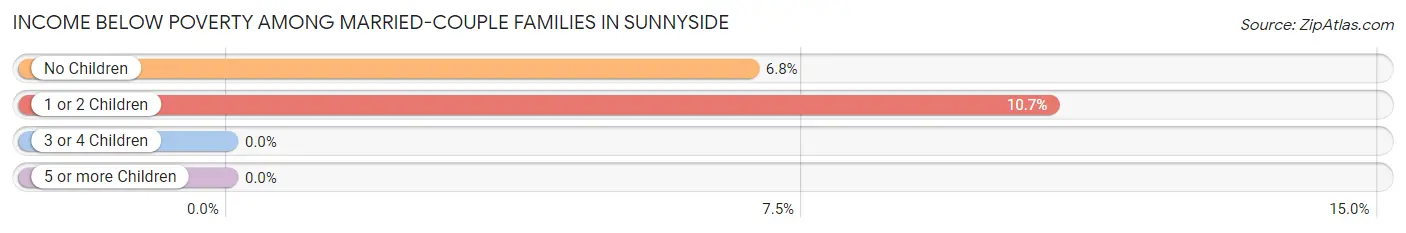
| Children | Above Poverty | Below Poverty |
| No Children | 809 (93.2%) | 59 (6.8%) |
| 1 or 2 Children | 333 (89.3%) | 40 (10.7%) |
| 3 or 4 Children | 844 (100.0%) | 0 (0.0%) |
| 5 or more Children | 0 (0.0%) | 0 (0.0%) |
| Total | 1,986 (95.3%) | 99 (4.8%) |
Income Below Poverty Among Single-Parent Households in Sunnyside
According to the poverty data in Sunnyside, 13.7% or 55 single-father households and 24.4% or 210 single-mother households are living below the poverty line. Among single-father households, those with 3 or 4 children have the highest poverty rate, with 50 households (45.9%) experiencing poverty. Likewise, among single-mother households, those with 3 or 4 children have the highest poverty rate, with 130 households (81.2%) falling below the poverty line.
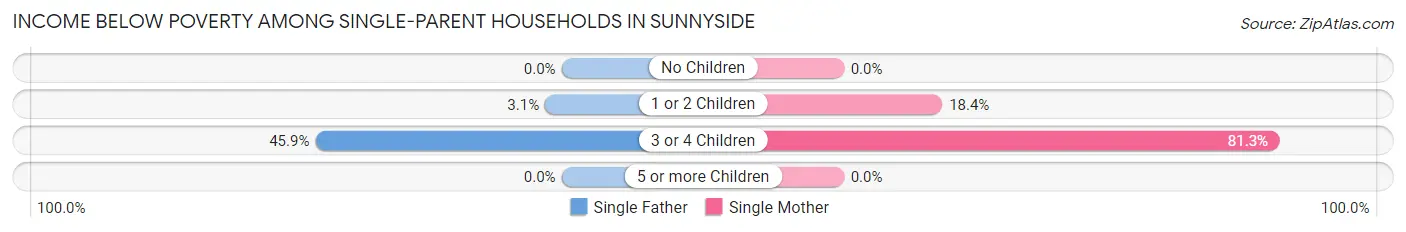
| Children | Single Father | Single Mother |
| No Children | 0 (0.0%) | 0 (0.0%) |
| 1 or 2 Children | 5 (3.1%) | 80 (18.3%) |
| 3 or 4 Children | 50 (45.9%) | 130 (81.2%) |
| 5 or more Children | 0 (0.0%) | 0 (0.0%) |
| Total | 55 (13.7%) | 210 (24.4%) |
Income Below Poverty Among Married-Couple vs Single-Parent Households in Sunnyside
The poverty data for Sunnyside shows that 99 of the married-couple family households (4.8%) and 265 of the single-parent households (21.0%) are living below the poverty level. Within the married-couple family households, those with 1 or 2 children have the highest poverty rate, with 40 households (10.7%) falling below the poverty line. Among the single-parent households, those with 3 or 4 children have the highest poverty rate, with 180 household (66.9%) living below poverty.
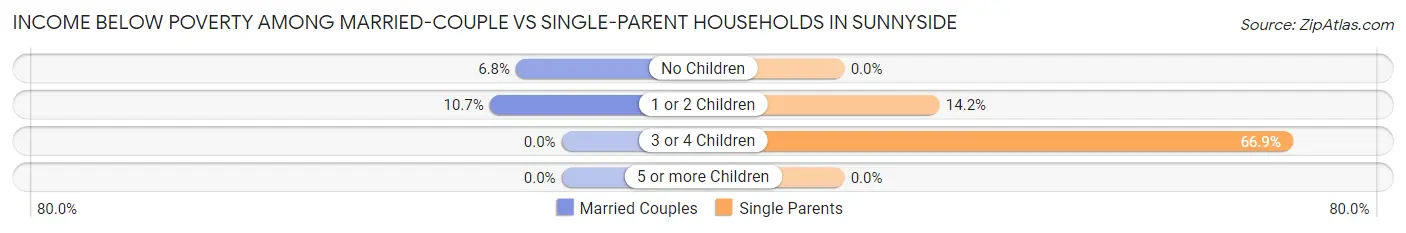
| Children | Married-Couple Families | Single-Parent Households |
| No Children | 59 (6.8%) | 0 (0.0%) |
| 1 or 2 Children | 40 (10.7%) | 85 (14.2%) |
| 3 or 4 Children | 0 (0.0%) | 180 (66.9%) |
| 5 or more Children | 0 (0.0%) | 0 (0.0%) |
| Total | 99 (4.8%) | 265 (21.0%) |
Race in Sunnyside
The most populous races in Sunnyside are Hispanic or Latino (14,056 | 86.1%), White / Caucasian (9,284 | 56.9%), and Two or more Races (3,613 | 22.1%).
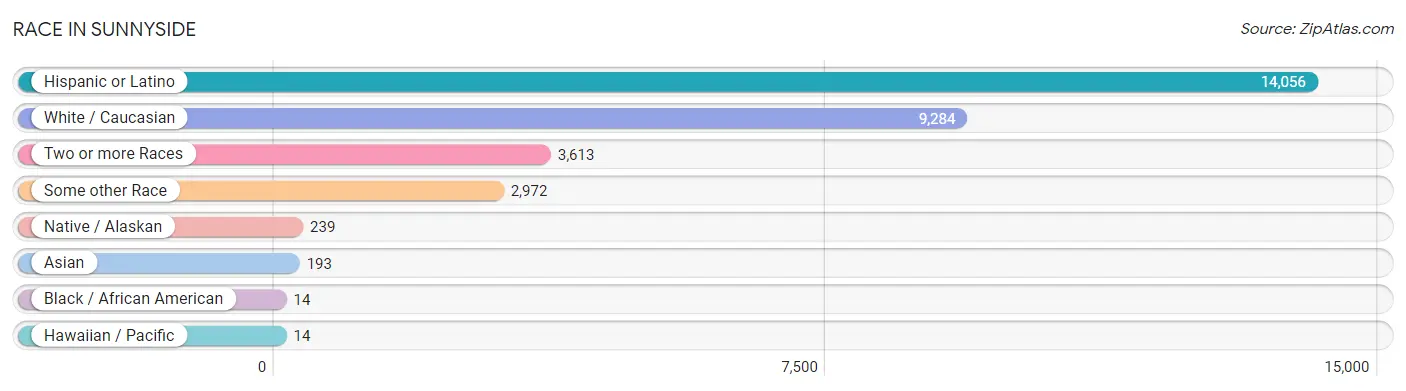
| Race | # Population | % Population |
| Asian | 193 | 1.2% |
| Black / African American | 14 | 0.1% |
| Hawaiian / Pacific | 14 | 0.1% |
| Hispanic or Latino | 14,056 | 86.1% |
| Native / Alaskan | 239 | 1.5% |
| White / Caucasian | 9,284 | 56.9% |
| Two or more Races | 3,613 | 22.1% |
| Some other Race | 2,972 | 18.2% |
| Total | 16,329 | 100.0% |
Ancestry in Sunnyside
The most populous ancestries reported in Sunnyside are Mexican (13,545 | 83.0%), American (516 | 3.2%), Central American (433 | 2.6%), Salvadoran (433 | 2.6%), and German (360 | 2.2%), together accounting for 93.6% of all Sunnyside residents.
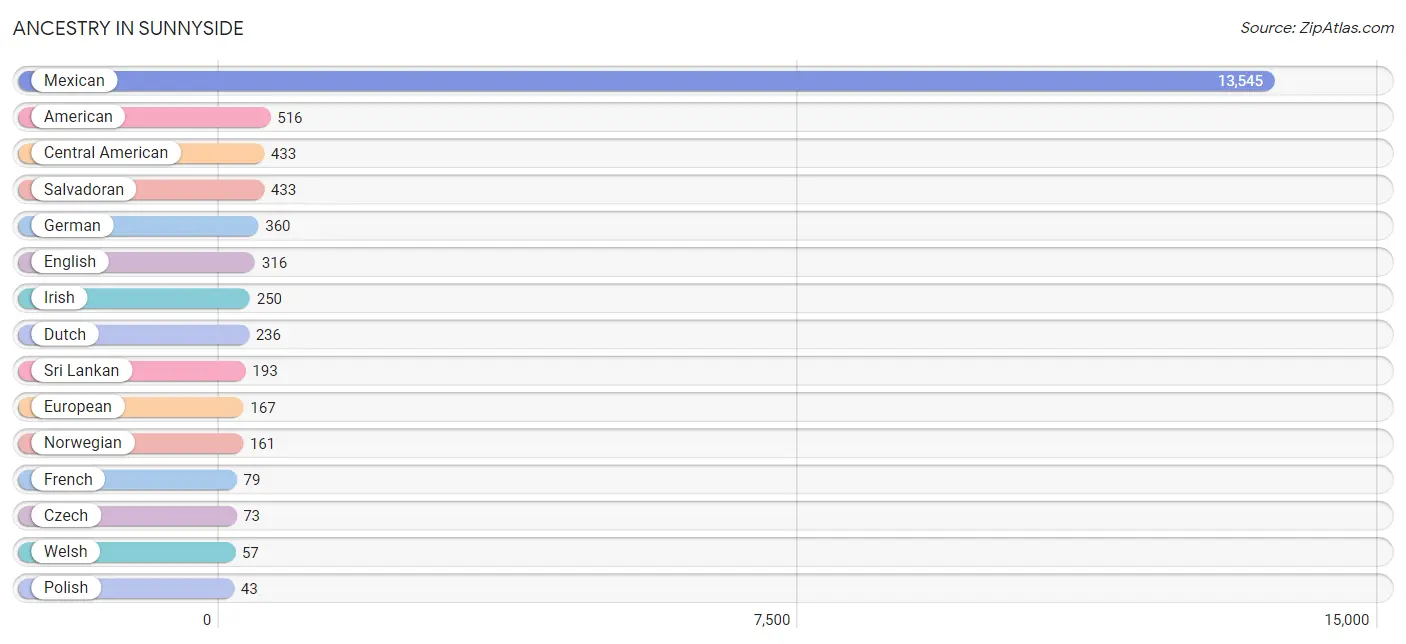
| Ancestry | # Population | % Population |
| American | 516 | 3.2% |
| Apache | 4 | 0.0% |
| Blackfeet | 22 | 0.1% |
| British | 12 | 0.1% |
| Central American | 433 | 2.6% |
| Central American Indian | 30 | 0.2% |
| Chippewa | 1 | 0.0% |
| Colombian | 12 | 0.1% |
| Creek | 3 | 0.0% |
| Czech | 73 | 0.4% |
| Czechoslovakian | 35 | 0.2% |
| Dutch | 236 | 1.5% |
| Eastern European | 22 | 0.1% |
| English | 316 | 1.9% |
| European | 167 | 1.0% |
| Finnish | 8 | 0.1% |
| French | 79 | 0.5% |
| German | 360 | 2.2% |
| Irish | 250 | 1.5% |
| Italian | 19 | 0.1% |
| Mexican | 13,545 | 83.0% |
| Mexican American Indian | 18 | 0.1% |
| Native Hawaiian | 14 | 0.1% |
| Norwegian | 161 | 1.0% |
| Polish | 43 | 0.3% |
| Puget Sound Salish | 2 | 0.0% |
| Russian | 42 | 0.3% |
| Salvadoran | 433 | 2.6% |
| Scotch-Irish | 10 | 0.1% |
| Scottish | 14 | 0.1% |
| South American | 12 | 0.1% |
| Spanish | 3 | 0.0% |
| Sri Lankan | 193 | 1.2% |
| Welsh | 57 | 0.4% |
| Yakama | 30 | 0.2% | View All 35 Rows |
Immigrants in Sunnyside
The most numerous immigrant groups reported in Sunnyside came from Latin America (5,270 | 32.3%), Central America (5,258 | 32.2%), Mexico (4,885 | 29.9%), El Salvador (373 | 2.3%), and Asia (91 | 0.6%), together accounting for 97.2% of all Sunnyside residents.
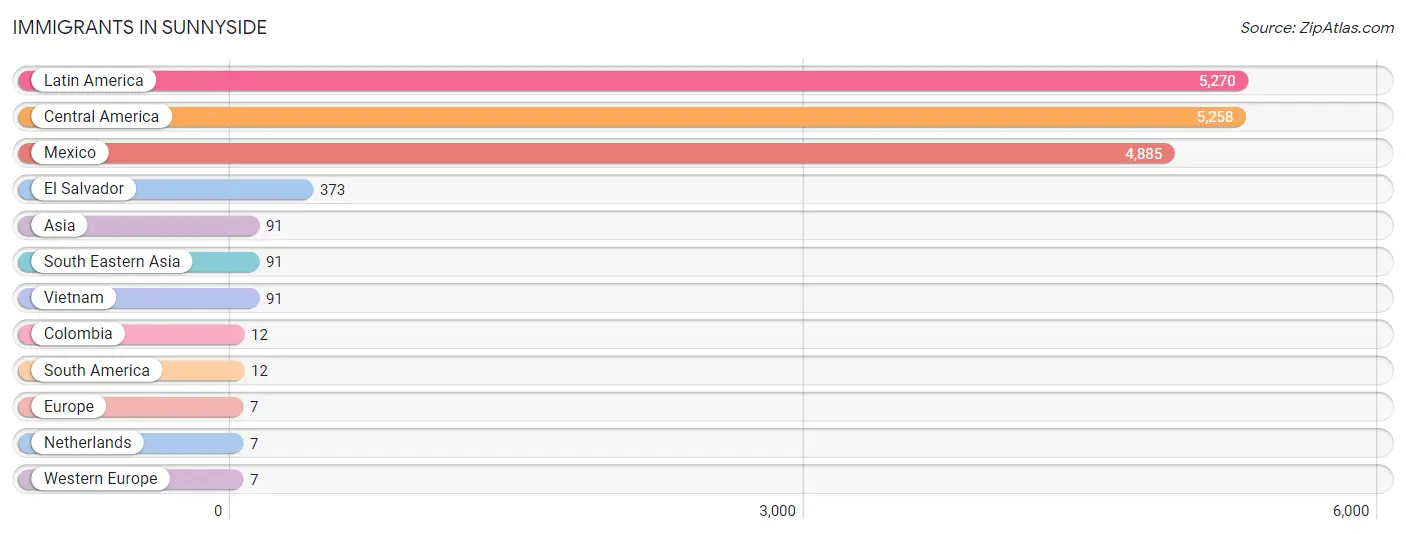
| Immigration Origin | # Population | % Population |
| Asia | 91 | 0.6% |
| Central America | 5,258 | 32.2% |
| Colombia | 12 | 0.1% |
| El Salvador | 373 | 2.3% |
| Europe | 7 | 0.0% |
| Latin America | 5,270 | 32.3% |
| Mexico | 4,885 | 29.9% |
| Netherlands | 7 | 0.0% |
| South America | 12 | 0.1% |
| South Eastern Asia | 91 | 0.6% |
| Vietnam | 91 | 0.6% |
| Western Europe | 7 | 0.0% | View All 12 Rows |
Sex and Age in Sunnyside
Sex and Age in Sunnyside
The most populous age groups in Sunnyside are 5 to 9 Years (1,091 | 13.0%) for men and 5 to 9 Years (1,147 | 14.4%) for women.
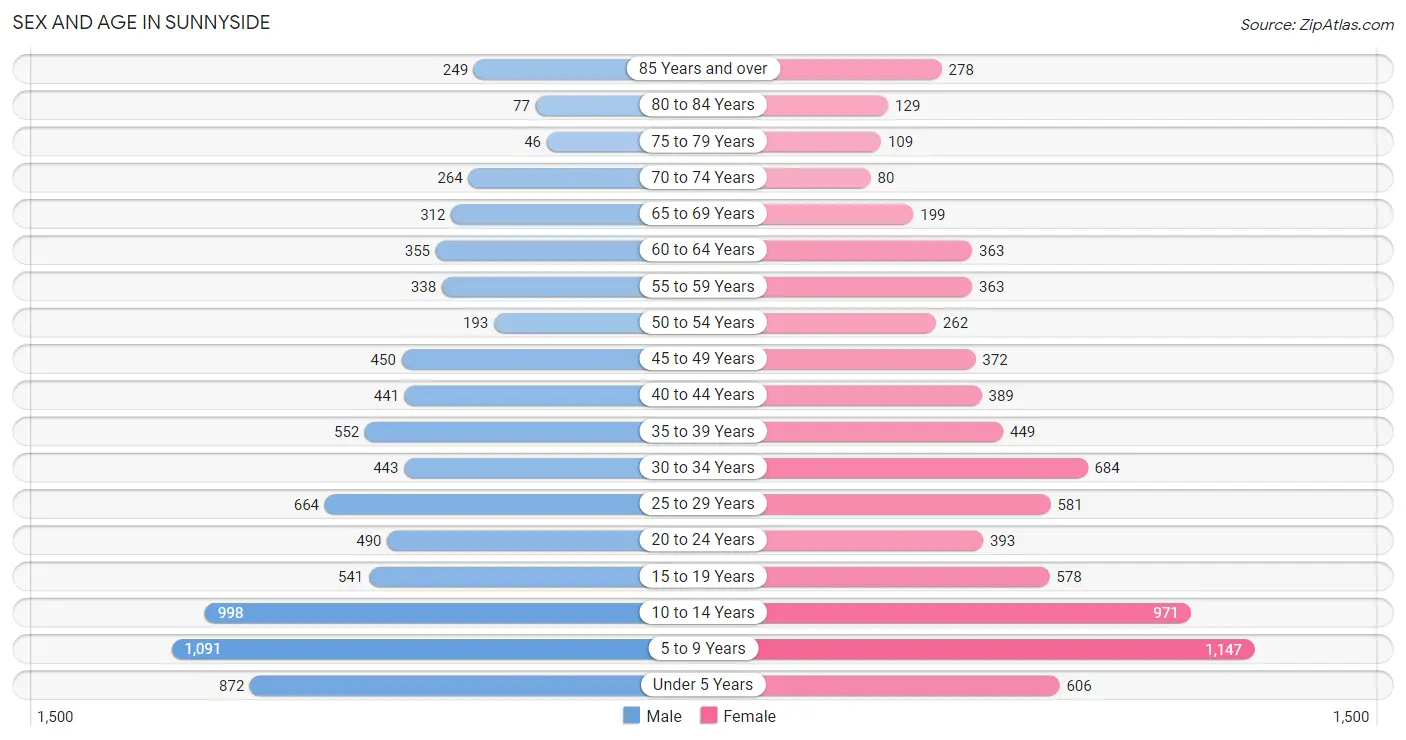
| Age Bracket | Male | Female |
| Under 5 Years | 872 (10.4%) | 606 (7.6%) |
| 5 to 9 Years | 1,091 (13.0%) | 1,147 (14.4%) |
| 10 to 14 Years | 998 (11.9%) | 971 (12.2%) |
| 15 to 19 Years | 541 (6.5%) | 578 (7.3%) |
| 20 to 24 Years | 490 (5.9%) | 393 (4.9%) |
| 25 to 29 Years | 664 (7.9%) | 581 (7.3%) |
| 30 to 34 Years | 443 (5.3%) | 684 (8.6%) |
| 35 to 39 Years | 552 (6.6%) | 449 (5.7%) |
| 40 to 44 Years | 441 (5.3%) | 389 (4.9%) |
| 45 to 49 Years | 450 (5.4%) | 372 (4.7%) |
| 50 to 54 Years | 193 (2.3%) | 262 (3.3%) |
| 55 to 59 Years | 338 (4.0%) | 363 (4.6%) |
| 60 to 64 Years | 355 (4.2%) | 363 (4.6%) |
| 65 to 69 Years | 312 (3.7%) | 199 (2.5%) |
| 70 to 74 Years | 264 (3.2%) | 80 (1.0%) |
| 75 to 79 Years | 46 (0.5%) | 109 (1.4%) |
| 80 to 84 Years | 77 (0.9%) | 129 (1.6%) |
| 85 Years and over | 249 (3.0%) | 278 (3.5%) |
| Total | 8,376 (100.0%) | 7,953 (100.0%) |
Families and Households in Sunnyside
Median Family Size in Sunnyside
The median family size in Sunnyside is 4.27 persons per family, with married-couple families (2,085 | 62.3%) accounting for the largest median family size of 4.6 persons per family. On the other hand, single female/mother families (860 | 25.7%) represent the smallest median family size with 3.48 persons per family.
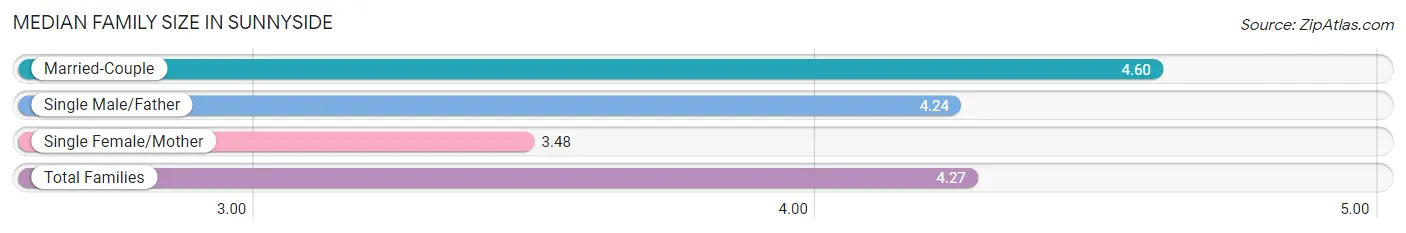
| Family Type | # Families | Family Size |
| Married-Couple | 2,085 (62.3%) | 4.60 |
| Single Male/Father | 402 (12.0%) | 4.24 |
| Single Female/Mother | 860 (25.7%) | 3.48 |
| Total Families | 3,347 (100.0%) | 4.27 |
Median Household Size in Sunnyside
The median household size in Sunnyside is 3.63 persons per household, with single male/father households (402 | 9.1%) accounting for the largest median household size of 4.87 persons per household. non-family households (1,082 | 24.4%) represent the smallest median household size with 1.16 persons per household.
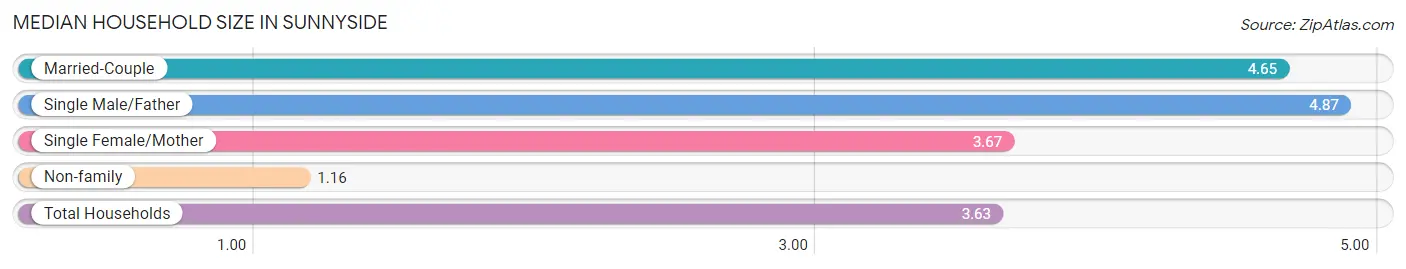
| Household Type | # Households | Household Size |
| Married-Couple | 2,085 (47.1%) | 4.65 |
| Single Male/Father | 402 (9.1%) | 4.87 |
| Single Female/Mother | 860 (19.4%) | 3.67 |
| Non-family | 1,082 (24.4%) | 1.16 |
| Total Households | 4,429 (100.0%) | 3.63 |
Household Size by Marriage Status in Sunnyside
Out of a total of 4,429 households in Sunnyside, 3,347 (75.6%) are family households, while 1,082 (24.4%) are nonfamily households. The most numerous type of family households are 5-person households, comprising 851, and the most common type of nonfamily households are 1-person households, comprising 961.
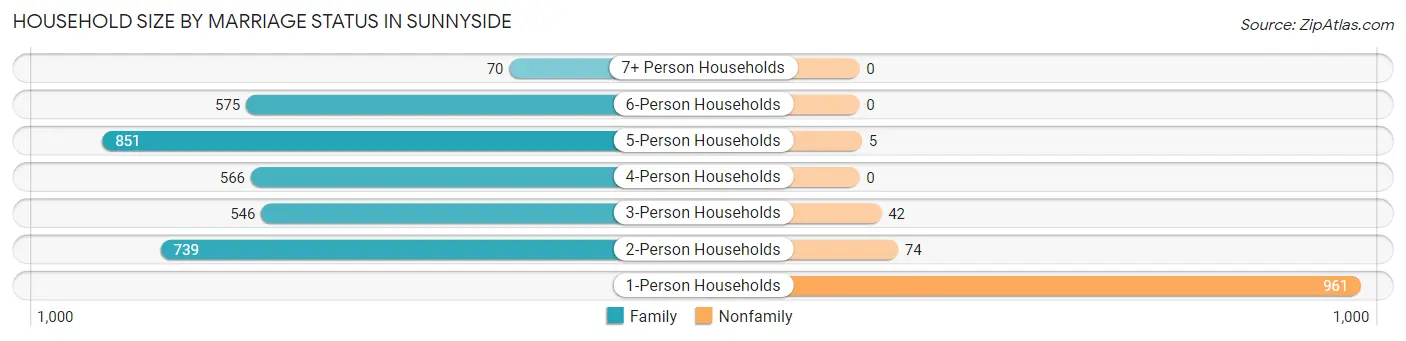
| Household Size | Family Households | Nonfamily Households |
| 1-Person Households | - | 961 (21.7%) |
| 2-Person Households | 739 (16.7%) | 74 (1.7%) |
| 3-Person Households | 546 (12.3%) | 42 (0.9%) |
| 4-Person Households | 566 (12.8%) | 0 (0.0%) |
| 5-Person Households | 851 (19.2%) | 5 (0.1%) |
| 6-Person Households | 575 (13.0%) | 0 (0.0%) |
| 7+ Person Households | 70 (1.6%) | 0 (0.0%) |
| Total | 3,347 (75.6%) | 1,082 (24.4%) |
Female Fertility in Sunnyside
Fertility by Age in Sunnyside
Average fertility rate in Sunnyside is 55.0 births per 1,000 women. Women in the age bracket of 15 to 19 years have the highest fertility rate with 78.0 births per 1,000 women. Women in the age bracket of 20 to 34 years acount for 52.7% of all women with births.
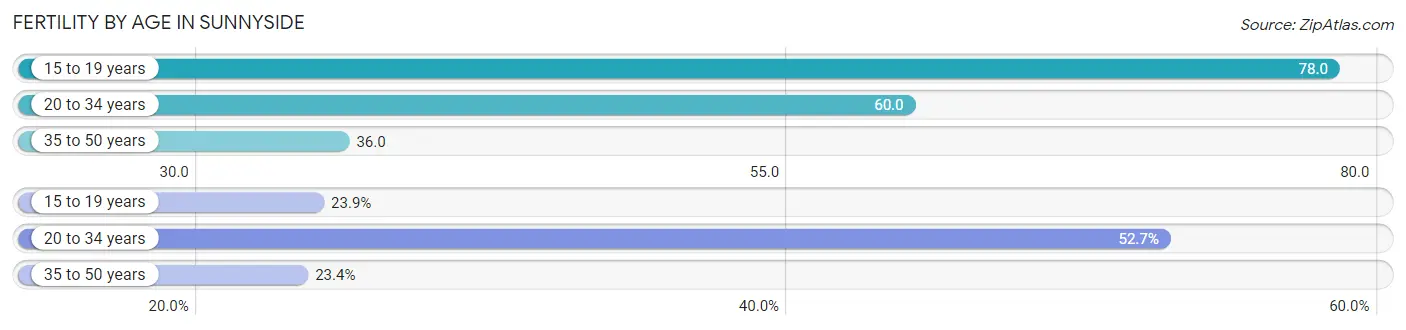
| Age Bracket | Women with Births | Births / 1,000 Women |
| 15 to 19 years | 45 (23.9%) | 78.0 |
| 20 to 34 years | 99 (52.7%) | 60.0 |
| 35 to 50 years | 44 (23.4%) | 36.0 |
| Total | 188 (100.0%) | 55.0 |
Fertility by Age by Marriage Status in Sunnyside
63.8% of women with births (188) in Sunnyside are married. The highest percentage of unmarried women with births falls into 15 to 19 years age bracket with 100.0% of them unmarried at the time of birth, while the lowest percentage of unmarried women with births belong to 35 to 50 years age bracket with 0.0% of them unmarried.
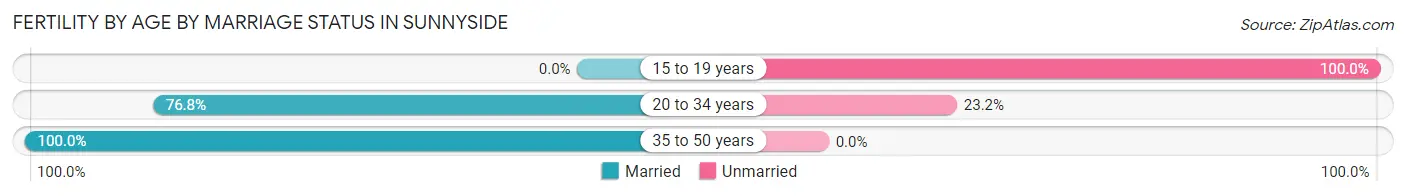
| Age Bracket | Married | Unmarried |
| 15 to 19 years | 0 (0.0%) | 45 (100.0%) |
| 20 to 34 years | 76 (76.8%) | 23 (23.2%) |
| 35 to 50 years | 44 (100.0%) | 0 (0.0%) |
| Total | 120 (63.8%) | 68 (36.2%) |
Fertility by Education in Sunnyside
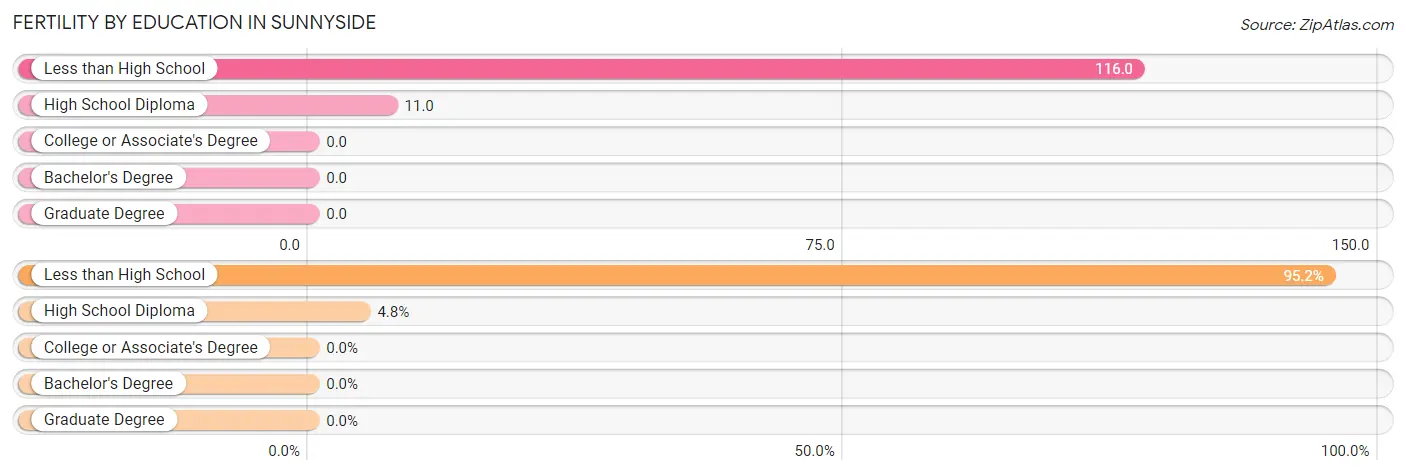
| Educational Attainment | Women with Births | Births / 1,000 Women |
| Less than High School | 179 (95.2%) | 116.0 |
| High School Diploma | 9 (4.8%) | 11.0 |
| College or Associate's Degree | 0 (0.0%) | 0.0 |
| Bachelor's Degree | 0 (0.0%) | 0.0 |
| Graduate Degree | 0 (0.0%) | 0.0 |
| Total | 188 (100.0%) | 55.0 |
Fertility by Education by Marriage Status in Sunnyside
36.2% of women with births in Sunnyside are unmarried. Women with the educational attainment of high school diploma are most likely to be married with 100.0% of them married at childbirth, while women with the educational attainment of less than high school are least likely to be married with 38.0% of them unmarried at childbirth.
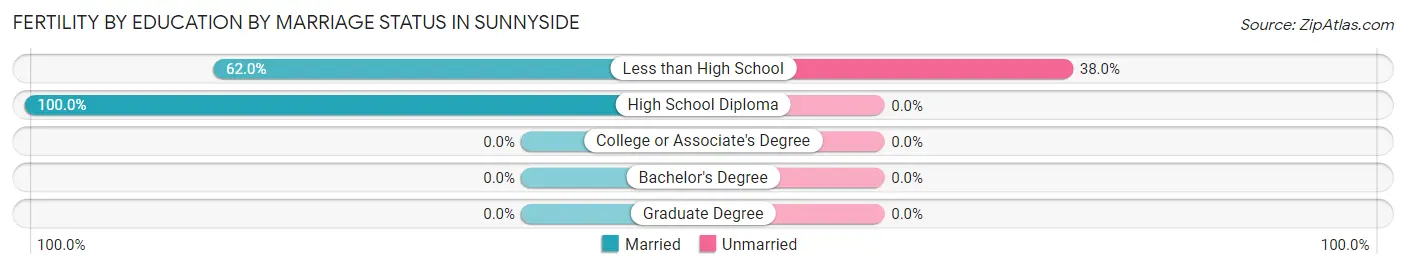
| Educational Attainment | Married | Unmarried |
| Less than High School | 111 (62.0%) | 68 (38.0%) |
| High School Diploma | 9 (100.0%) | 0 (0.0%) |
| College or Associate's Degree | 0 (0.0%) | 0 (0.0%) |
| Bachelor's Degree | 0 (0.0%) | 0 (0.0%) |
| Graduate Degree | 0 (0.0%) | 0 (0.0%) |
| Total | 120 (63.8%) | 68 (36.2%) |
Employment Characteristics in Sunnyside
Employment by Class of Employer in Sunnyside
Among the 6,070 employed individuals in Sunnyside, private company employees (4,469 | 73.6%), local government employees (536 | 8.8%), and state government employees (344 | 5.7%) make up the most common classes of employment.
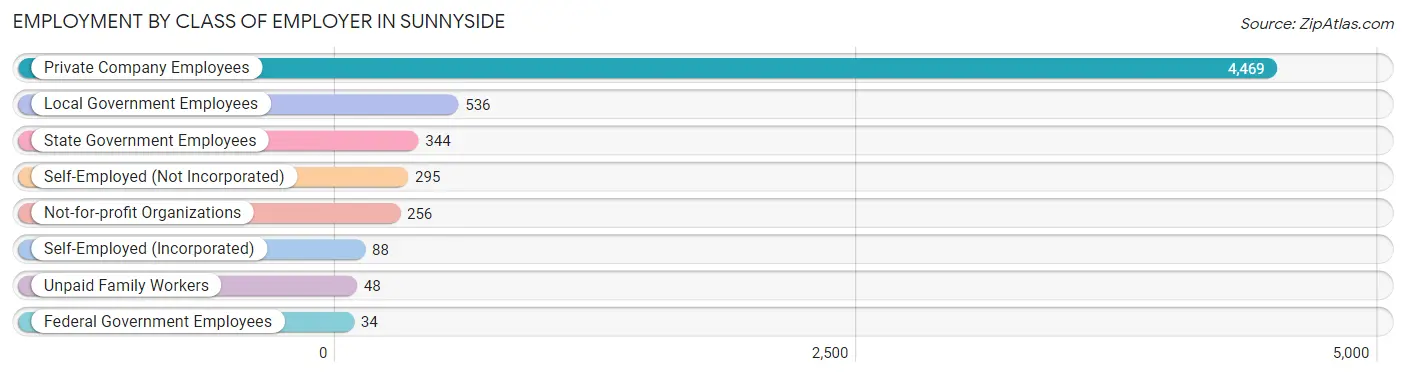
| Employer Class | # Employees | % Employees |
| Private Company Employees | 4,469 | 73.6% |
| Self-Employed (Incorporated) | 88 | 1.5% |
| Self-Employed (Not Incorporated) | 295 | 4.9% |
| Not-for-profit Organizations | 256 | 4.2% |
| Local Government Employees | 536 | 8.8% |
| State Government Employees | 344 | 5.7% |
| Federal Government Employees | 34 | 0.6% |
| Unpaid Family Workers | 48 | 0.8% |
| Total | 6,070 | 100.0% |
Employment Status by Age in Sunnyside
According to the labor force statistics for Sunnyside, out of the total population over 16 years of age (10,554), 65.2% or 6,881 individuals are in the labor force, with 8.9% or 612 of them unemployed. The age group with the highest labor force participation rate is 20 to 24 years, with 89.8% or 793 individuals in the labor force. Within the labor force, the 65 to 74 years age range has the highest percentage of unemployed individuals, with 28.0% or 145 of them being unemployed.
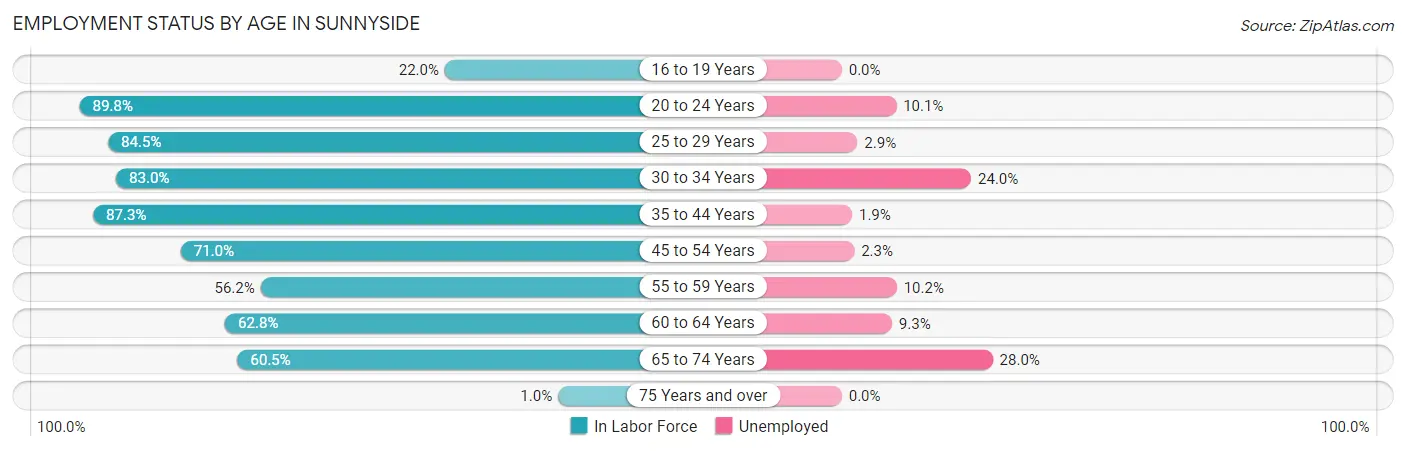
| Age Bracket | In Labor Force | Unemployed |
| 16 to 19 Years | 226 (22.0%) | 0 (0.0%) |
| 20 to 24 Years | 793 (89.8%) | 80 (10.1%) |
| 25 to 29 Years | 1,052 (84.5%) | 31 (2.9%) |
| 30 to 34 Years | 935 (83.0%) | 224 (24.0%) |
| 35 to 44 Years | 1,598 (87.3%) | 30 (1.9%) |
| 45 to 54 Years | 907 (71.0%) | 21 (2.3%) |
| 55 to 59 Years | 394 (56.2%) | 40 (10.2%) |
| 60 to 64 Years | 451 (62.8%) | 42 (9.3%) |
| 65 to 74 Years | 517 (60.5%) | 145 (28.0%) |
| 75 Years and over | 9 (1.0%) | 0 (0.0%) |
| Total | 6,881 (65.2%) | 612 (8.9%) |
Employment Status by Educational Attainment in Sunnyside
According to labor force statistics for Sunnyside, 77.4% of individuals (5,340) out of the total population between 25 and 64 years of age (6,899) are in the labor force, with 7.3% or 390 of them being unemployed. The group with the highest labor force participation rate are those with the educational attainment of bachelor's degree or higher, with 95.8% or 646 individuals in the labor force. Within the labor force, individuals with high school diploma education have the highest percentage of unemployment, with 9.2% or 136 of them being unemployed.
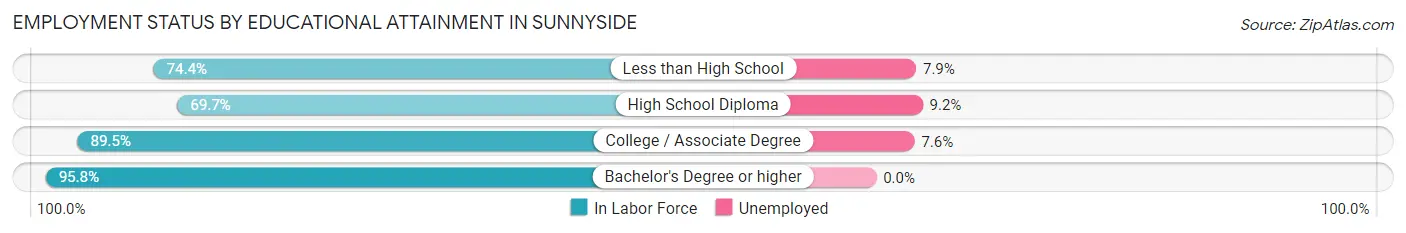
| Educational Attainment | In Labor Force | Unemployed |
| Less than High School | 2,268 (74.4%) | 241 (7.9%) |
| High School Diploma | 1,480 (69.7%) | 195 (9.2%) |
| College / Associate Degree | 942 (89.5%) | 80 (7.6%) |
| Bachelor's Degree or higher | 646 (95.8%) | 0 (0.0%) |
| Total | 5,340 (77.4%) | 504 (7.3%) |
Employment Occupations by Sex in Sunnyside
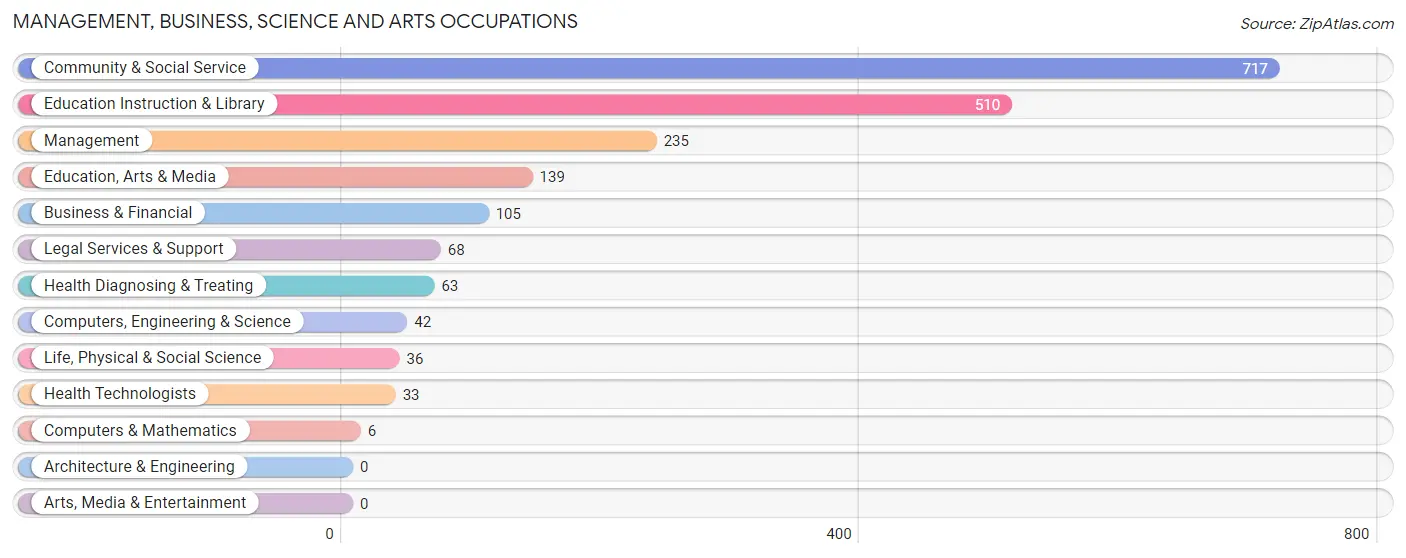
Management, Business, Science and Arts Occupations
The most common Management, Business, Science and Arts occupations in Sunnyside are Community & Social Service (717 | 11.4%), Education Instruction & Library (510 | 8.1%), Management (235 | 3.7%), Education, Arts & Media (139 | 2.2%), and Business & Financial (105 | 1.7%).
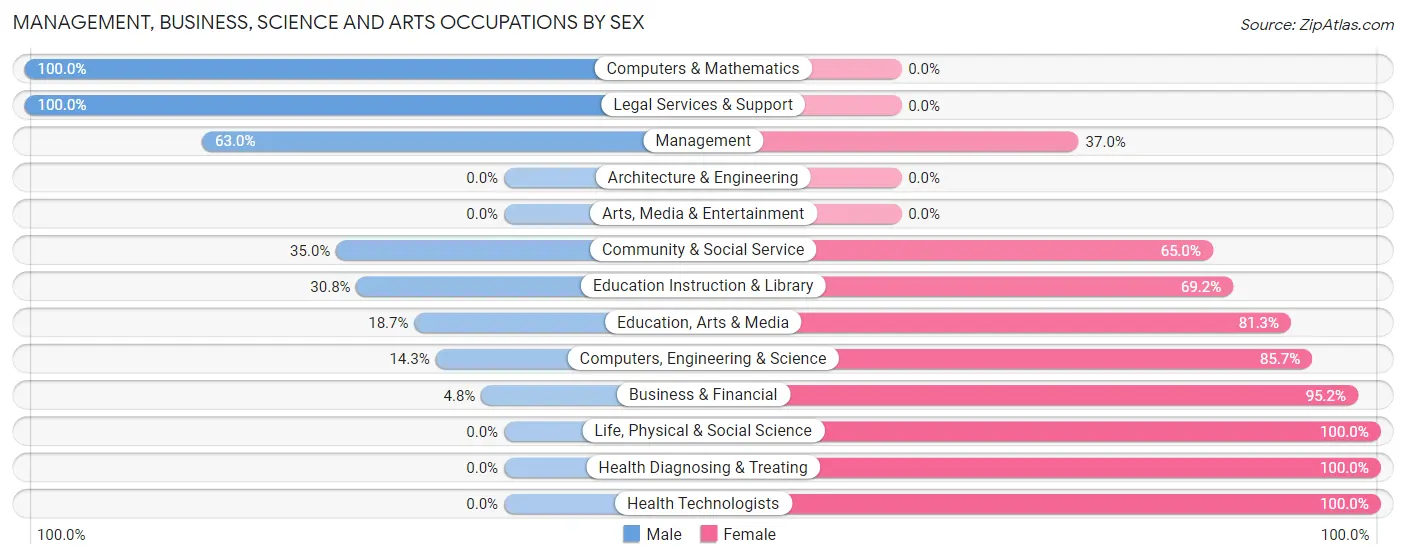
Management, Business, Science and Arts Occupations by Sex
Within the Management, Business, Science and Arts occupations in Sunnyside, the most male-oriented occupations are Computers & Mathematics (100.0%), Legal Services & Support (100.0%), and Management (63.0%), while the most female-oriented occupations are Life, Physical & Social Science (100.0%), Health Diagnosing & Treating (100.0%), and Health Technologists (100.0%).
| Occupation | Male | Female |
| Management | 148 (63.0%) | 87 (37.0%) |
| Business & Financial | 5 (4.8%) | 100 (95.2%) |
| Computers, Engineering & Science | 6 (14.3%) | 36 (85.7%) |
| Computers & Mathematics | 6 (100.0%) | 0 (0.0%) |
| Architecture & Engineering | 0 (0.0%) | 0 (0.0%) |
| Life, Physical & Social Science | 0 (0.0%) | 36 (100.0%) |
| Community & Social Service | 251 (35.0%) | 466 (65.0%) |
| Education, Arts & Media | 26 (18.7%) | 113 (81.3%) |
| Legal Services & Support | 68 (100.0%) | 0 (0.0%) |
| Education Instruction & Library | 157 (30.8%) | 353 (69.2%) |
| Arts, Media & Entertainment | 0 (0.0%) | 0 (0.0%) |
| Health Diagnosing & Treating | 0 (0.0%) | 63 (100.0%) |
| Health Technologists | 0 (0.0%) | 33 (100.0%) |
| Total (Category) | 410 (35.3%) | 752 (64.7%) |
| Total (Overall) | 3,574 (57.1%) | 2,691 (42.9%) |
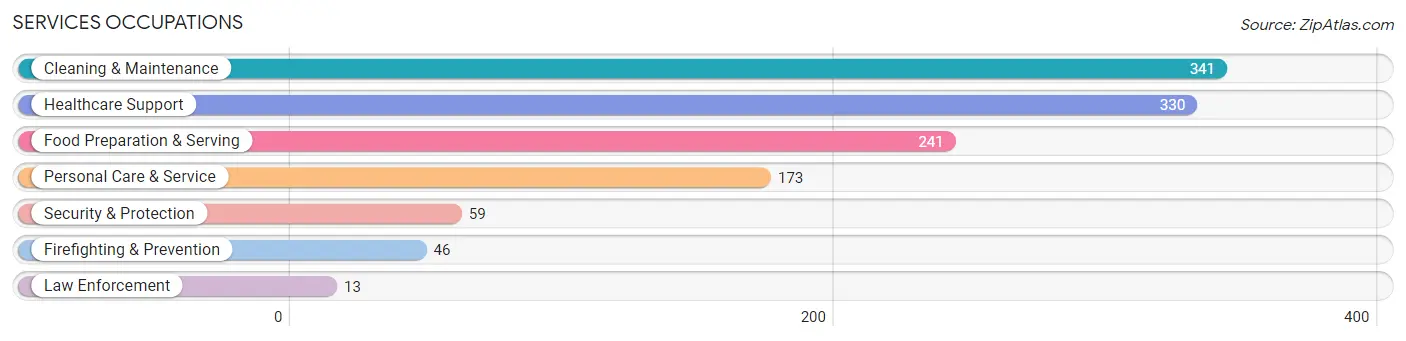
Services Occupations
The most common Services occupations in Sunnyside are Cleaning & Maintenance (341 | 5.4%), Healthcare Support (330 | 5.3%), Food Preparation & Serving (241 | 3.8%), Personal Care & Service (173 | 2.8%), and Security & Protection (59 | 0.9%).
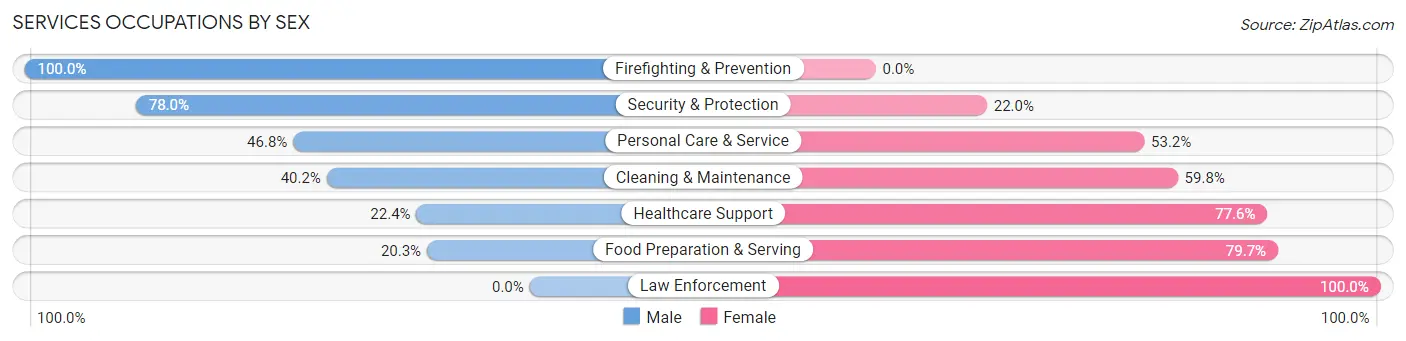
Services Occupations by Sex
Within the Services occupations in Sunnyside, the most male-oriented occupations are Firefighting & Prevention (100.0%), Security & Protection (78.0%), and Personal Care & Service (46.8%), while the most female-oriented occupations are Law Enforcement (100.0%), Food Preparation & Serving (79.7%), and Healthcare Support (77.6%).
| Occupation | Male | Female |
| Healthcare Support | 74 (22.4%) | 256 (77.6%) |
| Security & Protection | 46 (78.0%) | 13 (22.0%) |
| Firefighting & Prevention | 46 (100.0%) | 0 (0.0%) |
| Law Enforcement | 0 (0.0%) | 13 (100.0%) |
| Food Preparation & Serving | 49 (20.3%) | 192 (79.7%) |
| Cleaning & Maintenance | 137 (40.2%) | 204 (59.8%) |
| Personal Care & Service | 81 (46.8%) | 92 (53.2%) |
| Total (Category) | 387 (33.8%) | 757 (66.2%) |
| Total (Overall) | 3,574 (57.1%) | 2,691 (42.9%) |
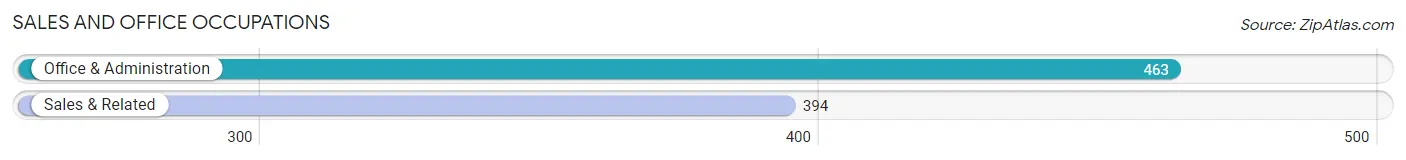
Sales and Office Occupations
The most common Sales and Office occupations in Sunnyside are Office & Administration (463 | 7.4%), and Sales & Related (394 | 6.3%).
Sales and Office Occupations by Sex
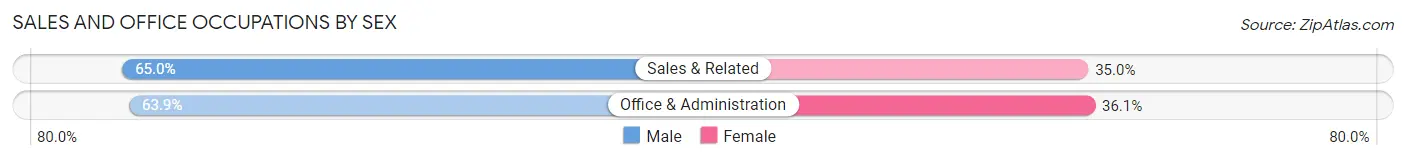
| Occupation | Male | Female |
| Sales & Related | 256 (65.0%) | 138 (35.0%) |
| Office & Administration | 296 (63.9%) | 167 (36.1%) |
| Total (Category) | 552 (64.4%) | 305 (35.6%) |
| Total (Overall) | 3,574 (57.1%) | 2,691 (42.9%) |
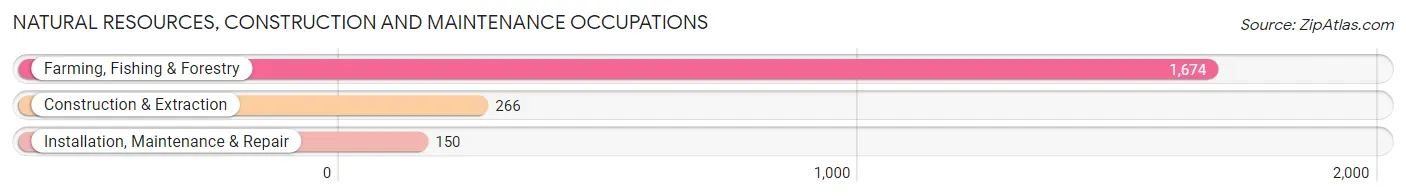
Natural Resources, Construction and Maintenance Occupations
The most common Natural Resources, Construction and Maintenance occupations in Sunnyside are Farming, Fishing & Forestry (1,674 | 26.7%), Construction & Extraction (266 | 4.3%), and Installation, Maintenance & Repair (150 | 2.4%).
Natural Resources, Construction and Maintenance Occupations by Sex
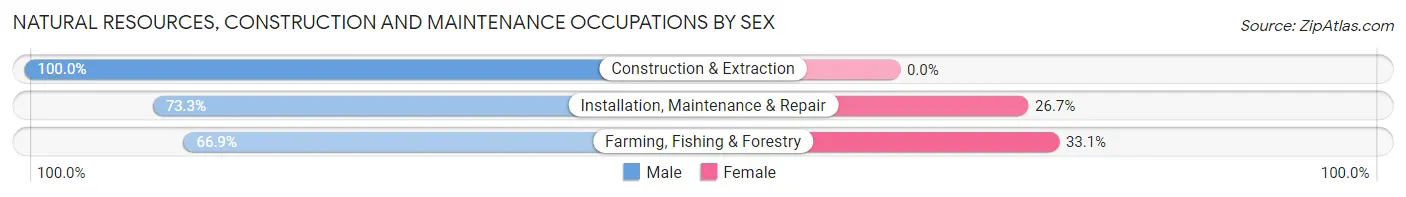
| Occupation | Male | Female |
| Farming, Fishing & Forestry | 1,120 (66.9%) | 554 (33.1%) |
| Construction & Extraction | 266 (100.0%) | 0 (0.0%) |
| Installation, Maintenance & Repair | 110 (73.3%) | 40 (26.7%) |
| Total (Category) | 1,496 (71.6%) | 594 (28.4%) |
| Total (Overall) | 3,574 (57.1%) | 2,691 (42.9%) |
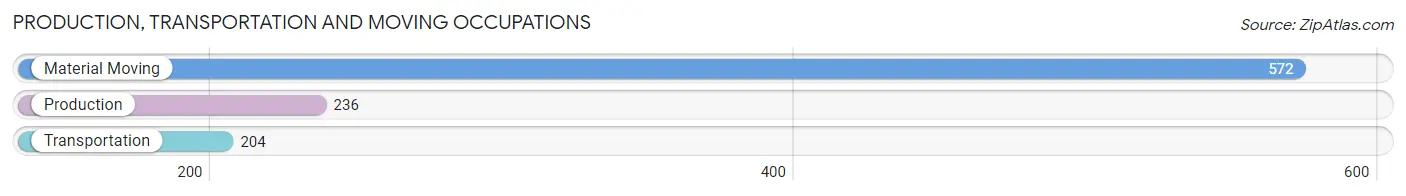
Production, Transportation and Moving Occupations
The most common Production, Transportation and Moving occupations in Sunnyside are Material Moving (572 | 9.1%), Production (236 | 3.8%), and Transportation (204 | 3.3%).
Production, Transportation and Moving Occupations by Sex
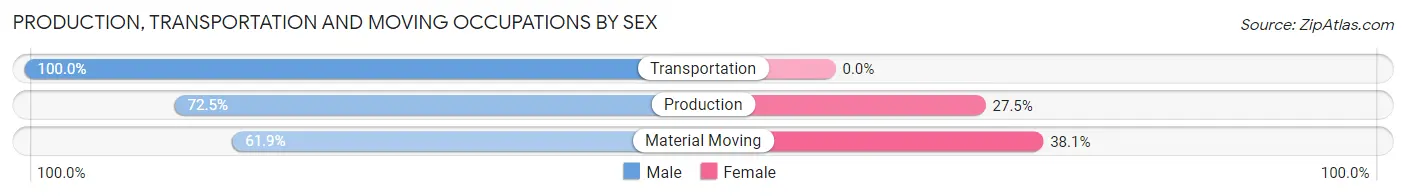
| Occupation | Male | Female |
| Production | 171 (72.5%) | 65 (27.5%) |
| Transportation | 204 (100.0%) | 0 (0.0%) |
| Material Moving | 354 (61.9%) | 218 (38.1%) |
| Total (Category) | 729 (72.0%) | 283 (28.0%) |
| Total (Overall) | 3,574 (57.1%) | 2,691 (42.9%) |
Employment Industries by Sex in Sunnyside
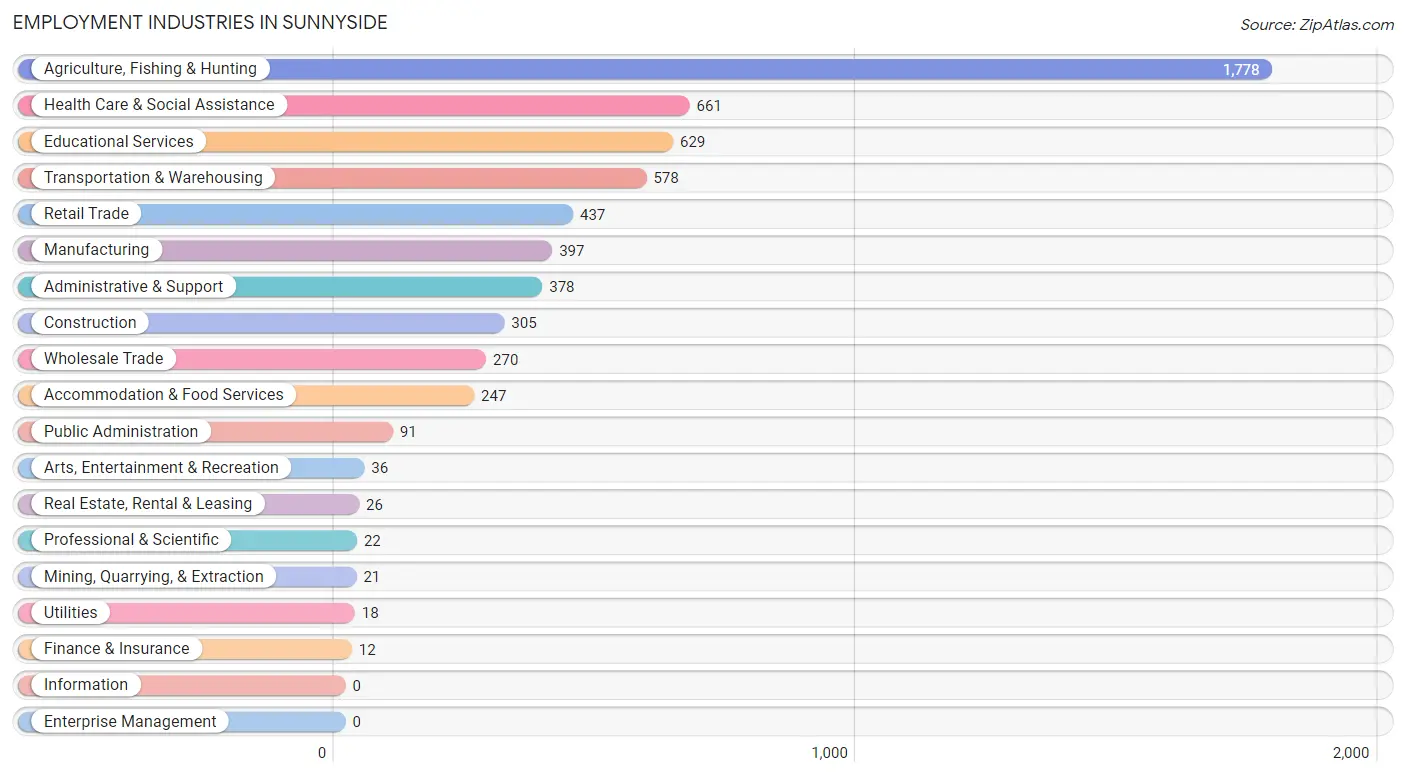
Employment Industries in Sunnyside
The major employment industries in Sunnyside include Agriculture, Fishing & Hunting (1,778 | 28.4%), Health Care & Social Assistance (661 | 10.5%), Educational Services (629 | 10.0%), Transportation & Warehousing (578 | 9.2%), and Retail Trade (437 | 7.0%).
Employment Industries by Sex in Sunnyside
The Sunnyside industries that see more men than women are Mining, Quarrying, & Extraction (100.0%), Utilities (100.0%), and Professional & Scientific (100.0%), whereas the industries that tend to have a higher number of women are Finance & Insurance (100.0%), Arts, Entertainment & Recreation (100.0%), and Accommodation & Food Services (77.7%).
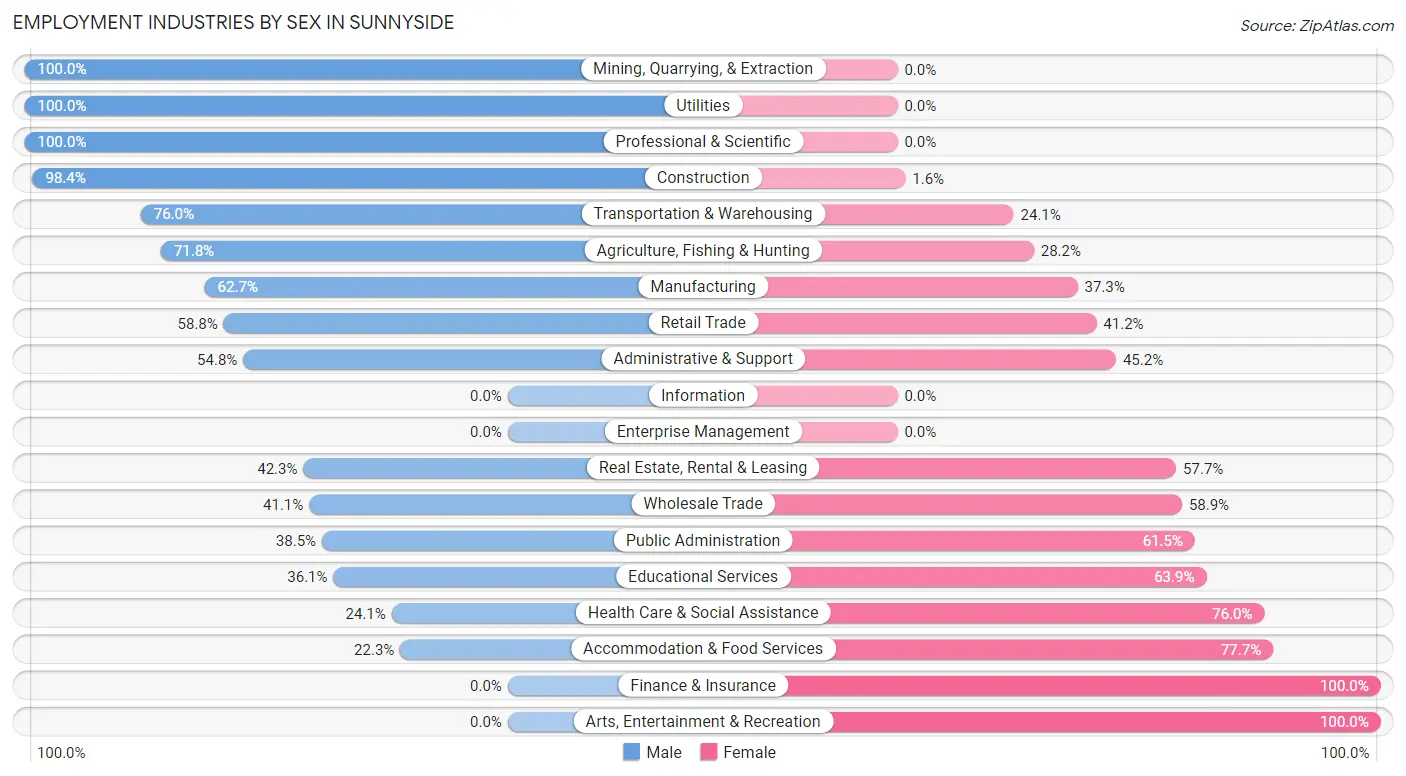
| Industry | Male | Female |
| Agriculture, Fishing & Hunting | 1,276 (71.8%) | 502 (28.2%) |
| Mining, Quarrying, & Extraction | 21 (100.0%) | 0 (0.0%) |
| Construction | 300 (98.4%) | 5 (1.6%) |
| Manufacturing | 249 (62.7%) | 148 (37.3%) |
| Wholesale Trade | 111 (41.1%) | 159 (58.9%) |
| Retail Trade | 257 (58.8%) | 180 (41.2%) |
| Transportation & Warehousing | 439 (75.9%) | 139 (24.0%) |
| Utilities | 18 (100.0%) | 0 (0.0%) |
| Information | 0 (0.0%) | 0 (0.0%) |
| Finance & Insurance | 0 (0.0%) | 12 (100.0%) |
| Real Estate, Rental & Leasing | 11 (42.3%) | 15 (57.7%) |
| Professional & Scientific | 22 (100.0%) | 0 (0.0%) |
| Enterprise Management | 0 (0.0%) | 0 (0.0%) |
| Administrative & Support | 207 (54.8%) | 171 (45.2%) |
| Educational Services | 227 (36.1%) | 402 (63.9%) |
| Health Care & Social Assistance | 159 (24.0%) | 502 (75.9%) |
| Arts, Entertainment & Recreation | 0 (0.0%) | 36 (100.0%) |
| Accommodation & Food Services | 55 (22.3%) | 192 (77.7%) |
| Public Administration | 35 (38.5%) | 56 (61.5%) |
| Total | 3,574 (57.1%) | 2,691 (42.9%) |
Education in Sunnyside
School Enrollment in Sunnyside
The most common levels of schooling among the 5,486 students in Sunnyside are middle school (1,579 | 28.8%), elementary school (1,491 | 27.2%), and high school (1,156 | 21.1%).
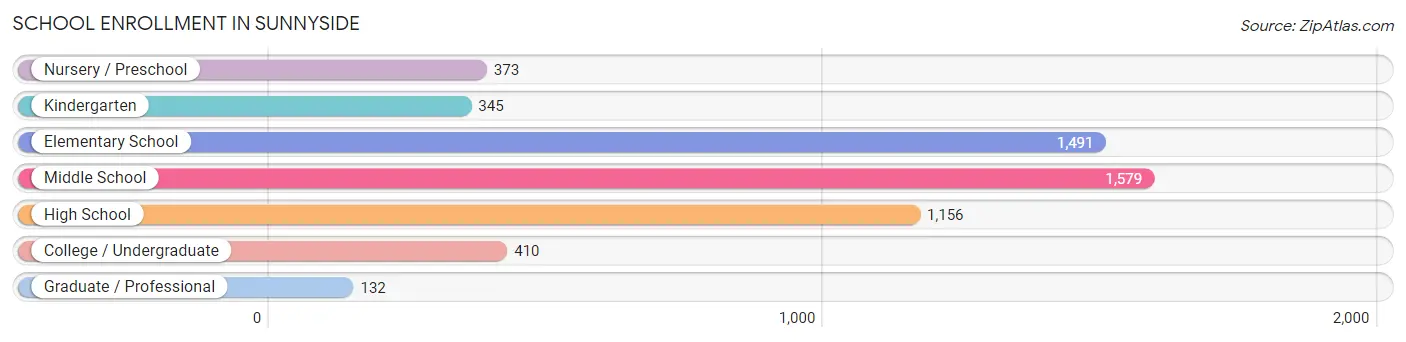
| School Level | # Students | % Students |
| Nursery / Preschool | 373 | 6.8% |
| Kindergarten | 345 | 6.3% |
| Elementary School | 1,491 | 27.2% |
| Middle School | 1,579 | 28.8% |
| High School | 1,156 | 21.1% |
| College / Undergraduate | 410 | 7.5% |
| Graduate / Professional | 132 | 2.4% |
| Total | 5,486 | 100.0% |
School Enrollment by Age by Funding Source in Sunnyside
Out of a total of 5,486 students who are enrolled in schools in Sunnyside, 307 (5.6%) attend a private institution, while the remaining 5,179 (94.4%) are enrolled in public schools. The age group of 25 to 34 year olds has the highest likelihood of being enrolled in private schools, with 111 (51.4% in the age bracket) enrolled. Conversely, the age group of 10 to 14 year olds has the lowest likelihood of being enrolled in a private school, with 1,894 (99.7% in the age bracket) attending a public institution.
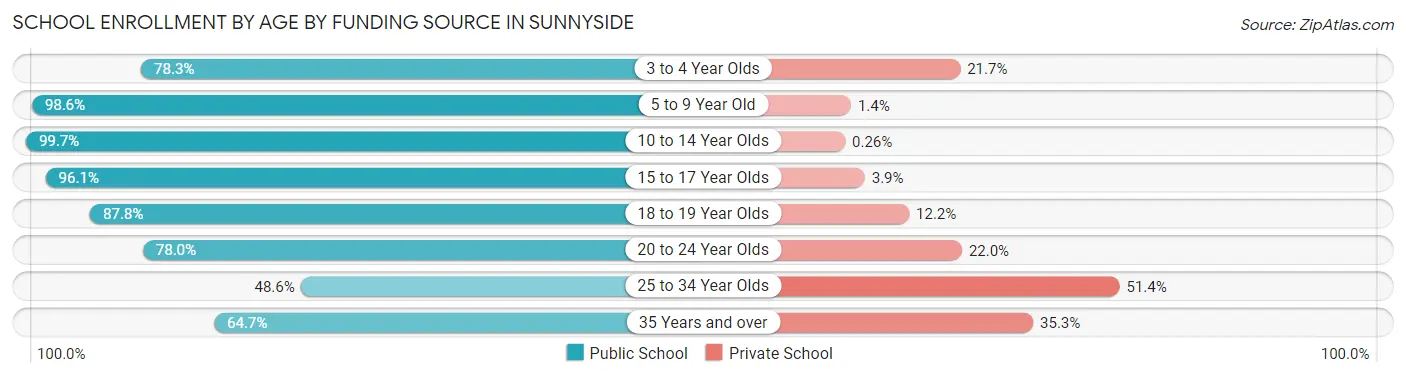
| Age Bracket | Public School | Private School |
| 3 to 4 Year Olds | 137 (78.3%) | 38 (21.7%) |
| 5 to 9 Year Old | 1,958 (98.6%) | 27 (1.4%) |
| 10 to 14 Year Olds | 1,894 (99.7%) | 5 (0.3%) |
| 15 to 17 Year Olds | 660 (96.1%) | 27 (3.9%) |
| 18 to 19 Year Olds | 245 (87.8%) | 34 (12.2%) |
| 20 to 24 Year Olds | 138 (78.0%) | 39 (22.0%) |
| 25 to 34 Year Olds | 105 (48.6%) | 111 (51.4%) |
| 35 Years and over | 44 (64.7%) | 24 (35.3%) |
| Total | 5,179 (94.4%) | 307 (5.6%) |
Educational Attainment by Field of Study in Sunnyside
Education (246 | 28.7%), psychology (118 | 13.8%), social sciences (111 | 13.0%), business (101 | 11.8%), and arts & humanities (95 | 11.1%) are the most common fields of study among 856 individuals in Sunnyside who have obtained a bachelor's degree or higher.
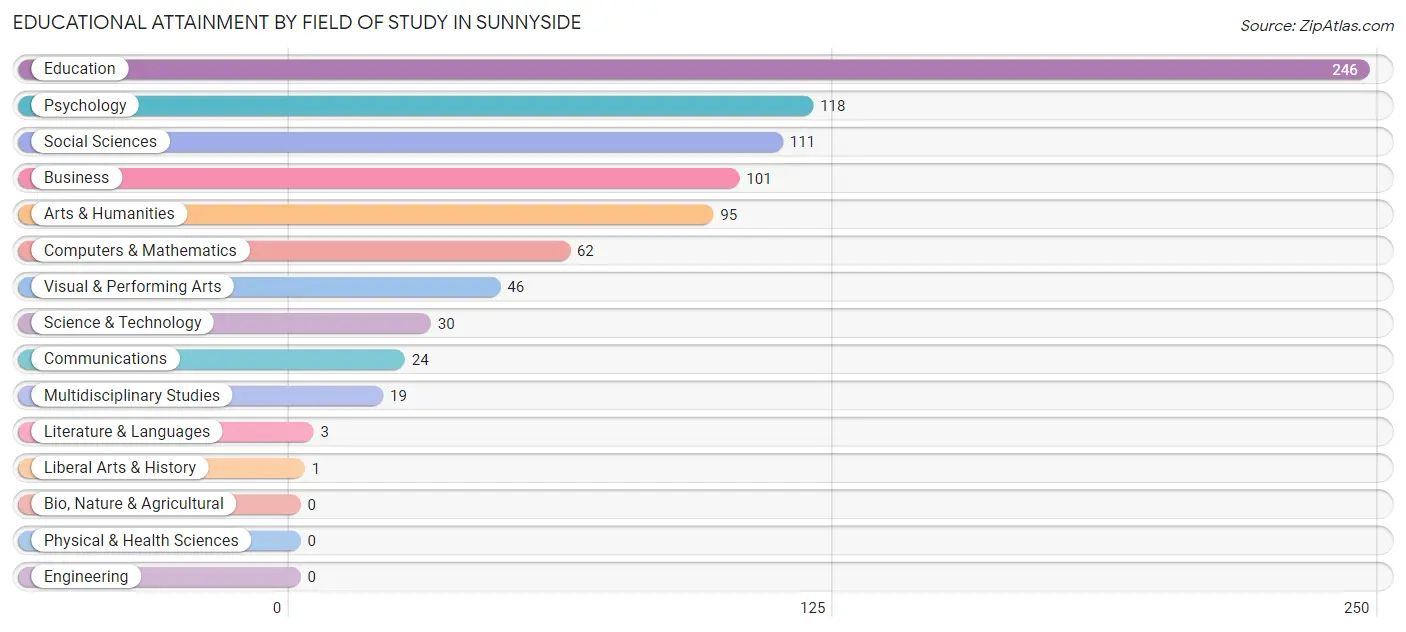
| Field of Study | # Graduates | % Graduates |
| Computers & Mathematics | 62 | 7.2% |
| Bio, Nature & Agricultural | 0 | 0.0% |
| Physical & Health Sciences | 0 | 0.0% |
| Psychology | 118 | 13.8% |
| Social Sciences | 111 | 13.0% |
| Engineering | 0 | 0.0% |
| Multidisciplinary Studies | 19 | 2.2% |
| Science & Technology | 30 | 3.5% |
| Business | 101 | 11.8% |
| Education | 246 | 28.7% |
| Literature & Languages | 3 | 0.4% |
| Liberal Arts & History | 1 | 0.1% |
| Visual & Performing Arts | 46 | 5.4% |
| Communications | 24 | 2.8% |
| Arts & Humanities | 95 | 11.1% |
| Total | 856 | 100.0% |
Transportation & Commute in Sunnyside
Vehicle Availability by Sex in Sunnyside
The most prevalent vehicle ownership categories in Sunnyside are males with 3 vehicles (1,167, accounting for 32.9%) and females with 3 vehicles (538, making up 46.3%).
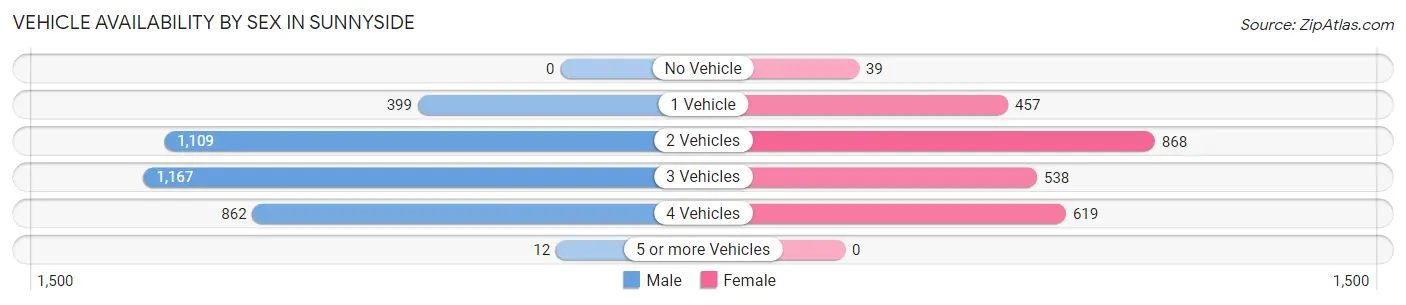
| Vehicles Available | Male | Female |
| No Vehicle | 0 (0.0%) | 39 (1.5%) |
| 1 Vehicle | 399 (11.2%) | 457 (18.1%) |
| 2 Vehicles | 1,109 (31.2%) | 868 (34.4%) |
| 3 Vehicles | 1,167 (32.9%) | 538 (21.3%) |
| 4 Vehicles | 862 (24.3%) | 619 (24.5%) |
| 5 or more Vehicles | 12 (0.3%) | 0 (0.0%) |
| Total | 3,549 (100.0%) | 2,521 (100.0%) |
Commute Time in Sunnyside
The most frequently occuring commute durations in Sunnyside are 10 to 14 minutes (1,104 commuters, 18.4%), 5 to 9 minutes (990 commuters, 16.5%), and 20 to 24 minutes (778 commuters, 13.0%).
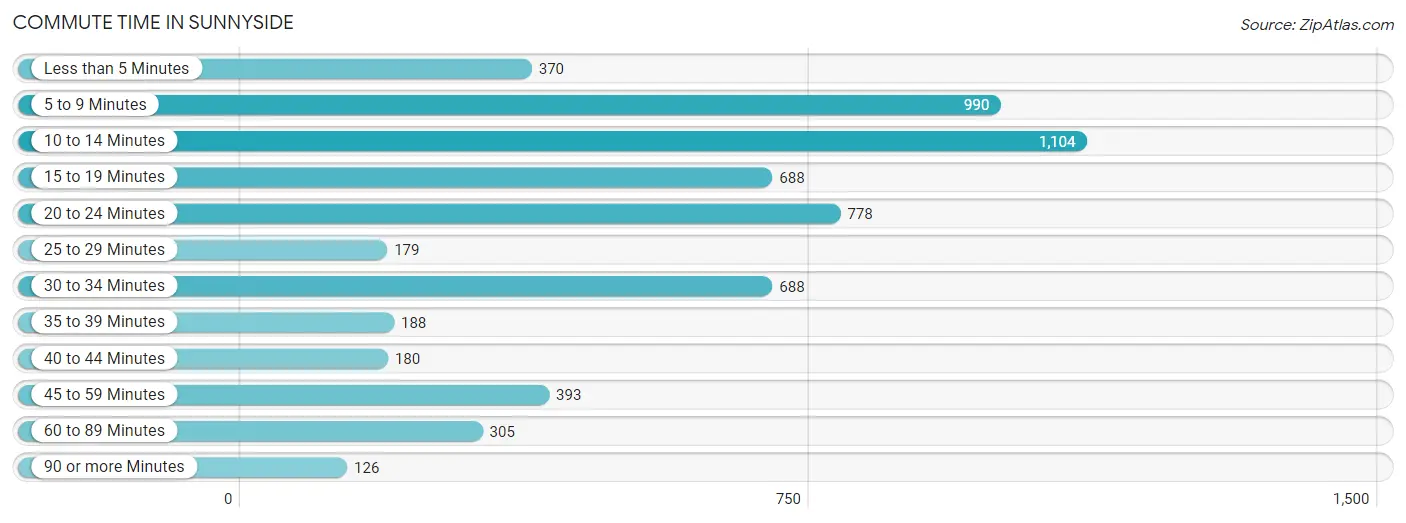
| Commute Time | # Commuters | % Commuters |
| Less than 5 Minutes | 370 | 6.2% |
| 5 to 9 Minutes | 990 | 16.5% |
| 10 to 14 Minutes | 1,104 | 18.4% |
| 15 to 19 Minutes | 688 | 11.5% |
| 20 to 24 Minutes | 778 | 13.0% |
| 25 to 29 Minutes | 179 | 3.0% |
| 30 to 34 Minutes | 688 | 11.5% |
| 35 to 39 Minutes | 188 | 3.1% |
| 40 to 44 Minutes | 180 | 3.0% |
| 45 to 59 Minutes | 393 | 6.6% |
| 60 to 89 Minutes | 305 | 5.1% |
| 90 or more Minutes | 126 | 2.1% |
Commute Time by Sex in Sunnyside
The most common commute times in Sunnyside are 10 to 14 minutes (695 commuters, 19.7%) for males and 5 to 9 minutes (535 commuters, 21.7%) for females.
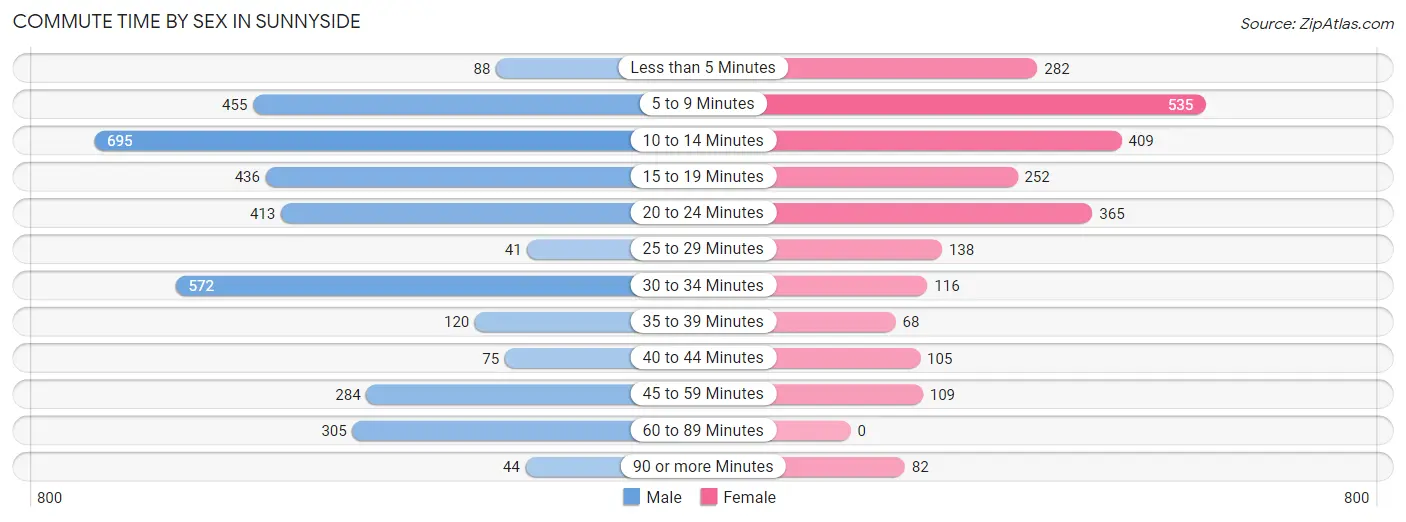
| Commute Time | Male | Female |
| Less than 5 Minutes | 88 (2.5%) | 282 (11.5%) |
| 5 to 9 Minutes | 455 (12.9%) | 535 (21.7%) |
| 10 to 14 Minutes | 695 (19.7%) | 409 (16.6%) |
| 15 to 19 Minutes | 436 (12.4%) | 252 (10.2%) |
| 20 to 24 Minutes | 413 (11.7%) | 365 (14.8%) |
| 25 to 29 Minutes | 41 (1.2%) | 138 (5.6%) |
| 30 to 34 Minutes | 572 (16.2%) | 116 (4.7%) |
| 35 to 39 Minutes | 120 (3.4%) | 68 (2.8%) |
| 40 to 44 Minutes | 75 (2.1%) | 105 (4.3%) |
| 45 to 59 Minutes | 284 (8.1%) | 109 (4.4%) |
| 60 to 89 Minutes | 305 (8.6%) | 0 (0.0%) |
| 90 or more Minutes | 44 (1.3%) | 82 (3.3%) |
Time of Departure to Work by Sex in Sunnyside
The most frequent times of departure to work in Sunnyside are 6:00 AM to 6:29 AM (725, 20.5%) for males and 7:30 AM to 7:59 AM (430, 17.5%) for females.
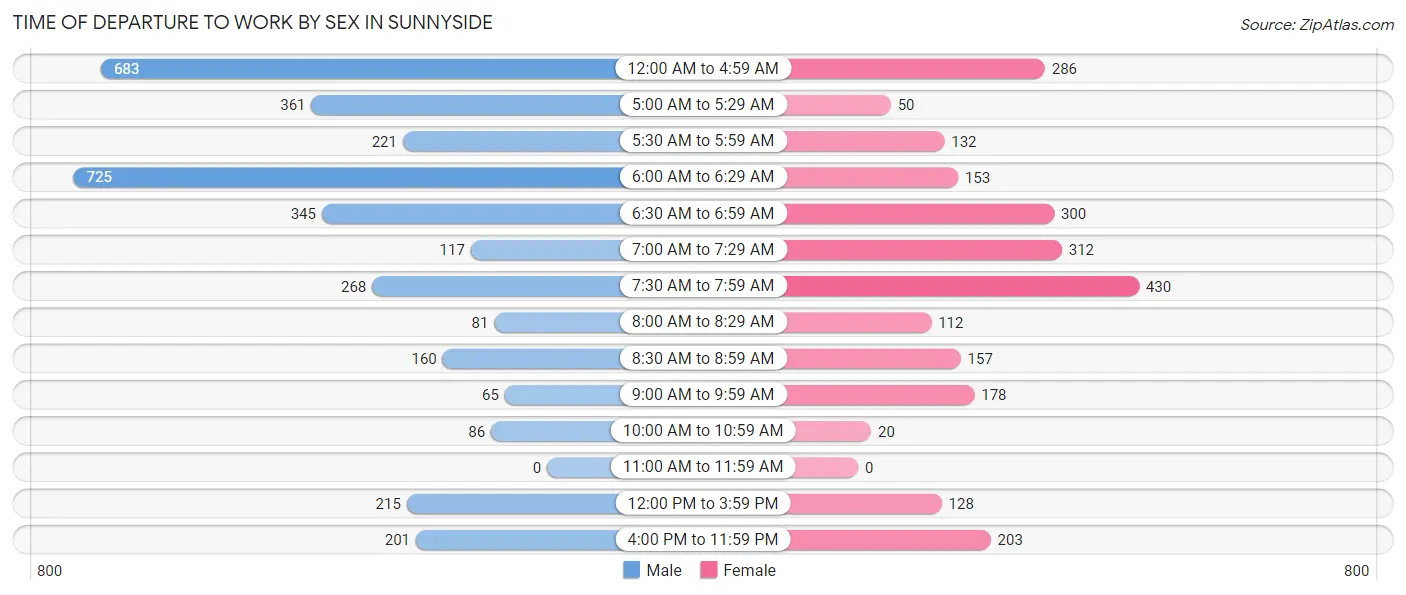
| Time of Departure | Male | Female |
| 12:00 AM to 4:59 AM | 683 (19.4%) | 286 (11.6%) |
| 5:00 AM to 5:29 AM | 361 (10.2%) | 50 (2.0%) |
| 5:30 AM to 5:59 AM | 221 (6.3%) | 132 (5.4%) |
| 6:00 AM to 6:29 AM | 725 (20.5%) | 153 (6.2%) |
| 6:30 AM to 6:59 AM | 345 (9.8%) | 300 (12.2%) |
| 7:00 AM to 7:29 AM | 117 (3.3%) | 312 (12.7%) |
| 7:30 AM to 7:59 AM | 268 (7.6%) | 430 (17.5%) |
| 8:00 AM to 8:29 AM | 81 (2.3%) | 112 (4.5%) |
| 8:30 AM to 8:59 AM | 160 (4.5%) | 157 (6.4%) |
| 9:00 AM to 9:59 AM | 65 (1.8%) | 178 (7.2%) |
| 10:00 AM to 10:59 AM | 86 (2.4%) | 20 (0.8%) |
| 11:00 AM to 11:59 AM | 0 (0.0%) | 0 (0.0%) |
| 12:00 PM to 3:59 PM | 215 (6.1%) | 128 (5.2%) |
| 4:00 PM to 11:59 PM | 201 (5.7%) | 203 (8.3%) |
| Total | 3,528 (100.0%) | 2,461 (100.0%) |
Housing Occupancy in Sunnyside
Occupancy by Ownership in Sunnyside
Of the total 4,429 dwellings in Sunnyside, owner-occupied units account for 2,702 (61.0%), while renter-occupied units make up 1,727 (39.0%).
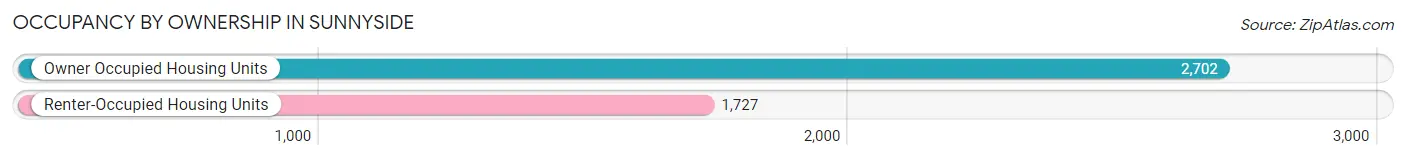
| Occupancy | # Housing Units | % Housing Units |
| Owner Occupied Housing Units | 2,702 | 61.0% |
| Renter-Occupied Housing Units | 1,727 | 39.0% |
| Total Occupied Housing Units | 4,429 | 100.0% |
Occupancy by Household Size in Sunnyside
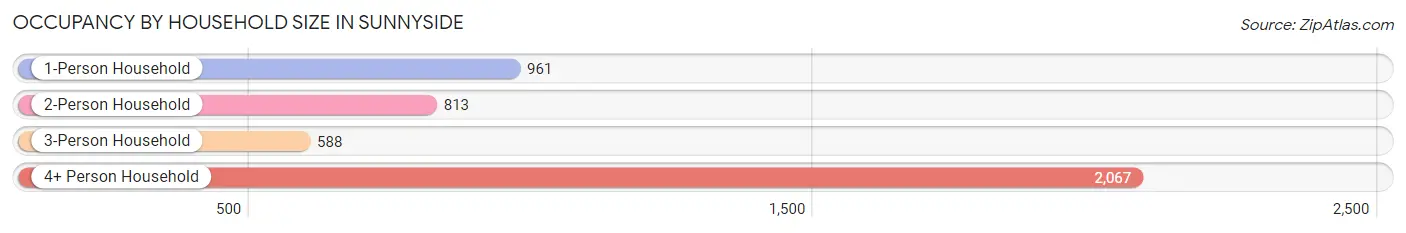
| Household Size | # Housing Units | % Housing Units |
| 1-Person Household | 961 | 21.7% |
| 2-Person Household | 813 | 18.4% |
| 3-Person Household | 588 | 13.3% |
| 4+ Person Household | 2,067 | 46.7% |
| Total Housing Units | 4,429 | 100.0% |
Occupancy by Ownership by Household Size in Sunnyside
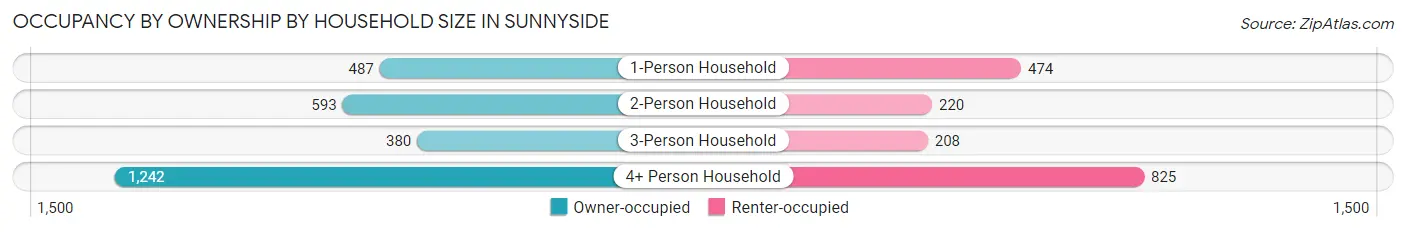
| Household Size | Owner-occupied | Renter-occupied |
| 1-Person Household | 487 (50.7%) | 474 (49.3%) |
| 2-Person Household | 593 (72.9%) | 220 (27.1%) |
| 3-Person Household | 380 (64.6%) | 208 (35.4%) |
| 4+ Person Household | 1,242 (60.1%) | 825 (39.9%) |
| Total Housing Units | 2,702 (61.0%) | 1,727 (39.0%) |
Occupancy by Educational Attainment in Sunnyside
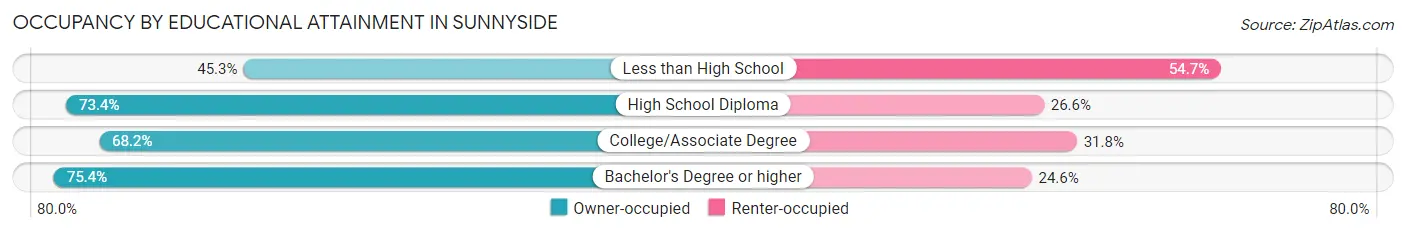
| Household Size | Owner-occupied | Renter-occupied |
| Less than High School | 831 (45.3%) | 1,003 (54.7%) |
| High School Diploma | 933 (73.4%) | 338 (26.6%) |
| College/Associate Degree | 568 (68.2%) | 265 (31.8%) |
| Bachelor's Degree or higher | 370 (75.4%) | 121 (24.6%) |
Occupancy by Age of Householder in Sunnyside
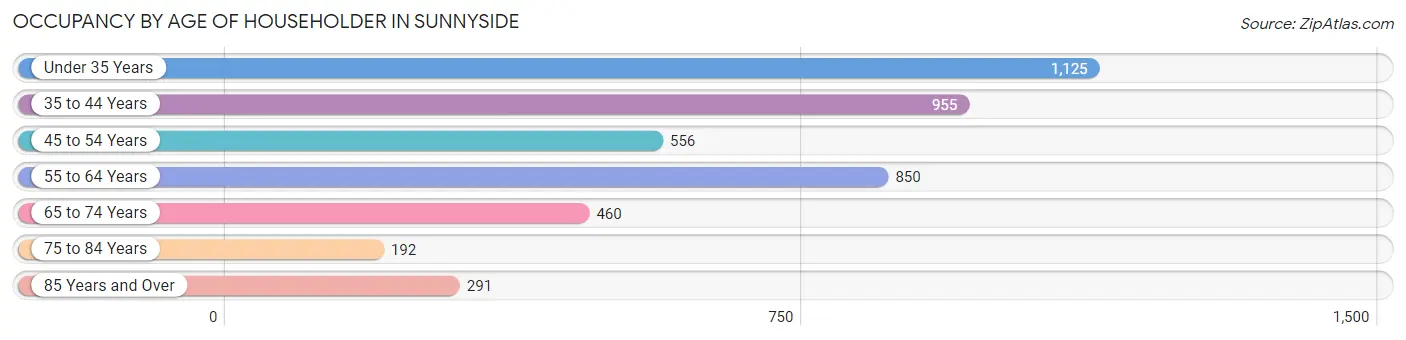
| Age Bracket | # Households | % Households |
| Under 35 Years | 1,125 | 25.4% |
| 35 to 44 Years | 955 | 21.6% |
| 45 to 54 Years | 556 | 12.6% |
| 55 to 64 Years | 850 | 19.2% |
| 65 to 74 Years | 460 | 10.4% |
| 75 to 84 Years | 192 | 4.3% |
| 85 Years and Over | 291 | 6.6% |
| Total | 4,429 | 100.0% |
Housing Finances in Sunnyside
Median Income by Occupancy in Sunnyside
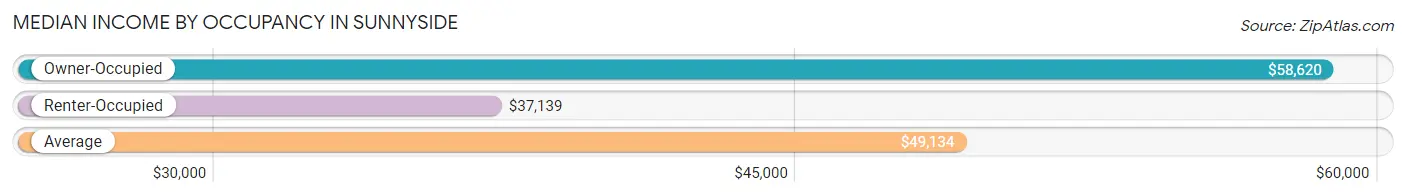
| Occupancy Type | # Households | Median Income |
| Owner-Occupied | 2,702 (61.0%) | $58,620 |
| Renter-Occupied | 1,727 (39.0%) | $37,139 |
| Average | 4,429 (100.0%) | $49,134 |
Occupancy by Householder Income Bracket in Sunnyside
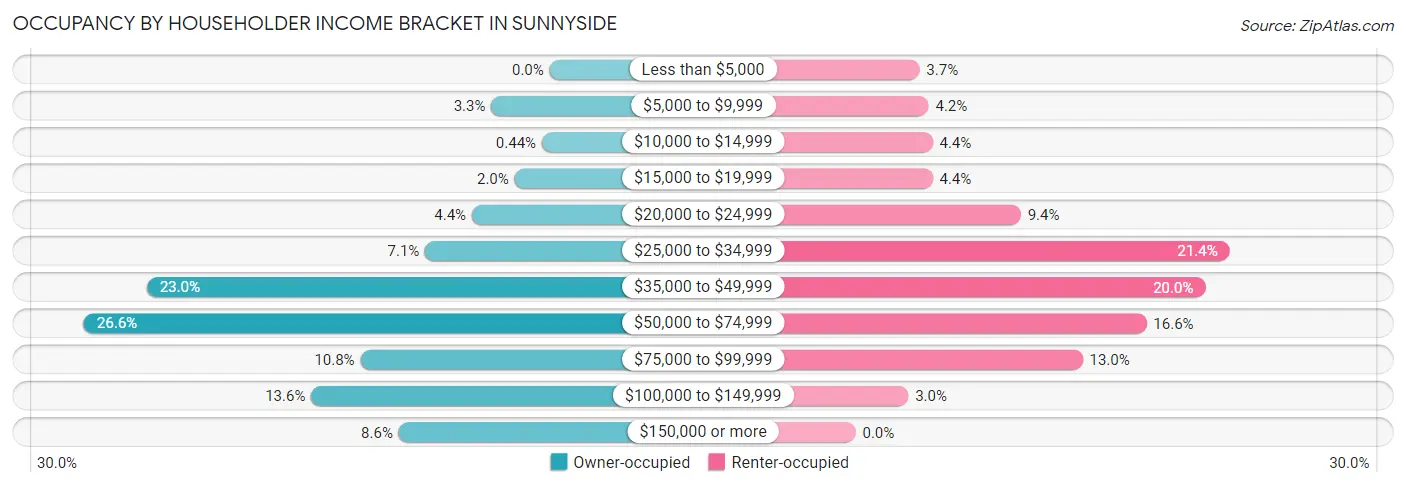
| Income Bracket | Owner-occupied | Renter-occupied |
| Less than $5,000 | 0 (0.0%) | 63 (3.6%) |
| $5,000 to $9,999 | 90 (3.3%) | 72 (4.2%) |
| $10,000 to $14,999 | 12 (0.4%) | 76 (4.4%) |
| $15,000 to $19,999 | 54 (2.0%) | 76 (4.4%) |
| $20,000 to $24,999 | 120 (4.4%) | 163 (9.4%) |
| $25,000 to $34,999 | 192 (7.1%) | 369 (21.4%) |
| $35,000 to $49,999 | 622 (23.0%) | 345 (20.0%) |
| $50,000 to $74,999 | 719 (26.6%) | 287 (16.6%) |
| $75,000 to $99,999 | 292 (10.8%) | 224 (13.0%) |
| $100,000 to $149,999 | 368 (13.6%) | 52 (3.0%) |
| $150,000 or more | 233 (8.6%) | 0 (0.0%) |
| Total | 2,702 (100.0%) | 1,727 (100.0%) |
Monthly Housing Cost Tiers in Sunnyside
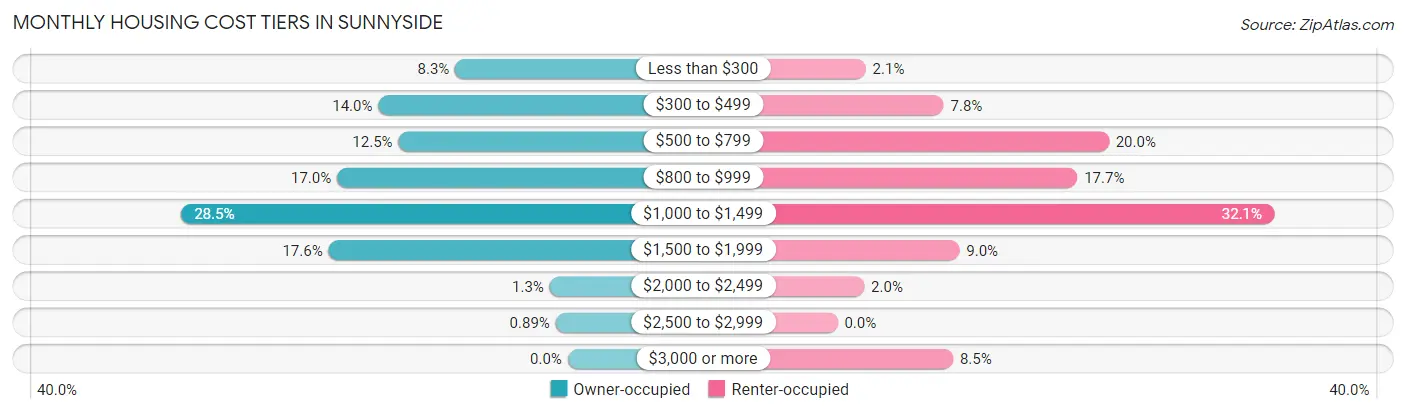
| Monthly Cost | Owner-occupied | Renter-occupied |
| Less than $300 | 224 (8.3%) | 36 (2.1%) |
| $300 to $499 | 377 (14.0%) | 135 (7.8%) |
| $500 to $799 | 337 (12.5%) | 345 (20.0%) |
| $800 to $999 | 459 (17.0%) | 305 (17.7%) |
| $1,000 to $1,499 | 769 (28.5%) | 555 (32.1%) |
| $1,500 to $1,999 | 476 (17.6%) | 155 (9.0%) |
| $2,000 to $2,499 | 36 (1.3%) | 34 (2.0%) |
| $2,500 to $2,999 | 24 (0.9%) | 0 (0.0%) |
| $3,000 or more | 0 (0.0%) | 147 (8.5%) |
| Total | 2,702 (100.0%) | 1,727 (100.0%) |
Physical Housing Characteristics in Sunnyside
Housing Structures in Sunnyside
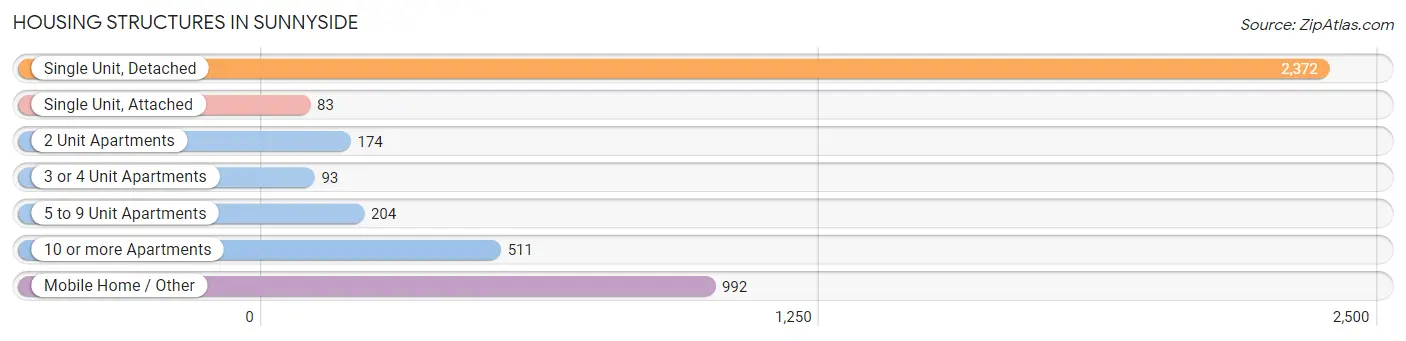
| Structure Type | # Housing Units | % Housing Units |
| Single Unit, Detached | 2,372 | 53.6% |
| Single Unit, Attached | 83 | 1.9% |
| 2 Unit Apartments | 174 | 3.9% |
| 3 or 4 Unit Apartments | 93 | 2.1% |
| 5 to 9 Unit Apartments | 204 | 4.6% |
| 10 or more Apartments | 511 | 11.5% |
| Mobile Home / Other | 992 | 22.4% |
| Total | 4,429 | 100.0% |
Housing Structures by Occupancy in Sunnyside
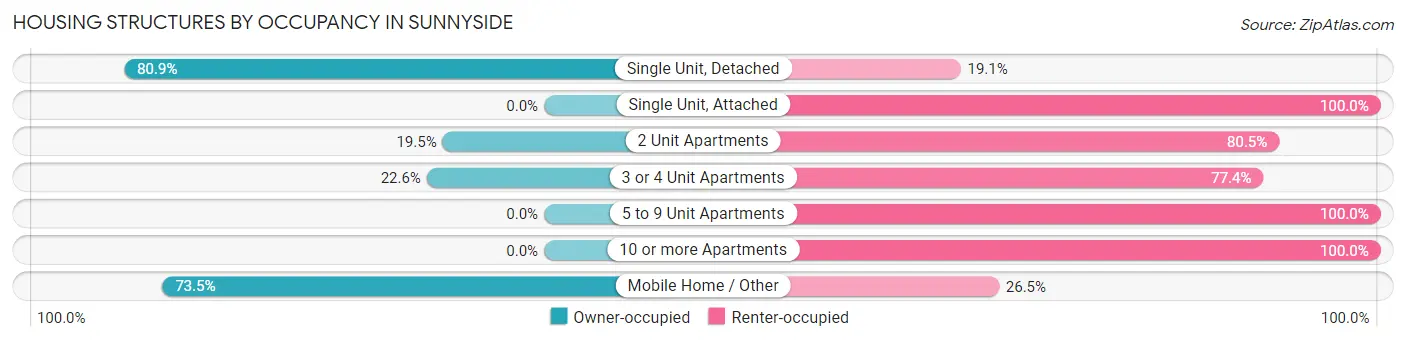
| Structure Type | Owner-occupied | Renter-occupied |
| Single Unit, Detached | 1,918 (80.9%) | 454 (19.1%) |
| Single Unit, Attached | 0 (0.0%) | 83 (100.0%) |
| 2 Unit Apartments | 34 (19.5%) | 140 (80.5%) |
| 3 or 4 Unit Apartments | 21 (22.6%) | 72 (77.4%) |
| 5 to 9 Unit Apartments | 0 (0.0%) | 204 (100.0%) |
| 10 or more Apartments | 0 (0.0%) | 511 (100.0%) |
| Mobile Home / Other | 729 (73.5%) | 263 (26.5%) |
| Total | 2,702 (61.0%) | 1,727 (39.0%) |
Housing Structures by Number of Rooms in Sunnyside
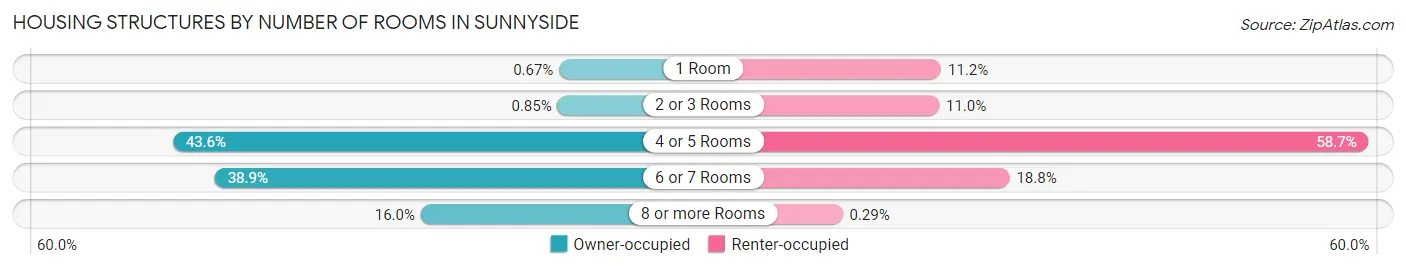
| Number of Rooms | Owner-occupied | Renter-occupied |
| 1 Room | 18 (0.7%) | 194 (11.2%) |
| 2 or 3 Rooms | 23 (0.9%) | 190 (11.0%) |
| 4 or 5 Rooms | 1,177 (43.6%) | 1,013 (58.7%) |
| 6 or 7 Rooms | 1,051 (38.9%) | 325 (18.8%) |
| 8 or more Rooms | 433 (16.0%) | 5 (0.3%) |
| Total | 2,702 (100.0%) | 1,727 (100.0%) |
Housing Structure by Heating Type in Sunnyside
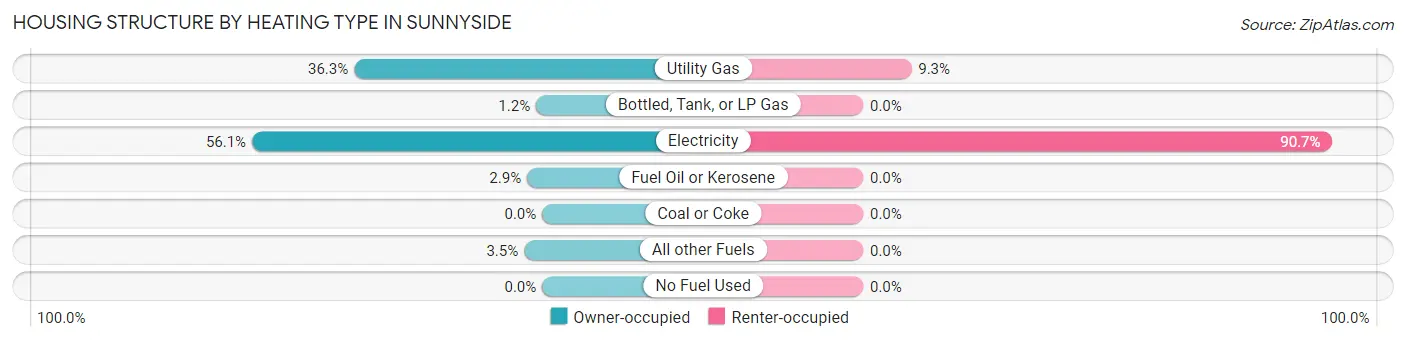
| Heating Type | Owner-occupied | Renter-occupied |
| Utility Gas | 982 (36.3%) | 161 (9.3%) |
| Bottled, Tank, or LP Gas | 32 (1.2%) | 0 (0.0%) |
| Electricity | 1,515 (56.1%) | 1,566 (90.7%) |
| Fuel Oil or Kerosene | 79 (2.9%) | 0 (0.0%) |
| Coal or Coke | 0 (0.0%) | 0 (0.0%) |
| All other Fuels | 94 (3.5%) | 0 (0.0%) |
| No Fuel Used | 0 (0.0%) | 0 (0.0%) |
| Total | 2,702 (100.0%) | 1,727 (100.0%) |
Household Vehicle Usage in Sunnyside
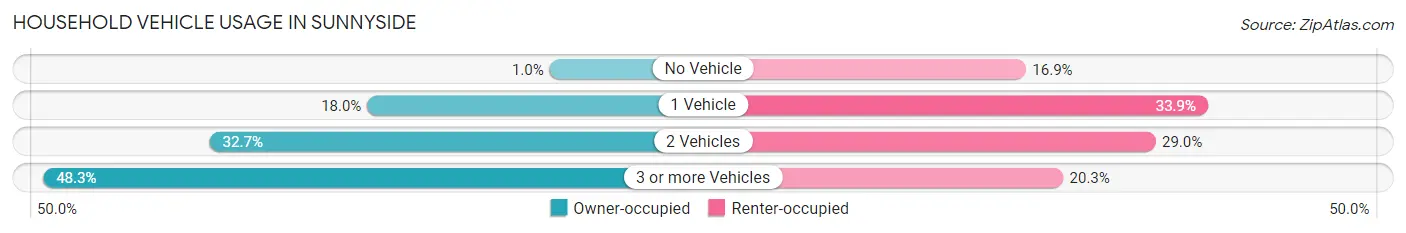
| Vehicles per Household | Owner-occupied | Renter-occupied |
| No Vehicle | 27 (1.0%) | 291 (16.9%) |
| 1 Vehicle | 487 (18.0%) | 585 (33.9%) |
| 2 Vehicles | 884 (32.7%) | 500 (28.9%) |
| 3 or more Vehicles | 1,304 (48.3%) | 351 (20.3%) |
| Total | 2,702 (100.0%) | 1,727 (100.0%) |
Real Estate & Mortgages in Sunnyside
Real Estate and Mortgage Overview in Sunnyside
| Characteristic | Without Mortgage | With Mortgage |
| Housing Units | 964 | 1,738 |
| Median Property Value | $163,600 | $195,800 |
| Median Household Income | $40,825 | $178 |
| Monthly Housing Costs | $471 | $0 |
| Real Estate Taxes | - | - |
Property Value by Mortgage Status in Sunnyside
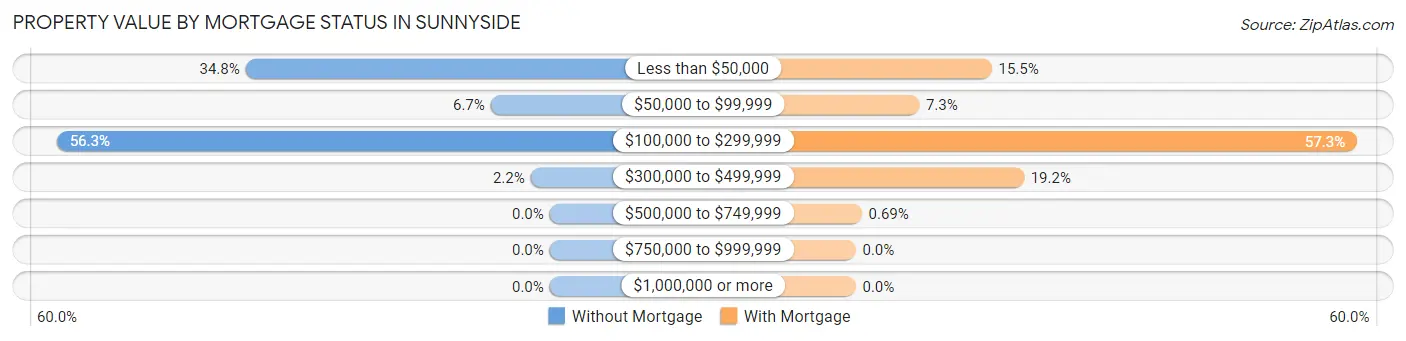
| Property Value | Without Mortgage | With Mortgage |
| Less than $50,000 | 335 (34.7%) | 270 (15.5%) |
| $50,000 to $99,999 | 65 (6.7%) | 126 (7.2%) |
| $100,000 to $299,999 | 543 (56.3%) | 996 (57.3%) |
| $300,000 to $499,999 | 21 (2.2%) | 334 (19.2%) |
| $500,000 to $749,999 | 0 (0.0%) | 12 (0.7%) |
| $750,000 to $999,999 | 0 (0.0%) | 0 (0.0%) |
| $1,000,000 or more | 0 (0.0%) | 0 (0.0%) |
| Total | 964 (100.0%) | 1,738 (100.0%) |
Household Income by Mortgage Status in Sunnyside
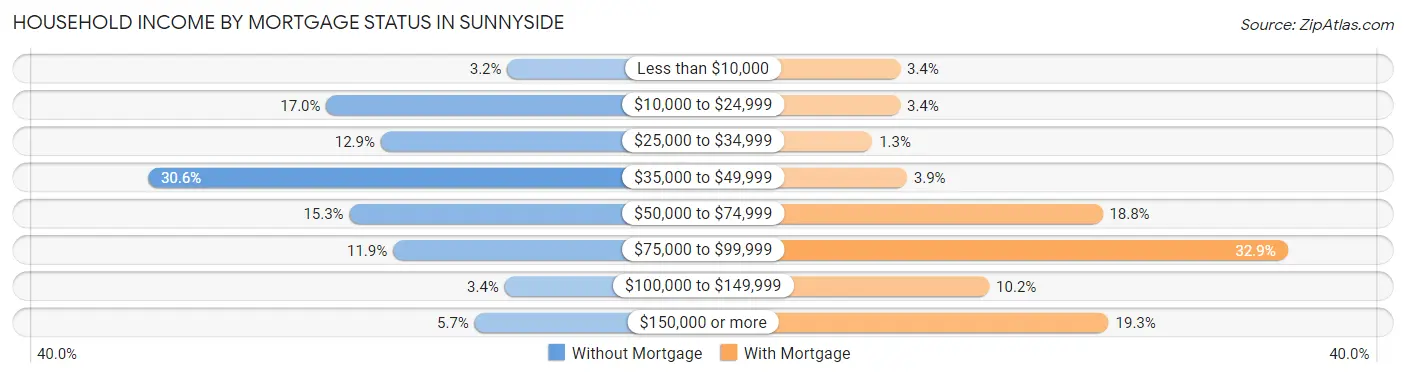
| Household Income | Without Mortgage | With Mortgage |
| Less than $10,000 | 31 (3.2%) | 59 (3.4%) |
| $10,000 to $24,999 | 164 (17.0%) | 59 (3.4%) |
| $25,000 to $34,999 | 124 (12.9%) | 22 (1.3%) |
| $35,000 to $49,999 | 295 (30.6%) | 68 (3.9%) |
| $50,000 to $74,999 | 147 (15.2%) | 327 (18.8%) |
| $75,000 to $99,999 | 115 (11.9%) | 572 (32.9%) |
| $100,000 to $149,999 | 33 (3.4%) | 177 (10.2%) |
| $150,000 or more | 55 (5.7%) | 335 (19.3%) |
| Total | 964 (100.0%) | 1,738 (100.0%) |
Property Value to Household Income Ratio in Sunnyside
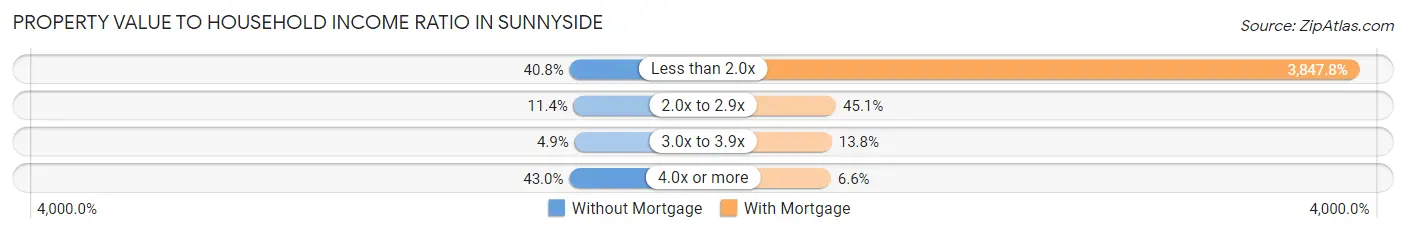
| Value-to-Income Ratio | Without Mortgage | With Mortgage |
| Less than 2.0x | 393 (40.8%) | 66,875 (3,847.8%) |
| 2.0x to 2.9x | 110 (11.4%) | 784 (45.1%) |
| 3.0x to 3.9x | 47 (4.9%) | 239 (13.8%) |
| 4.0x or more | 414 (42.9%) | 114 (6.6%) |
| Total | 964 (100.0%) | 1,738 (100.0%) |
Real Estate Taxes by Mortgage Status in Sunnyside
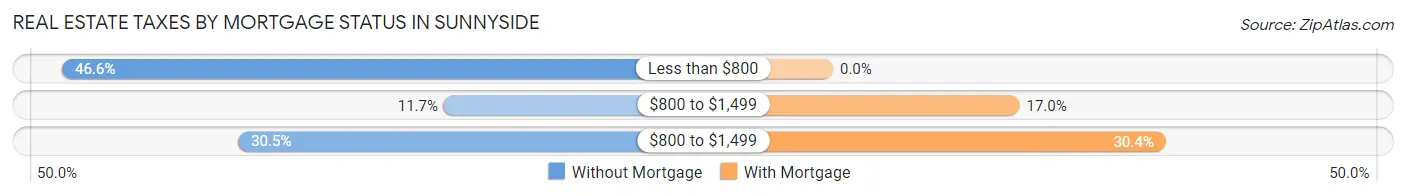
| Property Taxes | Without Mortgage | With Mortgage |
| Less than $800 | 449 (46.6%) | 0 (0.0%) |
| $800 to $1,499 | 113 (11.7%) | 296 (17.0%) |
| $800 to $1,499 | 294 (30.5%) | 528 (30.4%) |
| Total | 964 (100.0%) | 1,738 (100.0%) |
Health & Disability in Sunnyside
Health Insurance Coverage by Age in Sunnyside
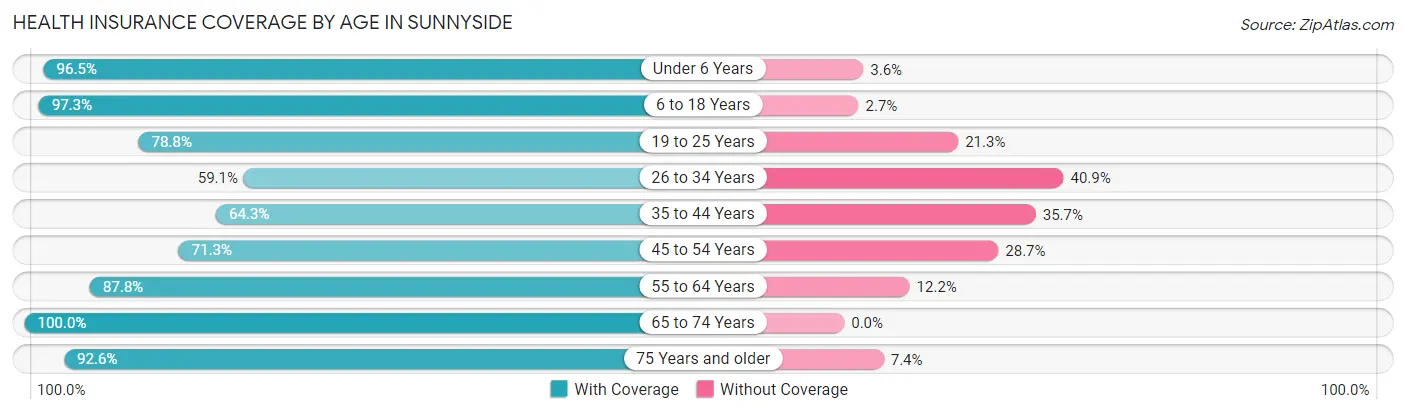
| Age Bracket | With Coverage | Without Coverage |
| Under 6 Years | 1,819 (96.5%) | 67 (3.5%) |
| 6 to 18 Years | 4,539 (97.3%) | 124 (2.7%) |
| 19 to 25 Years | 1,049 (78.7%) | 283 (21.2%) |
| 26 to 34 Years | 1,274 (59.1%) | 881 (40.9%) |
| 35 to 44 Years | 1,161 (64.3%) | 645 (35.7%) |
| 45 to 54 Years | 908 (71.3%) | 366 (28.7%) |
| 55 to 64 Years | 1,246 (87.8%) | 173 (12.2%) |
| 65 to 74 Years | 844 (100.0%) | 0 (0.0%) |
| 75 Years and older | 780 (92.6%) | 62 (7.4%) |
| Total | 13,620 (84.0%) | 2,601 (16.0%) |
Health Insurance Coverage by Citizenship Status in Sunnyside
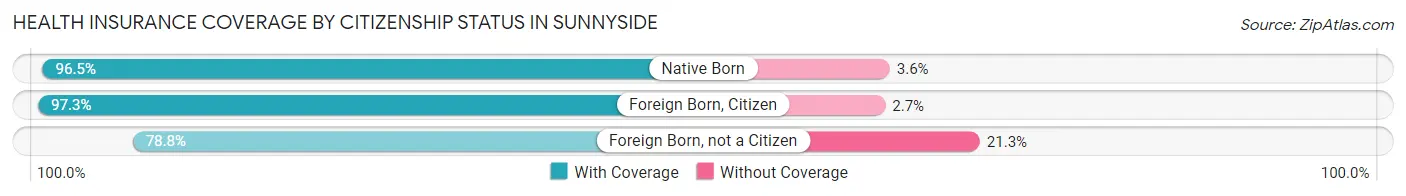
| Citizenship Status | With Coverage | Without Coverage |
| Native Born | 1,819 (96.5%) | 67 (3.5%) |
| Foreign Born, Citizen | 4,539 (97.3%) | 124 (2.7%) |
| Foreign Born, not a Citizen | 1,049 (78.7%) | 283 (21.2%) |
Health Insurance Coverage by Household Income in Sunnyside
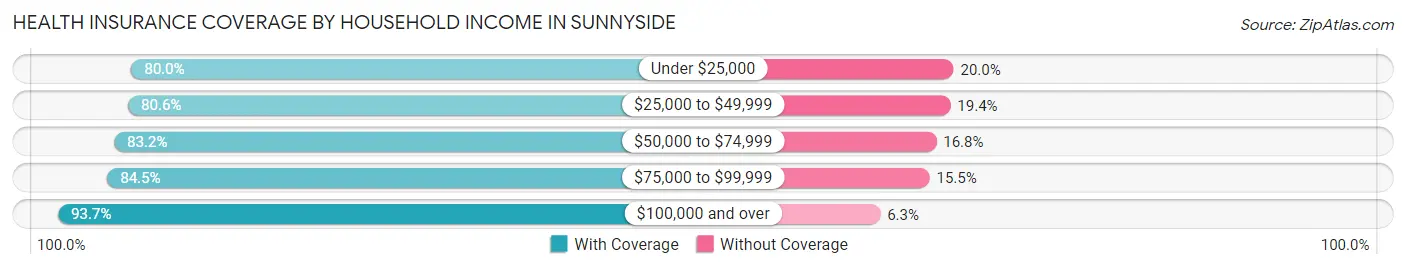
| Household Income | With Coverage | Without Coverage |
| Under $25,000 | 1,152 (80.0%) | 288 (20.0%) |
| $25,000 to $49,999 | 4,234 (80.6%) | 1,020 (19.4%) |
| $50,000 to $74,999 | 3,948 (83.2%) | 795 (16.8%) |
| $75,000 to $99,999 | 1,897 (84.5%) | 348 (15.5%) |
| $100,000 and over | 2,232 (93.7%) | 149 (6.3%) |
Public vs Private Health Insurance Coverage by Age in Sunnyside
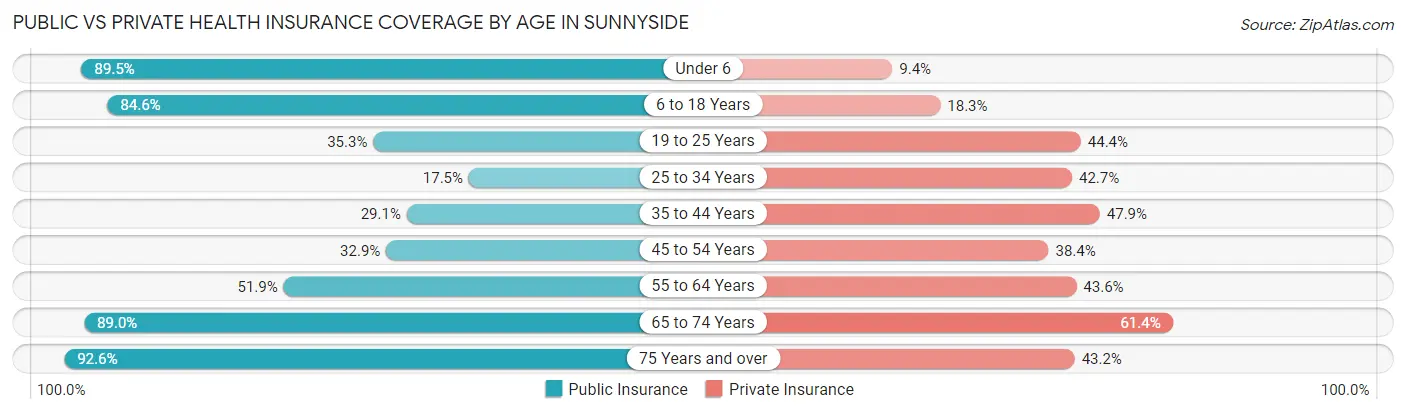
| Age Bracket | Public Insurance | Private Insurance |
| Under 6 | 1,687 (89.4%) | 177 (9.4%) |
| 6 to 18 Years | 3,946 (84.6%) | 853 (18.3%) |
| 19 to 25 Years | 470 (35.3%) | 591 (44.4%) |
| 25 to 34 Years | 378 (17.5%) | 921 (42.7%) |
| 35 to 44 Years | 525 (29.1%) | 865 (47.9%) |
| 45 to 54 Years | 419 (32.9%) | 489 (38.4%) |
| 55 to 64 Years | 737 (51.9%) | 618 (43.5%) |
| 65 to 74 Years | 751 (89.0%) | 518 (61.4%) |
| 75 Years and over | 780 (92.6%) | 364 (43.2%) |
| Total | 9,693 (59.8%) | 5,396 (33.3%) |
Disability Status by Sex by Age in Sunnyside
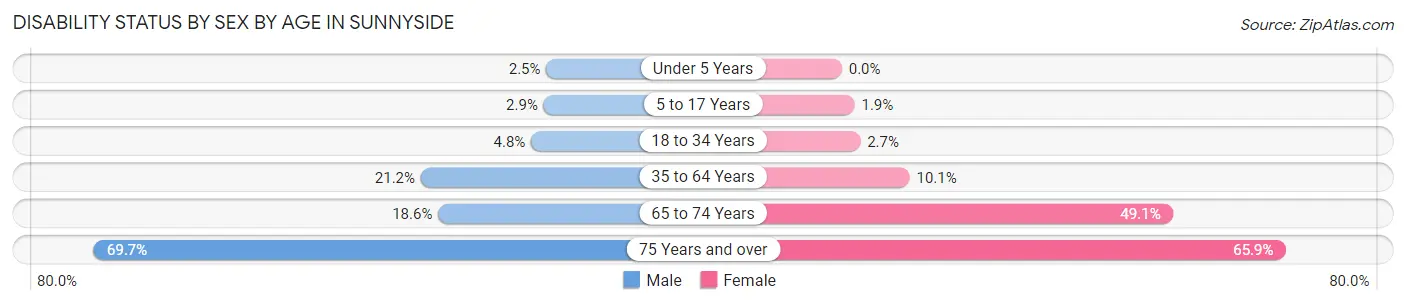
| Age Bracket | Male | Female |
| Under 5 Years | 22 (2.5%) | 0 (0.0%) |
| 5 to 17 Years | 70 (2.9%) | 47 (1.9%) |
| 18 to 34 Years | 86 (4.8%) | 51 (2.7%) |
| 35 to 64 Years | 487 (21.2%) | 221 (10.1%) |
| 65 to 74 Years | 105 (18.6%) | 137 (49.1%) |
| 75 Years and over | 244 (69.7%) | 324 (65.8%) |
Disability Class by Sex by Age in Sunnyside
Disability Class: Hearing Difficulty
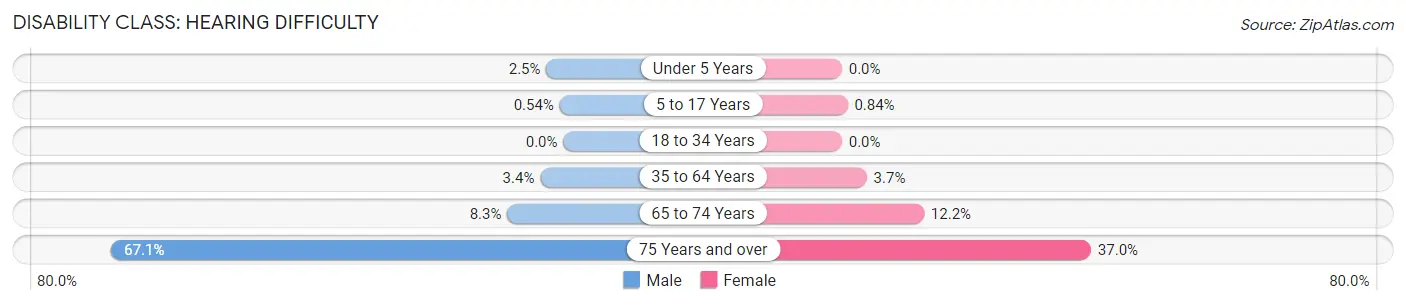
| Age Bracket | Male | Female |
| Under 5 Years | 22 (2.5%) | 0 (0.0%) |
| 5 to 17 Years | 13 (0.5%) | 21 (0.8%) |
| 18 to 34 Years | 0 (0.0%) | 0 (0.0%) |
| 35 to 64 Years | 79 (3.4%) | 81 (3.7%) |
| 65 to 74 Years | 47 (8.3%) | 34 (12.2%) |
| 75 Years and over | 235 (67.1%) | 182 (37.0%) |
Disability Class: Vision Difficulty
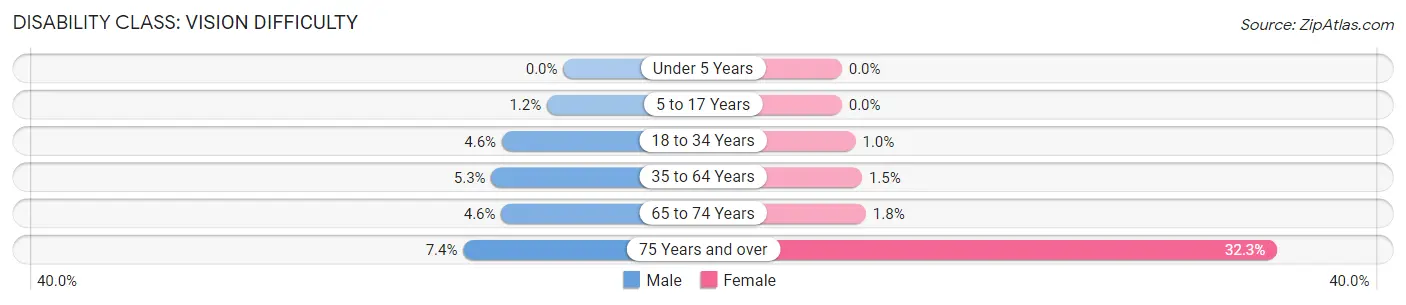
| Age Bracket | Male | Female |
| Under 5 Years | 0 (0.0%) | 0 (0.0%) |
| 5 to 17 Years | 29 (1.2%) | 0 (0.0%) |
| 18 to 34 Years | 82 (4.6%) | 19 (1.0%) |
| 35 to 64 Years | 123 (5.3%) | 33 (1.5%) |
| 65 to 74 Years | 26 (4.6%) | 5 (1.8%) |
| 75 Years and over | 26 (7.4%) | 159 (32.3%) |
Disability Class: Cognitive Difficulty
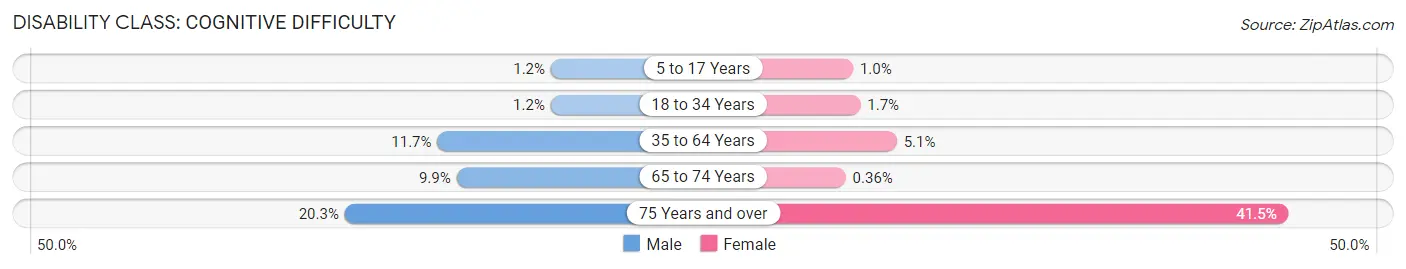
| Age Bracket | Male | Female |
| 5 to 17 Years | 28 (1.2%) | 26 (1.0%) |
| 18 to 34 Years | 21 (1.2%) | 32 (1.7%) |
| 35 to 64 Years | 269 (11.7%) | 112 (5.1%) |
| 65 to 74 Years | 56 (9.9%) | 1 (0.4%) |
| 75 Years and over | 71 (20.3%) | 204 (41.5%) |
Disability Class: Ambulatory Difficulty
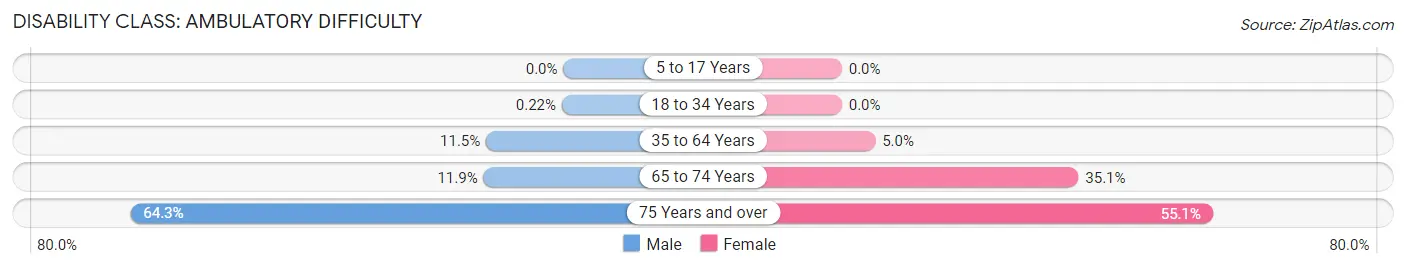
| Age Bracket | Male | Female |
| 5 to 17 Years | 0 (0.0%) | 0 (0.0%) |
| 18 to 34 Years | 4 (0.2%) | 0 (0.0%) |
| 35 to 64 Years | 264 (11.5%) | 109 (5.0%) |
| 65 to 74 Years | 67 (11.9%) | 98 (35.1%) |
| 75 Years and over | 225 (64.3%) | 271 (55.1%) |
Disability Class: Self-Care Difficulty
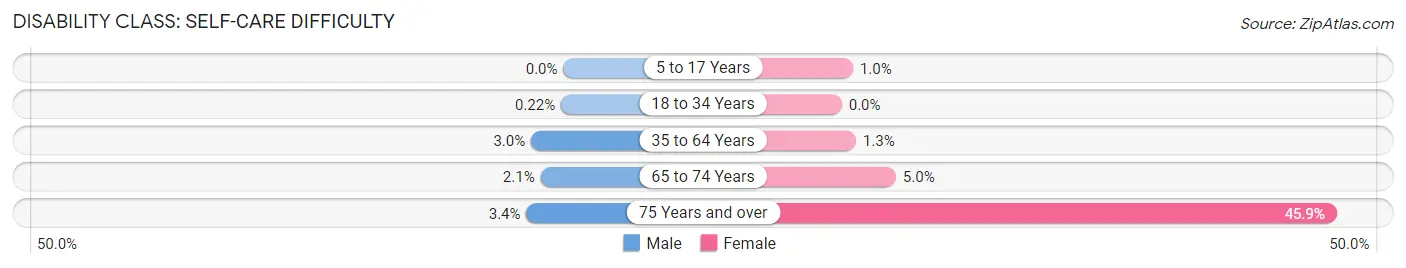
| Age Bracket | Male | Female |
| 5 to 17 Years | 0 (0.0%) | 26 (1.0%) |
| 18 to 34 Years | 4 (0.2%) | 0 (0.0%) |
| 35 to 64 Years | 69 (3.0%) | 29 (1.3%) |
| 65 to 74 Years | 12 (2.1%) | 14 (5.0%) |
| 75 Years and over | 12 (3.4%) | 226 (45.9%) |
Technology Access in Sunnyside
Computing Device Access in Sunnyside
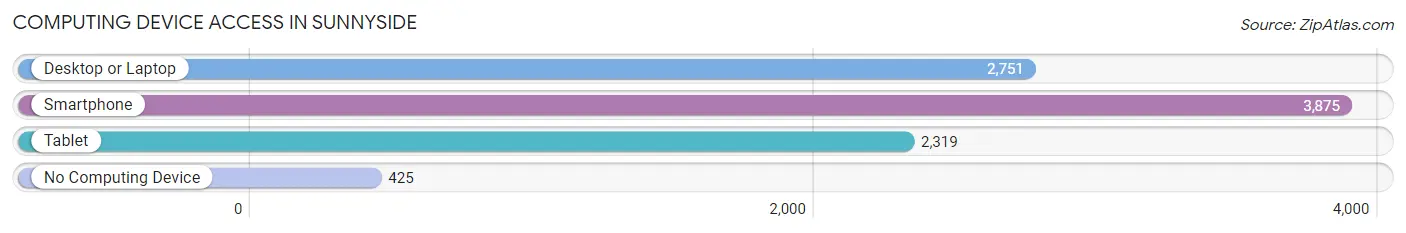
| Device Type | # Households | % Households |
| Desktop or Laptop | 2,751 | 62.1% |
| Smartphone | 3,875 | 87.5% |
| Tablet | 2,319 | 52.4% |
| No Computing Device | 425 | 9.6% |
| Total | 4,429 | 100.0% |
Internet Access in Sunnyside
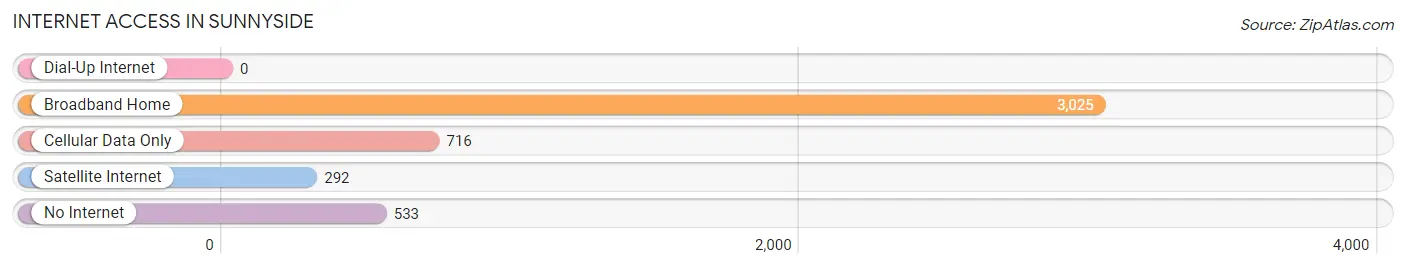
| Internet Type | # Households | % Households |
| Dial-Up Internet | 0 | 0.0% |
| Broadband Home | 3,025 | 68.3% |
| Cellular Data Only | 716 | 16.2% |
| Satellite Internet | 292 | 6.6% |
| No Internet | 533 | 12.0% |
| Total | 4,429 | 100.0% |
Sunnyside Summary
Sunnyside is a city located in Yakima County, Washington, United States. It is located in the Yakima Valley, a region known for its agricultural production. The population of Sunnyside was 15,858 at the 2010 census.
History
Sunnyside was founded in 1906 by the Northern Pacific Railway. The city was named after the Sunnyside Land Company, which was formed by the railroad to develop the area. The city was incorporated in 1910.
The Yakima Valley has been inhabited by Native Americans for thousands of years. The Yakama, Palouse, and Wanapum tribes were the primary inhabitants of the area. The Yakama Nation still has a reservation in the area.
Geography
Sunnyside is located in the Yakima Valley, a region known for its agricultural production. The city is situated in the foothills of the Cascade Mountains, and is surrounded by rolling hills and farmland. The Yakima River runs through the city, providing irrigation for the surrounding agricultural lands.
The climate in Sunnyside is semi-arid, with hot summers and cold winters. The average annual precipitation is 8.5 inches.
Economy
Sunnyside's economy is largely based on agriculture. The city is home to a number of large agricultural companies, including Lamb Weston, a potato processing plant, and Columbia Fruit Packers, a fruit packing and shipping company.
The city is also home to a number of other businesses, including a number of retail stores, restaurants, and hotels.
Demographics
As of the 2010 census, the population of Sunnyside was 15,858. The racial makeup of the city was 73.3% White, 0.9% African American, 1.2% Native American, 0.7% Asian, 0.1% Pacific Islander, 20.2% from other races, and 3.6% from two or more races. Hispanic or Latino of any race were 44.2% of the population.
The median household income in Sunnyside was $37,917, and the median family income was $45,938. The per capita income was $17,845. About 17.2% of families and 22.2% of the population were below the poverty line, including 33.2% of those under age 18 and 8.2% of those age 65 or over.
Sunnyside is served by the Sunnyside School District, which includes four elementary schools, one middle school, and one high school. The city is also home to a number of private schools, including Sunnyside Christian School and Sunnyside Adventist School.
Common Questions
What is Per Capita Income in Sunnyside?
Per Capita income in Sunnyside is $17,298.
What is the Median Family Income in Sunnyside?
Median Family Income in Sunnyside is $56,438.
What is the Median Household income in Sunnyside?
Median Household Income in Sunnyside is $49,134.
What is Income or Wage Gap in Sunnyside?
Income or Wage Gap in Sunnyside is 13.2%.
Women in Sunnyside earn 86.8 cents for every dollar earned by a man.
What is Family Income Deficit in Sunnyside?
Family Income Deficit in Sunnyside is $10,433.
Families that are below poverty line in Sunnyside earn $10,433 less on average than the poverty threshold level.
What is Inequality or Gini Index in Sunnyside?
Inequality or Gini Index in Sunnyside is 0.38.
What is the Total Population of Sunnyside?
Total Population of Sunnyside is 16,329.
What is the Total Male Population of Sunnyside?
Total Male Population of Sunnyside is 8,376.
What is the Total Female Population of Sunnyside?
Total Female Population of Sunnyside is 7,953.
What is the Ratio of Males per 100 Females in Sunnyside?
There are 105.32 Males per 100 Females in Sunnyside.
What is the Ratio of Females per 100 Males in Sunnyside?
There are 94.95 Females per 100 Males in Sunnyside.
What is the Median Population Age in Sunnyside?
Median Population Age in Sunnyside is 27.1 Years.
What is the Average Family Size in Sunnyside
Average Family Size in Sunnyside is 4.3 People.
What is the Average Household Size in Sunnyside
Average Household Size in Sunnyside is 3.6 People.
How Large is the Labor Force in Sunnyside?
There are 6,881 People in the Labor Forcein in Sunnyside.
What is the Percentage of People in the Labor Force in Sunnyside?
65.2% of People are in the Labor Force in Sunnyside.
What is the Unemployment Rate in Sunnyside?
Unemployment Rate in Sunnyside is 8.9%.