Niles, MI Map & Demographics
Niles Map
Niles Overview
$24,313
PER CAPITA INCOME
$55,618
AVG FAMILY INCOME
$42,181
AVG HOUSEHOLD INCOME
33.5%
WAGE / INCOME GAP [ % ]
66.5¢/ $1
WAGE / INCOME GAP [ $ ]
$13,611
FAMILY INCOME DEFICIT
0.43
INEQUALITY / GINI INDEX
11,871
TOTAL POPULATION
5,664
MALE POPULATION
6,207
FEMALE POPULATION
91.25
MALES / 100 FEMALES
109.59
FEMALES / 100 MALES
38.5
MEDIAN AGE
3.0
AVG FAMILY SIZE
2.3
AVG HOUSEHOLD SIZE
6,141
LABOR FORCE [ PEOPLE ]
63.4%
PERCENT IN LABOR FORCE
12.1%
UNEMPLOYMENT RATE
Niles Zip Codes
Niles Area Codes
Income in Niles
Income Overview in Niles
Per Capita Income in Niles is $24,313, while median incomes of families and households are $55,618 and $42,181 respectively.
| Characteristic | Number | Measure |
| Per Capita Income | 11,871 | $24,313 |
| Median Family Income | 2,802 | $55,618 |
| Mean Family Income | 2,802 | $65,797 |
| Median Household Income | 5,089 | $42,181 |
| Mean Household Income | 5,089 | $54,108 |
| Income Deficit | 2,802 | $13,611 |
| Wage / Income Gap (%) | 11,871 | 33.46% |
| Wage / Income Gap ($) | 11,871 | 66.54¢ per $1 |
| Gini / Inequality Index | 11,871 | 0.43 |
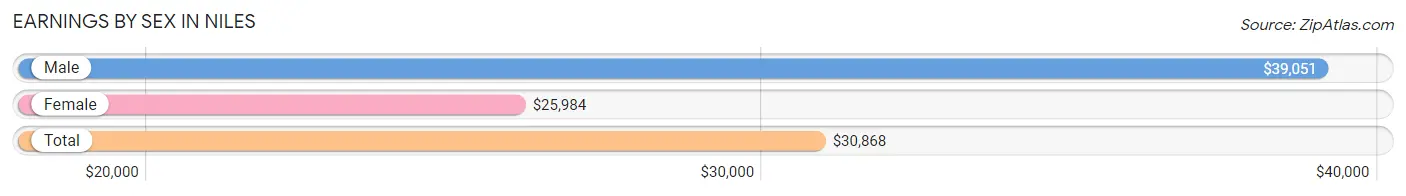
Earnings by Sex in Niles
Average Earnings in Niles are $30,868, $39,051 for men and $25,984 for women, a difference of 33.5%.
| Sex | Number | Average Earnings |
| Male | 3,106 (51.5%) | $39,051 |
| Female | 2,923 (48.5%) | $25,984 |
| Total | 6,029 (100.0%) | $30,868 |
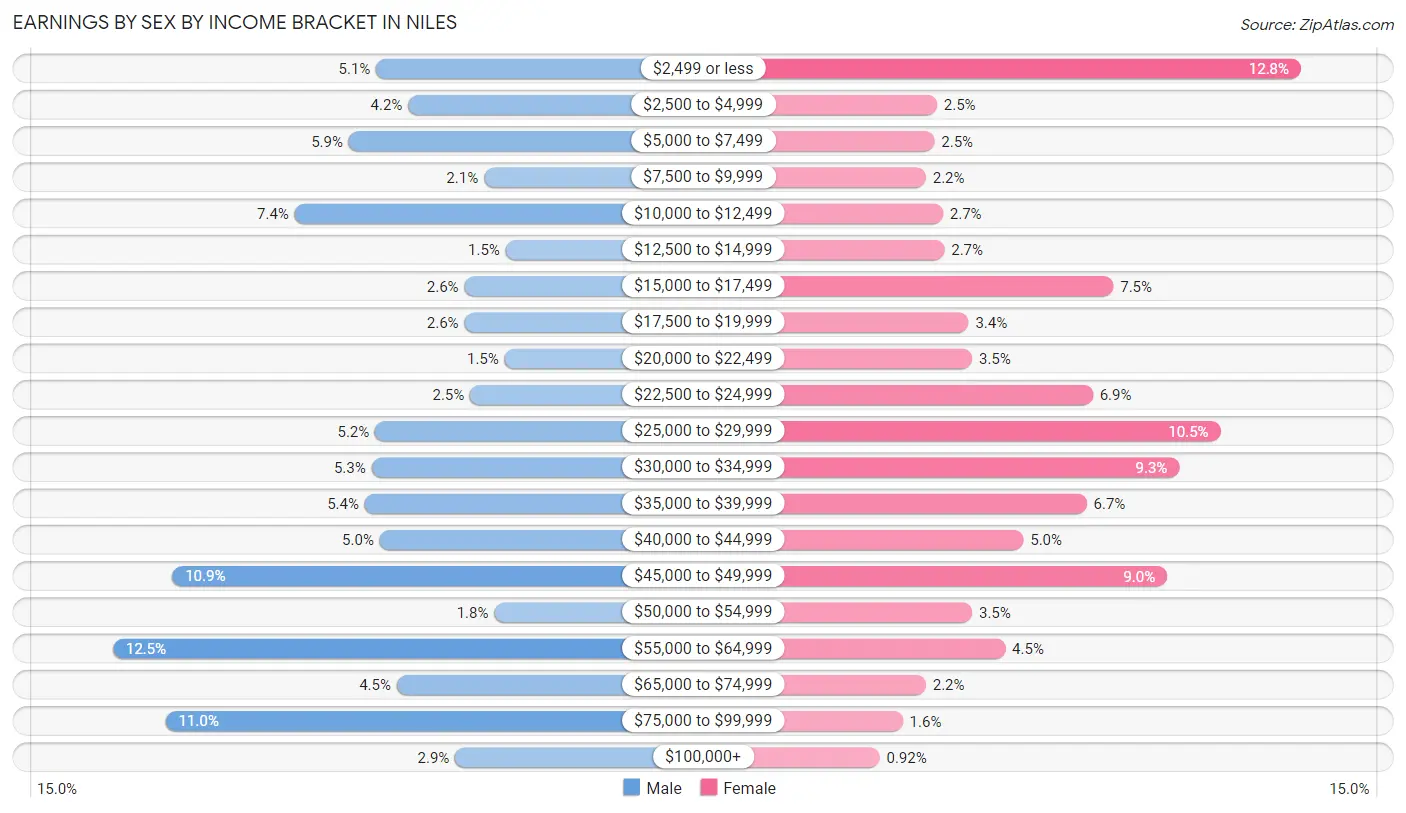
Earnings by Sex by Income Bracket in Niles
The most common earnings brackets in Niles are $55,000 to $64,999 for men (389 | 12.5%) and $2,499 or less for women (373 | 12.8%).
| Income | Male | Female |
| $2,499 or less | 159 (5.1%) | 373 (12.8%) |
| $2,500 to $4,999 | 131 (4.2%) | 74 (2.5%) |
| $5,000 to $7,499 | 183 (5.9%) | 72 (2.5%) |
| $7,500 to $9,999 | 65 (2.1%) | 65 (2.2%) |
| $10,000 to $12,499 | 230 (7.4%) | 79 (2.7%) |
| $12,500 to $14,999 | 46 (1.5%) | 80 (2.7%) |
| $15,000 to $17,499 | 82 (2.6%) | 219 (7.5%) |
| $17,500 to $19,999 | 82 (2.6%) | 100 (3.4%) |
| $20,000 to $22,499 | 47 (1.5%) | 103 (3.5%) |
| $22,500 to $24,999 | 77 (2.5%) | 202 (6.9%) |
| $25,000 to $29,999 | 160 (5.1%) | 307 (10.5%) |
| $30,000 to $34,999 | 163 (5.2%) | 273 (9.3%) |
| $35,000 to $39,999 | 169 (5.4%) | 197 (6.7%) |
| $40,000 to $44,999 | 156 (5.0%) | 145 (5.0%) |
| $45,000 to $49,999 | 337 (10.8%) | 263 (9.0%) |
| $50,000 to $54,999 | 56 (1.8%) | 103 (3.5%) |
| $55,000 to $64,999 | 389 (12.5%) | 130 (4.4%) |
| $65,000 to $74,999 | 141 (4.5%) | 65 (2.2%) |
| $75,000 to $99,999 | 343 (11.0%) | 46 (1.6%) |
| $100,000+ | 90 (2.9%) | 27 (0.9%) |
| Total | 3,106 (100.0%) | 2,923 (100.0%) |
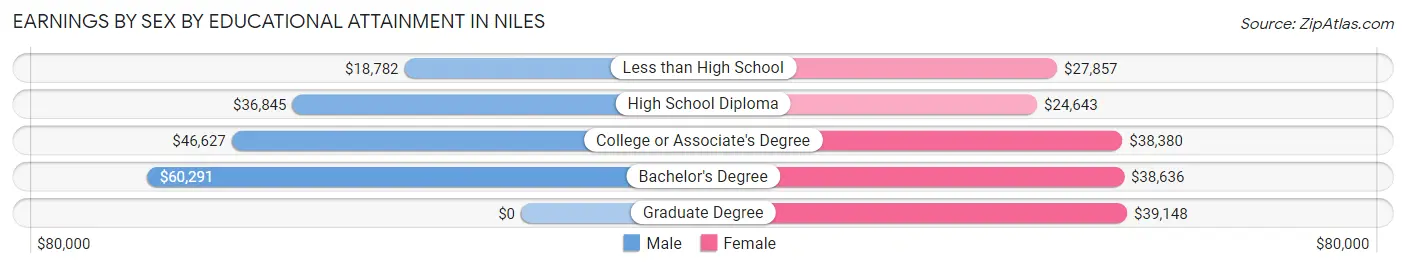
Earnings by Sex by Educational Attainment in Niles
Average earnings in Niles are $44,211 for men and $30,816 for women, a difference of 30.3%. Men with an educational attainment of bachelor's degree enjoy the highest average annual earnings of $60,291, while those with less than high school education earn the least with $18,782. Women with an educational attainment of graduate degree earn the most with the average annual earnings of $39,148, while those with high school diploma education have the smallest earnings of $24,643.
| Educational Attainment | Male Income | Female Income |
| Less than High School | $18,782 | $27,857 |
| High School Diploma | $36,845 | $24,643 |
| College or Associate's Degree | $46,627 | $38,380 |
| Bachelor's Degree | $60,291 | $38,636 |
| Graduate Degree | - | - |
| Total | $44,211 | $30,816 |
Family Income in Niles
Family Income Brackets in Niles
According to the Niles family income data, there are 546 families falling into the $50,000 to $74,999 income range, which is the most common income bracket and makes up 19.5% of all families. Conversely, the $200,000+ income bracket is the least frequent group with only 34 families (1.2%) belonging to this category.
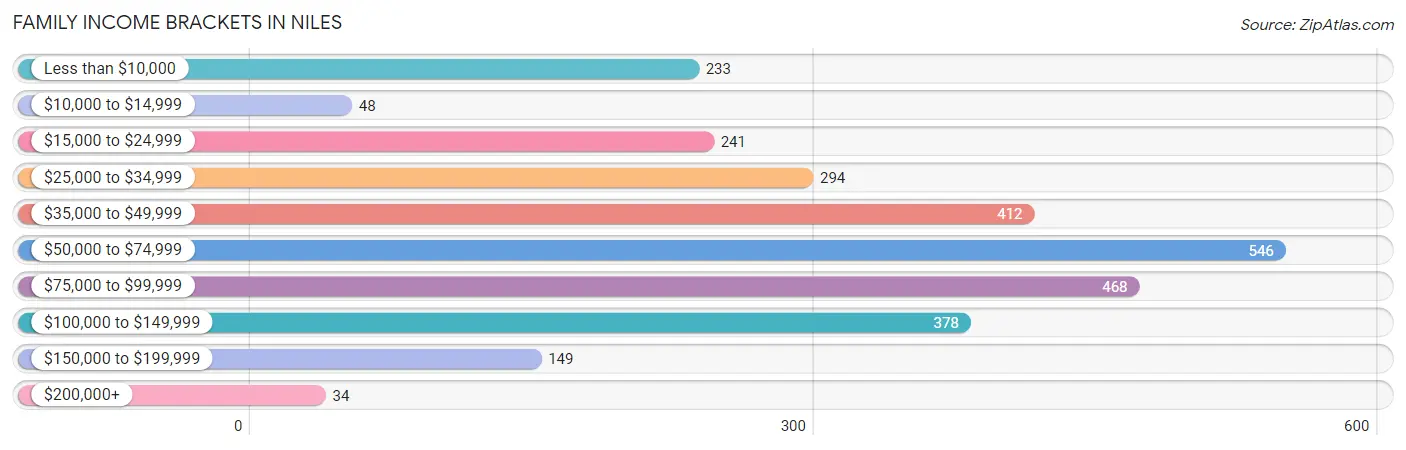
| Income Bracket | # Families | % Families |
| Less than $10,000 | 233 | 8.3% |
| $10,000 to $14,999 | 48 | 1.7% |
| $15,000 to $24,999 | 241 | 8.6% |
| $25,000 to $34,999 | 294 | 10.5% |
| $35,000 to $49,999 | 412 | 14.7% |
| $50,000 to $74,999 | 546 | 19.5% |
| $75,000 to $99,999 | 468 | 16.7% |
| $100,000 to $149,999 | 378 | 13.5% |
| $150,000 to $199,999 | 149 | 5.3% |
| $200,000+ | 34 | 1.2% |
Family Income by Famaliy Size in Niles
6-person families (60 | 2.1%) account for the highest median family income in Niles with $92,857 per family, while 2-person families (1,548 | 55.2%) have the highest median income of $25,675 per family member.
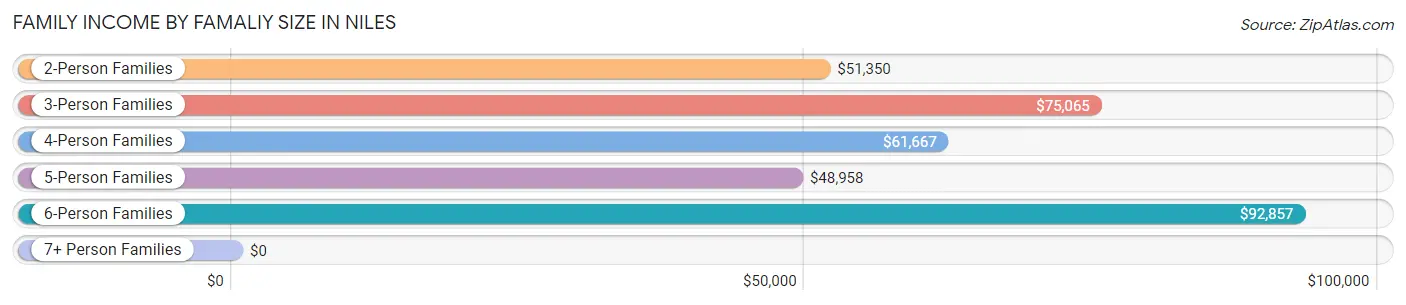
| Income Bracket | # Families | Median Income |
| 2-Person Families | 1,548 (55.2%) | $51,350 |
| 3-Person Families | 485 (17.3%) | $75,065 |
| 4-Person Families | 452 (16.1%) | $61,667 |
| 5-Person Families | 248 (8.8%) | $48,958 |
| 6-Person Families | 60 (2.1%) | $92,857 |
| 7+ Person Families | 9 (0.3%) | $0 |
| Total | 2,802 (100.0%) | $55,618 |
Family Income by Number of Earners in Niles
The median family income in Niles is $55,618, with families comprising 2 earners (866) having the highest median family income of $94,667, while families with 1 earner (1,213) have the lowest median family income of $37,578, accounting for 30.9% and 43.3% of families, respectively.
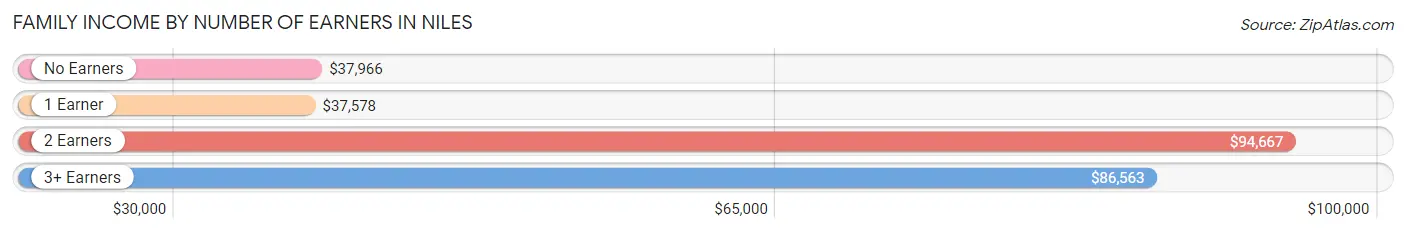
| Number of Earners | # Families | Median Income |
| No Earners | 478 (17.1%) | $37,966 |
| 1 Earner | 1,213 (43.3%) | $37,578 |
| 2 Earners | 866 (30.9%) | $94,667 |
| 3+ Earners | 245 (8.7%) | $86,563 |
| Total | 2,802 (100.0%) | $55,618 |
Household Income in Niles
Household Income Brackets in Niles
With 977 households falling in the category, the $50,000 to $74,999 income range is the most frequent in Niles, accounting for 19.2% of all households. In contrast, only 41 households (0.8%) fall into the $200,000+ income bracket, making it the least populous group.
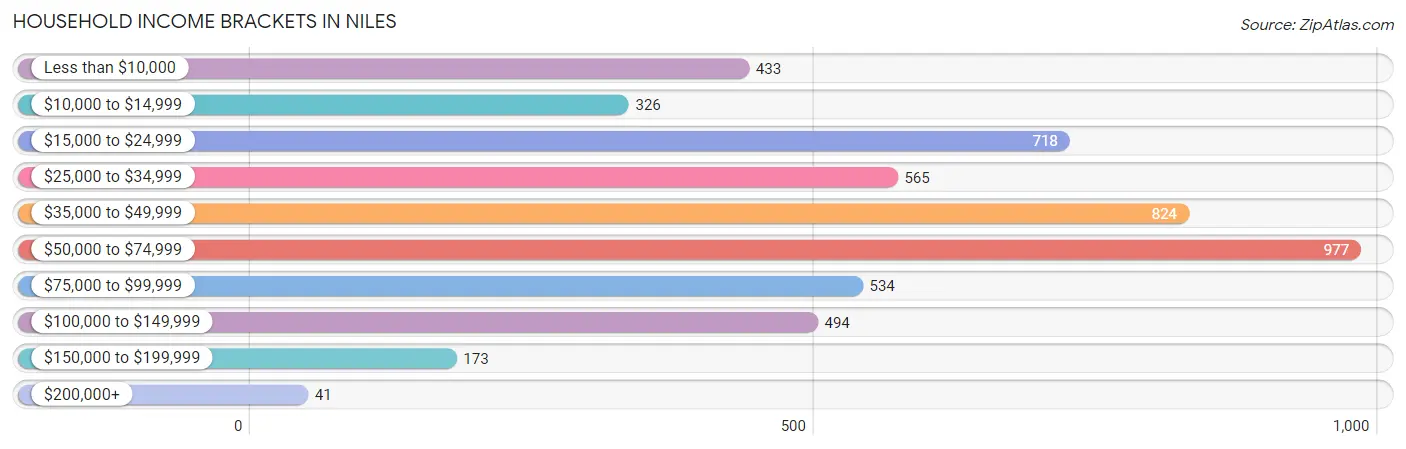
| Income Bracket | # Households | % Households |
| Less than $10,000 | 433 | 8.5% |
| $10,000 to $14,999 | 326 | 6.4% |
| $15,000 to $24,999 | 718 | 14.1% |
| $25,000 to $34,999 | 565 | 11.1% |
| $35,000 to $49,999 | 824 | 16.2% |
| $50,000 to $74,999 | 977 | 19.2% |
| $75,000 to $99,999 | 534 | 10.5% |
| $100,000 to $149,999 | 494 | 9.7% |
| $150,000 to $199,999 | 173 | 3.4% |
| $200,000+ | 41 | 0.8% |
Household Income by Householder Age in Niles
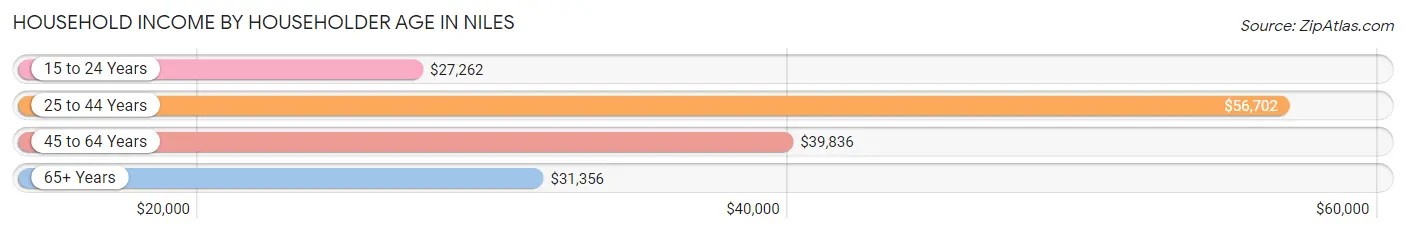
The median household income in Niles is $42,181, with the highest median household income of $56,702 found in the 25 to 44 years age bracket for the primary householder. A total of 1,582 households (31.1%) fall into this category. Meanwhile, the 15 to 24 years age bracket for the primary householder has the lowest median household income of $27,262, with 350 households (6.9%) in this group.
| Income Bracket | # Households | Median Income |
| 15 to 24 Years | 350 (6.9%) | $27,262 |
| 25 to 44 Years | 1,582 (31.1%) | $56,702 |
| 45 to 64 Years | 1,845 (36.2%) | $39,836 |
| 65+ Years | 1,312 (25.8%) | $31,356 |
| Total | 5,089 (100.0%) | $42,181 |
Poverty in Niles
Income Below Poverty by Sex and Age in Niles
With 22.2% poverty level for males and 21.2% for females among the residents of Niles, 15 year old males and under 5 year old females are the most vulnerable to poverty, with 102 males (82.3%) and 174 females (63.7%) in their respective age groups living below the poverty level.
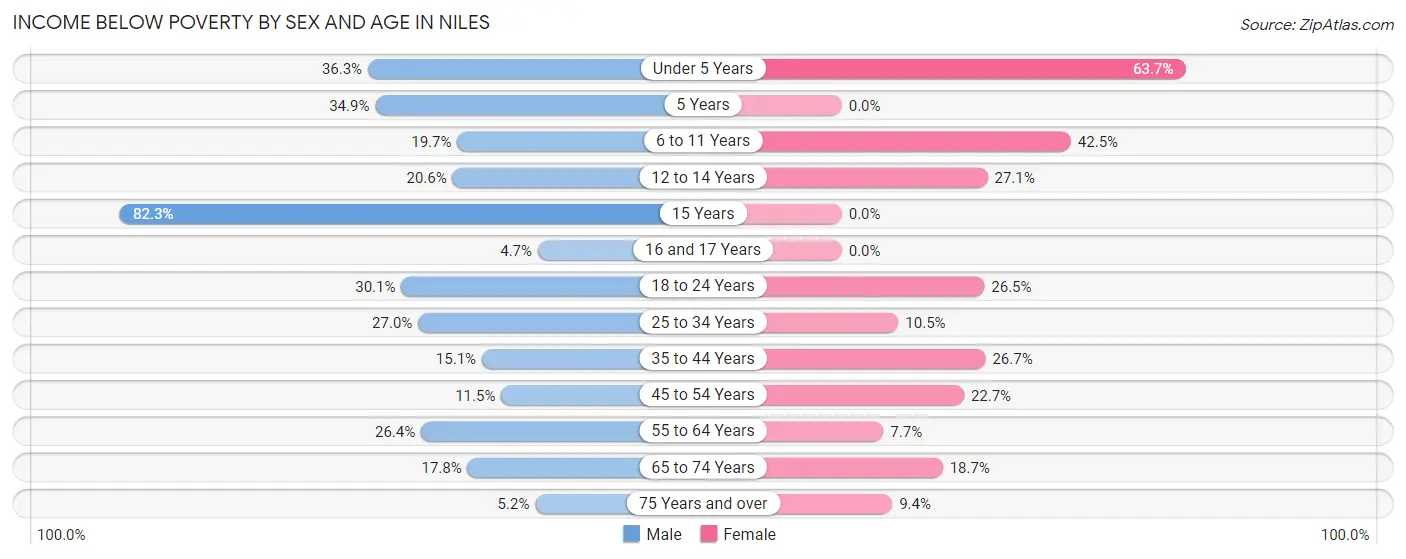
| Age Bracket | Male | Female |
| Under 5 Years | 111 (36.3%) | 174 (63.7%) |
| 5 Years | 22 (34.9%) | 0 (0.0%) |
| 6 to 11 Years | 87 (19.7%) | 168 (42.5%) |
| 12 to 14 Years | 36 (20.6%) | 76 (27.1%) |
| 15 Years | 102 (82.3%) | 0 (0.0%) |
| 16 and 17 Years | 8 (4.7%) | 0 (0.0%) |
| 18 to 24 Years | 188 (30.1%) | 195 (26.5%) |
| 25 to 34 Years | 238 (27.0%) | 72 (10.5%) |
| 35 to 44 Years | 119 (15.1%) | 216 (26.7%) |
| 45 to 54 Years | 71 (11.5%) | 134 (22.7%) |
| 55 to 64 Years | 177 (26.4%) | 56 (7.7%) |
| 65 to 74 Years | 69 (17.8%) | 133 (18.7%) |
| 75 Years and over | 19 (5.2%) | 61 (9.4%) |
| Total | 1,247 (22.2%) | 1,285 (21.2%) |
Income Above Poverty by Sex and Age in Niles
According to the poverty statistics in Niles, males aged 16 and 17 years and females aged 5 years are the age groups that are most secure financially, with 95.3% of males and 100.0% of females in these age groups living above the poverty line.
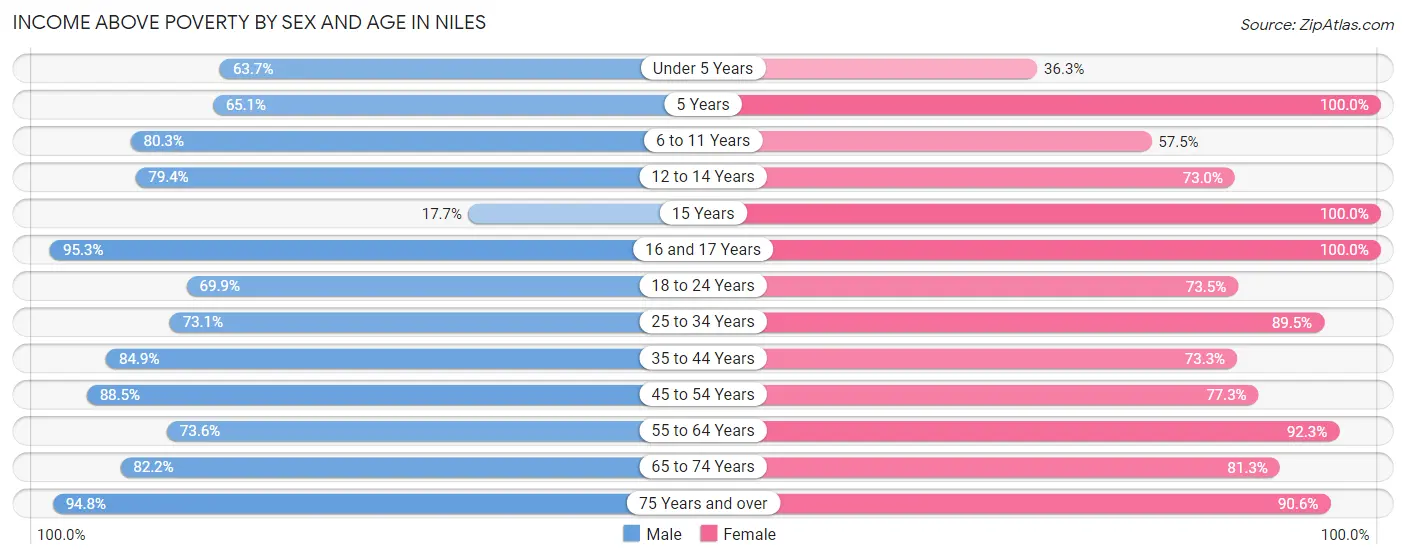
| Age Bracket | Male | Female |
| Under 5 Years | 195 (63.7%) | 99 (36.3%) |
| 5 Years | 41 (65.1%) | 8 (100.0%) |
| 6 to 11 Years | 355 (80.3%) | 227 (57.5%) |
| 12 to 14 Years | 139 (79.4%) | 205 (73.0%) |
| 15 Years | 22 (17.7%) | 68 (100.0%) |
| 16 and 17 Years | 161 (95.3%) | 123 (100.0%) |
| 18 to 24 Years | 437 (69.9%) | 542 (73.5%) |
| 25 to 34 Years | 645 (73.1%) | 613 (89.5%) |
| 35 to 44 Years | 668 (84.9%) | 594 (73.3%) |
| 45 to 54 Years | 545 (88.5%) | 457 (77.3%) |
| 55 to 64 Years | 493 (73.6%) | 669 (92.3%) |
| 65 to 74 Years | 319 (82.2%) | 577 (81.3%) |
| 75 Years and over | 345 (94.8%) | 591 (90.6%) |
| Total | 4,365 (77.8%) | 4,773 (78.8%) |
Income Below Poverty Among Married-Couple Families in Niles
The poverty statistics for married-couple families in Niles show that 10.5% or 177 of the total 1,684 families live below the poverty line. Families with 1 or 2 children have the highest poverty rate of 26.5%, comprising of 151 families. On the other hand, families with 3 or 4 children have the lowest poverty rate of 0.0%, which includes 0 families.
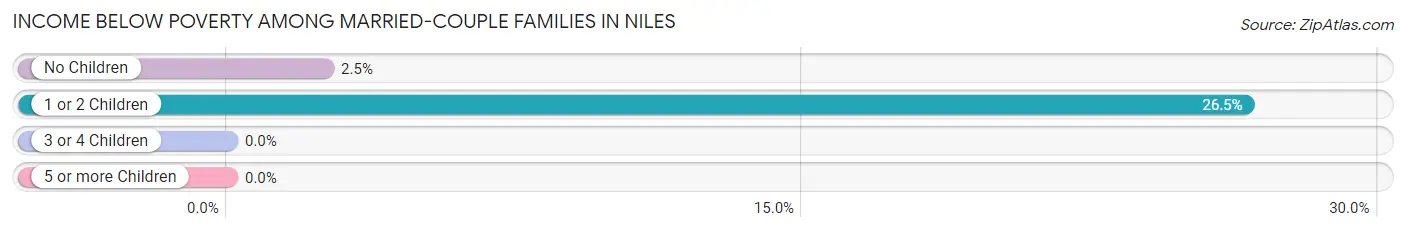
| Children | Above Poverty | Below Poverty |
| No Children | 1,011 (97.5%) | 26 (2.5%) |
| 1 or 2 Children | 418 (73.5%) | 151 (26.5%) |
| 3 or 4 Children | 69 (100.0%) | 0 (0.0%) |
| 5 or more Children | 9 (100.0%) | 0 (0.0%) |
| Total | 1,507 (89.5%) | 177 (10.5%) |
Income Below Poverty Among Single-Parent Households in Niles
According to the poverty data in Niles, 7.6% or 20 single-father households and 33.1% or 283 single-mother households are living below the poverty line. Among single-father households, those with 3 or 4 children have the highest poverty rate, with 8 households (25.8%) experiencing poverty. Likewise, among single-mother households, those with 5 or more children have the highest poverty rate, with 9 households (100.0%) falling below the poverty line.
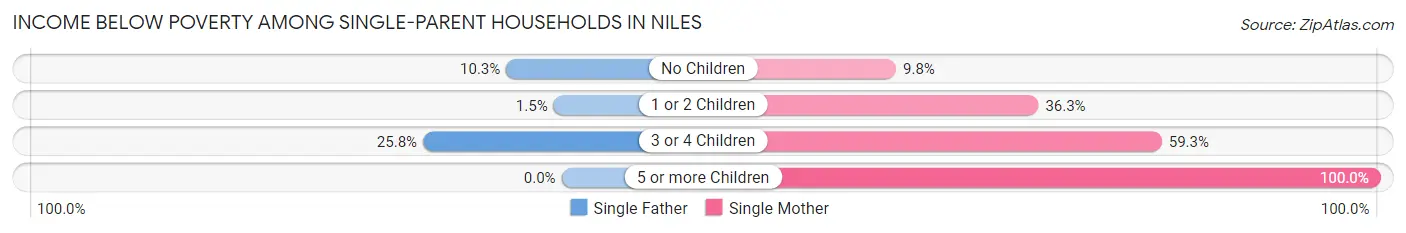
| Children | Single Father | Single Mother |
| No Children | 10 (10.3%) | 26 (9.8%) |
| 1 or 2 Children | 2 (1.5%) | 152 (36.3%) |
| 3 or 4 Children | 8 (25.8%) | 96 (59.3%) |
| 5 or more Children | 0 (0.0%) | 9 (100.0%) |
| Total | 20 (7.6%) | 283 (33.1%) |
Income Below Poverty Among Married-Couple vs Single-Parent Households in Niles
The poverty data for Niles shows that 177 of the married-couple family households (10.5%) and 303 of the single-parent households (27.1%) are living below the poverty level. Within the married-couple family households, those with 1 or 2 children have the highest poverty rate, with 151 households (26.5%) falling below the poverty line. Among the single-parent households, those with 5 or more children have the highest poverty rate, with 9 household (100.0%) living below poverty.
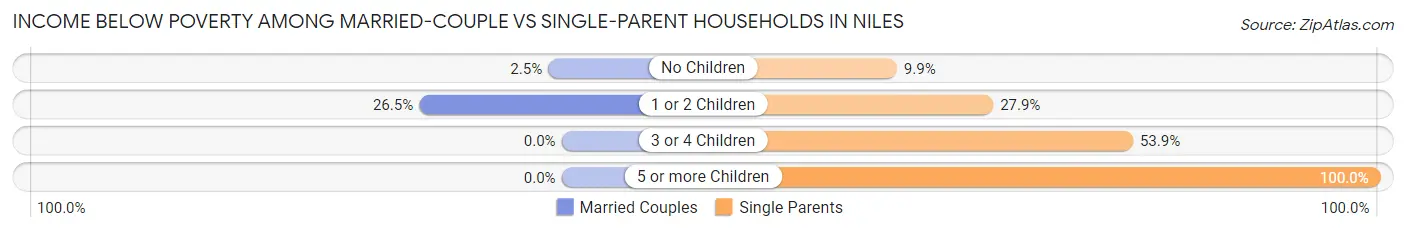
| Children | Married-Couple Families | Single-Parent Households |
| No Children | 26 (2.5%) | 36 (9.9%) |
| 1 or 2 Children | 151 (26.5%) | 154 (27.9%) |
| 3 or 4 Children | 0 (0.0%) | 104 (53.9%) |
| 5 or more Children | 0 (0.0%) | 9 (100.0%) |
| Total | 177 (10.5%) | 303 (27.1%) |
Race in Niles
The most populous races in Niles are White / Caucasian (9,284 | 78.2%), Black / African American (1,597 | 13.5%), and Two or more Races (649 | 5.5%).
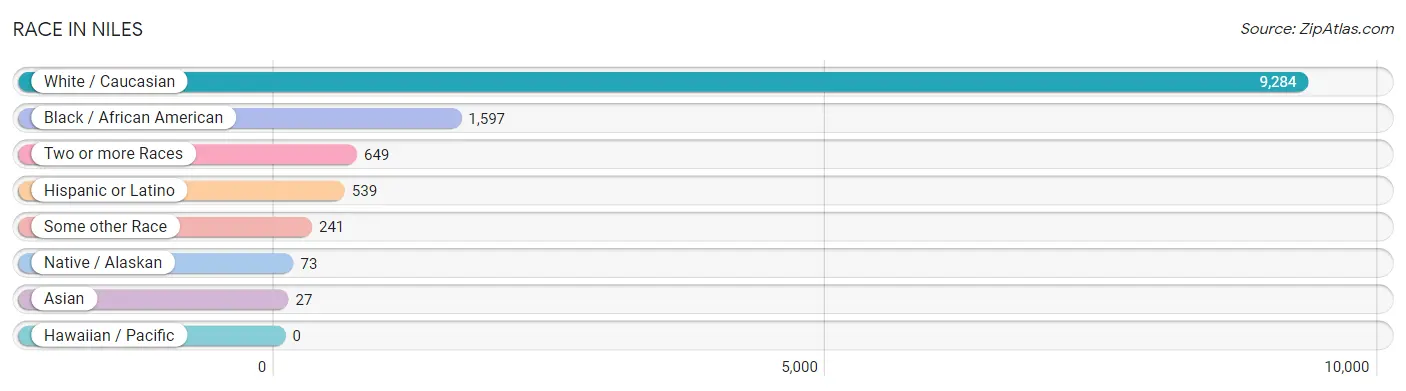
| Race | # Population | % Population |
| Asian | 27 | 0.2% |
| Black / African American | 1,597 | 13.5% |
| Hawaiian / Pacific | 0 | 0.0% |
| Hispanic or Latino | 539 | 4.5% |
| Native / Alaskan | 73 | 0.6% |
| White / Caucasian | 9,284 | 78.2% |
| Two or more Races | 649 | 5.5% |
| Some other Race | 241 | 2.0% |
| Total | 11,871 | 100.0% |
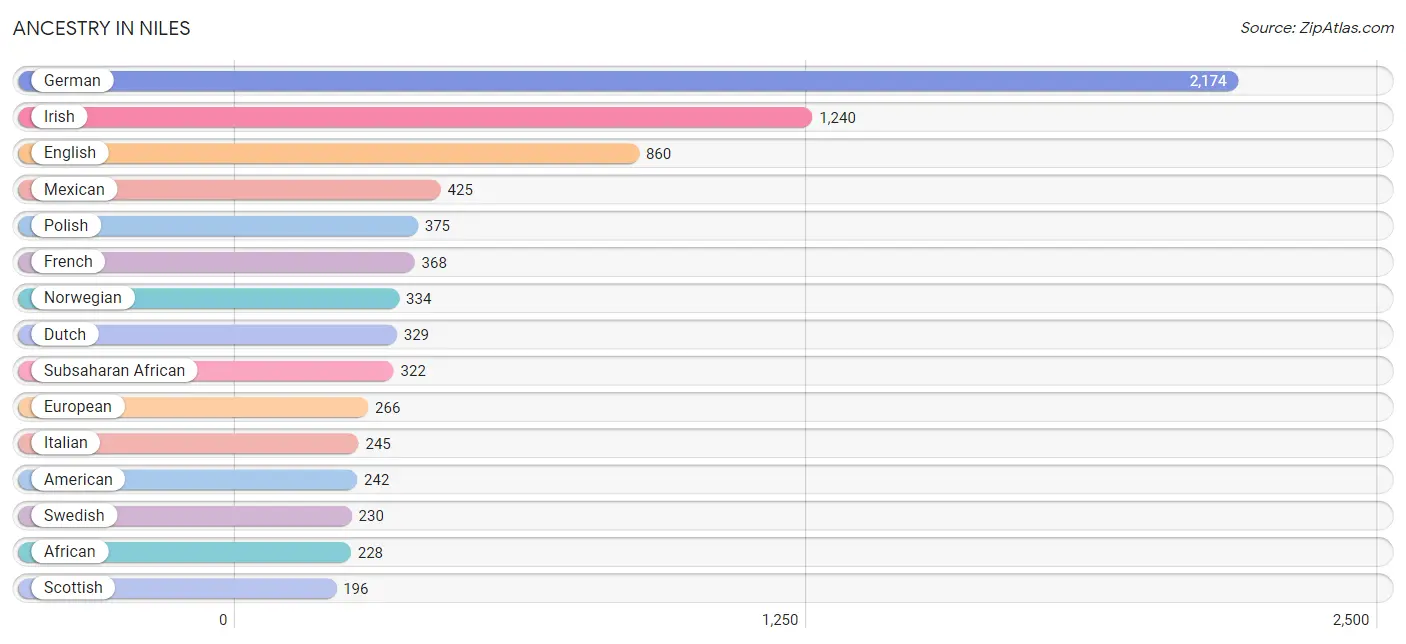
Ancestry in Niles
The most populous ancestries reported in Niles are German (2,174 | 18.3%), Irish (1,240 | 10.4%), English (860 | 7.2%), Mexican (425 | 3.6%), and Polish (375 | 3.2%), together accounting for 42.7% of all Niles residents.
| Ancestry | # Population | % Population |
| African | 228 | 1.9% |
| American | 242 | 2.0% |
| Arab | 7 | 0.1% |
| Argentinean | 16 | 0.1% |
| Austrian | 40 | 0.3% |
| Belgian | 10 | 0.1% |
| British | 24 | 0.2% |
| Burmese | 17 | 0.1% |
| Canadian | 26 | 0.2% |
| Cherokee | 4 | 0.0% |
| Chippewa | 61 | 0.5% |
| Cuban | 18 | 0.2% |
| Danish | 76 | 0.6% |
| Dutch | 329 | 2.8% |
| Eastern European | 75 | 0.6% |
| English | 860 | 7.2% |
| European | 266 | 2.2% |
| Finnish | 68 | 0.6% |
| French | 368 | 3.1% |
| French American Indian | 5 | 0.0% |
| French Canadian | 44 | 0.4% |
| German | 2,174 | 18.3% |
| Ghanaian | 80 | 0.7% |
| Hungarian | 58 | 0.5% |
| Iranian | 36 | 0.3% |
| Irish | 1,240 | 10.4% |
| Iroquois | 5 | 0.0% |
| Italian | 245 | 2.1% |
| Jamaican | 12 | 0.1% |
| Laotian | 28 | 0.2% |
| Lebanese | 7 | 0.1% |
| Mexican | 425 | 3.6% |
| Norwegian | 334 | 2.8% |
| Ottawa | 18 | 0.2% |
| Pakistani | 23 | 0.2% |
| Peruvian | 17 | 0.1% |
| Polish | 375 | 3.2% |
| Portuguese | 16 | 0.1% |
| Potawatomi | 35 | 0.3% |
| Puerto Rican | 29 | 0.2% |
| Russian | 10 | 0.1% |
| Scandinavian | 25 | 0.2% |
| Scotch-Irish | 100 | 0.8% |
| Scottish | 196 | 1.7% |
| Serbian | 21 | 0.2% |
| Slovak | 7 | 0.1% |
| South American | 48 | 0.4% |
| Spaniard | 18 | 0.2% |
| Subsaharan African | 322 | 2.7% |
| Swedish | 230 | 1.9% |
| Swiss | 17 | 0.1% |
| Thai | 38 | 0.3% |
| Trinidadian and Tobagonian | 15 | 0.1% |
| Ukrainian | 21 | 0.2% |
| Venezuelan | 15 | 0.1% |
| Welsh | 62 | 0.5% | View All 56 Rows |
Immigrants in Niles
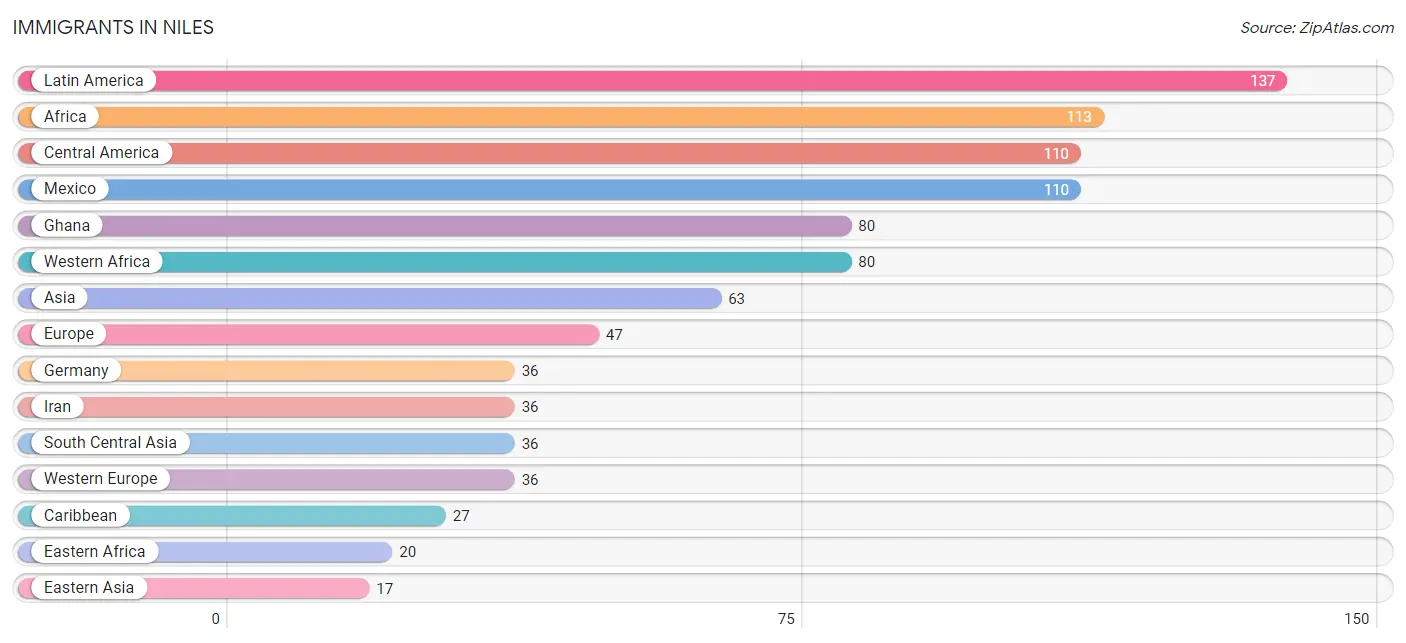
The most numerous immigrant groups reported in Niles came from Latin America (137 | 1.1%), Africa (113 | 0.9%), Central America (110 | 0.9%), Mexico (110 | 0.9%), and Ghana (80 | 0.7%), together accounting for 4.6% of all Niles residents.
| Immigration Origin | # Population | % Population |
| Africa | 113 | 0.9% |
| Asia | 63 | 0.5% |
| Caribbean | 27 | 0.2% |
| Central America | 110 | 0.9% |
| Eastern Africa | 20 | 0.2% |
| Eastern Asia | 17 | 0.1% |
| Eastern Europe | 11 | 0.1% |
| Europe | 47 | 0.4% |
| Germany | 36 | 0.3% |
| Ghana | 80 | 0.7% |
| Iran | 36 | 0.3% |
| Jamaica | 12 | 0.1% |
| Korea | 17 | 0.1% |
| Latin America | 137 | 1.1% |
| Mexico | 110 | 0.9% |
| Serbia | 11 | 0.1% |
| South Africa | 13 | 0.1% |
| South Central Asia | 36 | 0.3% |
| South Eastern Asia | 10 | 0.1% |
| Thailand | 10 | 0.1% |
| Trinidad and Tobago | 15 | 0.1% |
| Western Africa | 80 | 0.7% |
| Western Europe | 36 | 0.3% | View All 23 Rows |
Sex and Age in Niles
Sex and Age in Niles
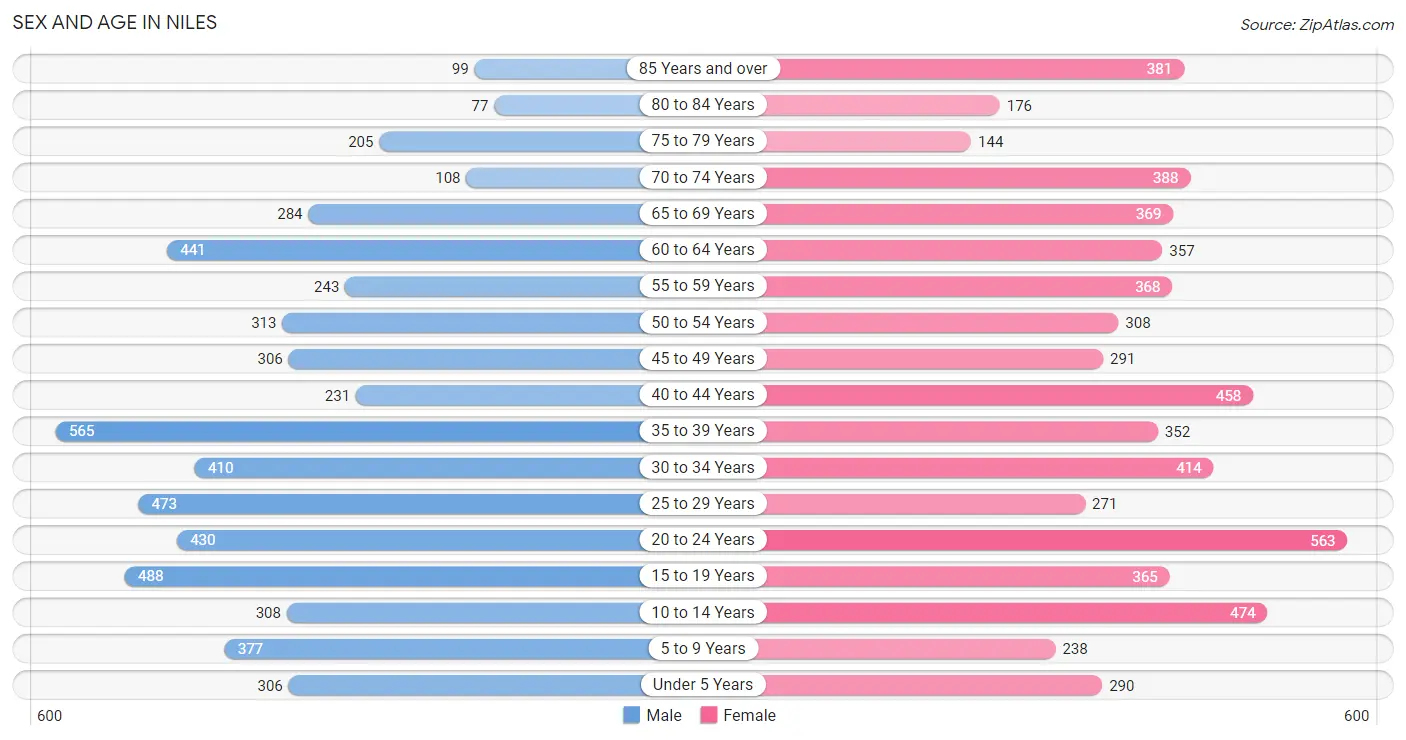
The most populous age groups in Niles are 35 to 39 Years (565 | 10.0%) for men and 20 to 24 Years (563 | 9.1%) for women.
| Age Bracket | Male | Female |
| Under 5 Years | 306 (5.4%) | 290 (4.7%) |
| 5 to 9 Years | 377 (6.7%) | 238 (3.8%) |
| 10 to 14 Years | 308 (5.4%) | 474 (7.6%) |
| 15 to 19 Years | 488 (8.6%) | 365 (5.9%) |
| 20 to 24 Years | 430 (7.6%) | 563 (9.1%) |
| 25 to 29 Years | 473 (8.4%) | 271 (4.4%) |
| 30 to 34 Years | 410 (7.2%) | 414 (6.7%) |
| 35 to 39 Years | 565 (10.0%) | 352 (5.7%) |
| 40 to 44 Years | 231 (4.1%) | 458 (7.4%) |
| 45 to 49 Years | 306 (5.4%) | 291 (4.7%) |
| 50 to 54 Years | 313 (5.5%) | 308 (5.0%) |
| 55 to 59 Years | 243 (4.3%) | 368 (5.9%) |
| 60 to 64 Years | 441 (7.8%) | 357 (5.8%) |
| 65 to 69 Years | 284 (5.0%) | 369 (5.9%) |
| 70 to 74 Years | 108 (1.9%) | 388 (6.2%) |
| 75 to 79 Years | 205 (3.6%) | 144 (2.3%) |
| 80 to 84 Years | 77 (1.4%) | 176 (2.8%) |
| 85 Years and over | 99 (1.8%) | 381 (6.1%) |
| Total | 5,664 (100.0%) | 6,207 (100.0%) |
Families and Households in Niles
Median Family Size in Niles
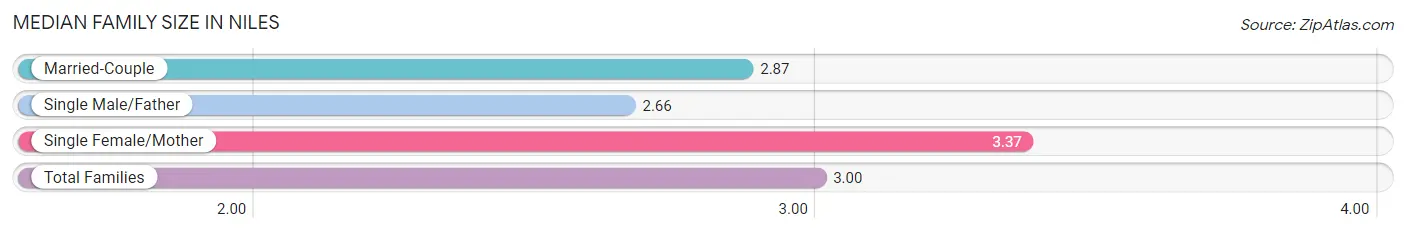
The median family size in Niles is 3.00 persons per family, with single female/mother families (856 | 30.5%) accounting for the largest median family size of 3.37 persons per family. On the other hand, single male/father families (262 | 9.3%) represent the smallest median family size with 2.66 persons per family.
| Family Type | # Families | Family Size |
| Married-Couple | 1,684 (60.1%) | 2.87 |
| Single Male/Father | 262 (9.3%) | 2.66 |
| Single Female/Mother | 856 (30.5%) | 3.37 |
| Total Families | 2,802 (100.0%) | 3.00 |
Median Household Size in Niles
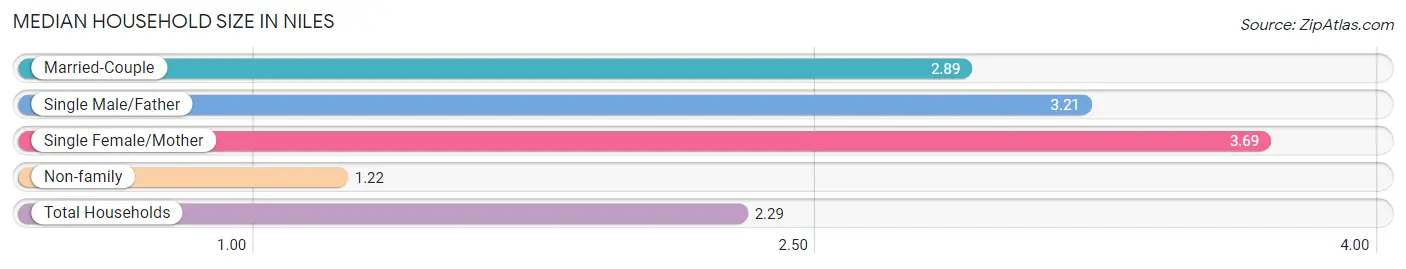
The median household size in Niles is 2.29 persons per household, with single female/mother households (856 | 16.8%) accounting for the largest median household size of 3.69 persons per household. non-family households (2,287 | 44.9%) represent the smallest median household size with 1.22 persons per household.
| Household Type | # Households | Household Size |
| Married-Couple | 1,684 (33.1%) | 2.89 |
| Single Male/Father | 262 (5.1%) | 3.21 |
| Single Female/Mother | 856 (16.8%) | 3.69 |
| Non-family | 2,287 (44.9%) | 1.22 |
| Total Households | 5,089 (100.0%) | 2.29 |
Household Size by Marriage Status in Niles
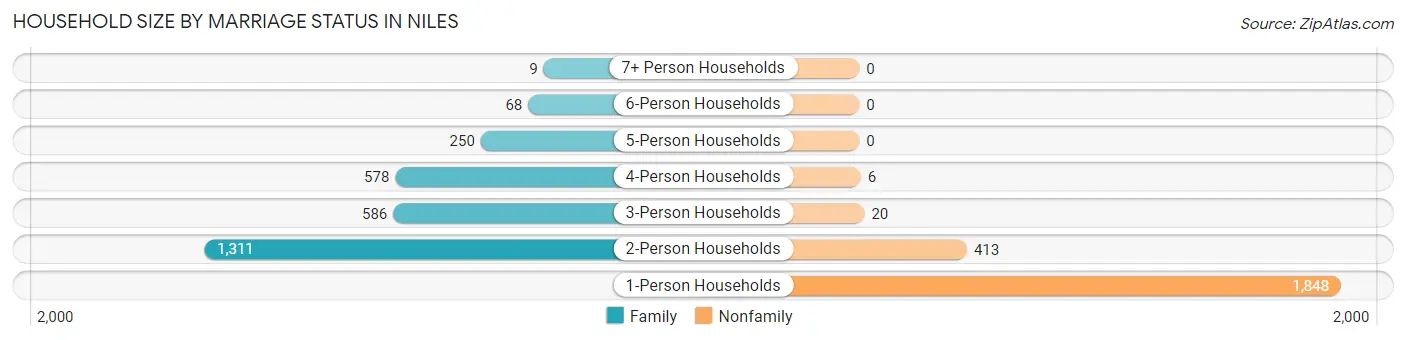
Out of a total of 5,089 households in Niles, 2,802 (55.1%) are family households, while 2,287 (44.9%) are nonfamily households. The most numerous type of family households are 2-person households, comprising 1,311, and the most common type of nonfamily households are 1-person households, comprising 1,848.
| Household Size | Family Households | Nonfamily Households |
| 1-Person Households | - | 1,848 (36.3%) |
| 2-Person Households | 1,311 (25.8%) | 413 (8.1%) |
| 3-Person Households | 586 (11.5%) | 20 (0.4%) |
| 4-Person Households | 578 (11.4%) | 6 (0.1%) |
| 5-Person Households | 250 (4.9%) | 0 (0.0%) |
| 6-Person Households | 68 (1.3%) | 0 (0.0%) |
| 7+ Person Households | 9 (0.2%) | 0 (0.0%) |
| Total | 2,802 (55.1%) | 2,287 (44.9%) |
Female Fertility in Niles
Fertility by Age in Niles
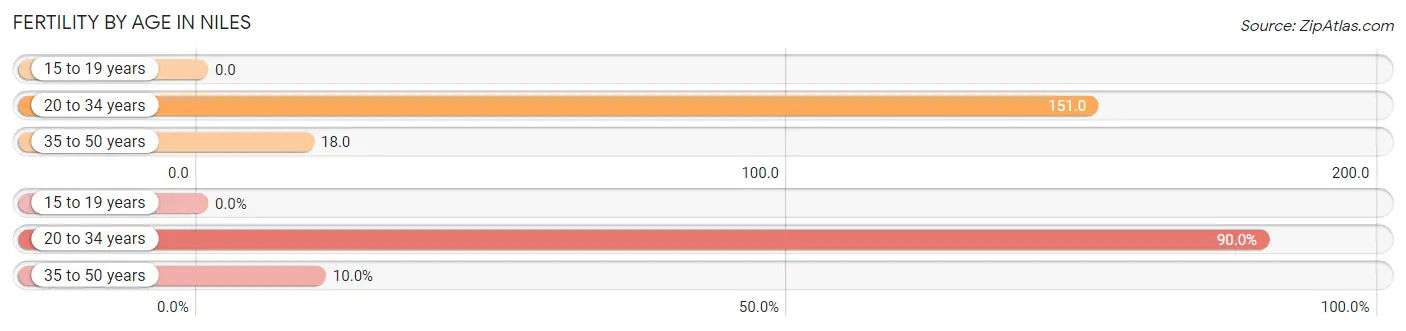
Average fertility rate in Niles is 76.0 births per 1,000 women. Women in the age bracket of 20 to 34 years have the highest fertility rate with 151.0 births per 1,000 women. Women in the age bracket of 20 to 34 years acount for 90.0% of all women with births.
| Age Bracket | Women with Births | Births / 1,000 Women |
| 15 to 19 years | 0 (0.0%) | 0.0 |
| 20 to 34 years | 189 (90.0%) | 151.0 |
| 35 to 50 years | 21 (10.0%) | 18.0 |
| Total | 210 (100.0%) | 76.0 |
Fertility by Age by Marriage Status in Niles
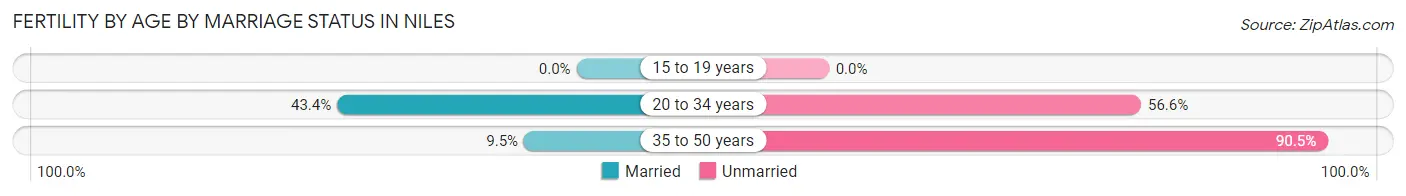
40.0% of women with births (210) in Niles are married. The highest percentage of unmarried women with births falls into 35 to 50 years age bracket with 90.5% of them unmarried at the time of birth, while the lowest percentage of unmarried women with births belong to 20 to 34 years age bracket with 56.6% of them unmarried.
| Age Bracket | Married | Unmarried |
| 15 to 19 years | 0 (0.0%) | 0 (0.0%) |
| 20 to 34 years | 82 (43.4%) | 107 (56.6%) |
| 35 to 50 years | 2 (9.5%) | 19 (90.5%) |
| Total | 84 (40.0%) | 126 (60.0%) |
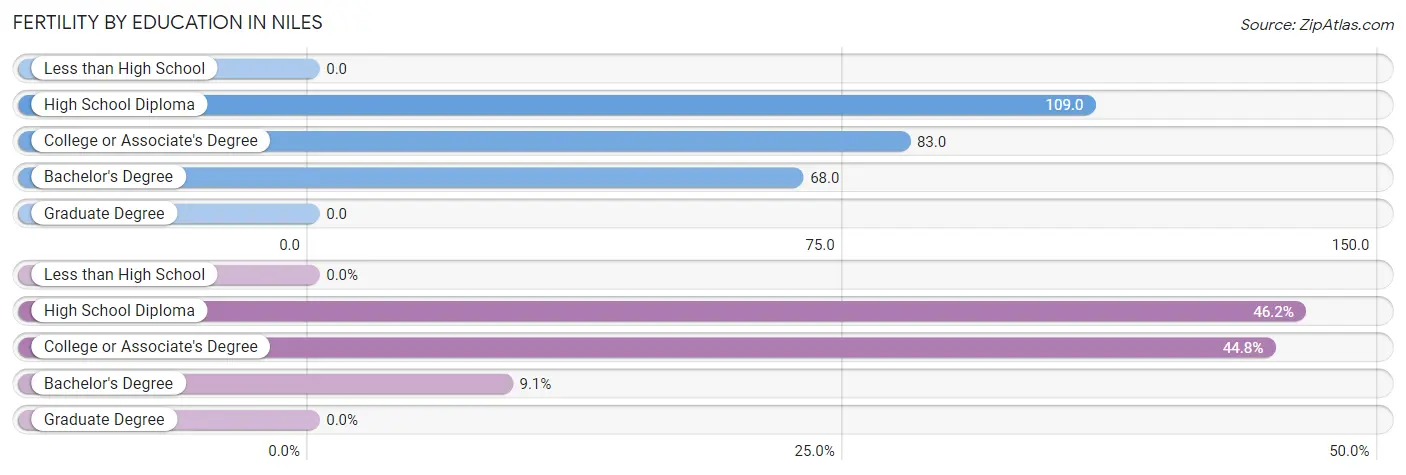
Fertility by Education in Niles
| Educational Attainment | Women with Births | Births / 1,000 Women |
| Less than High School | 0 (0.0%) | 0.0 |
| High School Diploma | 97 (46.2%) | 109.0 |
| College or Associate's Degree | 94 (44.8%) | 83.0 |
| Bachelor's Degree | 19 (9.0%) | 68.0 |
| Graduate Degree | 0 (0.0%) | 0.0 |
| Total | 210 (100.0%) | 76.0 |
Fertility by Education by Marriage Status in Niles
60.0% of women with births in Niles are unmarried. Women with the educational attainment of high school diploma are most likely to be married with 66.0% of them married at childbirth, while women with the educational attainment of bachelor's degree are least likely to be married with 100.0% of them unmarried at childbirth.
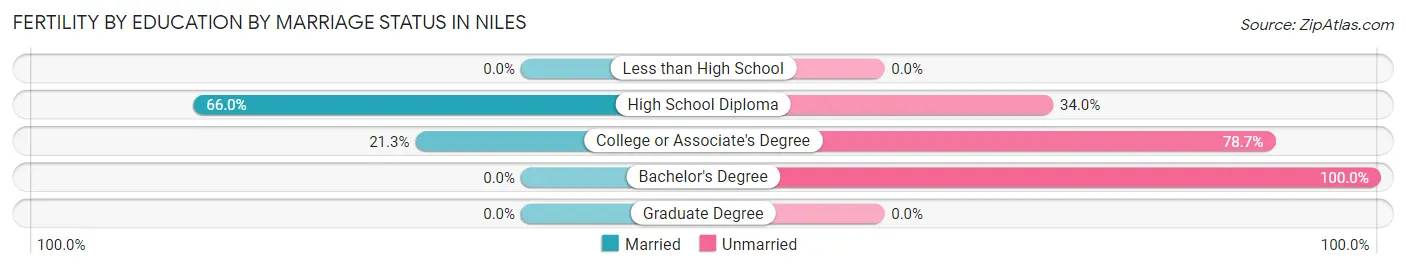
| Educational Attainment | Married | Unmarried |
| Less than High School | 0 (0.0%) | 0 (0.0%) |
| High School Diploma | 64 (66.0%) | 33 (34.0%) |
| College or Associate's Degree | 20 (21.3%) | 74 (78.7%) |
| Bachelor's Degree | 0 (0.0%) | 19 (100.0%) |
| Graduate Degree | 0 (0.0%) | 0 (0.0%) |
| Total | 84 (40.0%) | 126 (60.0%) |
Employment Characteristics in Niles
Employment by Class of Employer in Niles
Among the 5,318 employed individuals in Niles, private company employees (4,007 | 75.3%), not-for-profit organizations (613 | 11.5%), and local government employees (270 | 5.1%) make up the most common classes of employment.
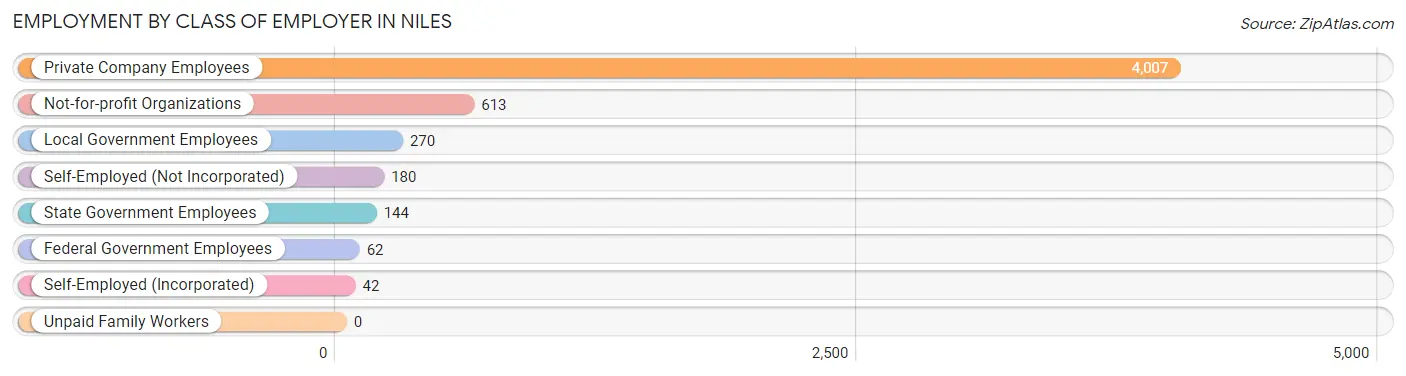
| Employer Class | # Employees | % Employees |
| Private Company Employees | 4,007 | 75.3% |
| Self-Employed (Incorporated) | 42 | 0.8% |
| Self-Employed (Not Incorporated) | 180 | 3.4% |
| Not-for-profit Organizations | 613 | 11.5% |
| Local Government Employees | 270 | 5.1% |
| State Government Employees | 144 | 2.7% |
| Federal Government Employees | 62 | 1.2% |
| Unpaid Family Workers | 0 | 0.0% |
| Total | 5,318 | 100.0% |
Employment Status by Age in Niles
According to the labor force statistics for Niles, out of the total population over 16 years of age (9,686), 63.4% or 6,141 individuals are in the labor force, with 12.1% or 743 of them unemployed. The age group with the highest labor force participation rate is 20 to 24 years, with 97.0% or 963 individuals in the labor force. Within the labor force, the 65 to 74 years age range has the highest percentage of unemployed individuals, with 34.8% or 126 of them being unemployed.
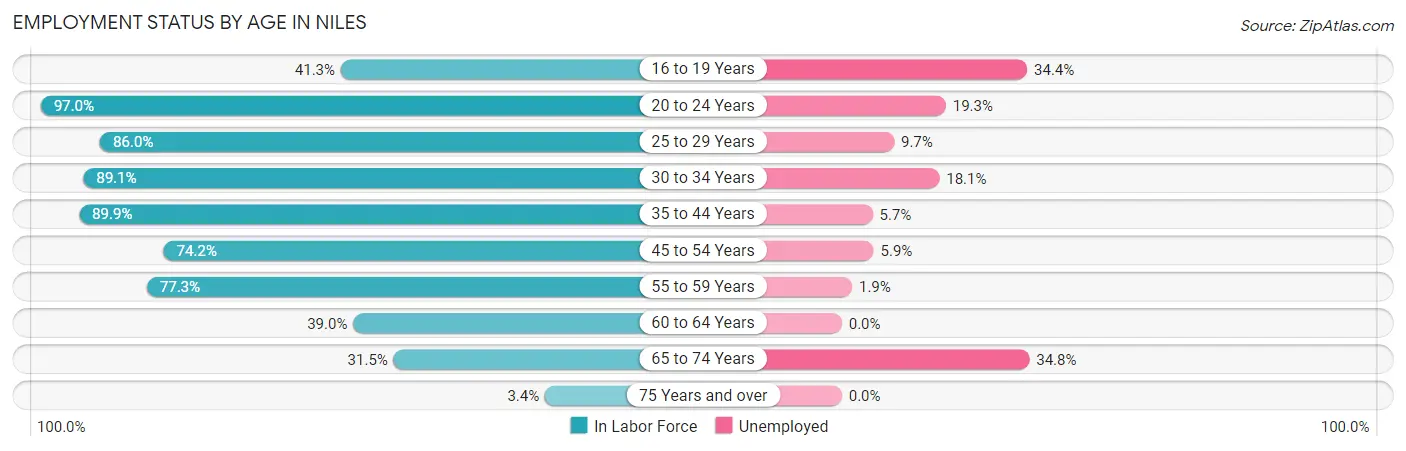
| Age Bracket | In Labor Force | Unemployed |
| 16 to 19 Years | 273 (41.3%) | 94 (34.4%) |
| 20 to 24 Years | 963 (97.0%) | 186 (19.3%) |
| 25 to 29 Years | 640 (86.0%) | 62 (9.7%) |
| 30 to 34 Years | 734 (89.1%) | 133 (18.1%) |
| 35 to 44 Years | 1,444 (89.9%) | 82 (5.7%) |
| 45 to 54 Years | 904 (74.2%) | 53 (5.9%) |
| 55 to 59 Years | 472 (77.3%) | 9 (1.9%) |
| 60 to 64 Years | 311 (39.0%) | 0 (0.0%) |
| 65 to 74 Years | 362 (31.5%) | 126 (34.8%) |
| 75 Years and over | 37 (3.4%) | 0 (0.0%) |
| Total | 6,141 (63.4%) | 743 (12.1%) |
Employment Status by Educational Attainment in Niles
According to labor force statistics for Niles, 77.7% of individuals (4,507) out of the total population between 25 and 64 years of age (5,801) are in the labor force, with 7.4% or 334 of them being unemployed. The group with the highest labor force participation rate are those with the educational attainment of bachelor's degree or higher, with 86.4% or 801 individuals in the labor force. Within the labor force, individuals with high school diploma education have the highest percentage of unemployment, with 11.6% or 168 of them being unemployed.
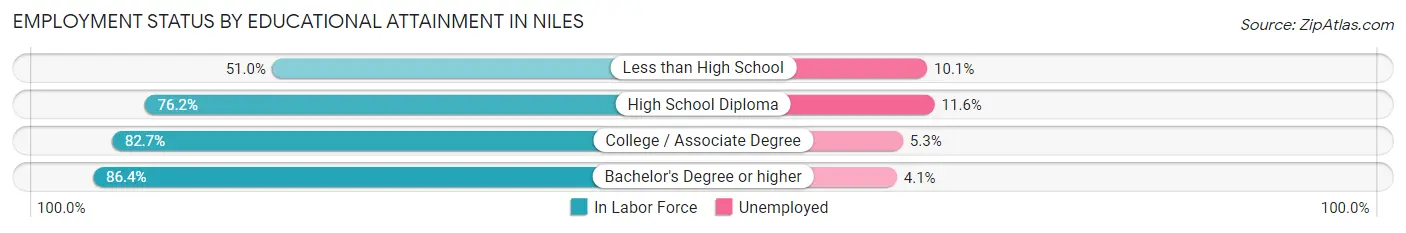
| Educational Attainment | In Labor Force | Unemployed |
| Less than High School | 327 (51.0%) | 65 (10.1%) |
| High School Diploma | 1,449 (76.2%) | 221 (11.6%) |
| College / Associate Degree | 1,928 (82.7%) | 124 (5.3%) |
| Bachelor's Degree or higher | 801 (86.4%) | 38 (4.1%) |
| Total | 4,507 (77.7%) | 429 (7.4%) |
Employment Occupations by Sex in Niles
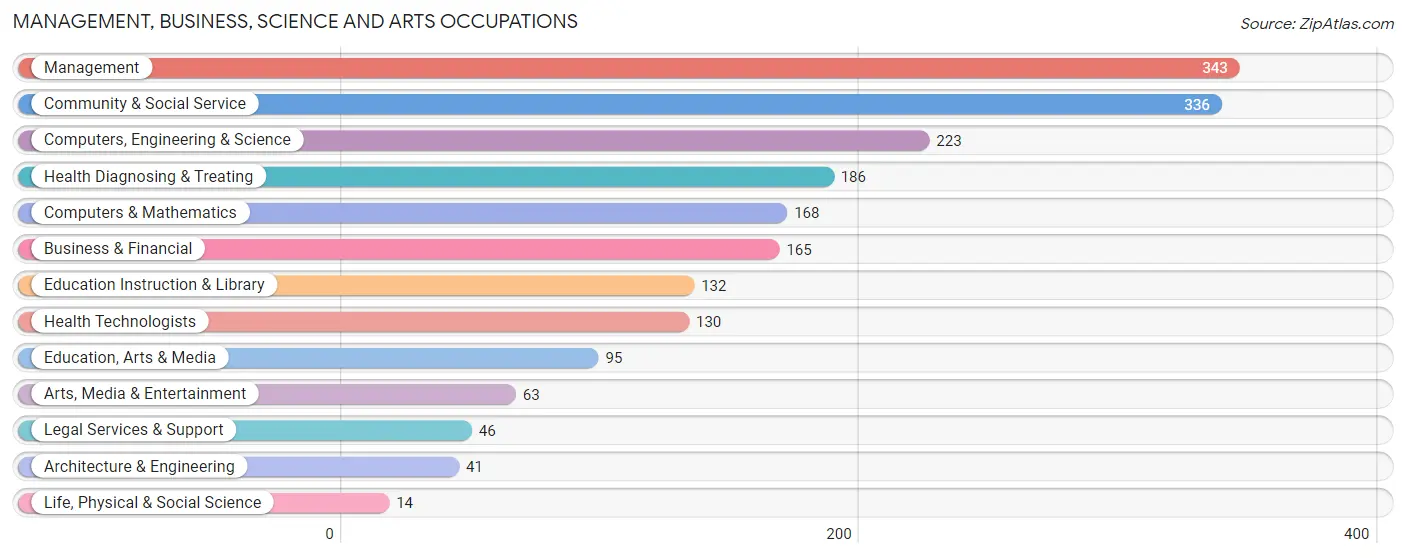
Management, Business, Science and Arts Occupations
The most common Management, Business, Science and Arts occupations in Niles are Management (343 | 6.4%), Community & Social Service (336 | 6.3%), Computers, Engineering & Science (223 | 4.2%), Health Diagnosing & Treating (186 | 3.5%), and Computers & Mathematics (168 | 3.1%).
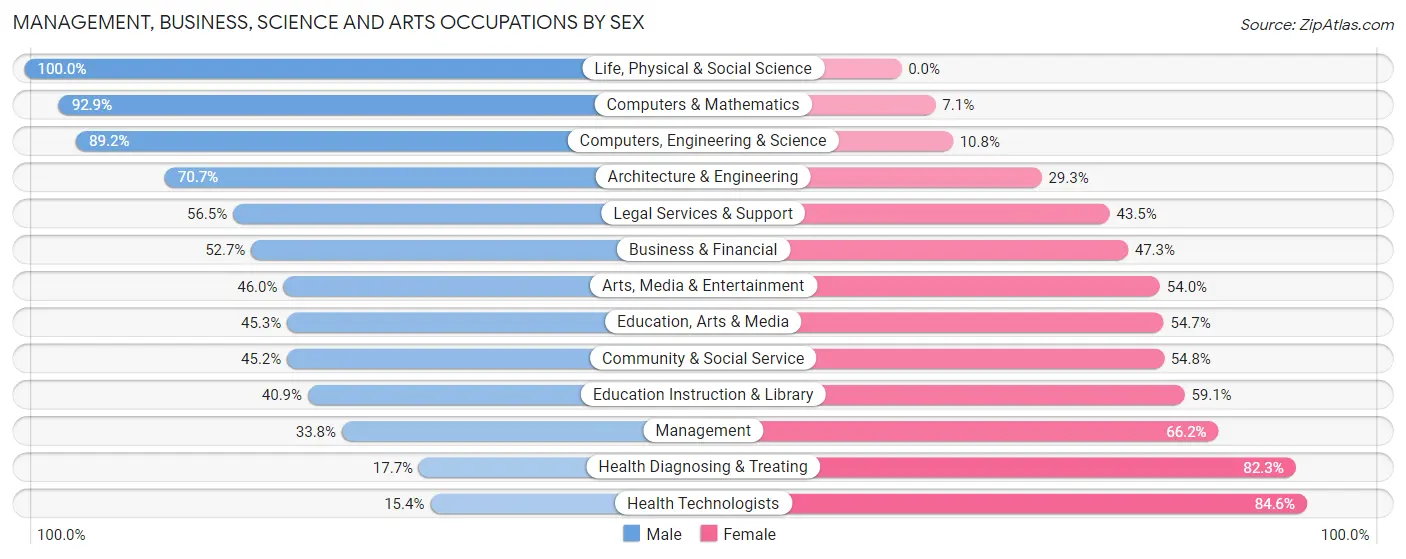
Management, Business, Science and Arts Occupations by Sex
Within the Management, Business, Science and Arts occupations in Niles, the most male-oriented occupations are Life, Physical & Social Science (100.0%), Computers & Mathematics (92.9%), and Computers, Engineering & Science (89.2%), while the most female-oriented occupations are Health Technologists (84.6%), Health Diagnosing & Treating (82.3%), and Management (66.2%).
| Occupation | Male | Female |
| Management | 116 (33.8%) | 227 (66.2%) |
| Business & Financial | 87 (52.7%) | 78 (47.3%) |
| Computers, Engineering & Science | 199 (89.2%) | 24 (10.8%) |
| Computers & Mathematics | 156 (92.9%) | 12 (7.1%) |
| Architecture & Engineering | 29 (70.7%) | 12 (29.3%) |
| Life, Physical & Social Science | 14 (100.0%) | 0 (0.0%) |
| Community & Social Service | 152 (45.2%) | 184 (54.8%) |
| Education, Arts & Media | 43 (45.3%) | 52 (54.7%) |
| Legal Services & Support | 26 (56.5%) | 20 (43.5%) |
| Education Instruction & Library | 54 (40.9%) | 78 (59.1%) |
| Arts, Media & Entertainment | 29 (46.0%) | 34 (54.0%) |
| Health Diagnosing & Treating | 33 (17.7%) | 153 (82.3%) |
| Health Technologists | 20 (15.4%) | 110 (84.6%) |
| Total (Category) | 587 (46.9%) | 666 (53.1%) |
| Total (Overall) | 2,864 (53.3%) | 2,506 (46.7%) |
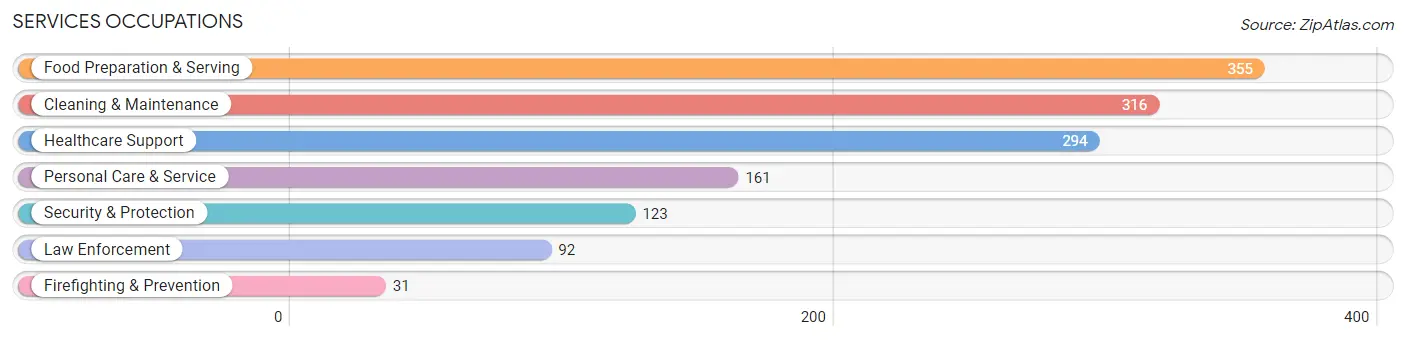
Services Occupations
The most common Services occupations in Niles are Food Preparation & Serving (355 | 6.6%), Cleaning & Maintenance (316 | 5.9%), Healthcare Support (294 | 5.5%), Personal Care & Service (161 | 3.0%), and Security & Protection (123 | 2.3%).
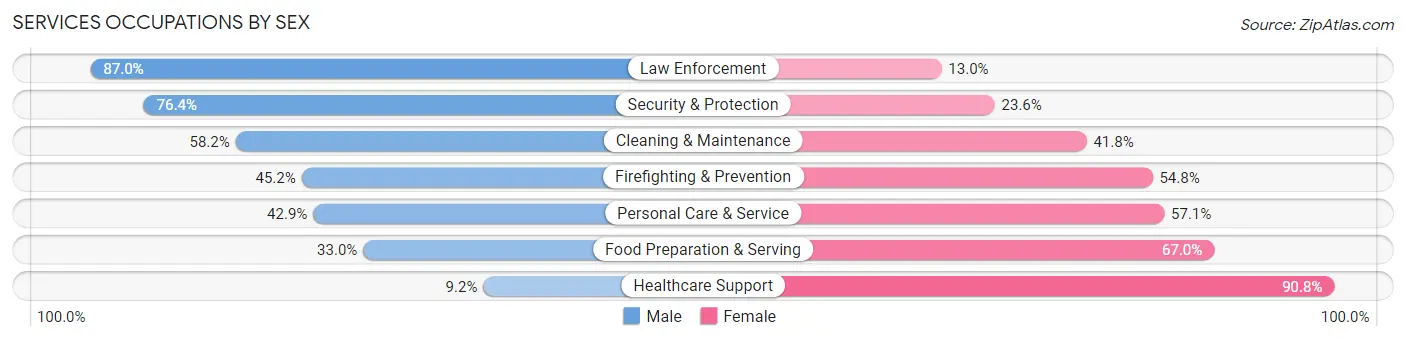
Services Occupations by Sex
Within the Services occupations in Niles, the most male-oriented occupations are Law Enforcement (87.0%), Security & Protection (76.4%), and Cleaning & Maintenance (58.2%), while the most female-oriented occupations are Healthcare Support (90.8%), Food Preparation & Serving (67.0%), and Personal Care & Service (57.1%).
| Occupation | Male | Female |
| Healthcare Support | 27 (9.2%) | 267 (90.8%) |
| Security & Protection | 94 (76.4%) | 29 (23.6%) |
| Firefighting & Prevention | 14 (45.2%) | 17 (54.8%) |
| Law Enforcement | 80 (87.0%) | 12 (13.0%) |
| Food Preparation & Serving | 117 (33.0%) | 238 (67.0%) |
| Cleaning & Maintenance | 184 (58.2%) | 132 (41.8%) |
| Personal Care & Service | 69 (42.9%) | 92 (57.1%) |
| Total (Category) | 491 (39.3%) | 758 (60.7%) |
| Total (Overall) | 2,864 (53.3%) | 2,506 (46.7%) |
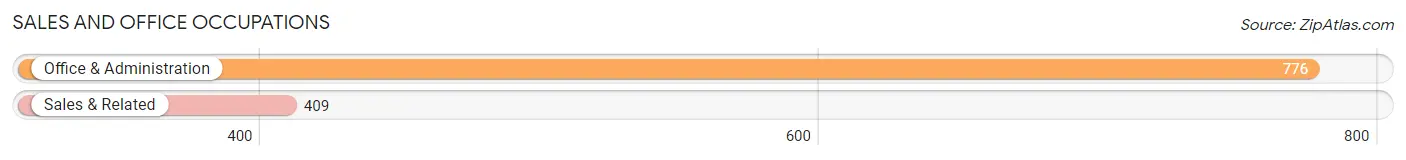
Sales and Office Occupations
The most common Sales and Office occupations in Niles are Office & Administration (776 | 14.4%), and Sales & Related (409 | 7.6%).
Sales and Office Occupations by Sex
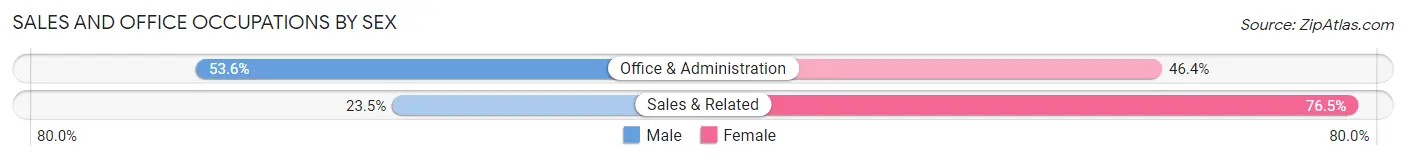
| Occupation | Male | Female |
| Sales & Related | 96 (23.5%) | 313 (76.5%) |
| Office & Administration | 416 (53.6%) | 360 (46.4%) |
| Total (Category) | 512 (43.2%) | 673 (56.8%) |
| Total (Overall) | 2,864 (53.3%) | 2,506 (46.7%) |
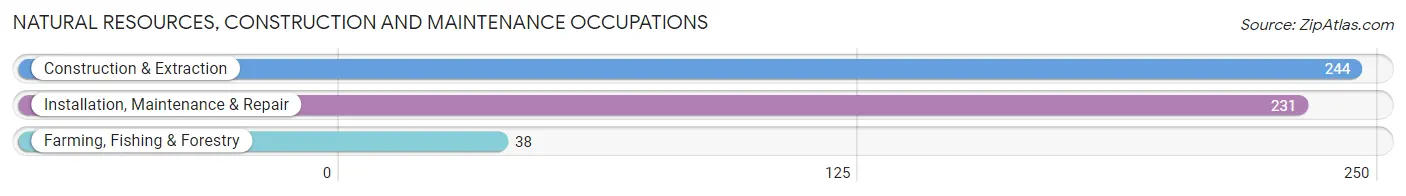
Natural Resources, Construction and Maintenance Occupations
The most common Natural Resources, Construction and Maintenance occupations in Niles are Construction & Extraction (244 | 4.5%), Installation, Maintenance & Repair (231 | 4.3%), and Farming, Fishing & Forestry (38 | 0.7%).
Natural Resources, Construction and Maintenance Occupations by Sex
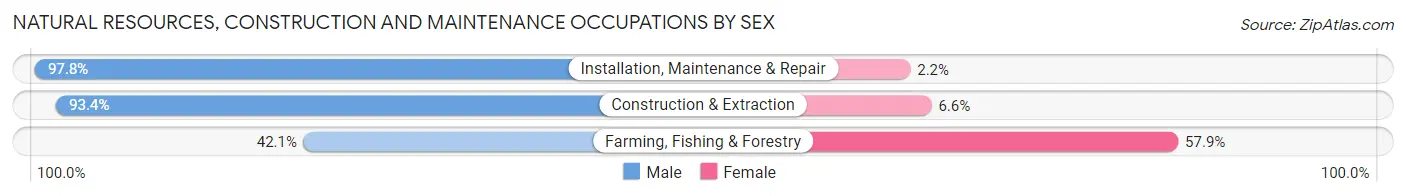
| Occupation | Male | Female |
| Farming, Fishing & Forestry | 16 (42.1%) | 22 (57.9%) |
| Construction & Extraction | 228 (93.4%) | 16 (6.6%) |
| Installation, Maintenance & Repair | 226 (97.8%) | 5 (2.2%) |
| Total (Category) | 470 (91.6%) | 43 (8.4%) |
| Total (Overall) | 2,864 (53.3%) | 2,506 (46.7%) |
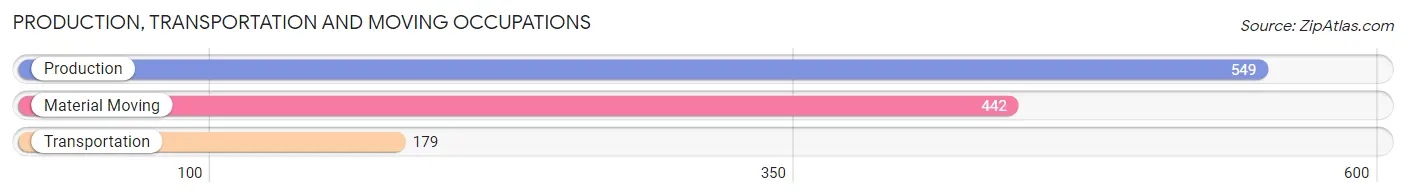
Production, Transportation and Moving Occupations
The most common Production, Transportation and Moving occupations in Niles are Production (549 | 10.2%), Material Moving (442 | 8.2%), and Transportation (179 | 3.3%).
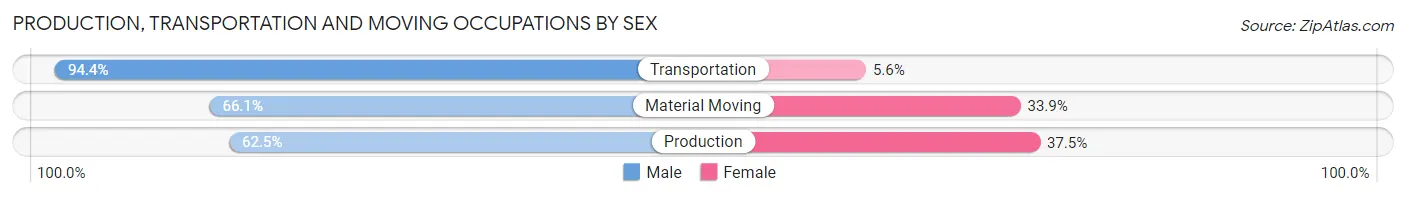
Production, Transportation and Moving Occupations by Sex
| Occupation | Male | Female |
| Production | 343 (62.5%) | 206 (37.5%) |
| Transportation | 169 (94.4%) | 10 (5.6%) |
| Material Moving | 292 (66.1%) | 150 (33.9%) |
| Total (Category) | 804 (68.7%) | 366 (31.3%) |
| Total (Overall) | 2,864 (53.3%) | 2,506 (46.7%) |
Employment Industries by Sex in Niles
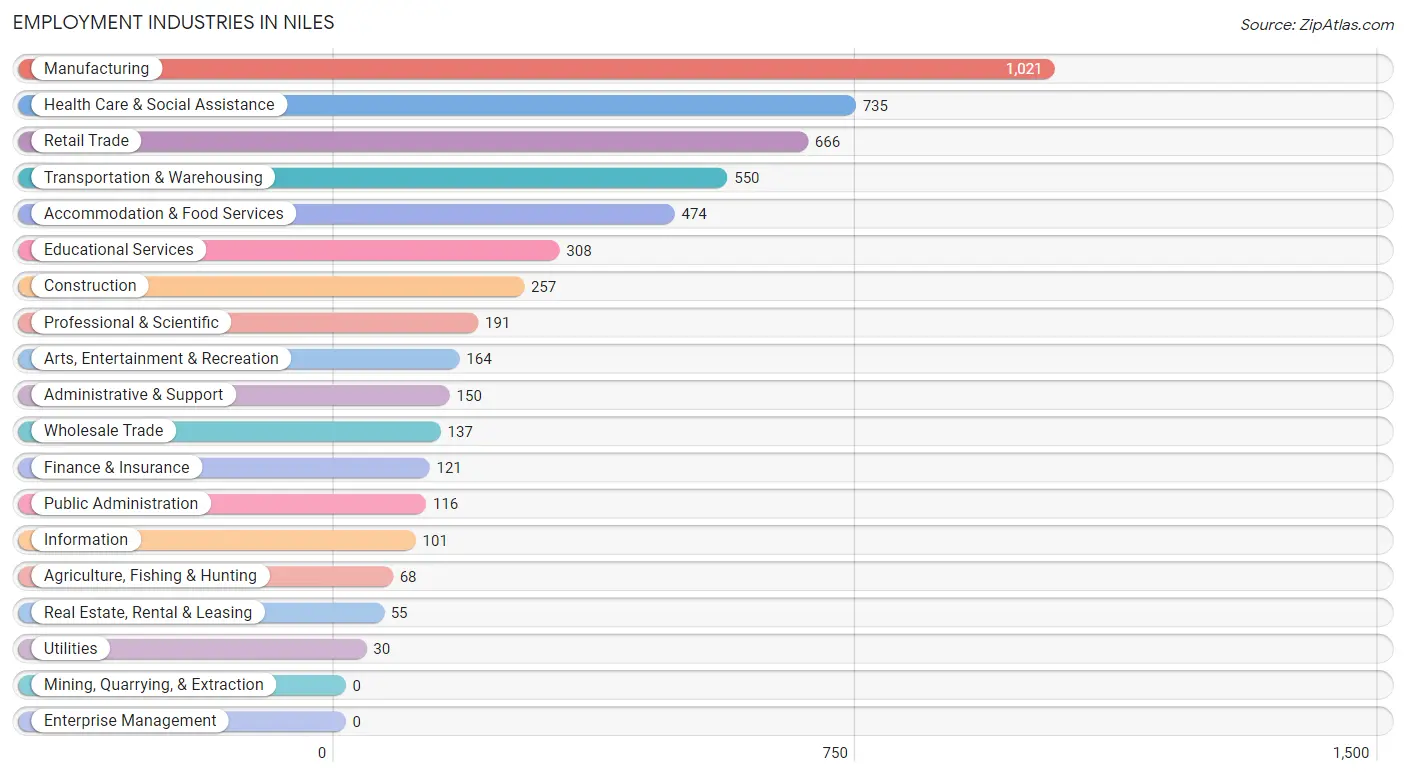
Employment Industries in Niles
The major employment industries in Niles include Manufacturing (1,021 | 19.0%), Health Care & Social Assistance (735 | 13.7%), Retail Trade (666 | 12.4%), Transportation & Warehousing (550 | 10.2%), and Accommodation & Food Services (474 | 8.8%).
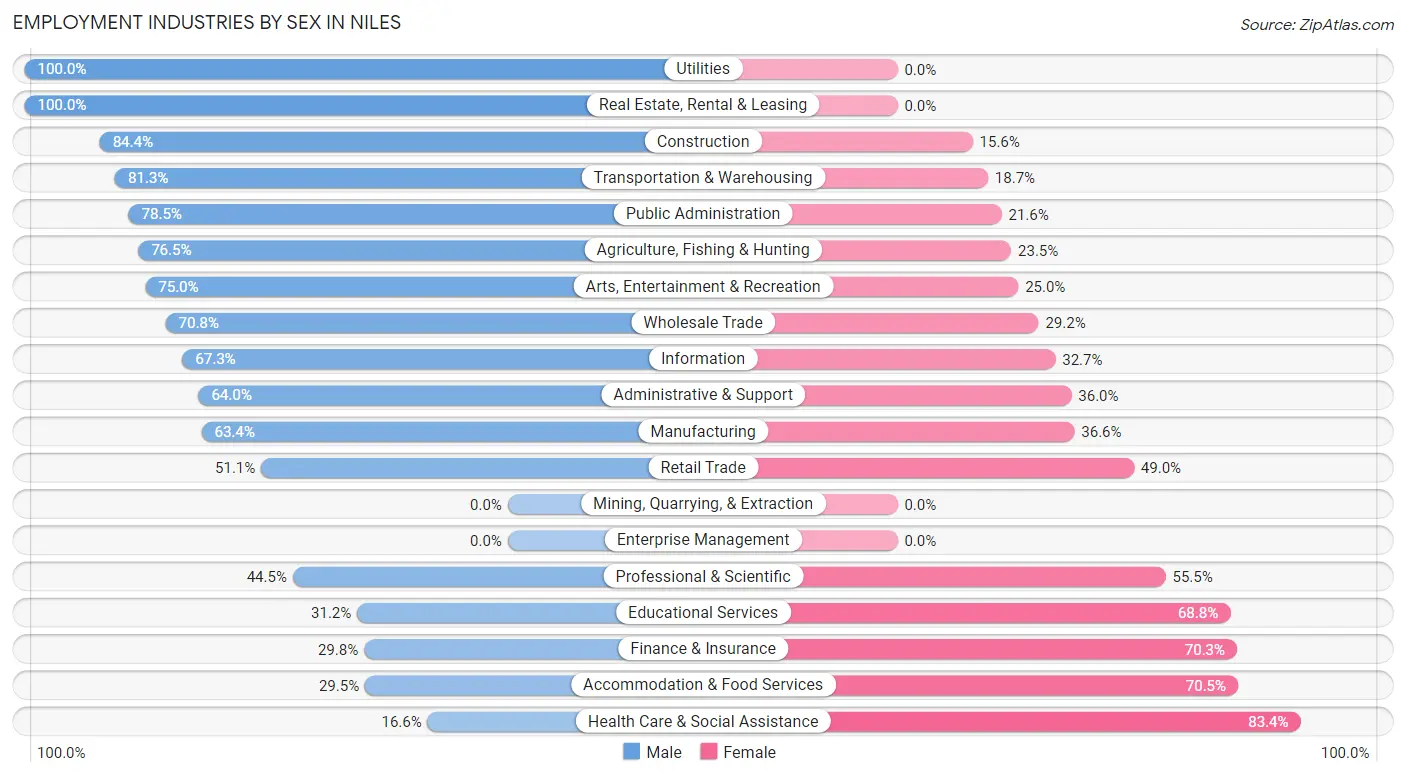
Employment Industries by Sex in Niles
The Niles industries that see more men than women are Utilities (100.0%), Real Estate, Rental & Leasing (100.0%), and Construction (84.4%), whereas the industries that tend to have a higher number of women are Health Care & Social Assistance (83.4%), Accommodation & Food Services (70.5%), and Finance & Insurance (70.3%).
| Industry | Male | Female |
| Agriculture, Fishing & Hunting | 52 (76.5%) | 16 (23.5%) |
| Mining, Quarrying, & Extraction | 0 (0.0%) | 0 (0.0%) |
| Construction | 217 (84.4%) | 40 (15.6%) |
| Manufacturing | 647 (63.4%) | 374 (36.6%) |
| Wholesale Trade | 97 (70.8%) | 40 (29.2%) |
| Retail Trade | 340 (51.0%) | 326 (48.9%) |
| Transportation & Warehousing | 447 (81.3%) | 103 (18.7%) |
| Utilities | 30 (100.0%) | 0 (0.0%) |
| Information | 68 (67.3%) | 33 (32.7%) |
| Finance & Insurance | 36 (29.7%) | 85 (70.3%) |
| Real Estate, Rental & Leasing | 55 (100.0%) | 0 (0.0%) |
| Professional & Scientific | 85 (44.5%) | 106 (55.5%) |
| Enterprise Management | 0 (0.0%) | 0 (0.0%) |
| Administrative & Support | 96 (64.0%) | 54 (36.0%) |
| Educational Services | 96 (31.2%) | 212 (68.8%) |
| Health Care & Social Assistance | 122 (16.6%) | 613 (83.4%) |
| Arts, Entertainment & Recreation | 123 (75.0%) | 41 (25.0%) |
| Accommodation & Food Services | 140 (29.5%) | 334 (70.5%) |
| Public Administration | 91 (78.4%) | 25 (21.5%) |
| Total | 2,864 (53.3%) | 2,506 (46.7%) |
Education in Niles
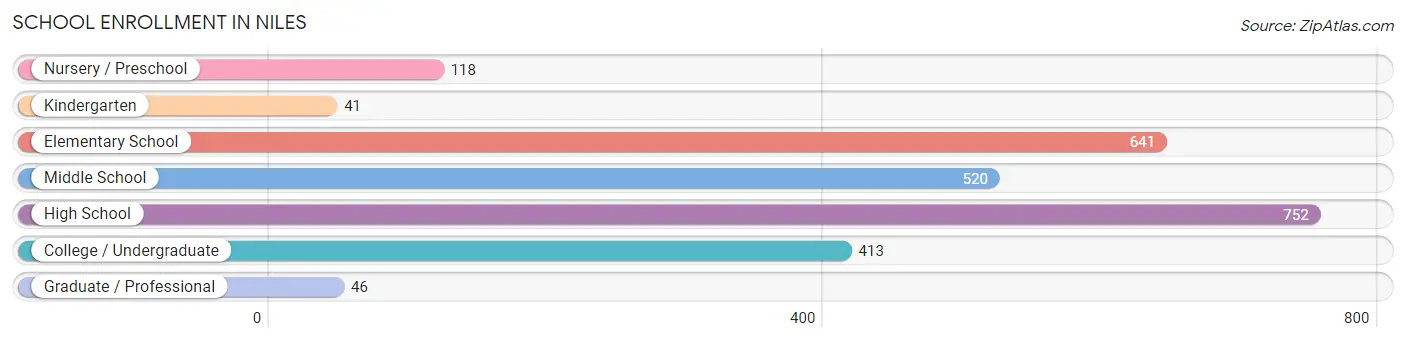
School Enrollment in Niles
The most common levels of schooling among the 2,531 students in Niles are high school (752 | 29.7%), elementary school (641 | 25.3%), and middle school (520 | 20.5%).
| School Level | # Students | % Students |
| Nursery / Preschool | 118 | 4.7% |
| Kindergarten | 41 | 1.6% |
| Elementary School | 641 | 25.3% |
| Middle School | 520 | 20.5% |
| High School | 752 | 29.7% |
| College / Undergraduate | 413 | 16.3% |
| Graduate / Professional | 46 | 1.8% |
| Total | 2,531 | 100.0% |
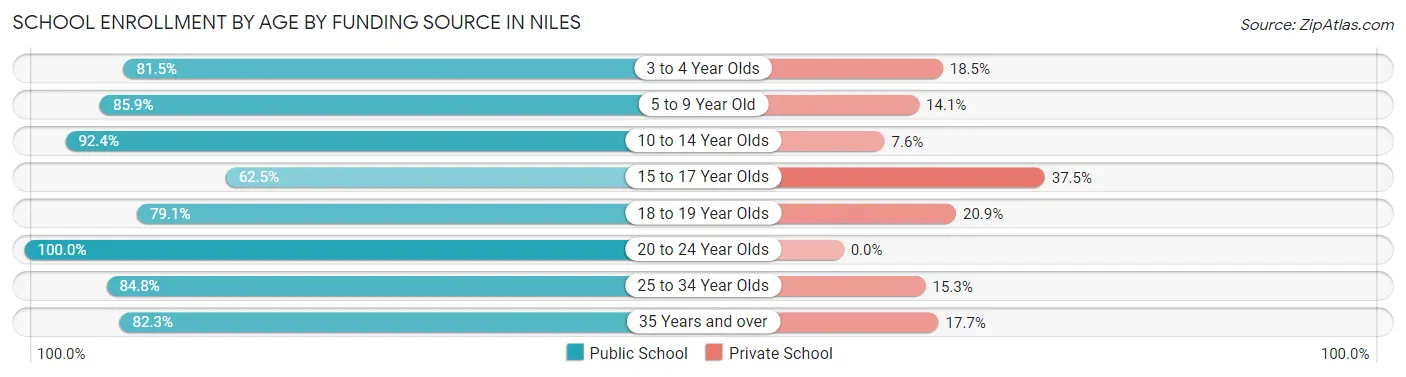
School Enrollment by Age by Funding Source in Niles
Out of a total of 2,531 students who are enrolled in schools in Niles, 410 (16.2%) attend a private institution, while the remaining 2,121 (83.8%) are enrolled in public schools. The age group of 15 to 17 year olds has the highest likelihood of being enrolled in private schools, with 178 (37.5% in the age bracket) enrolled. Conversely, the age group of 20 to 24 year olds has the lowest likelihood of being enrolled in a private school, with 238 (100.0% in the age bracket) attending a public institution.
| Age Bracket | Public School | Private School |
| 3 to 4 Year Olds | 53 (81.5%) | 12 (18.5%) |
| 5 to 9 Year Old | 489 (85.9%) | 80 (14.1%) |
| 10 to 14 Year Olds | 703 (92.4%) | 58 (7.6%) |
| 15 to 17 Year Olds | 297 (62.5%) | 178 (37.5%) |
| 18 to 19 Year Olds | 185 (79.1%) | 49 (20.9%) |
| 20 to 24 Year Olds | 238 (100.0%) | 0 (0.0%) |
| 25 to 34 Year Olds | 50 (84.8%) | 9 (15.2%) |
| 35 Years and over | 107 (82.3%) | 23 (17.7%) |
| Total | 2,121 (83.8%) | 410 (16.2%) |
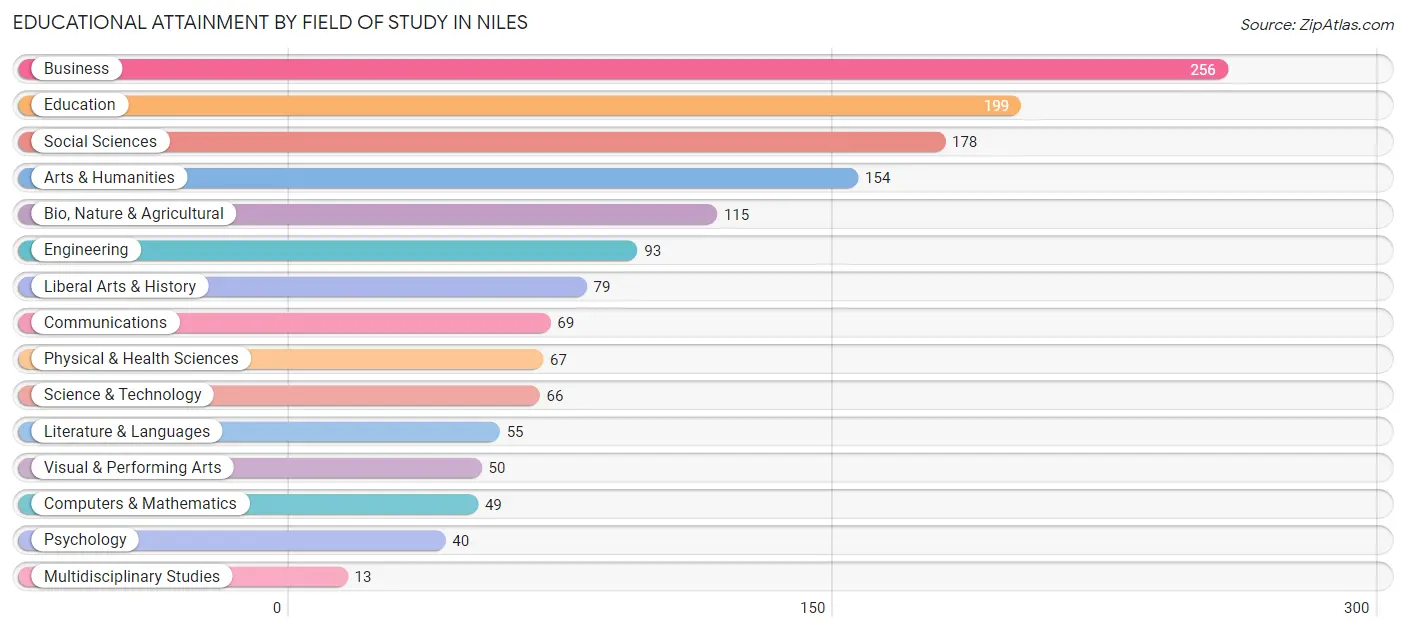
Educational Attainment by Field of Study in Niles
Business (256 | 17.3%), education (199 | 13.4%), social sciences (178 | 12.0%), arts & humanities (154 | 10.4%), and bio, nature & agricultural (115 | 7.7%) are the most common fields of study among 1,483 individuals in Niles who have obtained a bachelor's degree or higher.
| Field of Study | # Graduates | % Graduates |
| Computers & Mathematics | 49 | 3.3% |
| Bio, Nature & Agricultural | 115 | 7.7% |
| Physical & Health Sciences | 67 | 4.5% |
| Psychology | 40 | 2.7% |
| Social Sciences | 178 | 12.0% |
| Engineering | 93 | 6.3% |
| Multidisciplinary Studies | 13 | 0.9% |
| Science & Technology | 66 | 4.4% |
| Business | 256 | 17.3% |
| Education | 199 | 13.4% |
| Literature & Languages | 55 | 3.7% |
| Liberal Arts & History | 79 | 5.3% |
| Visual & Performing Arts | 50 | 3.4% |
| Communications | 69 | 4.6% |
| Arts & Humanities | 154 | 10.4% |
| Total | 1,483 | 100.0% |
Transportation & Commute in Niles
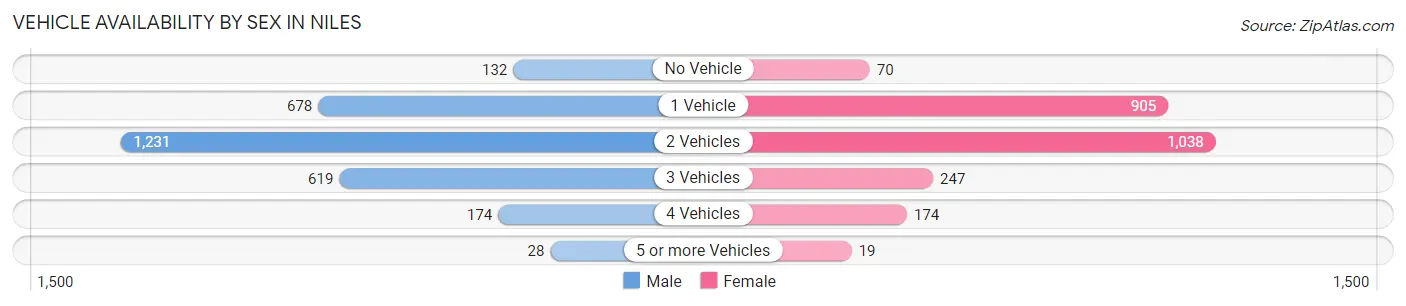
Vehicle Availability by Sex in Niles
The most prevalent vehicle ownership categories in Niles are males with 2 vehicles (1,231, accounting for 43.0%) and females with 2 vehicles (1,038, making up 50.2%).
| Vehicles Available | Male | Female |
| No Vehicle | 132 (4.6%) | 70 (2.9%) |
| 1 Vehicle | 678 (23.7%) | 905 (36.9%) |
| 2 Vehicles | 1,231 (43.0%) | 1,038 (42.3%) |
| 3 Vehicles | 619 (21.6%) | 247 (10.1%) |
| 4 Vehicles | 174 (6.1%) | 174 (7.1%) |
| 5 or more Vehicles | 28 (1.0%) | 19 (0.8%) |
| Total | 2,862 (100.0%) | 2,453 (100.0%) |
Commute Time in Niles
The most frequently occuring commute durations in Niles are 30 to 34 minutes (813 commuters, 16.0%), 20 to 24 minutes (779 commuters, 15.3%), and 5 to 9 minutes (717 commuters, 14.1%).
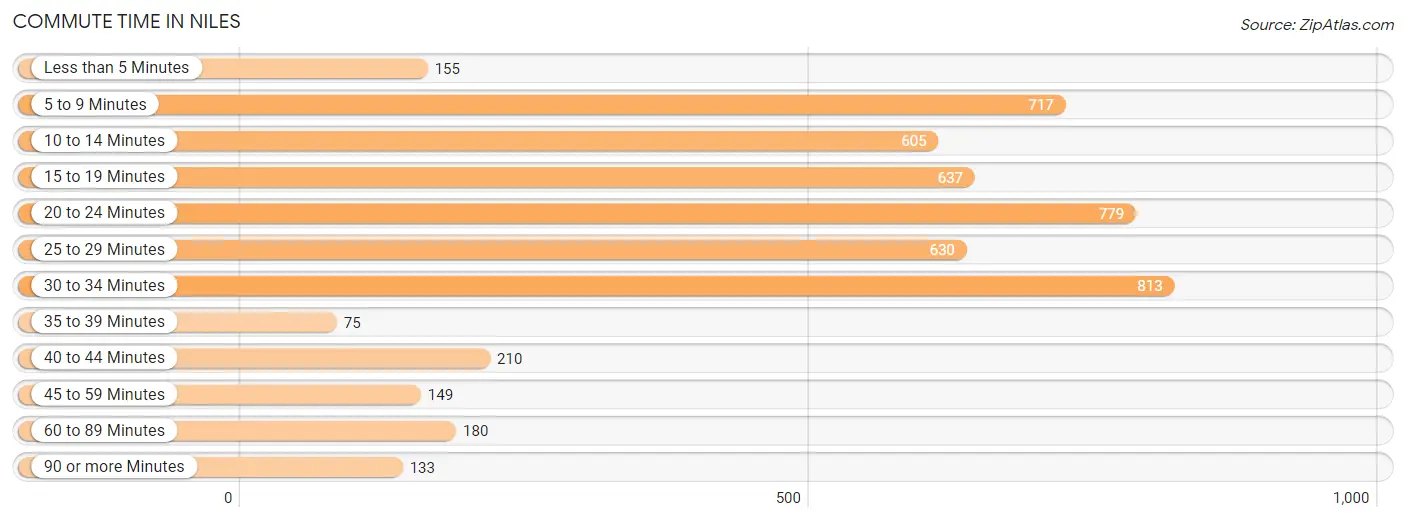
| Commute Time | # Commuters | % Commuters |
| Less than 5 Minutes | 155 | 3.0% |
| 5 to 9 Minutes | 717 | 14.1% |
| 10 to 14 Minutes | 605 | 11.9% |
| 15 to 19 Minutes | 637 | 12.5% |
| 20 to 24 Minutes | 779 | 15.3% |
| 25 to 29 Minutes | 630 | 12.4% |
| 30 to 34 Minutes | 813 | 16.0% |
| 35 to 39 Minutes | 75 | 1.5% |
| 40 to 44 Minutes | 210 | 4.1% |
| 45 to 59 Minutes | 149 | 2.9% |
| 60 to 89 Minutes | 180 | 3.5% |
| 90 or more Minutes | 133 | 2.6% |
Commute Time by Sex in Niles
The most common commute times in Niles are 20 to 24 minutes (476 commuters, 17.5%) for males and 30 to 34 minutes (394 commuters, 16.7%) for females.
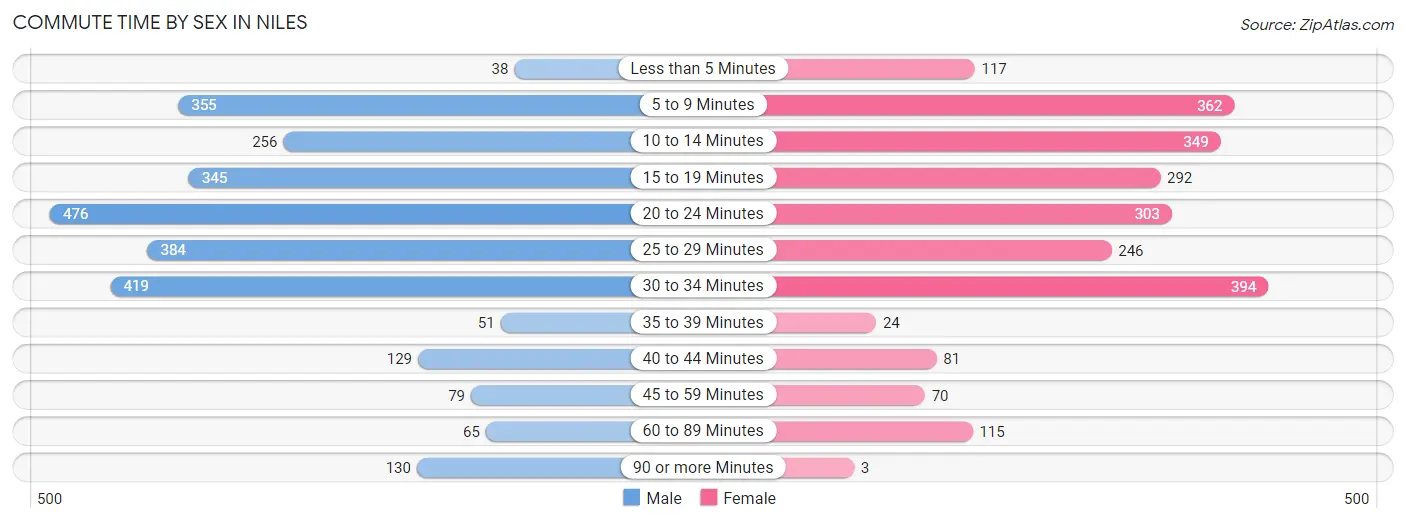
| Commute Time | Male | Female |
| Less than 5 Minutes | 38 (1.4%) | 117 (5.0%) |
| 5 to 9 Minutes | 355 (13.0%) | 362 (15.4%) |
| 10 to 14 Minutes | 256 (9.4%) | 349 (14.8%) |
| 15 to 19 Minutes | 345 (12.7%) | 292 (12.4%) |
| 20 to 24 Minutes | 476 (17.5%) | 303 (12.9%) |
| 25 to 29 Minutes | 384 (14.1%) | 246 (10.4%) |
| 30 to 34 Minutes | 419 (15.4%) | 394 (16.7%) |
| 35 to 39 Minutes | 51 (1.9%) | 24 (1.0%) |
| 40 to 44 Minutes | 129 (4.7%) | 81 (3.4%) |
| 45 to 59 Minutes | 79 (2.9%) | 70 (3.0%) |
| 60 to 89 Minutes | 65 (2.4%) | 115 (4.9%) |
| 90 or more Minutes | 130 (4.8%) | 3 (0.1%) |
Time of Departure to Work by Sex in Niles
The most frequent times of departure to work in Niles are 4:00 PM to 11:59 PM (339, 12.4%) for males and 12:00 PM to 3:59 PM (344, 14.6%) for females.
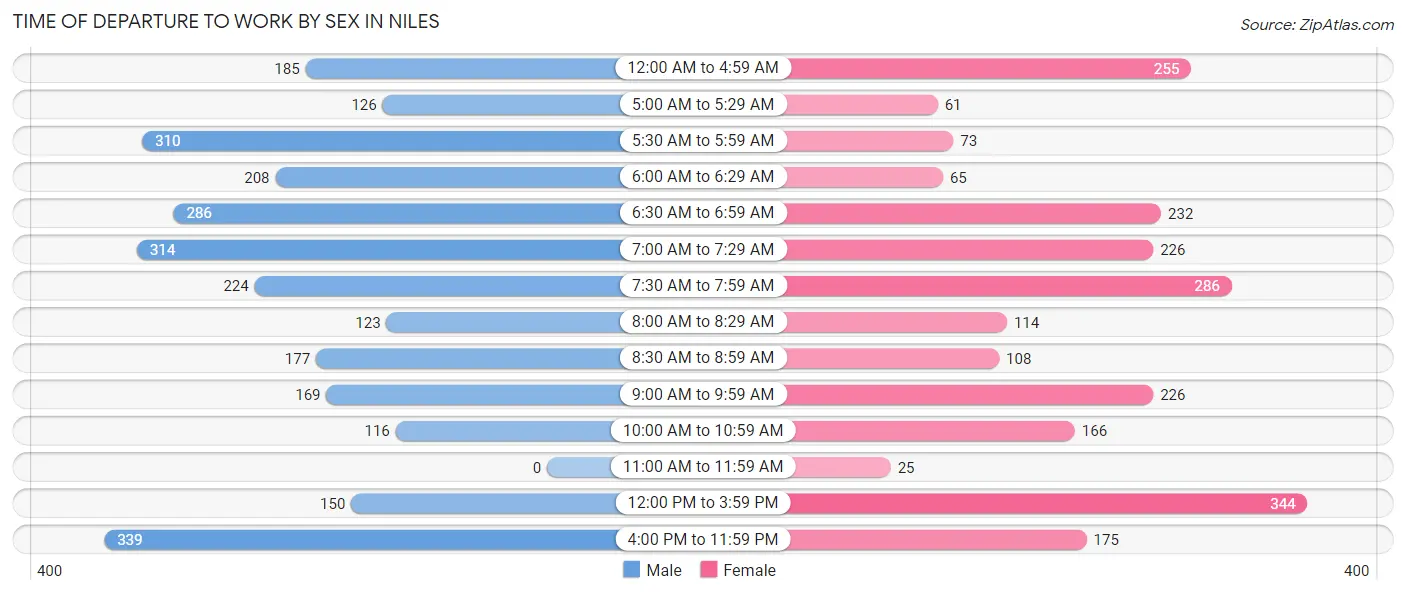
| Time of Departure | Male | Female |
| 12:00 AM to 4:59 AM | 185 (6.8%) | 255 (10.8%) |
| 5:00 AM to 5:29 AM | 126 (4.6%) | 61 (2.6%) |
| 5:30 AM to 5:59 AM | 310 (11.4%) | 73 (3.1%) |
| 6:00 AM to 6:29 AM | 208 (7.6%) | 65 (2.8%) |
| 6:30 AM to 6:59 AM | 286 (10.5%) | 232 (9.9%) |
| 7:00 AM to 7:29 AM | 314 (11.5%) | 226 (9.6%) |
| 7:30 AM to 7:59 AM | 224 (8.2%) | 286 (12.1%) |
| 8:00 AM to 8:29 AM | 123 (4.5%) | 114 (4.8%) |
| 8:30 AM to 8:59 AM | 177 (6.5%) | 108 (4.6%) |
| 9:00 AM to 9:59 AM | 169 (6.2%) | 226 (9.6%) |
| 10:00 AM to 10:59 AM | 116 (4.3%) | 166 (7.0%) |
| 11:00 AM to 11:59 AM | 0 (0.0%) | 25 (1.1%) |
| 12:00 PM to 3:59 PM | 150 (5.5%) | 344 (14.6%) |
| 4:00 PM to 11:59 PM | 339 (12.4%) | 175 (7.4%) |
| Total | 2,727 (100.0%) | 2,356 (100.0%) |
Housing Occupancy in Niles
Occupancy by Ownership in Niles
Of the total 5,089 dwellings in Niles, owner-occupied units account for 3,150 (61.9%), while renter-occupied units make up 1,939 (38.1%).
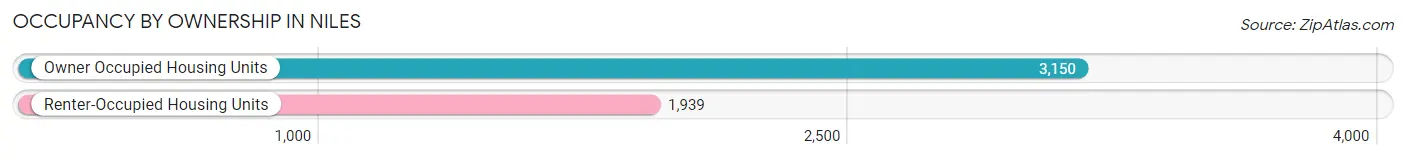
| Occupancy | # Housing Units | % Housing Units |
| Owner Occupied Housing Units | 3,150 | 61.9% |
| Renter-Occupied Housing Units | 1,939 | 38.1% |
| Total Occupied Housing Units | 5,089 | 100.0% |
Occupancy by Household Size in Niles
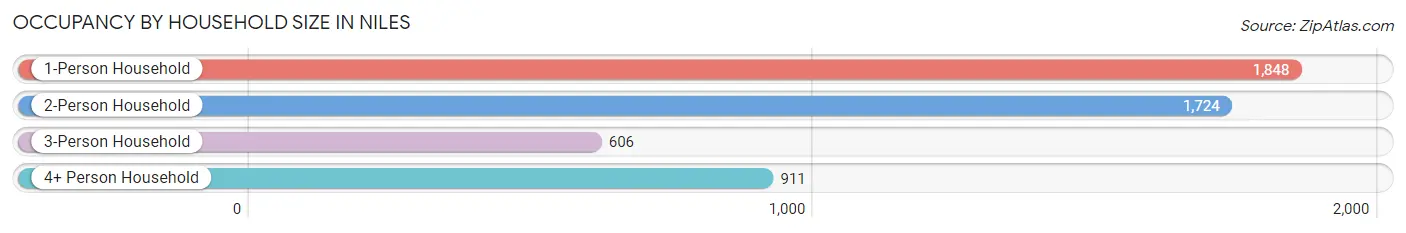
| Household Size | # Housing Units | % Housing Units |
| 1-Person Household | 1,848 | 36.3% |
| 2-Person Household | 1,724 | 33.9% |
| 3-Person Household | 606 | 11.9% |
| 4+ Person Household | 911 | 17.9% |
| Total Housing Units | 5,089 | 100.0% |
Occupancy by Ownership by Household Size in Niles
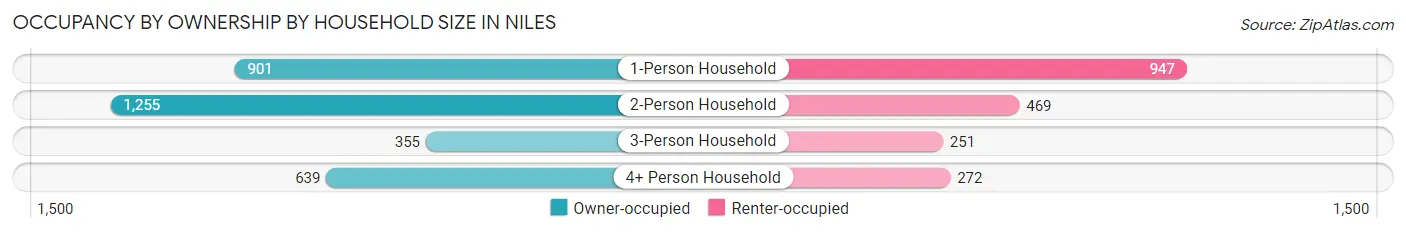
| Household Size | Owner-occupied | Renter-occupied |
| 1-Person Household | 901 (48.8%) | 947 (51.2%) |
| 2-Person Household | 1,255 (72.8%) | 469 (27.2%) |
| 3-Person Household | 355 (58.6%) | 251 (41.4%) |
| 4+ Person Household | 639 (70.1%) | 272 (29.9%) |
| Total Housing Units | 3,150 (61.9%) | 1,939 (38.1%) |
Occupancy by Educational Attainment in Niles
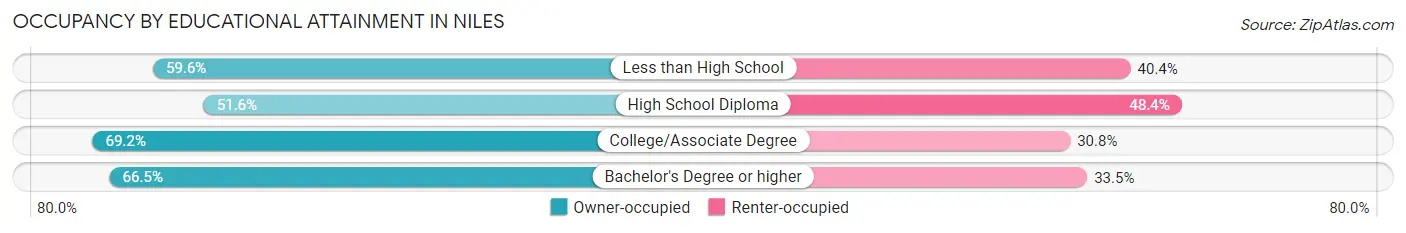
| Household Size | Owner-occupied | Renter-occupied |
| Less than High School | 328 (59.6%) | 222 (40.4%) |
| High School Diploma | 861 (51.6%) | 809 (48.4%) |
| College/Associate Degree | 1,347 (69.2%) | 599 (30.8%) |
| Bachelor's Degree or higher | 614 (66.5%) | 309 (33.5%) |
Occupancy by Age of Householder in Niles
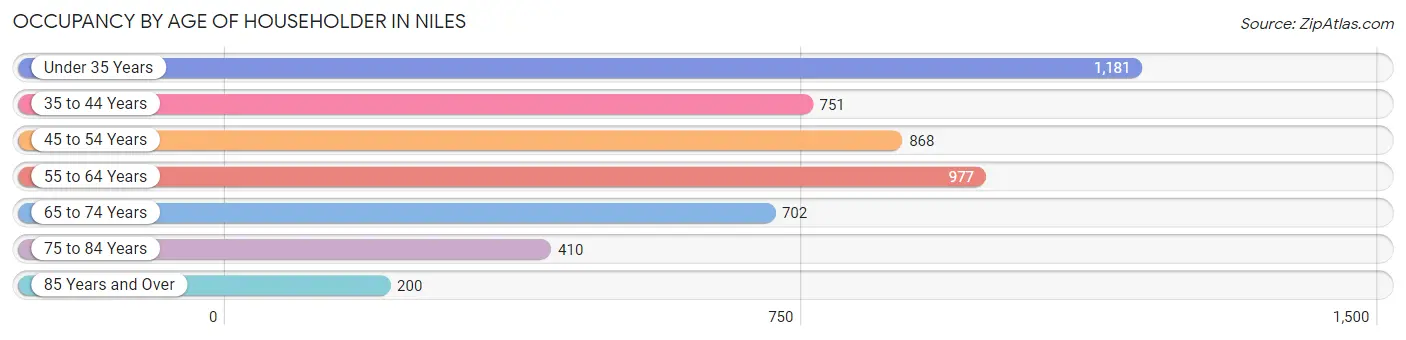
| Age Bracket | # Households | % Households |
| Under 35 Years | 1,181 | 23.2% |
| 35 to 44 Years | 751 | 14.8% |
| 45 to 54 Years | 868 | 17.1% |
| 55 to 64 Years | 977 | 19.2% |
| 65 to 74 Years | 702 | 13.8% |
| 75 to 84 Years | 410 | 8.1% |
| 85 Years and Over | 200 | 3.9% |
| Total | 5,089 | 100.0% |
Housing Finances in Niles
Median Income by Occupancy in Niles
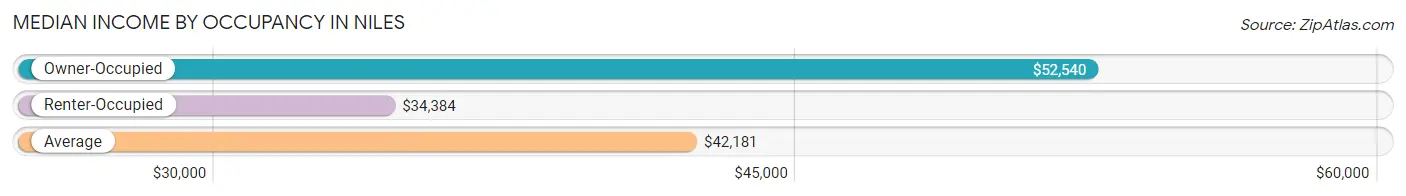
| Occupancy Type | # Households | Median Income |
| Owner-Occupied | 3,150 (61.9%) | $52,540 |
| Renter-Occupied | 1,939 (38.1%) | $34,384 |
| Average | 5,089 (100.0%) | $42,181 |
Occupancy by Householder Income Bracket in Niles
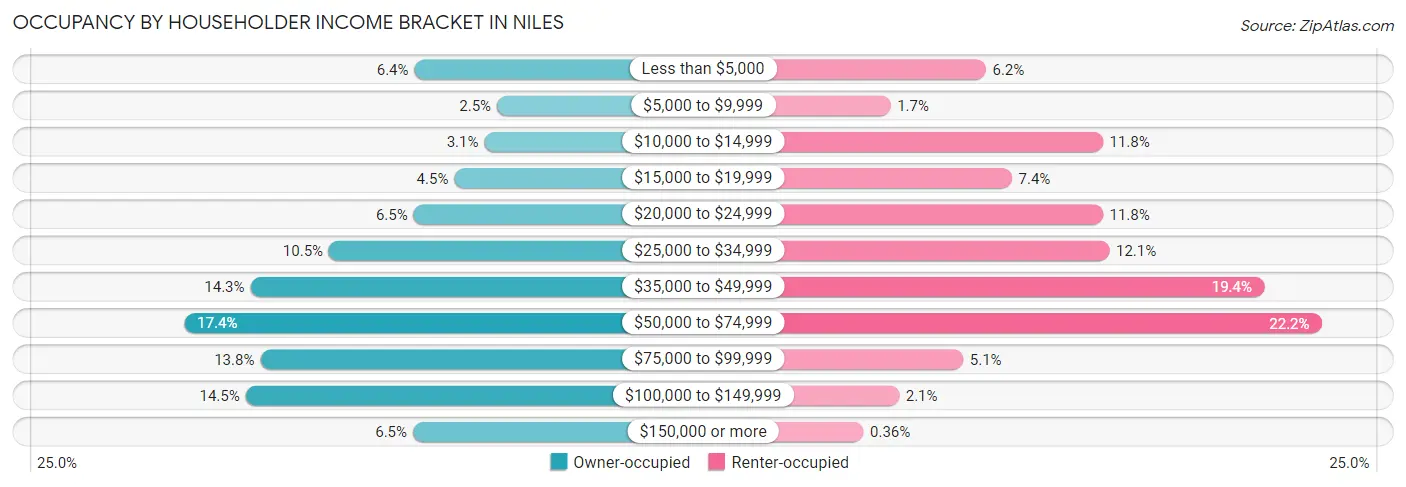
| Income Bracket | Owner-occupied | Renter-occupied |
| Less than $5,000 | 203 (6.4%) | 120 (6.2%) |
| $5,000 to $9,999 | 79 (2.5%) | 32 (1.7%) |
| $10,000 to $14,999 | 98 (3.1%) | 228 (11.8%) |
| $15,000 to $19,999 | 143 (4.5%) | 144 (7.4%) |
| $20,000 to $24,999 | 204 (6.5%) | 228 (11.8%) |
| $25,000 to $34,999 | 331 (10.5%) | 234 (12.1%) |
| $35,000 to $49,999 | 449 (14.2%) | 377 (19.4%) |
| $50,000 to $74,999 | 548 (17.4%) | 430 (22.2%) |
| $75,000 to $99,999 | 434 (13.8%) | 99 (5.1%) |
| $100,000 to $149,999 | 456 (14.5%) | 40 (2.1%) |
| $150,000 or more | 205 (6.5%) | 7 (0.4%) |
| Total | 3,150 (100.0%) | 1,939 (100.0%) |
Monthly Housing Cost Tiers in Niles
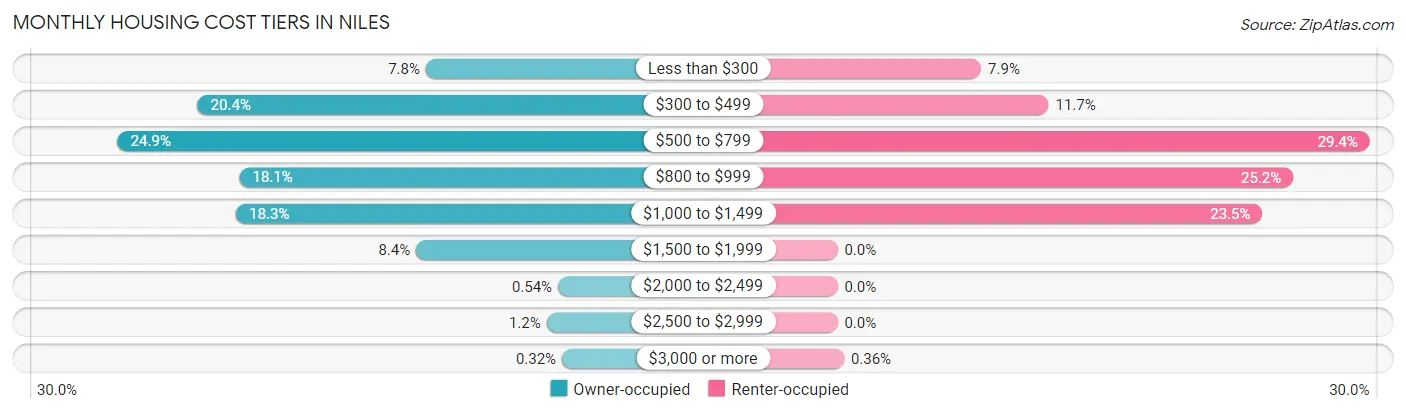
| Monthly Cost | Owner-occupied | Renter-occupied |
| Less than $300 | 247 (7.8%) | 154 (7.9%) |
| $300 to $499 | 644 (20.4%) | 226 (11.7%) |
| $500 to $799 | 783 (24.9%) | 570 (29.4%) |
| $800 to $999 | 571 (18.1%) | 488 (25.2%) |
| $1,000 to $1,499 | 577 (18.3%) | 455 (23.5%) |
| $1,500 to $1,999 | 264 (8.4%) | 0 (0.0%) |
| $2,000 to $2,499 | 17 (0.5%) | 0 (0.0%) |
| $2,500 to $2,999 | 37 (1.2%) | 0 (0.0%) |
| $3,000 or more | 10 (0.3%) | 7 (0.4%) |
| Total | 3,150 (100.0%) | 1,939 (100.0%) |
Physical Housing Characteristics in Niles
Housing Structures in Niles
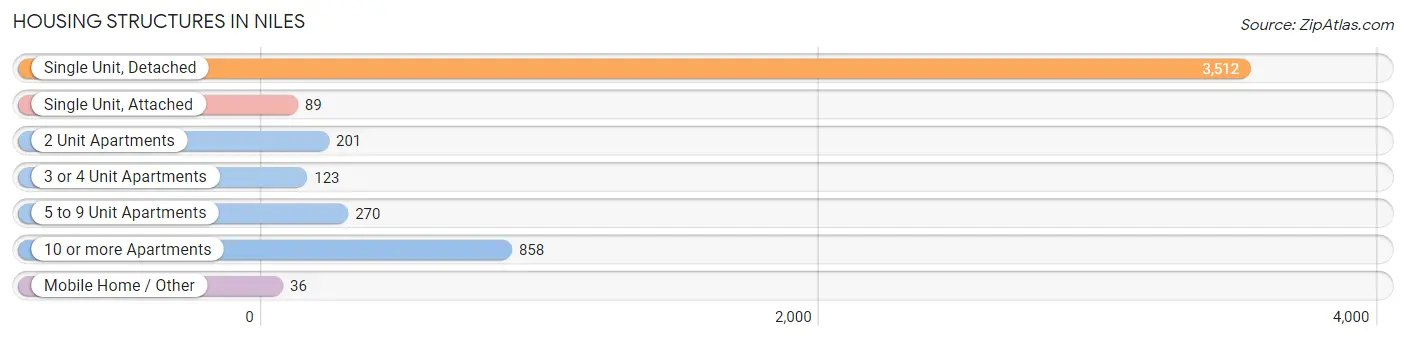
| Structure Type | # Housing Units | % Housing Units |
| Single Unit, Detached | 3,512 | 69.0% |
| Single Unit, Attached | 89 | 1.8% |
| 2 Unit Apartments | 201 | 4.0% |
| 3 or 4 Unit Apartments | 123 | 2.4% |
| 5 to 9 Unit Apartments | 270 | 5.3% |
| 10 or more Apartments | 858 | 16.9% |
| Mobile Home / Other | 36 | 0.7% |
| Total | 5,089 | 100.0% |
Housing Structures by Occupancy in Niles
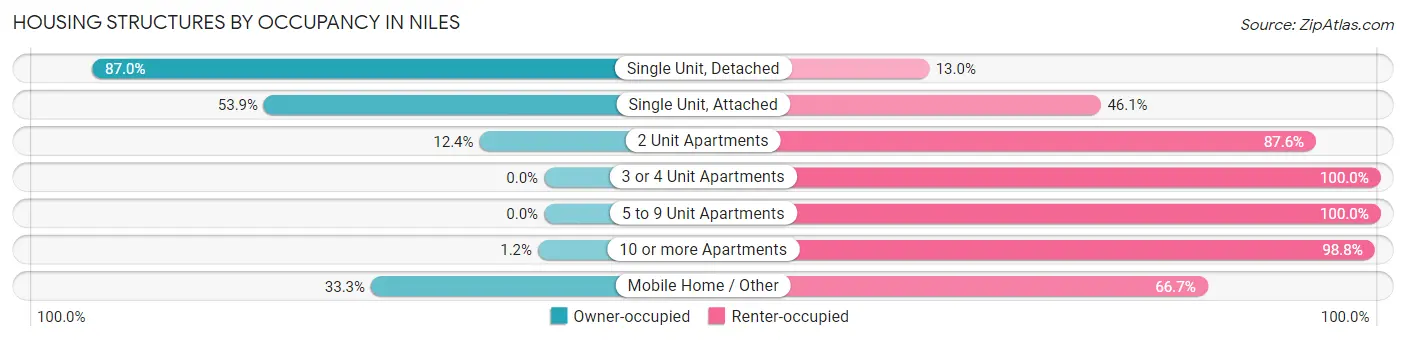
| Structure Type | Owner-occupied | Renter-occupied |
| Single Unit, Detached | 3,055 (87.0%) | 457 (13.0%) |
| Single Unit, Attached | 48 (53.9%) | 41 (46.1%) |
| 2 Unit Apartments | 25 (12.4%) | 176 (87.6%) |
| 3 or 4 Unit Apartments | 0 (0.0%) | 123 (100.0%) |
| 5 to 9 Unit Apartments | 0 (0.0%) | 270 (100.0%) |
| 10 or more Apartments | 10 (1.2%) | 848 (98.8%) |
| Mobile Home / Other | 12 (33.3%) | 24 (66.7%) |
| Total | 3,150 (61.9%) | 1,939 (38.1%) |
Housing Structures by Number of Rooms in Niles
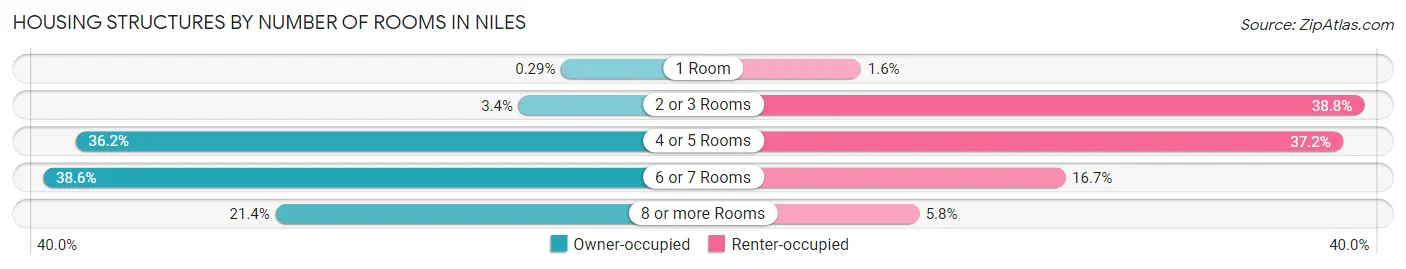
| Number of Rooms | Owner-occupied | Renter-occupied |
| 1 Room | 9 (0.3%) | 30 (1.5%) |
| 2 or 3 Rooms | 108 (3.4%) | 752 (38.8%) |
| 4 or 5 Rooms | 1,141 (36.2%) | 721 (37.2%) |
| 6 or 7 Rooms | 1,217 (38.6%) | 323 (16.7%) |
| 8 or more Rooms | 675 (21.4%) | 113 (5.8%) |
| Total | 3,150 (100.0%) | 1,939 (100.0%) |
Housing Structure by Heating Type in Niles
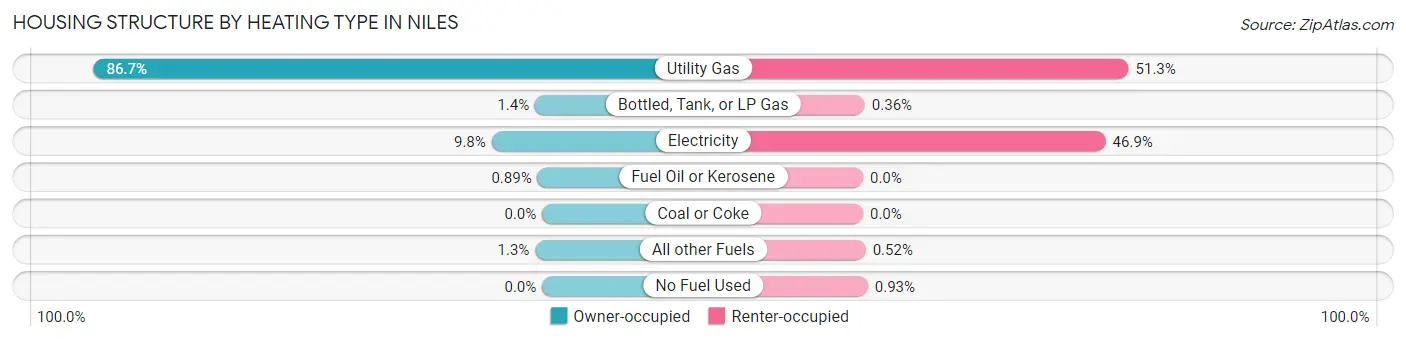
| Heating Type | Owner-occupied | Renter-occupied |
| Utility Gas | 2,730 (86.7%) | 995 (51.3%) |
| Bottled, Tank, or LP Gas | 43 (1.4%) | 7 (0.4%) |
| Electricity | 307 (9.8%) | 909 (46.9%) |
| Fuel Oil or Kerosene | 28 (0.9%) | 0 (0.0%) |
| Coal or Coke | 0 (0.0%) | 0 (0.0%) |
| All other Fuels | 42 (1.3%) | 10 (0.5%) |
| No Fuel Used | 0 (0.0%) | 18 (0.9%) |
| Total | 3,150 (100.0%) | 1,939 (100.0%) |
Household Vehicle Usage in Niles
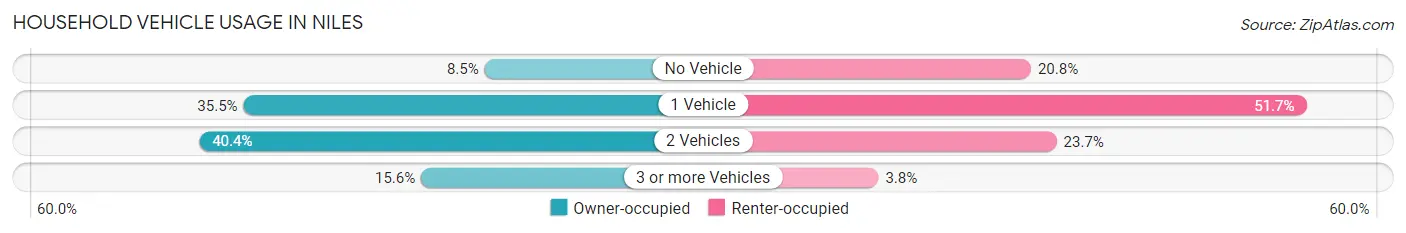
| Vehicles per Household | Owner-occupied | Renter-occupied |
| No Vehicle | 267 (8.5%) | 404 (20.8%) |
| 1 Vehicle | 1,118 (35.5%) | 1,002 (51.7%) |
| 2 Vehicles | 1,274 (40.4%) | 460 (23.7%) |
| 3 or more Vehicles | 491 (15.6%) | 73 (3.8%) |
| Total | 3,150 (100.0%) | 1,939 (100.0%) |
Real Estate & Mortgages in Niles
Real Estate and Mortgage Overview in Niles
| Characteristic | Without Mortgage | With Mortgage |
| Housing Units | 1,270 | 1,880 |
| Median Property Value | $87,400 | $118,300 |
| Median Household Income | $38,457 | $149 |
| Monthly Housing Costs | $413 | $0 |
| Real Estate Taxes | $1,403 | $56 |
Property Value by Mortgage Status in Niles
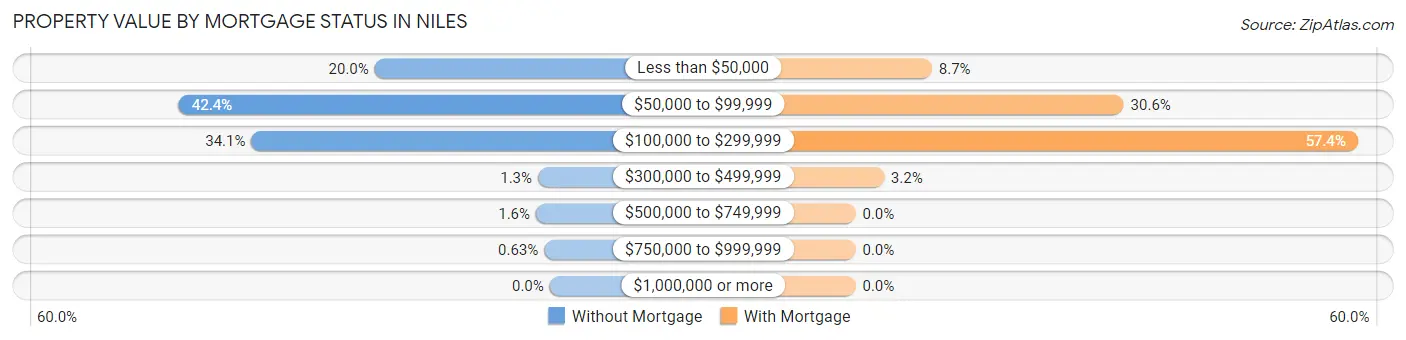
| Property Value | Without Mortgage | With Mortgage |
| Less than $50,000 | 254 (20.0%) | 164 (8.7%) |
| $50,000 to $99,999 | 538 (42.4%) | 576 (30.6%) |
| $100,000 to $299,999 | 433 (34.1%) | 1,079 (57.4%) |
| $300,000 to $499,999 | 17 (1.3%) | 61 (3.2%) |
| $500,000 to $749,999 | 20 (1.6%) | 0 (0.0%) |
| $750,000 to $999,999 | 8 (0.6%) | 0 (0.0%) |
| $1,000,000 or more | 0 (0.0%) | 0 (0.0%) |
| Total | 1,270 (100.0%) | 1,880 (100.0%) |
Household Income by Mortgage Status in Niles
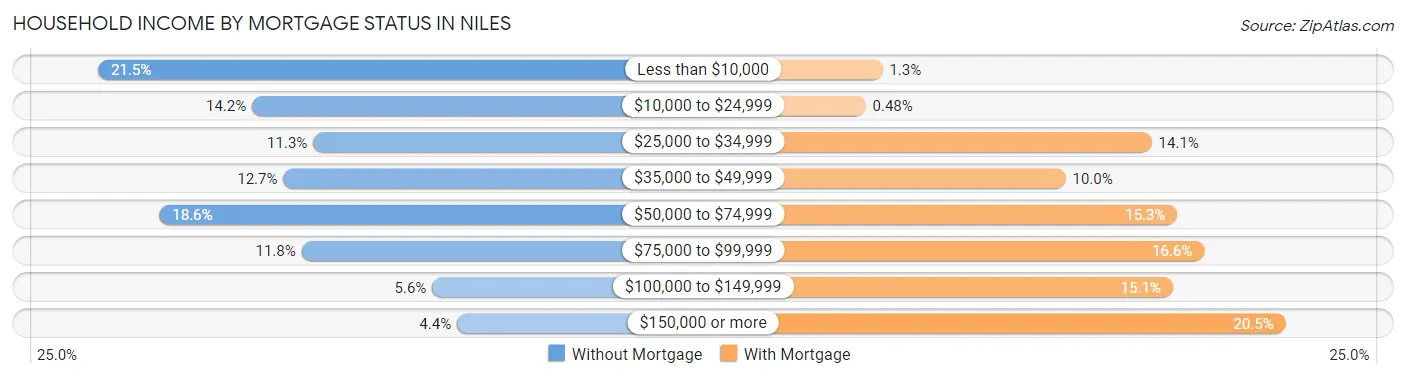
| Household Income | Without Mortgage | With Mortgage |
| Less than $10,000 | 273 (21.5%) | 24 (1.3%) |
| $10,000 to $24,999 | 180 (14.2%) | 9 (0.5%) |
| $25,000 to $34,999 | 143 (11.3%) | 265 (14.1%) |
| $35,000 to $49,999 | 161 (12.7%) | 188 (10.0%) |
| $50,000 to $74,999 | 236 (18.6%) | 288 (15.3%) |
| $75,000 to $99,999 | 150 (11.8%) | 312 (16.6%) |
| $100,000 to $149,999 | 71 (5.6%) | 284 (15.1%) |
| $150,000 or more | 56 (4.4%) | 385 (20.5%) |
| Total | 1,270 (100.0%) | 1,880 (100.0%) |
Property Value to Household Income Ratio in Niles
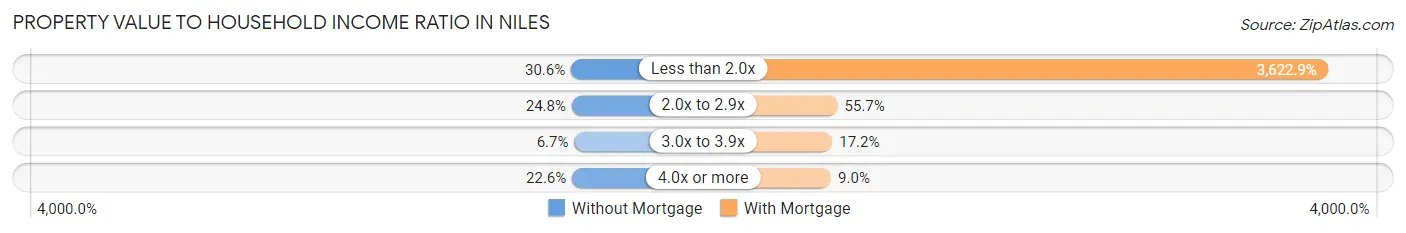
| Value-to-Income Ratio | Without Mortgage | With Mortgage |
| Less than 2.0x | 389 (30.6%) | 68,111 (3,622.9%) |
| 2.0x to 2.9x | 315 (24.8%) | 1,047 (55.7%) |
| 3.0x to 3.9x | 85 (6.7%) | 323 (17.2%) |
| 4.0x or more | 287 (22.6%) | 170 (9.0%) |
| Total | 1,270 (100.0%) | 1,880 (100.0%) |
Real Estate Taxes by Mortgage Status in Niles
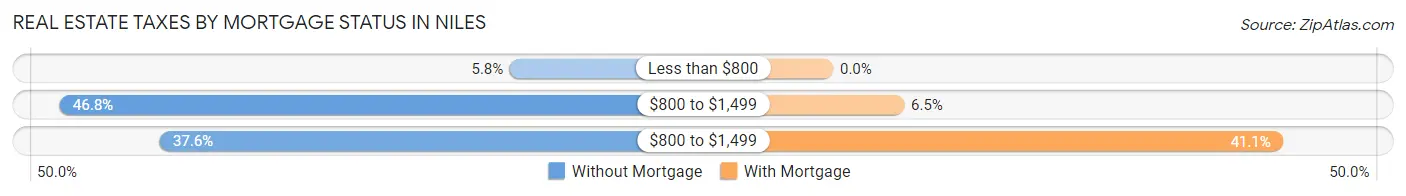
| Property Taxes | Without Mortgage | With Mortgage |
| Less than $800 | 73 (5.8%) | 0 (0.0%) |
| $800 to $1,499 | 594 (46.8%) | 122 (6.5%) |
| $800 to $1,499 | 478 (37.6%) | 772 (41.1%) |
| Total | 1,270 (100.0%) | 1,880 (100.0%) |
Health & Disability in Niles
Health Insurance Coverage by Age in Niles
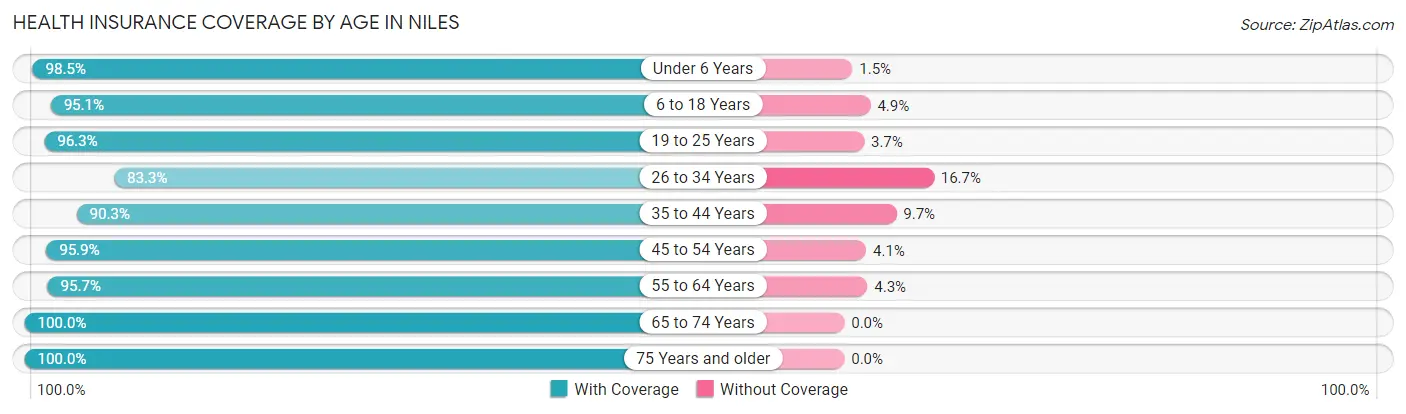
| Age Bracket | With Coverage | Without Coverage |
| Under 6 Years | 657 (98.5%) | 10 (1.5%) |
| 6 to 18 Years | 1,948 (95.1%) | 100 (4.9%) |
| 19 to 25 Years | 1,178 (96.3%) | 45 (3.7%) |
| 26 to 34 Years | 1,198 (83.3%) | 240 (16.7%) |
| 35 to 44 Years | 1,442 (90.3%) | 155 (9.7%) |
| 45 to 54 Years | 1,158 (95.9%) | 49 (4.1%) |
| 55 to 64 Years | 1,335 (95.7%) | 60 (4.3%) |
| 65 to 74 Years | 1,098 (100.0%) | 0 (0.0%) |
| 75 Years and older | 1,016 (100.0%) | 0 (0.0%) |
| Total | 11,030 (94.4%) | 659 (5.6%) |
Health Insurance Coverage by Citizenship Status in Niles
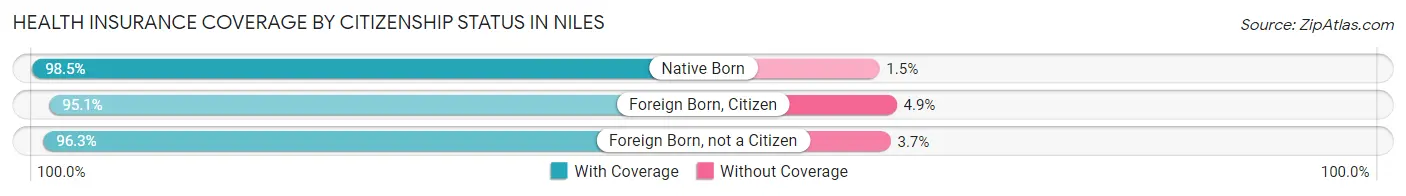
| Citizenship Status | With Coverage | Without Coverage |
| Native Born | 657 (98.5%) | 10 (1.5%) |
| Foreign Born, Citizen | 1,948 (95.1%) | 100 (4.9%) |
| Foreign Born, not a Citizen | 1,178 (96.3%) | 45 (3.7%) |
Health Insurance Coverage by Household Income in Niles
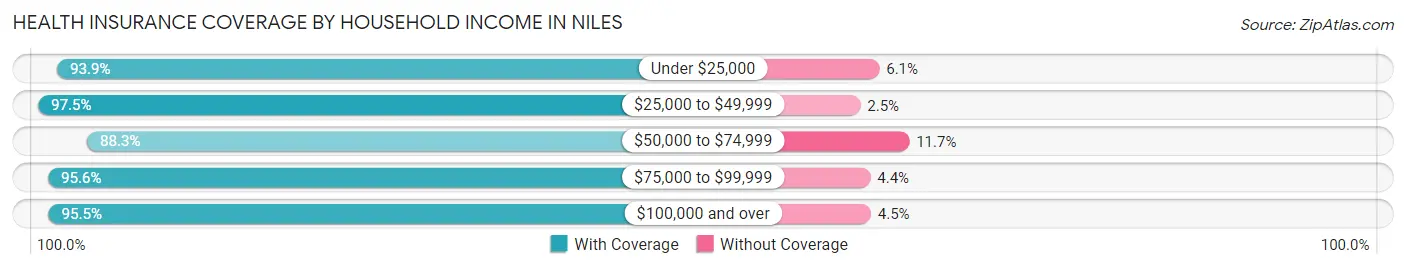
| Household Income | With Coverage | Without Coverage |
| Under $25,000 | 2,236 (93.9%) | 145 (6.1%) |
| $25,000 to $49,999 | 3,070 (97.5%) | 80 (2.5%) |
| $50,000 to $74,999 | 1,962 (88.3%) | 260 (11.7%) |
| $75,000 to $99,999 | 1,711 (95.6%) | 79 (4.4%) |
| $100,000 and over | 1,988 (95.5%) | 94 (4.5%) |
Public vs Private Health Insurance Coverage by Age in Niles
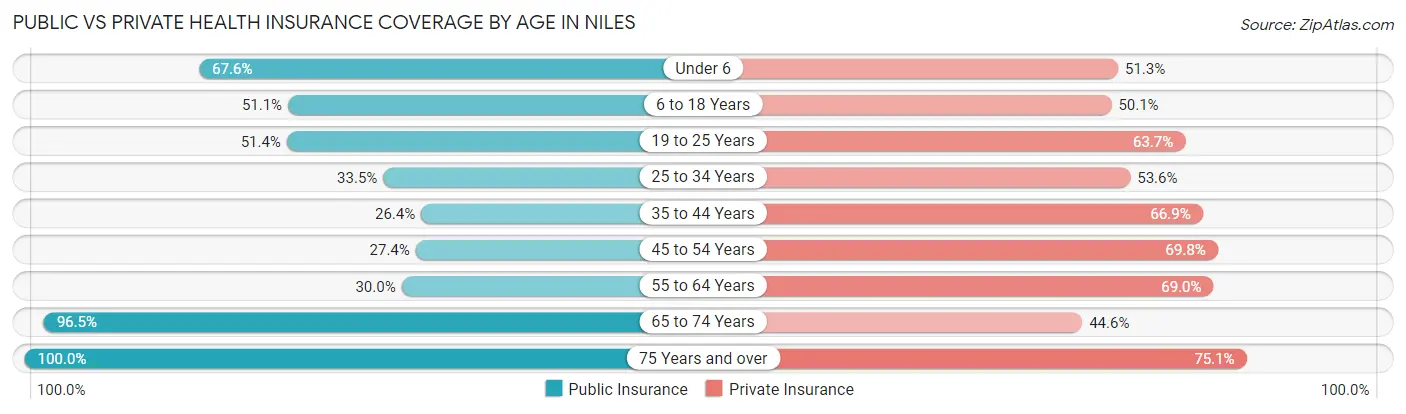
| Age Bracket | Public Insurance | Private Insurance |
| Under 6 | 451 (67.6%) | 342 (51.3%) |
| 6 to 18 Years | 1,047 (51.1%) | 1,025 (50.0%) |
| 19 to 25 Years | 628 (51.3%) | 779 (63.7%) |
| 25 to 34 Years | 481 (33.5%) | 770 (53.5%) |
| 35 to 44 Years | 422 (26.4%) | 1,069 (66.9%) |
| 45 to 54 Years | 331 (27.4%) | 842 (69.8%) |
| 55 to 64 Years | 419 (30.0%) | 962 (69.0%) |
| 65 to 74 Years | 1,059 (96.5%) | 490 (44.6%) |
| 75 Years and over | 1,016 (100.0%) | 763 (75.1%) |
| Total | 5,854 (50.1%) | 7,042 (60.2%) |
Disability Status by Sex by Age in Niles
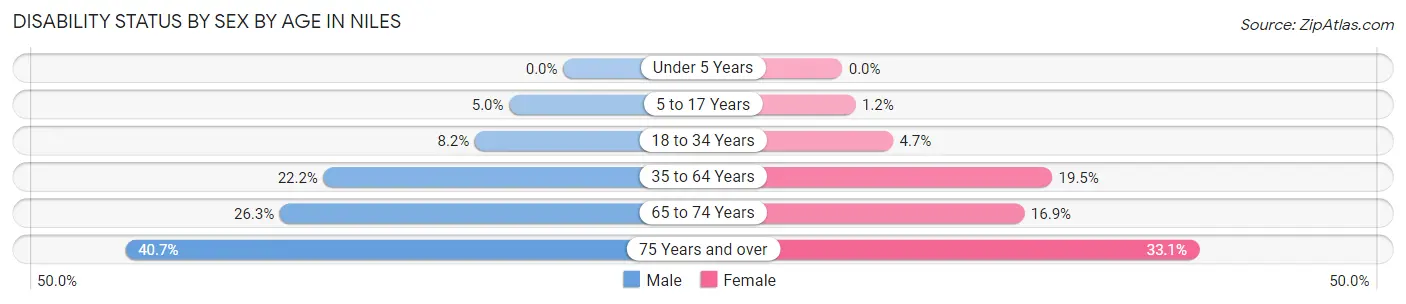
| Age Bracket | Male | Female |
| Under 5 Years | 0 (0.0%) | 0 (0.0%) |
| 5 to 17 Years | 49 (5.0%) | 11 (1.2%) |
| 18 to 34 Years | 121 (8.2%) | 67 (4.7%) |
| 35 to 64 Years | 461 (22.2%) | 414 (19.5%) |
| 65 to 74 Years | 102 (26.3%) | 120 (16.9%) |
| 75 Years and over | 148 (40.7%) | 216 (33.1%) |
Disability Class by Sex by Age in Niles
Disability Class: Hearing Difficulty
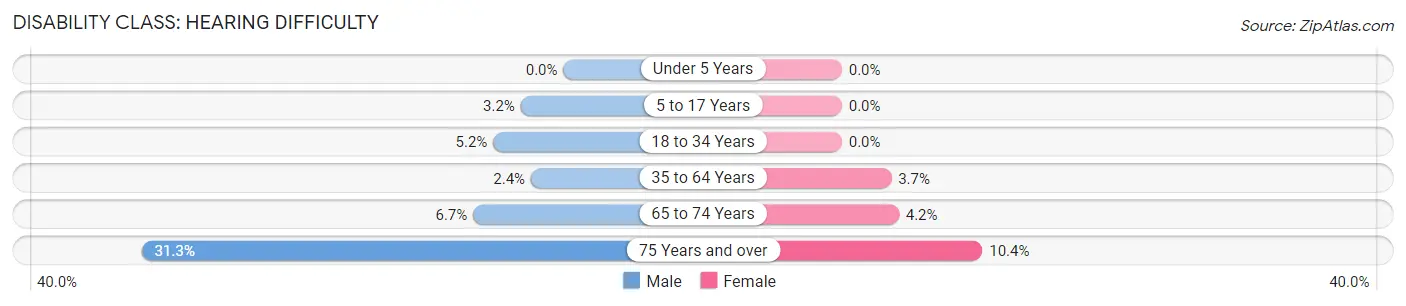
| Age Bracket | Male | Female |
| Under 5 Years | 0 (0.0%) | 0 (0.0%) |
| 5 to 17 Years | 31 (3.2%) | 0 (0.0%) |
| 18 to 34 Years | 77 (5.2%) | 0 (0.0%) |
| 35 to 64 Years | 50 (2.4%) | 78 (3.7%) |
| 65 to 74 Years | 26 (6.7%) | 30 (4.2%) |
| 75 Years and over | 114 (31.3%) | 68 (10.4%) |
Disability Class: Vision Difficulty
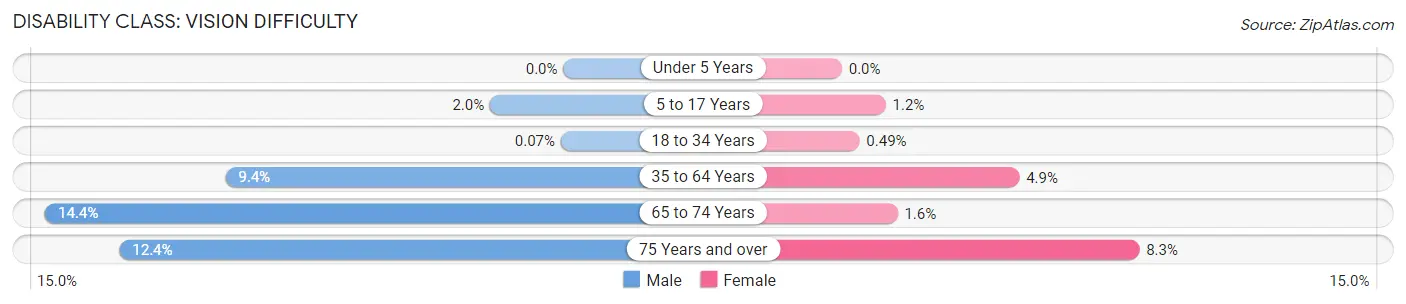
| Age Bracket | Male | Female |
| Under 5 Years | 0 (0.0%) | 0 (0.0%) |
| 5 to 17 Years | 20 (2.0%) | 11 (1.2%) |
| 18 to 34 Years | 1 (0.1%) | 7 (0.5%) |
| 35 to 64 Years | 195 (9.4%) | 105 (4.9%) |
| 65 to 74 Years | 56 (14.4%) | 11 (1.5%) |
| 75 Years and over | 45 (12.4%) | 54 (8.3%) |
Disability Class: Cognitive Difficulty
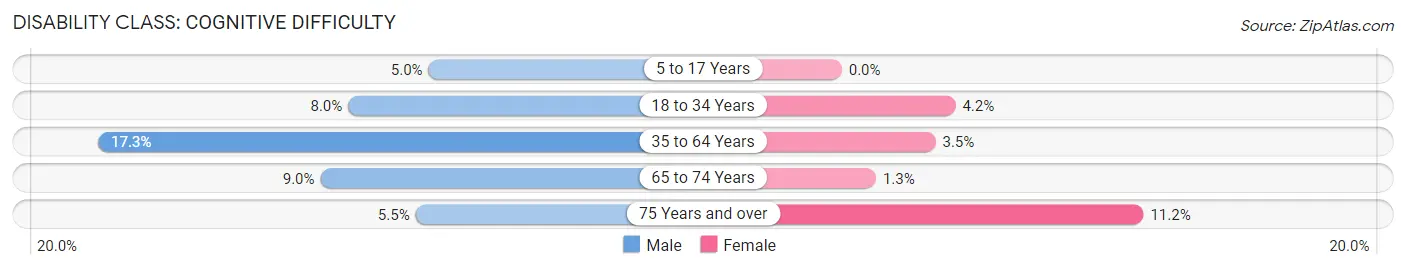
| Age Bracket | Male | Female |
| 5 to 17 Years | 49 (5.0%) | 0 (0.0%) |
| 18 to 34 Years | 118 (8.0%) | 60 (4.2%) |
| 35 to 64 Years | 358 (17.3%) | 74 (3.5%) |
| 65 to 74 Years | 35 (9.0%) | 9 (1.3%) |
| 75 Years and over | 20 (5.5%) | 73 (11.2%) |
Disability Class: Ambulatory Difficulty
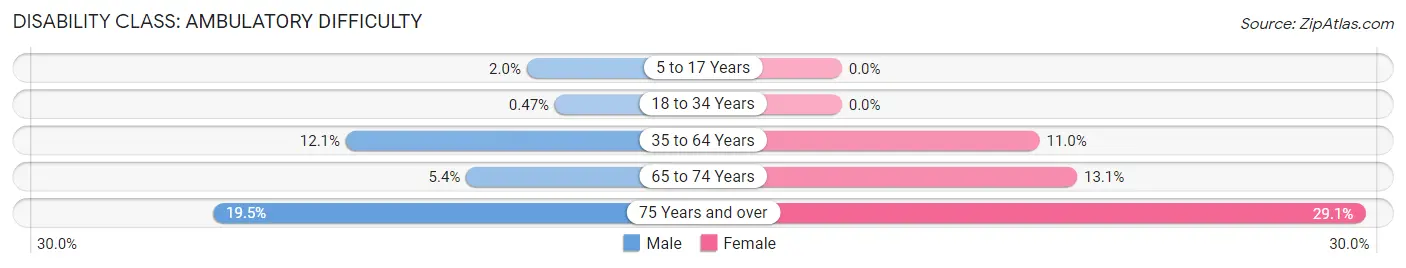
| Age Bracket | Male | Female |
| 5 to 17 Years | 20 (2.0%) | 0 (0.0%) |
| 18 to 34 Years | 7 (0.5%) | 0 (0.0%) |
| 35 to 64 Years | 251 (12.1%) | 234 (11.0%) |
| 65 to 74 Years | 21 (5.4%) | 93 (13.1%) |
| 75 Years and over | 71 (19.5%) | 190 (29.1%) |
Disability Class: Self-Care Difficulty
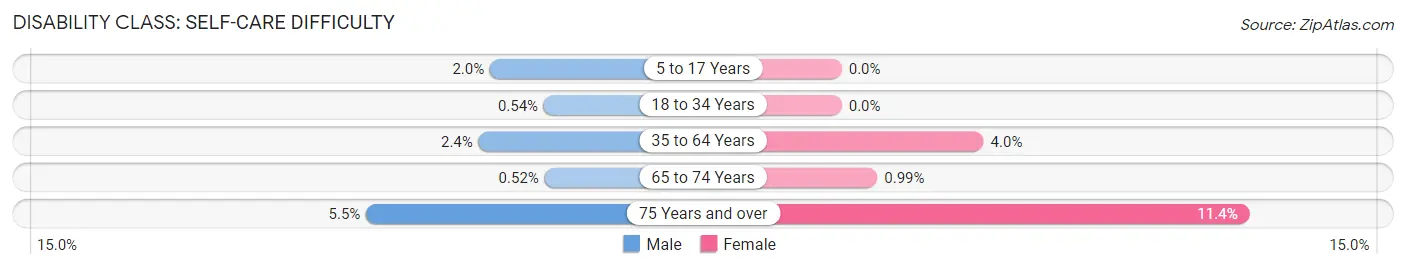
| Age Bracket | Male | Female |
| 5 to 17 Years | 20 (2.0%) | 0 (0.0%) |
| 18 to 34 Years | 8 (0.5%) | 0 (0.0%) |
| 35 to 64 Years | 49 (2.4%) | 84 (4.0%) |
| 65 to 74 Years | 2 (0.5%) | 7 (1.0%) |
| 75 Years and over | 20 (5.5%) | 74 (11.4%) |
Technology Access in Niles
Computing Device Access in Niles
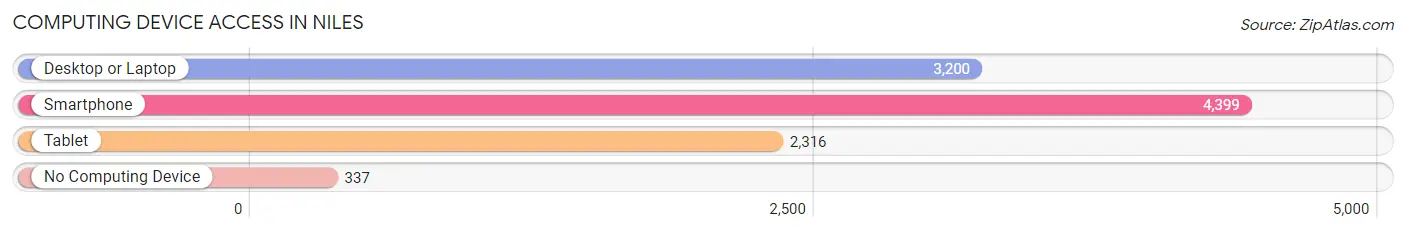
| Device Type | # Households | % Households |
| Desktop or Laptop | 3,200 | 62.9% |
| Smartphone | 4,399 | 86.4% |
| Tablet | 2,316 | 45.5% |
| No Computing Device | 337 | 6.6% |
| Total | 5,089 | 100.0% |
Internet Access in Niles
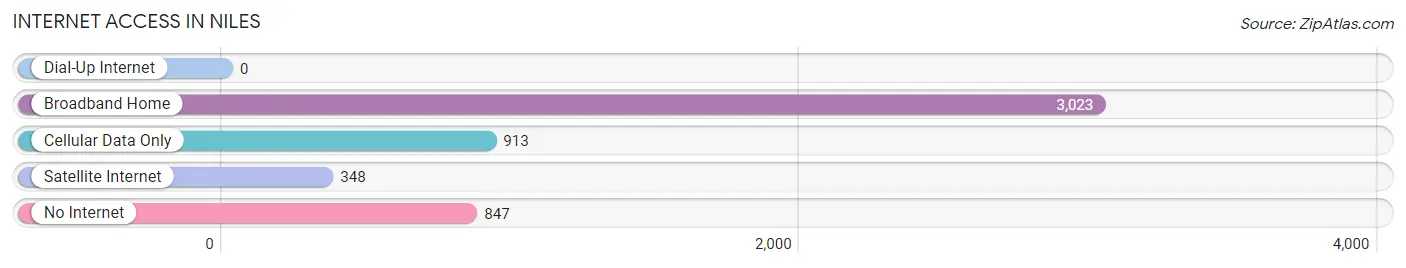
| Internet Type | # Households | % Households |
| Dial-Up Internet | 0 | 0.0% |
| Broadband Home | 3,023 | 59.4% |
| Cellular Data Only | 913 | 17.9% |
| Satellite Internet | 348 | 6.8% |
| No Internet | 847 | 16.6% |
| Total | 5,089 | 100.0% |
Niles Summary
Niles, Michigan is a city located in Berrien County, Michigan, United States. It is situated along the St. Joseph River, near the Michigan-Indiana border. The city is part of the Niles-Benton Harbor Metropolitan Statistical Area, which has a population of 156,813. As of the 2010 census, the city had a population of 11,600.
History
The area that is now Niles was first settled in 1827 by William Niles, a native of New York. He purchased land along the St. Joseph River and built a sawmill and gristmill. The settlement was initially known as Niles Mill, and was later renamed Niles. The city was incorporated in 1866.
In the late 19th century, Niles was a major center of industry, with several factories producing a variety of products, including stoves, furniture, and carriages. The city was also home to several foundries and machine shops.
Geography
Niles is located at 41°51'N 86°14'W (41.851, -86.233). According to the United States Census Bureau, the city has a total area of 5.2 square miles (13.4 km2), of which 5.1 square miles (13.2 km2) is land and 0.1 square miles (0.2 km2) is water.
Economy
Niles is home to several major employers, including Whirlpool Corporation, which has a large manufacturing facility in the city. Other major employers include Niles Community Schools, Niles-Benton Harbor Hospital, and the Niles-Benton Harbor Metropolitan Statistical Area.
Demographics
As of the 2010 census, there were 11,600 people, 4,717 households, and 2,945 families residing in the city. The population density was 2,269.2 people per square mile (876.7/km2). There were 5,093 housing units at an average density of 997.2 per square mile (385.2/km2). The racial makeup of the city was 79.2% White, 14.2% African American, 0.4% Native American, 0.7% Asian, 0.1% Pacific Islander, 2.7% from other races, and 2.7% from two or more races. Hispanic or Latino of any race were 6.3% of the population.
There were 4,717 households, out of which 28.2% had children under the age of 18 living with them, 41.2% were married couples living together, 15.7% had a female householder with no husband present, and 38.2% were non-families. 32.2% of all households were made up of individuals, and 13.2% had someone living alone who was 65 years of age or older. The average household size was 2.41 and the average family size was 3.03.
In the city, the population was spread out, with 24.2% under the age of 18, 8.7% from 18 to 24, 28.2% from 25 to 44, 22.3% from 45 to 64, and 16.6% who were 65 years of age or older. The median age was 37 years. For every 100 females, there were 91.2 males. For every 100 females age 18 and over, there were 87.2 males.
The median income for a household in the city was $33,917, and the median income for a family was $41,917. Males had a median income of $31,917 versus $22,917 for females. The per capita income for the city was $17,917. About 11.2% of families and 14.2% of the population were below the poverty line, including 19.2% of those under age 18 and 8.2% of those age 65 or over.
Common Questions
What is Per Capita Income in Niles?
Per Capita income in Niles is $24,313.
What is the Median Family Income in Niles?
Median Family Income in Niles is $55,618.
What is the Median Household income in Niles?
Median Household Income in Niles is $42,181.
What is Income or Wage Gap in Niles?
Income or Wage Gap in Niles is 33.5%.
Women in Niles earn 66.5 cents for every dollar earned by a man.
What is Family Income Deficit in Niles?
Family Income Deficit in Niles is $13,611.
Families that are below poverty line in Niles earn $13,611 less on average than the poverty threshold level.
What is Inequality or Gini Index in Niles?
Inequality or Gini Index in Niles is 0.43.
What is the Total Population of Niles?
Total Population of Niles is 11,871.
What is the Total Male Population of Niles?
Total Male Population of Niles is 5,664.
What is the Total Female Population of Niles?
Total Female Population of Niles is 6,207.
What is the Ratio of Males per 100 Females in Niles?
There are 91.25 Males per 100 Females in Niles.
What is the Ratio of Females per 100 Males in Niles?
There are 109.59 Females per 100 Males in Niles.
What is the Median Population Age in Niles?
Median Population Age in Niles is 38.5 Years.
What is the Average Family Size in Niles
Average Family Size in Niles is 3.0 People.
What is the Average Household Size in Niles
Average Household Size in Niles is 2.3 People.
How Large is the Labor Force in Niles?
There are 6,141 People in the Labor Forcein in Niles.
What is the Percentage of People in the Labor Force in Niles?
63.4% of People are in the Labor Force in Niles.
What is the Unemployment Rate in Niles?
Unemployment Rate in Niles is 12.1%.