Bloomington, IL Map & Demographics
Bloomington Map
Bloomington Overview
$42,286
PER CAPITA INCOME
$100,890
AVG FAMILY INCOME
$73,119
AVG HOUSEHOLD INCOME
31.0%
WAGE / INCOME GAP [ % ]
69.0¢/ $1
WAGE / INCOME GAP [ $ ]
$13,657
FAMILY INCOME DEFICIT
0.48
INEQUALITY / GINI INDEX
78,788
TOTAL POPULATION
39,151
MALE POPULATION
39,637
FEMALE POPULATION
98.77
MALES / 100 FEMALES
101.24
FEMALES / 100 MALES
35.9
MEDIAN AGE
3.0
AVG FAMILY SIZE
2.3
AVG HOUSEHOLD SIZE
40,897
LABOR FORCE [ PEOPLE ]
64.6%
PERCENT IN LABOR FORCE
3.3%
UNEMPLOYMENT RATE
Bloomington Area Codes
Income in Bloomington
Income Overview in Bloomington
Per Capita Income in Bloomington is $42,286, while median incomes of families and households are $100,890 and $73,119 respectively.
| Characteristic | Number | Measure |
| Per Capita Income | 78,788 | $42,286 |
| Median Family Income | 18,983 | $100,890 |
| Mean Family Income | 18,983 | $127,592 |
| Median Household Income | 33,885 | $73,119 |
| Mean Household Income | 33,885 | $97,190 |
| Income Deficit | 18,983 | $13,657 |
| Wage / Income Gap (%) | 78,788 | 31.03% |
| Wage / Income Gap ($) | 78,788 | 68.97¢ per $1 |
| Gini / Inequality Index | 78,788 | 0.48 |
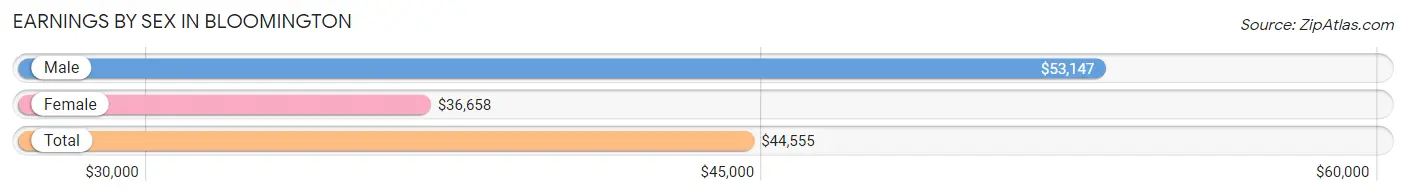
Earnings by Sex in Bloomington
Average Earnings in Bloomington are $44,555, $53,147 for men and $36,658 for women, a difference of 31.0%.
| Sex | Number | Average Earnings |
| Male | 22,794 (53.0%) | $53,147 |
| Female | 20,194 (47.0%) | $36,658 |
| Total | 42,988 (100.0%) | $44,555 |
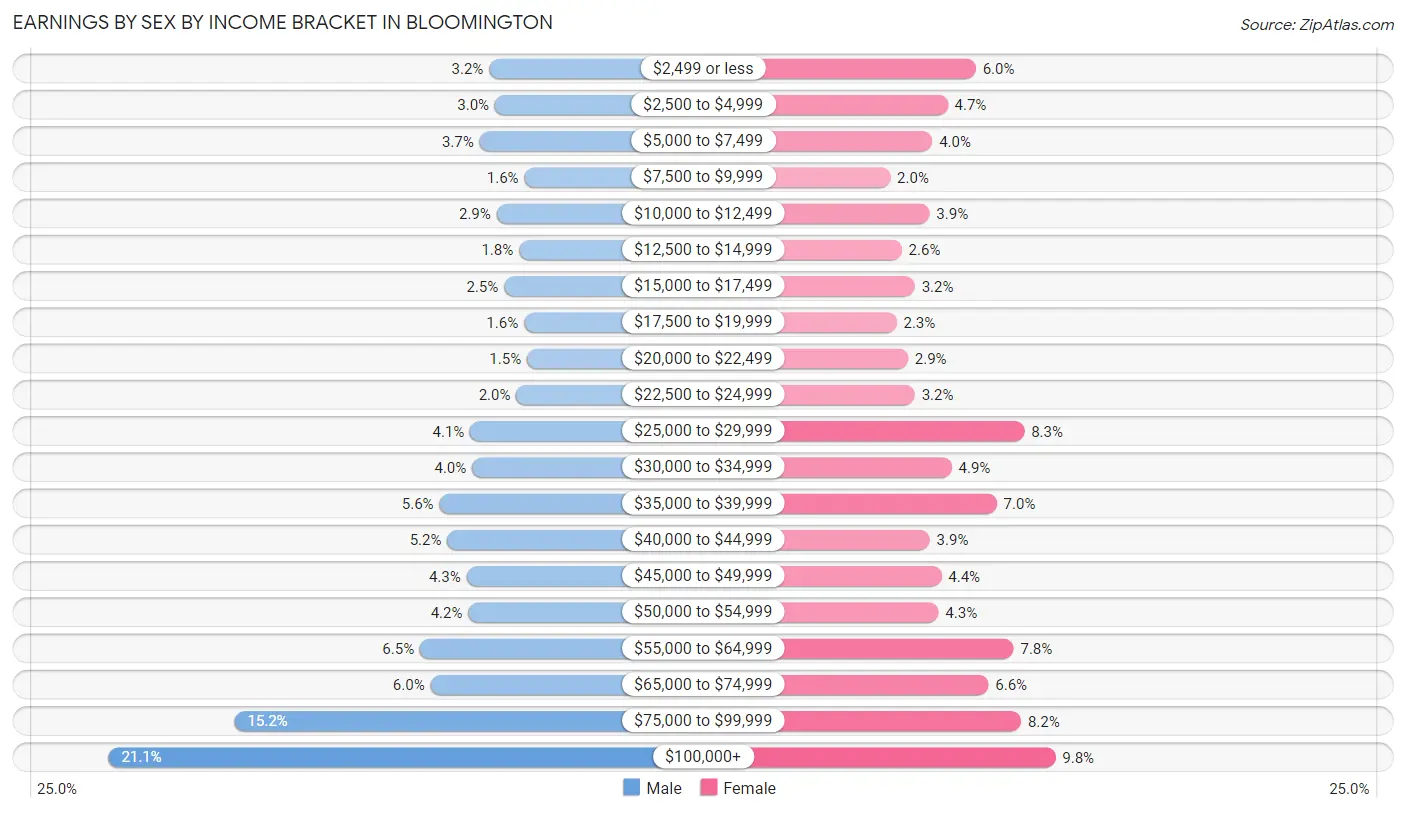
Earnings by Sex by Income Bracket in Bloomington
The most common earnings brackets in Bloomington are $100,000+ for men (4,802 | 21.1%) and $100,000+ for women (1,973 | 9.8%).
| Income | Male | Female |
| $2,499 or less | 738 (3.2%) | 1,219 (6.0%) |
| $2,500 to $4,999 | 677 (3.0%) | 954 (4.7%) |
| $5,000 to $7,499 | 842 (3.7%) | 808 (4.0%) |
| $7,500 to $9,999 | 362 (1.6%) | 409 (2.0%) |
| $10,000 to $12,499 | 658 (2.9%) | 782 (3.9%) |
| $12,500 to $14,999 | 420 (1.8%) | 519 (2.6%) |
| $15,000 to $17,499 | 580 (2.5%) | 643 (3.2%) |
| $17,500 to $19,999 | 367 (1.6%) | 471 (2.3%) |
| $20,000 to $22,499 | 335 (1.5%) | 577 (2.9%) |
| $22,500 to $24,999 | 450 (2.0%) | 643 (3.2%) |
| $25,000 to $29,999 | 942 (4.1%) | 1,678 (8.3%) |
| $30,000 to $34,999 | 922 (4.0%) | 992 (4.9%) |
| $35,000 to $39,999 | 1,270 (5.6%) | 1,418 (7.0%) |
| $40,000 to $44,999 | 1,186 (5.2%) | 784 (3.9%) |
| $45,000 to $49,999 | 980 (4.3%) | 895 (4.4%) |
| $50,000 to $54,999 | 963 (4.2%) | 867 (4.3%) |
| $55,000 to $64,999 | 1,478 (6.5%) | 1,577 (7.8%) |
| $65,000 to $74,999 | 1,365 (6.0%) | 1,338 (6.6%) |
| $75,000 to $99,999 | 3,457 (15.2%) | 1,647 (8.2%) |
| $100,000+ | 4,802 (21.1%) | 1,973 (9.8%) |
| Total | 22,794 (100.0%) | 20,194 (100.0%) |
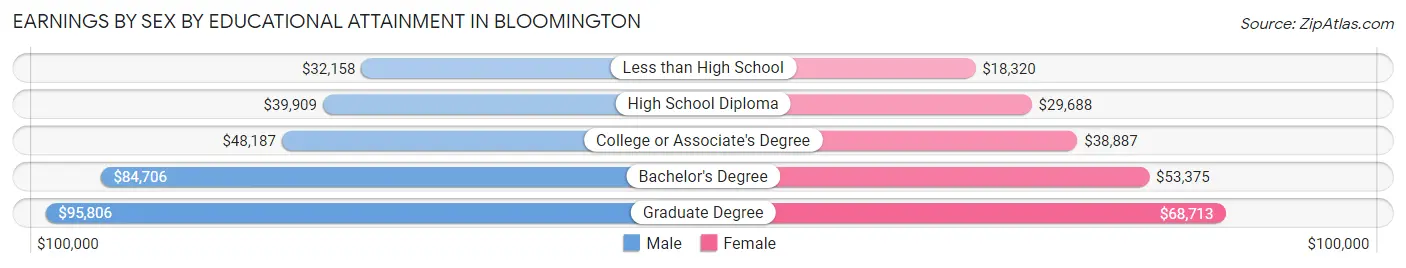
Earnings by Sex by Educational Attainment in Bloomington
Average earnings in Bloomington are $65,057 for men and $44,693 for women, a difference of 31.3%. Men with an educational attainment of graduate degree enjoy the highest average annual earnings of $95,806, while those with less than high school education earn the least with $32,158. Women with an educational attainment of graduate degree earn the most with the average annual earnings of $68,713, while those with less than high school education have the smallest earnings of $18,320.
| Educational Attainment | Male Income | Female Income |
| Less than High School | $32,158 | $18,320 |
| High School Diploma | $39,909 | $29,688 |
| College or Associate's Degree | $48,187 | $38,887 |
| Bachelor's Degree | $84,706 | $53,375 |
| Graduate Degree | $95,806 | $68,713 |
| Total | $65,057 | $44,693 |
Family Income in Bloomington
Family Income Brackets in Bloomington
According to the Bloomington family income data, there are 4,195 families falling into the $100,000 to $149,999 income range, which is the most common income bracket and makes up 22.1% of all families. Conversely, the $10,000 to $14,999 income bracket is the least frequent group with only 190 families (1.0%) belonging to this category.
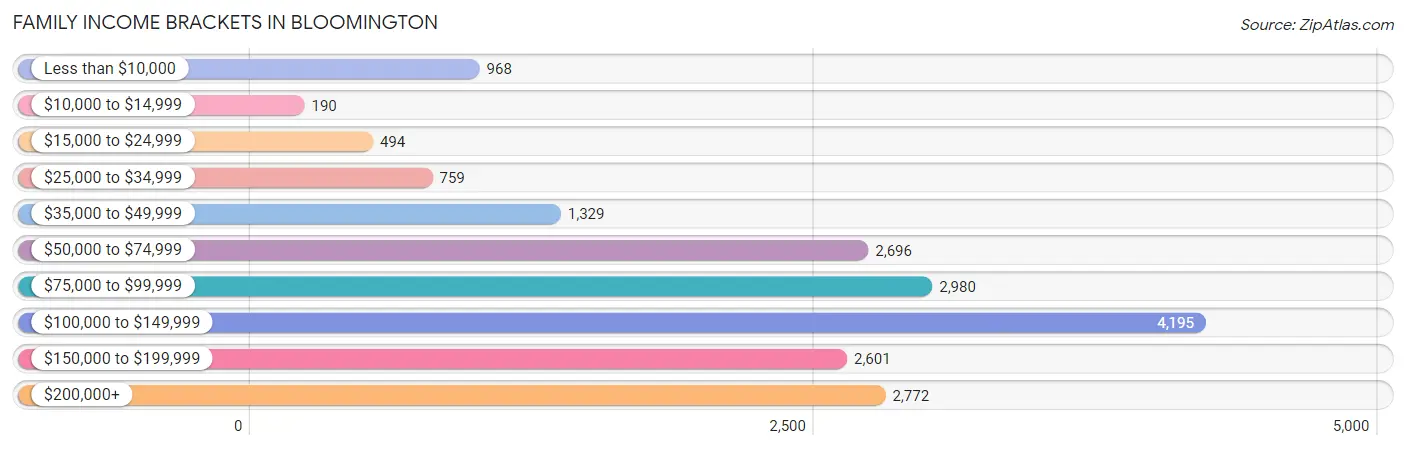
| Income Bracket | # Families | % Families |
| Less than $10,000 | 968 | 5.1% |
| $10,000 to $14,999 | 190 | 1.0% |
| $15,000 to $24,999 | 494 | 2.6% |
| $25,000 to $34,999 | 759 | 4.0% |
| $35,000 to $49,999 | 1,329 | 7.0% |
| $50,000 to $74,999 | 2,696 | 14.2% |
| $75,000 to $99,999 | 2,980 | 15.7% |
| $100,000 to $149,999 | 4,195 | 22.1% |
| $150,000 to $199,999 | 2,601 | 13.7% |
| $200,000+ | 2,772 | 14.6% |
Family Income by Famaliy Size in Bloomington
6-person families (524 | 2.8%) account for the highest median family income in Bloomington with $150,862 per family, while 2-person families (9,632 | 50.7%) have the highest median income of $46,620 per family member.
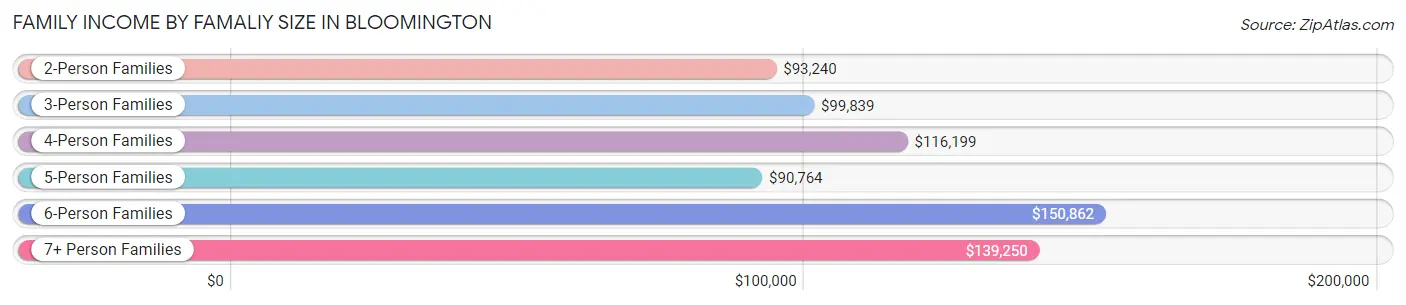
| Income Bracket | # Families | Median Income |
| 2-Person Families | 9,632 (50.7%) | $93,240 |
| 3-Person Families | 3,762 (19.8%) | $99,839 |
| 4-Person Families | 3,571 (18.8%) | $116,199 |
| 5-Person Families | 1,396 (7.3%) | $90,764 |
| 6-Person Families | 524 (2.8%) | $150,862 |
| 7+ Person Families | 98 (0.5%) | $139,250 |
| Total | 18,983 (100.0%) | $100,890 |
Family Income by Number of Earners in Bloomington
The median family income in Bloomington is $100,890, with families comprising 3+ earners (1,584) having the highest median family income of $170,796, while families with no earners (3,065) have the lowest median family income of $66,360, accounting for 8.3% and 16.2% of families, respectively.
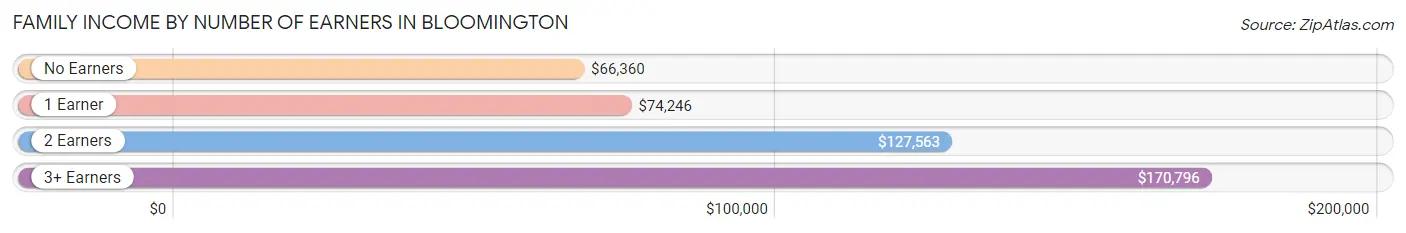
| Number of Earners | # Families | Median Income |
| No Earners | 3,065 (16.2%) | $66,360 |
| 1 Earner | 6,125 (32.3%) | $74,246 |
| 2 Earners | 8,209 (43.2%) | $127,563 |
| 3+ Earners | 1,584 (8.3%) | $170,796 |
| Total | 18,983 (100.0%) | $100,890 |
Household Income in Bloomington
Household Income Brackets in Bloomington
With 5,523 households falling in the category, the $100,000 to $149,999 income range is the most frequent in Bloomington, accounting for 16.3% of all households. In contrast, only 1,118 households (3.3%) fall into the $10,000 to $14,999 income bracket, making it the least populous group.
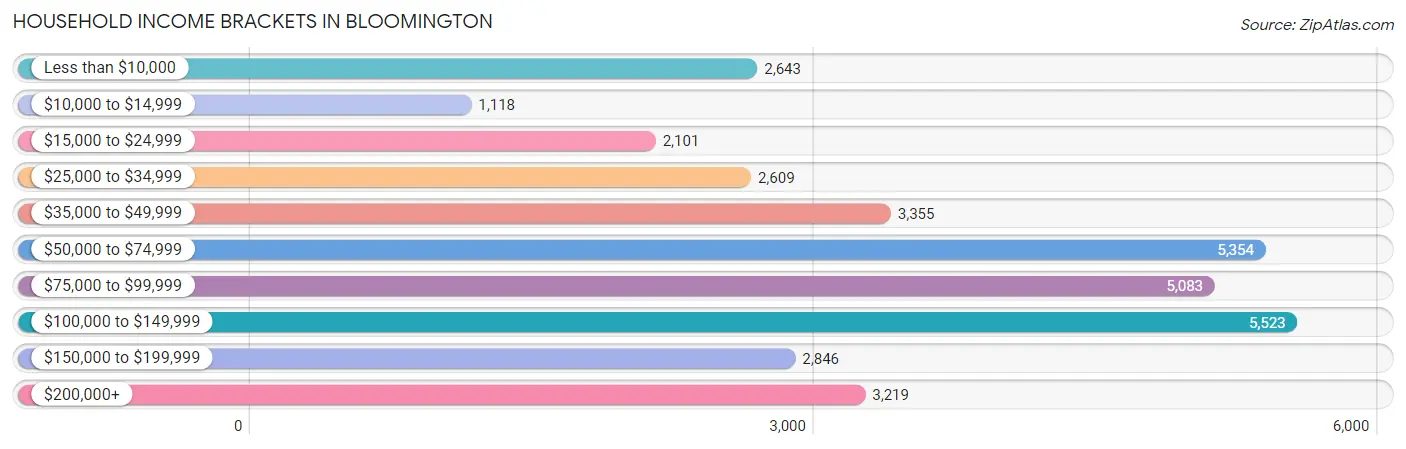
| Income Bracket | # Households | % Households |
| Less than $10,000 | 2,643 | 7.8% |
| $10,000 to $14,999 | 1,118 | 3.3% |
| $15,000 to $24,999 | 2,101 | 6.2% |
| $25,000 to $34,999 | 2,609 | 7.7% |
| $35,000 to $49,999 | 3,355 | 9.9% |
| $50,000 to $74,999 | 5,354 | 15.8% |
| $75,000 to $99,999 | 5,083 | 15.0% |
| $100,000 to $149,999 | 5,523 | 16.3% |
| $150,000 to $199,999 | 2,846 | 8.4% |
| $200,000+ | 3,219 | 9.5% |
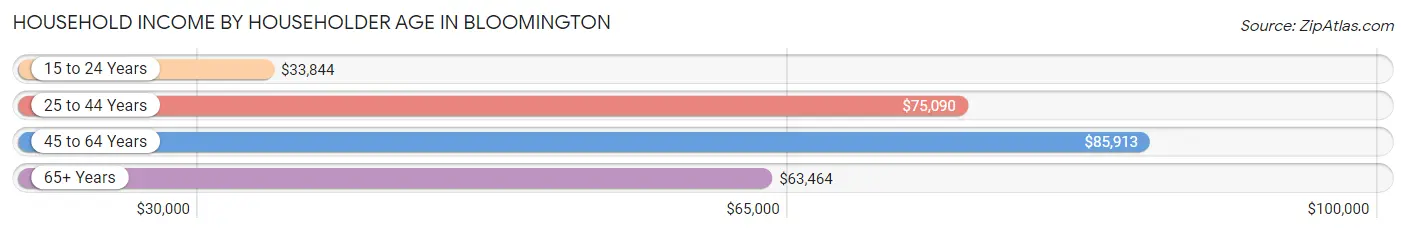
Household Income by Householder Age in Bloomington
The median household income in Bloomington is $73,119, with the highest median household income of $85,913 found in the 45 to 64 years age bracket for the primary householder. A total of 11,714 households (34.6%) fall into this category. Meanwhile, the 15 to 24 years age bracket for the primary householder has the lowest median household income of $33,844, with 2,338 households (6.9%) in this group.
| Income Bracket | # Households | Median Income |
| 15 to 24 Years | 2,338 (6.9%) | $33,844 |
| 25 to 44 Years | 12,690 (37.4%) | $75,090 |
| 45 to 64 Years | 11,714 (34.6%) | $85,913 |
| 65+ Years | 7,143 (21.1%) | $63,464 |
| Total | 33,885 (100.0%) | $73,119 |
Poverty in Bloomington
Income Below Poverty by Sex and Age in Bloomington
With 12.3% poverty level for males and 11.7% for females among the residents of Bloomington, 18 to 24 year old males and 18 to 24 year old females are the most vulnerable to poverty, with 975 males (22.5%) and 902 females (24.4%) in their respective age groups living below the poverty level.
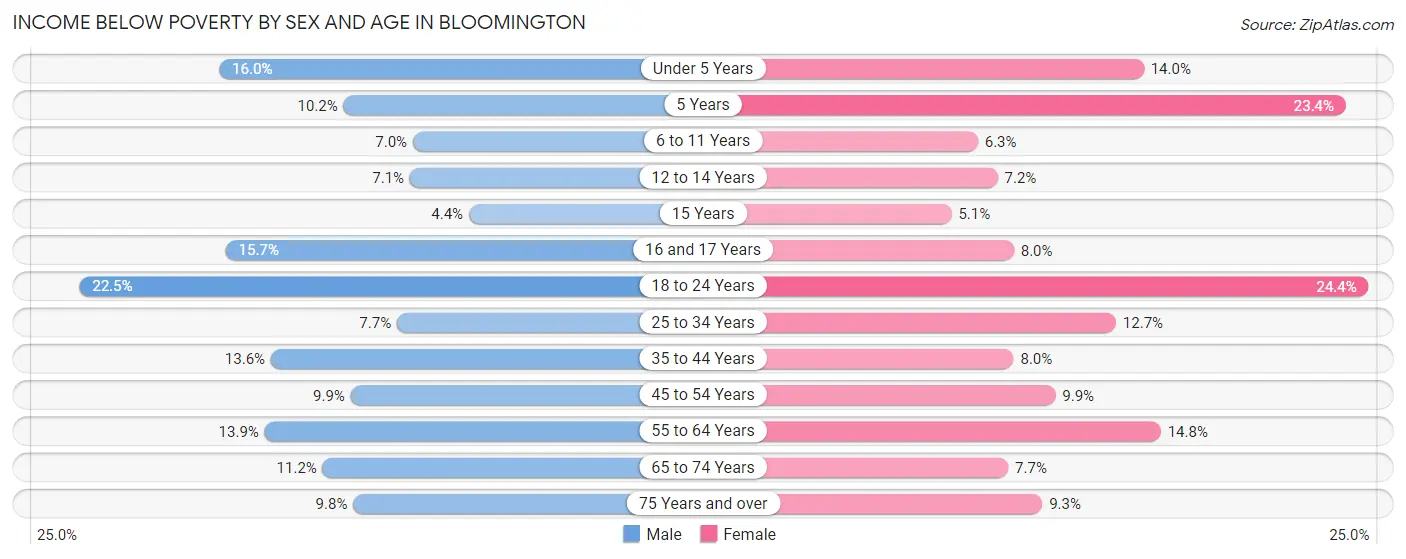
| Age Bracket | Male | Female |
| Under 5 Years | 425 (16.0%) | 308 (14.0%) |
| 5 Years | 35 (10.2%) | 105 (23.4%) |
| 6 to 11 Years | 177 (7.0%) | 169 (6.3%) |
| 12 to 14 Years | 108 (7.1%) | 124 (7.2%) |
| 15 Years | 21 (4.4%) | 31 (5.1%) |
| 16 and 17 Years | 157 (15.7%) | 69 (8.0%) |
| 18 to 24 Years | 975 (22.5%) | 902 (24.4%) |
| 25 to 34 Years | 456 (7.7%) | 712 (12.7%) |
| 35 to 44 Years | 775 (13.6%) | 393 (8.0%) |
| 45 to 54 Years | 461 (9.9%) | 474 (9.9%) |
| 55 to 64 Years | 611 (13.9%) | 733 (14.8%) |
| 65 to 74 Years | 345 (11.2%) | 285 (7.7%) |
| 75 Years and over | 149 (9.8%) | 219 (9.3%) |
| Total | 4,695 (12.3%) | 4,524 (11.7%) |
Income Above Poverty by Sex and Age in Bloomington
According to the poverty statistics in Bloomington, males aged 15 years and females aged 15 years are the age groups that are most secure financially, with 95.6% of males and 94.9% of females in these age groups living above the poverty line.
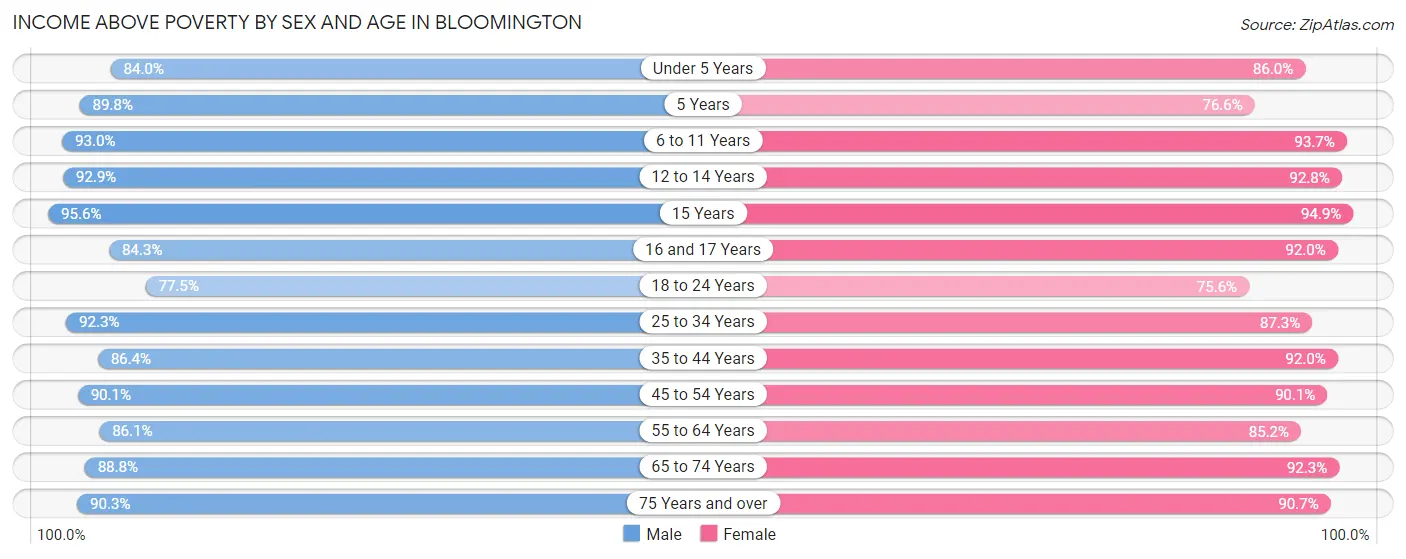
| Age Bracket | Male | Female |
| Under 5 Years | 2,236 (84.0%) | 1,890 (86.0%) |
| 5 Years | 308 (89.8%) | 344 (76.6%) |
| 6 to 11 Years | 2,360 (93.0%) | 2,509 (93.7%) |
| 12 to 14 Years | 1,409 (92.9%) | 1,591 (92.8%) |
| 15 Years | 459 (95.6%) | 578 (94.9%) |
| 16 and 17 Years | 845 (84.3%) | 796 (92.0%) |
| 18 to 24 Years | 3,366 (77.5%) | 2,788 (75.6%) |
| 25 to 34 Years | 5,447 (92.3%) | 4,884 (87.3%) |
| 35 to 44 Years | 4,938 (86.4%) | 4,535 (92.0%) |
| 45 to 54 Years | 4,208 (90.1%) | 4,311 (90.1%) |
| 55 to 64 Years | 3,797 (86.1%) | 4,219 (85.2%) |
| 65 to 74 Years | 2,745 (88.8%) | 3,406 (92.3%) |
| 75 Years and over | 1,379 (90.2%) | 2,137 (90.7%) |
| Total | 33,497 (87.7%) | 33,988 (88.2%) |
Income Below Poverty Among Married-Couple Families in Bloomington
The poverty statistics for married-couple families in Bloomington show that 4.2% or 617 of the total 14,656 families live below the poverty line. Families with no children have the highest poverty rate of 5.1%, comprising of 424 families. On the other hand, families with 1 or 2 children have the lowest poverty rate of 2.6%, which includes 136 families.
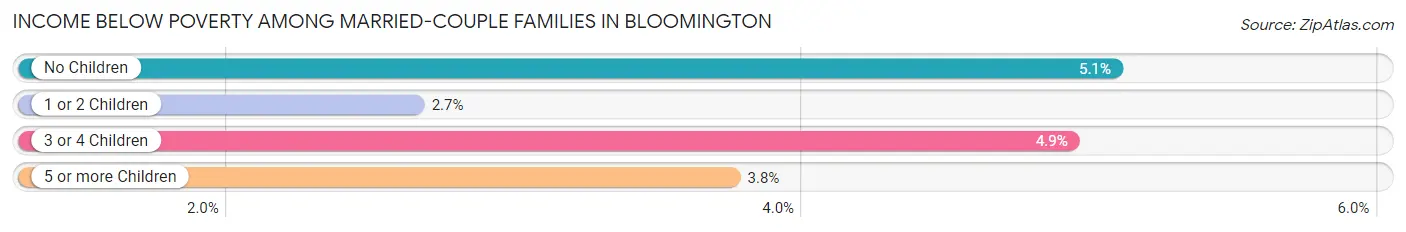
| Children | Above Poverty | Below Poverty |
| No Children | 7,927 (94.9%) | 424 (5.1%) |
| 1 or 2 Children | 4,993 (97.4%) | 136 (2.6%) |
| 3 or 4 Children | 1,042 (95.1%) | 54 (4.9%) |
| 5 or more Children | 77 (96.3%) | 3 (3.7%) |
| Total | 14,039 (95.8%) | 617 (4.2%) |
Income Below Poverty Among Single-Parent Households in Bloomington
According to the poverty data in Bloomington, 14.4% or 151 single-father households and 26.5% or 869 single-mother households are living below the poverty line. Among single-father households, those with no children have the highest poverty rate, with 145 households (30.5%) experiencing poverty. Likewise, among single-mother households, those with 5 or more children have the highest poverty rate, with 20 households (50.0%) falling below the poverty line.
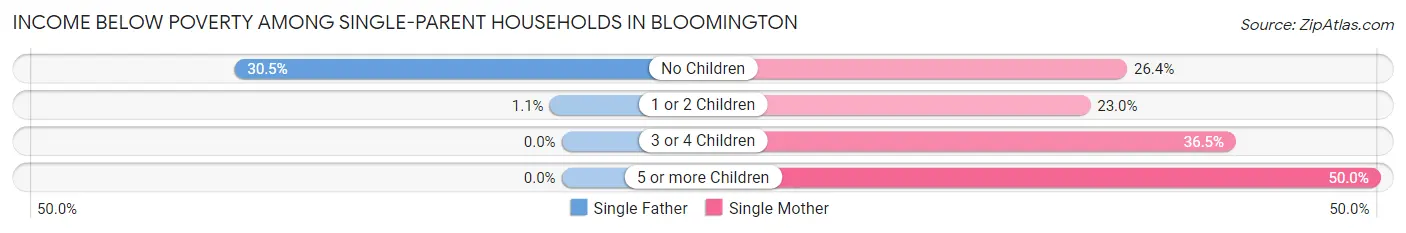
| Children | Single Father | Single Mother |
| No Children | 145 (30.5%) | 271 (26.4%) |
| 1 or 2 Children | 6 (1.1%) | 391 (23.0%) |
| 3 or 4 Children | 0 (0.0%) | 187 (36.5%) |
| 5 or more Children | 0 (0.0%) | 20 (50.0%) |
| Total | 151 (14.4%) | 869 (26.5%) |
Income Below Poverty Among Married-Couple vs Single-Parent Households in Bloomington
The poverty data for Bloomington shows that 617 of the married-couple family households (4.2%) and 1,020 of the single-parent households (23.6%) are living below the poverty level. Within the married-couple family households, those with no children have the highest poverty rate, with 424 households (5.1%) falling below the poverty line. Among the single-parent households, those with 5 or more children have the highest poverty rate, with 20 household (50.0%) living below poverty.
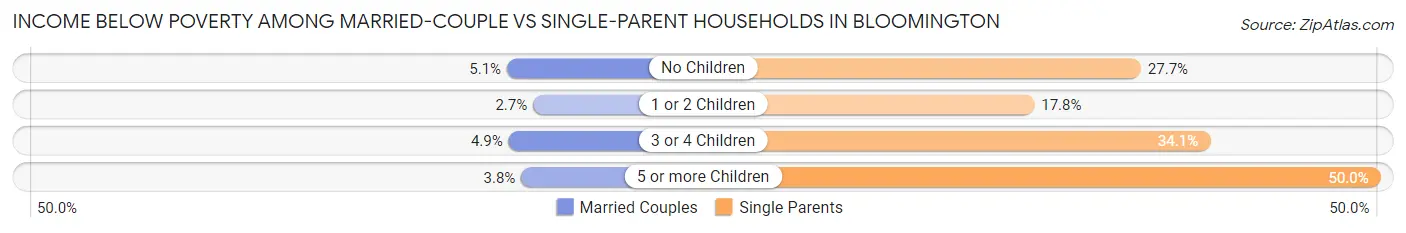
| Children | Married-Couple Families | Single-Parent Households |
| No Children | 424 (5.1%) | 416 (27.7%) |
| 1 or 2 Children | 136 (2.6%) | 397 (17.7%) |
| 3 or 4 Children | 54 (4.9%) | 187 (34.1%) |
| 5 or more Children | 3 (3.7%) | 20 (50.0%) |
| Total | 617 (4.2%) | 1,020 (23.6%) |
Race in Bloomington
The most populous races in Bloomington are White / Caucasian (59,402 | 75.4%), Black / African American (7,492 | 9.5%), and Asian (6,430 | 8.2%).
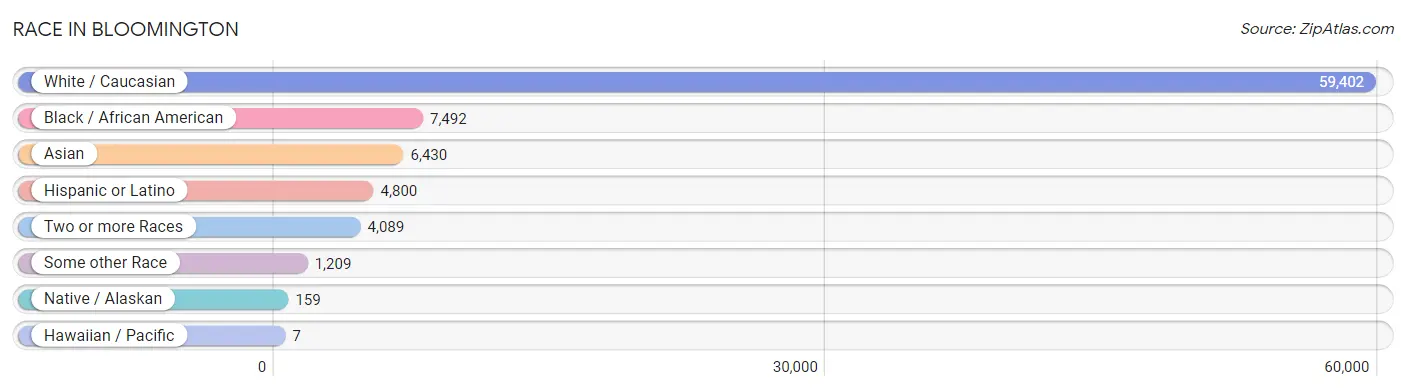
| Race | # Population | % Population |
| Asian | 6,430 | 8.2% |
| Black / African American | 7,492 | 9.5% |
| Hawaiian / Pacific | 7 | 0.0% |
| Hispanic or Latino | 4,800 | 6.1% |
| Native / Alaskan | 159 | 0.2% |
| White / Caucasian | 59,402 | 75.4% |
| Two or more Races | 4,089 | 5.2% |
| Some other Race | 1,209 | 1.5% |
| Total | 78,788 | 100.0% |
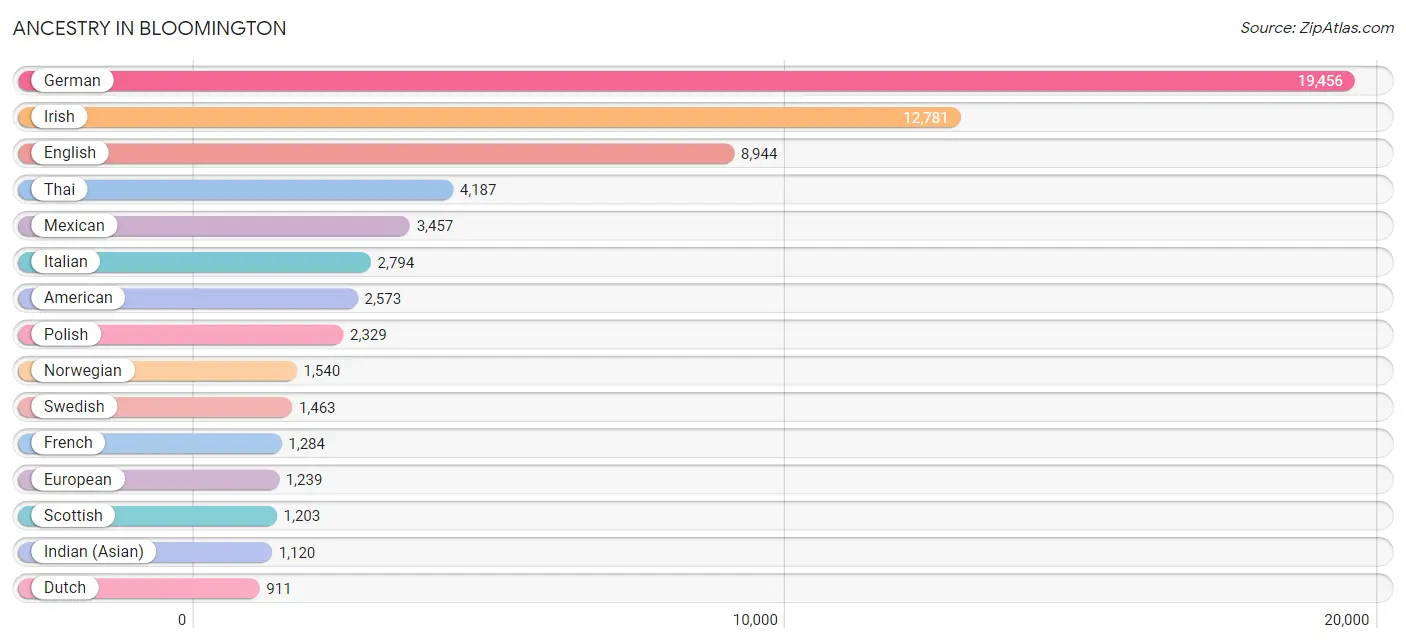
Ancestry in Bloomington
The most populous ancestries reported in Bloomington are German (19,456 | 24.7%), Irish (12,781 | 16.2%), English (8,944 | 11.4%), Thai (4,187 | 5.3%), and Mexican (3,457 | 4.4%), together accounting for 62.0% of all Bloomington residents.
| Ancestry | # Population | % Population |
| African | 243 | 0.3% |
| Albanian | 13 | 0.0% |
| American | 2,573 | 3.3% |
| Arab | 517 | 0.7% |
| Argentinean | 13 | 0.0% |
| Australian | 13 | 0.0% |
| Austrian | 152 | 0.2% |
| Belgian | 123 | 0.2% |
| Belizean | 17 | 0.0% |
| Bhutanese | 278 | 0.4% |
| Blackfeet | 76 | 0.1% |
| Bolivian | 20 | 0.0% |
| Brazilian | 12 | 0.0% |
| British | 260 | 0.3% |
| Burmese | 310 | 0.4% |
| Cajun | 17 | 0.0% |
| Canadian | 87 | 0.1% |
| Cape Verdean | 12 | 0.0% |
| Celtic | 17 | 0.0% |
| Central American | 241 | 0.3% |
| Central American Indian | 56 | 0.1% |
| Cherokee | 133 | 0.2% |
| Cheyenne | 7 | 0.0% |
| Choctaw | 4 | 0.0% |
| Colombian | 52 | 0.1% |
| Costa Rican | 57 | 0.1% |
| Croatian | 104 | 0.1% |
| Cuban | 140 | 0.2% |
| Czech | 291 | 0.4% |
| Czechoslovakian | 42 | 0.1% |
| Danish | 457 | 0.6% |
| Dominican | 20 | 0.0% |
| Dutch | 911 | 1.2% |
| Eastern European | 163 | 0.2% |
| Ecuadorian | 9 | 0.0% |
| Egyptian | 28 | 0.0% |
| English | 8,944 | 11.4% |
| Estonian | 20 | 0.0% |
| European | 1,239 | 1.6% |
| Filipino | 39 | 0.1% |
| Finnish | 14 | 0.0% |
| French | 1,284 | 1.6% |
| French Canadian | 187 | 0.2% |
| German | 19,456 | 24.7% |
| German Russian | 16 | 0.0% |
| Greek | 200 | 0.3% |
| Guatemalan | 59 | 0.1% |
| Guyanese | 35 | 0.0% |
| Haitian | 12 | 0.0% |
| Honduran | 64 | 0.1% |
| Hungarian | 327 | 0.4% |
| Indian (Asian) | 1,120 | 1.4% |
| Indonesian | 308 | 0.4% |
| Inupiat | 3 | 0.0% |
| Iranian | 52 | 0.1% |
| Irish | 12,781 | 16.2% |
| Iroquois | 17 | 0.0% |
| Italian | 2,794 | 3.5% |
| Jamaican | 138 | 0.2% |
| Jordanian | 72 | 0.1% |
| Kenyan | 1 | 0.0% |
| Korean | 551 | 0.7% |
| Laotian | 27 | 0.0% |
| Latvian | 15 | 0.0% |
| Lebanese | 94 | 0.1% |
| Lithuanian | 158 | 0.2% |
| Luxembourger | 34 | 0.0% |
| Macedonian | 5 | 0.0% |
| Malaysian | 26 | 0.0% |
| Mexican | 3,457 | 4.4% |
| Mexican American Indian | 8 | 0.0% |
| Moroccan | 64 | 0.1% |
| Native Hawaiian | 63 | 0.1% |
| Navajo | 9 | 0.0% |
| Nigerian | 115 | 0.2% |
| Northern European | 171 | 0.2% |
| Norwegian | 1,540 | 1.9% |
| Pakistani | 30 | 0.0% |
| Pennsylvania German | 4 | 0.0% |
| Peruvian | 29 | 0.0% |
| Polish | 2,329 | 3.0% |
| Portuguese | 66 | 0.1% |
| Puerto Rican | 283 | 0.4% |
| Romanian | 28 | 0.0% |
| Russian | 812 | 1.0% |
| Salvadoran | 61 | 0.1% |
| Scandinavian | 186 | 0.2% |
| Scotch-Irish | 621 | 0.8% |
| Scottish | 1,203 | 1.5% |
| Senegalese | 15 | 0.0% |
| Serbian | 31 | 0.0% |
| Sioux | 15 | 0.0% |
| Slavic | 17 | 0.0% |
| Slovak | 100 | 0.1% |
| Slovene | 38 | 0.1% |
| South American | 332 | 0.4% |
| Spaniard | 42 | 0.1% |
| Spanish | 3 | 0.0% |
| Spanish American | 10 | 0.0% |
| Sri Lankan | 328 | 0.4% |
| Subsaharan African | 745 | 0.9% |
| Swedish | 1,463 | 1.9% |
| Swiss | 152 | 0.2% |
| Thai | 4,187 | 5.3% |
| Tongan | 16 | 0.0% |
| Trinidadian and Tobagonian | 2 | 0.0% |
| Turkish | 123 | 0.2% |
| Ukrainian | 98 | 0.1% |
| Venezuelan | 209 | 0.3% |
| Welsh | 505 | 0.6% |
| West Indian | 12 | 0.0% |
| Yugoslavian | 50 | 0.1% | View All 112 Rows |
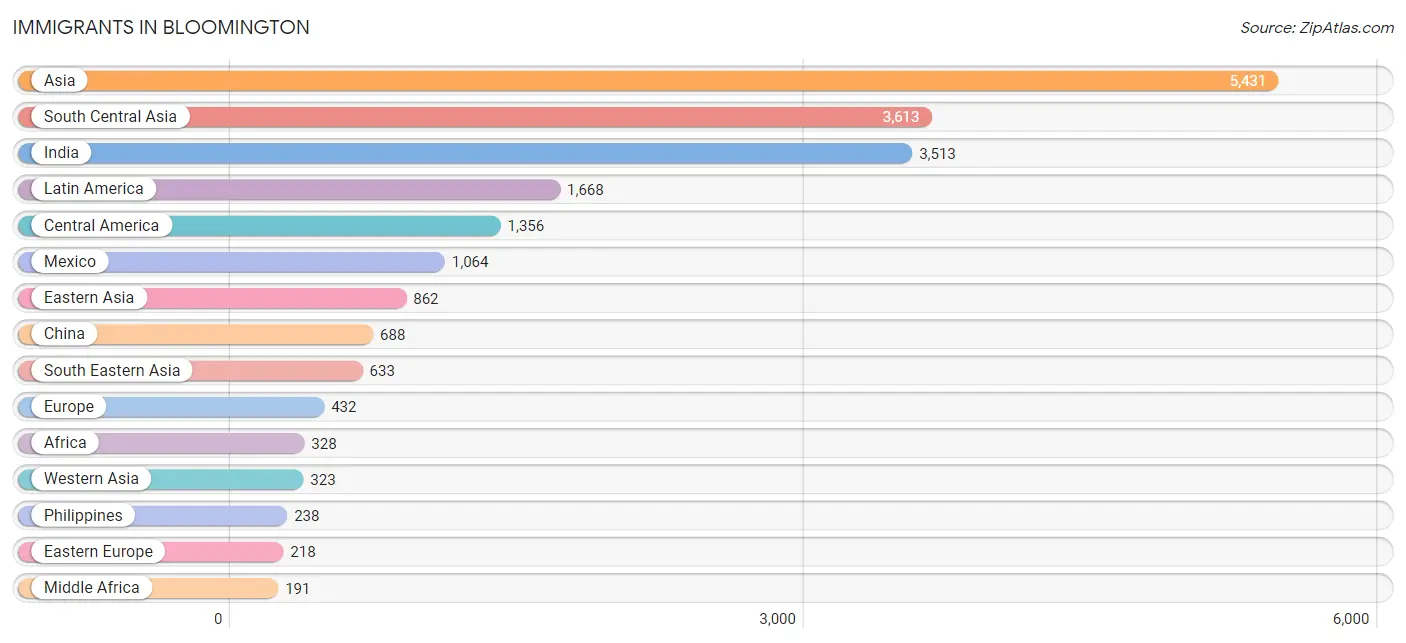
Immigrants in Bloomington
The most numerous immigrant groups reported in Bloomington came from Asia (5,431 | 6.9%), South Central Asia (3,613 | 4.6%), India (3,513 | 4.5%), Latin America (1,668 | 2.1%), and Central America (1,356 | 1.7%), together accounting for 19.8% of all Bloomington residents.
| Immigration Origin | # Population | % Population |
| Africa | 328 | 0.4% |
| Albania | 13 | 0.0% |
| Argentina | 13 | 0.0% |
| Asia | 5,431 | 6.9% |
| Australia | 13 | 0.0% |
| Austria | 4 | 0.0% |
| Belize | 17 | 0.0% |
| Bolivia | 20 | 0.0% |
| Brazil | 12 | 0.0% |
| Cameroon | 39 | 0.1% |
| Canada | 100 | 0.1% |
| Caribbean | 168 | 0.2% |
| Central America | 1,356 | 1.7% |
| Chile | 12 | 0.0% |
| China | 688 | 0.9% |
| Colombia | 33 | 0.0% |
| Congo | 106 | 0.1% |
| Costa Rica | 19 | 0.0% |
| Eastern Africa | 9 | 0.0% |
| Eastern Asia | 862 | 1.1% |
| Eastern Europe | 218 | 0.3% |
| Egypt | 14 | 0.0% |
| El Salvador | 21 | 0.0% |
| England | 54 | 0.1% |
| Europe | 432 | 0.5% |
| Germany | 72 | 0.1% |
| Guatemala | 177 | 0.2% |
| Guyana | 35 | 0.0% |
| Honduras | 58 | 0.1% |
| India | 3,513 | 4.5% |
| Iran | 10 | 0.0% |
| Italy | 9 | 0.0% |
| Jamaica | 105 | 0.1% |
| Japan | 37 | 0.1% |
| Jordan | 56 | 0.1% |
| Kazakhstan | 16 | 0.0% |
| Kenya | 1 | 0.0% |
| Korea | 137 | 0.2% |
| Kuwait | 153 | 0.2% |
| Latin America | 1,668 | 2.1% |
| Lithuania | 33 | 0.0% |
| Malaysia | 63 | 0.1% |
| Mexico | 1,064 | 1.3% |
| Middle Africa | 191 | 0.2% |
| Netherlands | 8 | 0.0% |
| Nigeria | 72 | 0.1% |
| Northern Africa | 14 | 0.0% |
| Northern Europe | 70 | 0.1% |
| Oceania | 13 | 0.0% |
| Pakistan | 74 | 0.1% |
| Peru | 19 | 0.0% |
| Philippines | 238 | 0.3% |
| Poland | 97 | 0.1% |
| Portugal | 41 | 0.1% |
| Russia | 38 | 0.1% |
| Saudi Arabia | 36 | 0.1% |
| Scotland | 6 | 0.0% |
| Senegal | 15 | 0.0% |
| South Africa | 27 | 0.0% |
| South America | 144 | 0.2% |
| South Central Asia | 3,613 | 4.6% |
| South Eastern Asia | 633 | 0.8% |
| Southern Europe | 60 | 0.1% |
| Spain | 10 | 0.0% |
| Taiwan | 15 | 0.0% |
| Thailand | 8 | 0.0% |
| Trinidad and Tobago | 53 | 0.1% |
| Turkey | 74 | 0.1% |
| Vietnam | 132 | 0.2% |
| Western Africa | 87 | 0.1% |
| Western Asia | 323 | 0.4% |
| Western Europe | 84 | 0.1% |
| Zaire | 46 | 0.1% | View All 73 Rows |
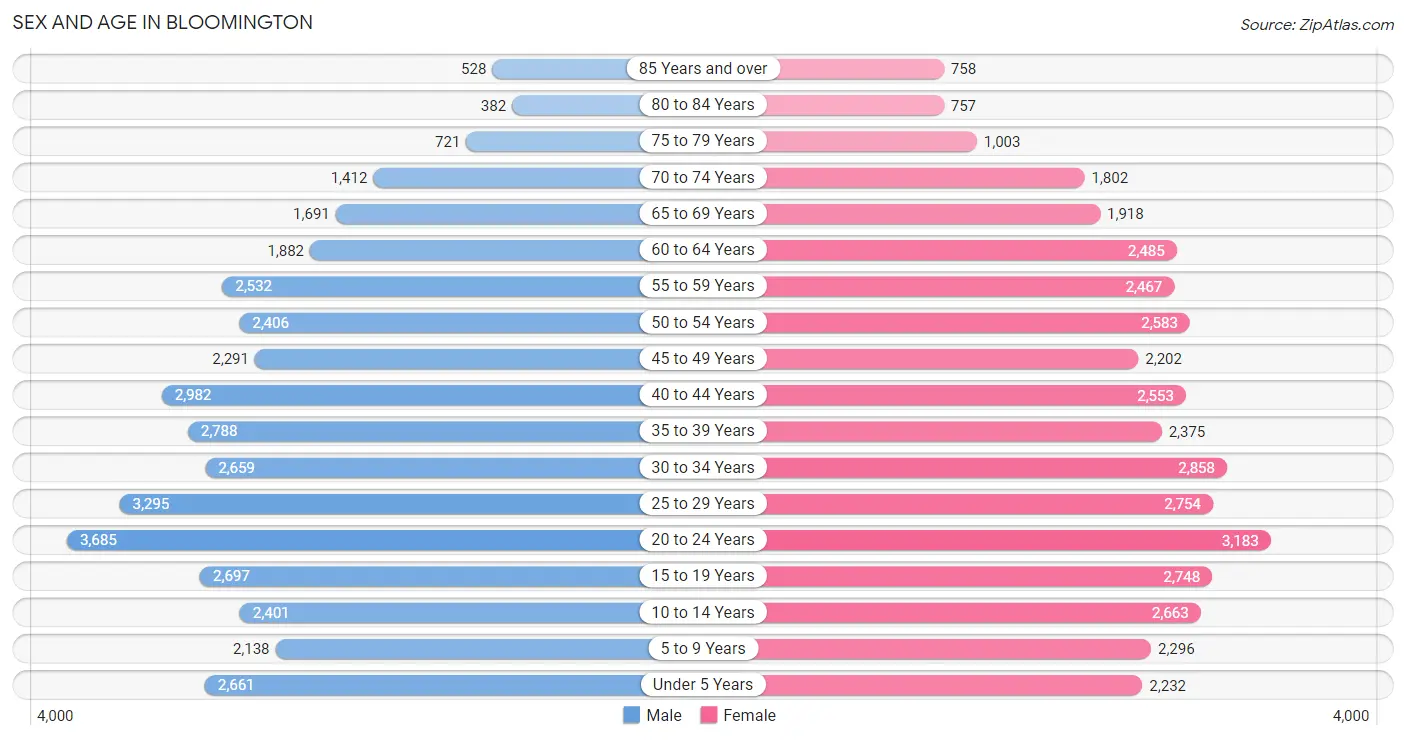
Sex and Age in Bloomington
Sex and Age in Bloomington
The most populous age groups in Bloomington are 20 to 24 Years (3,685 | 9.4%) for men and 20 to 24 Years (3,183 | 8.0%) for women.
| Age Bracket | Male | Female |
| Under 5 Years | 2,661 (6.8%) | 2,232 (5.6%) |
| 5 to 9 Years | 2,138 (5.5%) | 2,296 (5.8%) |
| 10 to 14 Years | 2,401 (6.1%) | 2,663 (6.7%) |
| 15 to 19 Years | 2,697 (6.9%) | 2,748 (6.9%) |
| 20 to 24 Years | 3,685 (9.4%) | 3,183 (8.0%) |
| 25 to 29 Years | 3,295 (8.4%) | 2,754 (7.0%) |
| 30 to 34 Years | 2,659 (6.8%) | 2,858 (7.2%) |
| 35 to 39 Years | 2,788 (7.1%) | 2,375 (6.0%) |
| 40 to 44 Years | 2,982 (7.6%) | 2,553 (6.4%) |
| 45 to 49 Years | 2,291 (5.9%) | 2,202 (5.6%) |
| 50 to 54 Years | 2,406 (6.1%) | 2,583 (6.5%) |
| 55 to 59 Years | 2,532 (6.5%) | 2,467 (6.2%) |
| 60 to 64 Years | 1,882 (4.8%) | 2,485 (6.3%) |
| 65 to 69 Years | 1,691 (4.3%) | 1,918 (4.8%) |
| 70 to 74 Years | 1,412 (3.6%) | 1,802 (4.5%) |
| 75 to 79 Years | 721 (1.8%) | 1,003 (2.5%) |
| 80 to 84 Years | 382 (1.0%) | 757 (1.9%) |
| 85 Years and over | 528 (1.3%) | 758 (1.9%) |
| Total | 39,151 (100.0%) | 39,637 (100.0%) |
Families and Households in Bloomington
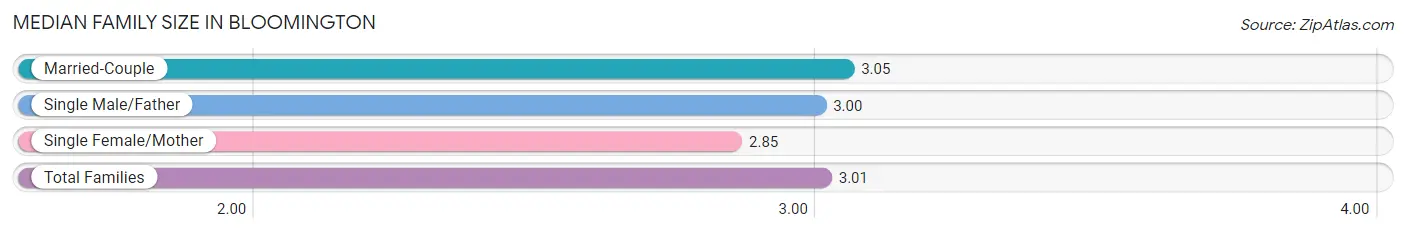
Median Family Size in Bloomington
The median family size in Bloomington is 3.01 persons per family, with married-couple families (14,656 | 77.2%) accounting for the largest median family size of 3.05 persons per family. On the other hand, single female/mother families (3,281 | 17.3%) represent the smallest median family size with 2.85 persons per family.
| Family Type | # Families | Family Size |
| Married-Couple | 14,656 (77.2%) | 3.05 |
| Single Male/Father | 1,046 (5.5%) | 3.00 |
| Single Female/Mother | 3,281 (17.3%) | 2.85 |
| Total Families | 18,983 (100.0%) | 3.01 |
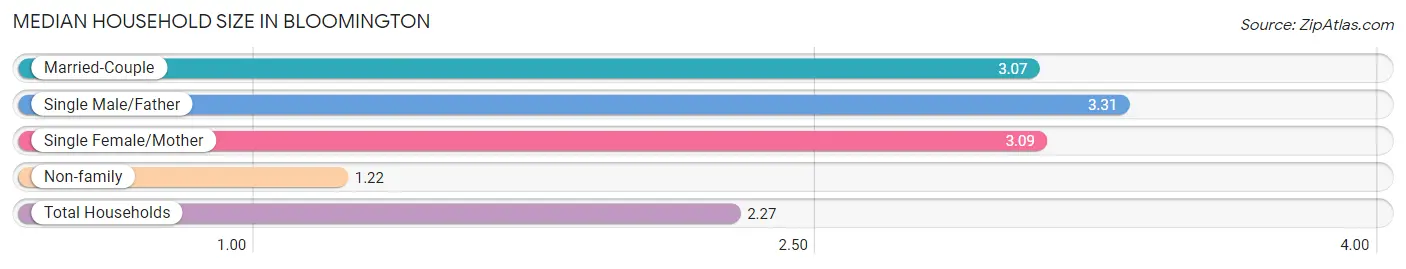
Median Household Size in Bloomington
The median household size in Bloomington is 2.27 persons per household, with single male/father households (1,046 | 3.1%) accounting for the largest median household size of 3.31 persons per household. non-family households (14,902 | 44.0%) represent the smallest median household size with 1.22 persons per household.
| Household Type | # Households | Household Size |
| Married-Couple | 14,656 (43.2%) | 3.07 |
| Single Male/Father | 1,046 (3.1%) | 3.31 |
| Single Female/Mother | 3,281 (9.7%) | 3.09 |
| Non-family | 14,902 (44.0%) | 1.22 |
| Total Households | 33,885 (100.0%) | 2.27 |
Household Size by Marriage Status in Bloomington
Out of a total of 33,885 households in Bloomington, 18,983 (56.0%) are family households, while 14,902 (44.0%) are nonfamily households. The most numerous type of family households are 2-person households, comprising 9,018, and the most common type of nonfamily households are 1-person households, comprising 12,357.
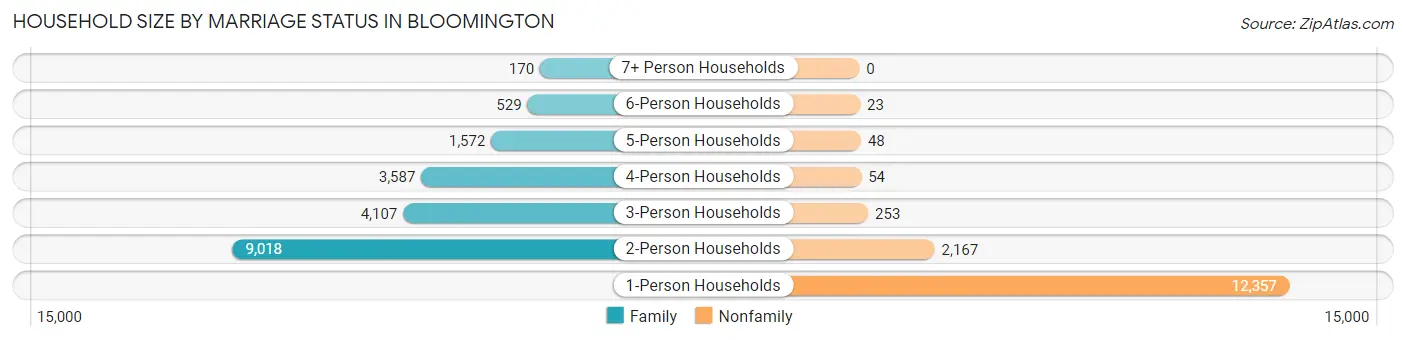
| Household Size | Family Households | Nonfamily Households |
| 1-Person Households | - | 12,357 (36.5%) |
| 2-Person Households | 9,018 (26.6%) | 2,167 (6.4%) |
| 3-Person Households | 4,107 (12.1%) | 253 (0.7%) |
| 4-Person Households | 3,587 (10.6%) | 54 (0.2%) |
| 5-Person Households | 1,572 (4.6%) | 48 (0.1%) |
| 6-Person Households | 529 (1.6%) | 23 (0.1%) |
| 7+ Person Households | 170 (0.5%) | 0 (0.0%) |
| Total | 18,983 (56.0%) | 14,902 (44.0%) |
Female Fertility in Bloomington
Fertility by Age in Bloomington
Average fertility rate in Bloomington is 62.0 births per 1,000 women. Women in the age bracket of 20 to 34 years have the highest fertility rate with 104.0 births per 1,000 women. Women in the age bracket of 20 to 34 years acount for 77.1% of all women with births.
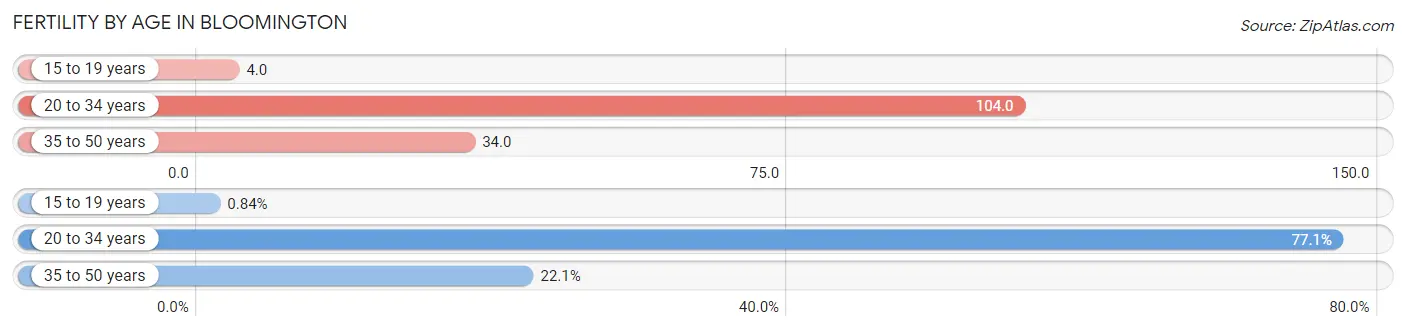
| Age Bracket | Women with Births | Births / 1,000 Women |
| 15 to 19 years | 10 (0.8%) | 4.0 |
| 20 to 34 years | 914 (77.1%) | 104.0 |
| 35 to 50 years | 262 (22.1%) | 34.0 |
| Total | 1,186 (100.0%) | 62.0 |
Fertility by Age by Marriage Status in Bloomington
75.0% of women with births (1,186) in Bloomington are married. The highest percentage of unmarried women with births falls into 15 to 19 years age bracket with 100.0% of them unmarried at the time of birth, while the lowest percentage of unmarried women with births belong to 20 to 34 years age bracket with 22.8% of them unmarried.
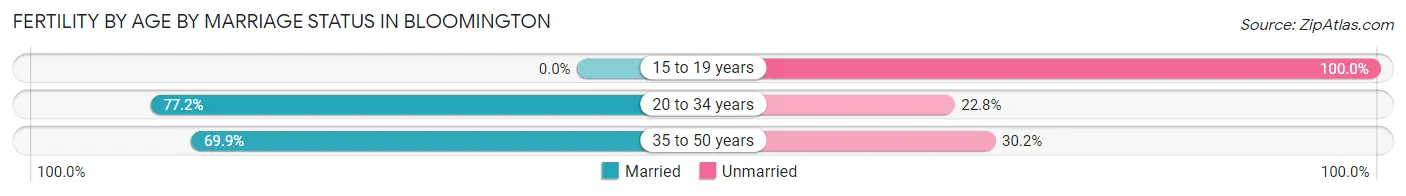
| Age Bracket | Married | Unmarried |
| 15 to 19 years | 0 (0.0%) | 10 (100.0%) |
| 20 to 34 years | 706 (77.2%) | 208 (22.8%) |
| 35 to 50 years | 183 (69.9%) | 79 (30.1%) |
| Total | 890 (75.0%) | 296 (25.0%) |
Fertility by Education in Bloomington
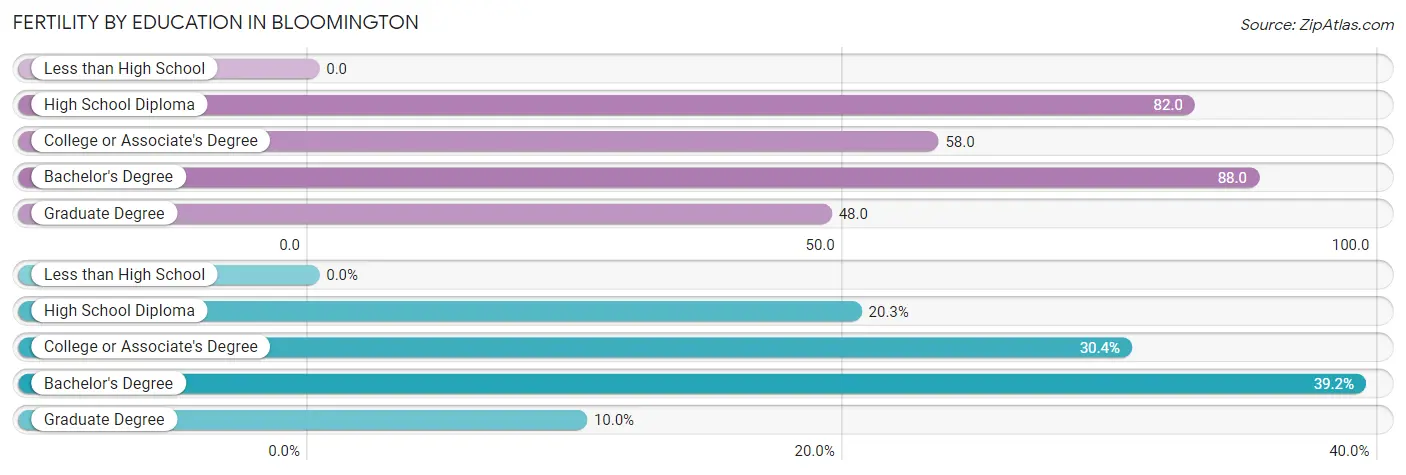
| Educational Attainment | Women with Births | Births / 1,000 Women |
| Less than High School | 0 (0.0%) | 0.0 |
| High School Diploma | 241 (20.3%) | 82.0 |
| College or Associate's Degree | 361 (30.4%) | 58.0 |
| Bachelor's Degree | 465 (39.2%) | 88.0 |
| Graduate Degree | 119 (10.0%) | 48.0 |
| Total | 1,186 (100.0%) | 62.0 |
Fertility by Education by Marriage Status in Bloomington
25.0% of women with births in Bloomington are unmarried. Women with the educational attainment of bachelor's degree are most likely to be married with 100.0% of them married at childbirth, while women with the educational attainment of high school diploma are least likely to be married with 49.8% of them unmarried at childbirth.
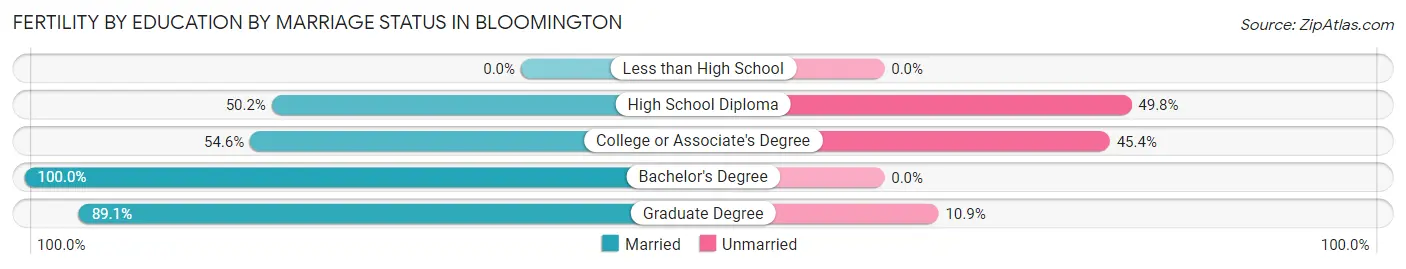
| Educational Attainment | Married | Unmarried |
| Less than High School | 0 (0.0%) | 0 (0.0%) |
| High School Diploma | 121 (50.2%) | 120 (49.8%) |
| College or Associate's Degree | 197 (54.6%) | 164 (45.4%) |
| Bachelor's Degree | 465 (100.0%) | 0 (0.0%) |
| Graduate Degree | 106 (89.1%) | 13 (10.9%) |
| Total | 890 (75.0%) | 296 (25.0%) |
Employment Characteristics in Bloomington
Employment by Class of Employer in Bloomington
Among the 38,848 employed individuals in Bloomington, private company employees (28,073 | 72.3%), not-for-profit organizations (3,982 | 10.2%), and local government employees (2,288 | 5.9%) make up the most common classes of employment.
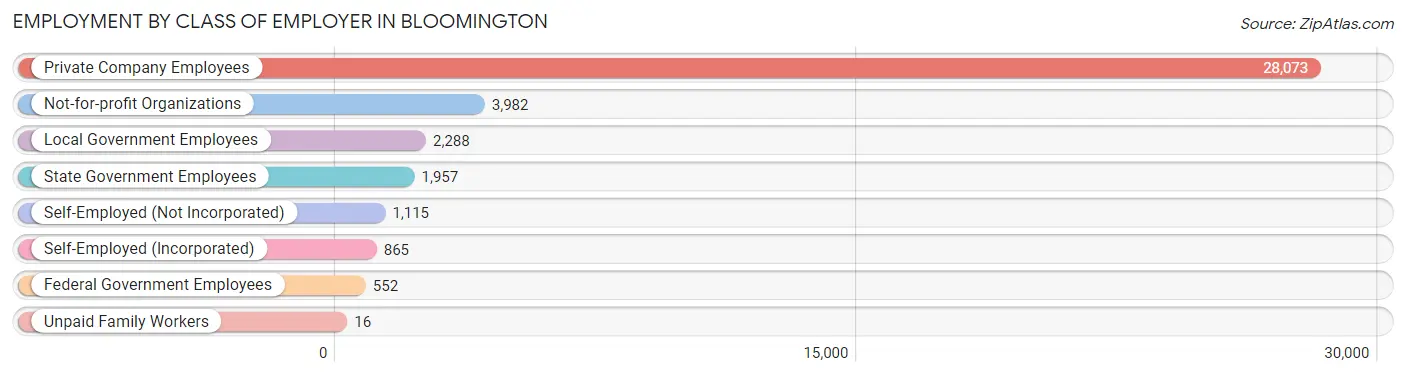
| Employer Class | # Employees | % Employees |
| Private Company Employees | 28,073 | 72.3% |
| Self-Employed (Incorporated) | 865 | 2.2% |
| Self-Employed (Not Incorporated) | 1,115 | 2.9% |
| Not-for-profit Organizations | 3,982 | 10.2% |
| Local Government Employees | 2,288 | 5.9% |
| State Government Employees | 1,957 | 5.0% |
| Federal Government Employees | 552 | 1.4% |
| Unpaid Family Workers | 16 | 0.0% |
| Total | 38,848 | 100.0% |
Employment Status by Age in Bloomington
According to the labor force statistics for Bloomington, out of the total population over 16 years of age (63,308), 64.6% or 40,897 individuals are in the labor force, with 3.3% or 1,350 of them unemployed. The age group with the highest labor force participation rate is 25 to 29 years, with 85.0% or 5,142 individuals in the labor force. Within the labor force, the 16 to 19 years age range has the highest percentage of unemployed individuals, with 13.4% or 251 of them being unemployed.
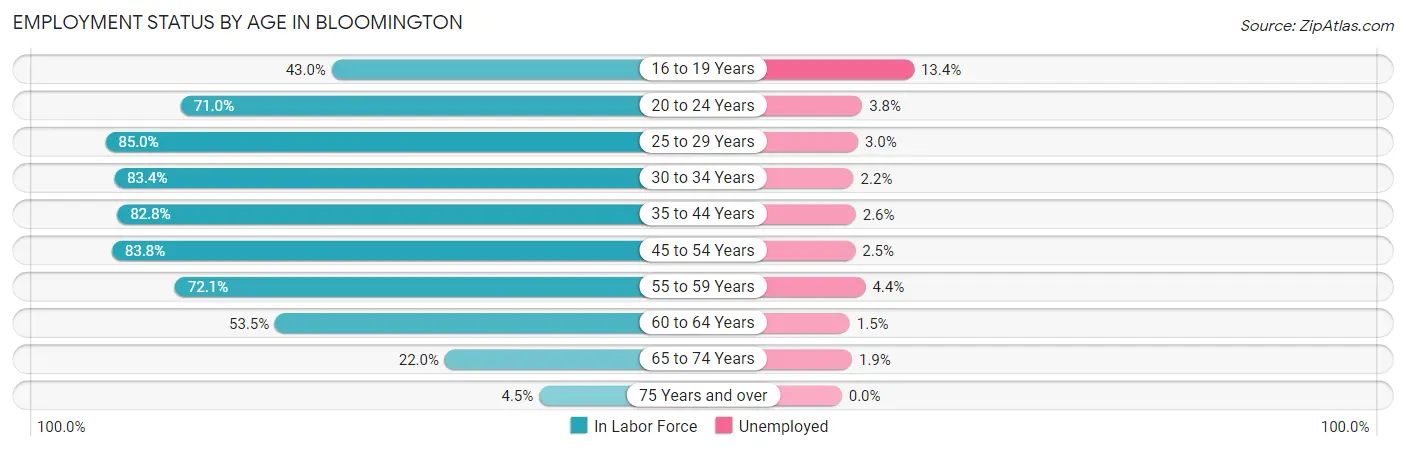
| Age Bracket | In Labor Force | Unemployed |
| 16 to 19 Years | 1,873 (43.0%) | 251 (13.4%) |
| 20 to 24 Years | 4,876 (71.0%) | 185 (3.8%) |
| 25 to 29 Years | 5,142 (85.0%) | 154 (3.0%) |
| 30 to 34 Years | 4,601 (83.4%) | 101 (2.2%) |
| 35 to 44 Years | 8,858 (82.8%) | 230 (2.6%) |
| 45 to 54 Years | 7,946 (83.8%) | 199 (2.5%) |
| 55 to 59 Years | 3,604 (72.1%) | 159 (4.4%) |
| 60 to 64 Years | 2,336 (53.5%) | 35 (1.5%) |
| 65 to 74 Years | 1,501 (22.0%) | 29 (1.9%) |
| 75 Years and over | 187 (4.5%) | 0 (0.0%) |
| Total | 40,897 (64.6%) | 1,350 (3.3%) |
Employment Status by Educational Attainment in Bloomington
According to labor force statistics for Bloomington, 79.0% of individuals (32,478) out of the total population between 25 and 64 years of age (41,112) are in the labor force, with 2.7% or 877 of them being unemployed. The group with the highest labor force participation rate are those with the educational attainment of bachelor's degree or higher, with 85.3% or 16,934 individuals in the labor force. Within the labor force, individuals with high school diploma education have the highest percentage of unemployment, with 5.2% or 299 of them being unemployed.
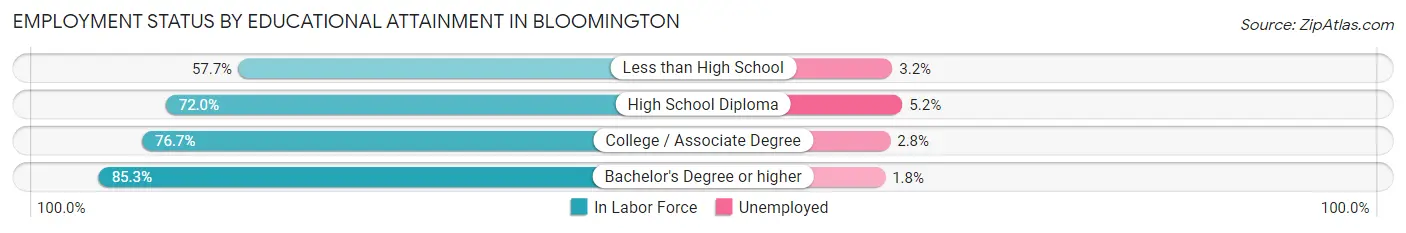
| Educational Attainment | In Labor Force | Unemployed |
| Less than High School | 1,150 (57.7%) | 64 (3.2%) |
| High School Diploma | 5,742 (72.0%) | 415 (5.2%) |
| College / Associate Degree | 8,661 (76.7%) | 316 (2.8%) |
| Bachelor's Degree or higher | 16,934 (85.3%) | 357 (1.8%) |
| Total | 32,478 (79.0%) | 1,110 (2.7%) |
Employment Occupations by Sex in Bloomington
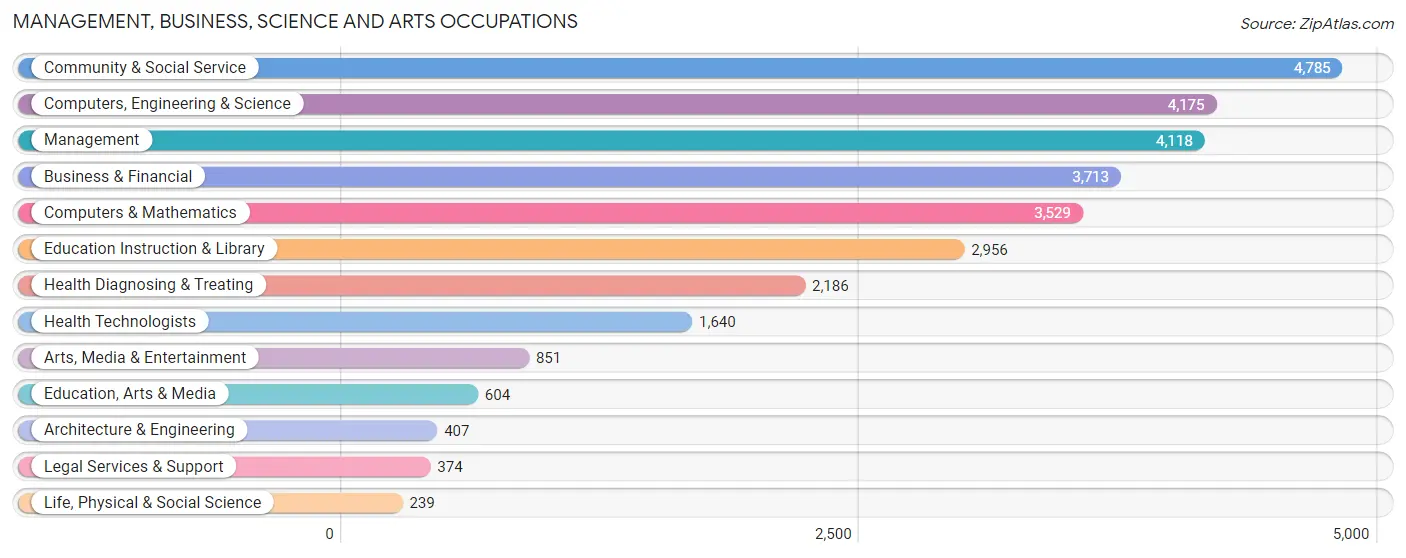
Management, Business, Science and Arts Occupations
The most common Management, Business, Science and Arts occupations in Bloomington are Community & Social Service (4,785 | 12.1%), Computers, Engineering & Science (4,175 | 10.6%), Management (4,118 | 10.4%), Business & Financial (3,713 | 9.4%), and Computers & Mathematics (3,529 | 8.9%).
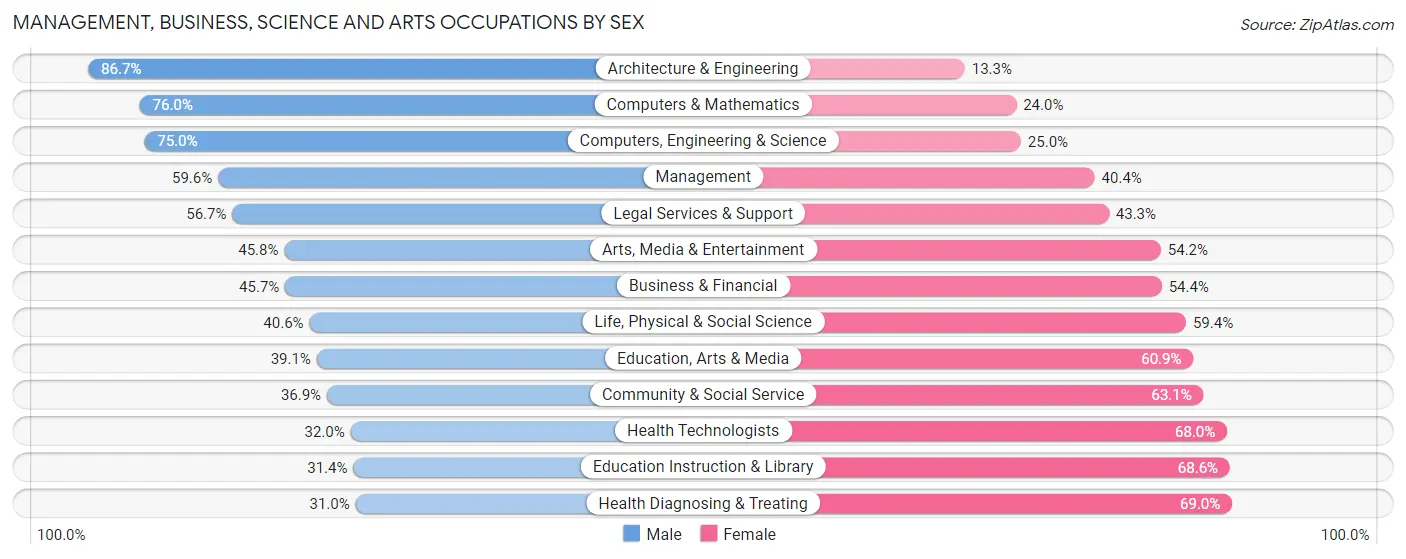
Management, Business, Science and Arts Occupations by Sex
Within the Management, Business, Science and Arts occupations in Bloomington, the most male-oriented occupations are Architecture & Engineering (86.7%), Computers & Mathematics (76.0%), and Computers, Engineering & Science (75.0%), while the most female-oriented occupations are Health Diagnosing & Treating (69.0%), Education Instruction & Library (68.6%), and Health Technologists (68.0%).
| Occupation | Male | Female |
| Management | 2,456 (59.6%) | 1,662 (40.4%) |
| Business & Financial | 1,695 (45.7%) | 2,018 (54.3%) |
| Computers, Engineering & Science | 3,132 (75.0%) | 1,043 (25.0%) |
| Computers & Mathematics | 2,682 (76.0%) | 847 (24.0%) |
| Architecture & Engineering | 353 (86.7%) | 54 (13.3%) |
| Life, Physical & Social Science | 97 (40.6%) | 142 (59.4%) |
| Community & Social Service | 1,767 (36.9%) | 3,018 (63.1%) |
| Education, Arts & Media | 236 (39.1%) | 368 (60.9%) |
| Legal Services & Support | 212 (56.7%) | 162 (43.3%) |
| Education Instruction & Library | 929 (31.4%) | 2,027 (68.6%) |
| Arts, Media & Entertainment | 390 (45.8%) | 461 (54.2%) |
| Health Diagnosing & Treating | 677 (31.0%) | 1,509 (69.0%) |
| Health Technologists | 525 (32.0%) | 1,115 (68.0%) |
| Total (Category) | 9,727 (51.3%) | 9,250 (48.7%) |
| Total (Overall) | 20,956 (53.0%) | 18,584 (47.0%) |
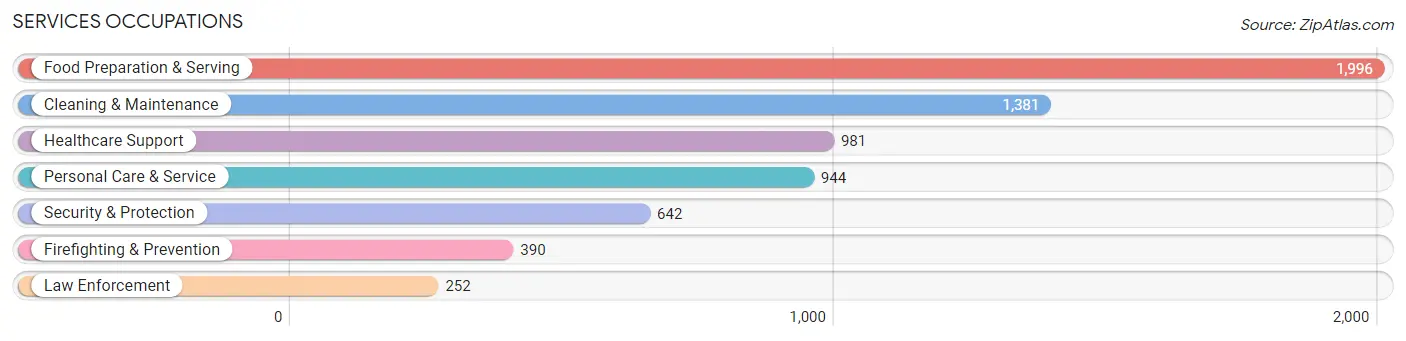
Services Occupations
The most common Services occupations in Bloomington are Food Preparation & Serving (1,996 | 5.1%), Cleaning & Maintenance (1,381 | 3.5%), Healthcare Support (981 | 2.5%), Personal Care & Service (944 | 2.4%), and Security & Protection (642 | 1.6%).
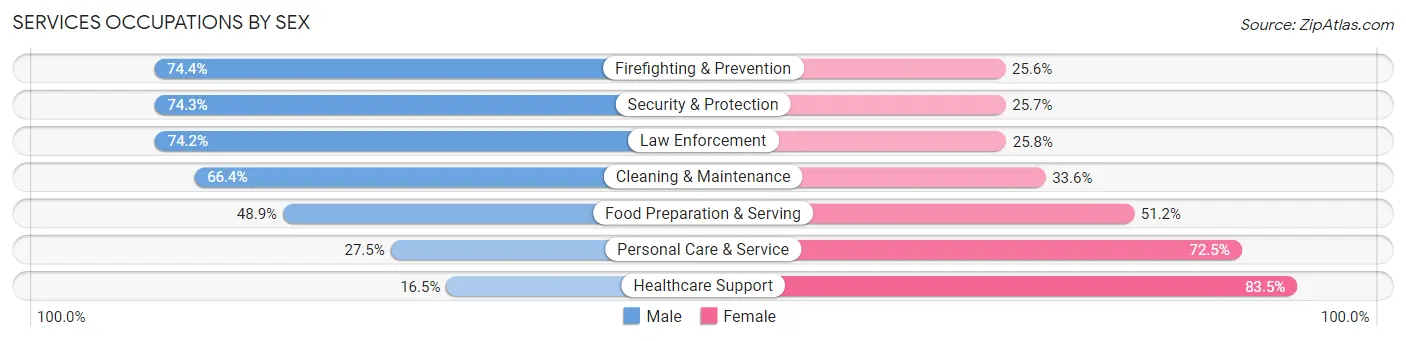
Services Occupations by Sex
Within the Services occupations in Bloomington, the most male-oriented occupations are Firefighting & Prevention (74.4%), Security & Protection (74.3%), and Law Enforcement (74.2%), while the most female-oriented occupations are Healthcare Support (83.5%), Personal Care & Service (72.5%), and Food Preparation & Serving (51.1%).
| Occupation | Male | Female |
| Healthcare Support | 162 (16.5%) | 819 (83.5%) |
| Security & Protection | 477 (74.3%) | 165 (25.7%) |
| Firefighting & Prevention | 290 (74.4%) | 100 (25.6%) |
| Law Enforcement | 187 (74.2%) | 65 (25.8%) |
| Food Preparation & Serving | 975 (48.8%) | 1,021 (51.1%) |
| Cleaning & Maintenance | 917 (66.4%) | 464 (33.6%) |
| Personal Care & Service | 260 (27.5%) | 684 (72.5%) |
| Total (Category) | 2,791 (46.9%) | 3,153 (53.0%) |
| Total (Overall) | 20,956 (53.0%) | 18,584 (47.0%) |
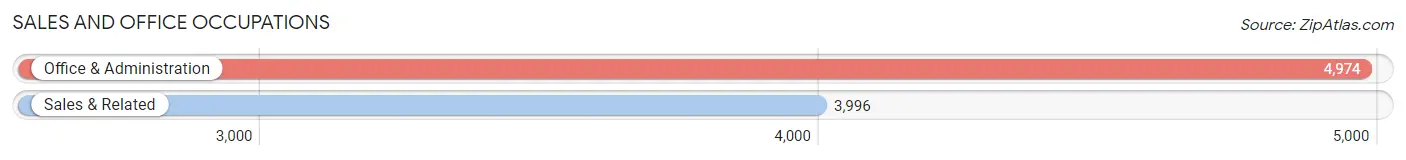
Sales and Office Occupations
The most common Sales and Office occupations in Bloomington are Office & Administration (4,974 | 12.6%), and Sales & Related (3,996 | 10.1%).
Sales and Office Occupations by Sex
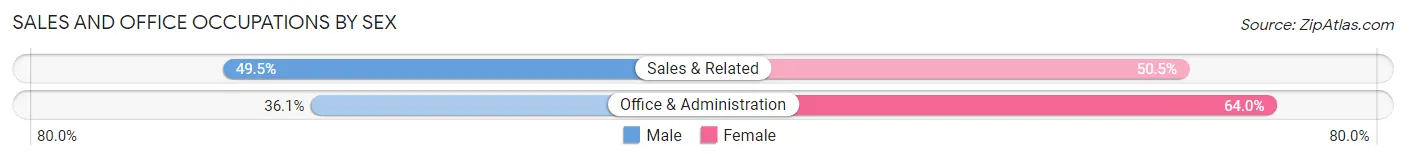
| Occupation | Male | Female |
| Sales & Related | 1,978 (49.5%) | 2,018 (50.5%) |
| Office & Administration | 1,793 (36.0%) | 3,181 (63.9%) |
| Total (Category) | 3,771 (42.0%) | 5,199 (58.0%) |
| Total (Overall) | 20,956 (53.0%) | 18,584 (47.0%) |
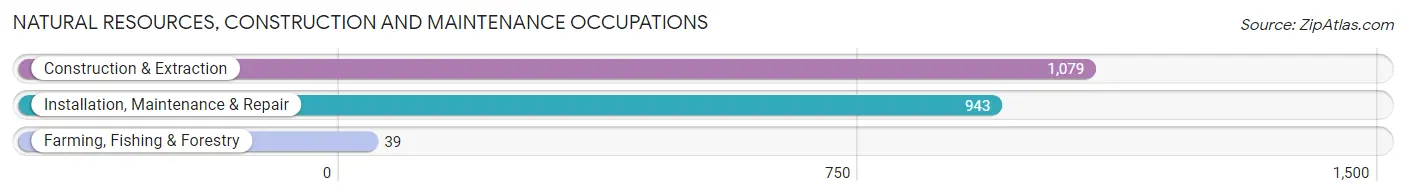
Natural Resources, Construction and Maintenance Occupations
The most common Natural Resources, Construction and Maintenance occupations in Bloomington are Construction & Extraction (1,079 | 2.7%), Installation, Maintenance & Repair (943 | 2.4%), and Farming, Fishing & Forestry (39 | 0.1%).
Natural Resources, Construction and Maintenance Occupations by Sex
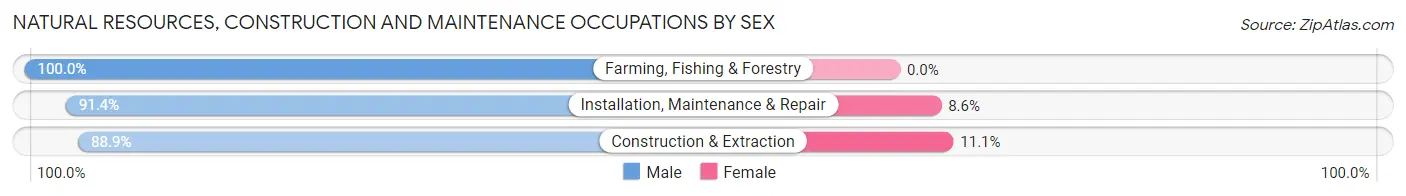
| Occupation | Male | Female |
| Farming, Fishing & Forestry | 39 (100.0%) | 0 (0.0%) |
| Construction & Extraction | 959 (88.9%) | 120 (11.1%) |
| Installation, Maintenance & Repair | 862 (91.4%) | 81 (8.6%) |
| Total (Category) | 1,860 (90.2%) | 201 (9.8%) |
| Total (Overall) | 20,956 (53.0%) | 18,584 (47.0%) |
Production, Transportation and Moving Occupations
The most common Production, Transportation and Moving occupations in Bloomington are Production (1,399 | 3.5%), Material Moving (1,184 | 3.0%), and Transportation (1,005 | 2.5%).
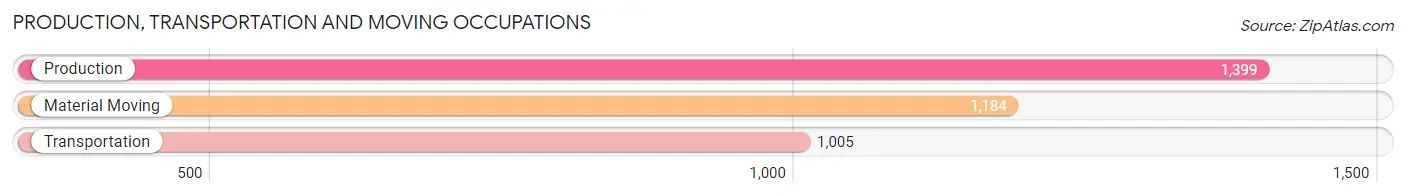
Production, Transportation and Moving Occupations by Sex
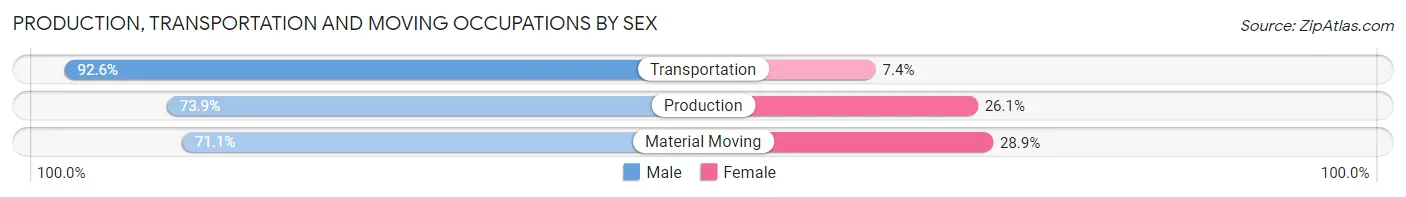
| Occupation | Male | Female |
| Production | 1,034 (73.9%) | 365 (26.1%) |
| Transportation | 931 (92.6%) | 74 (7.4%) |
| Material Moving | 842 (71.1%) | 342 (28.9%) |
| Total (Category) | 2,807 (78.2%) | 781 (21.8%) |
| Total (Overall) | 20,956 (53.0%) | 18,584 (47.0%) |
Employment Industries by Sex in Bloomington
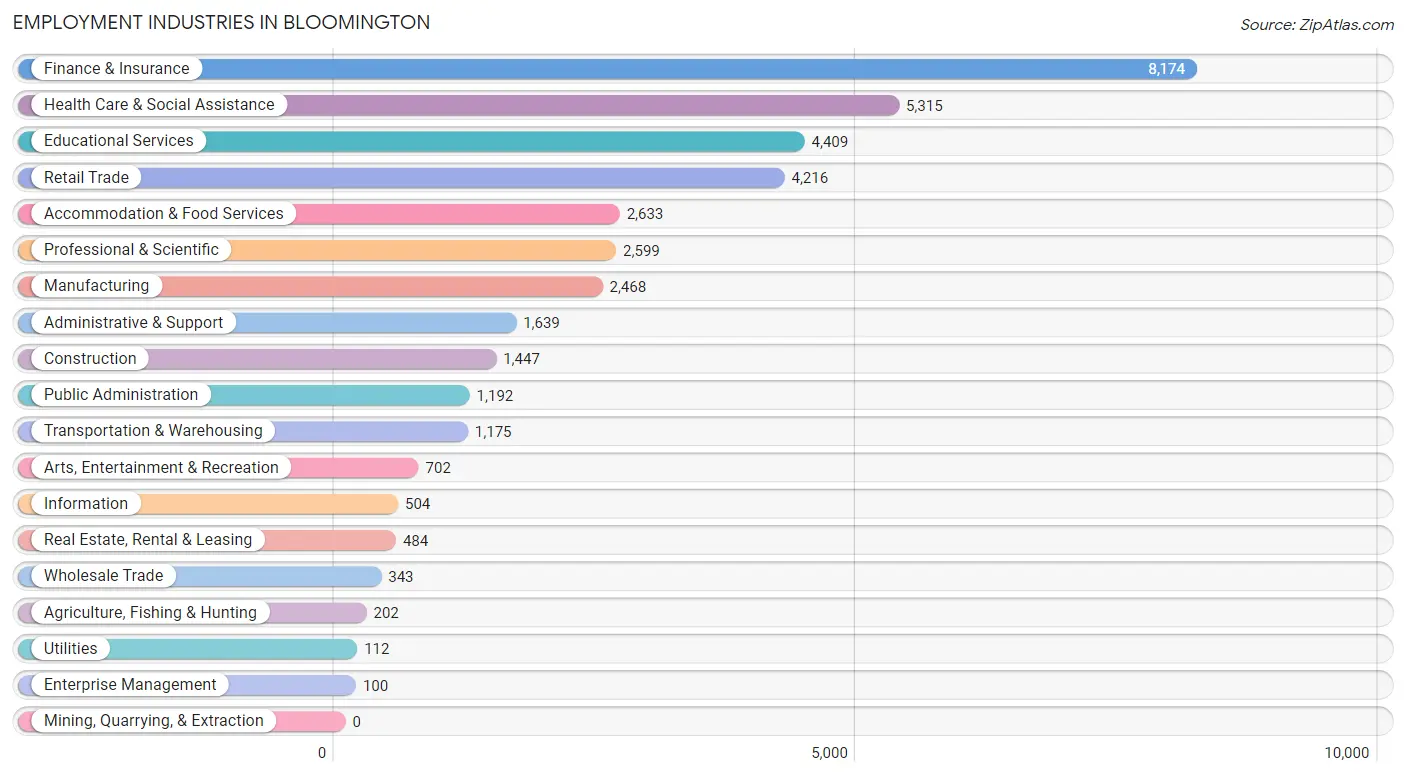
Employment Industries in Bloomington
The major employment industries in Bloomington include Finance & Insurance (8,174 | 20.7%), Health Care & Social Assistance (5,315 | 13.4%), Educational Services (4,409 | 11.2%), Retail Trade (4,216 | 10.7%), and Accommodation & Food Services (2,633 | 6.7%).
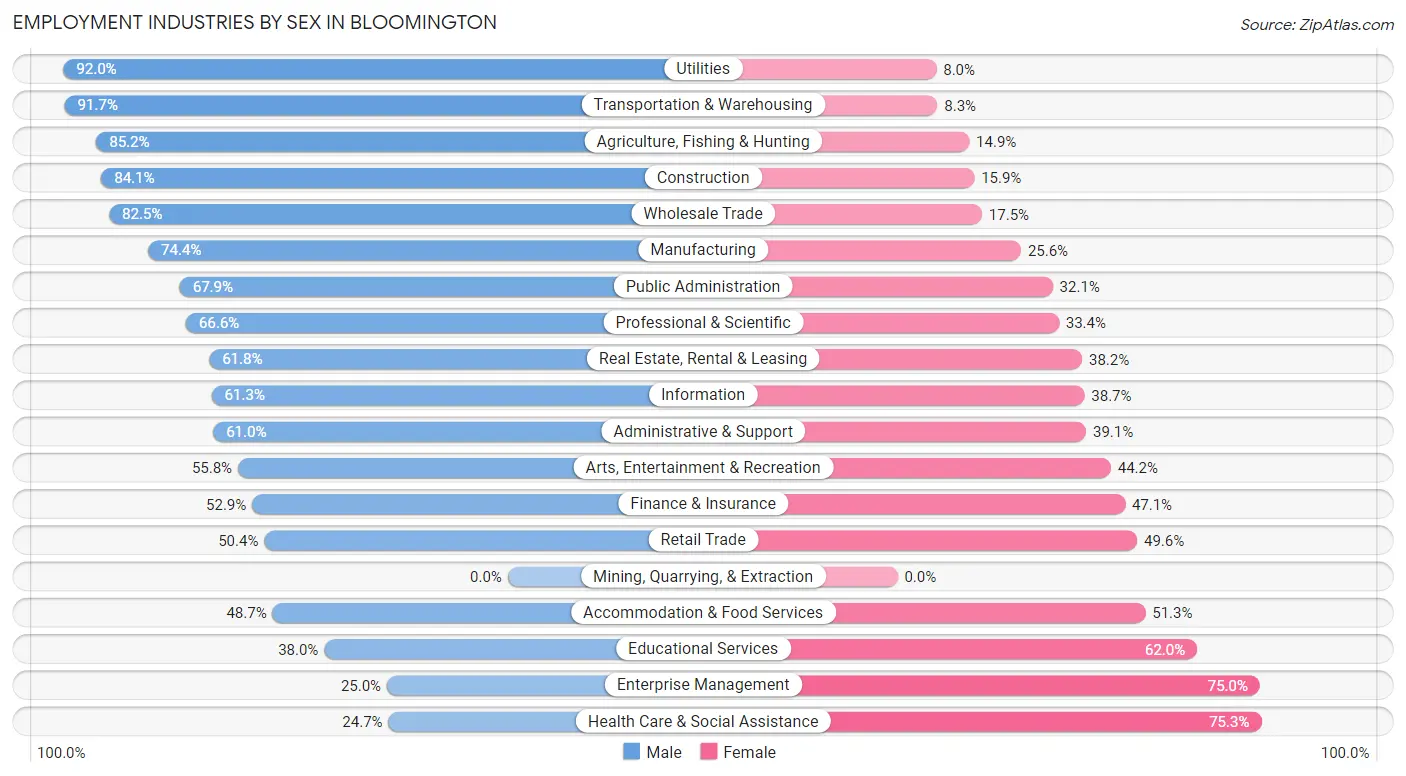
Employment Industries by Sex in Bloomington
The Bloomington industries that see more men than women are Utilities (92.0%), Transportation & Warehousing (91.7%), and Agriculture, Fishing & Hunting (85.2%), whereas the industries that tend to have a higher number of women are Health Care & Social Assistance (75.3%), Enterprise Management (75.0%), and Educational Services (62.0%).
| Industry | Male | Female |
| Agriculture, Fishing & Hunting | 172 (85.2%) | 30 (14.8%) |
| Mining, Quarrying, & Extraction | 0 (0.0%) | 0 (0.0%) |
| Construction | 1,217 (84.1%) | 230 (15.9%) |
| Manufacturing | 1,837 (74.4%) | 631 (25.6%) |
| Wholesale Trade | 283 (82.5%) | 60 (17.5%) |
| Retail Trade | 2,125 (50.4%) | 2,091 (49.6%) |
| Transportation & Warehousing | 1,078 (91.7%) | 97 (8.3%) |
| Utilities | 103 (92.0%) | 9 (8.0%) |
| Information | 309 (61.3%) | 195 (38.7%) |
| Finance & Insurance | 4,325 (52.9%) | 3,849 (47.1%) |
| Real Estate, Rental & Leasing | 299 (61.8%) | 185 (38.2%) |
| Professional & Scientific | 1,731 (66.6%) | 868 (33.4%) |
| Enterprise Management | 25 (25.0%) | 75 (75.0%) |
| Administrative & Support | 999 (61.0%) | 640 (39.1%) |
| Educational Services | 1,675 (38.0%) | 2,734 (62.0%) |
| Health Care & Social Assistance | 1,313 (24.7%) | 4,002 (75.3%) |
| Arts, Entertainment & Recreation | 392 (55.8%) | 310 (44.2%) |
| Accommodation & Food Services | 1,282 (48.7%) | 1,351 (51.3%) |
| Public Administration | 809 (67.9%) | 383 (32.1%) |
| Total | 20,956 (53.0%) | 18,584 (47.0%) |
Education in Bloomington
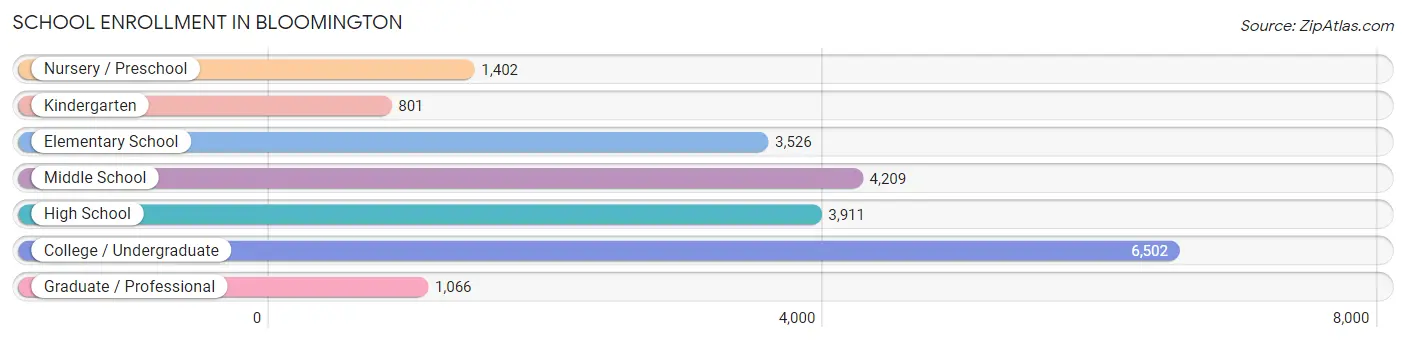
School Enrollment in Bloomington
The most common levels of schooling among the 21,417 students in Bloomington are college / undergraduate (6,502 | 30.4%), middle school (4,209 | 19.7%), and high school (3,911 | 18.3%).
| School Level | # Students | % Students |
| Nursery / Preschool | 1,402 | 6.6% |
| Kindergarten | 801 | 3.7% |
| Elementary School | 3,526 | 16.5% |
| Middle School | 4,209 | 19.7% |
| High School | 3,911 | 18.3% |
| College / Undergraduate | 6,502 | 30.4% |
| Graduate / Professional | 1,066 | 5.0% |
| Total | 21,417 | 100.0% |
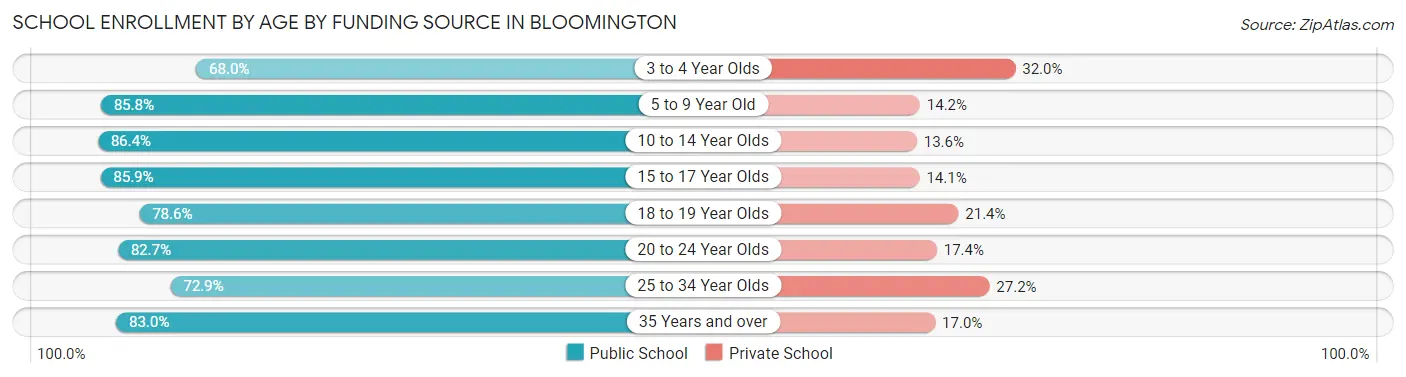
School Enrollment by Age by Funding Source in Bloomington
Out of a total of 21,417 students who are enrolled in schools in Bloomington, 3,662 (17.1%) attend a private institution, while the remaining 17,755 (82.9%) are enrolled in public schools. The age group of 3 to 4 year olds has the highest likelihood of being enrolled in private schools, with 357 (32.0% in the age bracket) enrolled. Conversely, the age group of 10 to 14 year olds has the lowest likelihood of being enrolled in a private school, with 4,295 (86.4% in the age bracket) attending a public institution.
| Age Bracket | Public School | Private School |
| 3 to 4 Year Olds | 760 (68.0%) | 357 (32.0%) |
| 5 to 9 Year Old | 3,628 (85.8%) | 600 (14.2%) |
| 10 to 14 Year Olds | 4,295 (86.4%) | 677 (13.6%) |
| 15 to 17 Year Olds | 2,494 (85.9%) | 410 (14.1%) |
| 18 to 19 Year Olds | 1,613 (78.6%) | 438 (21.4%) |
| 20 to 24 Year Olds | 3,068 (82.7%) | 644 (17.3%) |
| 25 to 34 Year Olds | 832 (72.9%) | 310 (27.2%) |
| 35 Years and over | 1,071 (83.0%) | 220 (17.0%) |
| Total | 17,755 (82.9%) | 3,662 (17.1%) |
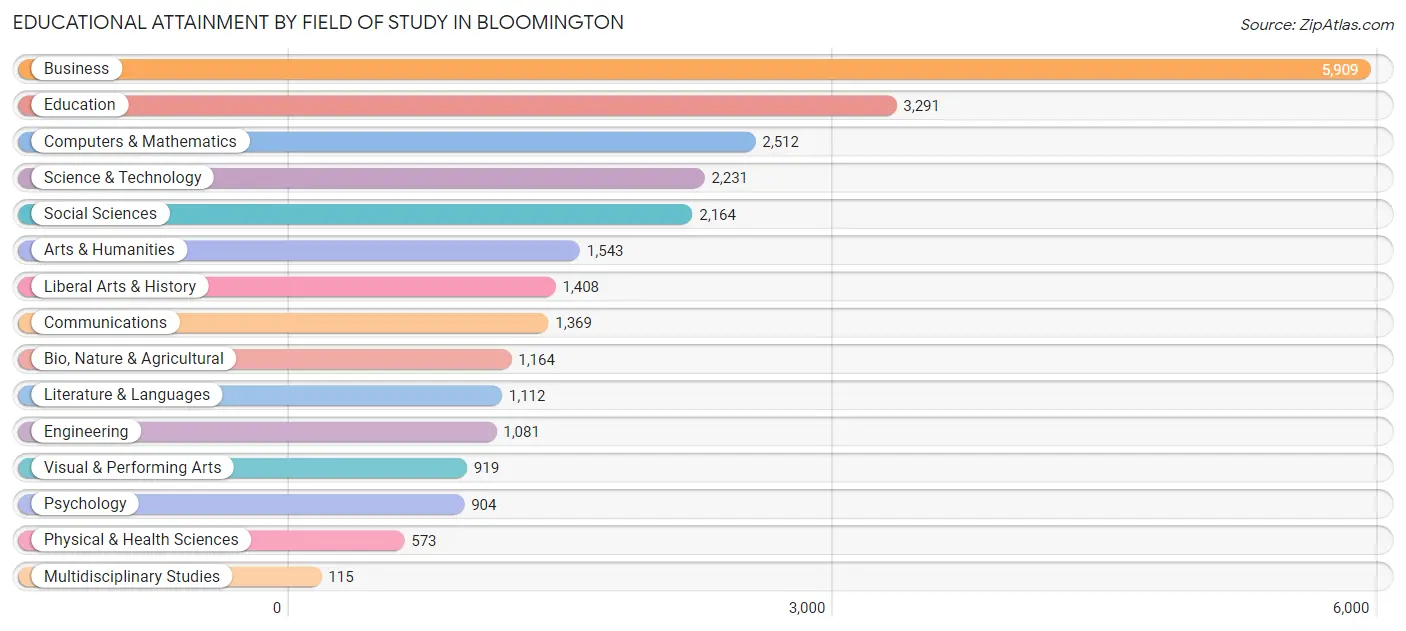
Educational Attainment by Field of Study in Bloomington
Business (5,909 | 22.5%), education (3,291 | 12.5%), computers & mathematics (2,512 | 9.6%), science & technology (2,231 | 8.5%), and social sciences (2,164 | 8.2%) are the most common fields of study among 26,295 individuals in Bloomington who have obtained a bachelor's degree or higher.
| Field of Study | # Graduates | % Graduates |
| Computers & Mathematics | 2,512 | 9.6% |
| Bio, Nature & Agricultural | 1,164 | 4.4% |
| Physical & Health Sciences | 573 | 2.2% |
| Psychology | 904 | 3.4% |
| Social Sciences | 2,164 | 8.2% |
| Engineering | 1,081 | 4.1% |
| Multidisciplinary Studies | 115 | 0.4% |
| Science & Technology | 2,231 | 8.5% |
| Business | 5,909 | 22.5% |
| Education | 3,291 | 12.5% |
| Literature & Languages | 1,112 | 4.2% |
| Liberal Arts & History | 1,408 | 5.3% |
| Visual & Performing Arts | 919 | 3.5% |
| Communications | 1,369 | 5.2% |
| Arts & Humanities | 1,543 | 5.9% |
| Total | 26,295 | 100.0% |
Transportation & Commute in Bloomington
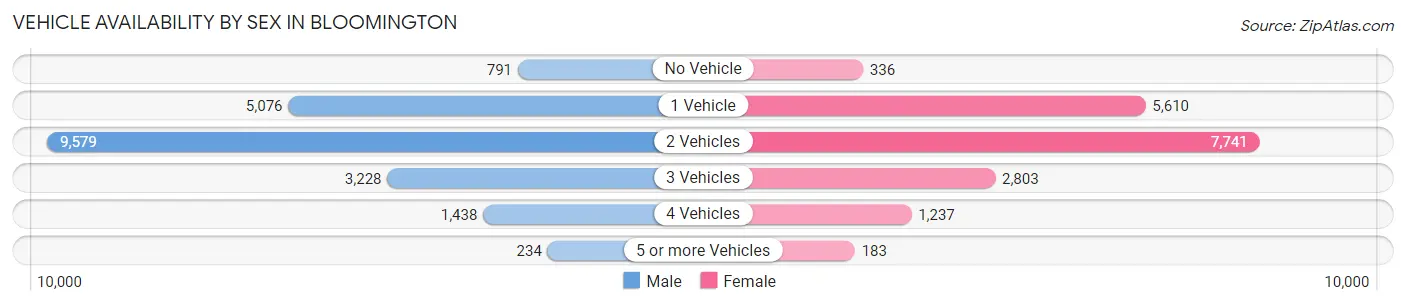
Vehicle Availability by Sex in Bloomington
The most prevalent vehicle ownership categories in Bloomington are males with 2 vehicles (9,579, accounting for 47.1%) and females with 2 vehicles (7,741, making up 53.5%).
| Vehicles Available | Male | Female |
| No Vehicle | 791 (3.9%) | 336 (1.9%) |
| 1 Vehicle | 5,076 (24.9%) | 5,610 (31.3%) |
| 2 Vehicles | 9,579 (47.1%) | 7,741 (43.2%) |
| 3 Vehicles | 3,228 (15.9%) | 2,803 (15.7%) |
| 4 Vehicles | 1,438 (7.1%) | 1,237 (6.9%) |
| 5 or more Vehicles | 234 (1.1%) | 183 (1.0%) |
| Total | 20,346 (100.0%) | 17,910 (100.0%) |
Commute Time in Bloomington
The most frequently occuring commute durations in Bloomington are 10 to 14 minutes (9,820 commuters, 29.7%), 15 to 19 minutes (7,354 commuters, 22.2%), and 5 to 9 minutes (6,987 commuters, 21.1%).
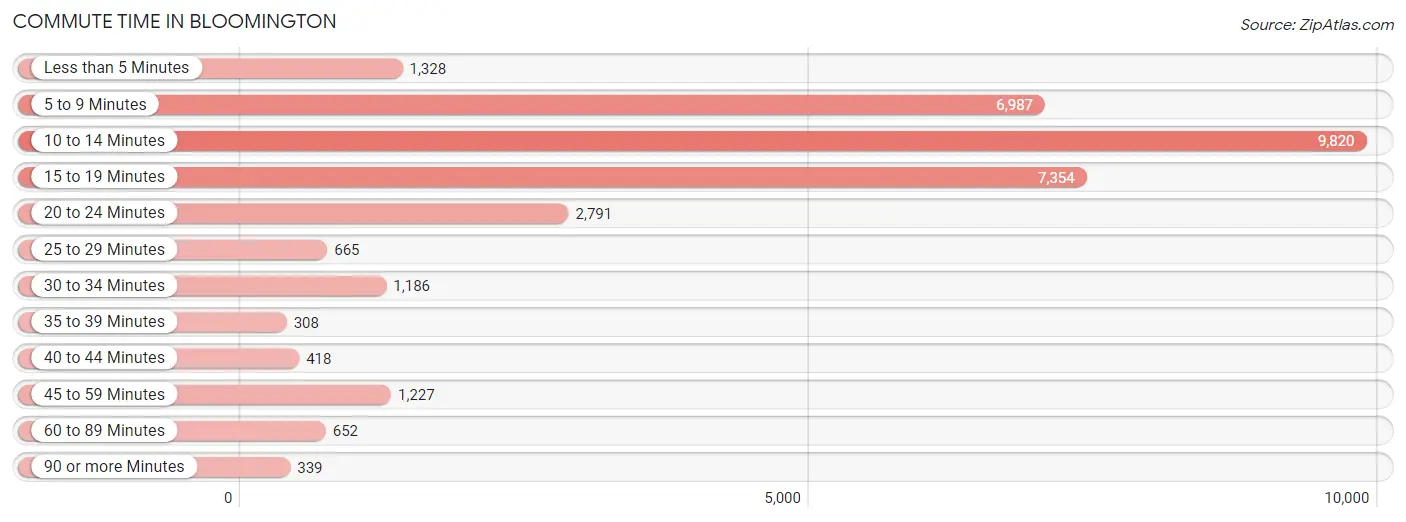
| Commute Time | # Commuters | % Commuters |
| Less than 5 Minutes | 1,328 | 4.0% |
| 5 to 9 Minutes | 6,987 | 21.1% |
| 10 to 14 Minutes | 9,820 | 29.7% |
| 15 to 19 Minutes | 7,354 | 22.2% |
| 20 to 24 Minutes | 2,791 | 8.4% |
| 25 to 29 Minutes | 665 | 2.0% |
| 30 to 34 Minutes | 1,186 | 3.6% |
| 35 to 39 Minutes | 308 | 0.9% |
| 40 to 44 Minutes | 418 | 1.3% |
| 45 to 59 Minutes | 1,227 | 3.7% |
| 60 to 89 Minutes | 652 | 2.0% |
| 90 or more Minutes | 339 | 1.0% |
Commute Time by Sex in Bloomington
The most common commute times in Bloomington are 10 to 14 minutes (4,997 commuters, 28.1%) for males and 10 to 14 minutes (4,823 commuters, 31.6%) for females.
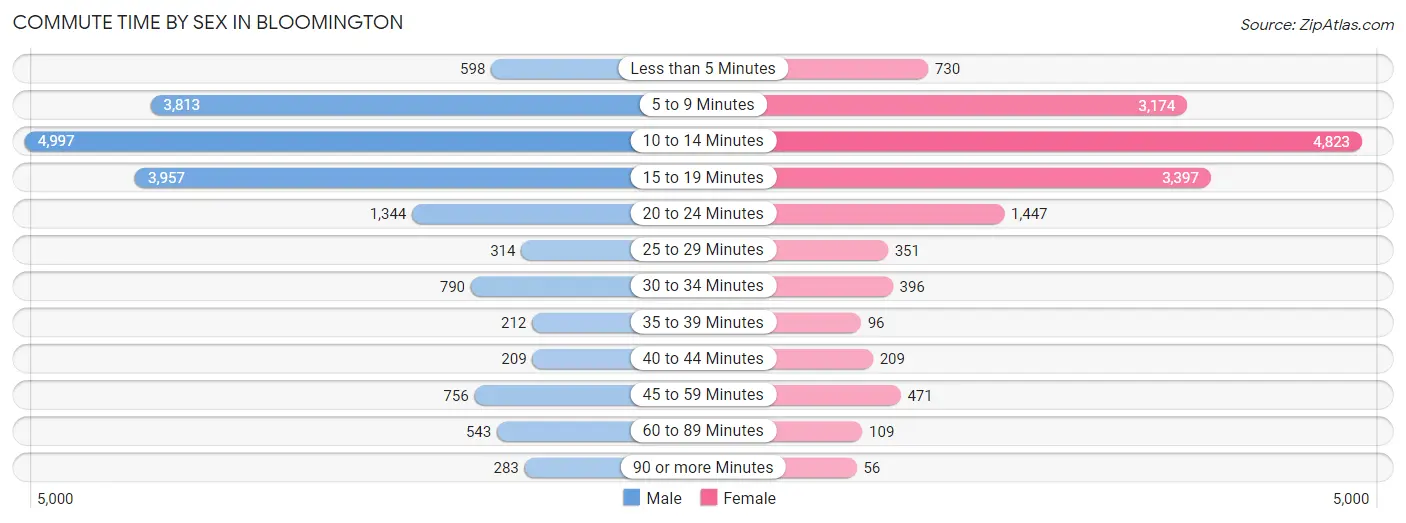
| Commute Time | Male | Female |
| Less than 5 Minutes | 598 (3.4%) | 730 (4.8%) |
| 5 to 9 Minutes | 3,813 (21.4%) | 3,174 (20.8%) |
| 10 to 14 Minutes | 4,997 (28.1%) | 4,823 (31.6%) |
| 15 to 19 Minutes | 3,957 (22.2%) | 3,397 (22.3%) |
| 20 to 24 Minutes | 1,344 (7.5%) | 1,447 (9.5%) |
| 25 to 29 Minutes | 314 (1.8%) | 351 (2.3%) |
| 30 to 34 Minutes | 790 (4.4%) | 396 (2.6%) |
| 35 to 39 Minutes | 212 (1.2%) | 96 (0.6%) |
| 40 to 44 Minutes | 209 (1.2%) | 209 (1.4%) |
| 45 to 59 Minutes | 756 (4.2%) | 471 (3.1%) |
| 60 to 89 Minutes | 543 (3.0%) | 109 (0.7%) |
| 90 or more Minutes | 283 (1.6%) | 56 (0.4%) |
Time of Departure to Work by Sex in Bloomington
The most frequent times of departure to work in Bloomington are 7:30 AM to 7:59 AM (3,030, 17.0%) for males and 7:30 AM to 7:59 AM (3,325, 21.8%) for females.
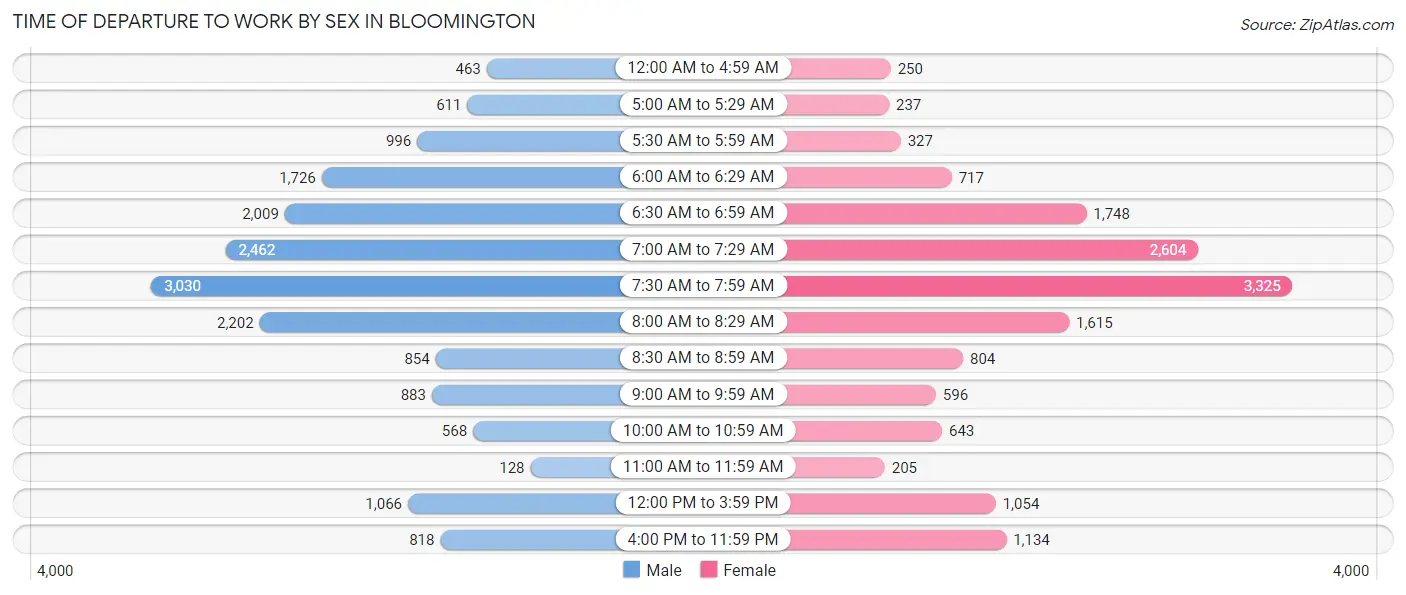
| Time of Departure | Male | Female |
| 12:00 AM to 4:59 AM | 463 (2.6%) | 250 (1.6%) |
| 5:00 AM to 5:29 AM | 611 (3.4%) | 237 (1.5%) |
| 5:30 AM to 5:59 AM | 996 (5.6%) | 327 (2.1%) |
| 6:00 AM to 6:29 AM | 1,726 (9.7%) | 717 (4.7%) |
| 6:30 AM to 6:59 AM | 2,009 (11.3%) | 1,748 (11.5%) |
| 7:00 AM to 7:29 AM | 2,462 (13.8%) | 2,604 (17.1%) |
| 7:30 AM to 7:59 AM | 3,030 (17.0%) | 3,325 (21.8%) |
| 8:00 AM to 8:29 AM | 2,202 (12.4%) | 1,615 (10.6%) |
| 8:30 AM to 8:59 AM | 854 (4.8%) | 804 (5.3%) |
| 9:00 AM to 9:59 AM | 883 (5.0%) | 596 (3.9%) |
| 10:00 AM to 10:59 AM | 568 (3.2%) | 643 (4.2%) |
| 11:00 AM to 11:59 AM | 128 (0.7%) | 205 (1.3%) |
| 12:00 PM to 3:59 PM | 1,066 (6.0%) | 1,054 (6.9%) |
| 4:00 PM to 11:59 PM | 818 (4.6%) | 1,134 (7.4%) |
| Total | 17,816 (100.0%) | 15,259 (100.0%) |
Housing Occupancy in Bloomington
Occupancy by Ownership in Bloomington
Of the total 33,885 dwellings in Bloomington, owner-occupied units account for 20,689 (61.1%), while renter-occupied units make up 13,196 (38.9%).
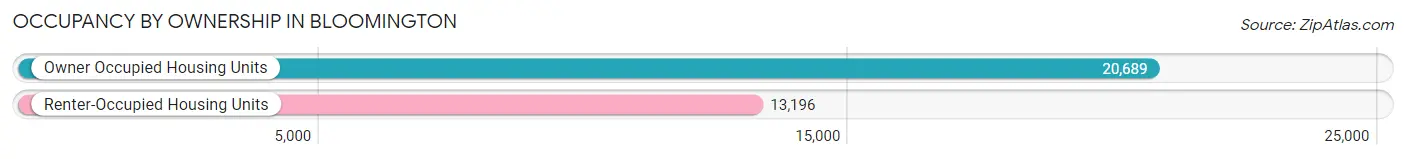
| Occupancy | # Housing Units | % Housing Units |
| Owner Occupied Housing Units | 20,689 | 61.1% |
| Renter-Occupied Housing Units | 13,196 | 38.9% |
| Total Occupied Housing Units | 33,885 | 100.0% |
Occupancy by Household Size in Bloomington
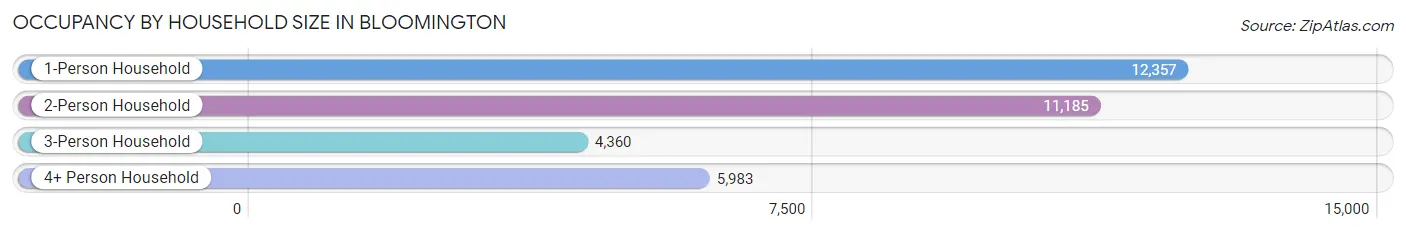
| Household Size | # Housing Units | % Housing Units |
| 1-Person Household | 12,357 | 36.5% |
| 2-Person Household | 11,185 | 33.0% |
| 3-Person Household | 4,360 | 12.9% |
| 4+ Person Household | 5,983 | 17.7% |
| Total Housing Units | 33,885 | 100.0% |
Occupancy by Ownership by Household Size in Bloomington
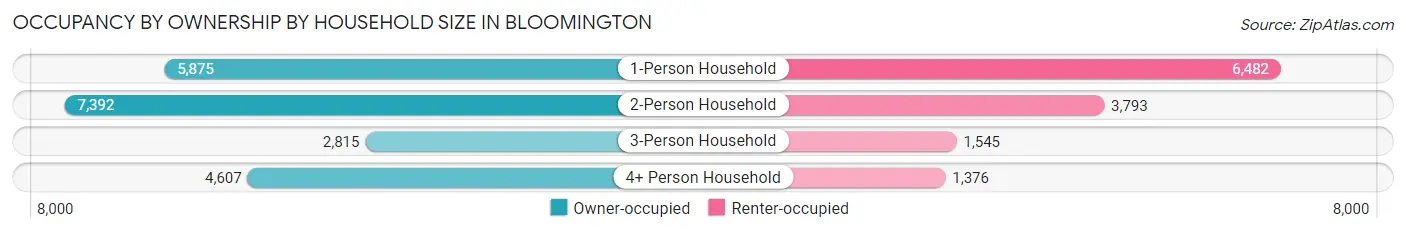
| Household Size | Owner-occupied | Renter-occupied |
| 1-Person Household | 5,875 (47.5%) | 6,482 (52.5%) |
| 2-Person Household | 7,392 (66.1%) | 3,793 (33.9%) |
| 3-Person Household | 2,815 (64.6%) | 1,545 (35.4%) |
| 4+ Person Household | 4,607 (77.0%) | 1,376 (23.0%) |
| Total Housing Units | 20,689 (61.1%) | 13,196 (38.9%) |
Occupancy by Educational Attainment in Bloomington
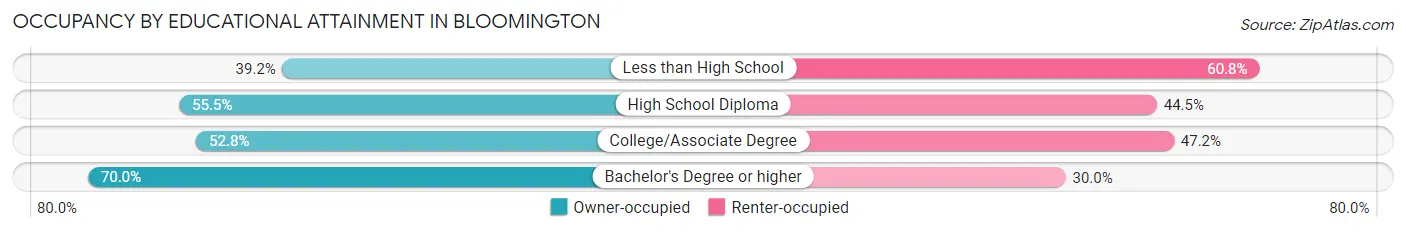
| Household Size | Owner-occupied | Renter-occupied |
| Less than High School | 517 (39.2%) | 801 (60.8%) |
| High School Diploma | 3,631 (55.5%) | 2,913 (44.5%) |
| College/Associate Degree | 5,118 (52.8%) | 4,578 (47.2%) |
| Bachelor's Degree or higher | 11,423 (70.0%) | 4,904 (30.0%) |
Occupancy by Age of Householder in Bloomington
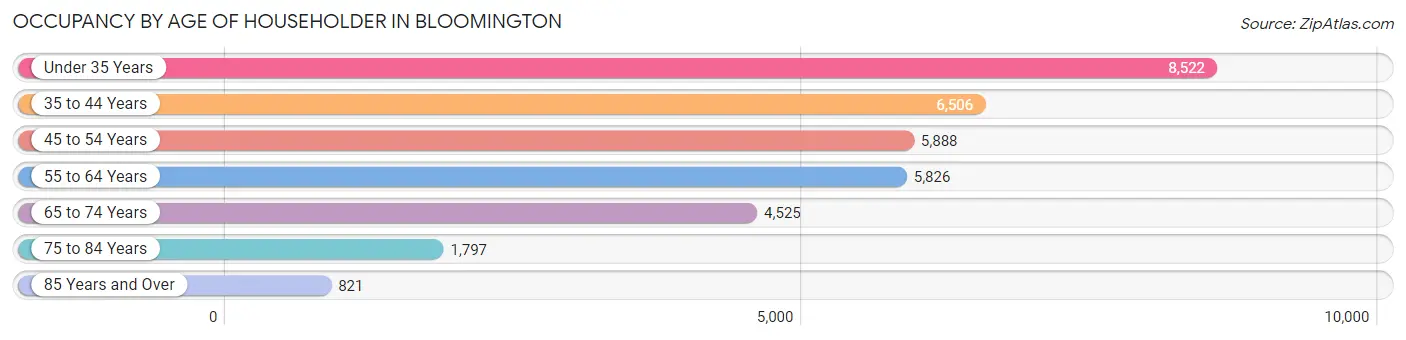
| Age Bracket | # Households | % Households |
| Under 35 Years | 8,522 | 25.2% |
| 35 to 44 Years | 6,506 | 19.2% |
| 45 to 54 Years | 5,888 | 17.4% |
| 55 to 64 Years | 5,826 | 17.2% |
| 65 to 74 Years | 4,525 | 13.4% |
| 75 to 84 Years | 1,797 | 5.3% |
| 85 Years and Over | 821 | 2.4% |
| Total | 33,885 | 100.0% |
Housing Finances in Bloomington
Median Income by Occupancy in Bloomington
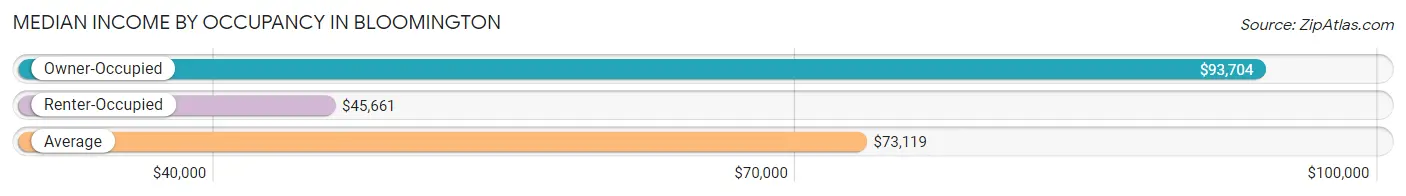
| Occupancy Type | # Households | Median Income |
| Owner-Occupied | 20,689 (61.1%) | $93,704 |
| Renter-Occupied | 13,196 (38.9%) | $45,661 |
| Average | 33,885 (100.0%) | $73,119 |
Occupancy by Householder Income Bracket in Bloomington
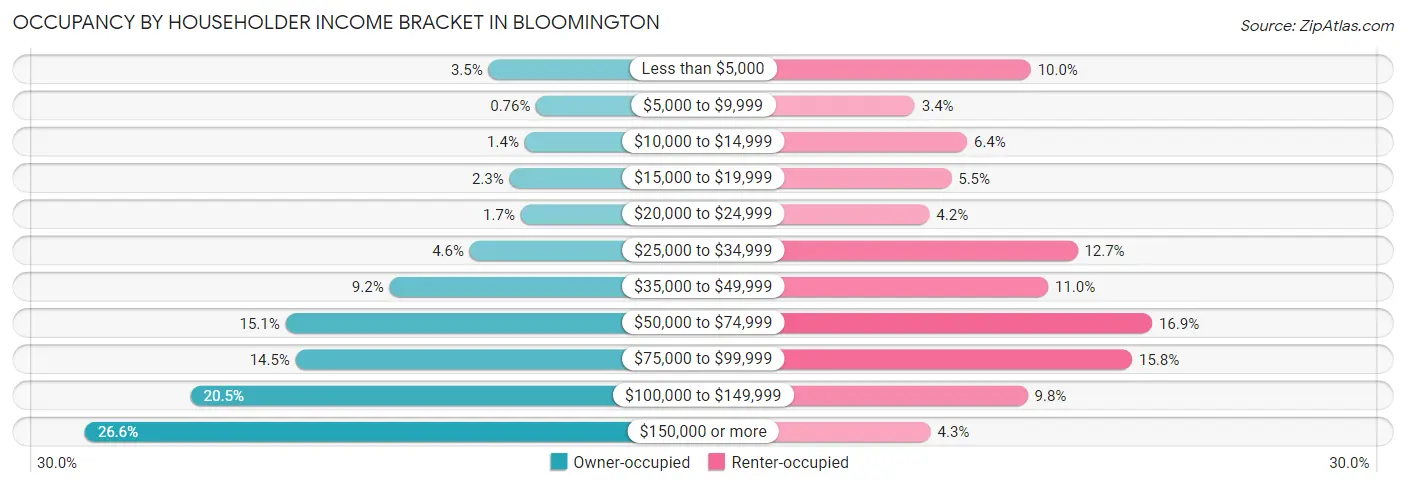
| Income Bracket | Owner-occupied | Renter-occupied |
| Less than $5,000 | 722 (3.5%) | 1,321 (10.0%) |
| $5,000 to $9,999 | 157 (0.8%) | 448 (3.4%) |
| $10,000 to $14,999 | 293 (1.4%) | 840 (6.4%) |
| $15,000 to $19,999 | 473 (2.3%) | 722 (5.5%) |
| $20,000 to $24,999 | 342 (1.7%) | 557 (4.2%) |
| $25,000 to $34,999 | 944 (4.6%) | 1,673 (12.7%) |
| $35,000 to $49,999 | 1,894 (9.1%) | 1,452 (11.0%) |
| $50,000 to $74,999 | 3,123 (15.1%) | 2,235 (16.9%) |
| $75,000 to $99,999 | 3,003 (14.5%) | 2,085 (15.8%) |
| $100,000 to $149,999 | 4,243 (20.5%) | 1,297 (9.8%) |
| $150,000 or more | 5,495 (26.6%) | 566 (4.3%) |
| Total | 20,689 (100.0%) | 13,196 (100.0%) |
Monthly Housing Cost Tiers in Bloomington
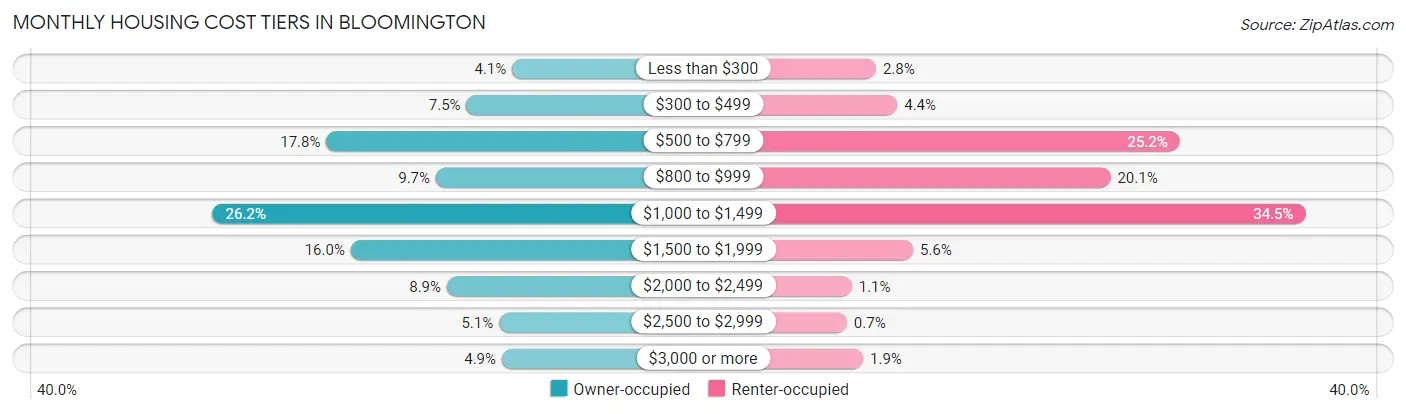
| Monthly Cost | Owner-occupied | Renter-occupied |
| Less than $300 | 849 (4.1%) | 375 (2.8%) |
| $300 to $499 | 1,544 (7.5%) | 582 (4.4%) |
| $500 to $799 | 3,679 (17.8%) | 3,325 (25.2%) |
| $800 to $999 | 2,009 (9.7%) | 2,654 (20.1%) |
| $1,000 to $1,499 | 5,411 (26.2%) | 4,547 (34.5%) |
| $1,500 to $1,999 | 3,306 (16.0%) | 735 (5.6%) |
| $2,000 to $2,499 | 1,841 (8.9%) | 140 (1.1%) |
| $2,500 to $2,999 | 1,046 (5.1%) | 93 (0.7%) |
| $3,000 or more | 1,004 (4.9%) | 250 (1.9%) |
| Total | 20,689 (100.0%) | 13,196 (100.0%) |
Physical Housing Characteristics in Bloomington
Housing Structures in Bloomington
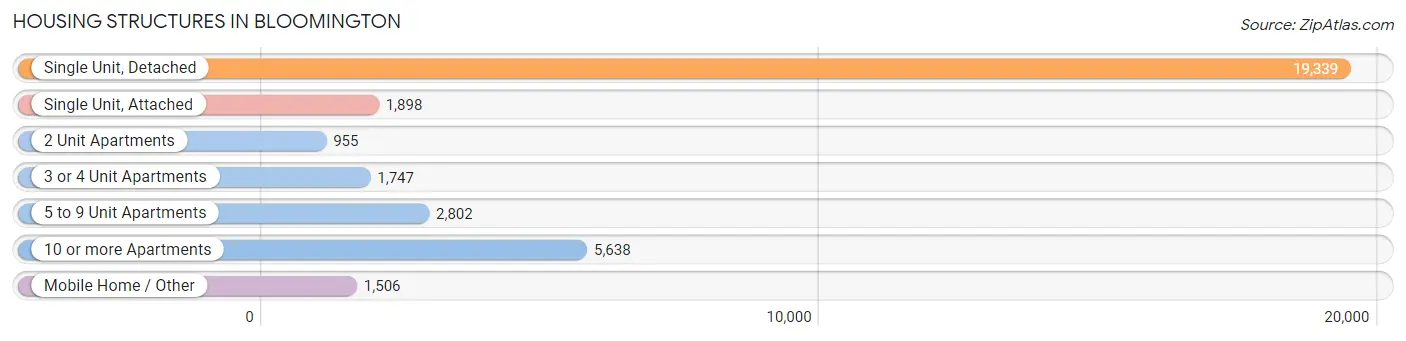
| Structure Type | # Housing Units | % Housing Units |
| Single Unit, Detached | 19,339 | 57.1% |
| Single Unit, Attached | 1,898 | 5.6% |
| 2 Unit Apartments | 955 | 2.8% |
| 3 or 4 Unit Apartments | 1,747 | 5.2% |
| 5 to 9 Unit Apartments | 2,802 | 8.3% |
| 10 or more Apartments | 5,638 | 16.6% |
| Mobile Home / Other | 1,506 | 4.4% |
| Total | 33,885 | 100.0% |
Housing Structures by Occupancy in Bloomington
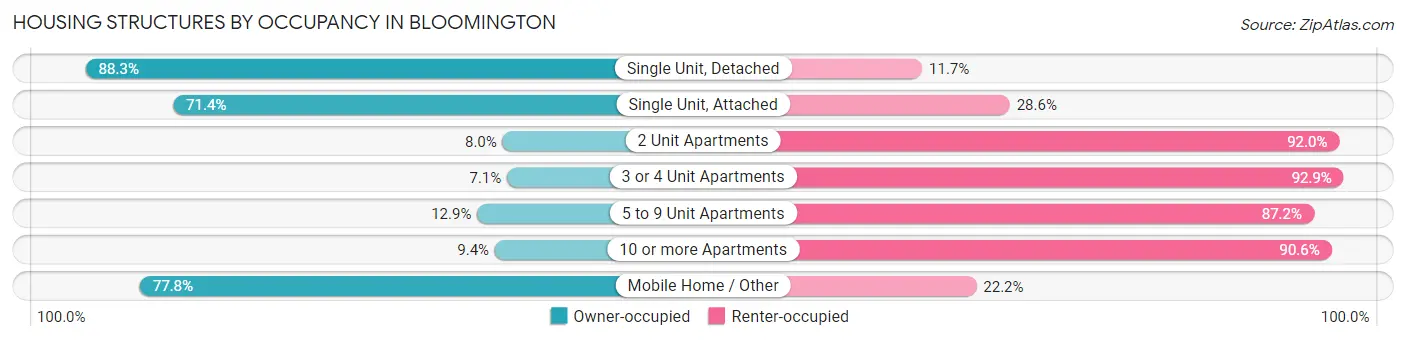
| Structure Type | Owner-occupied | Renter-occupied |
| Single Unit, Detached | 17,070 (88.3%) | 2,269 (11.7%) |
| Single Unit, Attached | 1,355 (71.4%) | 543 (28.6%) |
| 2 Unit Apartments | 76 (8.0%) | 879 (92.0%) |
| 3 or 4 Unit Apartments | 124 (7.1%) | 1,623 (92.9%) |
| 5 to 9 Unit Apartments | 360 (12.9%) | 2,442 (87.2%) |
| 10 or more Apartments | 532 (9.4%) | 5,106 (90.6%) |
| Mobile Home / Other | 1,172 (77.8%) | 334 (22.2%) |
| Total | 20,689 (61.1%) | 13,196 (38.9%) |
Housing Structures by Number of Rooms in Bloomington
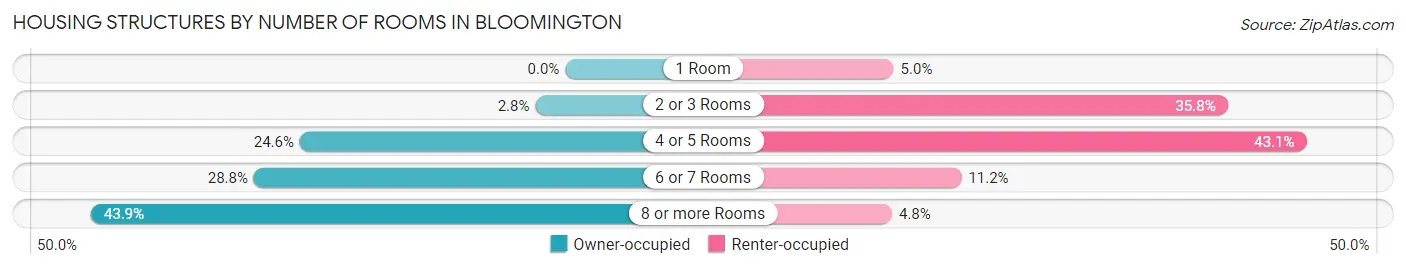
| Number of Rooms | Owner-occupied | Renter-occupied |
| 1 Room | 0 (0.0%) | 656 (5.0%) |
| 2 or 3 Rooms | 574 (2.8%) | 4,730 (35.8%) |
| 4 or 5 Rooms | 5,080 (24.5%) | 5,691 (43.1%) |
| 6 or 7 Rooms | 5,959 (28.8%) | 1,483 (11.2%) |
| 8 or more Rooms | 9,076 (43.9%) | 636 (4.8%) |
| Total | 20,689 (100.0%) | 13,196 (100.0%) |
Housing Structure by Heating Type in Bloomington
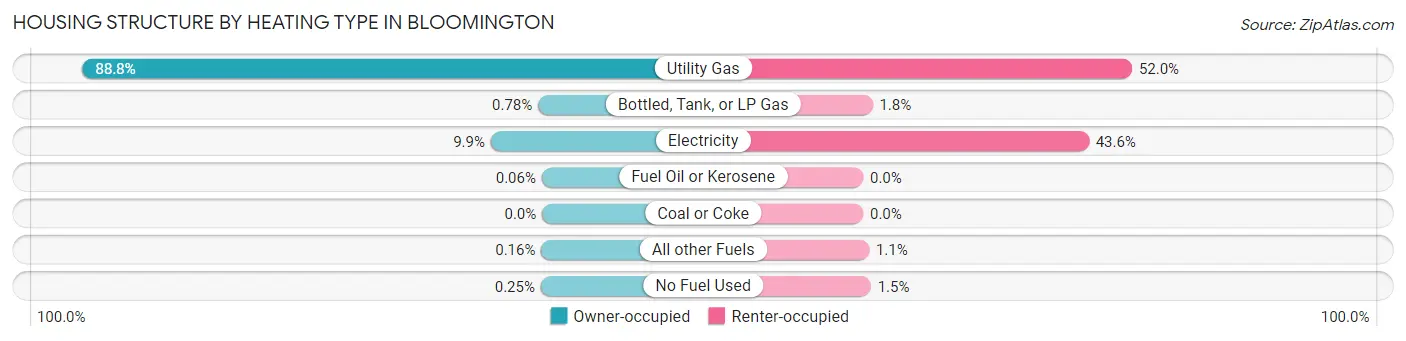
| Heating Type | Owner-occupied | Renter-occupied |
| Utility Gas | 18,379 (88.8%) | 6,857 (52.0%) |
| Bottled, Tank, or LP Gas | 161 (0.8%) | 240 (1.8%) |
| Electricity | 2,050 (9.9%) | 5,754 (43.6%) |
| Fuel Oil or Kerosene | 13 (0.1%) | 0 (0.0%) |
| Coal or Coke | 0 (0.0%) | 0 (0.0%) |
| All other Fuels | 34 (0.2%) | 150 (1.1%) |
| No Fuel Used | 52 (0.3%) | 195 (1.5%) |
| Total | 20,689 (100.0%) | 13,196 (100.0%) |
Household Vehicle Usage in Bloomington
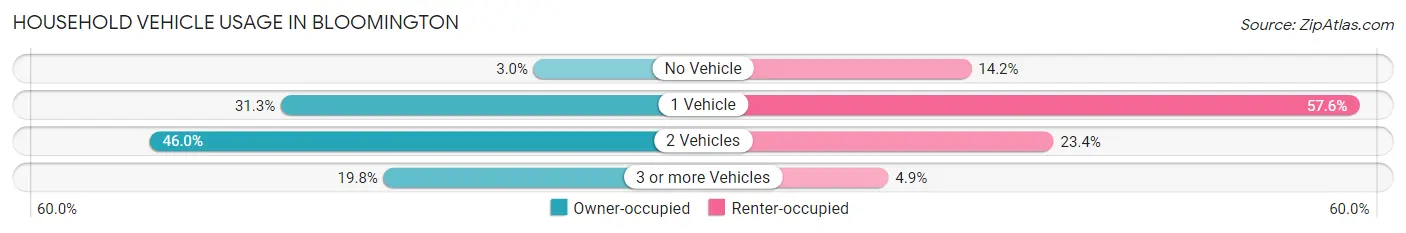
| Vehicles per Household | Owner-occupied | Renter-occupied |
| No Vehicle | 610 (2.9%) | 1,869 (14.2%) |
| 1 Vehicle | 6,472 (31.3%) | 7,599 (57.6%) |
| 2 Vehicles | 9,514 (46.0%) | 3,085 (23.4%) |
| 3 or more Vehicles | 4,093 (19.8%) | 643 (4.9%) |
| Total | 20,689 (100.0%) | 13,196 (100.0%) |
Real Estate & Mortgages in Bloomington
Real Estate and Mortgage Overview in Bloomington
| Characteristic | Without Mortgage | With Mortgage |
| Housing Units | 7,712 | 12,977 |
| Median Property Value | $167,900 | $199,500 |
| Median Household Income | $70,987 | $3,797 |
| Monthly Housing Costs | $642 | $986 |
| Real Estate Taxes | $3,713 | $74 |
Property Value by Mortgage Status in Bloomington
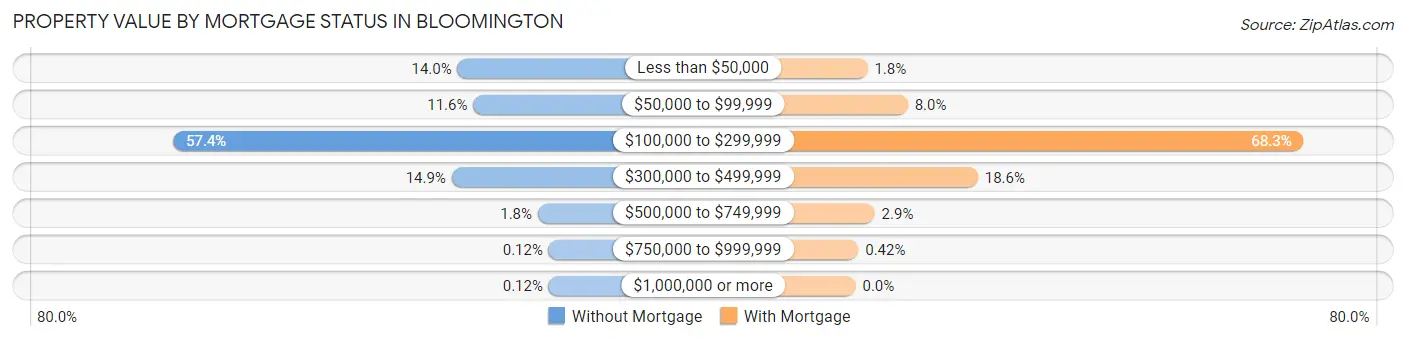
| Property Value | Without Mortgage | With Mortgage |
| Less than $50,000 | 1,082 (14.0%) | 236 (1.8%) |
| $50,000 to $99,999 | 897 (11.6%) | 1,032 (8.0%) |
| $100,000 to $299,999 | 4,426 (57.4%) | 8,859 (68.3%) |
| $300,000 to $499,999 | 1,151 (14.9%) | 2,418 (18.6%) |
| $500,000 to $749,999 | 138 (1.8%) | 378 (2.9%) |
| $750,000 to $999,999 | 9 (0.1%) | 54 (0.4%) |
| $1,000,000 or more | 9 (0.1%) | 0 (0.0%) |
| Total | 7,712 (100.0%) | 12,977 (100.0%) |
Household Income by Mortgage Status in Bloomington
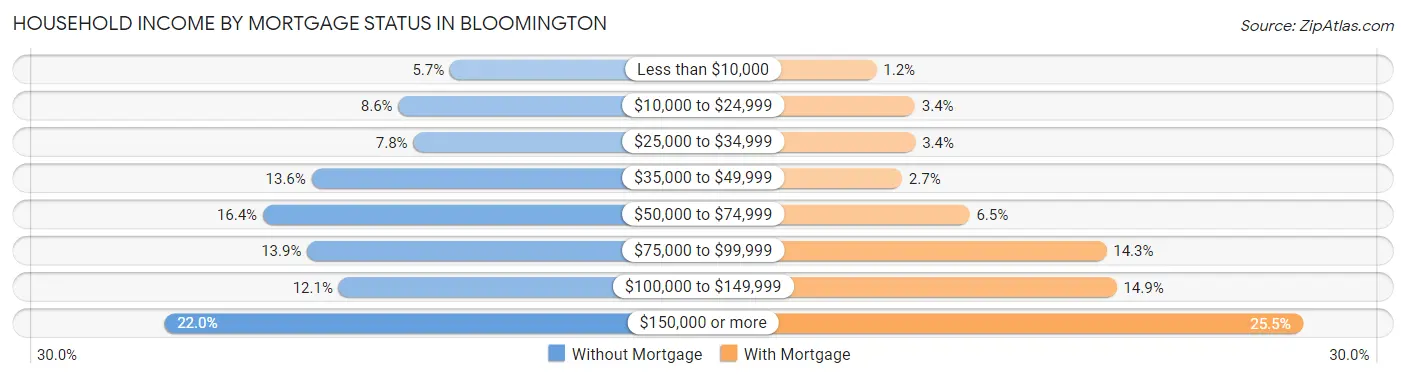
| Household Income | Without Mortgage | With Mortgage |
| Less than $10,000 | 439 (5.7%) | 154 (1.2%) |
| $10,000 to $24,999 | 666 (8.6%) | 440 (3.4%) |
| $25,000 to $34,999 | 600 (7.8%) | 442 (3.4%) |
| $35,000 to $49,999 | 1,049 (13.6%) | 344 (2.6%) |
| $50,000 to $74,999 | 1,263 (16.4%) | 845 (6.5%) |
| $75,000 to $99,999 | 1,068 (13.9%) | 1,860 (14.3%) |
| $100,000 to $149,999 | 929 (12.0%) | 1,935 (14.9%) |
| $150,000 or more | 1,698 (22.0%) | 3,314 (25.5%) |
| Total | 7,712 (100.0%) | 12,977 (100.0%) |
Property Value to Household Income Ratio in Bloomington
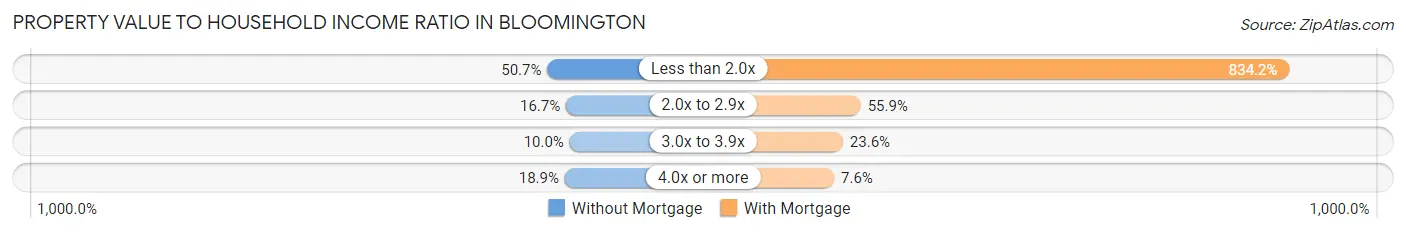
| Value-to-Income Ratio | Without Mortgage | With Mortgage |
| Less than 2.0x | 3,912 (50.7%) | 108,250 (834.2%) |
| 2.0x to 2.9x | 1,291 (16.7%) | 7,250 (55.9%) |
| 3.0x to 3.9x | 772 (10.0%) | 3,057 (23.6%) |
| 4.0x or more | 1,459 (18.9%) | 982 (7.6%) |
| Total | 7,712 (100.0%) | 12,977 (100.0%) |
Real Estate Taxes by Mortgage Status in Bloomington
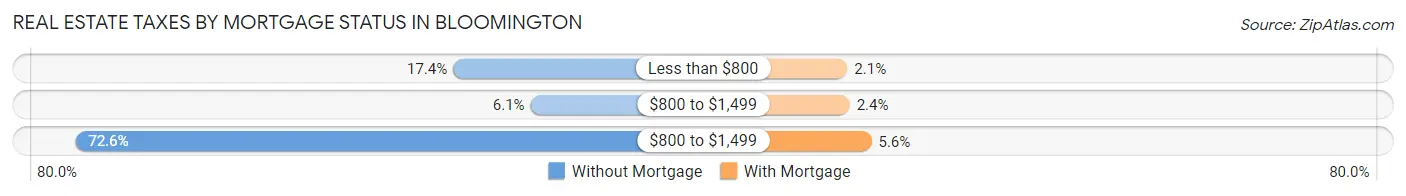
| Property Taxes | Without Mortgage | With Mortgage |
| Less than $800 | 1,342 (17.4%) | 273 (2.1%) |
| $800 to $1,499 | 470 (6.1%) | 317 (2.4%) |
| $800 to $1,499 | 5,598 (72.6%) | 729 (5.6%) |
| Total | 7,712 (100.0%) | 12,977 (100.0%) |
Health & Disability in Bloomington
Health Insurance Coverage by Age in Bloomington
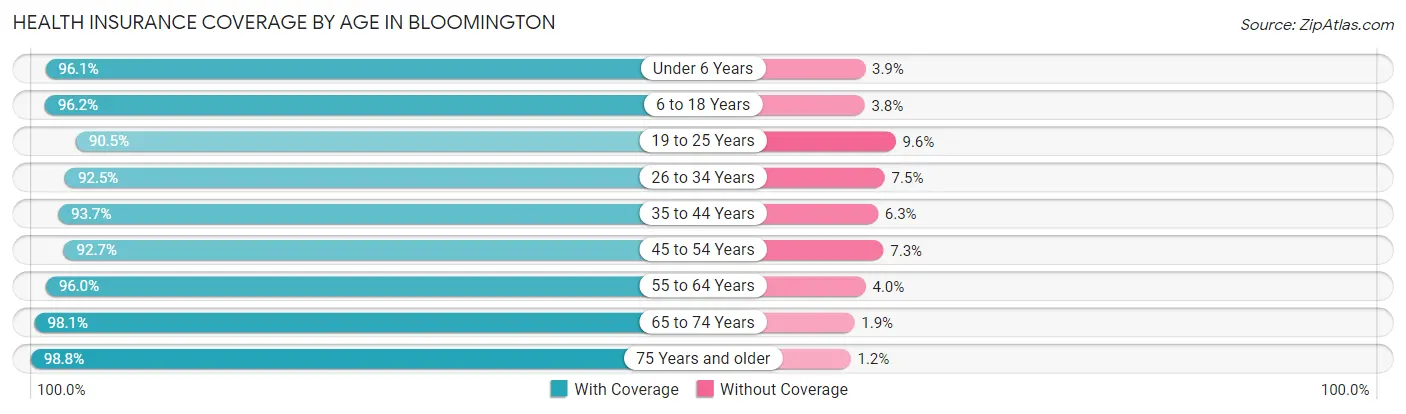
| Age Bracket | With Coverage | Without Coverage |
| Under 6 Years | 5,545 (96.1%) | 223 (3.9%) |
| 6 to 18 Years | 12,421 (96.2%) | 486 (3.8%) |
| 19 to 25 Years | 8,051 (90.4%) | 850 (9.6%) |
| 26 to 34 Years | 9,777 (92.5%) | 796 (7.5%) |
| 35 to 44 Years | 9,945 (93.7%) | 664 (6.3%) |
| 45 to 54 Years | 8,766 (92.7%) | 688 (7.3%) |
| 55 to 64 Years | 8,989 (96.0%) | 371 (4.0%) |
| 65 to 74 Years | 6,654 (98.1%) | 127 (1.9%) |
| 75 Years and older | 3,839 (98.8%) | 45 (1.2%) |
| Total | 73,987 (94.6%) | 4,250 (5.4%) |
Health Insurance Coverage by Citizenship Status in Bloomington
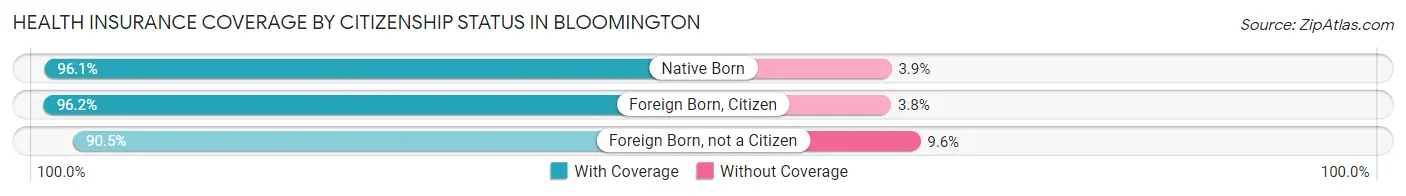
| Citizenship Status | With Coverage | Without Coverage |
| Native Born | 5,545 (96.1%) | 223 (3.9%) |
| Foreign Born, Citizen | 12,421 (96.2%) | 486 (3.8%) |
| Foreign Born, not a Citizen | 8,051 (90.4%) | 850 (9.6%) |
Health Insurance Coverage by Household Income in Bloomington
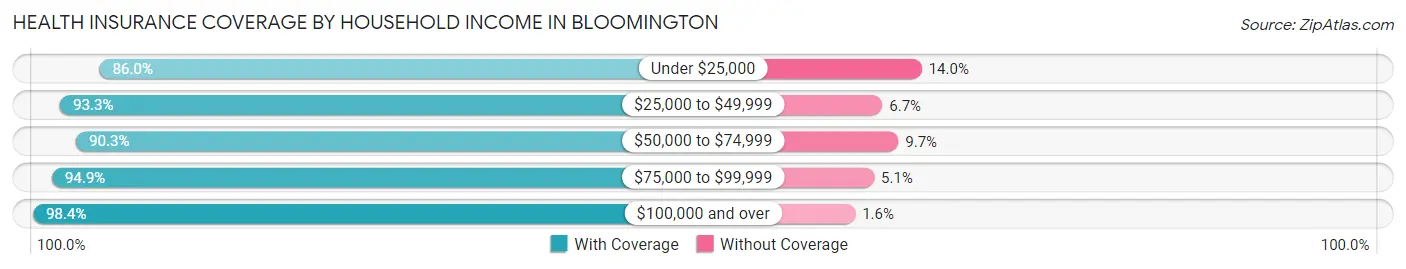
| Household Income | With Coverage | Without Coverage |
| Under $25,000 | 7,855 (86.0%) | 1,283 (14.0%) |
| $25,000 to $49,999 | 9,451 (93.3%) | 674 (6.7%) |
| $50,000 to $74,999 | 10,589 (90.3%) | 1,132 (9.7%) |
| $75,000 to $99,999 | 11,278 (94.9%) | 608 (5.1%) |
| $100,000 and over | 33,400 (98.4%) | 536 (1.6%) |
Public vs Private Health Insurance Coverage by Age in Bloomington
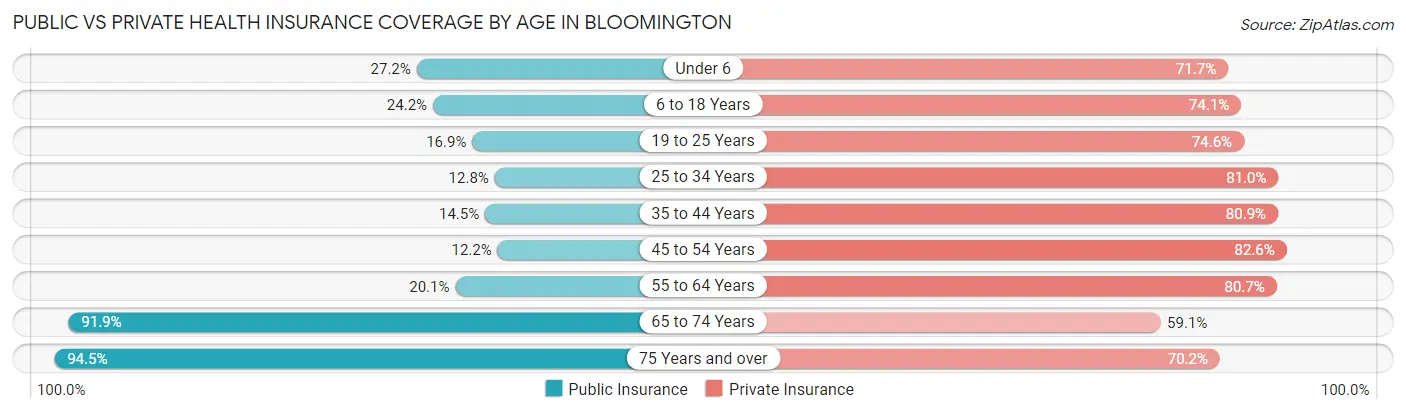
| Age Bracket | Public Insurance | Private Insurance |
| Under 6 | 1,571 (27.2%) | 4,135 (71.7%) |
| 6 to 18 Years | 3,125 (24.2%) | 9,567 (74.1%) |
| 19 to 25 Years | 1,505 (16.9%) | 6,644 (74.6%) |
| 25 to 34 Years | 1,348 (12.8%) | 8,566 (81.0%) |
| 35 to 44 Years | 1,542 (14.5%) | 8,587 (80.9%) |
| 45 to 54 Years | 1,155 (12.2%) | 7,805 (82.6%) |
| 55 to 64 Years | 1,877 (20.1%) | 7,554 (80.7%) |
| 65 to 74 Years | 6,230 (91.9%) | 4,007 (59.1%) |
| 75 Years and over | 3,670 (94.5%) | 2,725 (70.2%) |
| Total | 22,023 (28.1%) | 59,590 (76.2%) |
Disability Status by Sex by Age in Bloomington
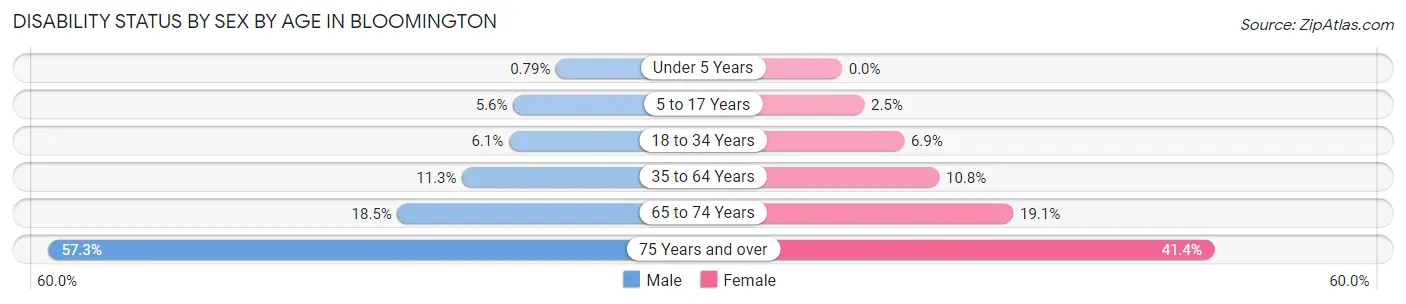
| Age Bracket | Male | Female |
| Under 5 Years | 21 (0.8%) | 0 (0.0%) |
| 5 to 17 Years | 336 (5.6%) | 160 (2.5%) |
| 18 to 34 Years | 650 (6.0%) | 695 (6.9%) |
| 35 to 64 Years | 1,660 (11.3%) | 1,589 (10.8%) |
| 65 to 74 Years | 570 (18.4%) | 704 (19.1%) |
| 75 Years and over | 876 (57.3%) | 976 (41.4%) |
Disability Class by Sex by Age in Bloomington
Disability Class: Hearing Difficulty
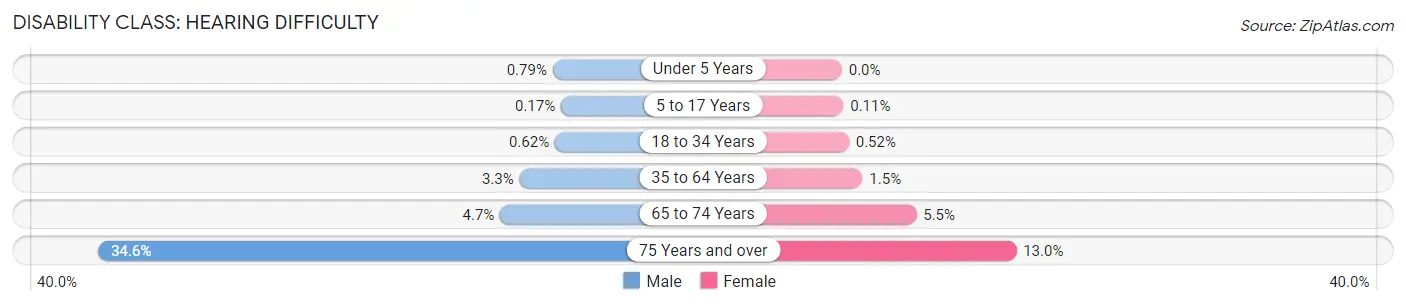
| Age Bracket | Male | Female |
| Under 5 Years | 21 (0.8%) | 0 (0.0%) |
| 5 to 17 Years | 10 (0.2%) | 7 (0.1%) |
| 18 to 34 Years | 67 (0.6%) | 52 (0.5%) |
| 35 to 64 Years | 479 (3.3%) | 224 (1.5%) |
| 65 to 74 Years | 145 (4.7%) | 204 (5.5%) |
| 75 Years and over | 528 (34.5%) | 305 (13.0%) |
Disability Class: Vision Difficulty
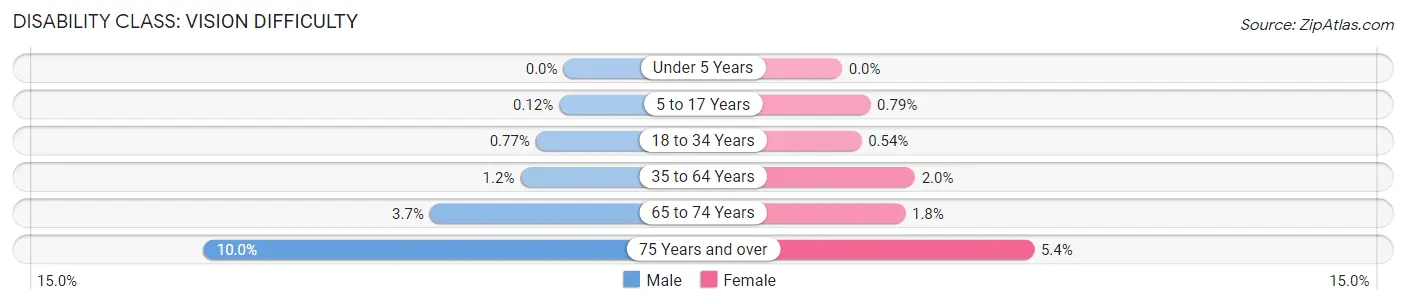
| Age Bracket | Male | Female |
| Under 5 Years | 0 (0.0%) | 0 (0.0%) |
| 5 to 17 Years | 7 (0.1%) | 51 (0.8%) |
| 18 to 34 Years | 83 (0.8%) | 54 (0.5%) |
| 35 to 64 Years | 177 (1.2%) | 298 (2.0%) |
| 65 to 74 Years | 115 (3.7%) | 65 (1.8%) |
| 75 Years and over | 153 (10.0%) | 126 (5.3%) |
Disability Class: Cognitive Difficulty
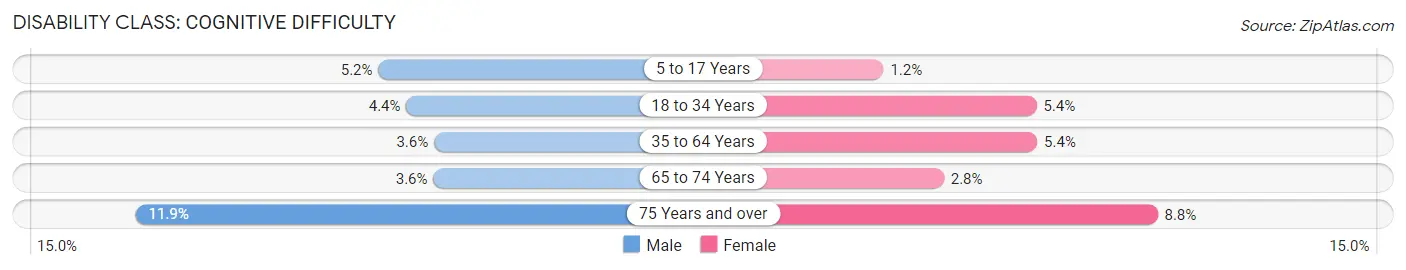
| Age Bracket | Male | Female |
| 5 to 17 Years | 311 (5.1%) | 75 (1.2%) |
| 18 to 34 Years | 469 (4.4%) | 544 (5.4%) |
| 35 to 64 Years | 531 (3.6%) | 798 (5.4%) |
| 65 to 74 Years | 112 (3.6%) | 105 (2.8%) |
| 75 Years and over | 182 (11.9%) | 207 (8.8%) |
Disability Class: Ambulatory Difficulty
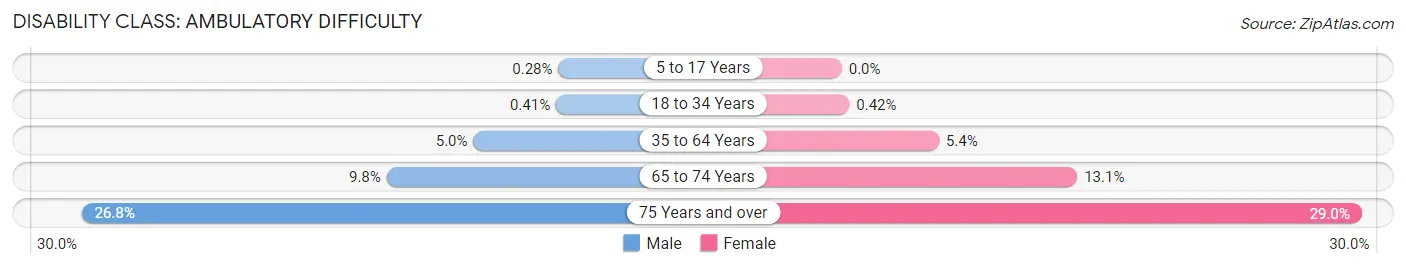
| Age Bracket | Male | Female |
| 5 to 17 Years | 17 (0.3%) | 0 (0.0%) |
| 18 to 34 Years | 44 (0.4%) | 42 (0.4%) |
| 35 to 64 Years | 739 (5.0%) | 794 (5.4%) |
| 65 to 74 Years | 304 (9.8%) | 484 (13.1%) |
| 75 Years and over | 410 (26.8%) | 682 (28.9%) |
Disability Class: Self-Care Difficulty
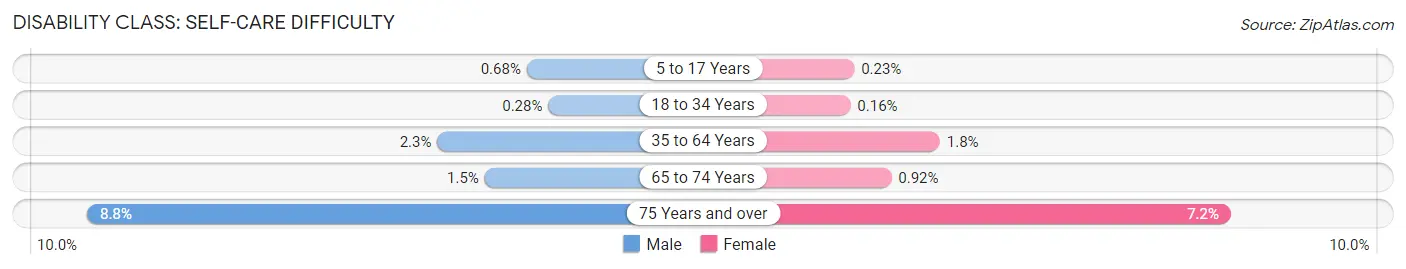
| Age Bracket | Male | Female |
| 5 to 17 Years | 41 (0.7%) | 15 (0.2%) |
| 18 to 34 Years | 30 (0.3%) | 16 (0.2%) |
| 35 to 64 Years | 346 (2.3%) | 267 (1.8%) |
| 65 to 74 Years | 45 (1.5%) | 34 (0.9%) |
| 75 Years and over | 135 (8.8%) | 170 (7.2%) |
Technology Access in Bloomington
Computing Device Access in Bloomington
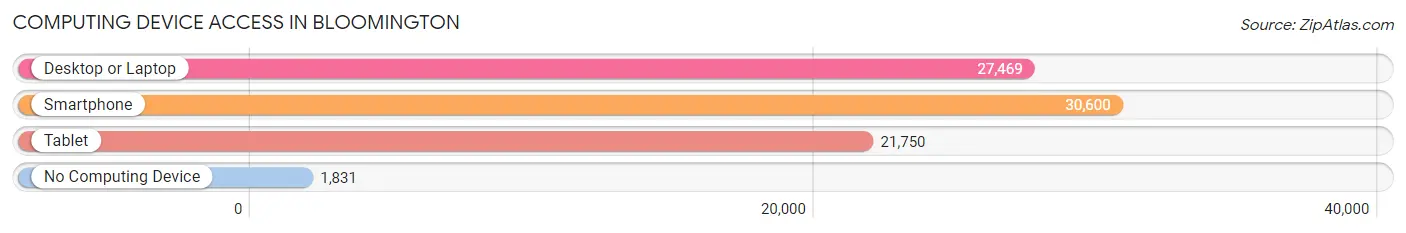
| Device Type | # Households | % Households |
| Desktop or Laptop | 27,469 | 81.1% |
| Smartphone | 30,600 | 90.3% |
| Tablet | 21,750 | 64.2% |
| No Computing Device | 1,831 | 5.4% |
| Total | 33,885 | 100.0% |
Internet Access in Bloomington
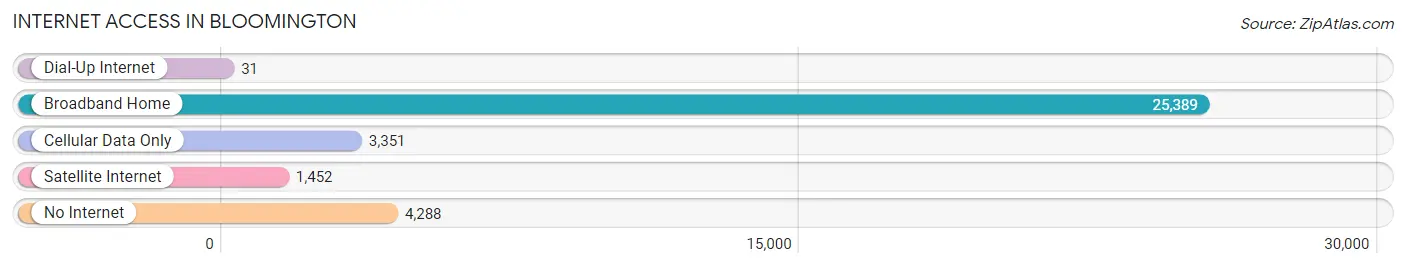
| Internet Type | # Households | % Households |
| Dial-Up Internet | 31 | 0.1% |
| Broadband Home | 25,389 | 74.9% |
| Cellular Data Only | 3,351 | 9.9% |
| Satellite Internet | 1,452 | 4.3% |
| No Internet | 4,288 | 12.7% |
| Total | 33,885 | 100.0% |
Bloomington Summary
Bloomington, Illinois is a city located in McLean County, Illinois, United States. It is the county seat of McLean County and the 12th most populous city in the state of Illinois. The city is located in the heart of the Midwest, approximately halfway between Chicago and St. Louis. Bloomington is the home of Illinois State University and the headquarters of State Farm Insurance.
History
Bloomington was founded in 1831 by a group of settlers from Kentucky, Tennessee, and Virginia. The city was named after Bloomington, Indiana, which was named after the blooming flowers that were found in the area. The city was incorporated in 1855 and was the first city in McLean County.
In the late 19th century, Bloomington was a major stop on the Underground Railroad. The city was also home to the first African-American church in the county, the Second Baptist Church.
In the early 20th century, Bloomington was a major center for the manufacturing of farm equipment. The city was also home to the first public library in the county, the Bloomington Public Library.
Geography
Bloomington is located in central Illinois, approximately halfway between Chicago and St. Louis. The city is situated on the banks of the Illinois River and is surrounded by rolling hills and farmland. The city has a total area of 24.2 square miles, of which 24.1 square miles is land and 0.1 square miles is water.
Economy
Bloomington is a major economic center in central Illinois. The city is home to several major employers, including State Farm Insurance, Illinois State University, and Mitsubishi Motors. The city is also home to several major retail and entertainment venues, including Eastland Mall and the Bloomington Center for the Performing Arts.
Demographics
As of the 2010 census, the population of Bloomington was 76,610. The racial makeup of the city was 79.2% White, 11.2% African American, 0.3% Native American, 3.2% Asian, 0.1% Pacific Islander, 3.3% from other races, and 2.9% from two or more races. Hispanic or Latino of any race were 8.2% of the population.
The median income for a household in the city was $45,902, and the median income for a family was $56,945. The per capita income for the city was $23,837. About 11.2% of families and 16.2% of the population were below the poverty line, including 22.2% of those under age 18 and 8.2% of those age 65 or over.
Common Questions
What is Per Capita Income in Bloomington?
Per Capita income in Bloomington is $42,286.
What is the Median Family Income in Bloomington?
Median Family Income in Bloomington is $100,890.
What is the Median Household income in Bloomington?
Median Household Income in Bloomington is $73,119.
What is Income or Wage Gap in Bloomington?
Income or Wage Gap in Bloomington is 31.0%.
Women in Bloomington earn 69.0 cents for every dollar earned by a man.
What is Family Income Deficit in Bloomington?
Family Income Deficit in Bloomington is $13,657.
Families that are below poverty line in Bloomington earn $13,657 less on average than the poverty threshold level.
What is Inequality or Gini Index in Bloomington?
Inequality or Gini Index in Bloomington is 0.48.
What is the Total Population of Bloomington?
Total Population of Bloomington is 78,788.
What is the Total Male Population of Bloomington?
Total Male Population of Bloomington is 39,151.
What is the Total Female Population of Bloomington?
Total Female Population of Bloomington is 39,637.
What is the Ratio of Males per 100 Females in Bloomington?
There are 98.77 Males per 100 Females in Bloomington.
What is the Ratio of Females per 100 Males in Bloomington?
There are 101.24 Females per 100 Males in Bloomington.
What is the Median Population Age in Bloomington?
Median Population Age in Bloomington is 35.9 Years.
What is the Average Family Size in Bloomington
Average Family Size in Bloomington is 3.0 People.
What is the Average Household Size in Bloomington
Average Household Size in Bloomington is 2.3 People.
How Large is the Labor Force in Bloomington?
There are 40,897 People in the Labor Forcein in Bloomington.
What is the Percentage of People in the Labor Force in Bloomington?
64.6% of People are in the Labor Force in Bloomington.
What is the Unemployment Rate in Bloomington?
Unemployment Rate in Bloomington is 3.3%.