Campbell, CA Map & Demographics
Campbell Map
Campbell Overview
$77,923
PER CAPITA INCOME
$182,790
AVG FAMILY INCOME
$141,794
AVG HOUSEHOLD INCOME
35.9%
WAGE / INCOME GAP [ % ]
64.1¢/ $1
WAGE / INCOME GAP [ $ ]
$10,999
FAMILY INCOME DEFICIT
0.46
INEQUALITY / GINI INDEX
43,464
TOTAL POPULATION
21,571
MALE POPULATION
21,893
FEMALE POPULATION
98.53
MALES / 100 FEMALES
101.49
FEMALES / 100 MALES
39.3
MEDIAN AGE
3.1
AVG FAMILY SIZE
2.5
AVG HOUSEHOLD SIZE
24,560
LABOR FORCE [ PEOPLE ]
69.7%
PERCENT IN LABOR FORCE
3.9%
UNEMPLOYMENT RATE
Campbell Zip Codes
Income in Campbell
Income Overview in Campbell
Per Capita Income in Campbell is $77,923, while median incomes of families and households are $182,790 and $141,794 respectively.
| Characteristic | Number | Measure |
| Per Capita Income | 43,464 | $77,923 |
| Median Family Income | 11,075 | $182,790 |
| Mean Family Income | 11,075 | $228,642 |
| Median Household Income | 17,064 | $141,794 |
| Mean Household Income | 17,064 | $193,966 |
| Income Deficit | 11,075 | $10,999 |
| Wage / Income Gap (%) | 43,464 | 35.86% |
| Wage / Income Gap ($) | 43,464 | 64.14¢ per $1 |
| Gini / Inequality Index | 43,464 | 0.46 |
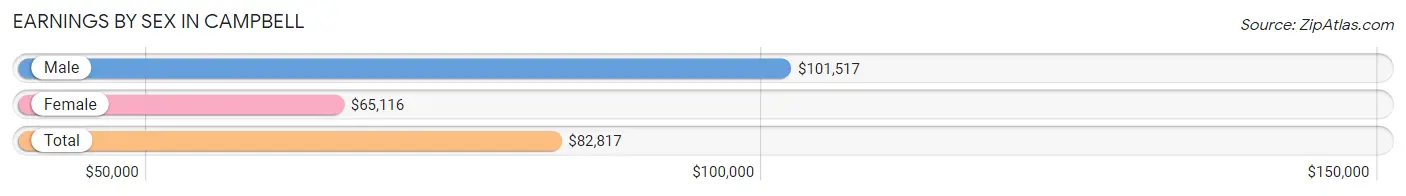
Earnings by Sex in Campbell
Average Earnings in Campbell are $82,817, $101,517 for men and $65,116 for women, a difference of 35.9%.
| Sex | Number | Average Earnings |
| Male | 13,842 (54.6%) | $101,517 |
| Female | 11,493 (45.4%) | $65,116 |
| Total | 25,335 (100.0%) | $82,817 |
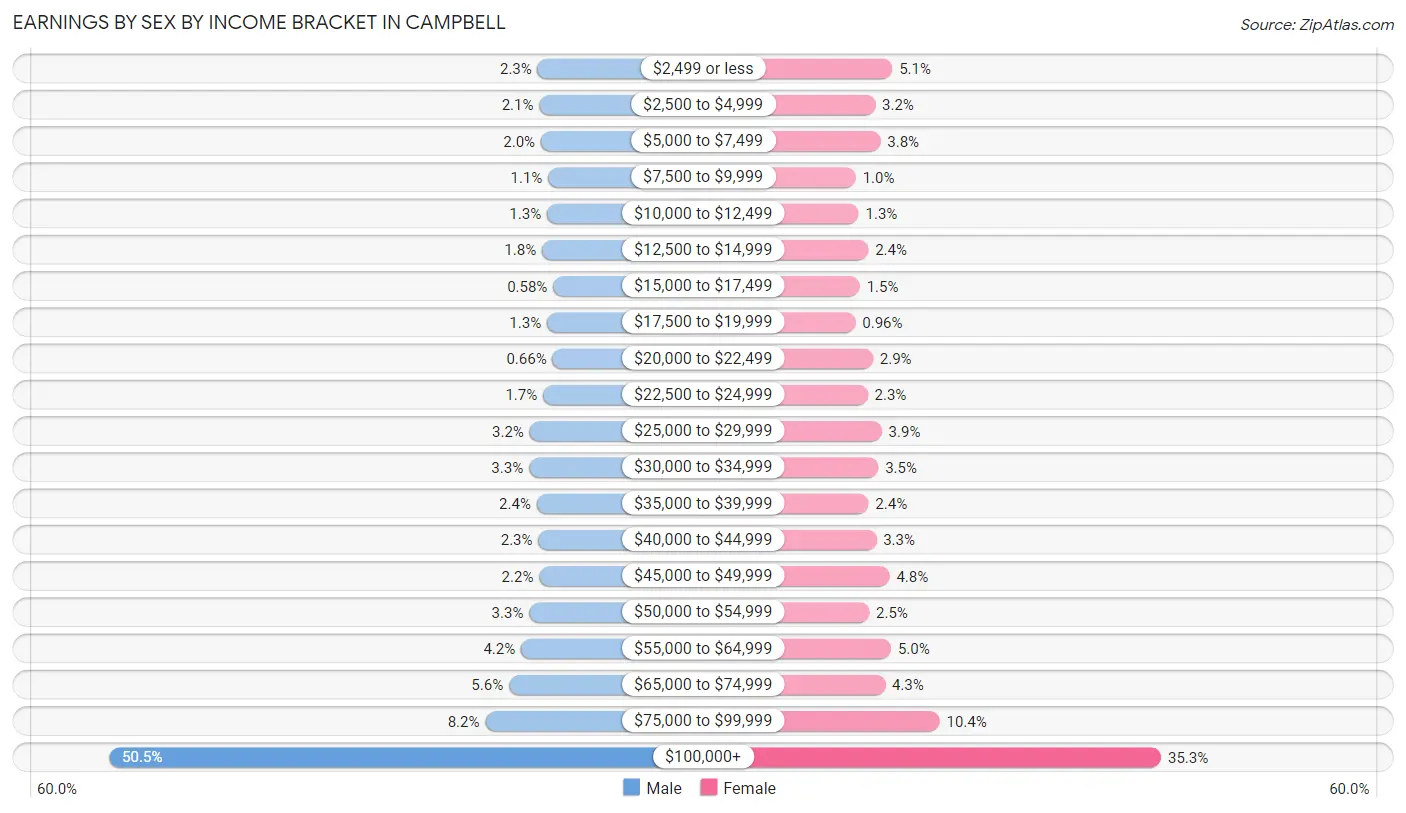
Earnings by Sex by Income Bracket in Campbell
The most common earnings brackets in Campbell are $100,000+ for men (6,992 | 50.5%) and $100,000+ for women (4,061 | 35.3%).
| Income | Male | Female |
| $2,499 or less | 322 (2.3%) | 587 (5.1%) |
| $2,500 to $4,999 | 296 (2.1%) | 365 (3.2%) |
| $5,000 to $7,499 | 271 (2.0%) | 433 (3.8%) |
| $7,500 to $9,999 | 158 (1.1%) | 115 (1.0%) |
| $10,000 to $12,499 | 177 (1.3%) | 153 (1.3%) |
| $12,500 to $14,999 | 255 (1.8%) | 277 (2.4%) |
| $15,000 to $17,499 | 80 (0.6%) | 167 (1.5%) |
| $17,500 to $19,999 | 177 (1.3%) | 110 (1.0%) |
| $20,000 to $22,499 | 92 (0.7%) | 337 (2.9%) |
| $22,500 to $24,999 | 238 (1.7%) | 269 (2.3%) |
| $25,000 to $29,999 | 446 (3.2%) | 450 (3.9%) |
| $30,000 to $34,999 | 457 (3.3%) | 406 (3.5%) |
| $35,000 to $39,999 | 336 (2.4%) | 279 (2.4%) |
| $40,000 to $44,999 | 311 (2.2%) | 380 (3.3%) |
| $45,000 to $49,999 | 298 (2.1%) | 552 (4.8%) |
| $50,000 to $54,999 | 452 (3.3%) | 289 (2.5%) |
| $55,000 to $64,999 | 580 (4.2%) | 571 (5.0%) |
| $65,000 to $74,999 | 768 (5.6%) | 493 (4.3%) |
| $75,000 to $99,999 | 1,136 (8.2%) | 1,199 (10.4%) |
| $100,000+ | 6,992 (50.5%) | 4,061 (35.3%) |
| Total | 13,842 (100.0%) | 11,493 (100.0%) |
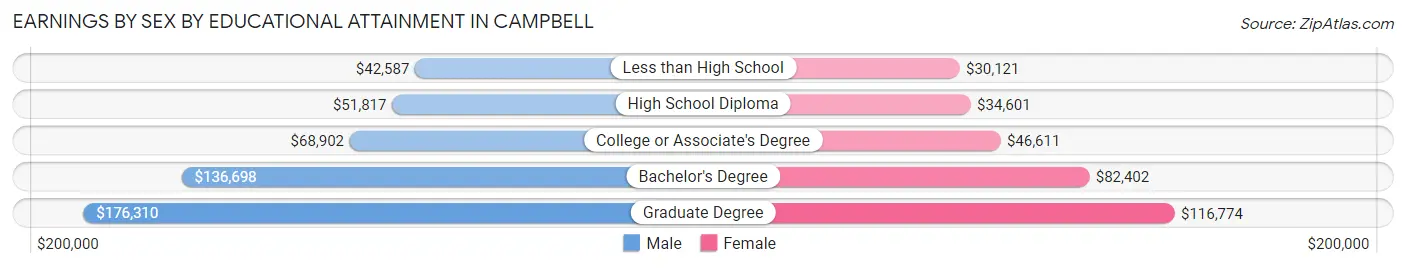
Earnings by Sex by Educational Attainment in Campbell
Average earnings in Campbell are $113,090 for men and $74,240 for women, a difference of 34.4%. Men with an educational attainment of graduate degree enjoy the highest average annual earnings of $176,310, while those with less than high school education earn the least with $42,587. Women with an educational attainment of graduate degree earn the most with the average annual earnings of $116,774, while those with less than high school education have the smallest earnings of $30,121.
| Educational Attainment | Male Income | Female Income |
| Less than High School | $42,587 | $30,121 |
| High School Diploma | $51,817 | $34,601 |
| College or Associate's Degree | $68,902 | $46,611 |
| Bachelor's Degree | $136,698 | $82,402 |
| Graduate Degree | $176,310 | $116,774 |
| Total | $113,090 | $74,240 |
Family Income in Campbell
Family Income Brackets in Campbell
According to the Campbell family income data, there are 5,017 families falling into the $200,000+ income range, which is the most common income bracket and makes up 45.3% of all families. Conversely, the $10,000 to $14,999 income bracket is the least frequent group with only 55 families (0.5%) belonging to this category.
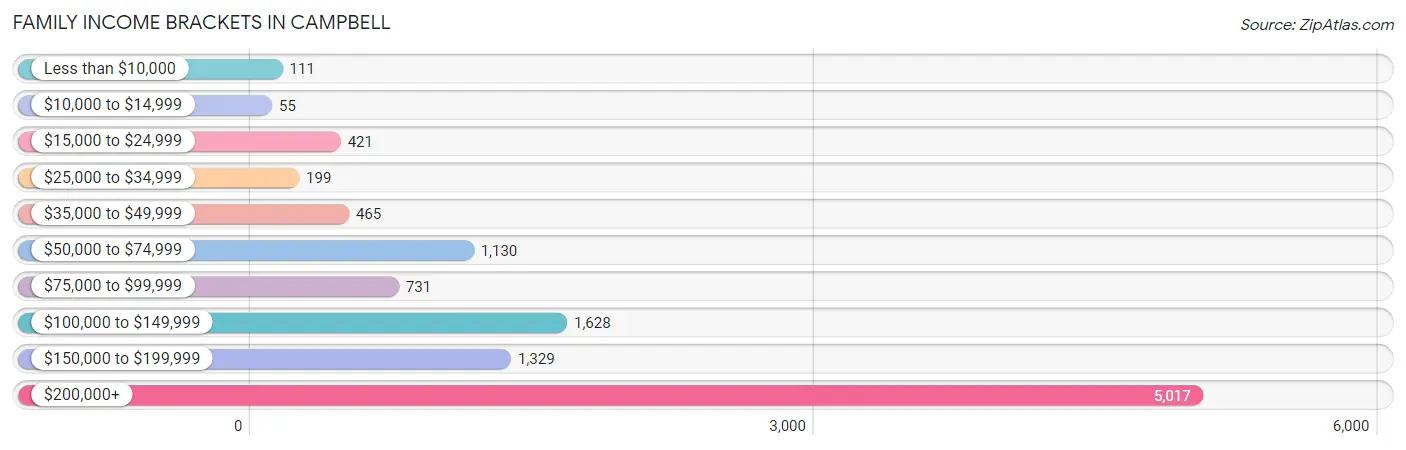
| Income Bracket | # Families | % Families |
| Less than $10,000 | 111 | 1.0% |
| $10,000 to $14,999 | 55 | 0.5% |
| $15,000 to $24,999 | 421 | 3.8% |
| $25,000 to $34,999 | 199 | 1.8% |
| $35,000 to $49,999 | 465 | 4.2% |
| $50,000 to $74,999 | 1,130 | 10.2% |
| $75,000 to $99,999 | 731 | 6.6% |
| $100,000 to $149,999 | 1,628 | 14.7% |
| $150,000 to $199,999 | 1,329 | 12.0% |
| $200,000+ | 5,017 | 45.3% |
Family Income by Famaliy Size in Campbell
6-person families (112 | 1.0%) account for the highest median family income in Campbell with $243,864 per family, while 2-person families (4,751 | 42.9%) have the highest median income of $66,238 per family member.
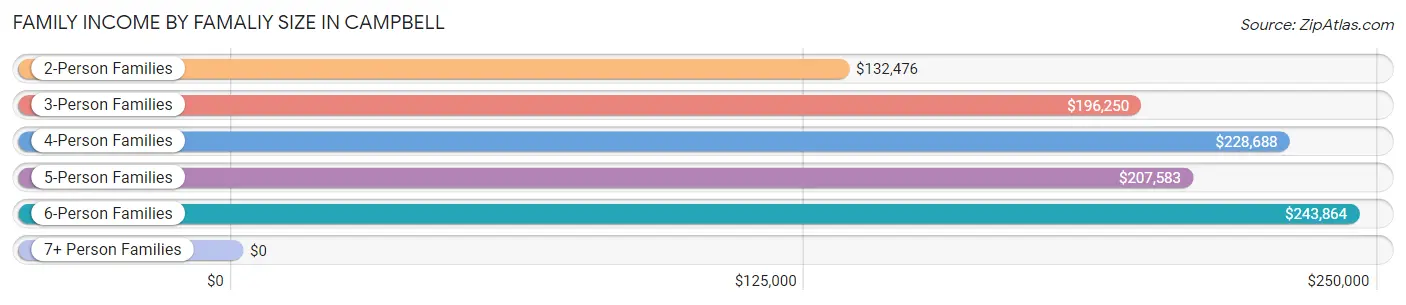
| Income Bracket | # Families | Median Income |
| 2-Person Families | 4,751 (42.9%) | $132,476 |
| 3-Person Families | 2,689 (24.3%) | $196,250 |
| 4-Person Families | 2,653 (23.9%) | $228,688 |
| 5-Person Families | 821 (7.4%) | $207,583 |
| 6-Person Families | 112 (1.0%) | $243,864 |
| 7+ Person Families | 49 (0.4%) | $0 |
| Total | 11,075 (100.0%) | $182,790 |
Family Income by Number of Earners in Campbell
The median family income in Campbell is $182,790, with families comprising 2 earners (5,225) having the highest median family income of $225,958, while families with no earners (1,146) have the lowest median family income of $63,912, accounting for 47.2% and 10.3% of families, respectively.
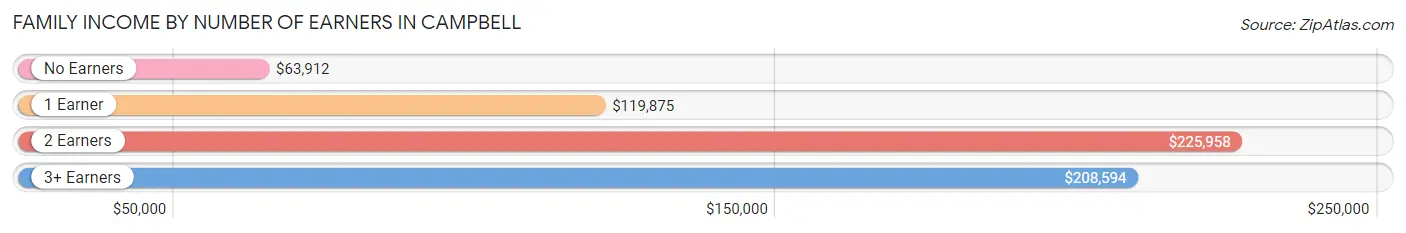
| Number of Earners | # Families | Median Income |
| No Earners | 1,146 (10.3%) | $63,912 |
| 1 Earner | 3,269 (29.5%) | $119,875 |
| 2 Earners | 5,225 (47.2%) | $225,958 |
| 3+ Earners | 1,435 (13.0%) | $208,594 |
| Total | 11,075 (100.0%) | $182,790 |
Household Income in Campbell
Household Income Brackets in Campbell
With 6,126 households falling in the category, the $200,000+ income range is the most frequent in Campbell, accounting for 35.9% of all households. In contrast, only 392 households (2.3%) fall into the $10,000 to $14,999 income bracket, making it the least populous group.
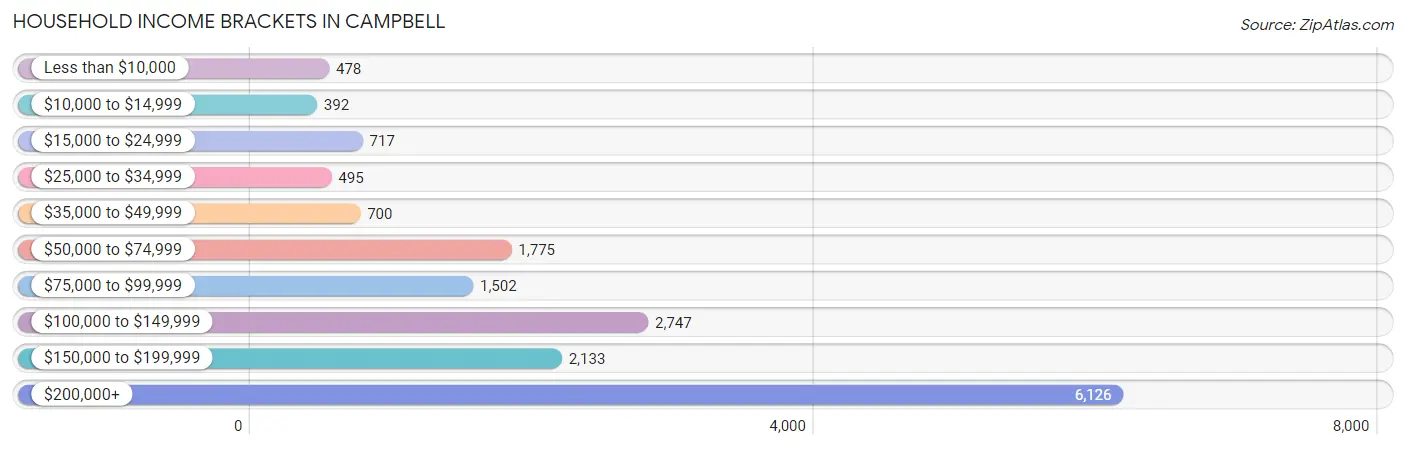
| Income Bracket | # Households | % Households |
| Less than $10,000 | 478 | 2.8% |
| $10,000 to $14,999 | 392 | 2.3% |
| $15,000 to $24,999 | 717 | 4.2% |
| $25,000 to $34,999 | 495 | 2.9% |
| $35,000 to $49,999 | 700 | 4.1% |
| $50,000 to $74,999 | 1,775 | 10.4% |
| $75,000 to $99,999 | 1,502 | 8.8% |
| $100,000 to $149,999 | 2,747 | 16.1% |
| $150,000 to $199,999 | 2,133 | 12.5% |
| $200,000+ | 6,126 | 35.9% |
Household Income by Householder Age in Campbell
The median household income in Campbell is $141,794, with the highest median household income of $186,230 found in the 45 to 64 years age bracket for the primary householder. A total of 6,649 households (39.0%) fall into this category. Meanwhile, the 15 to 24 years age bracket for the primary householder has the lowest median household income of $62,225, with 163 households (1.0%) in this group.
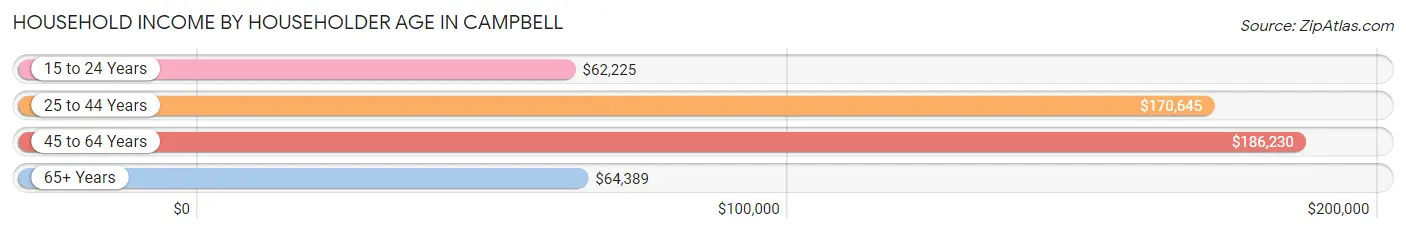
| Income Bracket | # Households | Median Income |
| 15 to 24 Years | 163 (1.0%) | $62,225 |
| 25 to 44 Years | 6,462 (37.9%) | $170,645 |
| 45 to 64 Years | 6,649 (39.0%) | $186,230 |
| 65+ Years | 3,790 (22.2%) | $64,389 |
| Total | 17,064 (100.0%) | $141,794 |
Poverty in Campbell
Income Below Poverty by Sex and Age in Campbell
With 4.5% poverty level for males and 6.7% for females among the residents of Campbell, 6 to 11 year old males and 75 year old and over females are the most vulnerable to poverty, with 108 males (6.2%) and 362 females (19.8%) in their respective age groups living below the poverty level.
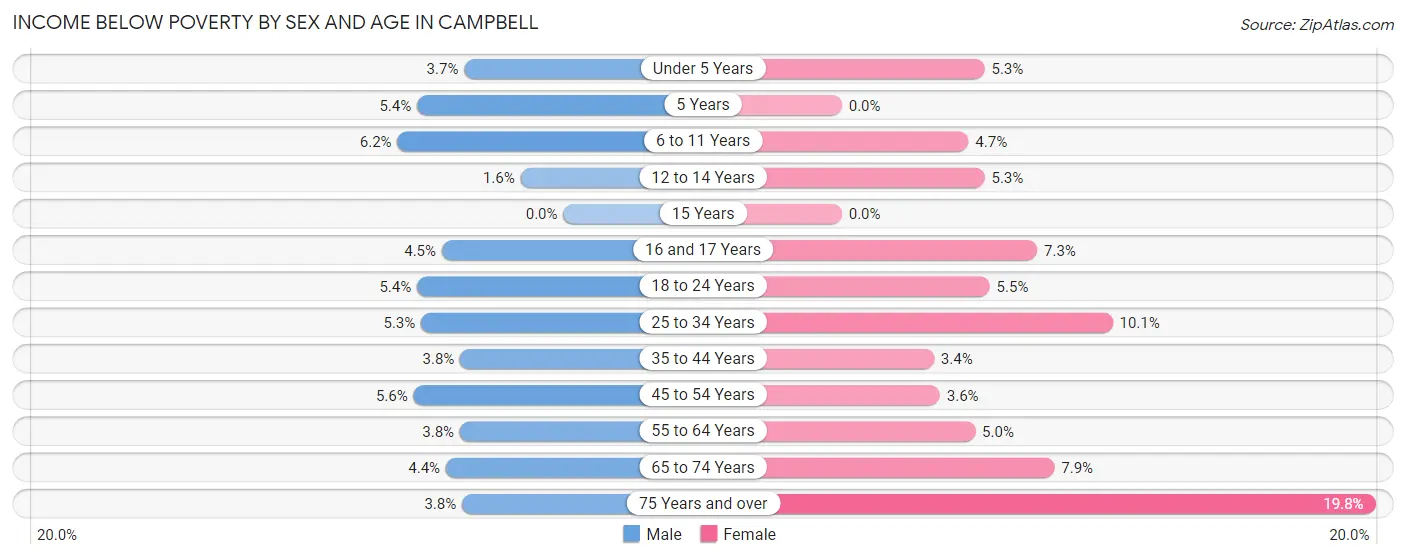
| Age Bracket | Male | Female |
| Under 5 Years | 47 (3.7%) | 76 (5.3%) |
| 5 Years | 12 (5.4%) | 0 (0.0%) |
| 6 to 11 Years | 108 (6.2%) | 59 (4.7%) |
| 12 to 14 Years | 12 (1.6%) | 42 (5.3%) |
| 15 Years | 0 (0.0%) | 0 (0.0%) |
| 16 and 17 Years | 24 (4.5%) | 51 (7.2%) |
| 18 to 24 Years | 66 (5.4%) | 65 (5.5%) |
| 25 to 34 Years | 184 (5.3%) | 303 (10.1%) |
| 35 to 44 Years | 133 (3.8%) | 120 (3.4%) |
| 45 to 54 Years | 150 (5.6%) | 104 (3.6%) |
| 55 to 64 Years | 129 (3.8%) | 142 (5.0%) |
| 65 to 74 Years | 60 (4.4%) | 147 (7.9%) |
| 75 Years and over | 42 (3.8%) | 362 (19.8%) |
| Total | 967 (4.5%) | 1,471 (6.7%) |
Income Above Poverty by Sex and Age in Campbell
According to the poverty statistics in Campbell, males aged 15 years and females aged 5 years are the age groups that are most secure financially, with 100.0% of males and 100.0% of females in these age groups living above the poverty line.
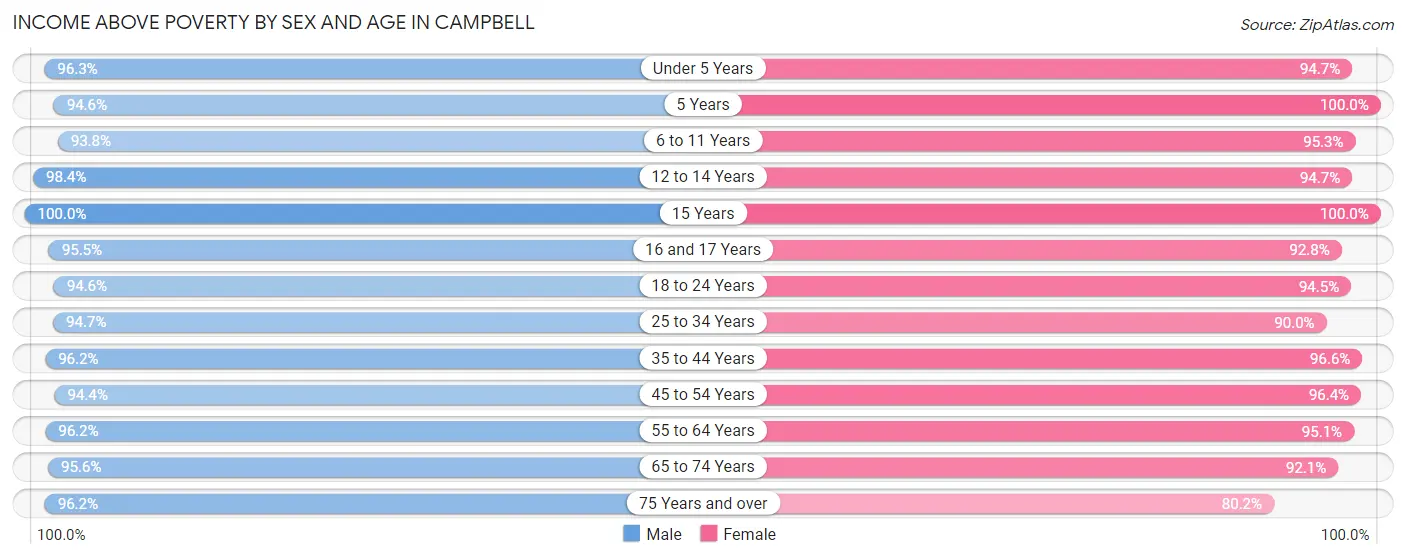
| Age Bracket | Male | Female |
| Under 5 Years | 1,231 (96.3%) | 1,358 (94.7%) |
| 5 Years | 209 (94.6%) | 289 (100.0%) |
| 6 to 11 Years | 1,646 (93.8%) | 1,195 (95.3%) |
| 12 to 14 Years | 744 (98.4%) | 751 (94.7%) |
| 15 Years | 225 (100.0%) | 221 (100.0%) |
| 16 and 17 Years | 508 (95.5%) | 652 (92.7%) |
| 18 to 24 Years | 1,149 (94.6%) | 1,120 (94.5%) |
| 25 to 34 Years | 3,301 (94.7%) | 2,711 (89.9%) |
| 35 to 44 Years | 3,337 (96.2%) | 3,385 (96.6%) |
| 45 to 54 Years | 2,550 (94.4%) | 2,753 (96.4%) |
| 55 to 64 Years | 3,227 (96.2%) | 2,724 (95.1%) |
| 65 to 74 Years | 1,316 (95.6%) | 1,716 (92.1%) |
| 75 Years and over | 1,076 (96.2%) | 1,465 (80.2%) |
| Total | 20,519 (95.5%) | 20,340 (93.3%) |
Income Below Poverty Among Married-Couple Families in Campbell
The poverty statistics for married-couple families in Campbell show that 2.2% or 189 of the total 8,602 families live below the poverty line. Families with 5 or more children have the highest poverty rate of 37.5%, comprising of 12 families. On the other hand, families with 1 or 2 children have the lowest poverty rate of 1.1%, which includes 39 families.
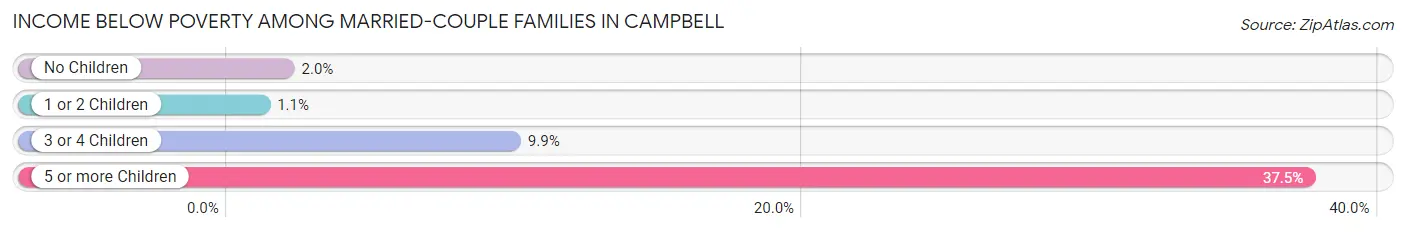
| Children | Above Poverty | Below Poverty |
| No Children | 4,531 (98.0%) | 91 (2.0%) |
| 1 or 2 Children | 3,432 (98.9%) | 39 (1.1%) |
| 3 or 4 Children | 430 (90.1%) | 47 (9.9%) |
| 5 or more Children | 20 (62.5%) | 12 (37.5%) |
| Total | 8,413 (97.8%) | 189 (2.2%) |
Income Below Poverty Among Single-Parent Households in Campbell
According to the poverty data in Campbell, 3.4% or 29 single-father households and 6.1% or 99 single-mother households are living below the poverty line. Among single-father households, those with no children have the highest poverty rate, with 21 households (6.0%) experiencing poverty. Likewise, among single-mother households, those with 3 or 4 children have the highest poverty rate, with 37 households (60.7%) falling below the poverty line.
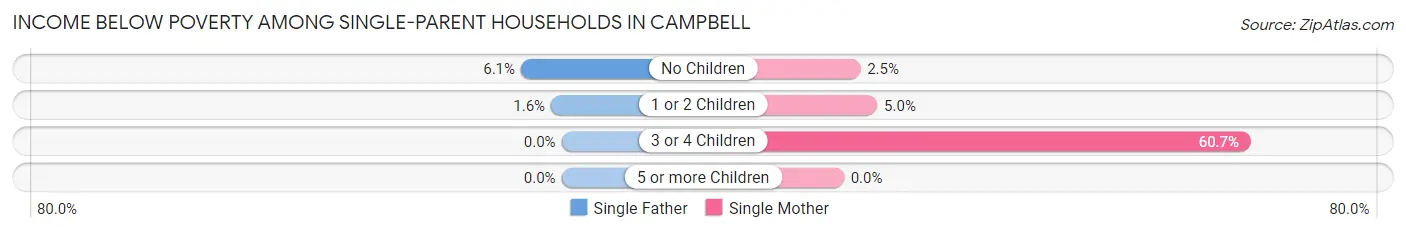
| Children | Single Father | Single Mother |
| No Children | 21 (6.0%) | 15 (2.5%) |
| 1 or 2 Children | 8 (1.6%) | 47 (5.0%) |
| 3 or 4 Children | 0 (0.0%) | 37 (60.7%) |
| 5 or more Children | 0 (0.0%) | 0 (0.0%) |
| Total | 29 (3.4%) | 99 (6.1%) |
Income Below Poverty Among Married-Couple vs Single-Parent Households in Campbell
The poverty data for Campbell shows that 189 of the married-couple family households (2.2%) and 128 of the single-parent households (5.2%) are living below the poverty level. Within the married-couple family households, those with 5 or more children have the highest poverty rate, with 12 households (37.5%) falling below the poverty line. Among the single-parent households, those with 3 or 4 children have the highest poverty rate, with 37 household (55.2%) living below poverty.
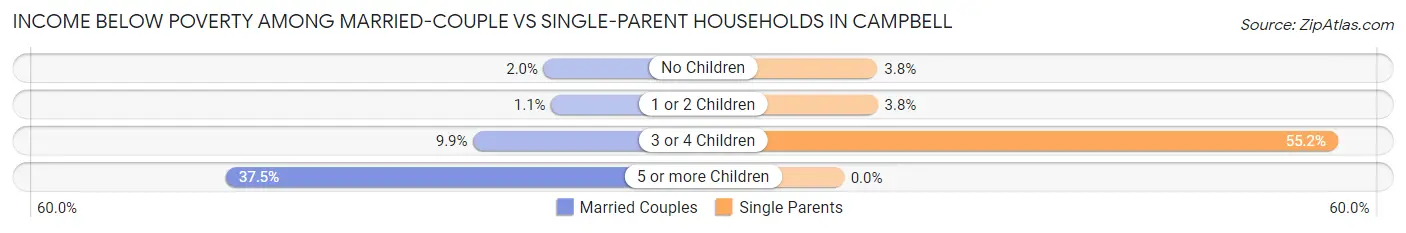
| Children | Married-Couple Families | Single-Parent Households |
| No Children | 91 (2.0%) | 36 (3.8%) |
| 1 or 2 Children | 39 (1.1%) | 55 (3.8%) |
| 3 or 4 Children | 47 (9.9%) | 37 (55.2%) |
| 5 or more Children | 12 (37.5%) | 0 (0.0%) |
| Total | 189 (2.2%) | 128 (5.2%) |
Race in Campbell
The most populous races in Campbell are White / Caucasian (23,321 | 53.7%), Asian (11,604 | 26.7%), and Hispanic or Latino (7,650 | 17.6%).
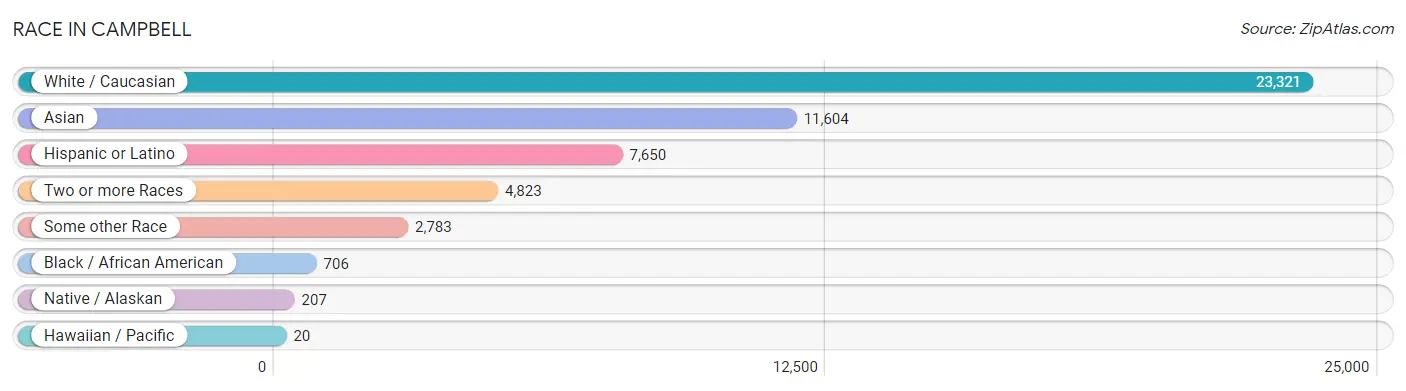
| Race | # Population | % Population |
| Asian | 11,604 | 26.7% |
| Black / African American | 706 | 1.6% |
| Hawaiian / Pacific | 20 | 0.1% |
| Hispanic or Latino | 7,650 | 17.6% |
| Native / Alaskan | 207 | 0.5% |
| White / Caucasian | 23,321 | 53.7% |
| Two or more Races | 4,823 | 11.1% |
| Some other Race | 2,783 | 6.4% |
| Total | 43,464 | 100.0% |
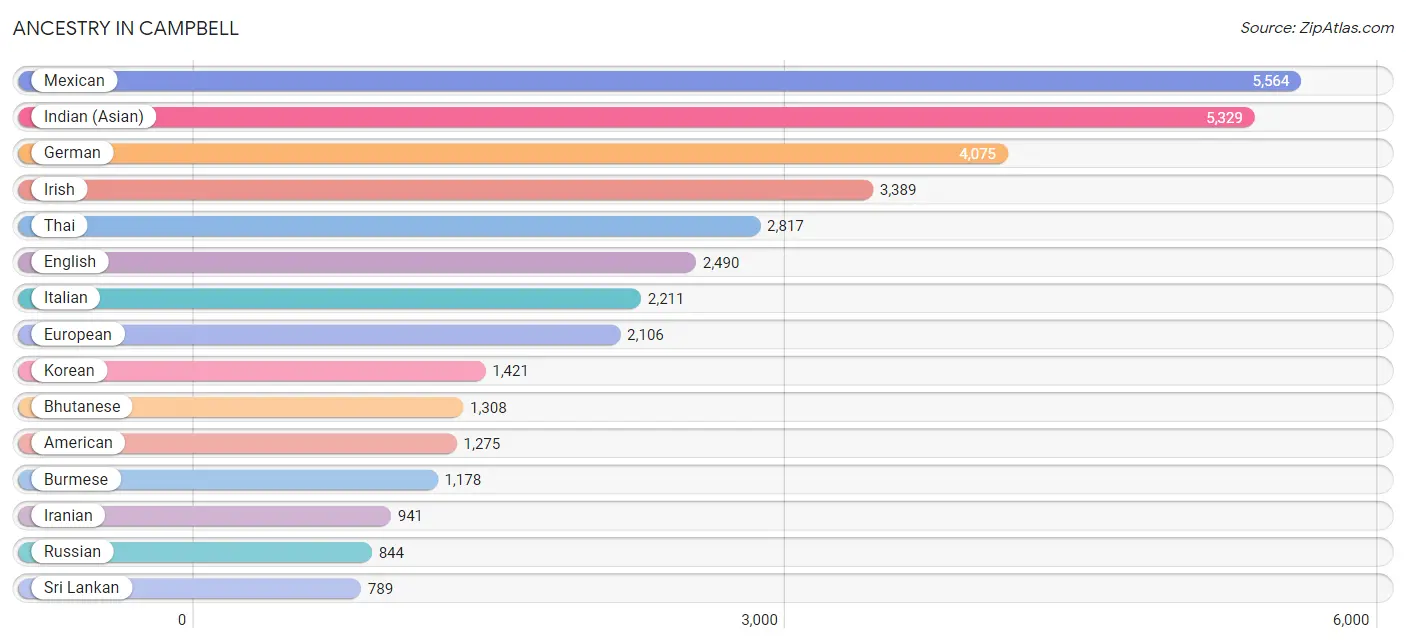
Ancestry in Campbell
The most populous ancestries reported in Campbell are Mexican (5,564 | 12.8%), Indian (Asian) (5,329 | 12.3%), German (4,075 | 9.4%), Irish (3,389 | 7.8%), and Thai (2,817 | 6.5%), together accounting for 48.7% of all Campbell residents.
| Ancestry | # Population | % Population |
| African | 140 | 0.3% |
| Albanian | 13 | 0.0% |
| American | 1,275 | 2.9% |
| Arab | 584 | 1.3% |
| Argentinean | 25 | 0.1% |
| Armenian | 299 | 0.7% |
| Assyrian / Chaldean / Syriac | 68 | 0.2% |
| Australian | 101 | 0.2% |
| Austrian | 118 | 0.3% |
| Basque | 9 | 0.0% |
| Belgian | 39 | 0.1% |
| Bhutanese | 1,308 | 3.0% |
| Blackfeet | 7 | 0.0% |
| Brazilian | 564 | 1.3% |
| British | 217 | 0.5% |
| Bulgarian | 63 | 0.1% |
| Burmese | 1,178 | 2.7% |
| Canadian | 167 | 0.4% |
| Cape Verdean | 134 | 0.3% |
| Celtic | 14 | 0.0% |
| Central American | 689 | 1.6% |
| Central American Indian | 22 | 0.1% |
| Cherokee | 107 | 0.3% |
| Chilean | 141 | 0.3% |
| Choctaw | 24 | 0.1% |
| Colombian | 113 | 0.3% |
| Croatian | 92 | 0.2% |
| Cuban | 76 | 0.2% |
| Czech | 75 | 0.2% |
| Czechoslovakian | 76 | 0.2% |
| Danish | 201 | 0.5% |
| Dominican | 13 | 0.0% |
| Dutch | 297 | 0.7% |
| Eastern European | 143 | 0.3% |
| Egyptian | 11 | 0.0% |
| English | 2,490 | 5.7% |
| Estonian | 15 | 0.0% |
| Ethiopian | 122 | 0.3% |
| European | 2,106 | 4.9% |
| Filipino | 452 | 1.0% |
| Finnish | 41 | 0.1% |
| French | 725 | 1.7% |
| French Canadian | 59 | 0.1% |
| German | 4,075 | 9.4% |
| Greek | 132 | 0.3% |
| Guatemalan | 51 | 0.1% |
| Honduran | 187 | 0.4% |
| Hungarian | 227 | 0.5% |
| Icelander | 24 | 0.1% |
| Indian (Asian) | 5,329 | 12.3% |
| Indonesian | 61 | 0.1% |
| Iranian | 941 | 2.2% |
| Irish | 3,389 | 7.8% |
| Israeli | 10 | 0.0% |
| Italian | 2,211 | 5.1% |
| Japanese | 25 | 0.1% |
| Korean | 1,421 | 3.3% |
| Laotian | 8 | 0.0% |
| Latvian | 14 | 0.0% |
| Lebanese | 51 | 0.1% |
| Lithuanian | 49 | 0.1% |
| Maltese | 8 | 0.0% |
| Mexican | 5,564 | 12.8% |
| Mexican American Indian | 65 | 0.2% |
| Moroccan | 52 | 0.1% |
| Native Hawaiian | 65 | 0.2% |
| Navajo | 11 | 0.0% |
| Nicaraguan | 44 | 0.1% |
| Northern European | 190 | 0.4% |
| Norwegian | 453 | 1.0% |
| Pakistani | 108 | 0.3% |
| Palestinian | 131 | 0.3% |
| Paraguayan | 10 | 0.0% |
| Peruvian | 229 | 0.5% |
| Polish | 649 | 1.5% |
| Portuguese | 532 | 1.2% |
| Puerto Rican | 113 | 0.3% |
| Romanian | 78 | 0.2% |
| Russian | 844 | 1.9% |
| Salvadoran | 407 | 0.9% |
| Samoan | 13 | 0.0% |
| Scandinavian | 142 | 0.3% |
| Scotch-Irish | 296 | 0.7% |
| Scottish | 698 | 1.6% |
| Sioux | 21 | 0.1% |
| Slovak | 8 | 0.0% |
| South American | 624 | 1.4% |
| Spaniard | 222 | 0.5% |
| Spanish | 203 | 0.5% |
| Spanish American | 11 | 0.0% |
| Sri Lankan | 789 | 1.8% |
| Subsaharan African | 411 | 0.9% |
| Swedish | 459 | 1.1% |
| Swiss | 88 | 0.2% |
| Syrian | 108 | 0.3% |
| Thai | 2,817 | 6.5% |
| Tohono O'Odham | 7 | 0.0% |
| Turkish | 25 | 0.1% |
| Ugandan | 15 | 0.0% |
| Ukrainian | 167 | 0.4% |
| Uruguayan | 84 | 0.2% |
| Venezuelan | 22 | 0.1% |
| Welsh | 221 | 0.5% |
| Yugoslavian | 180 | 0.4% | View All 104 Rows |
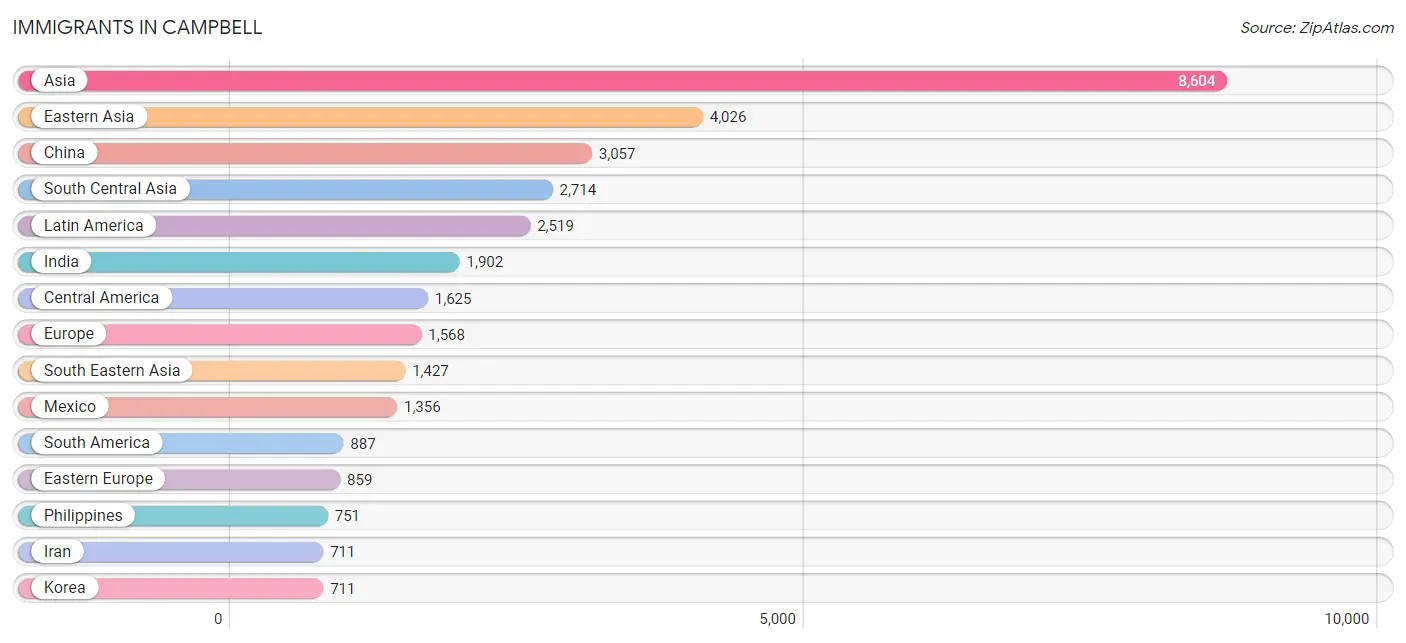
Immigrants in Campbell
The most numerous immigrant groups reported in Campbell came from Asia (8,604 | 19.8%), Eastern Asia (4,026 | 9.3%), China (3,057 | 7.0%), South Central Asia (2,714 | 6.2%), and Latin America (2,519 | 5.8%), together accounting for 48.1% of all Campbell residents.
| Immigration Origin | # Population | % Population |
| Africa | 378 | 0.9% |
| Argentina | 25 | 0.1% |
| Armenia | 46 | 0.1% |
| Asia | 8,604 | 19.8% |
| Australia | 88 | 0.2% |
| Austria | 23 | 0.1% |
| Belarus | 108 | 0.3% |
| Belgium | 10 | 0.0% |
| Bosnia and Herzegovina | 96 | 0.2% |
| Brazil | 411 | 0.9% |
| Bulgaria | 42 | 0.1% |
| Canada | 314 | 0.7% |
| Caribbean | 7 | 0.0% |
| Central America | 1,625 | 3.7% |
| Chile | 44 | 0.1% |
| China | 3,057 | 7.0% |
| Colombia | 234 | 0.5% |
| Costa Rica | 5 | 0.0% |
| Croatia | 9 | 0.0% |
| Eastern Africa | 292 | 0.7% |
| Eastern Asia | 4,026 | 9.3% |
| Eastern Europe | 859 | 2.0% |
| El Salvador | 139 | 0.3% |
| England | 40 | 0.1% |
| Eritrea | 43 | 0.1% |
| Ethiopia | 168 | 0.4% |
| Europe | 1,568 | 3.6% |
| France | 51 | 0.1% |
| Germany | 264 | 0.6% |
| Greece | 16 | 0.0% |
| Guatemala | 13 | 0.0% |
| Honduras | 91 | 0.2% |
| Hong Kong | 284 | 0.6% |
| India | 1,902 | 4.4% |
| Indonesia | 81 | 0.2% |
| Iran | 711 | 1.6% |
| Iraq | 38 | 0.1% |
| Ireland | 64 | 0.2% |
| Israel | 129 | 0.3% |
| Italy | 23 | 0.1% |
| Jamaica | 7 | 0.0% |
| Japan | 258 | 0.6% |
| Korea | 711 | 1.6% |
| Kuwait | 9 | 0.0% |
| Latin America | 2,519 | 5.8% |
| Lebanon | 48 | 0.1% |
| Lithuania | 15 | 0.0% |
| Malaysia | 55 | 0.1% |
| Mexico | 1,356 | 3.1% |
| Moldova | 70 | 0.2% |
| Morocco | 52 | 0.1% |
| Nepal | 62 | 0.1% |
| Nicaragua | 21 | 0.1% |
| Northern Africa | 75 | 0.2% |
| Northern Europe | 251 | 0.6% |
| Oceania | 124 | 0.3% |
| Peru | 90 | 0.2% |
| Philippines | 751 | 1.7% |
| Poland | 45 | 0.1% |
| Romania | 15 | 0.0% |
| Russia | 357 | 0.8% |
| Singapore | 25 | 0.1% |
| South Africa | 11 | 0.0% |
| South America | 887 | 2.0% |
| South Central Asia | 2,714 | 6.2% |
| South Eastern Asia | 1,427 | 3.3% |
| Southern Europe | 68 | 0.2% |
| Spain | 21 | 0.1% |
| Sri Lanka | 20 | 0.1% |
| Sudan | 8 | 0.0% |
| Switzerland | 27 | 0.1% |
| Taiwan | 484 | 1.1% |
| Thailand | 36 | 0.1% |
| Turkey | 25 | 0.1% |
| Uganda | 15 | 0.0% |
| Ukraine | 39 | 0.1% |
| Uruguay | 40 | 0.1% |
| Uzbekistan | 19 | 0.0% |
| Venezuela | 33 | 0.1% |
| Vietnam | 410 | 0.9% |
| Western Asia | 360 | 0.8% |
| Western Europe | 375 | 0.9% | View All 82 Rows |
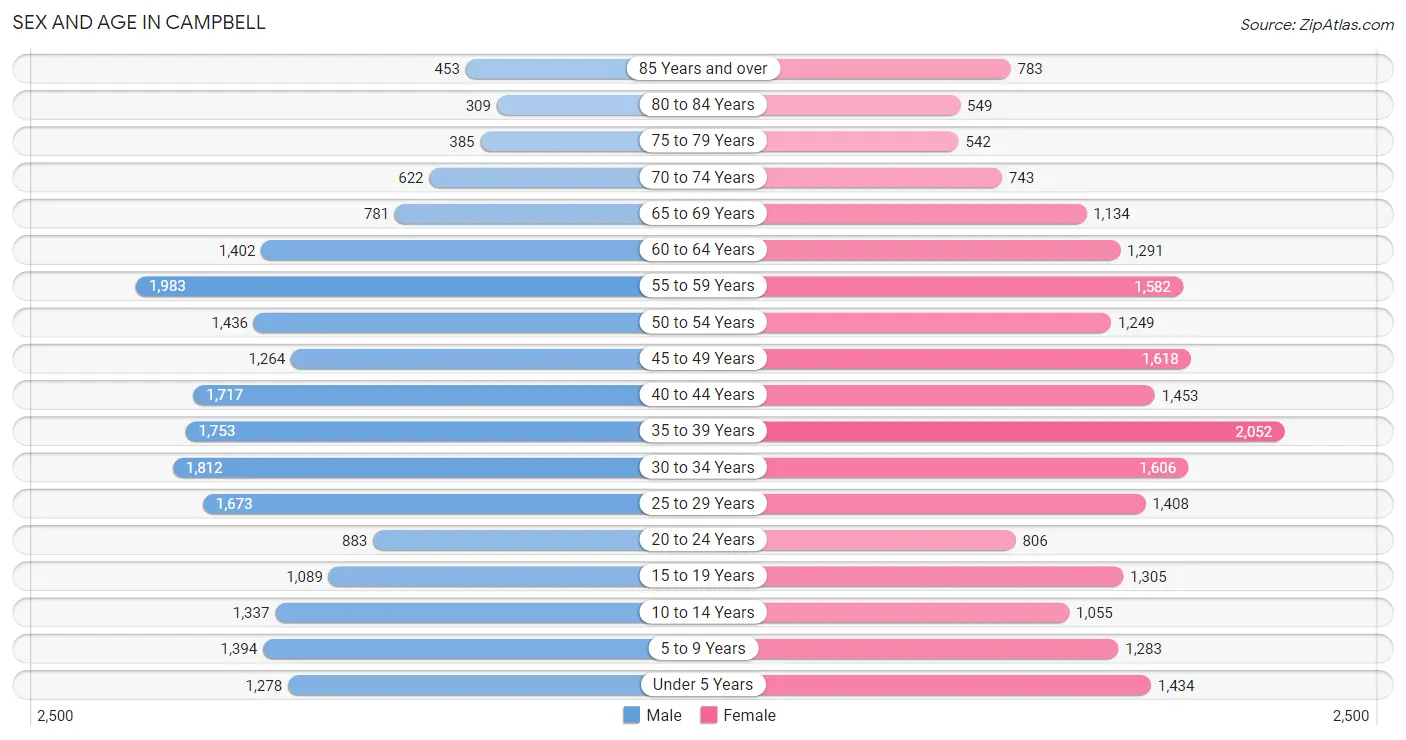
Sex and Age in Campbell
Sex and Age in Campbell
The most populous age groups in Campbell are 55 to 59 Years (1,983 | 9.2%) for men and 35 to 39 Years (2,052 | 9.4%) for women.
| Age Bracket | Male | Female |
| Under 5 Years | 1,278 (5.9%) | 1,434 (6.6%) |
| 5 to 9 Years | 1,394 (6.5%) | 1,283 (5.9%) |
| 10 to 14 Years | 1,337 (6.2%) | 1,055 (4.8%) |
| 15 to 19 Years | 1,089 (5.1%) | 1,305 (6.0%) |
| 20 to 24 Years | 883 (4.1%) | 806 (3.7%) |
| 25 to 29 Years | 1,673 (7.8%) | 1,408 (6.4%) |
| 30 to 34 Years | 1,812 (8.4%) | 1,606 (7.3%) |
| 35 to 39 Years | 1,753 (8.1%) | 2,052 (9.4%) |
| 40 to 44 Years | 1,717 (8.0%) | 1,453 (6.6%) |
| 45 to 49 Years | 1,264 (5.9%) | 1,618 (7.4%) |
| 50 to 54 Years | 1,436 (6.7%) | 1,249 (5.7%) |
| 55 to 59 Years | 1,983 (9.2%) | 1,582 (7.2%) |
| 60 to 64 Years | 1,402 (6.5%) | 1,291 (5.9%) |
| 65 to 69 Years | 781 (3.6%) | 1,134 (5.2%) |
| 70 to 74 Years | 622 (2.9%) | 743 (3.4%) |
| 75 to 79 Years | 385 (1.8%) | 542 (2.5%) |
| 80 to 84 Years | 309 (1.4%) | 549 (2.5%) |
| 85 Years and over | 453 (2.1%) | 783 (3.6%) |
| Total | 21,571 (100.0%) | 21,893 (100.0%) |
Families and Households in Campbell
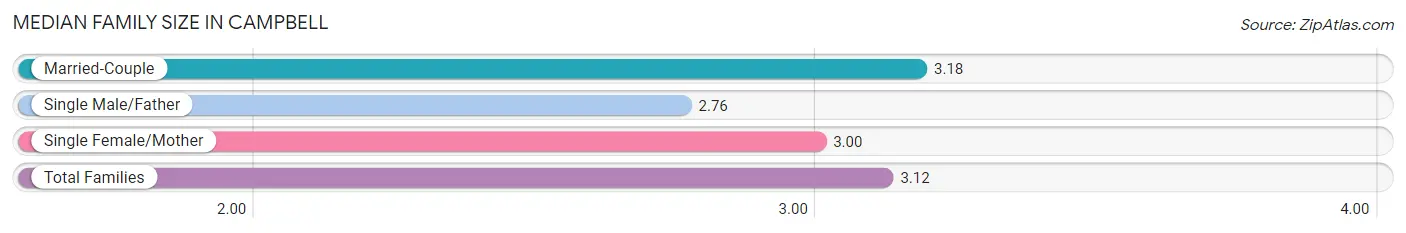
Median Family Size in Campbell
The median family size in Campbell is 3.12 persons per family, with married-couple families (8,602 | 77.7%) accounting for the largest median family size of 3.18 persons per family. On the other hand, single male/father families (862 | 7.8%) represent the smallest median family size with 2.76 persons per family.
| Family Type | # Families | Family Size |
| Married-Couple | 8,602 (77.7%) | 3.18 |
| Single Male/Father | 862 (7.8%) | 2.76 |
| Single Female/Mother | 1,611 (14.5%) | 3.00 |
| Total Families | 11,075 (100.0%) | 3.12 |
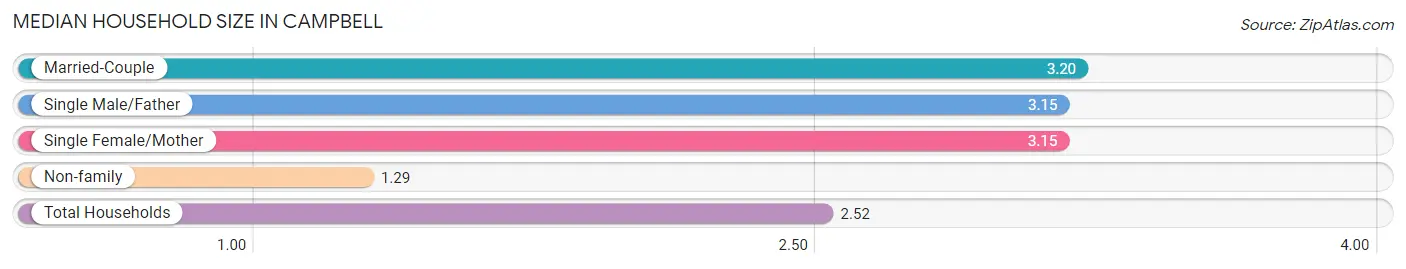
Median Household Size in Campbell
The median household size in Campbell is 2.52 persons per household, with married-couple households (8,602 | 50.4%) accounting for the largest median household size of 3.2 persons per household. non-family households (5,989 | 35.1%) represent the smallest median household size with 1.29 persons per household.
| Household Type | # Households | Household Size |
| Married-Couple | 8,602 (50.4%) | 3.20 |
| Single Male/Father | 862 (5.1%) | 3.15 |
| Single Female/Mother | 1,611 (9.4%) | 3.15 |
| Non-family | 5,989 (35.1%) | 1.29 |
| Total Households | 17,064 (100.0%) | 2.52 |
Household Size by Marriage Status in Campbell
Out of a total of 17,064 households in Campbell, 11,075 (64.9%) are family households, while 5,989 (35.1%) are nonfamily households. The most numerous type of family households are 2-person households, comprising 4,433, and the most common type of nonfamily households are 1-person households, comprising 4,709.
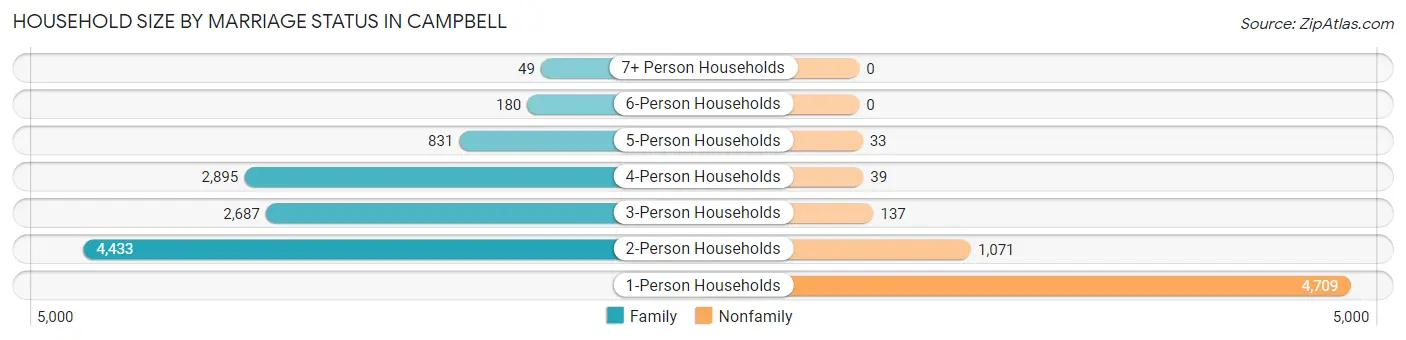
| Household Size | Family Households | Nonfamily Households |
| 1-Person Households | - | 4,709 (27.6%) |
| 2-Person Households | 4,433 (26.0%) | 1,071 (6.3%) |
| 3-Person Households | 2,687 (15.8%) | 137 (0.8%) |
| 4-Person Households | 2,895 (17.0%) | 39 (0.2%) |
| 5-Person Households | 831 (4.9%) | 33 (0.2%) |
| 6-Person Households | 180 (1.1%) | 0 (0.0%) |
| 7+ Person Households | 49 (0.3%) | 0 (0.0%) |
| Total | 11,075 (64.9%) | 5,989 (35.1%) |
Female Fertility in Campbell
Fertility by Age in Campbell
Average fertility rate in Campbell is 51.0 births per 1,000 women. Women in the age bracket of 20 to 34 years have the highest fertility rate with 63.0 births per 1,000 women. Women in the age bracket of 35 to 50 years acount for 55.1% of all women with births.
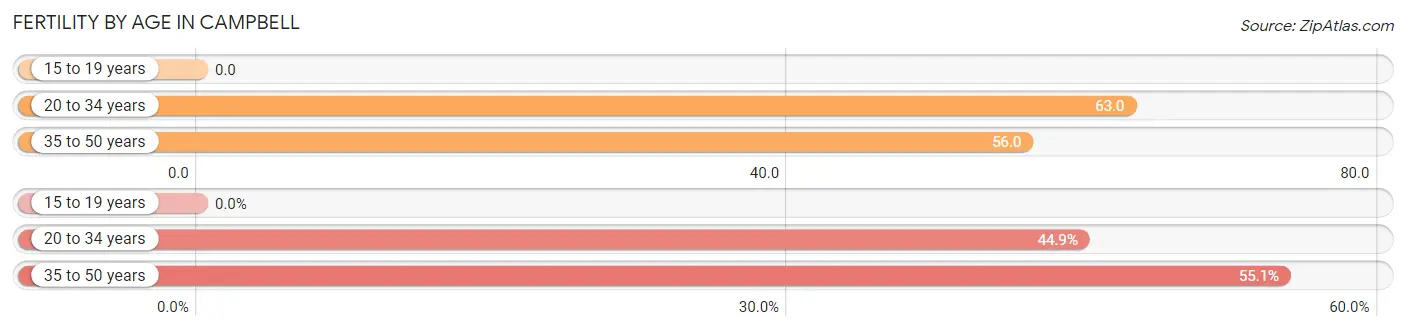
| Age Bracket | Women with Births | Births / 1,000 Women |
| 15 to 19 years | 0 (0.0%) | 0.0 |
| 20 to 34 years | 241 (44.9%) | 63.0 |
| 35 to 50 years | 296 (55.1%) | 56.0 |
| Total | 537 (100.0%) | 51.0 |
Fertility by Age by Marriage Status in Campbell
63.7% of women with births (537) in Campbell are married. The highest percentage of unmarried women with births falls into 20 to 34 years age bracket with 48.5% of them unmarried at the time of birth, while the lowest percentage of unmarried women with births belong to 35 to 50 years age bracket with 26.3% of them unmarried.
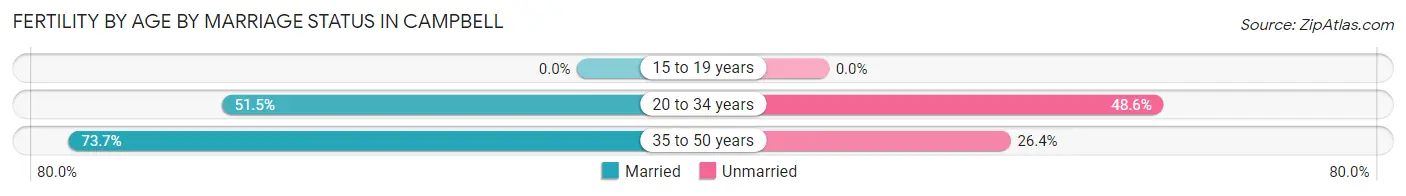
| Age Bracket | Married | Unmarried |
| 15 to 19 years | 0 (0.0%) | 0 (0.0%) |
| 20 to 34 years | 124 (51.4%) | 117 (48.5%) |
| 35 to 50 years | 218 (73.7%) | 78 (26.4%) |
| Total | 342 (63.7%) | 195 (36.3%) |
Fertility by Education in Campbell
Average fertility rate in Campbell is 51.0 births per 1,000 women. Women with the education attainment of high school diploma have the highest fertility rate of 149.0 births per 1,000 women, while women with the education attainment of college or associate's degree have the lowest fertility at 20.0 births per 1,000 women. Women with the education attainment of high school diploma represent 33.2% of all women with births.
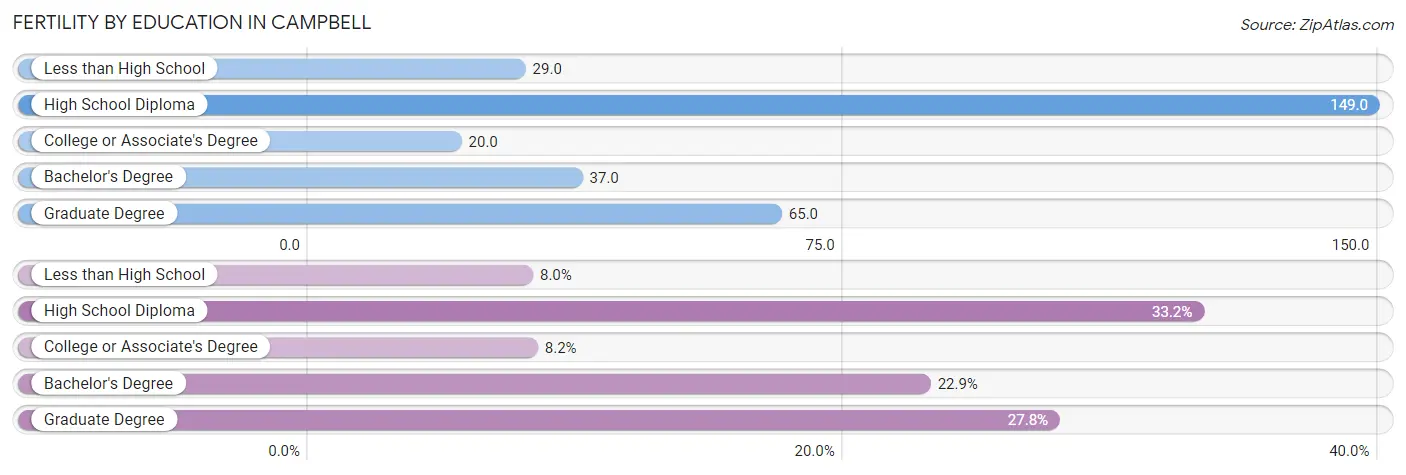
| Educational Attainment | Women with Births | Births / 1,000 Women |
| Less than High School | 43 (8.0%) | 29.0 |
| High School Diploma | 178 (33.2%) | 149.0 |
| College or Associate's Degree | 44 (8.2%) | 20.0 |
| Bachelor's Degree | 123 (22.9%) | 37.0 |
| Graduate Degree | 149 (27.8%) | 65.0 |
| Total | 537 (100.0%) | 51.0 |
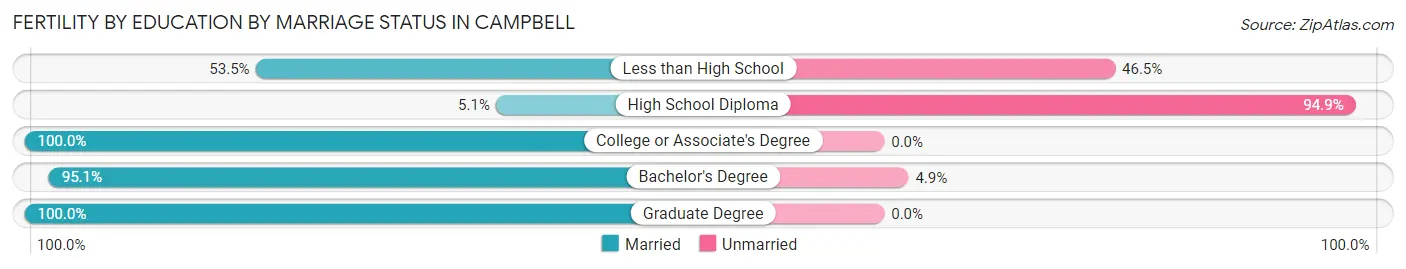
Fertility by Education by Marriage Status in Campbell
36.3% of women with births in Campbell are unmarried. Women with the educational attainment of college or associate's degree are most likely to be married with 100.0% of them married at childbirth, while women with the educational attainment of high school diploma are least likely to be married with 94.9% of them unmarried at childbirth.
| Educational Attainment | Married | Unmarried |
| Less than High School | 23 (53.5%) | 20 (46.5%) |
| High School Diploma | 9 (5.1%) | 169 (94.9%) |
| College or Associate's Degree | 44 (100.0%) | 0 (0.0%) |
| Bachelor's Degree | 117 (95.1%) | 6 (4.9%) |
| Graduate Degree | 149 (100.0%) | 0 (0.0%) |
| Total | 342 (63.7%) | 195 (36.3%) |
Employment Characteristics in Campbell
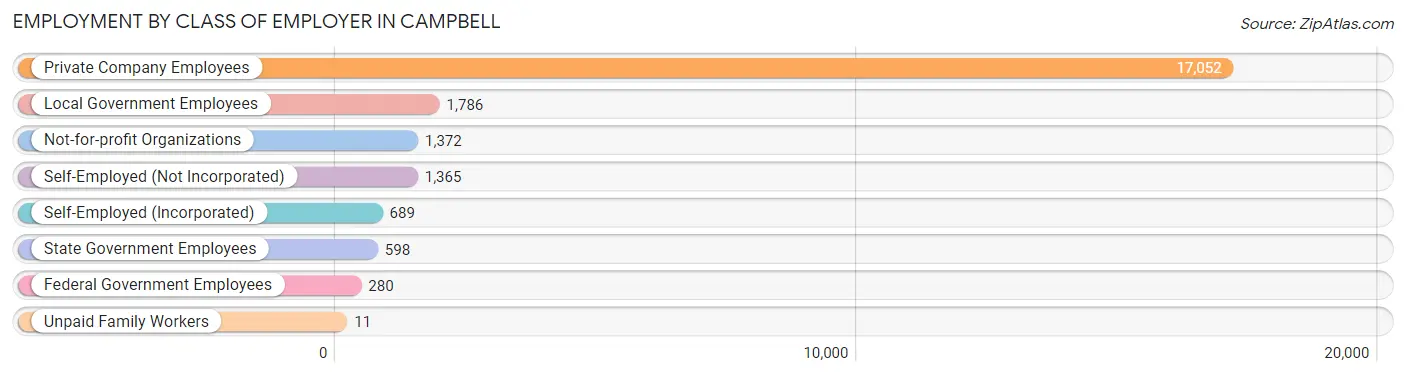
Employment by Class of Employer in Campbell
Among the 23,153 employed individuals in Campbell, private company employees (17,052 | 73.7%), local government employees (1,786 | 7.7%), and not-for-profit organizations (1,372 | 5.9%) make up the most common classes of employment.
| Employer Class | # Employees | % Employees |
| Private Company Employees | 17,052 | 73.7% |
| Self-Employed (Incorporated) | 689 | 3.0% |
| Self-Employed (Not Incorporated) | 1,365 | 5.9% |
| Not-for-profit Organizations | 1,372 | 5.9% |
| Local Government Employees | 1,786 | 7.7% |
| State Government Employees | 598 | 2.6% |
| Federal Government Employees | 280 | 1.2% |
| Unpaid Family Workers | 11 | 0.1% |
| Total | 23,153 | 100.0% |
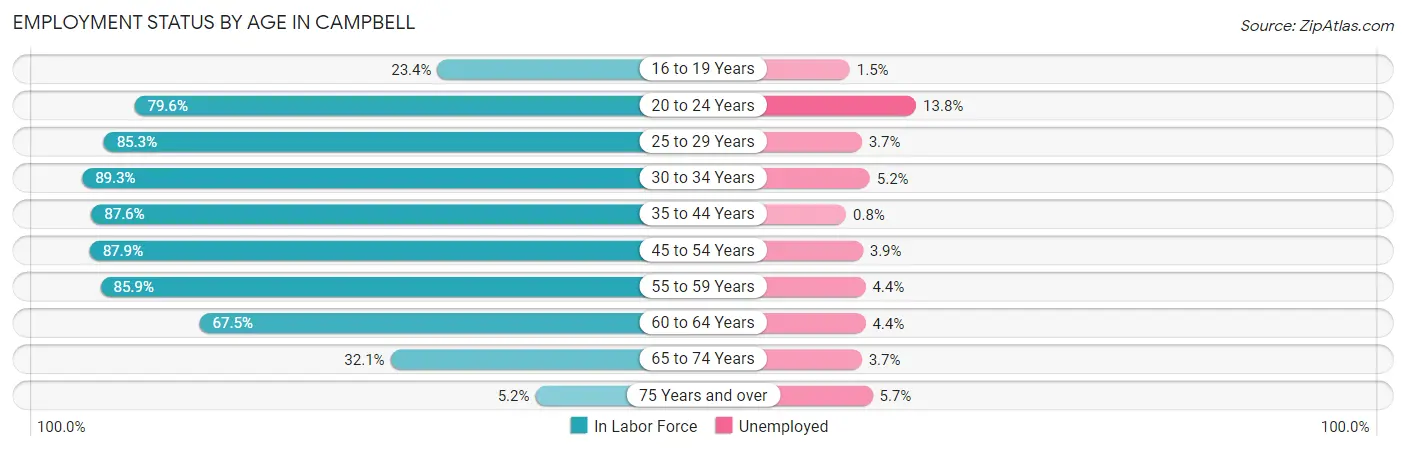
Employment Status by Age in Campbell
According to the labor force statistics for Campbell, out of the total population over 16 years of age (35,237), 69.7% or 24,560 individuals are in the labor force, with 3.9% or 958 of them unemployed. The age group with the highest labor force participation rate is 30 to 34 years, with 89.3% or 3,052 individuals in the labor force. Within the labor force, the 20 to 24 years age range has the highest percentage of unemployed individuals, with 13.8% or 185 of them being unemployed.
| Age Bracket | In Labor Force | Unemployed |
| 16 to 19 Years | 456 (23.4%) | 7 (1.5%) |
| 20 to 24 Years | 1,344 (79.6%) | 185 (13.8%) |
| 25 to 29 Years | 2,628 (85.3%) | 97 (3.7%) |
| 30 to 34 Years | 3,052 (89.3%) | 159 (5.2%) |
| 35 to 44 Years | 6,110 (87.6%) | 49 (0.8%) |
| 45 to 54 Years | 4,893 (87.9%) | 191 (3.9%) |
| 55 to 59 Years | 3,062 (85.9%) | 135 (4.4%) |
| 60 to 64 Years | 1,818 (67.5%) | 80 (4.4%) |
| 65 to 74 Years | 1,053 (32.1%) | 39 (3.7%) |
| 75 Years and over | 157 (5.2%) | 9 (5.7%) |
| Total | 24,560 (69.7%) | 958 (3.9%) |
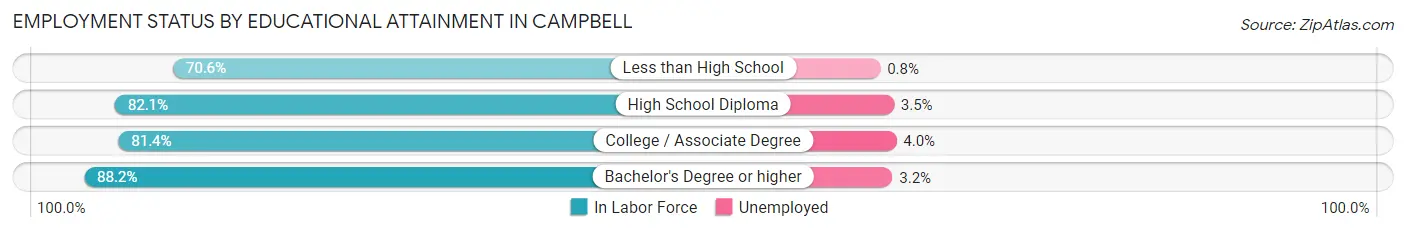
Employment Status by Educational Attainment in Campbell
According to labor force statistics for Campbell, 85.2% of individuals (21,555) out of the total population between 25 and 64 years of age (25,299) are in the labor force, with 3.3% or 711 of them being unemployed. The group with the highest labor force participation rate are those with the educational attainment of bachelor's degree or higher, with 88.2% or 14,103 individuals in the labor force. Within the labor force, individuals with college / associate degree education have the highest percentage of unemployment, with 4.0% or 169 of them being unemployed.
| Educational Attainment | In Labor Force | Unemployed |
| Less than High School | 898 (70.6%) | 10 (0.8%) |
| High School Diploma | 2,339 (82.1%) | 100 (3.5%) |
| College / Associate Degree | 4,223 (81.4%) | 208 (4.0%) |
| Bachelor's Degree or higher | 14,103 (88.2%) | 512 (3.2%) |
| Total | 21,555 (85.2%) | 835 (3.3%) |
Employment Occupations by Sex in Campbell
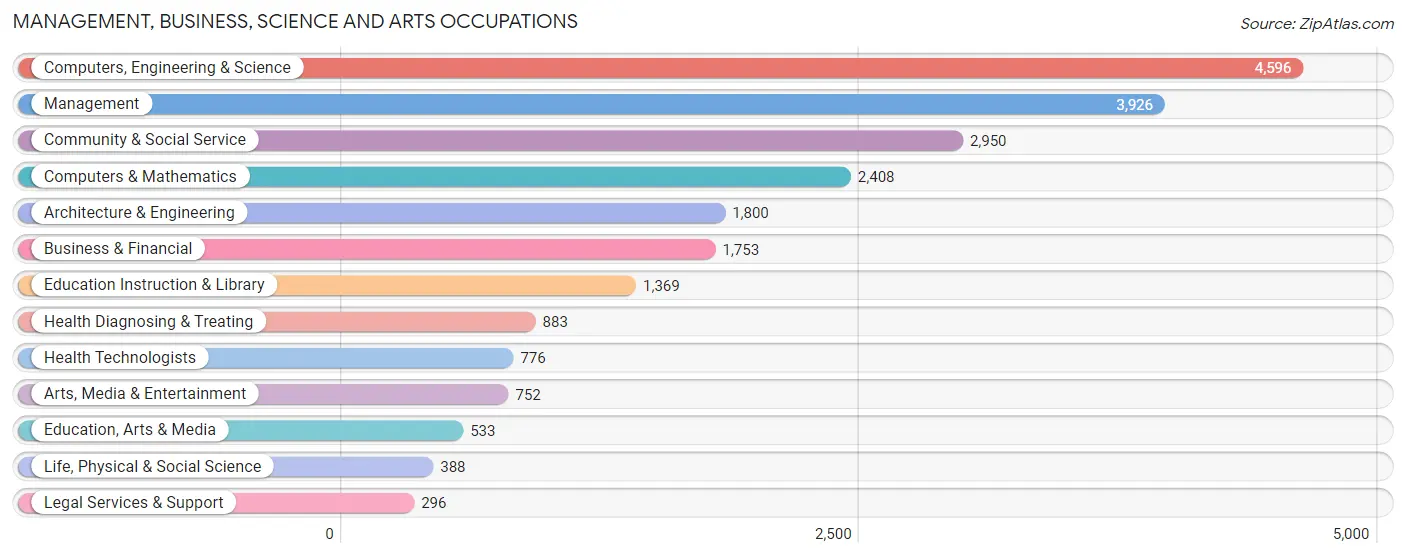
Management, Business, Science and Arts Occupations
The most common Management, Business, Science and Arts occupations in Campbell are Computers, Engineering & Science (4,596 | 19.5%), Management (3,926 | 16.6%), Community & Social Service (2,950 | 12.5%), Computers & Mathematics (2,408 | 10.2%), and Architecture & Engineering (1,800 | 7.6%).
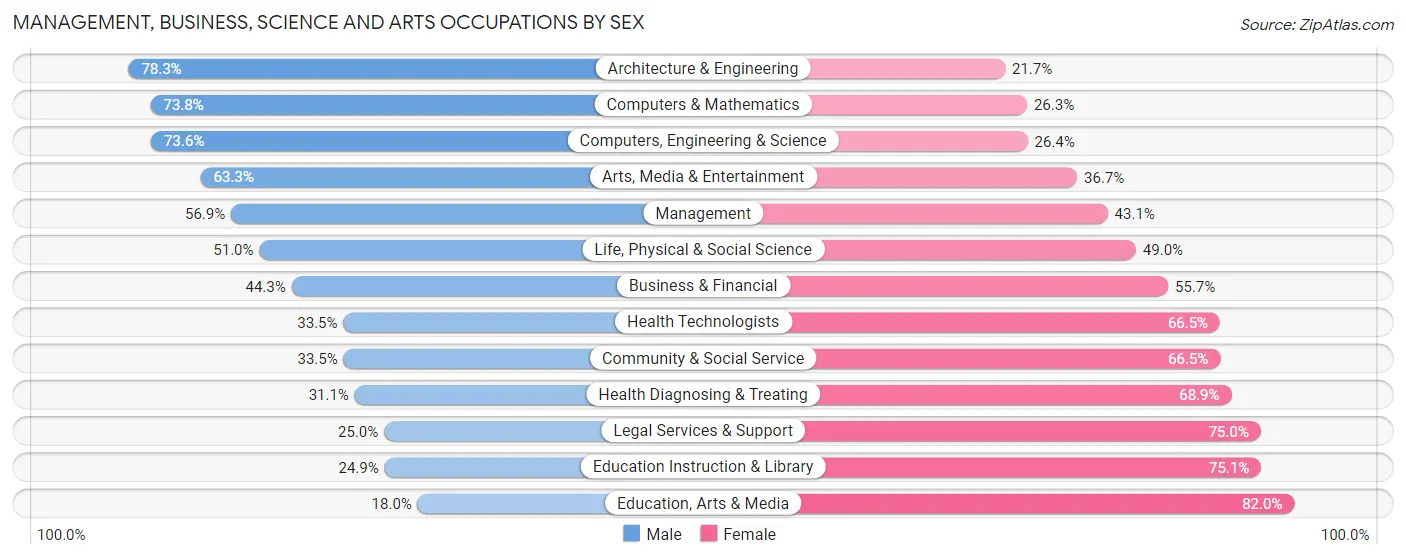
Management, Business, Science and Arts Occupations by Sex
Within the Management, Business, Science and Arts occupations in Campbell, the most male-oriented occupations are Architecture & Engineering (78.3%), Computers & Mathematics (73.8%), and Computers, Engineering & Science (73.6%), while the most female-oriented occupations are Education, Arts & Media (82.0%), Education Instruction & Library (75.1%), and Legal Services & Support (75.0%).
| Occupation | Male | Female |
| Management | 2,235 (56.9%) | 1,691 (43.1%) |
| Business & Financial | 777 (44.3%) | 976 (55.7%) |
| Computers, Engineering & Science | 3,384 (73.6%) | 1,212 (26.4%) |
| Computers & Mathematics | 1,776 (73.8%) | 632 (26.3%) |
| Architecture & Engineering | 1,410 (78.3%) | 390 (21.7%) |
| Life, Physical & Social Science | 198 (51.0%) | 190 (49.0%) |
| Community & Social Service | 987 (33.5%) | 1,963 (66.5%) |
| Education, Arts & Media | 96 (18.0%) | 437 (82.0%) |
| Legal Services & Support | 74 (25.0%) | 222 (75.0%) |
| Education Instruction & Library | 341 (24.9%) | 1,028 (75.1%) |
| Arts, Media & Entertainment | 476 (63.3%) | 276 (36.7%) |
| Health Diagnosing & Treating | 275 (31.1%) | 608 (68.9%) |
| Health Technologists | 260 (33.5%) | 516 (66.5%) |
| Total (Category) | 7,658 (54.3%) | 6,450 (45.7%) |
| Total (Overall) | 12,945 (54.8%) | 10,668 (45.2%) |
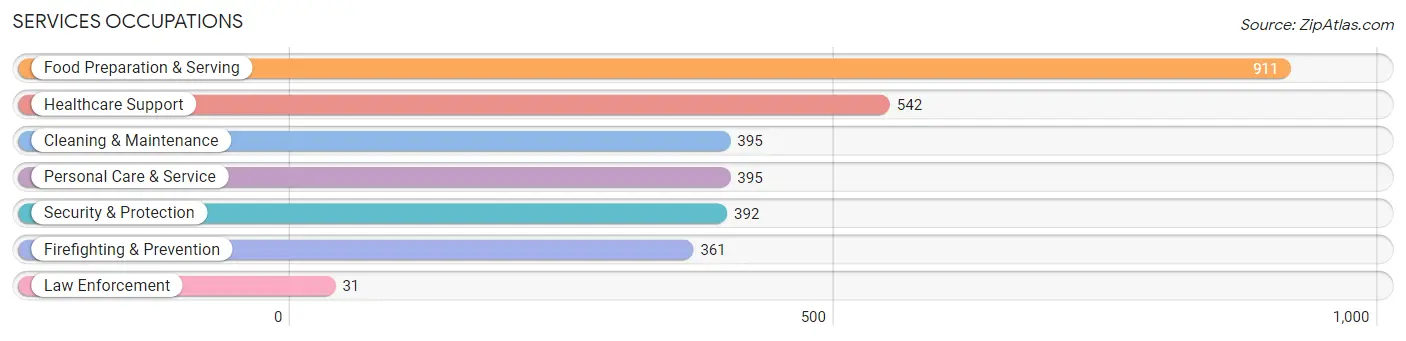
Services Occupations
The most common Services occupations in Campbell are Food Preparation & Serving (911 | 3.9%), Healthcare Support (542 | 2.3%), Cleaning & Maintenance (395 | 1.7%), Personal Care & Service (395 | 1.7%), and Security & Protection (392 | 1.7%).
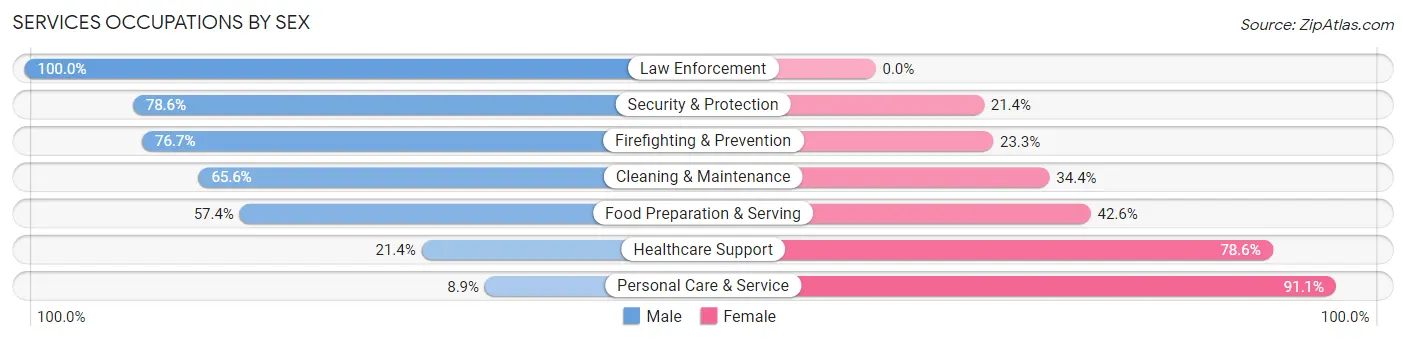
Services Occupations by Sex
Within the Services occupations in Campbell, the most male-oriented occupations are Law Enforcement (100.0%), Security & Protection (78.6%), and Firefighting & Prevention (76.7%), while the most female-oriented occupations are Personal Care & Service (91.1%), Healthcare Support (78.6%), and Food Preparation & Serving (42.6%).
| Occupation | Male | Female |
| Healthcare Support | 116 (21.4%) | 426 (78.6%) |
| Security & Protection | 308 (78.6%) | 84 (21.4%) |
| Firefighting & Prevention | 277 (76.7%) | 84 (23.3%) |
| Law Enforcement | 31 (100.0%) | 0 (0.0%) |
| Food Preparation & Serving | 523 (57.4%) | 388 (42.6%) |
| Cleaning & Maintenance | 259 (65.6%) | 136 (34.4%) |
| Personal Care & Service | 35 (8.9%) | 360 (91.1%) |
| Total (Category) | 1,241 (47.1%) | 1,394 (52.9%) |
| Total (Overall) | 12,945 (54.8%) | 10,668 (45.2%) |
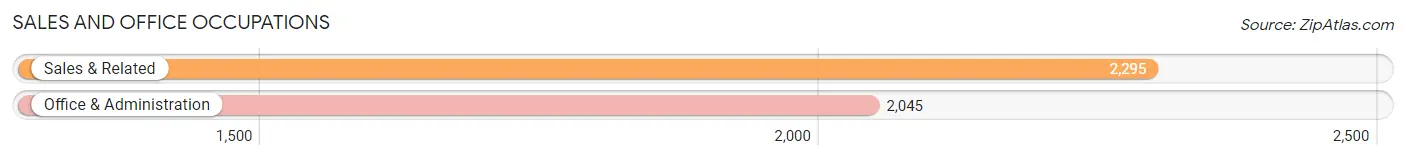
Sales and Office Occupations
The most common Sales and Office occupations in Campbell are Sales & Related (2,295 | 9.7%), and Office & Administration (2,045 | 8.7%).
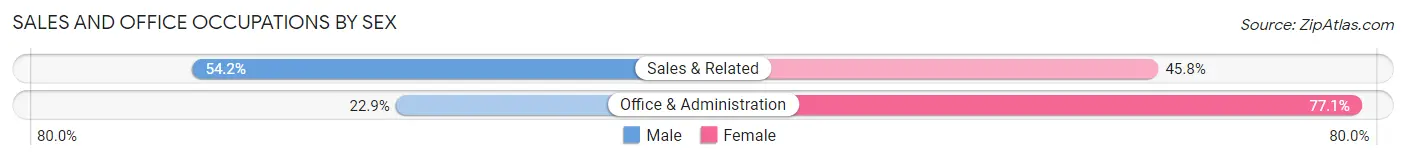
Sales and Office Occupations by Sex
| Occupation | Male | Female |
| Sales & Related | 1,243 (54.2%) | 1,052 (45.8%) |
| Office & Administration | 469 (22.9%) | 1,576 (77.1%) |
| Total (Category) | 1,712 (39.5%) | 2,628 (60.6%) |
| Total (Overall) | 12,945 (54.8%) | 10,668 (45.2%) |
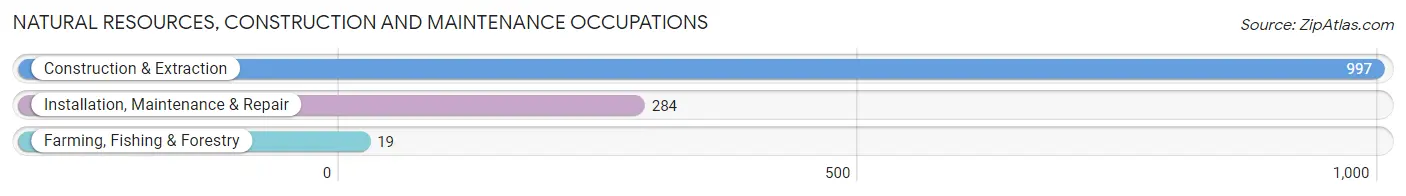
Natural Resources, Construction and Maintenance Occupations
The most common Natural Resources, Construction and Maintenance occupations in Campbell are Construction & Extraction (997 | 4.2%), Installation, Maintenance & Repair (284 | 1.2%), and Farming, Fishing & Forestry (19 | 0.1%).
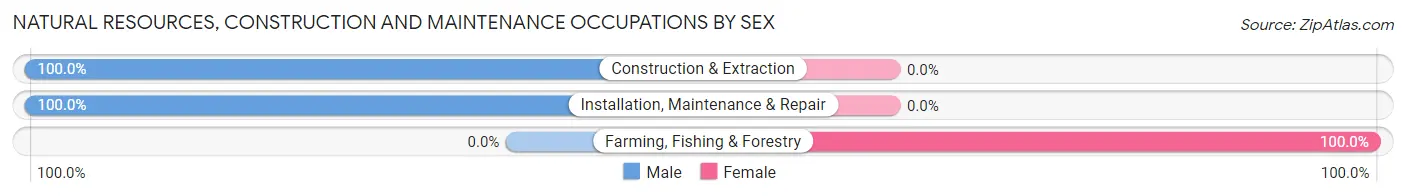
Natural Resources, Construction and Maintenance Occupations by Sex
| Occupation | Male | Female |
| Farming, Fishing & Forestry | 0 (0.0%) | 19 (100.0%) |
| Construction & Extraction | 997 (100.0%) | 0 (0.0%) |
| Installation, Maintenance & Repair | 284 (100.0%) | 0 (0.0%) |
| Total (Category) | 1,281 (98.5%) | 19 (1.5%) |
| Total (Overall) | 12,945 (54.8%) | 10,668 (45.2%) |
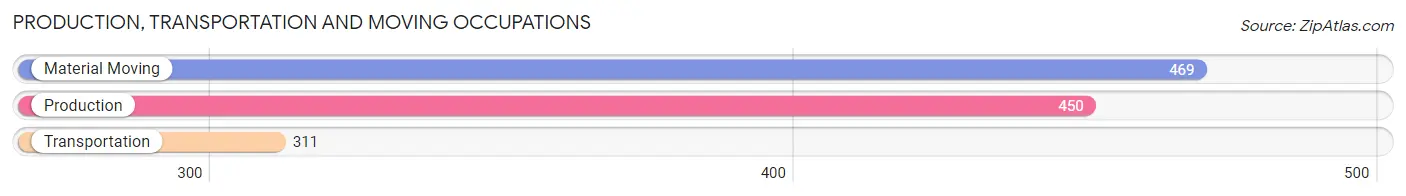
Production, Transportation and Moving Occupations
The most common Production, Transportation and Moving occupations in Campbell are Material Moving (469 | 2.0%), Production (450 | 1.9%), and Transportation (311 | 1.3%).
Production, Transportation and Moving Occupations by Sex
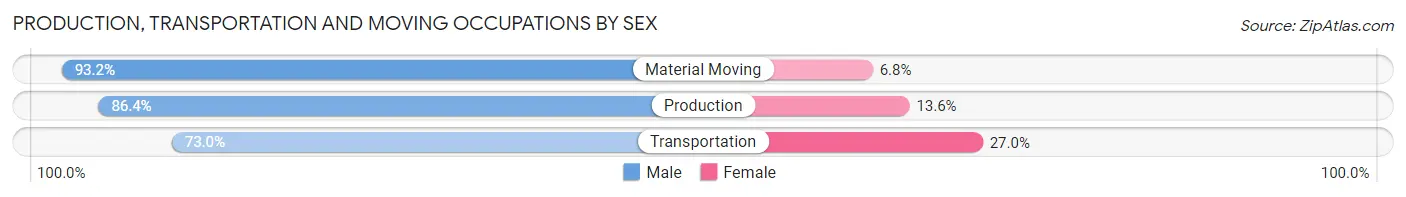
| Occupation | Male | Female |
| Production | 389 (86.4%) | 61 (13.6%) |
| Transportation | 227 (73.0%) | 84 (27.0%) |
| Material Moving | 437 (93.2%) | 32 (6.8%) |
| Total (Category) | 1,053 (85.6%) | 177 (14.4%) |
| Total (Overall) | 12,945 (54.8%) | 10,668 (45.2%) |
Employment Industries by Sex in Campbell
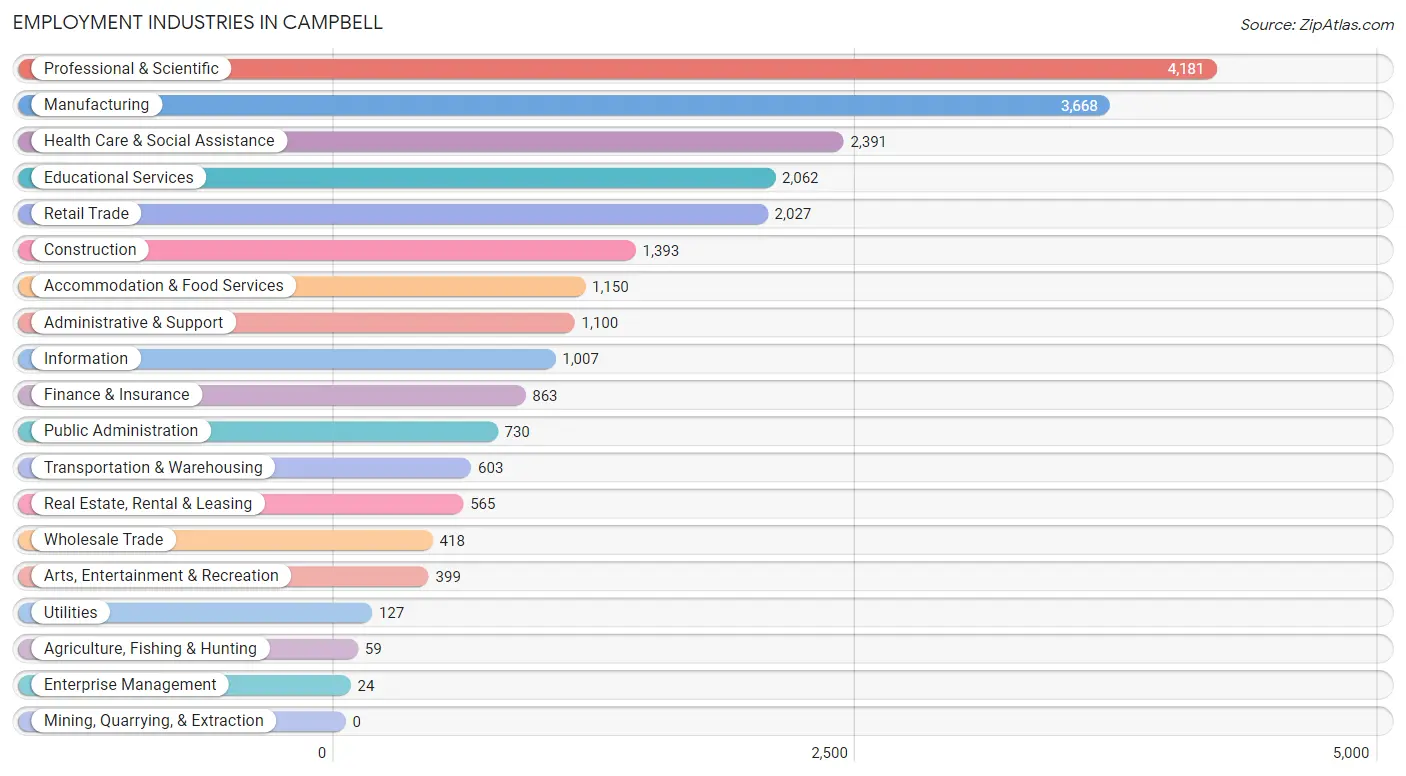
Employment Industries in Campbell
The major employment industries in Campbell include Professional & Scientific (4,181 | 17.7%), Manufacturing (3,668 | 15.5%), Health Care & Social Assistance (2,391 | 10.1%), Educational Services (2,062 | 8.7%), and Retail Trade (2,027 | 8.6%).
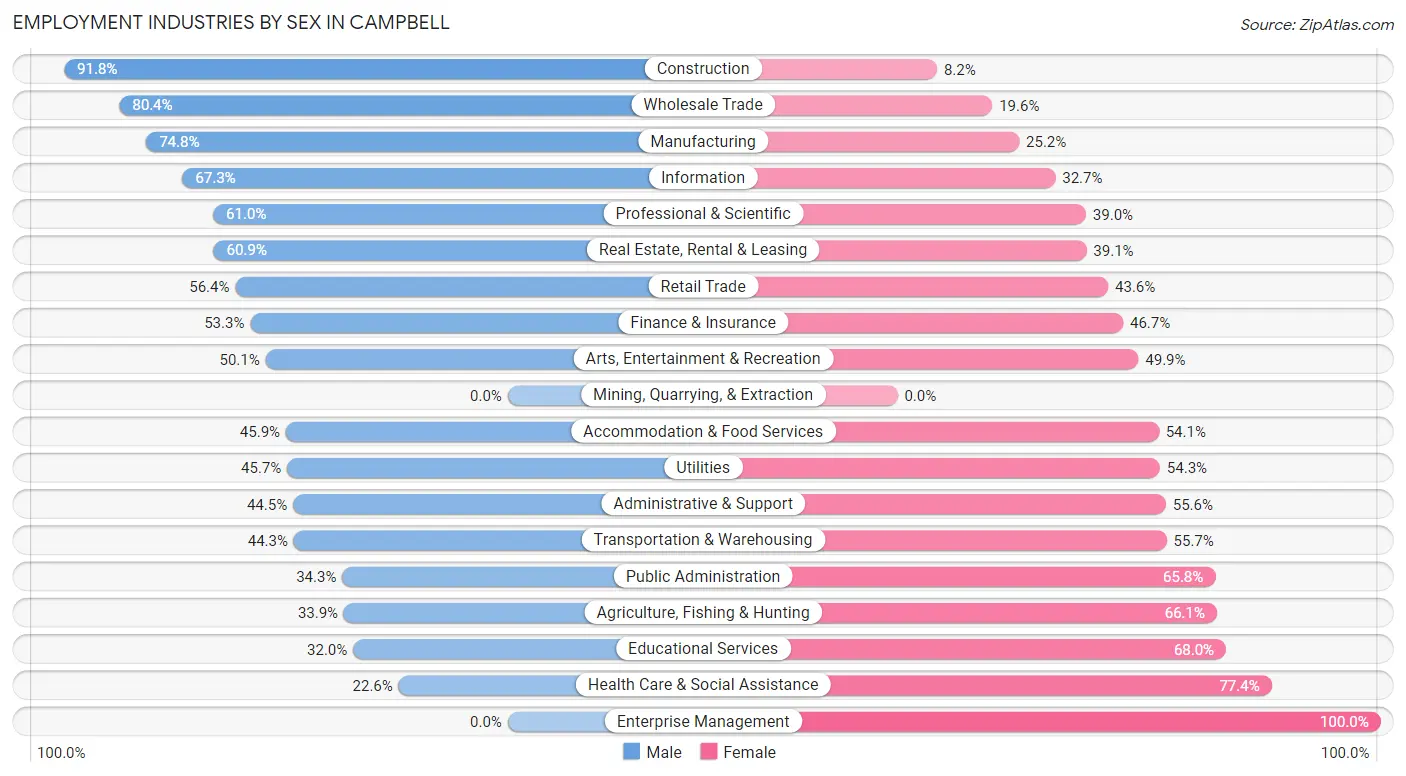
Employment Industries by Sex in Campbell
The Campbell industries that see more men than women are Construction (91.8%), Wholesale Trade (80.4%), and Manufacturing (74.8%), whereas the industries that tend to have a higher number of women are Enterprise Management (100.0%), Health Care & Social Assistance (77.4%), and Educational Services (68.0%).
| Industry | Male | Female |
| Agriculture, Fishing & Hunting | 20 (33.9%) | 39 (66.1%) |
| Mining, Quarrying, & Extraction | 0 (0.0%) | 0 (0.0%) |
| Construction | 1,279 (91.8%) | 114 (8.2%) |
| Manufacturing | 2,744 (74.8%) | 924 (25.2%) |
| Wholesale Trade | 336 (80.4%) | 82 (19.6%) |
| Retail Trade | 1,143 (56.4%) | 884 (43.6%) |
| Transportation & Warehousing | 267 (44.3%) | 336 (55.7%) |
| Utilities | 58 (45.7%) | 69 (54.3%) |
| Information | 678 (67.3%) | 329 (32.7%) |
| Finance & Insurance | 460 (53.3%) | 403 (46.7%) |
| Real Estate, Rental & Leasing | 344 (60.9%) | 221 (39.1%) |
| Professional & Scientific | 2,550 (61.0%) | 1,631 (39.0%) |
| Enterprise Management | 0 (0.0%) | 24 (100.0%) |
| Administrative & Support | 489 (44.5%) | 611 (55.5%) |
| Educational Services | 660 (32.0%) | 1,402 (68.0%) |
| Health Care & Social Assistance | 540 (22.6%) | 1,851 (77.4%) |
| Arts, Entertainment & Recreation | 200 (50.1%) | 199 (49.9%) |
| Accommodation & Food Services | 528 (45.9%) | 622 (54.1%) |
| Public Administration | 250 (34.3%) | 480 (65.7%) |
| Total | 12,945 (54.8%) | 10,668 (45.2%) |
Education in Campbell
School Enrollment in Campbell
The most common levels of schooling among the 9,843 students in Campbell are elementary school (2,247 | 22.8%), high school (2,096 | 21.3%), and middle school (1,915 | 19.5%).
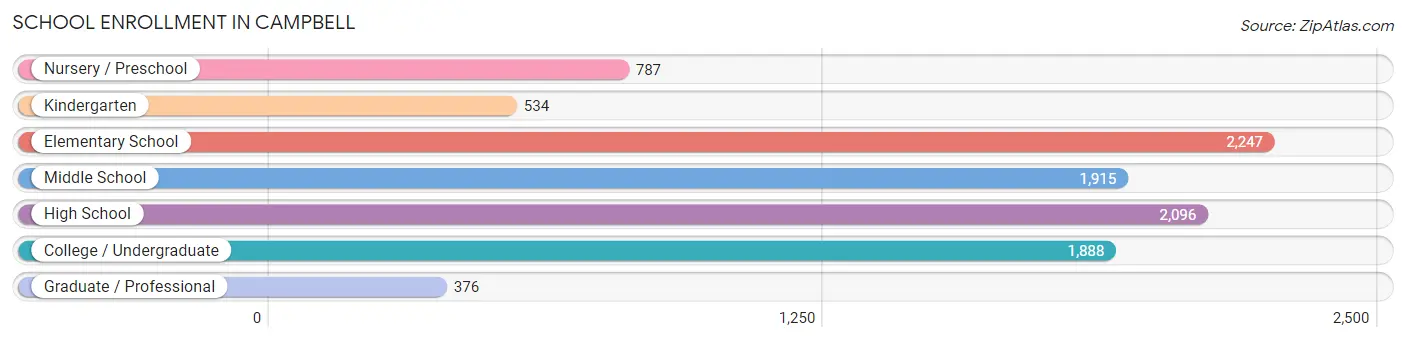
| School Level | # Students | % Students |
| Nursery / Preschool | 787 | 8.0% |
| Kindergarten | 534 | 5.4% |
| Elementary School | 2,247 | 22.8% |
| Middle School | 1,915 | 19.5% |
| High School | 2,096 | 21.3% |
| College / Undergraduate | 1,888 | 19.2% |
| Graduate / Professional | 376 | 3.8% |
| Total | 9,843 | 100.0% |
School Enrollment by Age by Funding Source in Campbell
Out of a total of 9,843 students who are enrolled in schools in Campbell, 2,067 (21.0%) attend a private institution, while the remaining 7,776 (79.0%) are enrolled in public schools. The age group of 3 to 4 year olds has the highest likelihood of being enrolled in private schools, with 458 (66.6% in the age bracket) enrolled. Conversely, the age group of 20 to 24 year olds has the lowest likelihood of being enrolled in a private school, with 803 (90.9% in the age bracket) attending a public institution.
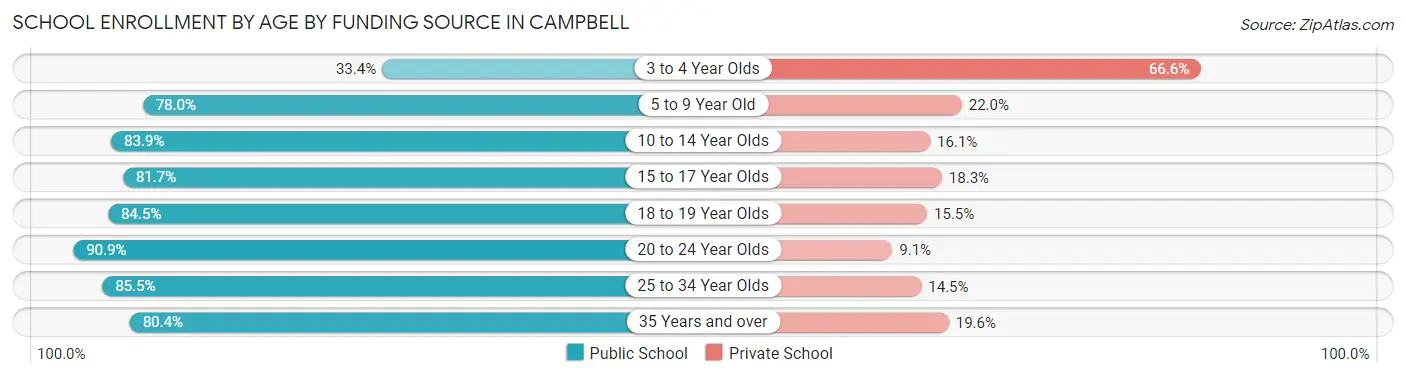
| Age Bracket | Public School | Private School |
| 3 to 4 Year Olds | 230 (33.4%) | 458 (66.6%) |
| 5 to 9 Year Old | 2,049 (78.0%) | 578 (22.0%) |
| 10 to 14 Year Olds | 2,000 (83.9%) | 384 (16.1%) |
| 15 to 17 Year Olds | 1,353 (81.7%) | 303 (18.3%) |
| 18 to 19 Year Olds | 489 (84.5%) | 90 (15.5%) |
| 20 to 24 Year Olds | 803 (90.9%) | 80 (9.1%) |
| 25 to 34 Year Olds | 467 (85.5%) | 79 (14.5%) |
| 35 Years and over | 386 (80.4%) | 94 (19.6%) |
| Total | 7,776 (79.0%) | 2,067 (21.0%) |
Educational Attainment by Field of Study in Campbell
Engineering (4,517 | 22.5%), business (3,128 | 15.6%), computers & mathematics (2,291 | 11.4%), social sciences (1,448 | 7.2%), and science & technology (1,170 | 5.8%) are the most common fields of study among 20,097 individuals in Campbell who have obtained a bachelor's degree or higher.
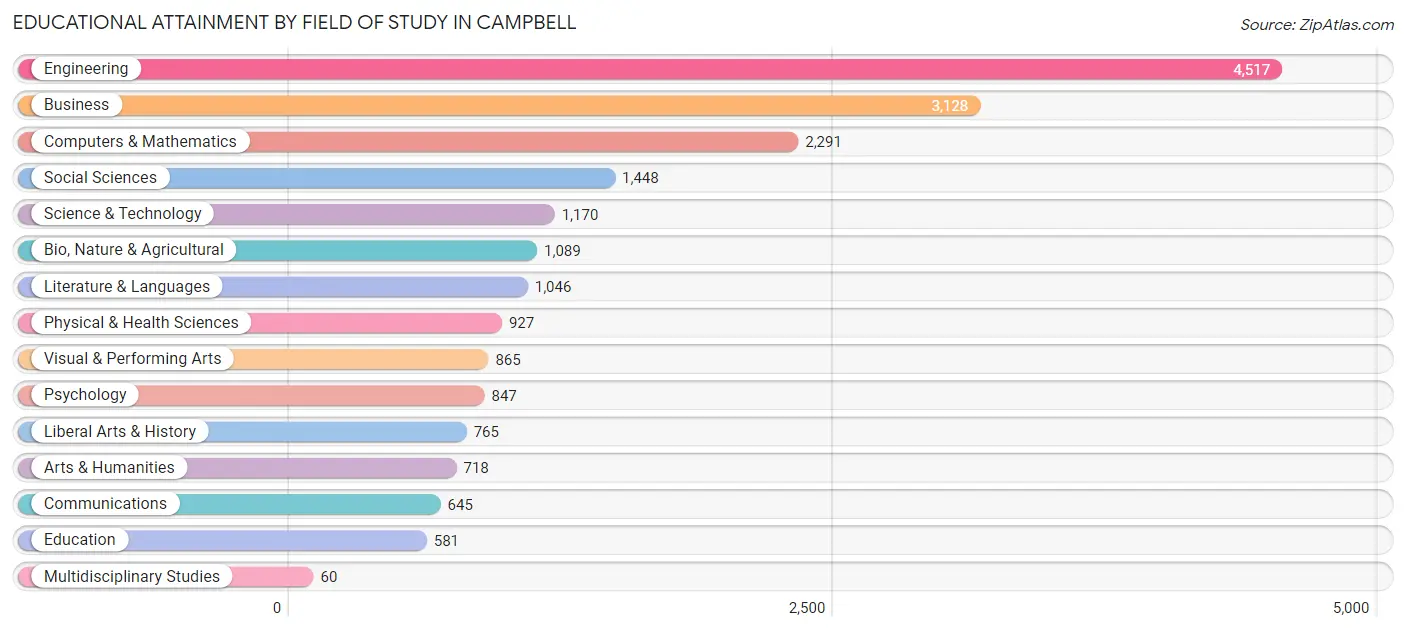
| Field of Study | # Graduates | % Graduates |
| Computers & Mathematics | 2,291 | 11.4% |
| Bio, Nature & Agricultural | 1,089 | 5.4% |
| Physical & Health Sciences | 927 | 4.6% |
| Psychology | 847 | 4.2% |
| Social Sciences | 1,448 | 7.2% |
| Engineering | 4,517 | 22.5% |
| Multidisciplinary Studies | 60 | 0.3% |
| Science & Technology | 1,170 | 5.8% |
| Business | 3,128 | 15.6% |
| Education | 581 | 2.9% |
| Literature & Languages | 1,046 | 5.2% |
| Liberal Arts & History | 765 | 3.8% |
| Visual & Performing Arts | 865 | 4.3% |
| Communications | 645 | 3.2% |
| Arts & Humanities | 718 | 3.6% |
| Total | 20,097 | 100.0% |
Transportation & Commute in Campbell
Vehicle Availability by Sex in Campbell
The most prevalent vehicle ownership categories in Campbell are males with 2 vehicles (6,228, accounting for 49.0%) and females with 2 vehicles (4,826, making up 59.9%).
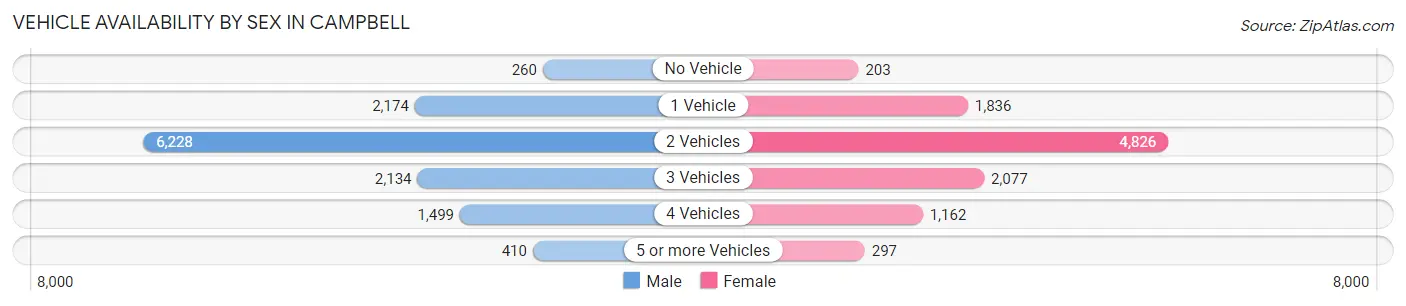
| Vehicles Available | Male | Female |
| No Vehicle | 260 (2.1%) | 203 (1.9%) |
| 1 Vehicle | 2,174 (17.1%) | 1,836 (17.6%) |
| 2 Vehicles | 6,228 (49.0%) | 4,826 (46.4%) |
| 3 Vehicles | 2,134 (16.8%) | 2,077 (20.0%) |
| 4 Vehicles | 1,499 (11.8%) | 1,162 (11.2%) |
| 5 or more Vehicles | 410 (3.2%) | 297 (2.9%) |
| Total | 12,705 (100.0%) | 10,401 (100.0%) |
Commute Time in Campbell
The most frequently occuring commute durations in Campbell are 20 to 24 minutes (3,412 commuters, 18.2%), 30 to 34 minutes (3,232 commuters, 17.2%), and 15 to 19 minutes (2,758 commuters, 14.7%).
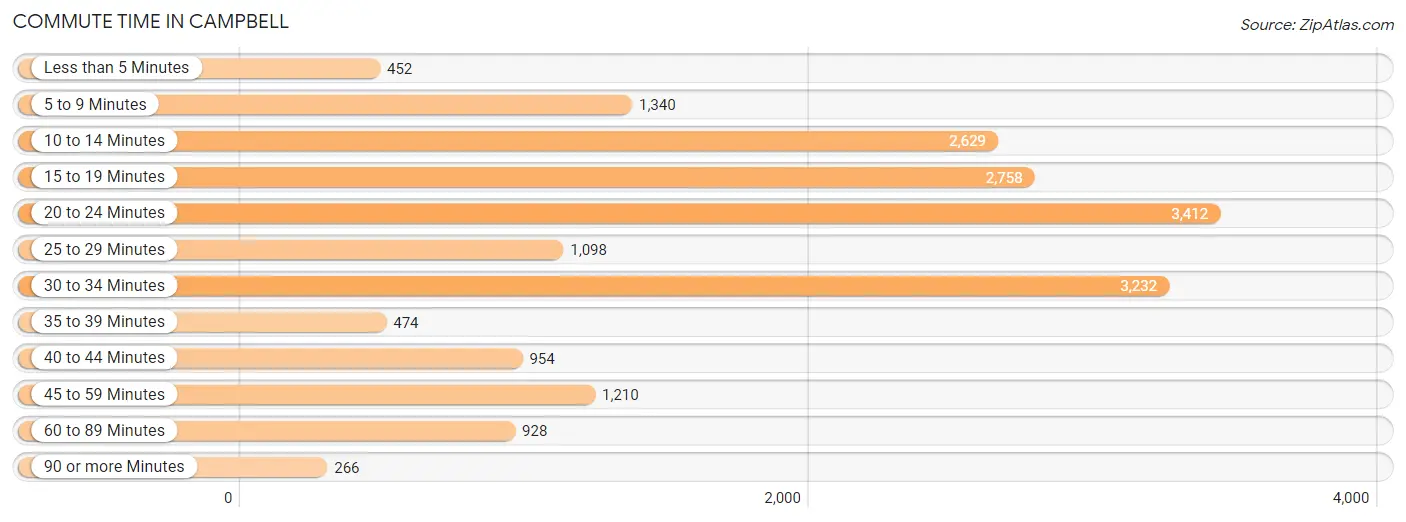
| Commute Time | # Commuters | % Commuters |
| Less than 5 Minutes | 452 | 2.4% |
| 5 to 9 Minutes | 1,340 | 7.1% |
| 10 to 14 Minutes | 2,629 | 14.0% |
| 15 to 19 Minutes | 2,758 | 14.7% |
| 20 to 24 Minutes | 3,412 | 18.2% |
| 25 to 29 Minutes | 1,098 | 5.9% |
| 30 to 34 Minutes | 3,232 | 17.2% |
| 35 to 39 Minutes | 474 | 2.5% |
| 40 to 44 Minutes | 954 | 5.1% |
| 45 to 59 Minutes | 1,210 | 6.5% |
| 60 to 89 Minutes | 928 | 5.0% |
| 90 or more Minutes | 266 | 1.4% |
Commute Time by Sex in Campbell
The most common commute times in Campbell are 30 to 34 minutes (2,051 commuters, 19.6%) for males and 10 to 14 minutes (1,493 commuters, 18.0%) for females.
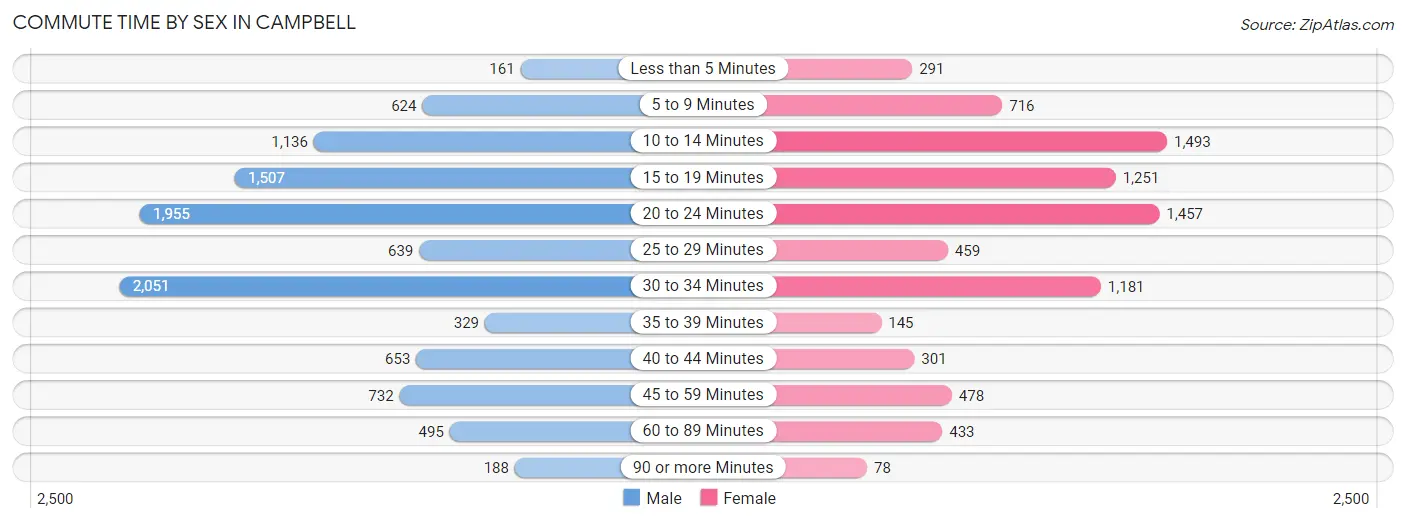
| Commute Time | Male | Female |
| Less than 5 Minutes | 161 (1.5%) | 291 (3.5%) |
| 5 to 9 Minutes | 624 (6.0%) | 716 (8.6%) |
| 10 to 14 Minutes | 1,136 (10.8%) | 1,493 (18.0%) |
| 15 to 19 Minutes | 1,507 (14.4%) | 1,251 (15.1%) |
| 20 to 24 Minutes | 1,955 (18.7%) | 1,457 (17.6%) |
| 25 to 29 Minutes | 639 (6.1%) | 459 (5.5%) |
| 30 to 34 Minutes | 2,051 (19.6%) | 1,181 (14.3%) |
| 35 to 39 Minutes | 329 (3.1%) | 145 (1.8%) |
| 40 to 44 Minutes | 653 (6.2%) | 301 (3.6%) |
| 45 to 59 Minutes | 732 (7.0%) | 478 (5.8%) |
| 60 to 89 Minutes | 495 (4.7%) | 433 (5.2%) |
| 90 or more Minutes | 188 (1.8%) | 78 (0.9%) |
Time of Departure to Work by Sex in Campbell
The most frequent times of departure to work in Campbell are 9:00 AM to 9:59 AM (1,607, 15.3%) for males and 8:00 AM to 8:29 AM (1,344, 16.2%) for females.
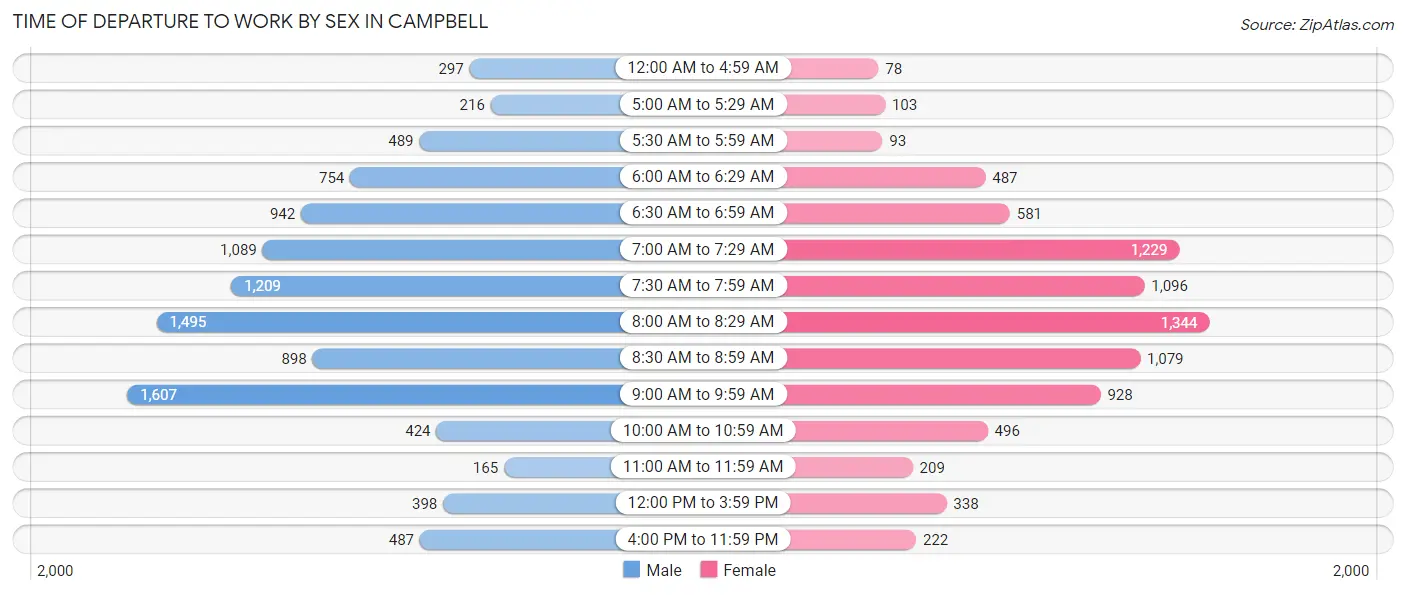
| Time of Departure | Male | Female |
| 12:00 AM to 4:59 AM | 297 (2.8%) | 78 (0.9%) |
| 5:00 AM to 5:29 AM | 216 (2.1%) | 103 (1.2%) |
| 5:30 AM to 5:59 AM | 489 (4.7%) | 93 (1.1%) |
| 6:00 AM to 6:29 AM | 754 (7.2%) | 487 (5.9%) |
| 6:30 AM to 6:59 AM | 942 (9.0%) | 581 (7.0%) |
| 7:00 AM to 7:29 AM | 1,089 (10.4%) | 1,229 (14.8%) |
| 7:30 AM to 7:59 AM | 1,209 (11.6%) | 1,096 (13.2%) |
| 8:00 AM to 8:29 AM | 1,495 (14.3%) | 1,344 (16.2%) |
| 8:30 AM to 8:59 AM | 898 (8.6%) | 1,079 (13.0%) |
| 9:00 AM to 9:59 AM | 1,607 (15.3%) | 928 (11.2%) |
| 10:00 AM to 10:59 AM | 424 (4.1%) | 496 (6.0%) |
| 11:00 AM to 11:59 AM | 165 (1.6%) | 209 (2.5%) |
| 12:00 PM to 3:59 PM | 398 (3.8%) | 338 (4.1%) |
| 4:00 PM to 11:59 PM | 487 (4.6%) | 222 (2.7%) |
| Total | 10,470 (100.0%) | 8,283 (100.0%) |
Housing Occupancy in Campbell
Occupancy by Ownership in Campbell
Of the total 17,064 dwellings in Campbell, owner-occupied units account for 8,803 (51.6%), while renter-occupied units make up 8,261 (48.4%).
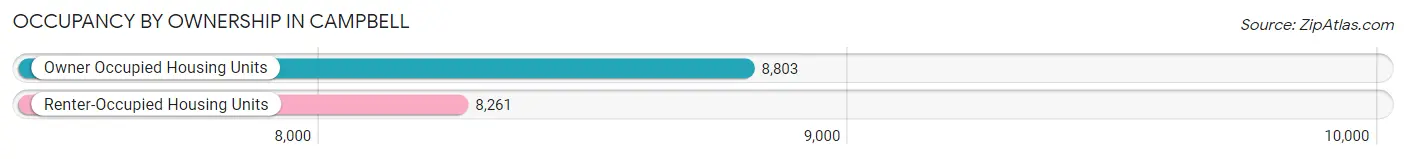
| Occupancy | # Housing Units | % Housing Units |
| Owner Occupied Housing Units | 8,803 | 51.6% |
| Renter-Occupied Housing Units | 8,261 | 48.4% |
| Total Occupied Housing Units | 17,064 | 100.0% |
Occupancy by Household Size in Campbell
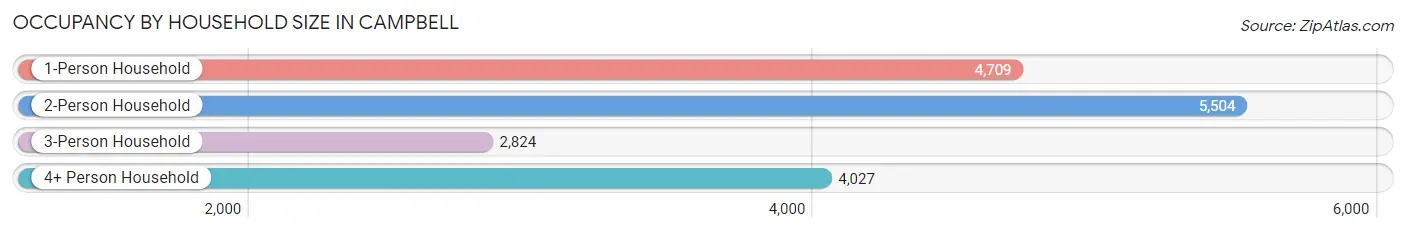
| Household Size | # Housing Units | % Housing Units |
| 1-Person Household | 4,709 | 27.6% |
| 2-Person Household | 5,504 | 32.3% |
| 3-Person Household | 2,824 | 16.6% |
| 4+ Person Household | 4,027 | 23.6% |
| Total Housing Units | 17,064 | 100.0% |
Occupancy by Ownership by Household Size in Campbell
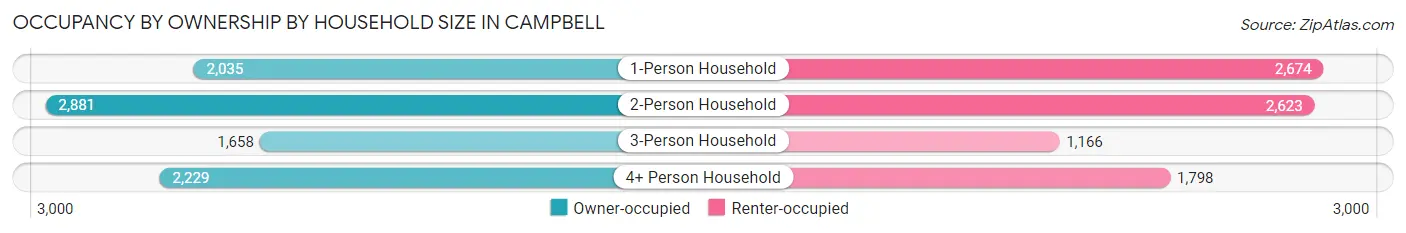
| Household Size | Owner-occupied | Renter-occupied |
| 1-Person Household | 2,035 (43.2%) | 2,674 (56.8%) |
| 2-Person Household | 2,881 (52.3%) | 2,623 (47.7%) |
| 3-Person Household | 1,658 (58.7%) | 1,166 (41.3%) |
| 4+ Person Household | 2,229 (55.3%) | 1,798 (44.7%) |
| Total Housing Units | 8,803 (51.6%) | 8,261 (48.4%) |
Occupancy by Educational Attainment in Campbell
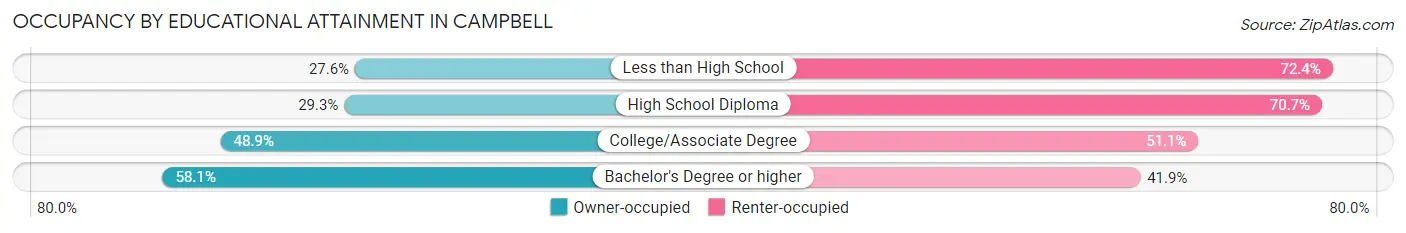
| Household Size | Owner-occupied | Renter-occupied |
| Less than High School | 263 (27.6%) | 690 (72.4%) |
| High School Diploma | 500 (29.3%) | 1,206 (70.7%) |
| College/Associate Degree | 1,766 (48.9%) | 1,845 (51.1%) |
| Bachelor's Degree or higher | 6,274 (58.1%) | 4,520 (41.9%) |
Occupancy by Age of Householder in Campbell
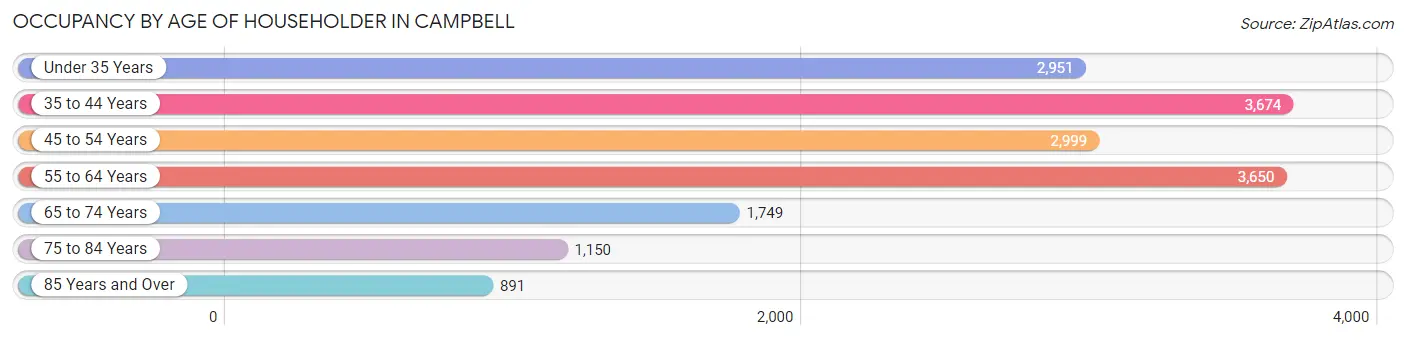
| Age Bracket | # Households | % Households |
| Under 35 Years | 2,951 | 17.3% |
| 35 to 44 Years | 3,674 | 21.5% |
| 45 to 54 Years | 2,999 | 17.6% |
| 55 to 64 Years | 3,650 | 21.4% |
| 65 to 74 Years | 1,749 | 10.2% |
| 75 to 84 Years | 1,150 | 6.7% |
| 85 Years and Over | 891 | 5.2% |
| Total | 17,064 | 100.0% |
Housing Finances in Campbell
Median Income by Occupancy in Campbell
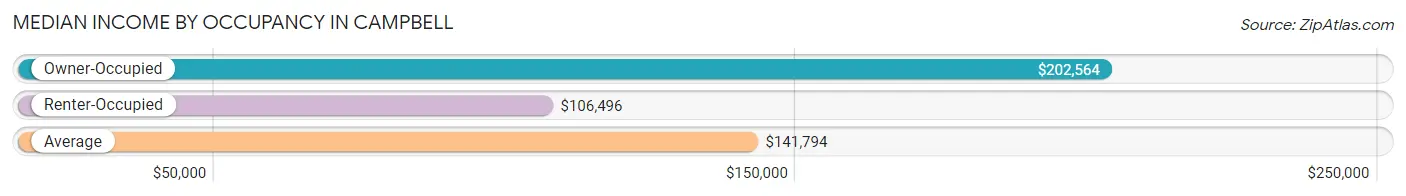
| Occupancy Type | # Households | Median Income |
| Owner-Occupied | 8,803 (51.6%) | $202,564 |
| Renter-Occupied | 8,261 (48.4%) | $106,496 |
| Average | 17,064 (100.0%) | $141,794 |
Occupancy by Householder Income Bracket in Campbell
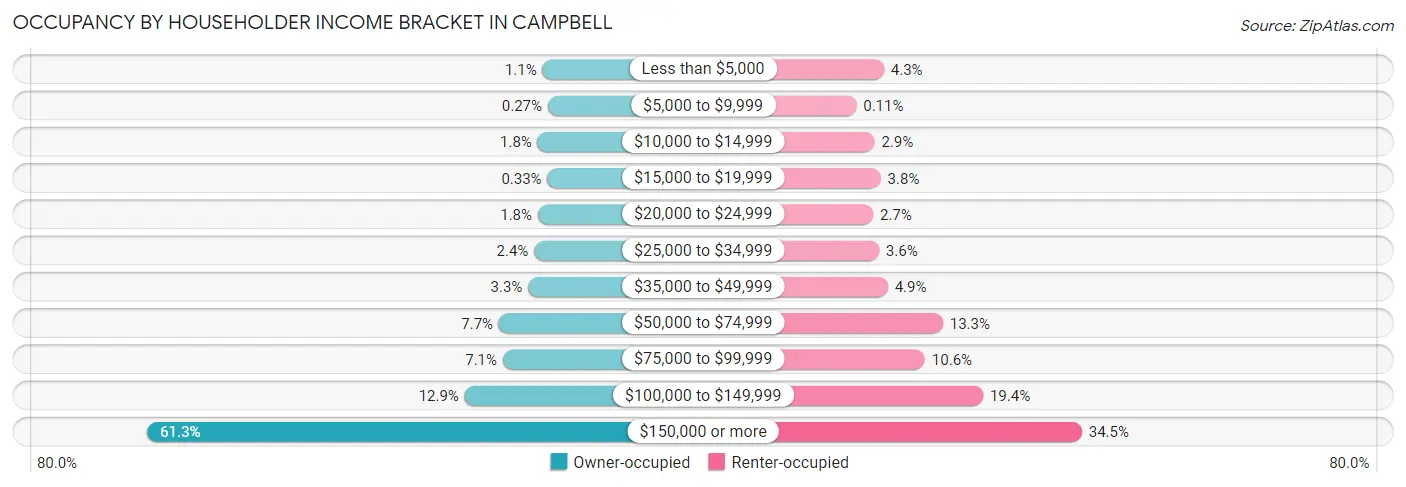
| Income Bracket | Owner-occupied | Renter-occupied |
| Less than $5,000 | 94 (1.1%) | 356 (4.3%) |
| $5,000 to $9,999 | 24 (0.3%) | 9 (0.1%) |
| $10,000 to $14,999 | 160 (1.8%) | 238 (2.9%) |
| $15,000 to $19,999 | 29 (0.3%) | 316 (3.8%) |
| $20,000 to $24,999 | 158 (1.8%) | 219 (2.6%) |
| $25,000 to $34,999 | 207 (2.4%) | 294 (3.6%) |
| $35,000 to $49,999 | 287 (3.3%) | 405 (4.9%) |
| $50,000 to $74,999 | 680 (7.7%) | 1,099 (13.3%) |
| $75,000 to $99,999 | 627 (7.1%) | 873 (10.6%) |
| $100,000 to $149,999 | 1,139 (12.9%) | 1,604 (19.4%) |
| $150,000 or more | 5,398 (61.3%) | 2,848 (34.5%) |
| Total | 8,803 (100.0%) | 8,261 (100.0%) |
Monthly Housing Cost Tiers in Campbell
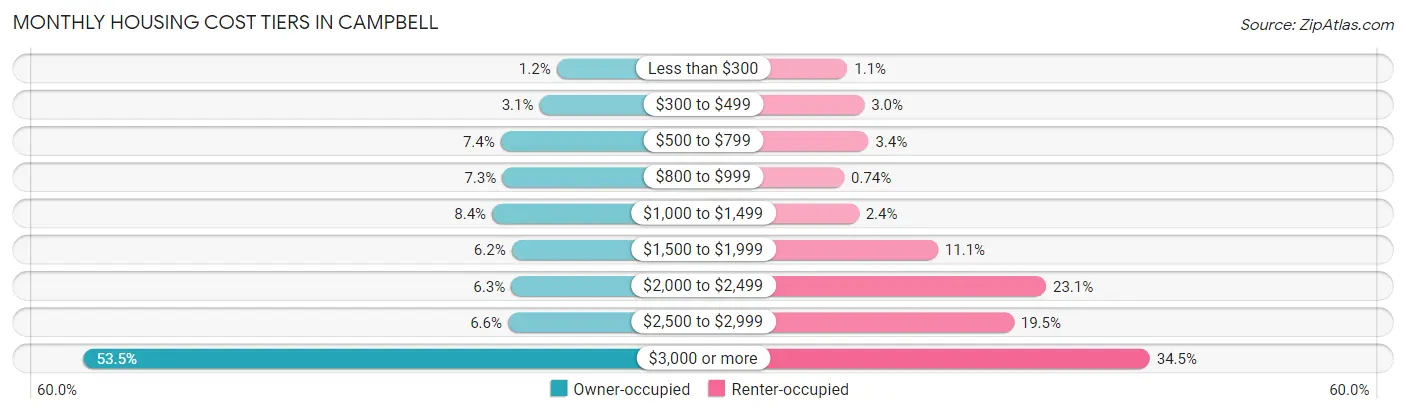
| Monthly Cost | Owner-occupied | Renter-occupied |
| Less than $300 | 109 (1.2%) | 91 (1.1%) |
| $300 to $499 | 276 (3.1%) | 245 (3.0%) |
| $500 to $799 | 653 (7.4%) | 283 (3.4%) |
| $800 to $999 | 639 (7.3%) | 61 (0.7%) |
| $1,000 to $1,499 | 737 (8.4%) | 194 (2.4%) |
| $1,500 to $1,999 | 547 (6.2%) | 917 (11.1%) |
| $2,000 to $2,499 | 552 (6.3%) | 1,904 (23.1%) |
| $2,500 to $2,999 | 583 (6.6%) | 1,609 (19.5%) |
| $3,000 or more | 4,707 (53.5%) | 2,851 (34.5%) |
| Total | 8,803 (100.0%) | 8,261 (100.0%) |
Physical Housing Characteristics in Campbell
Housing Structures in Campbell
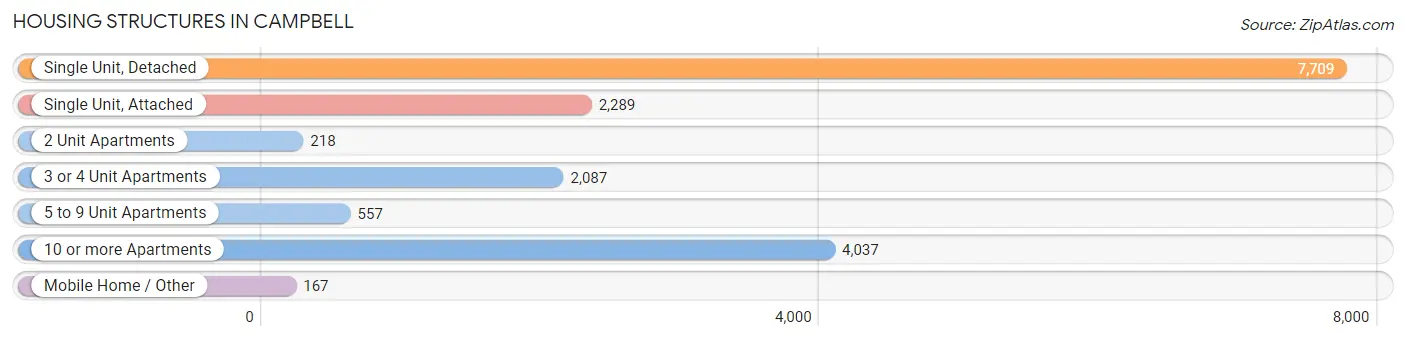
| Structure Type | # Housing Units | % Housing Units |
| Single Unit, Detached | 7,709 | 45.2% |
| Single Unit, Attached | 2,289 | 13.4% |
| 2 Unit Apartments | 218 | 1.3% |
| 3 or 4 Unit Apartments | 2,087 | 12.2% |
| 5 to 9 Unit Apartments | 557 | 3.3% |
| 10 or more Apartments | 4,037 | 23.7% |
| Mobile Home / Other | 167 | 1.0% |
| Total | 17,064 | 100.0% |
Housing Structures by Occupancy in Campbell
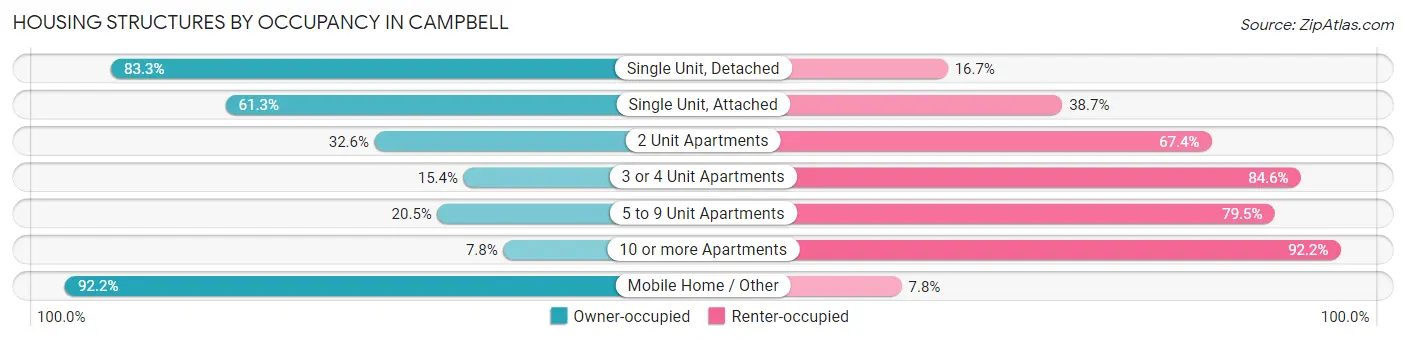
| Structure Type | Owner-occupied | Renter-occupied |
| Single Unit, Detached | 6,425 (83.3%) | 1,284 (16.7%) |
| Single Unit, Attached | 1,403 (61.3%) | 886 (38.7%) |
| 2 Unit Apartments | 71 (32.6%) | 147 (67.4%) |
| 3 or 4 Unit Apartments | 322 (15.4%) | 1,765 (84.6%) |
| 5 to 9 Unit Apartments | 114 (20.5%) | 443 (79.5%) |
| 10 or more Apartments | 314 (7.8%) | 3,723 (92.2%) |
| Mobile Home / Other | 154 (92.2%) | 13 (7.8%) |
| Total | 8,803 (51.6%) | 8,261 (48.4%) |
Housing Structures by Number of Rooms in Campbell
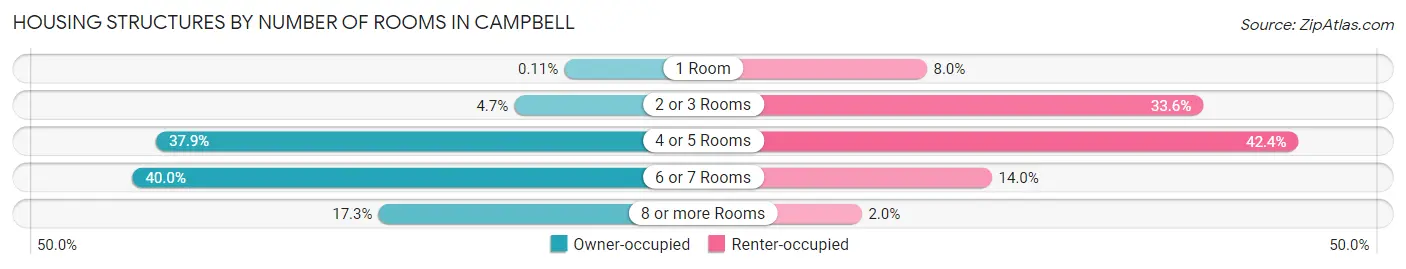
| Number of Rooms | Owner-occupied | Renter-occupied |
| 1 Room | 10 (0.1%) | 662 (8.0%) |
| 2 or 3 Rooms | 416 (4.7%) | 2,774 (33.6%) |
| 4 or 5 Rooms | 3,332 (37.9%) | 3,502 (42.4%) |
| 6 or 7 Rooms | 3,523 (40.0%) | 1,159 (14.0%) |
| 8 or more Rooms | 1,522 (17.3%) | 164 (2.0%) |
| Total | 8,803 (100.0%) | 8,261 (100.0%) |
Housing Structure by Heating Type in Campbell
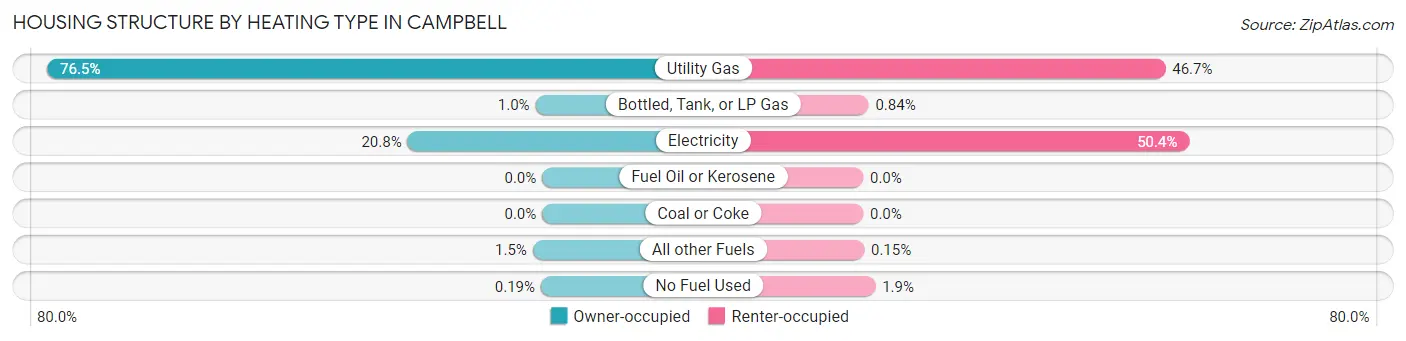
| Heating Type | Owner-occupied | Renter-occupied |
| Utility Gas | 6,735 (76.5%) | 3,860 (46.7%) |
| Bottled, Tank, or LP Gas | 91 (1.0%) | 69 (0.8%) |
| Electricity | 1,832 (20.8%) | 4,165 (50.4%) |
| Fuel Oil or Kerosene | 0 (0.0%) | 0 (0.0%) |
| Coal or Coke | 0 (0.0%) | 0 (0.0%) |
| All other Fuels | 128 (1.5%) | 12 (0.2%) |
| No Fuel Used | 17 (0.2%) | 155 (1.9%) |
| Total | 8,803 (100.0%) | 8,261 (100.0%) |
Household Vehicle Usage in Campbell
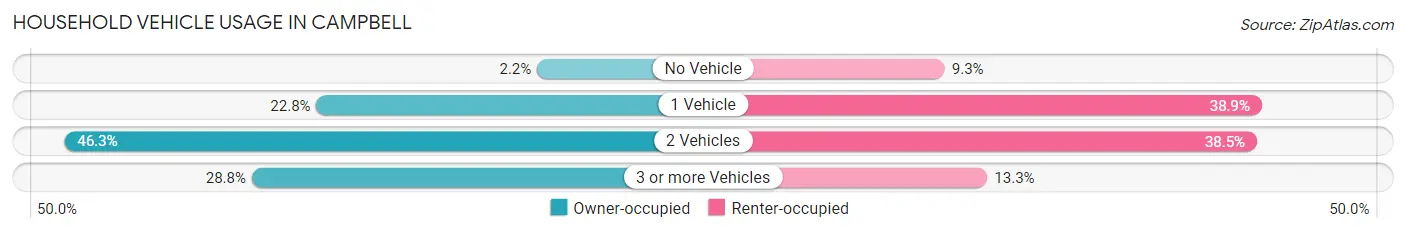
| Vehicles per Household | Owner-occupied | Renter-occupied |
| No Vehicle | 190 (2.2%) | 771 (9.3%) |
| 1 Vehicle | 2,004 (22.8%) | 3,214 (38.9%) |
| 2 Vehicles | 4,075 (46.3%) | 3,177 (38.5%) |
| 3 or more Vehicles | 2,534 (28.8%) | 1,099 (13.3%) |
| Total | 8,803 (100.0%) | 8,261 (100.0%) |
Real Estate & Mortgages in Campbell
Real Estate and Mortgage Overview in Campbell
| Characteristic | Without Mortgage | With Mortgage |
| Housing Units | 2,746 | 6,057 |
| Median Property Value | $1,274,400 | $1,555,000 |
| Median Household Income | $121,875 | $4,285 |
| Monthly Housing Costs | $880 | $4,672 |
| Real Estate Taxes | $5,276 | $70 |
Property Value by Mortgage Status in Campbell
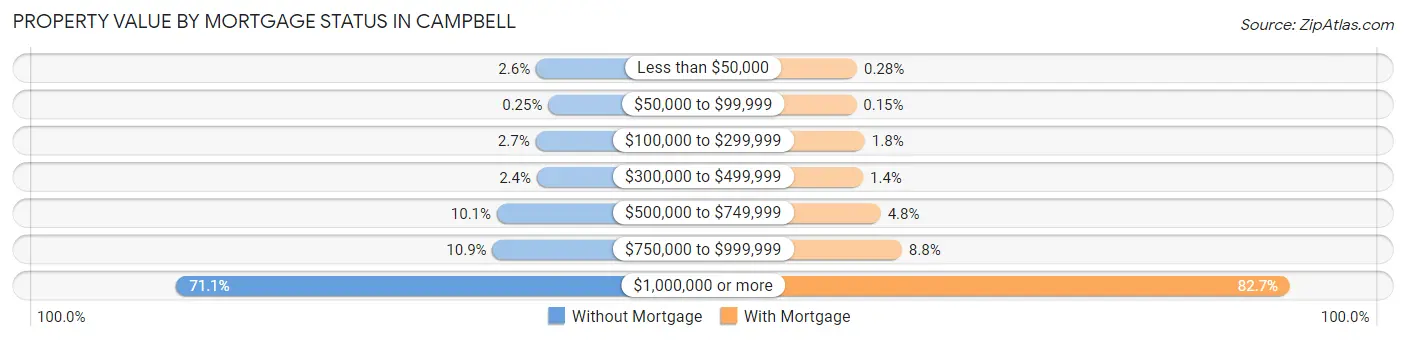
| Property Value | Without Mortgage | With Mortgage |
| Less than $50,000 | 71 (2.6%) | 17 (0.3%) |
| $50,000 to $99,999 | 7 (0.3%) | 9 (0.2%) |
| $100,000 to $299,999 | 74 (2.7%) | 108 (1.8%) |
| $300,000 to $499,999 | 67 (2.4%) | 87 (1.4%) |
| $500,000 to $749,999 | 276 (10.1%) | 290 (4.8%) |
| $750,000 to $999,999 | 299 (10.9%) | 535 (8.8%) |
| $1,000,000 or more | 1,952 (71.1%) | 5,011 (82.7%) |
| Total | 2,746 (100.0%) | 6,057 (100.0%) |
Household Income by Mortgage Status in Campbell
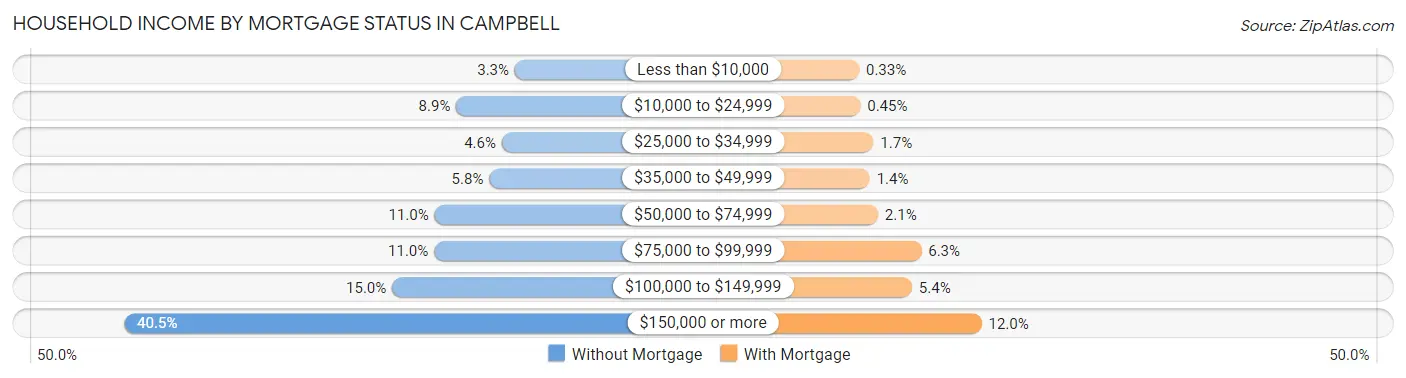
| Household Income | Without Mortgage | With Mortgage |
| Less than $10,000 | 91 (3.3%) | 20 (0.3%) |
| $10,000 to $24,999 | 244 (8.9%) | 27 (0.4%) |
| $25,000 to $34,999 | 125 (4.5%) | 103 (1.7%) |
| $35,000 to $49,999 | 158 (5.8%) | 82 (1.3%) |
| $50,000 to $74,999 | 301 (11.0%) | 129 (2.1%) |
| $75,000 to $99,999 | 302 (11.0%) | 379 (6.3%) |
| $100,000 to $149,999 | 412 (15.0%) | 325 (5.4%) |
| $150,000 or more | 1,113 (40.5%) | 727 (12.0%) |
| Total | 2,746 (100.0%) | 6,057 (100.0%) |
Property Value to Household Income Ratio in Campbell
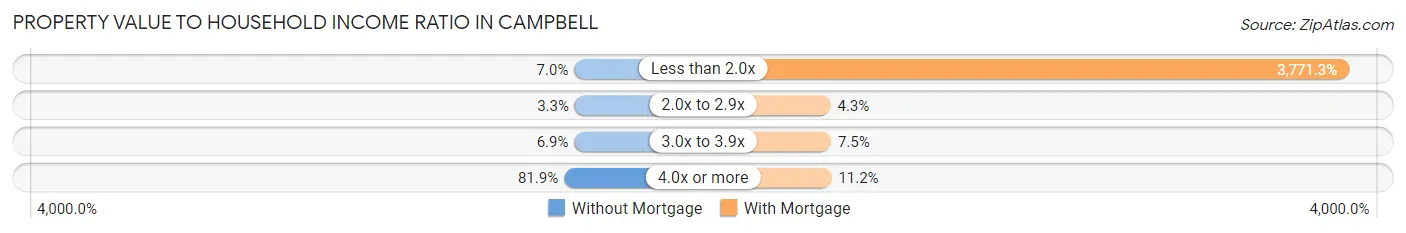
| Value-to-Income Ratio | Without Mortgage | With Mortgage |
| Less than 2.0x | 193 (7.0%) | 228,427 (3,771.3%) |
| 2.0x to 2.9x | 91 (3.3%) | 261 (4.3%) |
| 3.0x to 3.9x | 190 (6.9%) | 456 (7.5%) |
| 4.0x or more | 2,248 (81.9%) | 677 (11.2%) |
| Total | 2,746 (100.0%) | 6,057 (100.0%) |
Real Estate Taxes by Mortgage Status in Campbell
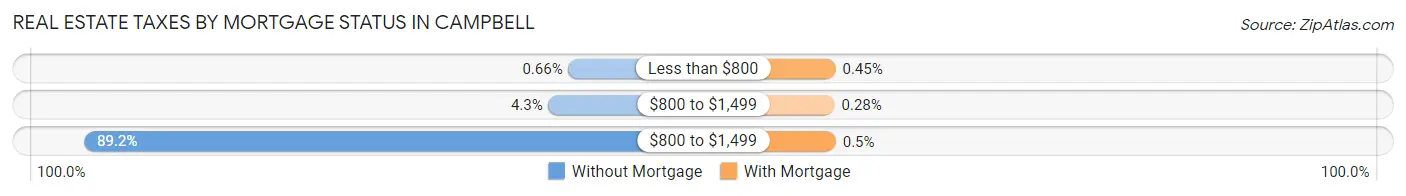
| Property Taxes | Without Mortgage | With Mortgage |
| Less than $800 | 18 (0.7%) | 27 (0.4%) |
| $800 to $1,499 | 118 (4.3%) | 17 (0.3%) |
| $800 to $1,499 | 2,448 (89.1%) | 30 (0.5%) |
| Total | 2,746 (100.0%) | 6,057 (100.0%) |
Health & Disability in Campbell
Health Insurance Coverage by Age in Campbell
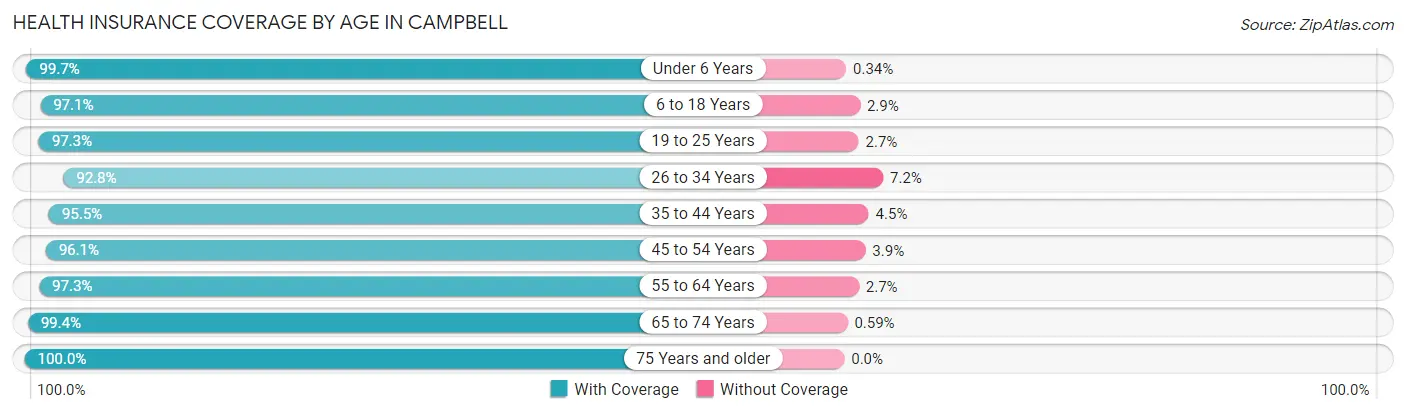
| Age Bracket | With Coverage | Without Coverage |
| Under 6 Years | 3,211 (99.7%) | 11 (0.3%) |
| 6 to 18 Years | 6,488 (97.1%) | 195 (2.9%) |
| 19 to 25 Years | 2,379 (97.3%) | 65 (2.7%) |
| 26 to 34 Years | 5,571 (92.8%) | 434 (7.2%) |
| 35 to 44 Years | 6,651 (95.5%) | 316 (4.5%) |
| 45 to 54 Years | 5,338 (96.1%) | 219 (3.9%) |
| 55 to 64 Years | 6,053 (97.3%) | 169 (2.7%) |
| 65 to 74 Years | 3,220 (99.4%) | 19 (0.6%) |
| 75 Years and older | 2,945 (100.0%) | 0 (0.0%) |
| Total | 41,856 (96.7%) | 1,428 (3.3%) |
Health Insurance Coverage by Citizenship Status in Campbell
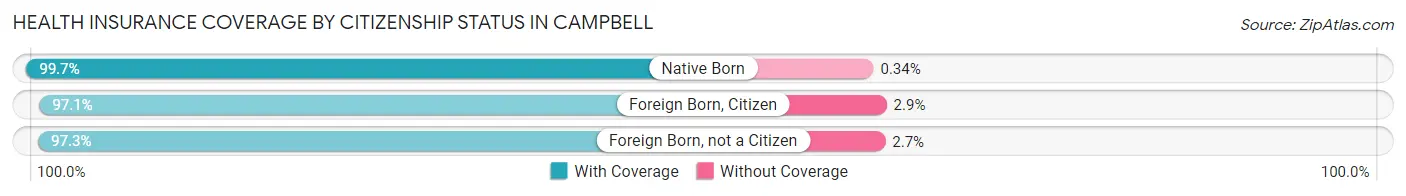
| Citizenship Status | With Coverage | Without Coverage |
| Native Born | 3,211 (99.7%) | 11 (0.3%) |
| Foreign Born, Citizen | 6,488 (97.1%) | 195 (2.9%) |
| Foreign Born, not a Citizen | 2,379 (97.3%) | 65 (2.7%) |
Health Insurance Coverage by Household Income in Campbell
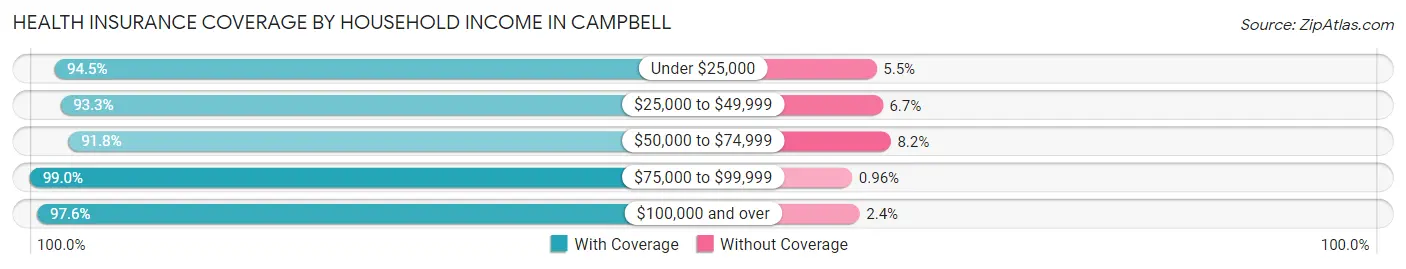
| Household Income | With Coverage | Without Coverage |
| Under $25,000 | 2,273 (94.5%) | 133 (5.5%) |
| $25,000 to $49,999 | 1,971 (93.3%) | 141 (6.7%) |
| $50,000 to $74,999 | 4,050 (91.8%) | 361 (8.2%) |
| $75,000 to $99,999 | 3,183 (99.0%) | 31 (1.0%) |
| $100,000 and over | 30,179 (97.6%) | 730 (2.4%) |
Public vs Private Health Insurance Coverage by Age in Campbell
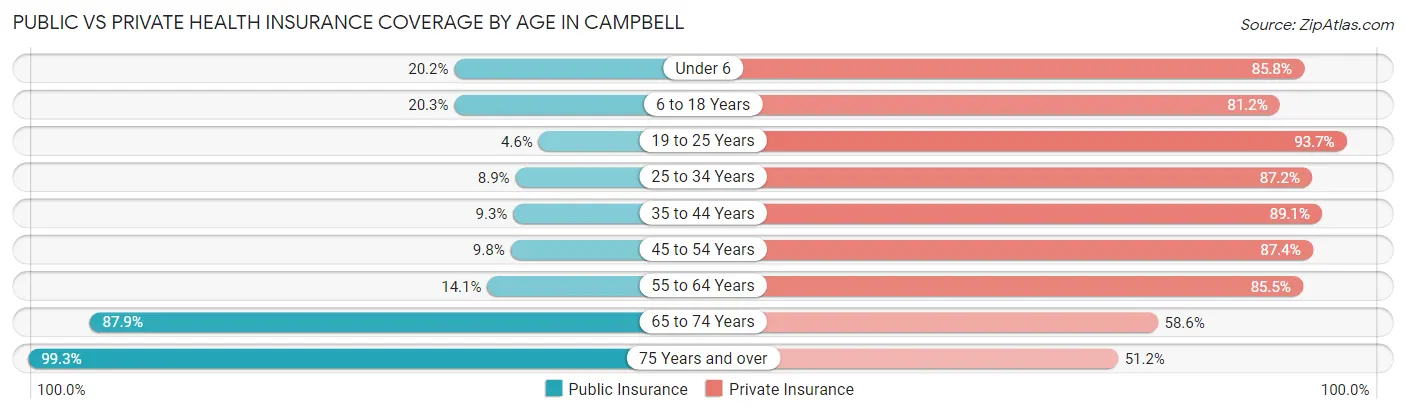
| Age Bracket | Public Insurance | Private Insurance |
| Under 6 | 652 (20.2%) | 2,763 (85.8%) |
| 6 to 18 Years | 1,353 (20.3%) | 5,429 (81.2%) |
| 19 to 25 Years | 112 (4.6%) | 2,289 (93.7%) |
| 25 to 34 Years | 534 (8.9%) | 5,238 (87.2%) |
| 35 to 44 Years | 649 (9.3%) | 6,207 (89.1%) |
| 45 to 54 Years | 545 (9.8%) | 4,855 (87.4%) |
| 55 to 64 Years | 878 (14.1%) | 5,322 (85.5%) |
| 65 to 74 Years | 2,848 (87.9%) | 1,898 (58.6%) |
| 75 Years and over | 2,925 (99.3%) | 1,508 (51.2%) |
| Total | 10,496 (24.2%) | 35,509 (82.0%) |
Disability Status by Sex by Age in Campbell
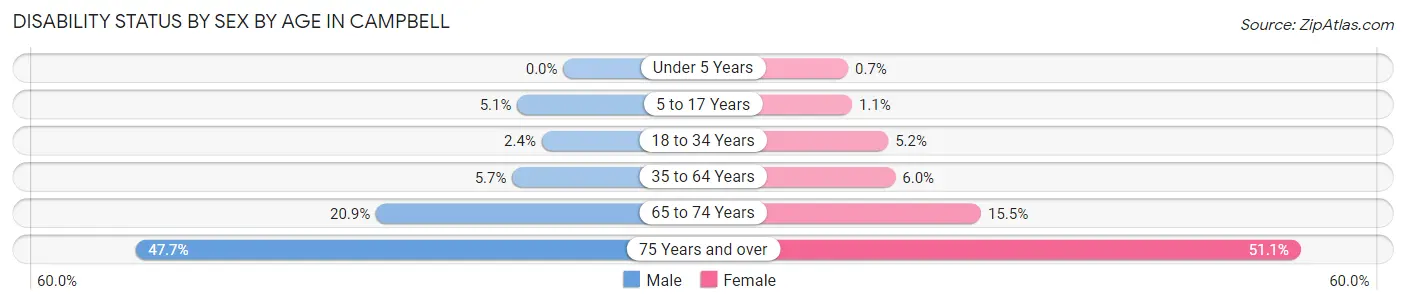
| Age Bracket | Male | Female |
| Under 5 Years | 0 (0.0%) | 10 (0.7%) |
| 5 to 17 Years | 179 (5.1%) | 37 (1.1%) |
| 18 to 34 Years | 113 (2.4%) | 217 (5.2%) |
| 35 to 64 Years | 542 (5.7%) | 550 (6.0%) |
| 65 to 74 Years | 287 (20.9%) | 289 (15.5%) |
| 75 Years and over | 533 (47.7%) | 934 (51.1%) |
Disability Class by Sex by Age in Campbell
Disability Class: Hearing Difficulty
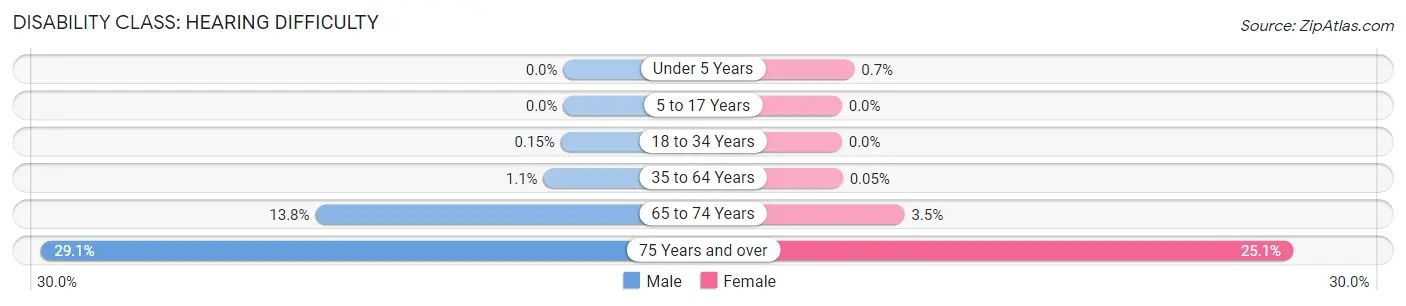
| Age Bracket | Male | Female |
| Under 5 Years | 0 (0.0%) | 10 (0.7%) |
| 5 to 17 Years | 0 (0.0%) | 0 (0.0%) |
| 18 to 34 Years | 7 (0.2%) | 0 (0.0%) |
| 35 to 64 Years | 106 (1.1%) | 5 (0.1%) |
| 65 to 74 Years | 190 (13.8%) | 65 (3.5%) |
| 75 Years and over | 325 (29.1%) | 459 (25.1%) |
Disability Class: Vision Difficulty
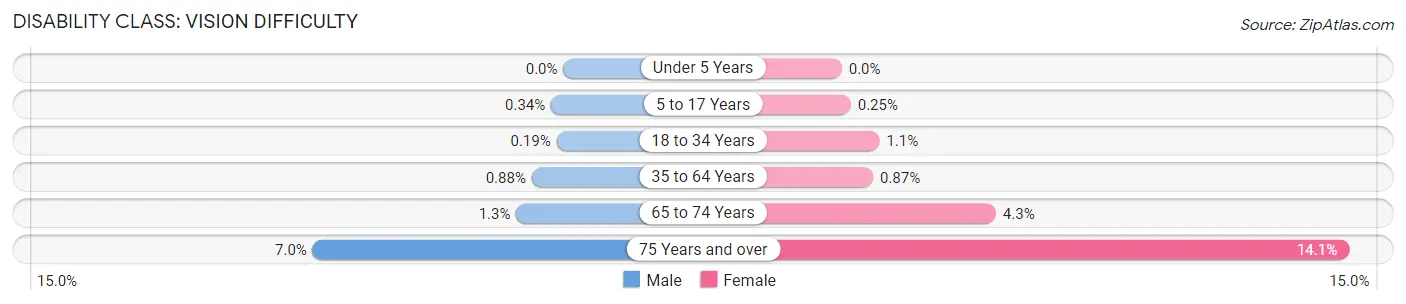
| Age Bracket | Male | Female |
| Under 5 Years | 0 (0.0%) | 0 (0.0%) |
| 5 to 17 Years | 12 (0.3%) | 8 (0.3%) |
| 18 to 34 Years | 9 (0.2%) | 44 (1.1%) |
| 35 to 64 Years | 84 (0.9%) | 80 (0.9%) |
| 65 to 74 Years | 18 (1.3%) | 80 (4.3%) |
| 75 Years and over | 78 (7.0%) | 258 (14.1%) |
Disability Class: Cognitive Difficulty
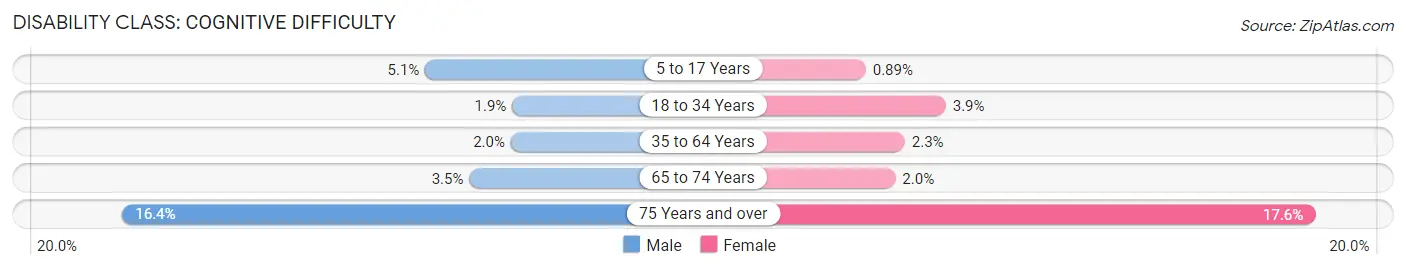
| Age Bracket | Male | Female |
| 5 to 17 Years | 179 (5.1%) | 29 (0.9%) |
| 18 to 34 Years | 89 (1.9%) | 162 (3.9%) |
| 35 to 64 Years | 186 (1.9%) | 216 (2.3%) |
| 65 to 74 Years | 48 (3.5%) | 37 (2.0%) |
| 75 Years and over | 183 (16.4%) | 321 (17.6%) |
Disability Class: Ambulatory Difficulty
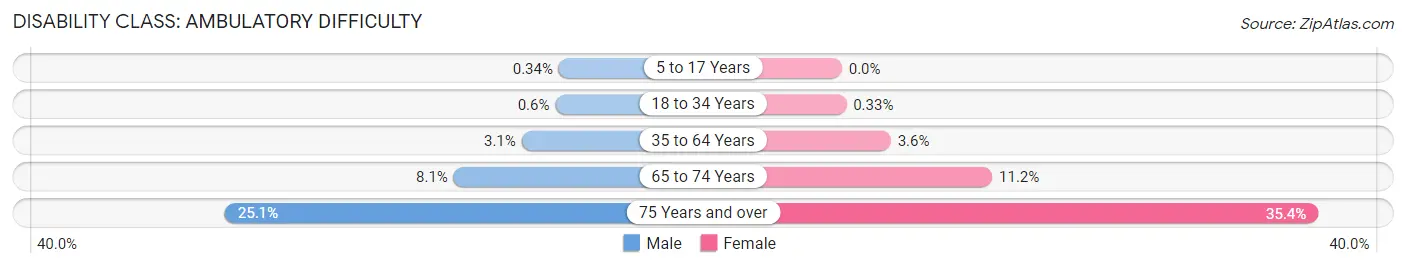
| Age Bracket | Male | Female |
| 5 to 17 Years | 12 (0.3%) | 0 (0.0%) |
| 18 to 34 Years | 28 (0.6%) | 14 (0.3%) |
| 35 to 64 Years | 295 (3.1%) | 335 (3.6%) |
| 65 to 74 Years | 112 (8.1%) | 208 (11.2%) |
| 75 Years and over | 281 (25.1%) | 646 (35.4%) |
Disability Class: Self-Care Difficulty
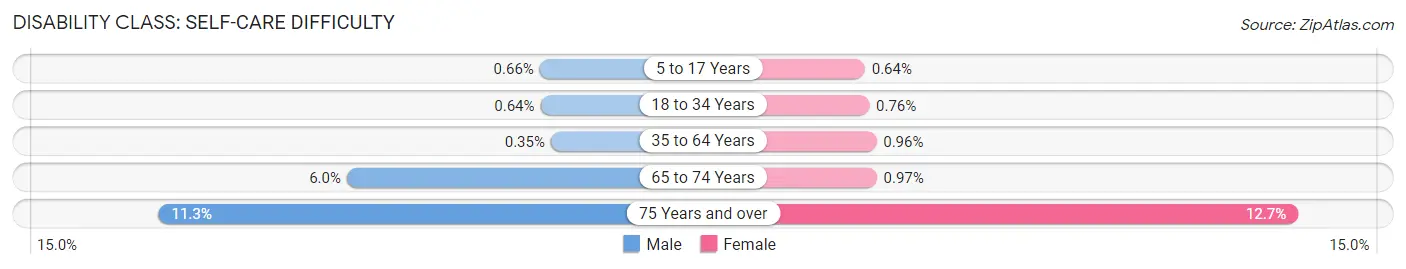
| Age Bracket | Male | Female |
| 5 to 17 Years | 23 (0.7%) | 21 (0.6%) |
| 18 to 34 Years | 30 (0.6%) | 32 (0.8%) |
| 35 to 64 Years | 33 (0.4%) | 89 (1.0%) |
| 65 to 74 Years | 83 (6.0%) | 18 (1.0%) |
| 75 Years and over | 126 (11.3%) | 232 (12.7%) |
Technology Access in Campbell
Computing Device Access in Campbell
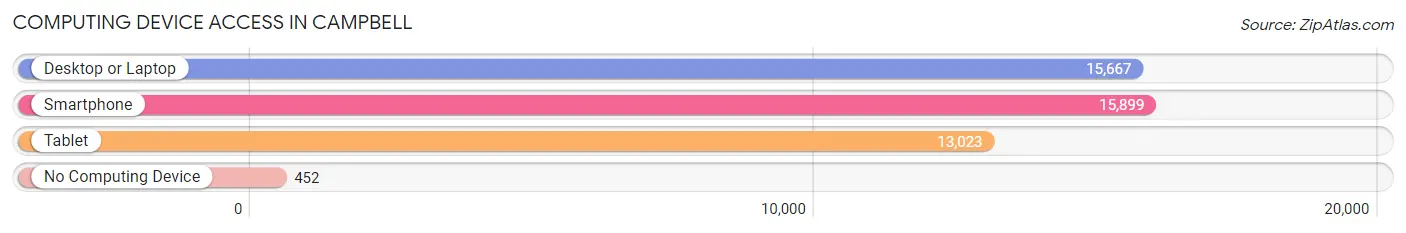
| Device Type | # Households | % Households |
| Desktop or Laptop | 15,667 | 91.8% |
| Smartphone | 15,899 | 93.2% |
| Tablet | 13,023 | 76.3% |
| No Computing Device | 452 | 2.6% |
| Total | 17,064 | 100.0% |
Internet Access in Campbell
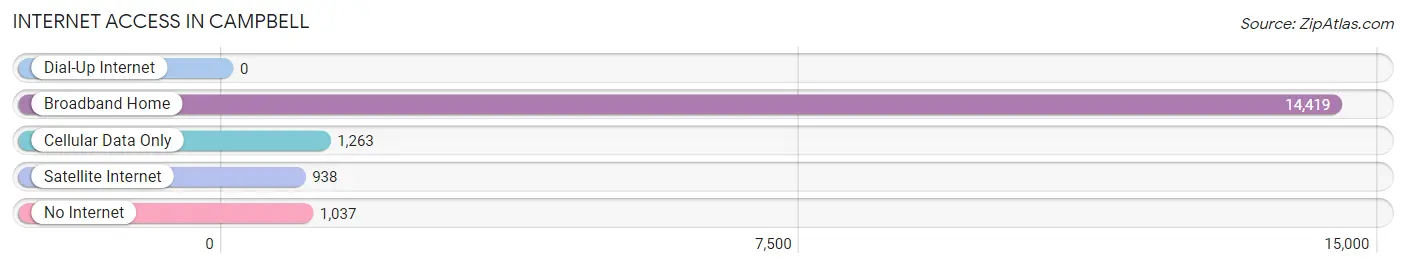
| Internet Type | # Households | % Households |
| Dial-Up Internet | 0 | 0.0% |
| Broadband Home | 14,419 | 84.5% |
| Cellular Data Only | 1,263 | 7.4% |
| Satellite Internet | 938 | 5.5% |
| No Internet | 1,037 | 6.1% |
| Total | 17,064 | 100.0% |
Campbell Summary
Campbell, California is a city located in Santa Clara County, in the San Francisco Bay Area. It is situated between San Jose and Los Gatos, and is part of the Silicon Valley. The city has a population of approximately 42,000 people, and is known for its small-town charm and vibrant downtown area.
History
The area that is now Campbell was originally inhabited by the Ohlone people, who lived in the area for thousands of years before the arrival of Europeans. The first Europeans to settle in the area were the Spanish, who established the Mission Santa Clara de Asís in 1777. The mission was the eighth of the 21 missions established in California by the Spanish.
In the mid-1800s, the area was settled by pioneers, who established farms and ranches in the area. The town of Campbell was founded in 1851, and was named after Benjamin Campbell, a local rancher. The town grew slowly, and by the early 1900s, it had become a popular destination for tourists.
In the 1950s, the city began to experience rapid growth, as the population of the San Francisco Bay Area increased. This growth was fueled by the development of the nearby Silicon Valley, which brought many new businesses and jobs to the area.
Geography
Campbell is located in the Santa Clara Valley, in the San Francisco Bay Area. It is situated between San Jose and Los Gatos, and is part of the Silicon Valley. The city is bordered by the cities of San Jose, Los Gatos, and Saratoga.
The city has a total area of 5.2 square miles, of which 5.1 square miles is land and 0.1 square miles is water. The city is located at an elevation of about 500 feet above sea level.
Economy
Campbell is part of the Silicon Valley, and is home to many technology companies. The city is also home to a number of retail stores, restaurants, and other businesses.
The city's largest employers include eBay, Cisco Systems, and Lockheed Martin. Other major employers include Apple, Google, and Yahoo.
Demographics
As of the 2010 census, the population of Campbell was 42,184. The racial makeup of the city was 57.2% White, 1.2% African American, 0.4% Native American, 25.2% Asian, 0.2% Pacific Islander, 11.2% from other races, and 4.7% from two or more races. Hispanic or Latino of any race were 24.6% of the population.
The median household income in Campbell was $90,917, and the median family income was $103,917. The per capita income for the city was $41,945. About 5.2% of families and 7.3% of the population were below the poverty line.
The city is served by the Campbell Union School District, which includes seven elementary schools, two middle schools, and one high school. The city is also home to several private schools, including the Harker School and the Stratford School.
Common Questions
What is Per Capita Income in Campbell?
Per Capita income in Campbell is $77,923.
What is the Median Family Income in Campbell?
Median Family Income in Campbell is $182,790.
What is the Median Household income in Campbell?
Median Household Income in Campbell is $141,794.
What is Income or Wage Gap in Campbell?
Income or Wage Gap in Campbell is 35.9%.
Women in Campbell earn 64.1 cents for every dollar earned by a man.
What is Family Income Deficit in Campbell?
Family Income Deficit in Campbell is $10,999.
Families that are below poverty line in Campbell earn $10,999 less on average than the poverty threshold level.
What is Inequality or Gini Index in Campbell?
Inequality or Gini Index in Campbell is 0.46.
What is the Total Population of Campbell?
Total Population of Campbell is 43,464.
What is the Total Male Population of Campbell?
Total Male Population of Campbell is 21,571.
What is the Total Female Population of Campbell?
Total Female Population of Campbell is 21,893.
What is the Ratio of Males per 100 Females in Campbell?
There are 98.53 Males per 100 Females in Campbell.
What is the Ratio of Females per 100 Males in Campbell?
There are 101.49 Females per 100 Males in Campbell.
What is the Median Population Age in Campbell?
Median Population Age in Campbell is 39.3 Years.
What is the Average Family Size in Campbell
Average Family Size in Campbell is 3.1 People.
What is the Average Household Size in Campbell
Average Household Size in Campbell is 2.5 People.
How Large is the Labor Force in Campbell?
There are 24,560 People in the Labor Forcein in Campbell.
What is the Percentage of People in the Labor Force in Campbell?
69.7% of People are in the Labor Force in Campbell.
What is the Unemployment Rate in Campbell?
Unemployment Rate in Campbell is 3.9%.