Walnut, CA Map & Demographics
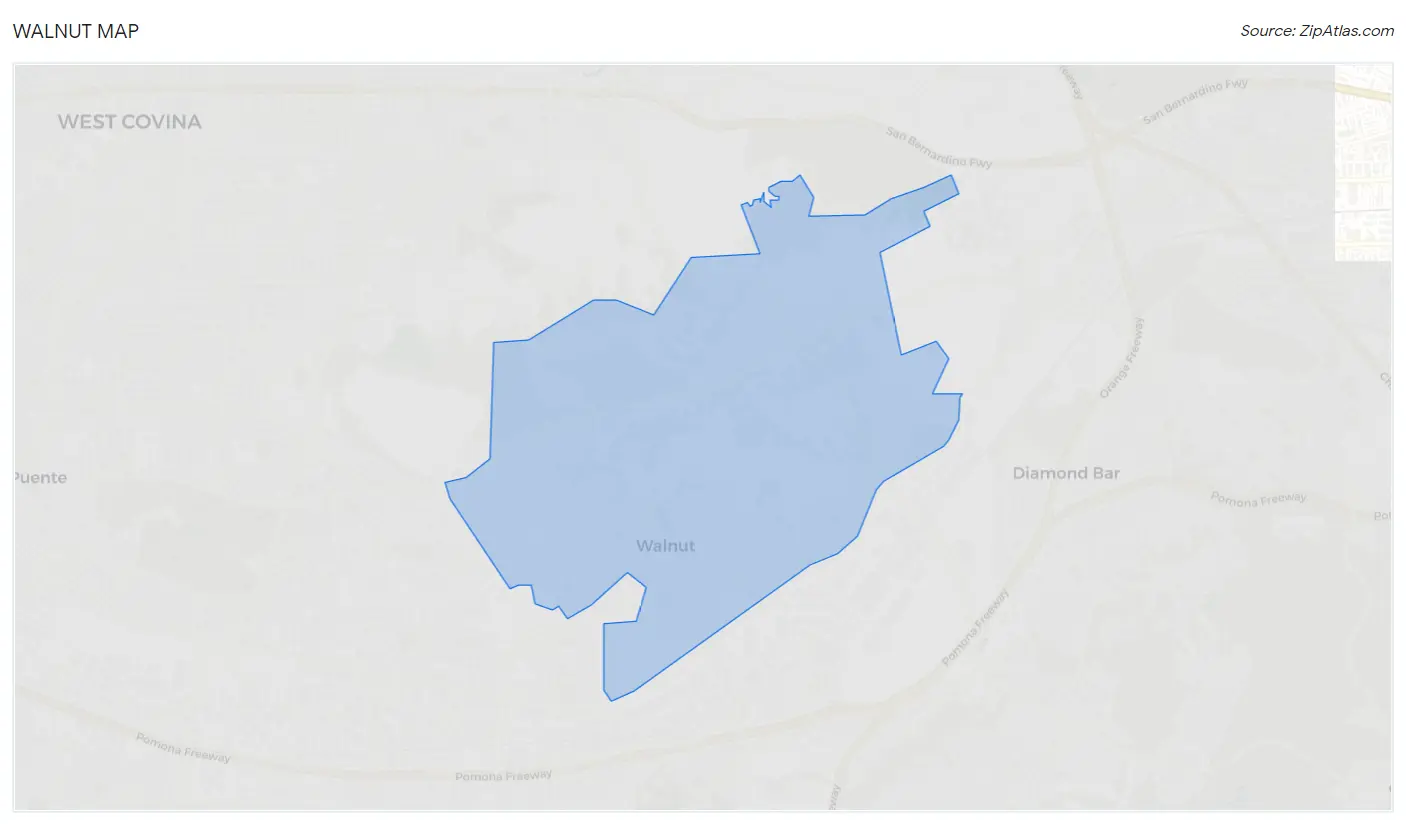
Walnut Map
Walnut Overview
$50,712
PER CAPITA INCOME
$138,661
AVG FAMILY INCOME
$130,444
AVG HOUSEHOLD INCOME
9.3%
WAGE / INCOME GAP [ % ]
90.7¢/ $1
WAGE / INCOME GAP [ $ ]
$12,842
FAMILY INCOME DEFICIT
0.44
INEQUALITY / GINI INDEX
28,212
TOTAL POPULATION
14,148
MALE POPULATION
14,064
FEMALE POPULATION
100.60
MALES / 100 FEMALES
99.41
FEMALES / 100 MALES
46.5
MEDIAN AGE
3.5
AVG FAMILY SIZE
3.3
AVG HOUSEHOLD SIZE
14,027
LABOR FORCE [ PEOPLE ]
59.6%
PERCENT IN LABOR FORCE
4.2%
UNEMPLOYMENT RATE
Walnut Zip Codes
Walnut Area Codes
Income in Walnut
Income Overview in Walnut
Per Capita Income in Walnut is $50,712, while median incomes of families and households are $138,661 and $130,444 respectively.
| Characteristic | Number | Measure |
| Per Capita Income | 28,212 | $50,712 |
| Median Family Income | 7,606 | $138,661 |
| Mean Family Income | 7,606 | $170,385 |
| Median Household Income | 8,616 | $130,444 |
| Mean Household Income | 8,616 | $160,844 |
| Income Deficit | 7,606 | $12,842 |
| Wage / Income Gap (%) | 28,212 | 9.32% |
| Wage / Income Gap ($) | 28,212 | 90.68¢ per $1 |
| Gini / Inequality Index | 28,212 | 0.44 |
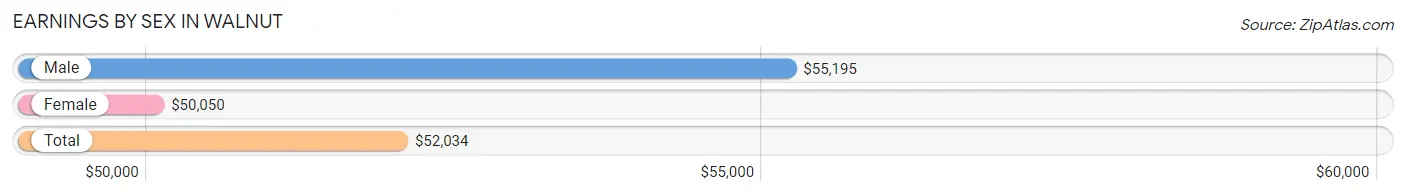
Earnings by Sex in Walnut
Average Earnings in Walnut are $52,034, $55,195 for men and $50,050 for women, a difference of 9.3%.
| Sex | Number | Average Earnings |
| Male | 7,752 (53.9%) | $55,195 |
| Female | 6,620 (46.1%) | $50,050 |
| Total | 14,372 (100.0%) | $52,034 |
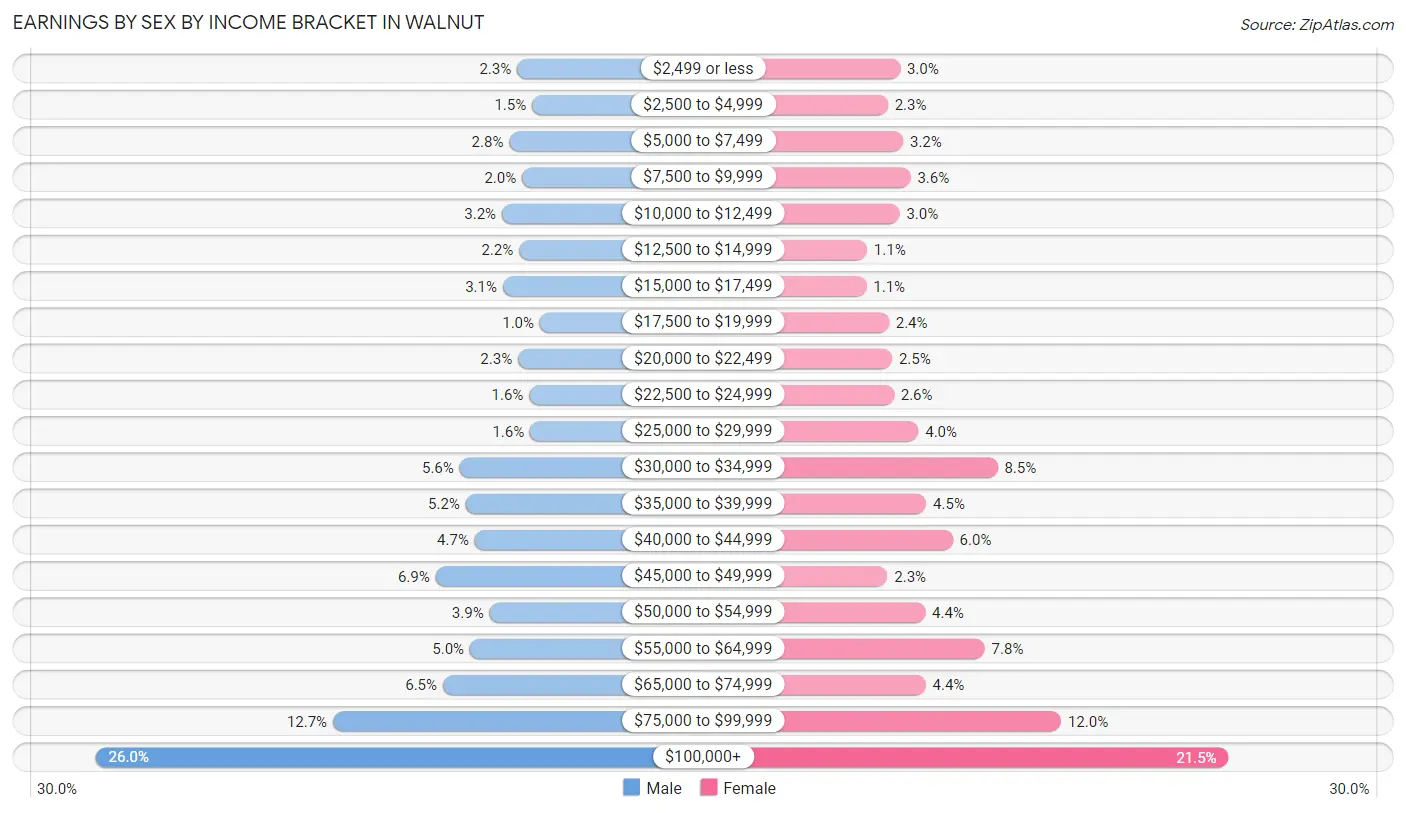
Earnings by Sex by Income Bracket in Walnut
The most common earnings brackets in Walnut are $100,000+ for men (2,016 | 26.0%) and $100,000+ for women (1,420 | 21.4%).
| Income | Male | Female |
| $2,499 or less | 180 (2.3%) | 198 (3.0%) |
| $2,500 to $4,999 | 115 (1.5%) | 152 (2.3%) |
| $5,000 to $7,499 | 214 (2.8%) | 209 (3.2%) |
| $7,500 to $9,999 | 158 (2.0%) | 237 (3.6%) |
| $10,000 to $12,499 | 246 (3.2%) | 196 (3.0%) |
| $12,500 to $14,999 | 171 (2.2%) | 75 (1.1%) |
| $15,000 to $17,499 | 242 (3.1%) | 73 (1.1%) |
| $17,500 to $19,999 | 81 (1.0%) | 156 (2.4%) |
| $20,000 to $22,499 | 176 (2.3%) | 168 (2.5%) |
| $22,500 to $24,999 | 127 (1.6%) | 175 (2.6%) |
| $25,000 to $29,999 | 123 (1.6%) | 266 (4.0%) |
| $30,000 to $34,999 | 430 (5.6%) | 561 (8.5%) |
| $35,000 to $39,999 | 404 (5.2%) | 295 (4.5%) |
| $40,000 to $44,999 | 364 (4.7%) | 394 (5.9%) |
| $45,000 to $49,999 | 535 (6.9%) | 151 (2.3%) |
| $50,000 to $54,999 | 300 (3.9%) | 291 (4.4%) |
| $55,000 to $64,999 | 385 (5.0%) | 513 (7.7%) |
| $65,000 to $74,999 | 503 (6.5%) | 293 (4.4%) |
| $75,000 to $99,999 | 982 (12.7%) | 797 (12.0%) |
| $100,000+ | 2,016 (26.0%) | 1,420 (21.4%) |
| Total | 7,752 (100.0%) | 6,620 (100.0%) |
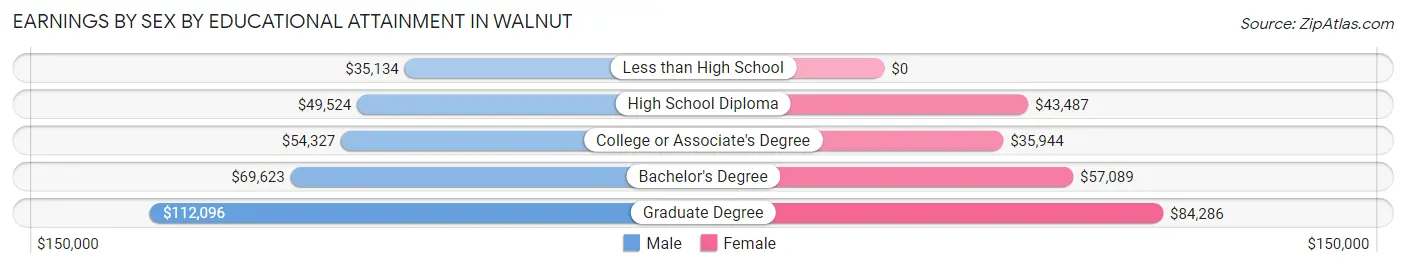
Earnings by Sex by Educational Attainment in Walnut
Average earnings in Walnut are $65,000 for men and $53,076 for women, a difference of 18.3%. Men with an educational attainment of graduate degree enjoy the highest average annual earnings of $112,096, while those with less than high school education earn the least with $35,134. Women with an educational attainment of graduate degree earn the most with the average annual earnings of $84,286, while those with college or associate's degree education have the smallest earnings of $35,944.
| Educational Attainment | Male Income | Female Income |
| Less than High School | $35,134 | $0 |
| High School Diploma | $49,524 | $43,487 |
| College or Associate's Degree | $54,327 | $35,944 |
| Bachelor's Degree | $69,623 | $57,089 |
| Graduate Degree | $112,096 | $84,286 |
| Total | $65,000 | $53,076 |
Family Income in Walnut
Family Income Brackets in Walnut
According to the Walnut family income data, there are 2,206 families falling into the $200,000+ income range, which is the most common income bracket and makes up 29.0% of all families. Conversely, the $10,000 to $14,999 income bracket is the least frequent group with only 46 families (0.6%) belonging to this category.
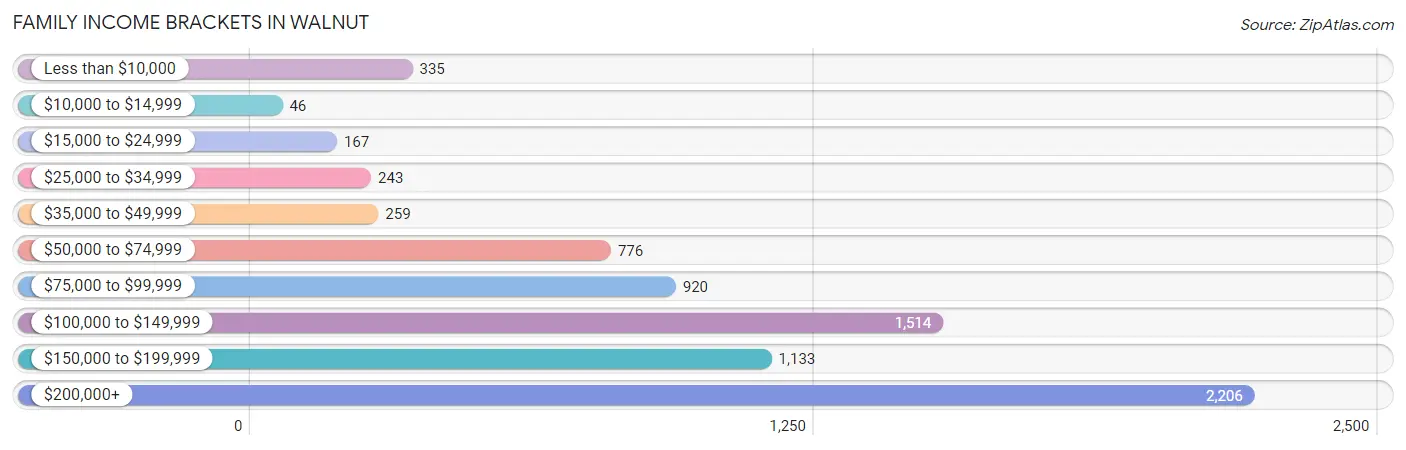
| Income Bracket | # Families | % Families |
| Less than $10,000 | 335 | 4.4% |
| $10,000 to $14,999 | 46 | 0.6% |
| $15,000 to $24,999 | 167 | 2.2% |
| $25,000 to $34,999 | 243 | 3.2% |
| $35,000 to $49,999 | 259 | 3.4% |
| $50,000 to $74,999 | 776 | 10.2% |
| $75,000 to $99,999 | 920 | 12.1% |
| $100,000 to $149,999 | 1,514 | 19.9% |
| $150,000 to $199,999 | 1,133 | 14.9% |
| $200,000+ | 2,206 | 29.0% |
Family Income by Famaliy Size in Walnut
7+ person families (187 | 2.5%) account for the highest median family income in Walnut with $250,001 per family, while 2-person families (2,835 | 37.3%) have the highest median income of $55,424 per family member.
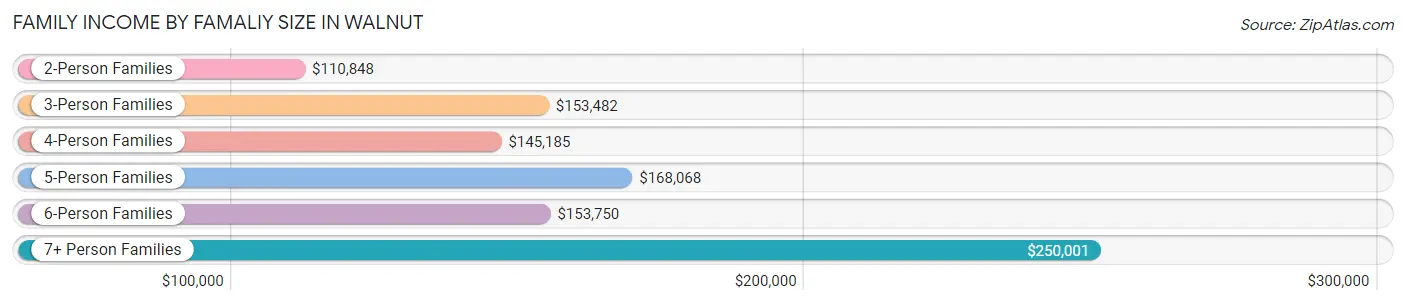
| Income Bracket | # Families | Median Income |
| 2-Person Families | 2,835 (37.3%) | $110,848 |
| 3-Person Families | 1,911 (25.1%) | $153,482 |
| 4-Person Families | 1,614 (21.2%) | $145,185 |
| 5-Person Families | 797 (10.5%) | $168,068 |
| 6-Person Families | 262 (3.4%) | $153,750 |
| 7+ Person Families | 187 (2.5%) | $250,001 |
| Total | 7,606 (100.0%) | $138,661 |
Family Income by Number of Earners in Walnut
The median family income in Walnut is $138,661, with families comprising 3+ earners (1,424) having the highest median family income of $187,074, while families with no earners (1,224) have the lowest median family income of $63,056, accounting for 18.7% and 16.1% of families, respectively.
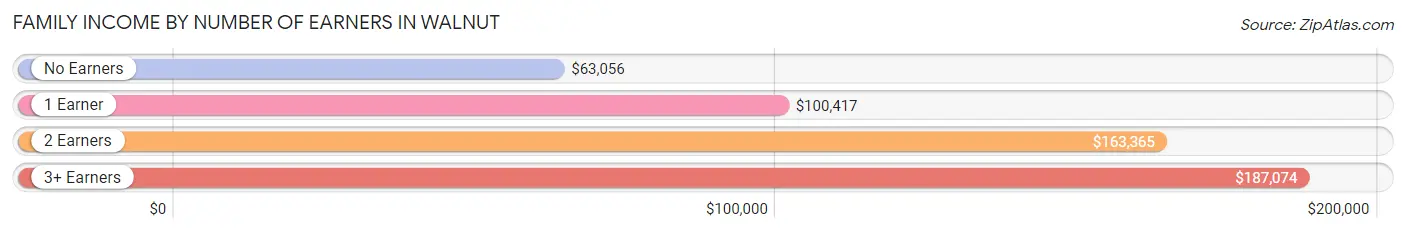
| Number of Earners | # Families | Median Income |
| No Earners | 1,224 (16.1%) | $63,056 |
| 1 Earner | 2,078 (27.3%) | $100,417 |
| 2 Earners | 2,880 (37.9%) | $163,365 |
| 3+ Earners | 1,424 (18.7%) | $187,074 |
| Total | 7,606 (100.0%) | $138,661 |
Household Income in Walnut
Household Income Brackets in Walnut
With 2,300 households falling in the category, the $200,000+ income range is the most frequent in Walnut, accounting for 26.7% of all households. In contrast, only 60 households (0.7%) fall into the $10,000 to $14,999 income bracket, making it the least populous group.
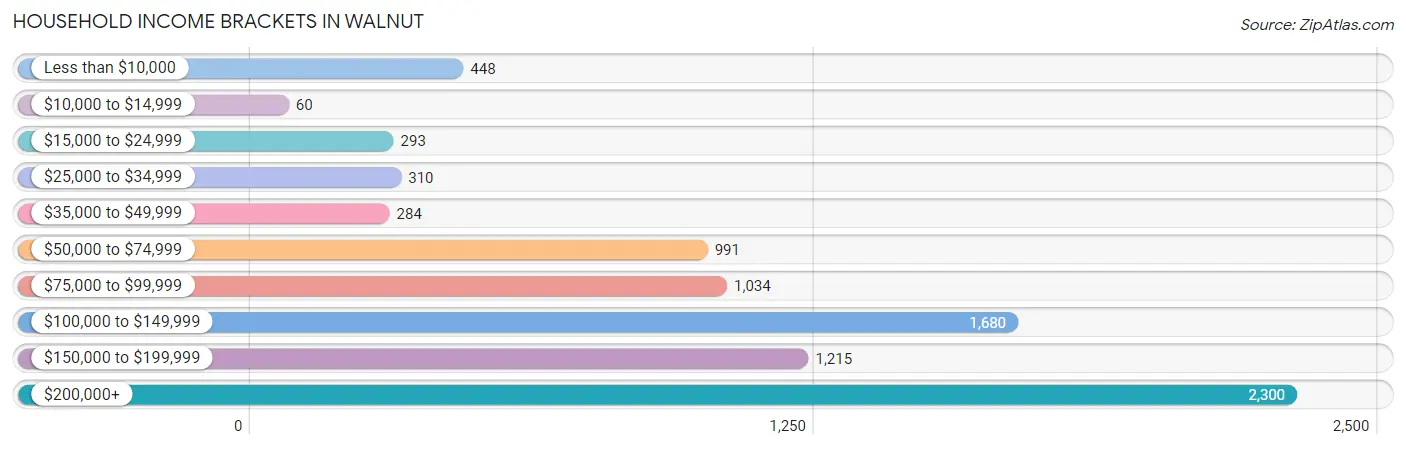
| Income Bracket | # Households | % Households |
| Less than $10,000 | 448 | 5.2% |
| $10,000 to $14,999 | 60 | 0.7% |
| $15,000 to $24,999 | 293 | 3.4% |
| $25,000 to $34,999 | 310 | 3.6% |
| $35,000 to $49,999 | 284 | 3.3% |
| $50,000 to $74,999 | 991 | 11.5% |
| $75,000 to $99,999 | 1,034 | 12.0% |
| $100,000 to $149,999 | 1,680 | 19.5% |
| $150,000 to $199,999 | 1,215 | 14.1% |
| $200,000+ | 2,300 | 26.7% |
Household Income by Householder Age in Walnut
The median household income in Walnut is $130,444, with the highest median household income of $142,689 found in the 45 to 64 years age bracket for the primary householder. A total of 3,920 households (45.5%) fall into this category. Meanwhile, the 15 to 24 years age bracket for the primary householder has the lowest median household income of $68,446, with 46 households (0.5%) in this group.
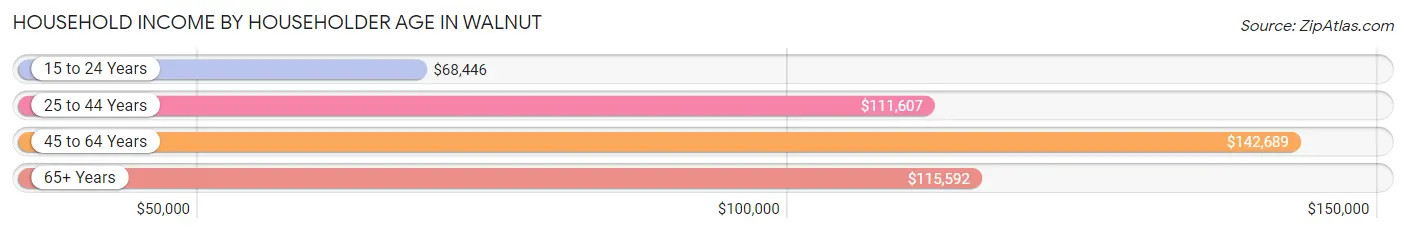
| Income Bracket | # Households | Median Income |
| 15 to 24 Years | 46 (0.5%) | $68,446 |
| 25 to 44 Years | 1,465 (17.0%) | $111,607 |
| 45 to 64 Years | 3,920 (45.5%) | $142,689 |
| 65+ Years | 3,185 (37.0%) | $115,592 |
| Total | 8,616 (100.0%) | $130,444 |
Poverty in Walnut
Income Below Poverty by Sex and Age in Walnut
With 7.1% poverty level for males and 8.5% for females among the residents of Walnut, 15 year old males and 16 and 17 year old females are the most vulnerable to poverty, with 26 males (33.8%) and 54 females (18.1%) in their respective age groups living below the poverty level.
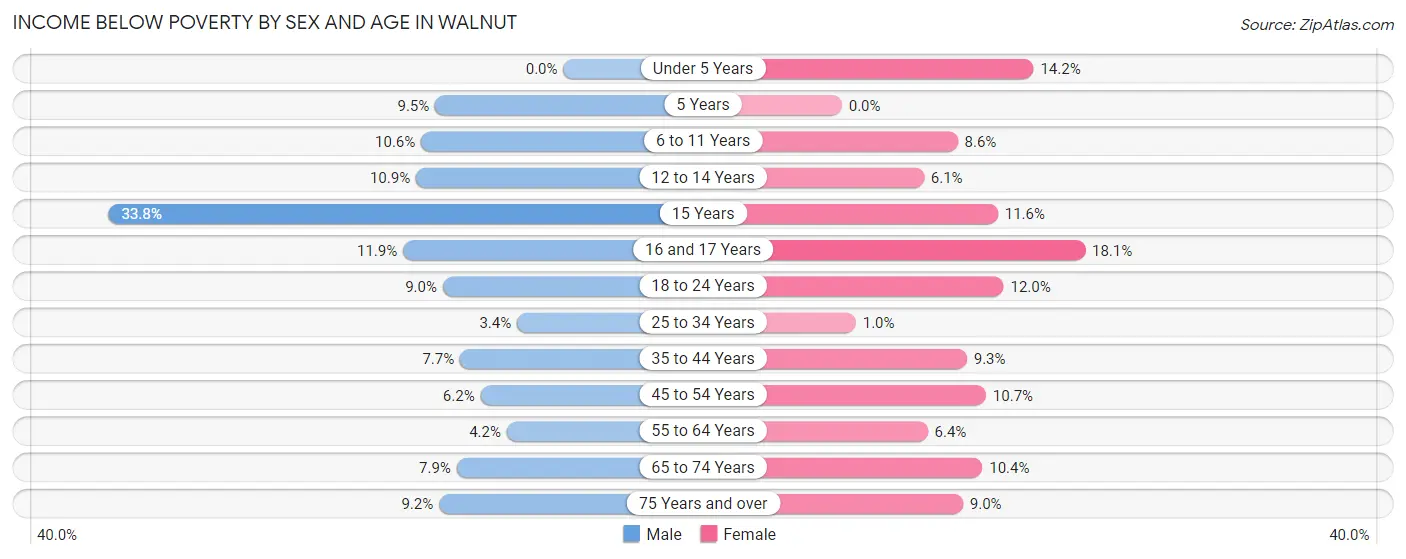
| Age Bracket | Male | Female |
| Under 5 Years | 0 (0.0%) | 76 (14.2%) |
| 5 Years | 8 (9.5%) | 0 (0.0%) |
| 6 to 11 Years | 110 (10.6%) | 76 (8.6%) |
| 12 to 14 Years | 73 (10.9%) | 29 (6.1%) |
| 15 Years | 26 (33.8%) | 22 (11.6%) |
| 16 and 17 Years | 40 (11.9%) | 54 (18.1%) |
| 18 to 24 Years | 116 (8.9%) | 95 (12.0%) |
| 25 to 34 Years | 57 (3.4%) | 15 (1.0%) |
| 35 to 44 Years | 116 (7.7%) | 148 (9.3%) |
| 45 to 54 Years | 108 (6.1%) | 186 (10.7%) |
| 55 to 64 Years | 85 (4.2%) | 164 (6.4%) |
| 65 to 74 Years | 169 (7.9%) | 229 (10.4%) |
| 75 Years and over | 96 (9.2%) | 102 (9.0%) |
| Total | 1,004 (7.1%) | 1,196 (8.5%) |
Income Above Poverty by Sex and Age in Walnut
According to the poverty statistics in Walnut, males aged under 5 years and females aged 5 years are the age groups that are most secure financially, with 100.0% of males and 100.0% of females in these age groups living above the poverty line.
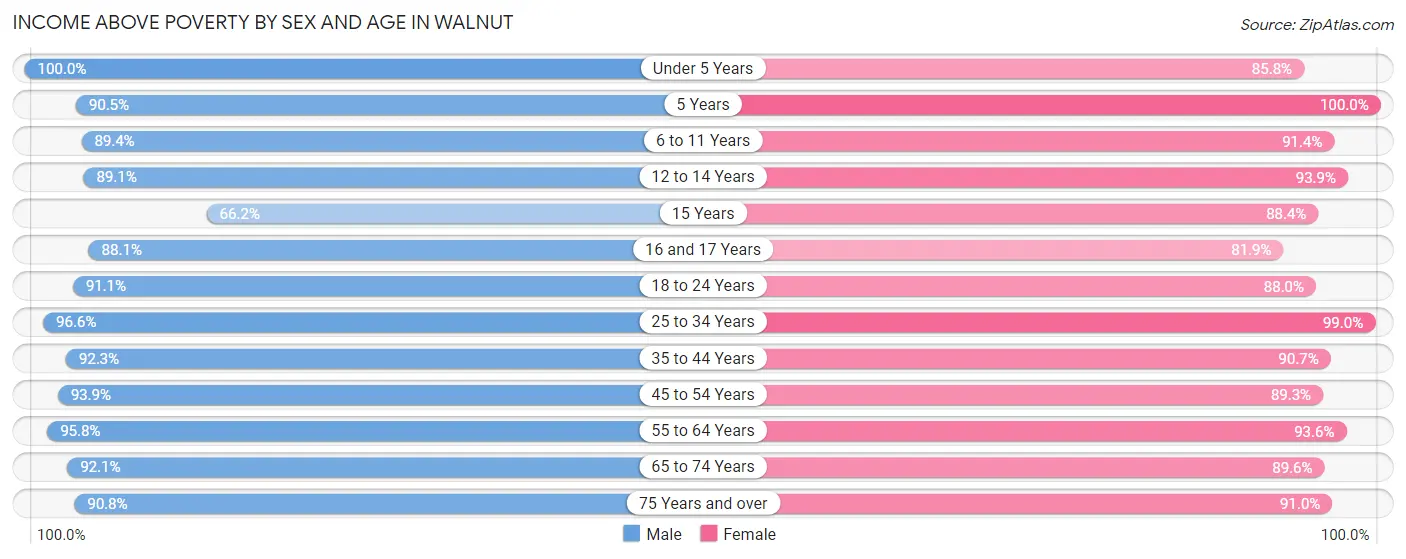
| Age Bracket | Male | Female |
| Under 5 Years | 514 (100.0%) | 458 (85.8%) |
| 5 Years | 76 (90.5%) | 190 (100.0%) |
| 6 to 11 Years | 932 (89.4%) | 808 (91.4%) |
| 12 to 14 Years | 594 (89.1%) | 447 (93.9%) |
| 15 Years | 51 (66.2%) | 168 (88.4%) |
| 16 and 17 Years | 296 (88.1%) | 245 (81.9%) |
| 18 to 24 Years | 1,180 (91.0%) | 696 (88.0%) |
| 25 to 34 Years | 1,599 (96.6%) | 1,431 (99.0%) |
| 35 to 44 Years | 1,396 (92.3%) | 1,447 (90.7%) |
| 45 to 54 Years | 1,647 (93.9%) | 1,552 (89.3%) |
| 55 to 64 Years | 1,940 (95.8%) | 2,409 (93.6%) |
| 65 to 74 Years | 1,966 (92.1%) | 1,966 (89.6%) |
| 75 Years and over | 944 (90.8%) | 1,033 (91.0%) |
| Total | 13,135 (92.9%) | 12,850 (91.5%) |
Income Below Poverty Among Married-Couple Families in Walnut
The poverty statistics for married-couple families in Walnut show that 6.3% or 382 of the total 6,032 families live below the poverty line. Families with 1 or 2 children have the highest poverty rate of 6.4%, comprising of 105 families. On the other hand, families with 3 or 4 children have the lowest poverty rate of 6.1%, which includes 19 families.
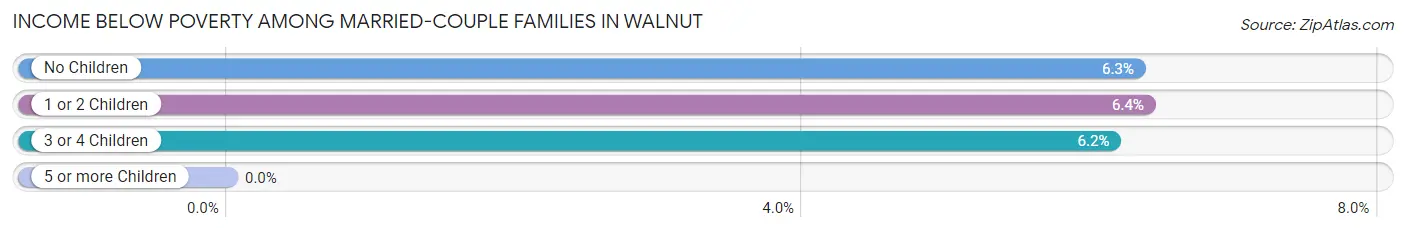
| Children | Above Poverty | Below Poverty |
| No Children | 3,823 (93.7%) | 258 (6.3%) |
| 1 or 2 Children | 1,537 (93.6%) | 105 (6.4%) |
| 3 or 4 Children | 290 (93.9%) | 19 (6.1%) |
| 5 or more Children | 0 (0.0%) | 0 (0.0%) |
| Total | 5,650 (93.7%) | 382 (6.3%) |
Income Below Poverty Among Single-Parent Households in Walnut
According to the poverty data in Walnut, 12.1% or 67 single-father households and 7.4% or 76 single-mother households are living below the poverty line. Among single-father households, those with no children have the highest poverty rate, with 66 households (20.7%) experiencing poverty. Likewise, among single-mother households, those with 5 or more children have the highest poverty rate, with 9 households (100.0%) falling below the poverty line.
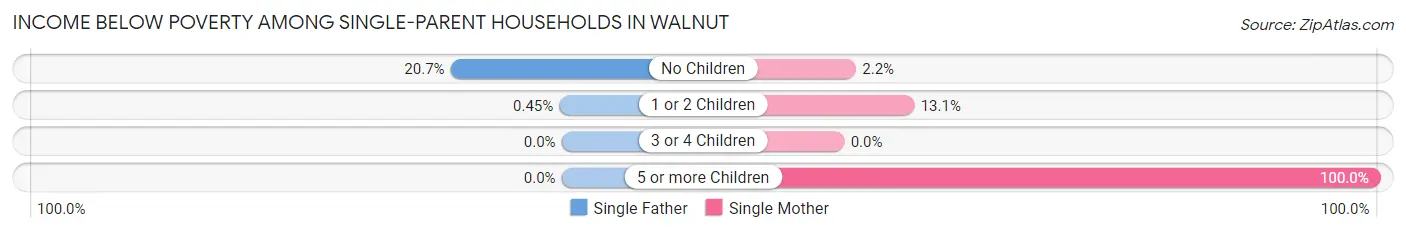
| Children | Single Father | Single Mother |
| No Children | 66 (20.7%) | 11 (2.2%) |
| 1 or 2 Children | 1 (0.4%) | 56 (13.1%) |
| 3 or 4 Children | 0 (0.0%) | 0 (0.0%) |
| 5 or more Children | 0 (0.0%) | 9 (100.0%) |
| Total | 67 (12.1%) | 76 (7.4%) |
Income Below Poverty Among Married-Couple vs Single-Parent Households in Walnut
The poverty data for Walnut shows that 382 of the married-couple family households (6.3%) and 143 of the single-parent households (9.1%) are living below the poverty level. Within the married-couple family households, those with 1 or 2 children have the highest poverty rate, with 105 households (6.4%) falling below the poverty line. Among the single-parent households, those with 5 or more children have the highest poverty rate, with 9 household (100.0%) living below poverty.
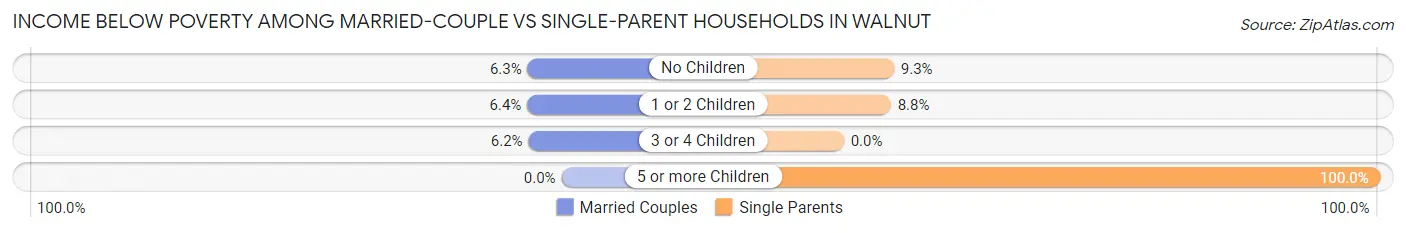
| Children | Married-Couple Families | Single-Parent Households |
| No Children | 258 (6.3%) | 77 (9.3%) |
| 1 or 2 Children | 105 (6.4%) | 57 (8.8%) |
| 3 or 4 Children | 19 (6.1%) | 0 (0.0%) |
| 5 or more Children | 0 (0.0%) | 9 (100.0%) |
| Total | 382 (6.3%) | 143 (9.1%) |
Race in Walnut
The most populous races in Walnut are Asian (18,586 | 65.9%), Hispanic or Latino (5,232 | 18.5%), and White / Caucasian (4,187 | 14.8%).
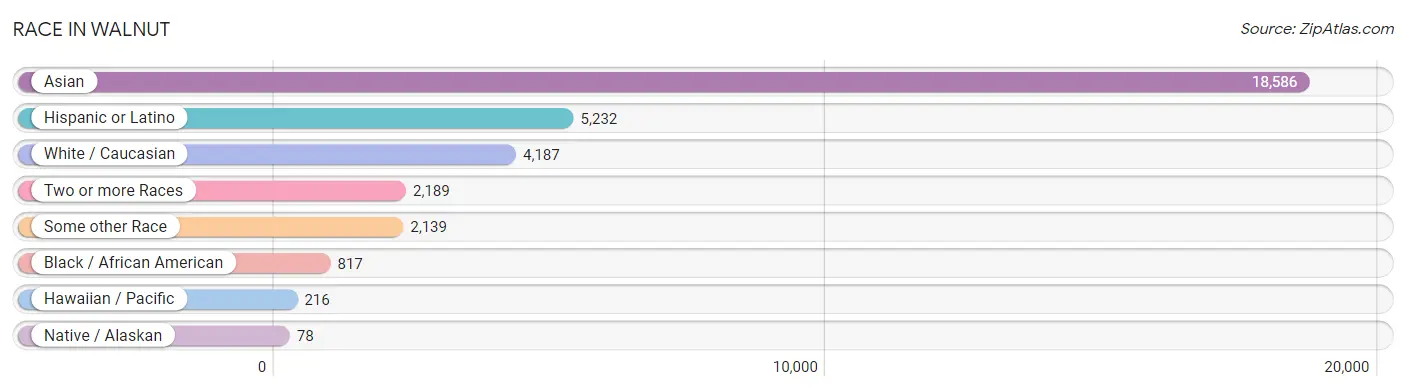
| Race | # Population | % Population |
| Asian | 18,586 | 65.9% |
| Black / African American | 817 | 2.9% |
| Hawaiian / Pacific | 216 | 0.8% |
| Hispanic or Latino | 5,232 | 18.5% |
| Native / Alaskan | 78 | 0.3% |
| White / Caucasian | 4,187 | 14.8% |
| Two or more Races | 2,189 | 7.8% |
| Some other Race | 2,139 | 7.6% |
| Total | 28,212 | 100.0% |
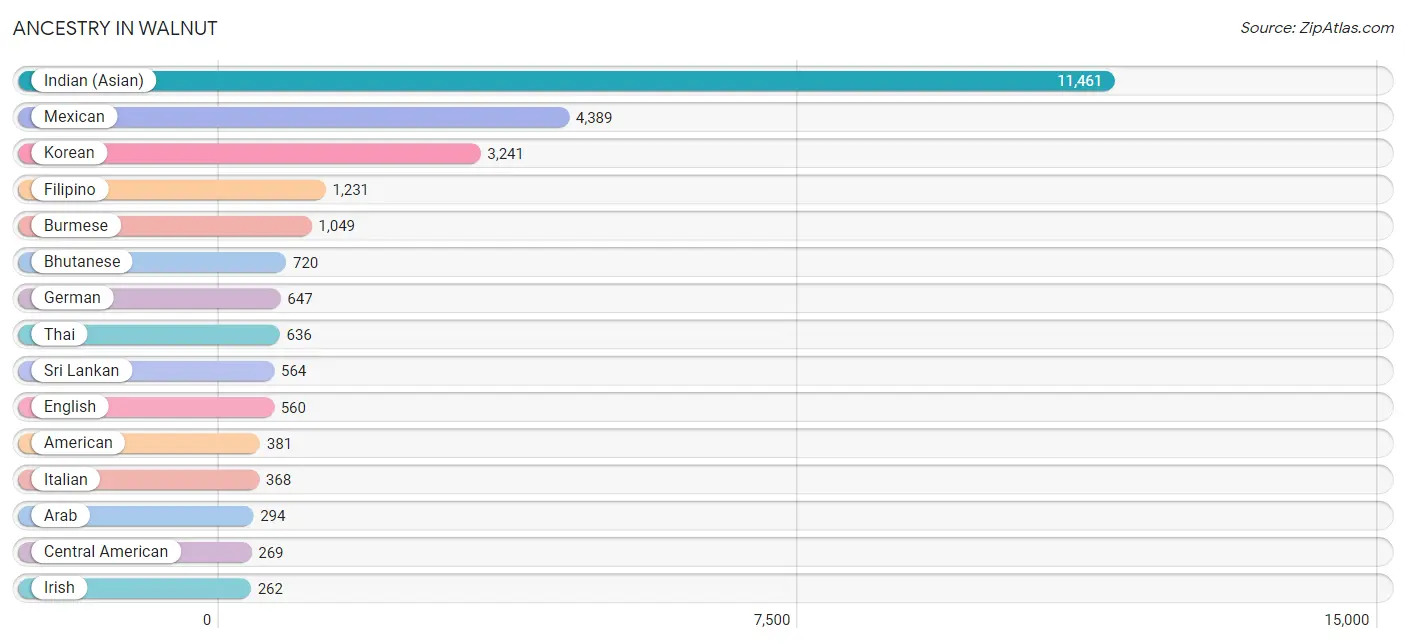
Ancestry in Walnut
The most populous ancestries reported in Walnut are Indian (Asian) (11,461 | 40.6%), Mexican (4,389 | 15.6%), Korean (3,241 | 11.5%), Filipino (1,231 | 4.4%), and Burmese (1,049 | 3.7%), together accounting for 75.7% of all Walnut residents.
| Ancestry | # Population | % Population |
| African | 11 | 0.0% |
| Albanian | 22 | 0.1% |
| American | 381 | 1.3% |
| Arab | 294 | 1.0% |
| Argentinean | 11 | 0.0% |
| Armenian | 21 | 0.1% |
| Belizean | 34 | 0.1% |
| Bhutanese | 720 | 2.5% |
| Brazilian | 9 | 0.0% |
| British | 28 | 0.1% |
| Burmese | 1,049 | 3.7% |
| Celtic | 10 | 0.0% |
| Central American | 269 | 0.9% |
| Costa Rican | 4 | 0.0% |
| Croatian | 6 | 0.0% |
| Cuban | 43 | 0.2% |
| Czech | 100 | 0.4% |
| Danish | 17 | 0.1% |
| Dutch | 27 | 0.1% |
| Eastern European | 5 | 0.0% |
| Egyptian | 155 | 0.5% |
| English | 560 | 2.0% |
| European | 199 | 0.7% |
| Filipino | 1,231 | 4.4% |
| French | 161 | 0.6% |
| French Canadian | 72 | 0.3% |
| German | 647 | 2.3% |
| Ghanaian | 6 | 0.0% |
| Greek | 17 | 0.1% |
| Guamanian / Chamorro | 34 | 0.1% |
| Guatemalan | 69 | 0.2% |
| Honduran | 34 | 0.1% |
| Hungarian | 43 | 0.2% |
| Indian (Asian) | 11,461 | 40.6% |
| Indonesian | 44 | 0.2% |
| Irish | 262 | 0.9% |
| Italian | 368 | 1.3% |
| Japanese | 99 | 0.4% |
| Jordanian | 7 | 0.0% |
| Korean | 3,241 | 11.5% |
| Laotian | 47 | 0.2% |
| Lebanese | 28 | 0.1% |
| Lithuanian | 151 | 0.5% |
| Mexican | 4,389 | 15.6% |
| Mexican American Indian | 48 | 0.2% |
| Native Hawaiian | 235 | 0.8% |
| Nicaraguan | 83 | 0.3% |
| Nigerian | 7 | 0.0% |
| Northern European | 72 | 0.3% |
| Norwegian | 19 | 0.1% |
| Osage | 10 | 0.0% |
| Pakistani | 165 | 0.6% |
| Palestinian | 7 | 0.0% |
| Panamanian | 10 | 0.0% |
| Peruvian | 39 | 0.1% |
| Polish | 94 | 0.3% |
| Portuguese | 19 | 0.1% |
| Puerto Rican | 86 | 0.3% |
| Russian | 111 | 0.4% |
| Salvadoran | 69 | 0.2% |
| Samoan | 34 | 0.1% |
| Scotch-Irish | 37 | 0.1% |
| Scottish | 68 | 0.2% |
| Serbian | 5 | 0.0% |
| Slovak | 5 | 0.0% |
| South American | 50 | 0.2% |
| South American Indian | 7 | 0.0% |
| Spaniard | 196 | 0.7% |
| Spanish | 66 | 0.2% |
| Sri Lankan | 564 | 2.0% |
| Subsaharan African | 24 | 0.1% |
| Swedish | 20 | 0.1% |
| Swiss | 65 | 0.2% |
| Syrian | 70 | 0.3% |
| Thai | 636 | 2.2% |
| Ukrainian | 25 | 0.1% |
| Vietnamese | 63 | 0.2% |
| Welsh | 80 | 0.3% |
| Yaqui | 19 | 0.1% | View All 79 Rows |
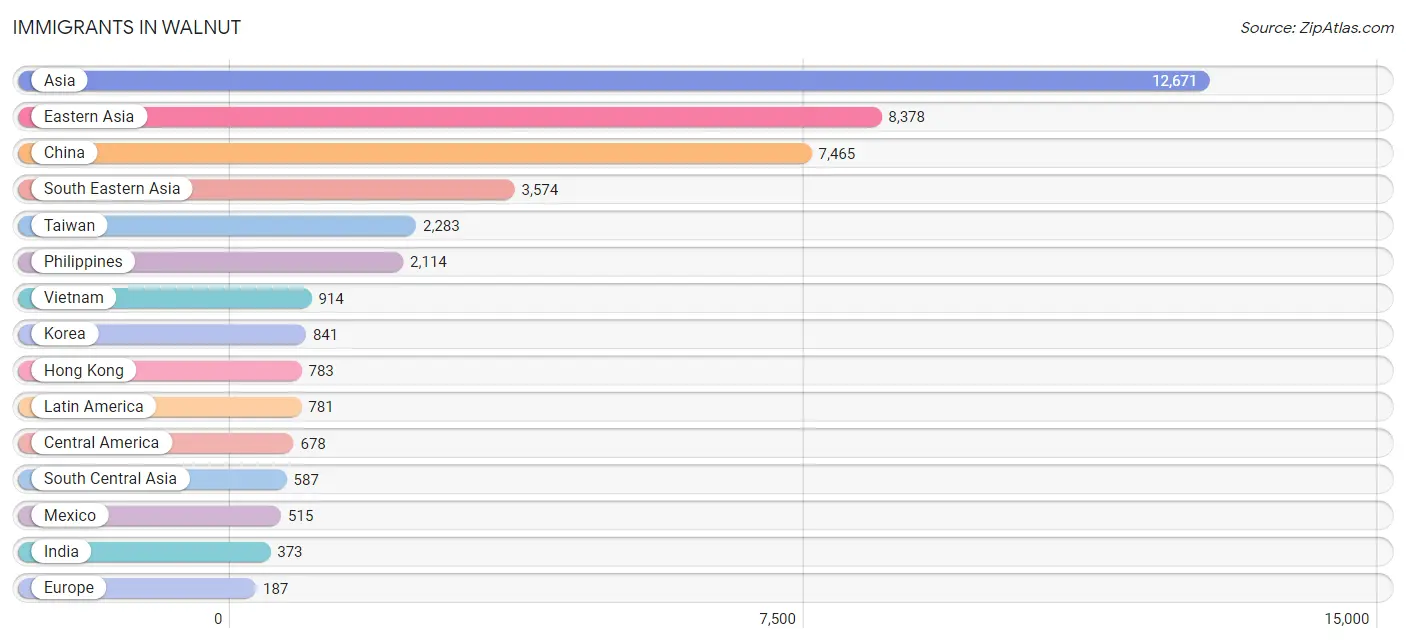
Immigrants in Walnut
The most numerous immigrant groups reported in Walnut came from Asia (12,671 | 44.9%), Eastern Asia (8,378 | 29.7%), China (7,465 | 26.5%), South Eastern Asia (3,574 | 12.7%), and Taiwan (2,283 | 8.1%), together accounting for 121.8% of all Walnut residents.
| Immigration Origin | # Population | % Population |
| Africa | 174 | 0.6% |
| Albania | 11 | 0.0% |
| Argentina | 11 | 0.0% |
| Asia | 12,671 | 44.9% |
| Bangladesh | 50 | 0.2% |
| Belize | 22 | 0.1% |
| Brazil | 23 | 0.1% |
| Cambodia | 92 | 0.3% |
| Canada | 71 | 0.3% |
| Caribbean | 24 | 0.1% |
| Central America | 678 | 2.4% |
| China | 7,465 | 26.5% |
| Costa Rica | 12 | 0.0% |
| Cuba | 24 | 0.1% |
| Eastern Africa | 47 | 0.2% |
| Eastern Asia | 8,378 | 29.7% |
| Eastern Europe | 29 | 0.1% |
| Egypt | 124 | 0.4% |
| El Salvador | 36 | 0.1% |
| Europe | 187 | 0.7% |
| Fiji | 36 | 0.1% |
| France | 4 | 0.0% |
| Germany | 12 | 0.0% |
| Ghana | 3 | 0.0% |
| Guatemala | 38 | 0.1% |
| Honduras | 21 | 0.1% |
| Hong Kong | 783 | 2.8% |
| Hungary | 4 | 0.0% |
| India | 373 | 1.3% |
| Indonesia | 109 | 0.4% |
| Iran | 24 | 0.1% |
| Ireland | 27 | 0.1% |
| Israel | 3 | 0.0% |
| Italy | 30 | 0.1% |
| Japan | 72 | 0.3% |
| Jordan | 14 | 0.1% |
| Kenya | 15 | 0.1% |
| Korea | 841 | 3.0% |
| Laos | 28 | 0.1% |
| Latin America | 781 | 2.8% |
| Lebanon | 42 | 0.2% |
| Malaysia | 73 | 0.3% |
| Mexico | 515 | 1.8% |
| Nicaragua | 22 | 0.1% |
| Northern Africa | 124 | 0.4% |
| Northern Europe | 92 | 0.3% |
| Oceania | 56 | 0.2% |
| Pakistan | 111 | 0.4% |
| Panama | 12 | 0.0% |
| Peru | 28 | 0.1% |
| Philippines | 2,114 | 7.5% |
| Portugal | 5 | 0.0% |
| Romania | 3 | 0.0% |
| Singapore | 19 | 0.1% |
| South America | 79 | 0.3% |
| South Central Asia | 587 | 2.1% |
| South Eastern Asia | 3,574 | 12.7% |
| Southern Europe | 50 | 0.2% |
| Spain | 15 | 0.1% |
| Sri Lanka | 29 | 0.1% |
| Syria | 43 | 0.2% |
| Taiwan | 2,283 | 8.1% |
| Thailand | 151 | 0.5% |
| Uganda | 13 | 0.1% |
| Venezuela | 17 | 0.1% |
| Vietnam | 914 | 3.2% |
| Western Africa | 3 | 0.0% |
| Western Asia | 124 | 0.4% |
| Western Europe | 16 | 0.1% | View All 69 Rows |
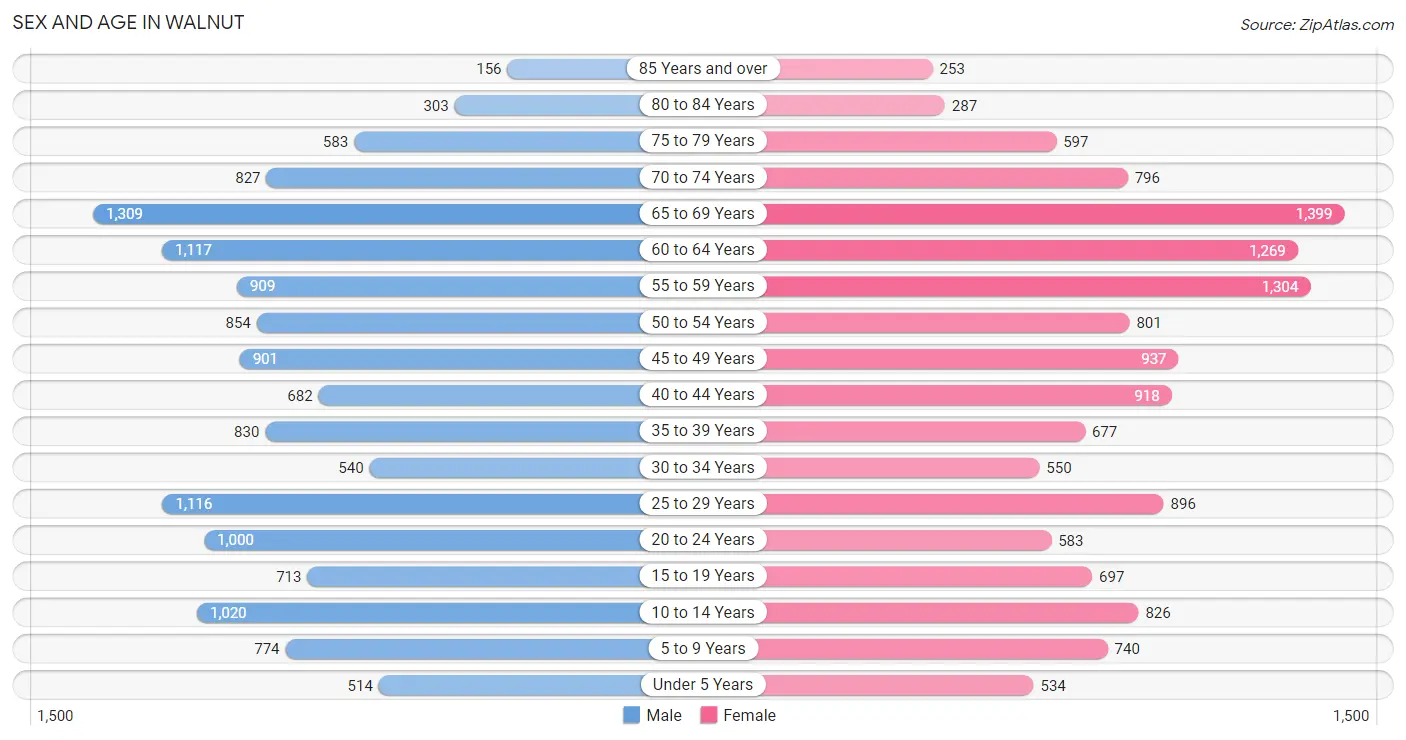
Sex and Age in Walnut
Sex and Age in Walnut
The most populous age groups in Walnut are 65 to 69 Years (1,309 | 9.2%) for men and 65 to 69 Years (1,399 | 10.0%) for women.
| Age Bracket | Male | Female |
| Under 5 Years | 514 (3.6%) | 534 (3.8%) |
| 5 to 9 Years | 774 (5.5%) | 740 (5.3%) |
| 10 to 14 Years | 1,020 (7.2%) | 826 (5.9%) |
| 15 to 19 Years | 713 (5.0%) | 697 (5.0%) |
| 20 to 24 Years | 1,000 (7.1%) | 583 (4.2%) |
| 25 to 29 Years | 1,116 (7.9%) | 896 (6.4%) |
| 30 to 34 Years | 540 (3.8%) | 550 (3.9%) |
| 35 to 39 Years | 830 (5.9%) | 677 (4.8%) |
| 40 to 44 Years | 682 (4.8%) | 918 (6.5%) |
| 45 to 49 Years | 901 (6.4%) | 937 (6.7%) |
| 50 to 54 Years | 854 (6.0%) | 801 (5.7%) |
| 55 to 59 Years | 909 (6.4%) | 1,304 (9.3%) |
| 60 to 64 Years | 1,117 (7.9%) | 1,269 (9.0%) |
| 65 to 69 Years | 1,309 (9.2%) | 1,399 (10.0%) |
| 70 to 74 Years | 827 (5.9%) | 796 (5.7%) |
| 75 to 79 Years | 583 (4.1%) | 597 (4.2%) |
| 80 to 84 Years | 303 (2.1%) | 287 (2.0%) |
| 85 Years and over | 156 (1.1%) | 253 (1.8%) |
| Total | 14,148 (100.0%) | 14,064 (100.0%) |
Families and Households in Walnut
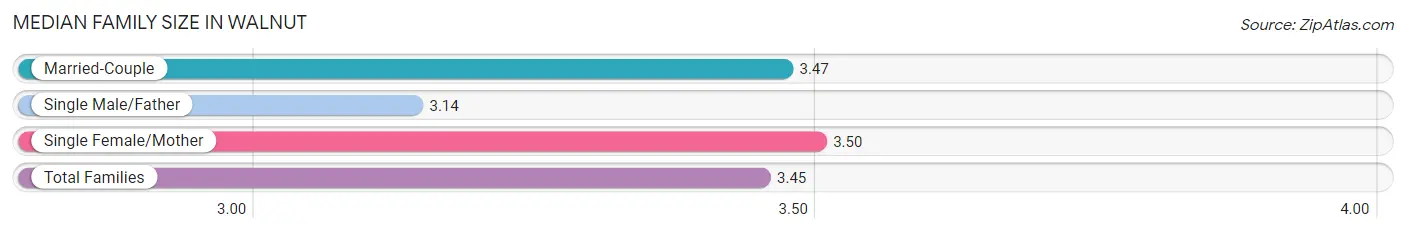
Median Family Size in Walnut
The median family size in Walnut is 3.45 persons per family, with single female/mother families (1,022 | 13.4%) accounting for the largest median family size of 3.5 persons per family. On the other hand, single male/father families (552 | 7.3%) represent the smallest median family size with 3.14 persons per family.
| Family Type | # Families | Family Size |
| Married-Couple | 6,032 (79.3%) | 3.47 |
| Single Male/Father | 552 (7.3%) | 3.14 |
| Single Female/Mother | 1,022 (13.4%) | 3.50 |
| Total Families | 7,606 (100.0%) | 3.45 |
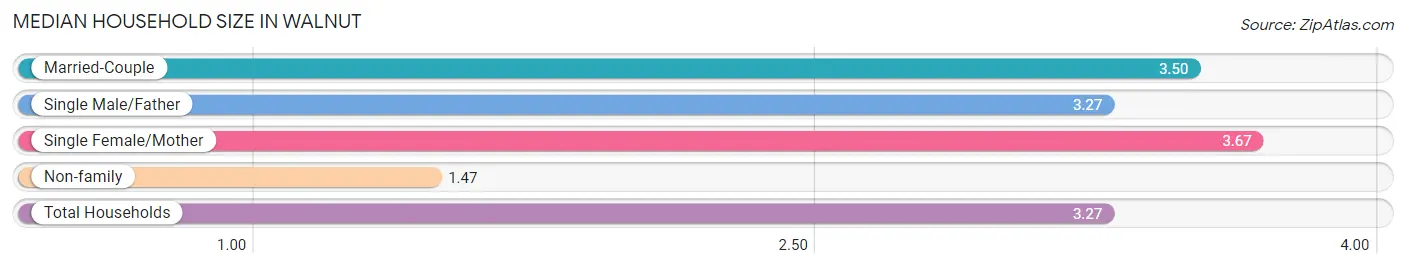
Median Household Size in Walnut
The median household size in Walnut is 3.27 persons per household, with single female/mother households (1,022 | 11.9%) accounting for the largest median household size of 3.67 persons per household. non-family households (1,010 | 11.7%) represent the smallest median household size with 1.47 persons per household.
| Household Type | # Households | Household Size |
| Married-Couple | 6,032 (70.0%) | 3.50 |
| Single Male/Father | 552 (6.4%) | 3.27 |
| Single Female/Mother | 1,022 (11.9%) | 3.67 |
| Non-family | 1,010 (11.7%) | 1.47 |
| Total Households | 8,616 (100.0%) | 3.27 |
Household Size by Marriage Status in Walnut
Out of a total of 8,616 households in Walnut, 7,606 (88.3%) are family households, while 1,010 (11.7%) are nonfamily households. The most numerous type of family households are 2-person households, comprising 2,778, and the most common type of nonfamily households are 1-person households, comprising 756.
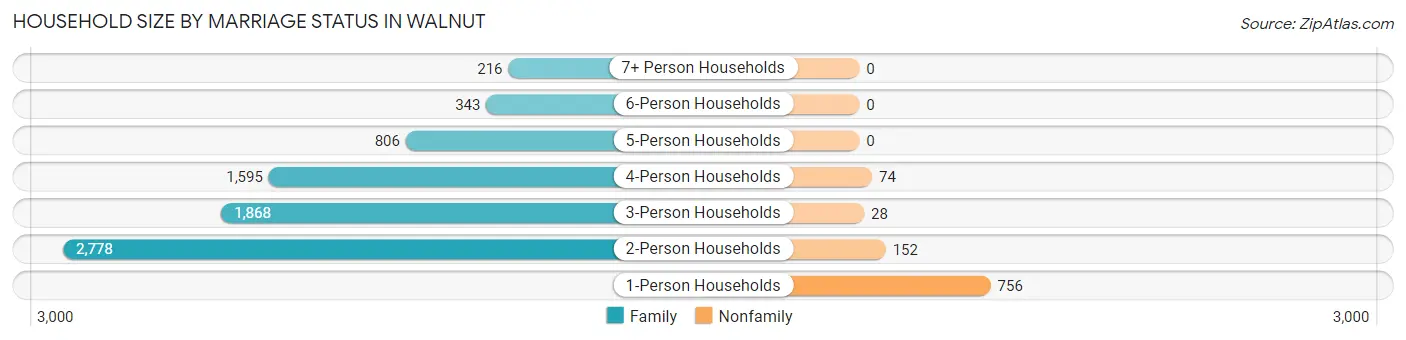
| Household Size | Family Households | Nonfamily Households |
| 1-Person Households | - | 756 (8.8%) |
| 2-Person Households | 2,778 (32.2%) | 152 (1.8%) |
| 3-Person Households | 1,868 (21.7%) | 28 (0.3%) |
| 4-Person Households | 1,595 (18.5%) | 74 (0.9%) |
| 5-Person Households | 806 (9.3%) | 0 (0.0%) |
| 6-Person Households | 343 (4.0%) | 0 (0.0%) |
| 7+ Person Households | 216 (2.5%) | 0 (0.0%) |
| Total | 7,606 (88.3%) | 1,010 (11.7%) |
Female Fertility in Walnut
Fertility by Age in Walnut
Average fertility rate in Walnut is 28.0 births per 1,000 women. Women in the age bracket of 35 to 50 years have the highest fertility rate with 33.0 births per 1,000 women. Women in the age bracket of 35 to 50 years acount for 58.3% of all women with births.
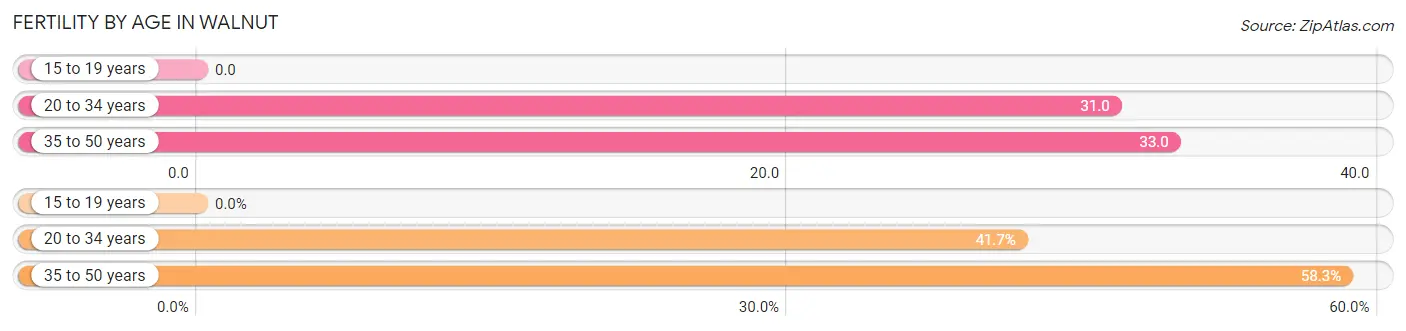
| Age Bracket | Women with Births | Births / 1,000 Women |
| 15 to 19 years | 0 (0.0%) | 0.0 |
| 20 to 34 years | 63 (41.7%) | 31.0 |
| 35 to 50 years | 88 (58.3%) | 33.0 |
| Total | 151 (100.0%) | 28.0 |
Fertility by Age by Marriage Status in Walnut
66.2% of women with births (151) in Walnut are married. The highest percentage of unmarried women with births falls into 20 to 34 years age bracket with 63.5% of them unmarried at the time of birth, while the lowest percentage of unmarried women with births belong to 35 to 50 years age bracket with 12.5% of them unmarried.
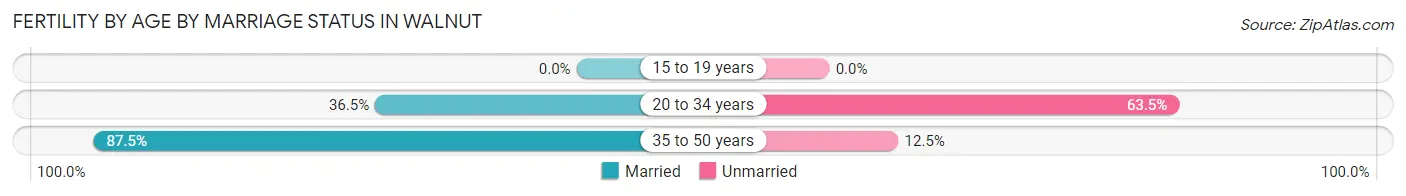
| Age Bracket | Married | Unmarried |
| 15 to 19 years | 0 (0.0%) | 0 (0.0%) |
| 20 to 34 years | 23 (36.5%) | 40 (63.5%) |
| 35 to 50 years | 77 (87.5%) | 11 (12.5%) |
| Total | 100 (66.2%) | 51 (33.8%) |
Fertility by Education in Walnut
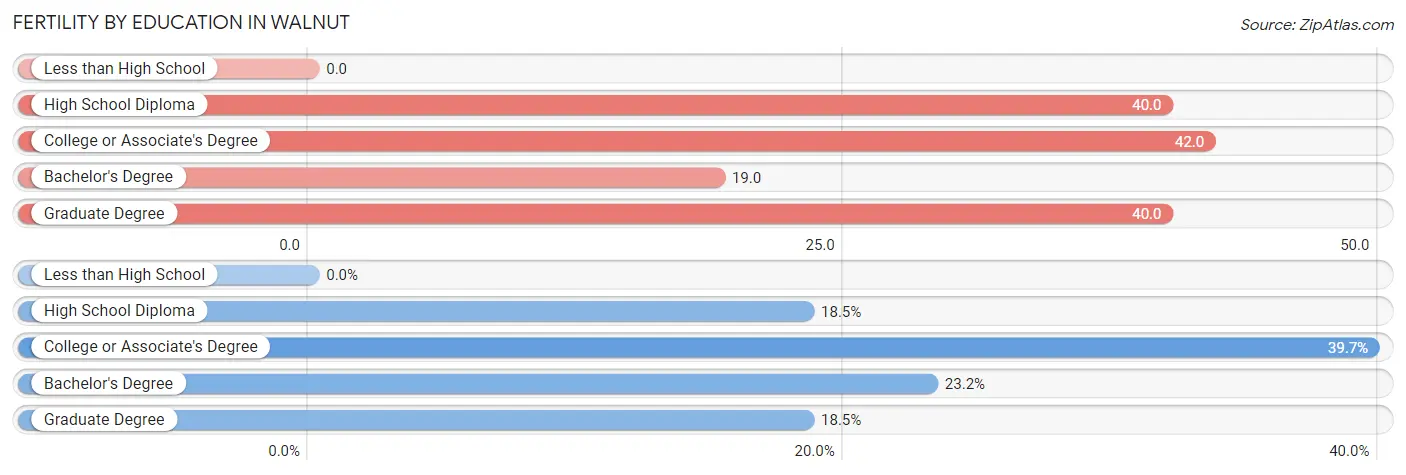
| Educational Attainment | Women with Births | Births / 1,000 Women |
| Less than High School | 0 (0.0%) | 0.0 |
| High School Diploma | 28 (18.5%) | 40.0 |
| College or Associate's Degree | 60 (39.7%) | 42.0 |
| Bachelor's Degree | 35 (23.2%) | 19.0 |
| Graduate Degree | 28 (18.5%) | 40.0 |
| Total | 151 (100.0%) | 28.0 |
Fertility by Education by Marriage Status in Walnut
33.8% of women with births in Walnut are unmarried. Women with the educational attainment of bachelor's degree are most likely to be married with 100.0% of them married at childbirth, while women with the educational attainment of high school diploma are least likely to be married with 78.6% of them unmarried at childbirth.
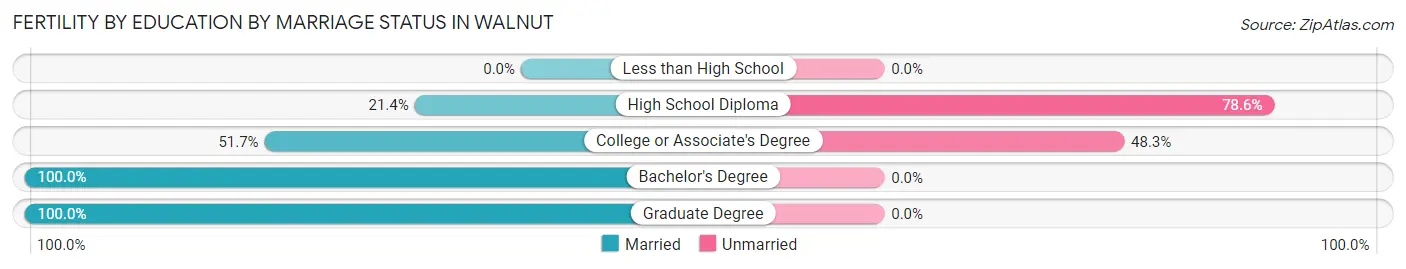
| Educational Attainment | Married | Unmarried |
| Less than High School | 0 (0.0%) | 0 (0.0%) |
| High School Diploma | 6 (21.4%) | 22 (78.6%) |
| College or Associate's Degree | 31 (51.7%) | 29 (48.3%) |
| Bachelor's Degree | 35 (100.0%) | 0 (0.0%) |
| Graduate Degree | 28 (100.0%) | 0 (0.0%) |
| Total | 100 (66.2%) | 51 (33.8%) |
Employment Characteristics in Walnut
Employment by Class of Employer in Walnut
Among the 13,066 employed individuals in Walnut, private company employees (8,089 | 61.9%), local government employees (1,370 | 10.5%), and not-for-profit organizations (989 | 7.6%) make up the most common classes of employment.
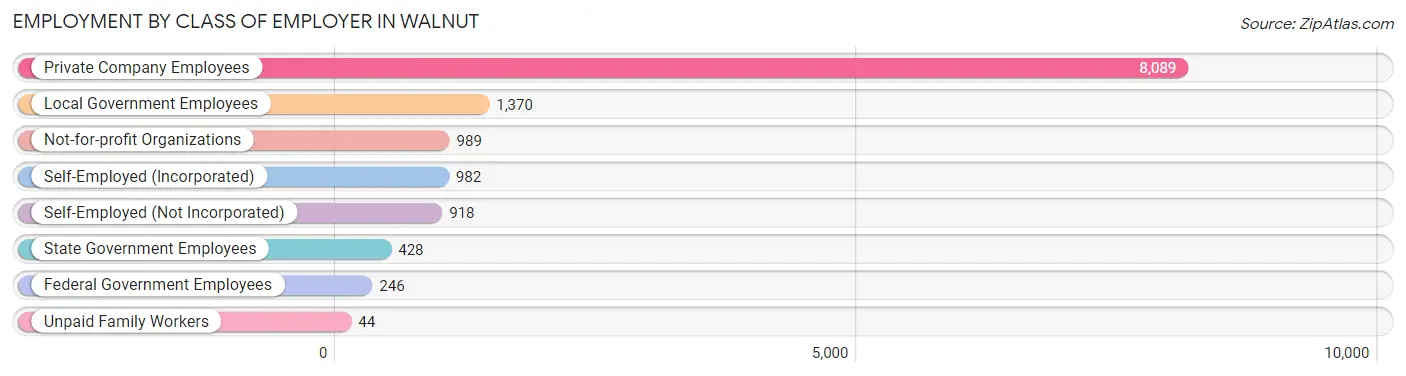
| Employer Class | # Employees | % Employees |
| Private Company Employees | 8,089 | 61.9% |
| Self-Employed (Incorporated) | 982 | 7.5% |
| Self-Employed (Not Incorporated) | 918 | 7.0% |
| Not-for-profit Organizations | 989 | 7.6% |
| Local Government Employees | 1,370 | 10.5% |
| State Government Employees | 428 | 3.3% |
| Federal Government Employees | 246 | 1.9% |
| Unpaid Family Workers | 44 | 0.3% |
| Total | 13,066 | 100.0% |
Employment Status by Age in Walnut
According to the labor force statistics for Walnut, out of the total population over 16 years of age (23,536), 59.6% or 14,027 individuals are in the labor force, with 4.2% or 589 of them unemployed. The age group with the highest labor force participation rate is 30 to 34 years, with 90.1% or 982 individuals in the labor force. Within the labor force, the 16 to 19 years age range has the highest percentage of unemployed individuals, with 8.7% or 15 of them being unemployed.
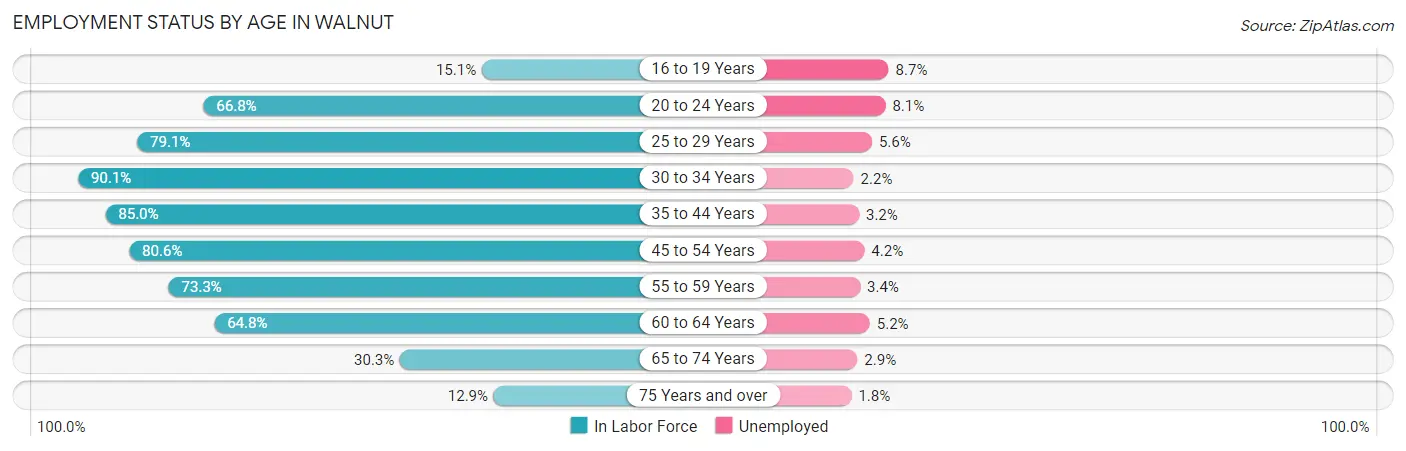
| Age Bracket | In Labor Force | Unemployed |
| 16 to 19 Years | 172 (15.1%) | 15 (8.7%) |
| 20 to 24 Years | 1,057 (66.8%) | 86 (8.1%) |
| 25 to 29 Years | 1,591 (79.1%) | 89 (5.6%) |
| 30 to 34 Years | 982 (90.1%) | 22 (2.2%) |
| 35 to 44 Years | 2,641 (85.0%) | 85 (3.2%) |
| 45 to 54 Years | 2,815 (80.6%) | 118 (4.2%) |
| 55 to 59 Years | 1,622 (73.3%) | 55 (3.4%) |
| 60 to 64 Years | 1,546 (64.8%) | 80 (5.2%) |
| 65 to 74 Years | 1,312 (30.3%) | 38 (2.9%) |
| 75 Years and over | 281 (12.9%) | 5 (1.8%) |
| Total | 14,027 (59.6%) | 589 (4.2%) |
Employment Status by Educational Attainment in Walnut
According to labor force statistics for Walnut, 78.3% of individuals (11,198) out of the total population between 25 and 64 years of age (14,301) are in the labor force, with 4.0% or 448 of them being unemployed. The group with the highest labor force participation rate are those with the educational attainment of bachelor's degree or higher, with 81.8% or 6,742 individuals in the labor force. Within the labor force, individuals with college / associate degree education have the highest percentage of unemployment, with 6.1% or 157 of them being unemployed.
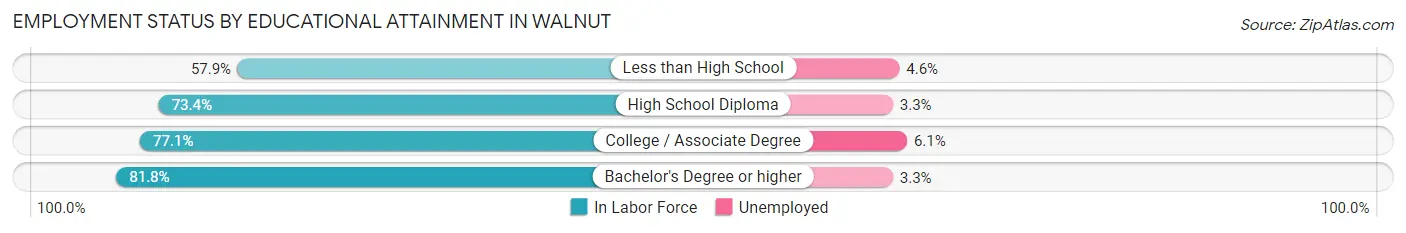
| Educational Attainment | In Labor Force | Unemployed |
| Less than High School | 431 (57.9%) | 34 (4.6%) |
| High School Diploma | 1,454 (73.4%) | 65 (3.3%) |
| College / Associate Degree | 2,571 (77.1%) | 203 (6.1%) |
| Bachelor's Degree or higher | 6,742 (81.8%) | 272 (3.3%) |
| Total | 11,198 (78.3%) | 572 (4.0%) |
Employment Occupations by Sex in Walnut
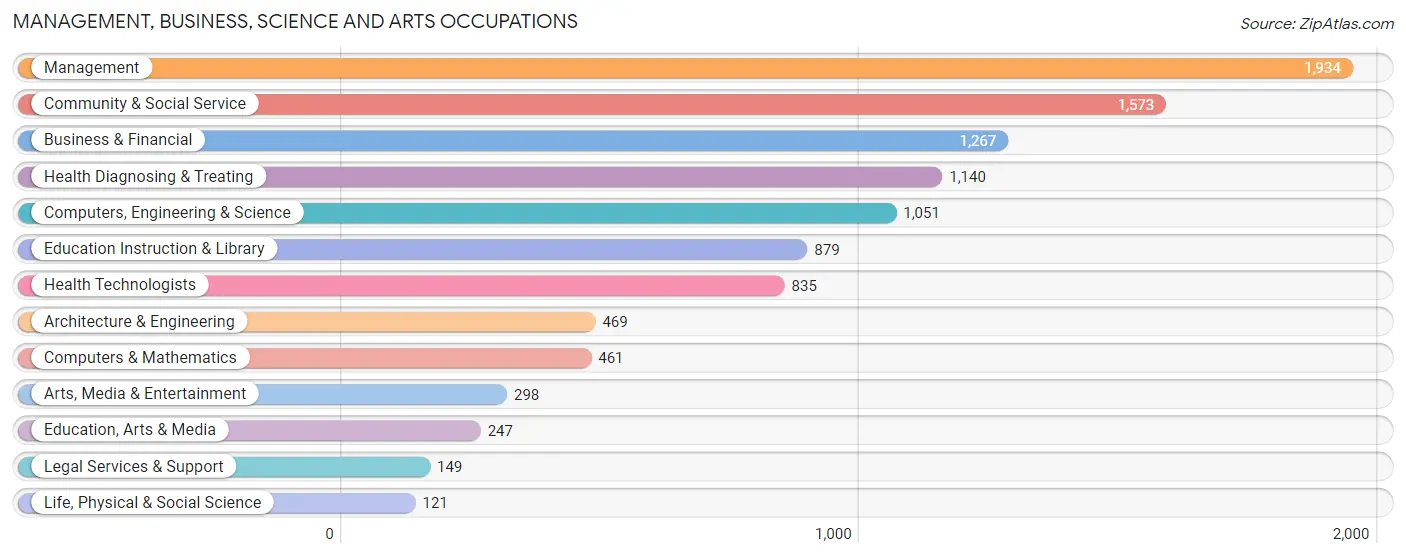
Management, Business, Science and Arts Occupations
The most common Management, Business, Science and Arts occupations in Walnut are Management (1,934 | 14.4%), Community & Social Service (1,573 | 11.7%), Business & Financial (1,267 | 9.5%), Health Diagnosing & Treating (1,140 | 8.5%), and Computers, Engineering & Science (1,051 | 7.8%).
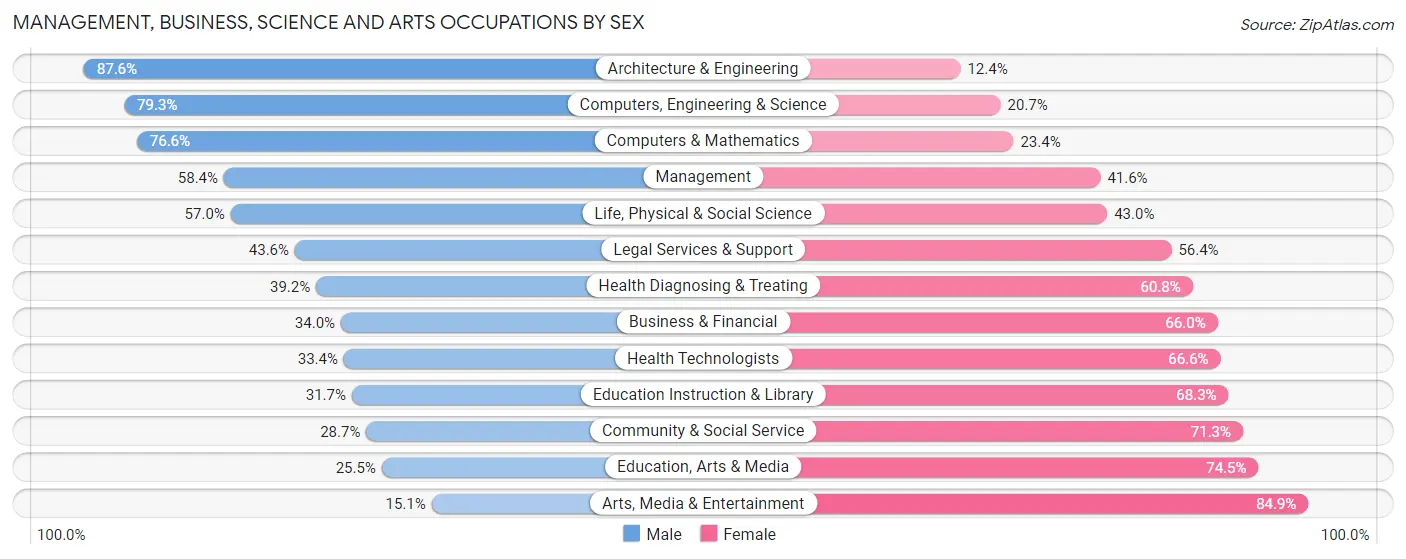
Management, Business, Science and Arts Occupations by Sex
Within the Management, Business, Science and Arts occupations in Walnut, the most male-oriented occupations are Architecture & Engineering (87.6%), Computers, Engineering & Science (79.3%), and Computers & Mathematics (76.6%), while the most female-oriented occupations are Arts, Media & Entertainment (84.9%), Education, Arts & Media (74.5%), and Community & Social Service (71.3%).
| Occupation | Male | Female |
| Management | 1,130 (58.4%) | 804 (41.6%) |
| Business & Financial | 431 (34.0%) | 836 (66.0%) |
| Computers, Engineering & Science | 833 (79.3%) | 218 (20.7%) |
| Computers & Mathematics | 353 (76.6%) | 108 (23.4%) |
| Architecture & Engineering | 411 (87.6%) | 58 (12.4%) |
| Life, Physical & Social Science | 69 (57.0%) | 52 (43.0%) |
| Community & Social Service | 452 (28.7%) | 1,121 (71.3%) |
| Education, Arts & Media | 63 (25.5%) | 184 (74.5%) |
| Legal Services & Support | 65 (43.6%) | 84 (56.4%) |
| Education Instruction & Library | 279 (31.7%) | 600 (68.3%) |
| Arts, Media & Entertainment | 45 (15.1%) | 253 (84.9%) |
| Health Diagnosing & Treating | 447 (39.2%) | 693 (60.8%) |
| Health Technologists | 279 (33.4%) | 556 (66.6%) |
| Total (Category) | 3,293 (47.3%) | 3,672 (52.7%) |
| Total (Overall) | 7,192 (53.6%) | 6,220 (46.4%) |
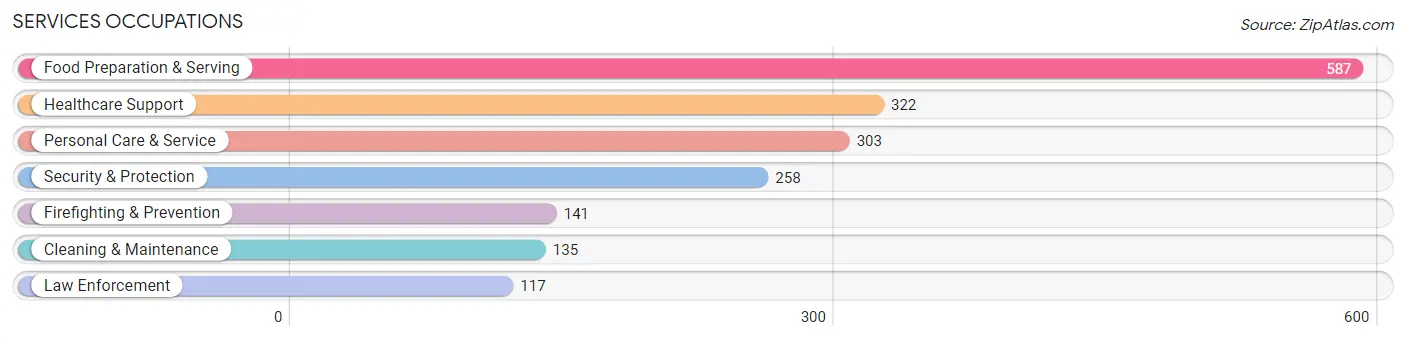
Services Occupations
The most common Services occupations in Walnut are Food Preparation & Serving (587 | 4.4%), Healthcare Support (322 | 2.4%), Personal Care & Service (303 | 2.3%), Security & Protection (258 | 1.9%), and Firefighting & Prevention (141 | 1.1%).
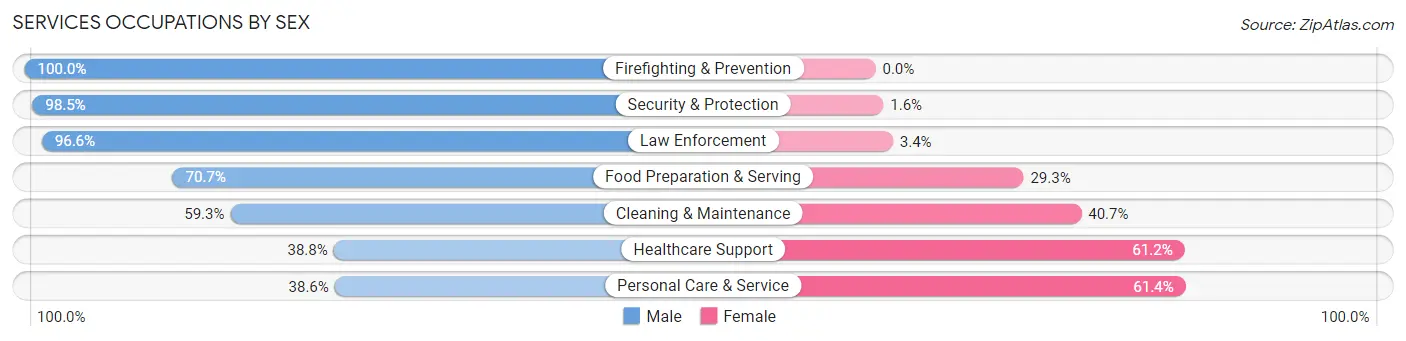
Services Occupations by Sex
Within the Services occupations in Walnut, the most male-oriented occupations are Firefighting & Prevention (100.0%), Security & Protection (98.5%), and Law Enforcement (96.6%), while the most female-oriented occupations are Personal Care & Service (61.4%), Healthcare Support (61.2%), and Cleaning & Maintenance (40.7%).
| Occupation | Male | Female |
| Healthcare Support | 125 (38.8%) | 197 (61.2%) |
| Security & Protection | 254 (98.5%) | 4 (1.5%) |
| Firefighting & Prevention | 141 (100.0%) | 0 (0.0%) |
| Law Enforcement | 113 (96.6%) | 4 (3.4%) |
| Food Preparation & Serving | 415 (70.7%) | 172 (29.3%) |
| Cleaning & Maintenance | 80 (59.3%) | 55 (40.7%) |
| Personal Care & Service | 117 (38.6%) | 186 (61.4%) |
| Total (Category) | 991 (61.7%) | 614 (38.3%) |
| Total (Overall) | 7,192 (53.6%) | 6,220 (46.4%) |
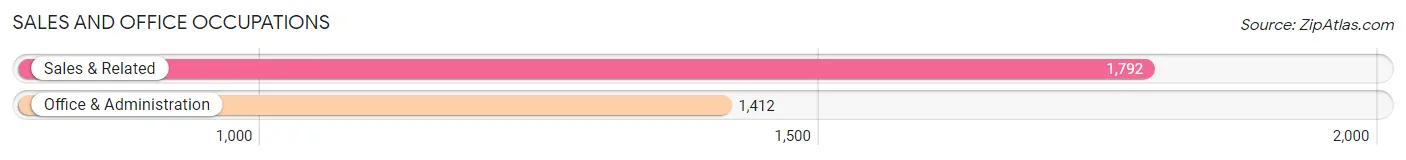
Sales and Office Occupations
The most common Sales and Office occupations in Walnut are Sales & Related (1,792 | 13.4%), and Office & Administration (1,412 | 10.5%).
Sales and Office Occupations by Sex
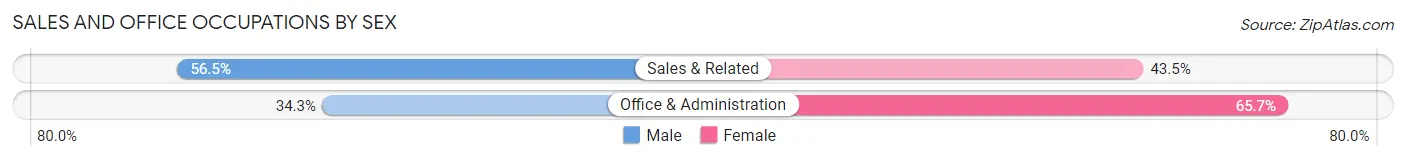
| Occupation | Male | Female |
| Sales & Related | 1,012 (56.5%) | 780 (43.5%) |
| Office & Administration | 484 (34.3%) | 928 (65.7%) |
| Total (Category) | 1,496 (46.7%) | 1,708 (53.3%) |
| Total (Overall) | 7,192 (53.6%) | 6,220 (46.4%) |
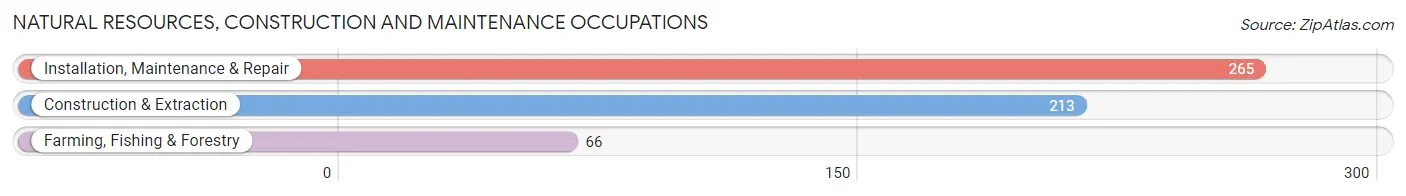
Natural Resources, Construction and Maintenance Occupations
The most common Natural Resources, Construction and Maintenance occupations in Walnut are Installation, Maintenance & Repair (265 | 2.0%), Construction & Extraction (213 | 1.6%), and Farming, Fishing & Forestry (66 | 0.5%).
Natural Resources, Construction and Maintenance Occupations by Sex
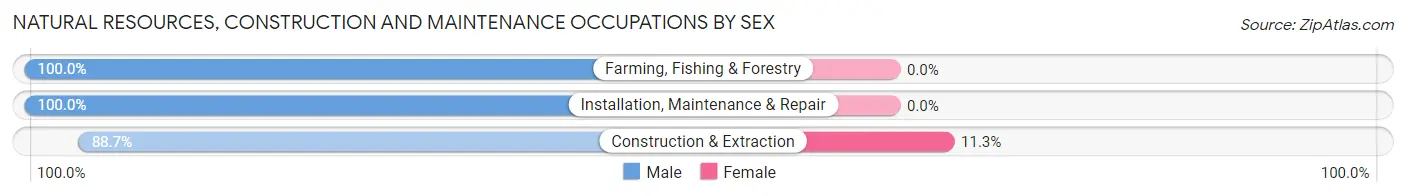
| Occupation | Male | Female |
| Farming, Fishing & Forestry | 66 (100.0%) | 0 (0.0%) |
| Construction & Extraction | 189 (88.7%) | 24 (11.3%) |
| Installation, Maintenance & Repair | 265 (100.0%) | 0 (0.0%) |
| Total (Category) | 520 (95.6%) | 24 (4.4%) |
| Total (Overall) | 7,192 (53.6%) | 6,220 (46.4%) |
Production, Transportation and Moving Occupations
The most common Production, Transportation and Moving occupations in Walnut are Production (386 | 2.9%), Transportation (385 | 2.9%), and Material Moving (323 | 2.4%).
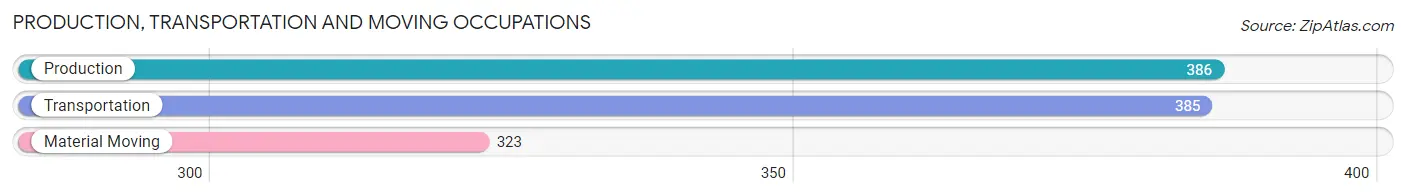
Production, Transportation and Moving Occupations by Sex
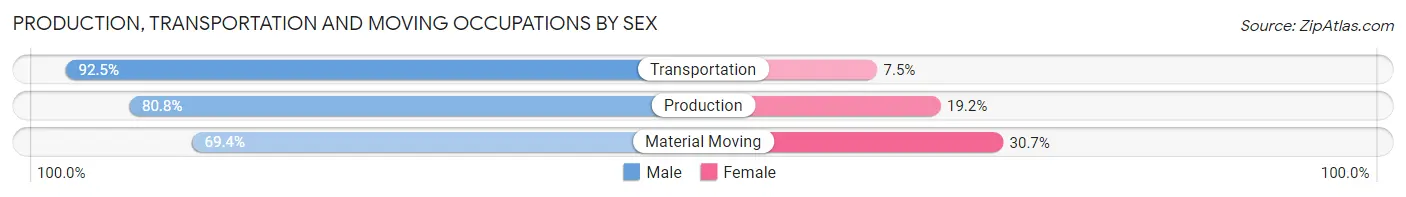
| Occupation | Male | Female |
| Production | 312 (80.8%) | 74 (19.2%) |
| Transportation | 356 (92.5%) | 29 (7.5%) |
| Material Moving | 224 (69.4%) | 99 (30.6%) |
| Total (Category) | 892 (81.5%) | 202 (18.5%) |
| Total (Overall) | 7,192 (53.6%) | 6,220 (46.4%) |
Employment Industries by Sex in Walnut
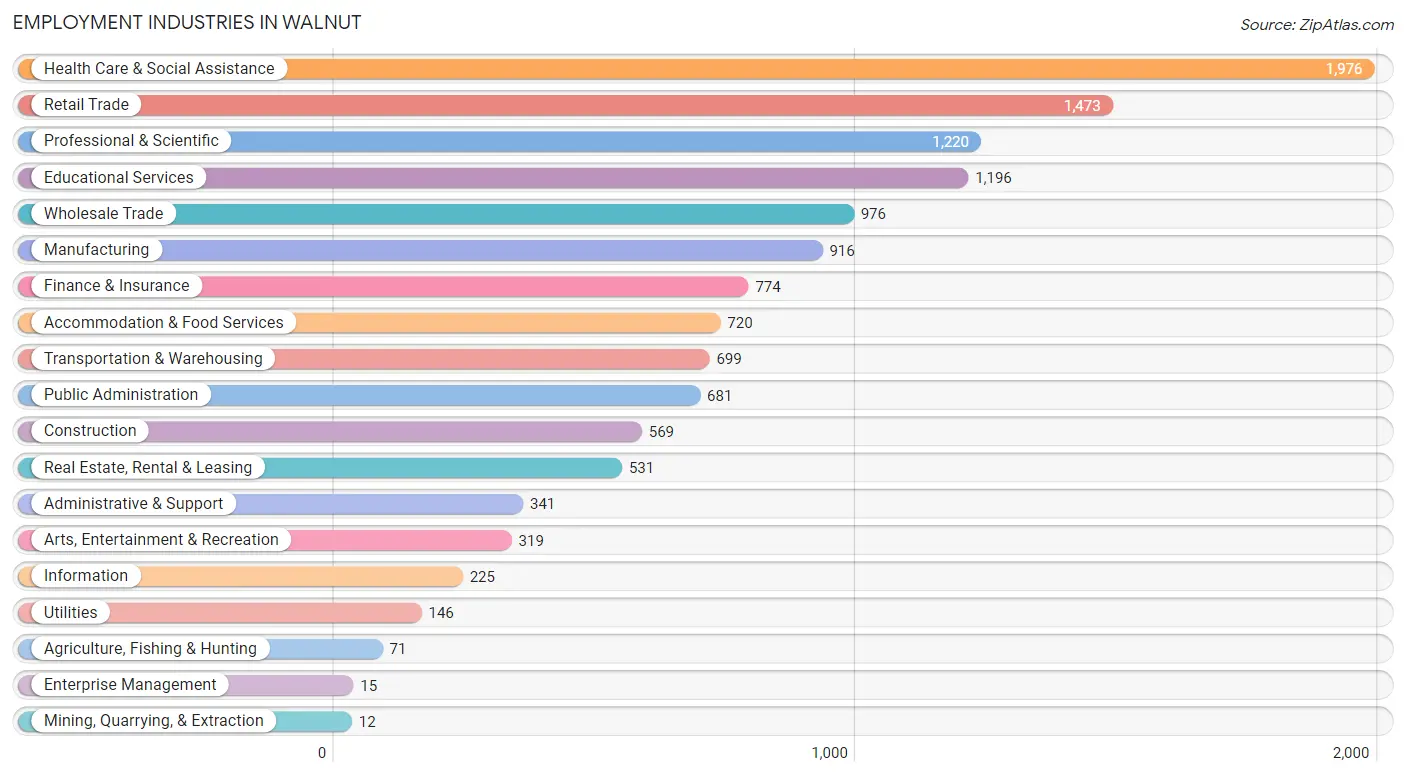
Employment Industries in Walnut
The major employment industries in Walnut include Health Care & Social Assistance (1,976 | 14.7%), Retail Trade (1,473 | 11.0%), Professional & Scientific (1,220 | 9.1%), Educational Services (1,196 | 8.9%), and Wholesale Trade (976 | 7.3%).
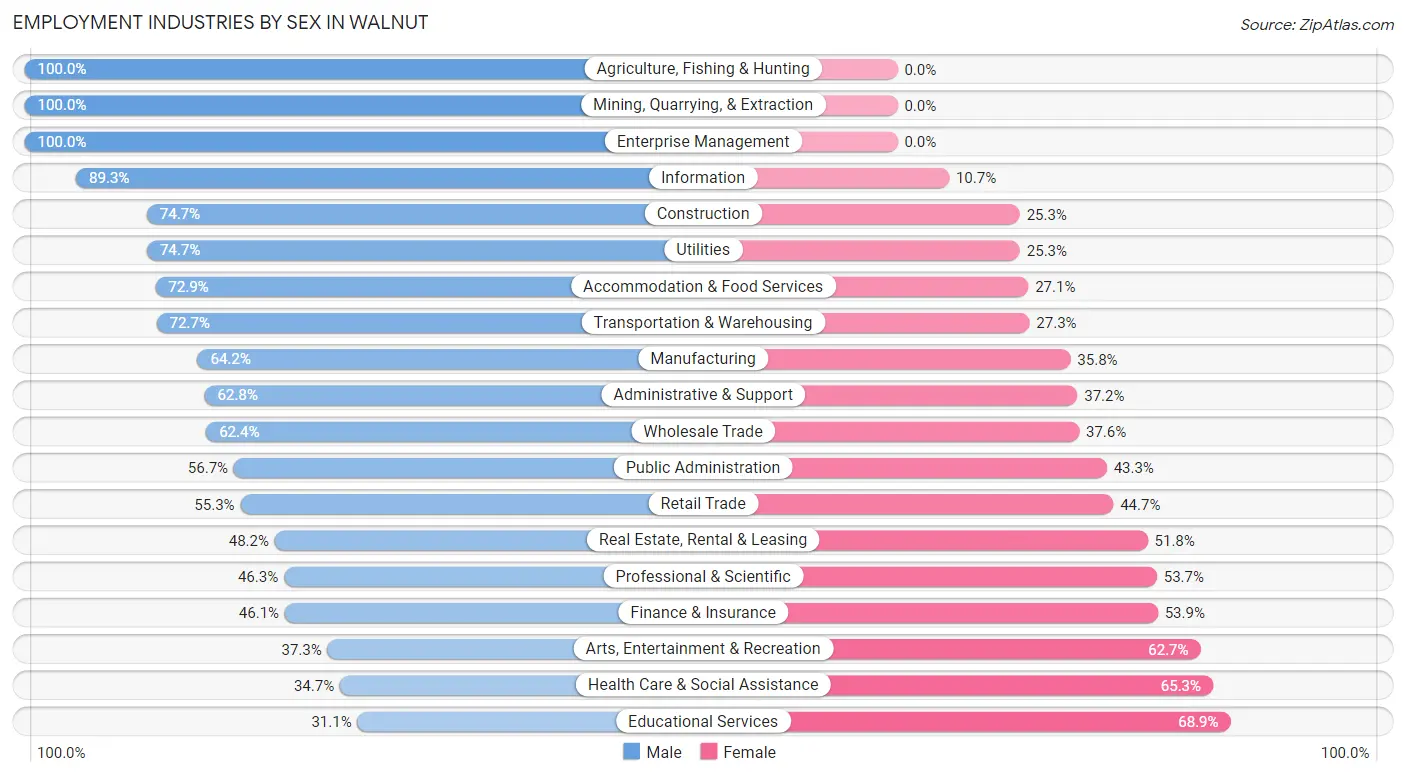
Employment Industries by Sex in Walnut
The Walnut industries that see more men than women are Agriculture, Fishing & Hunting (100.0%), Mining, Quarrying, & Extraction (100.0%), and Enterprise Management (100.0%), whereas the industries that tend to have a higher number of women are Educational Services (68.9%), Health Care & Social Assistance (65.3%), and Arts, Entertainment & Recreation (62.7%).
| Industry | Male | Female |
| Agriculture, Fishing & Hunting | 71 (100.0%) | 0 (0.0%) |
| Mining, Quarrying, & Extraction | 12 (100.0%) | 0 (0.0%) |
| Construction | 425 (74.7%) | 144 (25.3%) |
| Manufacturing | 588 (64.2%) | 328 (35.8%) |
| Wholesale Trade | 609 (62.4%) | 367 (37.6%) |
| Retail Trade | 815 (55.3%) | 658 (44.7%) |
| Transportation & Warehousing | 508 (72.7%) | 191 (27.3%) |
| Utilities | 109 (74.7%) | 37 (25.3%) |
| Information | 201 (89.3%) | 24 (10.7%) |
| Finance & Insurance | 357 (46.1%) | 417 (53.9%) |
| Real Estate, Rental & Leasing | 256 (48.2%) | 275 (51.8%) |
| Professional & Scientific | 565 (46.3%) | 655 (53.7%) |
| Enterprise Management | 15 (100.0%) | 0 (0.0%) |
| Administrative & Support | 214 (62.8%) | 127 (37.2%) |
| Educational Services | 372 (31.1%) | 824 (68.9%) |
| Health Care & Social Assistance | 686 (34.7%) | 1,290 (65.3%) |
| Arts, Entertainment & Recreation | 119 (37.3%) | 200 (62.7%) |
| Accommodation & Food Services | 525 (72.9%) | 195 (27.1%) |
| Public Administration | 386 (56.7%) | 295 (43.3%) |
| Total | 7,192 (53.6%) | 6,220 (46.4%) |
Education in Walnut
School Enrollment in Walnut
The most common levels of schooling among the 6,843 students in Walnut are college / undergraduate (1,853 | 27.1%), middle school (1,452 | 21.2%), and high school (1,244 | 18.2%).
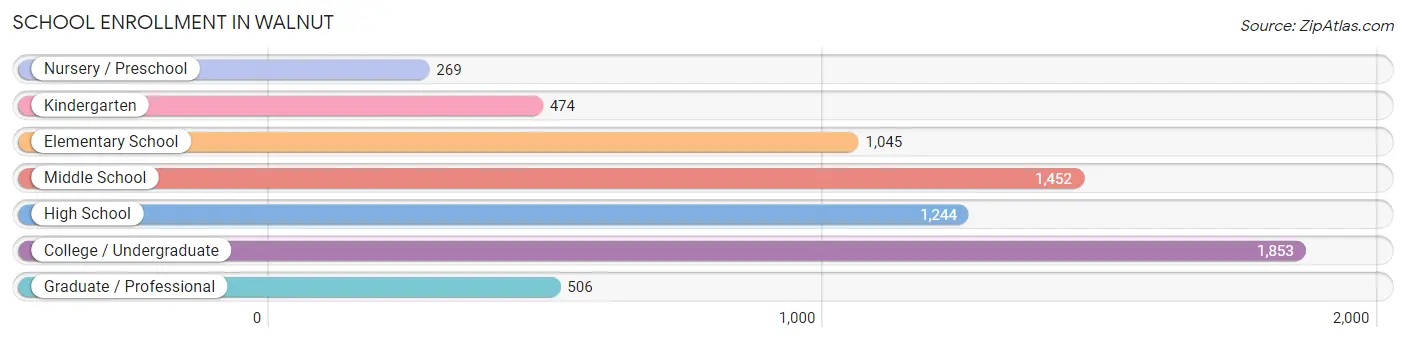
| School Level | # Students | % Students |
| Nursery / Preschool | 269 | 3.9% |
| Kindergarten | 474 | 6.9% |
| Elementary School | 1,045 | 15.3% |
| Middle School | 1,452 | 21.2% |
| High School | 1,244 | 18.2% |
| College / Undergraduate | 1,853 | 27.1% |
| Graduate / Professional | 506 | 7.4% |
| Total | 6,843 | 100.0% |
School Enrollment by Age by Funding Source in Walnut
Out of a total of 6,843 students who are enrolled in schools in Walnut, 801 (11.7%) attend a private institution, while the remaining 6,042 (88.3%) are enrolled in public schools. The age group of 3 to 4 year olds has the highest likelihood of being enrolled in private schools, with 139 (51.9% in the age bracket) enrolled. Conversely, the age group of 15 to 17 year olds has the lowest likelihood of being enrolled in a private school, with 868 (97.0% in the age bracket) attending a public institution.
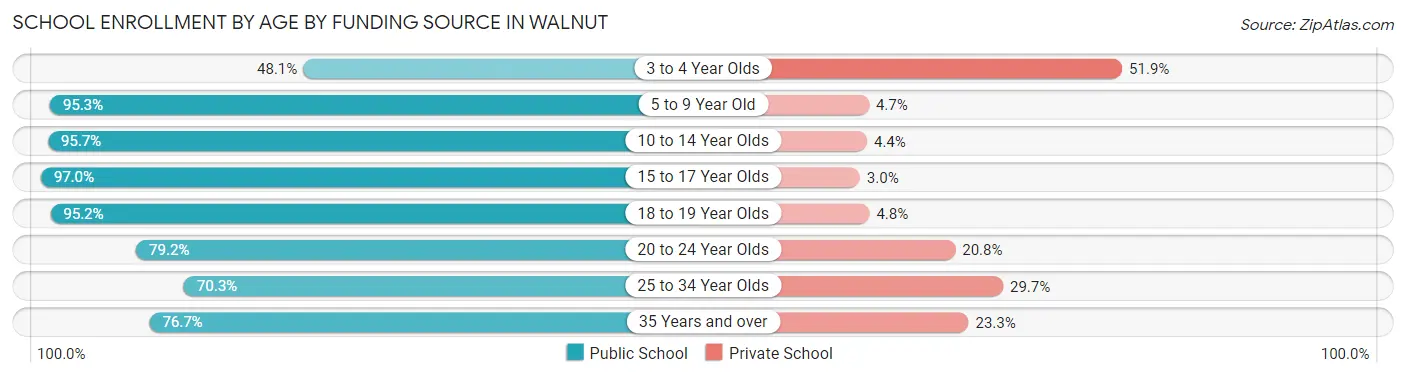
| Age Bracket | Public School | Private School |
| 3 to 4 Year Olds | 129 (48.1%) | 139 (51.9%) |
| 5 to 9 Year Old | 1,354 (95.3%) | 67 (4.7%) |
| 10 to 14 Year Olds | 1,761 (95.7%) | 80 (4.3%) |
| 15 to 17 Year Olds | 868 (97.0%) | 27 (3.0%) |
| 18 to 19 Year Olds | 476 (95.2%) | 24 (4.8%) |
| 20 to 24 Year Olds | 766 (79.2%) | 201 (20.8%) |
| 25 to 34 Year Olds | 436 (70.3%) | 184 (29.7%) |
| 35 Years and over | 254 (76.7%) | 77 (23.3%) |
| Total | 6,042 (88.3%) | 801 (11.7%) |
Educational Attainment by Field of Study in Walnut
Business (3,507 | 29.1%), engineering (1,460 | 12.1%), science & technology (1,113 | 9.2%), social sciences (881 | 7.3%), and visual & performing arts (754 | 6.3%) are the most common fields of study among 12,045 individuals in Walnut who have obtained a bachelor's degree or higher.
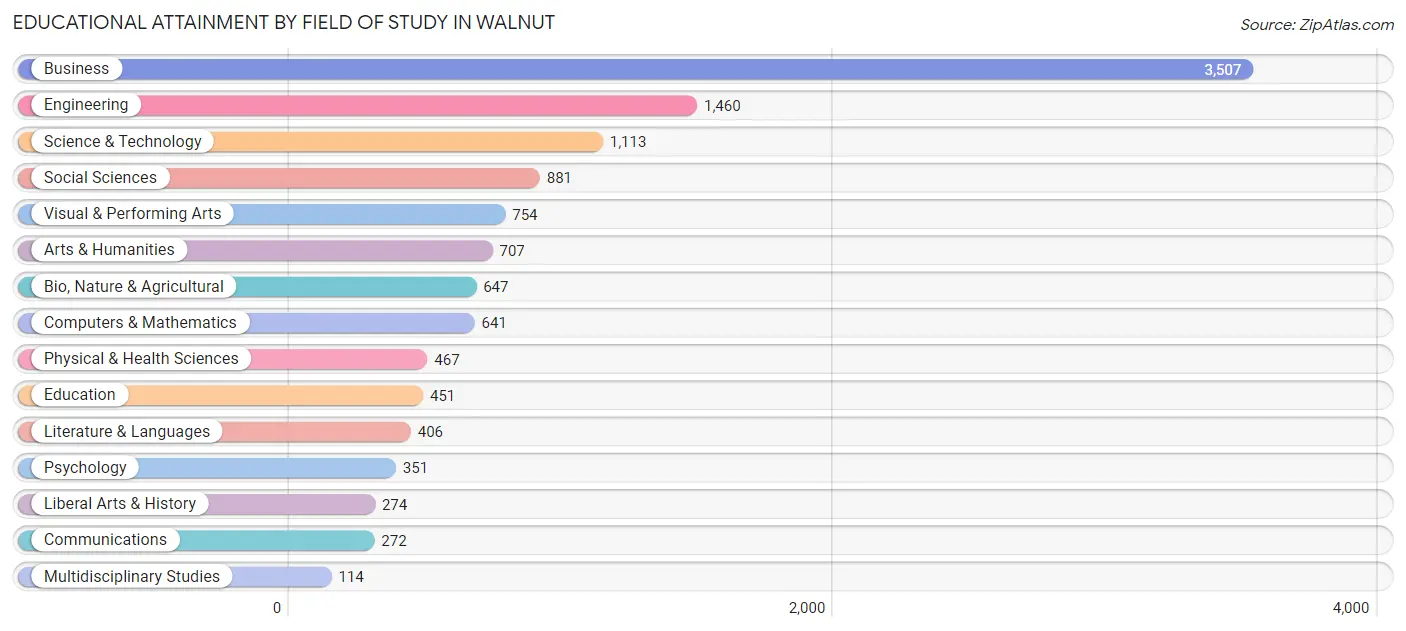
| Field of Study | # Graduates | % Graduates |
| Computers & Mathematics | 641 | 5.3% |
| Bio, Nature & Agricultural | 647 | 5.4% |
| Physical & Health Sciences | 467 | 3.9% |
| Psychology | 351 | 2.9% |
| Social Sciences | 881 | 7.3% |
| Engineering | 1,460 | 12.1% |
| Multidisciplinary Studies | 114 | 0.9% |
| Science & Technology | 1,113 | 9.2% |
| Business | 3,507 | 29.1% |
| Education | 451 | 3.7% |
| Literature & Languages | 406 | 3.4% |
| Liberal Arts & History | 274 | 2.3% |
| Visual & Performing Arts | 754 | 6.3% |
| Communications | 272 | 2.3% |
| Arts & Humanities | 707 | 5.9% |
| Total | 12,045 | 100.0% |
Transportation & Commute in Walnut
Vehicle Availability by Sex in Walnut
The most prevalent vehicle ownership categories in Walnut are males with 2 vehicles (2,400, accounting for 34.0%) and females with 2 vehicles (1,985, making up 40.0%).
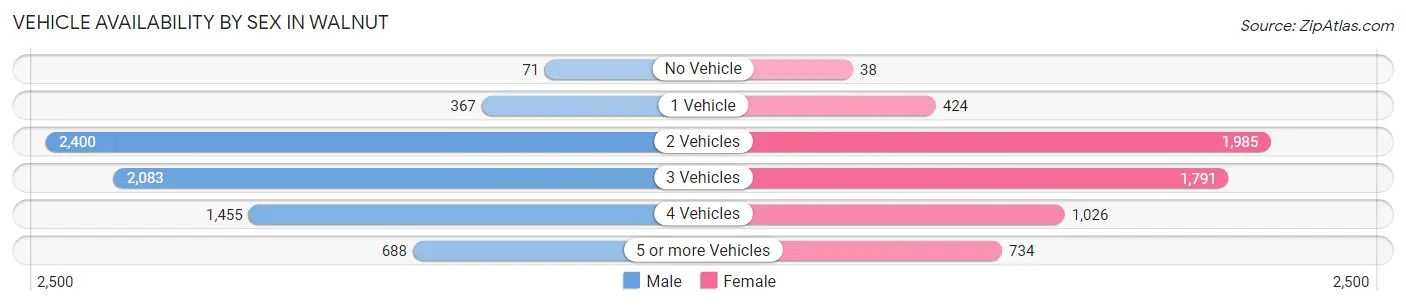
| Vehicles Available | Male | Female |
| No Vehicle | 71 (1.0%) | 38 (0.6%) |
| 1 Vehicle | 367 (5.2%) | 424 (7.1%) |
| 2 Vehicles | 2,400 (34.0%) | 1,985 (33.1%) |
| 3 Vehicles | 2,083 (29.5%) | 1,791 (29.9%) |
| 4 Vehicles | 1,455 (20.6%) | 1,026 (17.1%) |
| 5 or more Vehicles | 688 (9.7%) | 734 (12.2%) |
| Total | 7,064 (100.0%) | 5,998 (100.0%) |
Commute Time in Walnut
The most frequently occuring commute durations in Walnut are 30 to 34 minutes (1,898 commuters, 17.2%), 60 to 89 minutes (1,546 commuters, 14.0%), and 20 to 24 minutes (1,421 commuters, 12.9%).
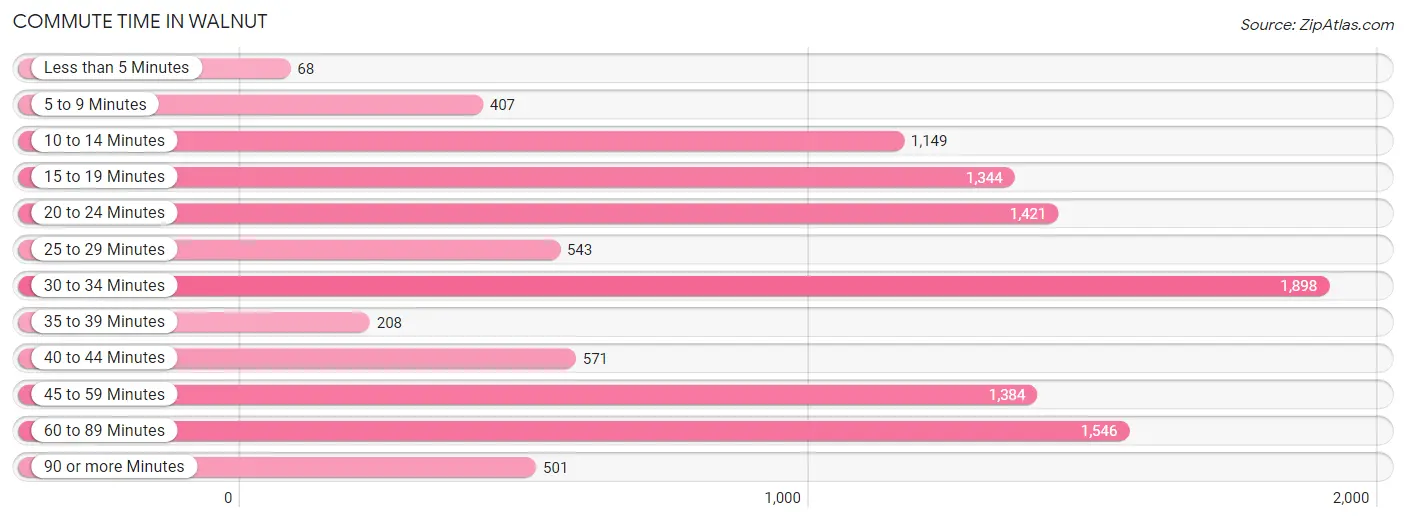
| Commute Time | # Commuters | % Commuters |
| Less than 5 Minutes | 68 | 0.6% |
| 5 to 9 Minutes | 407 | 3.7% |
| 10 to 14 Minutes | 1,149 | 10.4% |
| 15 to 19 Minutes | 1,344 | 12.2% |
| 20 to 24 Minutes | 1,421 | 12.9% |
| 25 to 29 Minutes | 543 | 4.9% |
| 30 to 34 Minutes | 1,898 | 17.2% |
| 35 to 39 Minutes | 208 | 1.9% |
| 40 to 44 Minutes | 571 | 5.2% |
| 45 to 59 Minutes | 1,384 | 12.5% |
| 60 to 89 Minutes | 1,546 | 14.0% |
| 90 or more Minutes | 501 | 4.5% |
Commute Time by Sex in Walnut
The most common commute times in Walnut are 30 to 34 minutes (1,111 commuters, 18.3%) for males and 30 to 34 minutes (787 commuters, 15.9%) for females.
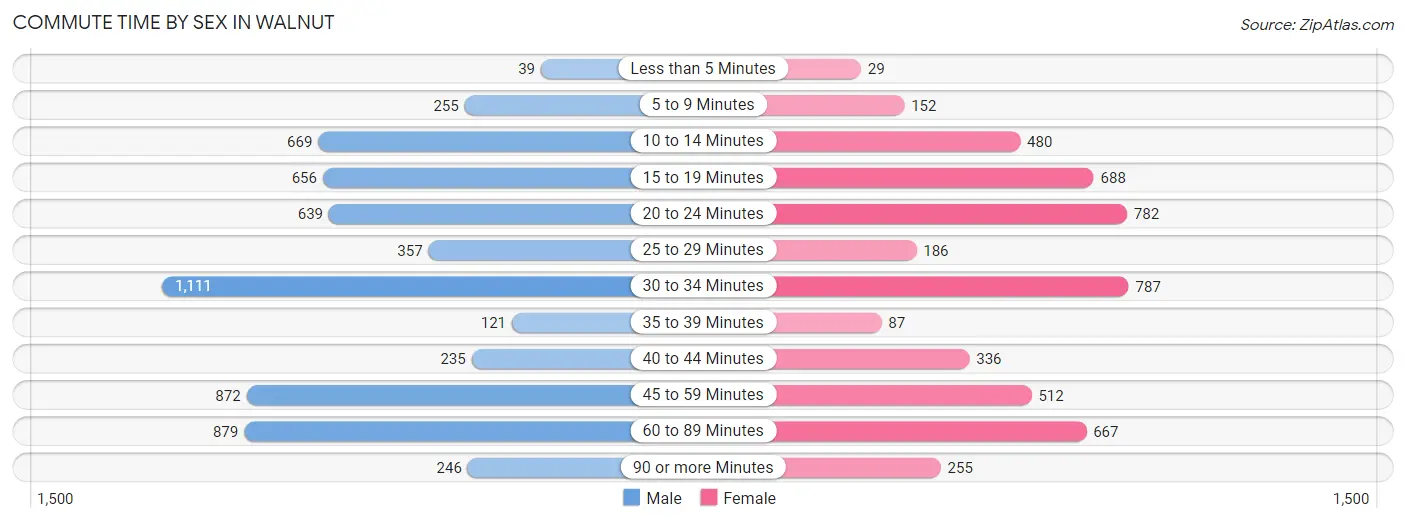
| Commute Time | Male | Female |
| Less than 5 Minutes | 39 (0.6%) | 29 (0.6%) |
| 5 to 9 Minutes | 255 (4.2%) | 152 (3.1%) |
| 10 to 14 Minutes | 669 (11.0%) | 480 (9.7%) |
| 15 to 19 Minutes | 656 (10.8%) | 688 (13.9%) |
| 20 to 24 Minutes | 639 (10.5%) | 782 (15.8%) |
| 25 to 29 Minutes | 357 (5.9%) | 186 (3.7%) |
| 30 to 34 Minutes | 1,111 (18.3%) | 787 (15.9%) |
| 35 to 39 Minutes | 121 (2.0%) | 87 (1.8%) |
| 40 to 44 Minutes | 235 (3.9%) | 336 (6.8%) |
| 45 to 59 Minutes | 872 (14.3%) | 512 (10.3%) |
| 60 to 89 Minutes | 879 (14.5%) | 667 (13.4%) |
| 90 or more Minutes | 246 (4.1%) | 255 (5.1%) |
Time of Departure to Work by Sex in Walnut
The most frequent times of departure to work in Walnut are 8:00 AM to 8:29 AM (1,121, 18.4%) for males and 8:00 AM to 8:29 AM (850, 17.1%) for females.
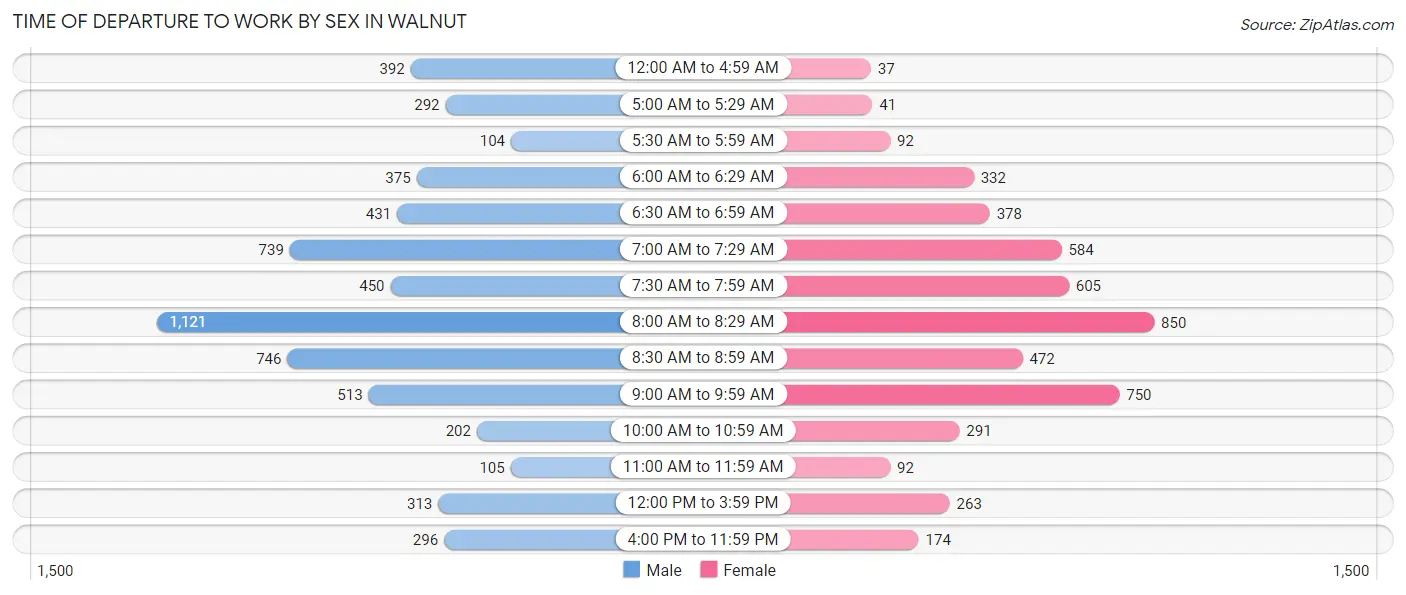
| Time of Departure | Male | Female |
| 12:00 AM to 4:59 AM | 392 (6.5%) | 37 (0.7%) |
| 5:00 AM to 5:29 AM | 292 (4.8%) | 41 (0.8%) |
| 5:30 AM to 5:59 AM | 104 (1.7%) | 92 (1.8%) |
| 6:00 AM to 6:29 AM | 375 (6.2%) | 332 (6.7%) |
| 6:30 AM to 6:59 AM | 431 (7.1%) | 378 (7.6%) |
| 7:00 AM to 7:29 AM | 739 (12.2%) | 584 (11.8%) |
| 7:30 AM to 7:59 AM | 450 (7.4%) | 605 (12.2%) |
| 8:00 AM to 8:29 AM | 1,121 (18.4%) | 850 (17.1%) |
| 8:30 AM to 8:59 AM | 746 (12.3%) | 472 (9.5%) |
| 9:00 AM to 9:59 AM | 513 (8.4%) | 750 (15.1%) |
| 10:00 AM to 10:59 AM | 202 (3.3%) | 291 (5.9%) |
| 11:00 AM to 11:59 AM | 105 (1.7%) | 92 (1.8%) |
| 12:00 PM to 3:59 PM | 313 (5.1%) | 263 (5.3%) |
| 4:00 PM to 11:59 PM | 296 (4.9%) | 174 (3.5%) |
| Total | 6,079 (100.0%) | 4,961 (100.0%) |
Housing Occupancy in Walnut
Occupancy by Ownership in Walnut
Of the total 8,616 dwellings in Walnut, owner-occupied units account for 7,111 (82.5%), while renter-occupied units make up 1,505 (17.5%).
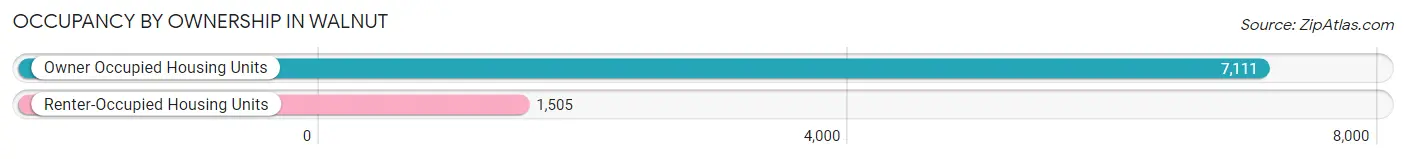
| Occupancy | # Housing Units | % Housing Units |
| Owner Occupied Housing Units | 7,111 | 82.5% |
| Renter-Occupied Housing Units | 1,505 | 17.5% |
| Total Occupied Housing Units | 8,616 | 100.0% |
Occupancy by Household Size in Walnut
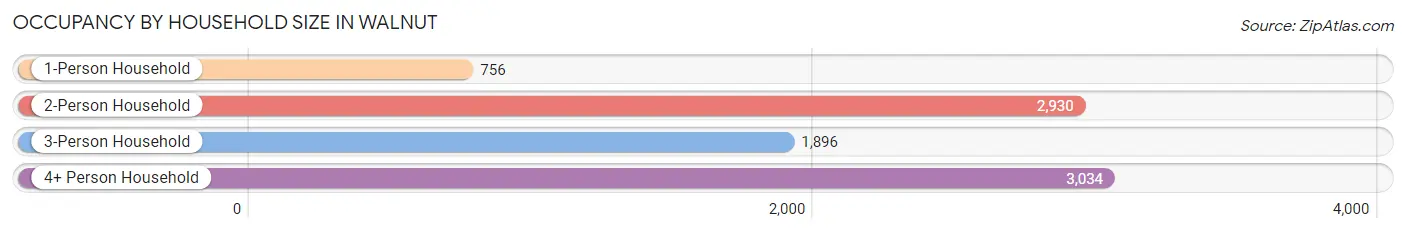
| Household Size | # Housing Units | % Housing Units |
| 1-Person Household | 756 | 8.8% |
| 2-Person Household | 2,930 | 34.0% |
| 3-Person Household | 1,896 | 22.0% |
| 4+ Person Household | 3,034 | 35.2% |
| Total Housing Units | 8,616 | 100.0% |
Occupancy by Ownership by Household Size in Walnut
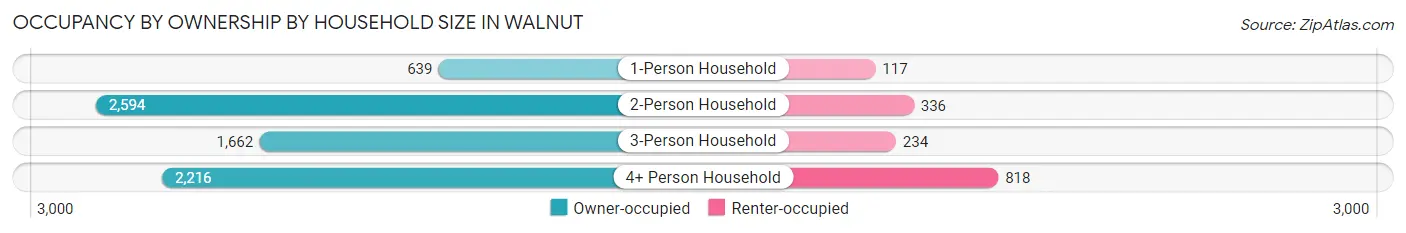
| Household Size | Owner-occupied | Renter-occupied |
| 1-Person Household | 639 (84.5%) | 117 (15.5%) |
| 2-Person Household | 2,594 (88.5%) | 336 (11.5%) |
| 3-Person Household | 1,662 (87.7%) | 234 (12.3%) |
| 4+ Person Household | 2,216 (73.0%) | 818 (27.0%) |
| Total Housing Units | 7,111 (82.5%) | 1,505 (17.5%) |
Occupancy by Educational Attainment in Walnut
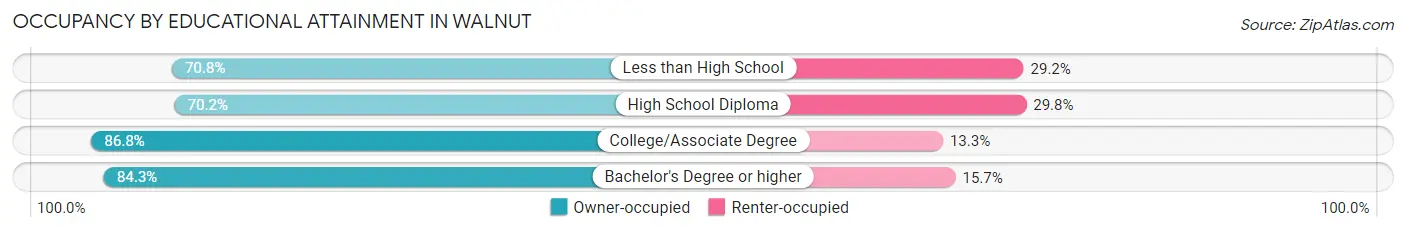
| Household Size | Owner-occupied | Renter-occupied |
| Less than High School | 247 (70.8%) | 102 (29.2%) |
| High School Diploma | 741 (70.2%) | 314 (29.8%) |
| College/Associate Degree | 1,584 (86.8%) | 242 (13.3%) |
| Bachelor's Degree or higher | 4,539 (84.3%) | 847 (15.7%) |
Occupancy by Age of Householder in Walnut
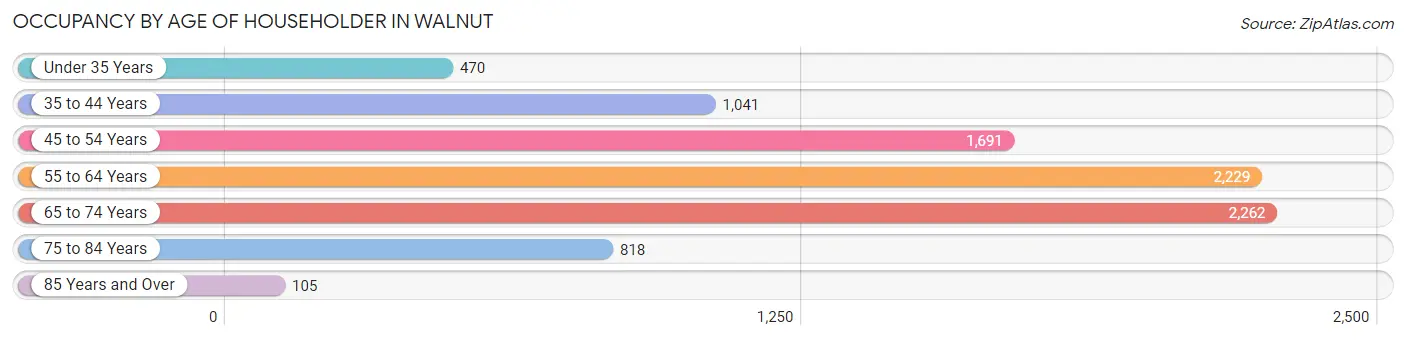
| Age Bracket | # Households | % Households |
| Under 35 Years | 470 | 5.4% |
| 35 to 44 Years | 1,041 | 12.1% |
| 45 to 54 Years | 1,691 | 19.6% |
| 55 to 64 Years | 2,229 | 25.9% |
| 65 to 74 Years | 2,262 | 26.3% |
| 75 to 84 Years | 818 | 9.5% |
| 85 Years and Over | 105 | 1.2% |
| Total | 8,616 | 100.0% |
Housing Finances in Walnut
Median Income by Occupancy in Walnut
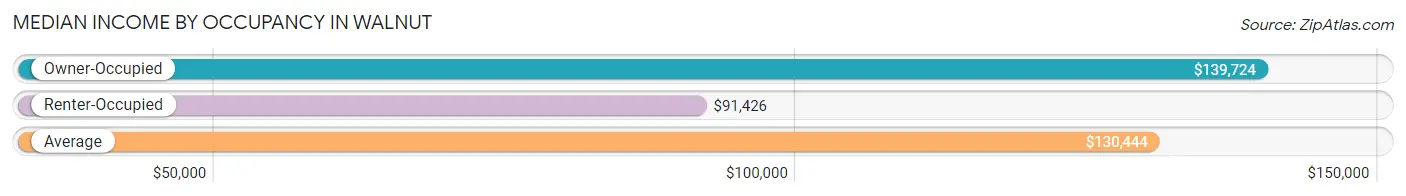
| Occupancy Type | # Households | Median Income |
| Owner-Occupied | 7,111 (82.5%) | $139,724 |
| Renter-Occupied | 1,505 (17.5%) | $91,426 |
| Average | 8,616 (100.0%) | $130,444 |
Occupancy by Householder Income Bracket in Walnut
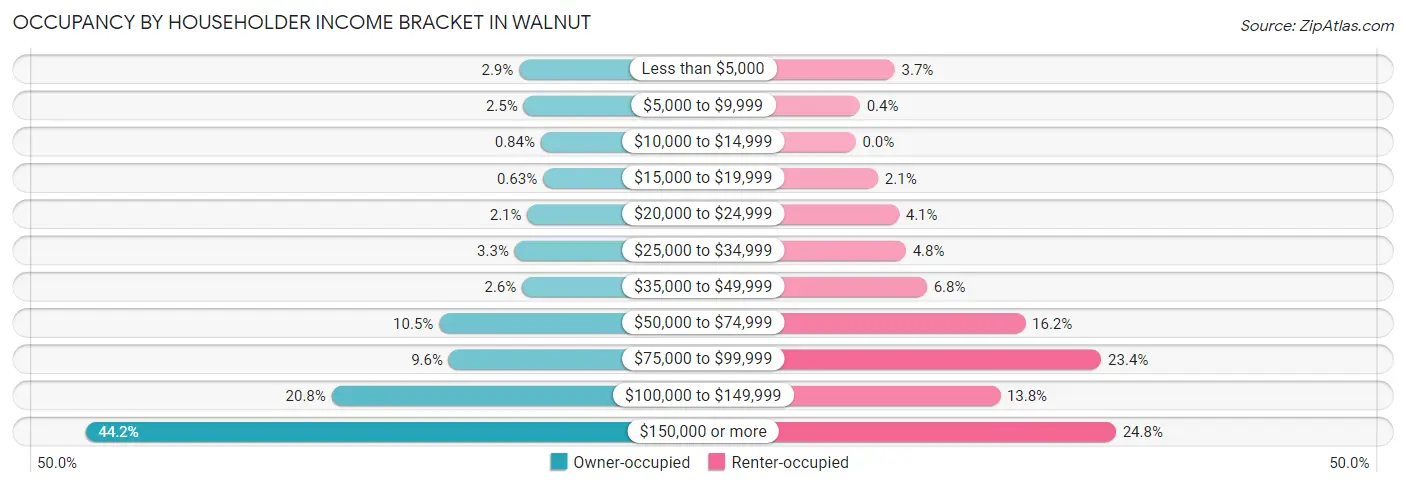
| Income Bracket | Owner-occupied | Renter-occupied |
| Less than $5,000 | 206 (2.9%) | 56 (3.7%) |
| $5,000 to $9,999 | 176 (2.5%) | 6 (0.4%) |
| $10,000 to $14,999 | 60 (0.8%) | 0 (0.0%) |
| $15,000 to $19,999 | 45 (0.6%) | 32 (2.1%) |
| $20,000 to $24,999 | 151 (2.1%) | 62 (4.1%) |
| $25,000 to $34,999 | 236 (3.3%) | 72 (4.8%) |
| $35,000 to $49,999 | 186 (2.6%) | 102 (6.8%) |
| $50,000 to $74,999 | 748 (10.5%) | 243 (16.2%) |
| $75,000 to $99,999 | 683 (9.6%) | 352 (23.4%) |
| $100,000 to $149,999 | 1,476 (20.8%) | 207 (13.8%) |
| $150,000 or more | 3,144 (44.2%) | 373 (24.8%) |
| Total | 7,111 (100.0%) | 1,505 (100.0%) |
Monthly Housing Cost Tiers in Walnut
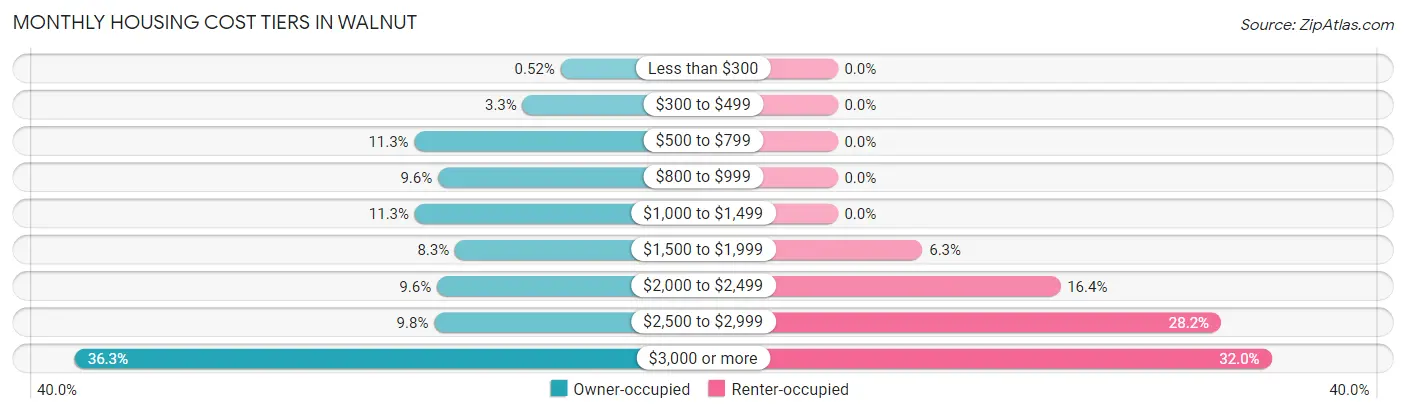
| Monthly Cost | Owner-occupied | Renter-occupied |
| Less than $300 | 37 (0.5%) | 0 (0.0%) |
| $300 to $499 | 236 (3.3%) | 0 (0.0%) |
| $500 to $799 | 803 (11.3%) | 0 (0.0%) |
| $800 to $999 | 679 (9.6%) | 0 (0.0%) |
| $1,000 to $1,499 | 801 (11.3%) | 0 (0.0%) |
| $1,500 to $1,999 | 590 (8.3%) | 94 (6.2%) |
| $2,000 to $2,499 | 685 (9.6%) | 247 (16.4%) |
| $2,500 to $2,999 | 699 (9.8%) | 425 (28.2%) |
| $3,000 or more | 2,581 (36.3%) | 481 (32.0%) |
| Total | 7,111 (100.0%) | 1,505 (100.0%) |
Physical Housing Characteristics in Walnut
Housing Structures in Walnut
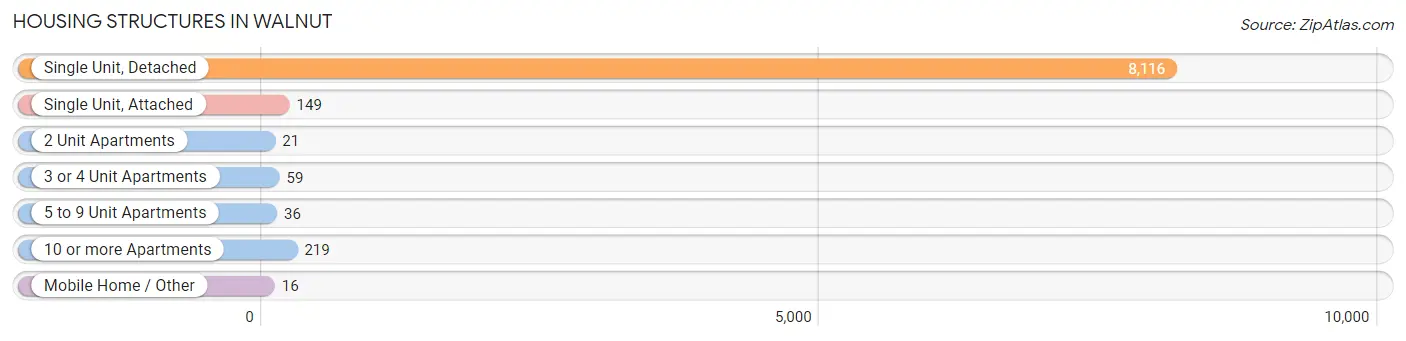
| Structure Type | # Housing Units | % Housing Units |
| Single Unit, Detached | 8,116 | 94.2% |
| Single Unit, Attached | 149 | 1.7% |
| 2 Unit Apartments | 21 | 0.2% |
| 3 or 4 Unit Apartments | 59 | 0.7% |
| 5 to 9 Unit Apartments | 36 | 0.4% |
| 10 or more Apartments | 219 | 2.5% |
| Mobile Home / Other | 16 | 0.2% |
| Total | 8,616 | 100.0% |
Housing Structures by Occupancy in Walnut
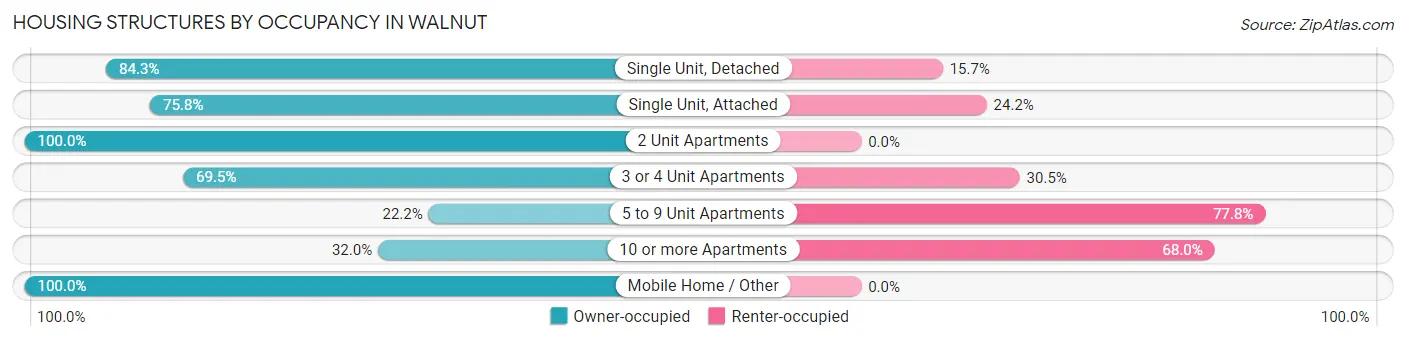
| Structure Type | Owner-occupied | Renter-occupied |
| Single Unit, Detached | 6,842 (84.3%) | 1,274 (15.7%) |
| Single Unit, Attached | 113 (75.8%) | 36 (24.2%) |
| 2 Unit Apartments | 21 (100.0%) | 0 (0.0%) |
| 3 or 4 Unit Apartments | 41 (69.5%) | 18 (30.5%) |
| 5 to 9 Unit Apartments | 8 (22.2%) | 28 (77.8%) |
| 10 or more Apartments | 70 (32.0%) | 149 (68.0%) |
| Mobile Home / Other | 16 (100.0%) | 0 (0.0%) |
| Total | 7,111 (82.5%) | 1,505 (17.5%) |
Housing Structures by Number of Rooms in Walnut
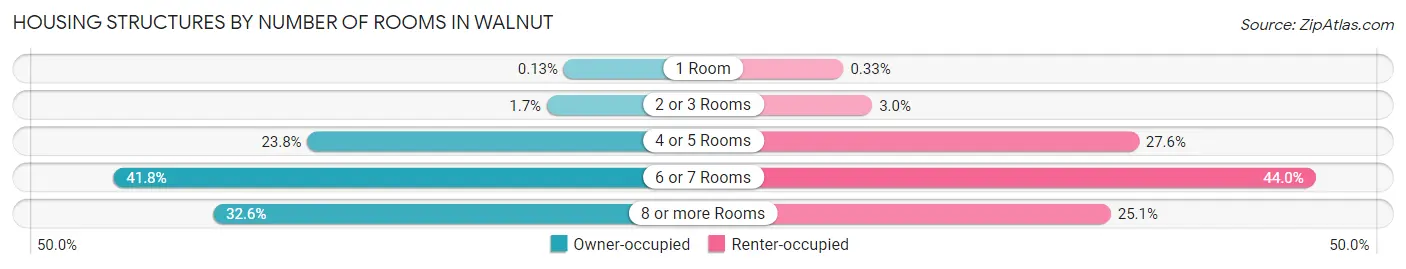
| Number of Rooms | Owner-occupied | Renter-occupied |
| 1 Room | 9 (0.1%) | 5 (0.3%) |
| 2 or 3 Rooms | 120 (1.7%) | 45 (3.0%) |
| 4 or 5 Rooms | 1,695 (23.8%) | 416 (27.6%) |
| 6 or 7 Rooms | 2,972 (41.8%) | 662 (44.0%) |
| 8 or more Rooms | 2,315 (32.6%) | 377 (25.1%) |
| Total | 7,111 (100.0%) | 1,505 (100.0%) |
Housing Structure by Heating Type in Walnut
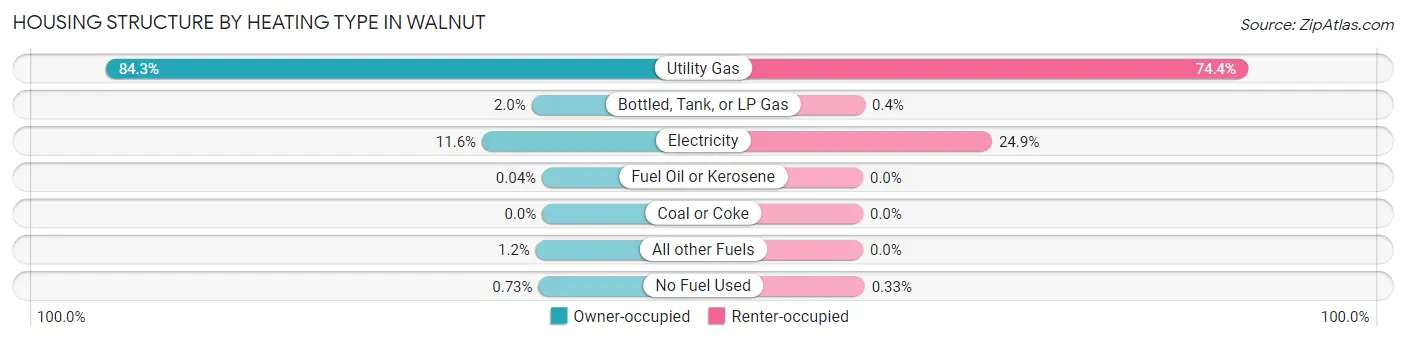
| Heating Type | Owner-occupied | Renter-occupied |
| Utility Gas | 5,996 (84.3%) | 1,119 (74.4%) |
| Bottled, Tank, or LP Gas | 145 (2.0%) | 6 (0.4%) |
| Electricity | 827 (11.6%) | 375 (24.9%) |
| Fuel Oil or Kerosene | 3 (0.0%) | 0 (0.0%) |
| Coal or Coke | 0 (0.0%) | 0 (0.0%) |
| All other Fuels | 88 (1.2%) | 0 (0.0%) |
| No Fuel Used | 52 (0.7%) | 5 (0.3%) |
| Total | 7,111 (100.0%) | 1,505 (100.0%) |
Household Vehicle Usage in Walnut
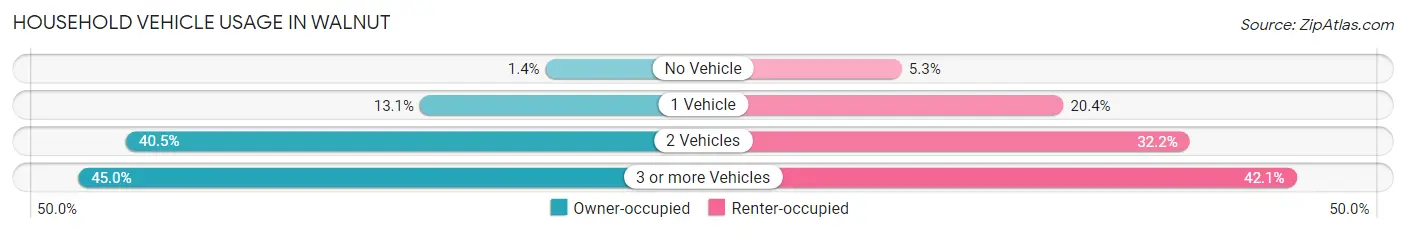
| Vehicles per Household | Owner-occupied | Renter-occupied |
| No Vehicle | 98 (1.4%) | 80 (5.3%) |
| 1 Vehicle | 932 (13.1%) | 307 (20.4%) |
| 2 Vehicles | 2,882 (40.5%) | 484 (32.2%) |
| 3 or more Vehicles | 3,199 (45.0%) | 634 (42.1%) |
| Total | 7,111 (100.0%) | 1,505 (100.0%) |
Real Estate & Mortgages in Walnut
Real Estate and Mortgage Overview in Walnut
| Characteristic | Without Mortgage | With Mortgage |
| Housing Units | 2,798 | 4,313 |
| Median Property Value | $913,900 | $957,200 |
| Median Household Income | $119,611 | $2,221 |
| Monthly Housing Costs | $910 | $2,525 |
| Real Estate Taxes | $6,628 | $34 |
Property Value by Mortgage Status in Walnut
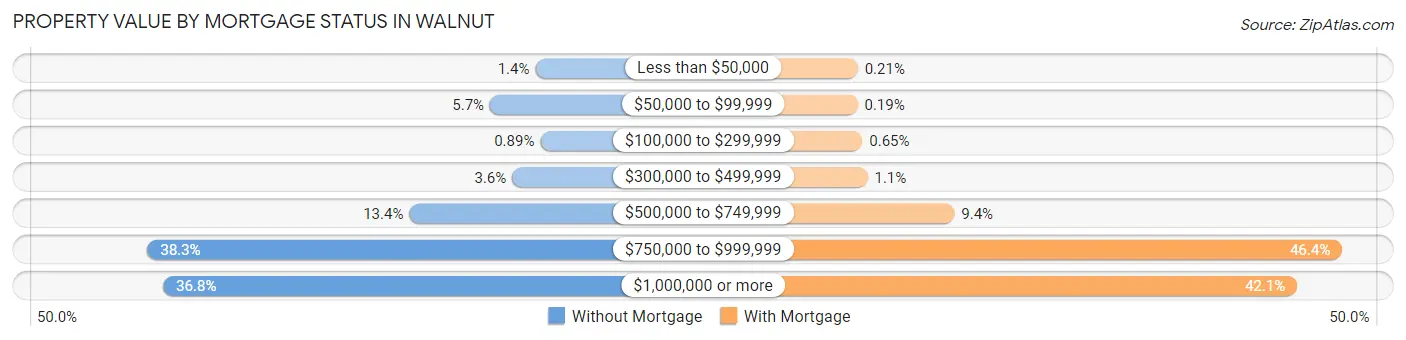
| Property Value | Without Mortgage | With Mortgage |
| Less than $50,000 | 38 (1.4%) | 9 (0.2%) |
| $50,000 to $99,999 | 159 (5.7%) | 8 (0.2%) |
| $100,000 to $299,999 | 25 (0.9%) | 28 (0.6%) |
| $300,000 to $499,999 | 100 (3.6%) | 49 (1.1%) |
| $500,000 to $749,999 | 374 (13.4%) | 406 (9.4%) |
| $750,000 to $999,999 | 1,072 (38.3%) | 1,999 (46.4%) |
| $1,000,000 or more | 1,030 (36.8%) | 1,814 (42.1%) |
| Total | 2,798 (100.0%) | 4,313 (100.0%) |
Household Income by Mortgage Status in Walnut
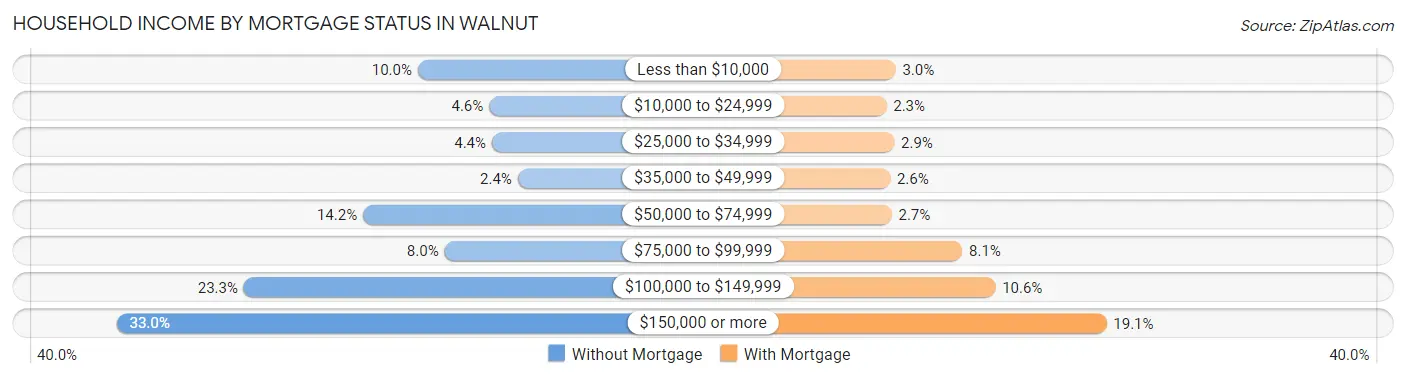
| Household Income | Without Mortgage | With Mortgage |
| Less than $10,000 | 281 (10.0%) | 131 (3.0%) |
| $10,000 to $24,999 | 129 (4.6%) | 101 (2.3%) |
| $25,000 to $34,999 | 123 (4.4%) | 127 (2.9%) |
| $35,000 to $49,999 | 68 (2.4%) | 113 (2.6%) |
| $50,000 to $74,999 | 398 (14.2%) | 118 (2.7%) |
| $75,000 to $99,999 | 224 (8.0%) | 350 (8.1%) |
| $100,000 to $149,999 | 652 (23.3%) | 459 (10.6%) |
| $150,000 or more | 923 (33.0%) | 824 (19.1%) |
| Total | 2,798 (100.0%) | 4,313 (100.0%) |
Property Value to Household Income Ratio in Walnut
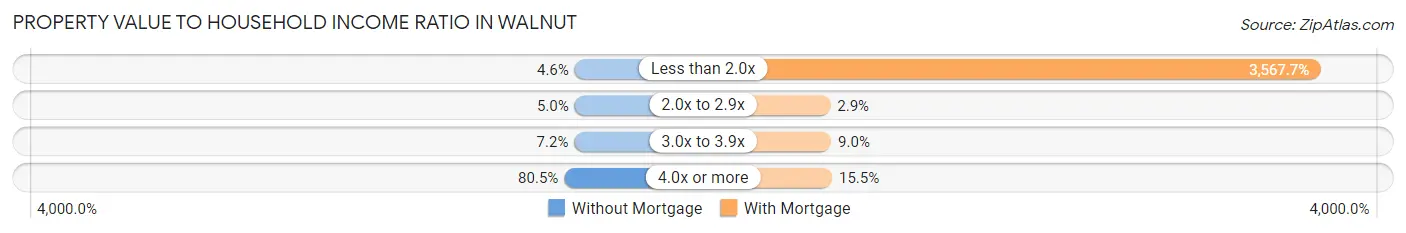
| Value-to-Income Ratio | Without Mortgage | With Mortgage |
| Less than 2.0x | 129 (4.6%) | 153,873 (3,567.7%) |
| 2.0x to 2.9x | 139 (5.0%) | 123 (2.9%) |
| 3.0x to 3.9x | 200 (7.1%) | 386 (8.9%) |
| 4.0x or more | 2,251 (80.4%) | 669 (15.5%) |
| Total | 2,798 (100.0%) | 4,313 (100.0%) |
Real Estate Taxes by Mortgage Status in Walnut
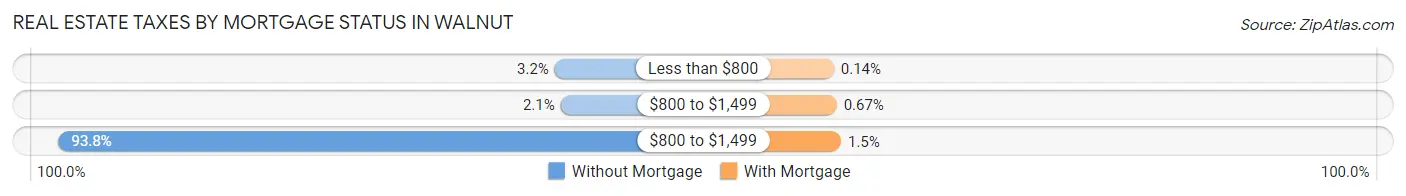
| Property Taxes | Without Mortgage | With Mortgage |
| Less than $800 | 89 (3.2%) | 6 (0.1%) |
| $800 to $1,499 | 59 (2.1%) | 29 (0.7%) |
| $800 to $1,499 | 2,625 (93.8%) | 63 (1.5%) |
| Total | 2,798 (100.0%) | 4,313 (100.0%) |
Health & Disability in Walnut
Health Insurance Coverage by Age in Walnut
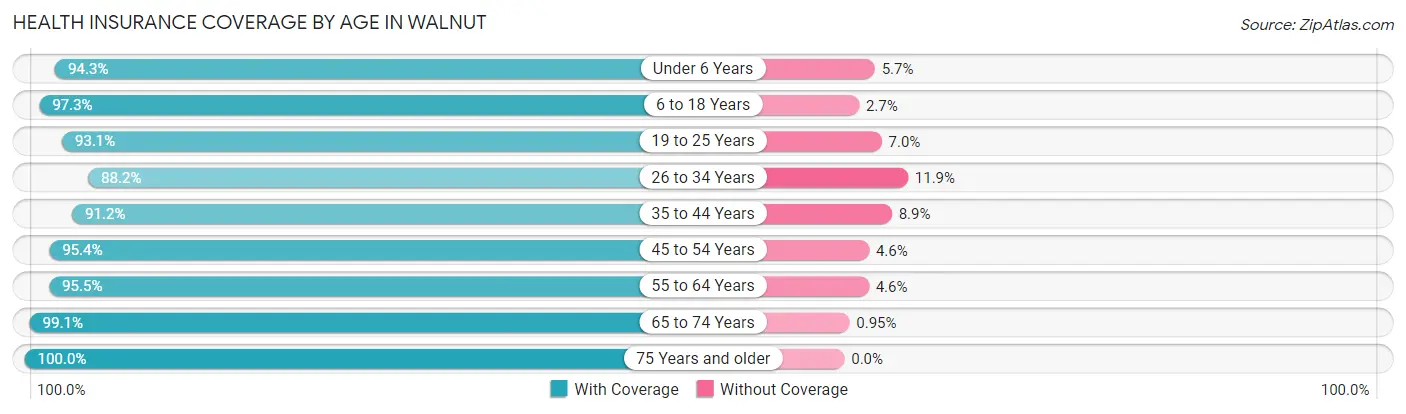
| Age Bracket | With Coverage | Without Coverage |
| Under 6 Years | 1,247 (94.3%) | 75 (5.7%) |
| 6 to 18 Years | 4,128 (97.3%) | 116 (2.7%) |
| 19 to 25 Years | 2,170 (93.0%) | 162 (7.0%) |
| 26 to 34 Years | 2,292 (88.1%) | 308 (11.8%) |
| 35 to 44 Years | 2,832 (91.1%) | 275 (8.8%) |
| 45 to 54 Years | 3,318 (95.4%) | 160 (4.6%) |
| 55 to 64 Years | 4,389 (95.5%) | 209 (4.5%) |
| 65 to 74 Years | 4,289 (99.1%) | 41 (0.9%) |
| 75 Years and older | 2,175 (100.0%) | 0 (0.0%) |
| Total | 26,840 (95.2%) | 1,346 (4.8%) |
Health Insurance Coverage by Citizenship Status in Walnut
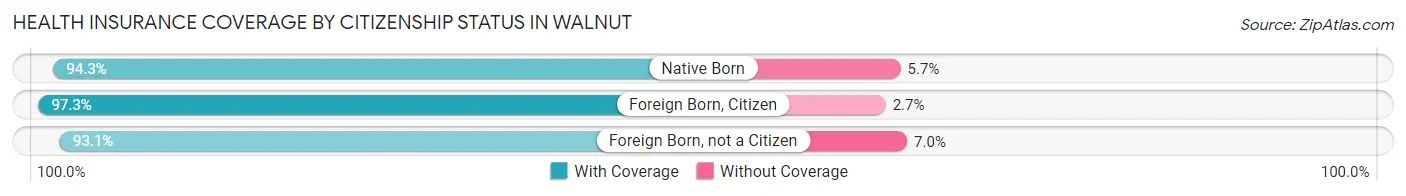
| Citizenship Status | With Coverage | Without Coverage |
| Native Born | 1,247 (94.3%) | 75 (5.7%) |
| Foreign Born, Citizen | 4,128 (97.3%) | 116 (2.7%) |
| Foreign Born, not a Citizen | 2,170 (93.0%) | 162 (7.0%) |
Health Insurance Coverage by Household Income in Walnut
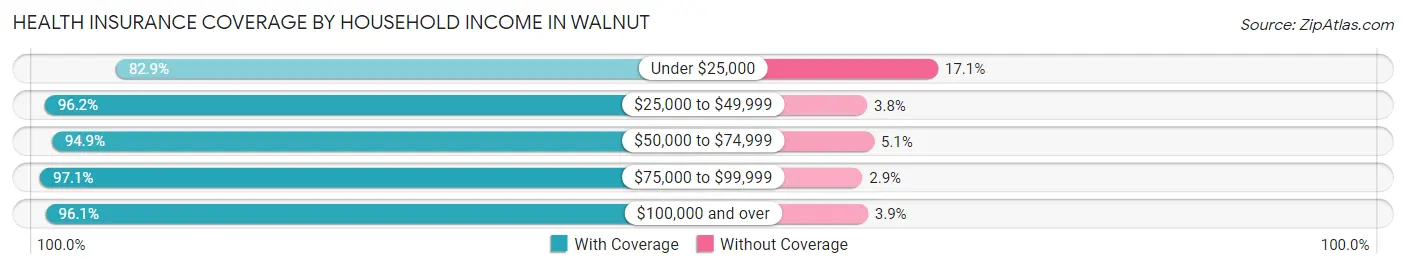
| Household Income | With Coverage | Without Coverage |
| Under $25,000 | 1,514 (82.9%) | 312 (17.1%) |
| $25,000 to $49,999 | 1,568 (96.2%) | 62 (3.8%) |
| $50,000 to $74,999 | 2,679 (94.9%) | 144 (5.1%) |
| $75,000 to $99,999 | 3,133 (97.1%) | 94 (2.9%) |
| $100,000 and over | 17,913 (96.1%) | 734 (3.9%) |
Public vs Private Health Insurance Coverage by Age in Walnut
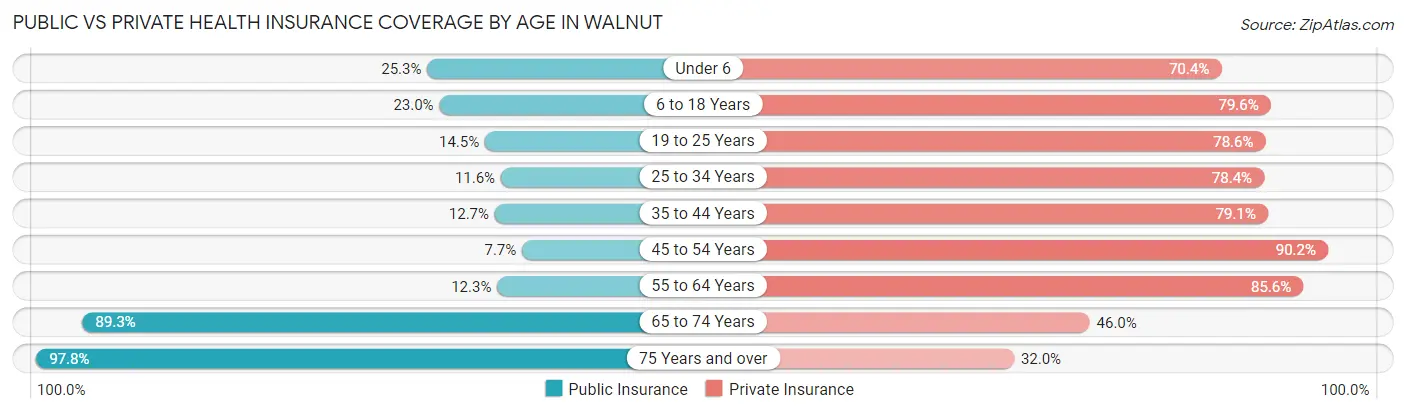
| Age Bracket | Public Insurance | Private Insurance |
| Under 6 | 334 (25.3%) | 931 (70.4%) |
| 6 to 18 Years | 976 (23.0%) | 3,377 (79.6%) |
| 19 to 25 Years | 339 (14.5%) | 1,833 (78.6%) |
| 25 to 34 Years | 301 (11.6%) | 2,037 (78.3%) |
| 35 to 44 Years | 395 (12.7%) | 2,456 (79.0%) |
| 45 to 54 Years | 266 (7.6%) | 3,137 (90.2%) |
| 55 to 64 Years | 564 (12.3%) | 3,937 (85.6%) |
| 65 to 74 Years | 3,865 (89.3%) | 1,992 (46.0%) |
| 75 Years and over | 2,128 (97.8%) | 695 (32.0%) |
| Total | 9,168 (32.5%) | 20,395 (72.4%) |
Disability Status by Sex by Age in Walnut
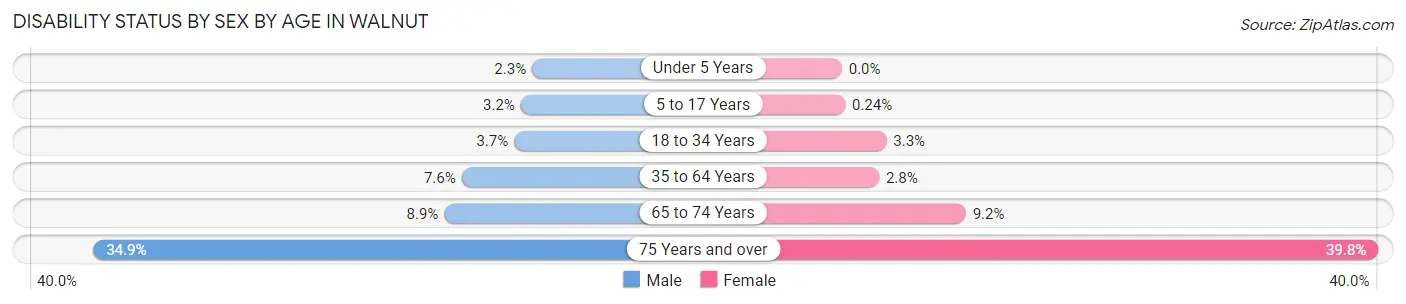
| Age Bracket | Male | Female |
| Under 5 Years | 12 (2.3%) | 0 (0.0%) |
| 5 to 17 Years | 70 (3.2%) | 5 (0.2%) |
| 18 to 34 Years | 108 (3.7%) | 74 (3.3%) |
| 35 to 64 Years | 399 (7.6%) | 163 (2.8%) |
| 65 to 74 Years | 189 (8.8%) | 202 (9.2%) |
| 75 Years and over | 363 (34.9%) | 452 (39.8%) |
Disability Class by Sex by Age in Walnut
Disability Class: Hearing Difficulty
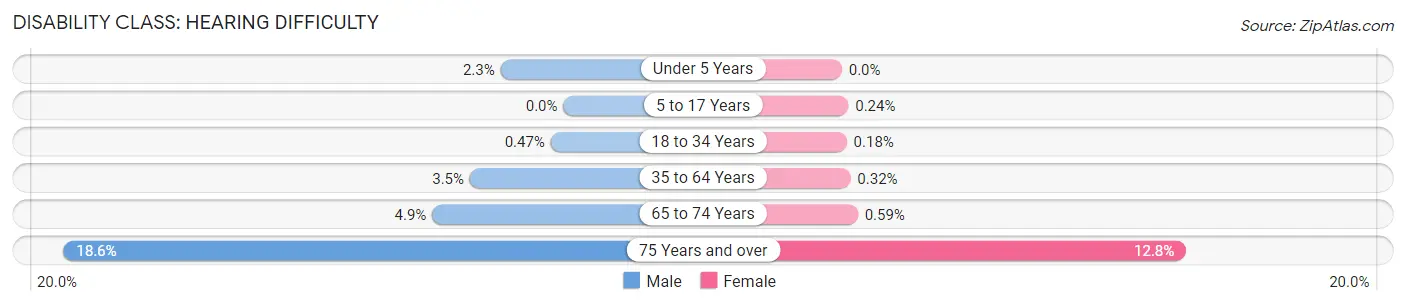
| Age Bracket | Male | Female |
| Under 5 Years | 12 (2.3%) | 0 (0.0%) |
| 5 to 17 Years | 0 (0.0%) | 5 (0.2%) |
| 18 to 34 Years | 14 (0.5%) | 4 (0.2%) |
| 35 to 64 Years | 183 (3.5%) | 19 (0.3%) |
| 65 to 74 Years | 104 (4.9%) | 13 (0.6%) |
| 75 Years and over | 193 (18.6%) | 145 (12.8%) |
Disability Class: Vision Difficulty
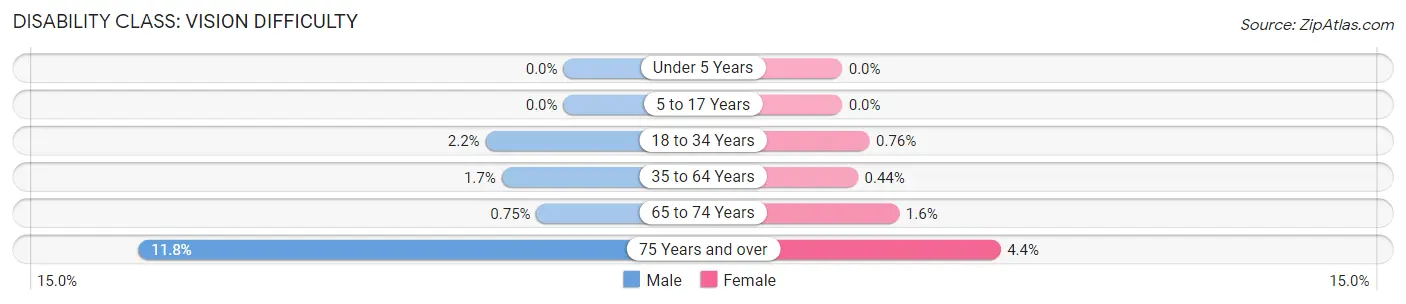
| Age Bracket | Male | Female |
| Under 5 Years | 0 (0.0%) | 0 (0.0%) |
| 5 to 17 Years | 0 (0.0%) | 0 (0.0%) |
| 18 to 34 Years | 64 (2.2%) | 17 (0.8%) |
| 35 to 64 Years | 91 (1.7%) | 26 (0.4%) |
| 65 to 74 Years | 16 (0.7%) | 35 (1.6%) |
| 75 Years and over | 123 (11.8%) | 50 (4.4%) |
Disability Class: Cognitive Difficulty
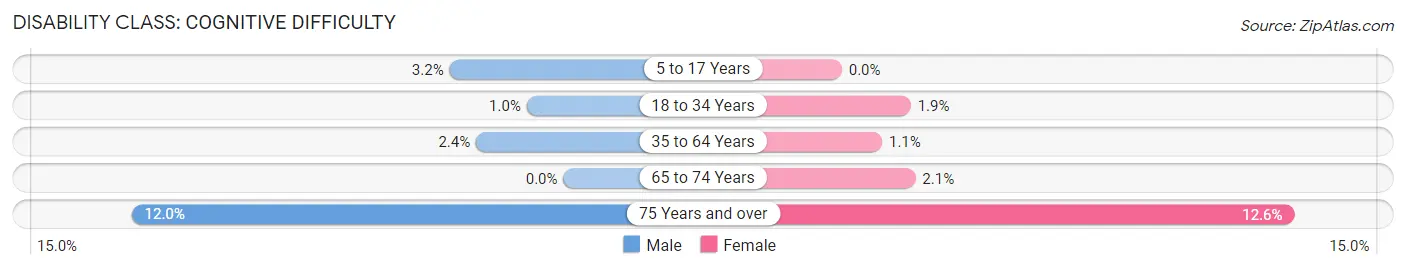
| Age Bracket | Male | Female |
| 5 to 17 Years | 70 (3.2%) | 0 (0.0%) |
| 18 to 34 Years | 30 (1.0%) | 43 (1.9%) |
| 35 to 64 Years | 128 (2.4%) | 66 (1.1%) |
| 65 to 74 Years | 0 (0.0%) | 45 (2.1%) |
| 75 Years and over | 125 (12.0%) | 143 (12.6%) |
Disability Class: Ambulatory Difficulty
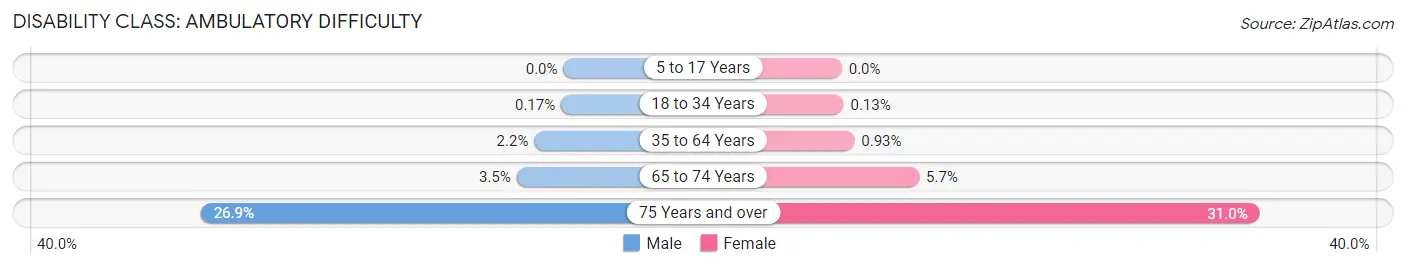
| Age Bracket | Male | Female |
| 5 to 17 Years | 0 (0.0%) | 0 (0.0%) |
| 18 to 34 Years | 5 (0.2%) | 3 (0.1%) |
| 35 to 64 Years | 114 (2.2%) | 55 (0.9%) |
| 65 to 74 Years | 74 (3.5%) | 126 (5.7%) |
| 75 Years and over | 280 (26.9%) | 352 (31.0%) |
Disability Class: Self-Care Difficulty
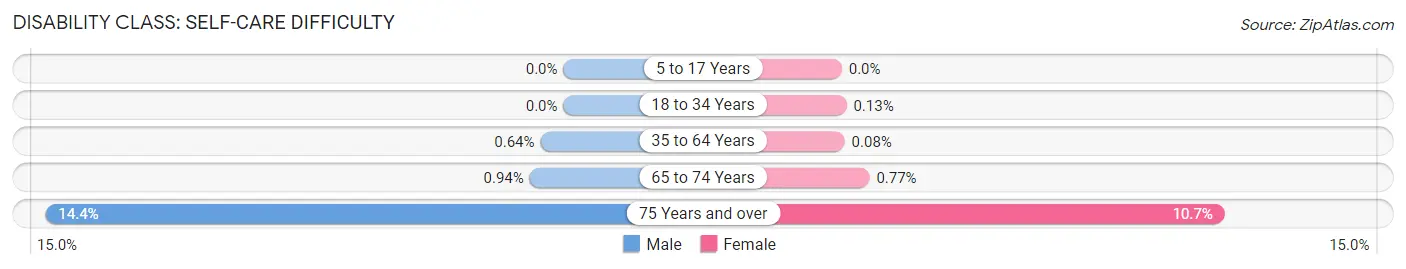
| Age Bracket | Male | Female |
| 5 to 17 Years | 0 (0.0%) | 0 (0.0%) |
| 18 to 34 Years | 0 (0.0%) | 3 (0.1%) |
| 35 to 64 Years | 34 (0.6%) | 5 (0.1%) |
| 65 to 74 Years | 20 (0.9%) | 17 (0.8%) |
| 75 Years and over | 150 (14.4%) | 121 (10.7%) |
Technology Access in Walnut
Computing Device Access in Walnut
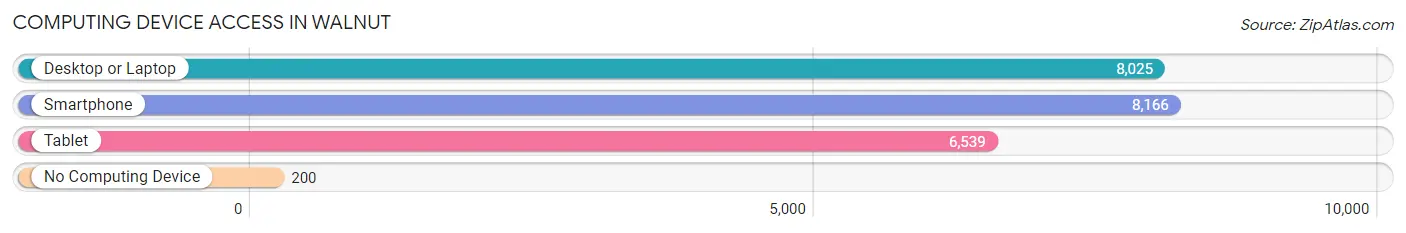
| Device Type | # Households | % Households |
| Desktop or Laptop | 8,025 | 93.1% |
| Smartphone | 8,166 | 94.8% |
| Tablet | 6,539 | 75.9% |
| No Computing Device | 200 | 2.3% |
| Total | 8,616 | 100.0% |
Internet Access in Walnut
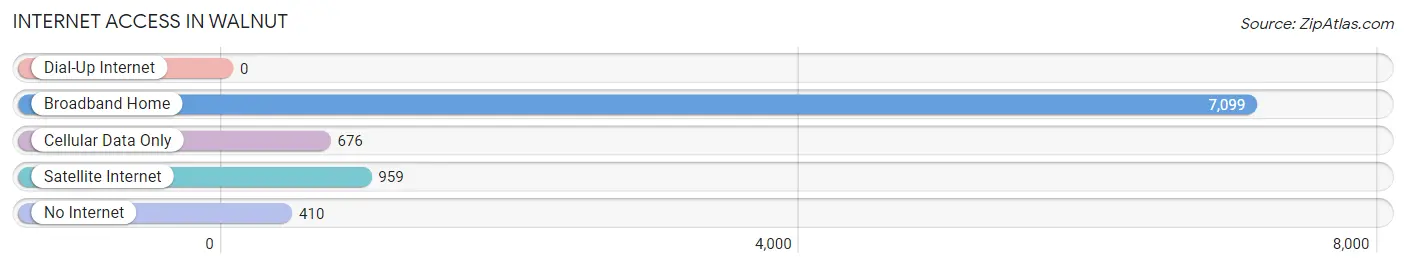
| Internet Type | # Households | % Households |
| Dial-Up Internet | 0 | 0.0% |
| Broadband Home | 7,099 | 82.4% |
| Cellular Data Only | 676 | 7.9% |
| Satellite Internet | 959 | 11.1% |
| No Internet | 410 | 4.8% |
| Total | 8,616 | 100.0% |
Walnut Summary
Walnut, California is a city located in the eastern part of Los Angeles County, California. It is situated in the San Gabriel Valley, approximately 30 miles east of downtown Los Angeles. The city is bordered by the cities of Diamond Bar to the north, Pomona to the east, West Covina to the south, and La Puente to the west. The population of Walnut was estimated to be 30,004 in 2019.
History
The area that is now Walnut was originally inhabited by the Tongva people, who were later displaced by Spanish settlers in the late 18th century. The area was part of the Rancho Los Nogales land grant, which was granted to Ygnacio Palomares and Ricardo Vejar in 1837. The land was used for cattle grazing and farming.
In the late 19th century, the area was subdivided and sold to settlers, who began to cultivate walnut and citrus groves. The city was officially incorporated in 1959, and the name was chosen to reflect the area’s agricultural history.
Geography
Walnut is located in the eastern part of Los Angeles County, California. It is situated in the San Gabriel Valley, approximately 30 miles east of downtown Los Angeles. The city is bordered by the cities of Diamond Bar to the north, Pomona to the east, West Covina to the south, and La Puente to the west.
The city has a total area of 5.7 square miles, of which 5.6 square miles is land and 0.1 square miles is water. The city is located at an elevation of 545 feet above sea level.
Economy
The economy of Walnut is largely based on the service industry, with many residents employed in retail, healthcare, and education. The city is also home to several corporate headquarters, including the headquarters of 99 Cents Only Stores, which is located in the city’s business park.
The city is also home to several shopping centers, including the Walnut Plaza Shopping Center, which is anchored by a Walmart Supercenter. The city also has several restaurants, including the popular Chinese restaurant, Golden Dragon.
Demographics
As of the 2019 census, the population of Walnut was estimated to be 30,004. The racial makeup of the city was 57.2% White, 1.3% African American, 0.4% Native American, 25.2% Asian, 0.1% Pacific Islander, 11.2% from other races, and 4.6% from two or more races. Hispanic or Latino of any race were 24.3% of the population.
The median household income in Walnut was $87,845 in 2019, and the median home value was $717,400. The city has a high rate of homeownership, with 73.3% of residents owning their homes.
Conclusion
Walnut, California is a city located in the eastern part of Los Angeles County, California. It is situated in the San Gabriel Valley, approximately 30 miles east of downtown Los Angeles. The city is bordered by the cities of Diamond Bar to the north, Pomona to the east, West Covina to the south, and La Puente to the west. The population of Walnut was estimated to be 30,004 in 2019. The economy of Walnut is largely based on the service industry, with many residents employed in retail, healthcare, and education. The racial makeup of the city was 57.2% White, 1.3% African American, 0.4% Native American, 25.2% Asian, 0.1% Pacific Islander, 11.2% from other races, and 4.6% from two or more races. The median household income in Walnut was $87,845 in 2019, and the median home value was $717,400.
Common Questions
What is Per Capita Income in Walnut?
Per Capita income in Walnut is $50,712.
What is the Median Family Income in Walnut?
Median Family Income in Walnut is $138,661.
What is the Median Household income in Walnut?
Median Household Income in Walnut is $130,444.
What is Income or Wage Gap in Walnut?
Income or Wage Gap in Walnut is 9.3%.
Women in Walnut earn 90.7 cents for every dollar earned by a man.
What is Family Income Deficit in Walnut?
Family Income Deficit in Walnut is $12,842.
Families that are below poverty line in Walnut earn $12,842 less on average than the poverty threshold level.
What is Inequality or Gini Index in Walnut?
Inequality or Gini Index in Walnut is 0.44.
What is the Total Population of Walnut?
Total Population of Walnut is 28,212.
What is the Total Male Population of Walnut?
Total Male Population of Walnut is 14,148.
What is the Total Female Population of Walnut?
Total Female Population of Walnut is 14,064.
What is the Ratio of Males per 100 Females in Walnut?
There are 100.60 Males per 100 Females in Walnut.
What is the Ratio of Females per 100 Males in Walnut?
There are 99.41 Females per 100 Males in Walnut.
What is the Median Population Age in Walnut?
Median Population Age in Walnut is 46.5 Years.
What is the Average Family Size in Walnut
Average Family Size in Walnut is 3.5 People.
What is the Average Household Size in Walnut
Average Household Size in Walnut is 3.3 People.
How Large is the Labor Force in Walnut?
There are 14,027 People in the Labor Forcein in Walnut.
What is the Percentage of People in the Labor Force in Walnut?
59.6% of People are in the Labor Force in Walnut.
What is the Unemployment Rate in Walnut?
Unemployment Rate in Walnut is 4.2%.