Ruskin, FL Map & Demographics
Ruskin Map
Ruskin Overview
$28,055
PER CAPITA INCOME
$80,114
AVG FAMILY INCOME
$73,828
AVG HOUSEHOLD INCOME
22.2%
WAGE / INCOME GAP [ % ]
77.8¢/ $1
WAGE / INCOME GAP [ $ ]
$10,016
FAMILY INCOME DEFICIT
0.39
INEQUALITY / GINI INDEX
28,878
TOTAL POPULATION
14,689
MALE POPULATION
14,189
FEMALE POPULATION
103.52
MALES / 100 FEMALES
96.60
FEMALES / 100 MALES
32.9
MEDIAN AGE
3.6
AVG FAMILY SIZE
3.2
AVG HOUSEHOLD SIZE
14,406
LABOR FORCE [ PEOPLE ]
66.7%
PERCENT IN LABOR FORCE
5.3%
UNEMPLOYMENT RATE
Ruskin Zip Codes
Ruskin Area Codes
Income in Ruskin
Income Overview in Ruskin
Per Capita Income in Ruskin is $28,055, while median incomes of families and households are $80,114 and $73,828 respectively.
| Characteristic | Number | Measure |
| Per Capita Income | 28,878 | $28,055 |
| Median Family Income | 7,138 | $80,114 |
| Mean Family Income | 7,138 | $89,548 |
| Median Household Income | 9,008 | $73,828 |
| Mean Household Income | 9,008 | $86,063 |
| Income Deficit | 7,138 | $10,016 |
| Wage / Income Gap (%) | 28,878 | 22.24% |
| Wage / Income Gap ($) | 28,878 | 77.76¢ per $1 |
| Gini / Inequality Index | 28,878 | 0.39 |
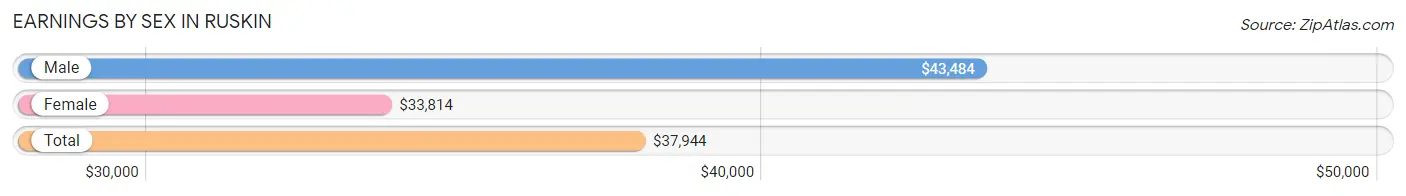
Earnings by Sex in Ruskin
Average Earnings in Ruskin are $37,944, $43,484 for men and $33,814 for women, a difference of 22.2%.
| Sex | Number | Average Earnings |
| Male | 7,453 (51.2%) | $43,484 |
| Female | 7,113 (48.8%) | $33,814 |
| Total | 14,566 (100.0%) | $37,944 |
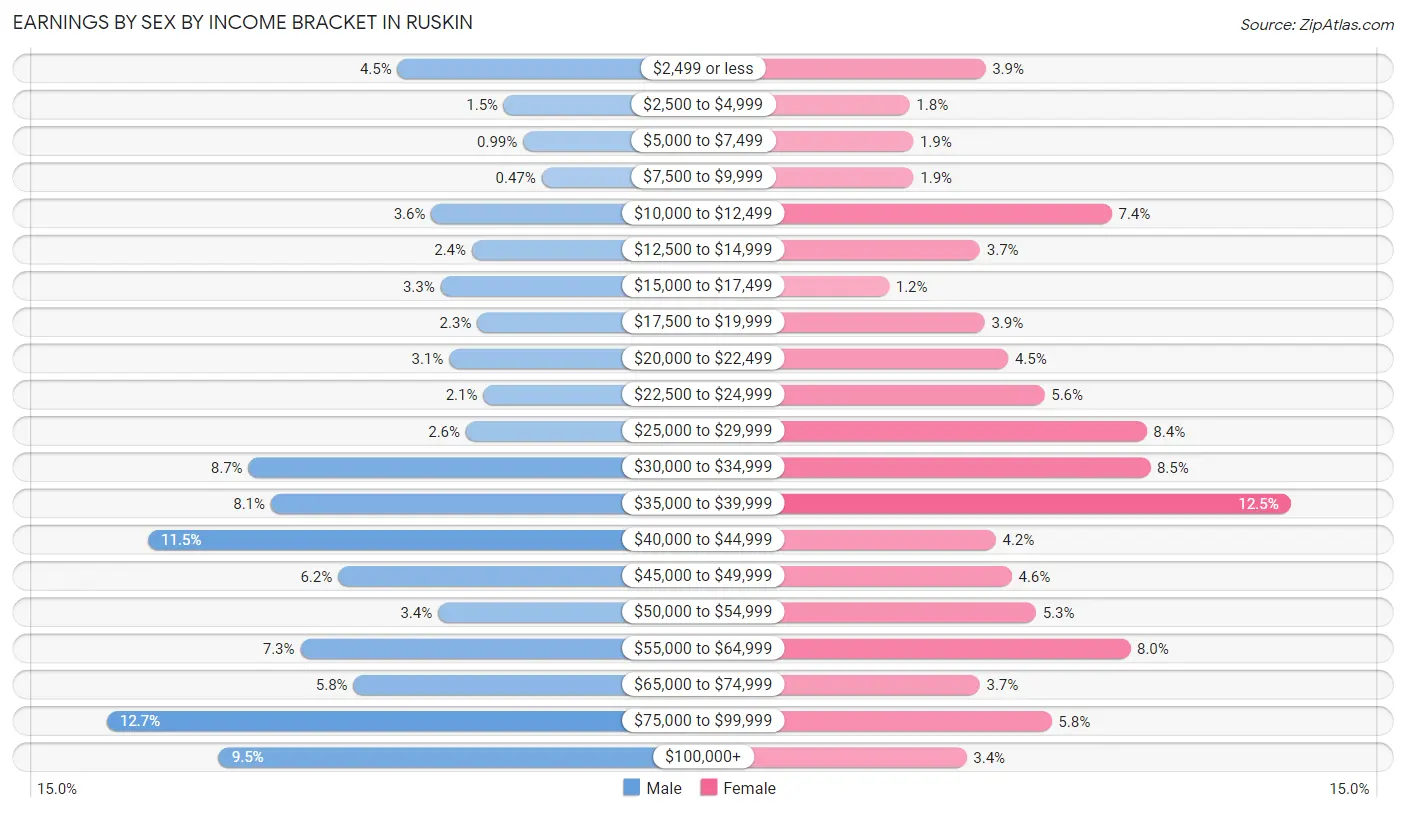
Earnings by Sex by Income Bracket in Ruskin
The most common earnings brackets in Ruskin are $75,000 to $99,999 for men (946 | 12.7%) and $35,000 to $39,999 for women (887 | 12.5%).
| Income | Male | Female |
| $2,499 or less | 337 (4.5%) | 277 (3.9%) |
| $2,500 to $4,999 | 114 (1.5%) | 125 (1.8%) |
| $5,000 to $7,499 | 74 (1.0%) | 132 (1.9%) |
| $7,500 to $9,999 | 35 (0.5%) | 133 (1.9%) |
| $10,000 to $12,499 | 266 (3.6%) | 529 (7.4%) |
| $12,500 to $14,999 | 181 (2.4%) | 266 (3.7%) |
| $15,000 to $17,499 | 247 (3.3%) | 84 (1.2%) |
| $17,500 to $19,999 | 170 (2.3%) | 275 (3.9%) |
| $20,000 to $22,499 | 229 (3.1%) | 322 (4.5%) |
| $22,500 to $24,999 | 157 (2.1%) | 395 (5.6%) |
| $25,000 to $29,999 | 194 (2.6%) | 599 (8.4%) |
| $30,000 to $34,999 | 649 (8.7%) | 606 (8.5%) |
| $35,000 to $39,999 | 602 (8.1%) | 887 (12.5%) |
| $40,000 to $44,999 | 859 (11.5%) | 297 (4.2%) |
| $45,000 to $49,999 | 461 (6.2%) | 329 (4.6%) |
| $50,000 to $54,999 | 252 (3.4%) | 378 (5.3%) |
| $55,000 to $64,999 | 540 (7.2%) | 566 (8.0%) |
| $65,000 to $74,999 | 429 (5.8%) | 265 (3.7%) |
| $75,000 to $99,999 | 946 (12.7%) | 409 (5.8%) |
| $100,000+ | 711 (9.5%) | 239 (3.4%) |
| Total | 7,453 (100.0%) | 7,113 (100.0%) |
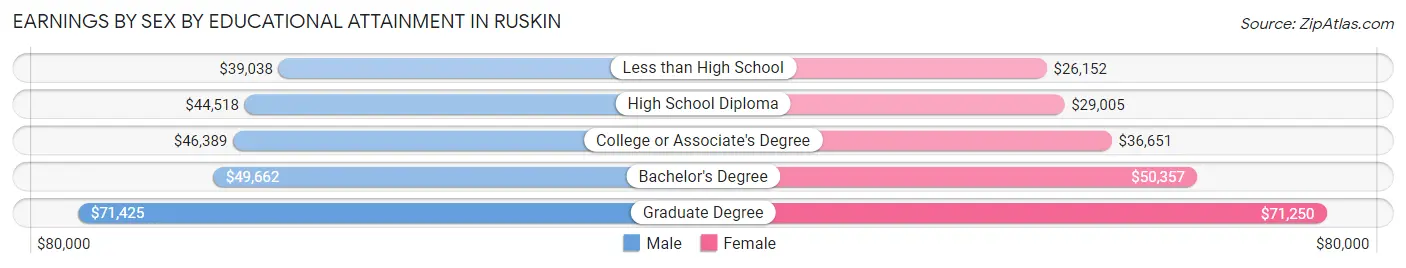
Earnings by Sex by Educational Attainment in Ruskin
Average earnings in Ruskin are $45,700 for men and $36,287 for women, a difference of 20.6%. Men with an educational attainment of graduate degree enjoy the highest average annual earnings of $71,425, while those with less than high school education earn the least with $39,038. Women with an educational attainment of graduate degree earn the most with the average annual earnings of $71,250, while those with less than high school education have the smallest earnings of $26,152.
| Educational Attainment | Male Income | Female Income |
| Less than High School | $39,038 | $26,152 |
| High School Diploma | $44,518 | $29,005 |
| College or Associate's Degree | $46,389 | $36,651 |
| Bachelor's Degree | $49,662 | $50,357 |
| Graduate Degree | $71,425 | $71,250 |
| Total | $45,700 | $36,287 |
Family Income in Ruskin
Family Income Brackets in Ruskin
According to the Ruskin family income data, there are 1,656 families falling into the $100,000 to $149,999 income range, which is the most common income bracket and makes up 23.2% of all families. Conversely, the $10,000 to $14,999 income bracket is the least frequent group with only 157 families (2.2%) belonging to this category.
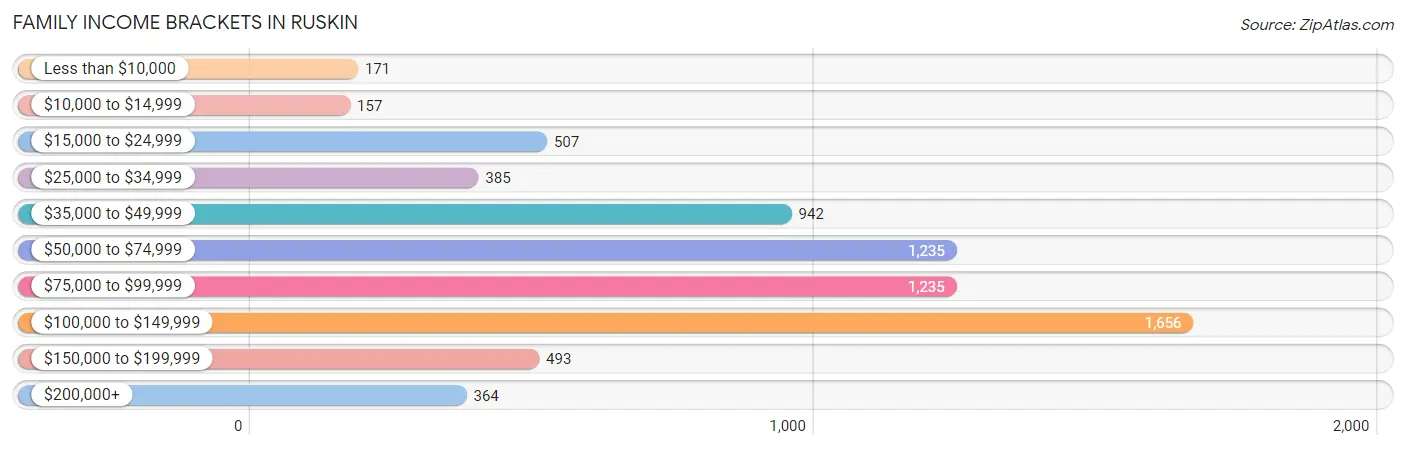
| Income Bracket | # Families | % Families |
| Less than $10,000 | 171 | 2.4% |
| $10,000 to $14,999 | 157 | 2.2% |
| $15,000 to $24,999 | 507 | 7.1% |
| $25,000 to $34,999 | 385 | 5.4% |
| $35,000 to $49,999 | 942 | 13.2% |
| $50,000 to $74,999 | 1,235 | 17.3% |
| $75,000 to $99,999 | 1,235 | 17.3% |
| $100,000 to $149,999 | 1,656 | 23.2% |
| $150,000 to $199,999 | 493 | 6.9% |
| $200,000+ | 364 | 5.1% |
Family Income by Famaliy Size in Ruskin
7+ person families (254 | 3.6%) account for the highest median family income in Ruskin with $153,726 per family, while 2-person families (2,812 | 39.4%) have the highest median income of $39,508 per family member.
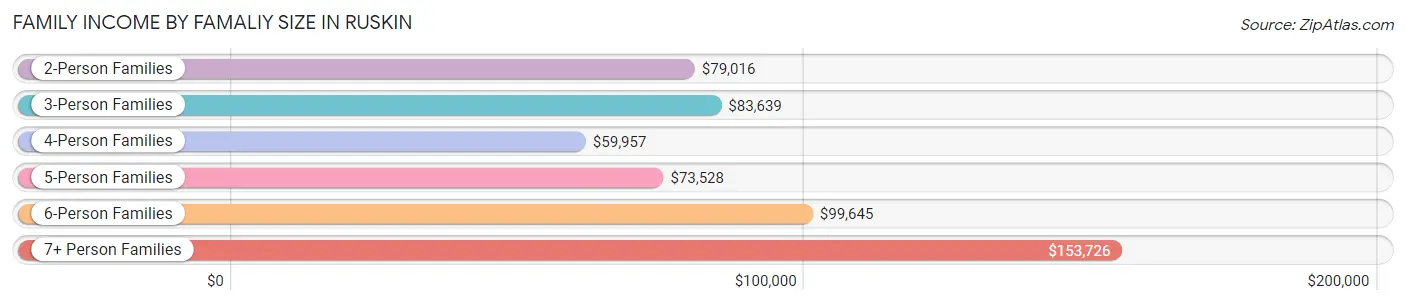
| Income Bracket | # Families | Median Income |
| 2-Person Families | 2,812 (39.4%) | $79,016 |
| 3-Person Families | 1,547 (21.7%) | $83,639 |
| 4-Person Families | 1,396 (19.6%) | $59,957 |
| 5-Person Families | 856 (12.0%) | $73,528 |
| 6-Person Families | 273 (3.8%) | $99,645 |
| 7+ Person Families | 254 (3.6%) | $153,726 |
| Total | 7,138 (100.0%) | $80,114 |
Family Income by Number of Earners in Ruskin
The median family income in Ruskin is $80,114, with families comprising 3+ earners (940) having the highest median family income of $116,042, while families with no earners (675) have the lowest median family income of $42,321, accounting for 13.2% and 9.5% of families, respectively.
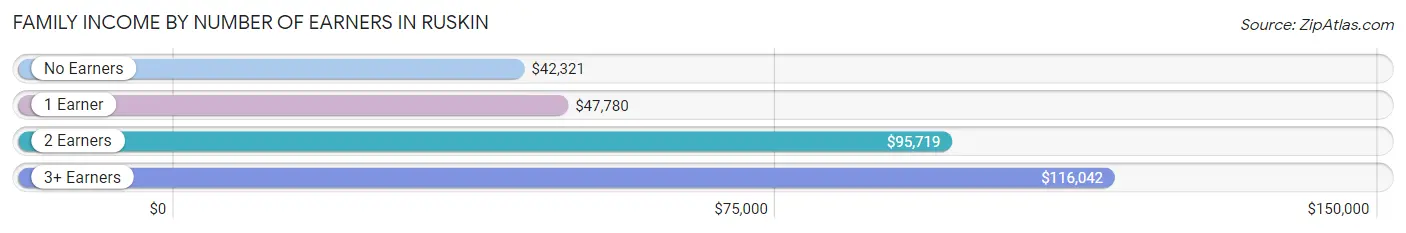
| Number of Earners | # Families | Median Income |
| No Earners | 675 (9.5%) | $42,321 |
| 1 Earner | 2,526 (35.4%) | $47,780 |
| 2 Earners | 2,997 (42.0%) | $95,719 |
| 3+ Earners | 940 (13.2%) | $116,042 |
| Total | 7,138 (100.0%) | $80,114 |
Household Income in Ruskin
Household Income Brackets in Ruskin
With 2,054 households falling in the category, the $100,000 to $149,999 income range is the most frequent in Ruskin, accounting for 22.8% of all households. In contrast, only 207 households (2.3%) fall into the $10,000 to $14,999 income bracket, making it the least populous group.
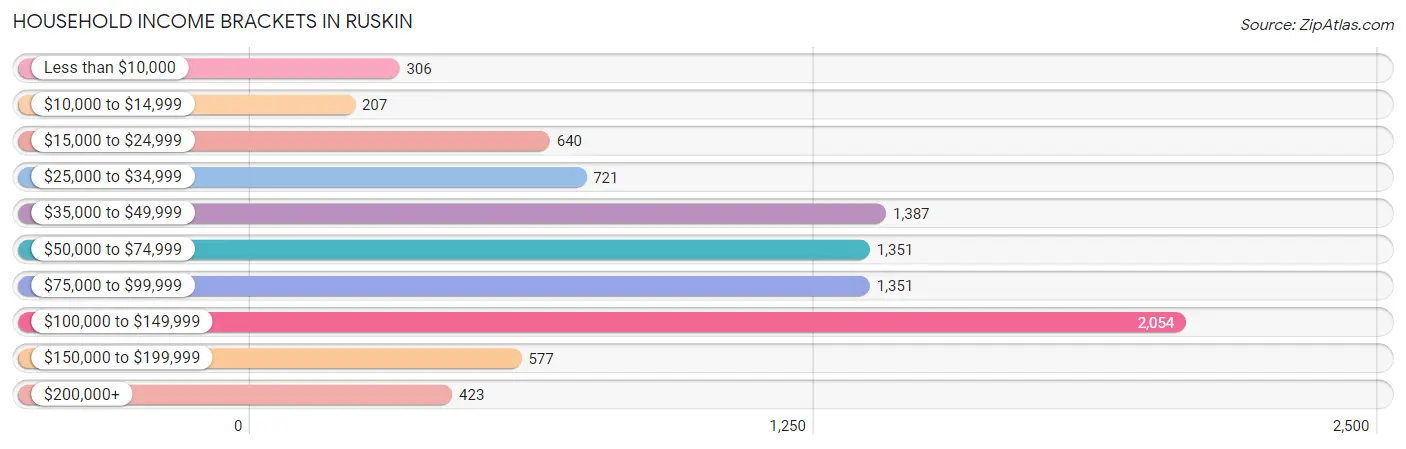
| Income Bracket | # Households | % Households |
| Less than $10,000 | 306 | 3.4% |
| $10,000 to $14,999 | 207 | 2.3% |
| $15,000 to $24,999 | 640 | 7.1% |
| $25,000 to $34,999 | 721 | 8.0% |
| $35,000 to $49,999 | 1,387 | 15.4% |
| $50,000 to $74,999 | 1,351 | 15.0% |
| $75,000 to $99,999 | 1,351 | 15.0% |
| $100,000 to $149,999 | 2,054 | 22.8% |
| $150,000 to $199,999 | 577 | 6.4% |
| $200,000+ | 423 | 4.7% |
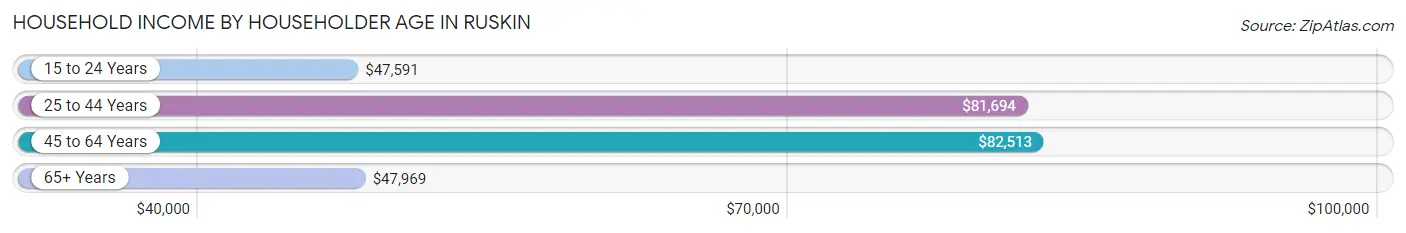
Household Income by Householder Age in Ruskin
The median household income in Ruskin is $73,828, with the highest median household income of $82,513 found in the 45 to 64 years age bracket for the primary householder. A total of 3,409 households (37.8%) fall into this category. Meanwhile, the 15 to 24 years age bracket for the primary householder has the lowest median household income of $47,591, with 257 households (2.9%) in this group.
| Income Bracket | # Households | Median Income |
| 15 to 24 Years | 257 (2.9%) | $47,591 |
| 25 to 44 Years | 3,532 (39.2%) | $81,694 |
| 45 to 64 Years | 3,409 (37.8%) | $82,513 |
| 65+ Years | 1,810 (20.1%) | $47,969 |
| Total | 9,008 (100.0%) | $73,828 |
Poverty in Ruskin
Income Below Poverty by Sex and Age in Ruskin
With 13.3% poverty level for males and 14.9% for females among the residents of Ruskin, 75 year old and over males and 5 year old females are the most vulnerable to poverty, with 207 males (33.0%) and 101 females (41.7%) in their respective age groups living below the poverty level.
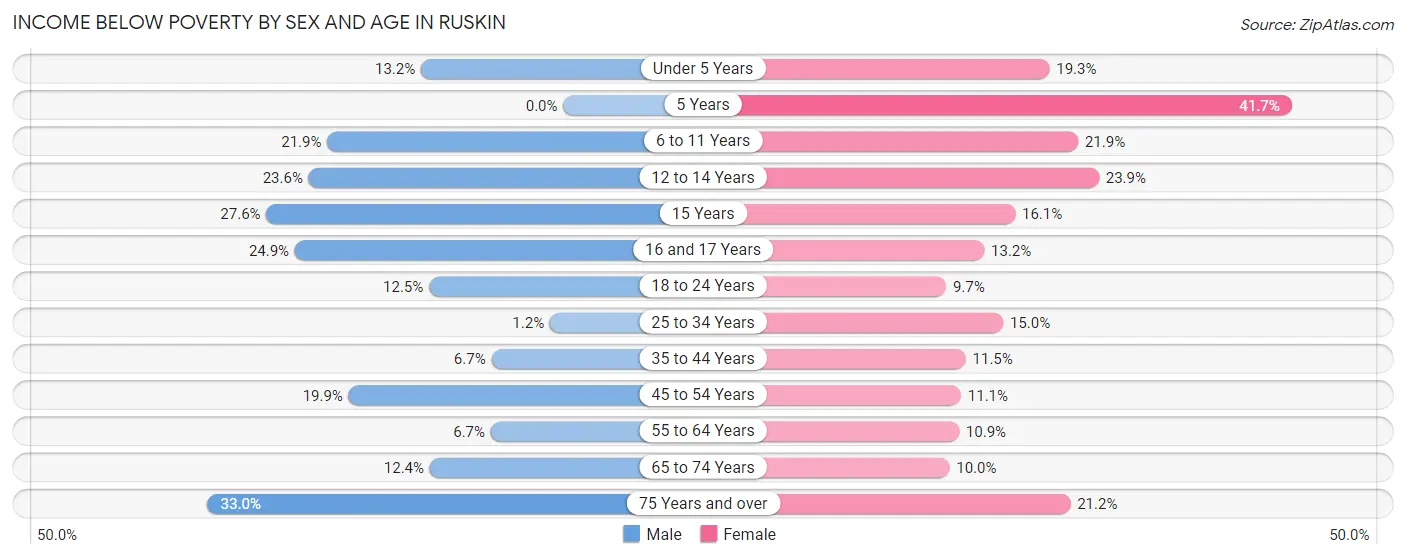
| Age Bracket | Male | Female |
| Under 5 Years | 133 (13.2%) | 193 (19.3%) |
| 5 Years | 0 (0.0%) | 101 (41.7%) |
| 6 to 11 Years | 257 (21.9%) | 334 (21.9%) |
| 12 to 14 Years | 251 (23.6%) | 150 (23.8%) |
| 15 Years | 62 (27.6%) | 23 (16.1%) |
| 16 and 17 Years | 133 (24.9%) | 65 (13.2%) |
| 18 to 24 Years | 183 (12.5%) | 118 (9.7%) |
| 25 to 34 Years | 24 (1.2%) | 349 (15.0%) |
| 35 to 44 Years | 148 (6.7%) | 230 (11.5%) |
| 45 to 54 Years | 318 (19.9%) | 183 (11.1%) |
| 55 to 64 Years | 99 (6.7%) | 163 (10.9%) |
| 65 to 74 Years | 139 (12.4%) | 93 (10.0%) |
| 75 Years and over | 207 (33.0%) | 106 (21.2%) |
| Total | 1,954 (13.3%) | 2,108 (14.9%) |
Income Above Poverty by Sex and Age in Ruskin
According to the poverty statistics in Ruskin, males aged 5 years and females aged 18 to 24 years are the age groups that are most secure financially, with 100.0% of males and 90.3% of females in these age groups living above the poverty line.
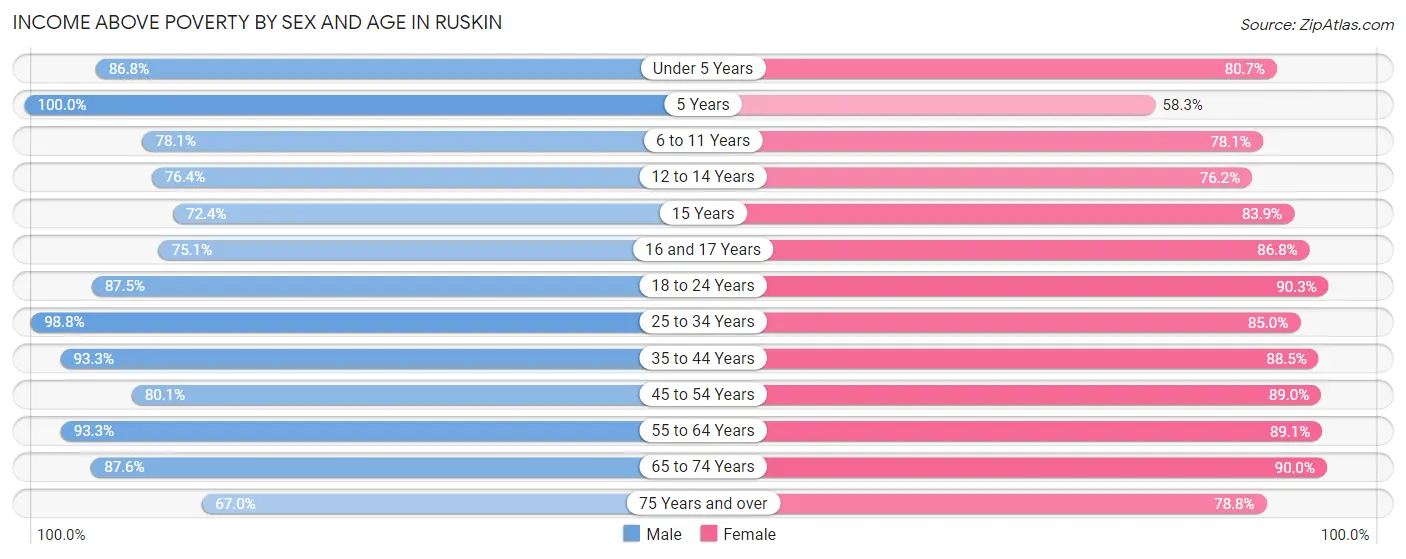
| Age Bracket | Male | Female |
| Under 5 Years | 874 (86.8%) | 809 (80.7%) |
| 5 Years | 251 (100.0%) | 141 (58.3%) |
| 6 to 11 Years | 916 (78.1%) | 1,190 (78.1%) |
| 12 to 14 Years | 811 (76.4%) | 479 (76.1%) |
| 15 Years | 163 (72.4%) | 120 (83.9%) |
| 16 and 17 Years | 401 (75.1%) | 427 (86.8%) |
| 18 to 24 Years | 1,286 (87.5%) | 1,102 (90.3%) |
| 25 to 34 Years | 1,904 (98.8%) | 1,984 (85.0%) |
| 35 to 44 Years | 2,071 (93.3%) | 1,771 (88.5%) |
| 45 to 54 Years | 1,278 (80.1%) | 1,473 (88.9%) |
| 55 to 64 Years | 1,371 (93.3%) | 1,336 (89.1%) |
| 65 to 74 Years | 983 (87.6%) | 839 (90.0%) |
| 75 Years and over | 420 (67.0%) | 394 (78.8%) |
| Total | 12,729 (86.7%) | 12,065 (85.1%) |
Income Below Poverty Among Married-Couple Families in Ruskin
The poverty statistics for married-couple families in Ruskin show that 8.3% or 387 of the total 4,650 families live below the poverty line. Families with 5 or more children have the highest poverty rate of 18.6%, comprising of 18 families. On the other hand, families with 3 or 4 children have the lowest poverty rate of 0.0%, which includes 0 families.
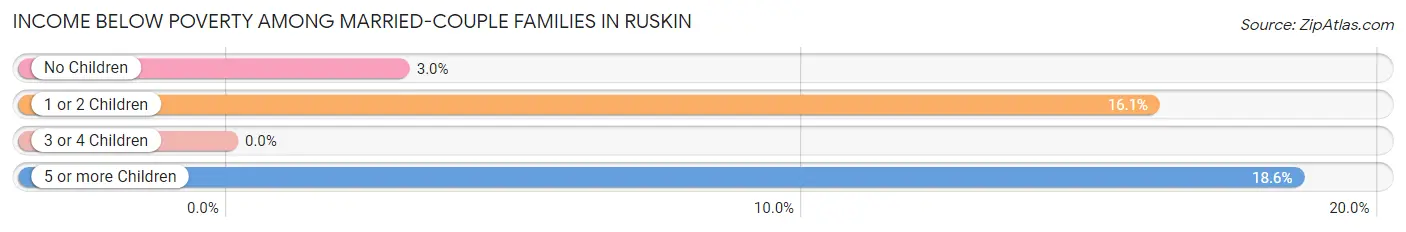
| Children | Above Poverty | Below Poverty |
| No Children | 2,269 (97.0%) | 70 (3.0%) |
| 1 or 2 Children | 1,564 (84.0%) | 299 (16.1%) |
| 3 or 4 Children | 351 (100.0%) | 0 (0.0%) |
| 5 or more Children | 79 (81.4%) | 18 (18.6%) |
| Total | 4,263 (91.7%) | 387 (8.3%) |
Income Below Poverty Among Single-Parent Households in Ruskin
According to the poverty data in Ruskin, 12.8% or 117 single-father households and 26.3% or 414 single-mother households are living below the poverty line. Among single-father households, those with 3 or 4 children have the highest poverty rate, with 37 households (100.0%) experiencing poverty. Likewise, among single-mother households, those with 5 or more children have the highest poverty rate, with 55 households (93.2%) falling below the poverty line.
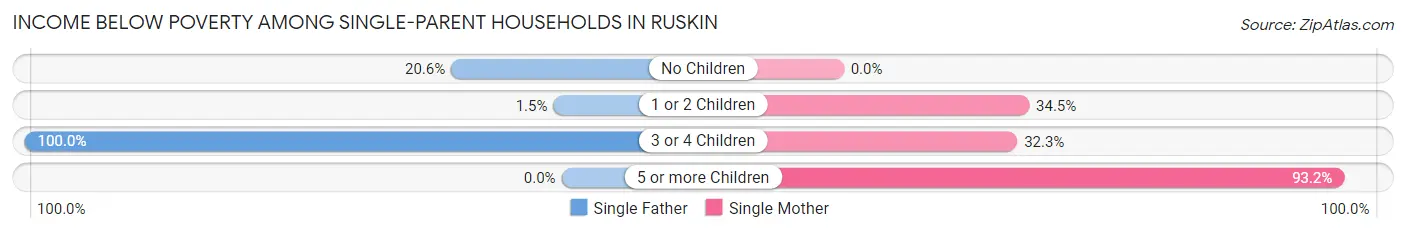
| Children | Single Father | Single Mother |
| No Children | 72 (20.6%) | 0 (0.0%) |
| 1 or 2 Children | 8 (1.5%) | 200 (34.5%) |
| 3 or 4 Children | 37 (100.0%) | 159 (32.3%) |
| 5 or more Children | 0 (0.0%) | 55 (93.2%) |
| Total | 117 (12.8%) | 414 (26.3%) |
Income Below Poverty Among Married-Couple vs Single-Parent Households in Ruskin
The poverty data for Ruskin shows that 387 of the married-couple family households (8.3%) and 531 of the single-parent households (21.3%) are living below the poverty level. Within the married-couple family households, those with 5 or more children have the highest poverty rate, with 18 households (18.6%) falling below the poverty line. Among the single-parent households, those with 5 or more children have the highest poverty rate, with 55 household (93.2%) living below poverty.
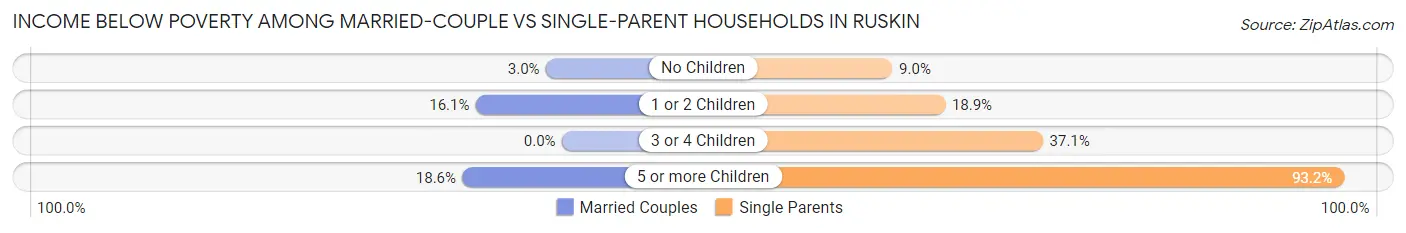
| Children | Married-Couple Families | Single-Parent Households |
| No Children | 70 (3.0%) | 72 (9.0%) |
| 1 or 2 Children | 299 (16.1%) | 208 (18.9%) |
| 3 or 4 Children | 0 (0.0%) | 196 (37.0%) |
| 5 or more Children | 18 (18.6%) | 55 (93.2%) |
| Total | 387 (8.3%) | 531 (21.3%) |
Race in Ruskin
The most populous races in Ruskin are White / Caucasian (14,325 | 49.6%), Hispanic or Latino (9,576 | 33.2%), and Black / African American (7,457 | 25.8%).
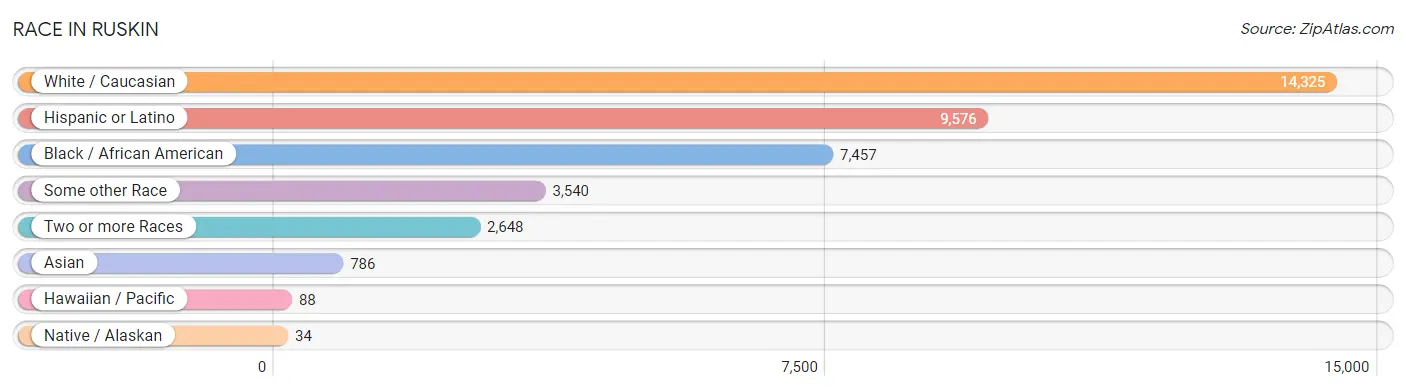
| Race | # Population | % Population |
| Asian | 786 | 2.7% |
| Black / African American | 7,457 | 25.8% |
| Hawaiian / Pacific | 88 | 0.3% |
| Hispanic or Latino | 9,576 | 33.2% |
| Native / Alaskan | 34 | 0.1% |
| White / Caucasian | 14,325 | 49.6% |
| Two or more Races | 2,648 | 9.2% |
| Some other Race | 3,540 | 12.3% |
| Total | 28,878 | 100.0% |
Ancestry in Ruskin
The most populous ancestries reported in Ruskin are Mexican (5,138 | 17.8%), Puerto Rican (1,833 | 6.4%), German (1,437 | 5.0%), American (1,386 | 4.8%), and Irish (1,130 | 3.9%), together accounting for 37.8% of all Ruskin residents.
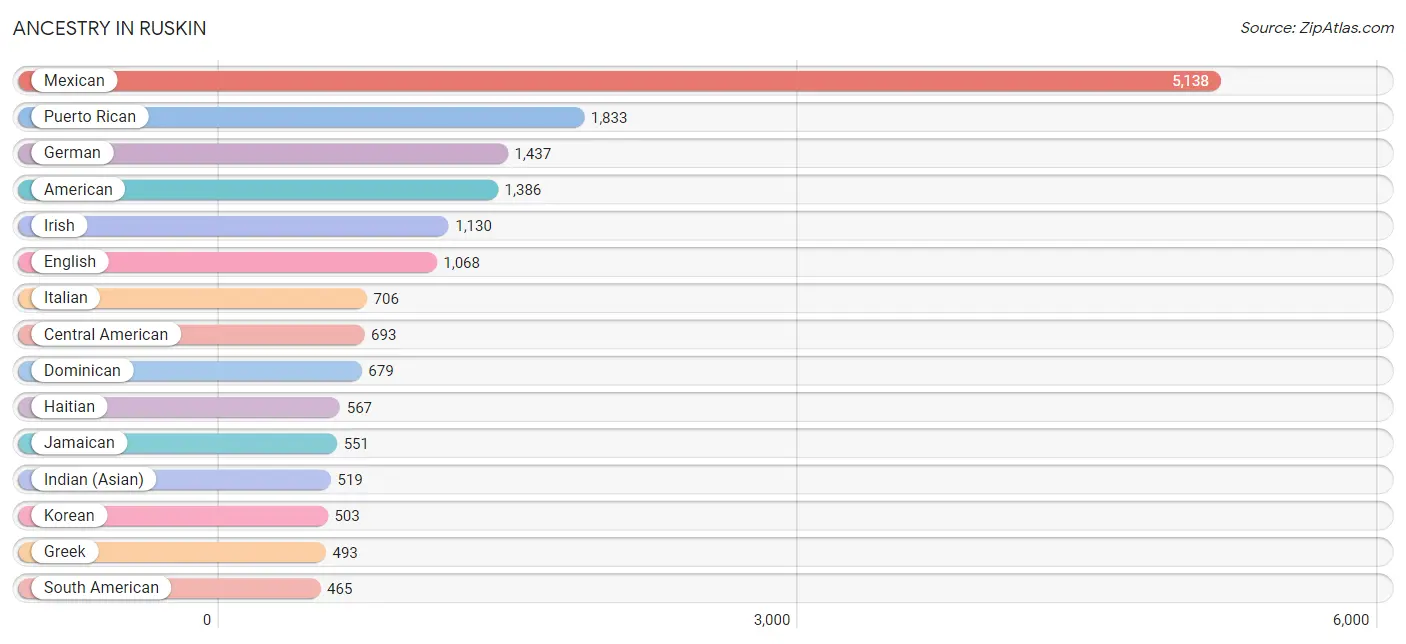
| Ancestry | # Population | % Population |
| African | 51 | 0.2% |
| American | 1,386 | 4.8% |
| Arab | 30 | 0.1% |
| Australian | 14 | 0.1% |
| Austrian | 12 | 0.0% |
| Bahamian | 70 | 0.2% |
| Belgian | 20 | 0.1% |
| Belizean | 248 | 0.9% |
| Bhutanese | 118 | 0.4% |
| Blackfeet | 14 | 0.1% |
| Brazilian | 9 | 0.0% |
| British | 62 | 0.2% |
| British West Indian | 15 | 0.1% |
| Burmese | 369 | 1.3% |
| Canadian | 53 | 0.2% |
| Central American | 693 | 2.4% |
| Central American Indian | 48 | 0.2% |
| Cherokee | 74 | 0.3% |
| Colombian | 221 | 0.8% |
| Cuban | 317 | 1.1% |
| Czech | 69 | 0.2% |
| Czechoslovakian | 65 | 0.2% |
| Danish | 37 | 0.1% |
| Dominican | 679 | 2.4% |
| Dutch | 126 | 0.4% |
| Eastern European | 51 | 0.2% |
| Ecuadorian | 88 | 0.3% |
| English | 1,068 | 3.7% |
| European | 250 | 0.9% |
| French | 131 | 0.4% |
| French Canadian | 90 | 0.3% |
| German | 1,437 | 5.0% |
| Greek | 493 | 1.7% |
| Guamanian / Chamorro | 46 | 0.2% |
| Guatemalan | 343 | 1.2% |
| Guyanese | 15 | 0.1% |
| Haitian | 567 | 2.0% |
| Honduran | 185 | 0.6% |
| Hungarian | 18 | 0.1% |
| Indian (Asian) | 519 | 1.8% |
| Irish | 1,130 | 3.9% |
| Italian | 706 | 2.4% |
| Jamaican | 551 | 1.9% |
| Korean | 503 | 1.7% |
| Lebanese | 30 | 0.1% |
| Lithuanian | 7 | 0.0% |
| Mexican | 5,138 | 17.8% |
| Nigerian | 45 | 0.2% |
| Northern European | 6 | 0.0% |
| Norwegian | 71 | 0.3% |
| Pakistani | 118 | 0.4% |
| Panamanian | 165 | 0.6% |
| Peruvian | 74 | 0.3% |
| Polish | 342 | 1.2% |
| Portuguese | 105 | 0.4% |
| Puerto Rican | 1,833 | 6.4% |
| Russian | 29 | 0.1% |
| Samoan | 183 | 0.6% |
| Scotch-Irish | 105 | 0.4% |
| Scottish | 174 | 0.6% |
| Slovak | 12 | 0.0% |
| South American | 465 | 1.6% |
| Spaniard | 25 | 0.1% |
| Sri Lankan | 367 | 1.3% |
| Subsaharan African | 128 | 0.4% |
| Swedish | 104 | 0.4% |
| Swiss | 13 | 0.1% |
| Thai | 361 | 1.3% |
| Trinidadian and Tobagonian | 32 | 0.1% |
| Ukrainian | 26 | 0.1% |
| Venezuelan | 82 | 0.3% |
| Welsh | 42 | 0.2% |
| West Indian | 25 | 0.1% | View All 73 Rows |
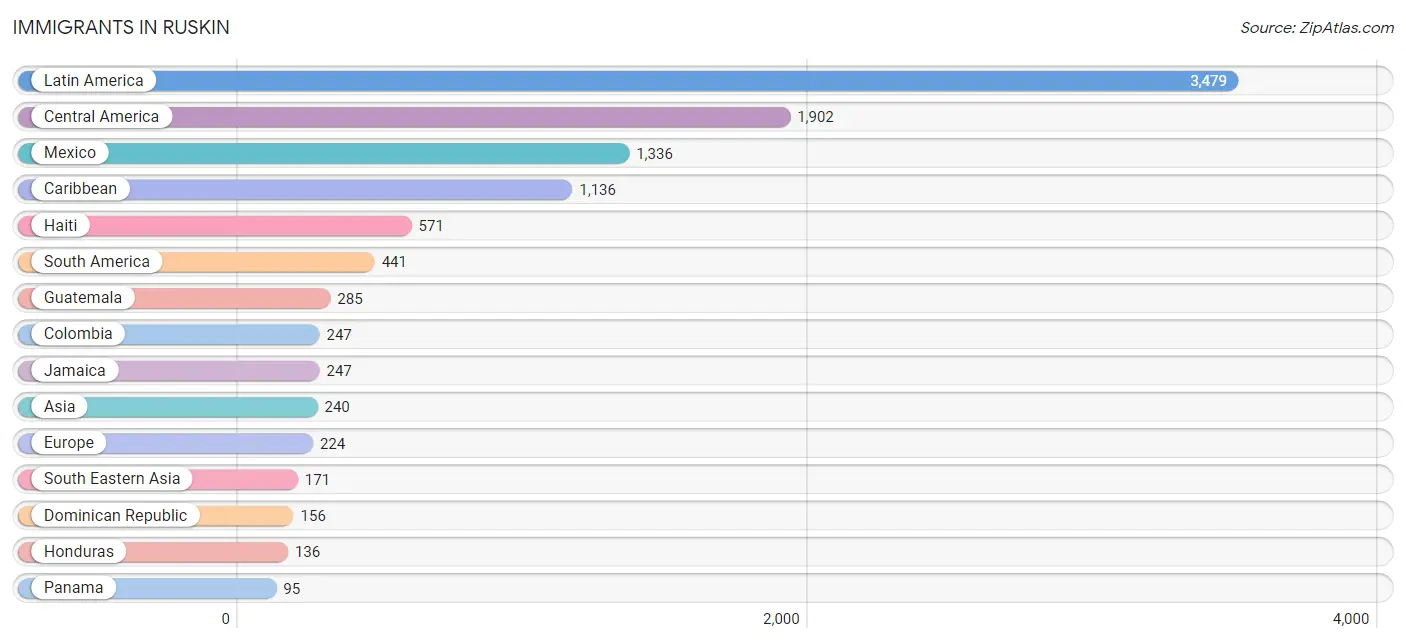
Immigrants in Ruskin
The most numerous immigrant groups reported in Ruskin came from Latin America (3,479 | 12.0%), Central America (1,902 | 6.6%), Mexico (1,336 | 4.6%), Caribbean (1,136 | 3.9%), and Haiti (571 | 2.0%), together accounting for 29.2% of all Ruskin residents.
| Immigration Origin | # Population | % Population |
| Asia | 240 | 0.8% |
| Australia | 14 | 0.1% |
| Austria | 12 | 0.0% |
| Bahamas | 27 | 0.1% |
| Belize | 50 | 0.2% |
| Canada | 21 | 0.1% |
| Caribbean | 1,136 | 3.9% |
| Central America | 1,902 | 6.6% |
| China | 39 | 0.1% |
| Colombia | 247 | 0.9% |
| Cuba | 71 | 0.3% |
| Czechoslovakia | 12 | 0.0% |
| Dominica | 17 | 0.1% |
| Dominican Republic | 156 | 0.5% |
| Eastern Asia | 39 | 0.1% |
| Eastern Europe | 12 | 0.0% |
| Ecuador | 57 | 0.2% |
| England | 9 | 0.0% |
| Europe | 224 | 0.8% |
| France | 33 | 0.1% |
| Germany | 36 | 0.1% |
| Guatemala | 285 | 1.0% |
| Guyana | 15 | 0.1% |
| Haiti | 571 | 2.0% |
| Honduras | 136 | 0.5% |
| Ireland | 3 | 0.0% |
| Italy | 16 | 0.1% |
| Jamaica | 247 | 0.9% |
| Latin America | 3,479 | 12.0% |
| Lebanon | 30 | 0.1% |
| Mexico | 1,336 | 4.6% |
| Northern Europe | 64 | 0.2% |
| Oceania | 14 | 0.1% |
| Panama | 95 | 0.3% |
| Peru | 60 | 0.2% |
| Philippines | 40 | 0.1% |
| Portugal | 51 | 0.2% |
| Scotland | 25 | 0.1% |
| South America | 441 | 1.5% |
| South Eastern Asia | 171 | 0.6% |
| Southern Europe | 67 | 0.2% |
| Sweden | 9 | 0.0% |
| Thailand | 72 | 0.3% |
| Trinidad and Tobago | 32 | 0.1% |
| Venezuela | 62 | 0.2% |
| Vietnam | 59 | 0.2% |
| Western Asia | 30 | 0.1% |
| Western Europe | 81 | 0.3% | View All 48 Rows |
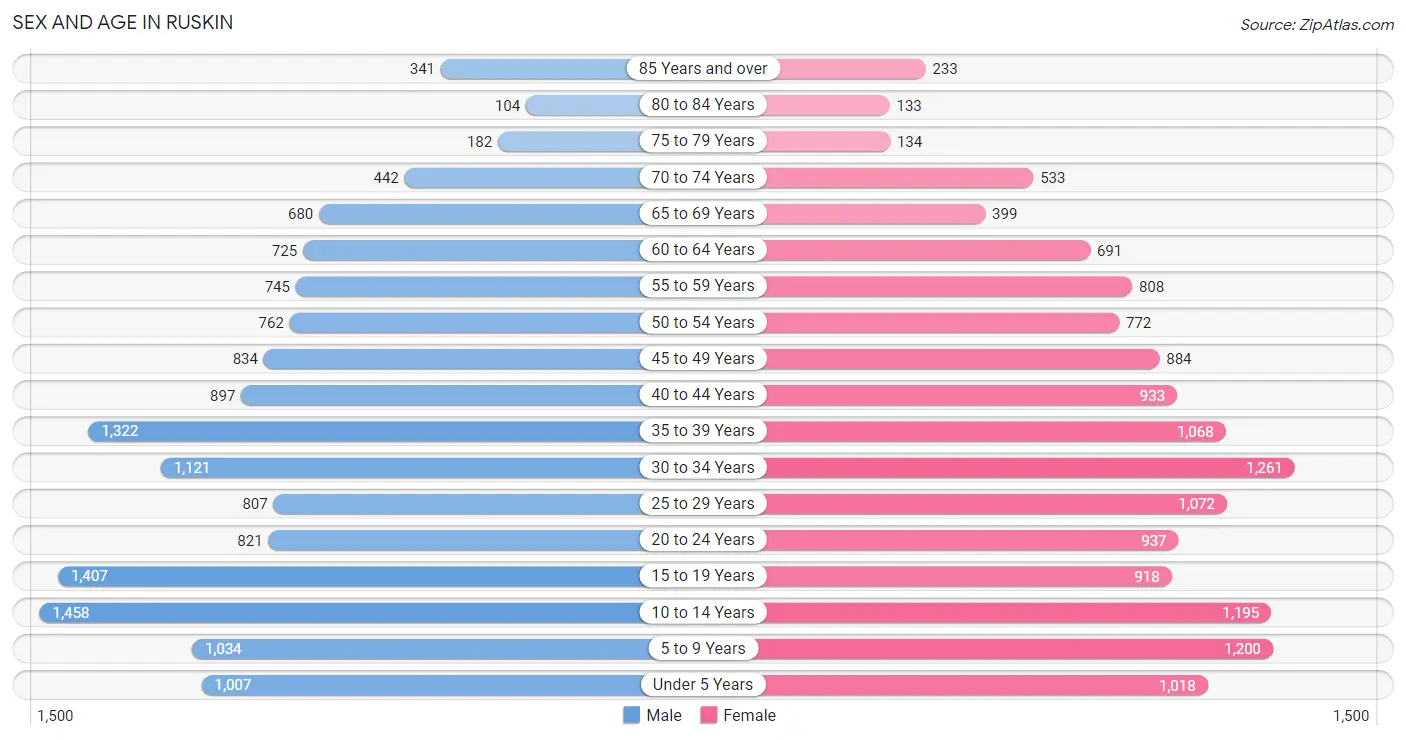
Sex and Age in Ruskin
Sex and Age in Ruskin
The most populous age groups in Ruskin are 10 to 14 Years (1,458 | 9.9%) for men and 30 to 34 Years (1,261 | 8.9%) for women.
| Age Bracket | Male | Female |
| Under 5 Years | 1,007 (6.9%) | 1,018 (7.2%) |
| 5 to 9 Years | 1,034 (7.0%) | 1,200 (8.5%) |
| 10 to 14 Years | 1,458 (9.9%) | 1,195 (8.4%) |
| 15 to 19 Years | 1,407 (9.6%) | 918 (6.5%) |
| 20 to 24 Years | 821 (5.6%) | 937 (6.6%) |
| 25 to 29 Years | 807 (5.5%) | 1,072 (7.6%) |
| 30 to 34 Years | 1,121 (7.6%) | 1,261 (8.9%) |
| 35 to 39 Years | 1,322 (9.0%) | 1,068 (7.5%) |
| 40 to 44 Years | 897 (6.1%) | 933 (6.6%) |
| 45 to 49 Years | 834 (5.7%) | 884 (6.2%) |
| 50 to 54 Years | 762 (5.2%) | 772 (5.4%) |
| 55 to 59 Years | 745 (5.1%) | 808 (5.7%) |
| 60 to 64 Years | 725 (4.9%) | 691 (4.9%) |
| 65 to 69 Years | 680 (4.6%) | 399 (2.8%) |
| 70 to 74 Years | 442 (3.0%) | 533 (3.8%) |
| 75 to 79 Years | 182 (1.2%) | 134 (0.9%) |
| 80 to 84 Years | 104 (0.7%) | 133 (0.9%) |
| 85 Years and over | 341 (2.3%) | 233 (1.6%) |
| Total | 14,689 (100.0%) | 14,189 (100.0%) |
Families and Households in Ruskin
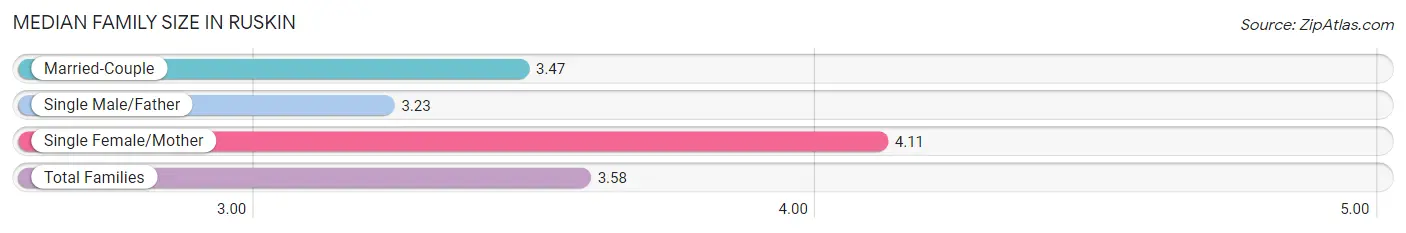
Median Family Size in Ruskin
The median family size in Ruskin is 3.58 persons per family, with single female/mother families (1,577 | 22.1%) accounting for the largest median family size of 4.11 persons per family. On the other hand, single male/father families (911 | 12.8%) represent the smallest median family size with 3.23 persons per family.
| Family Type | # Families | Family Size |
| Married-Couple | 4,650 (65.1%) | 3.47 |
| Single Male/Father | 911 (12.8%) | 3.23 |
| Single Female/Mother | 1,577 (22.1%) | 4.11 |
| Total Families | 7,138 (100.0%) | 3.58 |
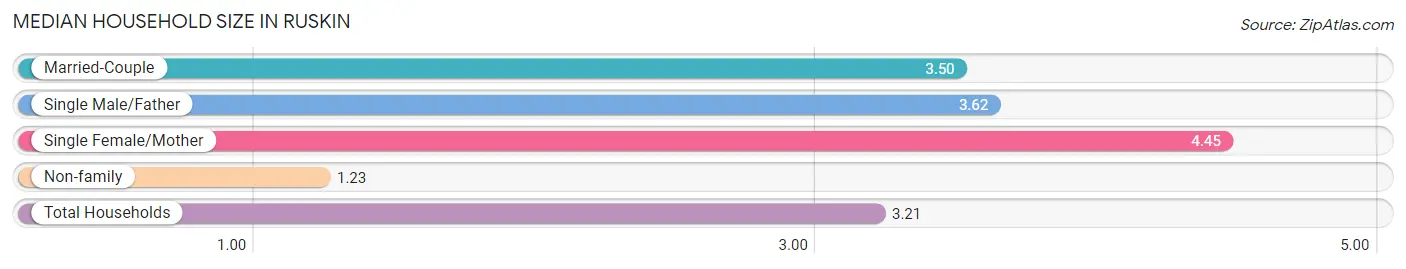
Median Household Size in Ruskin
The median household size in Ruskin is 3.21 persons per household, with single female/mother households (1,577 | 17.5%) accounting for the largest median household size of 4.45 persons per household. non-family households (1,870 | 20.8%) represent the smallest median household size with 1.23 persons per household.
| Household Type | # Households | Household Size |
| Married-Couple | 4,650 (51.6%) | 3.50 |
| Single Male/Father | 911 (10.1%) | 3.62 |
| Single Female/Mother | 1,577 (17.5%) | 4.45 |
| Non-family | 1,870 (20.8%) | 1.23 |
| Total Households | 9,008 (100.0%) | 3.21 |
Household Size by Marriage Status in Ruskin
Out of a total of 9,008 households in Ruskin, 7,138 (79.2%) are family households, while 1,870 (20.8%) are nonfamily households. The most numerous type of family households are 2-person households, comprising 2,474, and the most common type of nonfamily households are 1-person households, comprising 1,524.
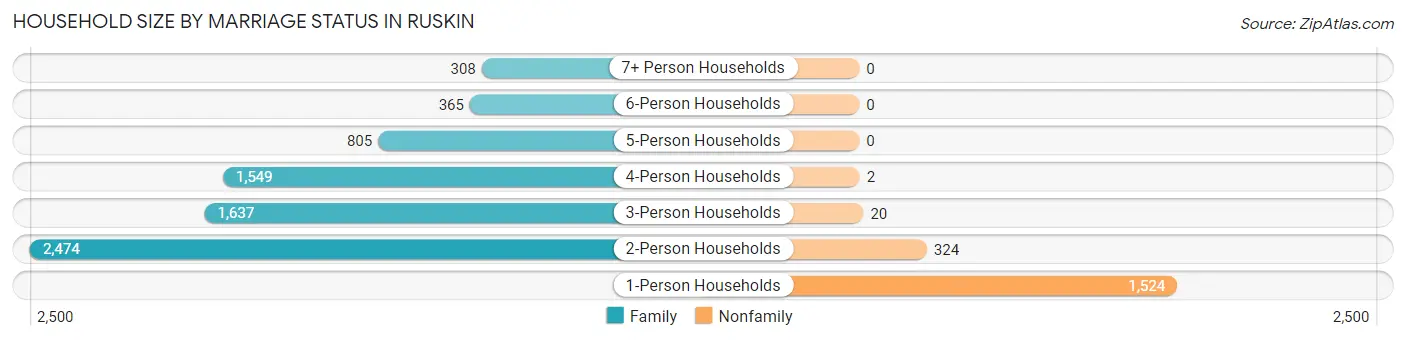
| Household Size | Family Households | Nonfamily Households |
| 1-Person Households | - | 1,524 (16.9%) |
| 2-Person Households | 2,474 (27.5%) | 324 (3.6%) |
| 3-Person Households | 1,637 (18.2%) | 20 (0.2%) |
| 4-Person Households | 1,549 (17.2%) | 2 (0.0%) |
| 5-Person Households | 805 (8.9%) | 0 (0.0%) |
| 6-Person Households | 365 (4.1%) | 0 (0.0%) |
| 7+ Person Households | 308 (3.4%) | 0 (0.0%) |
| Total | 7,138 (79.2%) | 1,870 (20.8%) |
Female Fertility in Ruskin
Fertility by Age in Ruskin
Average fertility rate in Ruskin is 75.0 births per 1,000 women. Women in the age bracket of 20 to 34 years have the highest fertility rate with 106.0 births per 1,000 women. Women in the age bracket of 20 to 34 years acount for 63.9% of all women with births.
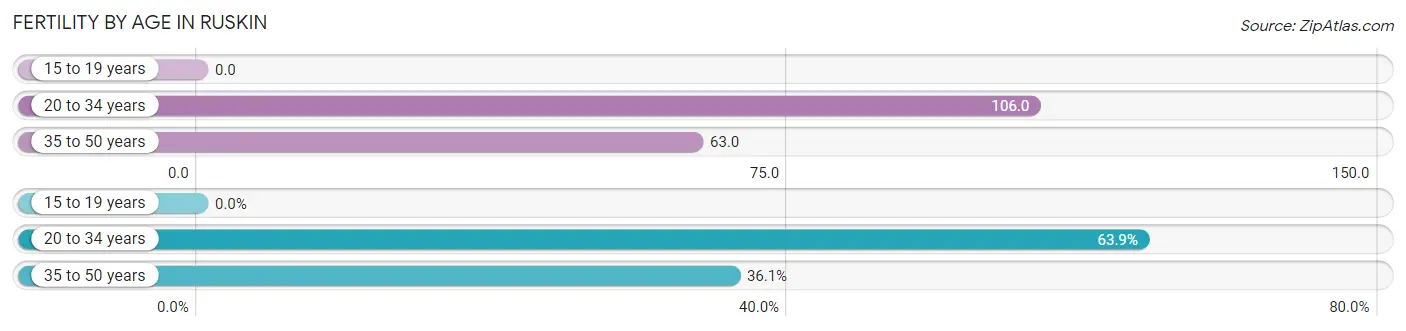
| Age Bracket | Women with Births | Births / 1,000 Women |
| 15 to 19 years | 0 (0.0%) | 0.0 |
| 20 to 34 years | 347 (63.9%) | 106.0 |
| 35 to 50 years | 196 (36.1%) | 63.0 |
| Total | 543 (100.0%) | 75.0 |
Fertility by Age by Marriage Status in Ruskin
37.0% of women with births (543) in Ruskin are married. The highest percentage of unmarried women with births falls into 35 to 50 years age bracket with 91.3% of them unmarried at the time of birth, while the lowest percentage of unmarried women with births belong to 20 to 34 years age bracket with 47.0% of them unmarried.
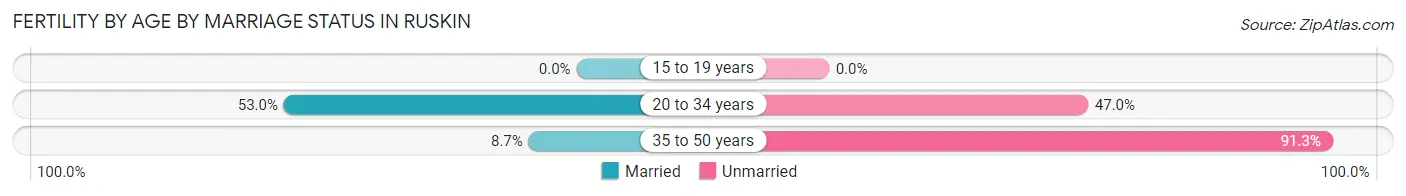
| Age Bracket | Married | Unmarried |
| 15 to 19 years | 0 (0.0%) | 0 (0.0%) |
| 20 to 34 years | 184 (53.0%) | 163 (47.0%) |
| 35 to 50 years | 17 (8.7%) | 179 (91.3%) |
| Total | 201 (37.0%) | 342 (63.0%) |
Fertility by Education in Ruskin
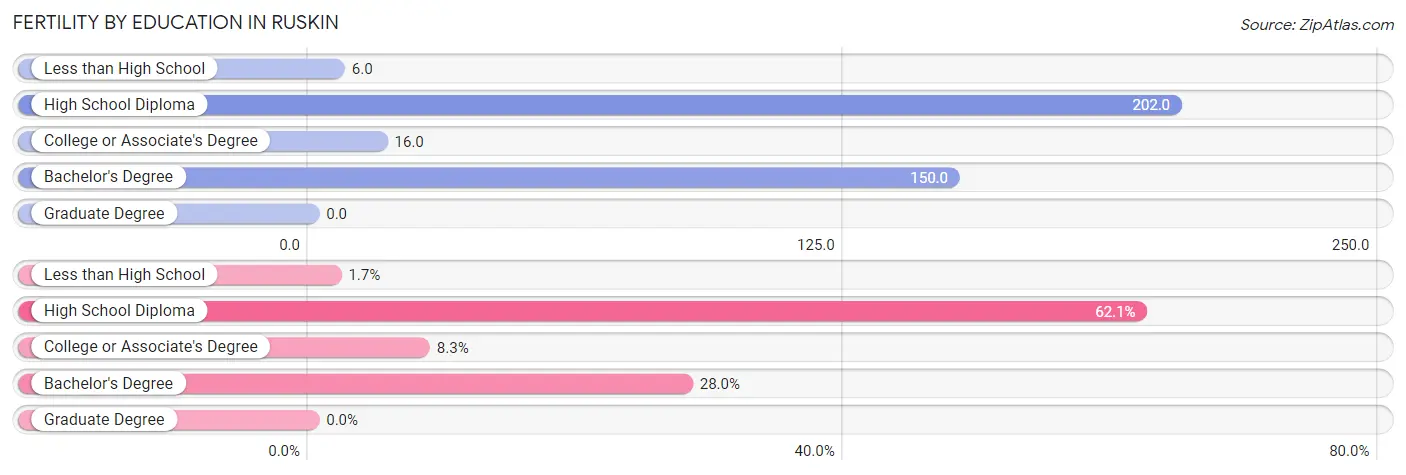
| Educational Attainment | Women with Births | Births / 1,000 Women |
| Less than High School | 9 (1.7%) | 6.0 |
| High School Diploma | 337 (62.1%) | 202.0 |
| College or Associate's Degree | 45 (8.3%) | 16.0 |
| Bachelor's Degree | 152 (28.0%) | 150.0 |
| Graduate Degree | 0 (0.0%) | 0.0 |
| Total | 543 (100.0%) | 75.0 |
Fertility by Education by Marriage Status in Ruskin
63.0% of women with births in Ruskin are unmarried. Women with the educational attainment of bachelor's degree are most likely to be married with 54.6% of them married at childbirth, while women with the educational attainment of less than high school are least likely to be married with 100.0% of them unmarried at childbirth.
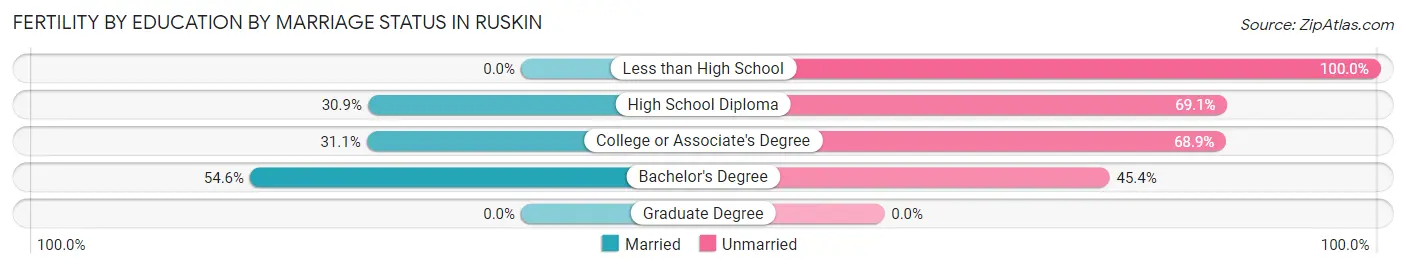
| Educational Attainment | Married | Unmarried |
| Less than High School | 0 (0.0%) | 9 (100.0%) |
| High School Diploma | 104 (30.9%) | 233 (69.1%) |
| College or Associate's Degree | 14 (31.1%) | 31 (68.9%) |
| Bachelor's Degree | 83 (54.6%) | 69 (45.4%) |
| Graduate Degree | 0 (0.0%) | 0 (0.0%) |
| Total | 201 (37.0%) | 342 (63.0%) |
Employment Characteristics in Ruskin
Employment by Class of Employer in Ruskin
Among the 13,430 employed individuals in Ruskin, private company employees (10,102 | 75.2%), local government employees (887 | 6.6%), and self-employed (not incorporated) (881 | 6.6%) make up the most common classes of employment.
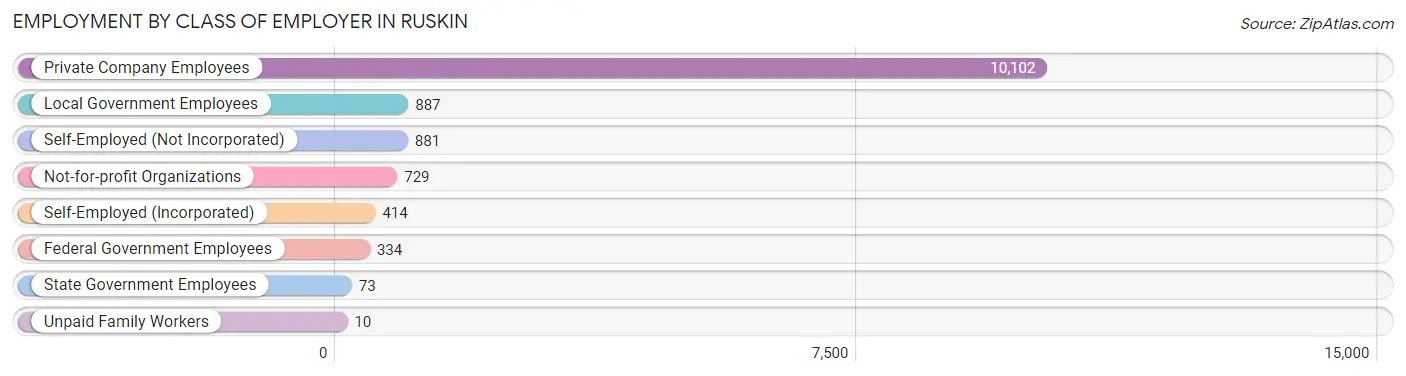
| Employer Class | # Employees | % Employees |
| Private Company Employees | 10,102 | 75.2% |
| Self-Employed (Incorporated) | 414 | 3.1% |
| Self-Employed (Not Incorporated) | 881 | 6.6% |
| Not-for-profit Organizations | 729 | 5.4% |
| Local Government Employees | 887 | 6.6% |
| State Government Employees | 73 | 0.5% |
| Federal Government Employees | 334 | 2.5% |
| Unpaid Family Workers | 10 | 0.1% |
| Total | 13,430 | 100.0% |
Employment Status by Age in Ruskin
According to the labor force statistics for Ruskin, out of the total population over 16 years of age (21,598), 66.7% or 14,406 individuals are in the labor force, with 5.3% or 764 of them unemployed. The age group with the highest labor force participation rate is 35 to 44 years, with 89.3% or 3,768 individuals in the labor force. Within the labor force, the 16 to 19 years age range has the highest percentage of unemployed individuals, with 13.5% or 103 of them being unemployed.
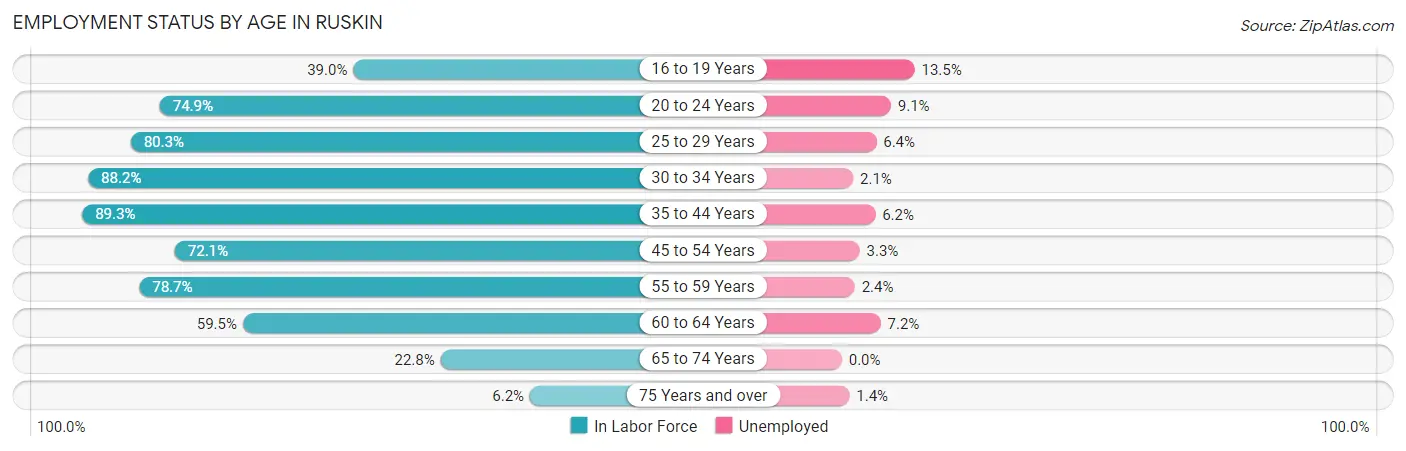
| Age Bracket | In Labor Force | Unemployed |
| 16 to 19 Years | 763 (39.0%) | 103 (13.5%) |
| 20 to 24 Years | 1,317 (74.9%) | 120 (9.1%) |
| 25 to 29 Years | 1,509 (80.3%) | 97 (6.4%) |
| 30 to 34 Years | 2,101 (88.2%) | 44 (2.1%) |
| 35 to 44 Years | 3,768 (89.3%) | 234 (6.2%) |
| 45 to 54 Years | 2,345 (72.1%) | 77 (3.3%) |
| 55 to 59 Years | 1,222 (78.7%) | 29 (2.4%) |
| 60 to 64 Years | 843 (59.5%) | 61 (7.2%) |
| 65 to 74 Years | 468 (22.8%) | 0 (0.0%) |
| 75 Years and over | 70 (6.2%) | 1 (1.4%) |
| Total | 14,406 (66.7%) | 764 (5.3%) |
Employment Status by Educational Attainment in Ruskin
According to labor force statistics for Ruskin, 80.2% of individuals (11,791) out of the total population between 25 and 64 years of age (14,702) are in the labor force, with 4.6% or 542 of them being unemployed. The group with the highest labor force participation rate are those with the educational attainment of bachelor's degree or higher, with 87.0% or 2,908 individuals in the labor force. Within the labor force, individuals with less than high school education have the highest percentage of unemployment, with 7.6% or 77 of them being unemployed.
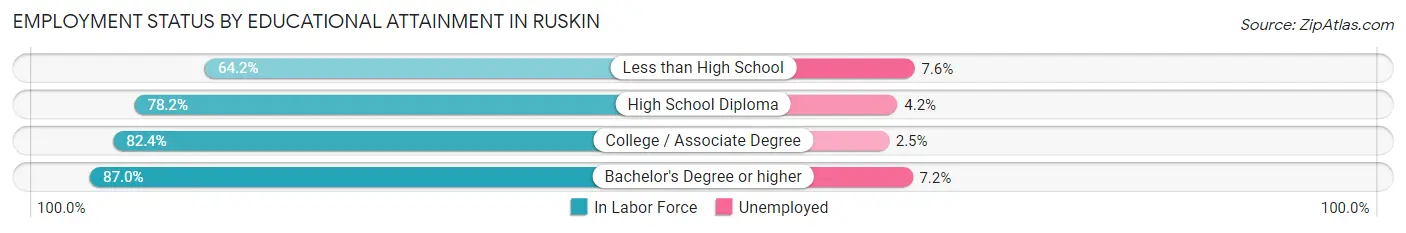
| Educational Attainment | In Labor Force | Unemployed |
| Less than High School | 1,007 (64.2%) | 119 (7.6%) |
| High School Diploma | 3,605 (78.2%) | 194 (4.2%) |
| College / Associate Degree | 4,268 (82.4%) | 130 (2.5%) |
| Bachelor's Degree or higher | 2,908 (87.0%) | 241 (7.2%) |
| Total | 11,791 (80.2%) | 676 (4.6%) |
Employment Occupations by Sex in Ruskin
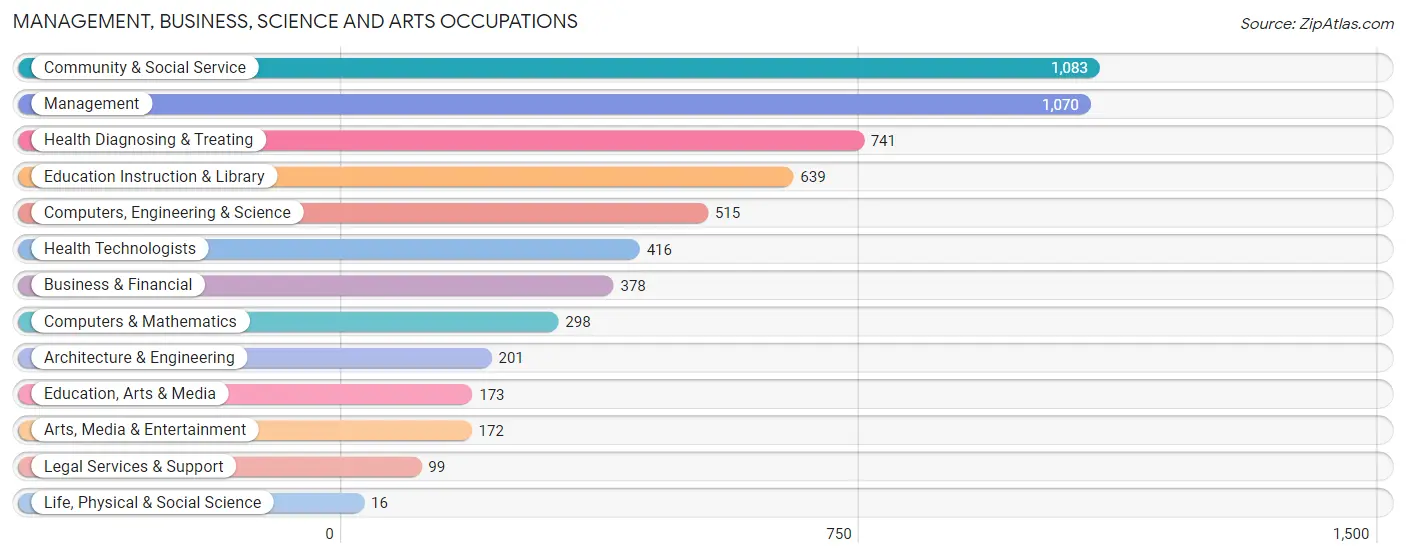
Management, Business, Science and Arts Occupations
The most common Management, Business, Science and Arts occupations in Ruskin are Community & Social Service (1,083 | 8.0%), Management (1,070 | 7.9%), Health Diagnosing & Treating (741 | 5.5%), Education Instruction & Library (639 | 4.7%), and Computers, Engineering & Science (515 | 3.8%).
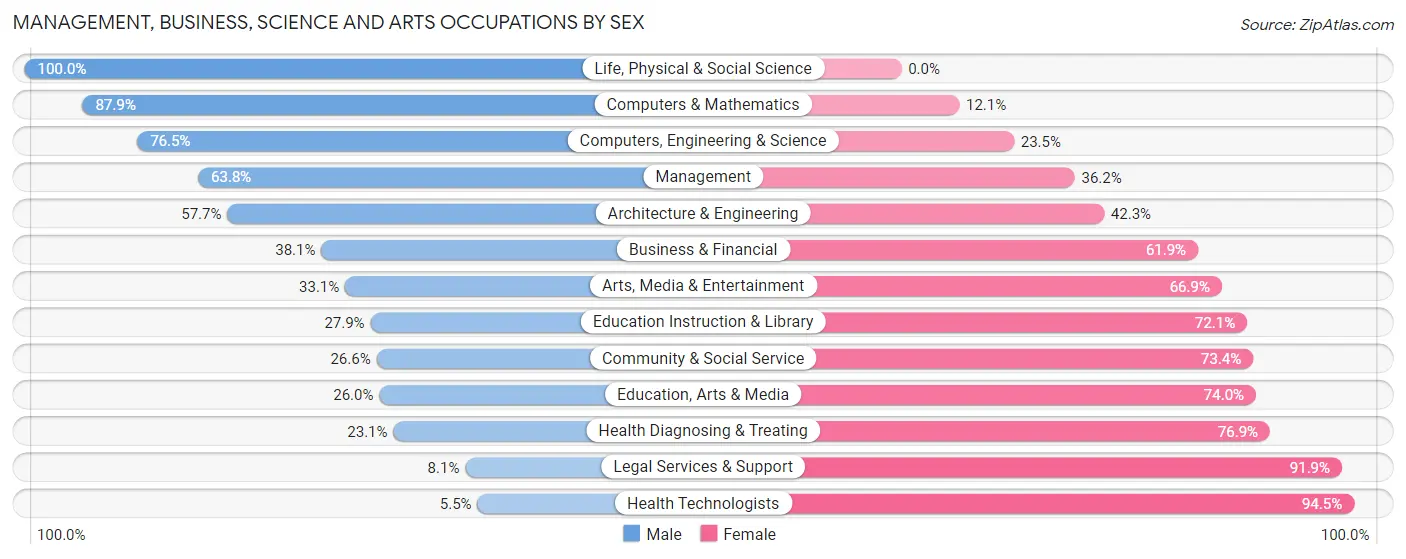
Management, Business, Science and Arts Occupations by Sex
Within the Management, Business, Science and Arts occupations in Ruskin, the most male-oriented occupations are Life, Physical & Social Science (100.0%), Computers & Mathematics (87.9%), and Computers, Engineering & Science (76.5%), while the most female-oriented occupations are Health Technologists (94.5%), Legal Services & Support (91.9%), and Health Diagnosing & Treating (76.9%).
| Occupation | Male | Female |
| Management | 683 (63.8%) | 387 (36.2%) |
| Business & Financial | 144 (38.1%) | 234 (61.9%) |
| Computers, Engineering & Science | 394 (76.5%) | 121 (23.5%) |
| Computers & Mathematics | 262 (87.9%) | 36 (12.1%) |
| Architecture & Engineering | 116 (57.7%) | 85 (42.3%) |
| Life, Physical & Social Science | 16 (100.0%) | 0 (0.0%) |
| Community & Social Service | 288 (26.6%) | 795 (73.4%) |
| Education, Arts & Media | 45 (26.0%) | 128 (74.0%) |
| Legal Services & Support | 8 (8.1%) | 91 (91.9%) |
| Education Instruction & Library | 178 (27.9%) | 461 (72.1%) |
| Arts, Media & Entertainment | 57 (33.1%) | 115 (66.9%) |
| Health Diagnosing & Treating | 171 (23.1%) | 570 (76.9%) |
| Health Technologists | 23 (5.5%) | 393 (94.5%) |
| Total (Category) | 1,680 (44.4%) | 2,107 (55.6%) |
| Total (Overall) | 7,027 (51.8%) | 6,533 (48.2%) |
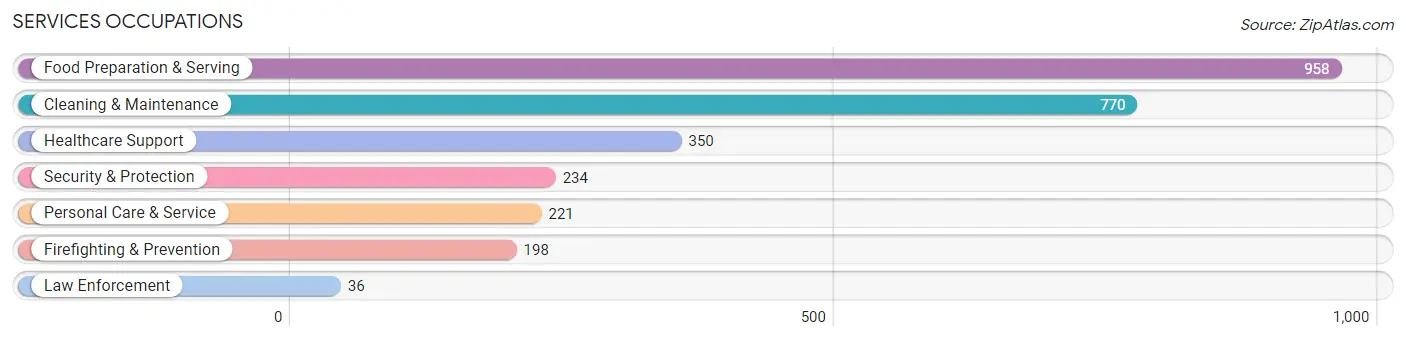
Services Occupations
The most common Services occupations in Ruskin are Food Preparation & Serving (958 | 7.1%), Cleaning & Maintenance (770 | 5.7%), Healthcare Support (350 | 2.6%), Security & Protection (234 | 1.7%), and Personal Care & Service (221 | 1.6%).
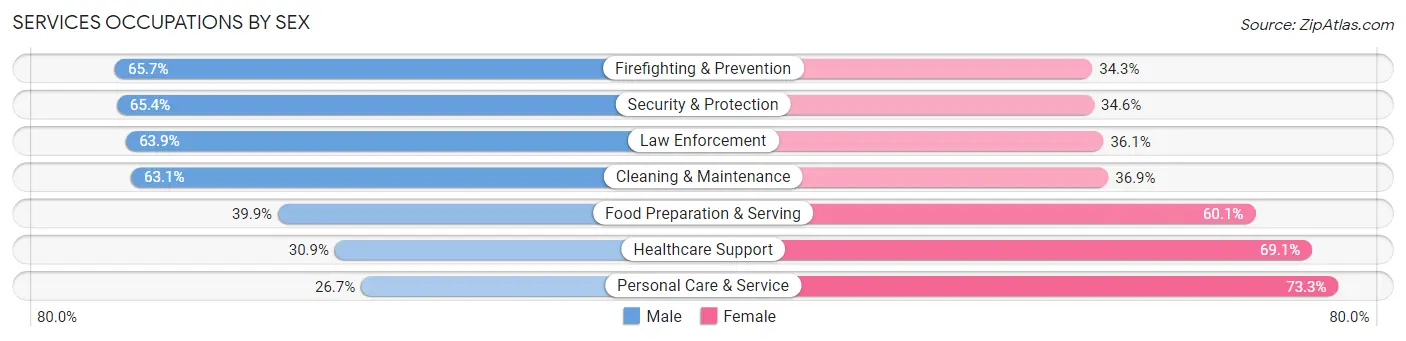
Services Occupations by Sex
Within the Services occupations in Ruskin, the most male-oriented occupations are Firefighting & Prevention (65.7%), Security & Protection (65.4%), and Law Enforcement (63.9%), while the most female-oriented occupations are Personal Care & Service (73.3%), Healthcare Support (69.1%), and Food Preparation & Serving (60.1%).
| Occupation | Male | Female |
| Healthcare Support | 108 (30.9%) | 242 (69.1%) |
| Security & Protection | 153 (65.4%) | 81 (34.6%) |
| Firefighting & Prevention | 130 (65.7%) | 68 (34.3%) |
| Law Enforcement | 23 (63.9%) | 13 (36.1%) |
| Food Preparation & Serving | 382 (39.9%) | 576 (60.1%) |
| Cleaning & Maintenance | 486 (63.1%) | 284 (36.9%) |
| Personal Care & Service | 59 (26.7%) | 162 (73.3%) |
| Total (Category) | 1,188 (46.9%) | 1,345 (53.1%) |
| Total (Overall) | 7,027 (51.8%) | 6,533 (48.2%) |
Sales and Office Occupations
The most common Sales and Office occupations in Ruskin are Office & Administration (1,877 | 13.8%), and Sales & Related (1,818 | 13.4%).

Sales and Office Occupations by Sex
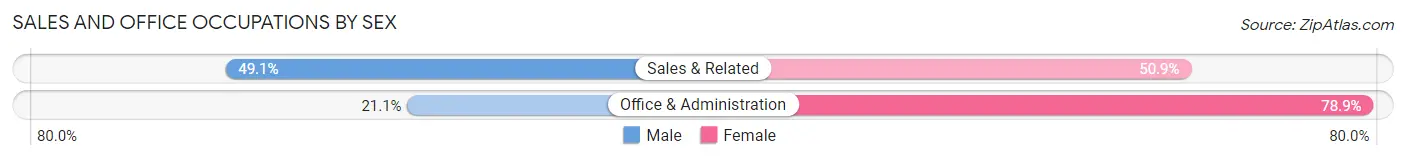
| Occupation | Male | Female |
| Sales & Related | 893 (49.1%) | 925 (50.9%) |
| Office & Administration | 396 (21.1%) | 1,481 (78.9%) |
| Total (Category) | 1,289 (34.9%) | 2,406 (65.1%) |
| Total (Overall) | 7,027 (51.8%) | 6,533 (48.2%) |
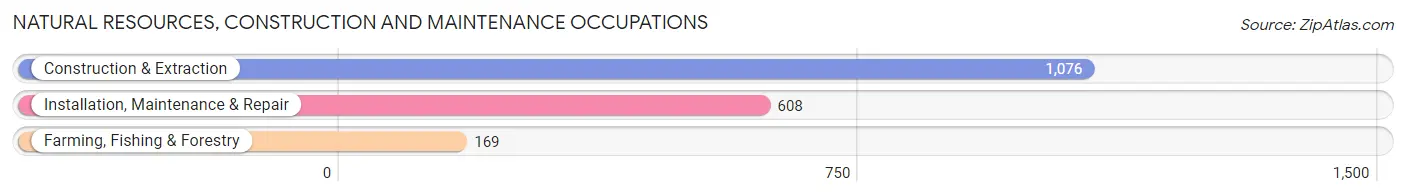
Natural Resources, Construction and Maintenance Occupations
The most common Natural Resources, Construction and Maintenance occupations in Ruskin are Construction & Extraction (1,076 | 7.9%), Installation, Maintenance & Repair (608 | 4.5%), and Farming, Fishing & Forestry (169 | 1.3%).
Natural Resources, Construction and Maintenance Occupations by Sex
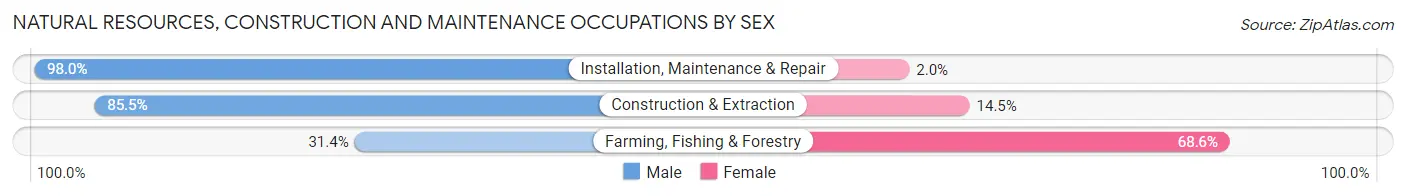
| Occupation | Male | Female |
| Farming, Fishing & Forestry | 53 (31.4%) | 116 (68.6%) |
| Construction & Extraction | 920 (85.5%) | 156 (14.5%) |
| Installation, Maintenance & Repair | 596 (98.0%) | 12 (2.0%) |
| Total (Category) | 1,569 (84.7%) | 284 (15.3%) |
| Total (Overall) | 7,027 (51.8%) | 6,533 (48.2%) |
Production, Transportation and Moving Occupations
The most common Production, Transportation and Moving occupations in Ruskin are Material Moving (669 | 4.9%), Transportation (540 | 4.0%), and Production (483 | 3.6%).
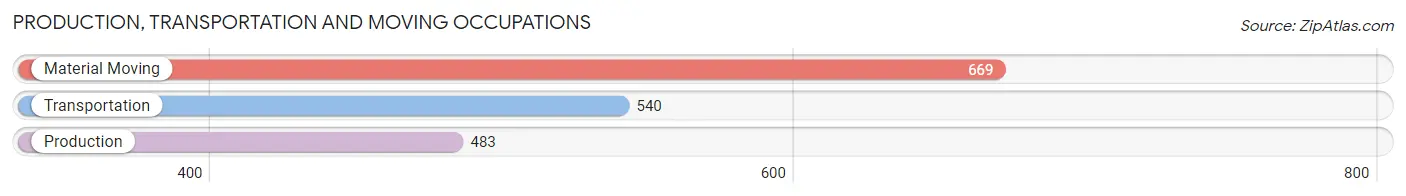
Production, Transportation and Moving Occupations by Sex
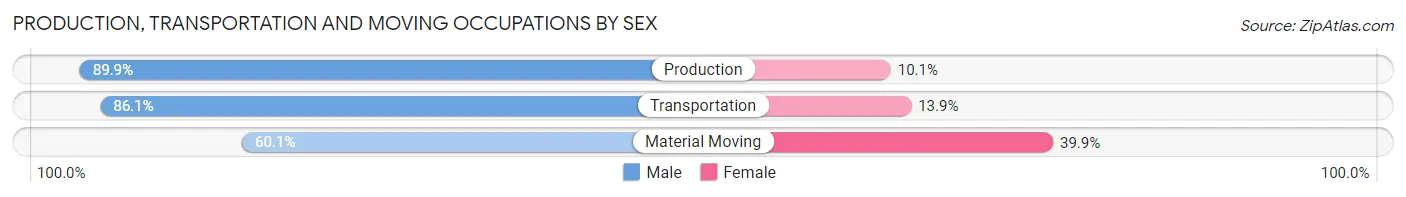
| Occupation | Male | Female |
| Production | 434 (89.9%) | 49 (10.1%) |
| Transportation | 465 (86.1%) | 75 (13.9%) |
| Material Moving | 402 (60.1%) | 267 (39.9%) |
| Total (Category) | 1,301 (76.9%) | 391 (23.1%) |
| Total (Overall) | 7,027 (51.8%) | 6,533 (48.2%) |
Employment Industries by Sex in Ruskin
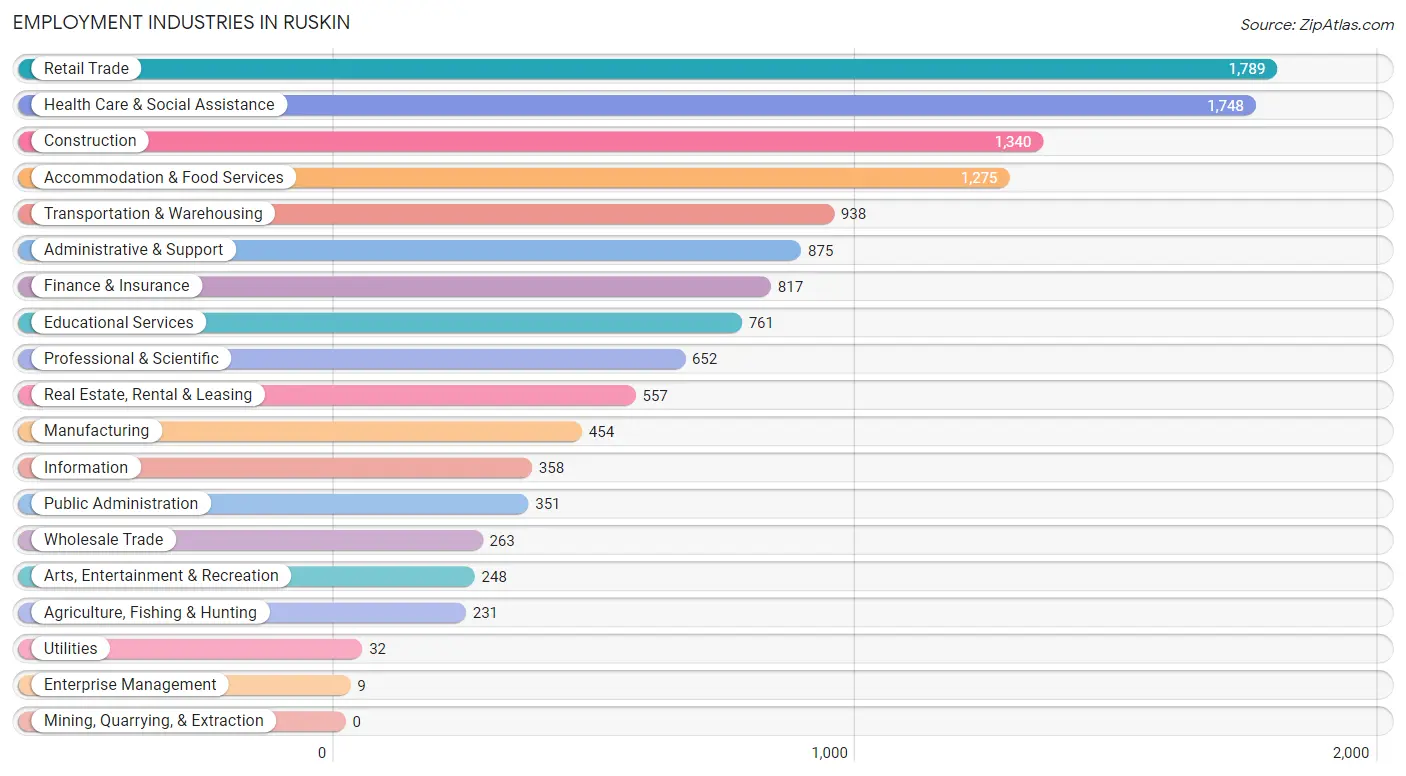
Employment Industries in Ruskin
The major employment industries in Ruskin include Retail Trade (1,789 | 13.2%), Health Care & Social Assistance (1,748 | 12.9%), Construction (1,340 | 9.9%), Accommodation & Food Services (1,275 | 9.4%), and Transportation & Warehousing (938 | 6.9%).
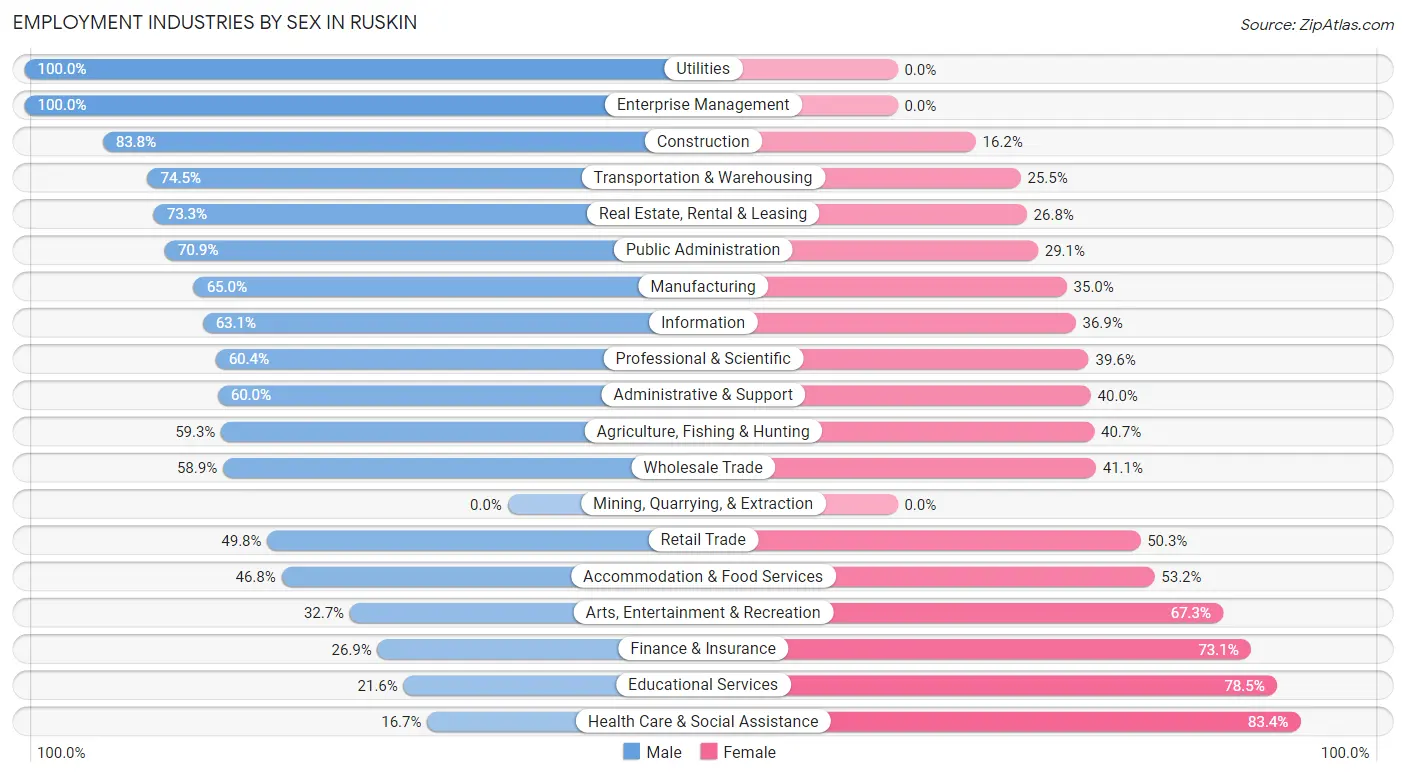
Employment Industries by Sex in Ruskin
The Ruskin industries that see more men than women are Utilities (100.0%), Enterprise Management (100.0%), and Construction (83.8%), whereas the industries that tend to have a higher number of women are Health Care & Social Assistance (83.4%), Educational Services (78.4%), and Finance & Insurance (73.1%).
| Industry | Male | Female |
| Agriculture, Fishing & Hunting | 137 (59.3%) | 94 (40.7%) |
| Mining, Quarrying, & Extraction | 0 (0.0%) | 0 (0.0%) |
| Construction | 1,123 (83.8%) | 217 (16.2%) |
| Manufacturing | 295 (65.0%) | 159 (35.0%) |
| Wholesale Trade | 155 (58.9%) | 108 (41.1%) |
| Retail Trade | 890 (49.7%) | 899 (50.2%) |
| Transportation & Warehousing | 699 (74.5%) | 239 (25.5%) |
| Utilities | 32 (100.0%) | 0 (0.0%) |
| Information | 226 (63.1%) | 132 (36.9%) |
| Finance & Insurance | 220 (26.9%) | 597 (73.1%) |
| Real Estate, Rental & Leasing | 408 (73.3%) | 149 (26.8%) |
| Professional & Scientific | 394 (60.4%) | 258 (39.6%) |
| Enterprise Management | 9 (100.0%) | 0 (0.0%) |
| Administrative & Support | 525 (60.0%) | 350 (40.0%) |
| Educational Services | 164 (21.5%) | 597 (78.4%) |
| Health Care & Social Assistance | 291 (16.7%) | 1,457 (83.4%) |
| Arts, Entertainment & Recreation | 81 (32.7%) | 167 (67.3%) |
| Accommodation & Food Services | 597 (46.8%) | 678 (53.2%) |
| Public Administration | 249 (70.9%) | 102 (29.1%) |
| Total | 7,027 (51.8%) | 6,533 (48.2%) |
Education in Ruskin
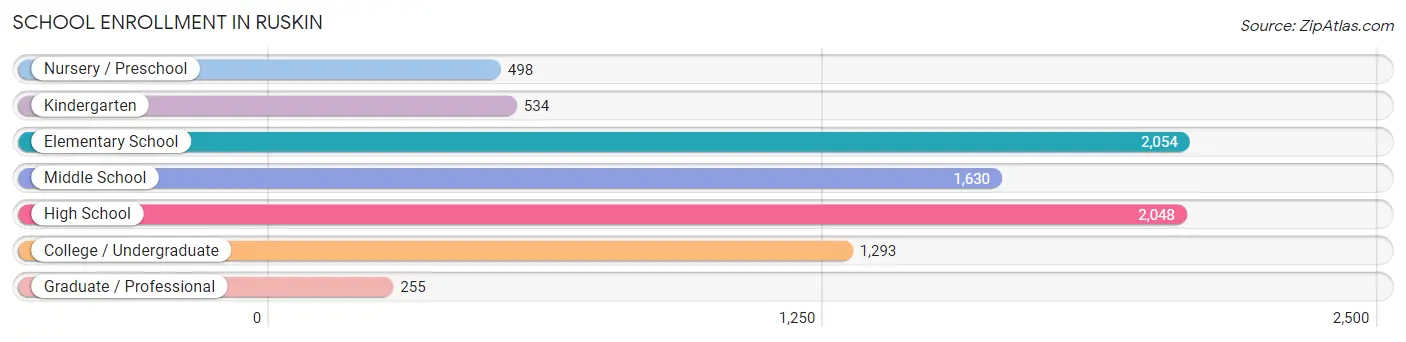
School Enrollment in Ruskin
The most common levels of schooling among the 8,312 students in Ruskin are elementary school (2,054 | 24.7%), high school (2,048 | 24.6%), and middle school (1,630 | 19.6%).
| School Level | # Students | % Students |
| Nursery / Preschool | 498 | 6.0% |
| Kindergarten | 534 | 6.4% |
| Elementary School | 2,054 | 24.7% |
| Middle School | 1,630 | 19.6% |
| High School | 2,048 | 24.6% |
| College / Undergraduate | 1,293 | 15.6% |
| Graduate / Professional | 255 | 3.1% |
| Total | 8,312 | 100.0% |
School Enrollment by Age by Funding Source in Ruskin
Out of a total of 8,312 students who are enrolled in schools in Ruskin, 997 (12.0%) attend a private institution, while the remaining 7,315 (88.0%) are enrolled in public schools. The age group of 20 to 24 year olds has the highest likelihood of being enrolled in private schools, with 234 (46.0% in the age bracket) enrolled. Conversely, the age group of 15 to 17 year olds has the lowest likelihood of being enrolled in a private school, with 1,303 (99.2% in the age bracket) attending a public institution.
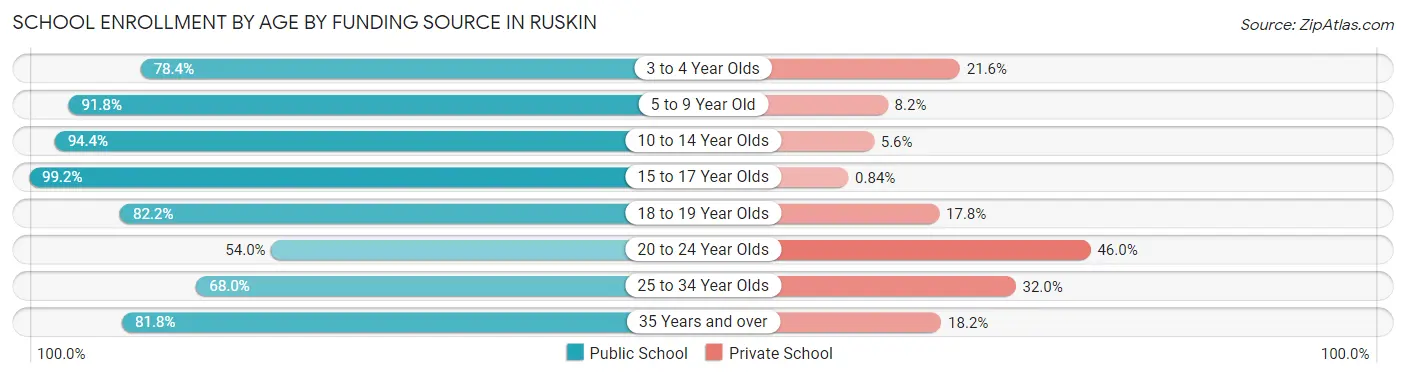
| Age Bracket | Public School | Private School |
| 3 to 4 Year Olds | 420 (78.4%) | 116 (21.6%) |
| 5 to 9 Year Old | 1,883 (91.8%) | 168 (8.2%) |
| 10 to 14 Year Olds | 2,288 (94.4%) | 136 (5.6%) |
| 15 to 17 Year Olds | 1,303 (99.2%) | 11 (0.8%) |
| 18 to 19 Year Olds | 467 (82.2%) | 101 (17.8%) |
| 20 to 24 Year Olds | 275 (54.0%) | 234 (46.0%) |
| 25 to 34 Year Olds | 308 (68.0%) | 145 (32.0%) |
| 35 Years and over | 374 (81.8%) | 83 (18.2%) |
| Total | 7,315 (88.0%) | 997 (12.0%) |
Educational Attainment by Field of Study in Ruskin
Business (897 | 21.7%), science & technology (508 | 12.3%), arts & humanities (349 | 8.5%), social sciences (281 | 6.8%), and psychology (270 | 6.5%) are the most common fields of study among 4,129 individuals in Ruskin who have obtained a bachelor's degree or higher.
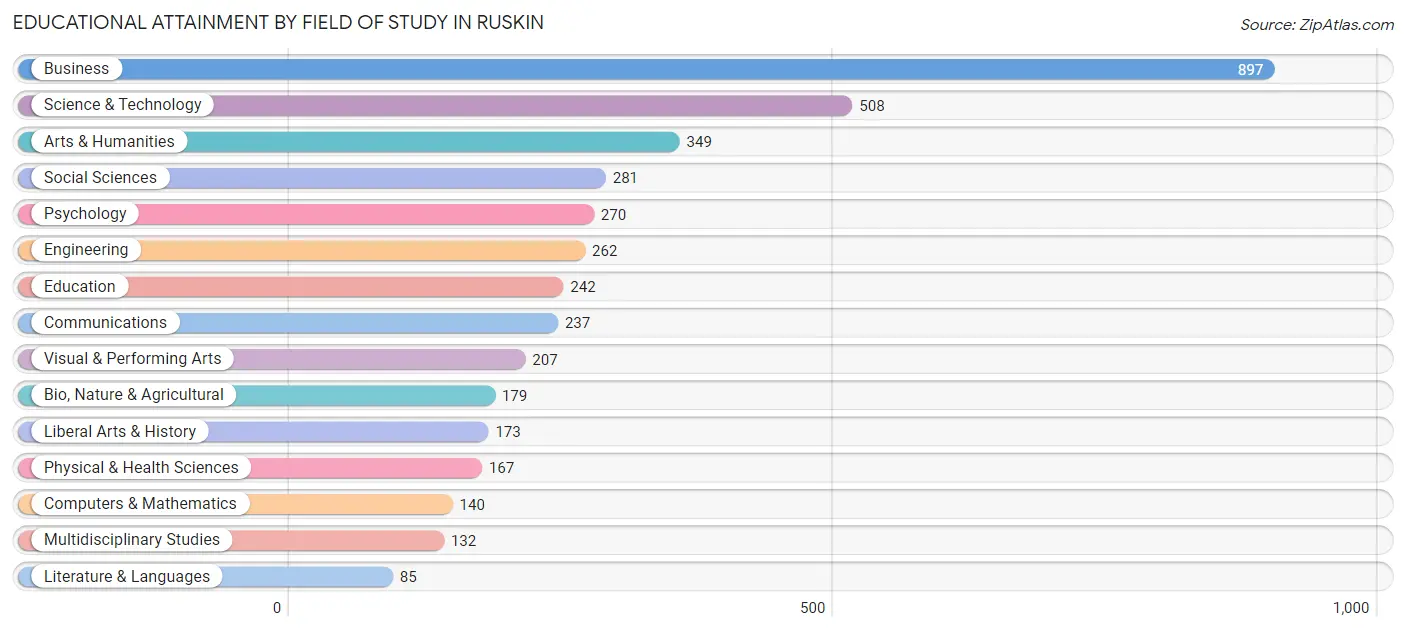
| Field of Study | # Graduates | % Graduates |
| Computers & Mathematics | 140 | 3.4% |
| Bio, Nature & Agricultural | 179 | 4.3% |
| Physical & Health Sciences | 167 | 4.0% |
| Psychology | 270 | 6.5% |
| Social Sciences | 281 | 6.8% |
| Engineering | 262 | 6.4% |
| Multidisciplinary Studies | 132 | 3.2% |
| Science & Technology | 508 | 12.3% |
| Business | 897 | 21.7% |
| Education | 242 | 5.9% |
| Literature & Languages | 85 | 2.1% |
| Liberal Arts & History | 173 | 4.2% |
| Visual & Performing Arts | 207 | 5.0% |
| Communications | 237 | 5.7% |
| Arts & Humanities | 349 | 8.5% |
| Total | 4,129 | 100.0% |
Transportation & Commute in Ruskin
Vehicle Availability by Sex in Ruskin
The most prevalent vehicle ownership categories in Ruskin are males with 2 vehicles (3,247, accounting for 46.4%) and females with 2 vehicles (2,842, making up 50.5%).
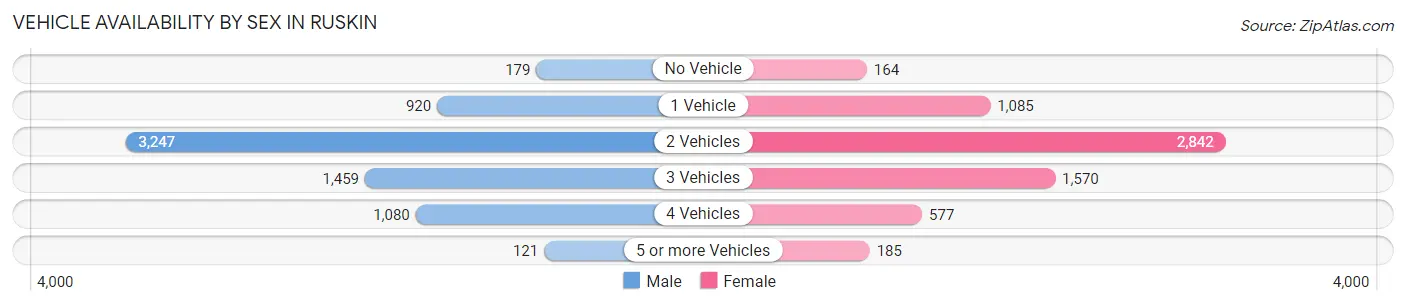
| Vehicles Available | Male | Female |
| No Vehicle | 179 (2.5%) | 164 (2.5%) |
| 1 Vehicle | 920 (13.1%) | 1,085 (16.9%) |
| 2 Vehicles | 3,247 (46.4%) | 2,842 (44.3%) |
| 3 Vehicles | 1,459 (20.8%) | 1,570 (24.4%) |
| 4 Vehicles | 1,080 (15.4%) | 577 (9.0%) |
| 5 or more Vehicles | 121 (1.7%) | 185 (2.9%) |
| Total | 7,006 (100.0%) | 6,423 (100.0%) |
Commute Time in Ruskin
The most frequently occuring commute durations in Ruskin are 45 to 59 minutes (2,732 commuters, 23.0%), 30 to 34 minutes (1,581 commuters, 13.3%), and 60 to 89 minutes (1,484 commuters, 12.5%).
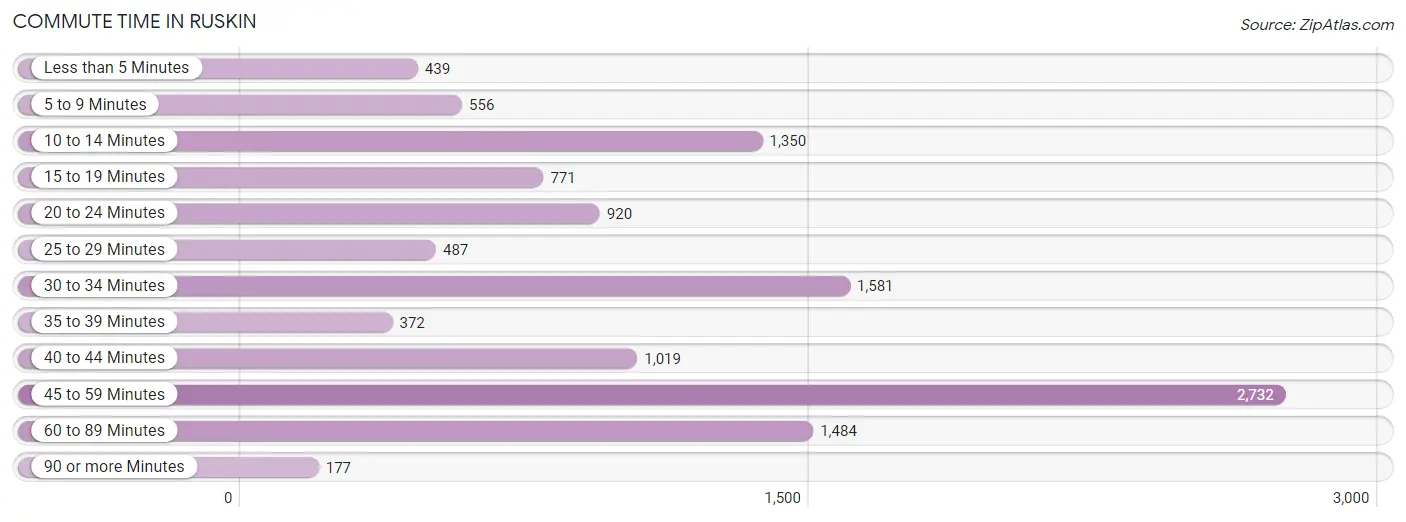
| Commute Time | # Commuters | % Commuters |
| Less than 5 Minutes | 439 | 3.7% |
| 5 to 9 Minutes | 556 | 4.7% |
| 10 to 14 Minutes | 1,350 | 11.4% |
| 15 to 19 Minutes | 771 | 6.5% |
| 20 to 24 Minutes | 920 | 7.7% |
| 25 to 29 Minutes | 487 | 4.1% |
| 30 to 34 Minutes | 1,581 | 13.3% |
| 35 to 39 Minutes | 372 | 3.1% |
| 40 to 44 Minutes | 1,019 | 8.6% |
| 45 to 59 Minutes | 2,732 | 23.0% |
| 60 to 89 Minutes | 1,484 | 12.5% |
| 90 or more Minutes | 177 | 1.5% |
Commute Time by Sex in Ruskin
The most common commute times in Ruskin are 45 to 59 minutes (1,650 commuters, 25.2%) for males and 45 to 59 minutes (1,082 commuters, 20.3%) for females.
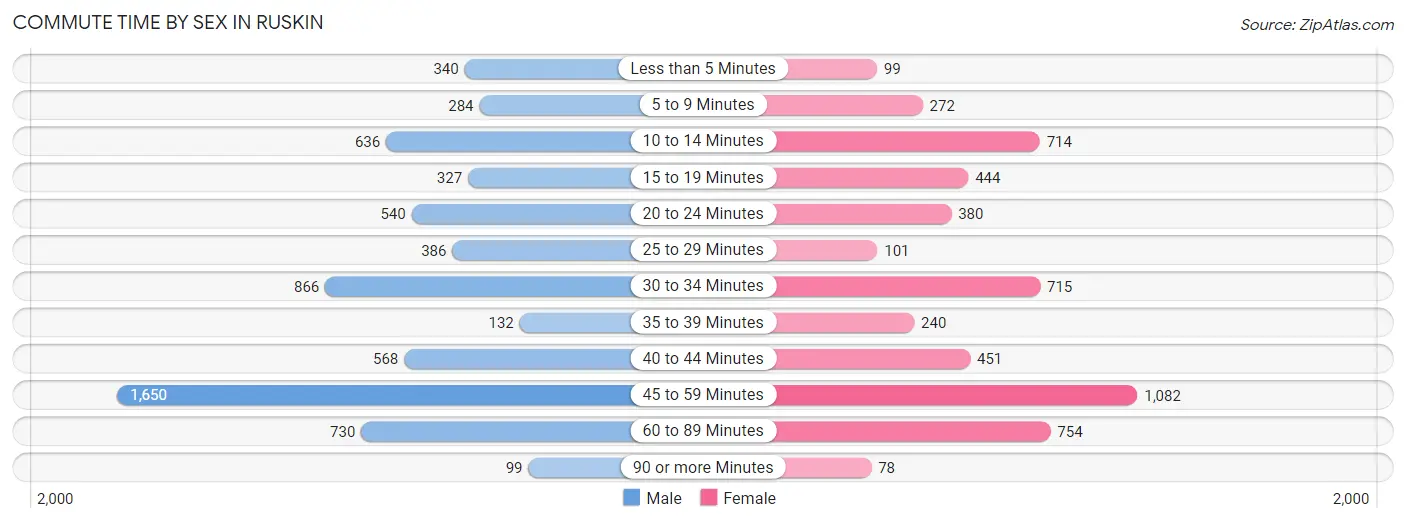
| Commute Time | Male | Female |
| Less than 5 Minutes | 340 (5.2%) | 99 (1.9%) |
| 5 to 9 Minutes | 284 (4.3%) | 272 (5.1%) |
| 10 to 14 Minutes | 636 (9.7%) | 714 (13.4%) |
| 15 to 19 Minutes | 327 (5.0%) | 444 (8.3%) |
| 20 to 24 Minutes | 540 (8.2%) | 380 (7.1%) |
| 25 to 29 Minutes | 386 (5.9%) | 101 (1.9%) |
| 30 to 34 Minutes | 866 (13.2%) | 715 (13.4%) |
| 35 to 39 Minutes | 132 (2.0%) | 240 (4.5%) |
| 40 to 44 Minutes | 568 (8.7%) | 451 (8.5%) |
| 45 to 59 Minutes | 1,650 (25.2%) | 1,082 (20.3%) |
| 60 to 89 Minutes | 730 (11.1%) | 754 (14.1%) |
| 90 or more Minutes | 99 (1.5%) | 78 (1.5%) |
Time of Departure to Work by Sex in Ruskin
The most frequent times of departure to work in Ruskin are 6:00 AM to 6:29 AM (1,016, 15.5%) for males and 6:30 AM to 6:59 AM (1,074, 20.2%) for females.
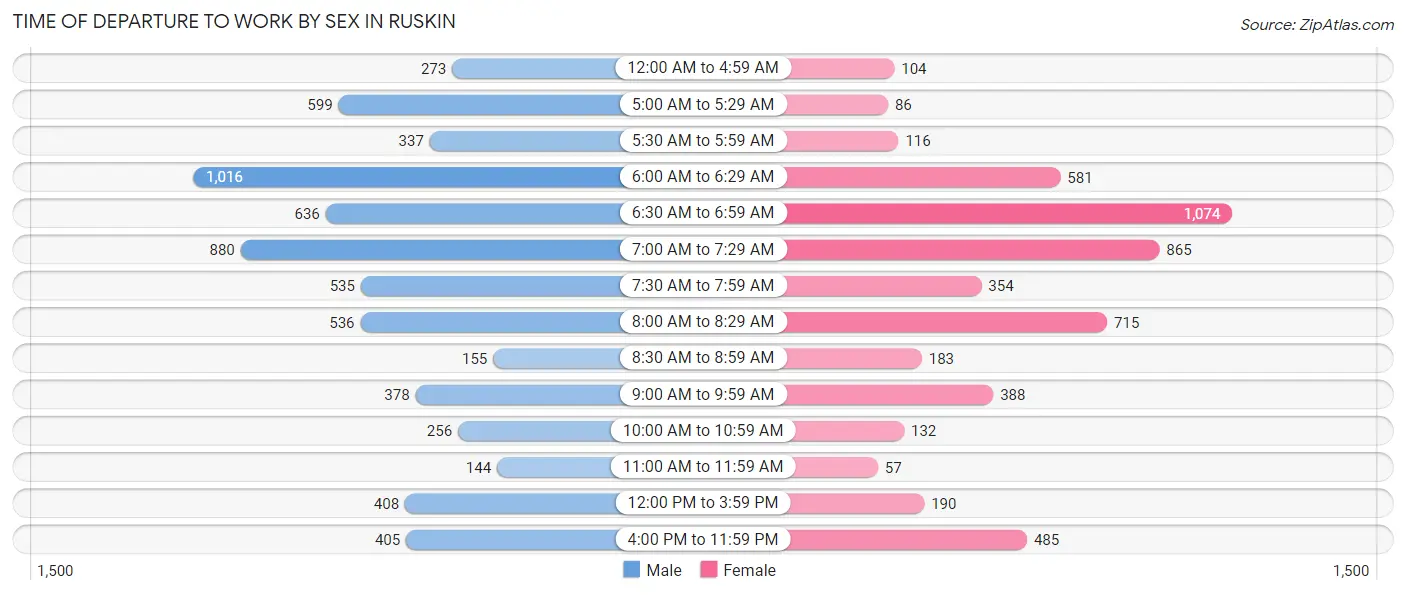
| Time of Departure | Male | Female |
| 12:00 AM to 4:59 AM | 273 (4.2%) | 104 (1.9%) |
| 5:00 AM to 5:29 AM | 599 (9.1%) | 86 (1.6%) |
| 5:30 AM to 5:59 AM | 337 (5.1%) | 116 (2.2%) |
| 6:00 AM to 6:29 AM | 1,016 (15.5%) | 581 (10.9%) |
| 6:30 AM to 6:59 AM | 636 (9.7%) | 1,074 (20.2%) |
| 7:00 AM to 7:29 AM | 880 (13.4%) | 865 (16.2%) |
| 7:30 AM to 7:59 AM | 535 (8.2%) | 354 (6.6%) |
| 8:00 AM to 8:29 AM | 536 (8.2%) | 715 (13.4%) |
| 8:30 AM to 8:59 AM | 155 (2.4%) | 183 (3.4%) |
| 9:00 AM to 9:59 AM | 378 (5.8%) | 388 (7.3%) |
| 10:00 AM to 10:59 AM | 256 (3.9%) | 132 (2.5%) |
| 11:00 AM to 11:59 AM | 144 (2.2%) | 57 (1.1%) |
| 12:00 PM to 3:59 PM | 408 (6.2%) | 190 (3.6%) |
| 4:00 PM to 11:59 PM | 405 (6.2%) | 485 (9.1%) |
| Total | 6,558 (100.0%) | 5,330 (100.0%) |
Housing Occupancy in Ruskin
Occupancy by Ownership in Ruskin
Of the total 9,008 dwellings in Ruskin, owner-occupied units account for 6,504 (72.2%), while renter-occupied units make up 2,504 (27.8%).
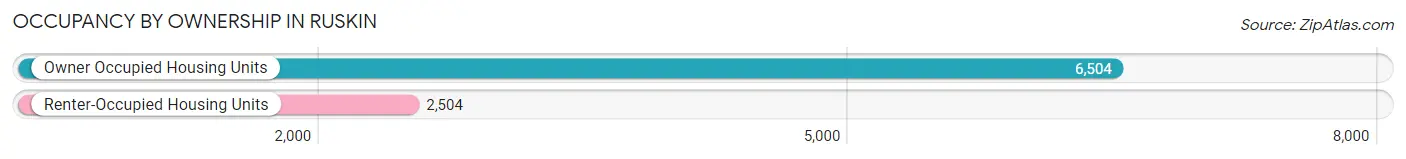
| Occupancy | # Housing Units | % Housing Units |
| Owner Occupied Housing Units | 6,504 | 72.2% |
| Renter-Occupied Housing Units | 2,504 | 27.8% |
| Total Occupied Housing Units | 9,008 | 100.0% |
Occupancy by Household Size in Ruskin
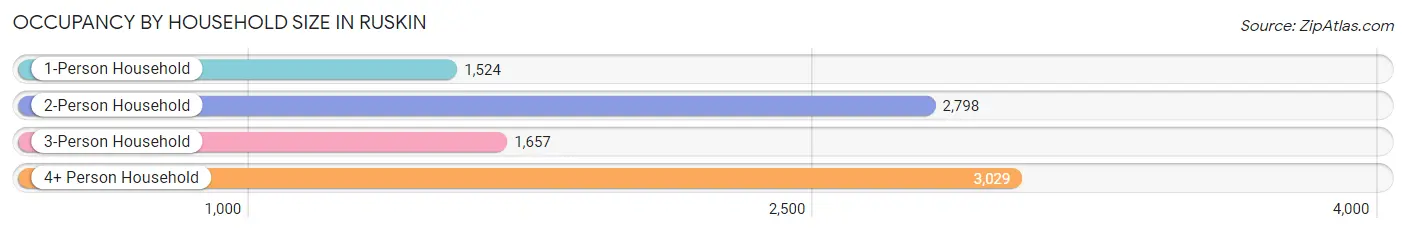
| Household Size | # Housing Units | % Housing Units |
| 1-Person Household | 1,524 | 16.9% |
| 2-Person Household | 2,798 | 31.1% |
| 3-Person Household | 1,657 | 18.4% |
| 4+ Person Household | 3,029 | 33.6% |
| Total Housing Units | 9,008 | 100.0% |
Occupancy by Ownership by Household Size in Ruskin
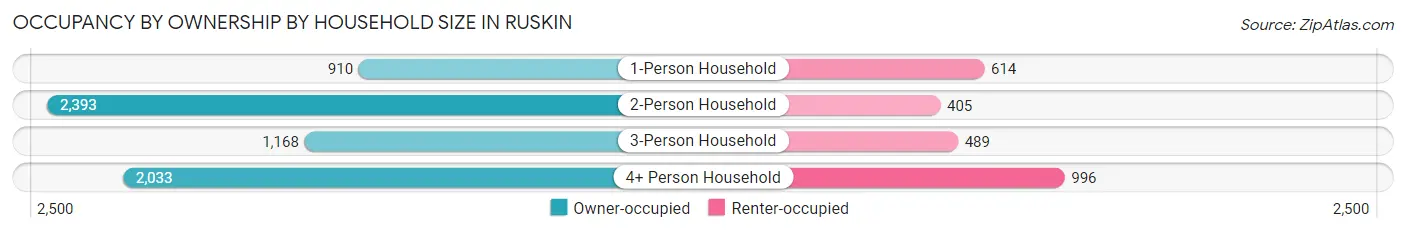
| Household Size | Owner-occupied | Renter-occupied |
| 1-Person Household | 910 (59.7%) | 614 (40.3%) |
| 2-Person Household | 2,393 (85.5%) | 405 (14.5%) |
| 3-Person Household | 1,168 (70.5%) | 489 (29.5%) |
| 4+ Person Household | 2,033 (67.1%) | 996 (32.9%) |
| Total Housing Units | 6,504 (72.2%) | 2,504 (27.8%) |
Occupancy by Educational Attainment in Ruskin
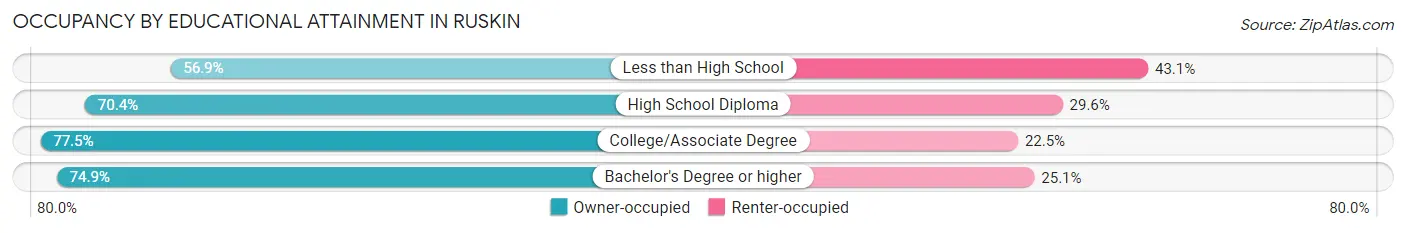
| Household Size | Owner-occupied | Renter-occupied |
| Less than High School | 670 (56.9%) | 508 (43.1%) |
| High School Diploma | 1,839 (70.4%) | 772 (29.6%) |
| College/Associate Degree | 2,550 (77.5%) | 740 (22.5%) |
| Bachelor's Degree or higher | 1,445 (74.9%) | 484 (25.1%) |
Occupancy by Age of Householder in Ruskin
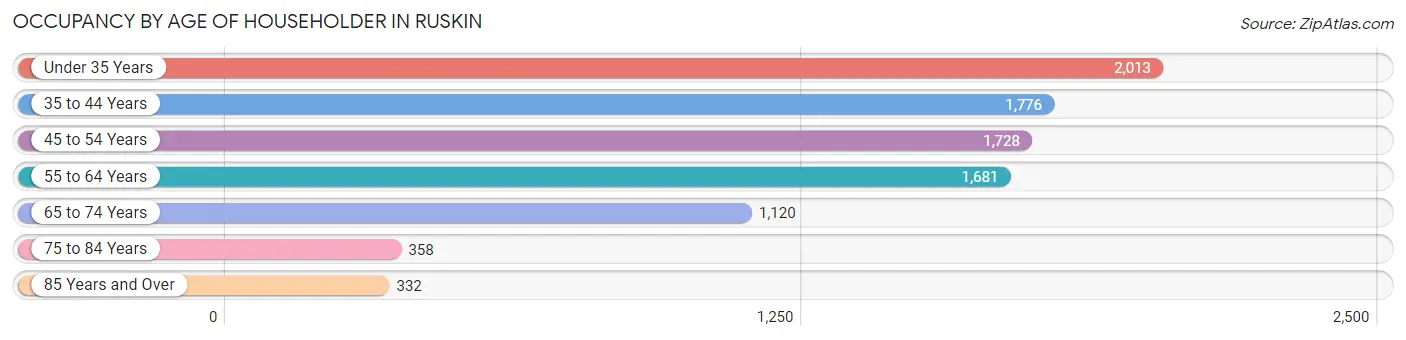
| Age Bracket | # Households | % Households |
| Under 35 Years | 2,013 | 22.4% |
| 35 to 44 Years | 1,776 | 19.7% |
| 45 to 54 Years | 1,728 | 19.2% |
| 55 to 64 Years | 1,681 | 18.7% |
| 65 to 74 Years | 1,120 | 12.4% |
| 75 to 84 Years | 358 | 4.0% |
| 85 Years and Over | 332 | 3.7% |
| Total | 9,008 | 100.0% |
Housing Finances in Ruskin
Median Income by Occupancy in Ruskin
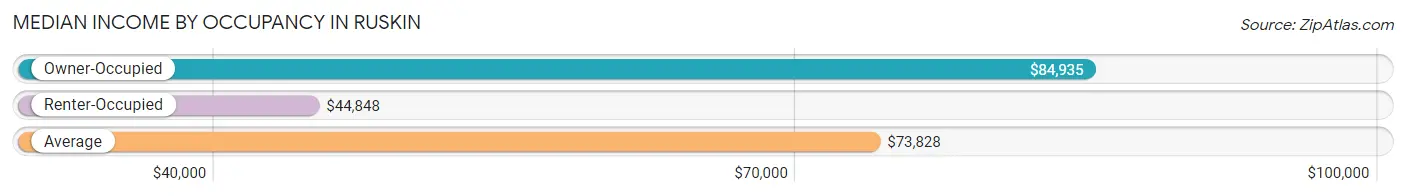
| Occupancy Type | # Households | Median Income |
| Owner-Occupied | 6,504 (72.2%) | $84,935 |
| Renter-Occupied | 2,504 (27.8%) | $44,848 |
| Average | 9,008 (100.0%) | $73,828 |
Occupancy by Householder Income Bracket in Ruskin
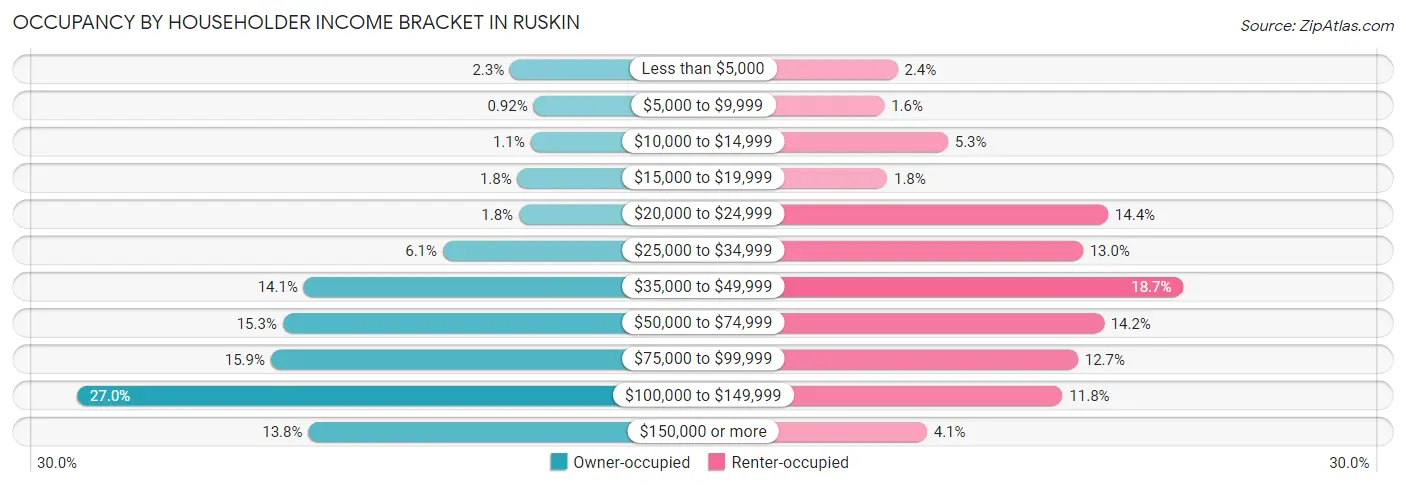
| Income Bracket | Owner-occupied | Renter-occupied |
| Less than $5,000 | 147 (2.3%) | 60 (2.4%) |
| $5,000 to $9,999 | 60 (0.9%) | 41 (1.6%) |
| $10,000 to $14,999 | 71 (1.1%) | 132 (5.3%) |
| $15,000 to $19,999 | 119 (1.8%) | 45 (1.8%) |
| $20,000 to $24,999 | 114 (1.8%) | 361 (14.4%) |
| $25,000 to $34,999 | 397 (6.1%) | 325 (13.0%) |
| $35,000 to $49,999 | 914 (14.1%) | 469 (18.7%) |
| $50,000 to $74,999 | 992 (15.2%) | 355 (14.2%) |
| $75,000 to $99,999 | 1,036 (15.9%) | 318 (12.7%) |
| $100,000 to $149,999 | 1,757 (27.0%) | 296 (11.8%) |
| $150,000 or more | 897 (13.8%) | 102 (4.1%) |
| Total | 6,504 (100.0%) | 2,504 (100.0%) |
Monthly Housing Cost Tiers in Ruskin
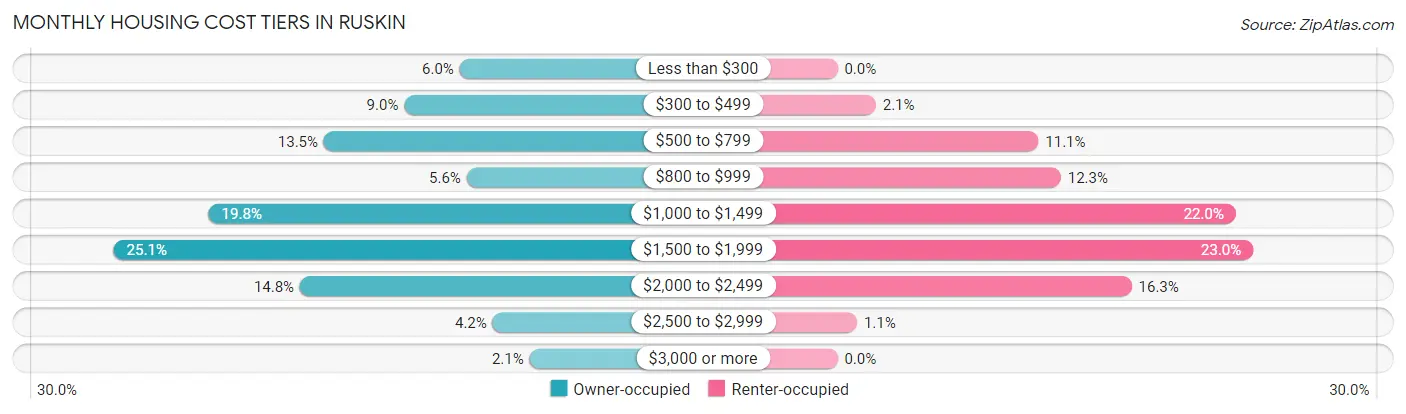
| Monthly Cost | Owner-occupied | Renter-occupied |
| Less than $300 | 388 (6.0%) | 0 (0.0%) |
| $300 to $499 | 587 (9.0%) | 53 (2.1%) |
| $500 to $799 | 876 (13.5%) | 278 (11.1%) |
| $800 to $999 | 363 (5.6%) | 309 (12.3%) |
| $1,000 to $1,499 | 1,290 (19.8%) | 551 (22.0%) |
| $1,500 to $1,999 | 1,631 (25.1%) | 575 (23.0%) |
| $2,000 to $2,499 | 962 (14.8%) | 407 (16.3%) |
| $2,500 to $2,999 | 270 (4.2%) | 27 (1.1%) |
| $3,000 or more | 137 (2.1%) | 0 (0.0%) |
| Total | 6,504 (100.0%) | 2,504 (100.0%) |
Physical Housing Characteristics in Ruskin
Housing Structures in Ruskin
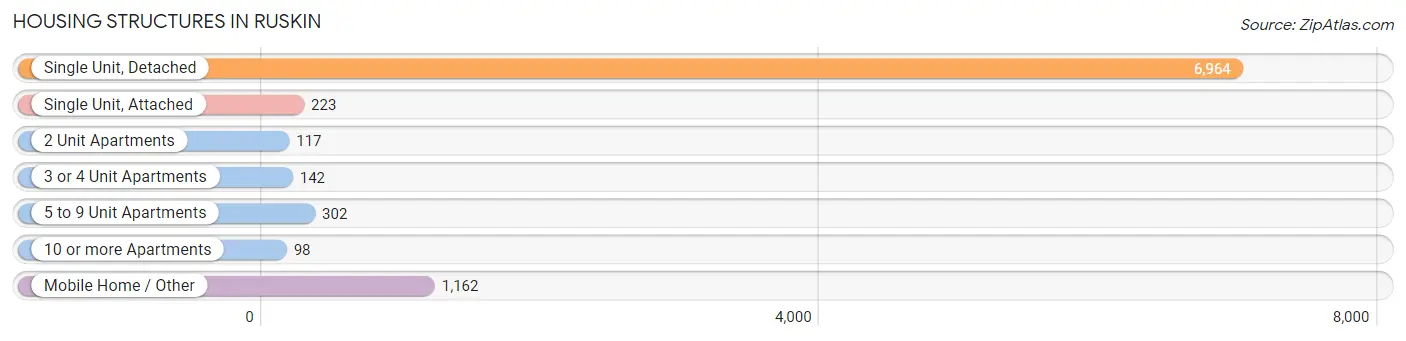
| Structure Type | # Housing Units | % Housing Units |
| Single Unit, Detached | 6,964 | 77.3% |
| Single Unit, Attached | 223 | 2.5% |
| 2 Unit Apartments | 117 | 1.3% |
| 3 or 4 Unit Apartments | 142 | 1.6% |
| 5 to 9 Unit Apartments | 302 | 3.4% |
| 10 or more Apartments | 98 | 1.1% |
| Mobile Home / Other | 1,162 | 12.9% |
| Total | 9,008 | 100.0% |
Housing Structures by Occupancy in Ruskin
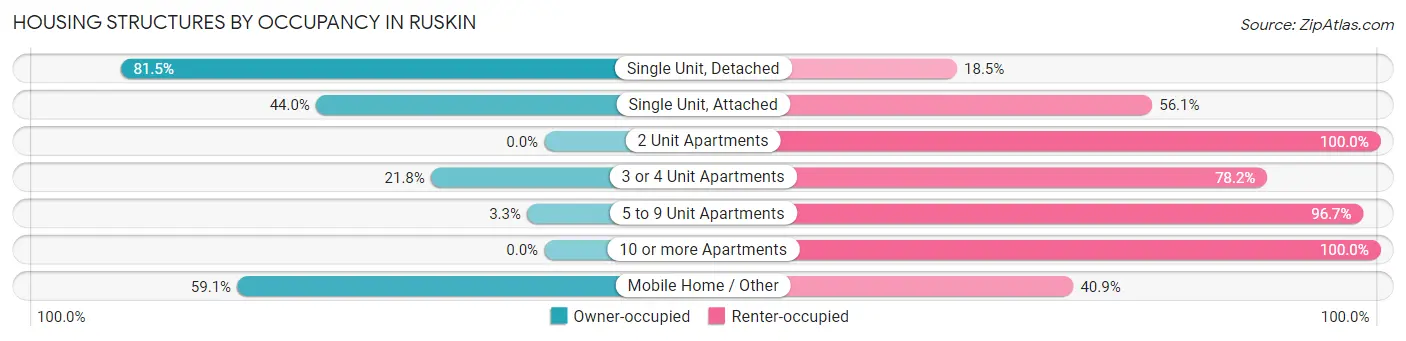
| Structure Type | Owner-occupied | Renter-occupied |
| Single Unit, Detached | 5,678 (81.5%) | 1,286 (18.5%) |
| Single Unit, Attached | 98 (44.0%) | 125 (56.0%) |
| 2 Unit Apartments | 0 (0.0%) | 117 (100.0%) |
| 3 or 4 Unit Apartments | 31 (21.8%) | 111 (78.2%) |
| 5 to 9 Unit Apartments | 10 (3.3%) | 292 (96.7%) |
| 10 or more Apartments | 0 (0.0%) | 98 (100.0%) |
| Mobile Home / Other | 687 (59.1%) | 475 (40.9%) |
| Total | 6,504 (72.2%) | 2,504 (27.8%) |
Housing Structures by Number of Rooms in Ruskin
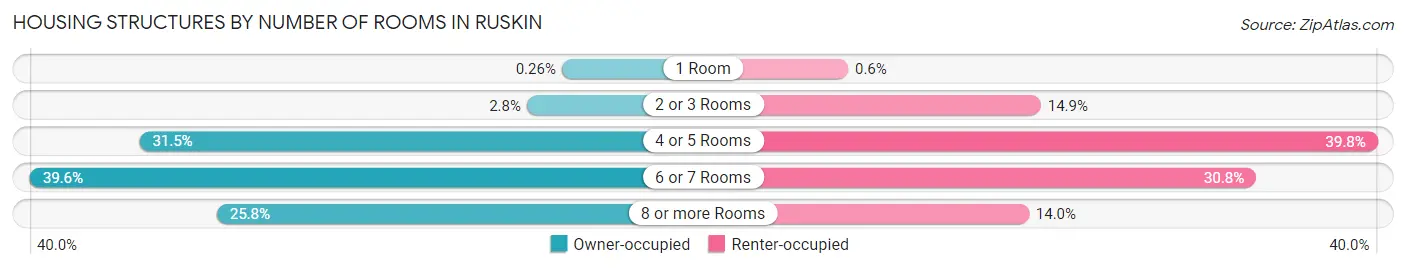
| Number of Rooms | Owner-occupied | Renter-occupied |
| 1 Room | 17 (0.3%) | 15 (0.6%) |
| 2 or 3 Rooms | 185 (2.8%) | 372 (14.9%) |
| 4 or 5 Rooms | 2,049 (31.5%) | 996 (39.8%) |
| 6 or 7 Rooms | 2,576 (39.6%) | 771 (30.8%) |
| 8 or more Rooms | 1,677 (25.8%) | 350 (14.0%) |
| Total | 6,504 (100.0%) | 2,504 (100.0%) |
Housing Structure by Heating Type in Ruskin
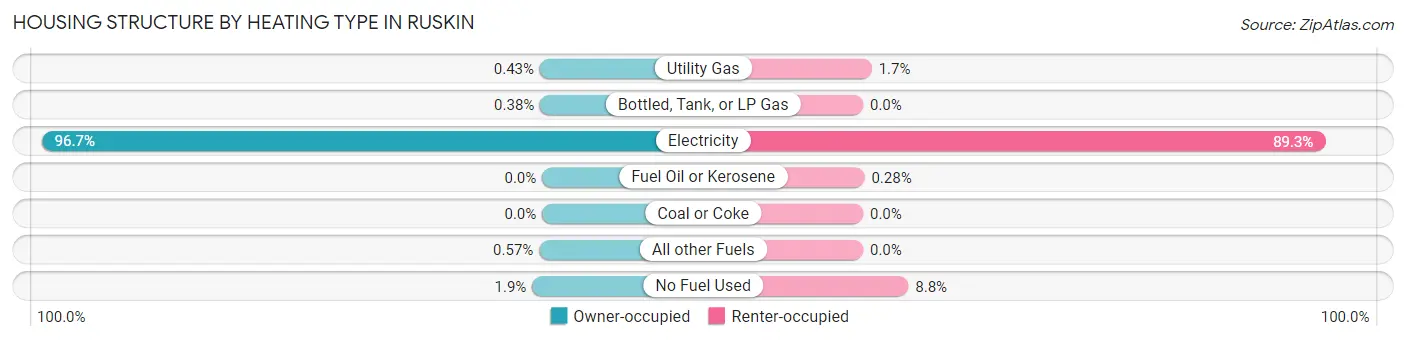
| Heating Type | Owner-occupied | Renter-occupied |
| Utility Gas | 28 (0.4%) | 42 (1.7%) |
| Bottled, Tank, or LP Gas | 25 (0.4%) | 0 (0.0%) |
| Electricity | 6,290 (96.7%) | 2,236 (89.3%) |
| Fuel Oil or Kerosene | 0 (0.0%) | 7 (0.3%) |
| Coal or Coke | 0 (0.0%) | 0 (0.0%) |
| All other Fuels | 37 (0.6%) | 0 (0.0%) |
| No Fuel Used | 124 (1.9%) | 219 (8.7%) |
| Total | 6,504 (100.0%) | 2,504 (100.0%) |
Household Vehicle Usage in Ruskin
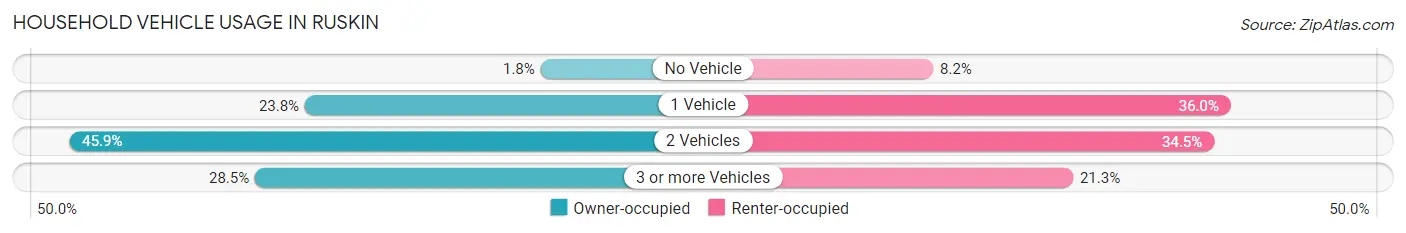
| Vehicles per Household | Owner-occupied | Renter-occupied |
| No Vehicle | 119 (1.8%) | 206 (8.2%) |
| 1 Vehicle | 1,550 (23.8%) | 902 (36.0%) |
| 2 Vehicles | 2,982 (45.9%) | 863 (34.5%) |
| 3 or more Vehicles | 1,853 (28.5%) | 533 (21.3%) |
| Total | 6,504 (100.0%) | 2,504 (100.0%) |
Real Estate & Mortgages in Ruskin
Real Estate and Mortgage Overview in Ruskin
| Characteristic | Without Mortgage | With Mortgage |
| Housing Units | 1,669 | 4,835 |
| Median Property Value | $175,900 | $253,100 |
| Median Household Income | $54,957 | $745 |
| Monthly Housing Costs | $505 | $137 |
| Real Estate Taxes | $1,686 | $199 |
Property Value by Mortgage Status in Ruskin
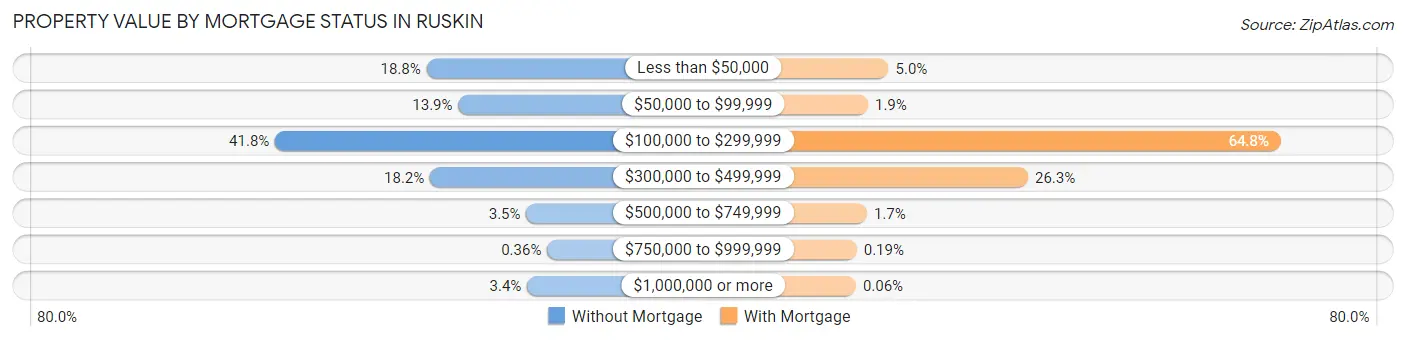
| Property Value | Without Mortgage | With Mortgage |
| Less than $50,000 | 313 (18.8%) | 243 (5.0%) |
| $50,000 to $99,999 | 232 (13.9%) | 92 (1.9%) |
| $100,000 to $299,999 | 698 (41.8%) | 3,133 (64.8%) |
| $300,000 to $499,999 | 304 (18.2%) | 1,271 (26.3%) |
| $500,000 to $749,999 | 59 (3.5%) | 84 (1.7%) |
| $750,000 to $999,999 | 6 (0.4%) | 9 (0.2%) |
| $1,000,000 or more | 57 (3.4%) | 3 (0.1%) |
| Total | 1,669 (100.0%) | 4,835 (100.0%) |
Household Income by Mortgage Status in Ruskin
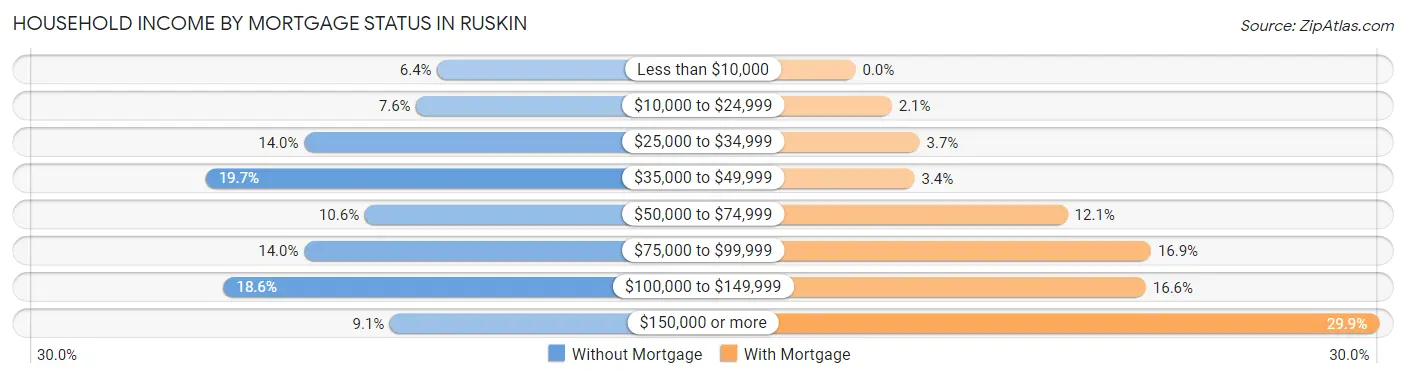
| Household Income | Without Mortgage | With Mortgage |
| Less than $10,000 | 107 (6.4%) | 0 (0.0%) |
| $10,000 to $24,999 | 127 (7.6%) | 100 (2.1%) |
| $25,000 to $34,999 | 234 (14.0%) | 177 (3.7%) |
| $35,000 to $49,999 | 328 (19.7%) | 163 (3.4%) |
| $50,000 to $74,999 | 176 (10.5%) | 586 (12.1%) |
| $75,000 to $99,999 | 234 (14.0%) | 816 (16.9%) |
| $100,000 to $149,999 | 311 (18.6%) | 802 (16.6%) |
| $150,000 or more | 152 (9.1%) | 1,446 (29.9%) |
| Total | 1,669 (100.0%) | 4,835 (100.0%) |
Property Value to Household Income Ratio in Ruskin
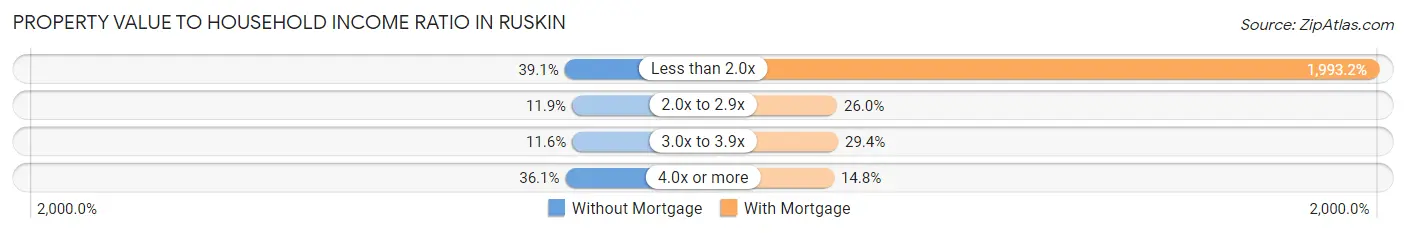
| Value-to-Income Ratio | Without Mortgage | With Mortgage |
| Less than 2.0x | 652 (39.1%) | 96,371 (1,993.2%) |
| 2.0x to 2.9x | 198 (11.9%) | 1,256 (26.0%) |
| 3.0x to 3.9x | 193 (11.6%) | 1,422 (29.4%) |
| 4.0x or more | 603 (36.1%) | 714 (14.8%) |
| Total | 1,669 (100.0%) | 4,835 (100.0%) |
Real Estate Taxes by Mortgage Status in Ruskin
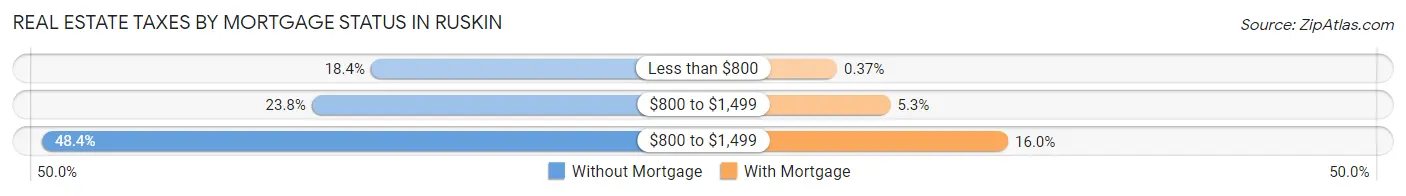
| Property Taxes | Without Mortgage | With Mortgage |
| Less than $800 | 307 (18.4%) | 18 (0.4%) |
| $800 to $1,499 | 397 (23.8%) | 254 (5.2%) |
| $800 to $1,499 | 808 (48.4%) | 773 (16.0%) |
| Total | 1,669 (100.0%) | 4,835 (100.0%) |
Health & Disability in Ruskin
Health Insurance Coverage by Age in Ruskin
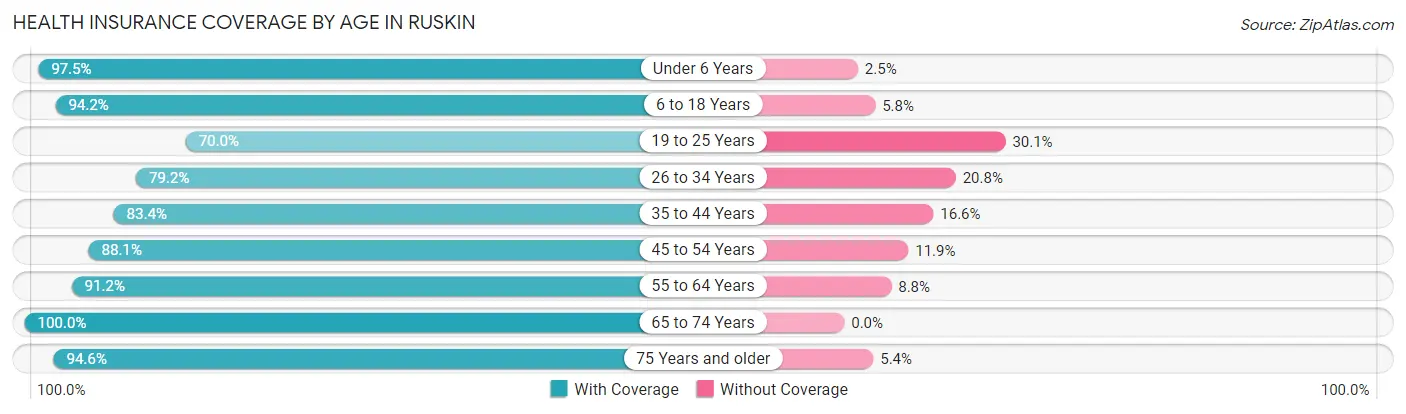
| Age Bracket | With Coverage | Without Coverage |
| Under 6 Years | 2,454 (97.5%) | 64 (2.5%) |
| 6 to 18 Years | 5,941 (94.2%) | 363 (5.8%) |
| 19 to 25 Years | 1,553 (70.0%) | 667 (30.0%) |
| 26 to 34 Years | 3,271 (79.2%) | 858 (20.8%) |
| 35 to 44 Years | 3,519 (83.4%) | 701 (16.6%) |
| 45 to 54 Years | 2,864 (88.1%) | 388 (11.9%) |
| 55 to 64 Years | 2,709 (91.2%) | 260 (8.8%) |
| 65 to 74 Years | 2,054 (100.0%) | 0 (0.0%) |
| 75 Years and older | 1,066 (94.6%) | 61 (5.4%) |
| Total | 25,431 (88.3%) | 3,362 (11.7%) |
Health Insurance Coverage by Citizenship Status in Ruskin
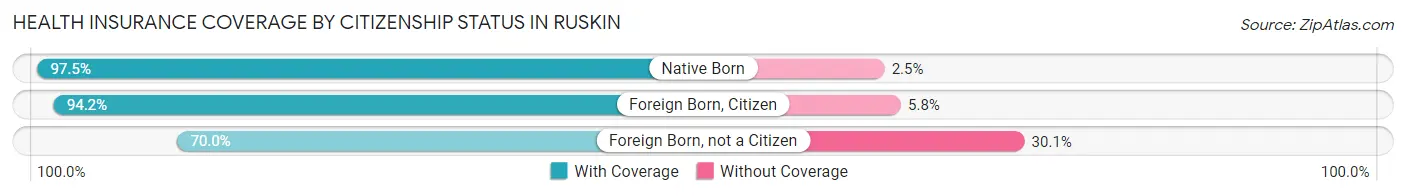
| Citizenship Status | With Coverage | Without Coverage |
| Native Born | 2,454 (97.5%) | 64 (2.5%) |
| Foreign Born, Citizen | 5,941 (94.2%) | 363 (5.8%) |
| Foreign Born, not a Citizen | 1,553 (70.0%) | 667 (30.0%) |
Health Insurance Coverage by Household Income in Ruskin
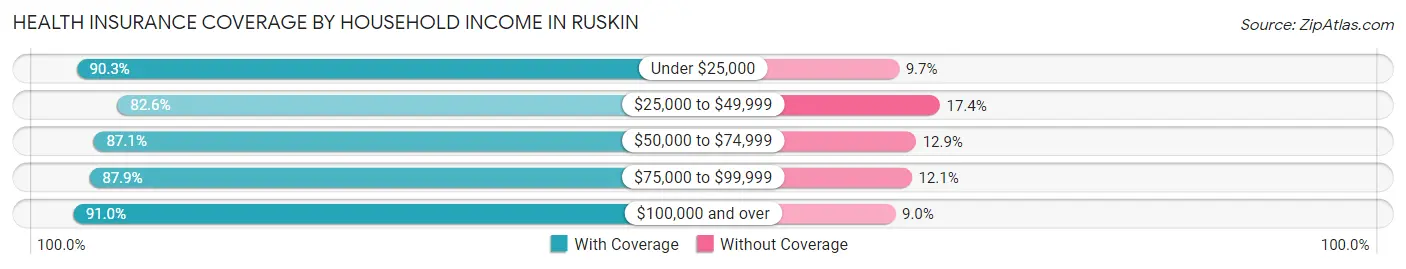
| Household Income | With Coverage | Without Coverage |
| Under $25,000 | 2,462 (90.3%) | 265 (9.7%) |
| $25,000 to $49,999 | 4,484 (82.6%) | 943 (17.4%) |
| $50,000 to $74,999 | 3,644 (87.1%) | 540 (12.9%) |
| $75,000 to $99,999 | 3,617 (87.9%) | 499 (12.1%) |
| $100,000 and over | 11,220 (91.0%) | 1,115 (9.0%) |
Public vs Private Health Insurance Coverage by Age in Ruskin
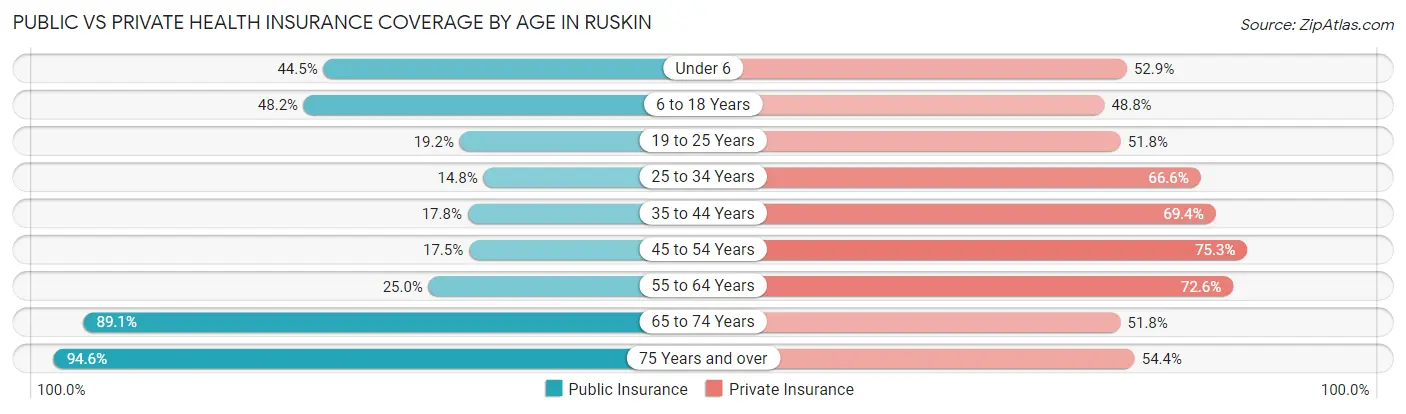
| Age Bracket | Public Insurance | Private Insurance |
| Under 6 | 1,121 (44.5%) | 1,333 (52.9%) |
| 6 to 18 Years | 3,036 (48.2%) | 3,073 (48.7%) |
| 19 to 25 Years | 427 (19.2%) | 1,150 (51.8%) |
| 25 to 34 Years | 612 (14.8%) | 2,750 (66.6%) |
| 35 to 44 Years | 749 (17.7%) | 2,927 (69.4%) |
| 45 to 54 Years | 569 (17.5%) | 2,447 (75.2%) |
| 55 to 64 Years | 742 (25.0%) | 2,156 (72.6%) |
| 65 to 74 Years | 1,829 (89.0%) | 1,063 (51.7%) |
| 75 Years and over | 1,066 (94.6%) | 613 (54.4%) |
| Total | 10,151 (35.3%) | 17,512 (60.8%) |
Disability Status by Sex by Age in Ruskin
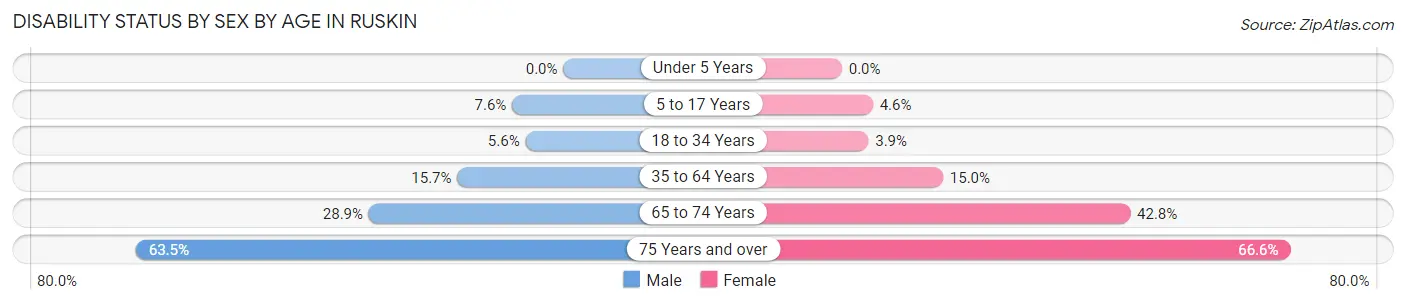
| Age Bracket | Male | Female |
| Under 5 Years | 0 (0.0%) | 0 (0.0%) |
| 5 to 17 Years | 247 (7.6%) | 139 (4.6%) |
| 18 to 34 Years | 187 (5.6%) | 139 (3.9%) |
| 35 to 64 Years | 832 (15.7%) | 774 (15.0%) |
| 65 to 74 Years | 324 (28.9%) | 399 (42.8%) |
| 75 Years and over | 398 (63.5%) | 333 (66.6%) |
Disability Class by Sex by Age in Ruskin
Disability Class: Hearing Difficulty
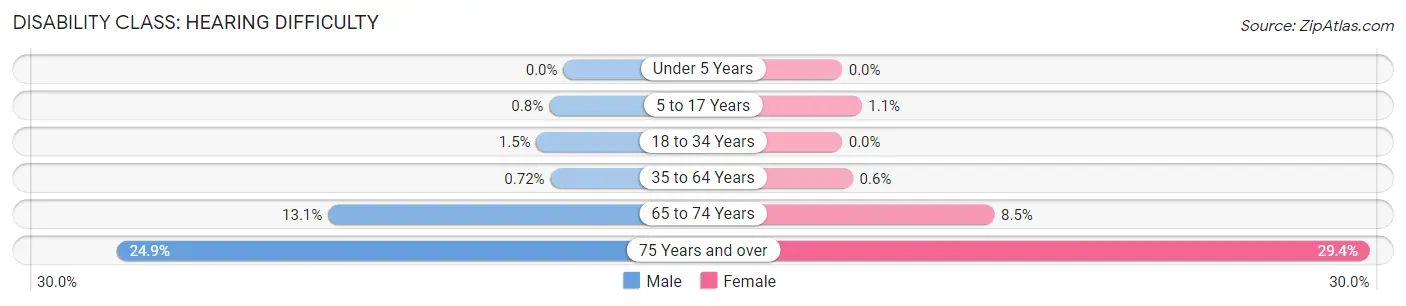
| Age Bracket | Male | Female |
| Under 5 Years | 0 (0.0%) | 0 (0.0%) |
| 5 to 17 Years | 26 (0.8%) | 33 (1.1%) |
| 18 to 34 Years | 50 (1.5%) | 0 (0.0%) |
| 35 to 64 Years | 38 (0.7%) | 31 (0.6%) |
| 65 to 74 Years | 147 (13.1%) | 79 (8.5%) |
| 75 Years and over | 156 (24.9%) | 147 (29.4%) |
Disability Class: Vision Difficulty
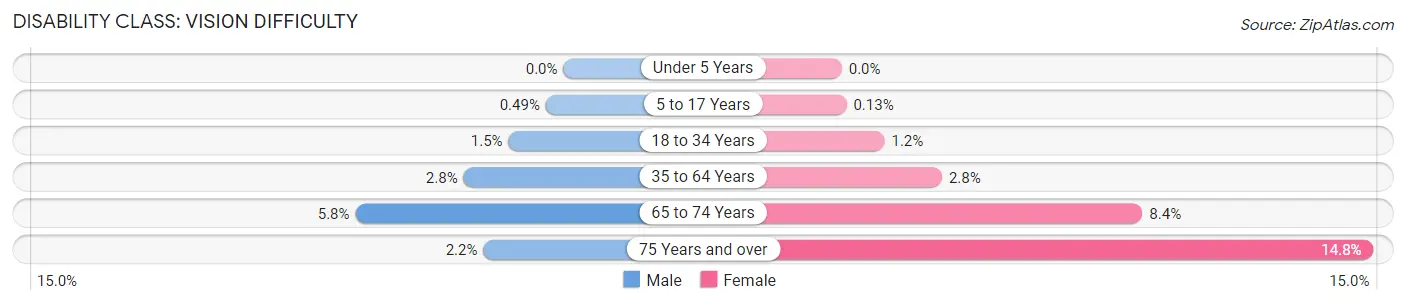
| Age Bracket | Male | Female |
| Under 5 Years | 0 (0.0%) | 0 (0.0%) |
| 5 to 17 Years | 16 (0.5%) | 4 (0.1%) |
| 18 to 34 Years | 51 (1.5%) | 42 (1.2%) |
| 35 to 64 Years | 147 (2.8%) | 144 (2.8%) |
| 65 to 74 Years | 65 (5.8%) | 78 (8.4%) |
| 75 Years and over | 14 (2.2%) | 74 (14.8%) |
Disability Class: Cognitive Difficulty
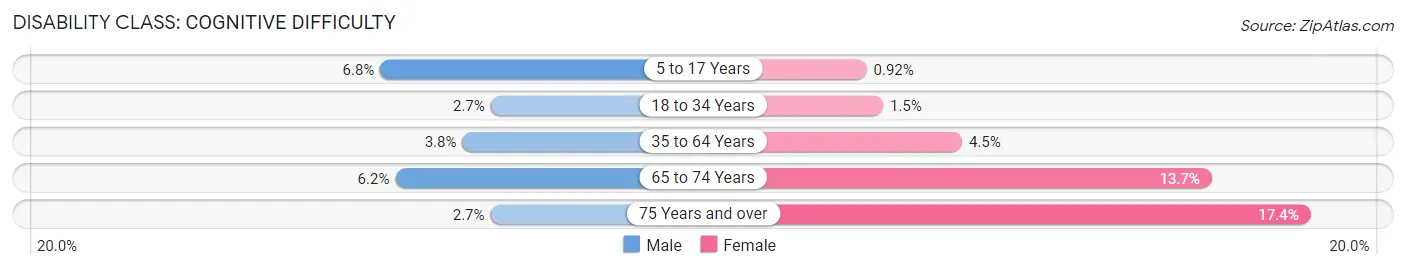
| Age Bracket | Male | Female |
| 5 to 17 Years | 221 (6.8%) | 28 (0.9%) |
| 18 to 34 Years | 90 (2.7%) | 54 (1.5%) |
| 35 to 64 Years | 198 (3.7%) | 230 (4.5%) |
| 65 to 74 Years | 70 (6.2%) | 128 (13.7%) |
| 75 Years and over | 17 (2.7%) | 87 (17.4%) |
Disability Class: Ambulatory Difficulty
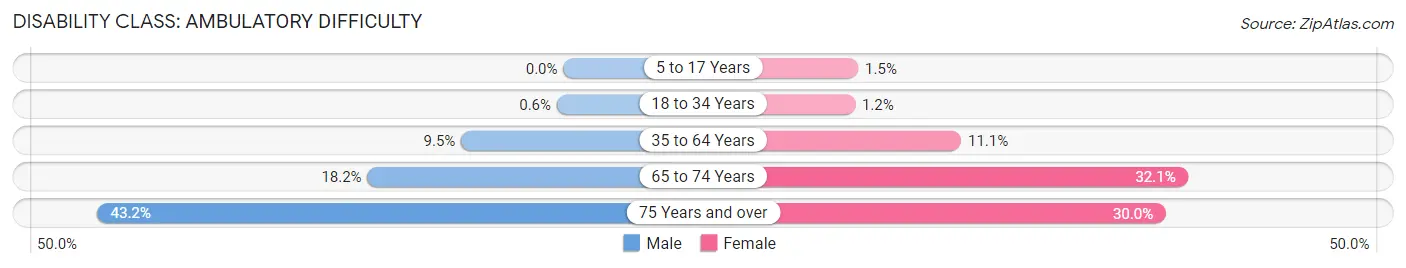
| Age Bracket | Male | Female |
| 5 to 17 Years | 0 (0.0%) | 46 (1.5%) |
| 18 to 34 Years | 20 (0.6%) | 43 (1.2%) |
| 35 to 64 Years | 501 (9.5%) | 571 (11.1%) |
| 65 to 74 Years | 204 (18.2%) | 299 (32.1%) |
| 75 Years and over | 271 (43.2%) | 150 (30.0%) |
Disability Class: Self-Care Difficulty
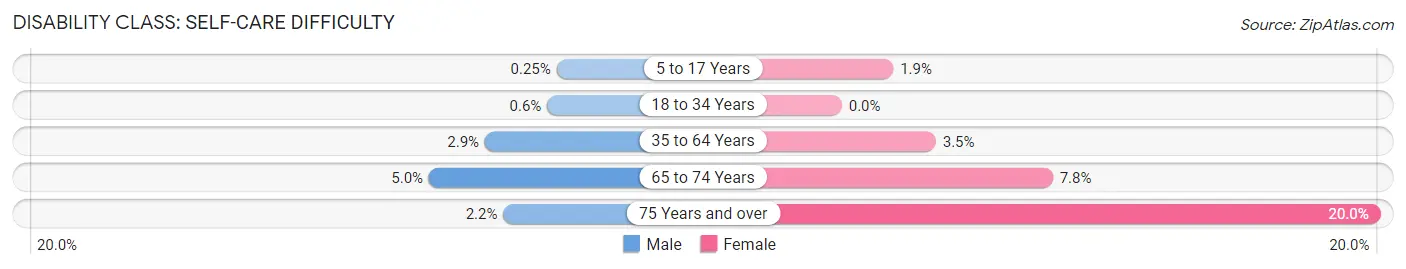
| Age Bracket | Male | Female |
| 5 to 17 Years | 8 (0.3%) | 58 (1.9%) |
| 18 to 34 Years | 20 (0.6%) | 0 (0.0%) |
| 35 to 64 Years | 154 (2.9%) | 180 (3.5%) |
| 65 to 74 Years | 56 (5.0%) | 73 (7.8%) |
| 75 Years and over | 14 (2.2%) | 100 (20.0%) |
Technology Access in Ruskin
Computing Device Access in Ruskin
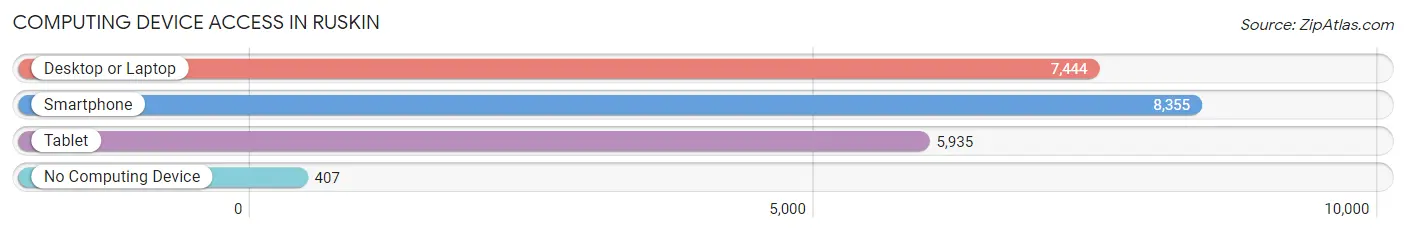
| Device Type | # Households | % Households |
| Desktop or Laptop | 7,444 | 82.6% |
| Smartphone | 8,355 | 92.7% |
| Tablet | 5,935 | 65.9% |
| No Computing Device | 407 | 4.5% |
| Total | 9,008 | 100.0% |
Internet Access in Ruskin
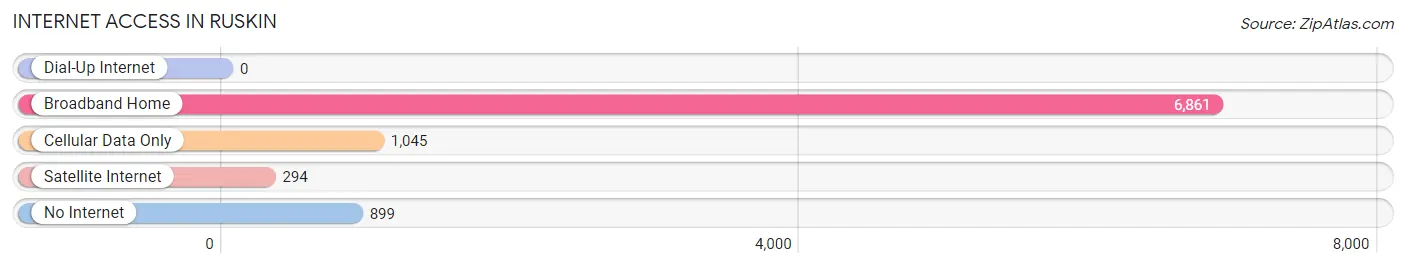
| Internet Type | # Households | % Households |
| Dial-Up Internet | 0 | 0.0% |
| Broadband Home | 6,861 | 76.2% |
| Cellular Data Only | 1,045 | 11.6% |
| Satellite Internet | 294 | 3.3% |
| No Internet | 899 | 10.0% |
| Total | 9,008 | 100.0% |
Ruskin Summary
Ruskin, Florida is a small unincorporated community located in Hillsborough County, Florida. It is situated on the south shore of Tampa Bay, approximately 20 miles south of Tampa. The population of Ruskin was estimated to be 17,208 in 2019.
History
Ruskin was founded in 1908 by Dr. George McAnelly Miller, a physician from South Carolina. He named the town after his friend, the English author and social critic John Ruskin. Miller purchased land from the Florida Central and Peninsular Railroad and began to develop the area. He built a hotel, a post office, a general store, and a school.
The town grew slowly, but by the 1920s, it had become a popular tourist destination. The town was known for its fishing, hunting, and camping. It also had a thriving citrus industry.
In the 1950s, the town began to experience rapid growth. The population increased from 1,000 in 1950 to over 10,000 by 1960. This growth was due to the construction of the Sunshine Skyway Bridge, which connected Ruskin to St. Petersburg and Tampa.
Geography
Ruskin is located in Hillsborough County, Florida. It is situated on the south shore of Tampa Bay, approximately 20 miles south of Tampa. The town is bordered by the Little Manatee River to the east and the Alafia River to the west.
The town has a total area of 11.3 square miles, of which 10.7 square miles is land and 0.6 square miles is water. The terrain is mostly flat, with some rolling hills.
Economy
The economy of Ruskin is largely based on tourism and agriculture. The town is home to several tourist attractions, including the Little Manatee River State Park, the Ruskin Family Drive-In Theater, and the Ruskin Historical Museum.
Agriculture is also an important part of the local economy. The town is home to several citrus groves, as well as vegetable farms and nurseries.
Demographics
As of the 2019 census, the population of Ruskin was estimated to be 17,208. The racial makeup of the town was 79.2% White, 11.2% African American, 0.7% Native American, 1.2% Asian, 0.1% Pacific Islander, 5.2% from other races, and 2.6% from two or more races. Hispanic or Latino of any race were 15.3% of the population.
The median household income in Ruskin was $50,945 in 2019. The per capita income was $25,945. The median age was 38.3 years. About 17.2% of the population was below the poverty line.
Common Questions
What is Per Capita Income in Ruskin?
Per Capita income in Ruskin is $28,055.
What is the Median Family Income in Ruskin?
Median Family Income in Ruskin is $80,114.
What is the Median Household income in Ruskin?
Median Household Income in Ruskin is $73,828.
What is Income or Wage Gap in Ruskin?
Income or Wage Gap in Ruskin is 22.2%.
Women in Ruskin earn 77.8 cents for every dollar earned by a man.
What is Family Income Deficit in Ruskin?
Family Income Deficit in Ruskin is $10,016.
Families that are below poverty line in Ruskin earn $10,016 less on average than the poverty threshold level.
What is Inequality or Gini Index in Ruskin?
Inequality or Gini Index in Ruskin is 0.39.
What is the Total Population of Ruskin?
Total Population of Ruskin is 28,878.
What is the Total Male Population of Ruskin?
Total Male Population of Ruskin is 14,689.
What is the Total Female Population of Ruskin?
Total Female Population of Ruskin is 14,189.
What is the Ratio of Males per 100 Females in Ruskin?
There are 103.52 Males per 100 Females in Ruskin.
What is the Ratio of Females per 100 Males in Ruskin?
There are 96.60 Females per 100 Males in Ruskin.
What is the Median Population Age in Ruskin?
Median Population Age in Ruskin is 32.9 Years.
What is the Average Family Size in Ruskin
Average Family Size in Ruskin is 3.6 People.
What is the Average Household Size in Ruskin
Average Household Size in Ruskin is 3.2 People.
How Large is the Labor Force in Ruskin?
There are 14,406 People in the Labor Forcein in Ruskin.
What is the Percentage of People in the Labor Force in Ruskin?
66.7% of People are in the Labor Force in Ruskin.
What is the Unemployment Rate in Ruskin?
Unemployment Rate in Ruskin is 5.3%.