Noblesville, IN Map & Demographics
Noblesville Map
Noblesville Overview
$44,826
PER CAPITA INCOME
$117,019
AVG FAMILY INCOME
$99,458
AVG HOUSEHOLD INCOME
37.6%
WAGE / INCOME GAP [ % ]
62.4¢/ $1
WAGE / INCOME GAP [ $ ]
0.40
INEQUALITY / GINI INDEX
70,442
TOTAL POPULATION
35,378
MALE POPULATION
35,064
FEMALE POPULATION
100.90
MALES / 100 FEMALES
99.11
FEMALES / 100 MALES
34.4
MEDIAN AGE
3.2
AVG FAMILY SIZE
2.7
AVG HOUSEHOLD SIZE
39,583
LABOR FORCE [ PEOPLE ]
73.1%
PERCENT IN LABOR FORCE
3.4%
UNEMPLOYMENT RATE
Noblesville Area Codes
Income in Noblesville
Income Overview in Noblesville
Per Capita Income in Noblesville is $44,826, while median incomes of families and households are $117,019 and $99,458 respectively.
| Characteristic | Number | Measure |
| Per Capita Income | 70,442 | $44,826 |
| Median Family Income | 18,832 | $117,019 |
| Mean Family Income | 18,832 | $139,861 |
| Median Household Income | 25,502 | $99,458 |
| Mean Household Income | 25,502 | $122,329 |
| Income Deficit | 18,832 | $0 |
| Wage / Income Gap (%) | 70,442 | 37.64% |
| Wage / Income Gap ($) | 70,442 | 62.36¢ per $1 |
| Gini / Inequality Index | 70,442 | 0.40 |
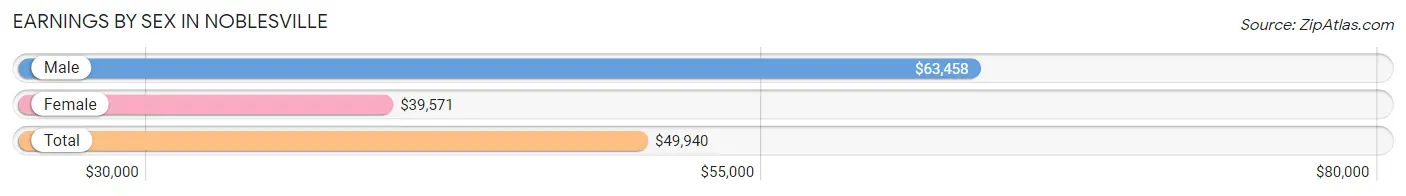
Earnings by Sex in Noblesville
Average Earnings in Noblesville are $49,940, $63,458 for men and $39,571 for women, a difference of 37.6%.
| Sex | Number | Average Earnings |
| Male | 21,743 (53.5%) | $63,458 |
| Female | 18,859 (46.5%) | $39,571 |
| Total | 40,602 (100.0%) | $49,940 |
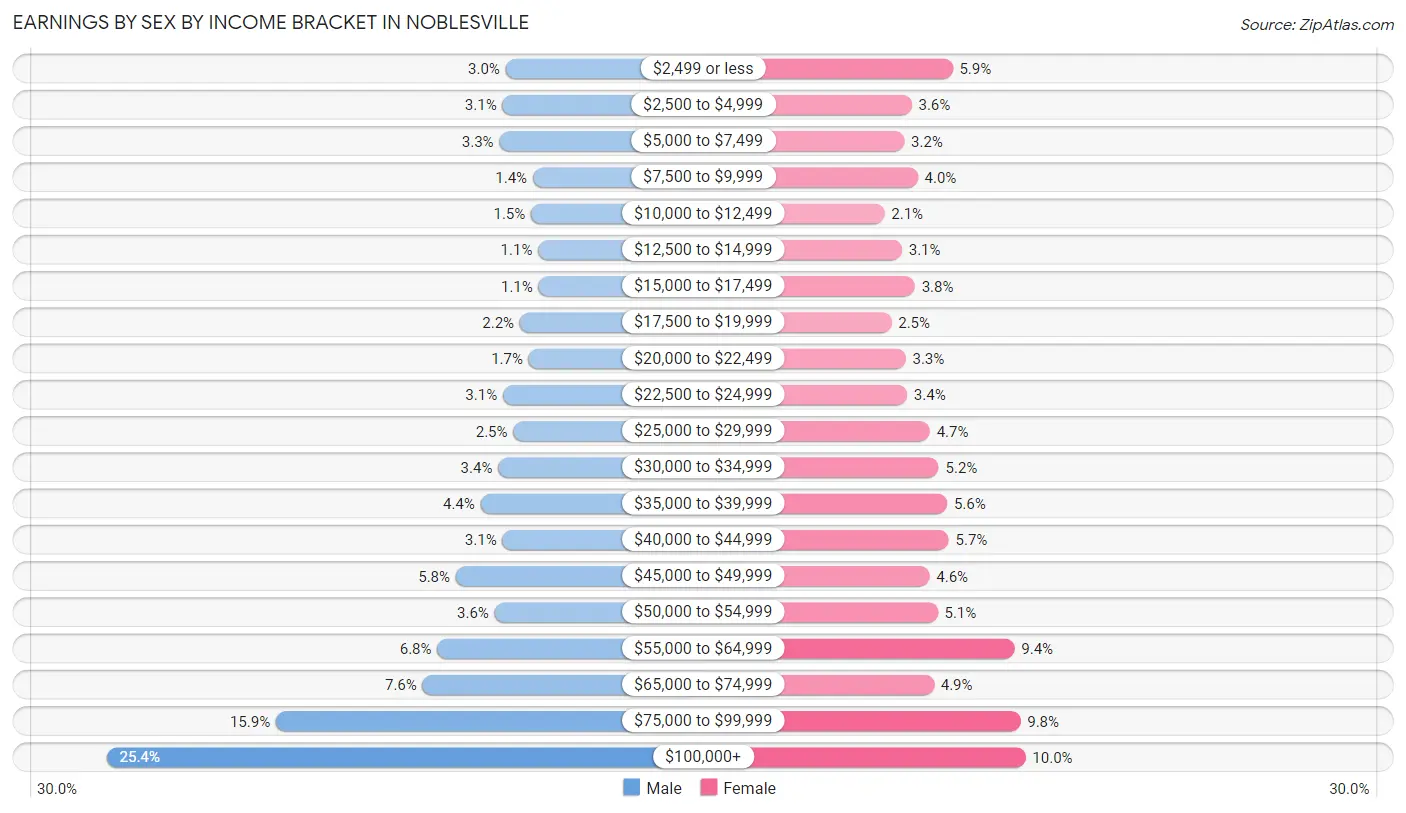
Earnings by Sex by Income Bracket in Noblesville
The most common earnings brackets in Noblesville are $100,000+ for men (5,520 | 25.4%) and $100,000+ for women (1,894 | 10.0%).
| Income | Male | Female |
| $2,499 or less | 644 (3.0%) | 1,120 (5.9%) |
| $2,500 to $4,999 | 683 (3.1%) | 687 (3.6%) |
| $5,000 to $7,499 | 719 (3.3%) | 608 (3.2%) |
| $7,500 to $9,999 | 310 (1.4%) | 751 (4.0%) |
| $10,000 to $12,499 | 332 (1.5%) | 397 (2.1%) |
| $12,500 to $14,999 | 246 (1.1%) | 583 (3.1%) |
| $15,000 to $17,499 | 241 (1.1%) | 720 (3.8%) |
| $17,500 to $19,999 | 470 (2.2%) | 472 (2.5%) |
| $20,000 to $22,499 | 360 (1.7%) | 623 (3.3%) |
| $22,500 to $24,999 | 677 (3.1%) | 637 (3.4%) |
| $25,000 to $29,999 | 550 (2.5%) | 878 (4.7%) |
| $30,000 to $34,999 | 736 (3.4%) | 974 (5.2%) |
| $35,000 to $39,999 | 951 (4.4%) | 1,062 (5.6%) |
| $40,000 to $44,999 | 682 (3.1%) | 1,079 (5.7%) |
| $45,000 to $49,999 | 1,253 (5.8%) | 875 (4.6%) |
| $50,000 to $54,999 | 779 (3.6%) | 962 (5.1%) |
| $55,000 to $64,999 | 1,479 (6.8%) | 1,777 (9.4%) |
| $65,000 to $74,999 | 1,660 (7.6%) | 922 (4.9%) |
| $75,000 to $99,999 | 3,451 (15.9%) | 1,838 (9.8%) |
| $100,000+ | 5,520 (25.4%) | 1,894 (10.0%) |
| Total | 21,743 (100.0%) | 18,859 (100.0%) |
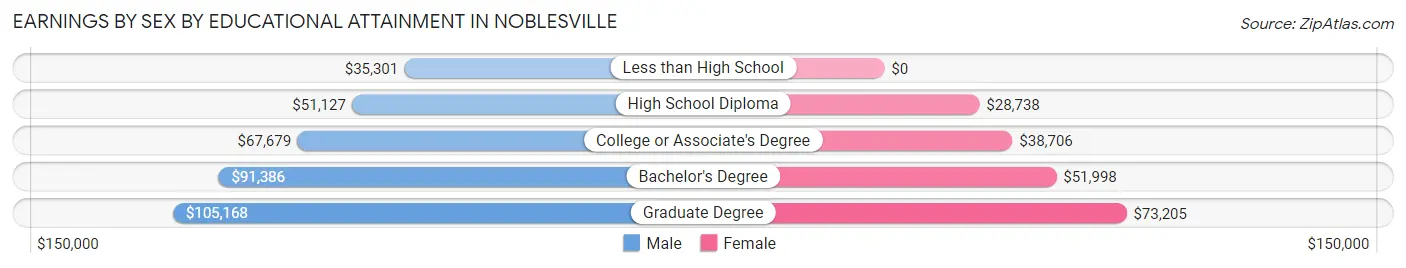
Earnings by Sex by Educational Attainment in Noblesville
Average earnings in Noblesville are $72,289 for men and $46,462 for women, a difference of 35.7%. Men with an educational attainment of graduate degree enjoy the highest average annual earnings of $105,168, while those with less than high school education earn the least with $35,301. Women with an educational attainment of graduate degree earn the most with the average annual earnings of $73,205, while those with high school diploma education have the smallest earnings of $28,738.
| Educational Attainment | Male Income | Female Income |
| Less than High School | $35,301 | $0 |
| High School Diploma | $51,127 | $28,738 |
| College or Associate's Degree | $67,679 | $38,706 |
| Bachelor's Degree | $91,386 | $51,998 |
| Graduate Degree | $105,168 | $73,205 |
| Total | $72,289 | $46,462 |
Family Income in Noblesville
Family Income Brackets in Noblesville
According to the Noblesville family income data, there are 4,877 families falling into the $100,000 to $149,999 income range, which is the most common income bracket and makes up 25.9% of all families. Conversely, the $10,000 to $14,999 income bracket is the least frequent group with only 94 families (0.5%) belonging to this category.
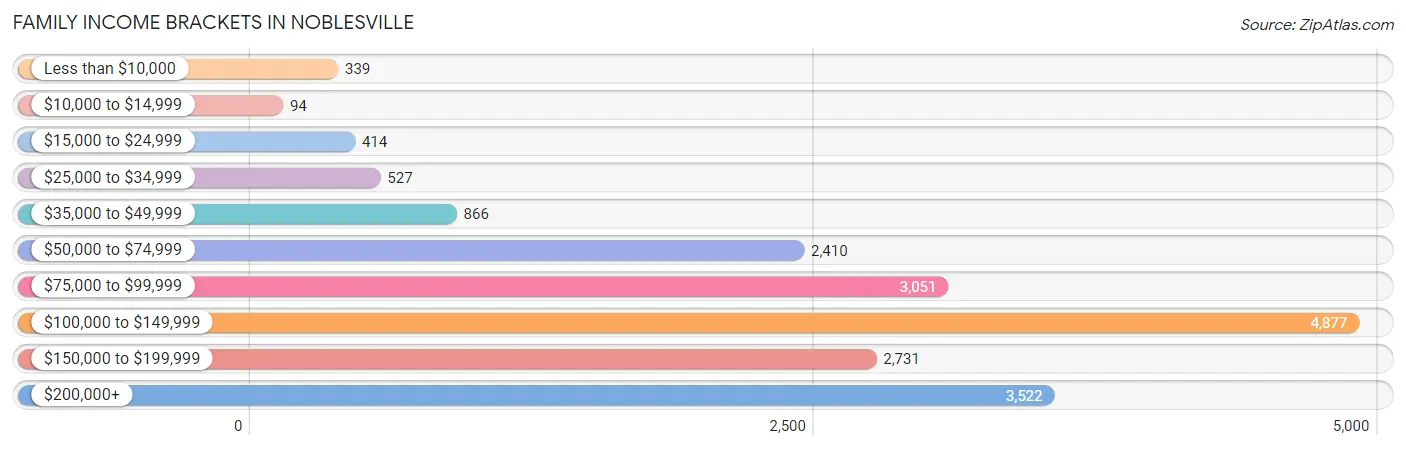
| Income Bracket | # Families | % Families |
| Less than $10,000 | 339 | 1.8% |
| $10,000 to $14,999 | 94 | 0.5% |
| $15,000 to $24,999 | 414 | 2.2% |
| $25,000 to $34,999 | 527 | 2.8% |
| $35,000 to $49,999 | 866 | 4.6% |
| $50,000 to $74,999 | 2,410 | 12.8% |
| $75,000 to $99,999 | 3,051 | 16.2% |
| $100,000 to $149,999 | 4,877 | 25.9% |
| $150,000 to $199,999 | 2,731 | 14.5% |
| $200,000+ | 3,522 | 18.7% |
Family Income by Famaliy Size in Noblesville
7+ person families (111 | 0.6%) account for the highest median family income in Noblesville with $172,536 per family, while 2-person families (7,443 | 39.5%) have the highest median income of $49,880 per family member.
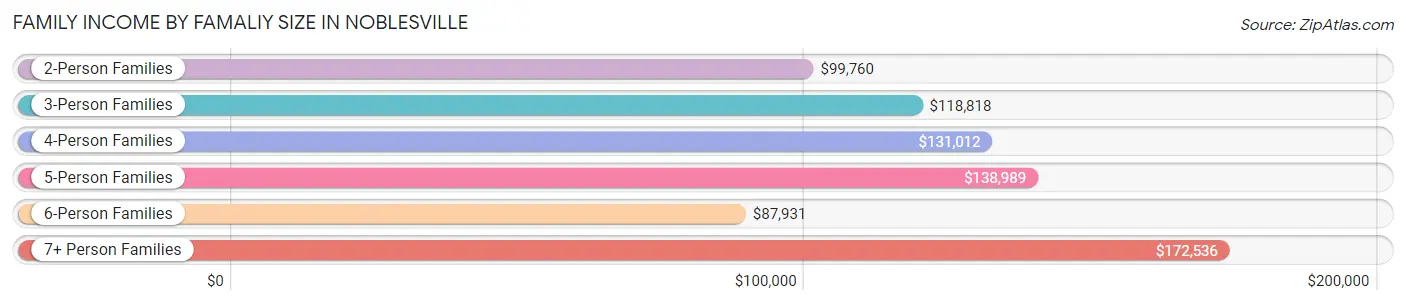
| Income Bracket | # Families | Median Income |
| 2-Person Families | 7,443 (39.5%) | $99,760 |
| 3-Person Families | 3,984 (21.2%) | $118,818 |
| 4-Person Families | 5,100 (27.1%) | $131,012 |
| 5-Person Families | 1,574 (8.4%) | $138,989 |
| 6-Person Families | 620 (3.3%) | $87,931 |
| 7+ Person Families | 111 (0.6%) | $172,536 |
| Total | 18,832 (100.0%) | $117,019 |
Family Income by Number of Earners in Noblesville
The median family income in Noblesville is $117,019, with families comprising 3+ earners (2,126) having the highest median family income of $166,481, while families with no earners (1,695) have the lowest median family income of $61,964, accounting for 11.3% and 9.0% of families, respectively.
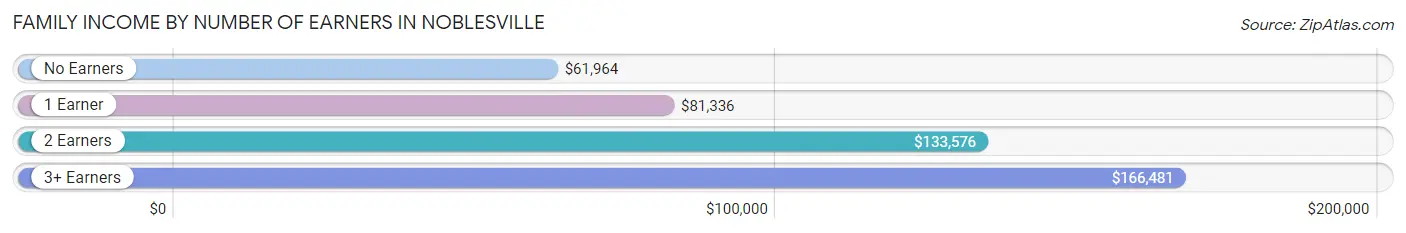
| Number of Earners | # Families | Median Income |
| No Earners | 1,695 (9.0%) | $61,964 |
| 1 Earner | 5,368 (28.5%) | $81,336 |
| 2 Earners | 9,643 (51.2%) | $133,576 |
| 3+ Earners | 2,126 (11.3%) | $166,481 |
| Total | 18,832 (100.0%) | $117,019 |
Household Income in Noblesville
Household Income Brackets in Noblesville
With 5,891 households falling in the category, the $100,000 to $149,999 income range is the most frequent in Noblesville, accounting for 23.1% of all households. In contrast, only 332 households (1.3%) fall into the $10,000 to $14,999 income bracket, making it the least populous group.
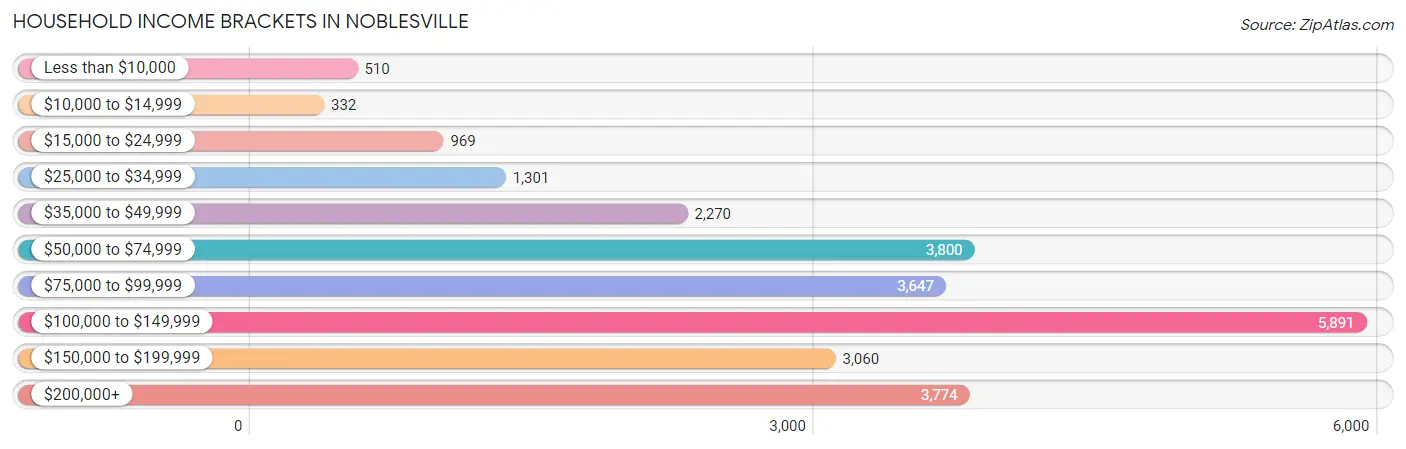
| Income Bracket | # Households | % Households |
| Less than $10,000 | 510 | 2.0% |
| $10,000 to $14,999 | 332 | 1.3% |
| $15,000 to $24,999 | 969 | 3.8% |
| $25,000 to $34,999 | 1,301 | 5.1% |
| $35,000 to $49,999 | 2,270 | 8.9% |
| $50,000 to $74,999 | 3,800 | 14.9% |
| $75,000 to $99,999 | 3,647 | 14.3% |
| $100,000 to $149,999 | 5,891 | 23.1% |
| $150,000 to $199,999 | 3,060 | 12.0% |
| $200,000+ | 3,774 | 14.8% |
Household Income by Householder Age in Noblesville
The median household income in Noblesville is $99,458, with the highest median household income of $118,230 found in the 45 to 64 years age bracket for the primary householder. A total of 8,799 households (34.5%) fall into this category. Meanwhile, the 15 to 24 years age bracket for the primary householder has the lowest median household income of $53,067, with 1,158 households (4.5%) in this group.

| Income Bracket | # Households | Median Income |
| 15 to 24 Years | 1,158 (4.5%) | $53,067 |
| 25 to 44 Years | 10,666 (41.8%) | $110,712 |
| 45 to 64 Years | 8,799 (34.5%) | $118,230 |
| 65+ Years | 4,879 (19.1%) | $71,384 |
| Total | 25,502 (100.0%) | $99,458 |
Poverty in Noblesville
Income Below Poverty by Sex and Age in Noblesville
With 4.0% poverty level for males and 6.9% for females among the residents of Noblesville, 75 year old and over males and 16 and 17 year old females are the most vulnerable to poverty, with 78 males (6.4%) and 125 females (13.2%) in their respective age groups living below the poverty level.
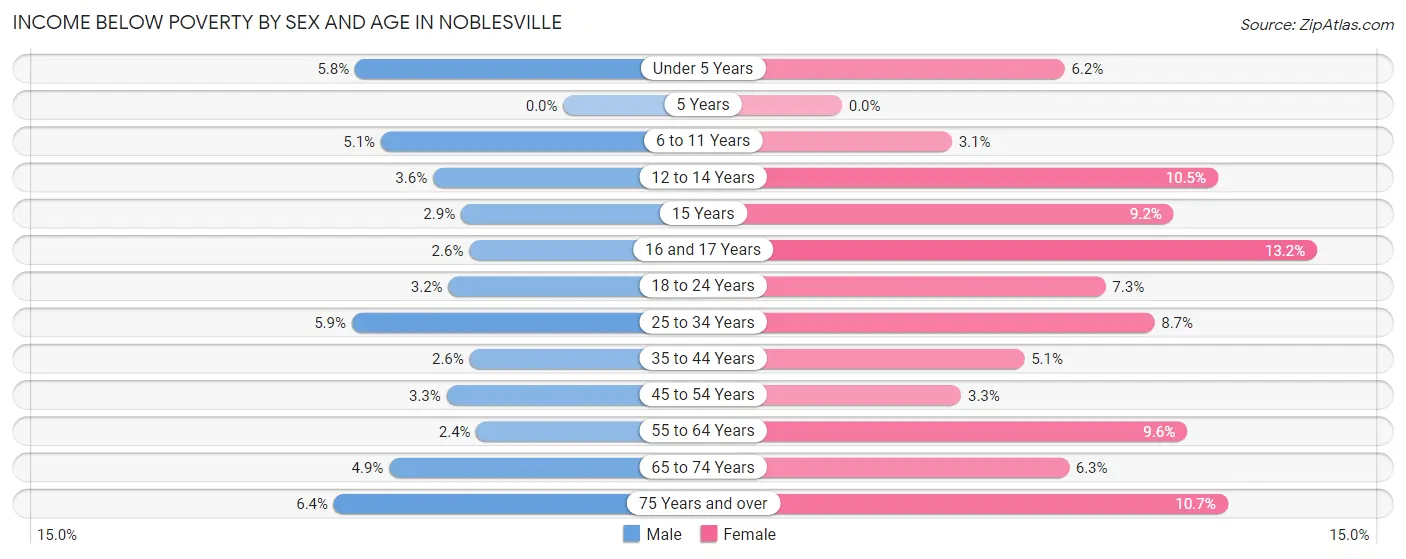
| Age Bracket | Male | Female |
| Under 5 Years | 167 (5.8%) | 171 (6.2%) |
| 5 Years | 0 (0.0%) | 0 (0.0%) |
| 6 to 11 Years | 160 (5.1%) | 64 (3.1%) |
| 12 to 14 Years | 45 (3.6%) | 191 (10.5%) |
| 15 Years | 21 (2.9%) | 46 (9.2%) |
| 16 and 17 Years | 31 (2.6%) | 125 (13.2%) |
| 18 to 24 Years | 113 (3.2%) | 245 (7.3%) |
| 25 to 34 Years | 303 (5.9%) | 458 (8.7%) |
| 35 to 44 Years | 138 (2.6%) | 259 (5.1%) |
| 45 to 54 Years | 152 (3.3%) | 140 (3.3%) |
| 55 to 64 Years | 77 (2.4%) | 352 (9.6%) |
| 65 to 74 Years | 104 (4.9%) | 173 (6.3%) |
| 75 Years and over | 78 (6.4%) | 188 (10.7%) |
| Total | 1,389 (4.0%) | 2,412 (6.9%) |
Income Above Poverty by Sex and Age in Noblesville
According to the poverty statistics in Noblesville, males aged 5 years and females aged 5 years are the age groups that are most secure financially, with 100.0% of males and 100.0% of females in these age groups living above the poverty line.
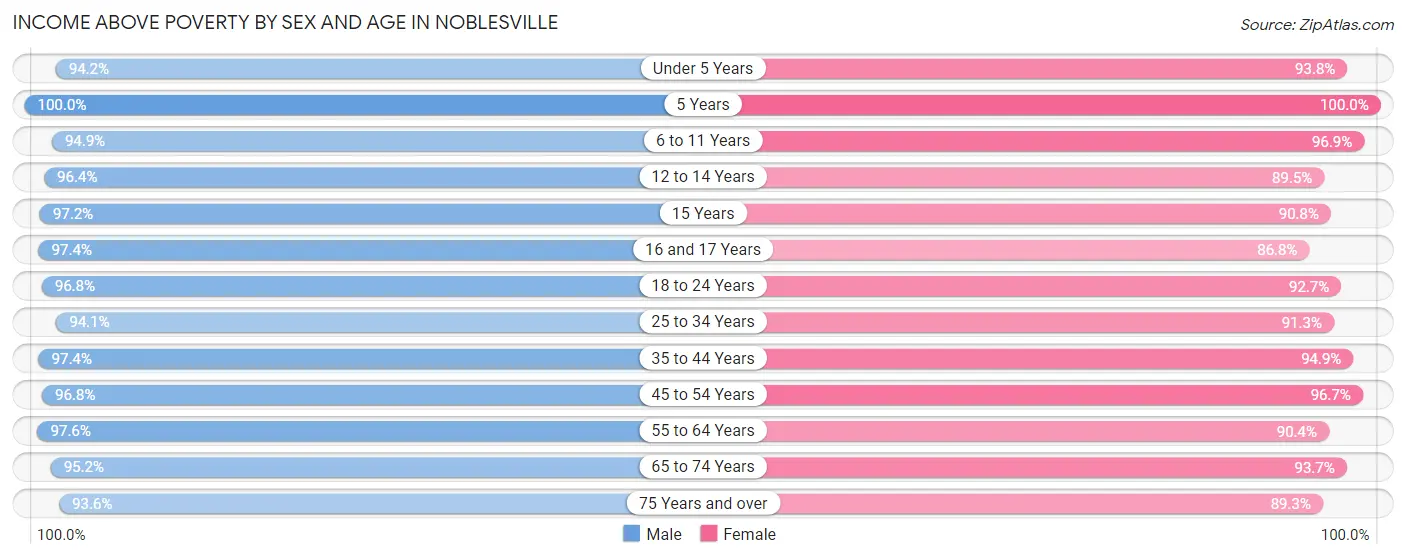
| Age Bracket | Male | Female |
| Under 5 Years | 2,710 (94.2%) | 2,587 (93.8%) |
| 5 Years | 394 (100.0%) | 556 (100.0%) |
| 6 to 11 Years | 2,992 (94.9%) | 2,027 (96.9%) |
| 12 to 14 Years | 1,196 (96.4%) | 1,633 (89.5%) |
| 15 Years | 716 (97.2%) | 452 (90.8%) |
| 16 and 17 Years | 1,153 (97.4%) | 820 (86.8%) |
| 18 to 24 Years | 3,416 (96.8%) | 3,093 (92.7%) |
| 25 to 34 Years | 4,845 (94.1%) | 4,804 (91.3%) |
| 35 to 44 Years | 5,148 (97.4%) | 4,841 (94.9%) |
| 45 to 54 Years | 4,523 (96.8%) | 4,080 (96.7%) |
| 55 to 64 Years | 3,106 (97.6%) | 3,311 (90.4%) |
| 65 to 74 Years | 2,042 (95.2%) | 2,563 (93.7%) |
| 75 Years and over | 1,142 (93.6%) | 1,562 (89.3%) |
| Total | 33,383 (96.0%) | 32,329 (93.1%) |
Income Below Poverty Among Married-Couple Families in Noblesville
The poverty statistics for married-couple families in Noblesville show that 2.1% or 313 of the total 15,126 families live below the poverty line. Families with 3 or 4 children have the highest poverty rate of 9.4%, comprising of 126 families. On the other hand, families with 5 or more children have the lowest poverty rate of 0.0%, which includes 0 families.
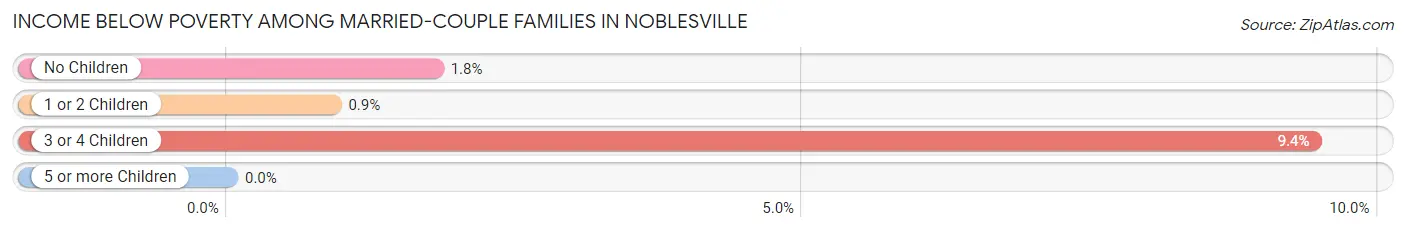
| Children | Above Poverty | Below Poverty |
| No Children | 6,968 (98.2%) | 127 (1.8%) |
| 1 or 2 Children | 6,580 (99.1%) | 60 (0.9%) |
| 3 or 4 Children | 1,210 (90.6%) | 126 (9.4%) |
| 5 or more Children | 55 (100.0%) | 0 (0.0%) |
| Total | 14,813 (97.9%) | 313 (2.1%) |
Income Below Poverty Among Single-Parent Households in Noblesville
According to the poverty data in Noblesville, 3.3% or 48 single-father households and 17.2% or 385 single-mother households are living below the poverty line. Among single-father households, those with no children have the highest poverty rate, with 35 households (7.6%) experiencing poverty. Likewise, among single-mother households, those with 1 or 2 children have the highest poverty rate, with 330 households (22.6%) falling below the poverty line.
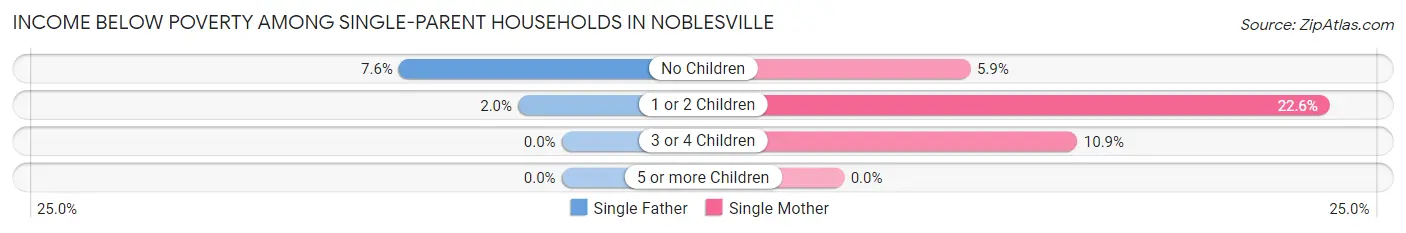
| Children | Single Father | Single Mother |
| No Children | 35 (7.6%) | 36 (5.9%) |
| 1 or 2 Children | 13 (2.0%) | 330 (22.6%) |
| 3 or 4 Children | 0 (0.0%) | 19 (10.9%) |
| 5 or more Children | 0 (0.0%) | 0 (0.0%) |
| Total | 48 (3.3%) | 385 (17.2%) |
Income Below Poverty Among Married-Couple vs Single-Parent Households in Noblesville
The poverty data for Noblesville shows that 313 of the married-couple family households (2.1%) and 433 of the single-parent households (11.7%) are living below the poverty level. Within the married-couple family households, those with 3 or 4 children have the highest poverty rate, with 126 households (9.4%) falling below the poverty line. Among the single-parent households, those with 1 or 2 children have the highest poverty rate, with 343 household (16.3%) living below poverty.
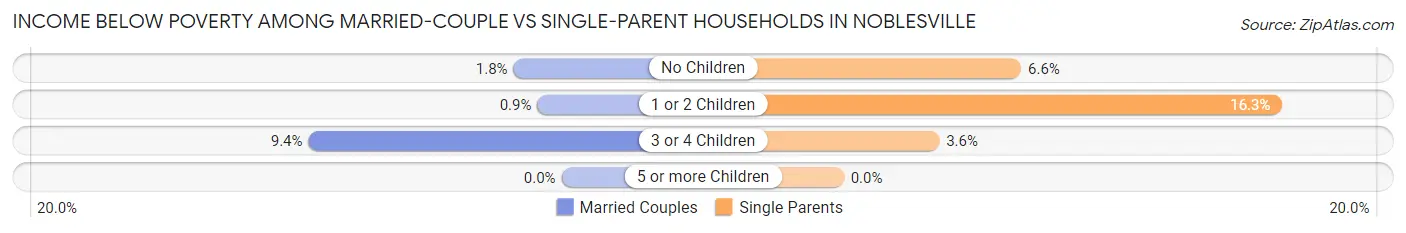
| Children | Married-Couple Families | Single-Parent Households |
| No Children | 127 (1.8%) | 71 (6.6%) |
| 1 or 2 Children | 60 (0.9%) | 343 (16.3%) |
| 3 or 4 Children | 126 (9.4%) | 19 (3.6%) |
| 5 or more Children | 0 (0.0%) | 0 (0.0%) |
| Total | 313 (2.1%) | 433 (11.7%) |
Race in Noblesville
The most populous races in Noblesville are White / Caucasian (60,309 | 85.6%), Black / African American (3,751 | 5.3%), and Two or more Races (3,674 | 5.2%).
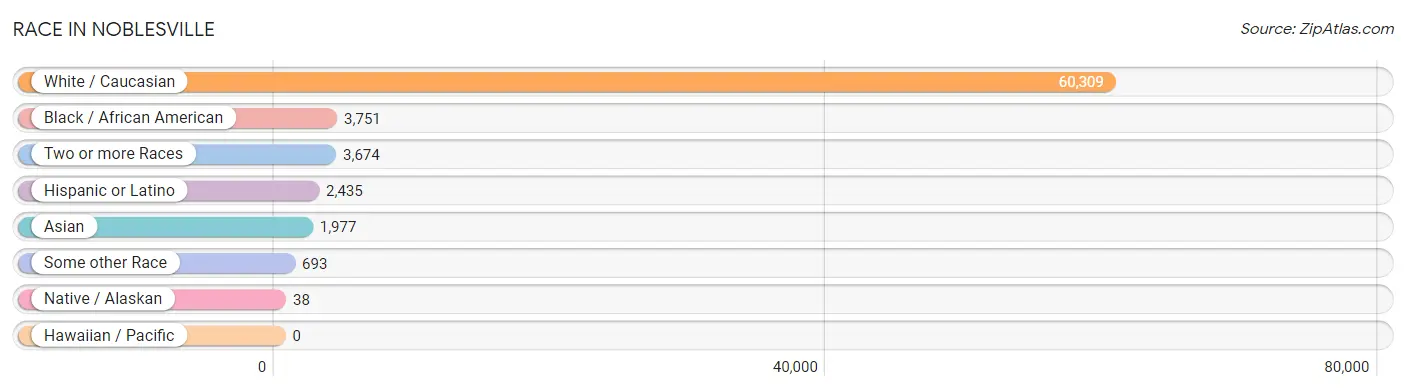
| Race | # Population | % Population |
| Asian | 1,977 | 2.8% |
| Black / African American | 3,751 | 5.3% |
| Hawaiian / Pacific | 0 | 0.0% |
| Hispanic or Latino | 2,435 | 3.5% |
| Native / Alaskan | 38 | 0.1% |
| White / Caucasian | 60,309 | 85.6% |
| Two or more Races | 3,674 | 5.2% |
| Some other Race | 693 | 1.0% |
| Total | 70,442 | 100.0% |
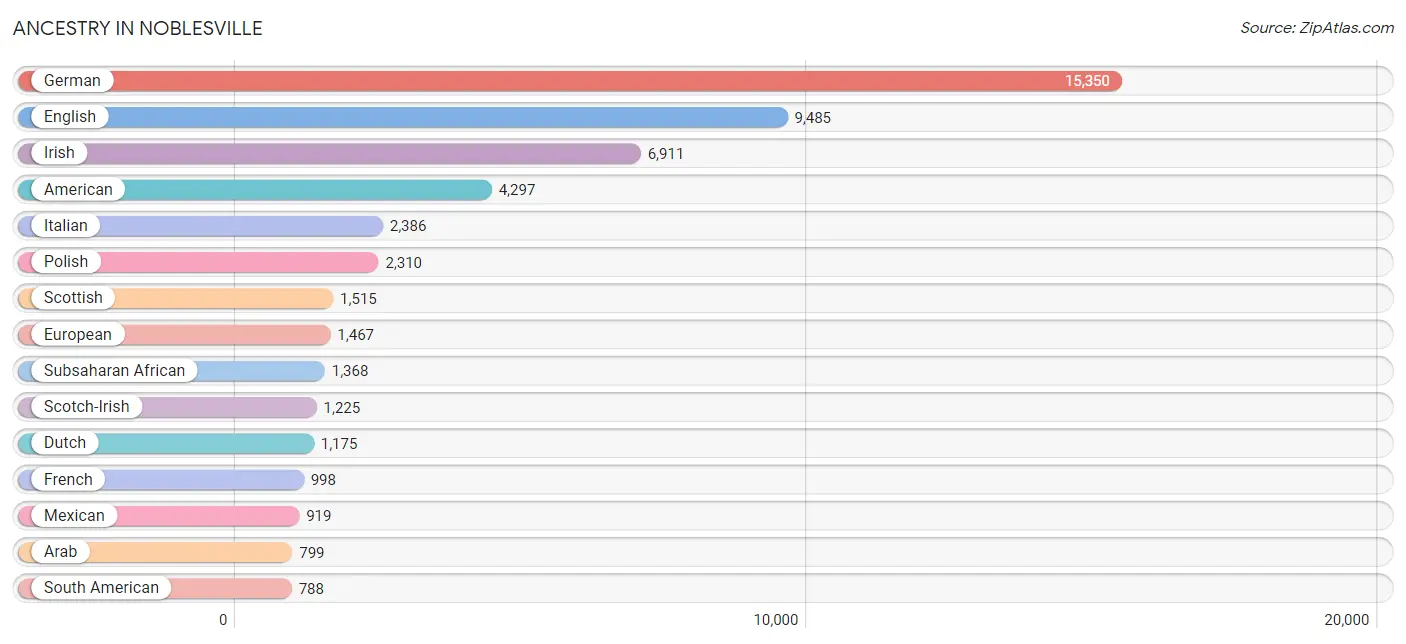
Ancestry in Noblesville
The most populous ancestries reported in Noblesville are German (15,350 | 21.8%), English (9,485 | 13.5%), Irish (6,911 | 9.8%), American (4,297 | 6.1%), and Italian (2,386 | 3.4%), together accounting for 54.6% of all Noblesville residents.
| Ancestry | # Population | % Population |
| Afghan | 382 | 0.5% |
| African | 342 | 0.5% |
| American | 4,297 | 6.1% |
| Apache | 15 | 0.0% |
| Arab | 799 | 1.1% |
| Argentinean | 38 | 0.1% |
| Armenian | 20 | 0.0% |
| Austrian | 62 | 0.1% |
| Barbadian | 59 | 0.1% |
| Belgian | 64 | 0.1% |
| Bhutanese | 449 | 0.6% |
| Brazilian | 70 | 0.1% |
| British | 466 | 0.7% |
| Bulgarian | 18 | 0.0% |
| Burmese | 195 | 0.3% |
| Cajun | 15 | 0.0% |
| Canadian | 119 | 0.2% |
| Central American | 204 | 0.3% |
| Cherokee | 123 | 0.2% |
| Colombian | 39 | 0.1% |
| Costa Rican | 79 | 0.1% |
| Creek | 2 | 0.0% |
| Croatian | 30 | 0.0% |
| Czech | 101 | 0.1% |
| Czechoslovakian | 58 | 0.1% |
| Danish | 97 | 0.1% |
| Dutch | 1,175 | 1.7% |
| Eastern European | 70 | 0.1% |
| English | 9,485 | 13.5% |
| European | 1,467 | 2.1% |
| Finnish | 46 | 0.1% |
| French | 998 | 1.4% |
| French American Indian | 22 | 0.0% |
| French Canadian | 112 | 0.2% |
| German | 15,350 | 21.8% |
| Ghanaian | 89 | 0.1% |
| Greek | 137 | 0.2% |
| Guatemalan | 53 | 0.1% |
| Honduran | 55 | 0.1% |
| Hungarian | 260 | 0.4% |
| Indian (Asian) | 630 | 0.9% |
| Iranian | 36 | 0.1% |
| Irish | 6,911 | 9.8% |
| Italian | 2,386 | 3.4% |
| Jordanian | 138 | 0.2% |
| Korean | 343 | 0.5% |
| Latvian | 59 | 0.1% |
| Lebanese | 153 | 0.2% |
| Liberian | 219 | 0.3% |
| Lithuanian | 122 | 0.2% |
| Macedonian | 39 | 0.1% |
| Maltese | 186 | 0.3% |
| Mexican | 919 | 1.3% |
| Mexican American Indian | 50 | 0.1% |
| Nigerian | 542 | 0.8% |
| Northern European | 71 | 0.1% |
| Norwegian | 539 | 0.8% |
| Panamanian | 17 | 0.0% |
| Pennsylvania German | 17 | 0.0% |
| Polish | 2,310 | 3.3% |
| Portuguese | 38 | 0.1% |
| Puerto Rican | 431 | 0.6% |
| Romanian | 50 | 0.1% |
| Russian | 490 | 0.7% |
| Scandinavian | 184 | 0.3% |
| Scotch-Irish | 1,225 | 1.7% |
| Scottish | 1,515 | 2.1% |
| Senegalese | 152 | 0.2% |
| Serbian | 15 | 0.0% |
| Slavic | 39 | 0.1% |
| Slovak | 156 | 0.2% |
| Slovene | 90 | 0.1% |
| South American | 788 | 1.1% |
| Spaniard | 93 | 0.1% |
| Sri Lankan | 182 | 0.3% |
| Subsaharan African | 1,368 | 1.9% |
| Swedish | 605 | 0.9% |
| Swiss | 207 | 0.3% |
| Syrian | 31 | 0.0% |
| Thai | 452 | 0.6% |
| Turkish | 14 | 0.0% |
| Ukrainian | 37 | 0.1% |
| Venezuelan | 711 | 1.0% |
| Welsh | 397 | 0.6% |
| Zimbabwean | 18 | 0.0% | View All 85 Rows |
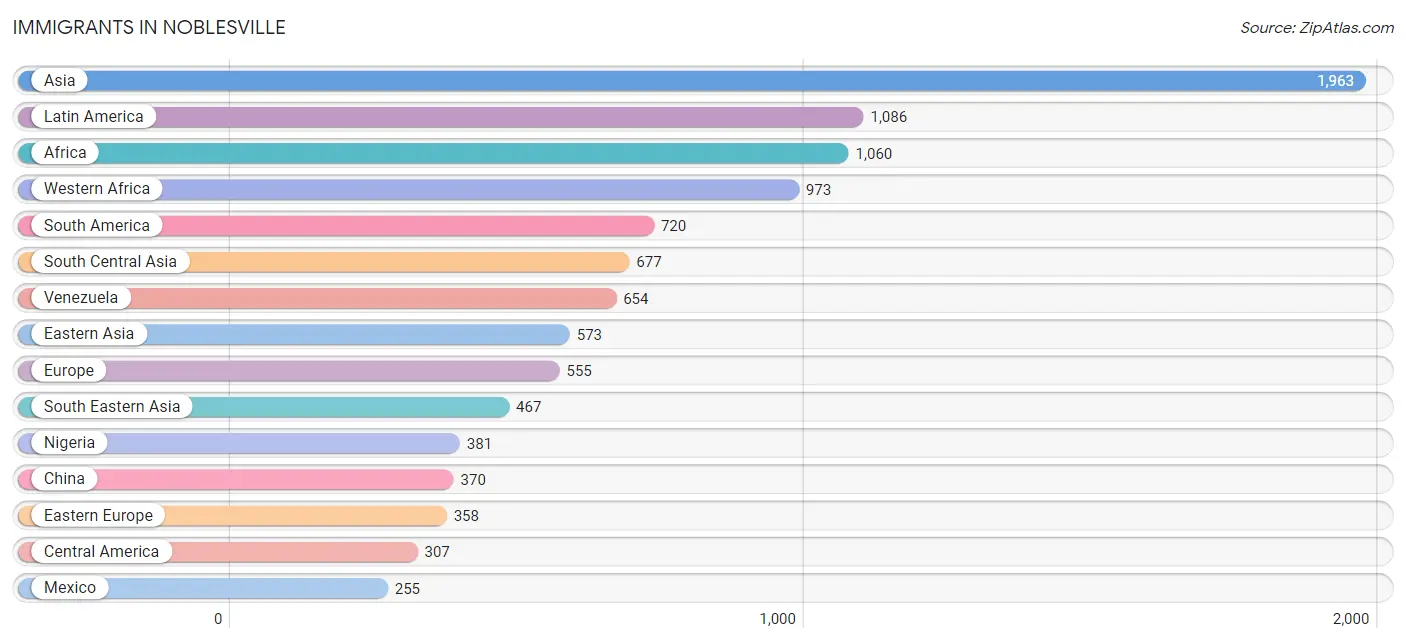
Immigrants in Noblesville
The most numerous immigrant groups reported in Noblesville came from Asia (1,963 | 2.8%), Latin America (1,086 | 1.5%), Africa (1,060 | 1.5%), Western Africa (973 | 1.4%), and South America (720 | 1.0%), together accounting for 8.2% of all Noblesville residents.
| Immigration Origin | # Population | % Population |
| Afghanistan | 78 | 0.1% |
| Africa | 1,060 | 1.5% |
| Asia | 1,963 | 2.8% |
| Barbados | 59 | 0.1% |
| Belarus | 25 | 0.0% |
| Bosnia and Herzegovina | 15 | 0.0% |
| Brazil | 52 | 0.1% |
| Canada | 32 | 0.1% |
| Caribbean | 59 | 0.1% |
| Central America | 307 | 0.4% |
| China | 370 | 0.5% |
| Colombia | 14 | 0.0% |
| Eastern Africa | 27 | 0.0% |
| Eastern Asia | 573 | 0.8% |
| Eastern Europe | 358 | 0.5% |
| England | 20 | 0.0% |
| Europe | 555 | 0.8% |
| Germany | 132 | 0.2% |
| Ghana | 89 | 0.1% |
| Guatemala | 22 | 0.0% |
| India | 235 | 0.3% |
| Indonesia | 174 | 0.3% |
| Iran | 239 | 0.3% |
| Italy | 14 | 0.0% |
| Japan | 132 | 0.2% |
| Jordan | 86 | 0.1% |
| Korea | 71 | 0.1% |
| Latin America | 1,086 | 1.5% |
| Latvia | 36 | 0.1% |
| Liberia | 201 | 0.3% |
| Mexico | 255 | 0.4% |
| Nepal | 28 | 0.0% |
| Nigeria | 381 | 0.5% |
| Northern Africa | 33 | 0.1% |
| Northern Europe | 51 | 0.1% |
| Pakistan | 97 | 0.1% |
| Panama | 30 | 0.0% |
| Philippines | 155 | 0.2% |
| Poland | 104 | 0.2% |
| Russia | 122 | 0.2% |
| Senegal | 46 | 0.1% |
| Singapore | 15 | 0.0% |
| South America | 720 | 1.0% |
| South Central Asia | 677 | 1.0% |
| South Eastern Asia | 467 | 0.7% |
| Southern Europe | 14 | 0.0% |
| Sweden | 10 | 0.0% |
| Taiwan | 13 | 0.0% |
| Ukraine | 42 | 0.1% |
| Venezuela | 654 | 0.9% |
| Vietnam | 123 | 0.2% |
| Western Africa | 973 | 1.4% |
| Western Asia | 246 | 0.4% |
| Western Europe | 132 | 0.2% |
| Yemen | 160 | 0.2% | View All 55 Rows |
Sex and Age in Noblesville
Sex and Age in Noblesville
The most populous age groups in Noblesville are Under 5 Years (2,877 | 8.1%) for men and 35 to 39 Years (2,864 | 8.2%) for women.
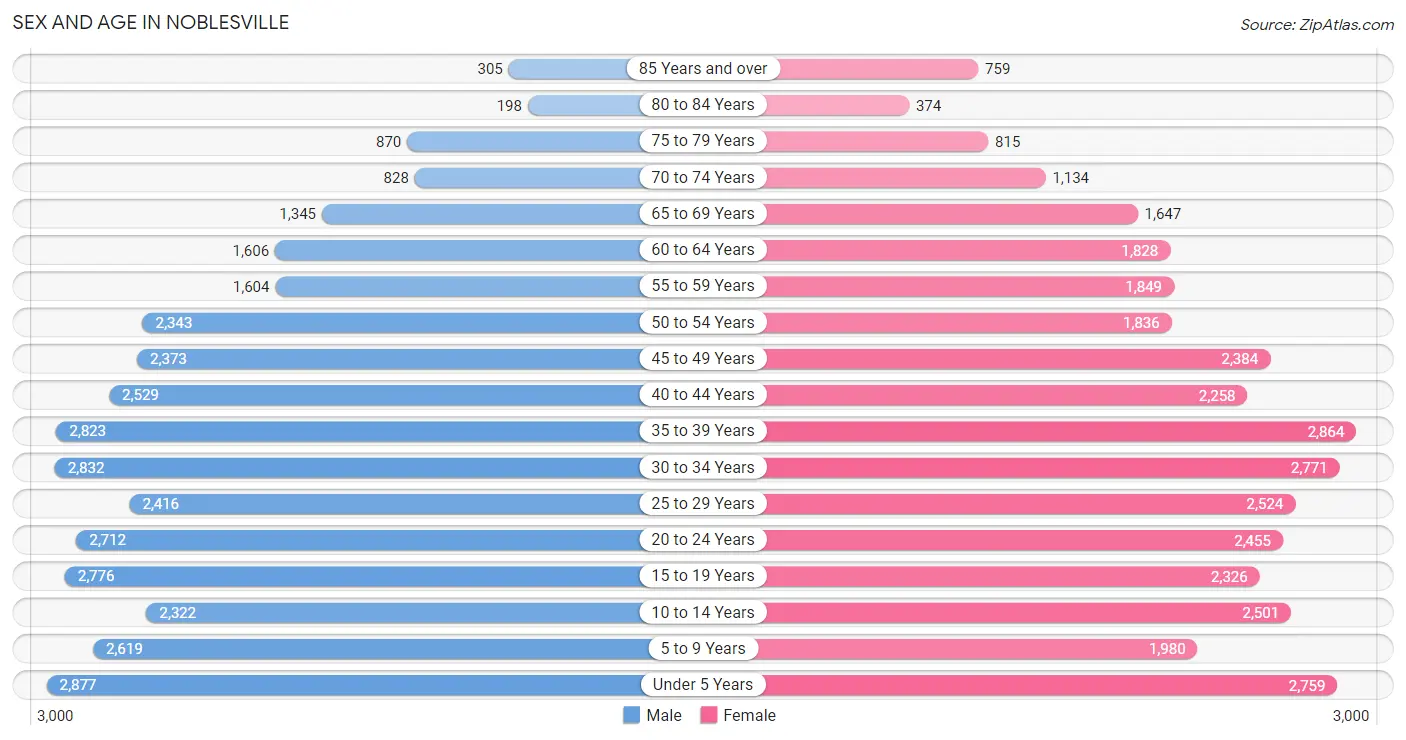
| Age Bracket | Male | Female |
| Under 5 Years | 2,877 (8.1%) | 2,759 (7.9%) |
| 5 to 9 Years | 2,619 (7.4%) | 1,980 (5.7%) |
| 10 to 14 Years | 2,322 (6.6%) | 2,501 (7.1%) |
| 15 to 19 Years | 2,776 (7.9%) | 2,326 (6.6%) |
| 20 to 24 Years | 2,712 (7.7%) | 2,455 (7.0%) |
| 25 to 29 Years | 2,416 (6.8%) | 2,524 (7.2%) |
| 30 to 34 Years | 2,832 (8.0%) | 2,771 (7.9%) |
| 35 to 39 Years | 2,823 (8.0%) | 2,864 (8.2%) |
| 40 to 44 Years | 2,529 (7.1%) | 2,258 (6.4%) |
| 45 to 49 Years | 2,373 (6.7%) | 2,384 (6.8%) |
| 50 to 54 Years | 2,343 (6.6%) | 1,836 (5.2%) |
| 55 to 59 Years | 1,604 (4.5%) | 1,849 (5.3%) |
| 60 to 64 Years | 1,606 (4.5%) | 1,828 (5.2%) |
| 65 to 69 Years | 1,345 (3.8%) | 1,647 (4.7%) |
| 70 to 74 Years | 828 (2.3%) | 1,134 (3.2%) |
| 75 to 79 Years | 870 (2.5%) | 815 (2.3%) |
| 80 to 84 Years | 198 (0.6%) | 374 (1.1%) |
| 85 Years and over | 305 (0.9%) | 759 (2.2%) |
| Total | 35,378 (100.0%) | 35,064 (100.0%) |
Families and Households in Noblesville
Median Family Size in Noblesville
The median family size in Noblesville is 3.18 persons per family, with married-couple families (15,126 | 80.3%) accounting for the largest median family size of 3.24 persons per family. On the other hand, single female/mother families (2,245 | 11.9%) represent the smallest median family size with 2.87 persons per family.
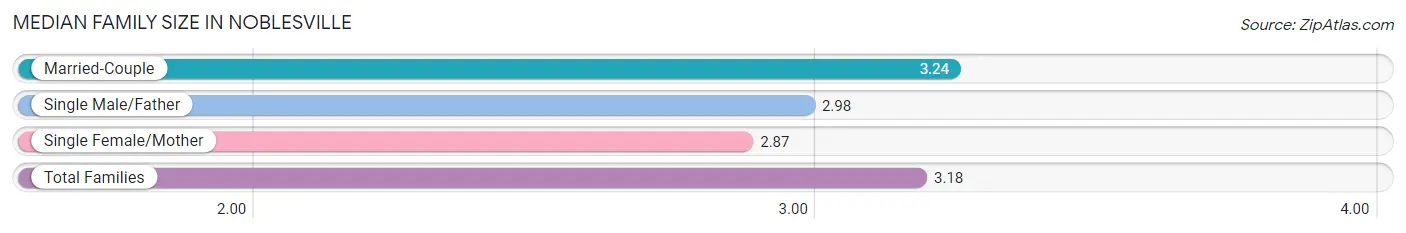
| Family Type | # Families | Family Size |
| Married-Couple | 15,126 (80.3%) | 3.24 |
| Single Male/Father | 1,461 (7.8%) | 2.98 |
| Single Female/Mother | 2,245 (11.9%) | 2.87 |
| Total Families | 18,832 (100.0%) | 3.18 |
Median Household Size in Noblesville
The median household size in Noblesville is 2.73 persons per household, with single male/father households (1,461 | 5.7%) accounting for the largest median household size of 3.49 persons per household. non-family households (6,670 | 26.2%) represent the smallest median household size with 1.26 persons per household.
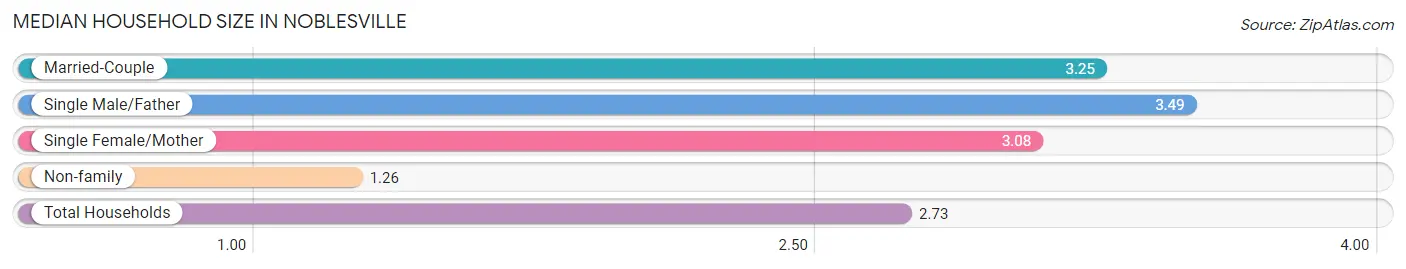
| Household Type | # Households | Household Size |
| Married-Couple | 15,126 (59.3%) | 3.25 |
| Single Male/Father | 1,461 (5.7%) | 3.49 |
| Single Female/Mother | 2,245 (8.8%) | 3.08 |
| Non-family | 6,670 (26.2%) | 1.26 |
| Total Households | 25,502 (100.0%) | 2.73 |
Household Size by Marriage Status in Noblesville
Out of a total of 25,502 households in Noblesville, 18,832 (73.9%) are family households, while 6,670 (26.2%) are nonfamily households. The most numerous type of family households are 2-person households, comprising 6,895, and the most common type of nonfamily households are 1-person households, comprising 5,299.
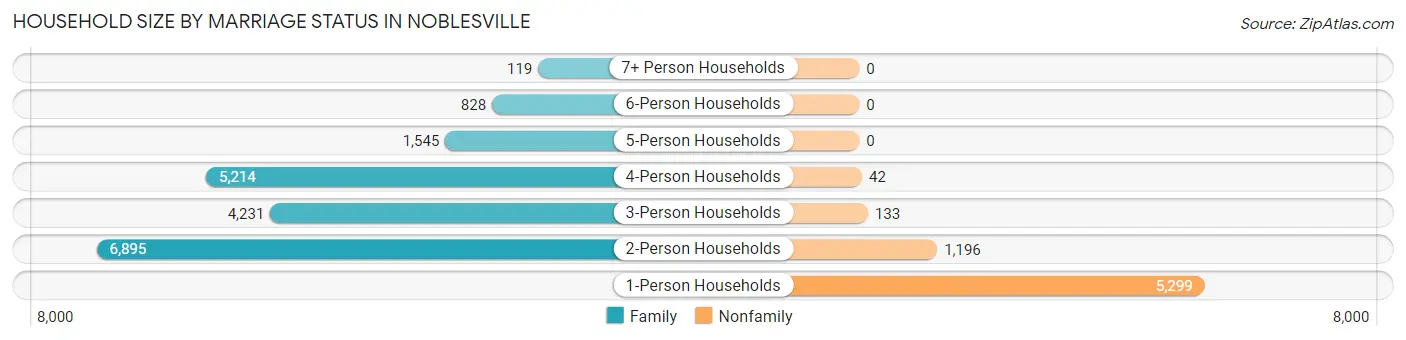
| Household Size | Family Households | Nonfamily Households |
| 1-Person Households | - | 5,299 (20.8%) |
| 2-Person Households | 6,895 (27.0%) | 1,196 (4.7%) |
| 3-Person Households | 4,231 (16.6%) | 133 (0.5%) |
| 4-Person Households | 5,214 (20.4%) | 42 (0.2%) |
| 5-Person Households | 1,545 (6.1%) | 0 (0.0%) |
| 6-Person Households | 828 (3.3%) | 0 (0.0%) |
| 7+ Person Households | 119 (0.5%) | 0 (0.0%) |
| Total | 18,832 (73.9%) | 6,670 (26.2%) |
Female Fertility in Noblesville
Fertility by Age in Noblesville
Average fertility rate in Noblesville is 46.0 births per 1,000 women. Women in the age bracket of 20 to 34 years have the highest fertility rate with 78.0 births per 1,000 women. Women in the age bracket of 20 to 34 years acount for 73.1% of all women with births.
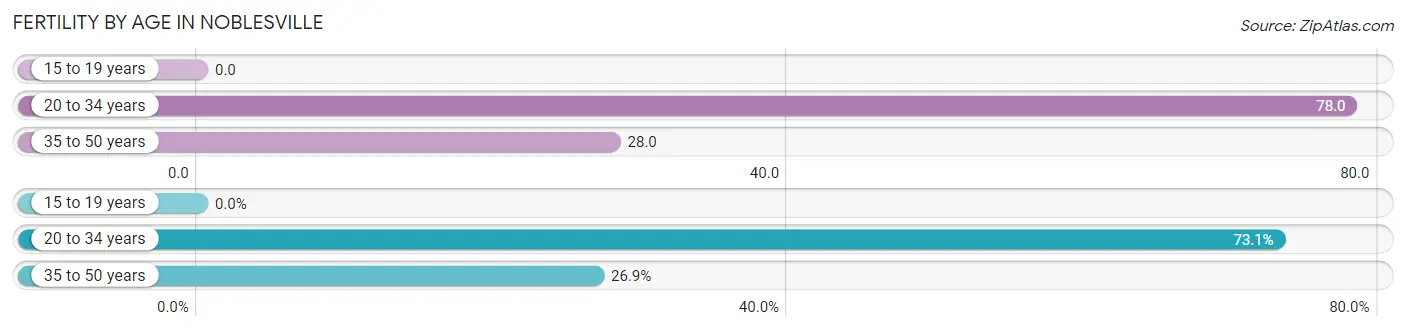
| Age Bracket | Women with Births | Births / 1,000 Women |
| 15 to 19 years | 0 (0.0%) | 0.0 |
| 20 to 34 years | 604 (73.1%) | 78.0 |
| 35 to 50 years | 222 (26.9%) | 28.0 |
| Total | 826 (100.0%) | 46.0 |
Fertility by Age by Marriage Status in Noblesville
87.4% of women with births (826) in Noblesville are married. The highest percentage of unmarried women with births falls into 35 to 50 years age bracket with 12.6% of them unmarried at the time of birth, while the lowest percentage of unmarried women with births belong to 20 to 34 years age bracket with 12.6% of them unmarried.
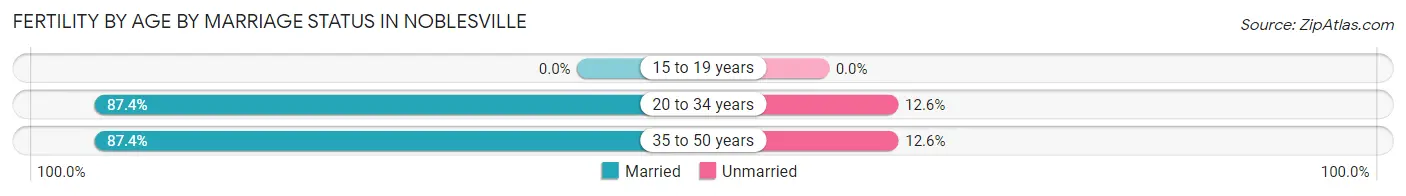
| Age Bracket | Married | Unmarried |
| 15 to 19 years | 0 (0.0%) | 0 (0.0%) |
| 20 to 34 years | 528 (87.4%) | 76 (12.6%) |
| 35 to 50 years | 194 (87.4%) | 28 (12.6%) |
| Total | 722 (87.4%) | 104 (12.6%) |
Fertility by Education in Noblesville
Average fertility rate in Noblesville is 46.0 births per 1,000 women. Women with the education attainment of less than high school have the highest fertility rate of 60.0 births per 1,000 women, while women with the education attainment of college or associate's degree have the lowest fertility at 40.0 births per 1,000 women. Women with the education attainment of bachelor's degree represent 32.2% of all women with births.
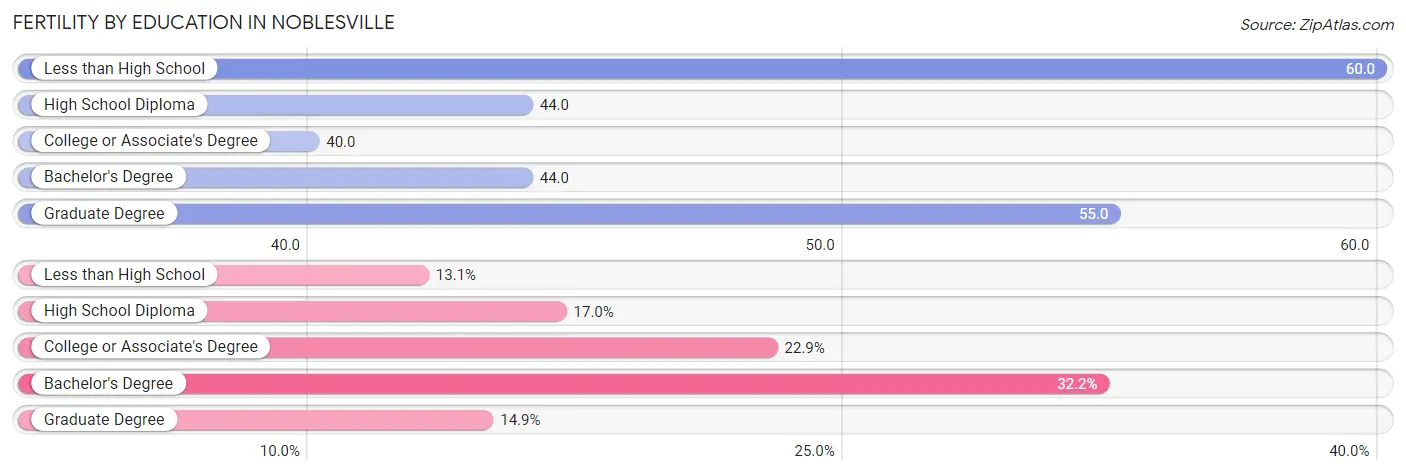
| Educational Attainment | Women with Births | Births / 1,000 Women |
| Less than High School | 108 (13.1%) | 60.0 |
| High School Diploma | 140 (17.0%) | 44.0 |
| College or Associate's Degree | 189 (22.9%) | 40.0 |
| Bachelor's Degree | 266 (32.2%) | 44.0 |
| Graduate Degree | 123 (14.9%) | 55.0 |
| Total | 826 (100.0%) | 46.0 |
Fertility by Education by Marriage Status in Noblesville
12.6% of women with births in Noblesville are unmarried. Women with the educational attainment of less than high school are most likely to be married with 100.0% of them married at childbirth, while women with the educational attainment of college or associate's degree are least likely to be married with 37.6% of them unmarried at childbirth.
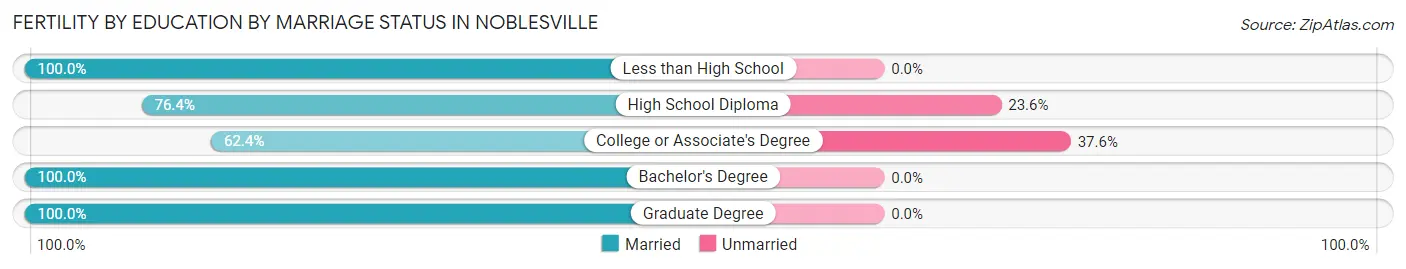
| Educational Attainment | Married | Unmarried |
| Less than High School | 108 (100.0%) | 0 (0.0%) |
| High School Diploma | 107 (76.4%) | 33 (23.6%) |
| College or Associate's Degree | 118 (62.4%) | 71 (37.6%) |
| Bachelor's Degree | 266 (100.0%) | 0 (0.0%) |
| Graduate Degree | 123 (100.0%) | 0 (0.0%) |
| Total | 722 (87.4%) | 104 (12.6%) |
Employment Characteristics in Noblesville
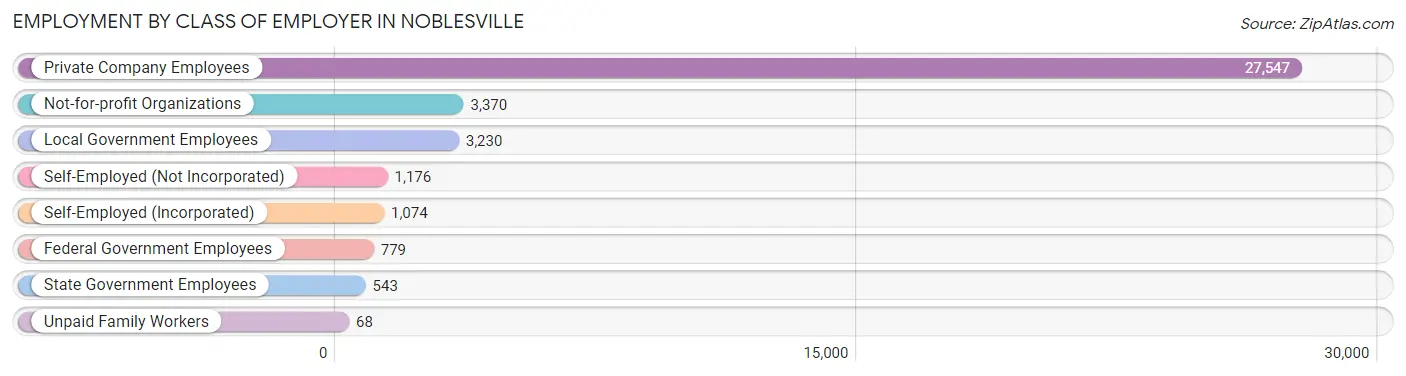
Employment by Class of Employer in Noblesville
Among the 37,787 employed individuals in Noblesville, private company employees (27,547 | 72.9%), not-for-profit organizations (3,370 | 8.9%), and local government employees (3,230 | 8.6%) make up the most common classes of employment.
| Employer Class | # Employees | % Employees |
| Private Company Employees | 27,547 | 72.9% |
| Self-Employed (Incorporated) | 1,074 | 2.8% |
| Self-Employed (Not Incorporated) | 1,176 | 3.1% |
| Not-for-profit Organizations | 3,370 | 8.9% |
| Local Government Employees | 3,230 | 8.6% |
| State Government Employees | 543 | 1.4% |
| Federal Government Employees | 779 | 2.1% |
| Unpaid Family Workers | 68 | 0.2% |
| Total | 37,787 | 100.0% |
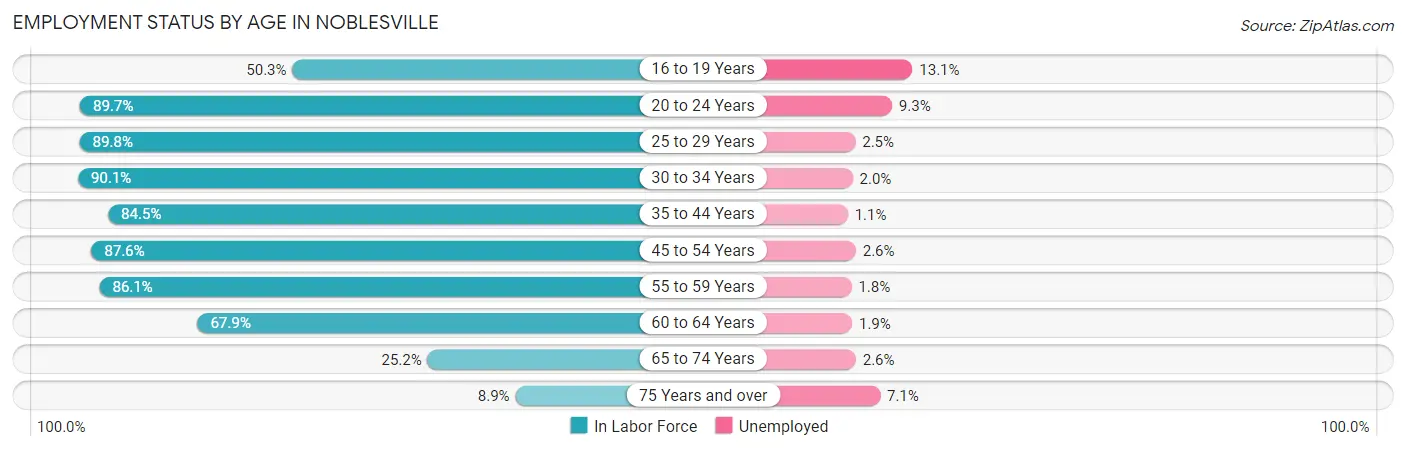
Employment Status by Age in Noblesville
According to the labor force statistics for Noblesville, out of the total population over 16 years of age (54,149), 73.1% or 39,583 individuals are in the labor force, with 3.4% or 1,346 of them unemployed. The age group with the highest labor force participation rate is 30 to 34 years, with 90.1% or 5,048 individuals in the labor force. Within the labor force, the 16 to 19 years age range has the highest percentage of unemployed individuals, with 13.1% or 255 of them being unemployed.
| Age Bracket | In Labor Force | Unemployed |
| 16 to 19 Years | 1,945 (50.3%) | 255 (13.1%) |
| 20 to 24 Years | 4,635 (89.7%) | 431 (9.3%) |
| 25 to 29 Years | 4,436 (89.8%) | 111 (2.5%) |
| 30 to 34 Years | 5,048 (90.1%) | 101 (2.0%) |
| 35 to 44 Years | 8,851 (84.5%) | 97 (1.1%) |
| 45 to 54 Years | 7,828 (87.6%) | 204 (2.6%) |
| 55 to 59 Years | 2,973 (86.1%) | 54 (1.8%) |
| 60 to 64 Years | 2,332 (67.9%) | 44 (1.9%) |
| 65 to 74 Years | 1,248 (25.2%) | 32 (2.6%) |
| 75 Years and over | 296 (8.9%) | 21 (7.1%) |
| Total | 39,583 (73.1%) | 1,346 (3.4%) |
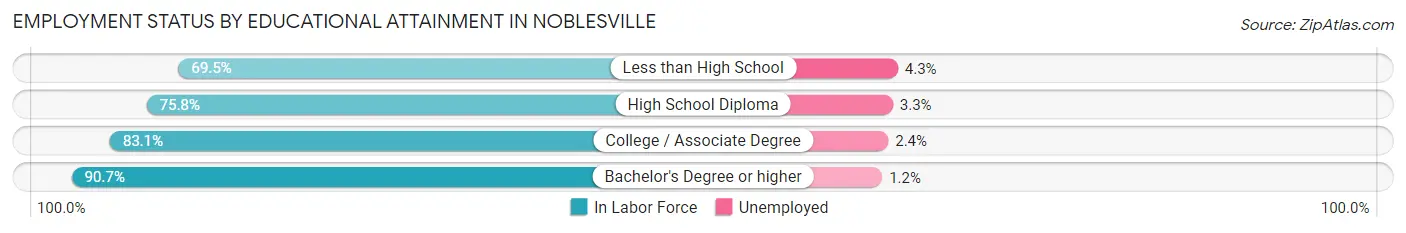
Employment Status by Educational Attainment in Noblesville
According to labor force statistics for Noblesville, 85.4% of individuals (31,461) out of the total population between 25 and 64 years of age (36,840) are in the labor force, with 1.9% or 598 of them being unemployed. The group with the highest labor force participation rate are those with the educational attainment of bachelor's degree or higher, with 90.7% or 17,555 individuals in the labor force. Within the labor force, individuals with less than high school education have the highest percentage of unemployment, with 4.3% or 36 of them being unemployed.
| Educational Attainment | In Labor Force | Unemployed |
| Less than High School | 844 (69.5%) | 52 (4.3%) |
| High School Diploma | 4,712 (75.8%) | 205 (3.3%) |
| College / Associate Degree | 8,356 (83.1%) | 241 (2.4%) |
| Bachelor's Degree or higher | 17,555 (90.7%) | 232 (1.2%) |
| Total | 31,461 (85.4%) | 700 (1.9%) |
Employment Occupations by Sex in Noblesville
Management, Business, Science and Arts Occupations
The most common Management, Business, Science and Arts occupations in Noblesville are Management (5,584 | 14.6%), Community & Social Service (4,388 | 11.5%), Health Diagnosing & Treating (2,994 | 7.9%), Computers, Engineering & Science (2,969 | 7.8%), and Business & Financial (2,674 | 7.0%).
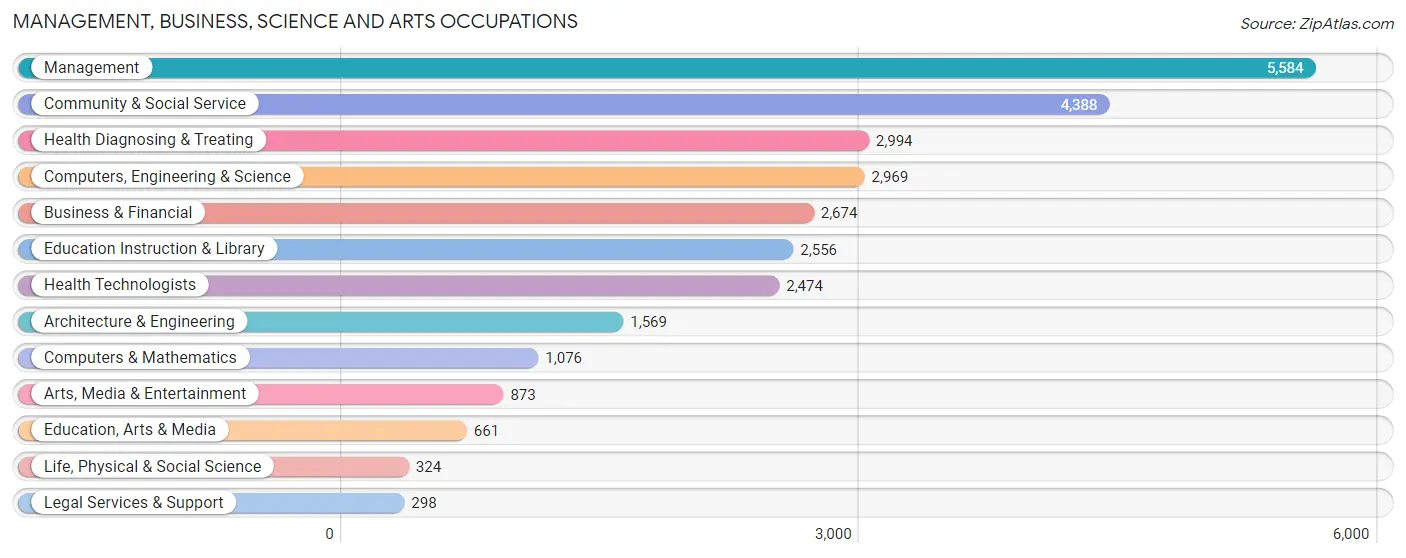
Management, Business, Science and Arts Occupations by Sex
Within the Management, Business, Science and Arts occupations in Noblesville, the most male-oriented occupations are Architecture & Engineering (85.2%), Computers & Mathematics (84.3%), and Computers, Engineering & Science (82.4%), while the most female-oriented occupations are Education Instruction & Library (87.5%), Health Diagnosing & Treating (79.4%), and Health Technologists (78.2%).
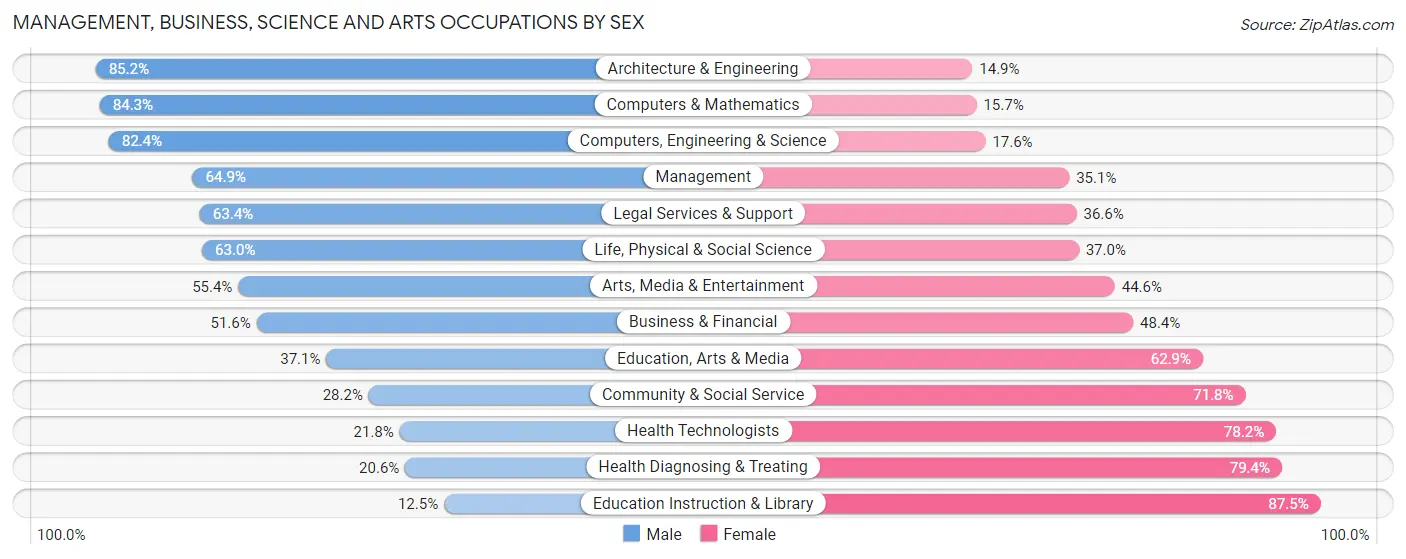
| Occupation | Male | Female |
| Management | 3,626 (64.9%) | 1,958 (35.1%) |
| Business & Financial | 1,380 (51.6%) | 1,294 (48.4%) |
| Computers, Engineering & Science | 2,447 (82.4%) | 522 (17.6%) |
| Computers & Mathematics | 907 (84.3%) | 169 (15.7%) |
| Architecture & Engineering | 1,336 (85.2%) | 233 (14.8%) |
| Life, Physical & Social Science | 204 (63.0%) | 120 (37.0%) |
| Community & Social Service | 1,238 (28.2%) | 3,150 (71.8%) |
| Education, Arts & Media | 245 (37.1%) | 416 (62.9%) |
| Legal Services & Support | 189 (63.4%) | 109 (36.6%) |
| Education Instruction & Library | 320 (12.5%) | 2,236 (87.5%) |
| Arts, Media & Entertainment | 484 (55.4%) | 389 (44.6%) |
| Health Diagnosing & Treating | 617 (20.6%) | 2,377 (79.4%) |
| Health Technologists | 539 (21.8%) | 1,935 (78.2%) |
| Total (Category) | 9,308 (50.0%) | 9,301 (50.0%) |
| Total (Overall) | 20,335 (53.3%) | 17,782 (46.7%) |
Services Occupations
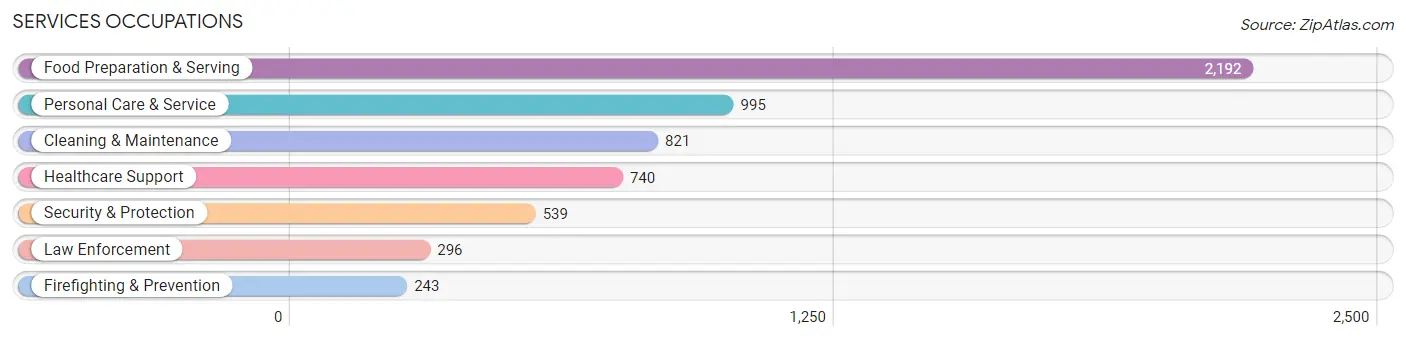
The most common Services occupations in Noblesville are Food Preparation & Serving (2,192 | 5.8%), Personal Care & Service (995 | 2.6%), Cleaning & Maintenance (821 | 2.1%), Healthcare Support (740 | 1.9%), and Security & Protection (539 | 1.4%).
Services Occupations by Sex
Within the Services occupations in Noblesville, the most male-oriented occupations are Firefighting & Prevention (95.9%), Security & Protection (92.0%), and Law Enforcement (88.8%), while the most female-oriented occupations are Healthcare Support (84.6%), Personal Care & Service (82.3%), and Food Preparation & Serving (60.4%).
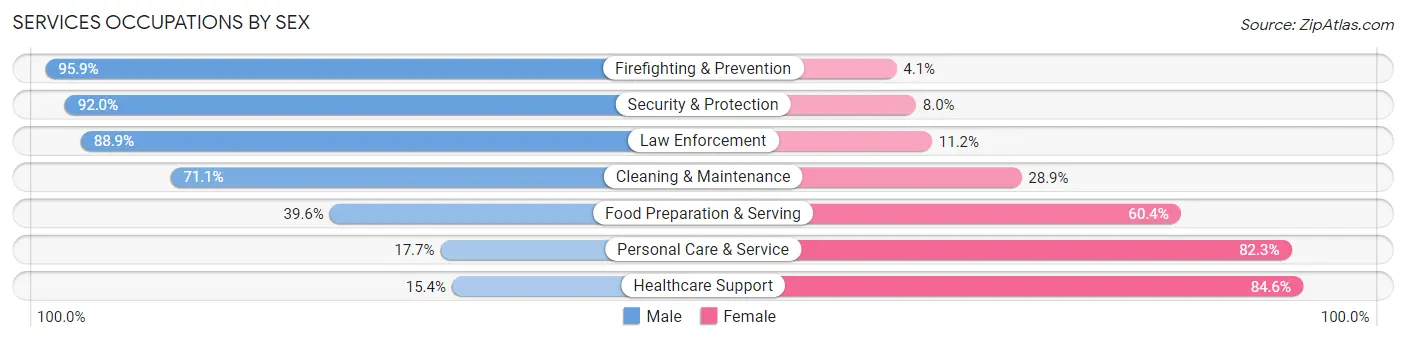
| Occupation | Male | Female |
| Healthcare Support | 114 (15.4%) | 626 (84.6%) |
| Security & Protection | 496 (92.0%) | 43 (8.0%) |
| Firefighting & Prevention | 233 (95.9%) | 10 (4.1%) |
| Law Enforcement | 263 (88.8%) | 33 (11.2%) |
| Food Preparation & Serving | 868 (39.6%) | 1,324 (60.4%) |
| Cleaning & Maintenance | 584 (71.1%) | 237 (28.9%) |
| Personal Care & Service | 176 (17.7%) | 819 (82.3%) |
| Total (Category) | 2,238 (42.3%) | 3,049 (57.7%) |
| Total (Overall) | 20,335 (53.3%) | 17,782 (46.7%) |
Sales and Office Occupations
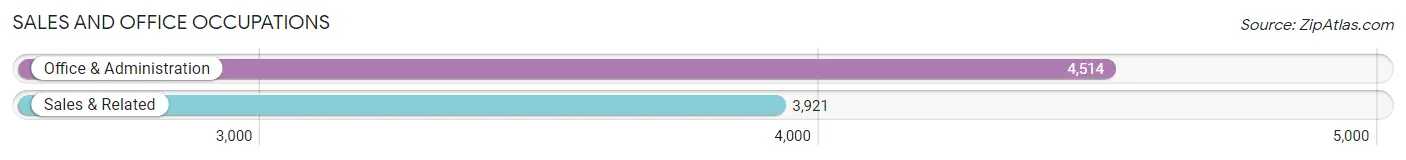
The most common Sales and Office occupations in Noblesville are Office & Administration (4,514 | 11.8%), and Sales & Related (3,921 | 10.3%).
Sales and Office Occupations by Sex
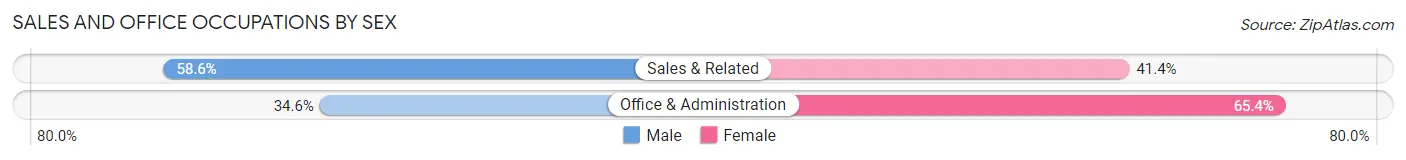
| Occupation | Male | Female |
| Sales & Related | 2,299 (58.6%) | 1,622 (41.4%) |
| Office & Administration | 1,562 (34.6%) | 2,952 (65.4%) |
| Total (Category) | 3,861 (45.8%) | 4,574 (54.2%) |
| Total (Overall) | 20,335 (53.3%) | 17,782 (46.7%) |
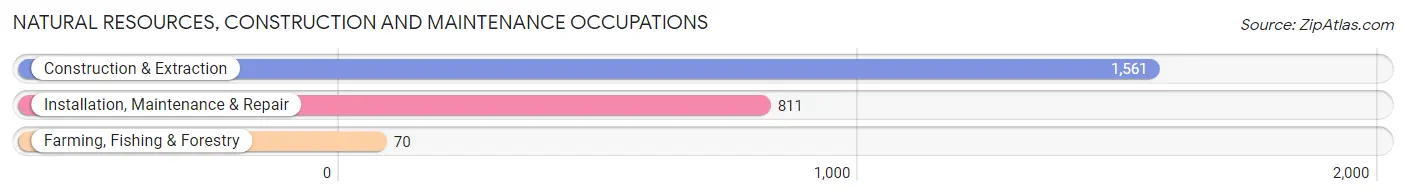
Natural Resources, Construction and Maintenance Occupations
The most common Natural Resources, Construction and Maintenance occupations in Noblesville are Construction & Extraction (1,561 | 4.1%), Installation, Maintenance & Repair (811 | 2.1%), and Farming, Fishing & Forestry (70 | 0.2%).
Natural Resources, Construction and Maintenance Occupations by Sex
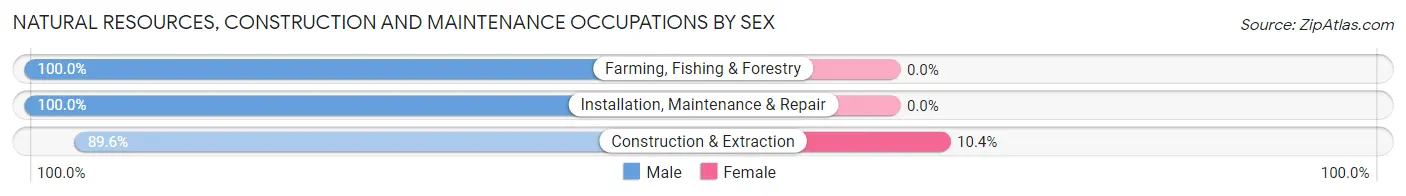
| Occupation | Male | Female |
| Farming, Fishing & Forestry | 70 (100.0%) | 0 (0.0%) |
| Construction & Extraction | 1,398 (89.6%) | 163 (10.4%) |
| Installation, Maintenance & Repair | 811 (100.0%) | 0 (0.0%) |
| Total (Category) | 2,279 (93.3%) | 163 (6.7%) |
| Total (Overall) | 20,335 (53.3%) | 17,782 (46.7%) |
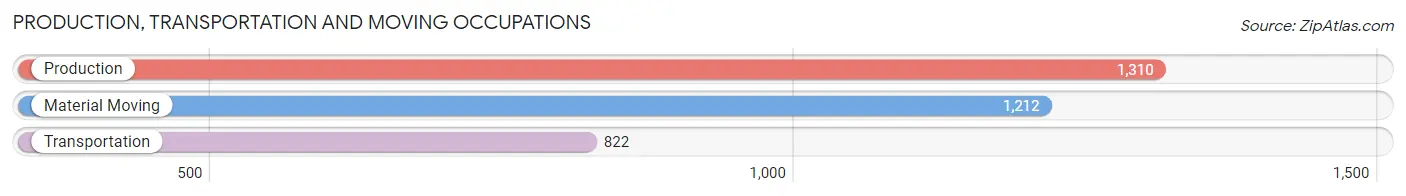
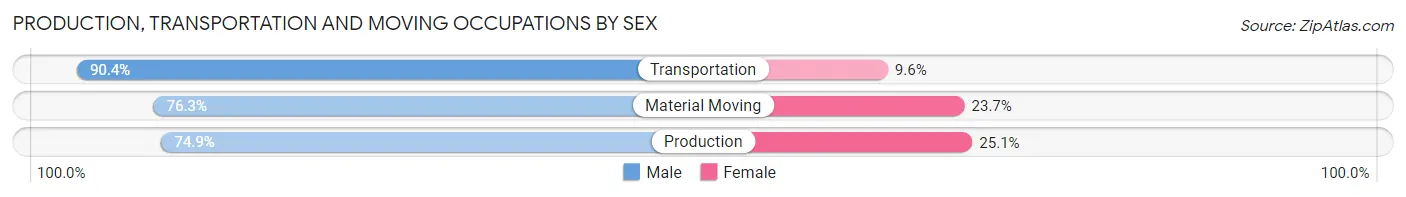
Production, Transportation and Moving Occupations
The most common Production, Transportation and Moving occupations in Noblesville are Production (1,310 | 3.4%), Material Moving (1,212 | 3.2%), and Transportation (822 | 2.2%).
Production, Transportation and Moving Occupations by Sex
| Occupation | Male | Female |
| Production | 981 (74.9%) | 329 (25.1%) |
| Transportation | 743 (90.4%) | 79 (9.6%) |
| Material Moving | 925 (76.3%) | 287 (23.7%) |
| Total (Category) | 2,649 (79.2%) | 695 (20.8%) |
| Total (Overall) | 20,335 (53.3%) | 17,782 (46.7%) |
Employment Industries by Sex in Noblesville
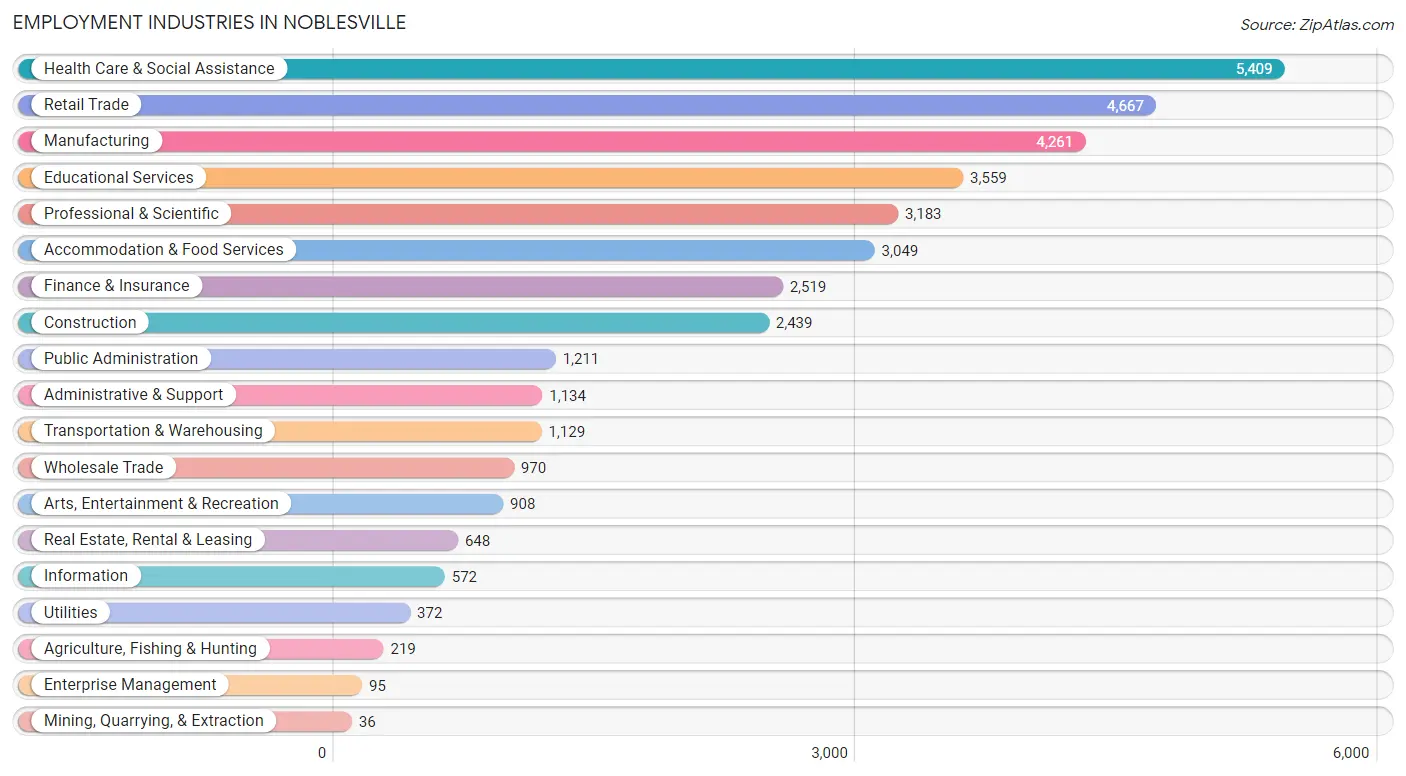
Employment Industries in Noblesville
The major employment industries in Noblesville include Health Care & Social Assistance (5,409 | 14.2%), Retail Trade (4,667 | 12.2%), Manufacturing (4,261 | 11.2%), Educational Services (3,559 | 9.3%), and Professional & Scientific (3,183 | 8.4%).
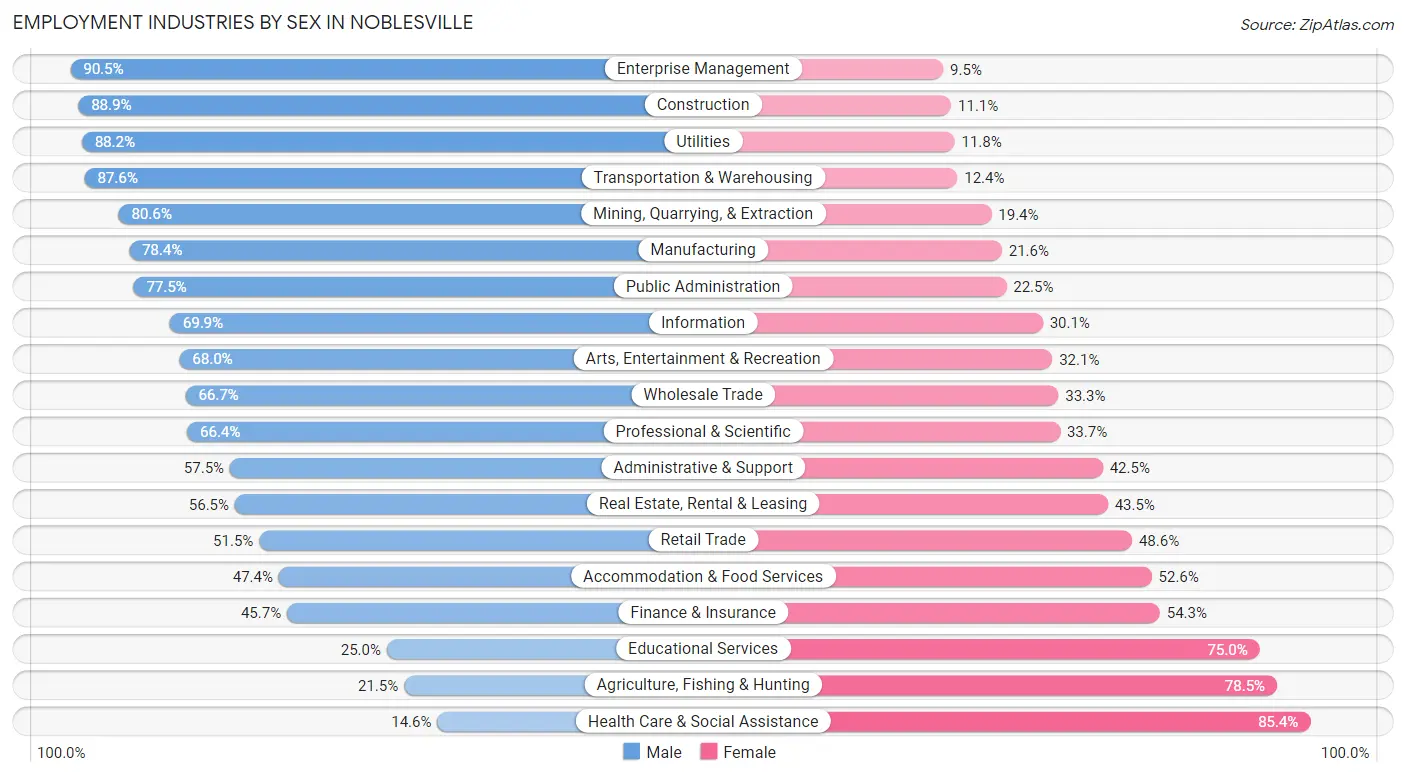
Employment Industries by Sex in Noblesville
The Noblesville industries that see more men than women are Enterprise Management (90.5%), Construction (88.9%), and Utilities (88.2%), whereas the industries that tend to have a higher number of women are Health Care & Social Assistance (85.4%), Agriculture, Fishing & Hunting (78.5%), and Educational Services (75.0%).
| Industry | Male | Female |
| Agriculture, Fishing & Hunting | 47 (21.5%) | 172 (78.5%) |
| Mining, Quarrying, & Extraction | 29 (80.6%) | 7 (19.4%) |
| Construction | 2,168 (88.9%) | 271 (11.1%) |
| Manufacturing | 3,340 (78.4%) | 921 (21.6%) |
| Wholesale Trade | 647 (66.7%) | 323 (33.3%) |
| Retail Trade | 2,401 (51.4%) | 2,266 (48.5%) |
| Transportation & Warehousing | 989 (87.6%) | 140 (12.4%) |
| Utilities | 328 (88.2%) | 44 (11.8%) |
| Information | 400 (69.9%) | 172 (30.1%) |
| Finance & Insurance | 1,151 (45.7%) | 1,368 (54.3%) |
| Real Estate, Rental & Leasing | 366 (56.5%) | 282 (43.5%) |
| Professional & Scientific | 2,112 (66.3%) | 1,071 (33.7%) |
| Enterprise Management | 86 (90.5%) | 9 (9.5%) |
| Administrative & Support | 652 (57.5%) | 482 (42.5%) |
| Educational Services | 891 (25.0%) | 2,668 (75.0%) |
| Health Care & Social Assistance | 788 (14.6%) | 4,621 (85.4%) |
| Arts, Entertainment & Recreation | 617 (67.9%) | 291 (32.1%) |
| Accommodation & Food Services | 1,445 (47.4%) | 1,604 (52.6%) |
| Public Administration | 938 (77.5%) | 273 (22.5%) |
| Total | 20,335 (53.3%) | 17,782 (46.7%) |
Education in Noblesville
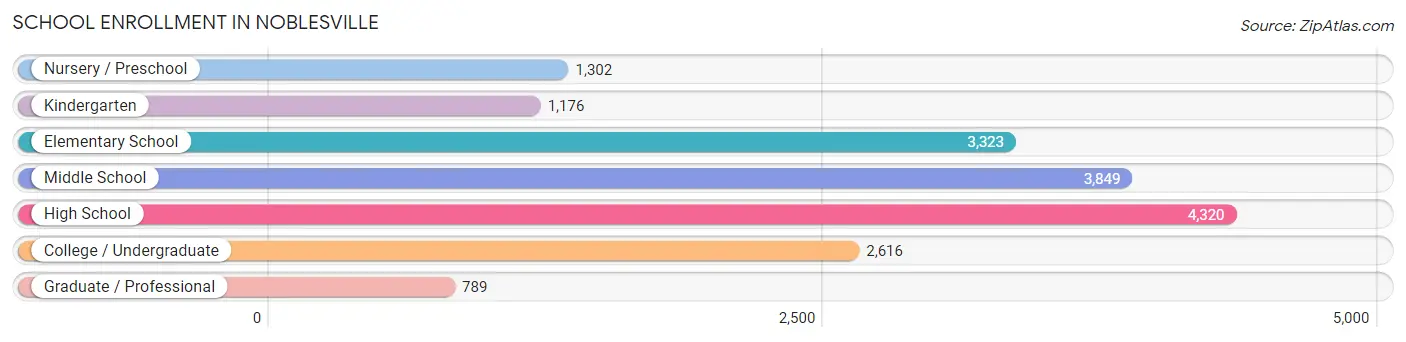
School Enrollment in Noblesville
The most common levels of schooling among the 17,375 students in Noblesville are high school (4,320 | 24.9%), middle school (3,849 | 22.2%), and elementary school (3,323 | 19.1%).
| School Level | # Students | % Students |
| Nursery / Preschool | 1,302 | 7.5% |
| Kindergarten | 1,176 | 6.8% |
| Elementary School | 3,323 | 19.1% |
| Middle School | 3,849 | 22.2% |
| High School | 4,320 | 24.9% |
| College / Undergraduate | 2,616 | 15.1% |
| Graduate / Professional | 789 | 4.5% |
| Total | 17,375 | 100.0% |
School Enrollment by Age by Funding Source in Noblesville
Out of a total of 17,375 students who are enrolled in schools in Noblesville, 3,214 (18.5%) attend a private institution, while the remaining 14,161 (81.5%) are enrolled in public schools. The age group of 3 to 4 year olds has the highest likelihood of being enrolled in private schools, with 793 (78.1% in the age bracket) enrolled. Conversely, the age group of 18 to 19 year olds has the lowest likelihood of being enrolled in a private school, with 1,130 (91.3% in the age bracket) attending a public institution.
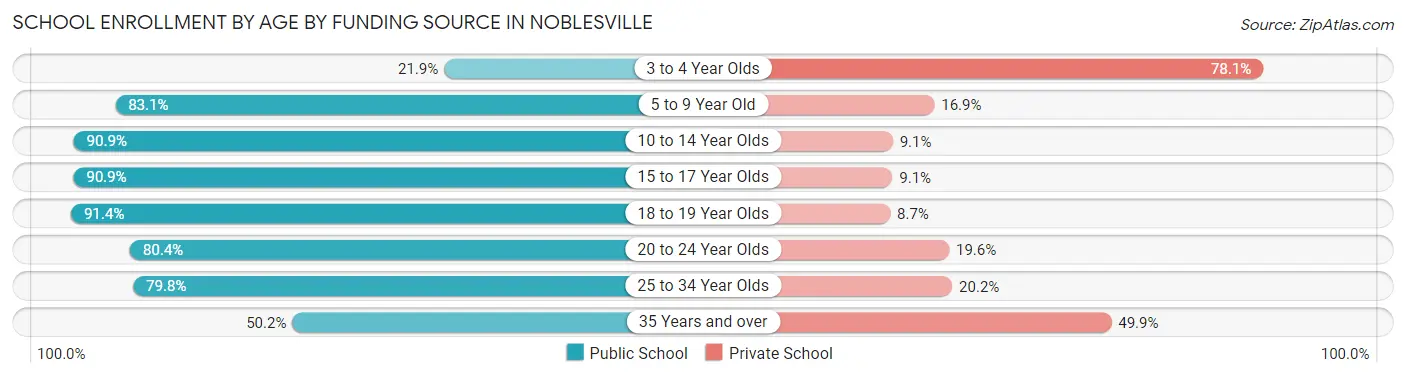
| Age Bracket | Public School | Private School |
| 3 to 4 Year Olds | 222 (21.9%) | 793 (78.1%) |
| 5 to 9 Year Old | 3,595 (83.1%) | 730 (16.9%) |
| 10 to 14 Year Olds | 4,303 (90.9%) | 433 (9.1%) |
| 15 to 17 Year Olds | 2,986 (90.9%) | 298 (9.1%) |
| 18 to 19 Year Olds | 1,130 (91.3%) | 107 (8.6%) |
| 20 to 24 Year Olds | 967 (80.4%) | 236 (19.6%) |
| 25 to 34 Year Olds | 466 (79.8%) | 118 (20.2%) |
| 35 Years and over | 497 (50.1%) | 494 (49.8%) |
| Total | 14,161 (81.5%) | 3,214 (18.5%) |
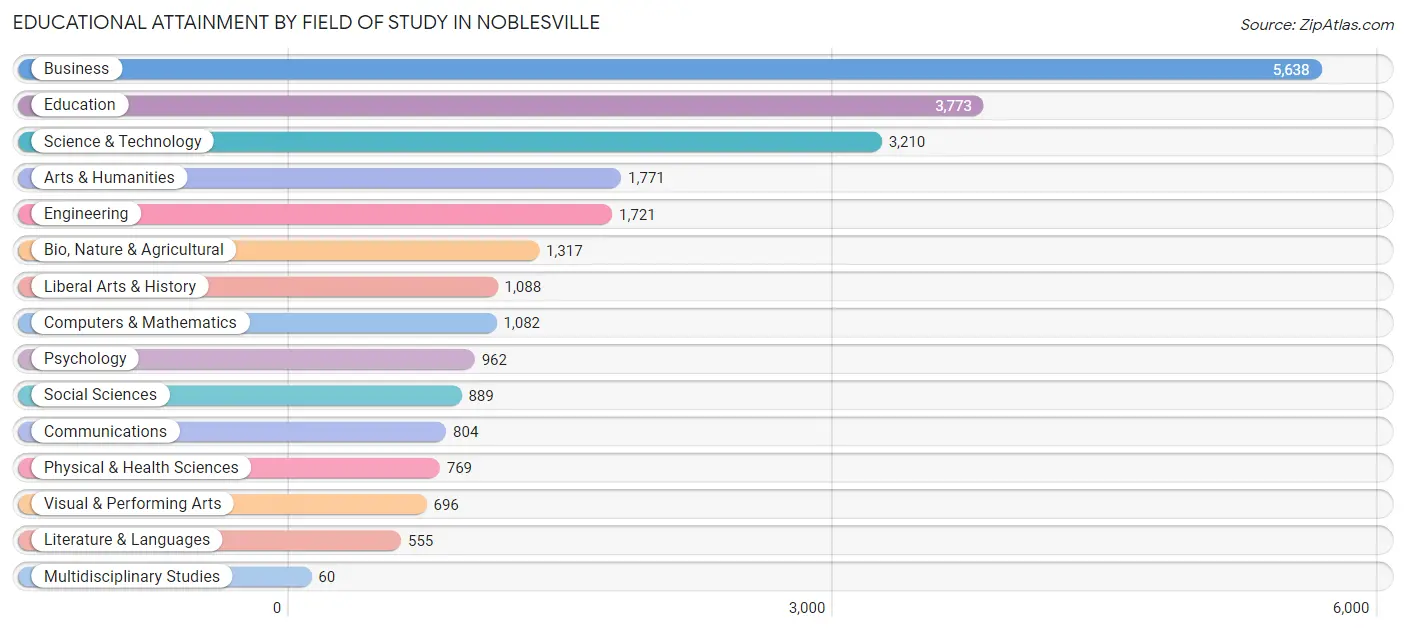
Educational Attainment by Field of Study in Noblesville
Business (5,638 | 23.2%), education (3,773 | 15.5%), science & technology (3,210 | 13.2%), arts & humanities (1,771 | 7.3%), and engineering (1,721 | 7.1%) are the most common fields of study among 24,335 individuals in Noblesville who have obtained a bachelor's degree or higher.
| Field of Study | # Graduates | % Graduates |
| Computers & Mathematics | 1,082 | 4.4% |
| Bio, Nature & Agricultural | 1,317 | 5.4% |
| Physical & Health Sciences | 769 | 3.2% |
| Psychology | 962 | 4.0% |
| Social Sciences | 889 | 3.6% |
| Engineering | 1,721 | 7.1% |
| Multidisciplinary Studies | 60 | 0.3% |
| Science & Technology | 3,210 | 13.2% |
| Business | 5,638 | 23.2% |
| Education | 3,773 | 15.5% |
| Literature & Languages | 555 | 2.3% |
| Liberal Arts & History | 1,088 | 4.5% |
| Visual & Performing Arts | 696 | 2.9% |
| Communications | 804 | 3.3% |
| Arts & Humanities | 1,771 | 7.3% |
| Total | 24,335 | 100.0% |
Transportation & Commute in Noblesville
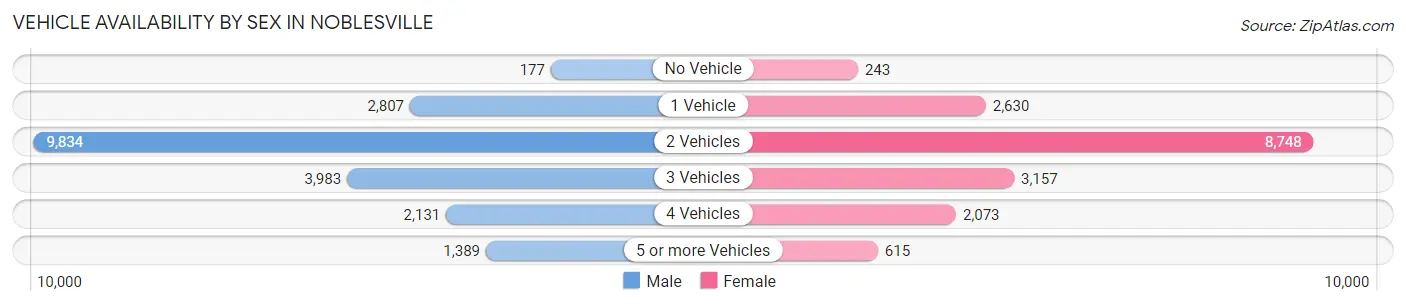
Vehicle Availability by Sex in Noblesville
The most prevalent vehicle ownership categories in Noblesville are males with 2 vehicles (9,834, accounting for 48.4%) and females with 2 vehicles (8,748, making up 56.3%).
| Vehicles Available | Male | Female |
| No Vehicle | 177 (0.9%) | 243 (1.4%) |
| 1 Vehicle | 2,807 (13.8%) | 2,630 (15.1%) |
| 2 Vehicles | 9,834 (48.4%) | 8,748 (50.1%) |
| 3 Vehicles | 3,983 (19.6%) | 3,157 (18.1%) |
| 4 Vehicles | 2,131 (10.5%) | 2,073 (11.9%) |
| 5 or more Vehicles | 1,389 (6.8%) | 615 (3.5%) |
| Total | 20,321 (100.0%) | 17,466 (100.0%) |
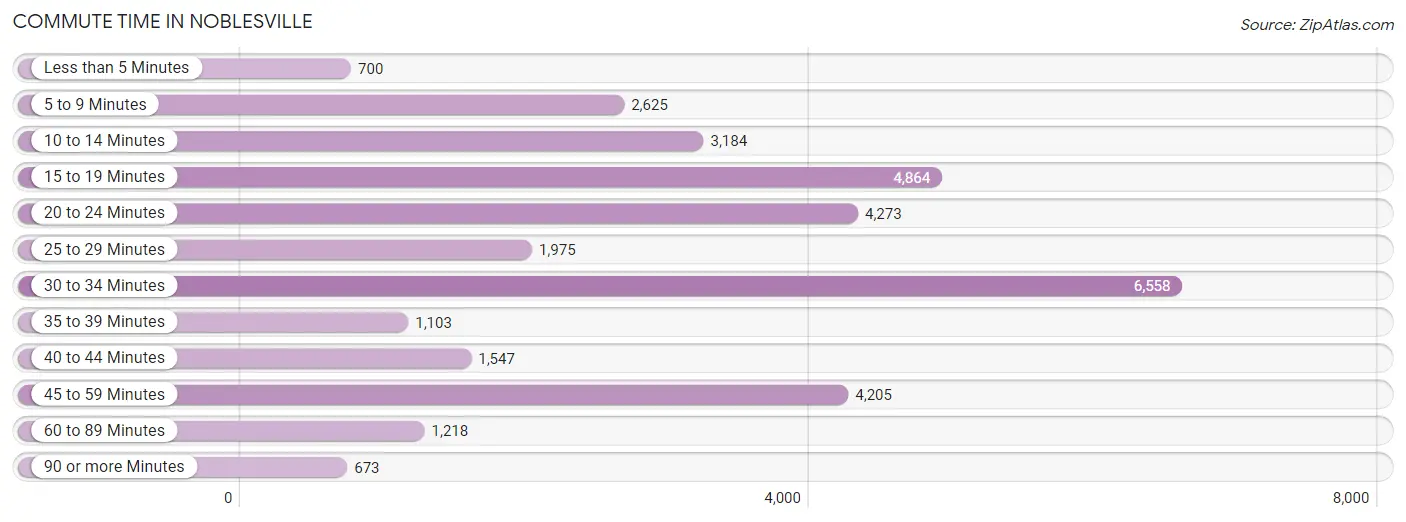
Commute Time in Noblesville
The most frequently occuring commute durations in Noblesville are 30 to 34 minutes (6,558 commuters, 19.9%), 15 to 19 minutes (4,864 commuters, 14.8%), and 20 to 24 minutes (4,273 commuters, 13.0%).
| Commute Time | # Commuters | % Commuters |
| Less than 5 Minutes | 700 | 2.1% |
| 5 to 9 Minutes | 2,625 | 8.0% |
| 10 to 14 Minutes | 3,184 | 9.7% |
| 15 to 19 Minutes | 4,864 | 14.8% |
| 20 to 24 Minutes | 4,273 | 13.0% |
| 25 to 29 Minutes | 1,975 | 6.0% |
| 30 to 34 Minutes | 6,558 | 19.9% |
| 35 to 39 Minutes | 1,103 | 3.4% |
| 40 to 44 Minutes | 1,547 | 4.7% |
| 45 to 59 Minutes | 4,205 | 12.8% |
| 60 to 89 Minutes | 1,218 | 3.7% |
| 90 or more Minutes | 673 | 2.0% |
Commute Time by Sex in Noblesville
The most common commute times in Noblesville are 30 to 34 minutes (3,837 commuters, 21.7%) for males and 15 to 19 minutes (2,778 commuters, 18.2%) for females.
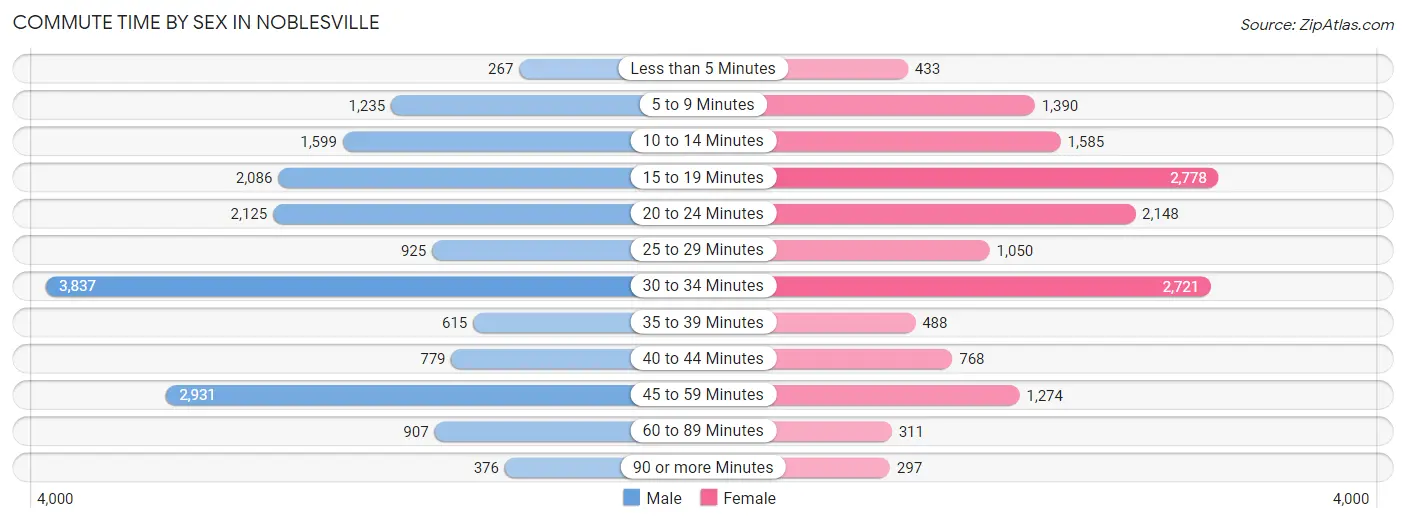
| Commute Time | Male | Female |
| Less than 5 Minutes | 267 (1.5%) | 433 (2.8%) |
| 5 to 9 Minutes | 1,235 (7.0%) | 1,390 (9.1%) |
| 10 to 14 Minutes | 1,599 (9.0%) | 1,585 (10.4%) |
| 15 to 19 Minutes | 2,086 (11.8%) | 2,778 (18.2%) |
| 20 to 24 Minutes | 2,125 (12.0%) | 2,148 (14.1%) |
| 25 to 29 Minutes | 925 (5.2%) | 1,050 (6.9%) |
| 30 to 34 Minutes | 3,837 (21.7%) | 2,721 (17.8%) |
| 35 to 39 Minutes | 615 (3.5%) | 488 (3.2%) |
| 40 to 44 Minutes | 779 (4.4%) | 768 (5.0%) |
| 45 to 59 Minutes | 2,931 (16.6%) | 1,274 (8.4%) |
| 60 to 89 Minutes | 907 (5.1%) | 311 (2.0%) |
| 90 or more Minutes | 376 (2.1%) | 297 (1.9%) |
Time of Departure to Work by Sex in Noblesville
The most frequent times of departure to work in Noblesville are 7:00 AM to 7:29 AM (3,546, 20.1%) for males and 7:00 AM to 7:29 AM (3,049, 20.0%) for females.
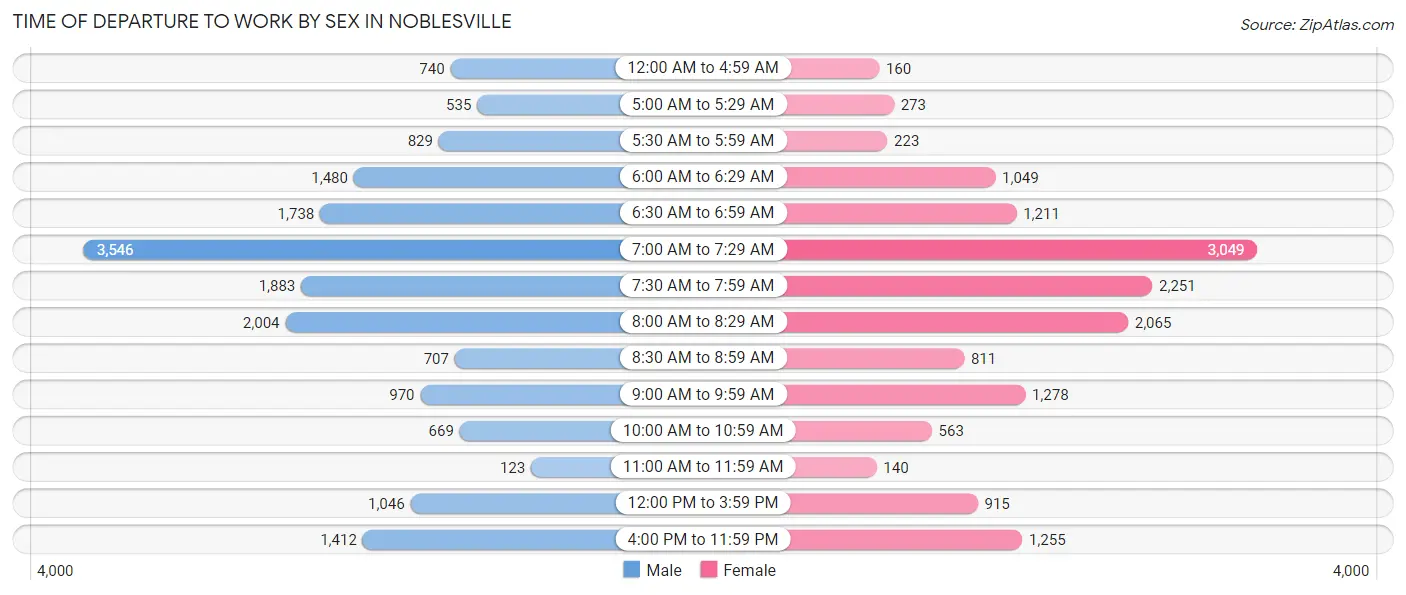
| Time of Departure | Male | Female |
| 12:00 AM to 4:59 AM | 740 (4.2%) | 160 (1.1%) |
| 5:00 AM to 5:29 AM | 535 (3.0%) | 273 (1.8%) |
| 5:30 AM to 5:59 AM | 829 (4.7%) | 223 (1.5%) |
| 6:00 AM to 6:29 AM | 1,480 (8.4%) | 1,049 (6.9%) |
| 6:30 AM to 6:59 AM | 1,738 (9.8%) | 1,211 (7.9%) |
| 7:00 AM to 7:29 AM | 3,546 (20.1%) | 3,049 (20.0%) |
| 7:30 AM to 7:59 AM | 1,883 (10.6%) | 2,251 (14.8%) |
| 8:00 AM to 8:29 AM | 2,004 (11.3%) | 2,065 (13.6%) |
| 8:30 AM to 8:59 AM | 707 (4.0%) | 811 (5.3%) |
| 9:00 AM to 9:59 AM | 970 (5.5%) | 1,278 (8.4%) |
| 10:00 AM to 10:59 AM | 669 (3.8%) | 563 (3.7%) |
| 11:00 AM to 11:59 AM | 123 (0.7%) | 140 (0.9%) |
| 12:00 PM to 3:59 PM | 1,046 (5.9%) | 915 (6.0%) |
| 4:00 PM to 11:59 PM | 1,412 (8.0%) | 1,255 (8.2%) |
| Total | 17,682 (100.0%) | 15,243 (100.0%) |
Housing Occupancy in Noblesville
Occupancy by Ownership in Noblesville
Of the total 25,502 dwellings in Noblesville, owner-occupied units account for 18,394 (72.1%), while renter-occupied units make up 7,108 (27.9%).
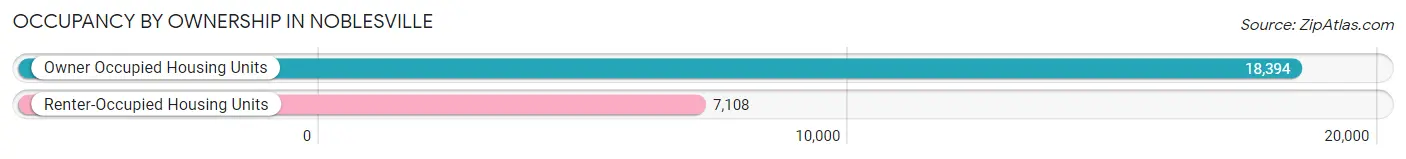
| Occupancy | # Housing Units | % Housing Units |
| Owner Occupied Housing Units | 18,394 | 72.1% |
| Renter-Occupied Housing Units | 7,108 | 27.9% |
| Total Occupied Housing Units | 25,502 | 100.0% |
Occupancy by Household Size in Noblesville
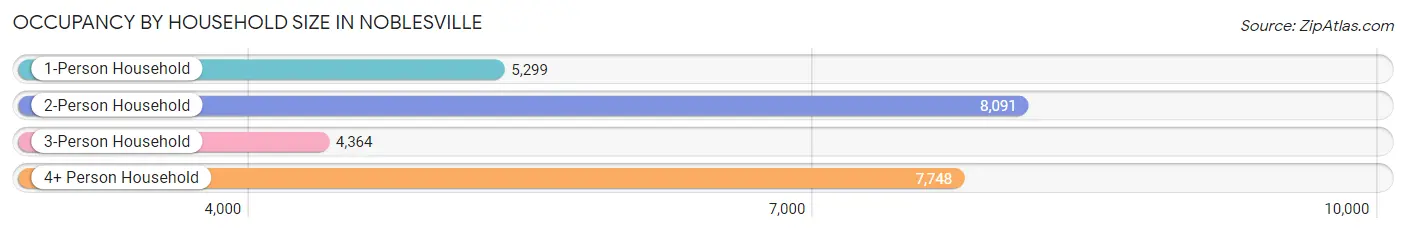
| Household Size | # Housing Units | % Housing Units |
| 1-Person Household | 5,299 | 20.8% |
| 2-Person Household | 8,091 | 31.7% |
| 3-Person Household | 4,364 | 17.1% |
| 4+ Person Household | 7,748 | 30.4% |
| Total Housing Units | 25,502 | 100.0% |
Occupancy by Ownership by Household Size in Noblesville
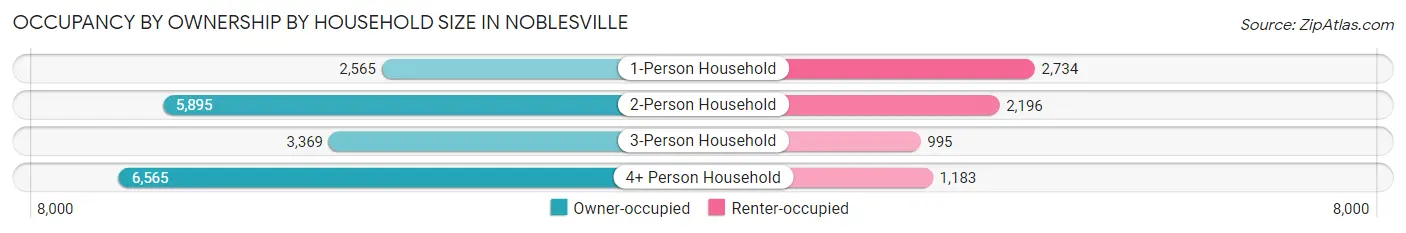
| Household Size | Owner-occupied | Renter-occupied |
| 1-Person Household | 2,565 (48.4%) | 2,734 (51.6%) |
| 2-Person Household | 5,895 (72.9%) | 2,196 (27.1%) |
| 3-Person Household | 3,369 (77.2%) | 995 (22.8%) |
| 4+ Person Household | 6,565 (84.7%) | 1,183 (15.3%) |
| Total Housing Units | 18,394 (72.1%) | 7,108 (27.9%) |
Occupancy by Educational Attainment in Noblesville
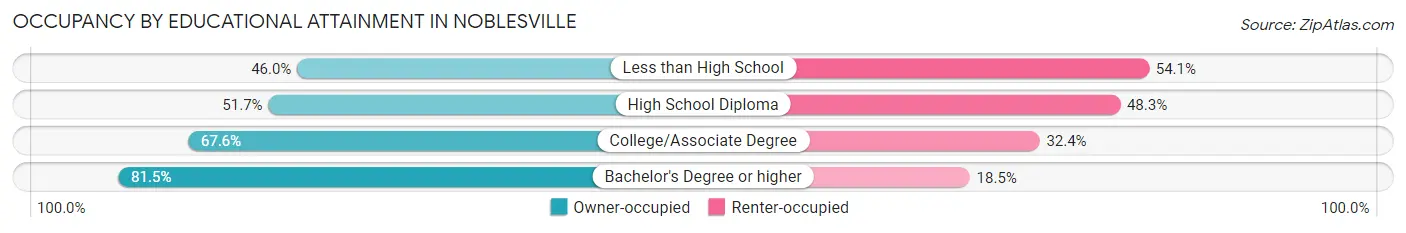
| Household Size | Owner-occupied | Renter-occupied |
| Less than High School | 312 (46.0%) | 367 (54.0%) |
| High School Diploma | 1,994 (51.7%) | 1,866 (48.3%) |
| College/Associate Degree | 4,835 (67.6%) | 2,314 (32.4%) |
| Bachelor's Degree or higher | 11,253 (81.5%) | 2,561 (18.5%) |
Occupancy by Age of Householder in Noblesville
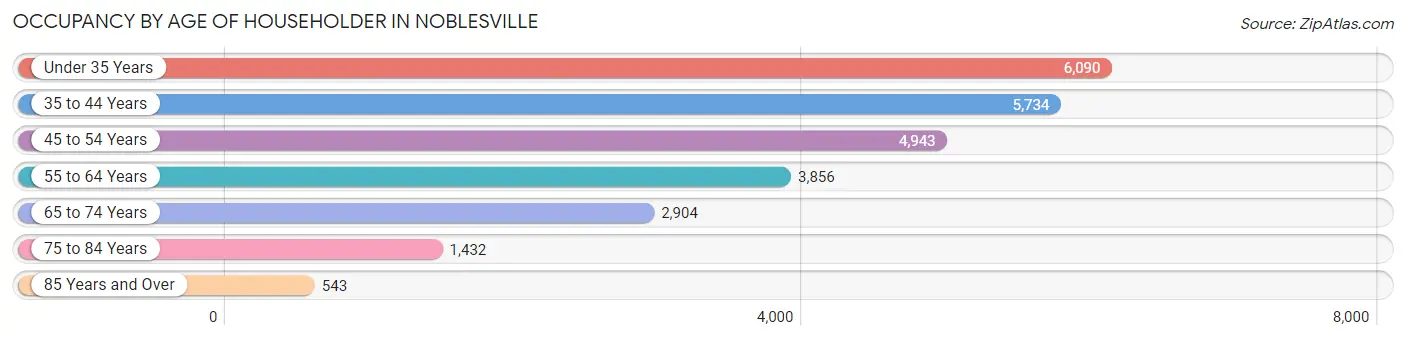
| Age Bracket | # Households | % Households |
| Under 35 Years | 6,090 | 23.9% |
| 35 to 44 Years | 5,734 | 22.5% |
| 45 to 54 Years | 4,943 | 19.4% |
| 55 to 64 Years | 3,856 | 15.1% |
| 65 to 74 Years | 2,904 | 11.4% |
| 75 to 84 Years | 1,432 | 5.6% |
| 85 Years and Over | 543 | 2.1% |
| Total | 25,502 | 100.0% |
Housing Finances in Noblesville
Median Income by Occupancy in Noblesville
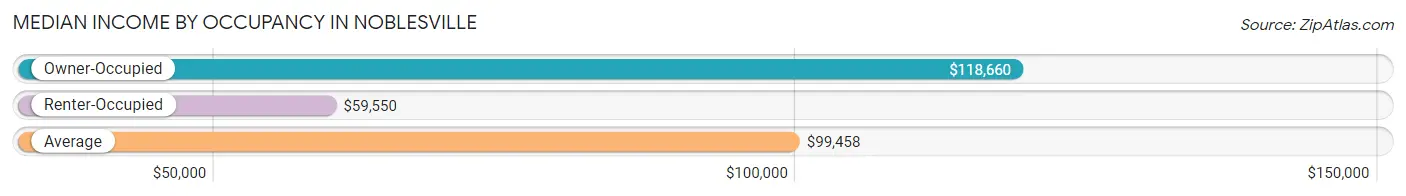
| Occupancy Type | # Households | Median Income |
| Owner-Occupied | 18,394 (72.1%) | $118,660 |
| Renter-Occupied | 7,108 (27.9%) | $59,550 |
| Average | 25,502 (100.0%) | $99,458 |
Occupancy by Householder Income Bracket in Noblesville
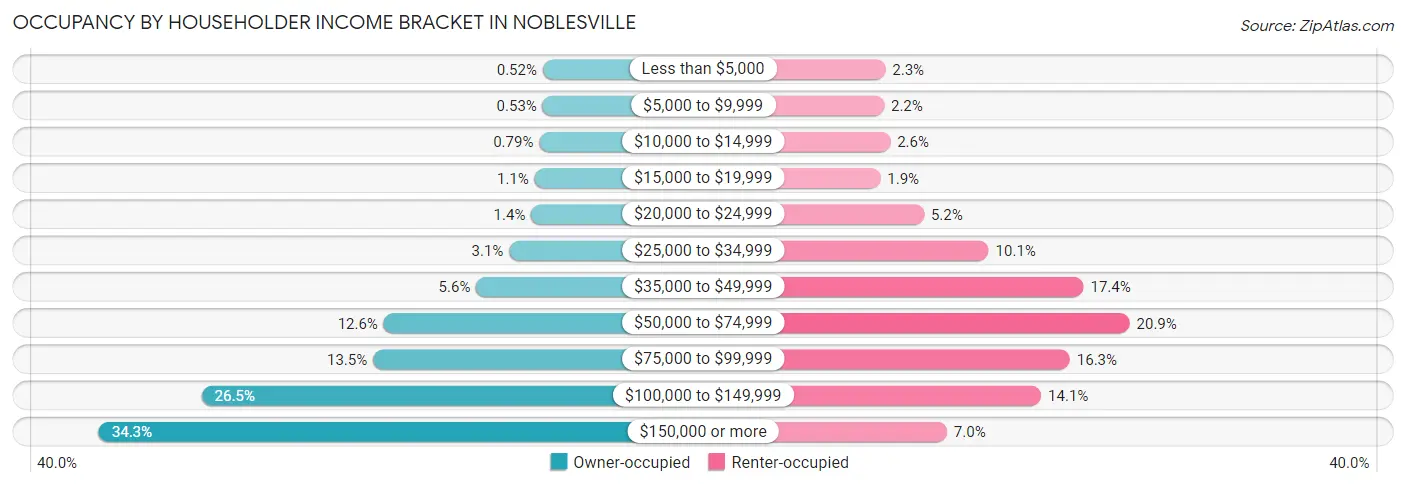
| Income Bracket | Owner-occupied | Renter-occupied |
| Less than $5,000 | 96 (0.5%) | 161 (2.3%) |
| $5,000 to $9,999 | 97 (0.5%) | 154 (2.2%) |
| $10,000 to $14,999 | 146 (0.8%) | 188 (2.6%) |
| $15,000 to $19,999 | 209 (1.1%) | 134 (1.9%) |
| $20,000 to $24,999 | 257 (1.4%) | 370 (5.2%) |
| $25,000 to $34,999 | 567 (3.1%) | 721 (10.1%) |
| $35,000 to $49,999 | 1,029 (5.6%) | 1,235 (17.4%) |
| $50,000 to $74,999 | 2,325 (12.6%) | 1,484 (20.9%) |
| $75,000 to $99,999 | 2,474 (13.5%) | 1,161 (16.3%) |
| $100,000 to $149,999 | 4,877 (26.5%) | 1,005 (14.1%) |
| $150,000 or more | 6,317 (34.3%) | 495 (7.0%) |
| Total | 18,394 (100.0%) | 7,108 (100.0%) |
Monthly Housing Cost Tiers in Noblesville
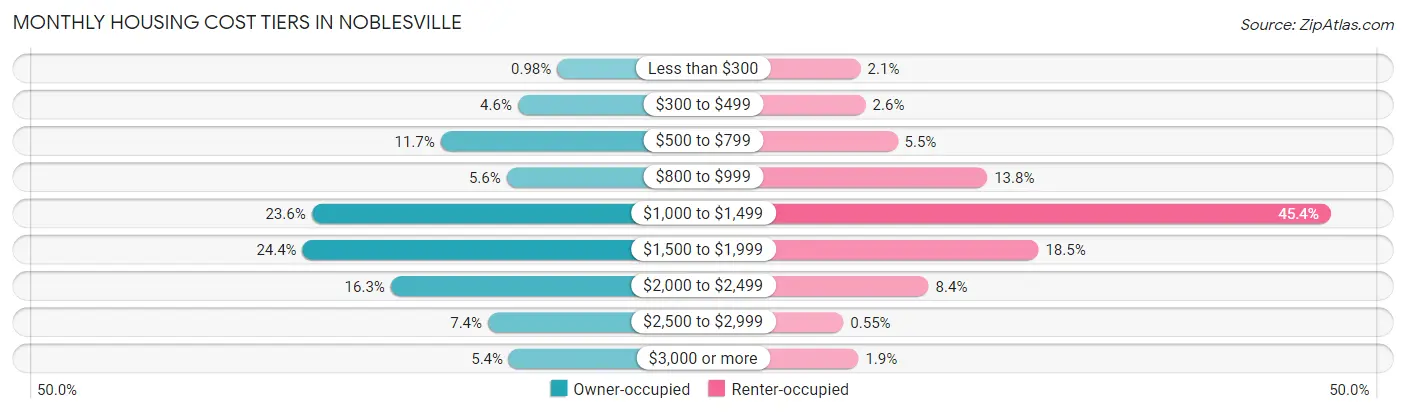
| Monthly Cost | Owner-occupied | Renter-occupied |
| Less than $300 | 181 (1.0%) | 152 (2.1%) |
| $300 to $499 | 846 (4.6%) | 185 (2.6%) |
| $500 to $799 | 2,154 (11.7%) | 394 (5.5%) |
| $800 to $999 | 1,035 (5.6%) | 980 (13.8%) |
| $1,000 to $1,499 | 4,340 (23.6%) | 3,227 (45.4%) |
| $1,500 to $1,999 | 4,491 (24.4%) | 1,316 (18.5%) |
| $2,000 to $2,499 | 2,998 (16.3%) | 597 (8.4%) |
| $2,500 to $2,999 | 1,352 (7.3%) | 39 (0.5%) |
| $3,000 or more | 997 (5.4%) | 138 (1.9%) |
| Total | 18,394 (100.0%) | 7,108 (100.0%) |
Physical Housing Characteristics in Noblesville
Housing Structures in Noblesville
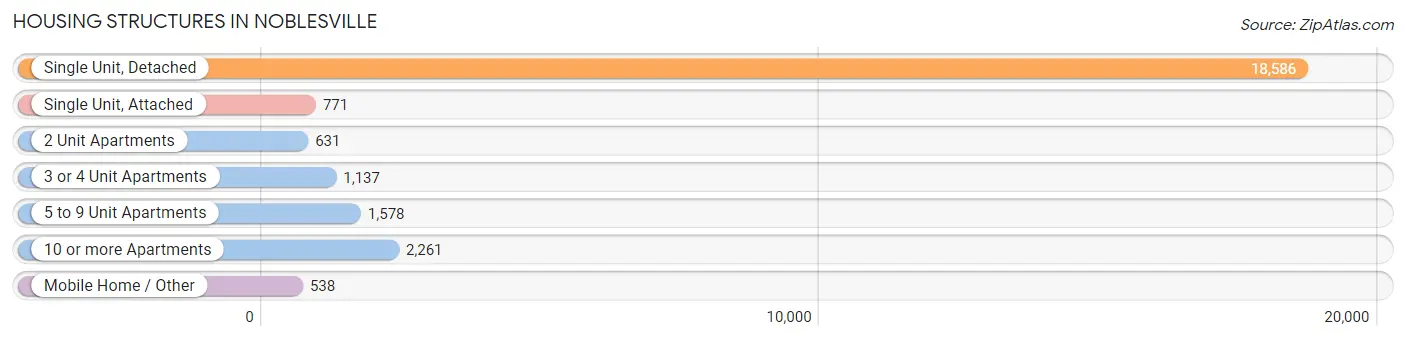
| Structure Type | # Housing Units | % Housing Units |
| Single Unit, Detached | 18,586 | 72.9% |
| Single Unit, Attached | 771 | 3.0% |
| 2 Unit Apartments | 631 | 2.5% |
| 3 or 4 Unit Apartments | 1,137 | 4.5% |
| 5 to 9 Unit Apartments | 1,578 | 6.2% |
| 10 or more Apartments | 2,261 | 8.9% |
| Mobile Home / Other | 538 | 2.1% |
| Total | 25,502 | 100.0% |
Housing Structures by Occupancy in Noblesville
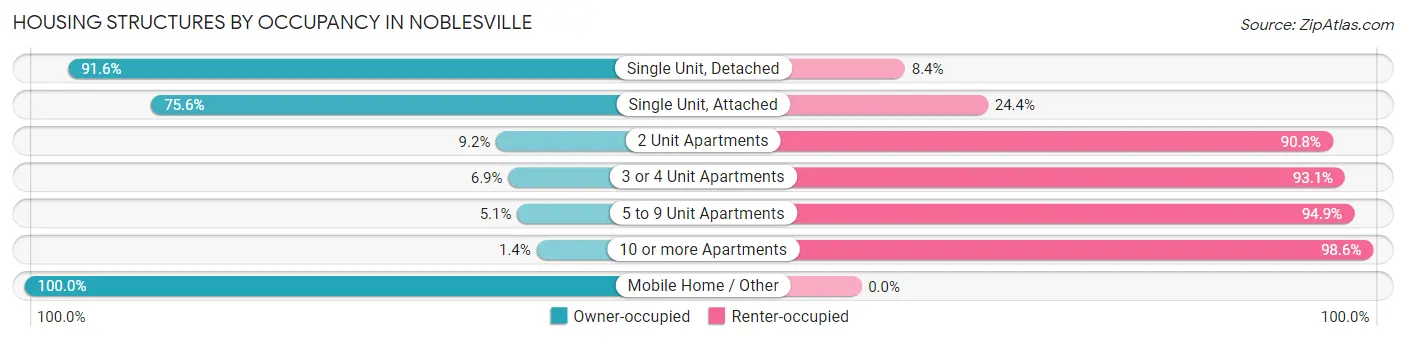
| Structure Type | Owner-occupied | Renter-occupied |
| Single Unit, Detached | 17,024 (91.6%) | 1,562 (8.4%) |
| Single Unit, Attached | 583 (75.6%) | 188 (24.4%) |
| 2 Unit Apartments | 58 (9.2%) | 573 (90.8%) |
| 3 or 4 Unit Apartments | 78 (6.9%) | 1,059 (93.1%) |
| 5 to 9 Unit Apartments | 81 (5.1%) | 1,497 (94.9%) |
| 10 or more Apartments | 32 (1.4%) | 2,229 (98.6%) |
| Mobile Home / Other | 538 (100.0%) | 0 (0.0%) |
| Total | 18,394 (72.1%) | 7,108 (27.9%) |
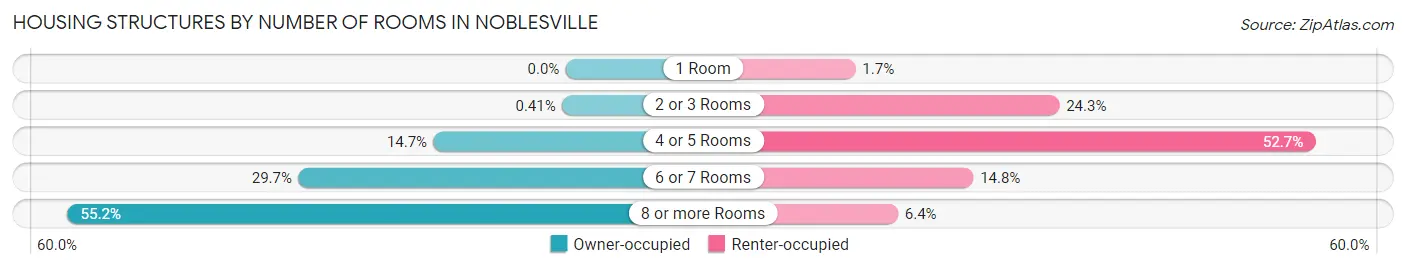
Housing Structures by Number of Rooms in Noblesville
| Number of Rooms | Owner-occupied | Renter-occupied |
| 1 Room | 0 (0.0%) | 122 (1.7%) |
| 2 or 3 Rooms | 76 (0.4%) | 1,730 (24.3%) |
| 4 or 5 Rooms | 2,700 (14.7%) | 3,748 (52.7%) |
| 6 or 7 Rooms | 5,460 (29.7%) | 1,051 (14.8%) |
| 8 or more Rooms | 10,158 (55.2%) | 457 (6.4%) |
| Total | 18,394 (100.0%) | 7,108 (100.0%) |
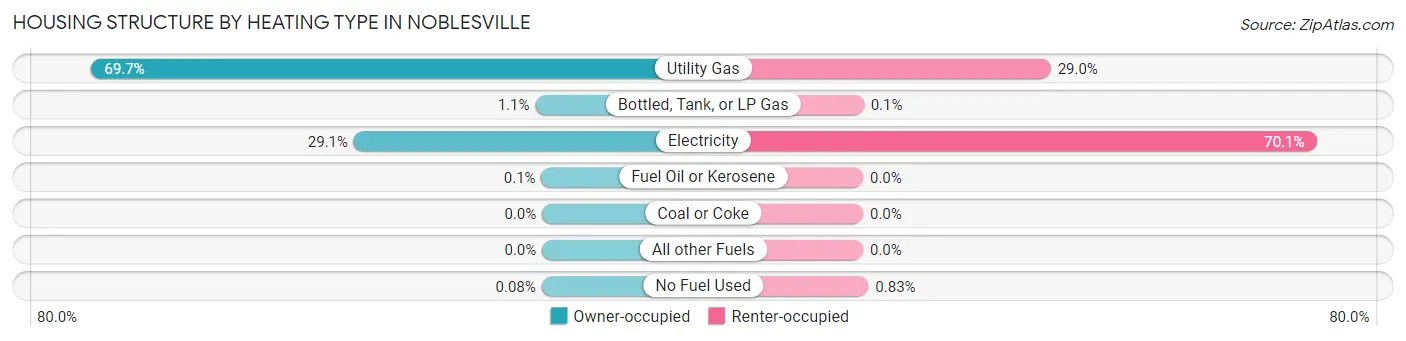
Housing Structure by Heating Type in Noblesville
| Heating Type | Owner-occupied | Renter-occupied |
| Utility Gas | 12,815 (69.7%) | 2,062 (29.0%) |
| Bottled, Tank, or LP Gas | 193 (1.1%) | 7 (0.1%) |
| Electricity | 5,352 (29.1%) | 4,980 (70.1%) |
| Fuel Oil or Kerosene | 19 (0.1%) | 0 (0.0%) |
| Coal or Coke | 0 (0.0%) | 0 (0.0%) |
| All other Fuels | 0 (0.0%) | 0 (0.0%) |
| No Fuel Used | 15 (0.1%) | 59 (0.8%) |
| Total | 18,394 (100.0%) | 7,108 (100.0%) |
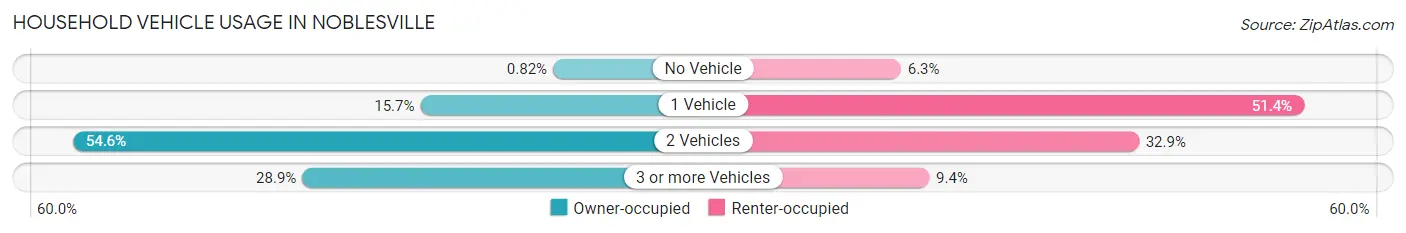
Household Vehicle Usage in Noblesville
| Vehicles per Household | Owner-occupied | Renter-occupied |
| No Vehicle | 151 (0.8%) | 445 (6.3%) |
| 1 Vehicle | 2,883 (15.7%) | 3,654 (51.4%) |
| 2 Vehicles | 10,042 (54.6%) | 2,339 (32.9%) |
| 3 or more Vehicles | 5,318 (28.9%) | 670 (9.4%) |
| Total | 18,394 (100.0%) | 7,108 (100.0%) |
Real Estate & Mortgages in Noblesville
Real Estate and Mortgage Overview in Noblesville
| Characteristic | Without Mortgage | With Mortgage |
| Housing Units | 3,675 | 14,719 |
| Median Property Value | $268,500 | $301,400 |
| Median Household Income | $77,318 | $5,533 |
| Monthly Housing Costs | $599 | $997 |
| Real Estate Taxes | $2,487 | $243 |
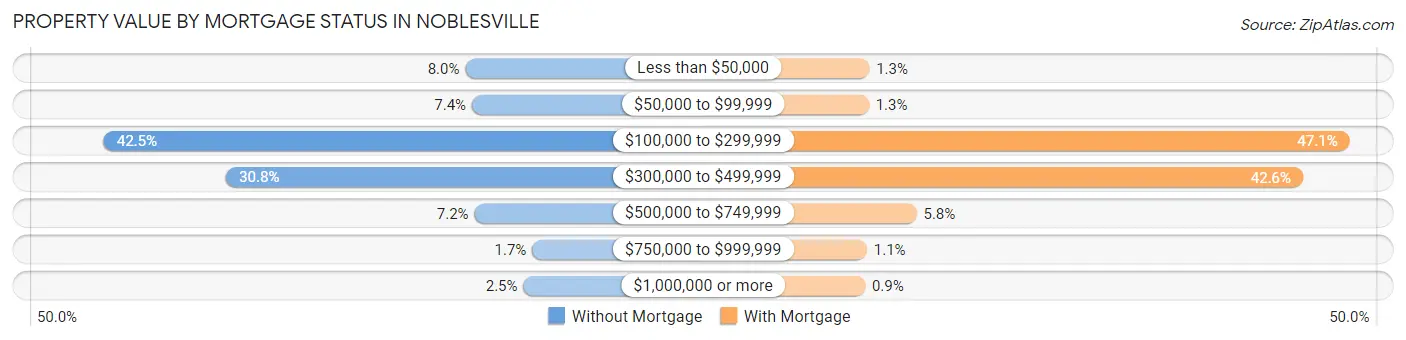
Property Value by Mortgage Status in Noblesville
| Property Value | Without Mortgage | With Mortgage |
| Less than $50,000 | 295 (8.0%) | 192 (1.3%) |
| $50,000 to $99,999 | 272 (7.4%) | 184 (1.3%) |
| $100,000 to $299,999 | 1,560 (42.4%) | 6,925 (47.0%) |
| $300,000 to $499,999 | 1,132 (30.8%) | 6,271 (42.6%) |
| $500,000 to $749,999 | 263 (7.2%) | 855 (5.8%) |
| $750,000 to $999,999 | 61 (1.7%) | 159 (1.1%) |
| $1,000,000 or more | 92 (2.5%) | 133 (0.9%) |
| Total | 3,675 (100.0%) | 14,719 (100.0%) |
Household Income by Mortgage Status in Noblesville
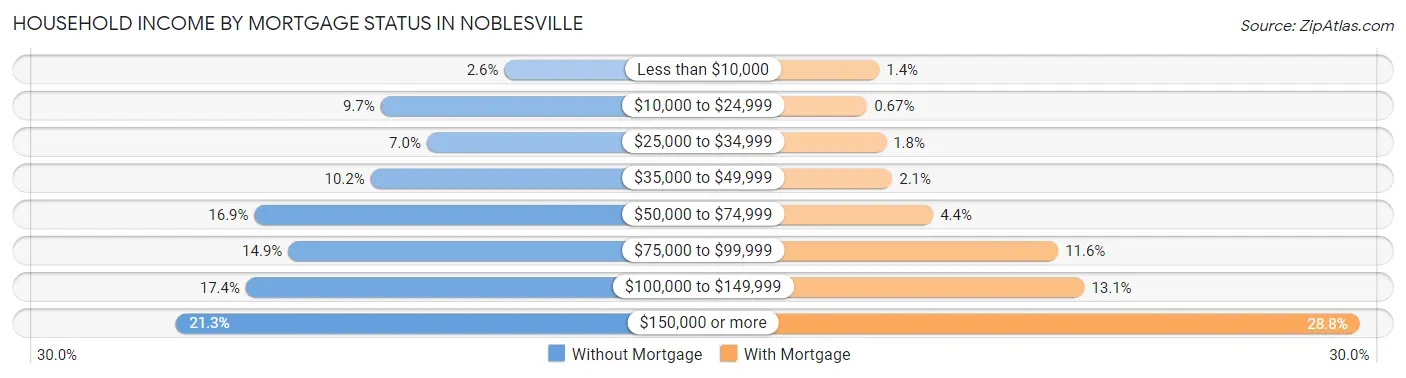
| Household Income | Without Mortgage | With Mortgage |
| Less than $10,000 | 95 (2.6%) | 200 (1.4%) |
| $10,000 to $24,999 | 355 (9.7%) | 98 (0.7%) |
| $25,000 to $34,999 | 258 (7.0%) | 257 (1.8%) |
| $35,000 to $49,999 | 376 (10.2%) | 309 (2.1%) |
| $50,000 to $74,999 | 620 (16.9%) | 653 (4.4%) |
| $75,000 to $99,999 | 549 (14.9%) | 1,705 (11.6%) |
| $100,000 to $149,999 | 638 (17.4%) | 1,925 (13.1%) |
| $150,000 or more | 784 (21.3%) | 4,239 (28.8%) |
| Total | 3,675 (100.0%) | 14,719 (100.0%) |
Property Value to Household Income Ratio in Noblesville
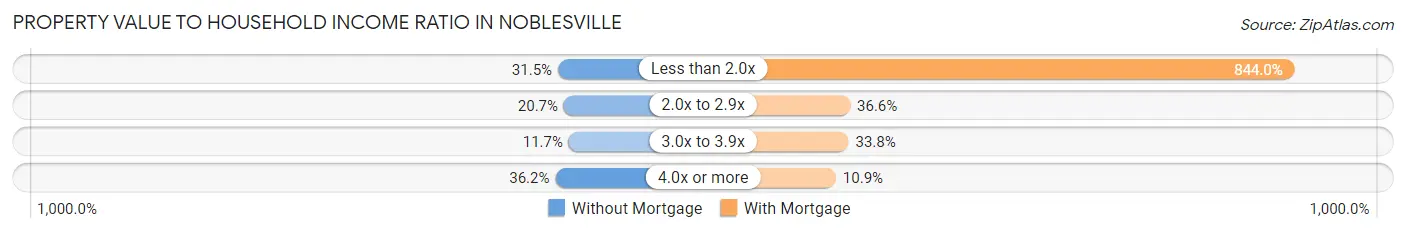
| Value-to-Income Ratio | Without Mortgage | With Mortgage |
| Less than 2.0x | 1,157 (31.5%) | 124,229 (844.0%) |
| 2.0x to 2.9x | 759 (20.6%) | 5,392 (36.6%) |
| 3.0x to 3.9x | 428 (11.7%) | 4,975 (33.8%) |
| 4.0x or more | 1,331 (36.2%) | 1,600 (10.9%) |
| Total | 3,675 (100.0%) | 14,719 (100.0%) |
Real Estate Taxes by Mortgage Status in Noblesville
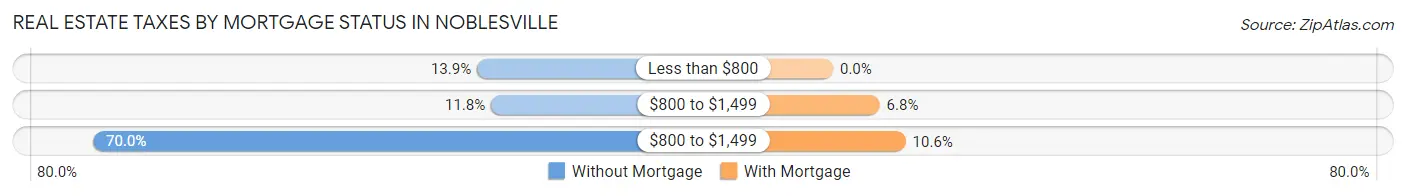
| Property Taxes | Without Mortgage | With Mortgage |
| Less than $800 | 511 (13.9%) | 0 (0.0%) |
| $800 to $1,499 | 435 (11.8%) | 1,002 (6.8%) |
| $800 to $1,499 | 2,572 (70.0%) | 1,562 (10.6%) |
| Total | 3,675 (100.0%) | 14,719 (100.0%) |
Health & Disability in Noblesville
Health Insurance Coverage by Age in Noblesville
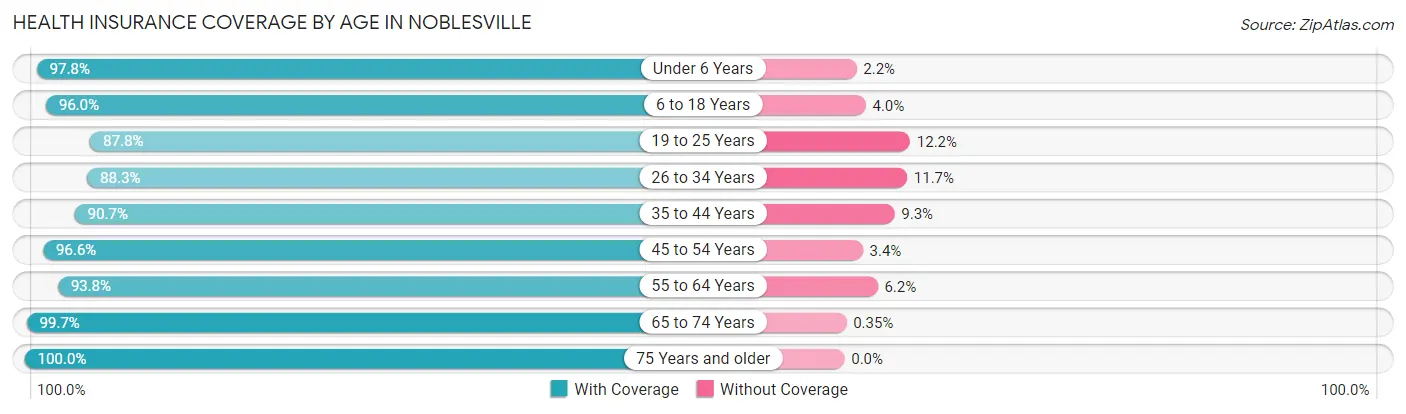
| Age Bracket | With Coverage | Without Coverage |
| Under 6 Years | 6,453 (97.8%) | 148 (2.2%) |
| 6 to 18 Years | 12,675 (96.0%) | 522 (4.0%) |
| 19 to 25 Years | 5,402 (87.8%) | 753 (12.2%) |
| 26 to 34 Years | 8,555 (88.3%) | 1,130 (11.7%) |
| 35 to 44 Years | 9,355 (90.7%) | 963 (9.3%) |
| 45 to 54 Years | 8,591 (96.6%) | 304 (3.4%) |
| 55 to 64 Years | 6,423 (93.8%) | 423 (6.2%) |
| 65 to 74 Years | 4,865 (99.7%) | 17 (0.4%) |
| 75 Years and older | 2,970 (100.0%) | 0 (0.0%) |
| Total | 65,289 (93.9%) | 4,260 (6.1%) |
Health Insurance Coverage by Citizenship Status in Noblesville
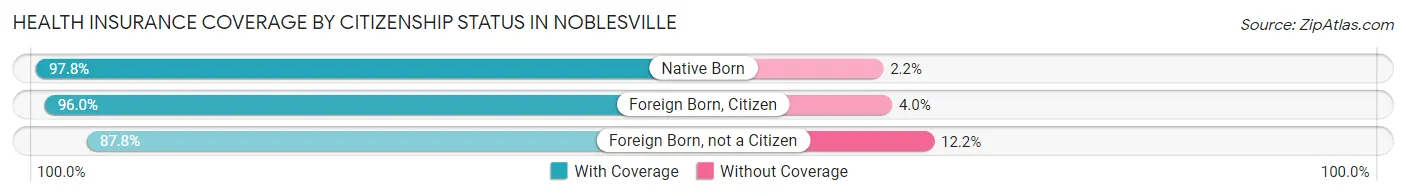
| Citizenship Status | With Coverage | Without Coverage |
| Native Born | 6,453 (97.8%) | 148 (2.2%) |
| Foreign Born, Citizen | 12,675 (96.0%) | 522 (4.0%) |
| Foreign Born, not a Citizen | 5,402 (87.8%) | 753 (12.2%) |
Health Insurance Coverage by Household Income in Noblesville
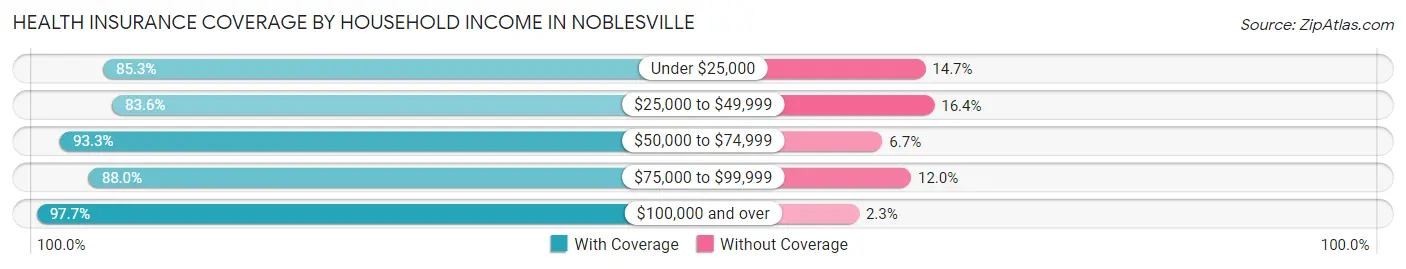
| Household Income | With Coverage | Without Coverage |
| Under $25,000 | 2,995 (85.3%) | 517 (14.7%) |
| $25,000 to $49,999 | 4,832 (83.6%) | 948 (16.4%) |
| $50,000 to $74,999 | 8,724 (93.3%) | 623 (6.7%) |
| $75,000 to $99,999 | 9,051 (88.0%) | 1,239 (12.0%) |
| $100,000 and over | 39,657 (97.7%) | 927 (2.3%) |
Public vs Private Health Insurance Coverage by Age in Noblesville
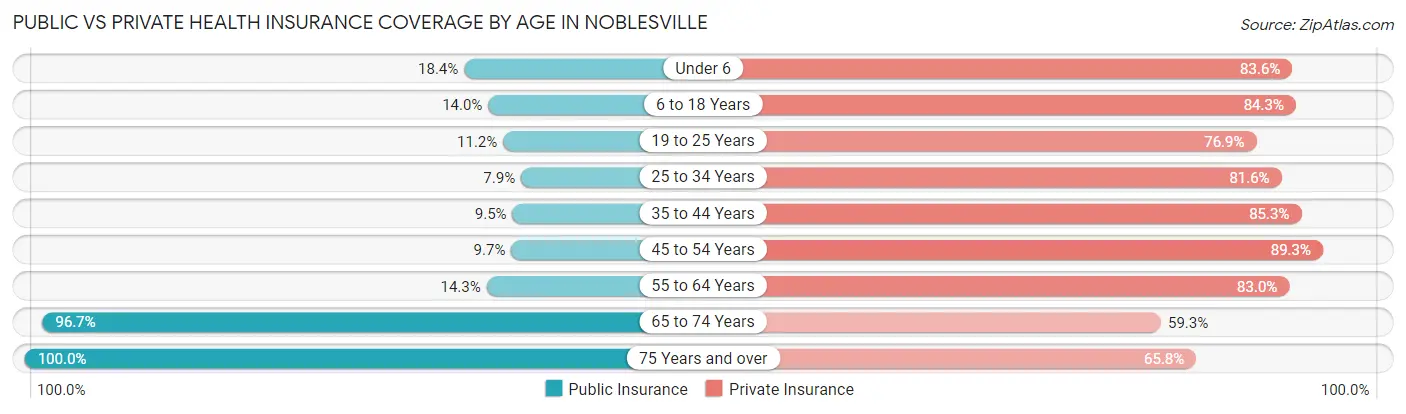
| Age Bracket | Public Insurance | Private Insurance |
| Under 6 | 1,216 (18.4%) | 5,518 (83.6%) |
| 6 to 18 Years | 1,841 (14.0%) | 11,119 (84.3%) |
| 19 to 25 Years | 688 (11.2%) | 4,735 (76.9%) |
| 25 to 34 Years | 761 (7.9%) | 7,903 (81.6%) |
| 35 to 44 Years | 975 (9.5%) | 8,798 (85.3%) |
| 45 to 54 Years | 860 (9.7%) | 7,941 (89.3%) |
| 55 to 64 Years | 976 (14.3%) | 5,684 (83.0%) |
| 65 to 74 Years | 4,721 (96.7%) | 2,893 (59.3%) |
| 75 Years and over | 2,969 (100.0%) | 1,953 (65.8%) |
| Total | 15,007 (21.6%) | 56,544 (81.3%) |
Disability Status by Sex by Age in Noblesville
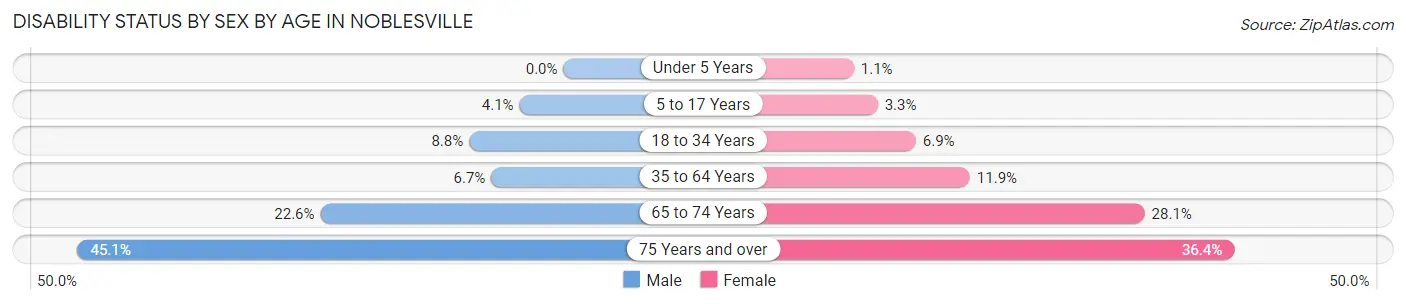
| Age Bracket | Male | Female |
| Under 5 Years | 0 (0.0%) | 31 (1.1%) |
| 5 to 17 Years | 280 (4.1%) | 197 (3.3%) |
| 18 to 34 Years | 754 (8.7%) | 591 (6.9%) |
| 35 to 64 Years | 877 (6.7%) | 1,542 (11.9%) |
| 65 to 74 Years | 484 (22.6%) | 769 (28.1%) |
| 75 Years and over | 550 (45.1%) | 637 (36.4%) |
Disability Class by Sex by Age in Noblesville
Disability Class: Hearing Difficulty
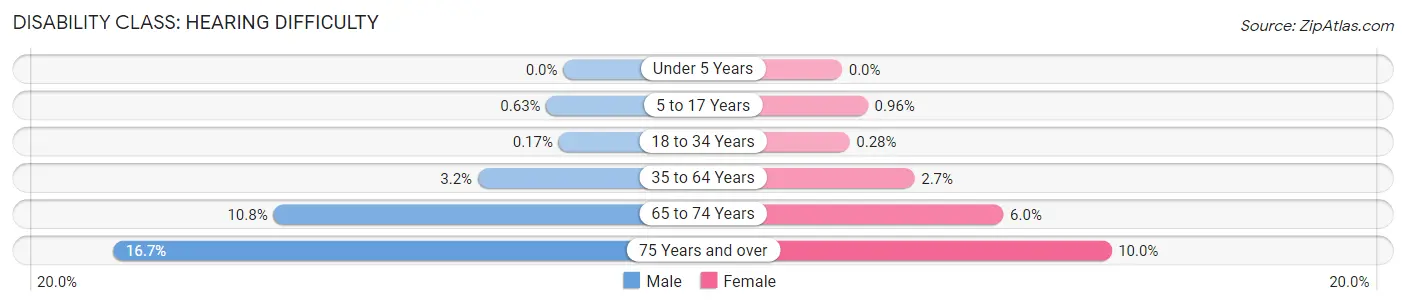
| Age Bracket | Male | Female |
| Under 5 Years | 0 (0.0%) | 0 (0.0%) |
| 5 to 17 Years | 43 (0.6%) | 57 (1.0%) |
| 18 to 34 Years | 15 (0.2%) | 24 (0.3%) |
| 35 to 64 Years | 415 (3.2%) | 349 (2.7%) |
| 65 to 74 Years | 231 (10.8%) | 164 (6.0%) |
| 75 Years and over | 204 (16.7%) | 175 (10.0%) |
Disability Class: Vision Difficulty
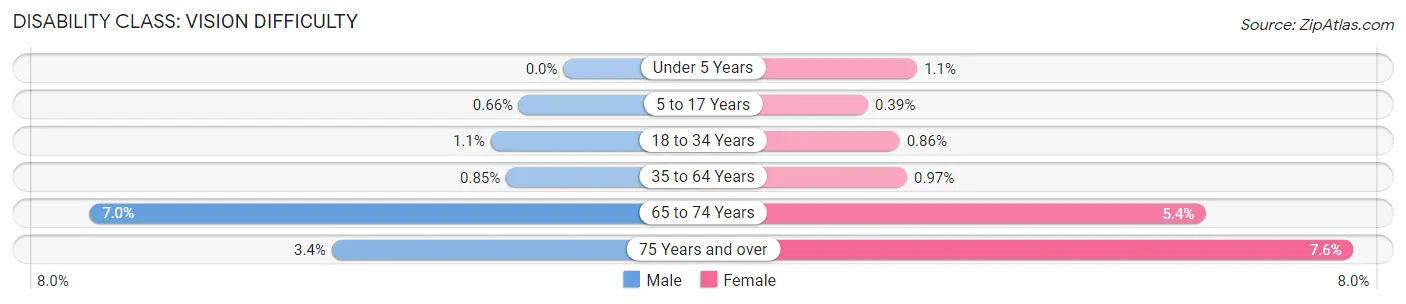
| Age Bracket | Male | Female |
| Under 5 Years | 0 (0.0%) | 31 (1.1%) |
| 5 to 17 Years | 45 (0.7%) | 23 (0.4%) |
| 18 to 34 Years | 93 (1.1%) | 74 (0.9%) |
| 35 to 64 Years | 111 (0.9%) | 126 (1.0%) |
| 65 to 74 Years | 151 (7.0%) | 148 (5.4%) |
| 75 Years and over | 42 (3.4%) | 133 (7.6%) |
Disability Class: Cognitive Difficulty
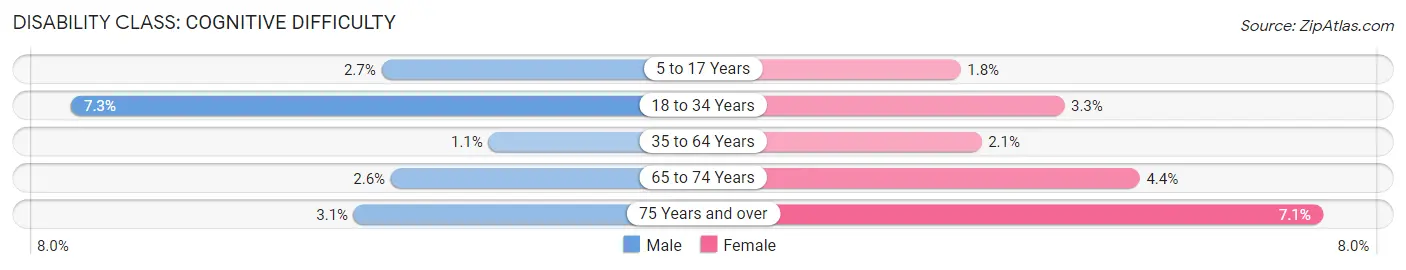
| Age Bracket | Male | Female |
| 5 to 17 Years | 185 (2.7%) | 104 (1.8%) |
| 18 to 34 Years | 630 (7.3%) | 284 (3.3%) |
| 35 to 64 Years | 145 (1.1%) | 268 (2.1%) |
| 65 to 74 Years | 55 (2.6%) | 121 (4.4%) |
| 75 Years and over | 38 (3.1%) | 125 (7.1%) |
Disability Class: Ambulatory Difficulty
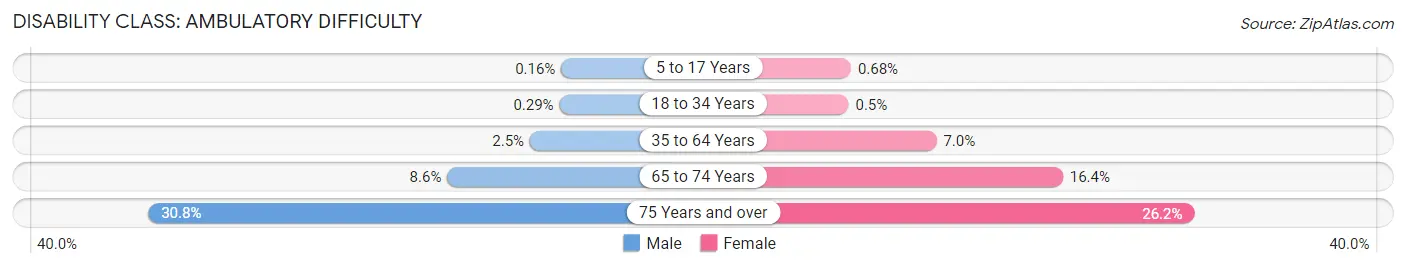
| Age Bracket | Male | Female |
| 5 to 17 Years | 11 (0.2%) | 40 (0.7%) |
| 18 to 34 Years | 25 (0.3%) | 43 (0.5%) |
| 35 to 64 Years | 325 (2.5%) | 912 (7.0%) |
| 65 to 74 Years | 185 (8.6%) | 449 (16.4%) |
| 75 Years and over | 376 (30.8%) | 458 (26.2%) |
Disability Class: Self-Care Difficulty
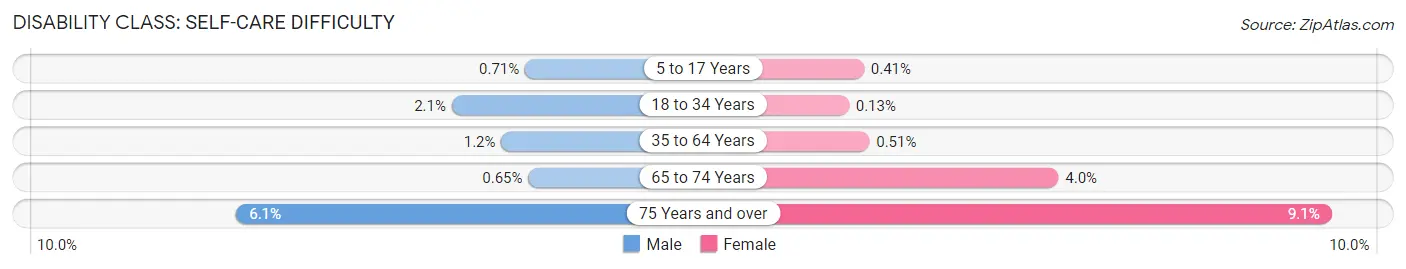
| Age Bracket | Male | Female |
| 5 to 17 Years | 49 (0.7%) | 24 (0.4%) |
| 18 to 34 Years | 178 (2.1%) | 11 (0.1%) |
| 35 to 64 Years | 151 (1.1%) | 66 (0.5%) |
| 65 to 74 Years | 14 (0.6%) | 110 (4.0%) |
| 75 Years and over | 74 (6.1%) | 159 (9.1%) |
Technology Access in Noblesville
Computing Device Access in Noblesville
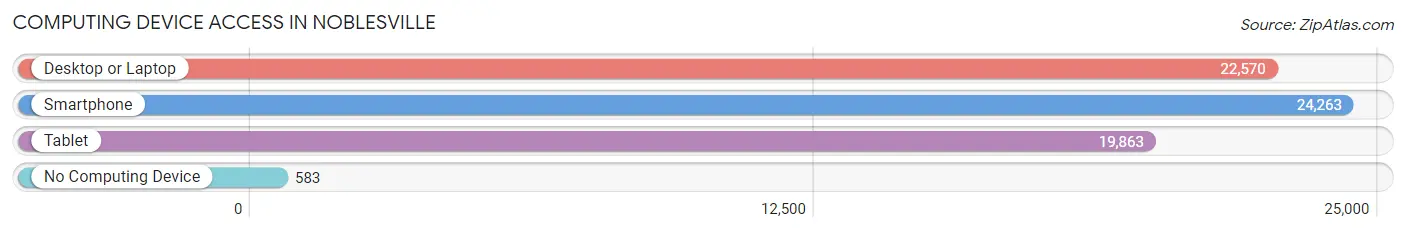
| Device Type | # Households | % Households |
| Desktop or Laptop | 22,570 | 88.5% |
| Smartphone | 24,263 | 95.1% |
| Tablet | 19,863 | 77.9% |
| No Computing Device | 583 | 2.3% |
| Total | 25,502 | 100.0% |
Internet Access in Noblesville
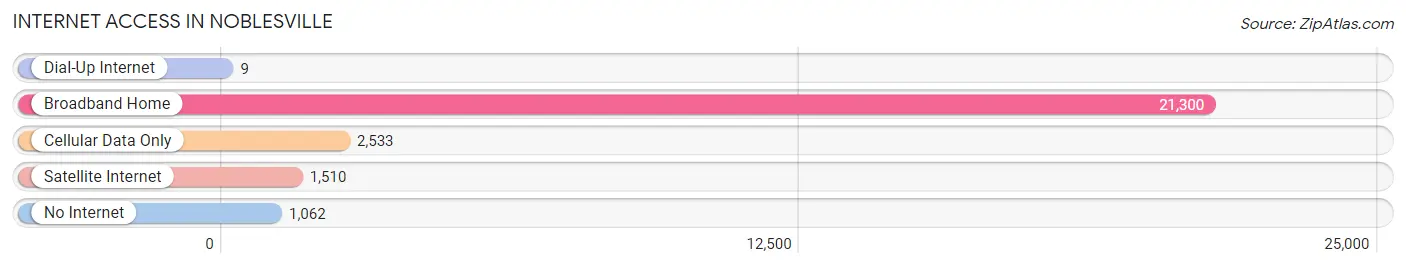
| Internet Type | # Households | % Households |
| Dial-Up Internet | 9 | 0.0% |
| Broadband Home | 21,300 | 83.5% |
| Cellular Data Only | 2,533 | 9.9% |
| Satellite Internet | 1,510 | 5.9% |
| No Internet | 1,062 | 4.2% |
| Total | 25,502 | 100.0% |
Noblesville Summary
Noblesville, Indiana is a city located in Hamilton County, Indiana, United States. It is the county seat of Hamilton County and is located just north of Indianapolis. The population of Noblesville was 51,969 at the 2010 census, making it the 14th largest city in Indiana.
History
The area that is now Noblesville was first settled in 1823 by William Conner and Josiah Polk. The two men had been sent by the US government to survey the area and to establish a trading post. The trading post was established in 1823 and the town was officially platted in 1823. The town was named after James Noble, a local landowner who had donated the land for the town.
In 1851, the first railroad line was built through Noblesville, connecting it to Indianapolis. This allowed for the growth of the city and the development of industry. In 1875, the first public school was established in Noblesville.
In the late 19th century, Noblesville was a major center for the production of agricultural equipment. The city was home to several factories that produced farm equipment, including the Noblesville Plow Company, the Noblesville Wagon Company, and the Noblesville Harvester Company.
Geography
Noblesville is located in central Indiana, approximately 20 miles north of Indianapolis. The city is situated on the White River, which flows through the city. The city is located in a hilly area, with the highest point in the city being the Noblesville Hill at an elevation of 845 feet.
The climate in Noblesville is humid continental, with hot summers and cold winters. The average annual temperature is 54 degrees Fahrenheit. The average annual precipitation is 40 inches.
Economy
The economy of Noblesville is largely based on manufacturing and services. The city is home to several large employers, including the Noblesville Plow Company, the Noblesville Wagon Company, and the Noblesville Harvester Company. Other major employers in the city include the Hamilton County Government, the Hamilton Southeastern School District, and the Hamilton County Hospital.
The city is also home to several retail and dining establishments, including the Hamilton Town Center, a large shopping mall.
Demographics
As of the 2010 census, the population of Noblesville was 51,969. The racial makeup of the city was 87.3% White, 6.2% African American, 0.3% Native American, 2.2% Asian, 0.1% Pacific Islander, 1.7% from other races, and 2.4% from two or more races. Hispanic or Latino of any race were 4.2% of the population.
The median income for a household in the city was $60,945, and the median income for a family was $71,945. The per capita income for the city was $27,945. About 4.3% of families and 5.7% of the population were below the poverty line, including 7.2% of those under age 18 and 4.2% of those age 65 or over.
Common Questions
What is Per Capita Income in Noblesville?
Per Capita income in Noblesville is $44,826.
What is the Median Family Income in Noblesville?
Median Family Income in Noblesville is $117,019.
What is the Median Household income in Noblesville?
Median Household Income in Noblesville is $99,458.
What is Income or Wage Gap in Noblesville?
Income or Wage Gap in Noblesville is 37.6%.
Women in Noblesville earn 62.4 cents for every dollar earned by a man.
What is Inequality or Gini Index in Noblesville?
Inequality or Gini Index in Noblesville is 0.40.
What is the Total Population of Noblesville?
Total Population of Noblesville is 70,442.
What is the Total Male Population of Noblesville?
Total Male Population of Noblesville is 35,378.
What is the Total Female Population of Noblesville?
Total Female Population of Noblesville is 35,064.
What is the Ratio of Males per 100 Females in Noblesville?
There are 100.90 Males per 100 Females in Noblesville.
What is the Ratio of Females per 100 Males in Noblesville?
There are 99.11 Females per 100 Males in Noblesville.
What is the Median Population Age in Noblesville?
Median Population Age in Noblesville is 34.4 Years.
What is the Average Family Size in Noblesville
Average Family Size in Noblesville is 3.2 People.
What is the Average Household Size in Noblesville
Average Household Size in Noblesville is 2.7 People.
How Large is the Labor Force in Noblesville?
There are 39,583 People in the Labor Forcein in Noblesville.
What is the Percentage of People in the Labor Force in Noblesville?
73.1% of People are in the Labor Force in Noblesville.
What is the Unemployment Rate in Noblesville?
Unemployment Rate in Noblesville is 3.4%.