Weatherford, TX Map & Demographics
Weatherford Map
Weatherford Overview
$40,367
PER CAPITA INCOME
$98,308
AVG FAMILY INCOME
$78,765
AVG HOUSEHOLD INCOME
35.3%
WAGE / INCOME GAP [ % ]
64.7¢/ $1
WAGE / INCOME GAP [ $ ]
0.45
INEQUALITY / GINI INDEX
32,168
TOTAL POPULATION
16,510
MALE POPULATION
15,658
FEMALE POPULATION
105.44
MALES / 100 FEMALES
94.84
FEMALES / 100 MALES
38.0
MEDIAN AGE
3.1
AVG FAMILY SIZE
2.5
AVG HOUSEHOLD SIZE
16,346
LABOR FORCE [ PEOPLE ]
63.0%
PERCENT IN LABOR FORCE
3.4%
UNEMPLOYMENT RATE
Income in Weatherford
Income Overview in Weatherford
Per Capita Income in Weatherford is $40,367, while median incomes of families and households are $98,308 and $78,765 respectively.
| Characteristic | Number | Measure |
| Per Capita Income | 32,168 | $40,367 |
| Median Family Income | 7,834 | $98,308 |
| Mean Family Income | 7,834 | $125,414 |
| Median Household Income | 12,336 | $78,765 |
| Mean Household Income | 12,336 | $101,412 |
| Income Deficit | 7,834 | $0 |
| Wage / Income Gap (%) | 32,168 | 35.25% |
| Wage / Income Gap ($) | 32,168 | 64.75¢ per $1 |
| Gini / Inequality Index | 32,168 | 0.45 |
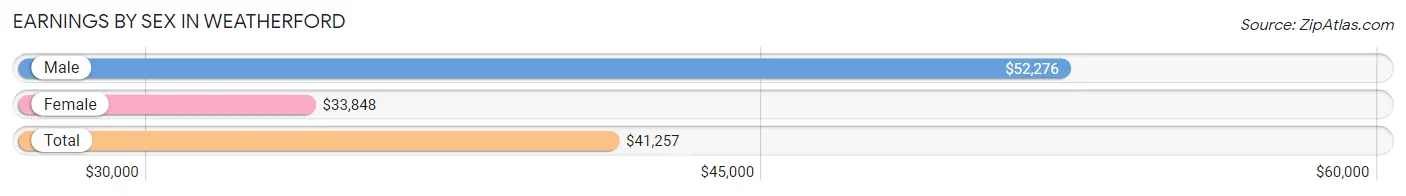
Earnings by Sex in Weatherford
Average Earnings in Weatherford are $41,257, $52,276 for men and $33,848 for women, a difference of 35.2%.
| Sex | Number | Average Earnings |
| Male | 9,466 (54.4%) | $52,276 |
| Female | 7,927 (45.6%) | $33,848 |
| Total | 17,393 (100.0%) | $41,257 |
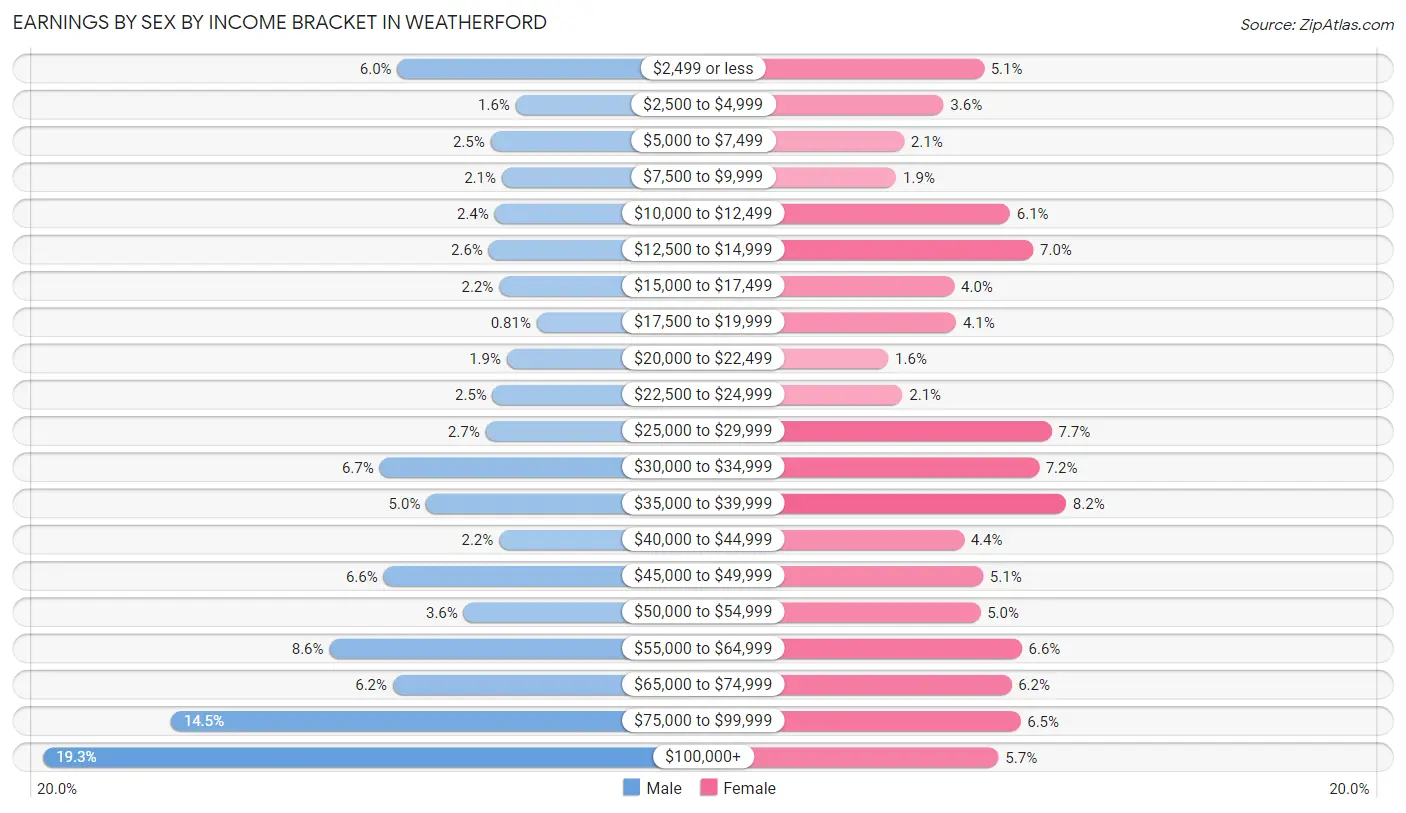
Earnings by Sex by Income Bracket in Weatherford
The most common earnings brackets in Weatherford are $100,000+ for men (1,827 | 19.3%) and $35,000 to $39,999 for women (651 | 8.2%).
| Income | Male | Female |
| $2,499 or less | 571 (6.0%) | 407 (5.1%) |
| $2,500 to $4,999 | 151 (1.6%) | 287 (3.6%) |
| $5,000 to $7,499 | 240 (2.5%) | 170 (2.1%) |
| $7,500 to $9,999 | 201 (2.1%) | 147 (1.8%) |
| $10,000 to $12,499 | 226 (2.4%) | 484 (6.1%) |
| $12,500 to $14,999 | 247 (2.6%) | 553 (7.0%) |
| $15,000 to $17,499 | 210 (2.2%) | 319 (4.0%) |
| $17,500 to $19,999 | 77 (0.8%) | 324 (4.1%) |
| $20,000 to $22,499 | 183 (1.9%) | 123 (1.5%) |
| $22,500 to $24,999 | 233 (2.5%) | 165 (2.1%) |
| $25,000 to $29,999 | 258 (2.7%) | 608 (7.7%) |
| $30,000 to $34,999 | 634 (6.7%) | 570 (7.2%) |
| $35,000 to $39,999 | 469 (5.0%) | 651 (8.2%) |
| $40,000 to $44,999 | 210 (2.2%) | 347 (4.4%) |
| $45,000 to $49,999 | 620 (6.6%) | 404 (5.1%) |
| $50,000 to $54,999 | 336 (3.5%) | 396 (5.0%) |
| $55,000 to $64,999 | 812 (8.6%) | 519 (6.6%) |
| $65,000 to $74,999 | 587 (6.2%) | 488 (6.2%) |
| $75,000 to $99,999 | 1,374 (14.5%) | 515 (6.5%) |
| $100,000+ | 1,827 (19.3%) | 450 (5.7%) |
| Total | 9,466 (100.0%) | 7,927 (100.0%) |
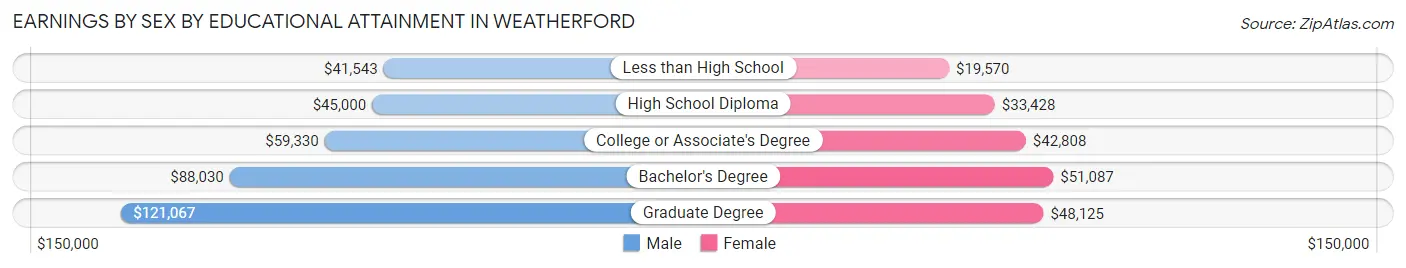
Earnings by Sex by Educational Attainment in Weatherford
Average earnings in Weatherford are $60,054 for men and $38,449 for women, a difference of 36.0%. Men with an educational attainment of graduate degree enjoy the highest average annual earnings of $121,067, while those with less than high school education earn the least with $41,543. Women with an educational attainment of bachelor's degree earn the most with the average annual earnings of $51,087, while those with less than high school education have the smallest earnings of $19,570.
| Educational Attainment | Male Income | Female Income |
| Less than High School | $41,543 | $19,570 |
| High School Diploma | $45,000 | $33,428 |
| College or Associate's Degree | $59,330 | $42,808 |
| Bachelor's Degree | $88,030 | $51,087 |
| Graduate Degree | $121,067 | $48,125 |
| Total | $60,054 | $38,449 |
Family Income in Weatherford
Family Income Brackets in Weatherford
According to the Weatherford family income data, there are 1,653 families falling into the $75,000 to $99,999 income range, which is the most common income bracket and makes up 21.1% of all families. Conversely, the $10,000 to $14,999 income bracket is the least frequent group with only 118 families (1.5%) belonging to this category.
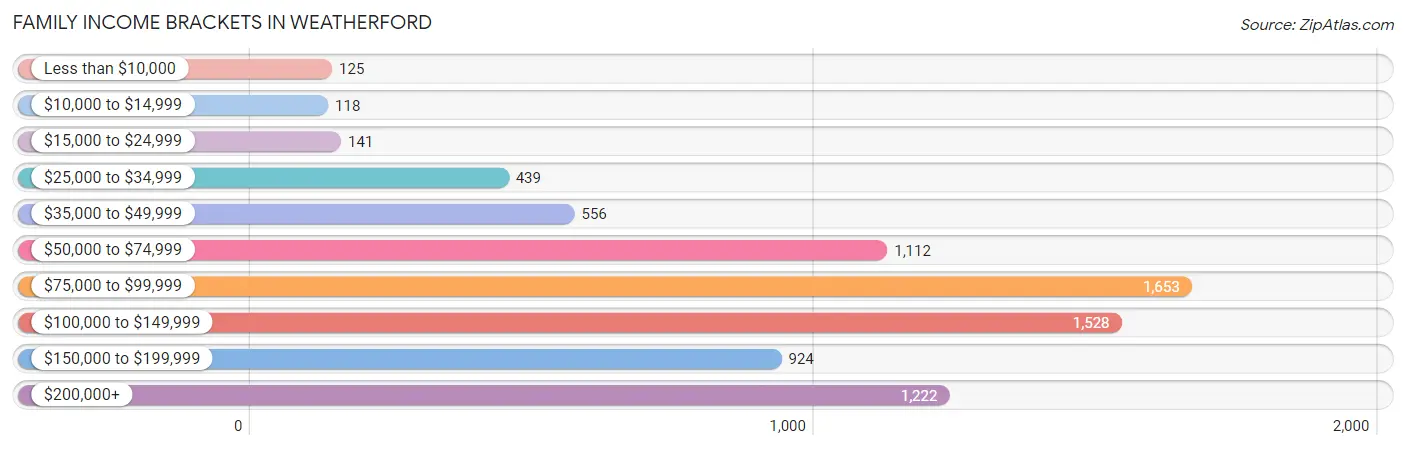
| Income Bracket | # Families | % Families |
| Less than $10,000 | 125 | 1.6% |
| $10,000 to $14,999 | 118 | 1.5% |
| $15,000 to $24,999 | 141 | 1.8% |
| $25,000 to $34,999 | 439 | 5.6% |
| $35,000 to $49,999 | 556 | 7.1% |
| $50,000 to $74,999 | 1,112 | 14.2% |
| $75,000 to $99,999 | 1,653 | 21.1% |
| $100,000 to $149,999 | 1,528 | 19.5% |
| $150,000 to $199,999 | 924 | 11.8% |
| $200,000+ | 1,222 | 15.6% |
Family Income by Famaliy Size in Weatherford
7+ person families (172 | 2.2%) account for the highest median family income in Weatherford with $182,612 per family, while 2-person families (3,841 | 49.0%) have the highest median income of $47,676 per family member.
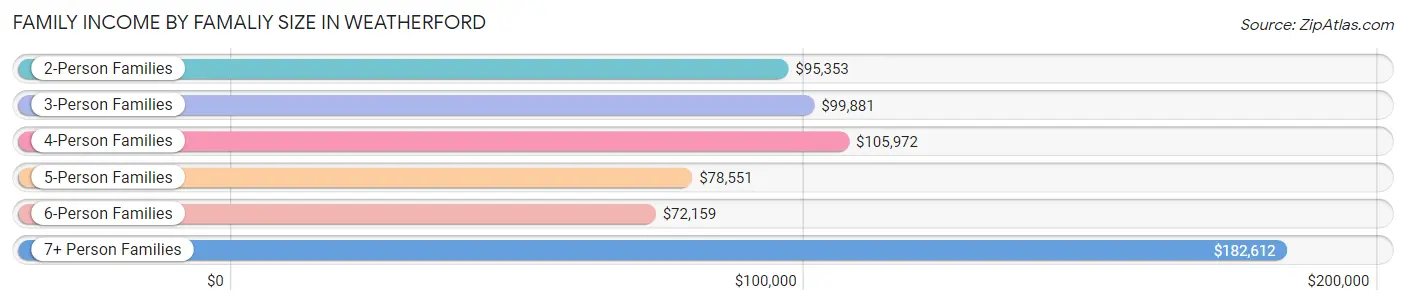
| Income Bracket | # Families | Median Income |
| 2-Person Families | 3,841 (49.0%) | $95,353 |
| 3-Person Families | 1,380 (17.6%) | $99,881 |
| 4-Person Families | 1,447 (18.5%) | $105,972 |
| 5-Person Families | 784 (10.0%) | $78,551 |
| 6-Person Families | 210 (2.7%) | $72,159 |
| 7+ Person Families | 172 (2.2%) | $182,612 |
| Total | 7,834 (100.0%) | $98,308 |
Family Income by Number of Earners in Weatherford
The median family income in Weatherford is $98,308, with families comprising 3+ earners (1,126) having the highest median family income of $158,504, while families with no earners (1,059) have the lowest median family income of $46,750, accounting for 14.4% and 13.5% of families, respectively.
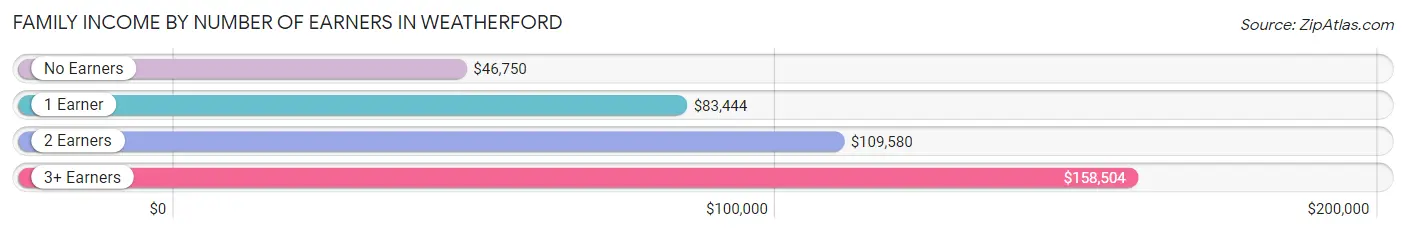
| Number of Earners | # Families | Median Income |
| No Earners | 1,059 (13.5%) | $46,750 |
| 1 Earner | 2,181 (27.8%) | $83,444 |
| 2 Earners | 3,468 (44.3%) | $109,580 |
| 3+ Earners | 1,126 (14.4%) | $158,504 |
| Total | 7,834 (100.0%) | $98,308 |
Household Income in Weatherford
Household Income Brackets in Weatherford
With 1,986 households falling in the category, the $75,000 to $99,999 income range is the most frequent in Weatherford, accounting for 16.1% of all households. In contrast, only 432 households (3.5%) fall into the $10,000 to $14,999 income bracket, making it the least populous group.
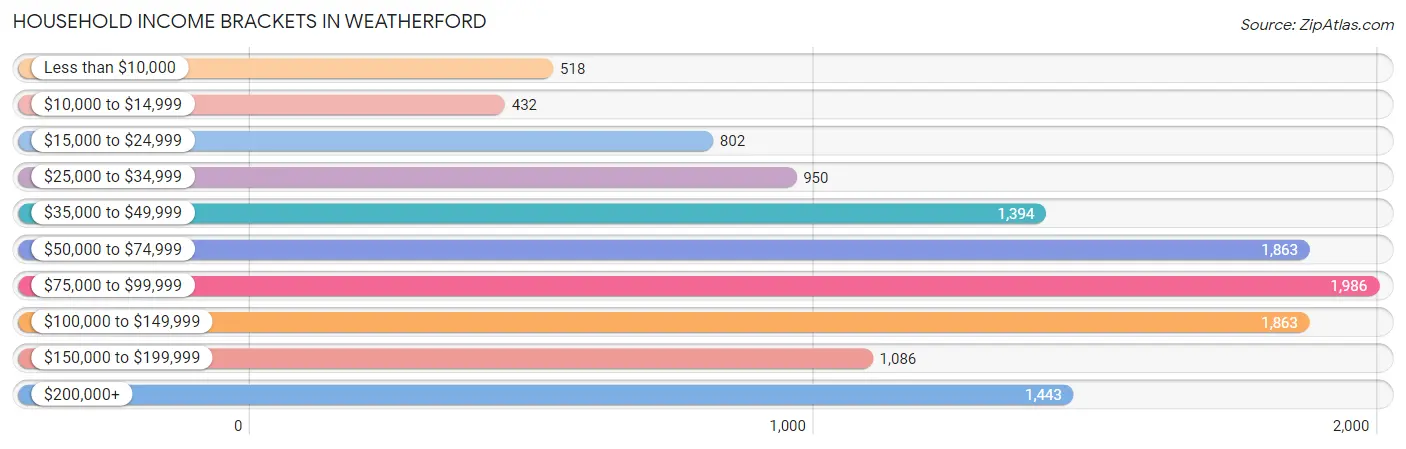
| Income Bracket | # Households | % Households |
| Less than $10,000 | 518 | 4.2% |
| $10,000 to $14,999 | 432 | 3.5% |
| $15,000 to $24,999 | 802 | 6.5% |
| $25,000 to $34,999 | 950 | 7.7% |
| $35,000 to $49,999 | 1,394 | 11.3% |
| $50,000 to $74,999 | 1,863 | 15.1% |
| $75,000 to $99,999 | 1,986 | 16.1% |
| $100,000 to $149,999 | 1,863 | 15.1% |
| $150,000 to $199,999 | 1,086 | 8.8% |
| $200,000+ | 1,443 | 11.7% |
Household Income by Householder Age in Weatherford
The median household income in Weatherford is $78,765, with the highest median household income of $95,880 found in the 45 to 64 years age bracket for the primary householder. A total of 4,254 households (34.5%) fall into this category. Meanwhile, the 65+ years age bracket for the primary householder has the lowest median household income of $46,125, with 3,682 households (29.8%) in this group.
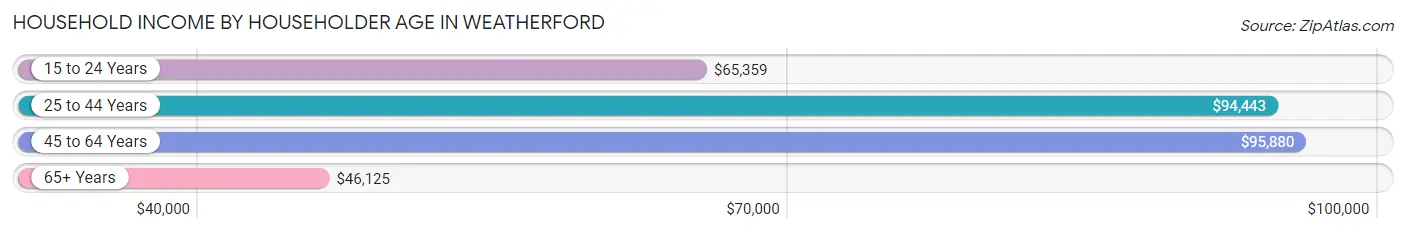
| Income Bracket | # Households | Median Income |
| 15 to 24 Years | 560 (4.5%) | $65,359 |
| 25 to 44 Years | 3,840 (31.1%) | $94,443 |
| 45 to 64 Years | 4,254 (34.5%) | $95,880 |
| 65+ Years | 3,682 (29.8%) | $46,125 |
| Total | 12,336 (100.0%) | $78,765 |
Poverty in Weatherford
Income Below Poverty by Sex and Age in Weatherford
With 6.5% poverty level for males and 11.2% for females among the residents of Weatherford, 35 to 44 year old males and 15 year old females are the most vulnerable to poverty, with 211 males (14.4%) and 26 females (32.5%) in their respective age groups living below the poverty level.
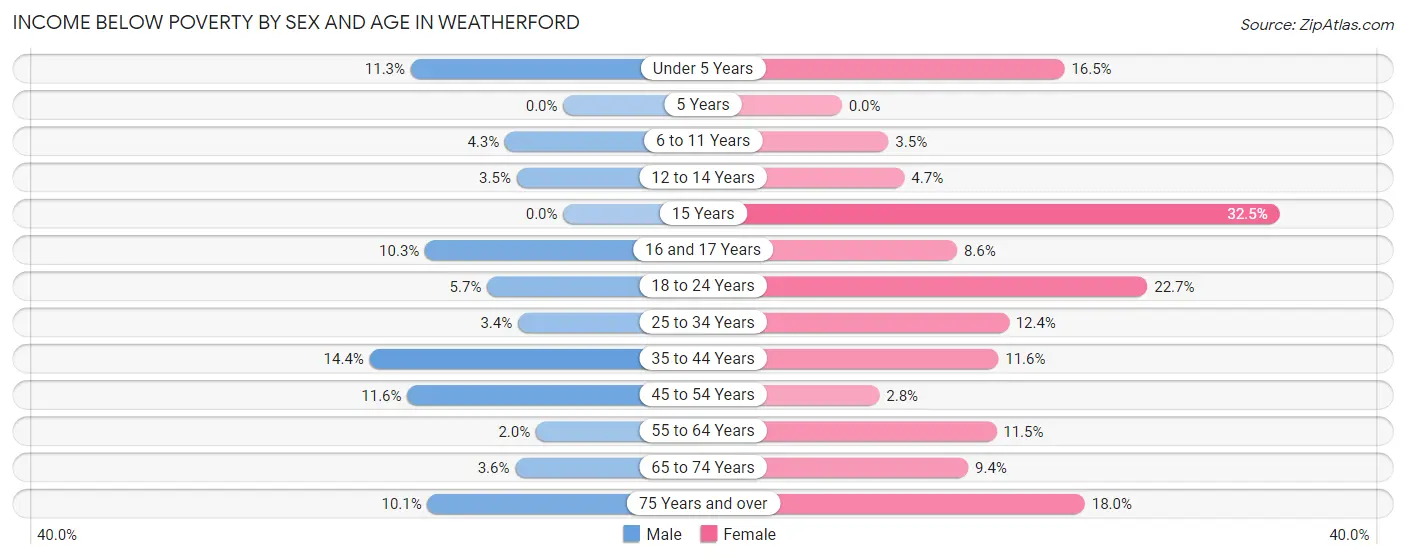
| Age Bracket | Male | Female |
| Under 5 Years | 128 (11.3%) | 102 (16.5%) |
| 5 Years | 0 (0.0%) | 0 (0.0%) |
| 6 to 11 Years | 57 (4.3%) | 37 (3.5%) |
| 12 to 14 Years | 17 (3.5%) | 20 (4.6%) |
| 15 Years | 0 (0.0%) | 26 (32.5%) |
| 16 and 17 Years | 39 (10.3%) | 43 (8.6%) |
| 18 to 24 Years | 99 (5.7%) | 317 (22.7%) |
| 25 to 34 Years | 79 (3.4%) | 230 (12.4%) |
| 35 to 44 Years | 211 (14.4%) | 219 (11.6%) |
| 45 to 54 Years | 194 (11.6%) | 48 (2.8%) |
| 55 to 64 Years | 46 (2.0%) | 230 (11.5%) |
| 65 to 74 Years | 51 (3.6%) | 155 (9.4%) |
| 75 Years and over | 91 (10.1%) | 241 (18.0%) |
| Total | 1,012 (6.5%) | 1,668 (11.2%) |
Income Above Poverty by Sex and Age in Weatherford
According to the poverty statistics in Weatherford, males aged 5 years and females aged 5 years are the age groups that are most secure financially, with 100.0% of males and 100.0% of females in these age groups living above the poverty line.
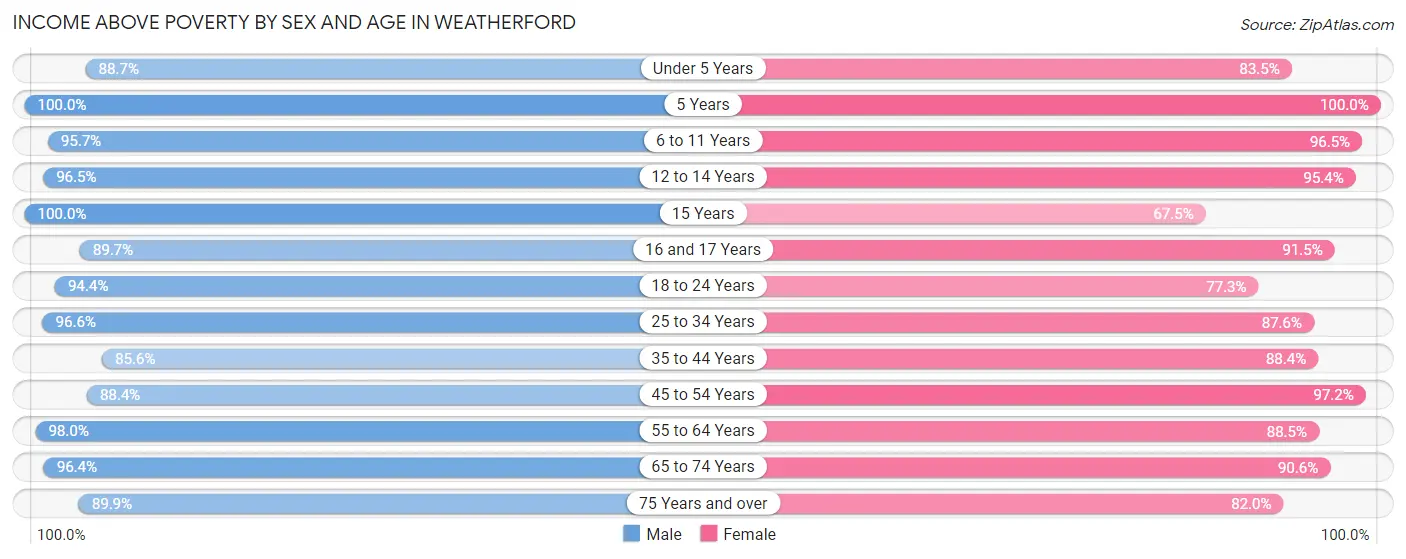
| Age Bracket | Male | Female |
| Under 5 Years | 1,003 (88.7%) | 515 (83.5%) |
| 5 Years | 150 (100.0%) | 346 (100.0%) |
| 6 to 11 Years | 1,260 (95.7%) | 1,032 (96.5%) |
| 12 to 14 Years | 474 (96.5%) | 410 (95.4%) |
| 15 Years | 252 (100.0%) | 54 (67.5%) |
| 16 and 17 Years | 341 (89.7%) | 460 (91.4%) |
| 18 to 24 Years | 1,654 (94.4%) | 1,081 (77.3%) |
| 25 to 34 Years | 2,273 (96.6%) | 1,627 (87.6%) |
| 35 to 44 Years | 1,256 (85.6%) | 1,666 (88.4%) |
| 45 to 54 Years | 1,482 (88.4%) | 1,673 (97.2%) |
| 55 to 64 Years | 2,215 (98.0%) | 1,775 (88.5%) |
| 65 to 74 Years | 1,379 (96.4%) | 1,497 (90.6%) |
| 75 Years and over | 812 (89.9%) | 1,095 (82.0%) |
| Total | 14,551 (93.5%) | 13,231 (88.8%) |
Income Below Poverty Among Married-Couple Families in Weatherford
The poverty statistics for married-couple families in Weatherford show that 5.6% or 349 of the total 6,217 families live below the poverty line. Families with 3 or 4 children have the highest poverty rate of 32.8%, comprising of 201 families. On the other hand, families with 5 or more children have the lowest poverty rate of 0.0%, which includes 0 families.
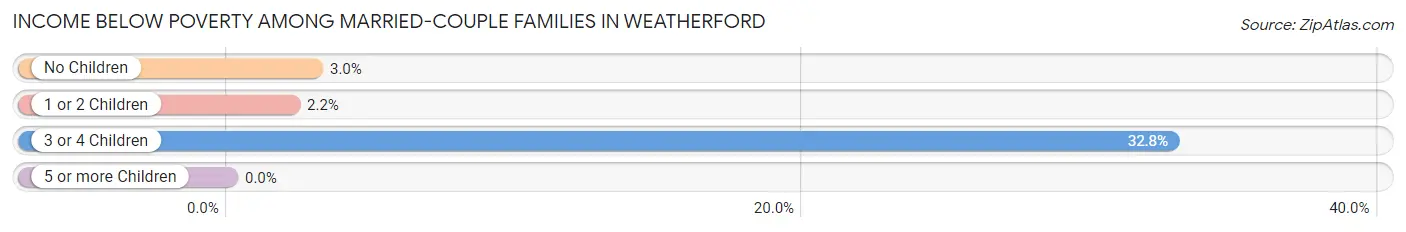
| Children | Above Poverty | Below Poverty |
| No Children | 3,438 (97.0%) | 105 (3.0%) |
| 1 or 2 Children | 1,949 (97.8%) | 43 (2.2%) |
| 3 or 4 Children | 412 (67.2%) | 201 (32.8%) |
| 5 or more Children | 69 (100.0%) | 0 (0.0%) |
| Total | 5,868 (94.4%) | 349 (5.6%) |
Income Below Poverty Among Single-Parent Households in Weatherford
According to the poverty data in Weatherford, 2.9% or 15 single-father households and 13.8% or 151 single-mother households are living below the poverty line. Among single-father households, those with no children have the highest poverty rate, with 11 households (3.7%) experiencing poverty. Likewise, among single-mother households, those with 1 or 2 children have the highest poverty rate, with 109 households (17.1%) falling below the poverty line.
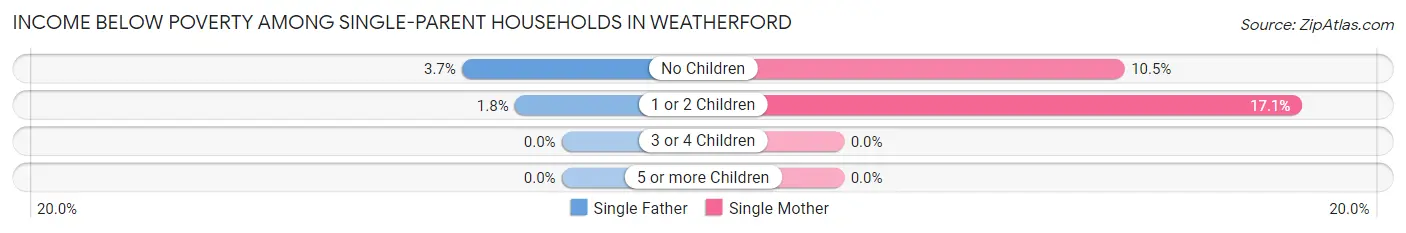
| Children | Single Father | Single Mother |
| No Children | 11 (3.7%) | 42 (10.4%) |
| 1 or 2 Children | 4 (1.8%) | 109 (17.1%) |
| 3 or 4 Children | 0 (0.0%) | 0 (0.0%) |
| 5 or more Children | 0 (0.0%) | 0 (0.0%) |
| Total | 15 (2.9%) | 151 (13.8%) |
Income Below Poverty Among Married-Couple vs Single-Parent Households in Weatherford
The poverty data for Weatherford shows that 349 of the married-couple family households (5.6%) and 166 of the single-parent households (10.3%) are living below the poverty level. Within the married-couple family households, those with 3 or 4 children have the highest poverty rate, with 201 households (32.8%) falling below the poverty line. Among the single-parent households, those with 1 or 2 children have the highest poverty rate, with 113 household (13.0%) living below poverty.
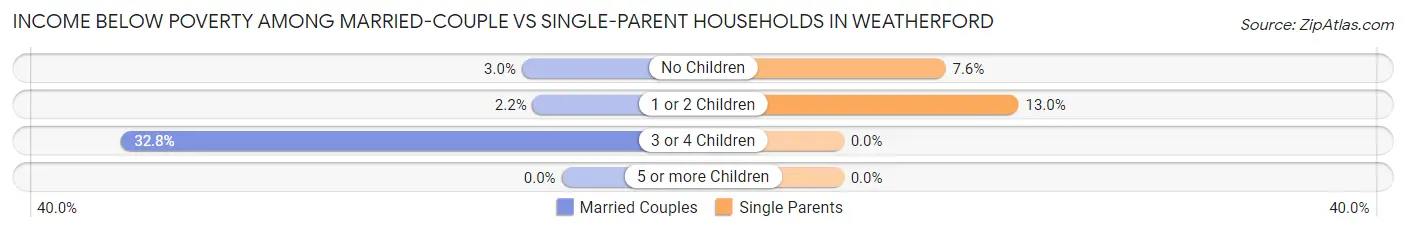
| Children | Married-Couple Families | Single-Parent Households |
| No Children | 105 (3.0%) | 53 (7.6%) |
| 1 or 2 Children | 43 (2.2%) | 113 (13.0%) |
| 3 or 4 Children | 201 (32.8%) | 0 (0.0%) |
| 5 or more Children | 0 (0.0%) | 0 (0.0%) |
| Total | 349 (5.6%) | 166 (10.3%) |
Race in Weatherford
The most populous races in Weatherford are White / Caucasian (27,481 | 85.4%), Hispanic or Latino (4,363 | 13.6%), and Two or more Races (2,242 | 7.0%).
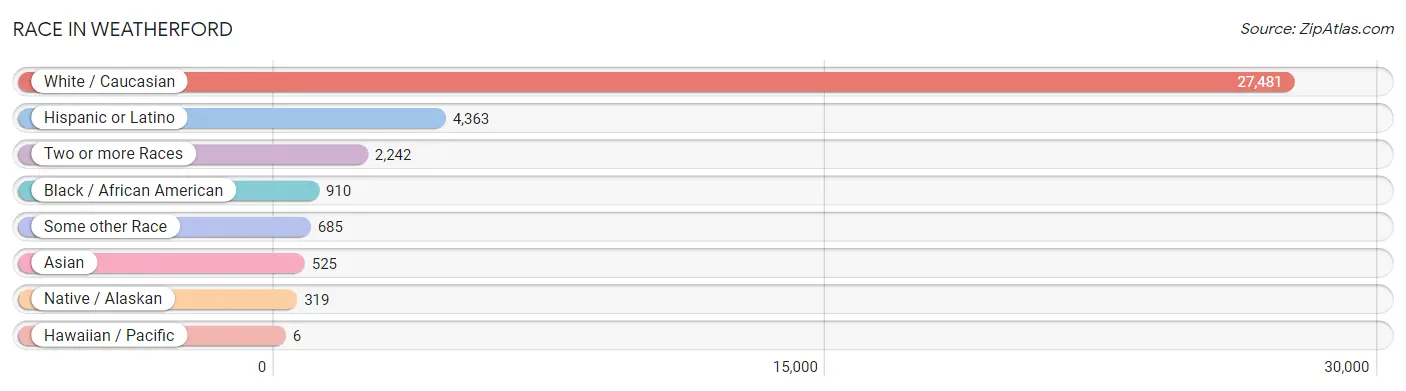
| Race | # Population | % Population |
| Asian | 525 | 1.6% |
| Black / African American | 910 | 2.8% |
| Hawaiian / Pacific | 6 | 0.0% |
| Hispanic or Latino | 4,363 | 13.6% |
| Native / Alaskan | 319 | 1.0% |
| White / Caucasian | 27,481 | 85.4% |
| Two or more Races | 2,242 | 7.0% |
| Some other Race | 685 | 2.1% |
| Total | 32,168 | 100.0% |
Ancestry in Weatherford
The most populous ancestries reported in Weatherford are English (4,654 | 14.5%), German (4,053 | 12.6%), Mexican (3,710 | 11.5%), Irish (3,542 | 11.0%), and American (2,414 | 7.5%), together accounting for 57.1% of all Weatherford residents.
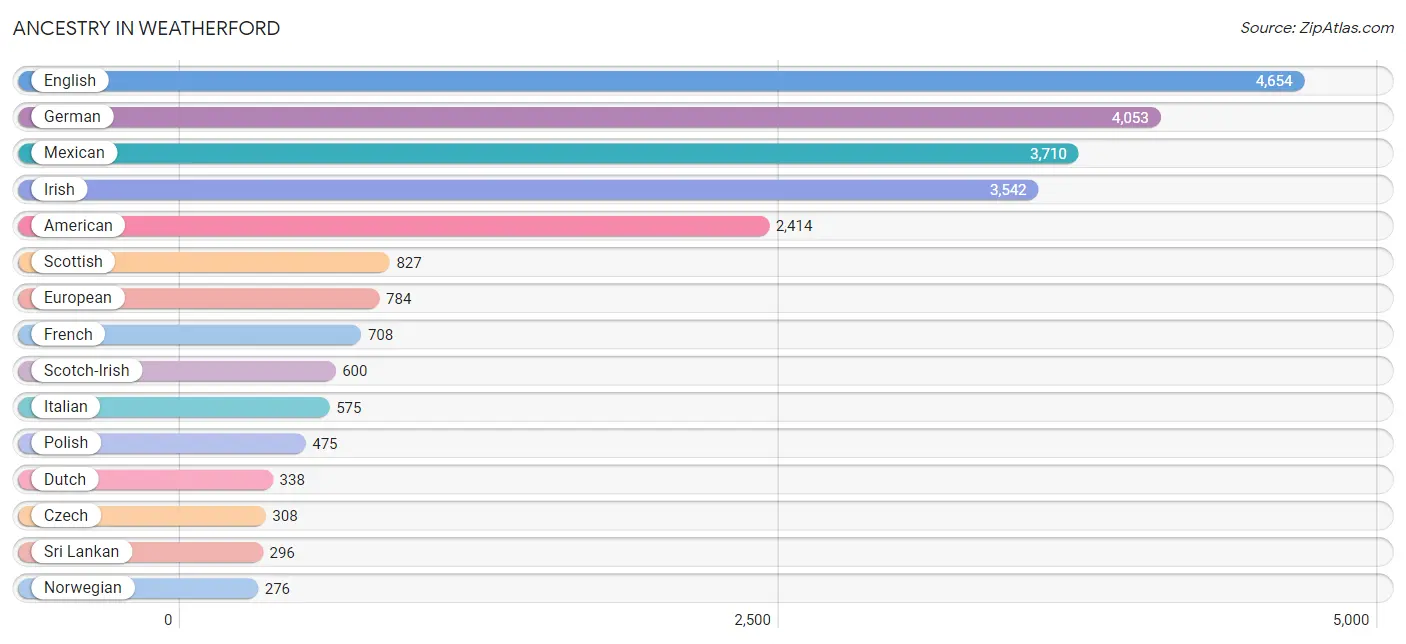
| Ancestry | # Population | % Population |
| African | 37 | 0.1% |
| Aleut | 34 | 0.1% |
| American | 2,414 | 7.5% |
| Arab | 83 | 0.3% |
| Argentinean | 17 | 0.1% |
| Basque | 23 | 0.1% |
| Belgian | 61 | 0.2% |
| British | 84 | 0.3% |
| Burmese | 153 | 0.5% |
| Central American | 55 | 0.2% |
| Cherokee | 168 | 0.5% |
| Chickasaw | 10 | 0.0% |
| Choctaw | 34 | 0.1% |
| Colombian | 37 | 0.1% |
| Comanche | 41 | 0.1% |
| Costa Rican | 9 | 0.0% |
| Creek | 8 | 0.0% |
| Cuban | 181 | 0.6% |
| Czech | 308 | 1.0% |
| Czechoslovakian | 26 | 0.1% |
| Danish | 75 | 0.2% |
| Dutch | 338 | 1.1% |
| Eastern European | 10 | 0.0% |
| English | 4,654 | 14.5% |
| European | 784 | 2.4% |
| Filipino | 44 | 0.1% |
| French | 708 | 2.2% |
| French Canadian | 22 | 0.1% |
| German | 4,053 | 12.6% |
| Greek | 45 | 0.1% |
| Honduran | 37 | 0.1% |
| Hungarian | 36 | 0.1% |
| Indian (Asian) | 55 | 0.2% |
| Irish | 3,542 | 11.0% |
| Italian | 575 | 1.8% |
| Japanese | 74 | 0.2% |
| Kiowa | 40 | 0.1% |
| Korean | 66 | 0.2% |
| Lebanese | 69 | 0.2% |
| Lithuanian | 23 | 0.1% |
| Mexican | 3,710 | 11.5% |
| Mexican American Indian | 148 | 0.5% |
| Mongolian | 13 | 0.0% |
| Nigerian | 20 | 0.1% |
| Norwegian | 276 | 0.9% |
| Pakistani | 48 | 0.2% |
| Pennsylvania German | 16 | 0.1% |
| Polish | 475 | 1.5% |
| Puerto Rican | 250 | 0.8% |
| Romanian | 42 | 0.1% |
| Russian | 71 | 0.2% |
| Salvadoran | 9 | 0.0% |
| Scandinavian | 82 | 0.3% |
| Scotch-Irish | 600 | 1.9% |
| Scottish | 827 | 2.6% |
| South American | 54 | 0.2% |
| Spaniard | 41 | 0.1% |
| Spanish | 38 | 0.1% |
| Sri Lankan | 296 | 0.9% |
| Subsaharan African | 57 | 0.2% |
| Swedish | 147 | 0.5% |
| Swiss | 42 | 0.1% |
| Syrian | 14 | 0.0% |
| Welsh | 55 | 0.2% | View All 64 Rows |
Immigrants in Weatherford
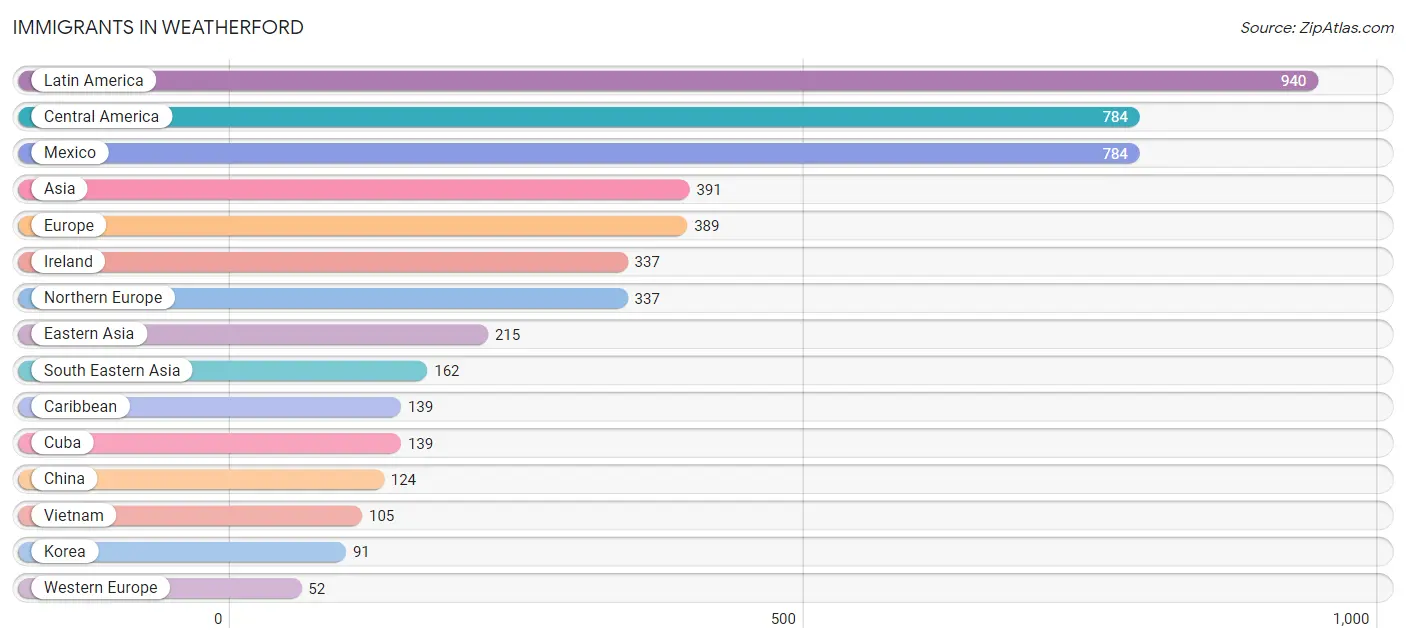
The most numerous immigrant groups reported in Weatherford came from Latin America (940 | 2.9%), Central America (784 | 2.4%), Mexico (784 | 2.4%), Asia (391 | 1.2%), and Europe (389 | 1.2%), together accounting for 10.2% of all Weatherford residents.
| Immigration Origin | # Population | % Population |
| Africa | 20 | 0.1% |
| Argentina | 17 | 0.1% |
| Asia | 391 | 1.2% |
| Australia | 11 | 0.0% |
| Cambodia | 9 | 0.0% |
| Canada | 32 | 0.1% |
| Caribbean | 139 | 0.4% |
| Central America | 784 | 2.4% |
| China | 124 | 0.4% |
| Cuba | 139 | 0.4% |
| Eastern Asia | 215 | 0.7% |
| Europe | 389 | 1.2% |
| France | 44 | 0.1% |
| Germany | 8 | 0.0% |
| Ireland | 337 | 1.1% |
| Korea | 91 | 0.3% |
| Latin America | 940 | 2.9% |
| Malaysia | 13 | 0.0% |
| Mexico | 784 | 2.4% |
| Nigeria | 20 | 0.1% |
| Northern Europe | 337 | 1.1% |
| Oceania | 11 | 0.0% |
| Philippines | 35 | 0.1% |
| South America | 17 | 0.1% |
| South Eastern Asia | 162 | 0.5% |
| Taiwan | 11 | 0.0% |
| Vietnam | 105 | 0.3% |
| Western Africa | 20 | 0.1% |
| Western Asia | 14 | 0.0% |
| Western Europe | 52 | 0.2% | View All 30 Rows |
Sex and Age in Weatherford
Sex and Age in Weatherford
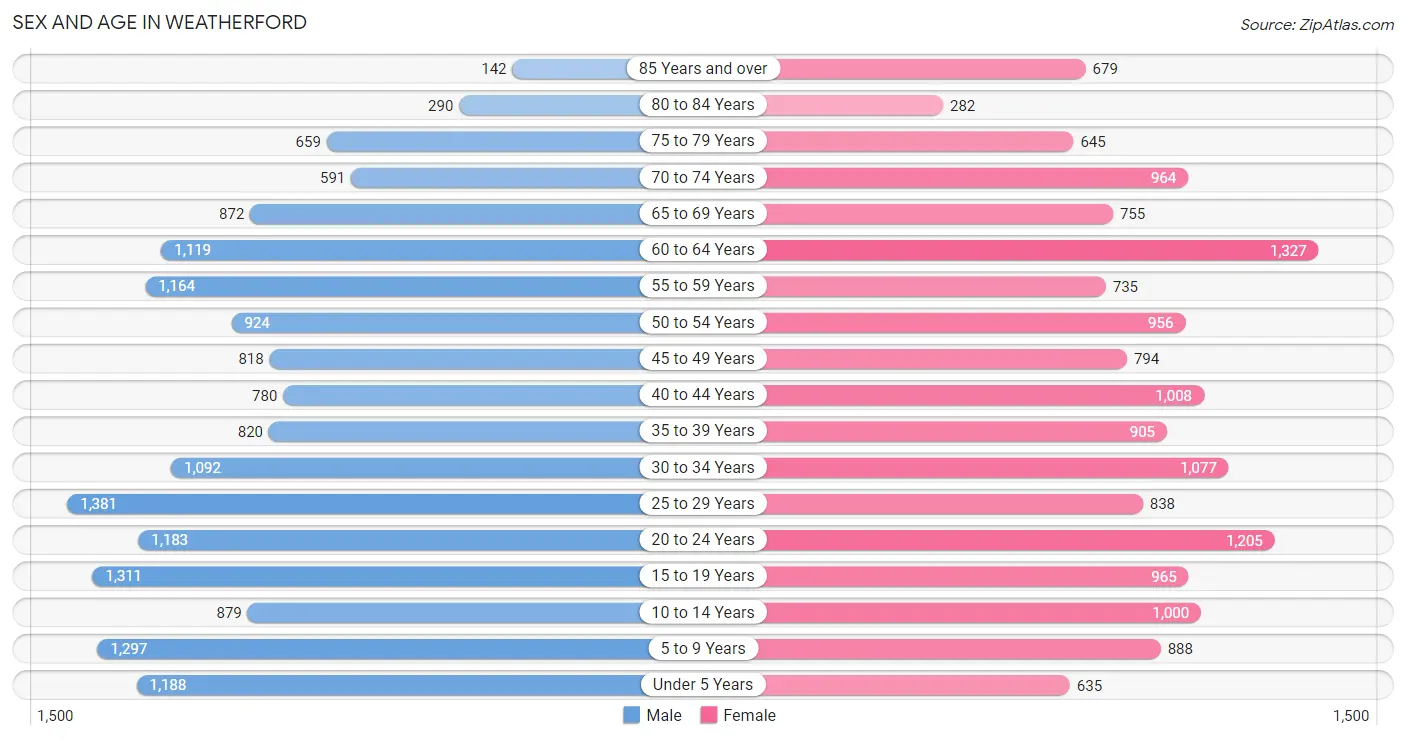
The most populous age groups in Weatherford are 25 to 29 Years (1,381 | 8.4%) for men and 60 to 64 Years (1,327 | 8.5%) for women.
| Age Bracket | Male | Female |
| Under 5 Years | 1,188 (7.2%) | 635 (4.1%) |
| 5 to 9 Years | 1,297 (7.9%) | 888 (5.7%) |
| 10 to 14 Years | 879 (5.3%) | 1,000 (6.4%) |
| 15 to 19 Years | 1,311 (7.9%) | 965 (6.2%) |
| 20 to 24 Years | 1,183 (7.2%) | 1,205 (7.7%) |
| 25 to 29 Years | 1,381 (8.4%) | 838 (5.3%) |
| 30 to 34 Years | 1,092 (6.6%) | 1,077 (6.9%) |
| 35 to 39 Years | 820 (5.0%) | 905 (5.8%) |
| 40 to 44 Years | 780 (4.7%) | 1,008 (6.4%) |
| 45 to 49 Years | 818 (5.0%) | 794 (5.1%) |
| 50 to 54 Years | 924 (5.6%) | 956 (6.1%) |
| 55 to 59 Years | 1,164 (7.0%) | 735 (4.7%) |
| 60 to 64 Years | 1,119 (6.8%) | 1,327 (8.5%) |
| 65 to 69 Years | 872 (5.3%) | 755 (4.8%) |
| 70 to 74 Years | 591 (3.6%) | 964 (6.2%) |
| 75 to 79 Years | 659 (4.0%) | 645 (4.1%) |
| 80 to 84 Years | 290 (1.8%) | 282 (1.8%) |
| 85 Years and over | 142 (0.9%) | 679 (4.3%) |
| Total | 16,510 (100.0%) | 15,658 (100.0%) |
Families and Households in Weatherford
Median Family Size in Weatherford
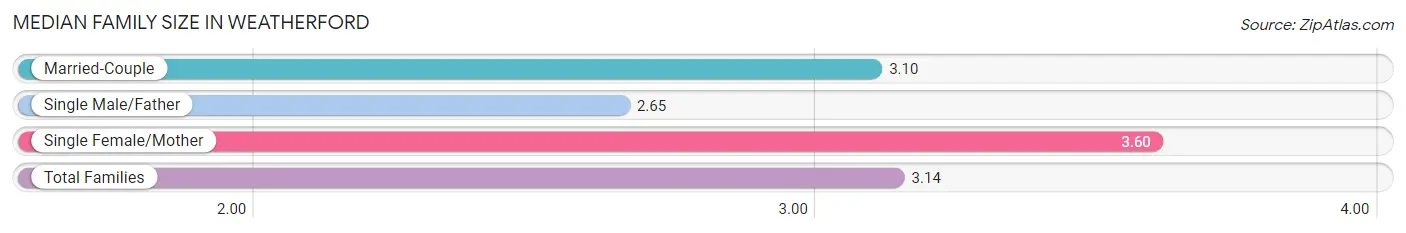
The median family size in Weatherford is 3.14 persons per family, with single female/mother families (1,092 | 13.9%) accounting for the largest median family size of 3.6 persons per family. On the other hand, single male/father families (525 | 6.7%) represent the smallest median family size with 2.65 persons per family.
| Family Type | # Families | Family Size |
| Married-Couple | 6,217 (79.4%) | 3.10 |
| Single Male/Father | 525 (6.7%) | 2.65 |
| Single Female/Mother | 1,092 (13.9%) | 3.60 |
| Total Families | 7,834 (100.0%) | 3.14 |
Median Household Size in Weatherford
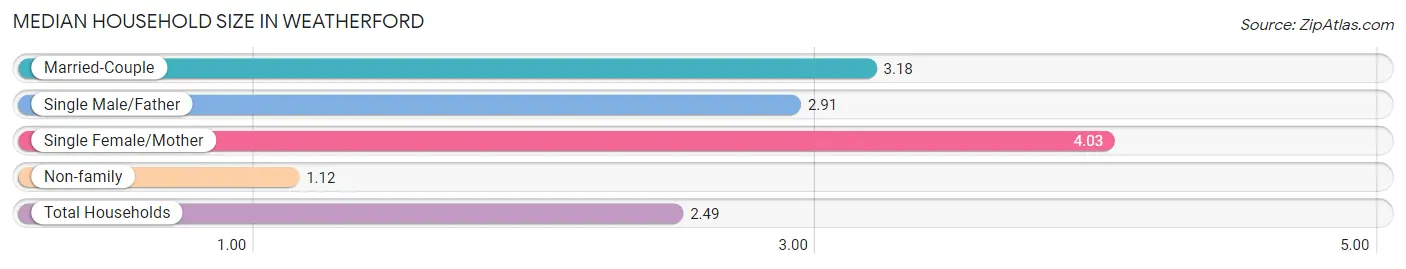
The median household size in Weatherford is 2.49 persons per household, with single female/mother households (1,092 | 8.8%) accounting for the largest median household size of 4.03 persons per household. non-family households (4,502 | 36.5%) represent the smallest median household size with 1.12 persons per household.
| Household Type | # Households | Household Size |
| Married-Couple | 6,217 (50.4%) | 3.18 |
| Single Male/Father | 525 (4.3%) | 2.91 |
| Single Female/Mother | 1,092 (8.8%) | 4.03 |
| Non-family | 4,502 (36.5%) | 1.12 |
| Total Households | 12,336 (100.0%) | 2.49 |
Household Size by Marriage Status in Weatherford
Out of a total of 12,336 households in Weatherford, 7,834 (63.5%) are family households, while 4,502 (36.5%) are nonfamily households. The most numerous type of family households are 2-person households, comprising 3,644, and the most common type of nonfamily households are 1-person households, comprising 4,075.
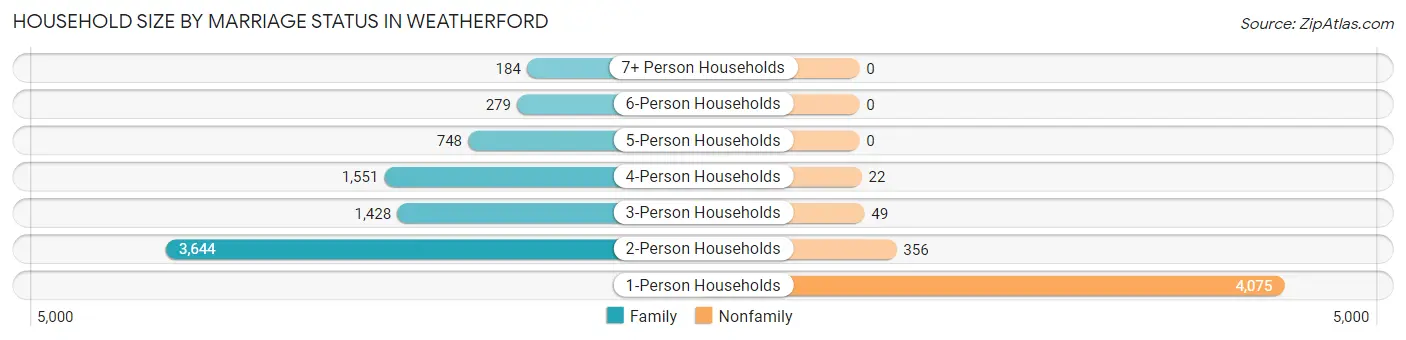
| Household Size | Family Households | Nonfamily Households |
| 1-Person Households | - | 4,075 (33.0%) |
| 2-Person Households | 3,644 (29.5%) | 356 (2.9%) |
| 3-Person Households | 1,428 (11.6%) | 49 (0.4%) |
| 4-Person Households | 1,551 (12.6%) | 22 (0.2%) |
| 5-Person Households | 748 (6.1%) | 0 (0.0%) |
| 6-Person Households | 279 (2.3%) | 0 (0.0%) |
| 7+ Person Households | 184 (1.5%) | 0 (0.0%) |
| Total | 7,834 (63.5%) | 4,502 (36.5%) |
Female Fertility in Weatherford
Fertility by Age in Weatherford
Average fertility rate in Weatherford is 65.0 births per 1,000 women. Women in the age bracket of 20 to 34 years have the highest fertility rate with 148.0 births per 1,000 women. Women in the age bracket of 20 to 34 years acount for 100.0% of all women with births.
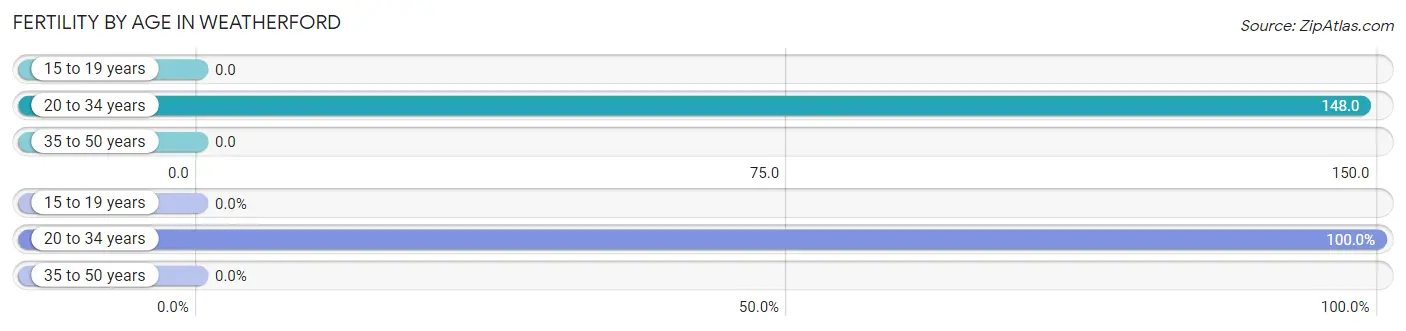
| Age Bracket | Women with Births | Births / 1,000 Women |
| 15 to 19 years | 0 (0.0%) | 0.0 |
| 20 to 34 years | 463 (100.0%) | 148.0 |
| 35 to 50 years | 0 (0.0%) | 0.0 |
| Total | 463 (100.0%) | 65.0 |
Fertility by Age by Marriage Status in Weatherford
71.9% of women with births (463) in Weatherford are married. The highest percentage of unmarried women with births falls into 20 to 34 years age bracket with 28.1% of them unmarried at the time of birth, while the lowest percentage of unmarried women with births belong to 20 to 34 years age bracket with 28.1% of them unmarried.
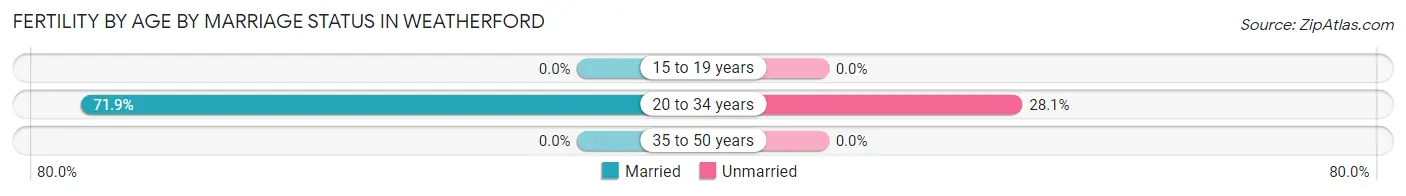
| Age Bracket | Married | Unmarried |
| 15 to 19 years | 0 (0.0%) | 0 (0.0%) |
| 20 to 34 years | 333 (71.9%) | 130 (28.1%) |
| 35 to 50 years | 0 (0.0%) | 0 (0.0%) |
| Total | 333 (71.9%) | 130 (28.1%) |
Fertility by Education in Weatherford
Average fertility rate in Weatherford is 65.0 births per 1,000 women. Women with the education attainment of bachelor's degree have the highest fertility rate of 96.0 births per 1,000 women, while women with the education attainment of less than high school have the lowest fertility at 32.0 births per 1,000 women. Women with the education attainment of college or associate's degree represent 47.7% of all women with births.
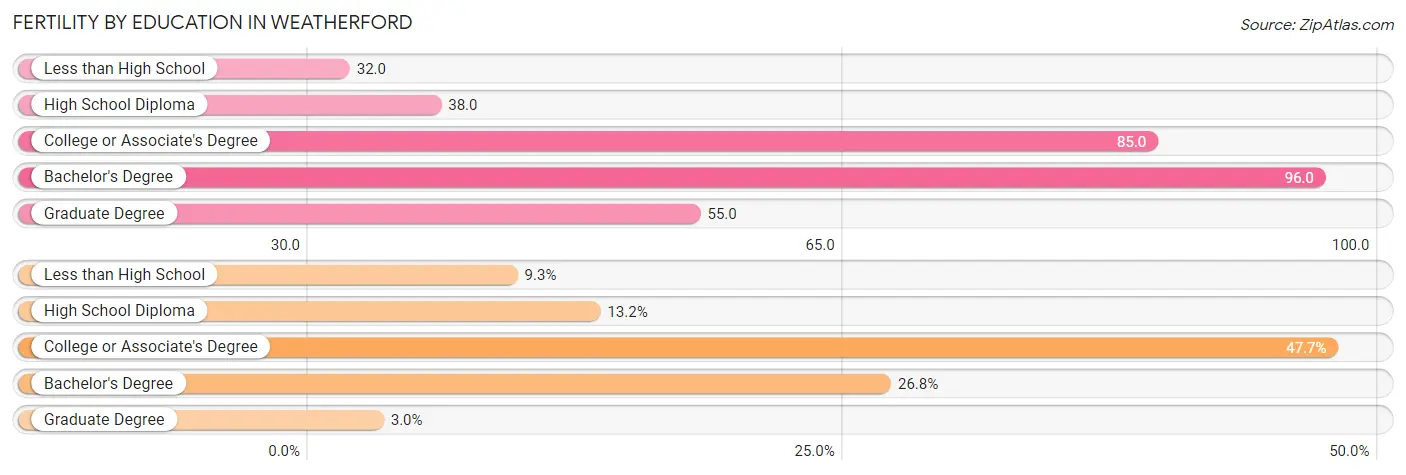
| Educational Attainment | Women with Births | Births / 1,000 Women |
| Less than High School | 43 (9.3%) | 32.0 |
| High School Diploma | 61 (13.2%) | 38.0 |
| College or Associate's Degree | 221 (47.7%) | 85.0 |
| Bachelor's Degree | 124 (26.8%) | 96.0 |
| Graduate Degree | 14 (3.0%) | 55.0 |
| Total | 463 (100.0%) | 65.0 |
Fertility by Education by Marriage Status in Weatherford
28.1% of women with births in Weatherford are unmarried. Women with the educational attainment of less than high school are most likely to be married with 100.0% of them married at childbirth, while women with the educational attainment of high school diploma are least likely to be married with 73.8% of them unmarried at childbirth.
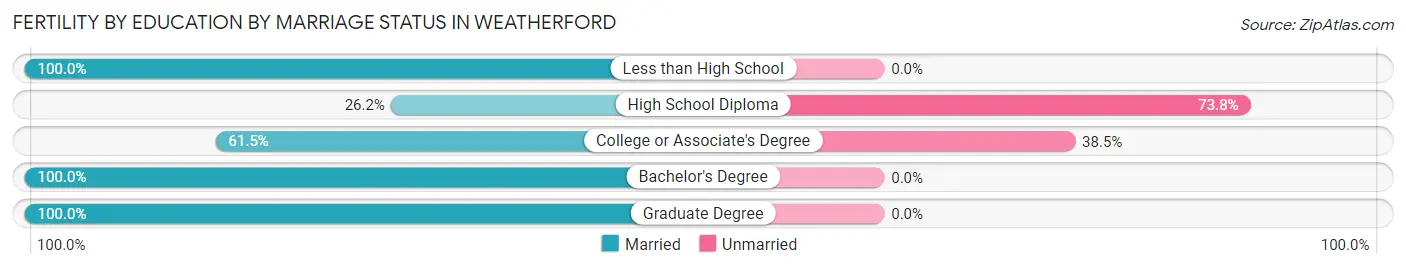
| Educational Attainment | Married | Unmarried |
| Less than High School | 43 (100.0%) | 0 (0.0%) |
| High School Diploma | 16 (26.2%) | 45 (73.8%) |
| College or Associate's Degree | 136 (61.5%) | 85 (38.5%) |
| Bachelor's Degree | 124 (100.0%) | 0 (0.0%) |
| Graduate Degree | 14 (100.0%) | 0 (0.0%) |
| Total | 333 (71.9%) | 130 (28.1%) |
Employment Characteristics in Weatherford
Employment by Class of Employer in Weatherford
Among the 15,539 employed individuals in Weatherford, private company employees (10,527 | 67.7%), self-employed (not incorporated) (1,422 | 9.1%), and local government employees (1,401 | 9.0%) make up the most common classes of employment.
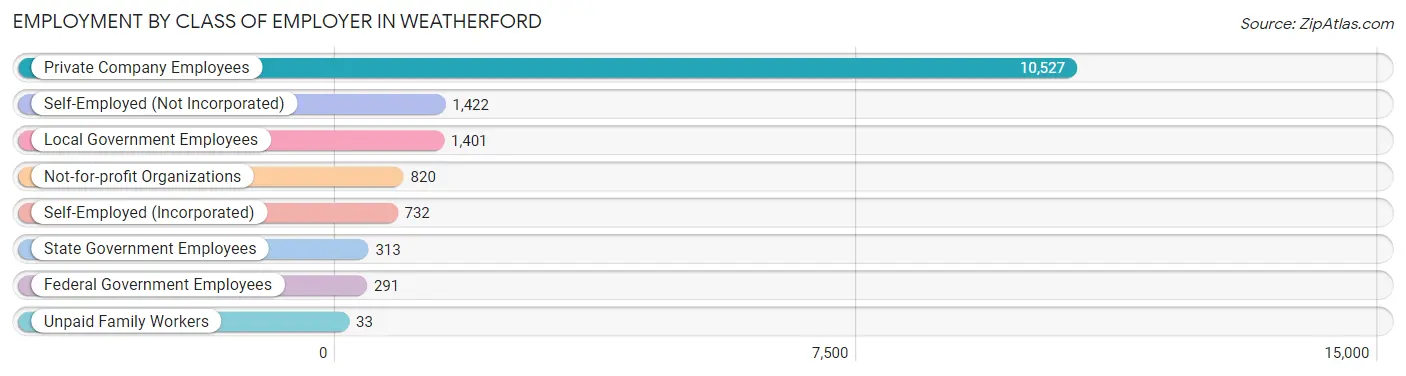
| Employer Class | # Employees | % Employees |
| Private Company Employees | 10,527 | 67.7% |
| Self-Employed (Incorporated) | 732 | 4.7% |
| Self-Employed (Not Incorporated) | 1,422 | 9.1% |
| Not-for-profit Organizations | 820 | 5.3% |
| Local Government Employees | 1,401 | 9.0% |
| State Government Employees | 313 | 2.0% |
| Federal Government Employees | 291 | 1.9% |
| Unpaid Family Workers | 33 | 0.2% |
| Total | 15,539 | 100.0% |
Employment Status by Age in Weatherford
According to the labor force statistics for Weatherford, out of the total population over 16 years of age (25,946), 63.0% or 16,346 individuals are in the labor force, with 3.4% or 556 of them unemployed. The age group with the highest labor force participation rate is 45 to 54 years, with 87.5% or 3,056 individuals in the labor force. Within the labor force, the 16 to 19 years age range has the highest percentage of unemployed individuals, with 12.0% or 120 of them being unemployed.
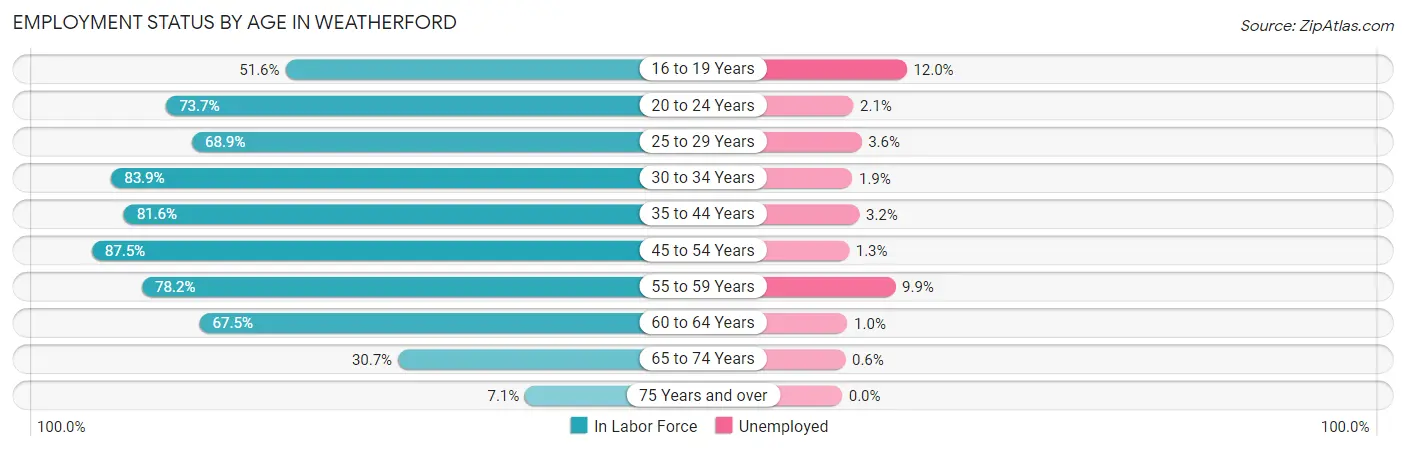
| Age Bracket | In Labor Force | Unemployed |
| 16 to 19 Years | 1,002 (51.6%) | 120 (12.0%) |
| 20 to 24 Years | 1,760 (73.7%) | 37 (2.1%) |
| 25 to 29 Years | 1,529 (68.9%) | 55 (3.6%) |
| 30 to 34 Years | 1,820 (83.9%) | 35 (1.9%) |
| 35 to 44 Years | 2,867 (81.6%) | 92 (3.2%) |
| 45 to 54 Years | 3,056 (87.5%) | 40 (1.3%) |
| 55 to 59 Years | 1,485 (78.2%) | 147 (9.9%) |
| 60 to 64 Years | 1,651 (67.5%) | 17 (1.0%) |
| 65 to 74 Years | 977 (30.7%) | 6 (0.6%) |
| 75 Years and over | 191 (7.1%) | 0 (0.0%) |
| Total | 16,346 (63.0%) | 556 (3.4%) |
Employment Status by Educational Attainment in Weatherford
According to labor force statistics for Weatherford, 78.8% of individuals (12,402) out of the total population between 25 and 64 years of age (15,738) are in the labor force, with 3.1% or 384 of them being unemployed. The group with the highest labor force participation rate are those with the educational attainment of bachelor's degree or higher, with 86.3% or 3,947 individuals in the labor force. Within the labor force, individuals with high school diploma education have the highest percentage of unemployment, with 6.4% or 191 of them being unemployed.
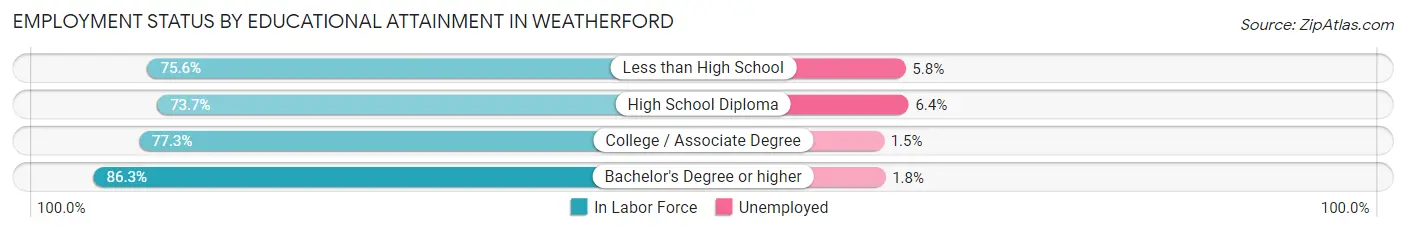
| Educational Attainment | In Labor Force | Unemployed |
| Less than High School | 1,023 (75.6%) | 78 (5.8%) |
| High School Diploma | 2,983 (73.7%) | 259 (6.4%) |
| College / Associate Degree | 4,456 (77.3%) | 86 (1.5%) |
| Bachelor's Degree or higher | 3,947 (86.3%) | 82 (1.8%) |
| Total | 12,402 (78.8%) | 488 (3.1%) |
Employment Occupations by Sex in Weatherford
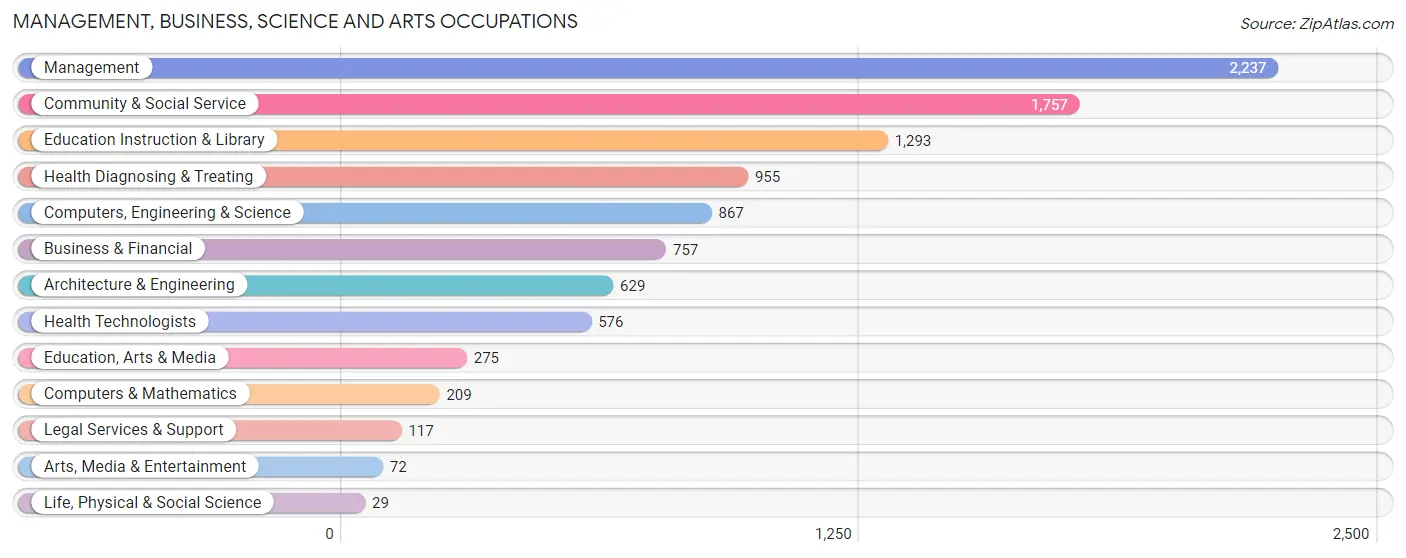
Management, Business, Science and Arts Occupations
The most common Management, Business, Science and Arts occupations in Weatherford are Management (2,237 | 14.2%), Community & Social Service (1,757 | 11.2%), Education Instruction & Library (1,293 | 8.2%), Health Diagnosing & Treating (955 | 6.1%), and Computers, Engineering & Science (867 | 5.5%).
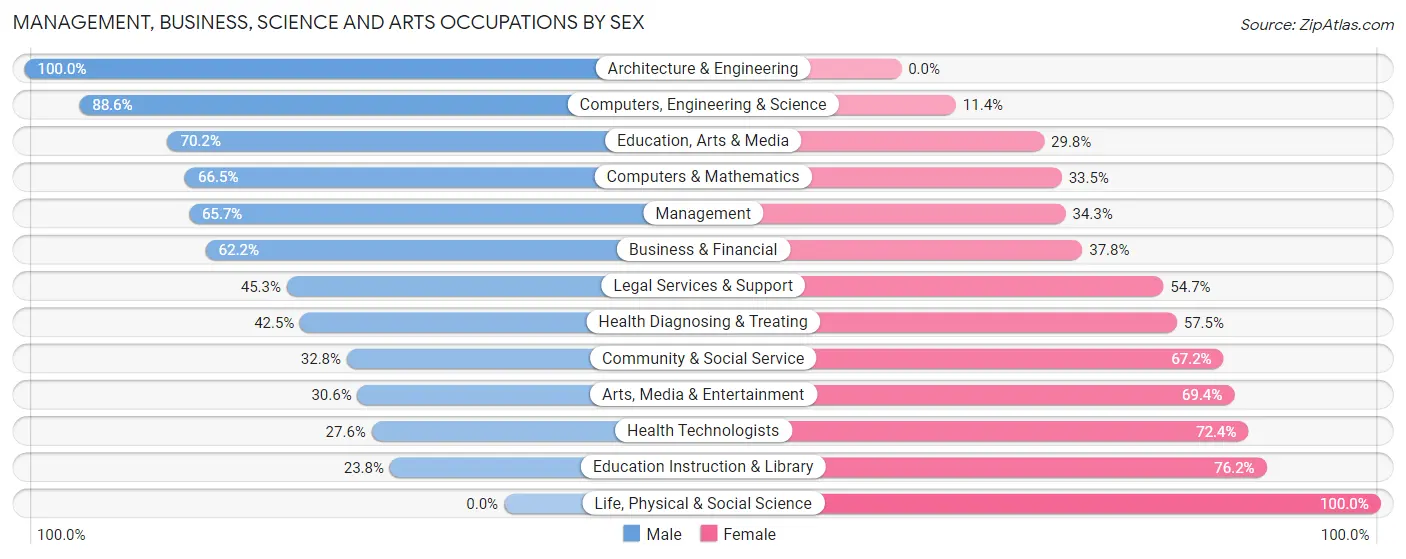
Management, Business, Science and Arts Occupations by Sex
Within the Management, Business, Science and Arts occupations in Weatherford, the most male-oriented occupations are Architecture & Engineering (100.0%), Computers, Engineering & Science (88.6%), and Education, Arts & Media (70.2%), while the most female-oriented occupations are Life, Physical & Social Science (100.0%), Education Instruction & Library (76.2%), and Health Technologists (72.4%).
| Occupation | Male | Female |
| Management | 1,470 (65.7%) | 767 (34.3%) |
| Business & Financial | 471 (62.2%) | 286 (37.8%) |
| Computers, Engineering & Science | 768 (88.6%) | 99 (11.4%) |
| Computers & Mathematics | 139 (66.5%) | 70 (33.5%) |
| Architecture & Engineering | 629 (100.0%) | 0 (0.0%) |
| Life, Physical & Social Science | 0 (0.0%) | 29 (100.0%) |
| Community & Social Service | 576 (32.8%) | 1,181 (67.2%) |
| Education, Arts & Media | 193 (70.2%) | 82 (29.8%) |
| Legal Services & Support | 53 (45.3%) | 64 (54.7%) |
| Education Instruction & Library | 308 (23.8%) | 985 (76.2%) |
| Arts, Media & Entertainment | 22 (30.6%) | 50 (69.4%) |
| Health Diagnosing & Treating | 406 (42.5%) | 549 (57.5%) |
| Health Technologists | 159 (27.6%) | 417 (72.4%) |
| Total (Category) | 3,691 (56.1%) | 2,882 (43.9%) |
| Total (Overall) | 8,509 (54.0%) | 7,240 (46.0%) |
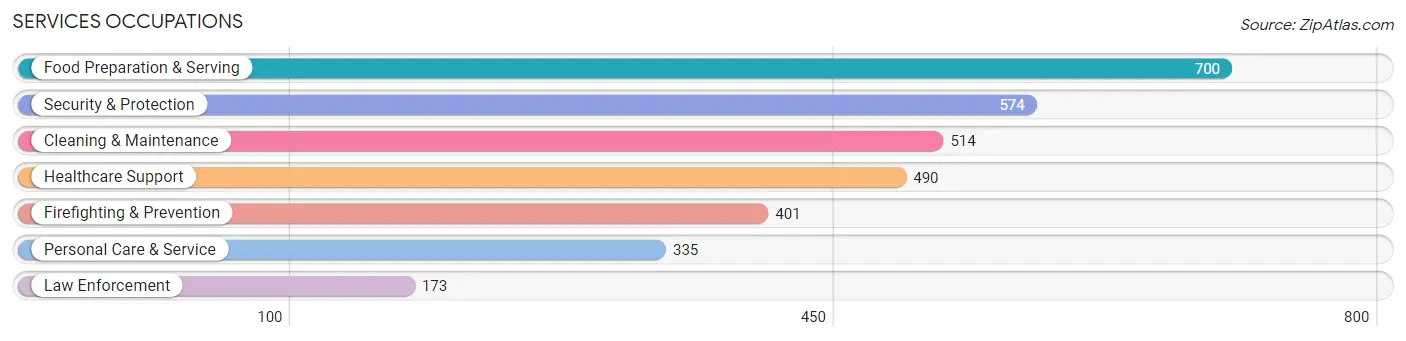
Services Occupations
The most common Services occupations in Weatherford are Food Preparation & Serving (700 | 4.4%), Security & Protection (574 | 3.6%), Cleaning & Maintenance (514 | 3.3%), Healthcare Support (490 | 3.1%), and Firefighting & Prevention (401 | 2.5%).
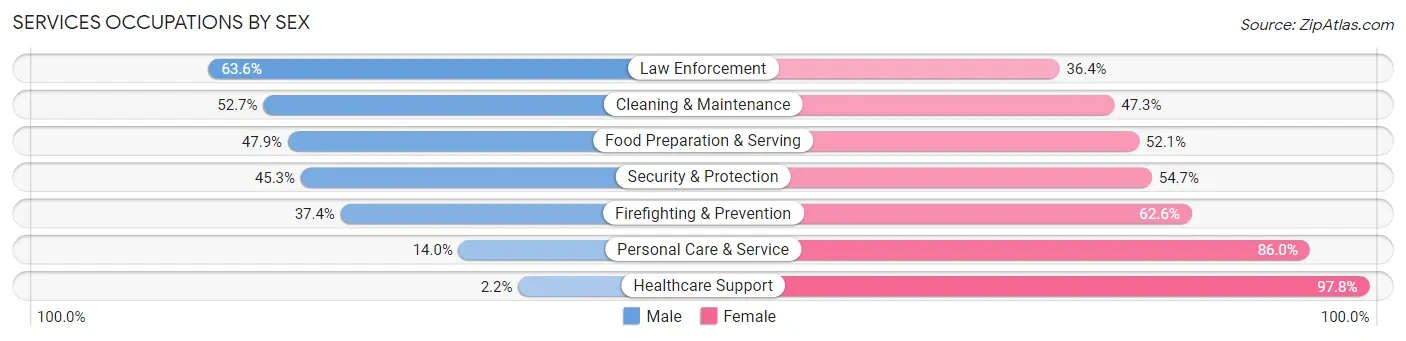
Services Occupations by Sex
Within the Services occupations in Weatherford, the most male-oriented occupations are Law Enforcement (63.6%), Cleaning & Maintenance (52.7%), and Food Preparation & Serving (47.9%), while the most female-oriented occupations are Healthcare Support (97.8%), Personal Care & Service (86.0%), and Firefighting & Prevention (62.6%).
| Occupation | Male | Female |
| Healthcare Support | 11 (2.2%) | 479 (97.8%) |
| Security & Protection | 260 (45.3%) | 314 (54.7%) |
| Firefighting & Prevention | 150 (37.4%) | 251 (62.6%) |
| Law Enforcement | 110 (63.6%) | 63 (36.4%) |
| Food Preparation & Serving | 335 (47.9%) | 365 (52.1%) |
| Cleaning & Maintenance | 271 (52.7%) | 243 (47.3%) |
| Personal Care & Service | 47 (14.0%) | 288 (86.0%) |
| Total (Category) | 924 (35.4%) | 1,689 (64.6%) |
| Total (Overall) | 8,509 (54.0%) | 7,240 (46.0%) |
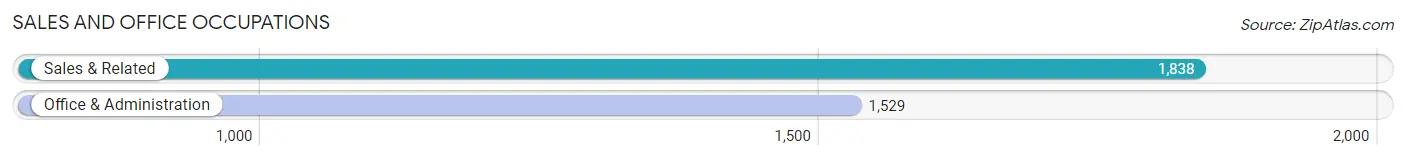
Sales and Office Occupations
The most common Sales and Office occupations in Weatherford are Sales & Related (1,838 | 11.7%), and Office & Administration (1,529 | 9.7%).
Sales and Office Occupations by Sex
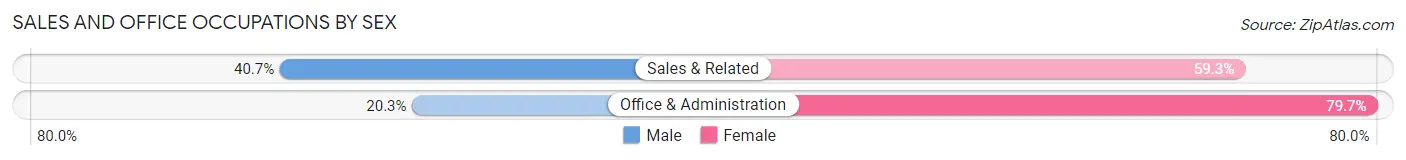
| Occupation | Male | Female |
| Sales & Related | 748 (40.7%) | 1,090 (59.3%) |
| Office & Administration | 311 (20.3%) | 1,218 (79.7%) |
| Total (Category) | 1,059 (31.5%) | 2,308 (68.5%) |
| Total (Overall) | 8,509 (54.0%) | 7,240 (46.0%) |
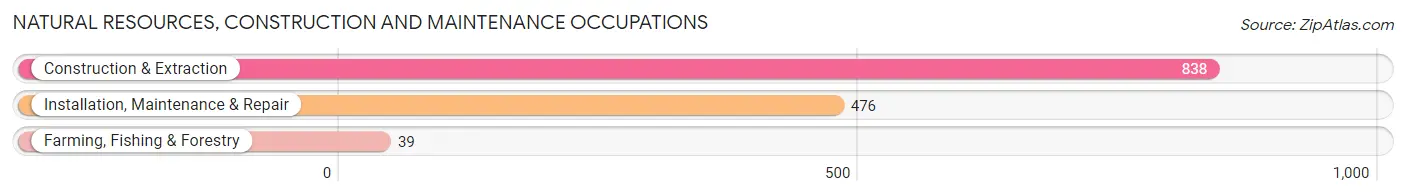
Natural Resources, Construction and Maintenance Occupations
The most common Natural Resources, Construction and Maintenance occupations in Weatherford are Construction & Extraction (838 | 5.3%), Installation, Maintenance & Repair (476 | 3.0%), and Farming, Fishing & Forestry (39 | 0.3%).
Natural Resources, Construction and Maintenance Occupations by Sex
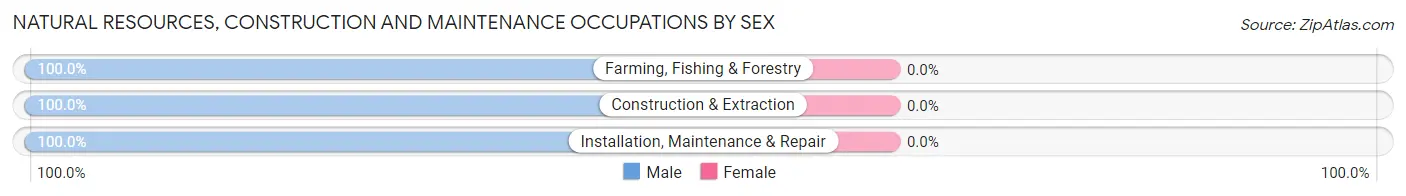
| Occupation | Male | Female |
| Farming, Fishing & Forestry | 39 (100.0%) | 0 (0.0%) |
| Construction & Extraction | 838 (100.0%) | 0 (0.0%) |
| Installation, Maintenance & Repair | 476 (100.0%) | 0 (0.0%) |
| Total (Category) | 1,353 (100.0%) | 0 (0.0%) |
| Total (Overall) | 8,509 (54.0%) | 7,240 (46.0%) |
Production, Transportation and Moving Occupations
The most common Production, Transportation and Moving occupations in Weatherford are Transportation (752 | 4.8%), Production (605 | 3.8%), and Material Moving (486 | 3.1%).
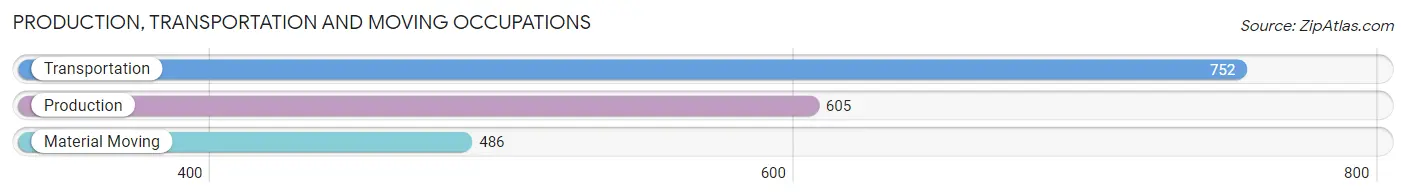
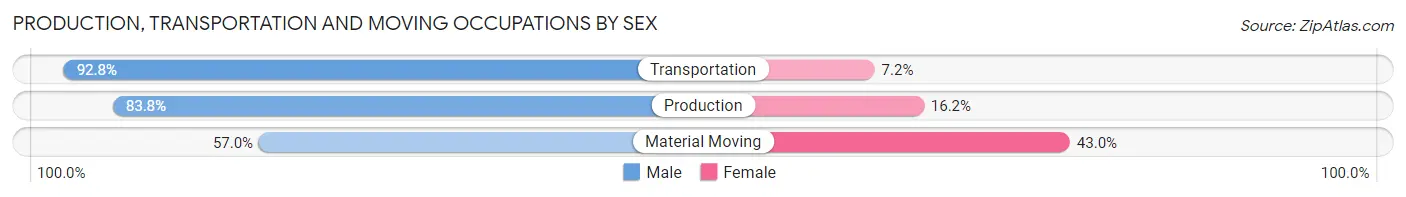
Production, Transportation and Moving Occupations by Sex
| Occupation | Male | Female |
| Production | 507 (83.8%) | 98 (16.2%) |
| Transportation | 698 (92.8%) | 54 (7.2%) |
| Material Moving | 277 (57.0%) | 209 (43.0%) |
| Total (Category) | 1,482 (80.4%) | 361 (19.6%) |
| Total (Overall) | 8,509 (54.0%) | 7,240 (46.0%) |
Employment Industries by Sex in Weatherford
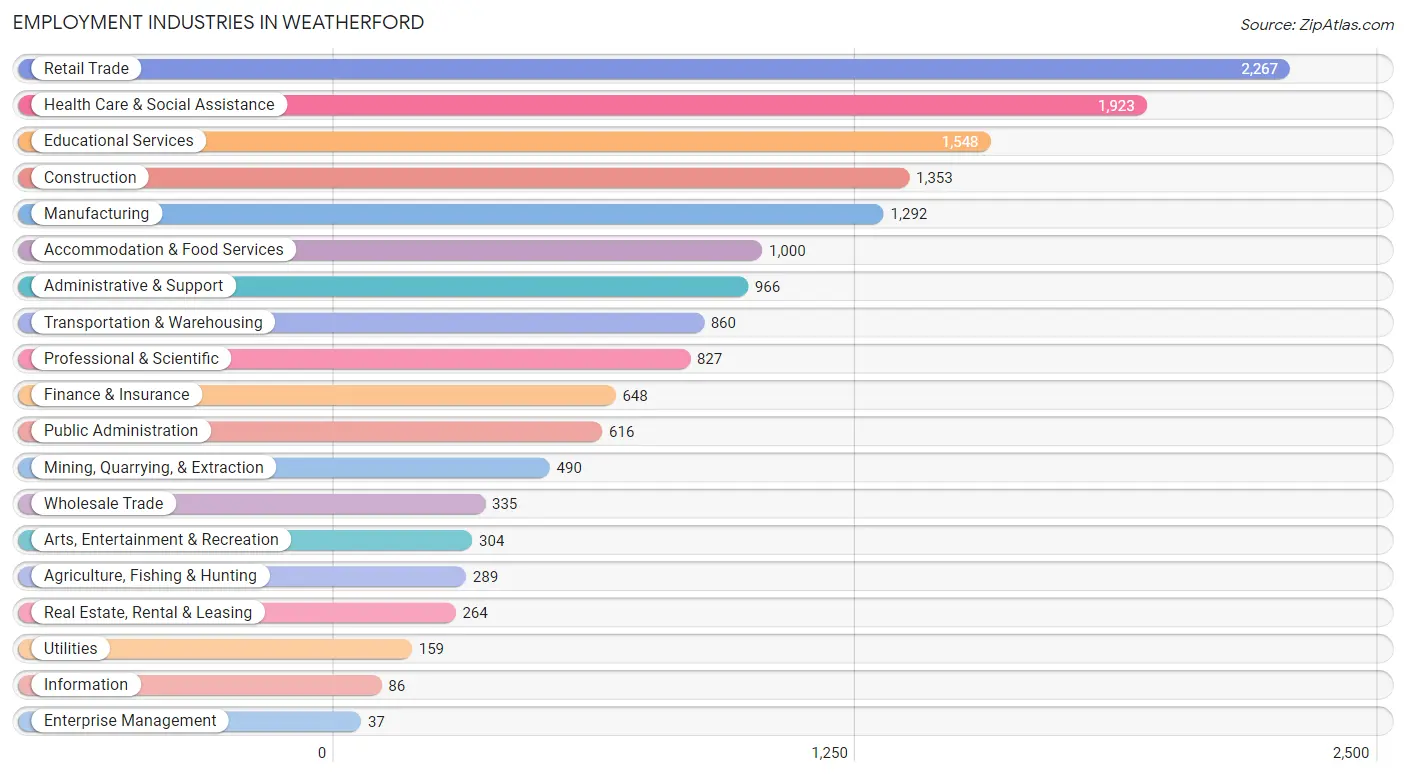
Employment Industries in Weatherford
The major employment industries in Weatherford include Retail Trade (2,267 | 14.4%), Health Care & Social Assistance (1,923 | 12.2%), Educational Services (1,548 | 9.8%), Construction (1,353 | 8.6%), and Manufacturing (1,292 | 8.2%).
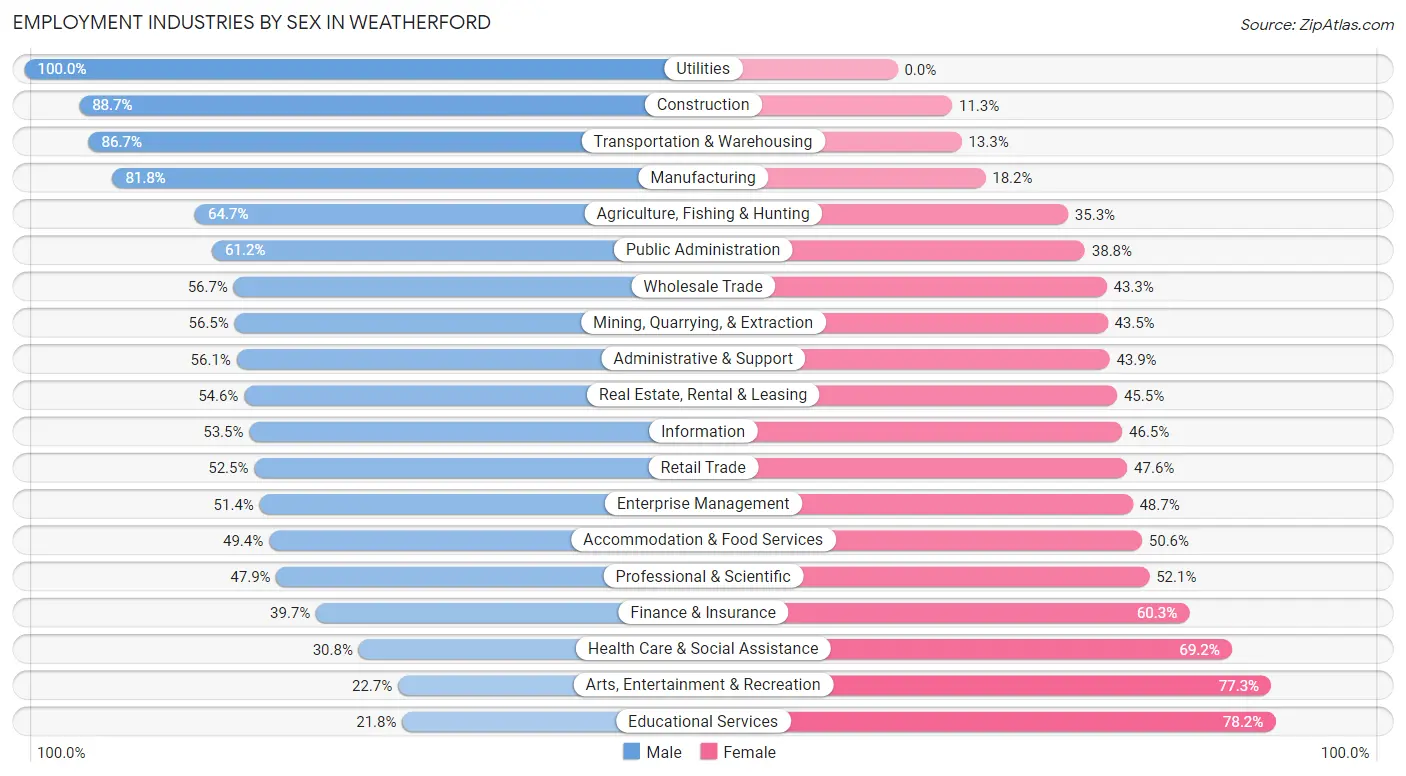
Employment Industries by Sex in Weatherford
The Weatherford industries that see more men than women are Utilities (100.0%), Construction (88.7%), and Transportation & Warehousing (86.7%), whereas the industries that tend to have a higher number of women are Educational Services (78.2%), Arts, Entertainment & Recreation (77.3%), and Health Care & Social Assistance (69.2%).
| Industry | Male | Female |
| Agriculture, Fishing & Hunting | 187 (64.7%) | 102 (35.3%) |
| Mining, Quarrying, & Extraction | 277 (56.5%) | 213 (43.5%) |
| Construction | 1,200 (88.7%) | 153 (11.3%) |
| Manufacturing | 1,057 (81.8%) | 235 (18.2%) |
| Wholesale Trade | 190 (56.7%) | 145 (43.3%) |
| Retail Trade | 1,189 (52.4%) | 1,078 (47.5%) |
| Transportation & Warehousing | 746 (86.7%) | 114 (13.3%) |
| Utilities | 159 (100.0%) | 0 (0.0%) |
| Information | 46 (53.5%) | 40 (46.5%) |
| Finance & Insurance | 257 (39.7%) | 391 (60.3%) |
| Real Estate, Rental & Leasing | 144 (54.5%) | 120 (45.5%) |
| Professional & Scientific | 396 (47.9%) | 431 (52.1%) |
| Enterprise Management | 19 (51.3%) | 18 (48.6%) |
| Administrative & Support | 542 (56.1%) | 424 (43.9%) |
| Educational Services | 338 (21.8%) | 1,210 (78.2%) |
| Health Care & Social Assistance | 593 (30.8%) | 1,330 (69.2%) |
| Arts, Entertainment & Recreation | 69 (22.7%) | 235 (77.3%) |
| Accommodation & Food Services | 494 (49.4%) | 506 (50.6%) |
| Public Administration | 377 (61.2%) | 239 (38.8%) |
| Total | 8,509 (54.0%) | 7,240 (46.0%) |
Education in Weatherford
School Enrollment in Weatherford
The most common levels of schooling among the 6,973 students in Weatherford are high school (1,836 | 26.3%), elementary school (1,556 | 22.3%), and middle school (1,530 | 21.9%).
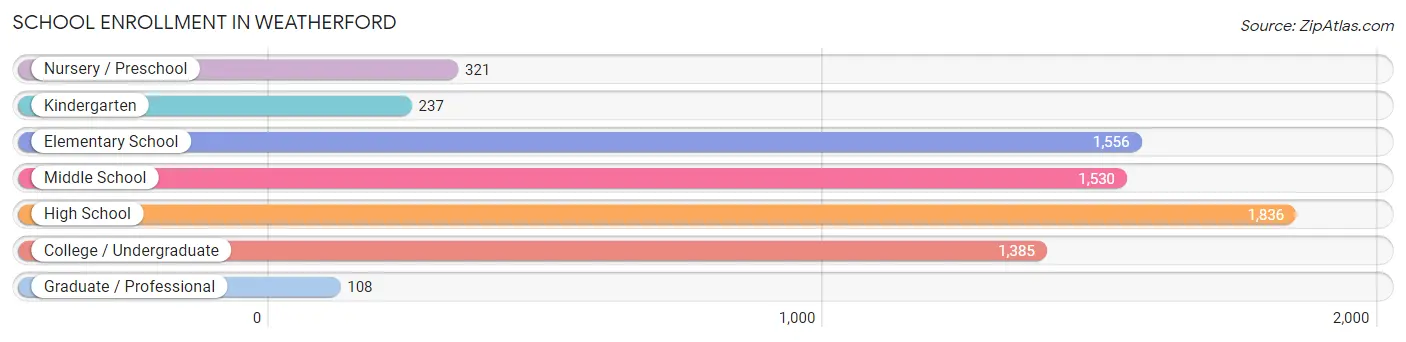
| School Level | # Students | % Students |
| Nursery / Preschool | 321 | 4.6% |
| Kindergarten | 237 | 3.4% |
| Elementary School | 1,556 | 22.3% |
| Middle School | 1,530 | 21.9% |
| High School | 1,836 | 26.3% |
| College / Undergraduate | 1,385 | 19.9% |
| Graduate / Professional | 108 | 1.5% |
| Total | 6,973 | 100.0% |
School Enrollment by Age by Funding Source in Weatherford
Out of a total of 6,973 students who are enrolled in schools in Weatherford, 1,374 (19.7%) attend a private institution, while the remaining 5,599 (80.3%) are enrolled in public schools. The age group of 3 to 4 year olds has the highest likelihood of being enrolled in private schools, with 59 (34.5% in the age bracket) enrolled. Conversely, the age group of 20 to 24 year olds has the lowest likelihood of being enrolled in a private school, with 419 (88.0% in the age bracket) attending a public institution.
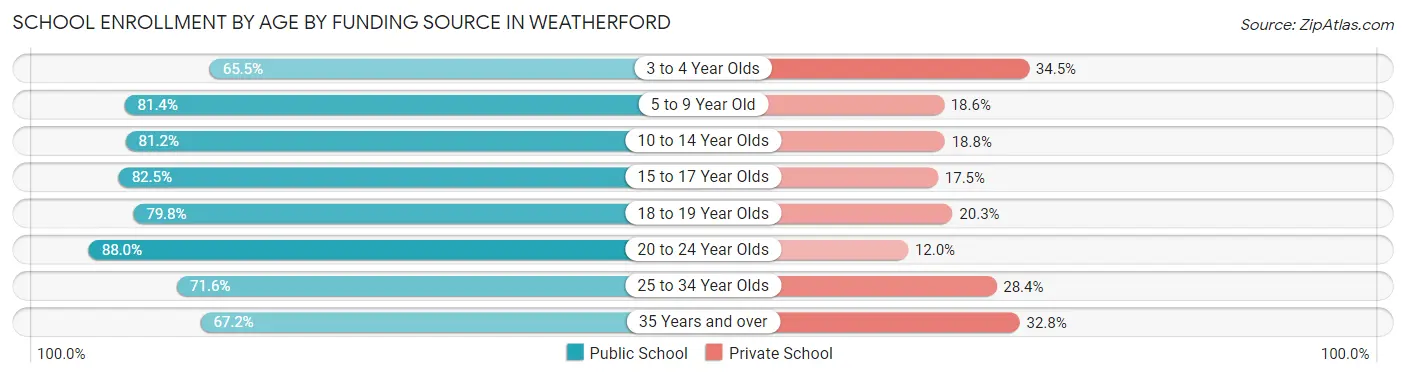
| Age Bracket | Public School | Private School |
| 3 to 4 Year Olds | 112 (65.5%) | 59 (34.5%) |
| 5 to 9 Year Old | 1,519 (81.4%) | 348 (18.6%) |
| 10 to 14 Year Olds | 1,431 (81.2%) | 332 (18.8%) |
| 15 to 17 Year Olds | 1,011 (82.5%) | 215 (17.5%) |
| 18 to 19 Year Olds | 697 (79.7%) | 177 (20.3%) |
| 20 to 24 Year Olds | 419 (88.0%) | 57 (12.0%) |
| 25 to 34 Year Olds | 136 (71.6%) | 54 (28.4%) |
| 35 Years and over | 273 (67.2%) | 133 (32.8%) |
| Total | 5,599 (80.3%) | 1,374 (19.7%) |
Educational Attainment by Field of Study in Weatherford
Business (1,823 | 28.6%), education (1,253 | 19.7%), science & technology (802 | 12.6%), engineering (491 | 7.7%), and arts & humanities (358 | 5.6%) are the most common fields of study among 6,377 individuals in Weatherford who have obtained a bachelor's degree or higher.
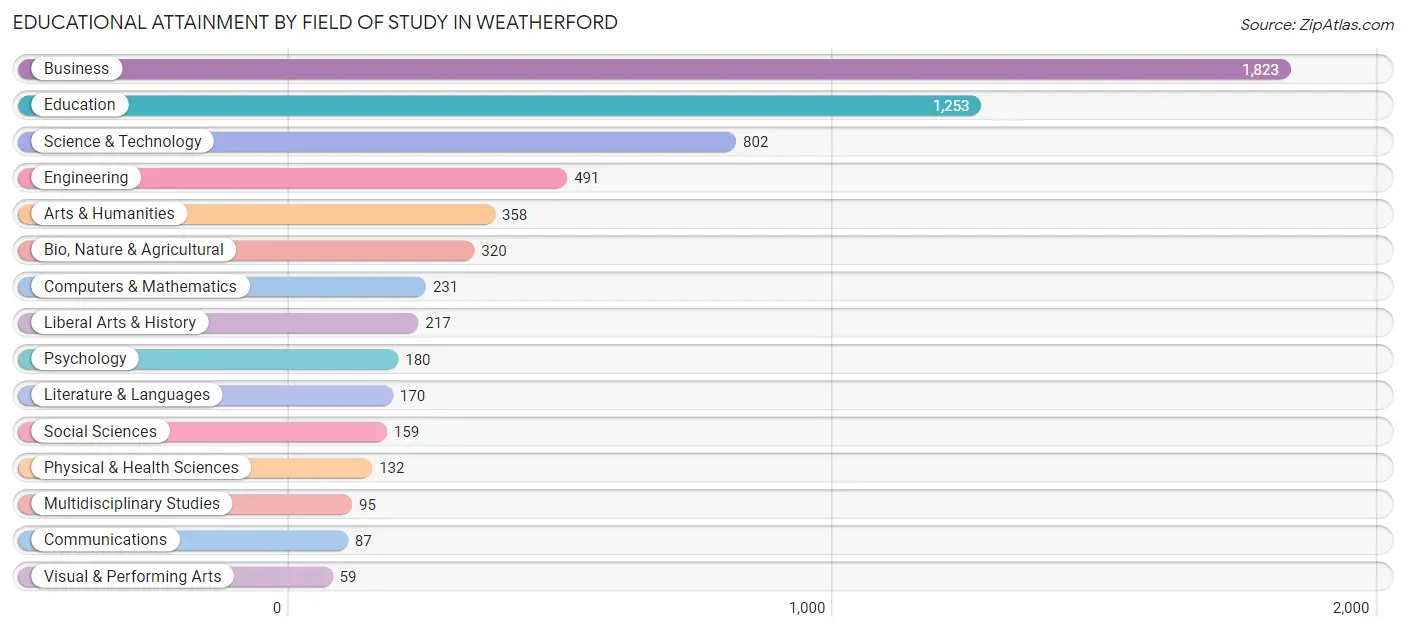
| Field of Study | # Graduates | % Graduates |
| Computers & Mathematics | 231 | 3.6% |
| Bio, Nature & Agricultural | 320 | 5.0% |
| Physical & Health Sciences | 132 | 2.1% |
| Psychology | 180 | 2.8% |
| Social Sciences | 159 | 2.5% |
| Engineering | 491 | 7.7% |
| Multidisciplinary Studies | 95 | 1.5% |
| Science & Technology | 802 | 12.6% |
| Business | 1,823 | 28.6% |
| Education | 1,253 | 19.7% |
| Literature & Languages | 170 | 2.7% |
| Liberal Arts & History | 217 | 3.4% |
| Visual & Performing Arts | 59 | 0.9% |
| Communications | 87 | 1.4% |
| Arts & Humanities | 358 | 5.6% |
| Total | 6,377 | 100.0% |
Transportation & Commute in Weatherford
Vehicle Availability by Sex in Weatherford
The most prevalent vehicle ownership categories in Weatherford are males with 2 vehicles (4,244, accounting for 50.7%) and females with 2 vehicles (3,082, making up 60.1%).
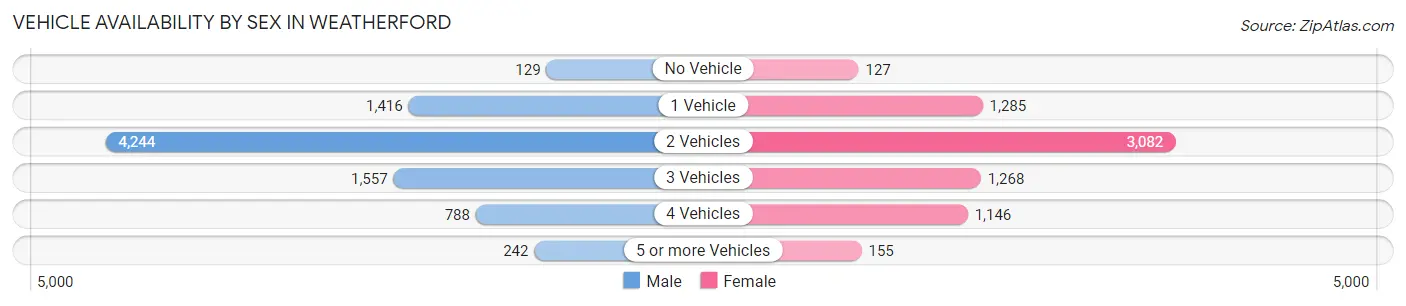
| Vehicles Available | Male | Female |
| No Vehicle | 129 (1.5%) | 127 (1.8%) |
| 1 Vehicle | 1,416 (16.9%) | 1,285 (18.2%) |
| 2 Vehicles | 4,244 (50.7%) | 3,082 (43.6%) |
| 3 Vehicles | 1,557 (18.6%) | 1,268 (17.9%) |
| 4 Vehicles | 788 (9.4%) | 1,146 (16.2%) |
| 5 or more Vehicles | 242 (2.9%) | 155 (2.2%) |
| Total | 8,376 (100.0%) | 7,063 (100.0%) |
Commute Time in Weatherford
The most frequently occuring commute durations in Weatherford are 10 to 14 minutes (2,266 commuters, 16.4%), 5 to 9 minutes (2,083 commuters, 15.1%), and 30 to 34 minutes (1,842 commuters, 13.3%).
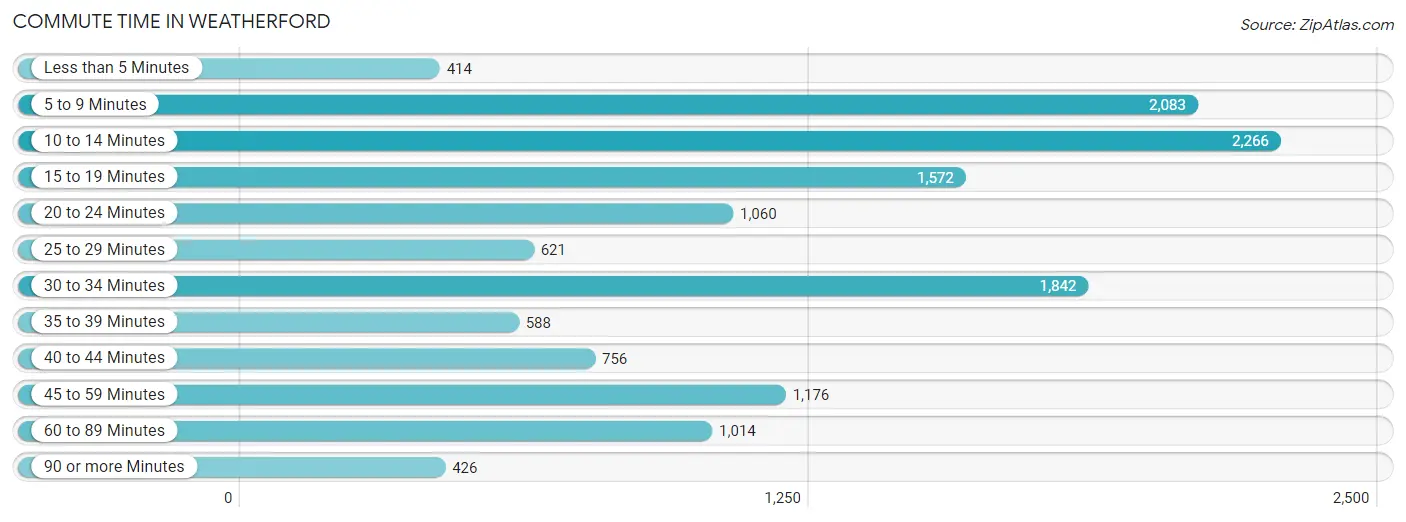
| Commute Time | # Commuters | % Commuters |
| Less than 5 Minutes | 414 | 3.0% |
| 5 to 9 Minutes | 2,083 | 15.1% |
| 10 to 14 Minutes | 2,266 | 16.4% |
| 15 to 19 Minutes | 1,572 | 11.4% |
| 20 to 24 Minutes | 1,060 | 7.7% |
| 25 to 29 Minutes | 621 | 4.5% |
| 30 to 34 Minutes | 1,842 | 13.3% |
| 35 to 39 Minutes | 588 | 4.3% |
| 40 to 44 Minutes | 756 | 5.5% |
| 45 to 59 Minutes | 1,176 | 8.5% |
| 60 to 89 Minutes | 1,014 | 7.3% |
| 90 or more Minutes | 426 | 3.1% |
Commute Time by Sex in Weatherford
The most common commute times in Weatherford are 30 to 34 minutes (1,186 commuters, 15.4%) for males and 10 to 14 minutes (1,330 commuters, 21.8%) for females.
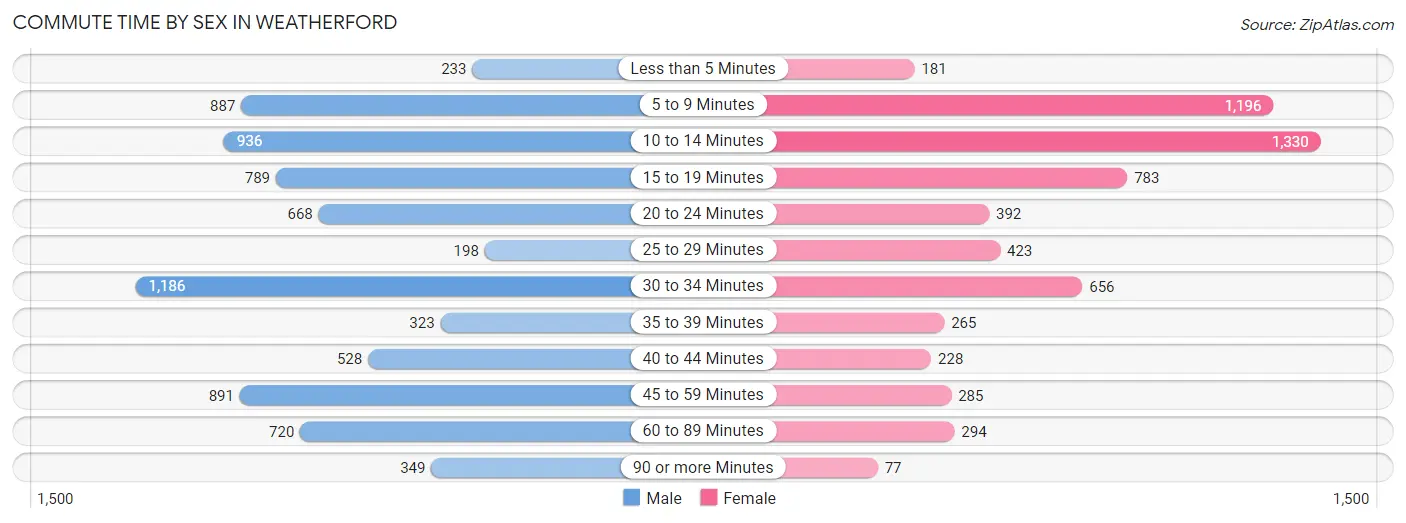
| Commute Time | Male | Female |
| Less than 5 Minutes | 233 (3.0%) | 181 (3.0%) |
| 5 to 9 Minutes | 887 (11.5%) | 1,196 (19.6%) |
| 10 to 14 Minutes | 936 (12.1%) | 1,330 (21.8%) |
| 15 to 19 Minutes | 789 (10.2%) | 783 (12.8%) |
| 20 to 24 Minutes | 668 (8.7%) | 392 (6.4%) |
| 25 to 29 Minutes | 198 (2.6%) | 423 (6.9%) |
| 30 to 34 Minutes | 1,186 (15.4%) | 656 (10.7%) |
| 35 to 39 Minutes | 323 (4.2%) | 265 (4.3%) |
| 40 to 44 Minutes | 528 (6.9%) | 228 (3.7%) |
| 45 to 59 Minutes | 891 (11.6%) | 285 (4.7%) |
| 60 to 89 Minutes | 720 (9.3%) | 294 (4.8%) |
| 90 or more Minutes | 349 (4.5%) | 77 (1.3%) |
Time of Departure to Work by Sex in Weatherford
The most frequent times of departure to work in Weatherford are 7:00 AM to 7:29 AM (1,405, 18.2%) for males and 7:30 AM to 7:59 AM (920, 15.1%) for females.
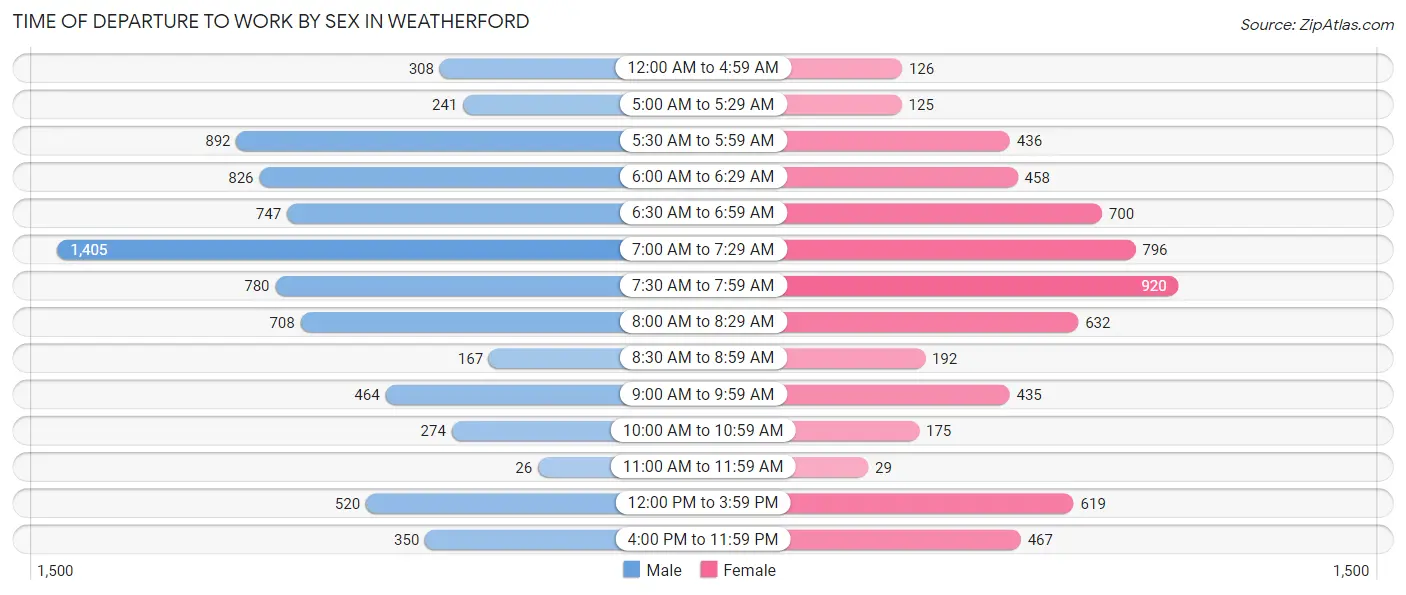
| Time of Departure | Male | Female |
| 12:00 AM to 4:59 AM | 308 (4.0%) | 126 (2.1%) |
| 5:00 AM to 5:29 AM | 241 (3.1%) | 125 (2.1%) |
| 5:30 AM to 5:59 AM | 892 (11.6%) | 436 (7.1%) |
| 6:00 AM to 6:29 AM | 826 (10.7%) | 458 (7.5%) |
| 6:30 AM to 6:59 AM | 747 (9.7%) | 700 (11.5%) |
| 7:00 AM to 7:29 AM | 1,405 (18.2%) | 796 (13.0%) |
| 7:30 AM to 7:59 AM | 780 (10.1%) | 920 (15.1%) |
| 8:00 AM to 8:29 AM | 708 (9.2%) | 632 (10.3%) |
| 8:30 AM to 8:59 AM | 167 (2.2%) | 192 (3.1%) |
| 9:00 AM to 9:59 AM | 464 (6.0%) | 435 (7.1%) |
| 10:00 AM to 10:59 AM | 274 (3.5%) | 175 (2.9%) |
| 11:00 AM to 11:59 AM | 26 (0.3%) | 29 (0.5%) |
| 12:00 PM to 3:59 PM | 520 (6.8%) | 619 (10.1%) |
| 4:00 PM to 11:59 PM | 350 (4.5%) | 467 (7.6%) |
| Total | 7,708 (100.0%) | 6,110 (100.0%) |
Housing Occupancy in Weatherford
Occupancy by Ownership in Weatherford
Of the total 12,336 dwellings in Weatherford, owner-occupied units account for 8,032 (65.1%), while renter-occupied units make up 4,304 (34.9%).
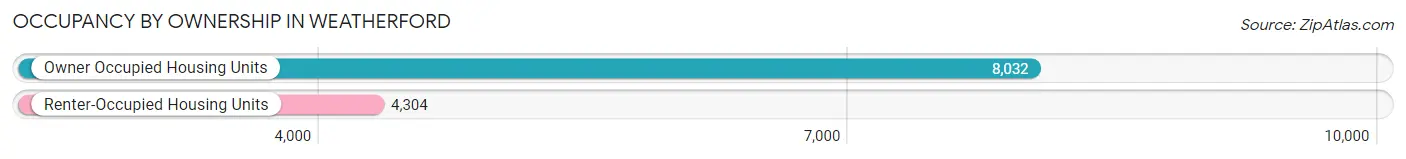
| Occupancy | # Housing Units | % Housing Units |
| Owner Occupied Housing Units | 8,032 | 65.1% |
| Renter-Occupied Housing Units | 4,304 | 34.9% |
| Total Occupied Housing Units | 12,336 | 100.0% |
Occupancy by Household Size in Weatherford
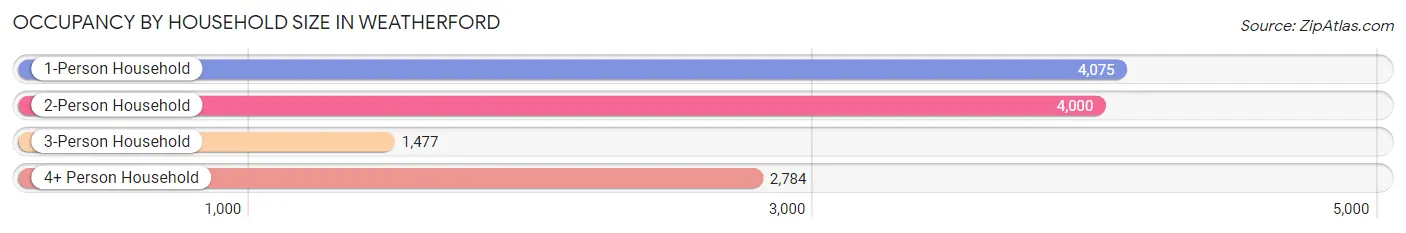
| Household Size | # Housing Units | % Housing Units |
| 1-Person Household | 4,075 | 33.0% |
| 2-Person Household | 4,000 | 32.4% |
| 3-Person Household | 1,477 | 12.0% |
| 4+ Person Household | 2,784 | 22.6% |
| Total Housing Units | 12,336 | 100.0% |
Occupancy by Ownership by Household Size in Weatherford
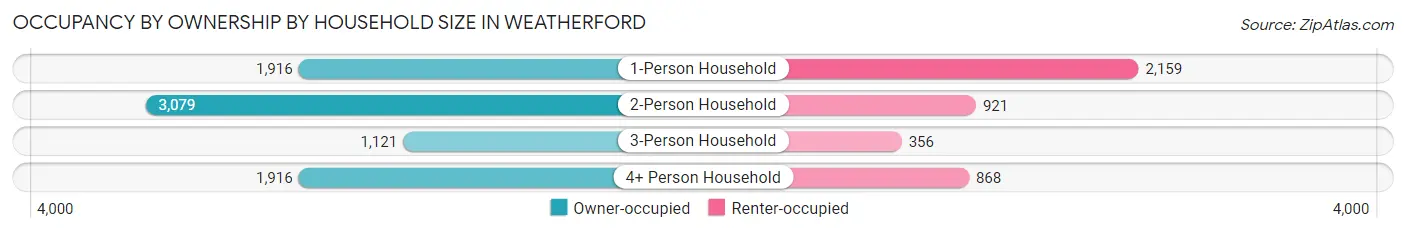
| Household Size | Owner-occupied | Renter-occupied |
| 1-Person Household | 1,916 (47.0%) | 2,159 (53.0%) |
| 2-Person Household | 3,079 (77.0%) | 921 (23.0%) |
| 3-Person Household | 1,121 (75.9%) | 356 (24.1%) |
| 4+ Person Household | 1,916 (68.8%) | 868 (31.2%) |
| Total Housing Units | 8,032 (65.1%) | 4,304 (34.9%) |
Occupancy by Educational Attainment in Weatherford
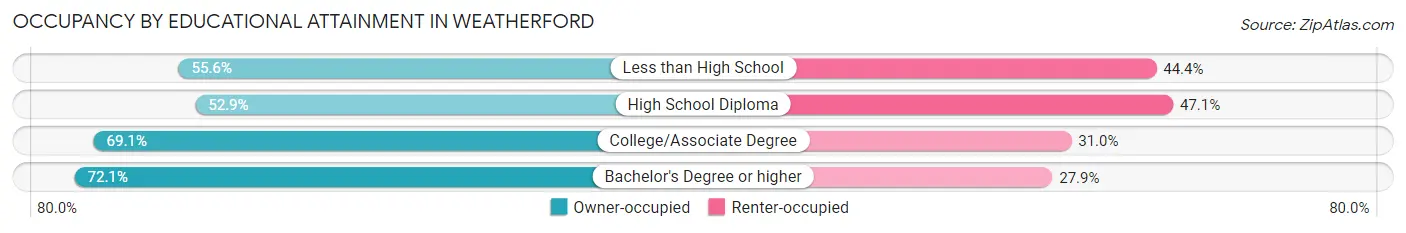
| Household Size | Owner-occupied | Renter-occupied |
| Less than High School | 499 (55.6%) | 399 (44.4%) |
| High School Diploma | 1,581 (52.9%) | 1,407 (47.1%) |
| College/Associate Degree | 3,146 (69.1%) | 1,410 (30.9%) |
| Bachelor's Degree or higher | 2,806 (72.1%) | 1,088 (27.9%) |
Occupancy by Age of Householder in Weatherford
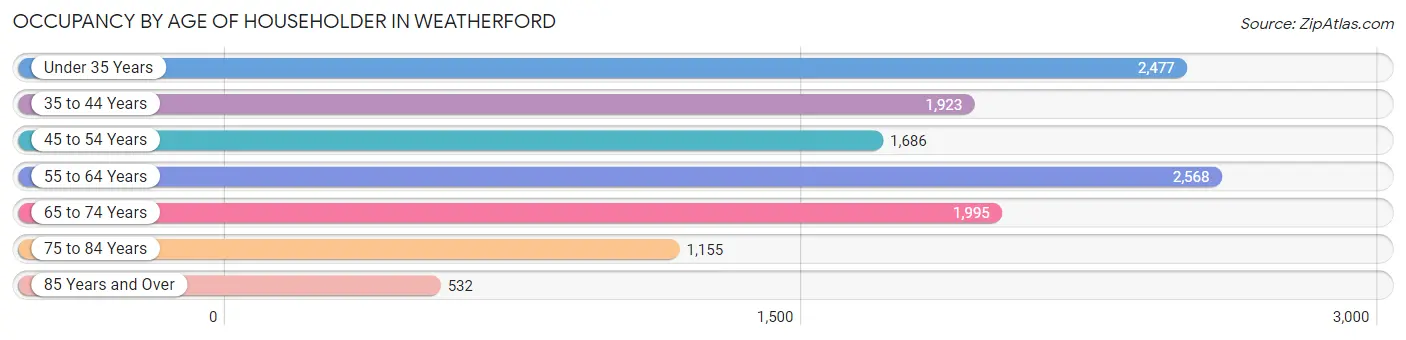
| Age Bracket | # Households | % Households |
| Under 35 Years | 2,477 | 20.1% |
| 35 to 44 Years | 1,923 | 15.6% |
| 45 to 54 Years | 1,686 | 13.7% |
| 55 to 64 Years | 2,568 | 20.8% |
| 65 to 74 Years | 1,995 | 16.2% |
| 75 to 84 Years | 1,155 | 9.4% |
| 85 Years and Over | 532 | 4.3% |
| Total | 12,336 | 100.0% |
Housing Finances in Weatherford
Median Income by Occupancy in Weatherford
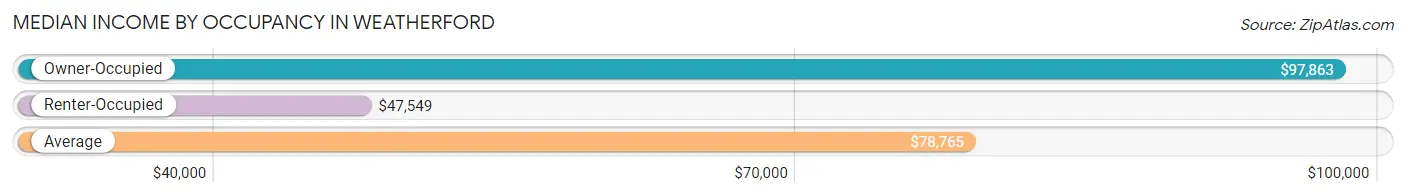
| Occupancy Type | # Households | Median Income |
| Owner-Occupied | 8,032 (65.1%) | $97,863 |
| Renter-Occupied | 4,304 (34.9%) | $47,549 |
| Average | 12,336 (100.0%) | $78,765 |
Occupancy by Householder Income Bracket in Weatherford
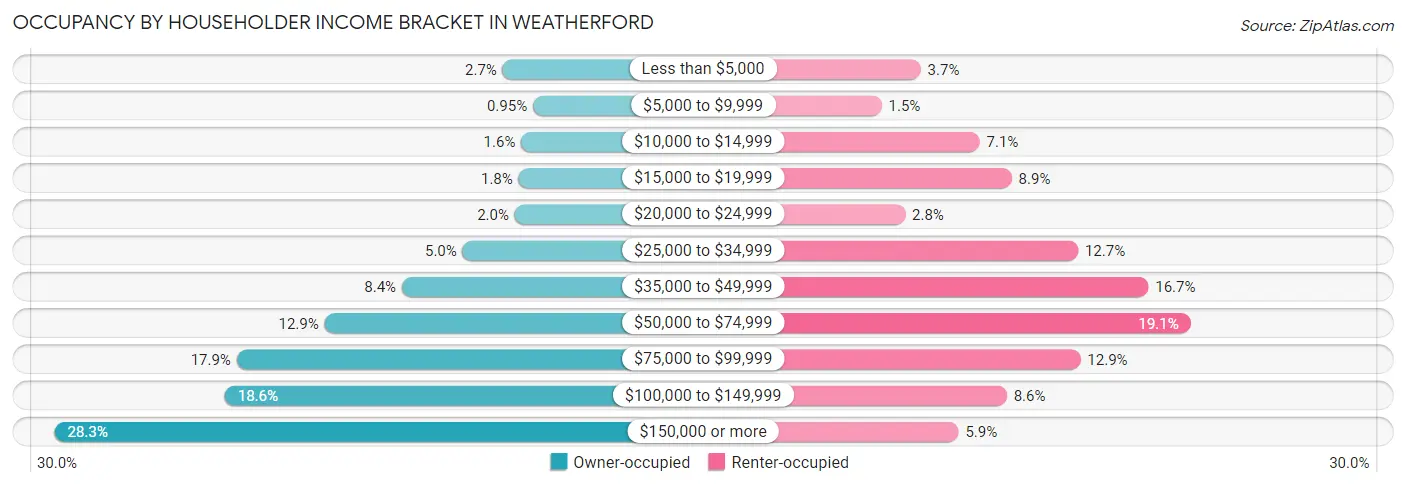
| Income Bracket | Owner-occupied | Renter-occupied |
| Less than $5,000 | 215 (2.7%) | 160 (3.7%) |
| $5,000 to $9,999 | 76 (0.9%) | 64 (1.5%) |
| $10,000 to $14,999 | 130 (1.6%) | 305 (7.1%) |
| $15,000 to $19,999 | 142 (1.8%) | 384 (8.9%) |
| $20,000 to $24,999 | 160 (2.0%) | 122 (2.8%) |
| $25,000 to $34,999 | 399 (5.0%) | 547 (12.7%) |
| $35,000 to $49,999 | 678 (8.4%) | 720 (16.7%) |
| $50,000 to $74,999 | 1,033 (12.9%) | 824 (19.1%) |
| $75,000 to $99,999 | 1,436 (17.9%) | 553 (12.9%) |
| $100,000 to $149,999 | 1,491 (18.6%) | 372 (8.6%) |
| $150,000 or more | 2,272 (28.3%) | 253 (5.9%) |
| Total | 8,032 (100.0%) | 4,304 (100.0%) |
Monthly Housing Cost Tiers in Weatherford
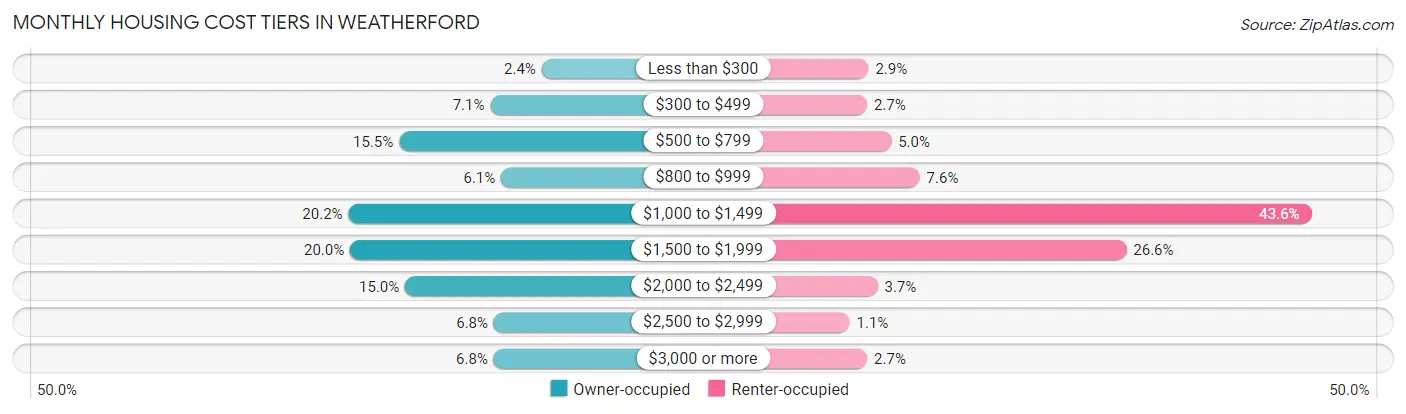
| Monthly Cost | Owner-occupied | Renter-occupied |
| Less than $300 | 193 (2.4%) | 123 (2.9%) |
| $300 to $499 | 573 (7.1%) | 117 (2.7%) |
| $500 to $799 | 1,247 (15.5%) | 213 (5.0%) |
| $800 to $999 | 492 (6.1%) | 326 (7.6%) |
| $1,000 to $1,499 | 1,622 (20.2%) | 1,878 (43.6%) |
| $1,500 to $1,999 | 1,610 (20.0%) | 1,145 (26.6%) |
| $2,000 to $2,499 | 1,202 (15.0%) | 159 (3.7%) |
| $2,500 to $2,999 | 546 (6.8%) | 48 (1.1%) |
| $3,000 or more | 547 (6.8%) | 118 (2.7%) |
| Total | 8,032 (100.0%) | 4,304 (100.0%) |
Physical Housing Characteristics in Weatherford
Housing Structures in Weatherford
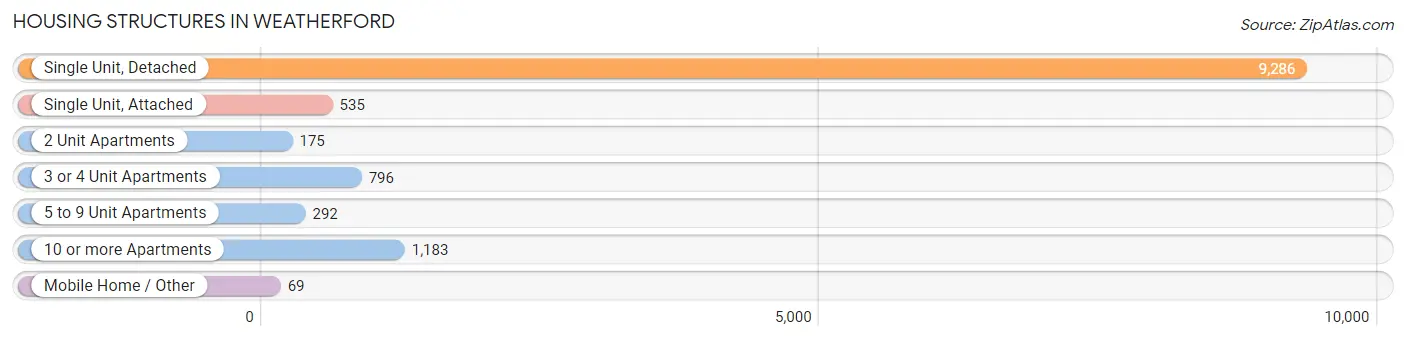
| Structure Type | # Housing Units | % Housing Units |
| Single Unit, Detached | 9,286 | 75.3% |
| Single Unit, Attached | 535 | 4.3% |
| 2 Unit Apartments | 175 | 1.4% |
| 3 or 4 Unit Apartments | 796 | 6.5% |
| 5 to 9 Unit Apartments | 292 | 2.4% |
| 10 or more Apartments | 1,183 | 9.6% |
| Mobile Home / Other | 69 | 0.6% |
| Total | 12,336 | 100.0% |
Housing Structures by Occupancy in Weatherford
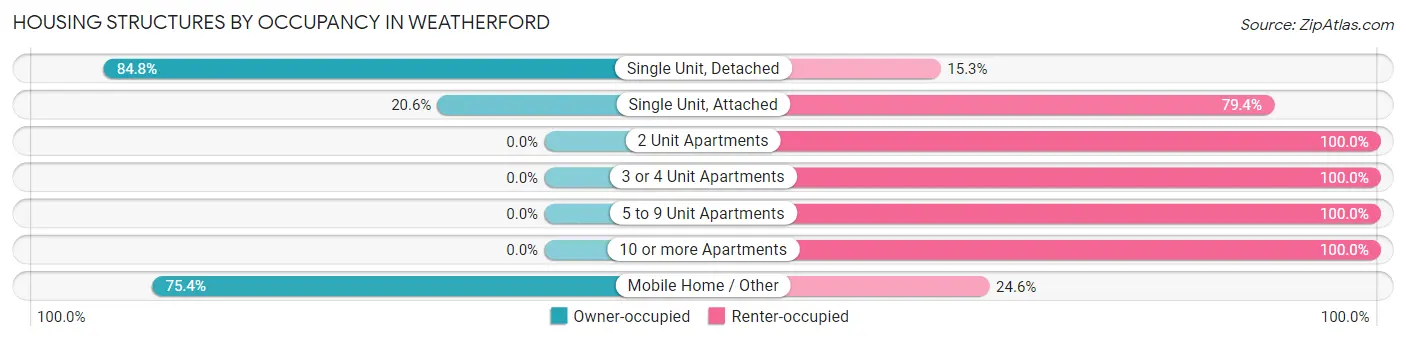
| Structure Type | Owner-occupied | Renter-occupied |
| Single Unit, Detached | 7,870 (84.8%) | 1,416 (15.2%) |
| Single Unit, Attached | 110 (20.6%) | 425 (79.4%) |
| 2 Unit Apartments | 0 (0.0%) | 175 (100.0%) |
| 3 or 4 Unit Apartments | 0 (0.0%) | 796 (100.0%) |
| 5 to 9 Unit Apartments | 0 (0.0%) | 292 (100.0%) |
| 10 or more Apartments | 0 (0.0%) | 1,183 (100.0%) |
| Mobile Home / Other | 52 (75.4%) | 17 (24.6%) |
| Total | 8,032 (65.1%) | 4,304 (34.9%) |
Housing Structures by Number of Rooms in Weatherford
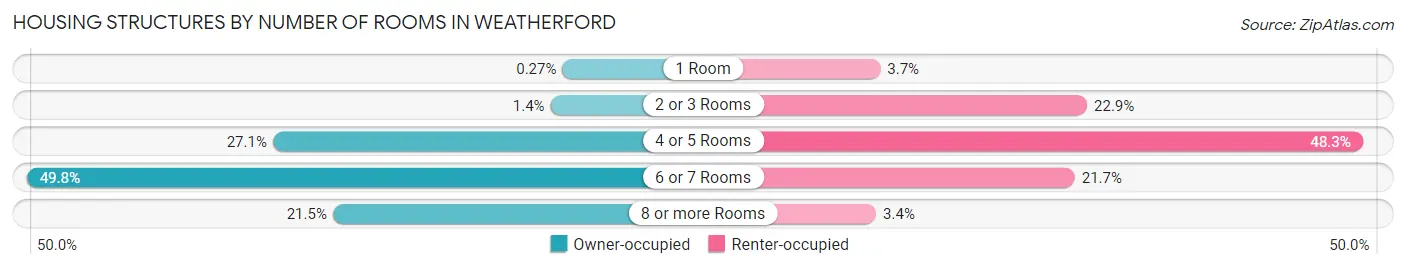
| Number of Rooms | Owner-occupied | Renter-occupied |
| 1 Room | 22 (0.3%) | 161 (3.7%) |
| 2 or 3 Rooms | 110 (1.4%) | 984 (22.9%) |
| 4 or 5 Rooms | 2,173 (27.1%) | 2,080 (48.3%) |
| 6 or 7 Rooms | 4,000 (49.8%) | 935 (21.7%) |
| 8 or more Rooms | 1,727 (21.5%) | 144 (3.4%) |
| Total | 8,032 (100.0%) | 4,304 (100.0%) |
Housing Structure by Heating Type in Weatherford
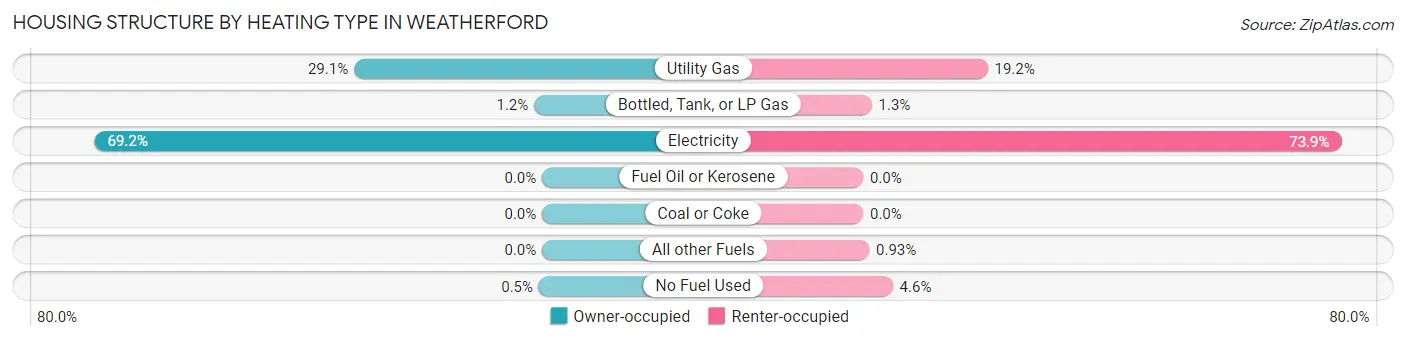
| Heating Type | Owner-occupied | Renter-occupied |
| Utility Gas | 2,336 (29.1%) | 828 (19.2%) |
| Bottled, Tank, or LP Gas | 99 (1.2%) | 57 (1.3%) |
| Electricity | 5,557 (69.2%) | 3,182 (73.9%) |
| Fuel Oil or Kerosene | 0 (0.0%) | 0 (0.0%) |
| Coal or Coke | 0 (0.0%) | 0 (0.0%) |
| All other Fuels | 0 (0.0%) | 40 (0.9%) |
| No Fuel Used | 40 (0.5%) | 197 (4.6%) |
| Total | 8,032 (100.0%) | 4,304 (100.0%) |
Household Vehicle Usage in Weatherford
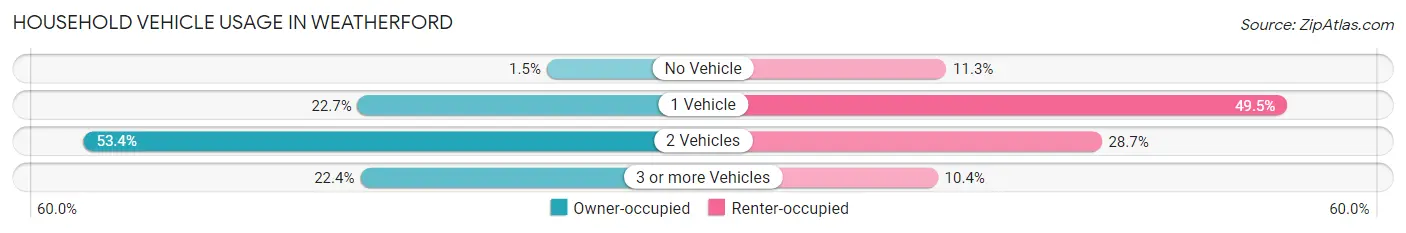
| Vehicles per Household | Owner-occupied | Renter-occupied |
| No Vehicle | 121 (1.5%) | 488 (11.3%) |
| 1 Vehicle | 1,824 (22.7%) | 2,132 (49.5%) |
| 2 Vehicles | 4,288 (53.4%) | 1,237 (28.7%) |
| 3 or more Vehicles | 1,799 (22.4%) | 447 (10.4%) |
| Total | 8,032 (100.0%) | 4,304 (100.0%) |
Real Estate & Mortgages in Weatherford
Real Estate and Mortgage Overview in Weatherford
| Characteristic | Without Mortgage | With Mortgage |
| Housing Units | 3,304 | 4,728 |
| Median Property Value | $236,900 | $267,300 |
| Median Household Income | $79,107 | $1,472 |
| Monthly Housing Costs | $753 | $547 |
| Real Estate Taxes | $3,156 | $137 |
Property Value by Mortgage Status in Weatherford
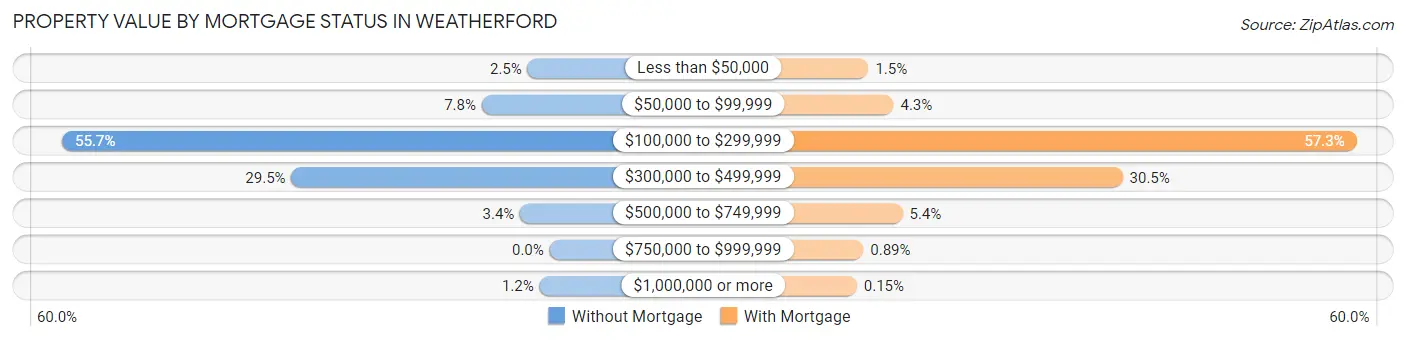
| Property Value | Without Mortgage | With Mortgage |
| Less than $50,000 | 83 (2.5%) | 70 (1.5%) |
| $50,000 to $99,999 | 256 (7.7%) | 205 (4.3%) |
| $100,000 to $299,999 | 1,841 (55.7%) | 2,707 (57.3%) |
| $300,000 to $499,999 | 975 (29.5%) | 1,443 (30.5%) |
| $500,000 to $749,999 | 111 (3.4%) | 254 (5.4%) |
| $750,000 to $999,999 | 0 (0.0%) | 42 (0.9%) |
| $1,000,000 or more | 38 (1.1%) | 7 (0.2%) |
| Total | 3,304 (100.0%) | 4,728 (100.0%) |
Household Income by Mortgage Status in Weatherford
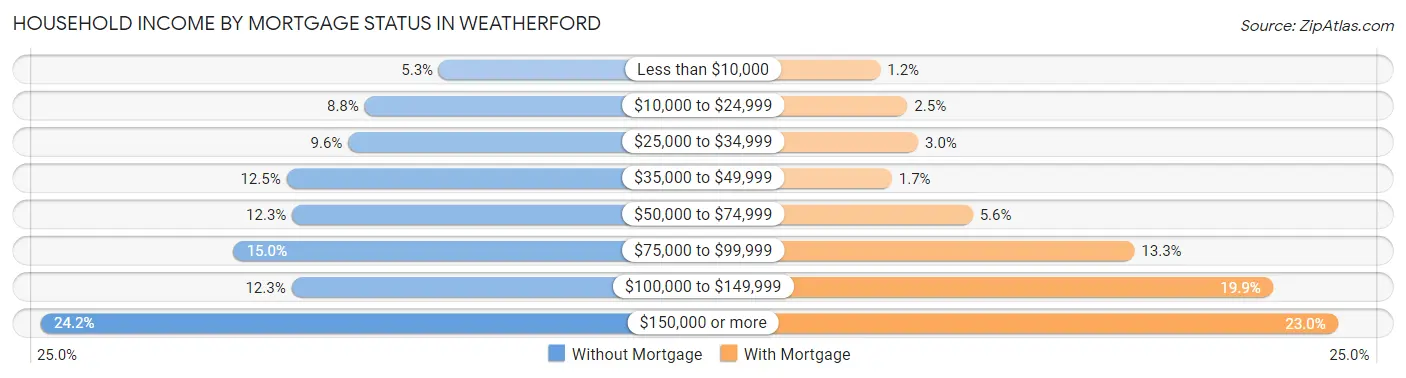
| Household Income | Without Mortgage | With Mortgage |
| Less than $10,000 | 174 (5.3%) | 56 (1.2%) |
| $10,000 to $24,999 | 291 (8.8%) | 117 (2.5%) |
| $25,000 to $34,999 | 317 (9.6%) | 141 (3.0%) |
| $35,000 to $49,999 | 414 (12.5%) | 82 (1.7%) |
| $50,000 to $74,999 | 405 (12.3%) | 264 (5.6%) |
| $75,000 to $99,999 | 497 (15.0%) | 628 (13.3%) |
| $100,000 to $149,999 | 406 (12.3%) | 939 (19.9%) |
| $150,000 or more | 800 (24.2%) | 1,085 (23.0%) |
| Total | 3,304 (100.0%) | 4,728 (100.0%) |
Property Value to Household Income Ratio in Weatherford
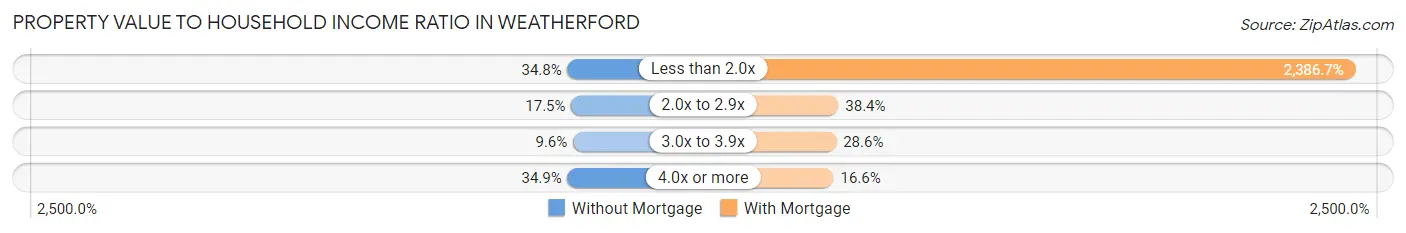
| Value-to-Income Ratio | Without Mortgage | With Mortgage |
| Less than 2.0x | 1,151 (34.8%) | 112,842 (2,386.7%) |
| 2.0x to 2.9x | 578 (17.5%) | 1,815 (38.4%) |
| 3.0x to 3.9x | 316 (9.6%) | 1,351 (28.6%) |
| 4.0x or more | 1,154 (34.9%) | 783 (16.6%) |
| Total | 3,304 (100.0%) | 4,728 (100.0%) |
Real Estate Taxes by Mortgage Status in Weatherford
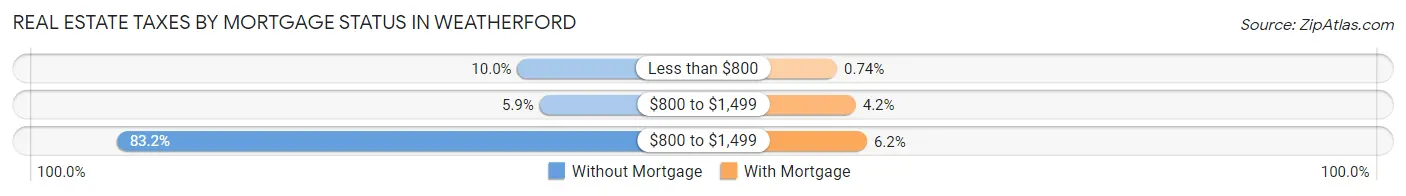
| Property Taxes | Without Mortgage | With Mortgage |
| Less than $800 | 330 (10.0%) | 35 (0.7%) |
| $800 to $1,499 | 196 (5.9%) | 196 (4.2%) |
| $800 to $1,499 | 2,748 (83.2%) | 293 (6.2%) |
| Total | 3,304 (100.0%) | 4,728 (100.0%) |
Health & Disability in Weatherford
Health Insurance Coverage by Age in Weatherford
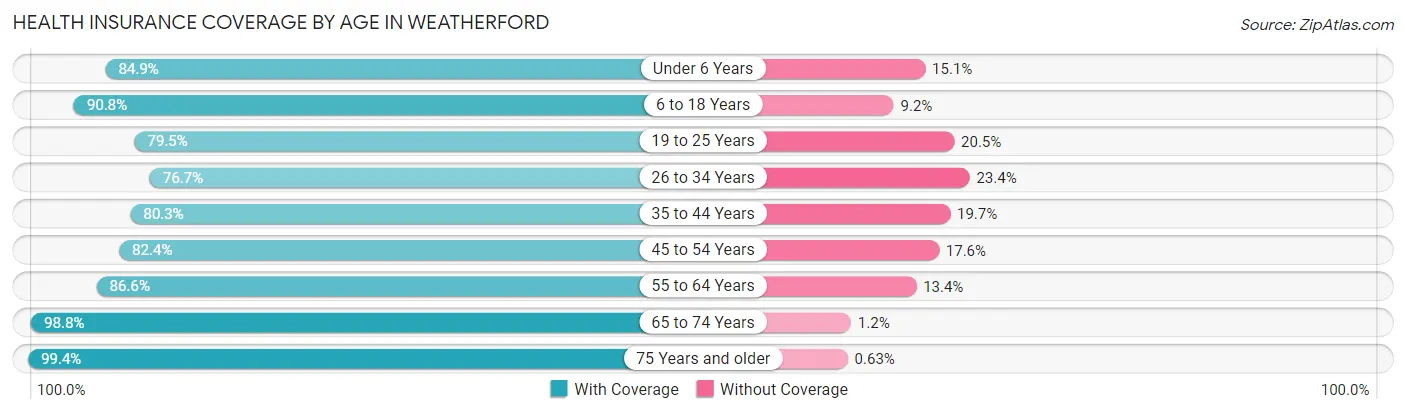
| Age Bracket | With Coverage | Without Coverage |
| Under 6 Years | 1,988 (84.9%) | 353 (15.1%) |
| 6 to 18 Years | 4,813 (90.8%) | 487 (9.2%) |
| 19 to 25 Years | 2,532 (79.5%) | 652 (20.5%) |
| 26 to 34 Years | 2,991 (76.6%) | 911 (23.4%) |
| 35 to 44 Years | 2,662 (80.3%) | 654 (19.7%) |
| 45 to 54 Years | 2,798 (82.4%) | 599 (17.6%) |
| 55 to 64 Years | 3,694 (86.6%) | 572 (13.4%) |
| 65 to 74 Years | 3,044 (98.8%) | 38 (1.2%) |
| 75 Years and older | 2,225 (99.4%) | 14 (0.6%) |
| Total | 26,747 (86.2%) | 4,280 (13.8%) |
Health Insurance Coverage by Citizenship Status in Weatherford
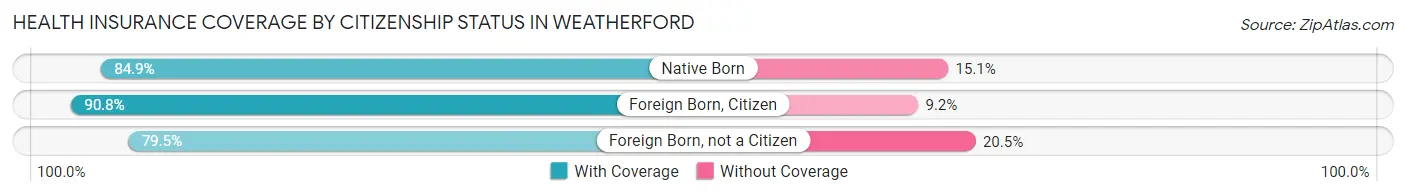
| Citizenship Status | With Coverage | Without Coverage |
| Native Born | 1,988 (84.9%) | 353 (15.1%) |
| Foreign Born, Citizen | 4,813 (90.8%) | 487 (9.2%) |
| Foreign Born, not a Citizen | 2,532 (79.5%) | 652 (20.5%) |
Health Insurance Coverage by Household Income in Weatherford
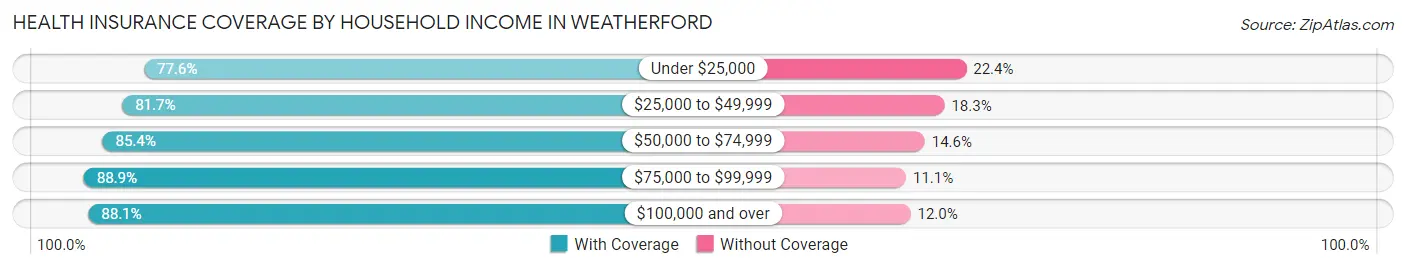
| Household Income | With Coverage | Without Coverage |
| Under $25,000 | 1,799 (77.6%) | 519 (22.4%) |
| $25,000 to $49,999 | 3,233 (81.7%) | 724 (18.3%) |
| $50,000 to $74,999 | 4,190 (85.4%) | 717 (14.6%) |
| $75,000 to $99,999 | 5,216 (88.9%) | 651 (11.1%) |
| $100,000 and over | 12,049 (88.0%) | 1,635 (11.9%) |
Public vs Private Health Insurance Coverage by Age in Weatherford
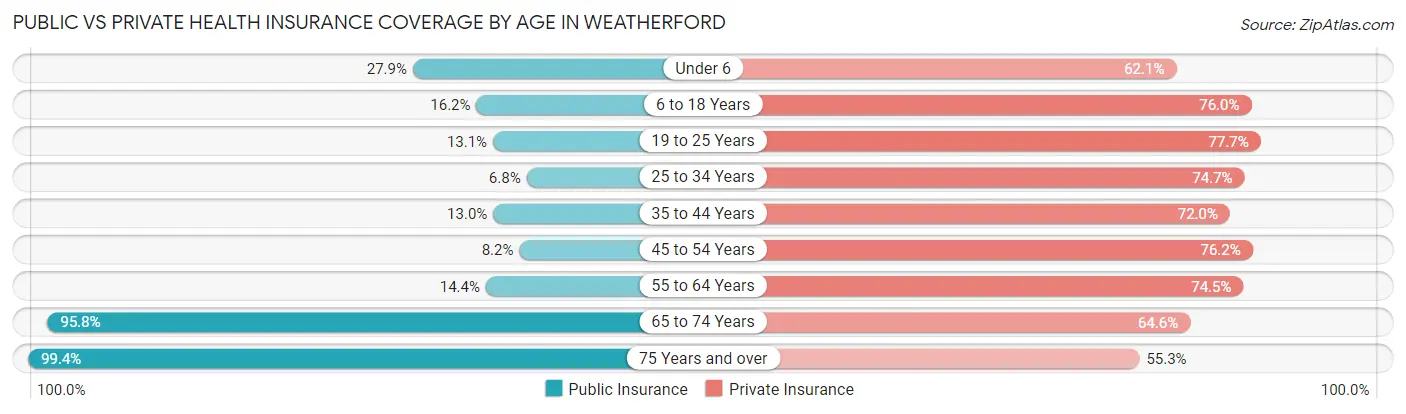
| Age Bracket | Public Insurance | Private Insurance |
| Under 6 | 654 (27.9%) | 1,453 (62.1%) |
| 6 to 18 Years | 856 (16.2%) | 4,028 (76.0%) |
| 19 to 25 Years | 416 (13.1%) | 2,475 (77.7%) |
| 25 to 34 Years | 267 (6.8%) | 2,916 (74.7%) |
| 35 to 44 Years | 432 (13.0%) | 2,388 (72.0%) |
| 45 to 54 Years | 278 (8.2%) | 2,590 (76.2%) |
| 55 to 64 Years | 614 (14.4%) | 3,179 (74.5%) |
| 65 to 74 Years | 2,952 (95.8%) | 1,992 (64.6%) |
| 75 Years and over | 2,225 (99.4%) | 1,237 (55.2%) |
| Total | 8,694 (28.0%) | 22,258 (71.7%) |
Disability Status by Sex by Age in Weatherford
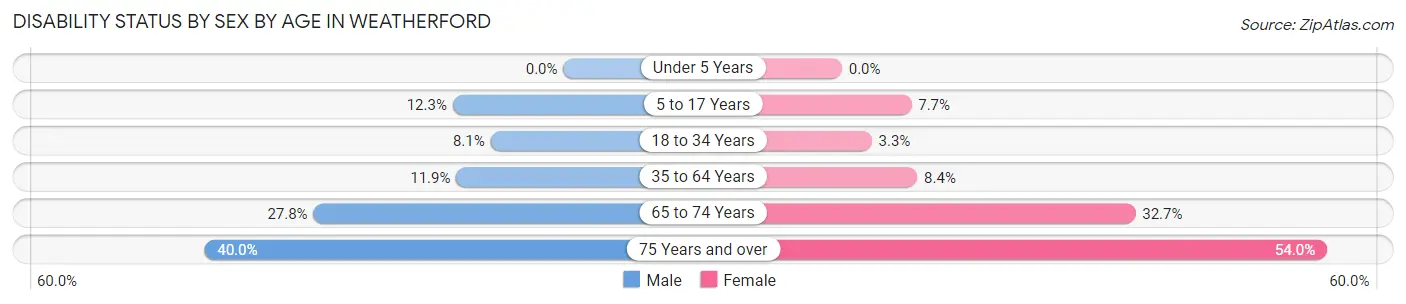
| Age Bracket | Male | Female |
| Under 5 Years | 0 (0.0%) | 0 (0.0%) |
| 5 to 17 Years | 345 (12.3%) | 191 (7.7%) |
| 18 to 34 Years | 341 (8.1%) | 114 (3.3%) |
| 35 to 64 Years | 640 (11.9%) | 471 (8.4%) |
| 65 to 74 Years | 398 (27.8%) | 540 (32.7%) |
| 75 Years and over | 361 (40.0%) | 722 (54.0%) |
Disability Class by Sex by Age in Weatherford
Disability Class: Hearing Difficulty
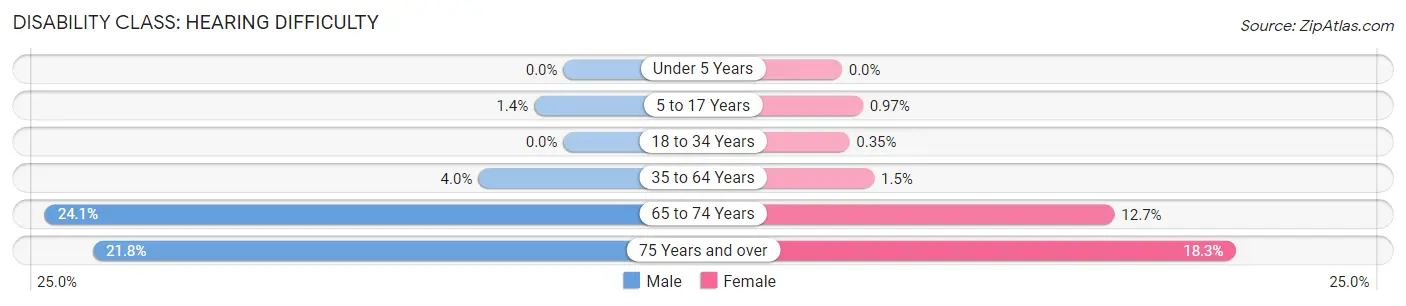
| Age Bracket | Male | Female |
| Under 5 Years | 0 (0.0%) | 0 (0.0%) |
| 5 to 17 Years | 38 (1.4%) | 24 (1.0%) |
| 18 to 34 Years | 0 (0.0%) | 12 (0.4%) |
| 35 to 64 Years | 212 (4.0%) | 84 (1.5%) |
| 65 to 74 Years | 344 (24.1%) | 209 (12.7%) |
| 75 Years and over | 197 (21.8%) | 244 (18.3%) |
Disability Class: Vision Difficulty
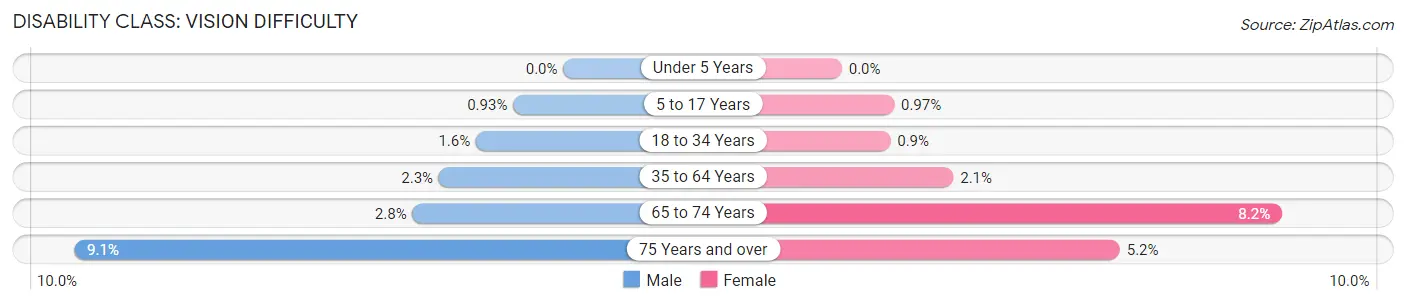
| Age Bracket | Male | Female |
| Under 5 Years | 0 (0.0%) | 0 (0.0%) |
| 5 to 17 Years | 26 (0.9%) | 24 (1.0%) |
| 18 to 34 Years | 68 (1.6%) | 31 (0.9%) |
| 35 to 64 Years | 124 (2.3%) | 116 (2.1%) |
| 65 to 74 Years | 40 (2.8%) | 135 (8.2%) |
| 75 Years and over | 82 (9.1%) | 69 (5.2%) |
Disability Class: Cognitive Difficulty
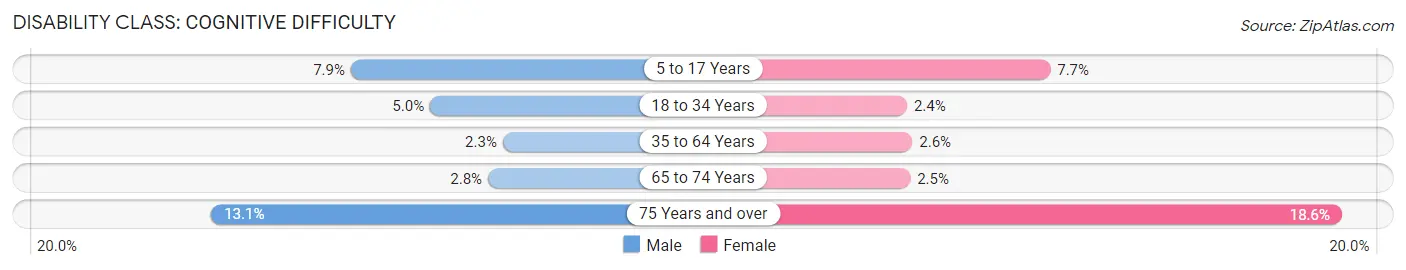
| Age Bracket | Male | Female |
| 5 to 17 Years | 221 (7.9%) | 191 (7.7%) |
| 18 to 34 Years | 208 (5.0%) | 83 (2.4%) |
| 35 to 64 Years | 121 (2.2%) | 147 (2.6%) |
| 65 to 74 Years | 40 (2.8%) | 42 (2.5%) |
| 75 Years and over | 118 (13.1%) | 248 (18.6%) |
Disability Class: Ambulatory Difficulty
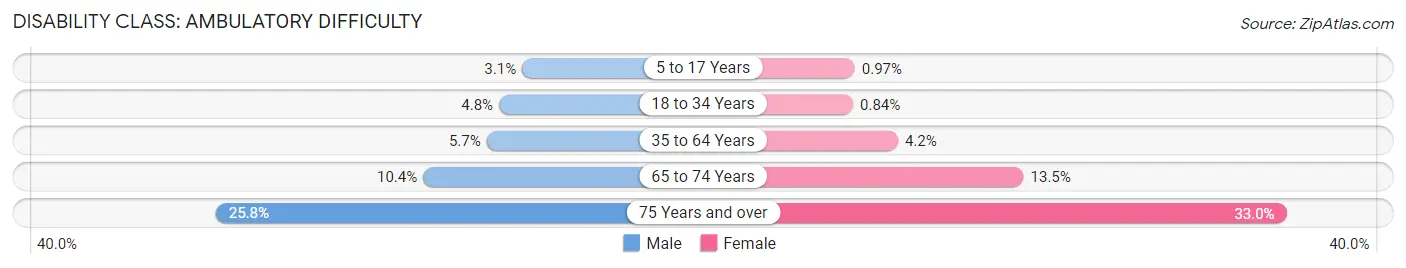
| Age Bracket | Male | Female |
| 5 to 17 Years | 86 (3.1%) | 24 (1.0%) |
| 18 to 34 Years | 201 (4.8%) | 29 (0.8%) |
| 35 to 64 Years | 306 (5.7%) | 234 (4.2%) |
| 65 to 74 Years | 149 (10.4%) | 223 (13.5%) |
| 75 Years and over | 233 (25.8%) | 441 (33.0%) |
Disability Class: Self-Care Difficulty
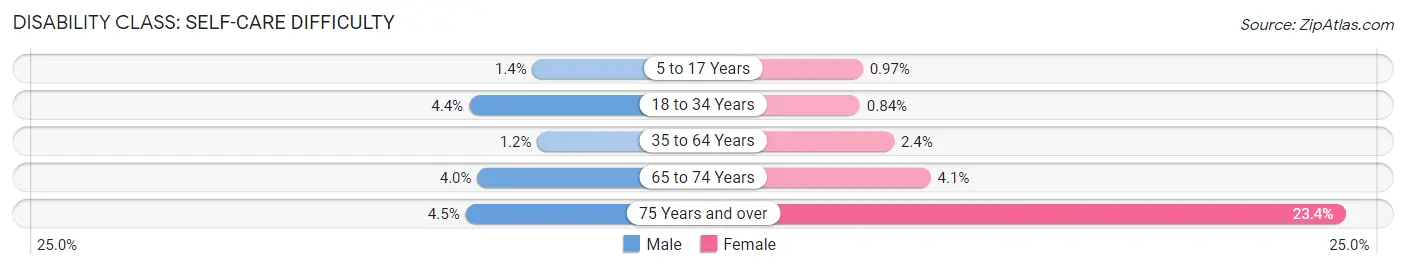
| Age Bracket | Male | Female |
| 5 to 17 Years | 40 (1.4%) | 24 (1.0%) |
| 18 to 34 Years | 184 (4.4%) | 29 (0.8%) |
| 35 to 64 Years | 65 (1.2%) | 136 (2.4%) |
| 65 to 74 Years | 57 (4.0%) | 68 (4.1%) |
| 75 Years and over | 41 (4.5%) | 312 (23.4%) |
Technology Access in Weatherford
Computing Device Access in Weatherford
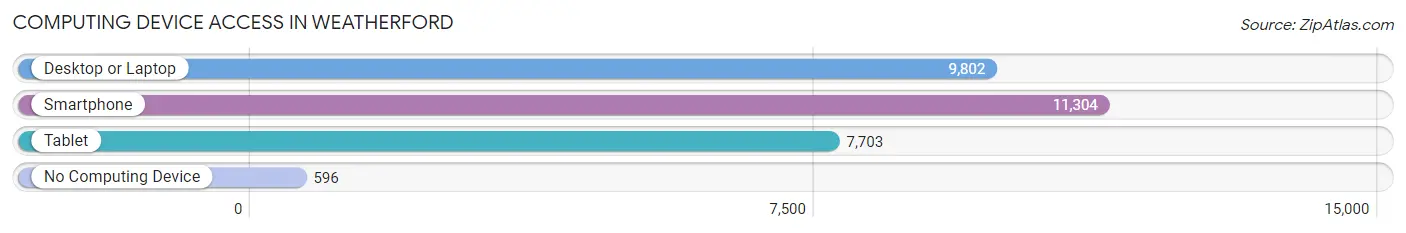
| Device Type | # Households | % Households |
| Desktop or Laptop | 9,802 | 79.5% |
| Smartphone | 11,304 | 91.6% |
| Tablet | 7,703 | 62.4% |
| No Computing Device | 596 | 4.8% |
| Total | 12,336 | 100.0% |
Internet Access in Weatherford
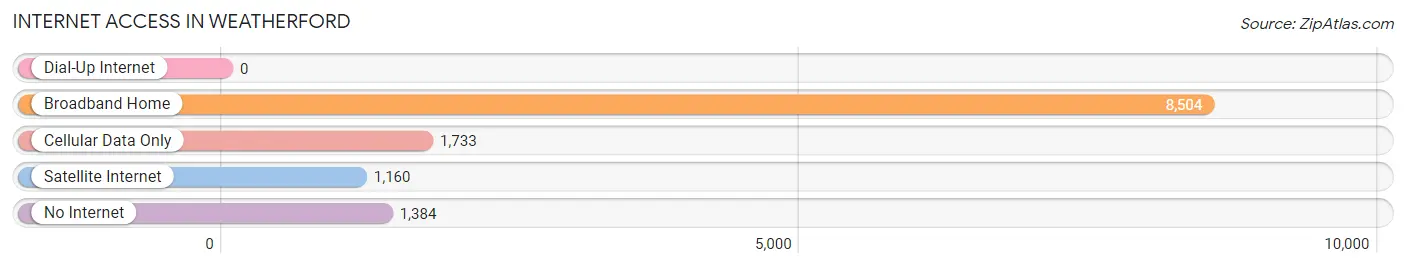
| Internet Type | # Households | % Households |
| Dial-Up Internet | 0 | 0.0% |
| Broadband Home | 8,504 | 68.9% |
| Cellular Data Only | 1,733 | 14.1% |
| Satellite Internet | 1,160 | 9.4% |
| No Internet | 1,384 | 11.2% |
| Total | 12,336 | 100.0% |
Weatherford Summary
History
The city of Weatherford, Texas is located in Parker County, approximately 25 miles west of Fort Worth. It was founded in 1854 by Thomas Jefferson Weatherford, a settler from Tennessee. Weatherford was originally known as “The Town of Weatherford” and was the county seat of Parker County. The city was named after Weatherford’s father, who was a veteran of the War of 1812.
Weatherford was an important stop on the Chisholm Trail, which was used by cowboys to drive cattle from Texas to Kansas. The city was also a major stop on the Butterfield Overland Mail route, which ran from St. Louis to San Francisco.
Weatherford was an important center of commerce in the late 19th century. It was home to several banks, a cotton gin, a flour mill, and a number of other businesses. The city was also home to several churches, including the First United Methodist Church, which was founded in 1856.
In the early 20th century, Weatherford experienced a period of growth and prosperity. The city was home to several large businesses, including a cotton mill, a brick factory, and a furniture factory. The city also had a thriving agricultural industry, with cotton, corn, and wheat being the main crops.
In the late 20th century, Weatherford experienced a period of decline. The city’s population decreased from a peak of 8,000 in the 1950s to just over 6,000 in 2000. The city’s economy also suffered, as many of the businesses that had been the backbone of the city’s economy closed or moved away.
Geography
Weatherford is located in the western part of Parker County, approximately 25 miles west of Fort Worth. The city is situated on the edge of the Cross Timbers region, which is a transition zone between the eastern and western parts of Texas. The city is located at the intersection of Interstate 20 and State Highway 180.
The city has a total area of 10.3 square miles, of which 10.2 square miles is land and 0.1 square miles is water. The terrain of the city is mostly flat, with some rolling hills in the northern and western parts of the city. The city is located at an elevation of 830 feet above sea level.
The climate of Weatherford is classified as humid subtropical, with hot summers and mild winters. The average temperature in the summer is around 90 degrees Fahrenheit, while the average temperature in the winter is around 50 degrees Fahrenheit. The city receives an average of 33 inches of precipitation per year.
Economy
Weatherford’s economy is largely based on agriculture and manufacturing. The city is home to several large agricultural operations, including cotton, corn, and wheat farms. The city is also home to several manufacturing companies, including a furniture factory, a brick factory, and a cotton mill.
The city is also home to several retail stores, restaurants, and other businesses. The city is home to several banks, including the First National Bank of Weatherford, which was founded in 1856. The city is also home to several medical facilities, including Weatherford Regional Medical Center.
Demographics
As of the 2010 census, the population of Weatherford was 25,250. The racial makeup of the city was 79.3% White, 11.3% African American, 0.7% Native American, 0.7% Asian, 0.1% Pacific Islander, 5.7% from other races, and 2.1% from two or more races. Hispanic or Latino of any race were 13.2% of the population.
The median household income in Weatherford was $45,945, and the median family income was $54,945. The per capita income in Weatherford was $22,945. About 11.3% of the population was below the poverty line.
Conclusion
Weatherford, Texas is a city located in Parker County, approximately 25 miles west of Fort Worth. The city was founded in 1854 and was an important stop on the Chisholm Trail and the Butterfield Overland Mail route. The city experienced a period of growth and prosperity in the early 20th century, but has since experienced a period of decline. The city’s economy is largely based on agriculture and manufacturing, and the city is home to several retail stores, restaurants, and other businesses. The population of Weatherford was 25,250 as of the 2010 census.
Common Questions
What is Per Capita Income in Weatherford?
Per Capita income in Weatherford is $40,367.
What is the Median Family Income in Weatherford?
Median Family Income in Weatherford is $98,308.
What is the Median Household income in Weatherford?
Median Household Income in Weatherford is $78,765.
What is Income or Wage Gap in Weatherford?
Income or Wage Gap in Weatherford is 35.3%.
Women in Weatherford earn 64.7 cents for every dollar earned by a man.
What is Inequality or Gini Index in Weatherford?
Inequality or Gini Index in Weatherford is 0.45.
What is the Total Population of Weatherford?
Total Population of Weatherford is 32,168.
What is the Total Male Population of Weatherford?
Total Male Population of Weatherford is 16,510.
What is the Total Female Population of Weatherford?
Total Female Population of Weatherford is 15,658.
What is the Ratio of Males per 100 Females in Weatherford?
There are 105.44 Males per 100 Females in Weatherford.
What is the Ratio of Females per 100 Males in Weatherford?
There are 94.84 Females per 100 Males in Weatherford.
What is the Median Population Age in Weatherford?
Median Population Age in Weatherford is 38.0 Years.
What is the Average Family Size in Weatherford
Average Family Size in Weatherford is 3.1 People.
What is the Average Household Size in Weatherford
Average Household Size in Weatherford is 2.5 People.
How Large is the Labor Force in Weatherford?
There are 16,346 People in the Labor Forcein in Weatherford.
What is the Percentage of People in the Labor Force in Weatherford?
63.0% of People are in the Labor Force in Weatherford.
What is the Unemployment Rate in Weatherford?
Unemployment Rate in Weatherford is 3.4%.