Grandview, WA Map & Demographics
Grandview Map
Grandview Overview
$20,605
PER CAPITA INCOME
$52,175
AVG FAMILY INCOME
$61,635
AVG HOUSEHOLD INCOME
24.7%
WAGE / INCOME GAP [ % ]
75.3¢/ $1
WAGE / INCOME GAP [ $ ]
0.37
INEQUALITY / GINI INDEX
10,922
TOTAL POPULATION
5,332
MALE POPULATION
5,590
FEMALE POPULATION
95.38
MALES / 100 FEMALES
104.84
FEMALES / 100 MALES
25.9
MEDIAN AGE
3.7
AVG FAMILY SIZE
3.5
AVG HOUSEHOLD SIZE
5,104
LABOR FORCE [ PEOPLE ]
74.4%
PERCENT IN LABOR FORCE
4.3%
UNEMPLOYMENT RATE
Grandview Zip Codes
Grandview Area Codes
Income in Grandview
Income Overview in Grandview
Per Capita Income in Grandview is $20,605, while median incomes of families and households are $52,175 and $61,635 respectively.
| Characteristic | Number | Measure |
| Per Capita Income | 10,922 | $20,605 |
| Median Family Income | 2,499 | $52,175 |
| Mean Family Income | 2,499 | $69,225 |
| Median Household Income | 3,116 | $61,635 |
| Mean Household Income | 3,116 | $70,516 |
| Income Deficit | 2,499 | $0 |
| Wage / Income Gap (%) | 10,922 | 24.73% |
| Wage / Income Gap ($) | 10,922 | 75.27¢ per $1 |
| Gini / Inequality Index | 10,922 | 0.37 |
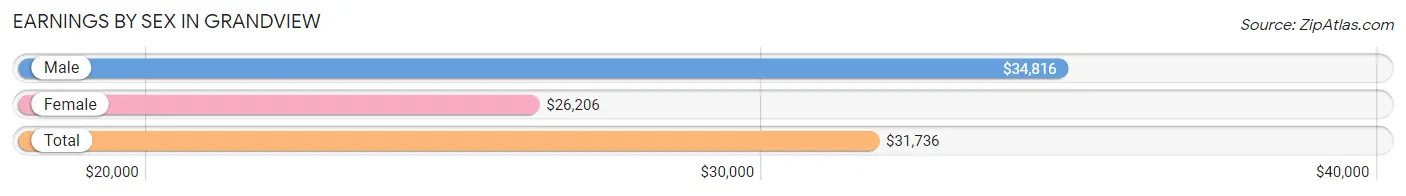
Earnings by Sex in Grandview
Average Earnings in Grandview are $31,736, $34,816 for men and $26,206 for women, a difference of 24.7%.
| Sex | Number | Average Earnings |
| Male | 2,772 (51.0%) | $34,816 |
| Female | 2,668 (49.0%) | $26,206 |
| Total | 5,440 (100.0%) | $31,736 |
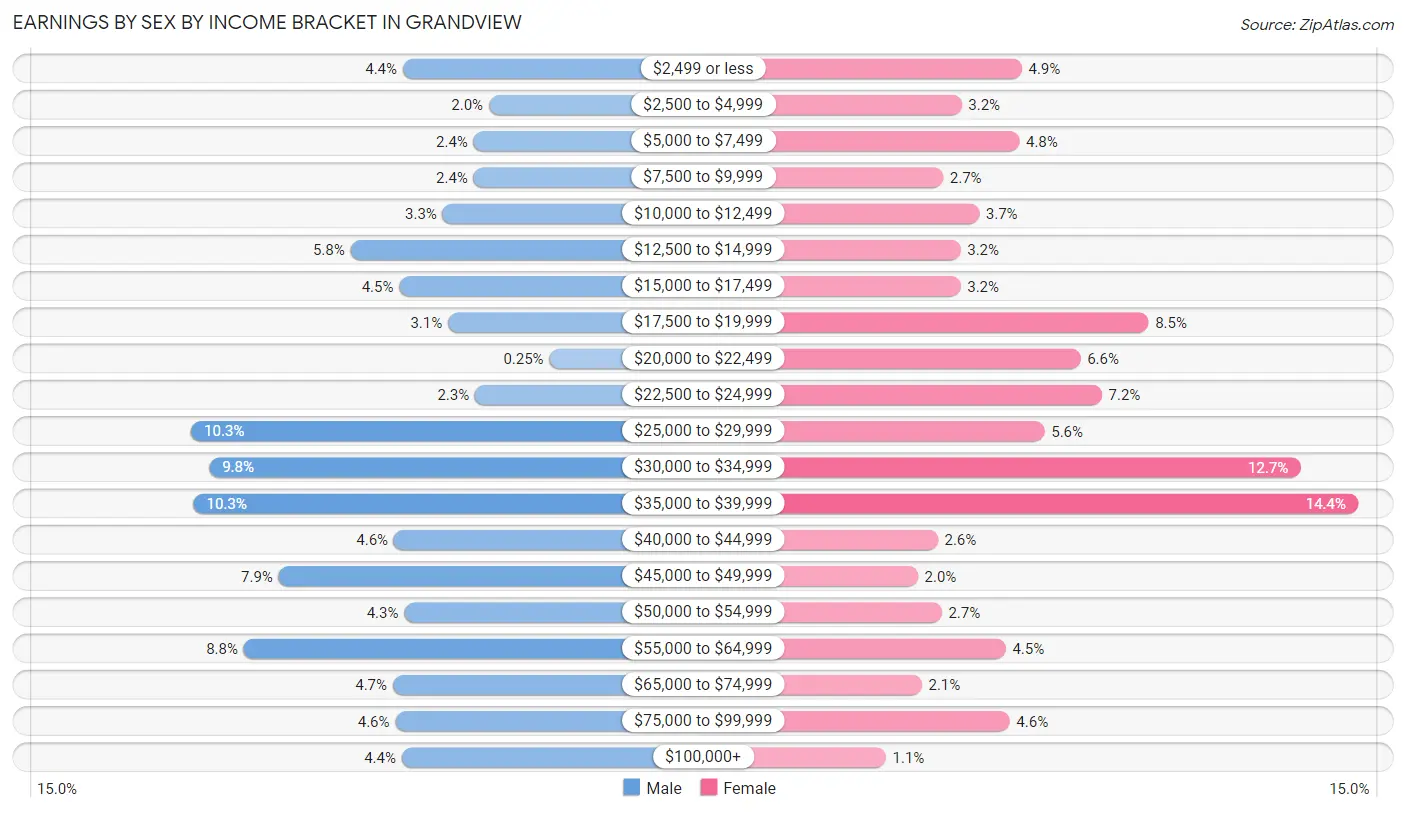
Earnings by Sex by Income Bracket in Grandview
The most common earnings brackets in Grandview are $25,000 to $29,999 for men (286 | 10.3%) and $35,000 to $39,999 for women (383 | 14.4%).
| Income | Male | Female |
| $2,499 or less | 121 (4.4%) | 131 (4.9%) |
| $2,500 to $4,999 | 54 (1.9%) | 86 (3.2%) |
| $5,000 to $7,499 | 66 (2.4%) | 129 (4.8%) |
| $7,500 to $9,999 | 66 (2.4%) | 72 (2.7%) |
| $10,000 to $12,499 | 90 (3.3%) | 99 (3.7%) |
| $12,500 to $14,999 | 162 (5.8%) | 85 (3.2%) |
| $15,000 to $17,499 | 124 (4.5%) | 85 (3.2%) |
| $17,500 to $19,999 | 86 (3.1%) | 226 (8.5%) |
| $20,000 to $22,499 | 7 (0.3%) | 175 (6.6%) |
| $22,500 to $24,999 | 65 (2.3%) | 191 (7.2%) |
| $25,000 to $29,999 | 286 (10.3%) | 148 (5.6%) |
| $30,000 to $34,999 | 272 (9.8%) | 340 (12.7%) |
| $35,000 to $39,999 | 284 (10.2%) | 383 (14.4%) |
| $40,000 to $44,999 | 128 (4.6%) | 68 (2.5%) |
| $45,000 to $49,999 | 218 (7.9%) | 53 (2.0%) |
| $50,000 to $54,999 | 120 (4.3%) | 71 (2.7%) |
| $55,000 to $64,999 | 245 (8.8%) | 119 (4.5%) |
| $65,000 to $74,999 | 129 (4.6%) | 56 (2.1%) |
| $75,000 to $99,999 | 127 (4.6%) | 122 (4.6%) |
| $100,000+ | 122 (4.4%) | 29 (1.1%) |
| Total | 2,772 (100.0%) | 2,668 (100.0%) |
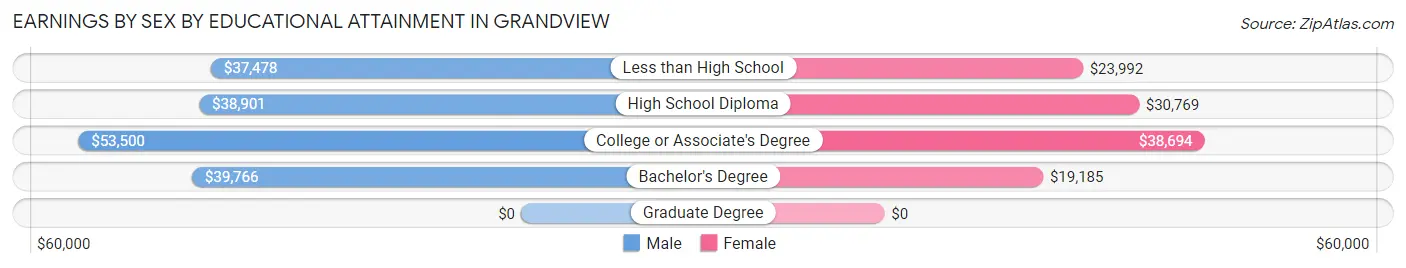
Earnings by Sex by Educational Attainment in Grandview
Average earnings in Grandview are $38,971 for men and $31,076 for women, a difference of 20.3%. Men with an educational attainment of college or associate's degree enjoy the highest average annual earnings of $53,500, while those with less than high school education earn the least with $37,478. Women with an educational attainment of college or associate's degree earn the most with the average annual earnings of $38,694, while those with bachelor's degree education have the smallest earnings of $19,185.
| Educational Attainment | Male Income | Female Income |
| Less than High School | $37,478 | $23,992 |
| High School Diploma | $38,901 | $30,769 |
| College or Associate's Degree | $53,500 | $38,694 |
| Bachelor's Degree | $39,766 | $19,185 |
| Graduate Degree | - | - |
| Total | $38,971 | $31,076 |
Family Income in Grandview
Family Income Brackets in Grandview
According to the Grandview family income data, there are 752 families falling into the $50,000 to $74,999 income range, which is the most common income bracket and makes up 30.1% of all families.
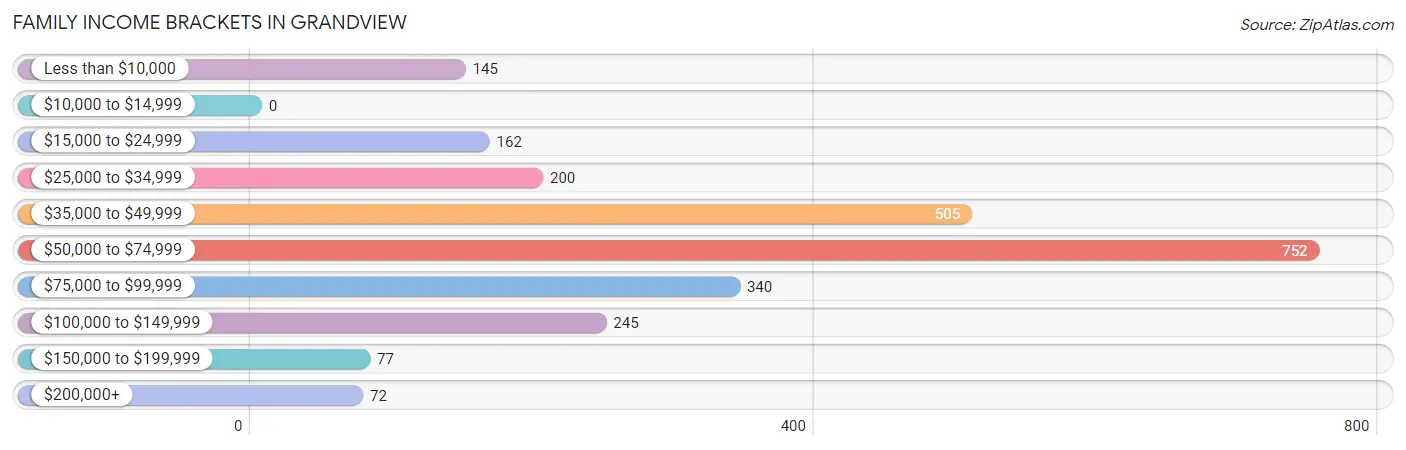
| Income Bracket | # Families | % Families |
| Less than $10,000 | 145 | 5.8% |
| $10,000 to $14,999 | 0 | 0.0% |
| $15,000 to $24,999 | 162 | 6.5% |
| $25,000 to $34,999 | 200 | 8.0% |
| $35,000 to $49,999 | 505 | 20.2% |
| $50,000 to $74,999 | 752 | 30.1% |
| $75,000 to $99,999 | 340 | 13.6% |
| $100,000 to $149,999 | 245 | 9.8% |
| $150,000 to $199,999 | 77 | 3.1% |
| $200,000+ | 72 | 2.9% |
Family Income by Famaliy Size in Grandview
7+ person families (82 | 3.3%) account for the highest median family income in Grandview with $89,018 per family, while 3-person families (659 | 26.4%) have the highest median income of $23,105 per family member.
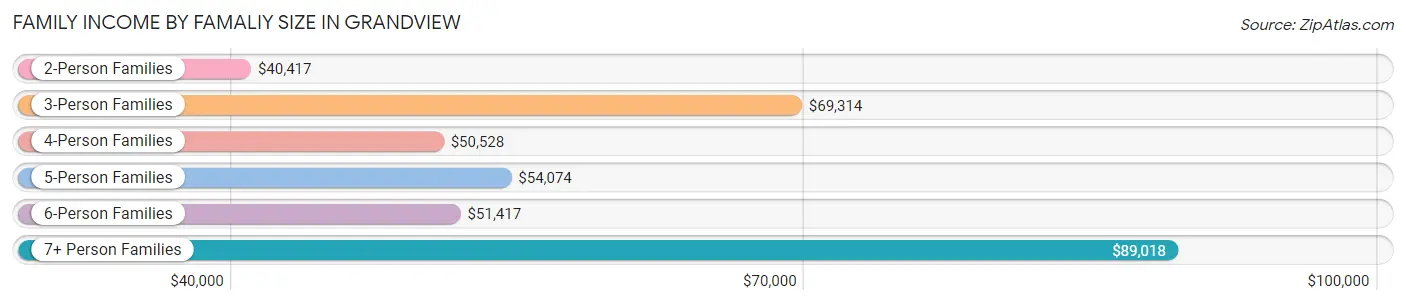
| Income Bracket | # Families | Median Income |
| 2-Person Families | 698 (27.9%) | $40,417 |
| 3-Person Families | 659 (26.4%) | $69,314 |
| 4-Person Families | 557 (22.3%) | $50,528 |
| 5-Person Families | 384 (15.4%) | $54,074 |
| 6-Person Families | 119 (4.8%) | $51,417 |
| 7+ Person Families | 82 (3.3%) | $89,018 |
| Total | 2,499 (100.0%) | $52,175 |
Family Income by Number of Earners in Grandview
The median family income in Grandview is $52,175, with families comprising 3+ earners (370) having the highest median family income of $90,645, while families with no earners (106) have the lowest median family income of $38,281, accounting for 14.8% and 4.2% of families, respectively.
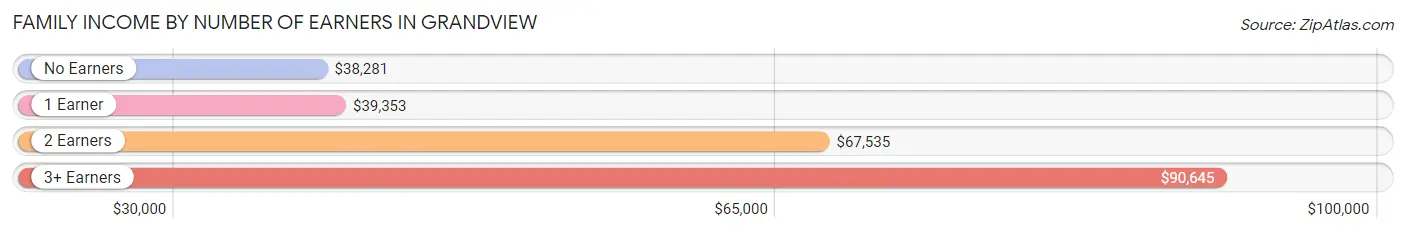
| Number of Earners | # Families | Median Income |
| No Earners | 106 (4.2%) | $38,281 |
| 1 Earner | 1,028 (41.1%) | $39,353 |
| 2 Earners | 995 (39.8%) | $67,535 |
| 3+ Earners | 370 (14.8%) | $90,645 |
| Total | 2,499 (100.0%) | $52,175 |
Household Income in Grandview
Household Income Brackets in Grandview
With 826 households falling in the category, the $50,000 to $74,999 income range is the most frequent in Grandview, accounting for 26.5% of all households. In contrast, only 41 households (1.3%) fall into the $150,000 to $199,999 income bracket, making it the least populous group.
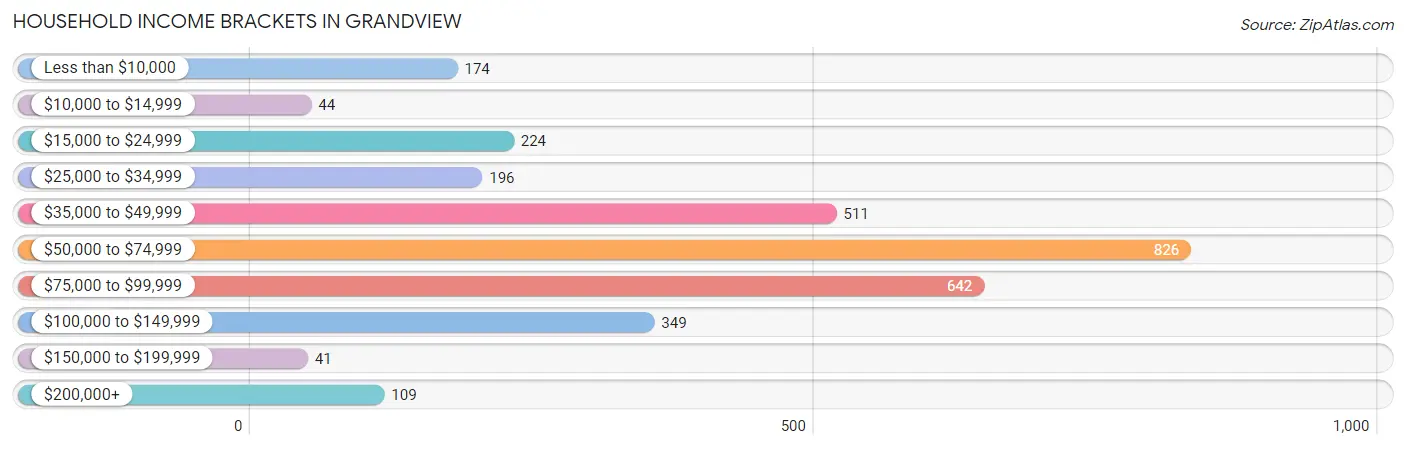
| Income Bracket | # Households | % Households |
| Less than $10,000 | 174 | 5.6% |
| $10,000 to $14,999 | 44 | 1.4% |
| $15,000 to $24,999 | 224 | 7.2% |
| $25,000 to $34,999 | 196 | 6.3% |
| $35,000 to $49,999 | 511 | 16.4% |
| $50,000 to $74,999 | 826 | 26.5% |
| $75,000 to $99,999 | 642 | 20.6% |
| $100,000 to $149,999 | 349 | 11.2% |
| $150,000 to $199,999 | 41 | 1.3% |
| $200,000+ | 109 | 3.5% |
Household Income by Householder Age in Grandview
The median household income in Grandview is $61,635, with the highest median household income of $68,549 found in the 45 to 64 years age bracket for the primary householder. A total of 1,000 households (32.1%) fall into this category. Meanwhile, the 15 to 24 years age bracket for the primary householder has the lowest median household income of $0, with 143 households (4.6%) in this group.
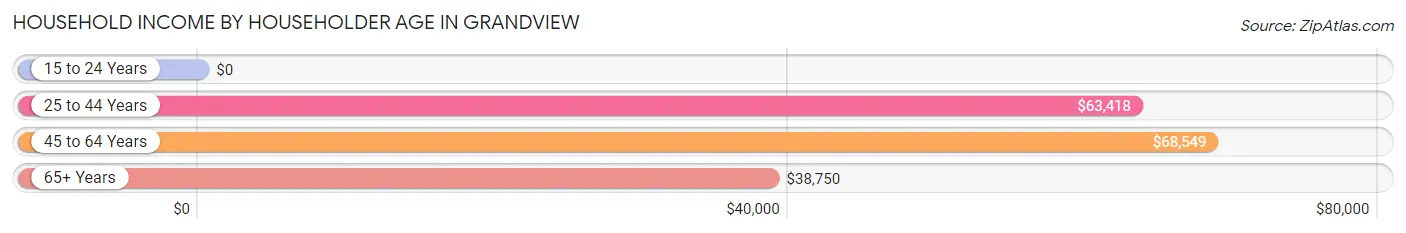
| Income Bracket | # Households | Median Income |
| 15 to 24 Years | 143 (4.6%) | $0 |
| 25 to 44 Years | 1,554 (49.9%) | $63,418 |
| 45 to 64 Years | 1,000 (32.1%) | $68,549 |
| 65+ Years | 419 (13.5%) | $38,750 |
| Total | 3,116 (100.0%) | $61,635 |
Poverty in Grandview
Income Below Poverty by Sex and Age in Grandview
With 12.9% poverty level for males and 17.3% for females among the residents of Grandview, 5 year old males and 6 to 11 year old females are the most vulnerable to poverty, with 37 males (50.0%) and 244 females (35.3%) in their respective age groups living below the poverty level.
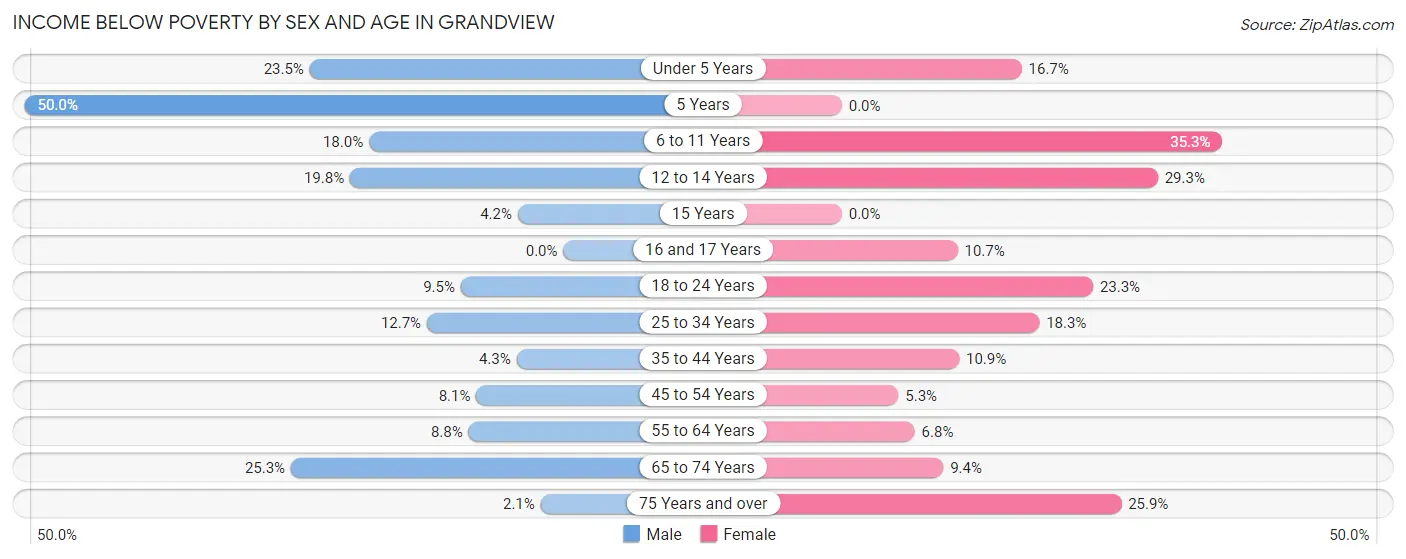
| Age Bracket | Male | Female |
| Under 5 Years | 105 (23.5%) | 123 (16.7%) |
| 5 Years | 37 (50.0%) | 0 (0.0%) |
| 6 to 11 Years | 151 (18.0%) | 244 (35.3%) |
| 12 to 14 Years | 59 (19.8%) | 129 (29.3%) |
| 15 Years | 9 (4.2%) | 0 (0.0%) |
| 16 and 17 Years | 0 (0.0%) | 13 (10.7%) |
| 18 to 24 Years | 53 (9.5%) | 107 (23.3%) |
| 25 to 34 Years | 112 (12.7%) | 161 (18.3%) |
| 35 to 44 Years | 24 (4.3%) | 83 (10.9%) |
| 45 to 54 Years | 50 (8.1%) | 28 (5.2%) |
| 55 to 64 Years | 36 (8.8%) | 20 (6.8%) |
| 65 to 74 Years | 45 (25.3%) | 19 (9.4%) |
| 75 Years and over | 3 (2.1%) | 35 (25.9%) |
| Total | 684 (12.9%) | 962 (17.3%) |
Income Above Poverty by Sex and Age in Grandview
According to the poverty statistics in Grandview, males aged 16 and 17 years and females aged 5 years are the age groups that are most secure financially, with 100.0% of males and 100.0% of females in these age groups living above the poverty line.
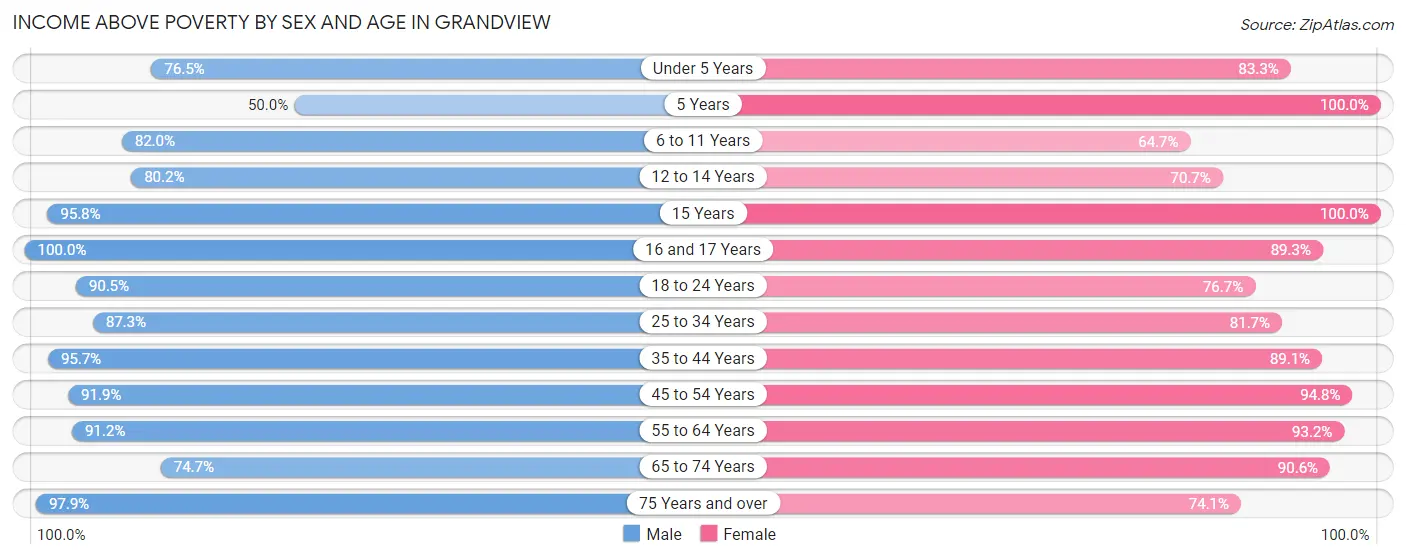
| Age Bracket | Male | Female |
| Under 5 Years | 341 (76.5%) | 614 (83.3%) |
| 5 Years | 37 (50.0%) | 110 (100.0%) |
| 6 to 11 Years | 686 (82.0%) | 447 (64.7%) |
| 12 to 14 Years | 239 (80.2%) | 311 (70.7%) |
| 15 Years | 204 (95.8%) | 190 (100.0%) |
| 16 and 17 Years | 103 (100.0%) | 108 (89.3%) |
| 18 to 24 Years | 504 (90.5%) | 352 (76.7%) |
| 25 to 34 Years | 773 (87.3%) | 718 (81.7%) |
| 35 to 44 Years | 529 (95.7%) | 680 (89.1%) |
| 45 to 54 Years | 569 (91.9%) | 505 (94.8%) |
| 55 to 64 Years | 373 (91.2%) | 276 (93.2%) |
| 65 to 74 Years | 133 (74.7%) | 183 (90.6%) |
| 75 Years and over | 139 (97.9%) | 100 (74.1%) |
| Total | 4,630 (87.1%) | 4,594 (82.7%) |
Income Below Poverty Among Married-Couple Families in Grandview
The poverty statistics for married-couple families in Grandview show that 1.6% or 22 of the total 1,363 families live below the poverty line. Families with 3 or 4 children have the highest poverty rate of 5.5%, comprising of 16 families. On the other hand, families with no children have the lowest poverty rate of 0.0%, which includes 0 families.
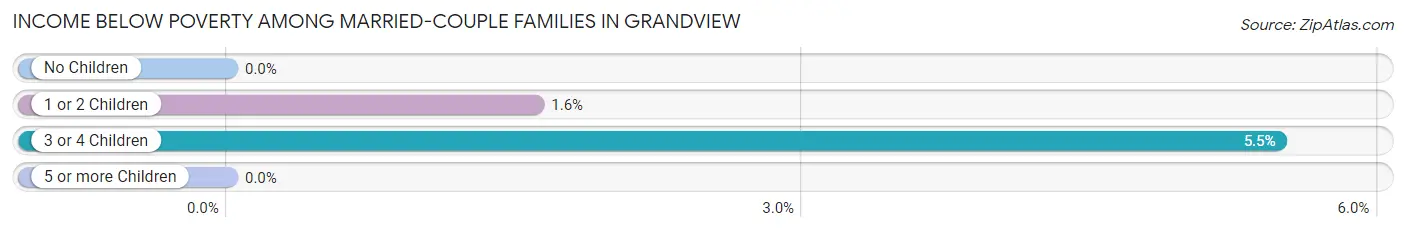
| Children | Above Poverty | Below Poverty |
| No Children | 677 (100.0%) | 0 (0.0%) |
| 1 or 2 Children | 369 (98.4%) | 6 (1.6%) |
| 3 or 4 Children | 276 (94.5%) | 16 (5.5%) |
| 5 or more Children | 19 (100.0%) | 0 (0.0%) |
| Total | 1,341 (98.4%) | 22 (1.6%) |
Income Below Poverty Among Single-Parent Households in Grandview
According to the poverty data in Grandview, 1.0% or 3 single-father households and 29.8% or 248 single-mother households are living below the poverty line. Among single-father households, those with 1 or 2 children have the highest poverty rate, with 3 households (1.5%) experiencing poverty. Likewise, among single-mother households, those with 5 or more children have the highest poverty rate, with 24 households (100.0%) falling below the poverty line.
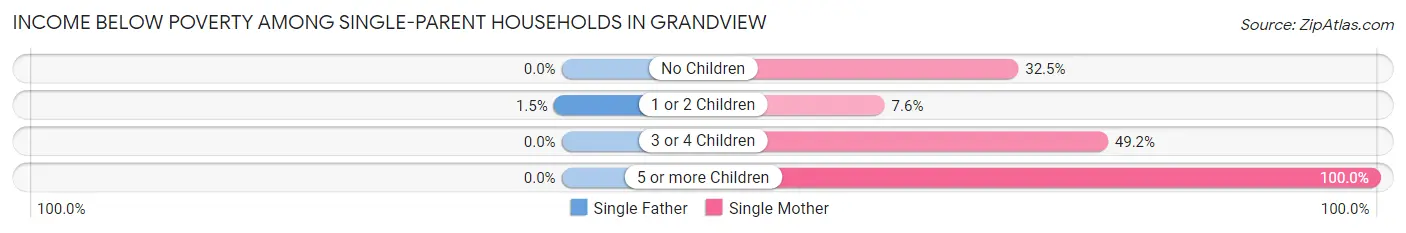
| Children | Single Father | Single Mother |
| No Children | 0 (0.0%) | 40 (32.5%) |
| 1 or 2 Children | 3 (1.5%) | 28 (7.6%) |
| 3 or 4 Children | 0 (0.0%) | 156 (49.2%) |
| 5 or more Children | 0 (0.0%) | 24 (100.0%) |
| Total | 3 (1.0%) | 248 (29.8%) |
Income Below Poverty Among Married-Couple vs Single-Parent Households in Grandview
The poverty data for Grandview shows that 22 of the married-couple family households (1.6%) and 251 of the single-parent households (22.1%) are living below the poverty level. Within the married-couple family households, those with 3 or 4 children have the highest poverty rate, with 16 households (5.5%) falling below the poverty line. Among the single-parent households, those with 5 or more children have the highest poverty rate, with 24 household (100.0%) living below poverty.
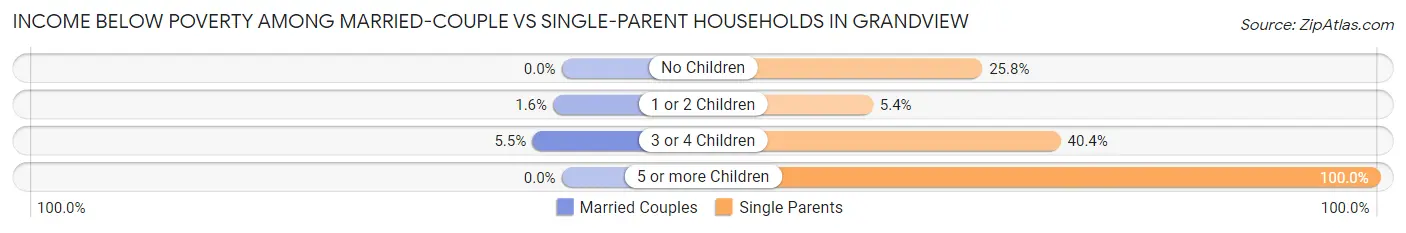
| Children | Married-Couple Families | Single-Parent Households |
| No Children | 0 (0.0%) | 40 (25.8%) |
| 1 or 2 Children | 6 (1.6%) | 31 (5.4%) |
| 3 or 4 Children | 16 (5.5%) | 156 (40.4%) |
| 5 or more Children | 0 (0.0%) | 24 (100.0%) |
| Total | 22 (1.6%) | 251 (22.1%) |
Race in Grandview
The most populous races in Grandview are Hispanic or Latino (9,364 | 85.7%), White / Caucasian (6,514 | 59.6%), and Two or more Races (2,231 | 20.4%).
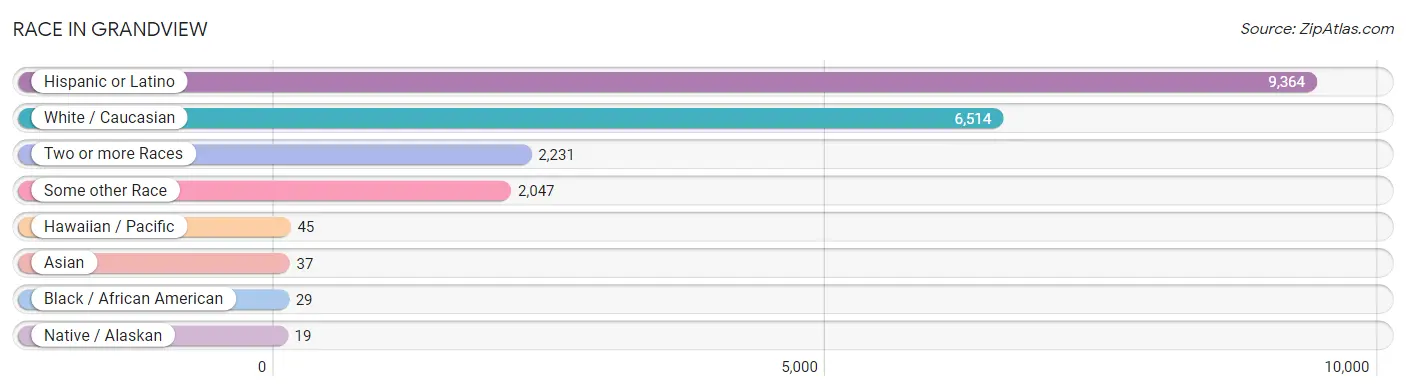
| Race | # Population | % Population |
| Asian | 37 | 0.3% |
| Black / African American | 29 | 0.3% |
| Hawaiian / Pacific | 45 | 0.4% |
| Hispanic or Latino | 9,364 | 85.7% |
| Native / Alaskan | 19 | 0.2% |
| White / Caucasian | 6,514 | 59.6% |
| Two or more Races | 2,231 | 20.4% |
| Some other Race | 2,047 | 18.7% |
| Total | 10,922 | 100.0% |
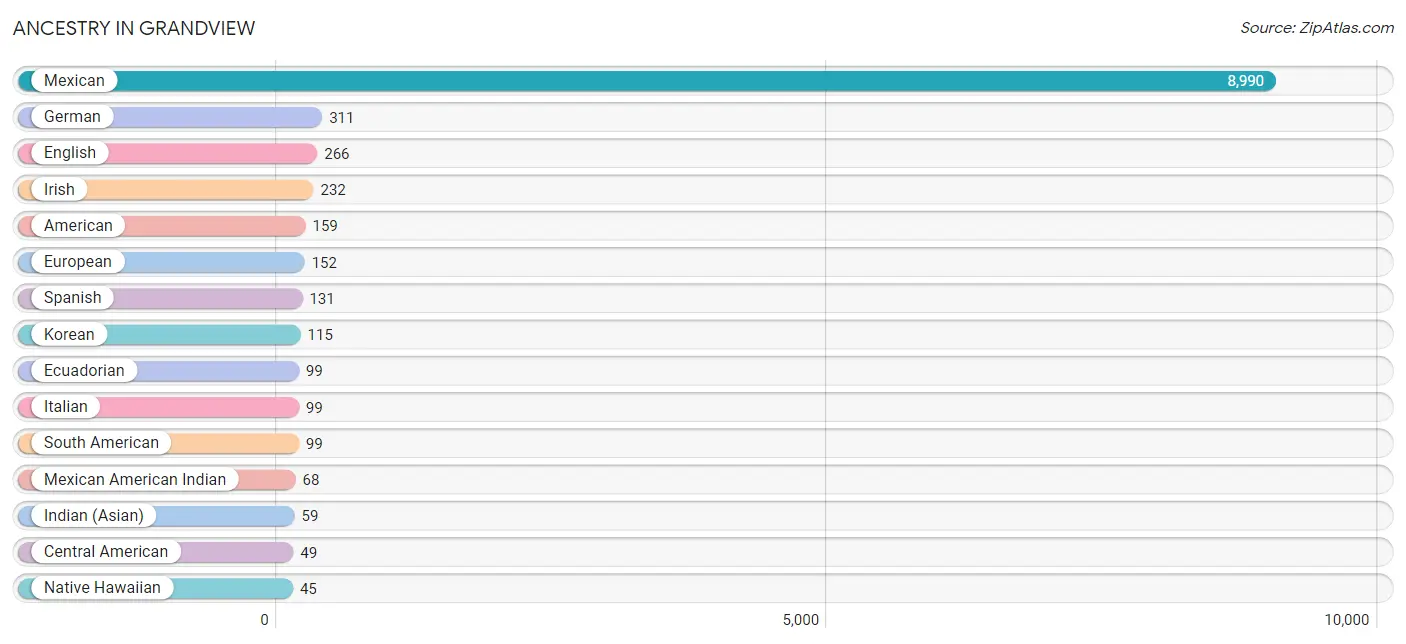
Ancestry in Grandview
The most populous ancestries reported in Grandview are Mexican (8,990 | 82.3%), German (311 | 2.9%), English (266 | 2.4%), Irish (232 | 2.1%), and American (159 | 1.5%), together accounting for 91.2% of all Grandview residents.
| Ancestry | # Population | % Population |
| American | 159 | 1.5% |
| Bhutanese | 8 | 0.1% |
| British | 18 | 0.2% |
| Canadian | 15 | 0.1% |
| Central American | 49 | 0.4% |
| Cherokee | 38 | 0.4% |
| Chippewa | 1 | 0.0% |
| Cuban | 10 | 0.1% |
| Czechoslovakian | 15 | 0.1% |
| Danish | 25 | 0.2% |
| Dutch | 15 | 0.1% |
| Ecuadorian | 99 | 0.9% |
| English | 266 | 2.4% |
| European | 152 | 1.4% |
| French | 12 | 0.1% |
| French Canadian | 8 | 0.1% |
| German | 311 | 2.9% |
| Guatemalan | 19 | 0.2% |
| Indian (Asian) | 59 | 0.5% |
| Irish | 232 | 2.1% |
| Italian | 99 | 0.9% |
| Korean | 115 | 1.1% |
| Mexican | 8,990 | 82.3% |
| Mexican American Indian | 68 | 0.6% |
| Native Hawaiian | 45 | 0.4% |
| Norwegian | 42 | 0.4% |
| Polish | 15 | 0.1% |
| Salvadoran | 30 | 0.3% |
| Scandinavian | 10 | 0.1% |
| Scotch-Irish | 42 | 0.4% |
| Scottish | 22 | 0.2% |
| South American | 99 | 0.9% |
| Spaniard | 34 | 0.3% |
| Spanish | 131 | 1.2% |
| Sri Lankan | 5 | 0.1% |
| Swedish | 13 | 0.1% | View All 36 Rows |
Immigrants in Grandview
The most numerous immigrant groups reported in Grandview came from Latin America (3,193 | 29.2%), Central America (3,183 | 29.1%), Mexico (3,149 | 28.8%), Asia (52 | 0.5%), and Eastern Asia (27 | 0.3%), together accounting for 87.9% of all Grandview residents.
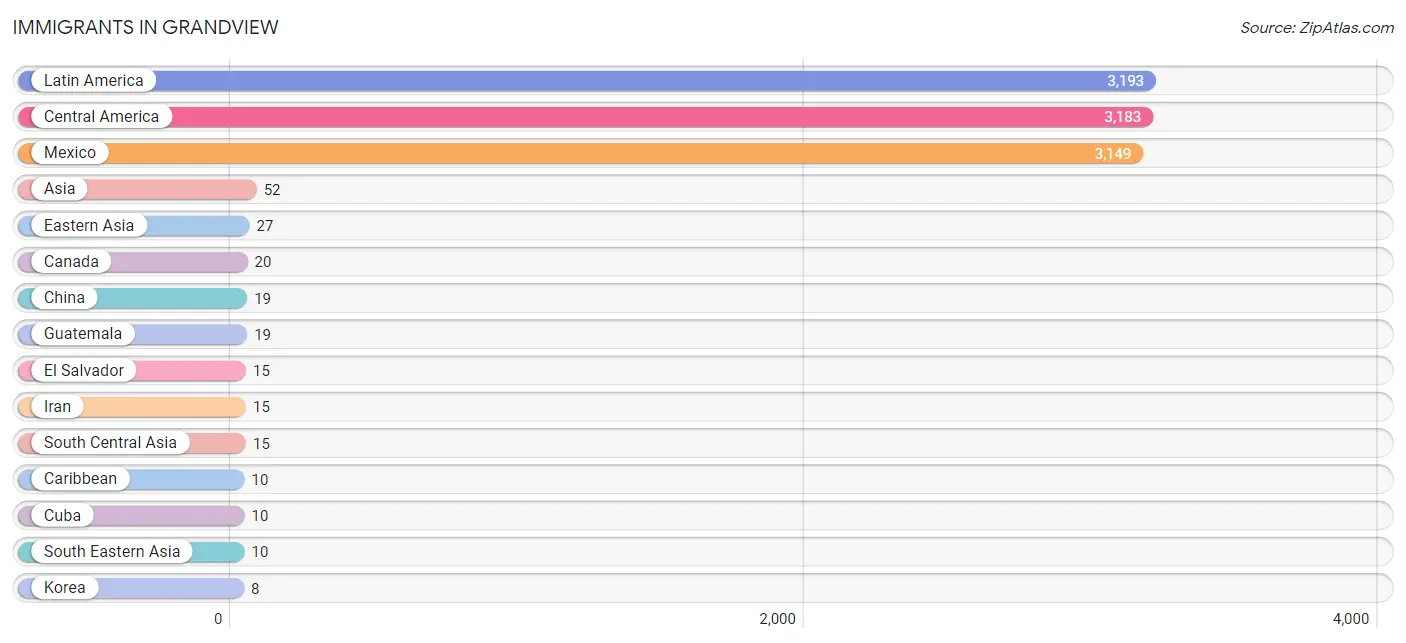
| Immigration Origin | # Population | % Population |
| Asia | 52 | 0.5% |
| Canada | 20 | 0.2% |
| Caribbean | 10 | 0.1% |
| Central America | 3,183 | 29.1% |
| China | 19 | 0.2% |
| Cuba | 10 | 0.1% |
| Eastern Asia | 27 | 0.3% |
| El Salvador | 15 | 0.1% |
| Guatemala | 19 | 0.2% |
| Hong Kong | 6 | 0.1% |
| Iran | 15 | 0.1% |
| Korea | 8 | 0.1% |
| Latin America | 3,193 | 29.2% |
| Mexico | 3,149 | 28.8% |
| Philippines | 5 | 0.1% |
| South Central Asia | 15 | 0.1% |
| South Eastern Asia | 10 | 0.1% |
| Vietnam | 5 | 0.1% | View All 18 Rows |
Sex and Age in Grandview
Sex and Age in Grandview
The most populous age groups in Grandview are 5 to 9 Years (627 | 11.8%) for men and Under 5 Years (737 | 13.2%) for women.
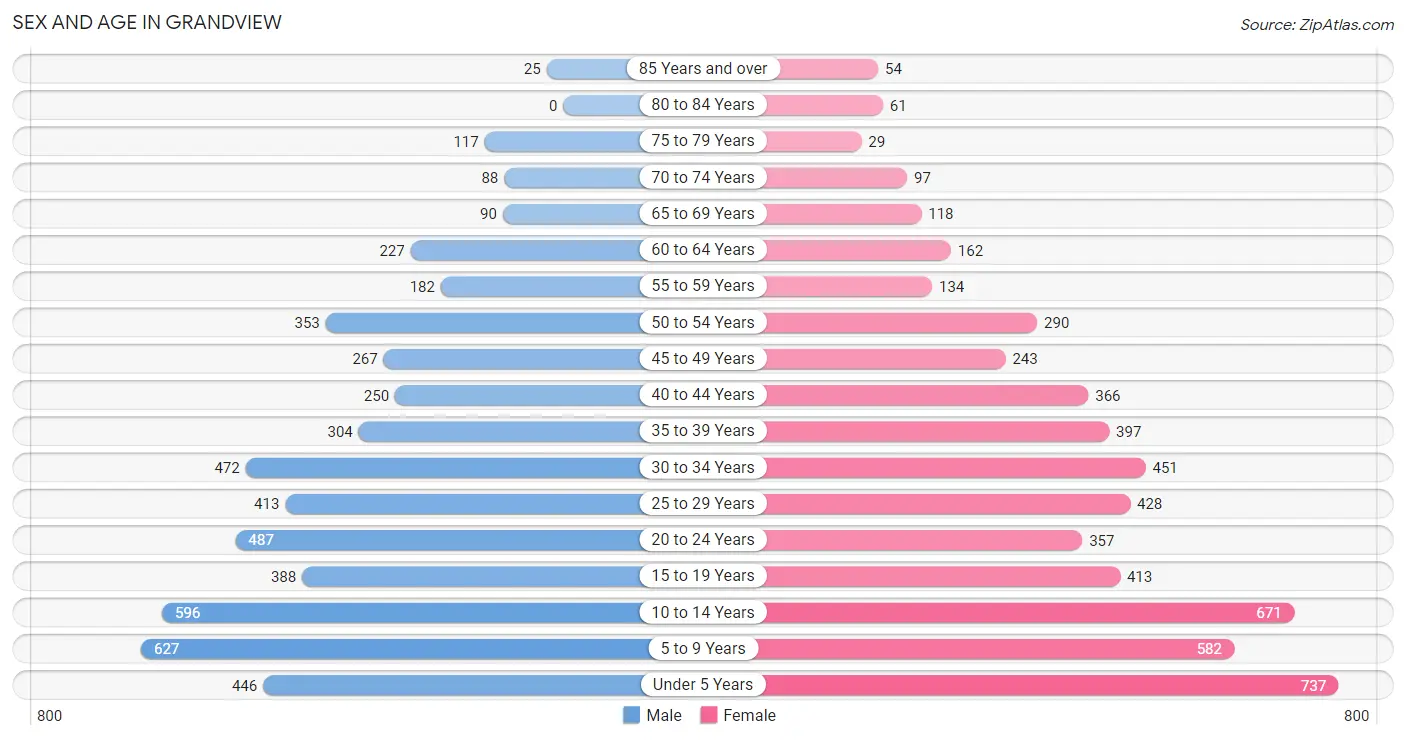
| Age Bracket | Male | Female |
| Under 5 Years | 446 (8.4%) | 737 (13.2%) |
| 5 to 9 Years | 627 (11.8%) | 582 (10.4%) |
| 10 to 14 Years | 596 (11.2%) | 671 (12.0%) |
| 15 to 19 Years | 388 (7.3%) | 413 (7.4%) |
| 20 to 24 Years | 487 (9.1%) | 357 (6.4%) |
| 25 to 29 Years | 413 (7.7%) | 428 (7.7%) |
| 30 to 34 Years | 472 (8.8%) | 451 (8.1%) |
| 35 to 39 Years | 304 (5.7%) | 397 (7.1%) |
| 40 to 44 Years | 250 (4.7%) | 366 (6.6%) |
| 45 to 49 Years | 267 (5.0%) | 243 (4.3%) |
| 50 to 54 Years | 353 (6.6%) | 290 (5.2%) |
| 55 to 59 Years | 182 (3.4%) | 134 (2.4%) |
| 60 to 64 Years | 227 (4.3%) | 162 (2.9%) |
| 65 to 69 Years | 90 (1.7%) | 118 (2.1%) |
| 70 to 74 Years | 88 (1.7%) | 97 (1.7%) |
| 75 to 79 Years | 117 (2.2%) | 29 (0.5%) |
| 80 to 84 Years | 0 (0.0%) | 61 (1.1%) |
| 85 Years and over | 25 (0.5%) | 54 (1.0%) |
| Total | 5,332 (100.0%) | 5,590 (100.0%) |
Families and Households in Grandview
Median Family Size in Grandview
The median family size in Grandview is 3.74 persons per family, with single male/father families (305 | 12.2%) accounting for the largest median family size of 4.04 persons per family. On the other hand, single female/mother families (831 | 33.3%) represent the smallest median family size with 3.40 persons per family.
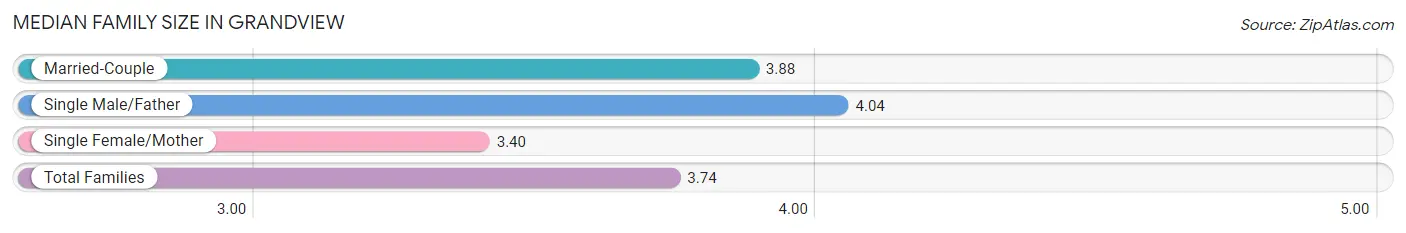
| Family Type | # Families | Family Size |
| Married-Couple | 1,363 (54.5%) | 3.88 |
| Single Male/Father | 305 (12.2%) | 4.04 |
| Single Female/Mother | 831 (33.3%) | 3.40 |
| Total Families | 2,499 (100.0%) | 3.74 |
Median Household Size in Grandview
The median household size in Grandview is 3.49 persons per household, with single male/father households (305 | 9.8%) accounting for the largest median household size of 4.94 persons per household. non-family households (617 | 19.8%) represent the smallest median household size with 1.38 persons per household.
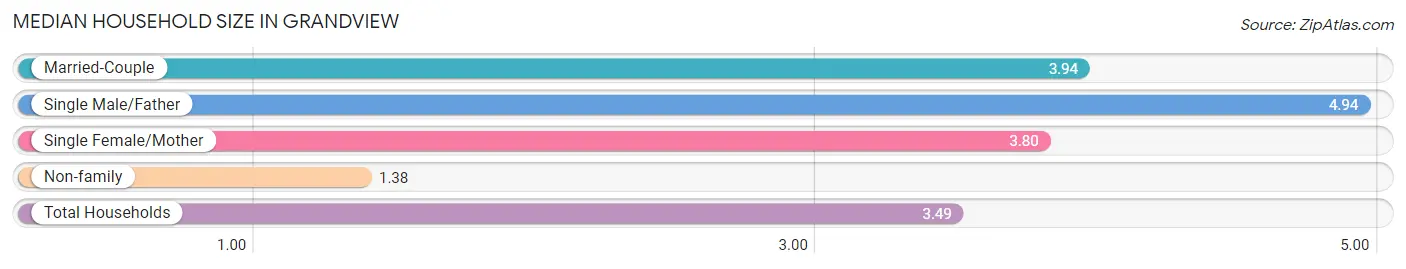
| Household Type | # Households | Household Size |
| Married-Couple | 1,363 (43.7%) | 3.94 |
| Single Male/Father | 305 (9.8%) | 4.94 |
| Single Female/Mother | 831 (26.7%) | 3.80 |
| Non-family | 617 (19.8%) | 1.38 |
| Total Households | 3,116 (100.0%) | 3.49 |
Household Size by Marriage Status in Grandview
Out of a total of 3,116 households in Grandview, 2,499 (80.2%) are family households, while 617 (19.8%) are nonfamily households. The most numerous type of family households are 3-person households, comprising 663, and the most common type of nonfamily households are 1-person households, comprising 431.
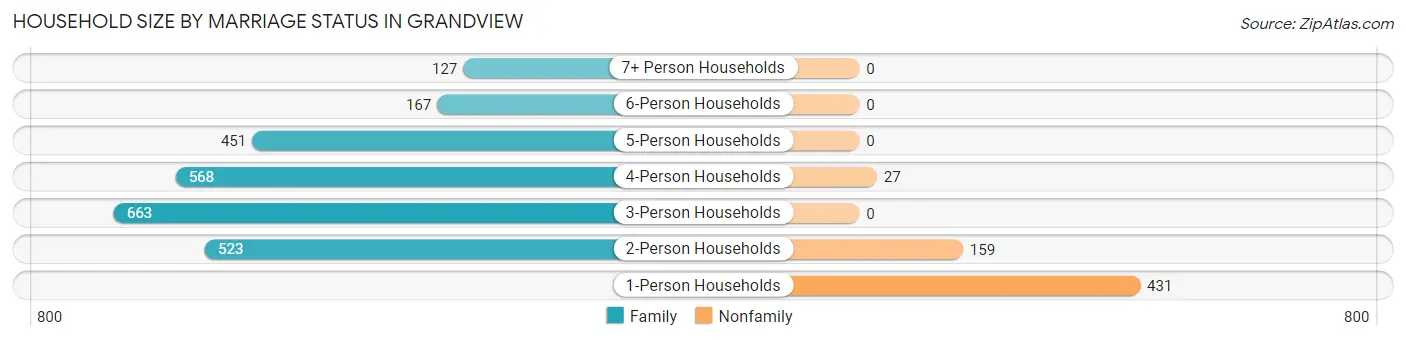
| Household Size | Family Households | Nonfamily Households |
| 1-Person Households | - | 431 (13.8%) |
| 2-Person Households | 523 (16.8%) | 159 (5.1%) |
| 3-Person Households | 663 (21.3%) | 0 (0.0%) |
| 4-Person Households | 568 (18.2%) | 27 (0.9%) |
| 5-Person Households | 451 (14.5%) | 0 (0.0%) |
| 6-Person Households | 167 (5.4%) | 0 (0.0%) |
| 7+ Person Households | 127 (4.1%) | 0 (0.0%) |
| Total | 2,499 (80.2%) | 617 (19.8%) |
Female Fertility in Grandview
Fertility by Age in Grandview
Average fertility rate in Grandview is 75.0 births per 1,000 women. Women in the age bracket of 20 to 34 years have the highest fertility rate with 125.0 births per 1,000 women. Women in the age bracket of 20 to 34 years acount for 74.9% of all women with births.
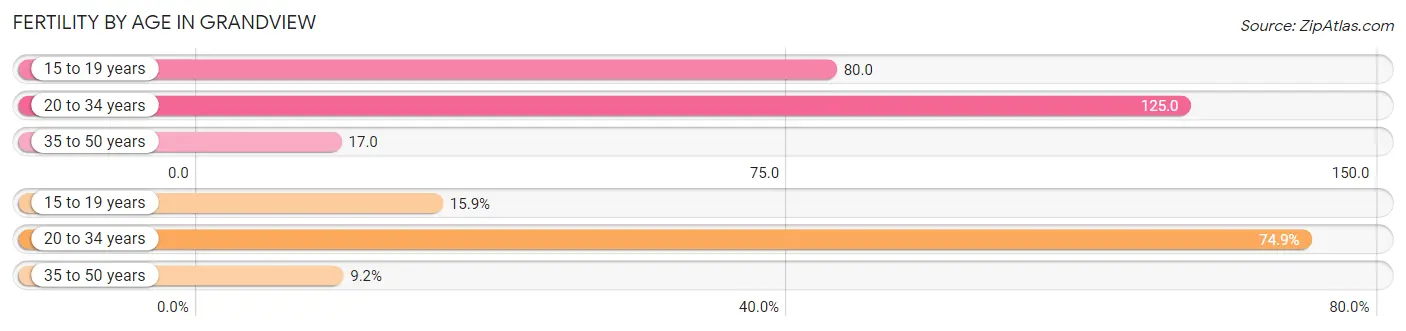
| Age Bracket | Women with Births | Births / 1,000 Women |
| 15 to 19 years | 33 (15.9%) | 80.0 |
| 20 to 34 years | 155 (74.9%) | 125.0 |
| 35 to 50 years | 19 (9.2%) | 17.0 |
| Total | 207 (100.0%) | 75.0 |
Fertility by Age by Marriage Status in Grandview
41.1% of women with births (207) in Grandview are married. The highest percentage of unmarried women with births falls into 15 to 19 years age bracket with 100.0% of them unmarried at the time of birth, while the lowest percentage of unmarried women with births belong to 35 to 50 years age bracket with 0.0% of them unmarried.
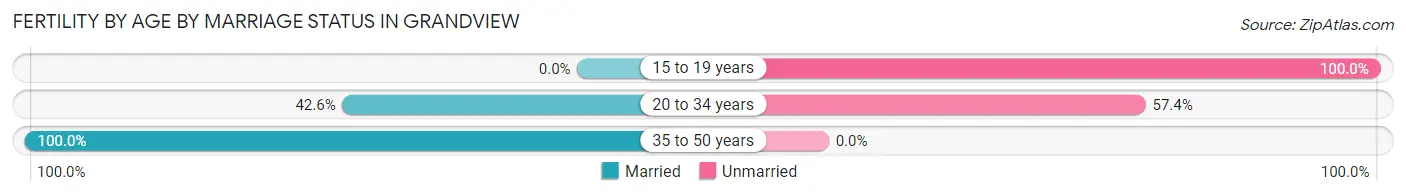
| Age Bracket | Married | Unmarried |
| 15 to 19 years | 0 (0.0%) | 33 (100.0%) |
| 20 to 34 years | 66 (42.6%) | 89 (57.4%) |
| 35 to 50 years | 19 (100.0%) | 0 (0.0%) |
| Total | 85 (41.1%) | 122 (58.9%) |
Fertility by Education in Grandview
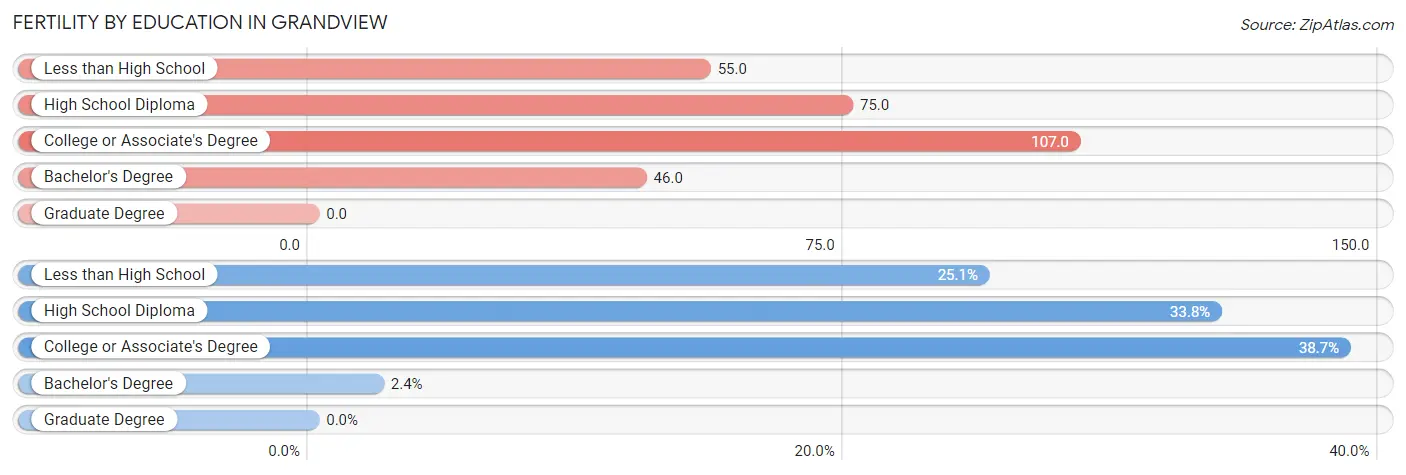
| Educational Attainment | Women with Births | Births / 1,000 Women |
| Less than High School | 52 (25.1%) | 55.0 |
| High School Diploma | 70 (33.8%) | 75.0 |
| College or Associate's Degree | 80 (38.7%) | 107.0 |
| Bachelor's Degree | 5 (2.4%) | 46.0 |
| Graduate Degree | 0 (0.0%) | 0.0 |
| Total | 207 (100.0%) | 75.0 |
Fertility by Education by Marriage Status in Grandview
58.9% of women with births in Grandview are unmarried. Women with the educational attainment of bachelor's degree are most likely to be married with 100.0% of them married at childbirth, while women with the educational attainment of college or associate's degree are least likely to be married with 81.2% of them unmarried at childbirth.
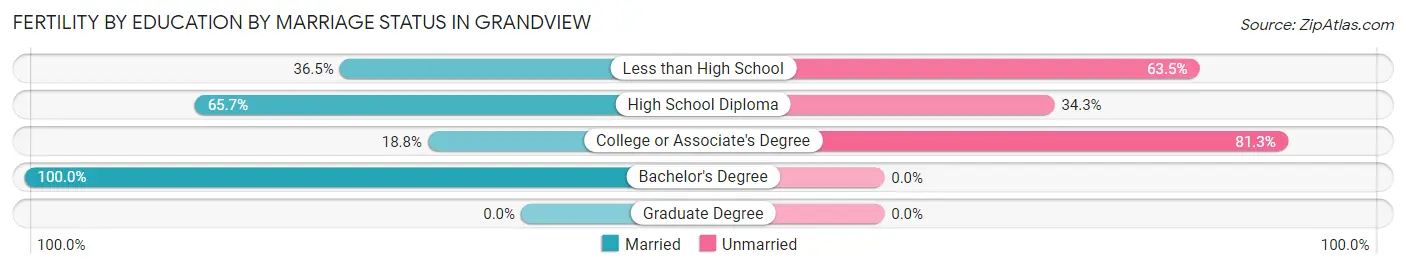
| Educational Attainment | Married | Unmarried |
| Less than High School | 19 (36.5%) | 33 (63.5%) |
| High School Diploma | 46 (65.7%) | 24 (34.3%) |
| College or Associate's Degree | 15 (18.8%) | 65 (81.2%) |
| Bachelor's Degree | 5 (100.0%) | 0 (0.0%) |
| Graduate Degree | 0 (0.0%) | 0 (0.0%) |
| Total | 85 (41.1%) | 122 (58.9%) |
Employment Characteristics in Grandview
Employment by Class of Employer in Grandview
Among the 4,683 employed individuals in Grandview, private company employees (3,782 | 80.8%), not-for-profit organizations (409 | 8.7%), and self-employed (not incorporated) (137 | 2.9%) make up the most common classes of employment.
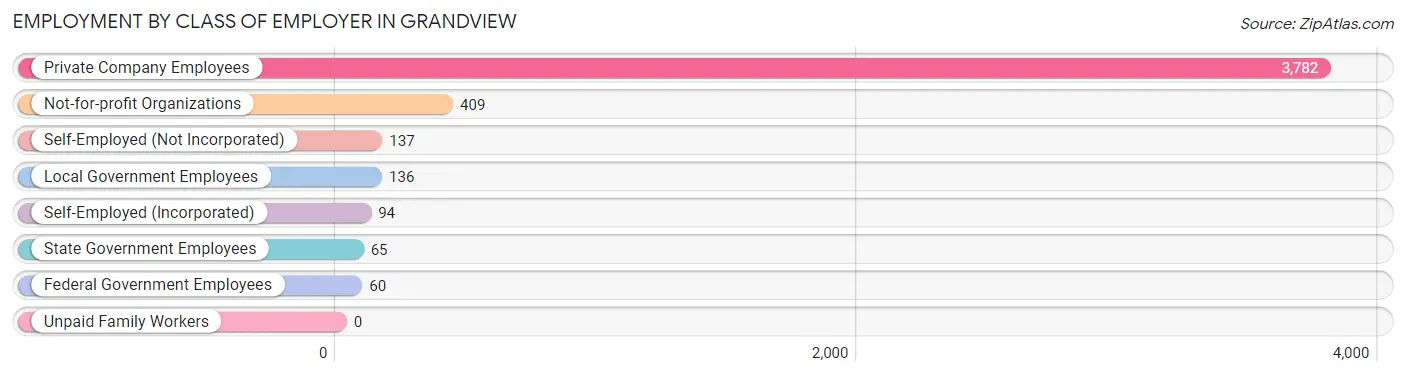
| Employer Class | # Employees | % Employees |
| Private Company Employees | 3,782 | 80.8% |
| Self-Employed (Incorporated) | 94 | 2.0% |
| Self-Employed (Not Incorporated) | 137 | 2.9% |
| Not-for-profit Organizations | 409 | 8.7% |
| Local Government Employees | 136 | 2.9% |
| State Government Employees | 65 | 1.4% |
| Federal Government Employees | 60 | 1.3% |
| Unpaid Family Workers | 0 | 0.0% |
| Total | 4,683 | 100.0% |
Employment Status by Age in Grandview
According to the labor force statistics for Grandview, out of the total population over 16 years of age (6,860), 74.4% or 5,104 individuals are in the labor force, with 4.3% or 219 of them unemployed. The age group with the highest labor force participation rate is 25 to 29 years, with 89.7% or 754 individuals in the labor force. Within the labor force, the 45 to 54 years age range has the highest percentage of unemployed individuals, with 12.7% or 109 of them being unemployed.
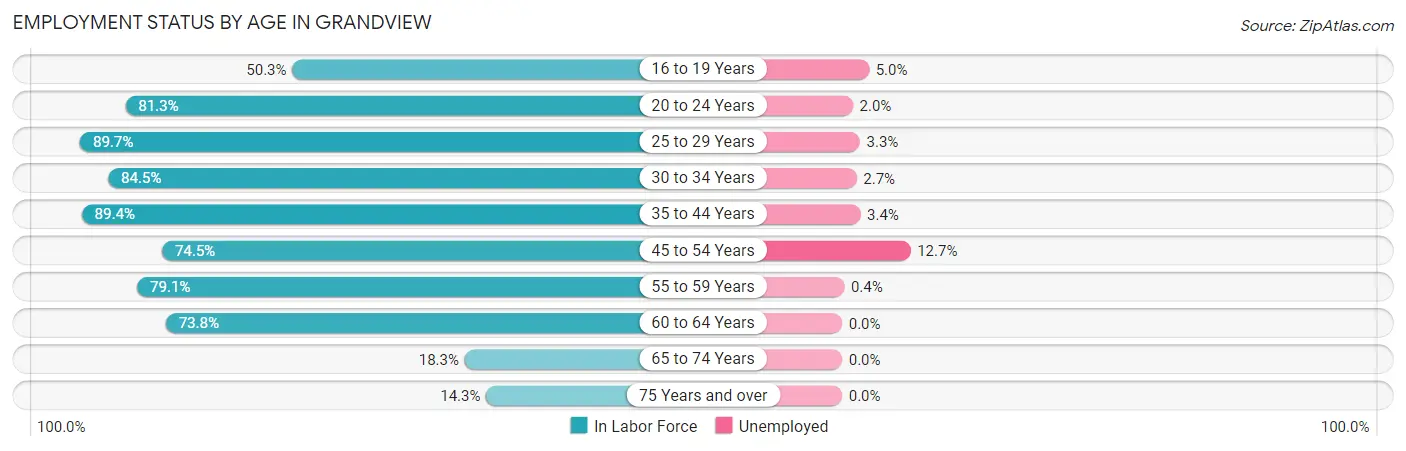
| Age Bracket | In Labor Force | Unemployed |
| 16 to 19 Years | 200 (50.3%) | 10 (5.0%) |
| 20 to 24 Years | 686 (81.3%) | 14 (2.0%) |
| 25 to 29 Years | 754 (89.7%) | 25 (3.3%) |
| 30 to 34 Years | 780 (84.5%) | 21 (2.7%) |
| 35 to 44 Years | 1,177 (89.4%) | 40 (3.4%) |
| 45 to 54 Years | 859 (74.5%) | 109 (12.7%) |
| 55 to 59 Years | 250 (79.1%) | 1 (0.4%) |
| 60 to 64 Years | 287 (73.8%) | 0 (0.0%) |
| 65 to 74 Years | 72 (18.3%) | 0 (0.0%) |
| 75 Years and over | 41 (14.3%) | 0 (0.0%) |
| Total | 5,104 (74.4%) | 219 (4.3%) |
Employment Status by Educational Attainment in Grandview
According to labor force statistics for Grandview, 83.2% of individuals (4,109) out of the total population between 25 and 64 years of age (4,939) are in the labor force, with 4.8% or 197 of them being unemployed. The group with the highest labor force participation rate are those with the educational attainment of high school diploma, with 89.0% or 1,711 individuals in the labor force. Within the labor force, individuals with less than high school education have the highest percentage of unemployment, with 6.1% or 85 of them being unemployed.
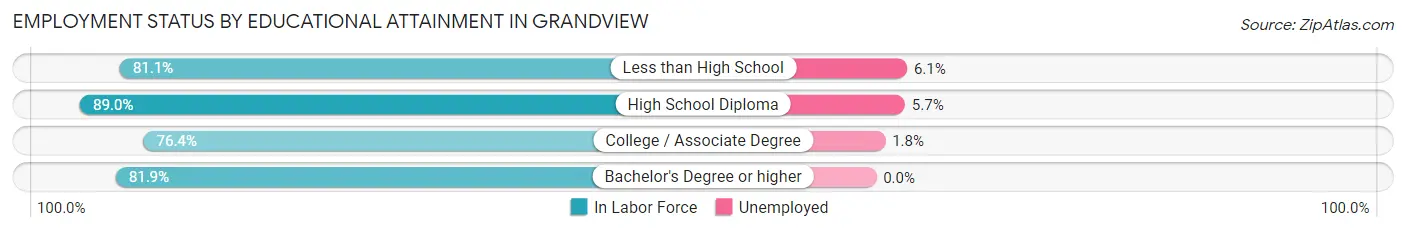
| Educational Attainment | In Labor Force | Unemployed |
| Less than High School | 1,387 (81.1%) | 104 (6.1%) |
| High School Diploma | 1,711 (89.0%) | 110 (5.7%) |
| College / Associate Degree | 838 (76.4%) | 20 (1.8%) |
| Bachelor's Degree or higher | 172 (81.9%) | 0 (0.0%) |
| Total | 4,109 (83.2%) | 237 (4.8%) |
Employment Occupations by Sex in Grandview
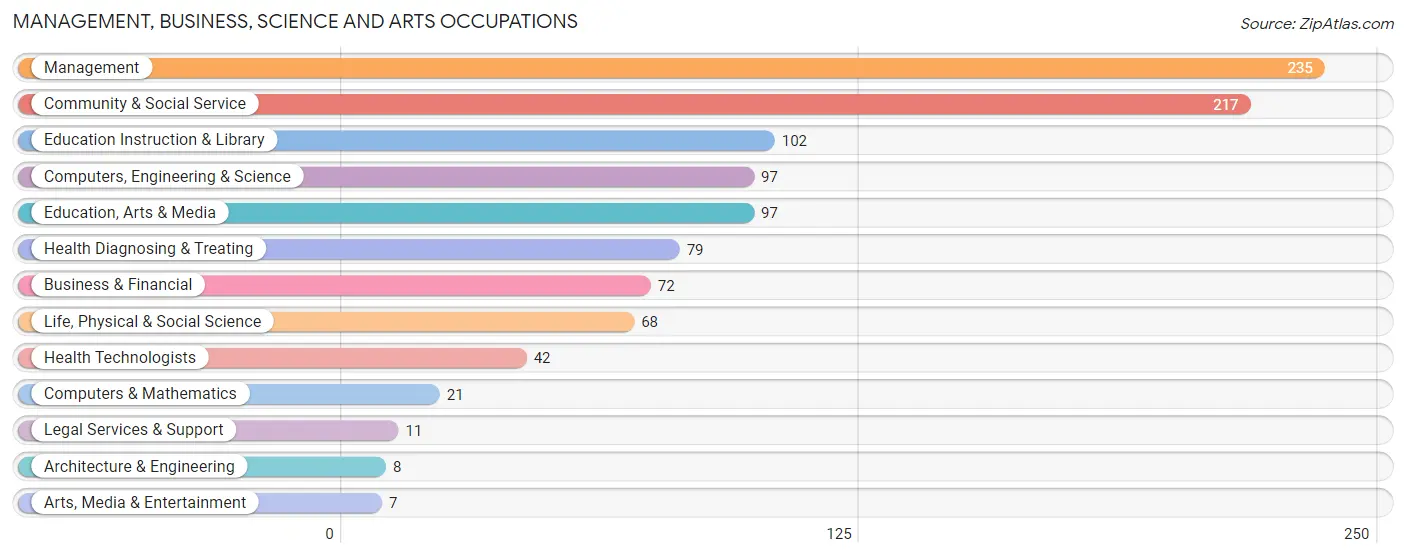
Management, Business, Science and Arts Occupations
The most common Management, Business, Science and Arts occupations in Grandview are Management (235 | 4.8%), Community & Social Service (217 | 4.4%), Education Instruction & Library (102 | 2.1%), Computers, Engineering & Science (97 | 2.0%), and Education, Arts & Media (97 | 2.0%).
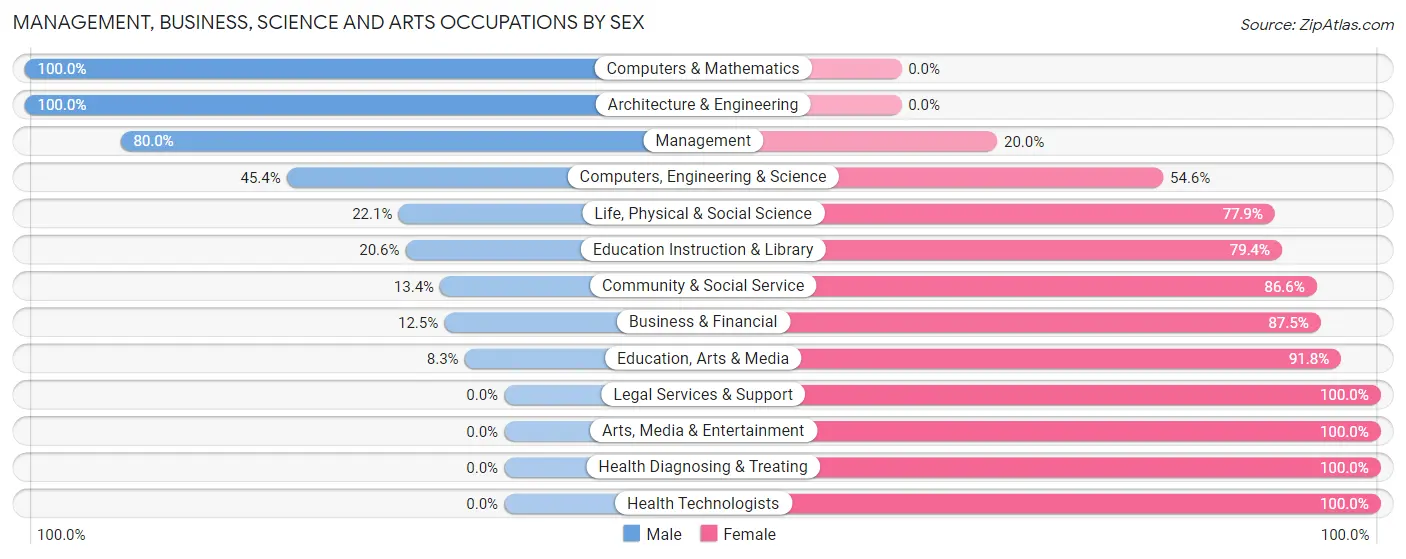
Management, Business, Science and Arts Occupations by Sex
Within the Management, Business, Science and Arts occupations in Grandview, the most male-oriented occupations are Computers & Mathematics (100.0%), Architecture & Engineering (100.0%), and Management (80.0%), while the most female-oriented occupations are Legal Services & Support (100.0%), Arts, Media & Entertainment (100.0%), and Health Diagnosing & Treating (100.0%).
| Occupation | Male | Female |
| Management | 188 (80.0%) | 47 (20.0%) |
| Business & Financial | 9 (12.5%) | 63 (87.5%) |
| Computers, Engineering & Science | 44 (45.4%) | 53 (54.6%) |
| Computers & Mathematics | 21 (100.0%) | 0 (0.0%) |
| Architecture & Engineering | 8 (100.0%) | 0 (0.0%) |
| Life, Physical & Social Science | 15 (22.1%) | 53 (77.9%) |
| Community & Social Service | 29 (13.4%) | 188 (86.6%) |
| Education, Arts & Media | 8 (8.3%) | 89 (91.7%) |
| Legal Services & Support | 0 (0.0%) | 11 (100.0%) |
| Education Instruction & Library | 21 (20.6%) | 81 (79.4%) |
| Arts, Media & Entertainment | 0 (0.0%) | 7 (100.0%) |
| Health Diagnosing & Treating | 0 (0.0%) | 79 (100.0%) |
| Health Technologists | 0 (0.0%) | 42 (100.0%) |
| Total (Category) | 270 (38.6%) | 430 (61.4%) |
| Total (Overall) | 2,506 (51.3%) | 2,381 (48.7%) |
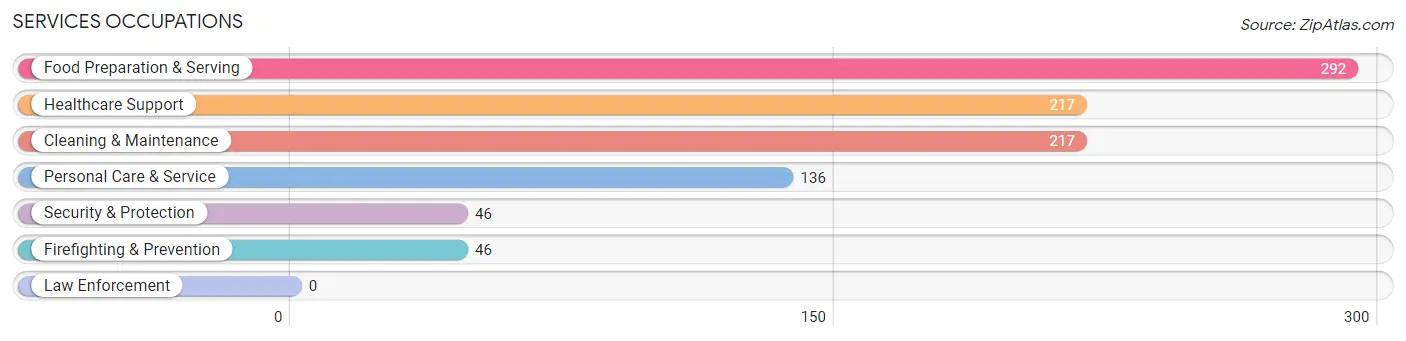
Services Occupations
The most common Services occupations in Grandview are Food Preparation & Serving (292 | 6.0%), Healthcare Support (217 | 4.4%), Cleaning & Maintenance (217 | 4.4%), Personal Care & Service (136 | 2.8%), and Security & Protection (46 | 0.9%).
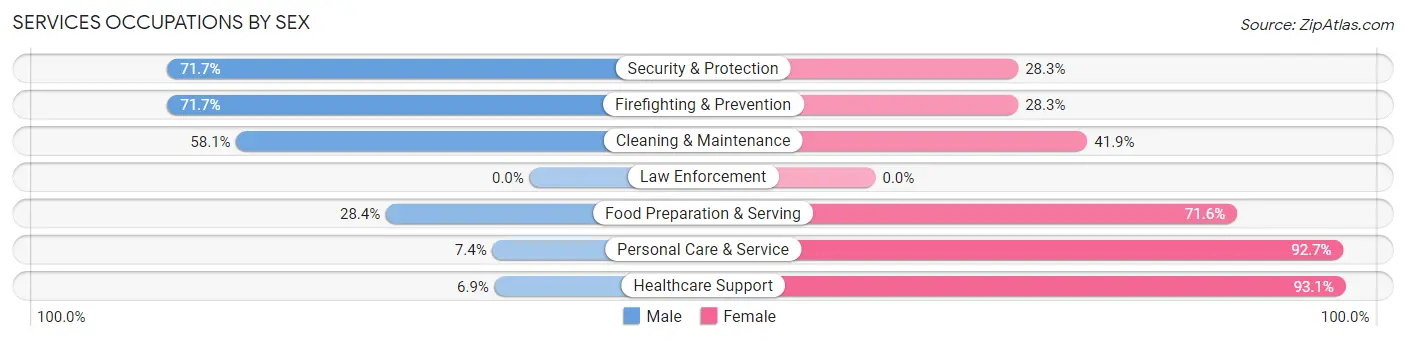
Services Occupations by Sex
Within the Services occupations in Grandview, the most male-oriented occupations are Security & Protection (71.7%), Firefighting & Prevention (71.7%), and Cleaning & Maintenance (58.1%), while the most female-oriented occupations are Healthcare Support (93.1%), Personal Care & Service (92.6%), and Food Preparation & Serving (71.6%).
| Occupation | Male | Female |
| Healthcare Support | 15 (6.9%) | 202 (93.1%) |
| Security & Protection | 33 (71.7%) | 13 (28.3%) |
| Firefighting & Prevention | 33 (71.7%) | 13 (28.3%) |
| Law Enforcement | 0 (0.0%) | 0 (0.0%) |
| Food Preparation & Serving | 83 (28.4%) | 209 (71.6%) |
| Cleaning & Maintenance | 126 (58.1%) | 91 (41.9%) |
| Personal Care & Service | 10 (7.3%) | 126 (92.6%) |
| Total (Category) | 267 (29.4%) | 641 (70.6%) |
| Total (Overall) | 2,506 (51.3%) | 2,381 (48.7%) |
Sales and Office Occupations
The most common Sales and Office occupations in Grandview are Sales & Related (403 | 8.3%), and Office & Administration (360 | 7.4%).

Sales and Office Occupations by Sex

| Occupation | Male | Female |
| Sales & Related | 160 (39.7%) | 243 (60.3%) |
| Office & Administration | 20 (5.6%) | 340 (94.4%) |
| Total (Category) | 180 (23.6%) | 583 (76.4%) |
| Total (Overall) | 2,506 (51.3%) | 2,381 (48.7%) |
Natural Resources, Construction and Maintenance Occupations
The most common Natural Resources, Construction and Maintenance occupations in Grandview are Farming, Fishing & Forestry (1,335 | 27.3%), Construction & Extraction (149 | 3.0%), and Installation, Maintenance & Repair (120 | 2.5%).
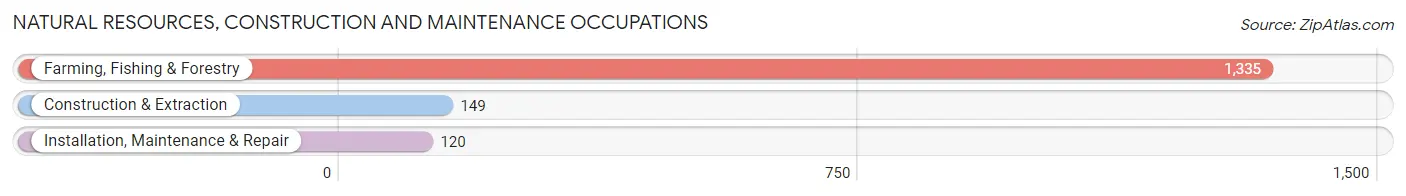
Natural Resources, Construction and Maintenance Occupations by Sex

| Occupation | Male | Female |
| Farming, Fishing & Forestry | 795 (59.6%) | 540 (40.5%) |
| Construction & Extraction | 149 (100.0%) | 0 (0.0%) |
| Installation, Maintenance & Repair | 120 (100.0%) | 0 (0.0%) |
| Total (Category) | 1,064 (66.3%) | 540 (33.7%) |
| Total (Overall) | 2,506 (51.3%) | 2,381 (48.7%) |
Production, Transportation and Moving Occupations
The most common Production, Transportation and Moving occupations in Grandview are Production (356 | 7.3%), Material Moving (332 | 6.8%), and Transportation (224 | 4.6%).
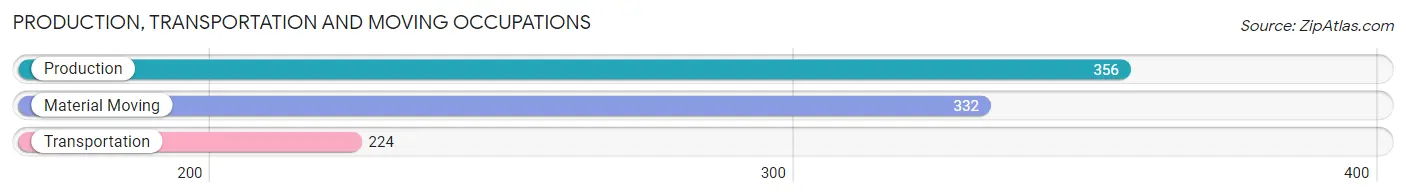
Production, Transportation and Moving Occupations by Sex
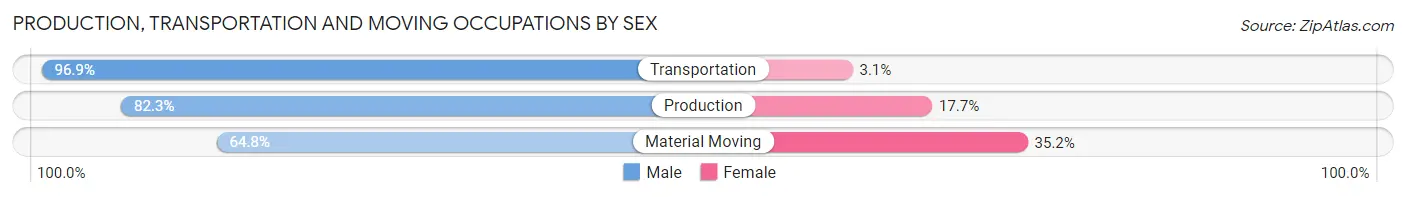
| Occupation | Male | Female |
| Production | 293 (82.3%) | 63 (17.7%) |
| Transportation | 217 (96.9%) | 7 (3.1%) |
| Material Moving | 215 (64.8%) | 117 (35.2%) |
| Total (Category) | 725 (79.5%) | 187 (20.5%) |
| Total (Overall) | 2,506 (51.3%) | 2,381 (48.7%) |
Employment Industries by Sex in Grandview
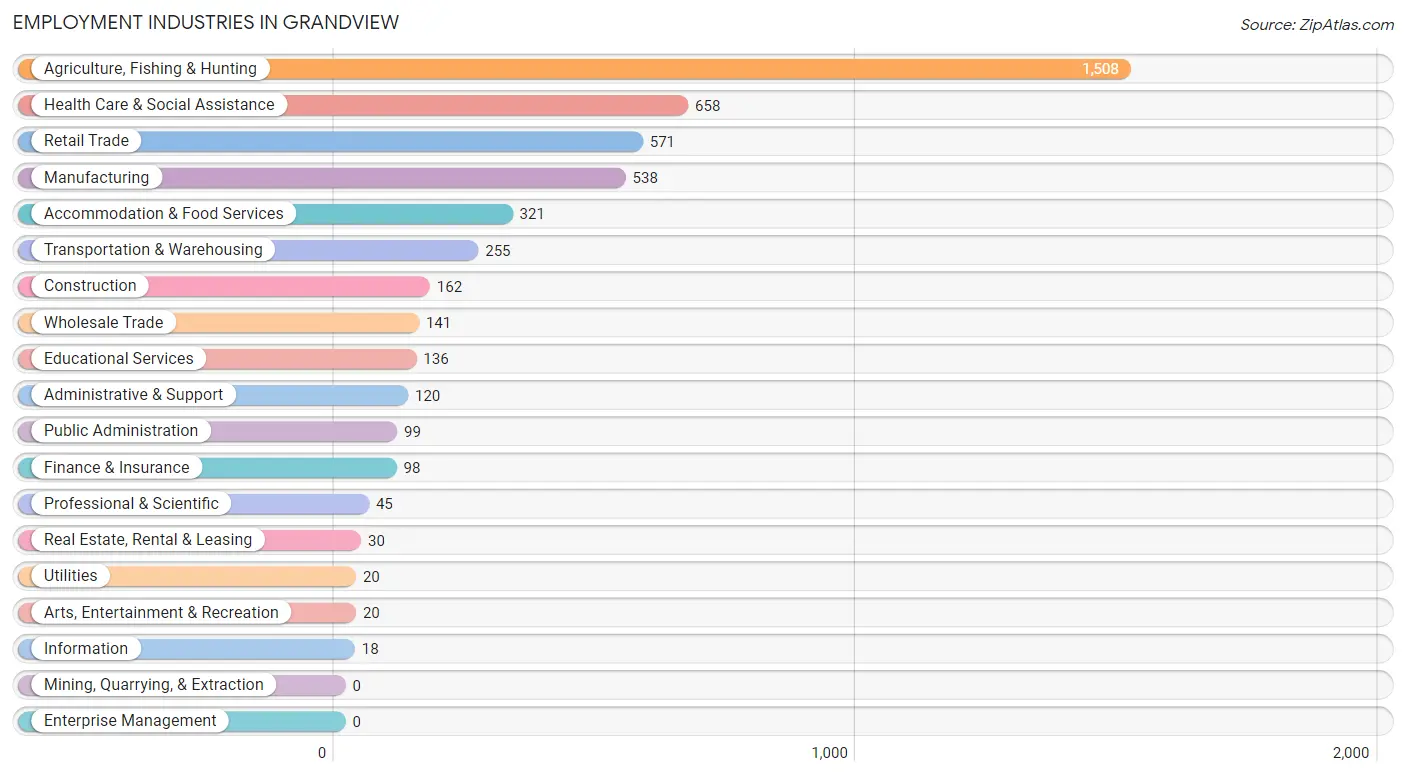
Employment Industries in Grandview
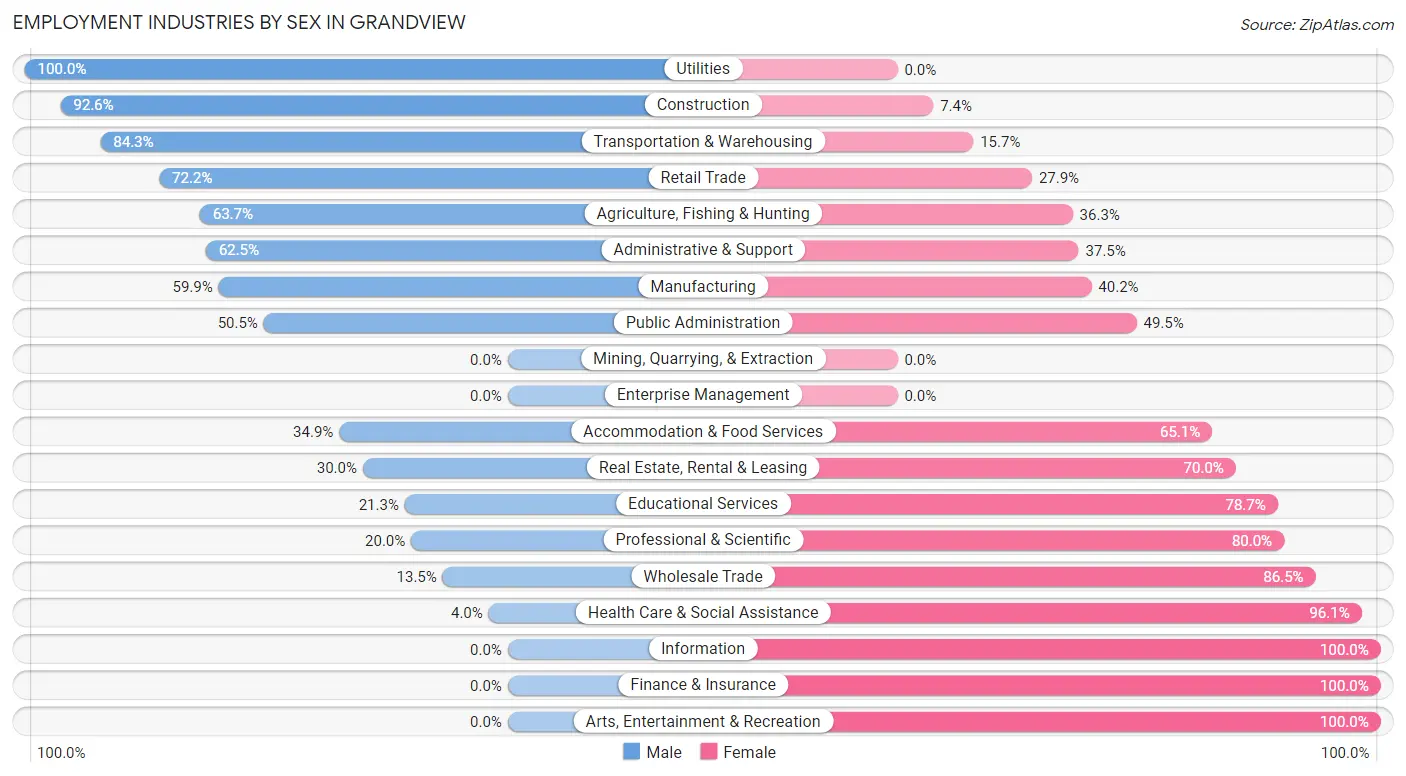
The major employment industries in Grandview include Agriculture, Fishing & Hunting (1,508 | 30.9%), Health Care & Social Assistance (658 | 13.5%), Retail Trade (571 | 11.7%), Manufacturing (538 | 11.0%), and Accommodation & Food Services (321 | 6.6%).
Employment Industries by Sex in Grandview
The Grandview industries that see more men than women are Utilities (100.0%), Construction (92.6%), and Transportation & Warehousing (84.3%), whereas the industries that tend to have a higher number of women are Information (100.0%), Finance & Insurance (100.0%), and Arts, Entertainment & Recreation (100.0%).
| Industry | Male | Female |
| Agriculture, Fishing & Hunting | 961 (63.7%) | 547 (36.3%) |
| Mining, Quarrying, & Extraction | 0 (0.0%) | 0 (0.0%) |
| Construction | 150 (92.6%) | 12 (7.4%) |
| Manufacturing | 322 (59.9%) | 216 (40.2%) |
| Wholesale Trade | 19 (13.5%) | 122 (86.5%) |
| Retail Trade | 412 (72.2%) | 159 (27.9%) |
| Transportation & Warehousing | 215 (84.3%) | 40 (15.7%) |
| Utilities | 20 (100.0%) | 0 (0.0%) |
| Information | 0 (0.0%) | 18 (100.0%) |
| Finance & Insurance | 0 (0.0%) | 98 (100.0%) |
| Real Estate, Rental & Leasing | 9 (30.0%) | 21 (70.0%) |
| Professional & Scientific | 9 (20.0%) | 36 (80.0%) |
| Enterprise Management | 0 (0.0%) | 0 (0.0%) |
| Administrative & Support | 75 (62.5%) | 45 (37.5%) |
| Educational Services | 29 (21.3%) | 107 (78.7%) |
| Health Care & Social Assistance | 26 (4.0%) | 632 (96.1%) |
| Arts, Entertainment & Recreation | 0 (0.0%) | 20 (100.0%) |
| Accommodation & Food Services | 112 (34.9%) | 209 (65.1%) |
| Public Administration | 50 (50.5%) | 49 (49.5%) |
| Total | 2,506 (51.3%) | 2,381 (48.7%) |
Education in Grandview
School Enrollment in Grandview
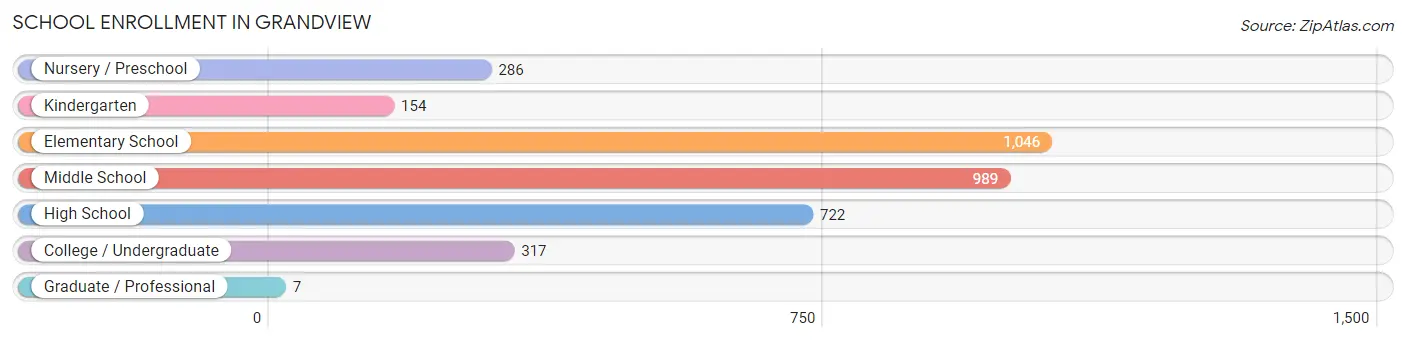
The most common levels of schooling among the 3,521 students in Grandview are elementary school (1,046 | 29.7%), middle school (989 | 28.1%), and high school (722 | 20.5%).
| School Level | # Students | % Students |
| Nursery / Preschool | 286 | 8.1% |
| Kindergarten | 154 | 4.4% |
| Elementary School | 1,046 | 29.7% |
| Middle School | 989 | 28.1% |
| High School | 722 | 20.5% |
| College / Undergraduate | 317 | 9.0% |
| Graduate / Professional | 7 | 0.2% |
| Total | 3,521 | 100.0% |
School Enrollment by Age by Funding Source in Grandview
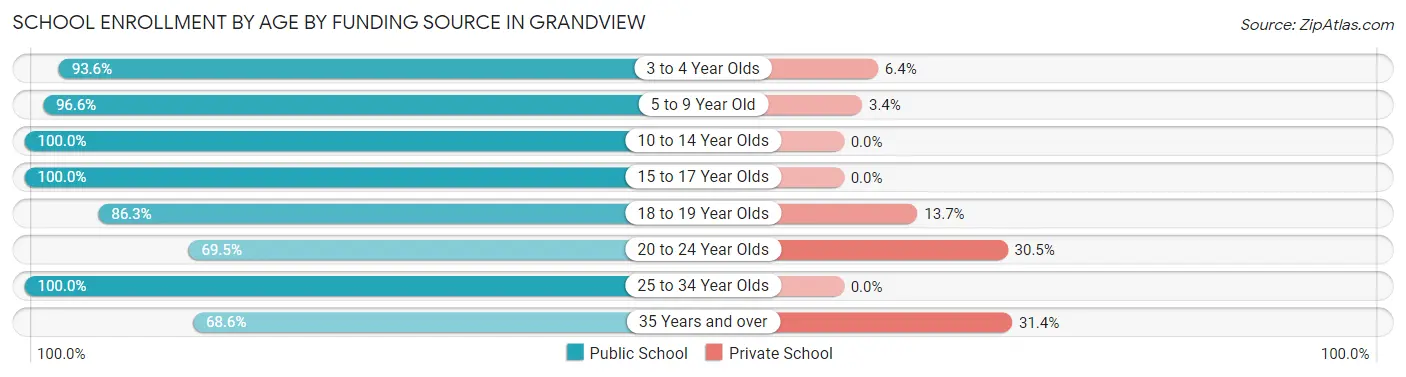
Out of a total of 3,521 students who are enrolled in schools in Grandview, 120 (3.4%) attend a private institution, while the remaining 3,401 (96.6%) are enrolled in public schools. The age group of 35 years and over has the highest likelihood of being enrolled in private schools, with 16 (31.4% in the age bracket) enrolled. Conversely, the age group of 10 to 14 year olds has the lowest likelihood of being enrolled in a private school, with 1,234 (100.0% in the age bracket) attending a public institution.
| Age Bracket | Public School | Private School |
| 3 to 4 Year Olds | 220 (93.6%) | 15 (6.4%) |
| 5 to 9 Year Old | 1,017 (96.6%) | 36 (3.4%) |
| 10 to 14 Year Olds | 1,234 (100.0%) | 0 (0.0%) |
| 15 to 17 Year Olds | 627 (100.0%) | 0 (0.0%) |
| 18 to 19 Year Olds | 88 (86.3%) | 14 (13.7%) |
| 20 to 24 Year Olds | 91 (69.5%) | 40 (30.5%) |
| 25 to 34 Year Olds | 88 (100.0%) | 0 (0.0%) |
| 35 Years and over | 35 (68.6%) | 16 (31.4%) |
| Total | 3,401 (96.6%) | 120 (3.4%) |
Educational Attainment by Field of Study in Grandview
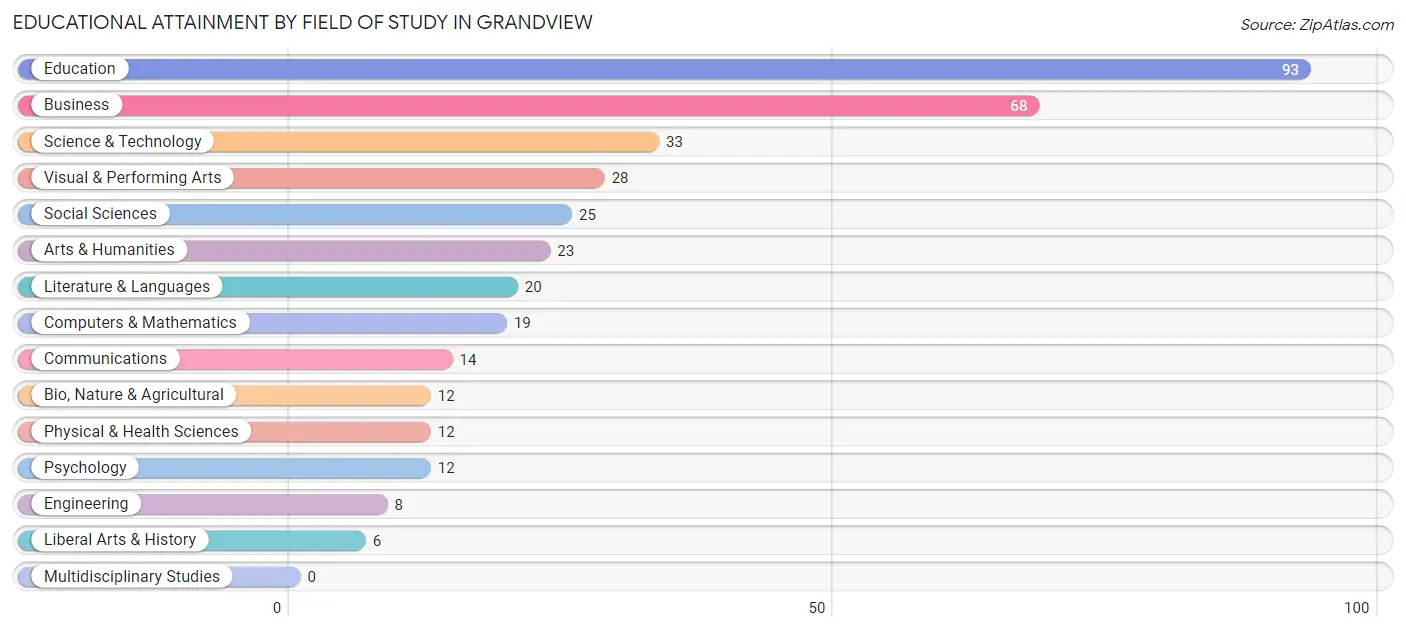
Education (93 | 24.9%), business (68 | 18.2%), science & technology (33 | 8.8%), visual & performing arts (28 | 7.5%), and social sciences (25 | 6.7%) are the most common fields of study among 373 individuals in Grandview who have obtained a bachelor's degree or higher.
| Field of Study | # Graduates | % Graduates |
| Computers & Mathematics | 19 | 5.1% |
| Bio, Nature & Agricultural | 12 | 3.2% |
| Physical & Health Sciences | 12 | 3.2% |
| Psychology | 12 | 3.2% |
| Social Sciences | 25 | 6.7% |
| Engineering | 8 | 2.1% |
| Multidisciplinary Studies | 0 | 0.0% |
| Science & Technology | 33 | 8.8% |
| Business | 68 | 18.2% |
| Education | 93 | 24.9% |
| Literature & Languages | 20 | 5.4% |
| Liberal Arts & History | 6 | 1.6% |
| Visual & Performing Arts | 28 | 7.5% |
| Communications | 14 | 3.7% |
| Arts & Humanities | 23 | 6.2% |
| Total | 373 | 100.0% |
Transportation & Commute in Grandview
Vehicle Availability by Sex in Grandview
The most prevalent vehicle ownership categories in Grandview are males with 2 vehicles (765, accounting for 32.4%) and females with 2 vehicles (864, making up 33.0%).
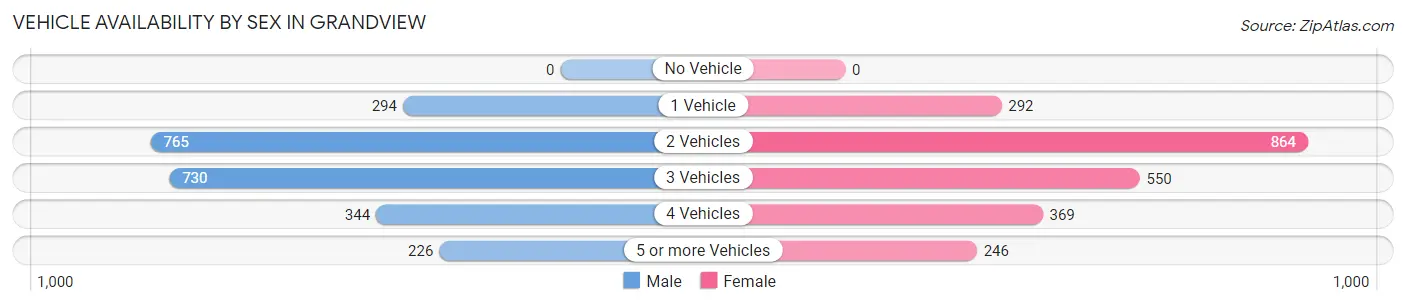
| Vehicles Available | Male | Female |
| No Vehicle | 0 (0.0%) | 0 (0.0%) |
| 1 Vehicle | 294 (12.5%) | 292 (12.6%) |
| 2 Vehicles | 765 (32.4%) | 864 (37.2%) |
| 3 Vehicles | 730 (30.9%) | 550 (23.7%) |
| 4 Vehicles | 344 (14.6%) | 369 (15.9%) |
| 5 or more Vehicles | 226 (9.6%) | 246 (10.6%) |
| Total | 2,359 (100.0%) | 2,321 (100.0%) |
Commute Time in Grandview
The most frequently occuring commute durations in Grandview are 15 to 19 minutes (1,218 commuters, 26.6%), 30 to 34 minutes (635 commuters, 13.8%), and 20 to 24 minutes (564 commuters, 12.3%).
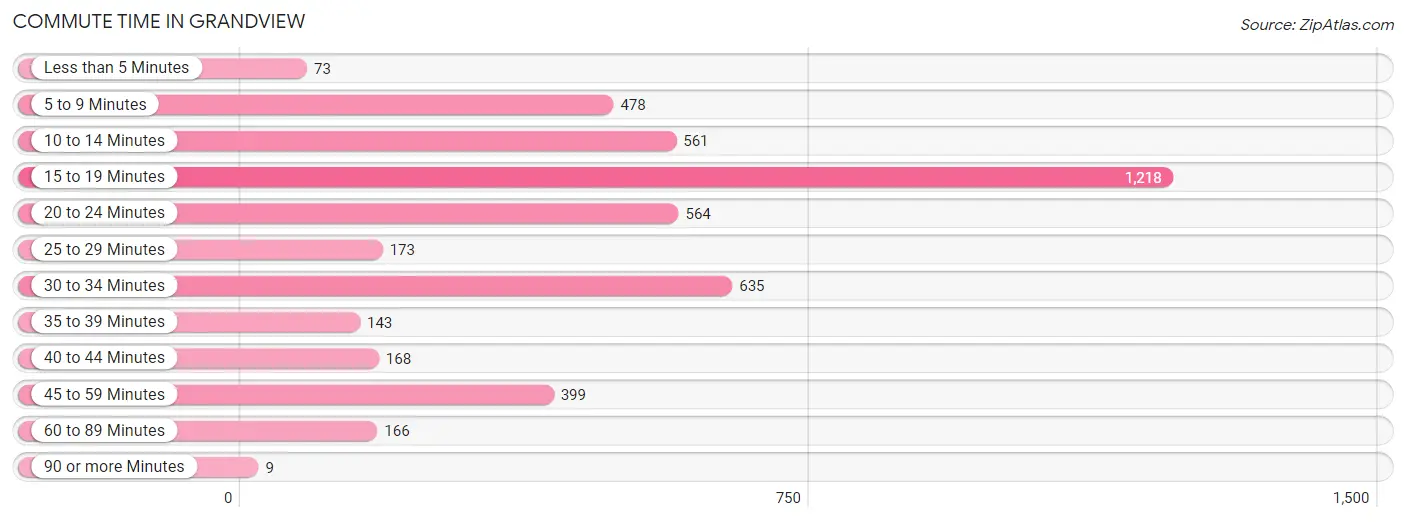
| Commute Time | # Commuters | % Commuters |
| Less than 5 Minutes | 73 | 1.6% |
| 5 to 9 Minutes | 478 | 10.4% |
| 10 to 14 Minutes | 561 | 12.2% |
| 15 to 19 Minutes | 1,218 | 26.6% |
| 20 to 24 Minutes | 564 | 12.3% |
| 25 to 29 Minutes | 173 | 3.8% |
| 30 to 34 Minutes | 635 | 13.8% |
| 35 to 39 Minutes | 143 | 3.1% |
| 40 to 44 Minutes | 168 | 3.7% |
| 45 to 59 Minutes | 399 | 8.7% |
| 60 to 89 Minutes | 166 | 3.6% |
| 90 or more Minutes | 9 | 0.2% |
Commute Time by Sex in Grandview
The most common commute times in Grandview are 15 to 19 minutes (537 commuters, 23.0%) for males and 15 to 19 minutes (681 commuters, 30.2%) for females.
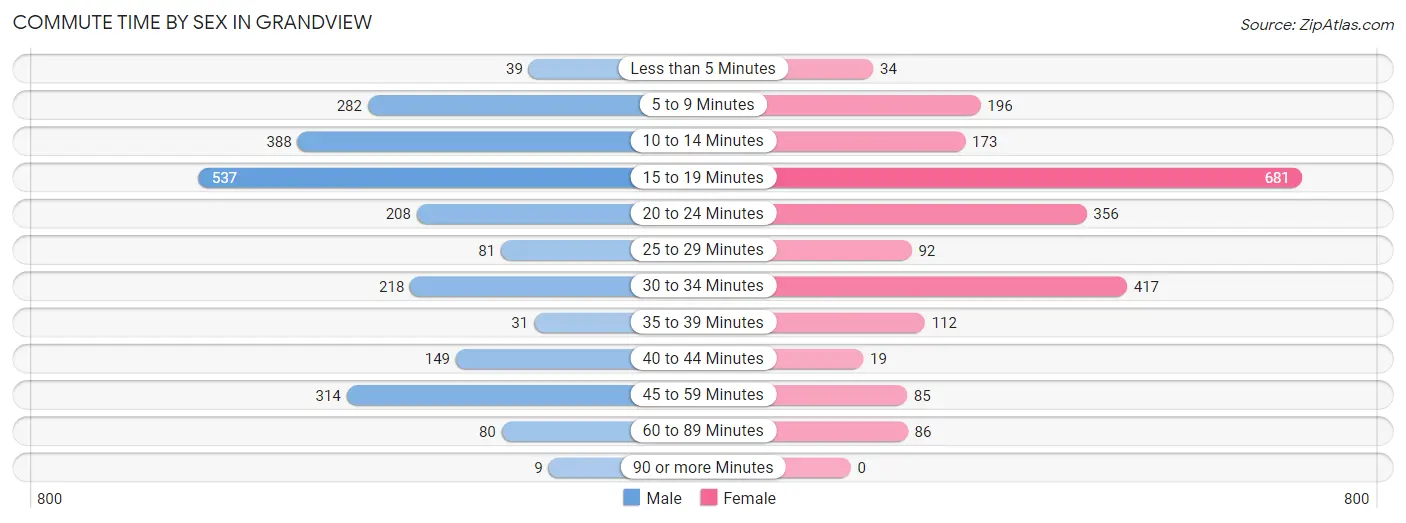
| Commute Time | Male | Female |
| Less than 5 Minutes | 39 (1.7%) | 34 (1.5%) |
| 5 to 9 Minutes | 282 (12.1%) | 196 (8.7%) |
| 10 to 14 Minutes | 388 (16.6%) | 173 (7.7%) |
| 15 to 19 Minutes | 537 (23.0%) | 681 (30.2%) |
| 20 to 24 Minutes | 208 (8.9%) | 356 (15.8%) |
| 25 to 29 Minutes | 81 (3.5%) | 92 (4.1%) |
| 30 to 34 Minutes | 218 (9.3%) | 417 (18.5%) |
| 35 to 39 Minutes | 31 (1.3%) | 112 (5.0%) |
| 40 to 44 Minutes | 149 (6.4%) | 19 (0.8%) |
| 45 to 59 Minutes | 314 (13.4%) | 85 (3.8%) |
| 60 to 89 Minutes | 80 (3.4%) | 86 (3.8%) |
| 90 or more Minutes | 9 (0.4%) | 0 (0.0%) |
Time of Departure to Work by Sex in Grandview
The most frequent times of departure to work in Grandview are 7:00 AM to 7:29 AM (369, 15.8%) for males and 7:30 AM to 7:59 AM (470, 20.9%) for females.
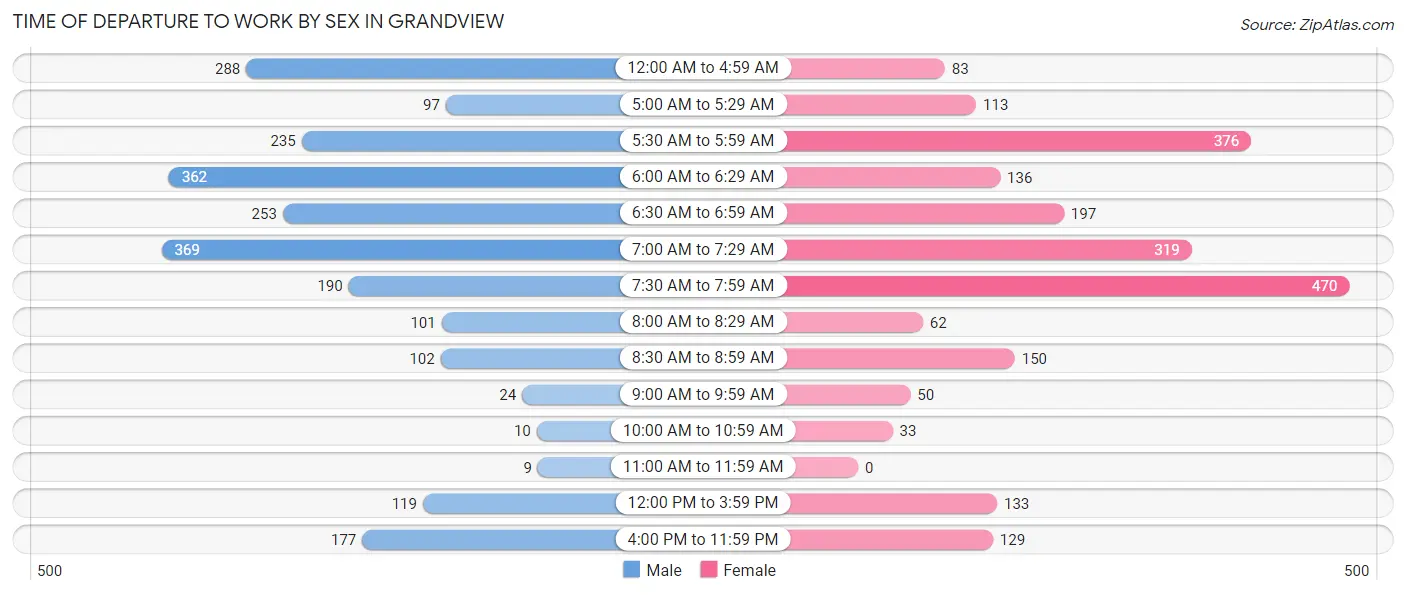
| Time of Departure | Male | Female |
| 12:00 AM to 4:59 AM | 288 (12.3%) | 83 (3.7%) |
| 5:00 AM to 5:29 AM | 97 (4.2%) | 113 (5.0%) |
| 5:30 AM to 5:59 AM | 235 (10.1%) | 376 (16.7%) |
| 6:00 AM to 6:29 AM | 362 (15.5%) | 136 (6.0%) |
| 6:30 AM to 6:59 AM | 253 (10.8%) | 197 (8.7%) |
| 7:00 AM to 7:29 AM | 369 (15.8%) | 319 (14.2%) |
| 7:30 AM to 7:59 AM | 190 (8.1%) | 470 (20.9%) |
| 8:00 AM to 8:29 AM | 101 (4.3%) | 62 (2.8%) |
| 8:30 AM to 8:59 AM | 102 (4.4%) | 150 (6.7%) |
| 9:00 AM to 9:59 AM | 24 (1.0%) | 50 (2.2%) |
| 10:00 AM to 10:59 AM | 10 (0.4%) | 33 (1.5%) |
| 11:00 AM to 11:59 AM | 9 (0.4%) | 0 (0.0%) |
| 12:00 PM to 3:59 PM | 119 (5.1%) | 133 (5.9%) |
| 4:00 PM to 11:59 PM | 177 (7.6%) | 129 (5.7%) |
| Total | 2,336 (100.0%) | 2,251 (100.0%) |
Housing Occupancy in Grandview
Occupancy by Ownership in Grandview
Of the total 3,116 dwellings in Grandview, owner-occupied units account for 1,729 (55.5%), while renter-occupied units make up 1,387 (44.5%).
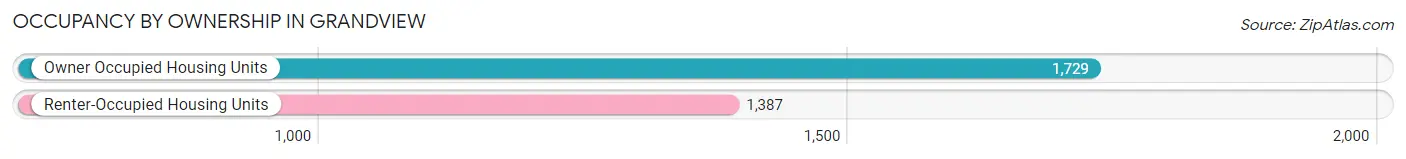
| Occupancy | # Housing Units | % Housing Units |
| Owner Occupied Housing Units | 1,729 | 55.5% |
| Renter-Occupied Housing Units | 1,387 | 44.5% |
| Total Occupied Housing Units | 3,116 | 100.0% |
Occupancy by Household Size in Grandview
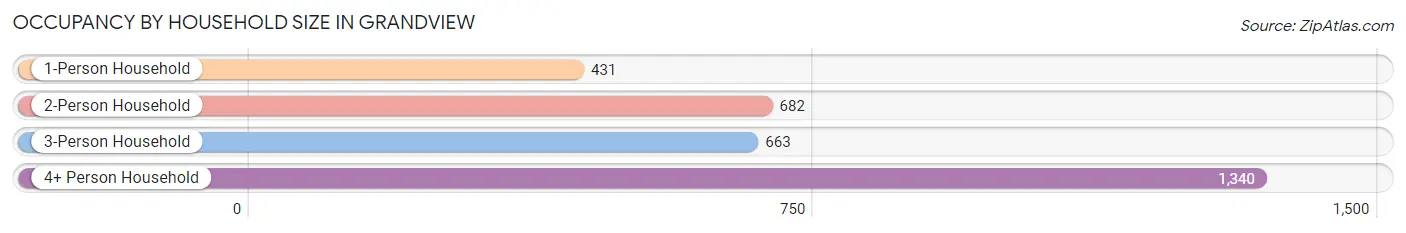
| Household Size | # Housing Units | % Housing Units |
| 1-Person Household | 431 | 13.8% |
| 2-Person Household | 682 | 21.9% |
| 3-Person Household | 663 | 21.3% |
| 4+ Person Household | 1,340 | 43.0% |
| Total Housing Units | 3,116 | 100.0% |
Occupancy by Ownership by Household Size in Grandview
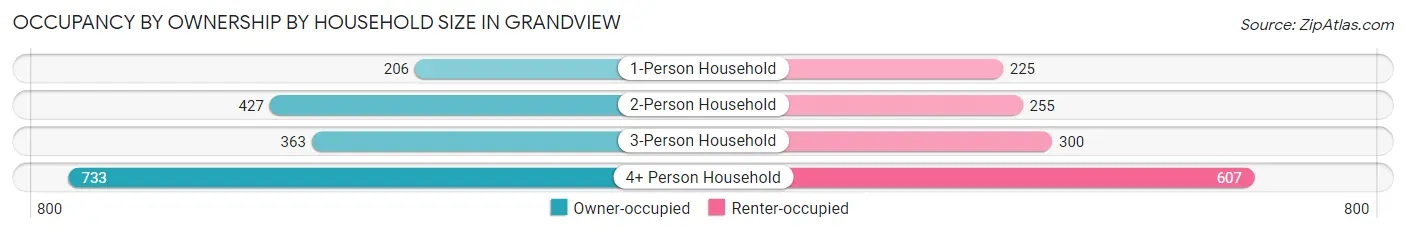
| Household Size | Owner-occupied | Renter-occupied |
| 1-Person Household | 206 (47.8%) | 225 (52.2%) |
| 2-Person Household | 427 (62.6%) | 255 (37.4%) |
| 3-Person Household | 363 (54.7%) | 300 (45.3%) |
| 4+ Person Household | 733 (54.7%) | 607 (45.3%) |
| Total Housing Units | 1,729 (55.5%) | 1,387 (44.5%) |
Occupancy by Educational Attainment in Grandview
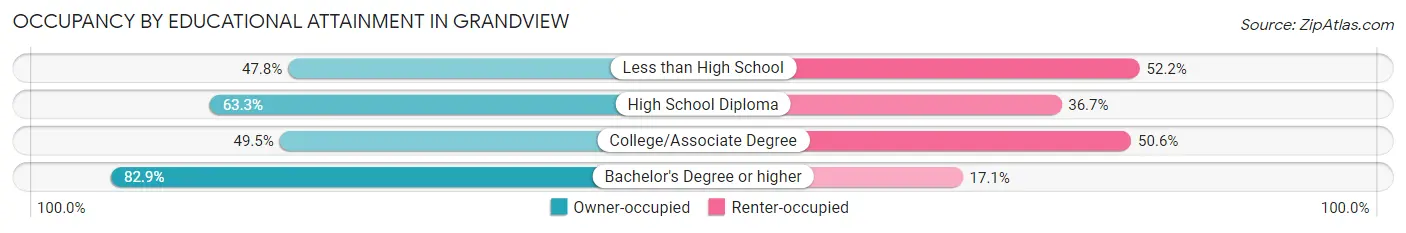
| Household Size | Owner-occupied | Renter-occupied |
| Less than High School | 503 (47.8%) | 550 (52.2%) |
| High School Diploma | 674 (63.3%) | 391 (36.7%) |
| College/Associate Degree | 407 (49.4%) | 416 (50.5%) |
| Bachelor's Degree or higher | 145 (82.9%) | 30 (17.1%) |
Occupancy by Age of Householder in Grandview
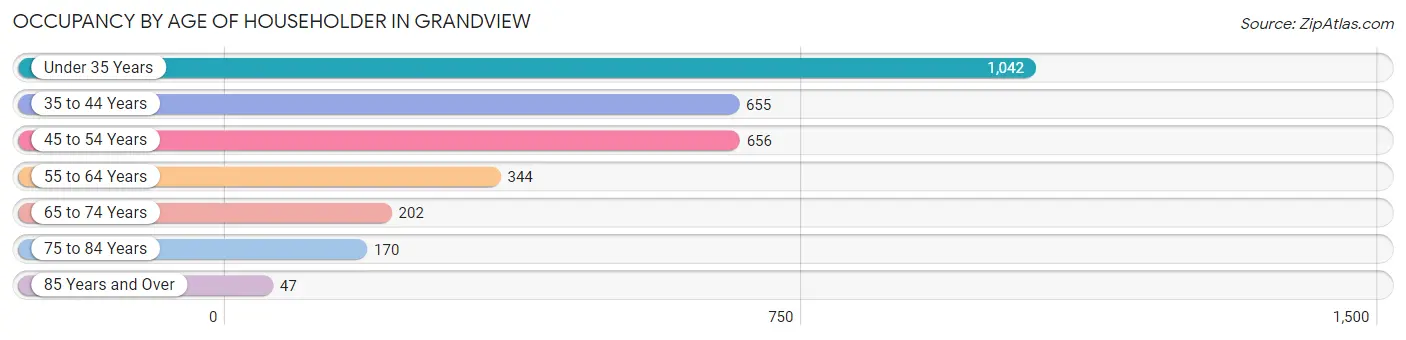
| Age Bracket | # Households | % Households |
| Under 35 Years | 1,042 | 33.4% |
| 35 to 44 Years | 655 | 21.0% |
| 45 to 54 Years | 656 | 21.0% |
| 55 to 64 Years | 344 | 11.0% |
| 65 to 74 Years | 202 | 6.5% |
| 75 to 84 Years | 170 | 5.5% |
| 85 Years and Over | 47 | 1.5% |
| Total | 3,116 | 100.0% |
Housing Finances in Grandview
Median Income by Occupancy in Grandview
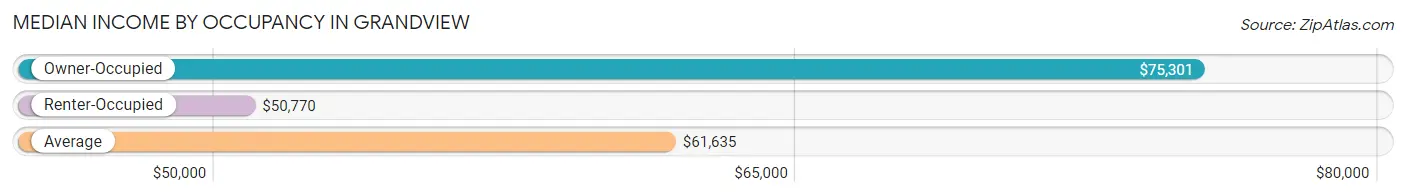
| Occupancy Type | # Households | Median Income |
| Owner-Occupied | 1,729 (55.5%) | $75,301 |
| Renter-Occupied | 1,387 (44.5%) | $50,770 |
| Average | 3,116 (100.0%) | $61,635 |
Occupancy by Householder Income Bracket in Grandview
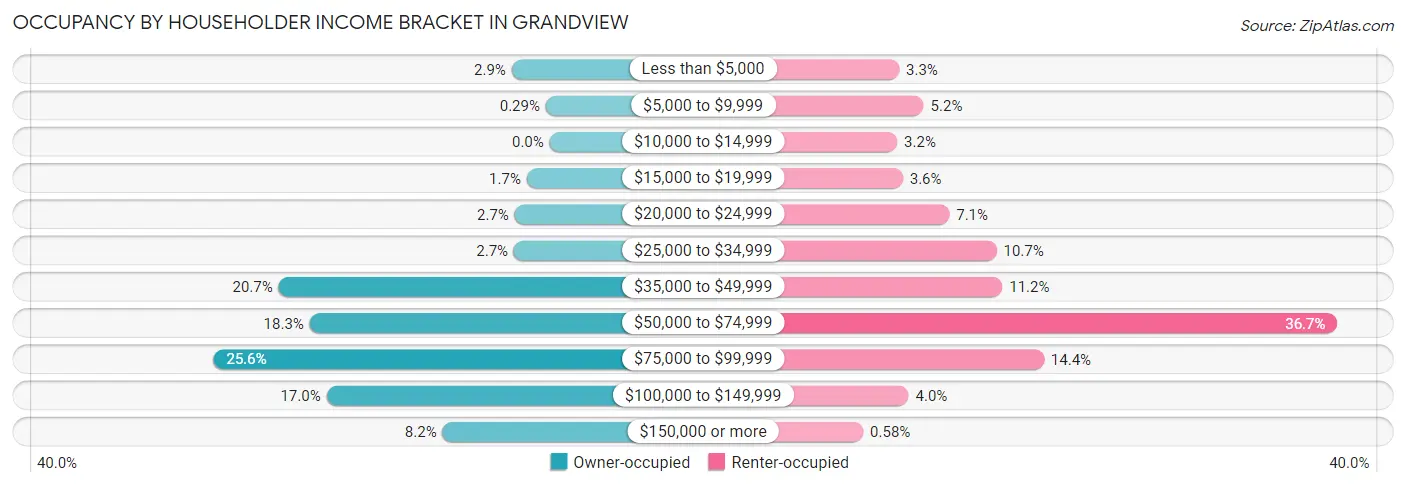
| Income Bracket | Owner-occupied | Renter-occupied |
| Less than $5,000 | 50 (2.9%) | 46 (3.3%) |
| $5,000 to $9,999 | 5 (0.3%) | 72 (5.2%) |
| $10,000 to $14,999 | 0 (0.0%) | 44 (3.2%) |
| $15,000 to $19,999 | 30 (1.7%) | 50 (3.6%) |
| $20,000 to $24,999 | 46 (2.7%) | 99 (7.1%) |
| $25,000 to $34,999 | 47 (2.7%) | 149 (10.7%) |
| $35,000 to $49,999 | 357 (20.6%) | 155 (11.2%) |
| $50,000 to $74,999 | 316 (18.3%) | 509 (36.7%) |
| $75,000 to $99,999 | 443 (25.6%) | 199 (14.3%) |
| $100,000 to $149,999 | 294 (17.0%) | 56 (4.0%) |
| $150,000 or more | 141 (8.2%) | 8 (0.6%) |
| Total | 1,729 (100.0%) | 1,387 (100.0%) |
Monthly Housing Cost Tiers in Grandview
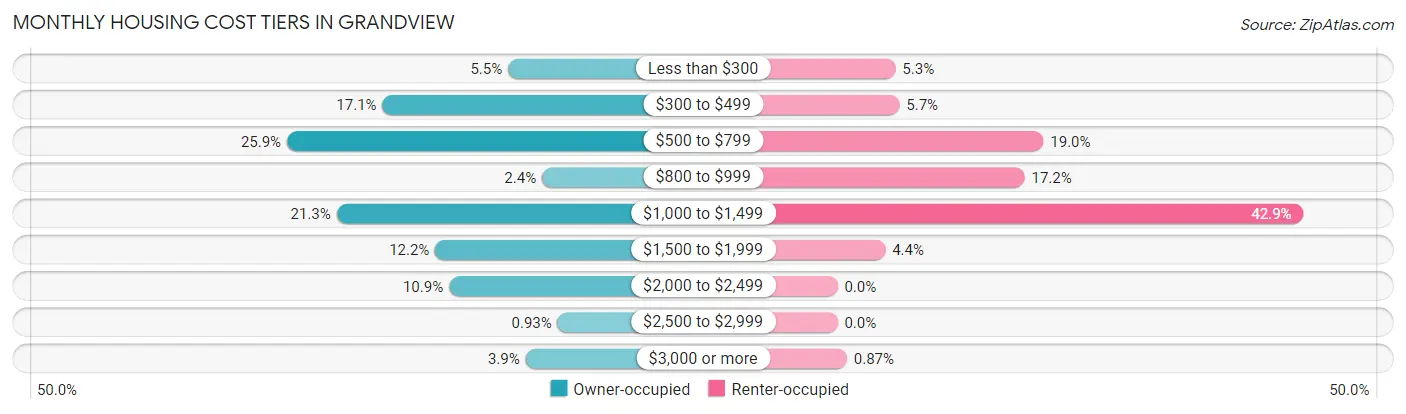
| Monthly Cost | Owner-occupied | Renter-occupied |
| Less than $300 | 95 (5.5%) | 74 (5.3%) |
| $300 to $499 | 295 (17.1%) | 79 (5.7%) |
| $500 to $799 | 447 (25.9%) | 263 (19.0%) |
| $800 to $999 | 41 (2.4%) | 239 (17.2%) |
| $1,000 to $1,499 | 368 (21.3%) | 595 (42.9%) |
| $1,500 to $1,999 | 211 (12.2%) | 61 (4.4%) |
| $2,000 to $2,499 | 189 (10.9%) | 0 (0.0%) |
| $2,500 to $2,999 | 16 (0.9%) | 0 (0.0%) |
| $3,000 or more | 67 (3.9%) | 12 (0.9%) |
| Total | 1,729 (100.0%) | 1,387 (100.0%) |
Physical Housing Characteristics in Grandview
Housing Structures in Grandview
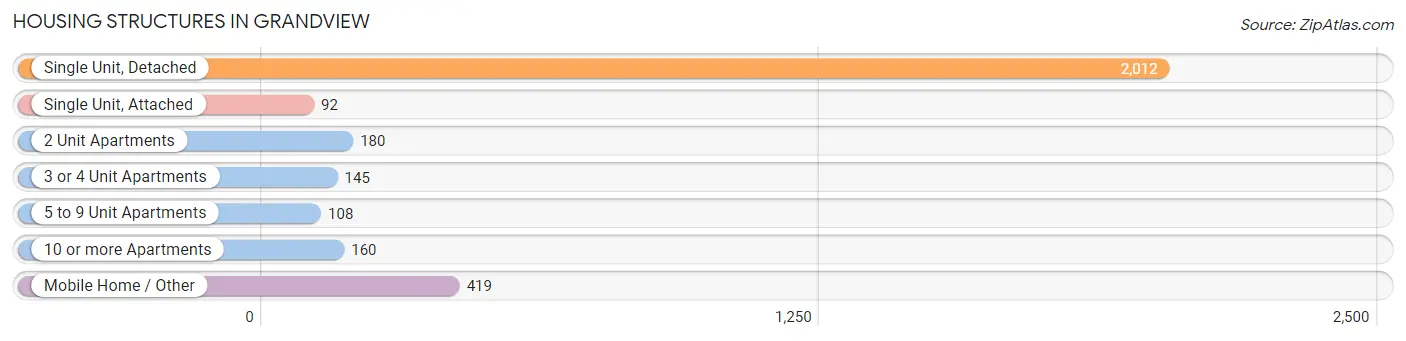
| Structure Type | # Housing Units | % Housing Units |
| Single Unit, Detached | 2,012 | 64.6% |
| Single Unit, Attached | 92 | 2.9% |
| 2 Unit Apartments | 180 | 5.8% |
| 3 or 4 Unit Apartments | 145 | 4.6% |
| 5 to 9 Unit Apartments | 108 | 3.5% |
| 10 or more Apartments | 160 | 5.1% |
| Mobile Home / Other | 419 | 13.5% |
| Total | 3,116 | 100.0% |
Housing Structures by Occupancy in Grandview
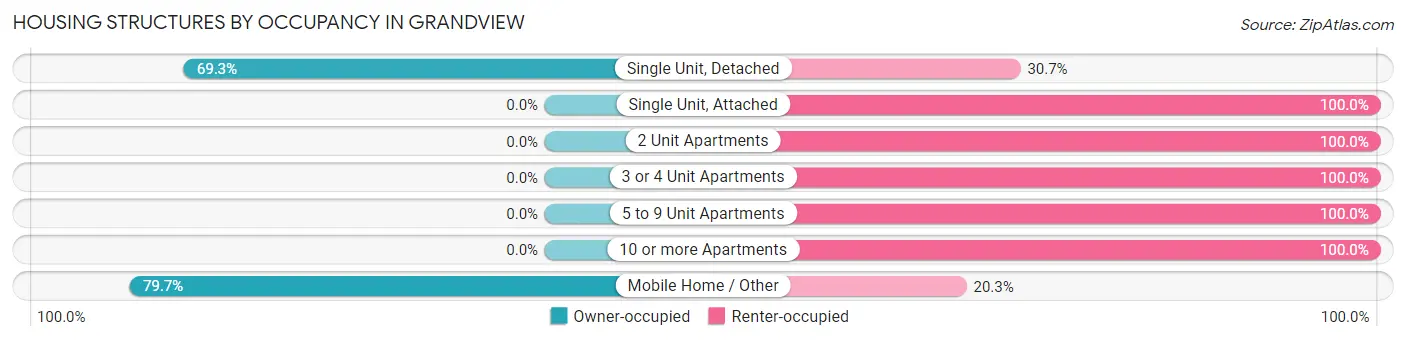
| Structure Type | Owner-occupied | Renter-occupied |
| Single Unit, Detached | 1,395 (69.3%) | 617 (30.7%) |
| Single Unit, Attached | 0 (0.0%) | 92 (100.0%) |
| 2 Unit Apartments | 0 (0.0%) | 180 (100.0%) |
| 3 or 4 Unit Apartments | 0 (0.0%) | 145 (100.0%) |
| 5 to 9 Unit Apartments | 0 (0.0%) | 108 (100.0%) |
| 10 or more Apartments | 0 (0.0%) | 160 (100.0%) |
| Mobile Home / Other | 334 (79.7%) | 85 (20.3%) |
| Total | 1,729 (55.5%) | 1,387 (44.5%) |
Housing Structures by Number of Rooms in Grandview
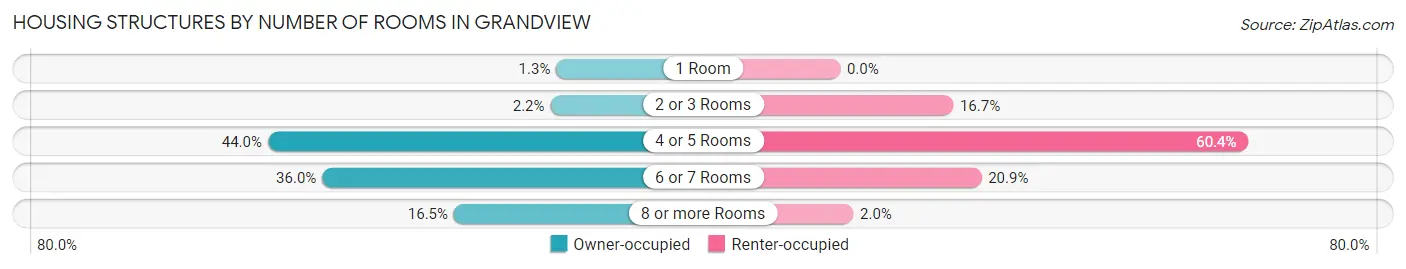
| Number of Rooms | Owner-occupied | Renter-occupied |
| 1 Room | 23 (1.3%) | 0 (0.0%) |
| 2 or 3 Rooms | 38 (2.2%) | 232 (16.7%) |
| 4 or 5 Rooms | 761 (44.0%) | 838 (60.4%) |
| 6 or 7 Rooms | 622 (36.0%) | 290 (20.9%) |
| 8 or more Rooms | 285 (16.5%) | 27 (1.9%) |
| Total | 1,729 (100.0%) | 1,387 (100.0%) |
Housing Structure by Heating Type in Grandview
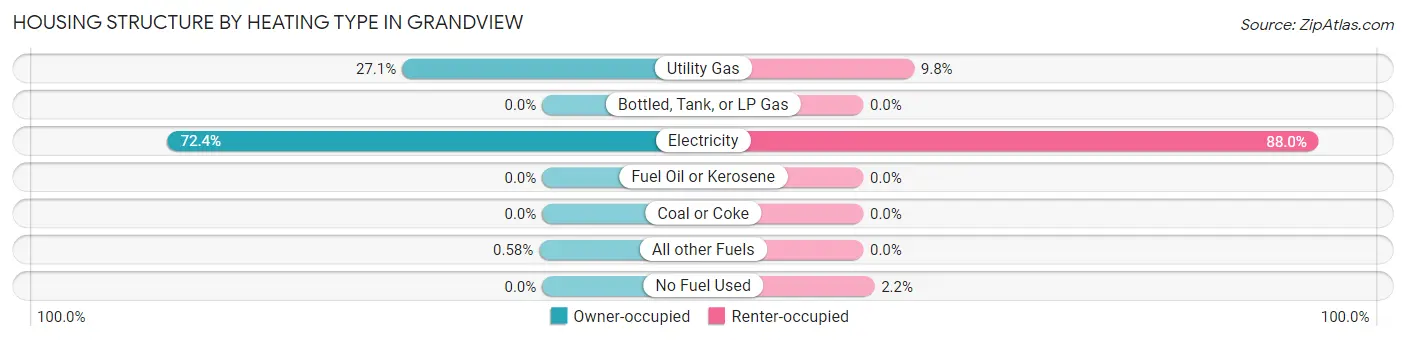
| Heating Type | Owner-occupied | Renter-occupied |
| Utility Gas | 468 (27.1%) | 136 (9.8%) |
| Bottled, Tank, or LP Gas | 0 (0.0%) | 0 (0.0%) |
| Electricity | 1,251 (72.4%) | 1,221 (88.0%) |
| Fuel Oil or Kerosene | 0 (0.0%) | 0 (0.0%) |
| Coal or Coke | 0 (0.0%) | 0 (0.0%) |
| All other Fuels | 10 (0.6%) | 0 (0.0%) |
| No Fuel Used | 0 (0.0%) | 30 (2.2%) |
| Total | 1,729 (100.0%) | 1,387 (100.0%) |
Household Vehicle Usage in Grandview
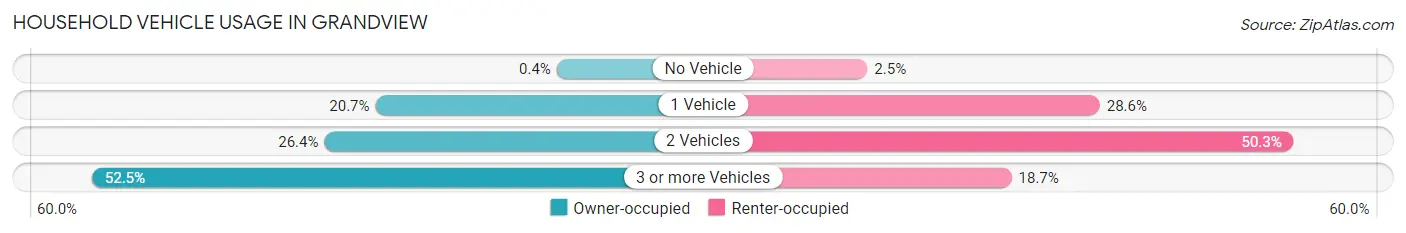
| Vehicles per Household | Owner-occupied | Renter-occupied |
| No Vehicle | 7 (0.4%) | 35 (2.5%) |
| 1 Vehicle | 358 (20.7%) | 396 (28.5%) |
| 2 Vehicles | 457 (26.4%) | 697 (50.2%) |
| 3 or more Vehicles | 907 (52.5%) | 259 (18.7%) |
| Total | 1,729 (100.0%) | 1,387 (100.0%) |
Real Estate & Mortgages in Grandview
Real Estate and Mortgage Overview in Grandview
| Characteristic | Without Mortgage | With Mortgage |
| Housing Units | 841 | 888 |
| Median Property Value | $152,700 | $230,100 |
| Median Household Income | $67,281 | $82 |
| Monthly Housing Costs | $525 | $67 |
| Real Estate Taxes | $1,508 | $0 |
Property Value by Mortgage Status in Grandview
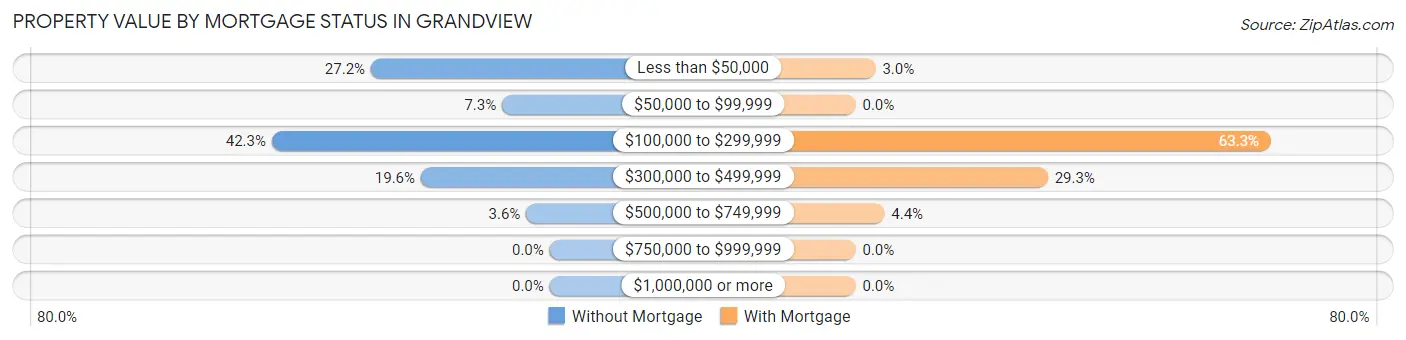
| Property Value | Without Mortgage | With Mortgage |
| Less than $50,000 | 229 (27.2%) | 27 (3.0%) |
| $50,000 to $99,999 | 61 (7.2%) | 0 (0.0%) |
| $100,000 to $299,999 | 356 (42.3%) | 562 (63.3%) |
| $300,000 to $499,999 | 165 (19.6%) | 260 (29.3%) |
| $500,000 to $749,999 | 30 (3.6%) | 39 (4.4%) |
| $750,000 to $999,999 | 0 (0.0%) | 0 (0.0%) |
| $1,000,000 or more | 0 (0.0%) | 0 (0.0%) |
| Total | 841 (100.0%) | 888 (100.0%) |
Household Income by Mortgage Status in Grandview
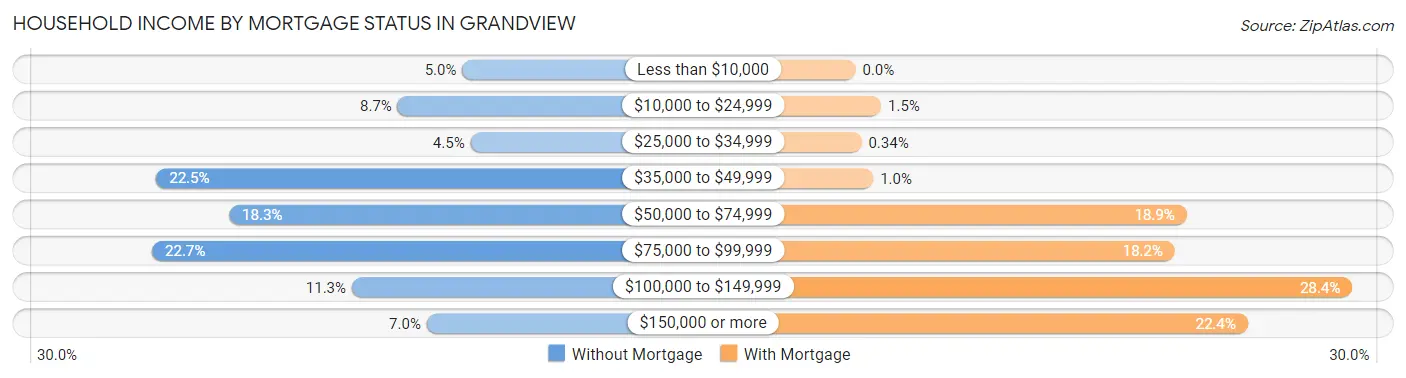
| Household Income | Without Mortgage | With Mortgage |
| Less than $10,000 | 42 (5.0%) | 0 (0.0%) |
| $10,000 to $24,999 | 73 (8.7%) | 13 (1.5%) |
| $25,000 to $34,999 | 38 (4.5%) | 3 (0.3%) |
| $35,000 to $49,999 | 189 (22.5%) | 9 (1.0%) |
| $50,000 to $74,999 | 154 (18.3%) | 168 (18.9%) |
| $75,000 to $99,999 | 191 (22.7%) | 162 (18.2%) |
| $100,000 to $149,999 | 95 (11.3%) | 252 (28.4%) |
| $150,000 or more | 59 (7.0%) | 199 (22.4%) |
| Total | 841 (100.0%) | 888 (100.0%) |
Property Value to Household Income Ratio in Grandview
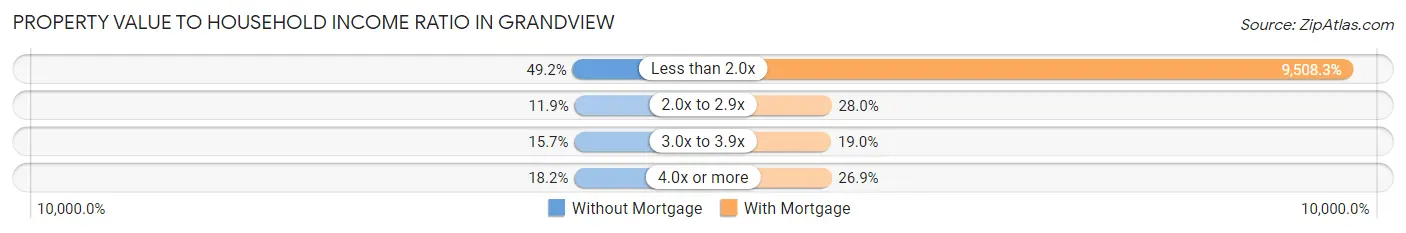
| Value-to-Income Ratio | Without Mortgage | With Mortgage |
| Less than 2.0x | 414 (49.2%) | 84,434 (9,508.3%) |
| 2.0x to 2.9x | 100 (11.9%) | 249 (28.0%) |
| 3.0x to 3.9x | 132 (15.7%) | 169 (19.0%) |
| 4.0x or more | 153 (18.2%) | 239 (26.9%) |
| Total | 841 (100.0%) | 888 (100.0%) |
Real Estate Taxes by Mortgage Status in Grandview
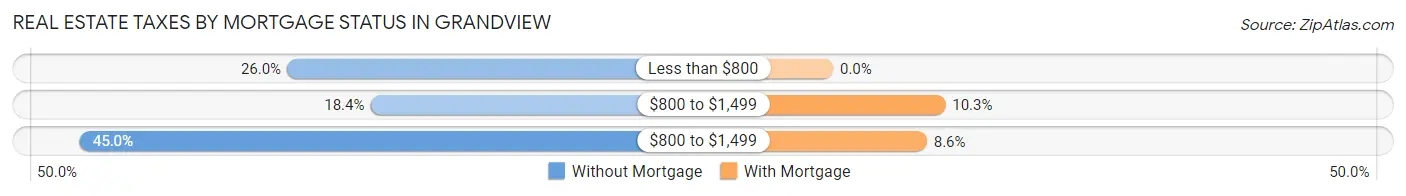
| Property Taxes | Without Mortgage | With Mortgage |
| Less than $800 | 219 (26.0%) | 0 (0.0%) |
| $800 to $1,499 | 155 (18.4%) | 91 (10.2%) |
| $800 to $1,499 | 378 (45.0%) | 76 (8.6%) |
| Total | 841 (100.0%) | 888 (100.0%) |
Health & Disability in Grandview
Health Insurance Coverage by Age in Grandview
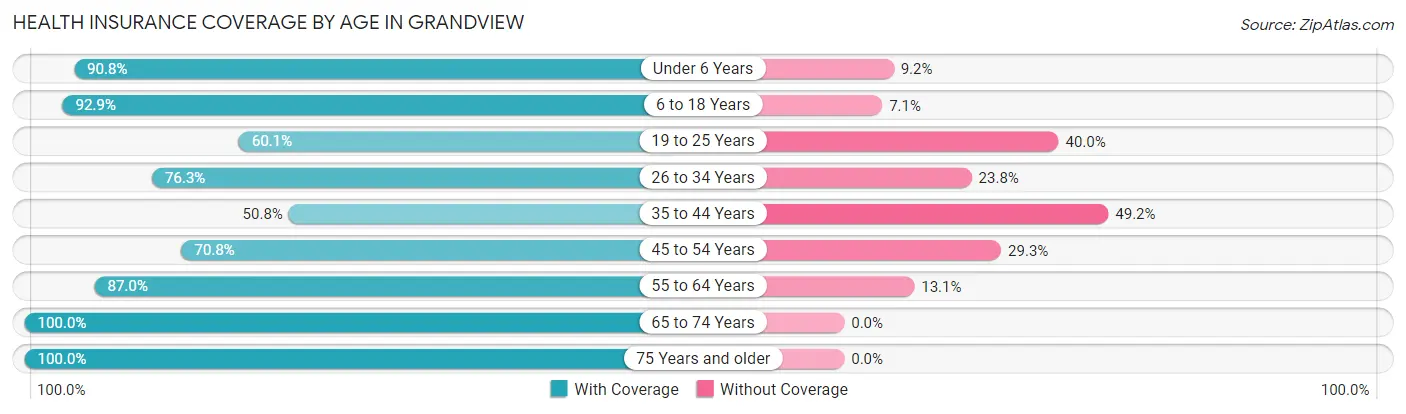
| Age Bracket | With Coverage | Without Coverage |
| Under 6 Years | 1,241 (90.8%) | 126 (9.2%) |
| 6 to 18 Years | 2,757 (92.9%) | 210 (7.1%) |
| 19 to 25 Years | 690 (60.1%) | 459 (40.0%) |
| 26 to 34 Years | 1,207 (76.2%) | 376 (23.7%) |
| 35 to 44 Years | 668 (50.8%) | 648 (49.2%) |
| 45 to 54 Years | 815 (70.8%) | 337 (29.2%) |
| 55 to 64 Years | 613 (87.0%) | 92 (13.1%) |
| 65 to 74 Years | 380 (100.0%) | 0 (0.0%) |
| 75 Years and older | 277 (100.0%) | 0 (0.0%) |
| Total | 8,648 (79.4%) | 2,248 (20.6%) |
Health Insurance Coverage by Citizenship Status in Grandview

| Citizenship Status | With Coverage | Without Coverage |
| Native Born | 1,241 (90.8%) | 126 (9.2%) |
| Foreign Born, Citizen | 2,757 (92.9%) | 210 (7.1%) |
| Foreign Born, not a Citizen | 690 (60.1%) | 459 (40.0%) |
Health Insurance Coverage by Household Income in Grandview
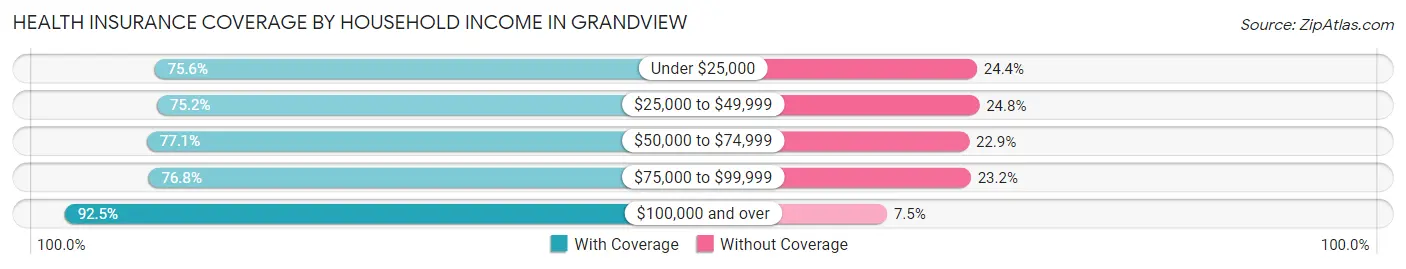
| Household Income | With Coverage | Without Coverage |
| Under $25,000 | 686 (75.6%) | 221 (24.4%) |
| $25,000 to $49,999 | 1,582 (75.2%) | 522 (24.8%) |
| $50,000 to $74,999 | 2,494 (77.1%) | 741 (22.9%) |
| $75,000 to $99,999 | 2,030 (76.8%) | 614 (23.2%) |
| $100,000 and over | 1,846 (92.5%) | 150 (7.5%) |
Public vs Private Health Insurance Coverage by Age in Grandview
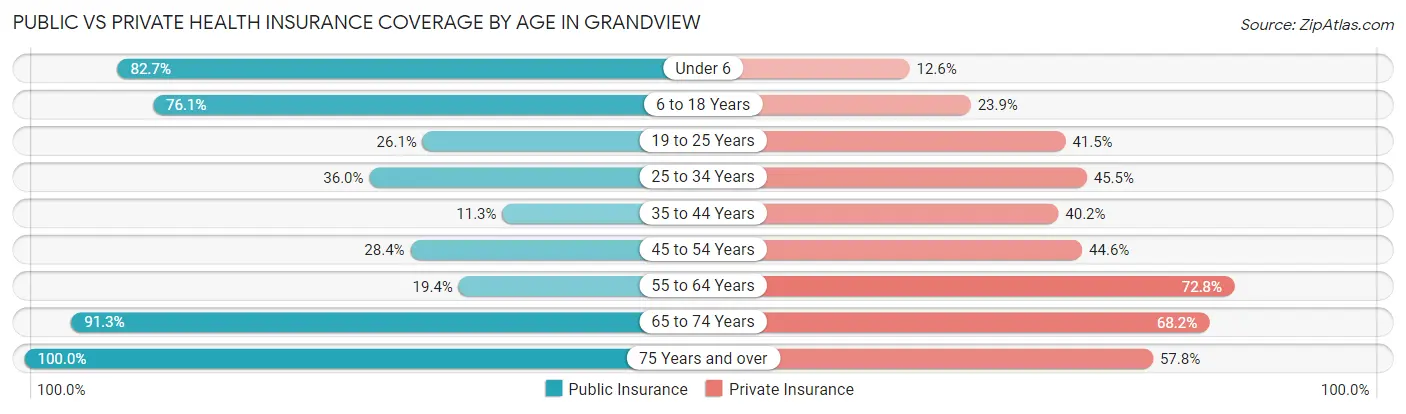
| Age Bracket | Public Insurance | Private Insurance |
| Under 6 | 1,131 (82.7%) | 172 (12.6%) |
| 6 to 18 Years | 2,259 (76.1%) | 710 (23.9%) |
| 19 to 25 Years | 300 (26.1%) | 477 (41.5%) |
| 25 to 34 Years | 570 (36.0%) | 720 (45.5%) |
| 35 to 44 Years | 149 (11.3%) | 529 (40.2%) |
| 45 to 54 Years | 327 (28.4%) | 514 (44.6%) |
| 55 to 64 Years | 137 (19.4%) | 513 (72.8%) |
| 65 to 74 Years | 347 (91.3%) | 259 (68.2%) |
| 75 Years and over | 277 (100.0%) | 160 (57.8%) |
| Total | 5,497 (50.4%) | 4,054 (37.2%) |
Disability Status by Sex by Age in Grandview
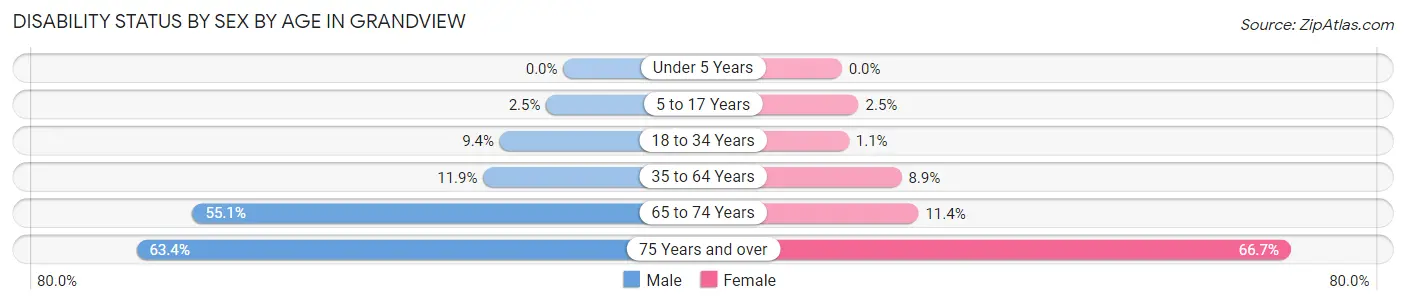
| Age Bracket | Male | Female |
| Under 5 Years | 0 (0.0%) | 0 (0.0%) |
| 5 to 17 Years | 39 (2.5%) | 39 (2.5%) |
| 18 to 34 Years | 136 (9.4%) | 14 (1.1%) |
| 35 to 64 Years | 188 (11.9%) | 141 (8.9%) |
| 65 to 74 Years | 98 (55.1%) | 23 (11.4%) |
| 75 Years and over | 90 (63.4%) | 90 (66.7%) |
Disability Class by Sex by Age in Grandview
Disability Class: Hearing Difficulty
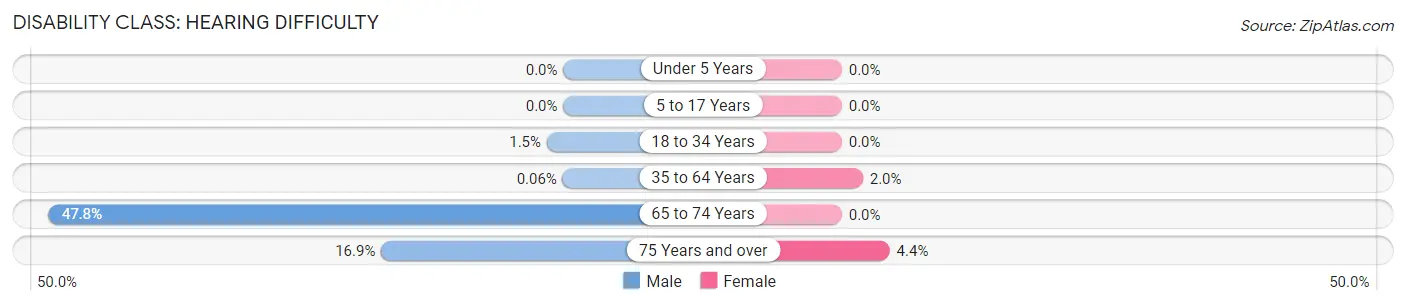
| Age Bracket | Male | Female |
| Under 5 Years | 0 (0.0%) | 0 (0.0%) |
| 5 to 17 Years | 0 (0.0%) | 0 (0.0%) |
| 18 to 34 Years | 22 (1.5%) | 0 (0.0%) |
| 35 to 64 Years | 1 (0.1%) | 31 (1.9%) |
| 65 to 74 Years | 85 (47.7%) | 0 (0.0%) |
| 75 Years and over | 24 (16.9%) | 6 (4.4%) |
Disability Class: Vision Difficulty
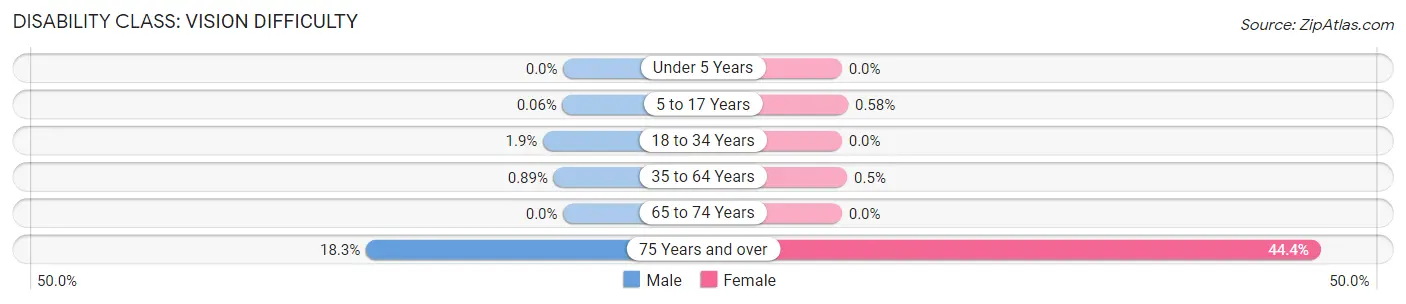
| Age Bracket | Male | Female |
| Under 5 Years | 0 (0.0%) | 0 (0.0%) |
| 5 to 17 Years | 1 (0.1%) | 9 (0.6%) |
| 18 to 34 Years | 27 (1.9%) | 0 (0.0%) |
| 35 to 64 Years | 14 (0.9%) | 8 (0.5%) |
| 65 to 74 Years | 0 (0.0%) | 0 (0.0%) |
| 75 Years and over | 26 (18.3%) | 60 (44.4%) |
Disability Class: Cognitive Difficulty
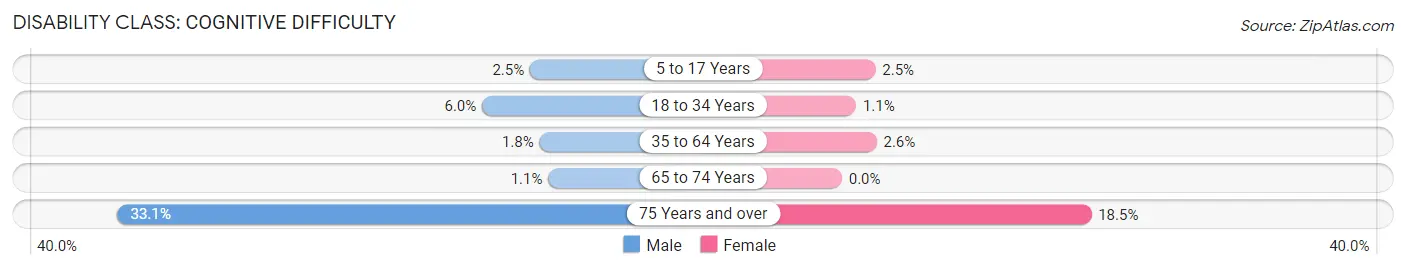
| Age Bracket | Male | Female |
| 5 to 17 Years | 38 (2.5%) | 39 (2.5%) |
| 18 to 34 Years | 87 (6.0%) | 14 (1.1%) |
| 35 to 64 Years | 28 (1.8%) | 41 (2.6%) |
| 65 to 74 Years | 2 (1.1%) | 0 (0.0%) |
| 75 Years and over | 47 (33.1%) | 25 (18.5%) |
Disability Class: Ambulatory Difficulty
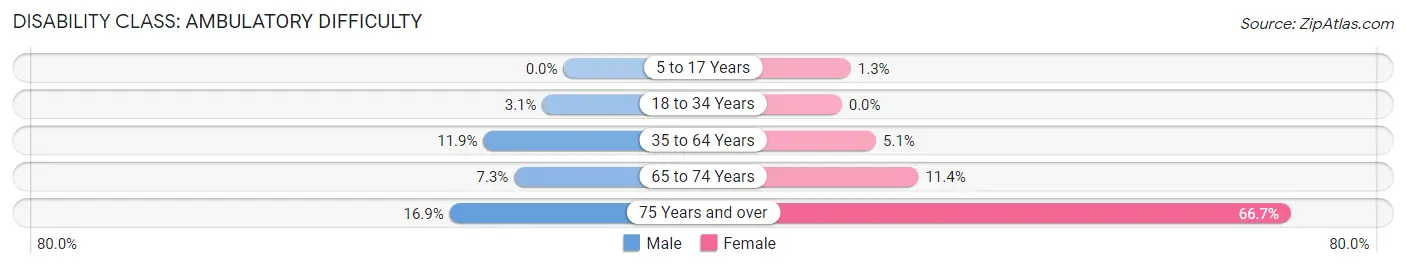
| Age Bracket | Male | Female |
| 5 to 17 Years | 0 (0.0%) | 21 (1.3%) |
| 18 to 34 Years | 45 (3.1%) | 0 (0.0%) |
| 35 to 64 Years | 188 (11.9%) | 81 (5.1%) |
| 65 to 74 Years | 13 (7.3%) | 23 (11.4%) |
| 75 Years and over | 24 (16.9%) | 90 (66.7%) |
Disability Class: Self-Care Difficulty
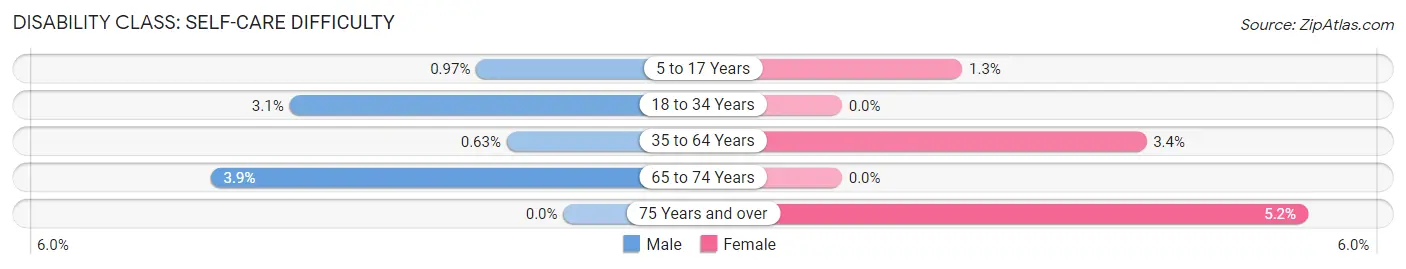
| Age Bracket | Male | Female |
| 5 to 17 Years | 15 (1.0%) | 21 (1.3%) |
| 18 to 34 Years | 44 (3.0%) | 0 (0.0%) |
| 35 to 64 Years | 10 (0.6%) | 54 (3.4%) |
| 65 to 74 Years | 7 (3.9%) | 0 (0.0%) |
| 75 Years and over | 0 (0.0%) | 7 (5.2%) |
Technology Access in Grandview
Computing Device Access in Grandview
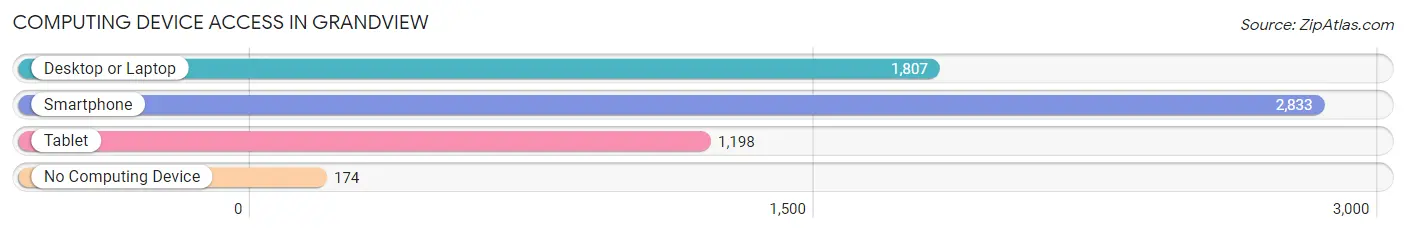
| Device Type | # Households | % Households |
| Desktop or Laptop | 1,807 | 58.0% |
| Smartphone | 2,833 | 90.9% |
| Tablet | 1,198 | 38.5% |
| No Computing Device | 174 | 5.6% |
| Total | 3,116 | 100.0% |
Internet Access in Grandview
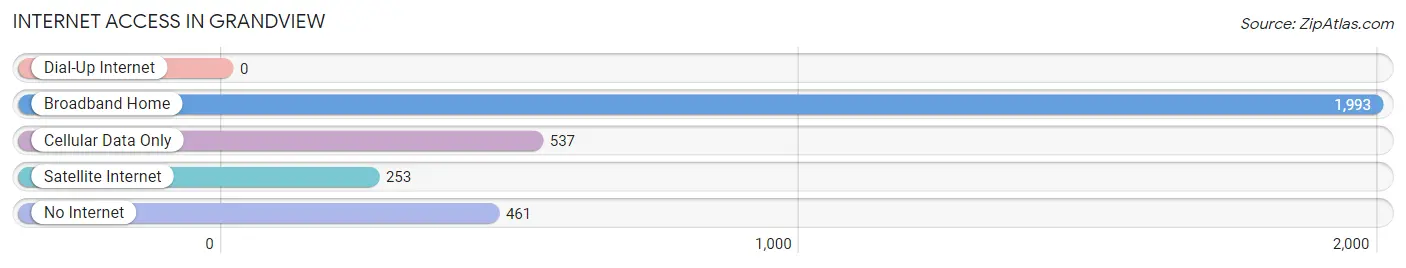
| Internet Type | # Households | % Households |
| Dial-Up Internet | 0 | 0.0% |
| Broadband Home | 1,993 | 64.0% |
| Cellular Data Only | 537 | 17.2% |
| Satellite Internet | 253 | 8.1% |
| No Internet | 461 | 14.8% |
| Total | 3,116 | 100.0% |
Grandview Summary
Geography
Grandview is a small town located in the Yakima Valley of Washington State. It is situated in the foothills of the Cascade Mountains, about 25 miles east of Yakima. The town is surrounded by rolling hills and is bordered by the Yakima River to the north and the Naches River to the south. The area is known for its fertile soil and abundant water resources, making it ideal for agriculture.
The climate in Grandview is semi-arid, with hot summers and cold winters. The average annual temperature is around 50 degrees Fahrenheit, with an average high of around 80 degrees in the summer and an average low of around 20 degrees in the winter. The area receives an average of 12 inches of precipitation per year, with most of it falling in the winter months.
History
Grandview was first settled in the late 1800s by homesteaders who were attracted to the area’s fertile soil and abundant water resources. The town was officially incorporated in 1909 and was named after the nearby Grandview Mountain.
In the early 1900s, the town was a thriving agricultural center, with many farmers growing apples, cherries, and other fruits and vegetables. The town also had a thriving dairy industry, with several local dairies producing milk and other dairy products.
In the 1950s, the town began to experience a decline in its agricultural industry as many farmers moved away in search of better opportunities. This led to a period of economic stagnation, which lasted until the late 1970s when the town began to experience a resurgence.
Today, Grandview is a small but vibrant community with a population of around 2,500 people. The town is home to several businesses, including a grocery store, a hardware store, and several restaurants.
Economy
Grandview’s economy is largely based on agriculture, with many local farmers growing apples, cherries, and other fruits and vegetables. The town also has a thriving dairy industry, with several local dairies producing milk and other dairy products.
In addition to agriculture, Grandview is home to several small businesses, including a grocery store, a hardware store, and several restaurants. The town also has a small manufacturing sector, with several local companies producing a variety of products, including furniture, clothing, and electronics.
Demographics
As of the 2010 census, Grandview had a population of 2,521 people. The racial makeup of the town was 94.3% White, 0.7% African American, 0.7% Native American, 0.3% Asian, 0.1% Pacific Islander, 1.2% from other races, and 2.1% from two or more races. Hispanic or Latino of any race were 4.2% of the population.
The median household income in Grandview was $37,917, and the median family income was $45,938. The per capita income for the town was $17,945. About 11.2% of families and 14.3% of the population were below the poverty line, including 19.2% of those under age 18 and 8.2% of those age 65 or over.
Common Questions
What is Per Capita Income in Grandview?
Per Capita income in Grandview is $20,605.
What is the Median Family Income in Grandview?
Median Family Income in Grandview is $52,175.
What is the Median Household income in Grandview?
Median Household Income in Grandview is $61,635.
What is Income or Wage Gap in Grandview?
Income or Wage Gap in Grandview is 24.7%.
Women in Grandview earn 75.3 cents for every dollar earned by a man.
What is Inequality or Gini Index in Grandview?
Inequality or Gini Index in Grandview is 0.37.
What is the Total Population of Grandview?
Total Population of Grandview is 10,922.
What is the Total Male Population of Grandview?
Total Male Population of Grandview is 5,332.
What is the Total Female Population of Grandview?
Total Female Population of Grandview is 5,590.
What is the Ratio of Males per 100 Females in Grandview?
There are 95.38 Males per 100 Females in Grandview.
What is the Ratio of Females per 100 Males in Grandview?
There are 104.84 Females per 100 Males in Grandview.
What is the Median Population Age in Grandview?
Median Population Age in Grandview is 25.9 Years.
What is the Average Family Size in Grandview
Average Family Size in Grandview is 3.7 People.
What is the Average Household Size in Grandview
Average Household Size in Grandview is 3.5 People.
How Large is the Labor Force in Grandview?
There are 5,104 People in the Labor Forcein in Grandview.
What is the Percentage of People in the Labor Force in Grandview?
74.4% of People are in the Labor Force in Grandview.
What is the Unemployment Rate in Grandview?
Unemployment Rate in Grandview is 4.3%.