Severn, MD Map & Demographics
Severn Map
Severn Overview
$54,186
PER CAPITA INCOME
$135,797
AVG FAMILY INCOME
$125,330
AVG HOUSEHOLD INCOME
30.1%
WAGE / INCOME GAP [ % ]
69.9¢/ $1
WAGE / INCOME GAP [ $ ]
0.37
INEQUALITY / GINI INDEX
56,438
TOTAL POPULATION
28,090
MALE POPULATION
28,348
FEMALE POPULATION
99.09
MALES / 100 FEMALES
100.92
FEMALES / 100 MALES
35.9
MEDIAN AGE
3.2
AVG FAMILY SIZE
2.7
AVG HOUSEHOLD SIZE
32,193
LABOR FORCE [ PEOPLE ]
72.1%
PERCENT IN LABOR FORCE
4.9%
UNEMPLOYMENT RATE
Severn Zip Codes
Income in Severn
Income Overview in Severn
Per Capita Income in Severn is $54,186, while median incomes of families and households are $135,797 and $125,330 respectively.
| Characteristic | Number | Measure |
| Per Capita Income | 56,438 | $54,186 |
| Median Family Income | 15,194 | $135,797 |
| Mean Family Income | 15,194 | $158,213 |
| Median Household Income | 20,736 | $125,330 |
| Mean Household Income | 20,736 | $146,753 |
| Income Deficit | 15,194 | $0 |
| Wage / Income Gap (%) | 56,438 | 30.06% |
| Wage / Income Gap ($) | 56,438 | 69.94¢ per $1 |
| Gini / Inequality Index | 56,438 | 0.37 |
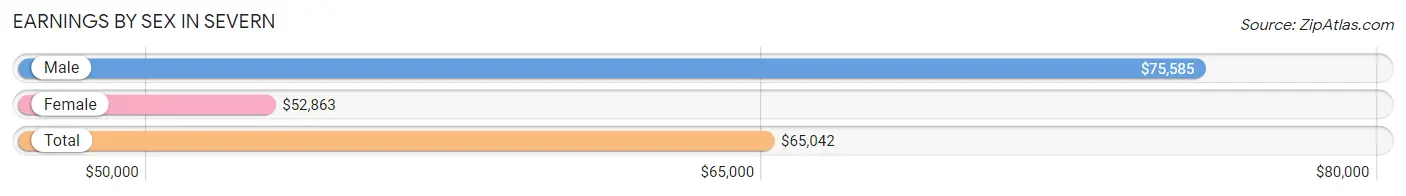
Earnings by Sex in Severn
Average Earnings in Severn are $65,042, $75,585 for men and $52,863 for women, a difference of 30.1%.
| Sex | Number | Average Earnings |
| Male | 17,770 (53.6%) | $75,585 |
| Female | 15,376 (46.4%) | $52,863 |
| Total | 33,146 (100.0%) | $65,042 |
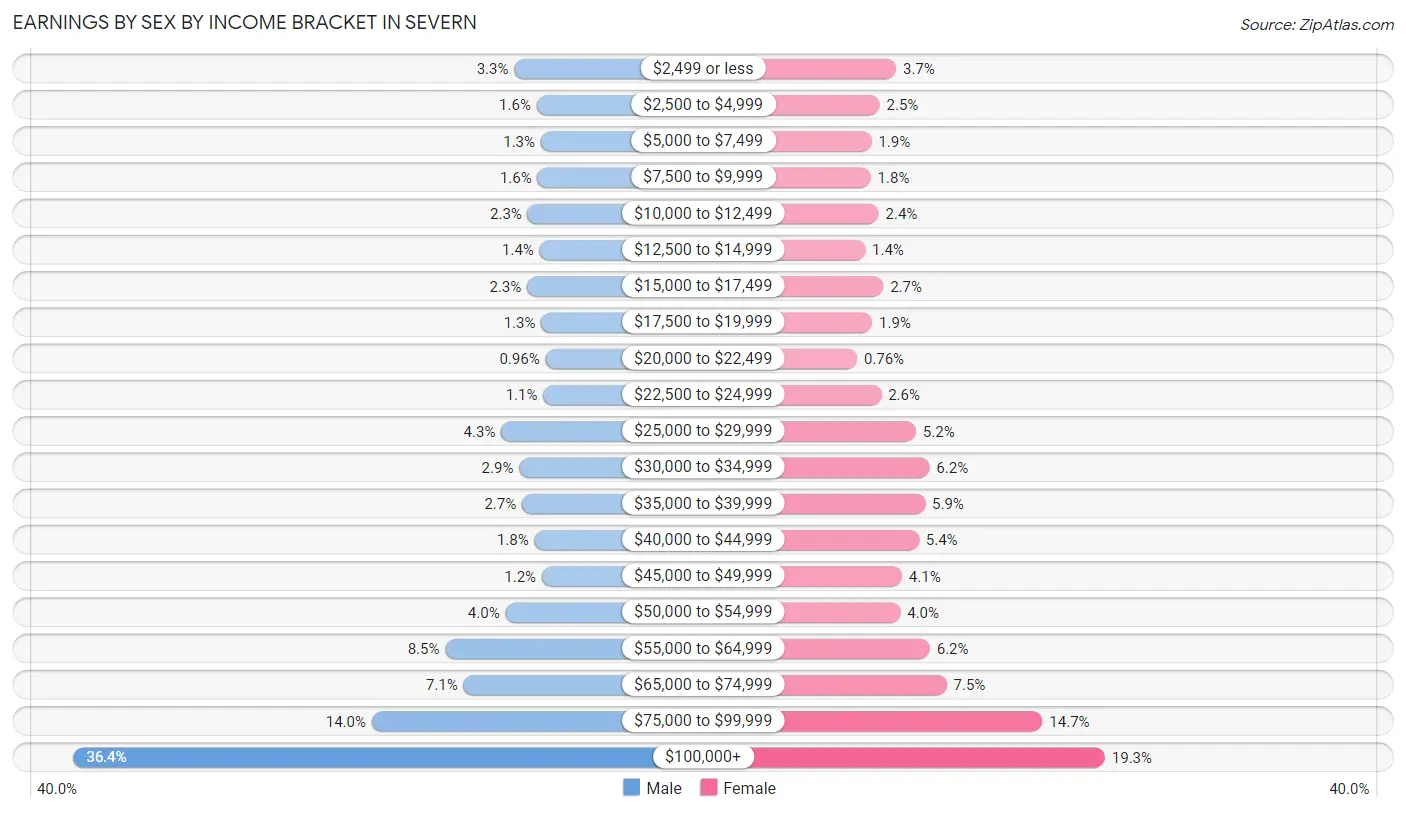
Earnings by Sex by Income Bracket in Severn
The most common earnings brackets in Severn are $100,000+ for men (6,459 | 36.3%) and $100,000+ for women (2,974 | 19.3%).
| Income | Male | Female |
| $2,499 or less | 586 (3.3%) | 568 (3.7%) |
| $2,500 to $4,999 | 288 (1.6%) | 378 (2.5%) |
| $5,000 to $7,499 | 232 (1.3%) | 285 (1.8%) |
| $7,500 to $9,999 | 277 (1.6%) | 275 (1.8%) |
| $10,000 to $12,499 | 408 (2.3%) | 366 (2.4%) |
| $12,500 to $14,999 | 248 (1.4%) | 210 (1.4%) |
| $15,000 to $17,499 | 416 (2.3%) | 419 (2.7%) |
| $17,500 to $19,999 | 228 (1.3%) | 292 (1.9%) |
| $20,000 to $22,499 | 170 (1.0%) | 117 (0.8%) |
| $22,500 to $24,999 | 201 (1.1%) | 397 (2.6%) |
| $25,000 to $29,999 | 761 (4.3%) | 797 (5.2%) |
| $30,000 to $34,999 | 521 (2.9%) | 952 (6.2%) |
| $35,000 to $39,999 | 484 (2.7%) | 902 (5.9%) |
| $40,000 to $44,999 | 316 (1.8%) | 831 (5.4%) |
| $45,000 to $49,999 | 219 (1.2%) | 635 (4.1%) |
| $50,000 to $54,999 | 703 (4.0%) | 617 (4.0%) |
| $55,000 to $64,999 | 1,505 (8.5%) | 957 (6.2%) |
| $65,000 to $74,999 | 1,264 (7.1%) | 1,150 (7.5%) |
| $75,000 to $99,999 | 2,484 (14.0%) | 2,254 (14.7%) |
| $100,000+ | 6,459 (36.3%) | 2,974 (19.3%) |
| Total | 17,770 (100.0%) | 15,376 (100.0%) |
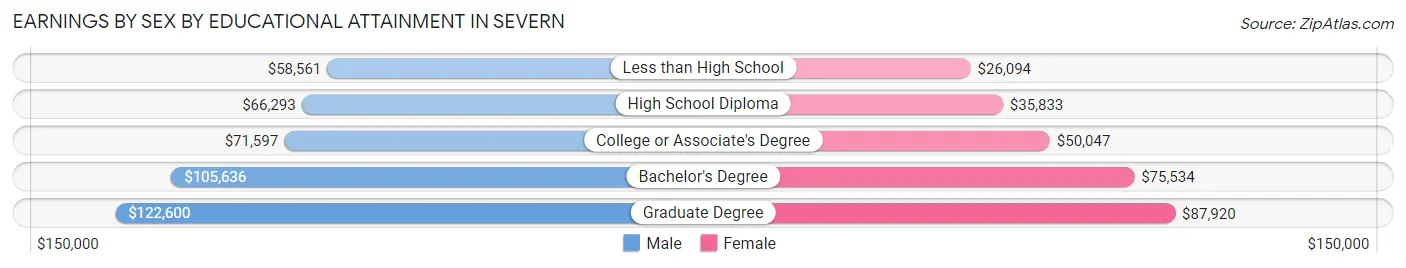
Earnings by Sex by Educational Attainment in Severn
Average earnings in Severn are $86,237 for men and $57,942 for women, a difference of 32.8%. Men with an educational attainment of graduate degree enjoy the highest average annual earnings of $122,600, while those with less than high school education earn the least with $58,561. Women with an educational attainment of graduate degree earn the most with the average annual earnings of $87,920, while those with less than high school education have the smallest earnings of $26,094.
| Educational Attainment | Male Income | Female Income |
| Less than High School | $58,561 | $26,094 |
| High School Diploma | $66,293 | $35,833 |
| College or Associate's Degree | $71,597 | $50,047 |
| Bachelor's Degree | $105,636 | $75,534 |
| Graduate Degree | $122,600 | $87,920 |
| Total | $86,237 | $57,942 |
Family Income in Severn
Family Income Brackets in Severn
According to the Severn family income data, there are 4,194 families falling into the $200,000+ income range, which is the most common income bracket and makes up 27.6% of all families. Conversely, the $15,000 to $24,999 income bracket is the least frequent group with only 91 families (0.6%) belonging to this category.
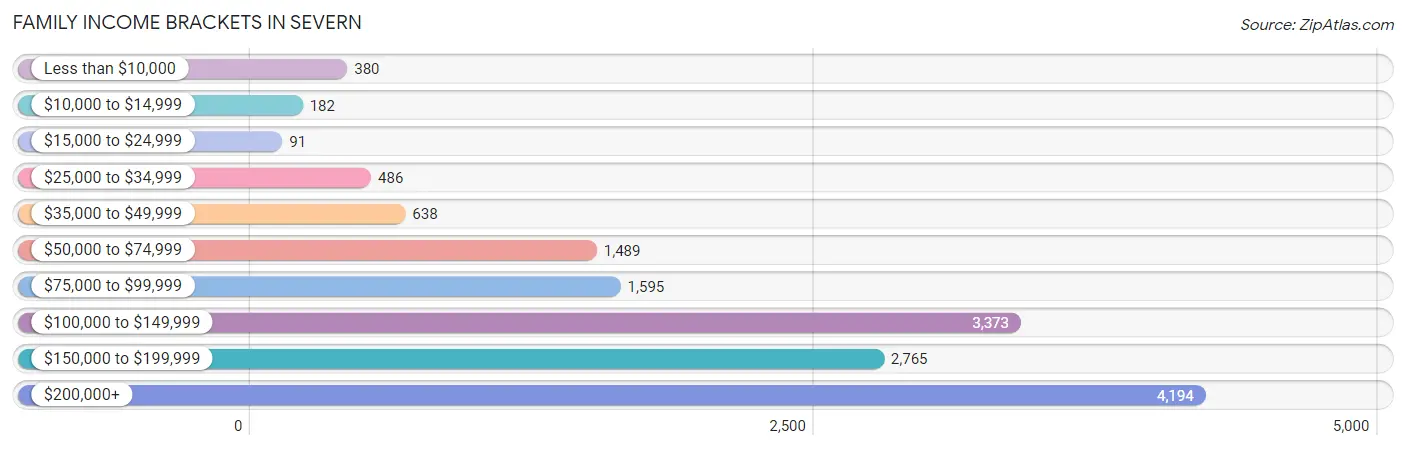
| Income Bracket | # Families | % Families |
| Less than $10,000 | 380 | 2.5% |
| $10,000 to $14,999 | 182 | 1.2% |
| $15,000 to $24,999 | 91 | 0.6% |
| $25,000 to $34,999 | 486 | 3.2% |
| $35,000 to $49,999 | 638 | 4.2% |
| $50,000 to $74,999 | 1,489 | 9.8% |
| $75,000 to $99,999 | 1,595 | 10.5% |
| $100,000 to $149,999 | 3,373 | 22.2% |
| $150,000 to $199,999 | 2,765 | 18.2% |
| $200,000+ | 4,194 | 27.6% |
Family Income by Famaliy Size in Severn
5-person families (1,821 | 12.0%) account for the highest median family income in Severn with $175,745 per family, while 2-person families (6,544 | 43.1%) have the highest median income of $57,416 per family member.
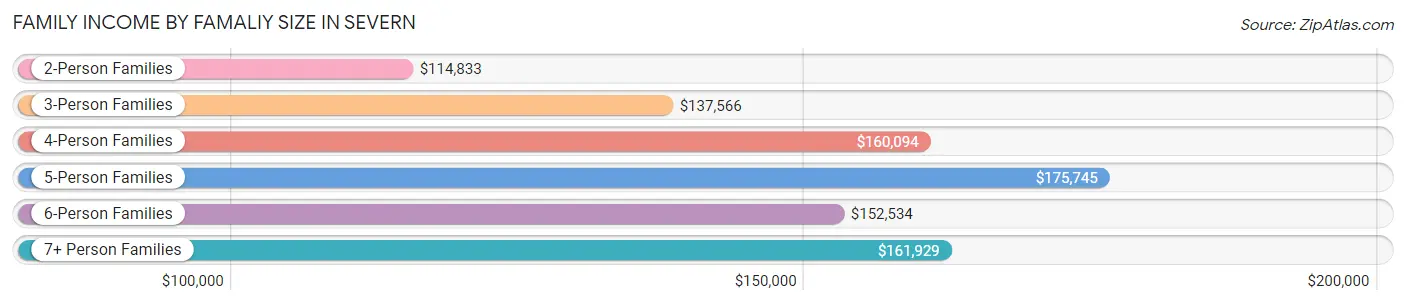
| Income Bracket | # Families | Median Income |
| 2-Person Families | 6,544 (43.1%) | $114,833 |
| 3-Person Families | 3,224 (21.2%) | $137,566 |
| 4-Person Families | 2,986 (19.7%) | $160,094 |
| 5-Person Families | 1,821 (12.0%) | $175,745 |
| 6-Person Families | 419 (2.8%) | $152,534 |
| 7+ Person Families | 200 (1.3%) | $161,929 |
| Total | 15,194 (100.0%) | $135,797 |
Family Income by Number of Earners in Severn
The median family income in Severn is $135,797, with families comprising 3+ earners (2,421) having the highest median family income of $182,406, while families with no earners (1,795) have the lowest median family income of $71,065, accounting for 15.9% and 11.8% of families, respectively.
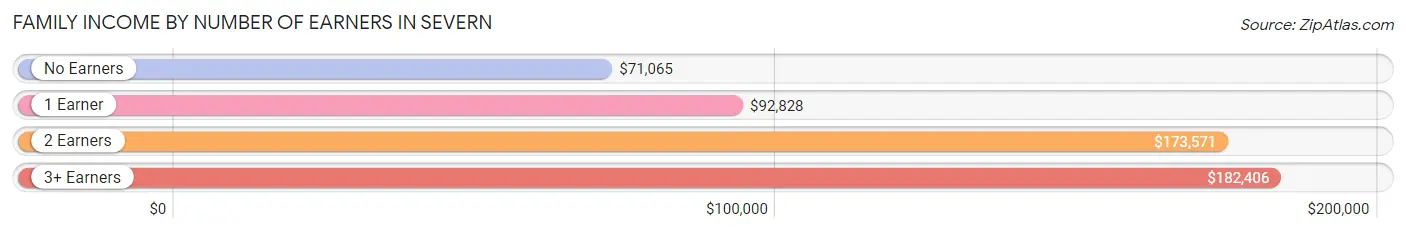
| Number of Earners | # Families | Median Income |
| No Earners | 1,795 (11.8%) | $71,065 |
| 1 Earner | 3,676 (24.2%) | $92,828 |
| 2 Earners | 7,302 (48.1%) | $173,571 |
| 3+ Earners | 2,421 (15.9%) | $182,406 |
| Total | 15,194 (100.0%) | $135,797 |
Household Income in Severn
Household Income Brackets in Severn
With 4,811 households falling in the category, the $200,000+ income range is the most frequent in Severn, accounting for 23.2% of all households. In contrast, only 207 households (1.0%) fall into the $10,000 to $14,999 income bracket, making it the least populous group.
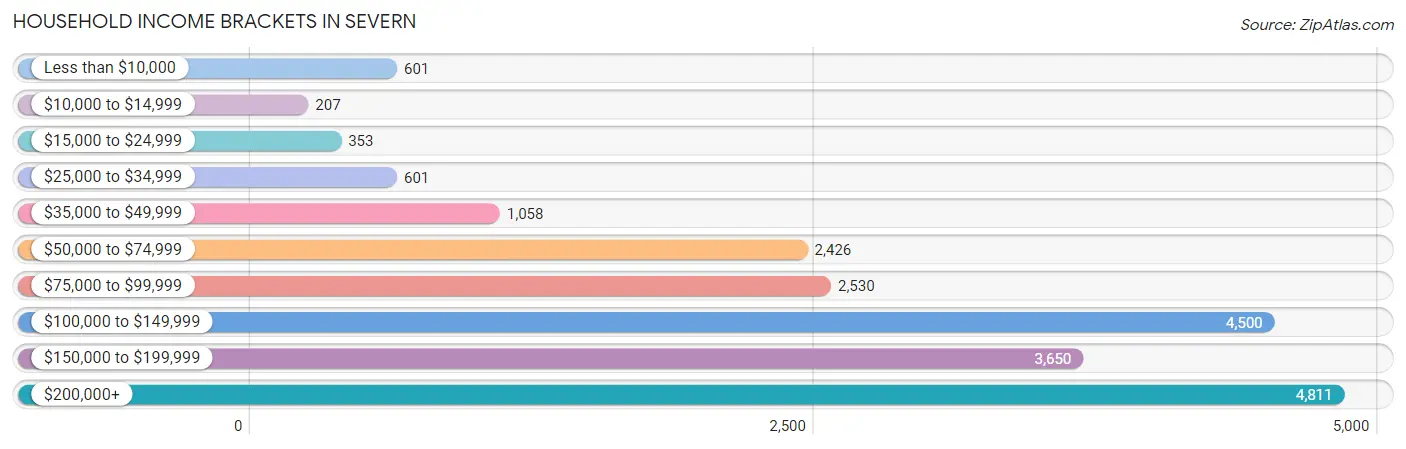
| Income Bracket | # Households | % Households |
| Less than $10,000 | 601 | 2.9% |
| $10,000 to $14,999 | 207 | 1.0% |
| $15,000 to $24,999 | 353 | 1.7% |
| $25,000 to $34,999 | 601 | 2.9% |
| $35,000 to $49,999 | 1,058 | 5.1% |
| $50,000 to $74,999 | 2,426 | 11.7% |
| $75,000 to $99,999 | 2,530 | 12.2% |
| $100,000 to $149,999 | 4,500 | 21.7% |
| $150,000 to $199,999 | 3,650 | 17.6% |
| $200,000+ | 4,811 | 23.2% |
Household Income by Householder Age in Severn
The median household income in Severn is $125,330, with the highest median household income of $154,932 found in the 45 to 64 years age bracket for the primary householder. A total of 7,730 households (37.3%) fall into this category. Meanwhile, the 15 to 24 years age bracket for the primary householder has the lowest median household income of $67,500, with 452 households (2.2%) in this group.
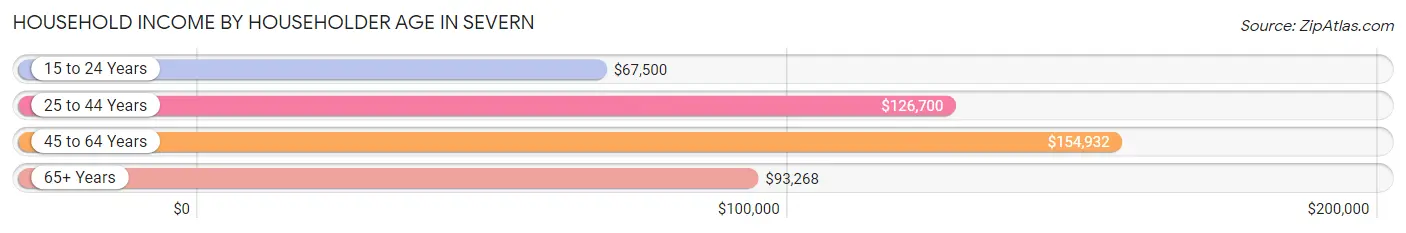
| Income Bracket | # Households | Median Income |
| 15 to 24 Years | 452 (2.2%) | $67,500 |
| 25 to 44 Years | 8,606 (41.5%) | $126,700 |
| 45 to 64 Years | 7,730 (37.3%) | $154,932 |
| 65+ Years | 3,948 (19.0%) | $93,268 |
| Total | 20,736 (100.0%) | $125,330 |
Poverty in Severn
Income Below Poverty by Sex and Age in Severn
With 5.2% poverty level for males and 7.7% for females among the residents of Severn, 12 to 14 year old males and 15 year old females are the most vulnerable to poverty, with 128 males (14.4%) and 113 females (24.6%) in their respective age groups living below the poverty level.
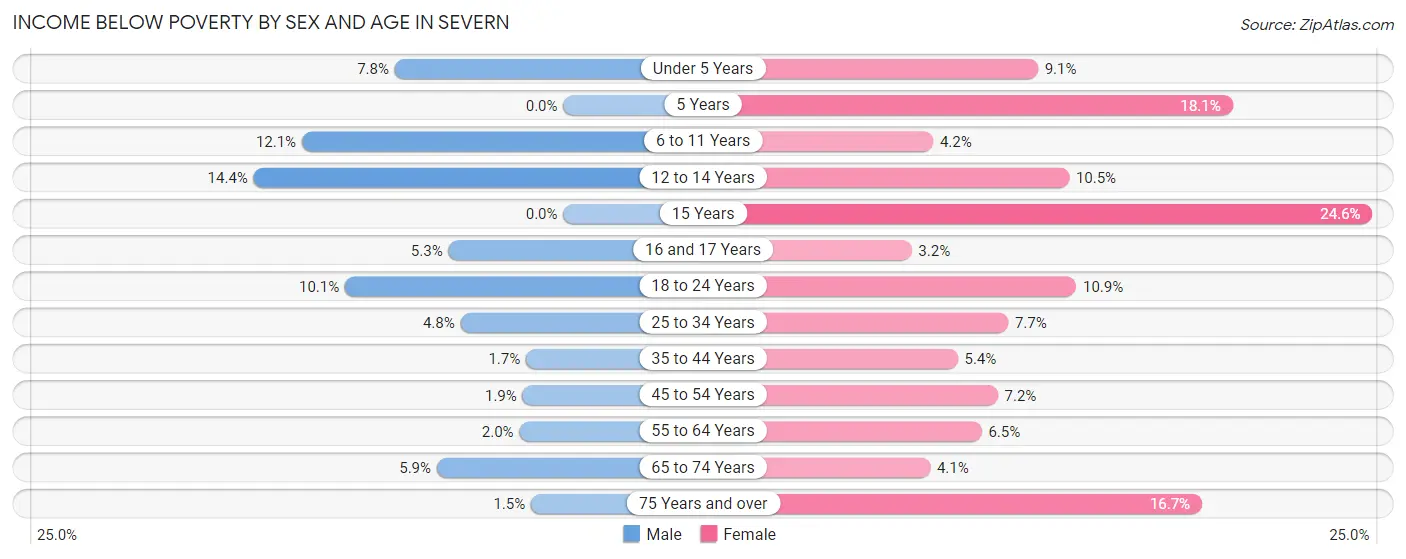
| Age Bracket | Male | Female |
| Under 5 Years | 155 (7.8%) | 155 (9.1%) |
| 5 Years | 0 (0.0%) | 62 (18.1%) |
| 6 to 11 Years | 292 (12.1%) | 92 (4.2%) |
| 12 to 14 Years | 128 (14.4%) | 99 (10.5%) |
| 15 Years | 0 (0.0%) | 113 (24.6%) |
| 16 and 17 Years | 35 (5.3%) | 16 (3.2%) |
| 18 to 24 Years | 268 (10.1%) | 243 (10.9%) |
| 25 to 34 Years | 218 (4.8%) | 368 (7.7%) |
| 35 to 44 Years | 75 (1.7%) | 230 (5.4%) |
| 45 to 54 Years | 68 (1.9%) | 259 (7.2%) |
| 55 to 64 Years | 66 (2.0%) | 238 (6.5%) |
| 65 to 74 Years | 133 (5.9%) | 97 (4.1%) |
| 75 Years and over | 11 (1.5%) | 189 (16.7%) |
| Total | 1,449 (5.2%) | 2,161 (7.7%) |
Income Above Poverty by Sex and Age in Severn
According to the poverty statistics in Severn, males aged 5 years and females aged 16 and 17 years are the age groups that are most secure financially, with 100.0% of males and 96.8% of females in these age groups living above the poverty line.
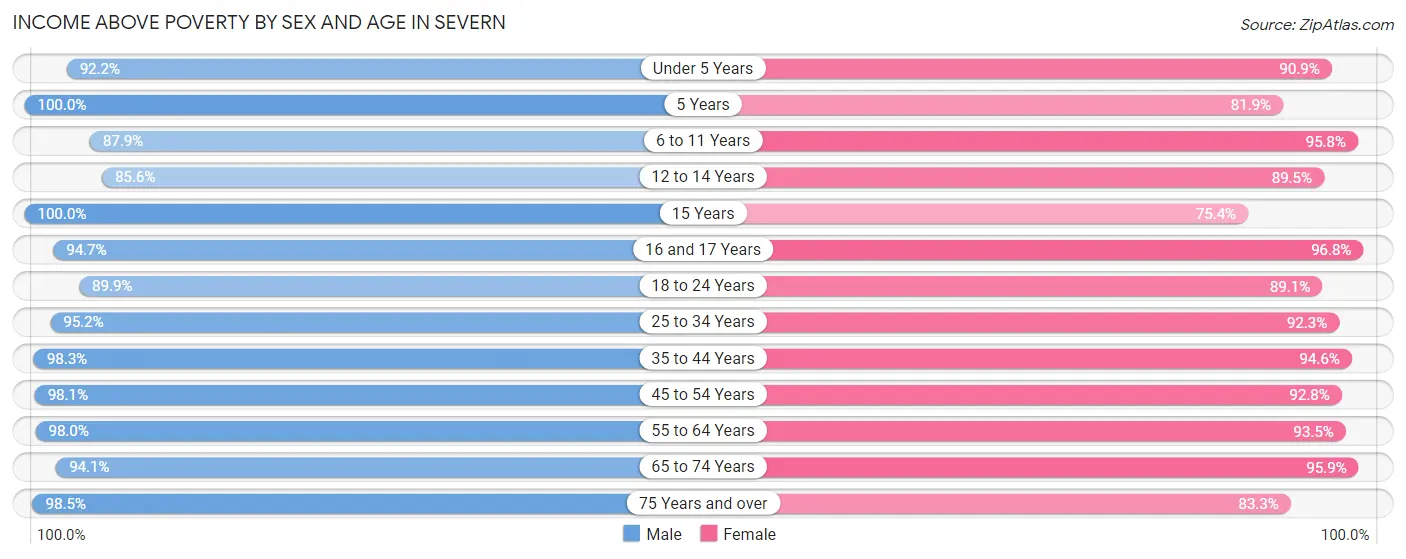
| Age Bracket | Male | Female |
| Under 5 Years | 1,828 (92.2%) | 1,551 (90.9%) |
| 5 Years | 463 (100.0%) | 280 (81.9%) |
| 6 to 11 Years | 2,116 (87.9%) | 2,084 (95.8%) |
| 12 to 14 Years | 763 (85.6%) | 840 (89.5%) |
| 15 Years | 233 (100.0%) | 346 (75.4%) |
| 16 and 17 Years | 622 (94.7%) | 479 (96.8%) |
| 18 to 24 Years | 2,378 (89.9%) | 1,992 (89.1%) |
| 25 to 34 Years | 4,349 (95.2%) | 4,405 (92.3%) |
| 35 to 44 Years | 4,252 (98.3%) | 4,052 (94.6%) |
| 45 to 54 Years | 3,521 (98.1%) | 3,324 (92.8%) |
| 55 to 64 Years | 3,172 (98.0%) | 3,433 (93.5%) |
| 65 to 74 Years | 2,131 (94.1%) | 2,274 (95.9%) |
| 75 Years and over | 720 (98.5%) | 942 (83.3%) |
| Total | 26,548 (94.8%) | 26,002 (92.3%) |
Income Below Poverty Among Married-Couple Families in Severn
The poverty statistics for married-couple families in Severn show that 1.9% or 220 of the total 11,587 families live below the poverty line. Families with 3 or 4 children have the highest poverty rate of 3.1%, comprising of 38 families. On the other hand, families with 1 or 2 children have the lowest poverty rate of 1.7%, which includes 65 families.
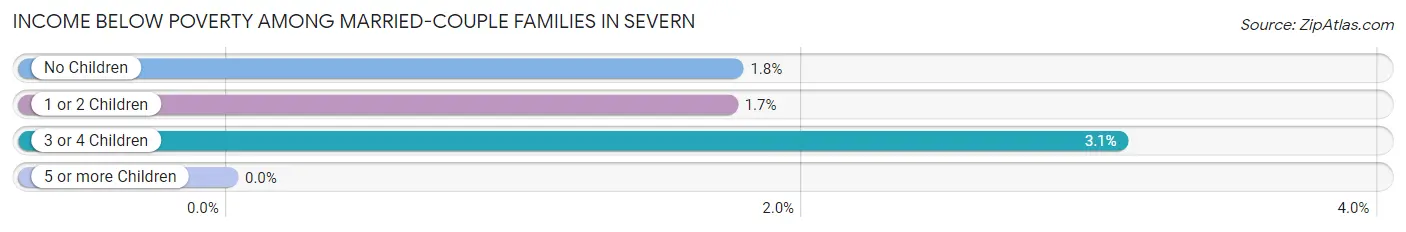
| Children | Above Poverty | Below Poverty |
| No Children | 6,518 (98.2%) | 117 (1.8%) |
| 1 or 2 Children | 3,662 (98.3%) | 65 (1.7%) |
| 3 or 4 Children | 1,187 (96.9%) | 38 (3.1%) |
| 5 or more Children | 0 (0.0%) | 0 (0.0%) |
| Total | 11,367 (98.1%) | 220 (1.9%) |
Income Below Poverty Among Single-Parent Households in Severn
According to the poverty data in Severn, 0.6% or 5 single-father households and 16.4% or 464 single-mother households are living below the poverty line. Among single-father households, those with 1 or 2 children have the highest poverty rate, with 5 households (1.5%) experiencing poverty. Likewise, among single-mother households, those with 3 or 4 children have the highest poverty rate, with 113 households (32.8%) falling below the poverty line.
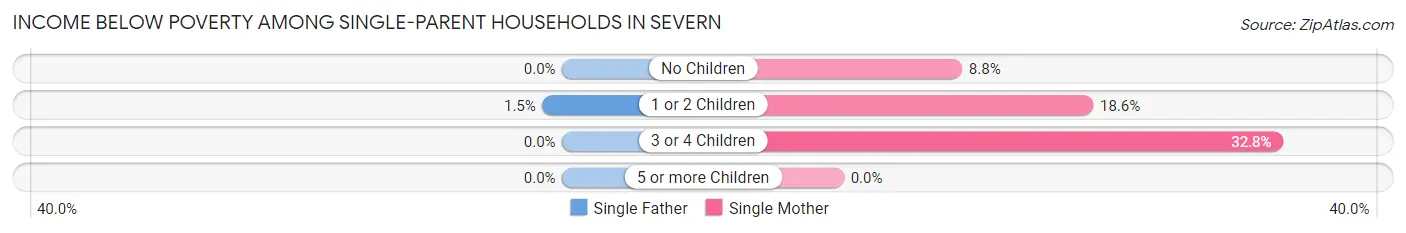
| Children | Single Father | Single Mother |
| No Children | 0 (0.0%) | 100 (8.8%) |
| 1 or 2 Children | 5 (1.5%) | 251 (18.6%) |
| 3 or 4 Children | 0 (0.0%) | 113 (32.8%) |
| 5 or more Children | 0 (0.0%) | 0 (0.0%) |
| Total | 5 (0.6%) | 464 (16.4%) |
Income Below Poverty Among Married-Couple vs Single-Parent Households in Severn
The poverty data for Severn shows that 220 of the married-couple family households (1.9%) and 469 of the single-parent households (13.0%) are living below the poverty level. Within the married-couple family households, those with 3 or 4 children have the highest poverty rate, with 38 households (3.1%) falling below the poverty line. Among the single-parent households, those with 3 or 4 children have the highest poverty rate, with 113 household (31.7%) living below poverty.
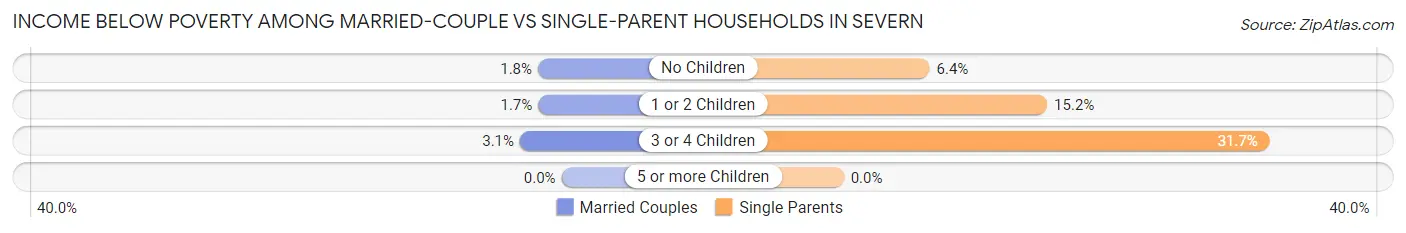
| Children | Married-Couple Families | Single-Parent Households |
| No Children | 117 (1.8%) | 100 (6.4%) |
| 1 or 2 Children | 65 (1.7%) | 256 (15.2%) |
| 3 or 4 Children | 38 (3.1%) | 113 (31.7%) |
| 5 or more Children | 0 (0.0%) | 0 (0.0%) |
| Total | 220 (1.9%) | 469 (13.0%) |
Race in Severn
The most populous races in Severn are White / Caucasian (25,415 | 45.0%), Black / African American (19,326 | 34.2%), and Hispanic or Latino (4,922 | 8.7%).
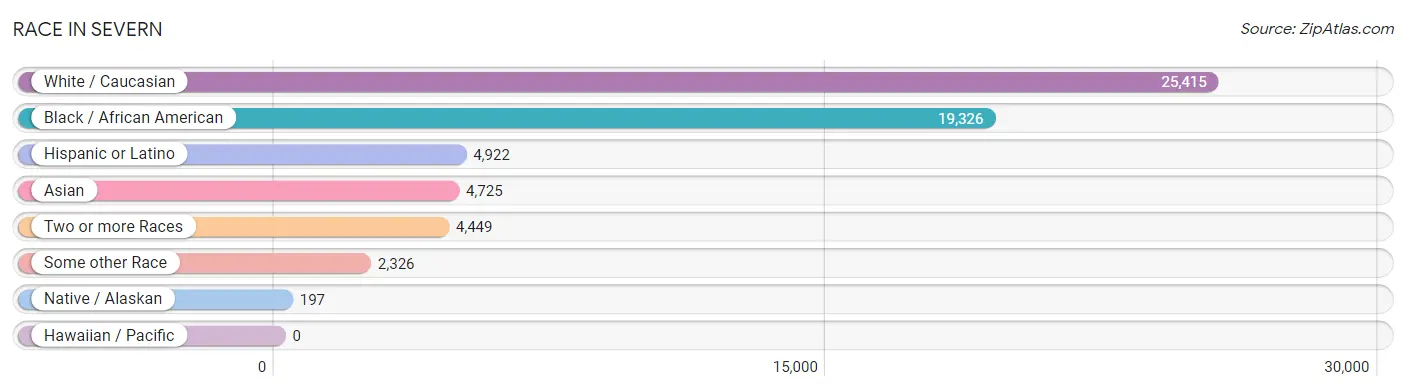
| Race | # Population | % Population |
| Asian | 4,725 | 8.4% |
| Black / African American | 19,326 | 34.2% |
| Hawaiian / Pacific | 0 | 0.0% |
| Hispanic or Latino | 4,922 | 8.7% |
| Native / Alaskan | 197 | 0.4% |
| White / Caucasian | 25,415 | 45.0% |
| Two or more Races | 4,449 | 7.9% |
| Some other Race | 2,326 | 4.1% |
| Total | 56,438 | 100.0% |
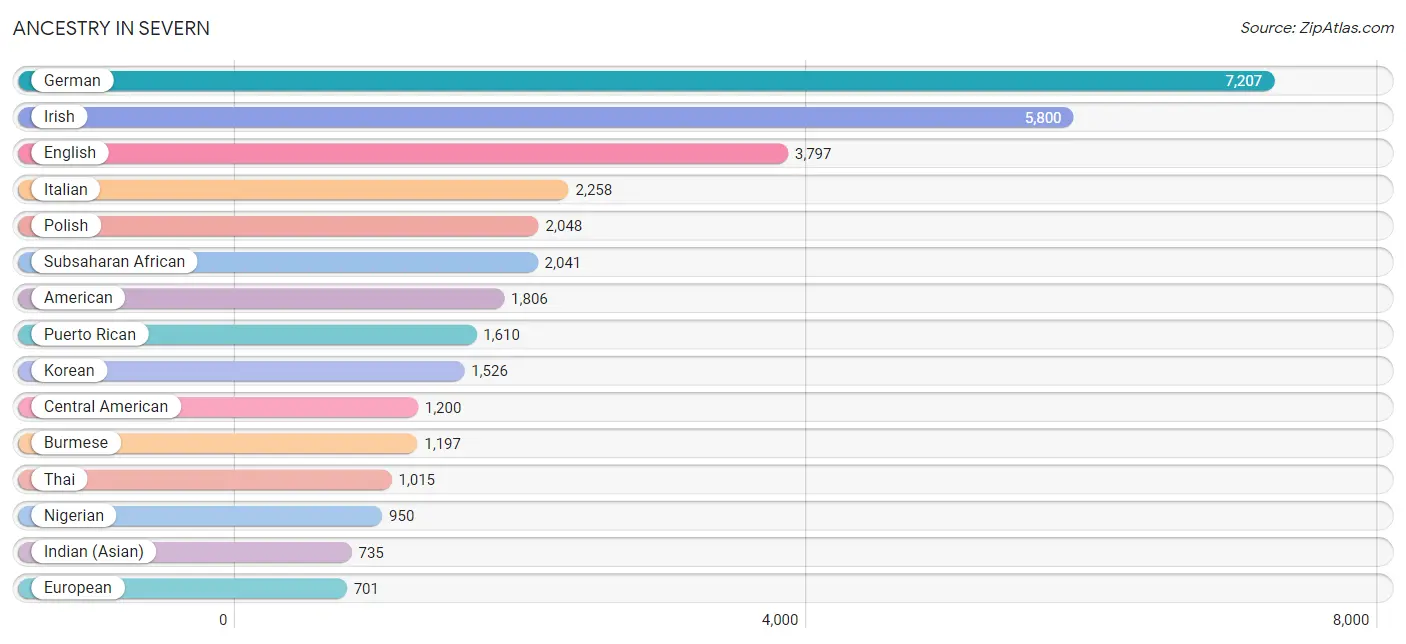
Ancestry in Severn
The most populous ancestries reported in Severn are German (7,207 | 12.8%), Irish (5,800 | 10.3%), English (3,797 | 6.7%), Italian (2,258 | 4.0%), and Polish (2,048 | 3.6%), together accounting for 37.4% of all Severn residents.
| Ancestry | # Population | % Population |
| Afghan | 153 | 0.3% |
| African | 447 | 0.8% |
| Albanian | 18 | 0.0% |
| American | 1,806 | 3.2% |
| Arab | 239 | 0.4% |
| Argentinean | 16 | 0.0% |
| Armenian | 27 | 0.1% |
| Austrian | 16 | 0.0% |
| Belgian | 73 | 0.1% |
| Bhutanese | 283 | 0.5% |
| Blackfeet | 38 | 0.1% |
| Bolivian | 252 | 0.4% |
| British | 550 | 1.0% |
| British West Indian | 51 | 0.1% |
| Burmese | 1,197 | 2.1% |
| Cajun | 51 | 0.1% |
| Canadian | 64 | 0.1% |
| Cape Verdean | 34 | 0.1% |
| Celtic | 53 | 0.1% |
| Central American | 1,200 | 2.1% |
| Central American Indian | 302 | 0.5% |
| Cherokee | 356 | 0.6% |
| Colombian | 17 | 0.0% |
| Croatian | 203 | 0.4% |
| Cuban | 132 | 0.2% |
| Czech | 60 | 0.1% |
| Czechoslovakian | 7 | 0.0% |
| Danish | 84 | 0.2% |
| Dominican | 262 | 0.5% |
| Dutch | 251 | 0.4% |
| Eastern European | 212 | 0.4% |
| Egyptian | 86 | 0.2% |
| English | 3,797 | 6.7% |
| Ethiopian | 52 | 0.1% |
| European | 701 | 1.2% |
| Filipino | 2 | 0.0% |
| Finnish | 37 | 0.1% |
| French | 652 | 1.2% |
| French Canadian | 222 | 0.4% |
| German | 7,207 | 12.8% |
| German Russian | 44 | 0.1% |
| Ghanaian | 415 | 0.7% |
| Greek | 229 | 0.4% |
| Guamanian / Chamorro | 64 | 0.1% |
| Guatemalan | 139 | 0.3% |
| Guyanese | 89 | 0.2% |
| Haitian | 543 | 1.0% |
| Honduran | 301 | 0.5% |
| Hungarian | 122 | 0.2% |
| Indian (Asian) | 735 | 1.3% |
| Indonesian | 218 | 0.4% |
| Iranian | 19 | 0.0% |
| Iraqi | 74 | 0.1% |
| Irish | 5,800 | 10.3% |
| Italian | 2,258 | 4.0% |
| Jamaican | 209 | 0.4% |
| Korean | 1,526 | 2.7% |
| Latvian | 55 | 0.1% |
| Lebanese | 10 | 0.0% |
| Liberian | 42 | 0.1% |
| Lithuanian | 73 | 0.1% |
| Malaysian | 9 | 0.0% |
| Mexican | 646 | 1.1% |
| Native Hawaiian | 172 | 0.3% |
| Nicaraguan | 10 | 0.0% |
| Nigerian | 950 | 1.7% |
| Northern European | 80 | 0.1% |
| Norwegian | 395 | 0.7% |
| Pakistani | 9 | 0.0% |
| Panamanian | 160 | 0.3% |
| Paraguayan | 12 | 0.0% |
| Pennsylvania German | 30 | 0.1% |
| Peruvian | 38 | 0.1% |
| Polish | 2,048 | 3.6% |
| Portuguese | 48 | 0.1% |
| Puerto Rican | 1,610 | 2.9% |
| Russian | 212 | 0.4% |
| Salvadoran | 590 | 1.1% |
| Samoan | 17 | 0.0% |
| Scandinavian | 106 | 0.2% |
| Scotch-Irish | 205 | 0.4% |
| Scottish | 689 | 1.2% |
| Serbian | 31 | 0.1% |
| Sierra Leonean | 24 | 0.0% |
| Slavic | 25 | 0.0% |
| Slovak | 345 | 0.6% |
| Slovene | 43 | 0.1% |
| South African | 23 | 0.0% |
| South American | 356 | 0.6% |
| Spaniard | 112 | 0.2% |
| Spanish | 319 | 0.6% |
| Spanish American | 56 | 0.1% |
| Sri Lankan | 438 | 0.8% |
| Subsaharan African | 2,041 | 3.6% |
| Swedish | 33 | 0.1% |
| Swiss | 67 | 0.1% |
| Syrian | 41 | 0.1% |
| Thai | 1,015 | 1.8% |
| Trinidadian and Tobagonian | 37 | 0.1% |
| Turkish | 152 | 0.3% |
| Ukrainian | 190 | 0.3% |
| Venezuelan | 21 | 0.0% |
| Welsh | 394 | 0.7% |
| Yugoslavian | 90 | 0.2% |
| Yuman | 139 | 0.3% | View All 105 Rows |
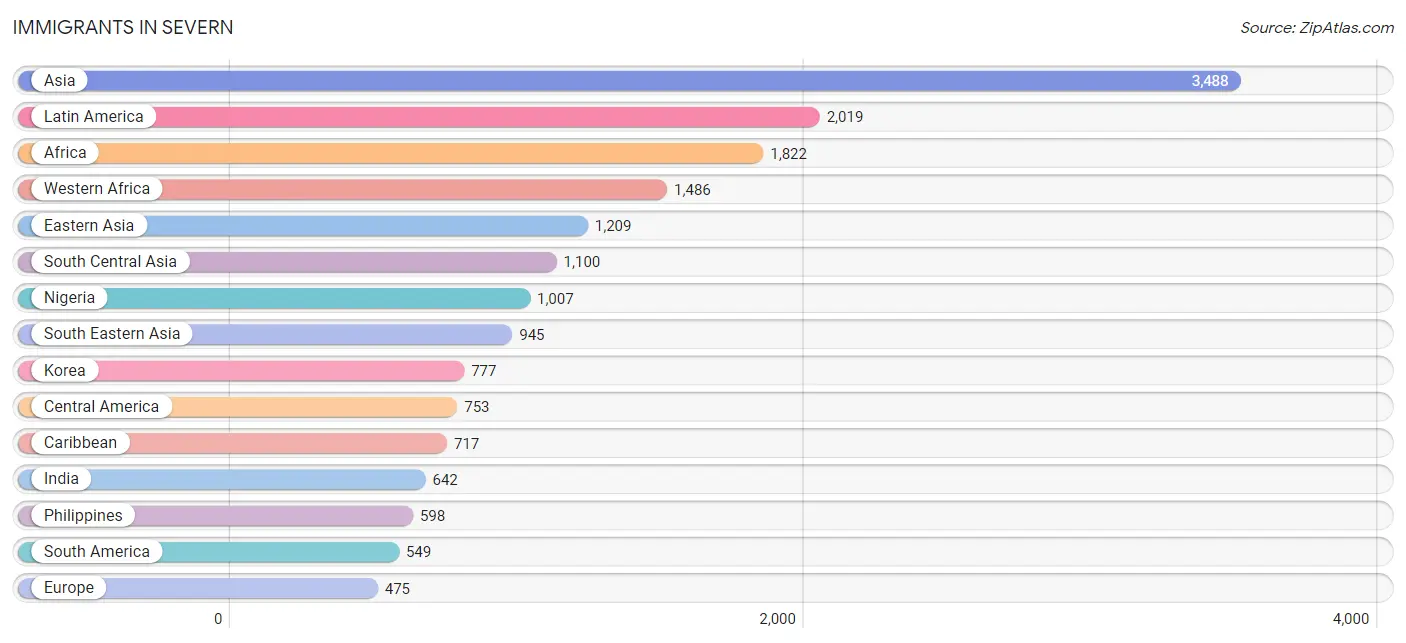
Immigrants in Severn
The most numerous immigrant groups reported in Severn came from Asia (3,488 | 6.2%), Latin America (2,019 | 3.6%), Africa (1,822 | 3.2%), Western Africa (1,486 | 2.6%), and Eastern Asia (1,209 | 2.1%), together accounting for 17.8% of all Severn residents.
| Immigration Origin | # Population | % Population |
| Afghanistan | 37 | 0.1% |
| Africa | 1,822 | 3.2% |
| Albania | 18 | 0.0% |
| Asia | 3,488 | 6.2% |
| Australia | 13 | 0.0% |
| Bahamas | 20 | 0.0% |
| Bangladesh | 15 | 0.0% |
| Belarus | 7 | 0.0% |
| Bolivia | 120 | 0.2% |
| Brazil | 79 | 0.1% |
| Cabo Verde | 25 | 0.0% |
| Cameroon | 25 | 0.0% |
| Canada | 116 | 0.2% |
| Caribbean | 717 | 1.3% |
| Central America | 753 | 1.3% |
| China | 360 | 0.6% |
| Colombia | 182 | 0.3% |
| Cuba | 15 | 0.0% |
| Dominican Republic | 152 | 0.3% |
| Eastern Africa | 132 | 0.2% |
| Eastern Asia | 1,209 | 2.1% |
| Eastern Europe | 133 | 0.2% |
| Egypt | 125 | 0.2% |
| El Salvador | 218 | 0.4% |
| England | 1 | 0.0% |
| Ethiopia | 78 | 0.1% |
| Europe | 475 | 0.8% |
| France | 23 | 0.0% |
| Germany | 191 | 0.3% |
| Ghana | 443 | 0.8% |
| Guatemala | 118 | 0.2% |
| Guyana | 104 | 0.2% |
| Haiti | 88 | 0.2% |
| Honduras | 121 | 0.2% |
| Hong Kong | 67 | 0.1% |
| Hungary | 8 | 0.0% |
| India | 642 | 1.1% |
| Iraq | 89 | 0.2% |
| Italy | 26 | 0.1% |
| Jamaica | 240 | 0.4% |
| Japan | 72 | 0.1% |
| Korea | 777 | 1.4% |
| Latin America | 2,019 | 3.6% |
| Liberia | 11 | 0.0% |
| Mexico | 91 | 0.2% |
| Middle Africa | 48 | 0.1% |
| Nepal | 133 | 0.2% |
| Netherlands | 7 | 0.0% |
| Nigeria | 1,007 | 1.8% |
| Northern Africa | 125 | 0.2% |
| Northern Europe | 95 | 0.2% |
| Norway | 35 | 0.1% |
| Oceania | 13 | 0.0% |
| Pakistan | 259 | 0.5% |
| Panama | 205 | 0.4% |
| Philippines | 598 | 1.1% |
| Poland | 51 | 0.1% |
| Romania | 9 | 0.0% |
| Russia | 40 | 0.1% |
| Saudi Arabia | 38 | 0.1% |
| Scotland | 15 | 0.0% |
| Somalia | 49 | 0.1% |
| South Africa | 31 | 0.1% |
| South America | 549 | 1.0% |
| South Central Asia | 1,100 | 1.9% |
| South Eastern Asia | 945 | 1.7% |
| Southern Europe | 26 | 0.1% |
| Sri Lanka | 14 | 0.0% |
| Sweden | 28 | 0.1% |
| Syria | 10 | 0.0% |
| Taiwan | 30 | 0.1% |
| Thailand | 33 | 0.1% |
| Trinidad and Tobago | 160 | 0.3% |
| Turkey | 97 | 0.2% |
| Venezuela | 38 | 0.1% |
| Vietnam | 155 | 0.3% |
| Western Africa | 1,486 | 2.6% |
| Western Asia | 234 | 0.4% |
| Western Europe | 221 | 0.4% | View All 79 Rows |
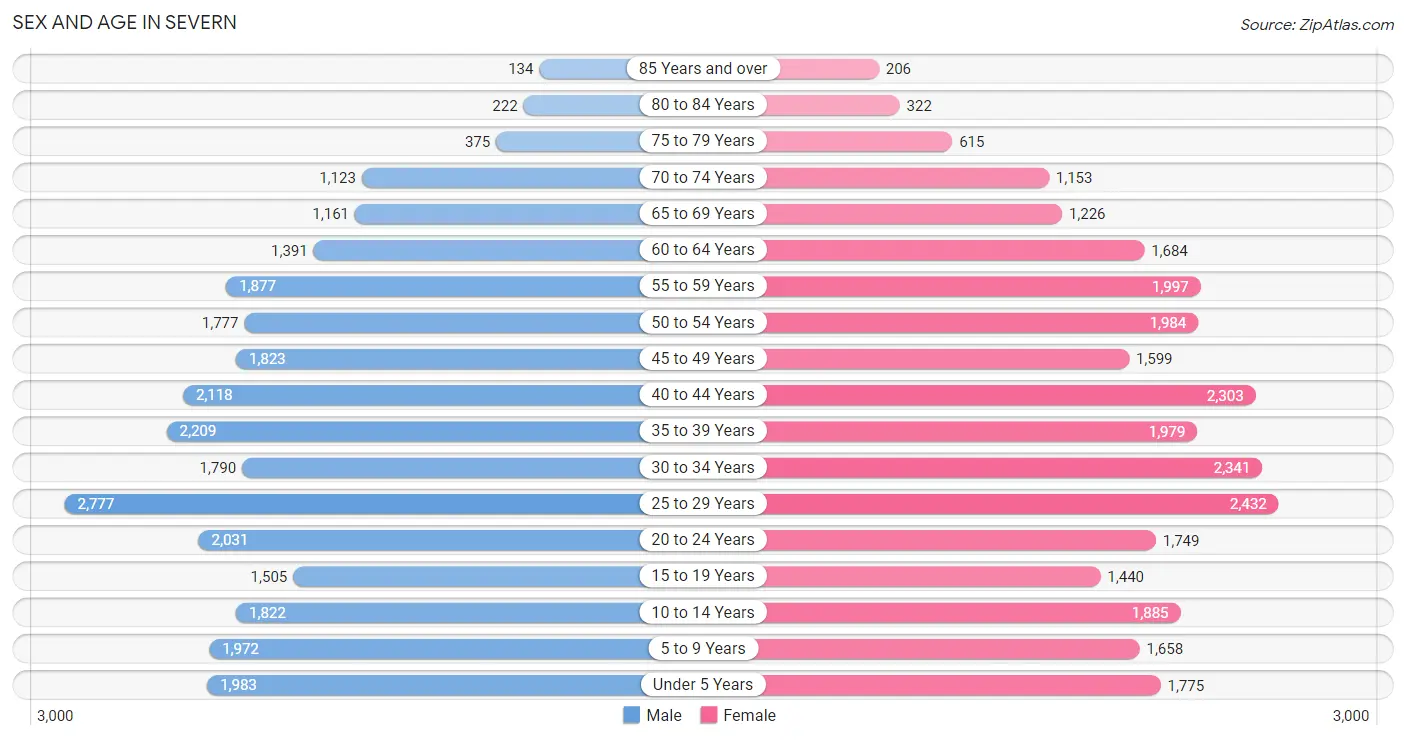
Sex and Age in Severn
Sex and Age in Severn
The most populous age groups in Severn are 25 to 29 Years (2,777 | 9.9%) for men and 25 to 29 Years (2,432 | 8.6%) for women.
| Age Bracket | Male | Female |
| Under 5 Years | 1,983 (7.1%) | 1,775 (6.3%) |
| 5 to 9 Years | 1,972 (7.0%) | 1,658 (5.9%) |
| 10 to 14 Years | 1,822 (6.5%) | 1,885 (6.7%) |
| 15 to 19 Years | 1,505 (5.4%) | 1,440 (5.1%) |
| 20 to 24 Years | 2,031 (7.2%) | 1,749 (6.2%) |
| 25 to 29 Years | 2,777 (9.9%) | 2,432 (8.6%) |
| 30 to 34 Years | 1,790 (6.4%) | 2,341 (8.3%) |
| 35 to 39 Years | 2,209 (7.9%) | 1,979 (7.0%) |
| 40 to 44 Years | 2,118 (7.5%) | 2,303 (8.1%) |
| 45 to 49 Years | 1,823 (6.5%) | 1,599 (5.6%) |
| 50 to 54 Years | 1,777 (6.3%) | 1,984 (7.0%) |
| 55 to 59 Years | 1,877 (6.7%) | 1,997 (7.0%) |
| 60 to 64 Years | 1,391 (5.0%) | 1,684 (5.9%) |
| 65 to 69 Years | 1,161 (4.1%) | 1,226 (4.3%) |
| 70 to 74 Years | 1,123 (4.0%) | 1,153 (4.1%) |
| 75 to 79 Years | 375 (1.3%) | 615 (2.2%) |
| 80 to 84 Years | 222 (0.8%) | 322 (1.1%) |
| 85 Years and over | 134 (0.5%) | 206 (0.7%) |
| Total | 28,090 (100.0%) | 28,348 (100.0%) |
Families and Households in Severn
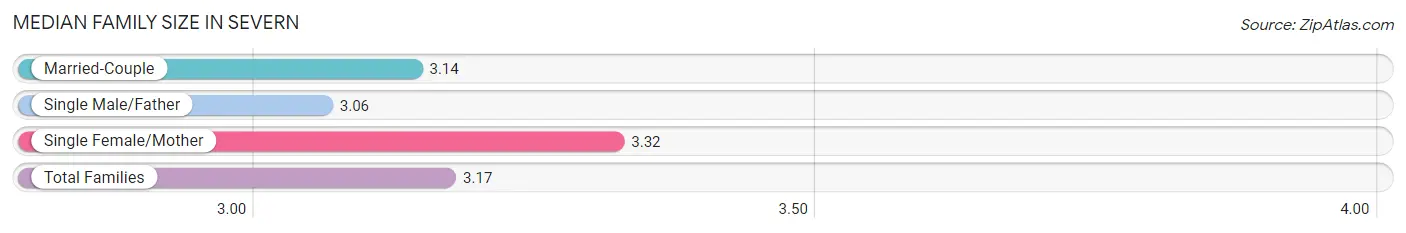
Median Family Size in Severn
The median family size in Severn is 3.17 persons per family, with single female/mother families (2,831 | 18.6%) accounting for the largest median family size of 3.32 persons per family. On the other hand, single male/father families (776 | 5.1%) represent the smallest median family size with 3.06 persons per family.
| Family Type | # Families | Family Size |
| Married-Couple | 11,587 (76.3%) | 3.14 |
| Single Male/Father | 776 (5.1%) | 3.06 |
| Single Female/Mother | 2,831 (18.6%) | 3.32 |
| Total Families | 15,194 (100.0%) | 3.17 |
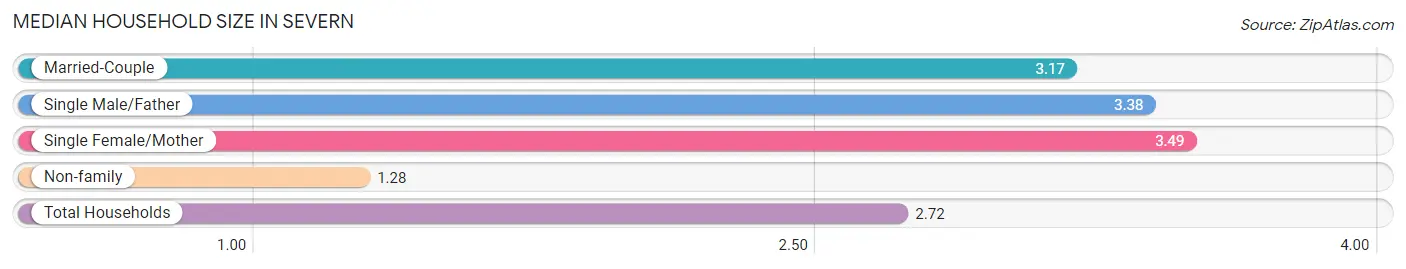
Median Household Size in Severn
The median household size in Severn is 2.72 persons per household, with single female/mother households (2,831 | 13.7%) accounting for the largest median household size of 3.49 persons per household. non-family households (5,542 | 26.7%) represent the smallest median household size with 1.28 persons per household.
| Household Type | # Households | Household Size |
| Married-Couple | 11,587 (55.9%) | 3.17 |
| Single Male/Father | 776 (3.7%) | 3.38 |
| Single Female/Mother | 2,831 (13.7%) | 3.49 |
| Non-family | 5,542 (26.7%) | 1.28 |
| Total Households | 20,736 (100.0%) | 2.72 |
Household Size by Marriage Status in Severn
Out of a total of 20,736 households in Severn, 15,194 (73.3%) are family households, while 5,542 (26.7%) are nonfamily households. The most numerous type of family households are 2-person households, comprising 6,198, and the most common type of nonfamily households are 1-person households, comprising 4,340.
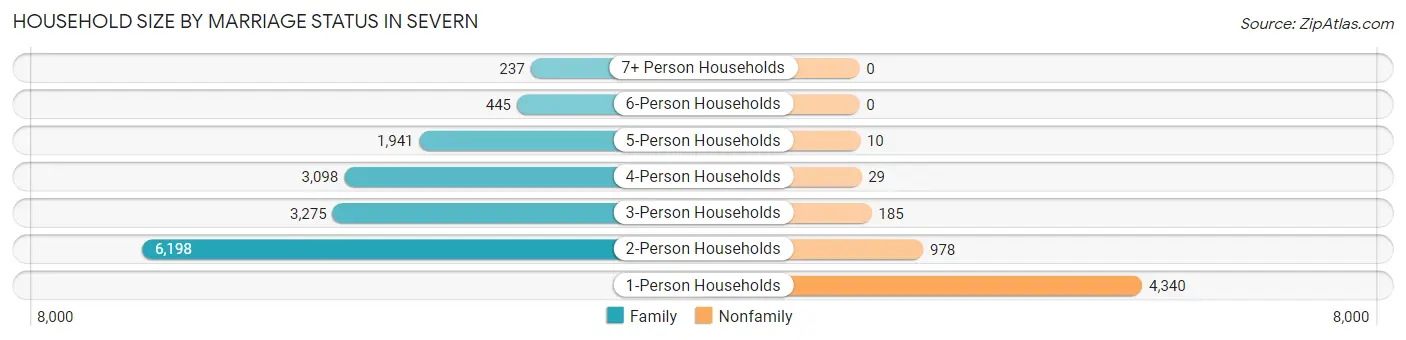
| Household Size | Family Households | Nonfamily Households |
| 1-Person Households | - | 4,340 (20.9%) |
| 2-Person Households | 6,198 (29.9%) | 978 (4.7%) |
| 3-Person Households | 3,275 (15.8%) | 185 (0.9%) |
| 4-Person Households | 3,098 (14.9%) | 29 (0.1%) |
| 5-Person Households | 1,941 (9.4%) | 10 (0.1%) |
| 6-Person Households | 445 (2.1%) | 0 (0.0%) |
| 7+ Person Households | 237 (1.1%) | 0 (0.0%) |
| Total | 15,194 (73.3%) | 5,542 (26.7%) |
Female Fertility in Severn
Fertility by Age in Severn
Average fertility rate in Severn is 68.0 births per 1,000 women. Women in the age bracket of 20 to 34 years have the highest fertility rate with 95.0 births per 1,000 women. Women in the age bracket of 20 to 34 years acount for 63.6% of all women with births.
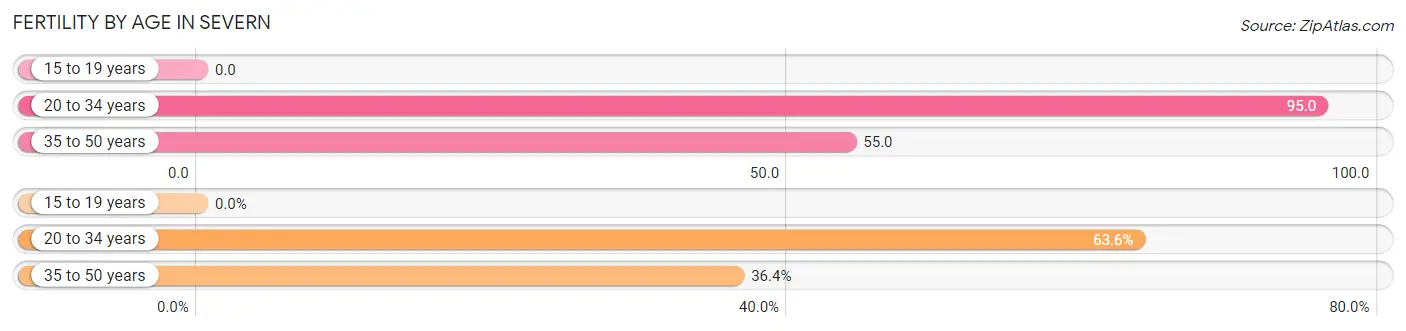
| Age Bracket | Women with Births | Births / 1,000 Women |
| 15 to 19 years | 0 (0.0%) | 0.0 |
| 20 to 34 years | 617 (63.6%) | 95.0 |
| 35 to 50 years | 353 (36.4%) | 55.0 |
| Total | 970 (100.0%) | 68.0 |
Fertility by Age by Marriage Status in Severn
84.9% of women with births (970) in Severn are married. The highest percentage of unmarried women with births falls into 20 to 34 years age bracket with 21.1% of them unmarried at the time of birth, while the lowest percentage of unmarried women with births belong to 35 to 50 years age bracket with 4.5% of them unmarried.
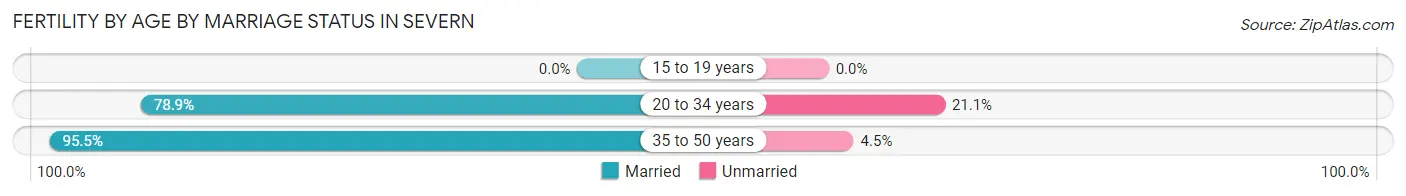
| Age Bracket | Married | Unmarried |
| 15 to 19 years | 0 (0.0%) | 0 (0.0%) |
| 20 to 34 years | 487 (78.9%) | 130 (21.1%) |
| 35 to 50 years | 337 (95.5%) | 16 (4.5%) |
| Total | 824 (85.0%) | 146 (15.0%) |
Fertility by Education in Severn
Average fertility rate in Severn is 68.0 births per 1,000 women. Women with the education attainment of less than high school have the highest fertility rate of 108.0 births per 1,000 women, while women with the education attainment of bachelor's degree have the lowest fertility at 40.0 births per 1,000 women. Women with the education attainment of college or associate's degree represent 29.9% of all women with births.
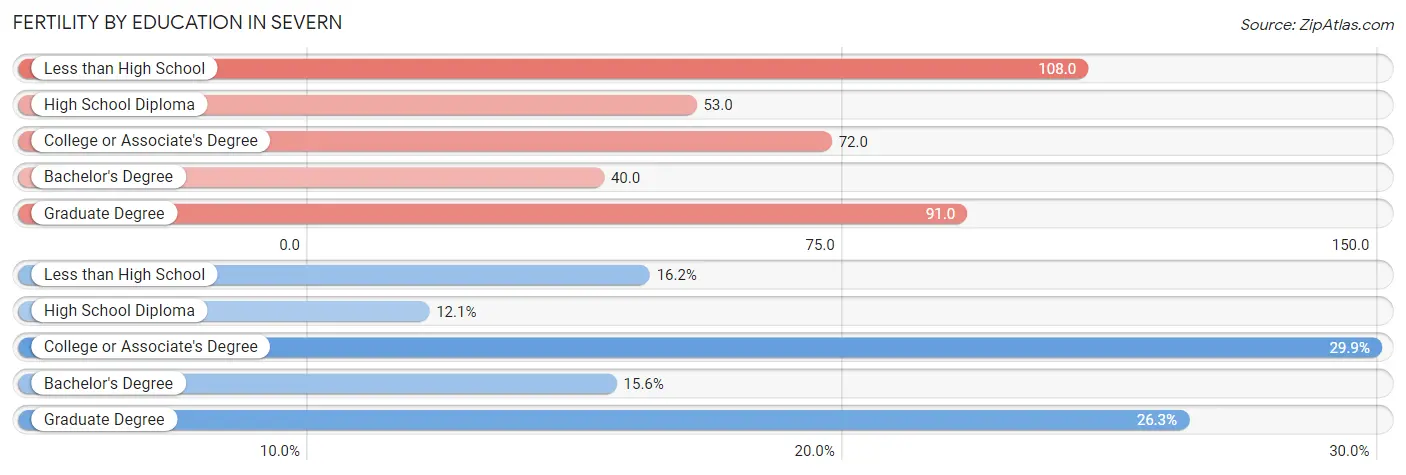
| Educational Attainment | Women with Births | Births / 1,000 Women |
| Less than High School | 157 (16.2%) | 108.0 |
| High School Diploma | 117 (12.1%) | 53.0 |
| College or Associate's Degree | 290 (29.9%) | 72.0 |
| Bachelor's Degree | 151 (15.6%) | 40.0 |
| Graduate Degree | 255 (26.3%) | 91.0 |
| Total | 970 (100.0%) | 68.0 |
Fertility by Education by Marriage Status in Severn
15.0% of women with births in Severn are unmarried. Women with the educational attainment of college or associate's degree are most likely to be married with 100.0% of them married at childbirth, while women with the educational attainment of high school diploma are least likely to be married with 82.1% of them unmarried at childbirth.
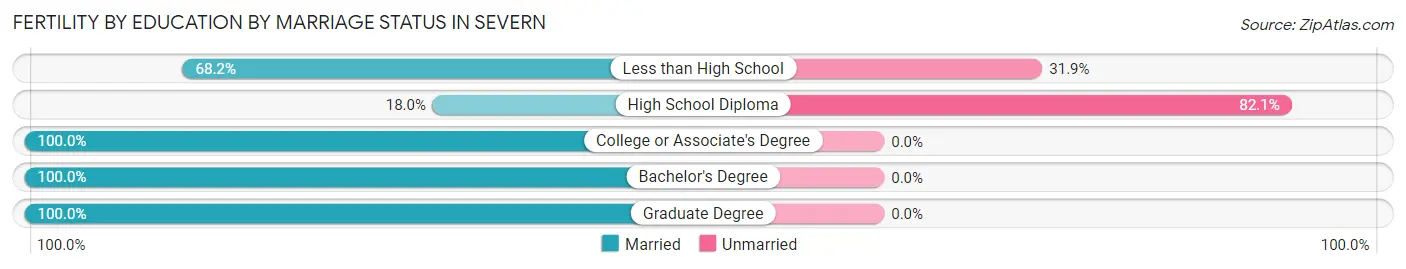
| Educational Attainment | Married | Unmarried |
| Less than High School | 107 (68.1%) | 50 (31.9%) |
| High School Diploma | 21 (17.9%) | 96 (82.1%) |
| College or Associate's Degree | 290 (100.0%) | 0 (0.0%) |
| Bachelor's Degree | 151 (100.0%) | 0 (0.0%) |
| Graduate Degree | 255 (100.0%) | 0 (0.0%) |
| Total | 824 (85.0%) | 146 (15.0%) |
Employment Characteristics in Severn
Employment by Class of Employer in Severn
Among the 30,130 employed individuals in Severn, private company employees (17,060 | 56.6%), federal government employees (6,129 | 20.3%), and not-for-profit organizations (2,478 | 8.2%) make up the most common classes of employment.
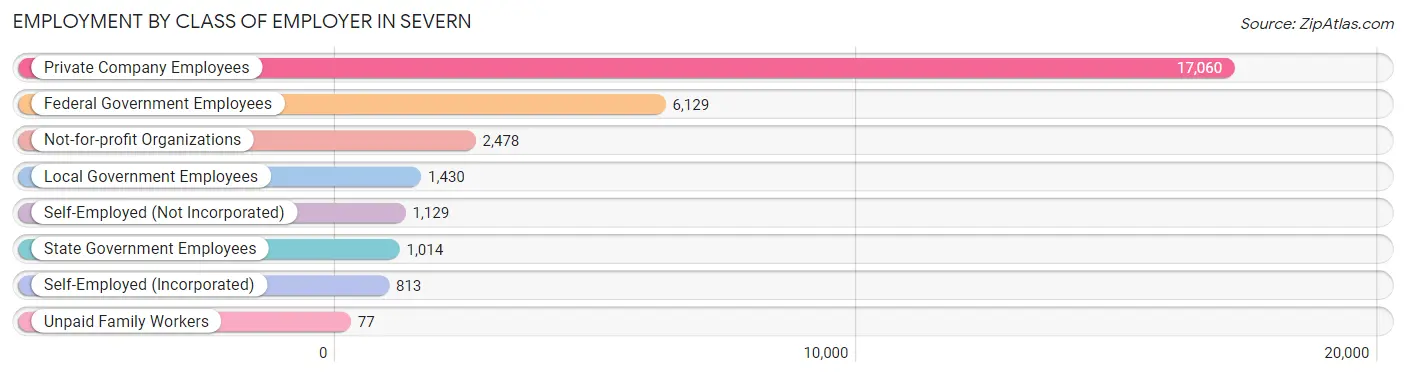
| Employer Class | # Employees | % Employees |
| Private Company Employees | 17,060 | 56.6% |
| Self-Employed (Incorporated) | 813 | 2.7% |
| Self-Employed (Not Incorporated) | 1,129 | 3.7% |
| Not-for-profit Organizations | 2,478 | 8.2% |
| Local Government Employees | 1,430 | 4.8% |
| State Government Employees | 1,014 | 3.4% |
| Federal Government Employees | 6,129 | 20.3% |
| Unpaid Family Workers | 77 | 0.3% |
| Total | 30,130 | 100.0% |
Employment Status by Age in Severn
According to the labor force statistics for Severn, out of the total population over 16 years of age (44,651), 72.1% or 32,193 individuals are in the labor force, with 4.9% or 1,577 of them unemployed. The age group with the highest labor force participation rate is 25 to 29 years, with 93.5% or 4,870 individuals in the labor force. Within the labor force, the 16 to 19 years age range has the highest percentage of unemployed individuals, with 24.5% or 190 of them being unemployed.
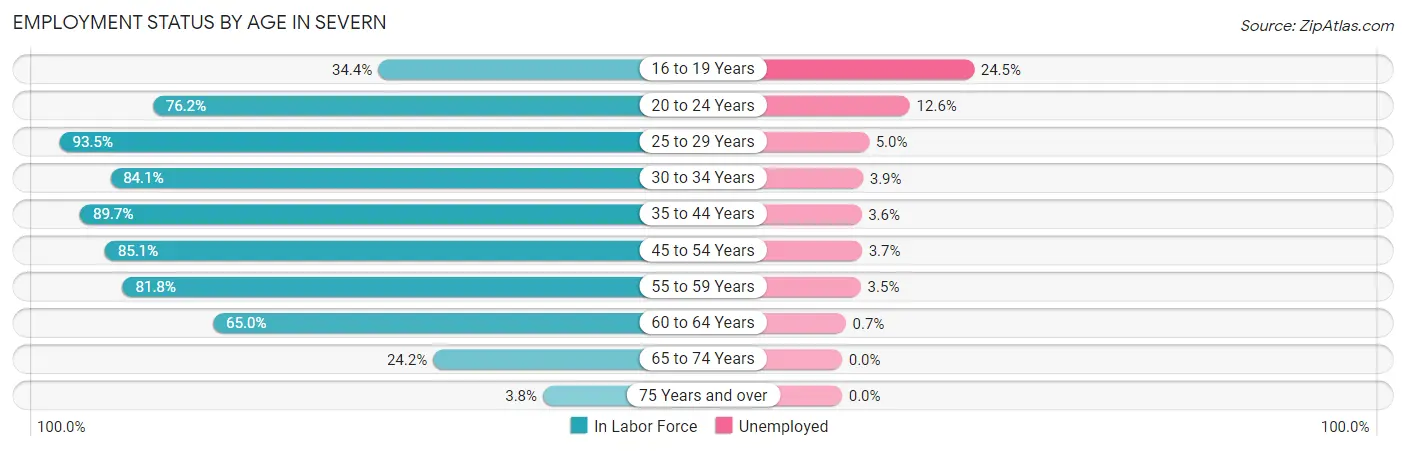
| Age Bracket | In Labor Force | Unemployed |
| 16 to 19 Years | 775 (34.4%) | 190 (24.5%) |
| 20 to 24 Years | 2,880 (76.2%) | 363 (12.6%) |
| 25 to 29 Years | 4,870 (93.5%) | 244 (5.0%) |
| 30 to 34 Years | 3,474 (84.1%) | 135 (3.9%) |
| 35 to 44 Years | 7,722 (89.7%) | 278 (3.6%) |
| 45 to 54 Years | 6,113 (85.1%) | 226 (3.7%) |
| 55 to 59 Years | 3,169 (81.8%) | 111 (3.5%) |
| 60 to 64 Years | 1,999 (65.0%) | 14 (0.7%) |
| 65 to 74 Years | 1,128 (24.2%) | 0 (0.0%) |
| 75 Years and over | 71 (3.8%) | 0 (0.0%) |
| Total | 32,193 (72.1%) | 1,577 (4.9%) |
Employment Status by Educational Attainment in Severn
According to labor force statistics for Severn, 85.2% of individuals (27,333) out of the total population between 25 and 64 years of age (32,081) are in the labor force, with 3.7% or 1,011 of them being unemployed. The group with the highest labor force participation rate are those with the educational attainment of bachelor's degree or higher, with 89.8% or 12,852 individuals in the labor force. Within the labor force, individuals with less than high school education have the highest percentage of unemployment, with 9.2% or 97 of them being unemployed.
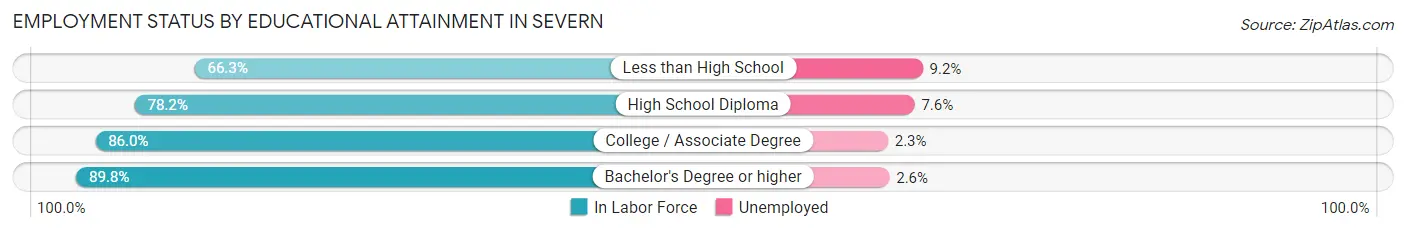
| Educational Attainment | In Labor Force | Unemployed |
| Less than High School | 1,057 (66.3%) | 147 (9.2%) |
| High School Diploma | 4,790 (78.2%) | 466 (7.6%) |
| College / Associate Degree | 8,643 (86.0%) | 231 (2.3%) |
| Bachelor's Degree or higher | 12,852 (89.8%) | 372 (2.6%) |
| Total | 27,333 (85.2%) | 1,187 (3.7%) |
Employment Occupations by Sex in Severn
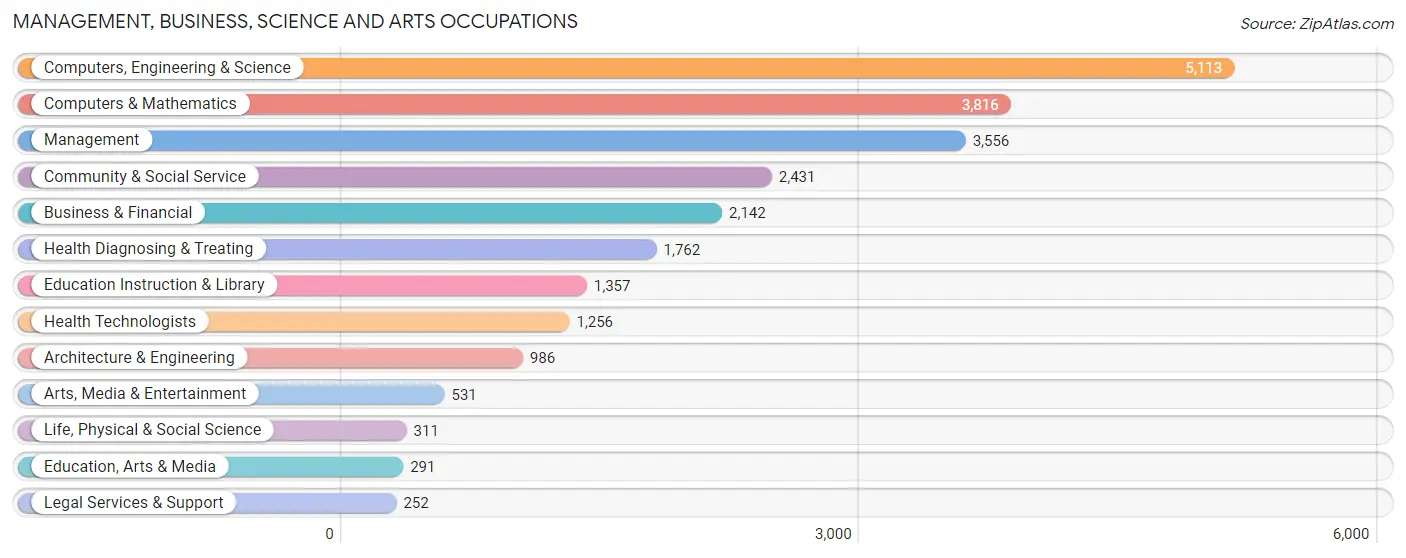
Management, Business, Science and Arts Occupations
The most common Management, Business, Science and Arts occupations in Severn are Computers, Engineering & Science (5,113 | 17.3%), Computers & Mathematics (3,816 | 12.9%), Management (3,556 | 12.0%), Community & Social Service (2,431 | 8.2%), and Business & Financial (2,142 | 7.2%).
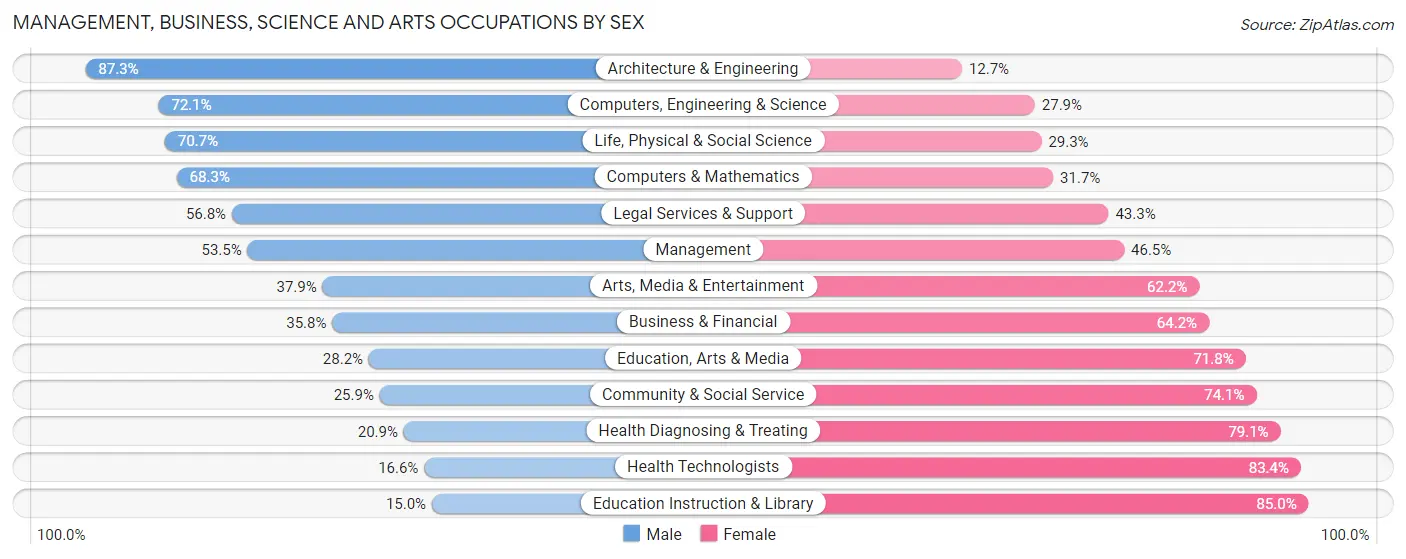
Management, Business, Science and Arts Occupations by Sex
Within the Management, Business, Science and Arts occupations in Severn, the most male-oriented occupations are Architecture & Engineering (87.3%), Computers, Engineering & Science (72.1%), and Life, Physical & Social Science (70.7%), while the most female-oriented occupations are Education Instruction & Library (85.0%), Health Technologists (83.4%), and Health Diagnosing & Treating (79.1%).
| Occupation | Male | Female |
| Management | 1,902 (53.5%) | 1,654 (46.5%) |
| Business & Financial | 767 (35.8%) | 1,375 (64.2%) |
| Computers, Engineering & Science | 3,687 (72.1%) | 1,426 (27.9%) |
| Computers & Mathematics | 2,606 (68.3%) | 1,210 (31.7%) |
| Architecture & Engineering | 861 (87.3%) | 125 (12.7%) |
| Life, Physical & Social Science | 220 (70.7%) | 91 (29.3%) |
| Community & Social Service | 630 (25.9%) | 1,801 (74.1%) |
| Education, Arts & Media | 82 (28.2%) | 209 (71.8%) |
| Legal Services & Support | 143 (56.8%) | 109 (43.2%) |
| Education Instruction & Library | 204 (15.0%) | 1,153 (85.0%) |
| Arts, Media & Entertainment | 201 (37.9%) | 330 (62.2%) |
| Health Diagnosing & Treating | 368 (20.9%) | 1,394 (79.1%) |
| Health Technologists | 209 (16.6%) | 1,047 (83.4%) |
| Total (Category) | 7,354 (49.0%) | 7,650 (51.0%) |
| Total (Overall) | 15,821 (53.6%) | 13,715 (46.4%) |
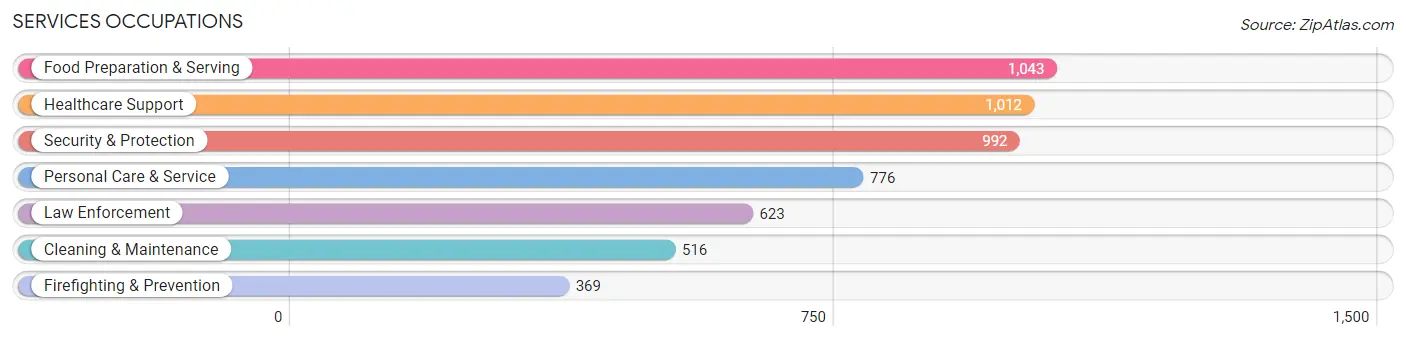
Services Occupations
The most common Services occupations in Severn are Food Preparation & Serving (1,043 | 3.5%), Healthcare Support (1,012 | 3.4%), Security & Protection (992 | 3.4%), Personal Care & Service (776 | 2.6%), and Law Enforcement (623 | 2.1%).
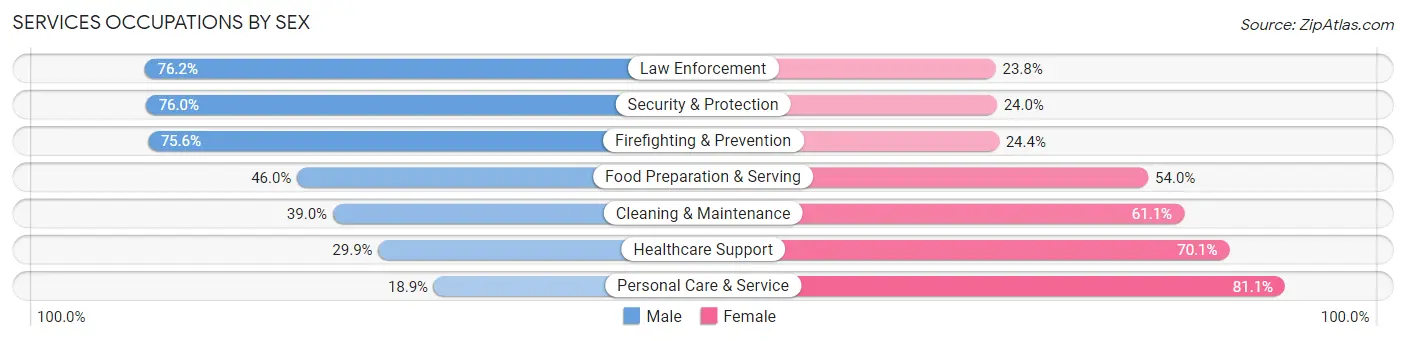
Services Occupations by Sex
Within the Services occupations in Severn, the most male-oriented occupations are Law Enforcement (76.2%), Security & Protection (76.0%), and Firefighting & Prevention (75.6%), while the most female-oriented occupations are Personal Care & Service (81.1%), Healthcare Support (70.1%), and Cleaning & Maintenance (61.1%).
| Occupation | Male | Female |
| Healthcare Support | 303 (29.9%) | 709 (70.1%) |
| Security & Protection | 754 (76.0%) | 238 (24.0%) |
| Firefighting & Prevention | 279 (75.6%) | 90 (24.4%) |
| Law Enforcement | 475 (76.2%) | 148 (23.8%) |
| Food Preparation & Serving | 480 (46.0%) | 563 (54.0%) |
| Cleaning & Maintenance | 201 (39.0%) | 315 (61.1%) |
| Personal Care & Service | 147 (18.9%) | 629 (81.1%) |
| Total (Category) | 1,885 (43.4%) | 2,454 (56.6%) |
| Total (Overall) | 15,821 (53.6%) | 13,715 (46.4%) |
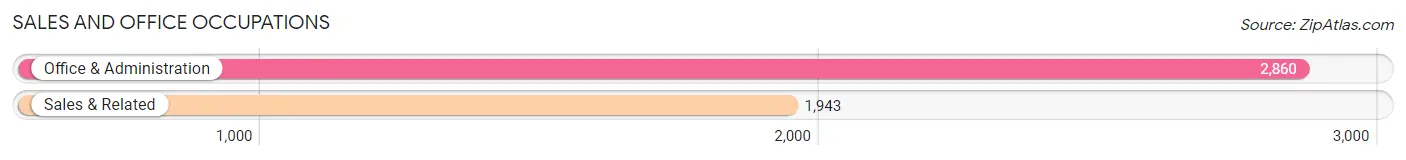
Sales and Office Occupations
The most common Sales and Office occupations in Severn are Office & Administration (2,860 | 9.7%), and Sales & Related (1,943 | 6.6%).
Sales and Office Occupations by Sex
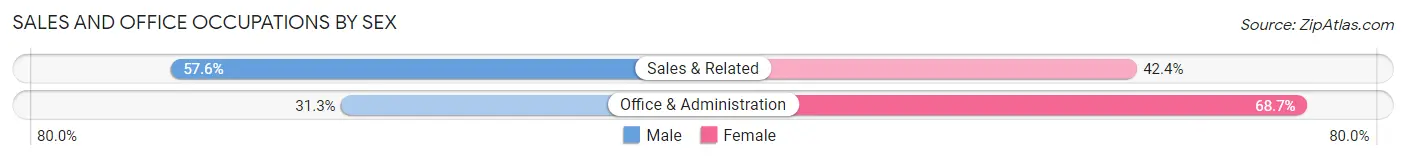
| Occupation | Male | Female |
| Sales & Related | 1,119 (57.6%) | 824 (42.4%) |
| Office & Administration | 894 (31.3%) | 1,966 (68.7%) |
| Total (Category) | 2,013 (41.9%) | 2,790 (58.1%) |
| Total (Overall) | 15,821 (53.6%) | 13,715 (46.4%) |
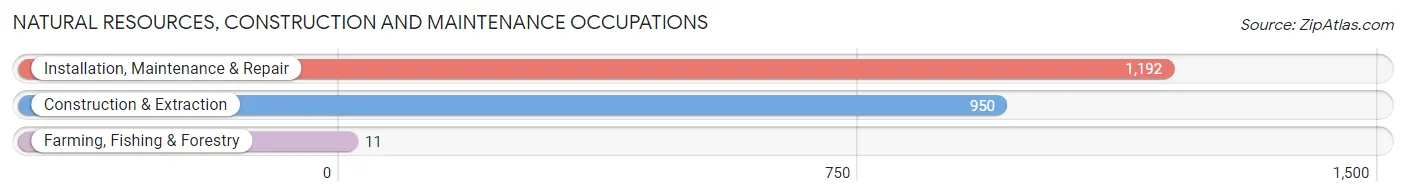
Natural Resources, Construction and Maintenance Occupations
The most common Natural Resources, Construction and Maintenance occupations in Severn are Installation, Maintenance & Repair (1,192 | 4.0%), Construction & Extraction (950 | 3.2%), and Farming, Fishing & Forestry (11 | 0.0%).
Natural Resources, Construction and Maintenance Occupations by Sex
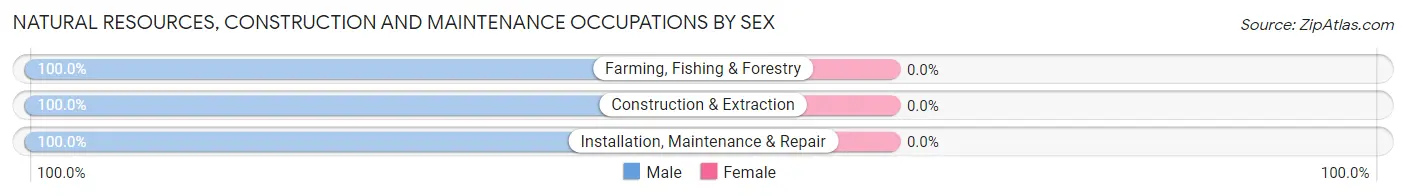
| Occupation | Male | Female |
| Farming, Fishing & Forestry | 11 (100.0%) | 0 (0.0%) |
| Construction & Extraction | 950 (100.0%) | 0 (0.0%) |
| Installation, Maintenance & Repair | 1,192 (100.0%) | 0 (0.0%) |
| Total (Category) | 2,153 (100.0%) | 0 (0.0%) |
| Total (Overall) | 15,821 (53.6%) | 13,715 (46.4%) |
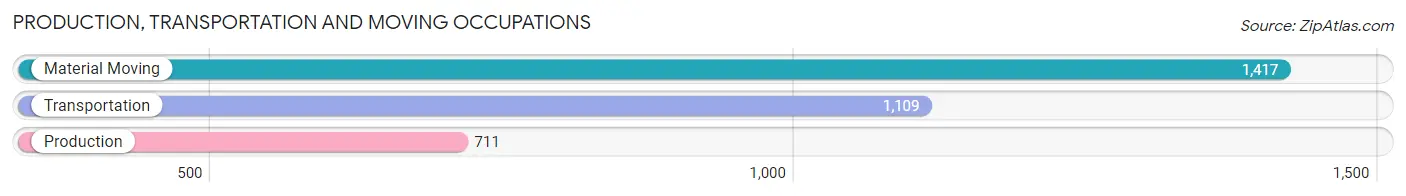
Production, Transportation and Moving Occupations
The most common Production, Transportation and Moving occupations in Severn are Material Moving (1,417 | 4.8%), Transportation (1,109 | 3.7%), and Production (711 | 2.4%).
Production, Transportation and Moving Occupations by Sex
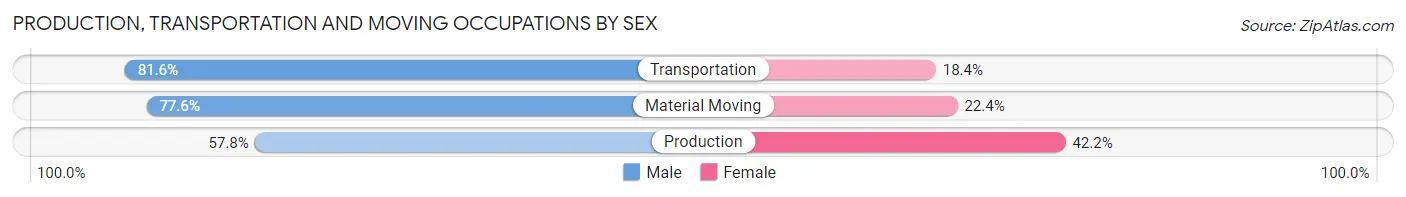
| Occupation | Male | Female |
| Production | 411 (57.8%) | 300 (42.2%) |
| Transportation | 905 (81.6%) | 204 (18.4%) |
| Material Moving | 1,100 (77.6%) | 317 (22.4%) |
| Total (Category) | 2,416 (74.6%) | 821 (25.4%) |
| Total (Overall) | 15,821 (53.6%) | 13,715 (46.4%) |
Employment Industries by Sex in Severn
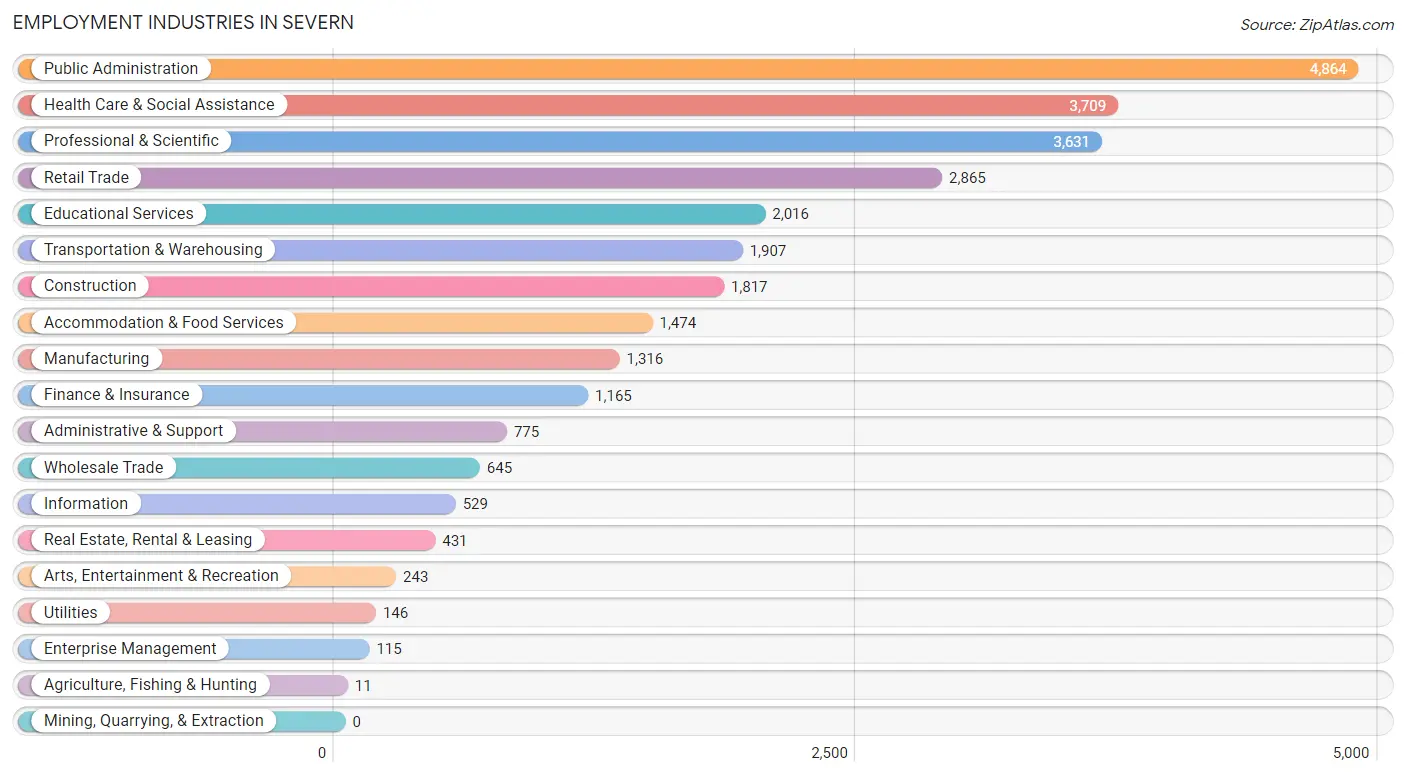
Employment Industries in Severn
The major employment industries in Severn include Public Administration (4,864 | 16.5%), Health Care & Social Assistance (3,709 | 12.6%), Professional & Scientific (3,631 | 12.3%), Retail Trade (2,865 | 9.7%), and Educational Services (2,016 | 6.8%).
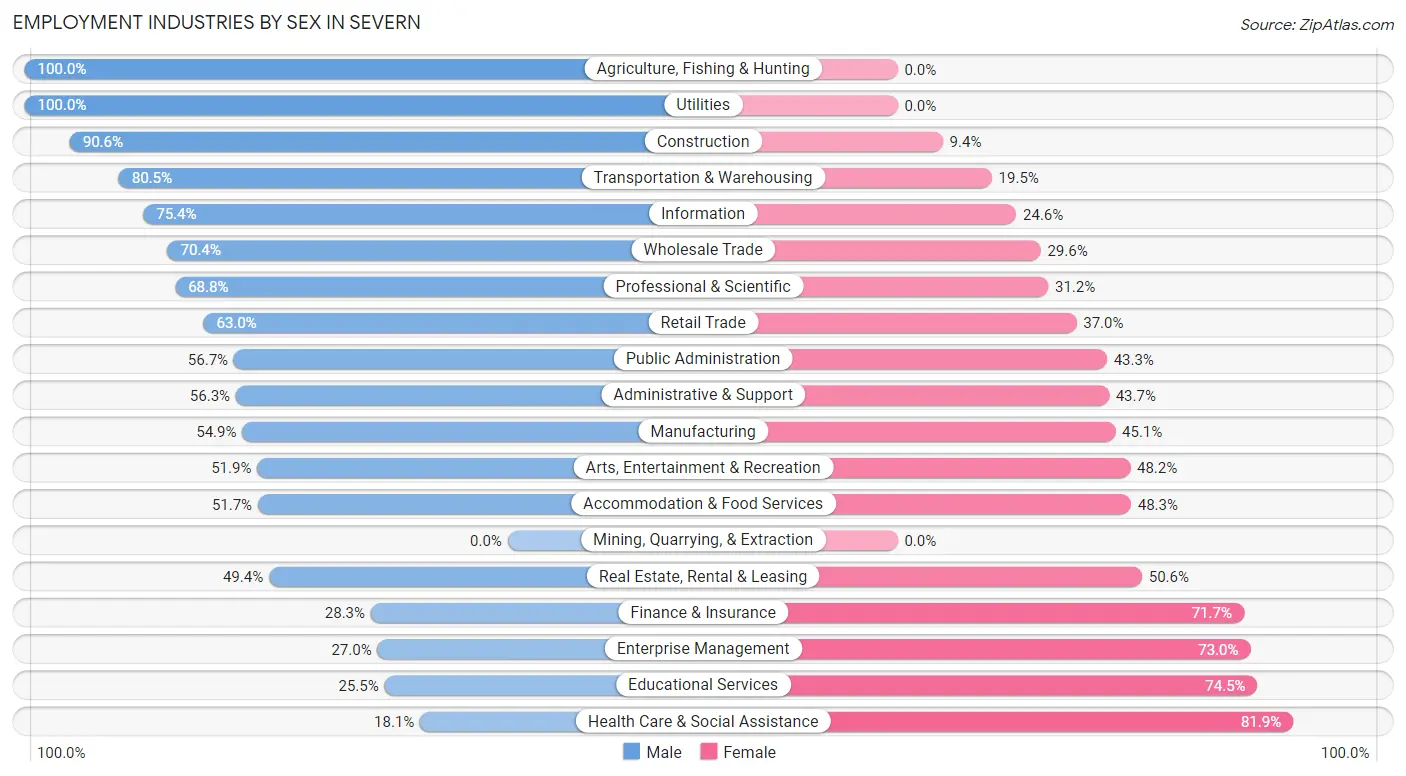
Employment Industries by Sex in Severn
The Severn industries that see more men than women are Agriculture, Fishing & Hunting (100.0%), Utilities (100.0%), and Construction (90.6%), whereas the industries that tend to have a higher number of women are Health Care & Social Assistance (81.9%), Educational Services (74.5%), and Enterprise Management (73.0%).
| Industry | Male | Female |
| Agriculture, Fishing & Hunting | 11 (100.0%) | 0 (0.0%) |
| Mining, Quarrying, & Extraction | 0 (0.0%) | 0 (0.0%) |
| Construction | 1,647 (90.6%) | 170 (9.4%) |
| Manufacturing | 723 (54.9%) | 593 (45.1%) |
| Wholesale Trade | 454 (70.4%) | 191 (29.6%) |
| Retail Trade | 1,804 (63.0%) | 1,061 (37.0%) |
| Transportation & Warehousing | 1,535 (80.5%) | 372 (19.5%) |
| Utilities | 146 (100.0%) | 0 (0.0%) |
| Information | 399 (75.4%) | 130 (24.6%) |
| Finance & Insurance | 330 (28.3%) | 835 (71.7%) |
| Real Estate, Rental & Leasing | 213 (49.4%) | 218 (50.6%) |
| Professional & Scientific | 2,499 (68.8%) | 1,132 (31.2%) |
| Enterprise Management | 31 (27.0%) | 84 (73.0%) |
| Administrative & Support | 436 (56.3%) | 339 (43.7%) |
| Educational Services | 514 (25.5%) | 1,502 (74.5%) |
| Health Care & Social Assistance | 672 (18.1%) | 3,037 (81.9%) |
| Arts, Entertainment & Recreation | 126 (51.8%) | 117 (48.1%) |
| Accommodation & Food Services | 762 (51.7%) | 712 (48.3%) |
| Public Administration | 2,757 (56.7%) | 2,107 (43.3%) |
| Total | 15,821 (53.6%) | 13,715 (46.4%) |
Education in Severn
School Enrollment in Severn
The most common levels of schooling among the 15,273 students in Severn are college / undergraduate (3,375 | 22.1%), elementary school (2,899 | 19.0%), and high school (2,736 | 17.9%).
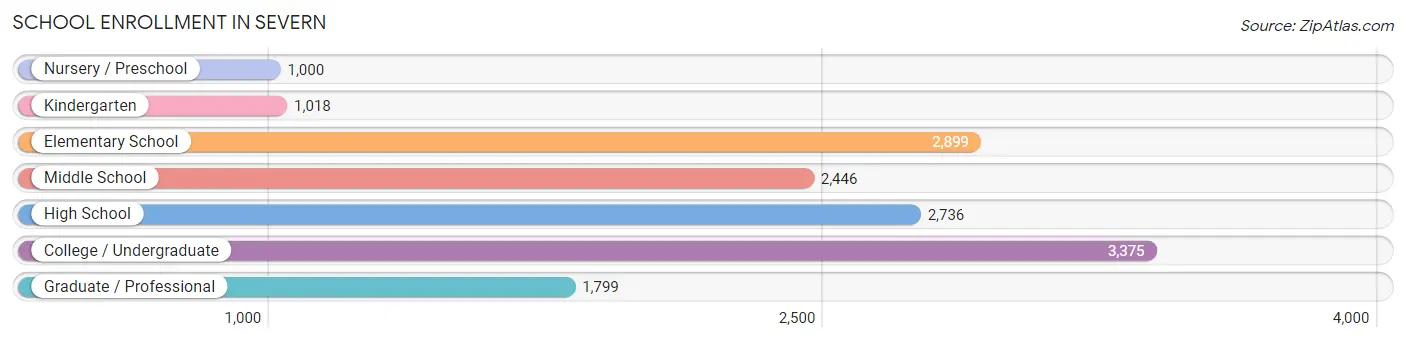
| School Level | # Students | % Students |
| Nursery / Preschool | 1,000 | 6.6% |
| Kindergarten | 1,018 | 6.7% |
| Elementary School | 2,899 | 19.0% |
| Middle School | 2,446 | 16.0% |
| High School | 2,736 | 17.9% |
| College / Undergraduate | 3,375 | 22.1% |
| Graduate / Professional | 1,799 | 11.8% |
| Total | 15,273 | 100.0% |
School Enrollment by Age by Funding Source in Severn
Out of a total of 15,273 students who are enrolled in schools in Severn, 3,391 (22.2%) attend a private institution, while the remaining 11,882 (77.8%) are enrolled in public schools. The age group of 35 years and over has the highest likelihood of being enrolled in private schools, with 744 (46.3% in the age bracket) enrolled. Conversely, the age group of 18 to 19 year olds has the lowest likelihood of being enrolled in a private school, with 890 (97.1% in the age bracket) attending a public institution.
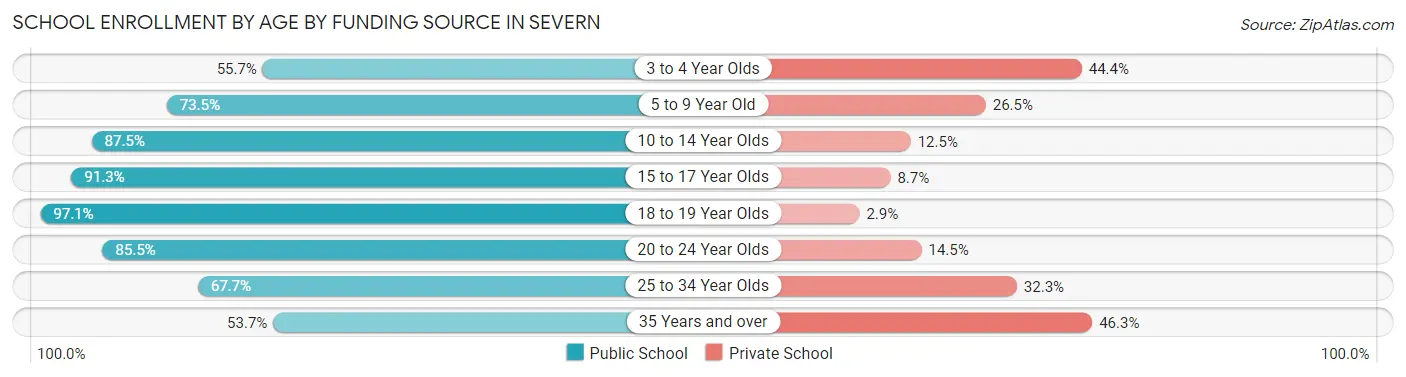
| Age Bracket | Public School | Private School |
| 3 to 4 Year Olds | 507 (55.6%) | 404 (44.4%) |
| 5 to 9 Year Old | 2,474 (73.5%) | 891 (26.5%) |
| 10 to 14 Year Olds | 3,089 (87.5%) | 441 (12.5%) |
| 15 to 17 Year Olds | 1,654 (91.3%) | 158 (8.7%) |
| 18 to 19 Year Olds | 890 (97.1%) | 27 (2.9%) |
| 20 to 24 Year Olds | 1,339 (85.5%) | 227 (14.5%) |
| 25 to 34 Year Olds | 1,060 (67.7%) | 505 (32.3%) |
| 35 Years and over | 863 (53.7%) | 744 (46.3%) |
| Total | 11,882 (77.8%) | 3,391 (22.2%) |
Educational Attainment by Field of Study in Severn
Business (2,574 | 14.5%), computers & mathematics (2,386 | 13.5%), engineering (1,893 | 10.7%), social sciences (1,485 | 8.4%), and education (1,484 | 8.4%) are the most common fields of study among 17,714 individuals in Severn who have obtained a bachelor's degree or higher.
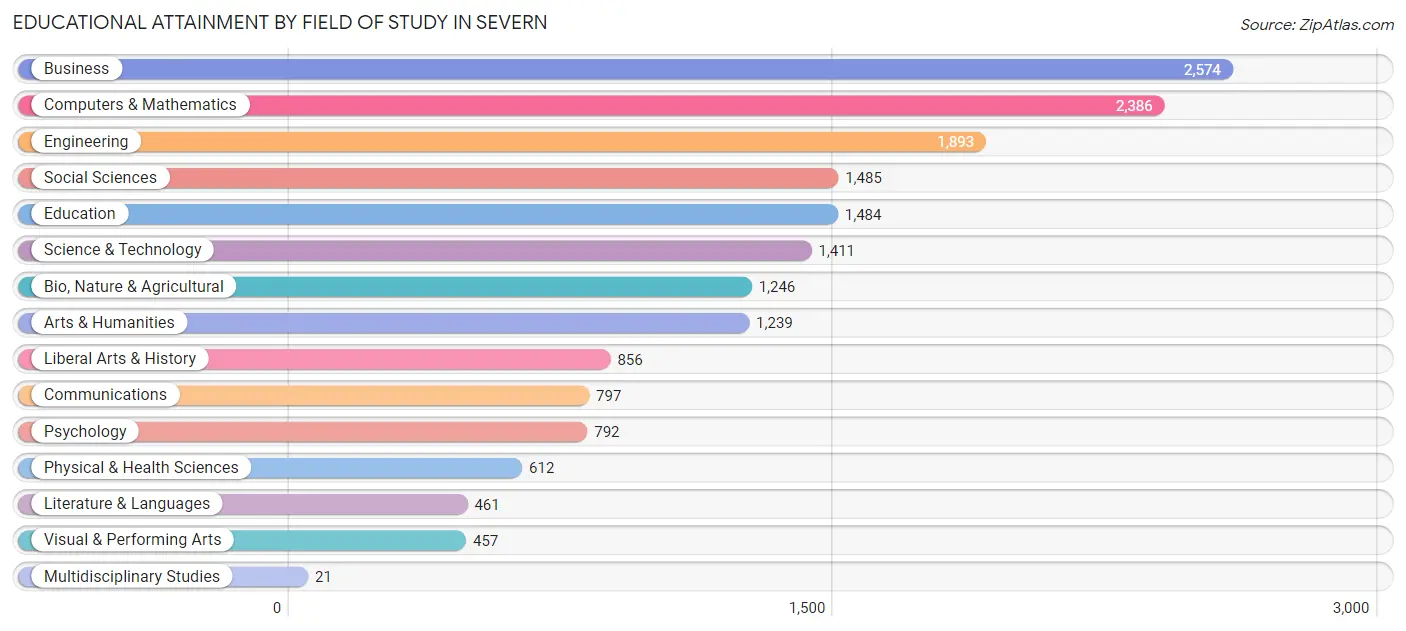
| Field of Study | # Graduates | % Graduates |
| Computers & Mathematics | 2,386 | 13.5% |
| Bio, Nature & Agricultural | 1,246 | 7.0% |
| Physical & Health Sciences | 612 | 3.5% |
| Psychology | 792 | 4.5% |
| Social Sciences | 1,485 | 8.4% |
| Engineering | 1,893 | 10.7% |
| Multidisciplinary Studies | 21 | 0.1% |
| Science & Technology | 1,411 | 8.0% |
| Business | 2,574 | 14.5% |
| Education | 1,484 | 8.4% |
| Literature & Languages | 461 | 2.6% |
| Liberal Arts & History | 856 | 4.8% |
| Visual & Performing Arts | 457 | 2.6% |
| Communications | 797 | 4.5% |
| Arts & Humanities | 1,239 | 7.0% |
| Total | 17,714 | 100.0% |
Transportation & Commute in Severn
Vehicle Availability by Sex in Severn
The most prevalent vehicle ownership categories in Severn are males with 2 vehicles (7,805, accounting for 47.2%) and females with 2 vehicles (5,746, making up 57.4%).
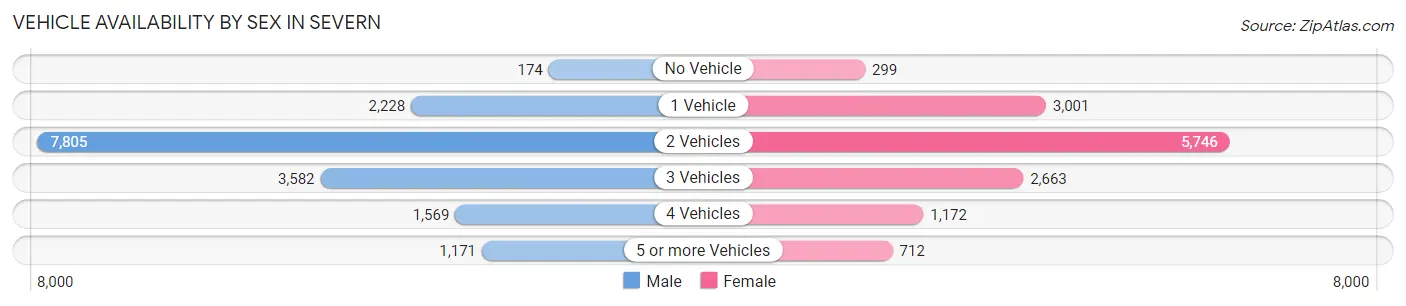
| Vehicles Available | Male | Female |
| No Vehicle | 174 (1.1%) | 299 (2.2%) |
| 1 Vehicle | 2,228 (13.5%) | 3,001 (22.1%) |
| 2 Vehicles | 7,805 (47.2%) | 5,746 (42.3%) |
| 3 Vehicles | 3,582 (21.7%) | 2,663 (19.6%) |
| 4 Vehicles | 1,569 (9.5%) | 1,172 (8.6%) |
| 5 or more Vehicles | 1,171 (7.1%) | 712 (5.2%) |
| Total | 16,529 (100.0%) | 13,593 (100.0%) |
Commute Time in Severn
The most frequently occuring commute durations in Severn are 15 to 19 minutes (5,189 commuters, 19.8%), 20 to 24 minutes (3,915 commuters, 14.9%), and 30 to 34 minutes (3,410 commuters, 13.0%).
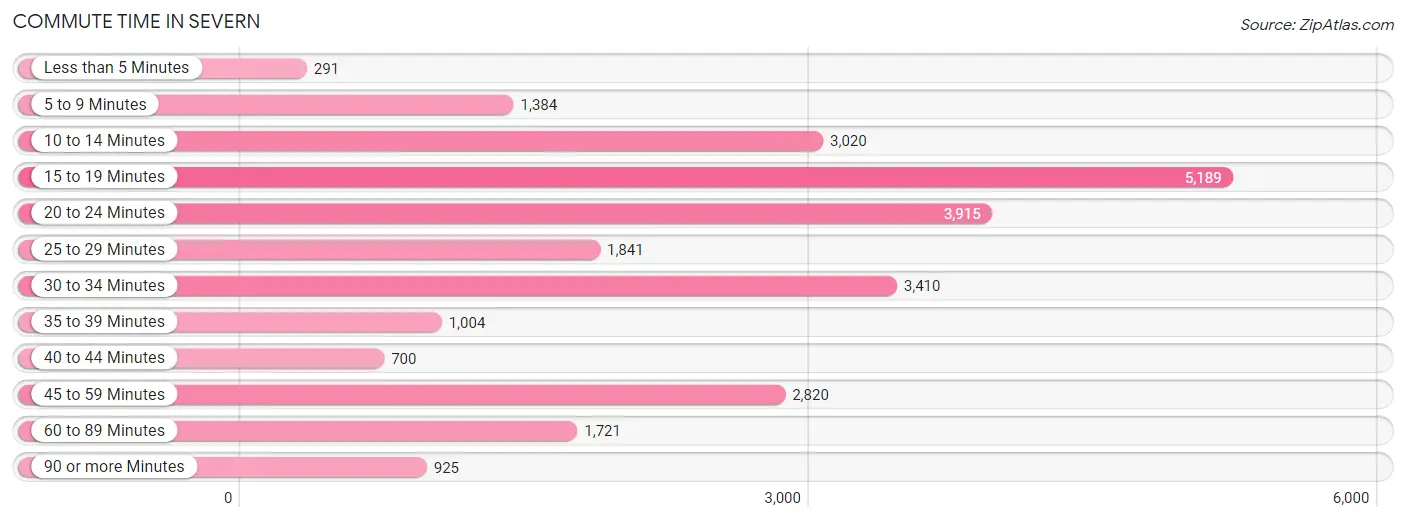
| Commute Time | # Commuters | % Commuters |
| Less than 5 Minutes | 291 | 1.1% |
| 5 to 9 Minutes | 1,384 | 5.3% |
| 10 to 14 Minutes | 3,020 | 11.5% |
| 15 to 19 Minutes | 5,189 | 19.8% |
| 20 to 24 Minutes | 3,915 | 14.9% |
| 25 to 29 Minutes | 1,841 | 7.0% |
| 30 to 34 Minutes | 3,410 | 13.0% |
| 35 to 39 Minutes | 1,004 | 3.8% |
| 40 to 44 Minutes | 700 | 2.7% |
| 45 to 59 Minutes | 2,820 | 10.8% |
| 60 to 89 Minutes | 1,721 | 6.6% |
| 90 or more Minutes | 925 | 3.5% |
Commute Time by Sex in Severn
The most common commute times in Severn are 15 to 19 minutes (3,363 commuters, 22.8%) for males and 15 to 19 minutes (1,826 commuters, 15.9%) for females.
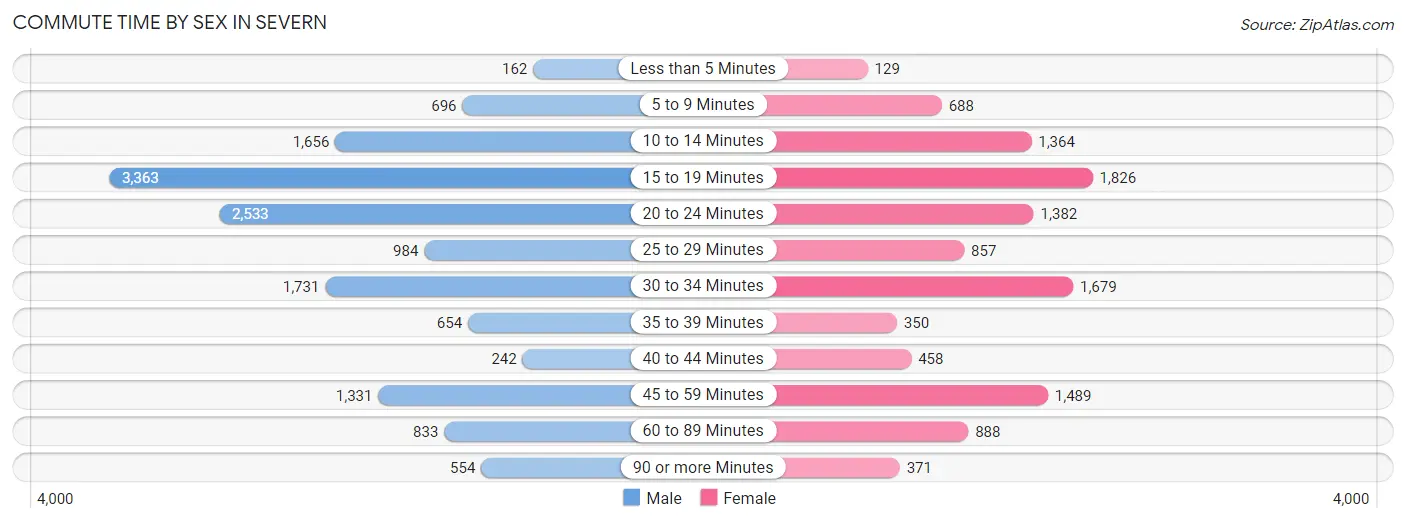
| Commute Time | Male | Female |
| Less than 5 Minutes | 162 (1.1%) | 129 (1.1%) |
| 5 to 9 Minutes | 696 (4.7%) | 688 (6.0%) |
| 10 to 14 Minutes | 1,656 (11.2%) | 1,364 (11.9%) |
| 15 to 19 Minutes | 3,363 (22.8%) | 1,826 (15.9%) |
| 20 to 24 Minutes | 2,533 (17.2%) | 1,382 (12.0%) |
| 25 to 29 Minutes | 984 (6.7%) | 857 (7.5%) |
| 30 to 34 Minutes | 1,731 (11.7%) | 1,679 (14.6%) |
| 35 to 39 Minutes | 654 (4.4%) | 350 (3.0%) |
| 40 to 44 Minutes | 242 (1.6%) | 458 (4.0%) |
| 45 to 59 Minutes | 1,331 (9.0%) | 1,489 (13.0%) |
| 60 to 89 Minutes | 833 (5.7%) | 888 (7.7%) |
| 90 or more Minutes | 554 (3.8%) | 371 (3.2%) |
Time of Departure to Work by Sex in Severn
The most frequent times of departure to work in Severn are 7:30 AM to 7:59 AM (1,854, 12.6%) for males and 7:00 AM to 7:29 AM (2,040, 17.8%) for females.
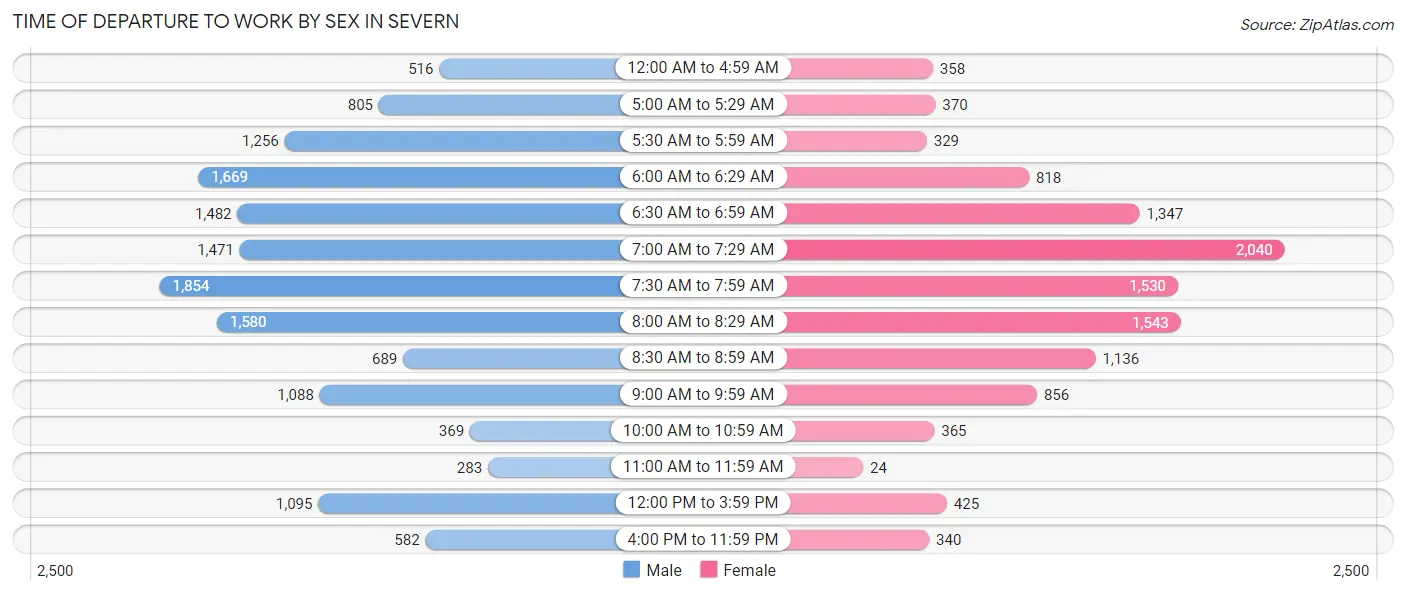
| Time of Departure | Male | Female |
| 12:00 AM to 4:59 AM | 516 (3.5%) | 358 (3.1%) |
| 5:00 AM to 5:29 AM | 805 (5.5%) | 370 (3.2%) |
| 5:30 AM to 5:59 AM | 1,256 (8.5%) | 329 (2.9%) |
| 6:00 AM to 6:29 AM | 1,669 (11.3%) | 818 (7.1%) |
| 6:30 AM to 6:59 AM | 1,482 (10.1%) | 1,347 (11.7%) |
| 7:00 AM to 7:29 AM | 1,471 (10.0%) | 2,040 (17.8%) |
| 7:30 AM to 7:59 AM | 1,854 (12.6%) | 1,530 (13.3%) |
| 8:00 AM to 8:29 AM | 1,580 (10.7%) | 1,543 (13.4%) |
| 8:30 AM to 8:59 AM | 689 (4.7%) | 1,136 (9.9%) |
| 9:00 AM to 9:59 AM | 1,088 (7.4%) | 856 (7.5%) |
| 10:00 AM to 10:59 AM | 369 (2.5%) | 365 (3.2%) |
| 11:00 AM to 11:59 AM | 283 (1.9%) | 24 (0.2%) |
| 12:00 PM to 3:59 PM | 1,095 (7.4%) | 425 (3.7%) |
| 4:00 PM to 11:59 PM | 582 (4.0%) | 340 (3.0%) |
| Total | 14,739 (100.0%) | 11,481 (100.0%) |
Housing Occupancy in Severn
Occupancy by Ownership in Severn
Of the total 20,736 dwellings in Severn, owner-occupied units account for 15,155 (73.1%), while renter-occupied units make up 5,581 (26.9%).
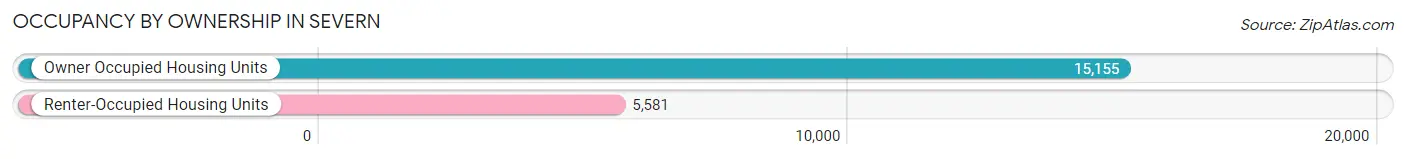
| Occupancy | # Housing Units | % Housing Units |
| Owner Occupied Housing Units | 15,155 | 73.1% |
| Renter-Occupied Housing Units | 5,581 | 26.9% |
| Total Occupied Housing Units | 20,736 | 100.0% |
Occupancy by Household Size in Severn
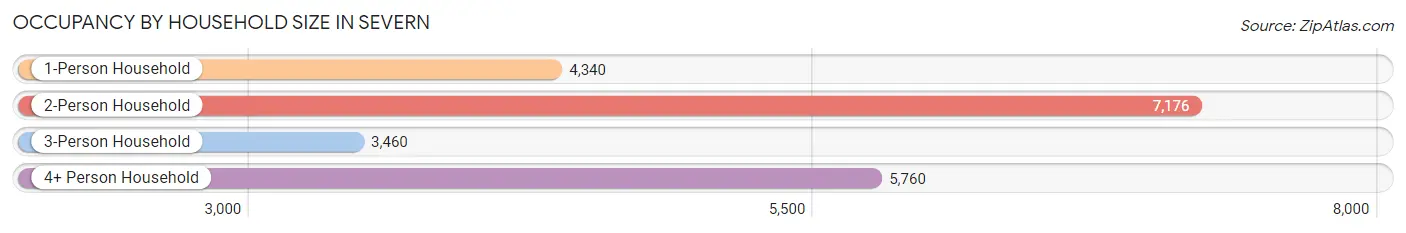
| Household Size | # Housing Units | % Housing Units |
| 1-Person Household | 4,340 | 20.9% |
| 2-Person Household | 7,176 | 34.6% |
| 3-Person Household | 3,460 | 16.7% |
| 4+ Person Household | 5,760 | 27.8% |
| Total Housing Units | 20,736 | 100.0% |
Occupancy by Ownership by Household Size in Severn
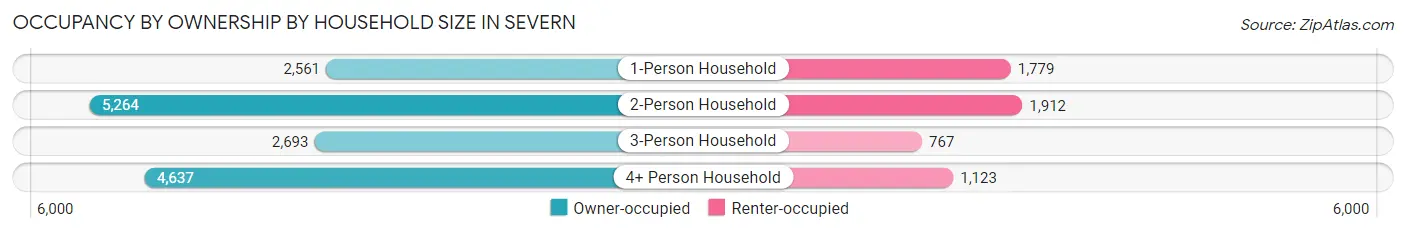
| Household Size | Owner-occupied | Renter-occupied |
| 1-Person Household | 2,561 (59.0%) | 1,779 (41.0%) |
| 2-Person Household | 5,264 (73.4%) | 1,912 (26.6%) |
| 3-Person Household | 2,693 (77.8%) | 767 (22.2%) |
| 4+ Person Household | 4,637 (80.5%) | 1,123 (19.5%) |
| Total Housing Units | 15,155 (73.1%) | 5,581 (26.9%) |
Occupancy by Educational Attainment in Severn
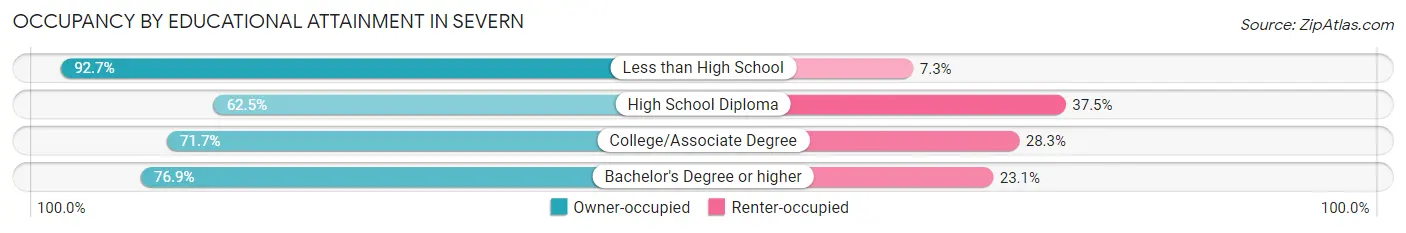
| Household Size | Owner-occupied | Renter-occupied |
| Less than High School | 523 (92.7%) | 41 (7.3%) |
| High School Diploma | 2,371 (62.5%) | 1,423 (37.5%) |
| College/Associate Degree | 4,597 (71.7%) | 1,812 (28.3%) |
| Bachelor's Degree or higher | 7,664 (76.9%) | 2,305 (23.1%) |
Occupancy by Age of Householder in Severn
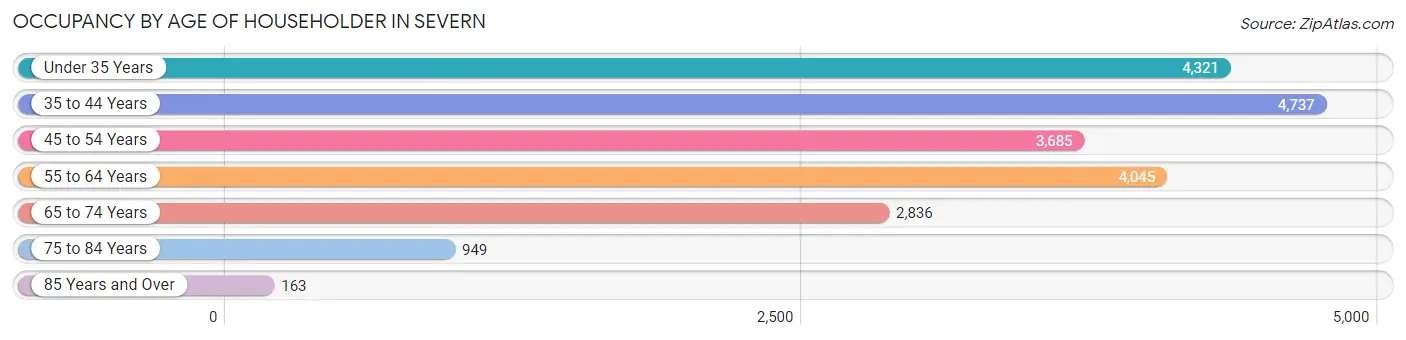
| Age Bracket | # Households | % Households |
| Under 35 Years | 4,321 | 20.8% |
| 35 to 44 Years | 4,737 | 22.8% |
| 45 to 54 Years | 3,685 | 17.8% |
| 55 to 64 Years | 4,045 | 19.5% |
| 65 to 74 Years | 2,836 | 13.7% |
| 75 to 84 Years | 949 | 4.6% |
| 85 Years and Over | 163 | 0.8% |
| Total | 20,736 | 100.0% |
Housing Finances in Severn
Median Income by Occupancy in Severn
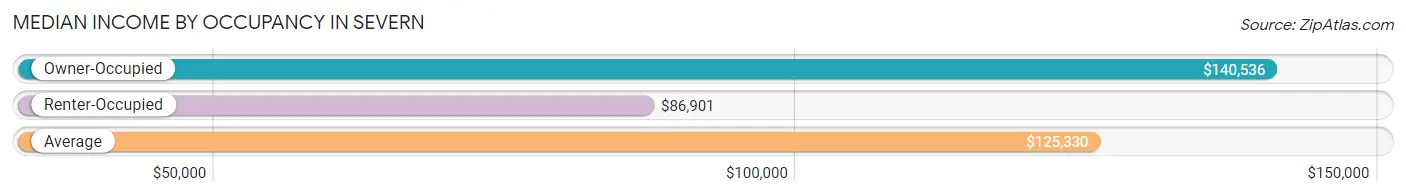
| Occupancy Type | # Households | Median Income |
| Owner-Occupied | 15,155 (73.1%) | $140,536 |
| Renter-Occupied | 5,581 (26.9%) | $86,901 |
| Average | 20,736 (100.0%) | $125,330 |
Occupancy by Householder Income Bracket in Severn
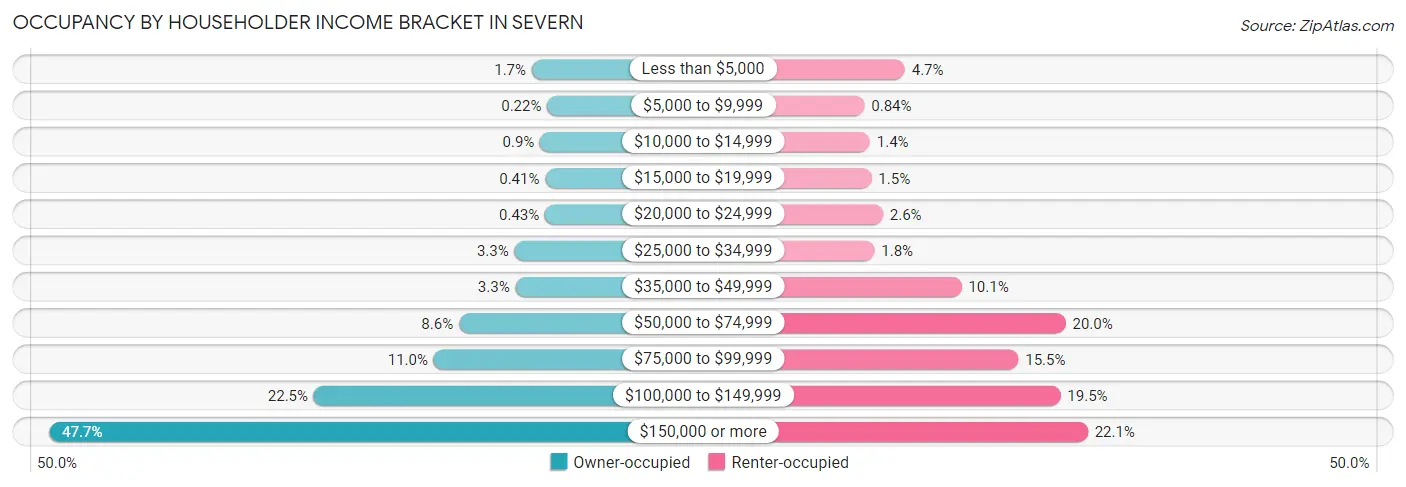
| Income Bracket | Owner-occupied | Renter-occupied |
| Less than $5,000 | 256 (1.7%) | 262 (4.7%) |
| $5,000 to $9,999 | 34 (0.2%) | 47 (0.8%) |
| $10,000 to $14,999 | 136 (0.9%) | 76 (1.4%) |
| $15,000 to $19,999 | 62 (0.4%) | 84 (1.5%) |
| $20,000 to $24,999 | 65 (0.4%) | 145 (2.6%) |
| $25,000 to $34,999 | 506 (3.3%) | 100 (1.8%) |
| $35,000 to $49,999 | 492 (3.3%) | 563 (10.1%) |
| $50,000 to $74,999 | 1,308 (8.6%) | 1,116 (20.0%) |
| $75,000 to $99,999 | 1,671 (11.0%) | 865 (15.5%) |
| $100,000 to $149,999 | 3,402 (22.5%) | 1,089 (19.5%) |
| $150,000 or more | 7,223 (47.7%) | 1,234 (22.1%) |
| Total | 15,155 (100.0%) | 5,581 (100.0%) |
Monthly Housing Cost Tiers in Severn
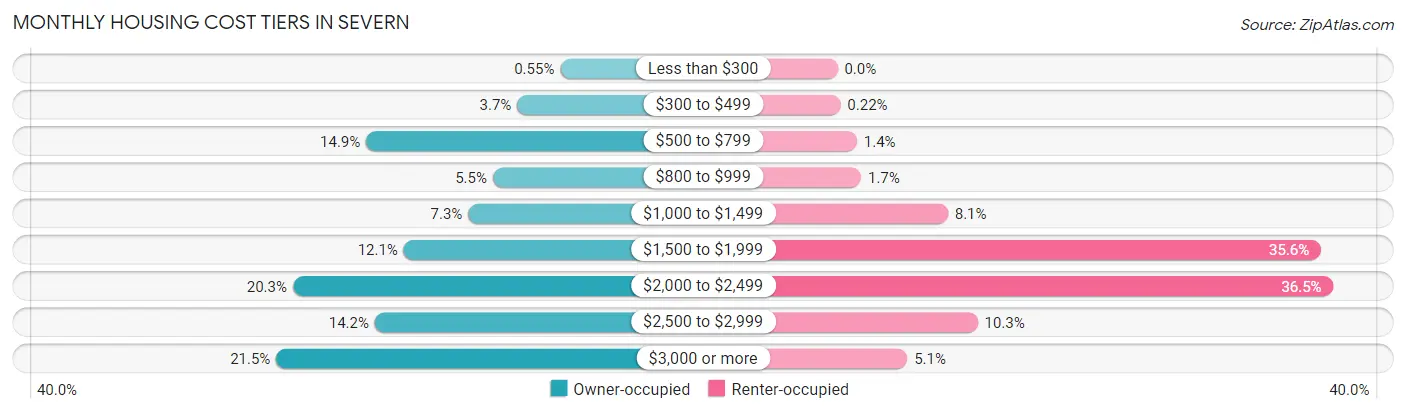
| Monthly Cost | Owner-occupied | Renter-occupied |
| Less than $300 | 84 (0.5%) | 0 (0.0%) |
| $300 to $499 | 564 (3.7%) | 12 (0.2%) |
| $500 to $799 | 2,251 (14.8%) | 80 (1.4%) |
| $800 to $999 | 837 (5.5%) | 97 (1.7%) |
| $1,000 to $1,499 | 1,111 (7.3%) | 454 (8.1%) |
| $1,500 to $1,999 | 1,831 (12.1%) | 1,988 (35.6%) |
| $2,000 to $2,499 | 3,069 (20.3%) | 2,039 (36.5%) |
| $2,500 to $2,999 | 2,154 (14.2%) | 576 (10.3%) |
| $3,000 or more | 3,254 (21.5%) | 287 (5.1%) |
| Total | 15,155 (100.0%) | 5,581 (100.0%) |
Physical Housing Characteristics in Severn
Housing Structures in Severn
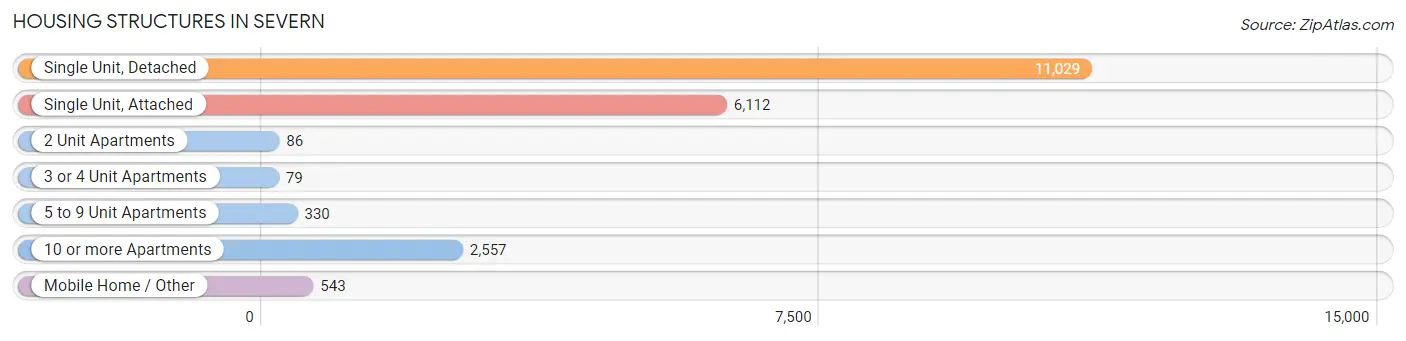
| Structure Type | # Housing Units | % Housing Units |
| Single Unit, Detached | 11,029 | 53.2% |
| Single Unit, Attached | 6,112 | 29.5% |
| 2 Unit Apartments | 86 | 0.4% |
| 3 or 4 Unit Apartments | 79 | 0.4% |
| 5 to 9 Unit Apartments | 330 | 1.6% |
| 10 or more Apartments | 2,557 | 12.3% |
| Mobile Home / Other | 543 | 2.6% |
| Total | 20,736 | 100.0% |
Housing Structures by Occupancy in Severn
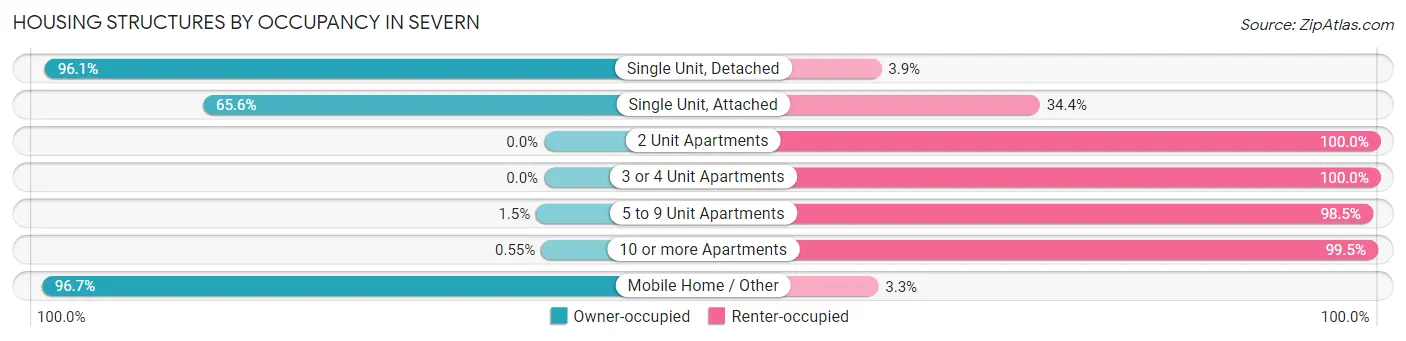
| Structure Type | Owner-occupied | Renter-occupied |
| Single Unit, Detached | 10,600 (96.1%) | 429 (3.9%) |
| Single Unit, Attached | 4,011 (65.6%) | 2,101 (34.4%) |
| 2 Unit Apartments | 0 (0.0%) | 86 (100.0%) |
| 3 or 4 Unit Apartments | 0 (0.0%) | 79 (100.0%) |
| 5 to 9 Unit Apartments | 5 (1.5%) | 325 (98.5%) |
| 10 or more Apartments | 14 (0.5%) | 2,543 (99.5%) |
| Mobile Home / Other | 525 (96.7%) | 18 (3.3%) |
| Total | 15,155 (73.1%) | 5,581 (26.9%) |
Housing Structures by Number of Rooms in Severn
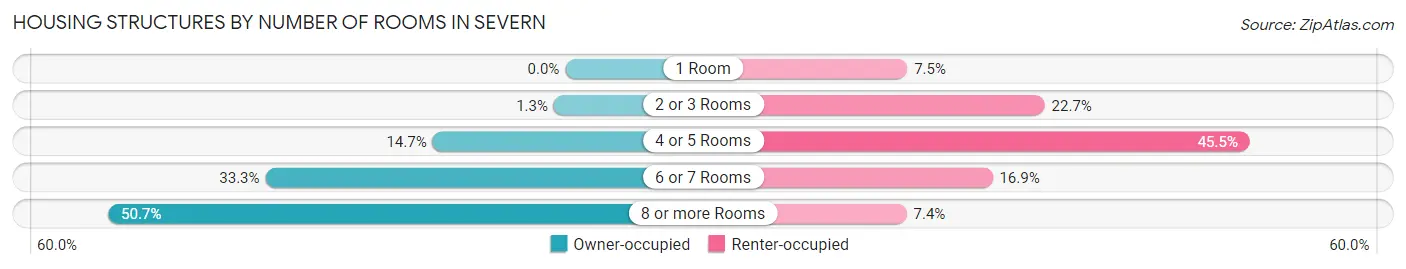
| Number of Rooms | Owner-occupied | Renter-occupied |
| 1 Room | 0 (0.0%) | 417 (7.5%) |
| 2 or 3 Rooms | 192 (1.3%) | 1,268 (22.7%) |
| 4 or 5 Rooms | 2,232 (14.7%) | 2,538 (45.5%) |
| 6 or 7 Rooms | 5,043 (33.3%) | 945 (16.9%) |
| 8 or more Rooms | 7,688 (50.7%) | 413 (7.4%) |
| Total | 15,155 (100.0%) | 5,581 (100.0%) |
Housing Structure by Heating Type in Severn
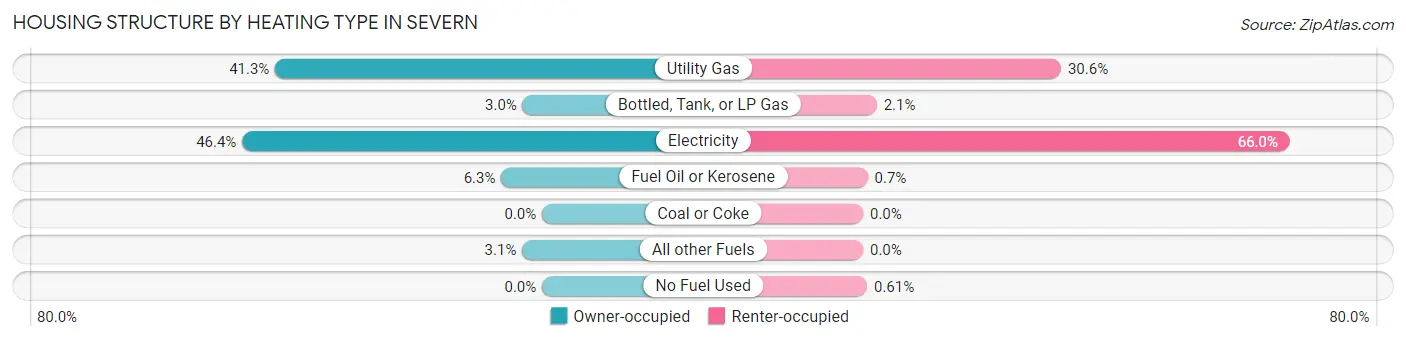
| Heating Type | Owner-occupied | Renter-occupied |
| Utility Gas | 6,253 (41.3%) | 1,708 (30.6%) |
| Bottled, Tank, or LP Gas | 455 (3.0%) | 118 (2.1%) |
| Electricity | 7,026 (46.4%) | 3,682 (66.0%) |
| Fuel Oil or Kerosene | 956 (6.3%) | 39 (0.7%) |
| Coal or Coke | 0 (0.0%) | 0 (0.0%) |
| All other Fuels | 465 (3.1%) | 0 (0.0%) |
| No Fuel Used | 0 (0.0%) | 34 (0.6%) |
| Total | 15,155 (100.0%) | 5,581 (100.0%) |
Household Vehicle Usage in Severn
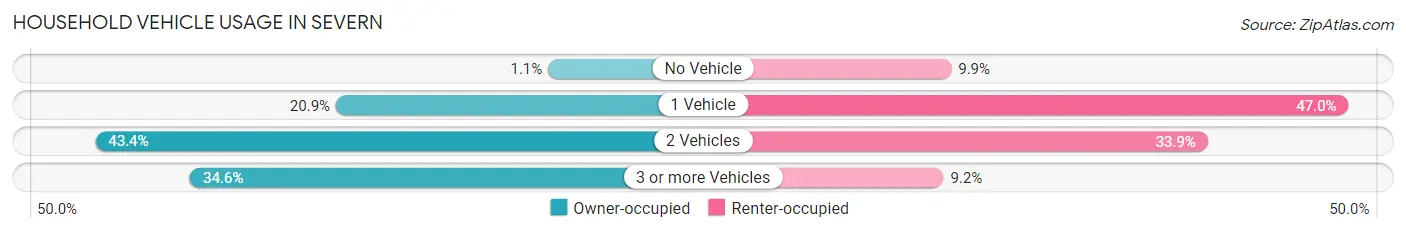
| Vehicles per Household | Owner-occupied | Renter-occupied |
| No Vehicle | 171 (1.1%) | 554 (9.9%) |
| 1 Vehicle | 3,173 (20.9%) | 2,623 (47.0%) |
| 2 Vehicles | 6,575 (43.4%) | 1,890 (33.9%) |
| 3 or more Vehicles | 5,236 (34.5%) | 514 (9.2%) |
| Total | 15,155 (100.0%) | 5,581 (100.0%) |
Real Estate & Mortgages in Severn
Real Estate and Mortgage Overview in Severn
| Characteristic | Without Mortgage | With Mortgage |
| Housing Units | 3,608 | 11,547 |
| Median Property Value | $388,100 | $454,200 |
| Median Household Income | $108,947 | $6,053 |
| Monthly Housing Costs | $654 | $3,254 |
| Real Estate Taxes | $3,378 | $308 |
Property Value by Mortgage Status in Severn
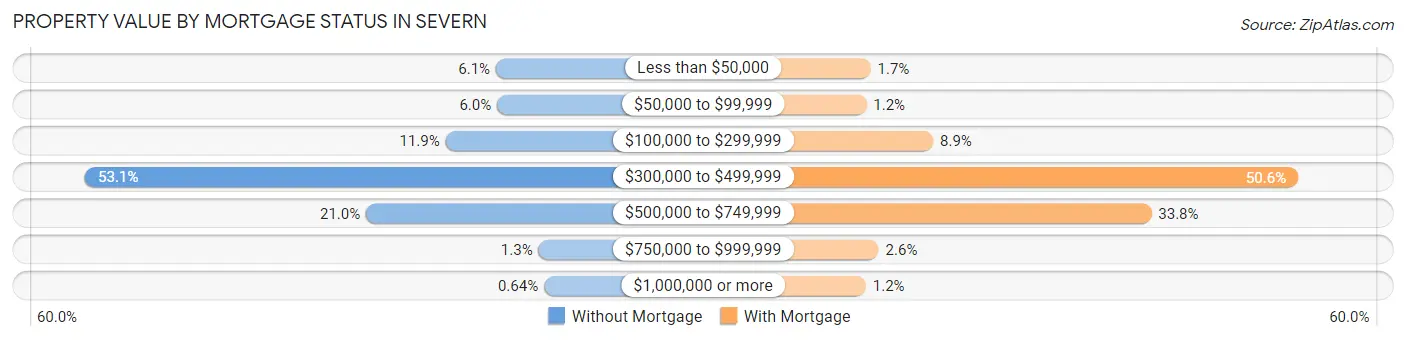
| Property Value | Without Mortgage | With Mortgage |
| Less than $50,000 | 221 (6.1%) | 199 (1.7%) |
| $50,000 to $99,999 | 217 (6.0%) | 142 (1.2%) |
| $100,000 to $299,999 | 429 (11.9%) | 1,023 (8.9%) |
| $300,000 to $499,999 | 1,915 (53.1%) | 5,838 (50.6%) |
| $500,000 to $749,999 | 757 (21.0%) | 3,904 (33.8%) |
| $750,000 to $999,999 | 46 (1.3%) | 305 (2.6%) |
| $1,000,000 or more | 23 (0.6%) | 136 (1.2%) |
| Total | 3,608 (100.0%) | 11,547 (100.0%) |
Household Income by Mortgage Status in Severn
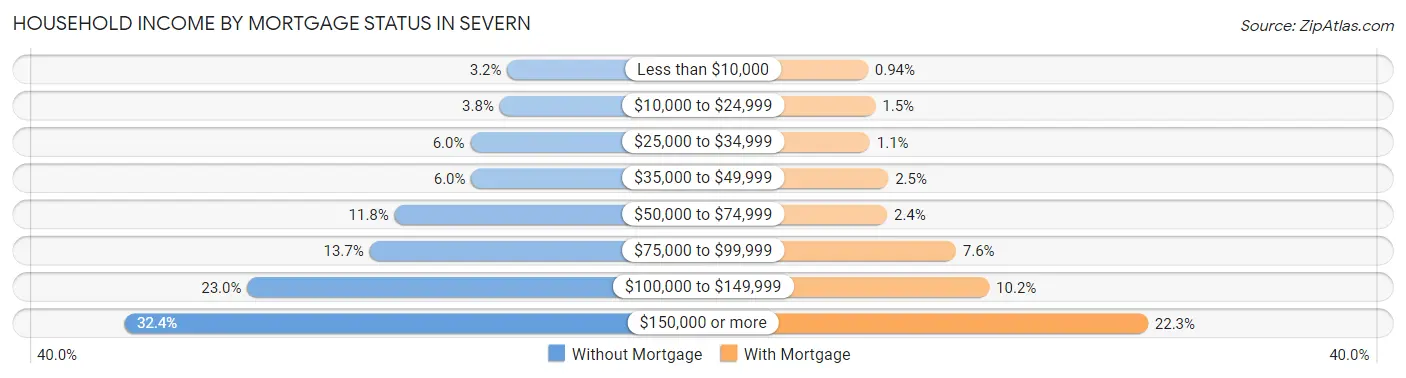
| Household Income | Without Mortgage | With Mortgage |
| Less than $10,000 | 116 (3.2%) | 109 (0.9%) |
| $10,000 to $24,999 | 137 (3.8%) | 174 (1.5%) |
| $25,000 to $34,999 | 218 (6.0%) | 126 (1.1%) |
| $35,000 to $49,999 | 215 (6.0%) | 288 (2.5%) |
| $50,000 to $74,999 | 426 (11.8%) | 277 (2.4%) |
| $75,000 to $99,999 | 495 (13.7%) | 882 (7.6%) |
| $100,000 to $149,999 | 831 (23.0%) | 1,176 (10.2%) |
| $150,000 or more | 1,170 (32.4%) | 2,571 (22.3%) |
| Total | 3,608 (100.0%) | 11,547 (100.0%) |
Property Value to Household Income Ratio in Severn
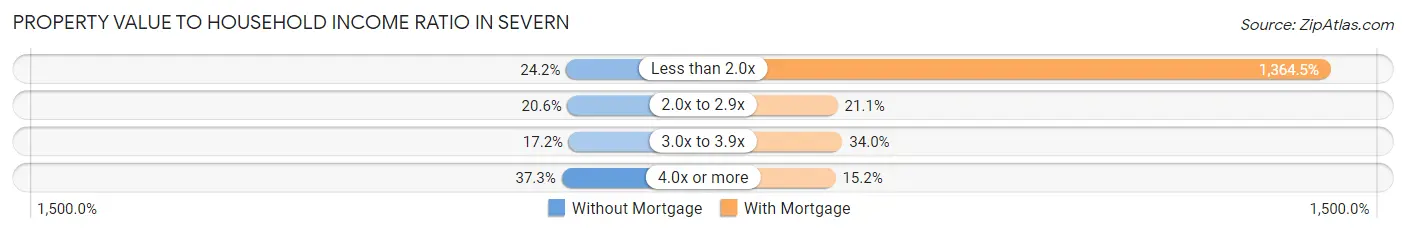
| Value-to-Income Ratio | Without Mortgage | With Mortgage |
| Less than 2.0x | 872 (24.2%) | 157,564 (1,364.5%) |
| 2.0x to 2.9x | 743 (20.6%) | 2,438 (21.1%) |
| 3.0x to 3.9x | 619 (17.2%) | 3,930 (34.0%) |
| 4.0x or more | 1,345 (37.3%) | 1,751 (15.2%) |
| Total | 3,608 (100.0%) | 11,547 (100.0%) |
Real Estate Taxes by Mortgage Status in Severn
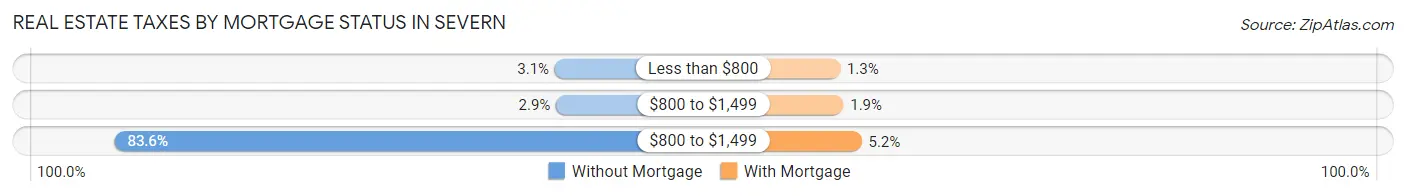
| Property Taxes | Without Mortgage | With Mortgage |
| Less than $800 | 113 (3.1%) | 146 (1.3%) |
| $800 to $1,499 | 105 (2.9%) | 216 (1.9%) |
| $800 to $1,499 | 3,015 (83.6%) | 601 (5.2%) |
| Total | 3,608 (100.0%) | 11,547 (100.0%) |
Health & Disability in Severn
Health Insurance Coverage by Age in Severn
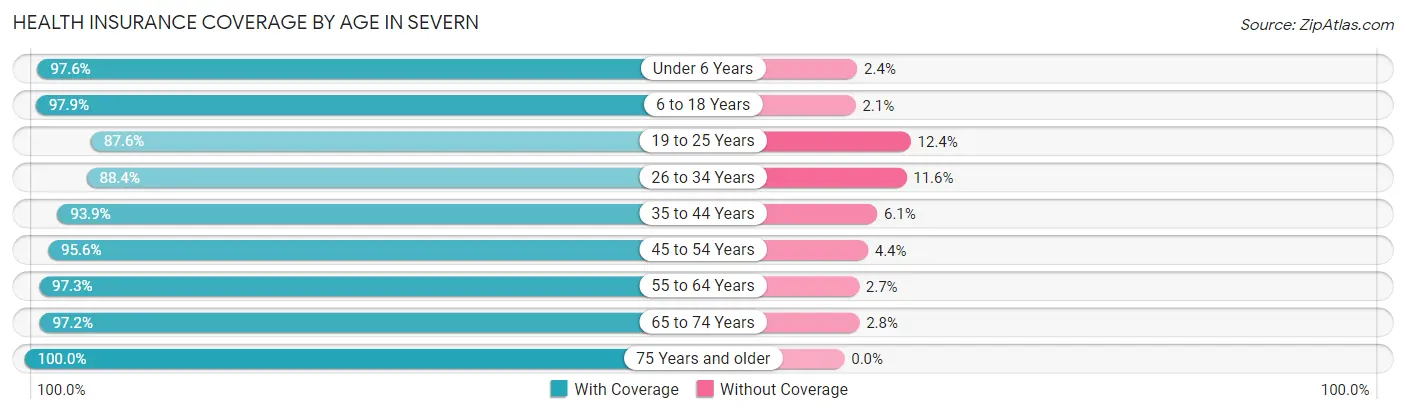
| Age Bracket | With Coverage | Without Coverage |
| Under 6 Years | 4,466 (97.6%) | 110 (2.4%) |
| 6 to 18 Years | 8,845 (97.9%) | 188 (2.1%) |
| 19 to 25 Years | 4,337 (87.6%) | 612 (12.4%) |
| 26 to 34 Years | 6,917 (88.4%) | 904 (11.6%) |
| 35 to 44 Years | 7,770 (93.9%) | 506 (6.1%) |
| 45 to 54 Years | 6,816 (95.6%) | 312 (4.4%) |
| 55 to 64 Years | 6,721 (97.3%) | 188 (2.7%) |
| 65 to 74 Years | 4,506 (97.2%) | 129 (2.8%) |
| 75 Years and older | 1,862 (100.0%) | 0 (0.0%) |
| Total | 52,240 (94.7%) | 2,949 (5.3%) |
Health Insurance Coverage by Citizenship Status in Severn
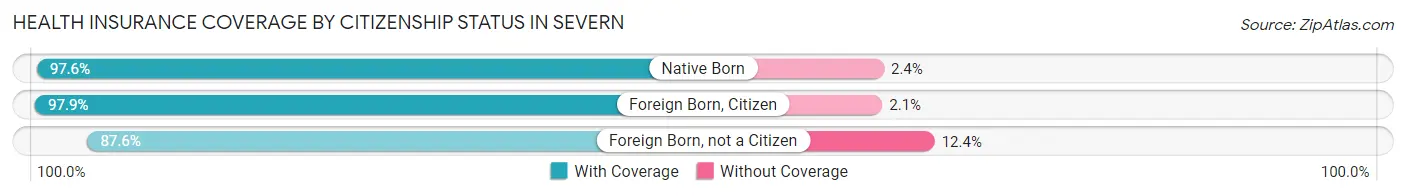
| Citizenship Status | With Coverage | Without Coverage |
| Native Born | 4,466 (97.6%) | 110 (2.4%) |
| Foreign Born, Citizen | 8,845 (97.9%) | 188 (2.1%) |
| Foreign Born, not a Citizen | 4,337 (87.6%) | 612 (12.4%) |
Health Insurance Coverage by Household Income in Severn
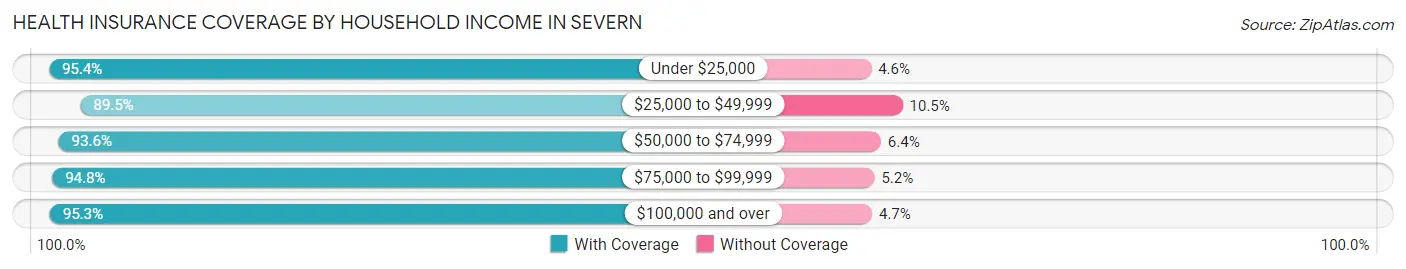
| Household Income | With Coverage | Without Coverage |
| Under $25,000 | 2,295 (95.4%) | 110 (4.6%) |
| $25,000 to $49,999 | 3,545 (89.5%) | 414 (10.5%) |
| $50,000 to $74,999 | 5,010 (93.6%) | 342 (6.4%) |
| $75,000 to $99,999 | 5,546 (94.8%) | 303 (5.2%) |
| $100,000 and over | 35,799 (95.3%) | 1,777 (4.7%) |
Public vs Private Health Insurance Coverage by Age in Severn
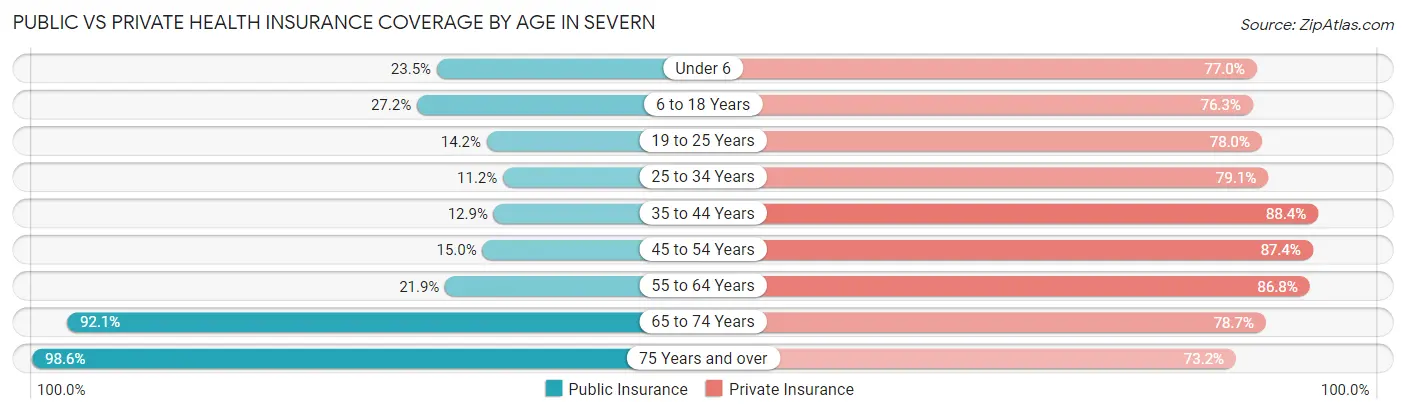
| Age Bracket | Public Insurance | Private Insurance |
| Under 6 | 1,074 (23.5%) | 3,523 (77.0%) |
| 6 to 18 Years | 2,454 (27.2%) | 6,890 (76.3%) |
| 19 to 25 Years | 703 (14.2%) | 3,858 (78.0%) |
| 25 to 34 Years | 874 (11.2%) | 6,189 (79.1%) |
| 35 to 44 Years | 1,069 (12.9%) | 7,316 (88.4%) |
| 45 to 54 Years | 1,069 (15.0%) | 6,230 (87.4%) |
| 55 to 64 Years | 1,515 (21.9%) | 5,999 (86.8%) |
| 65 to 74 Years | 4,270 (92.1%) | 3,647 (78.7%) |
| 75 Years and over | 1,836 (98.6%) | 1,362 (73.2%) |
| Total | 14,864 (26.9%) | 45,014 (81.6%) |
Disability Status by Sex by Age in Severn
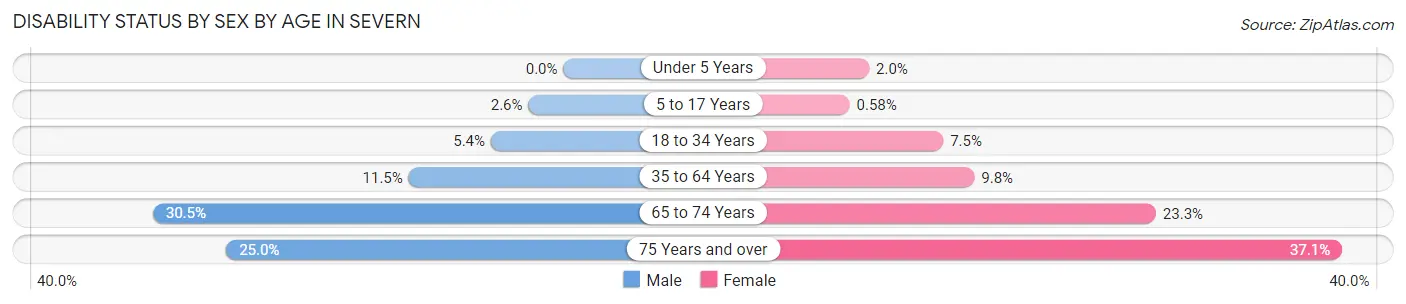
| Age Bracket | Male | Female |
| Under 5 Years | 0 (0.0%) | 36 (2.0%) |
| 5 to 17 Years | 122 (2.6%) | 26 (0.6%) |
| 18 to 34 Years | 352 (5.4%) | 519 (7.5%) |
| 35 to 64 Years | 1,248 (11.5%) | 1,127 (9.8%) |
| 65 to 74 Years | 690 (30.5%) | 553 (23.3%) |
| 75 Years and over | 183 (25.0%) | 420 (37.1%) |
Disability Class by Sex by Age in Severn
Disability Class: Hearing Difficulty
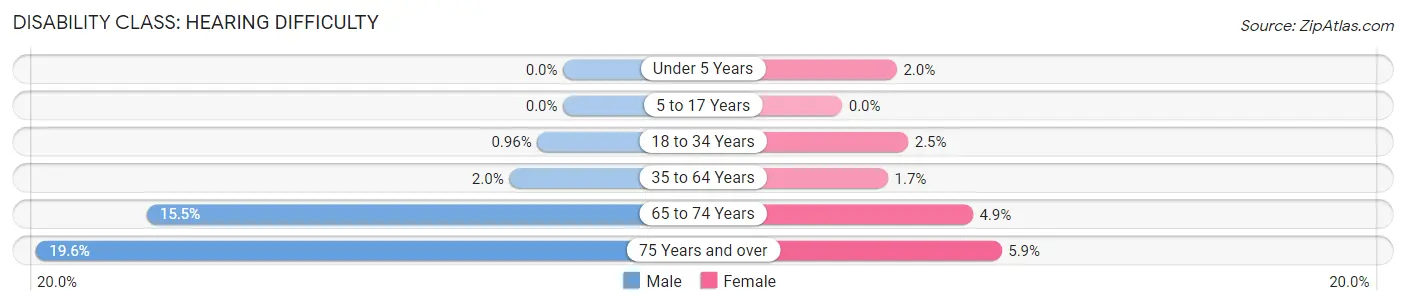
| Age Bracket | Male | Female |
| Under 5 Years | 0 (0.0%) | 36 (2.0%) |
| 5 to 17 Years | 0 (0.0%) | 0 (0.0%) |
| 18 to 34 Years | 63 (1.0%) | 169 (2.5%) |
| 35 to 64 Years | 217 (2.0%) | 195 (1.7%) |
| 65 to 74 Years | 350 (15.5%) | 115 (4.9%) |
| 75 Years and over | 143 (19.6%) | 67 (5.9%) |
Disability Class: Vision Difficulty
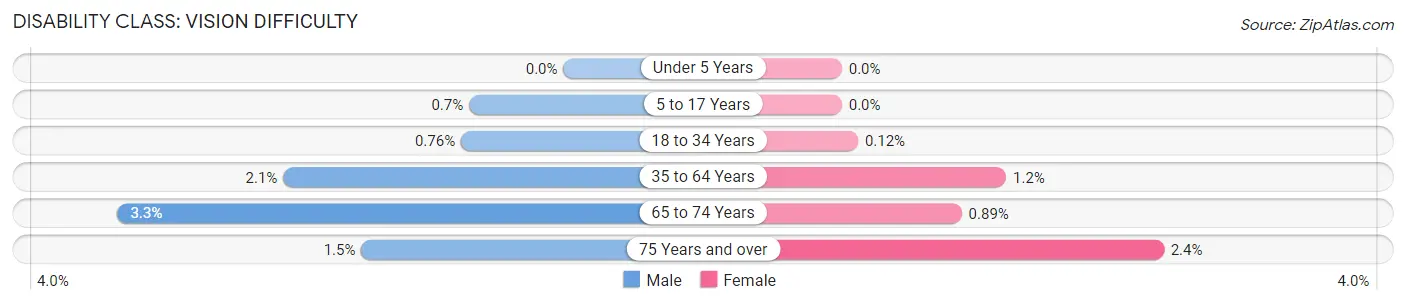
| Age Bracket | Male | Female |
| Under 5 Years | 0 (0.0%) | 0 (0.0%) |
| 5 to 17 Years | 33 (0.7%) | 0 (0.0%) |
| 18 to 34 Years | 50 (0.8%) | 8 (0.1%) |
| 35 to 64 Years | 226 (2.1%) | 140 (1.2%) |
| 65 to 74 Years | 75 (3.3%) | 21 (0.9%) |
| 75 Years and over | 11 (1.5%) | 27 (2.4%) |
Disability Class: Cognitive Difficulty
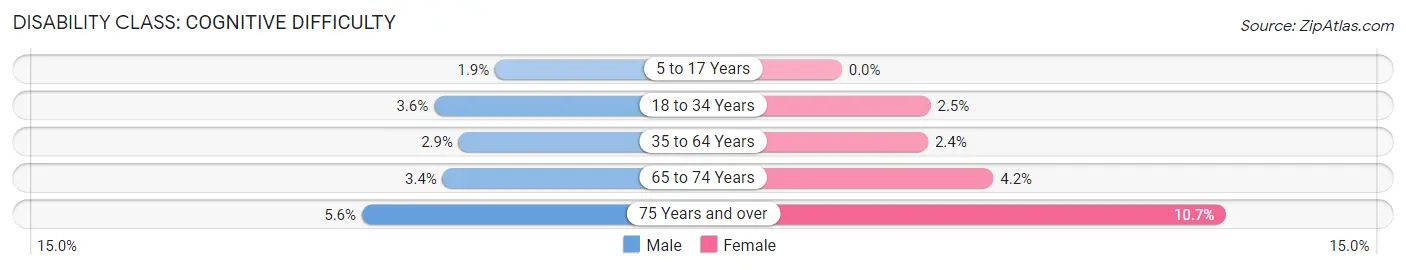
| Age Bracket | Male | Female |
| 5 to 17 Years | 89 (1.9%) | 0 (0.0%) |
| 18 to 34 Years | 236 (3.6%) | 170 (2.5%) |
| 35 to 64 Years | 316 (2.9%) | 275 (2.4%) |
| 65 to 74 Years | 76 (3.4%) | 100 (4.2%) |
| 75 Years and over | 41 (5.6%) | 121 (10.7%) |
Disability Class: Ambulatory Difficulty
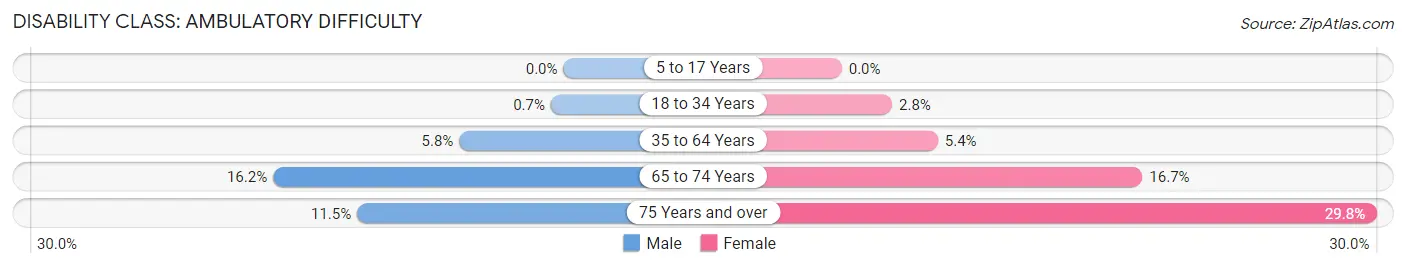
| Age Bracket | Male | Female |
| 5 to 17 Years | 0 (0.0%) | 0 (0.0%) |
| 18 to 34 Years | 46 (0.7%) | 193 (2.8%) |
| 35 to 64 Years | 630 (5.8%) | 612 (5.3%) |
| 65 to 74 Years | 366 (16.2%) | 397 (16.7%) |
| 75 Years and over | 84 (11.5%) | 337 (29.8%) |
Disability Class: Self-Care Difficulty
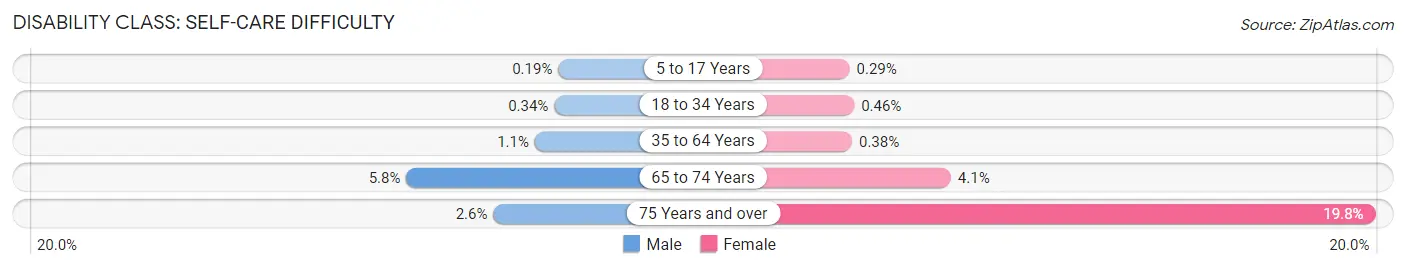
| Age Bracket | Male | Female |
| 5 to 17 Years | 9 (0.2%) | 13 (0.3%) |
| 18 to 34 Years | 22 (0.3%) | 32 (0.5%) |
| 35 to 64 Years | 115 (1.1%) | 43 (0.4%) |
| 65 to 74 Years | 132 (5.8%) | 96 (4.1%) |
| 75 Years and over | 19 (2.6%) | 224 (19.8%) |
Technology Access in Severn
Computing Device Access in Severn
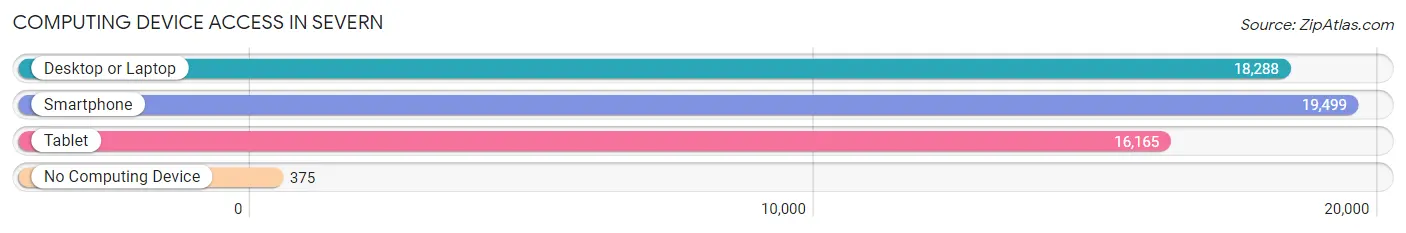
| Device Type | # Households | % Households |
| Desktop or Laptop | 18,288 | 88.2% |
| Smartphone | 19,499 | 94.0% |
| Tablet | 16,165 | 78.0% |
| No Computing Device | 375 | 1.8% |
| Total | 20,736 | 100.0% |
Internet Access in Severn
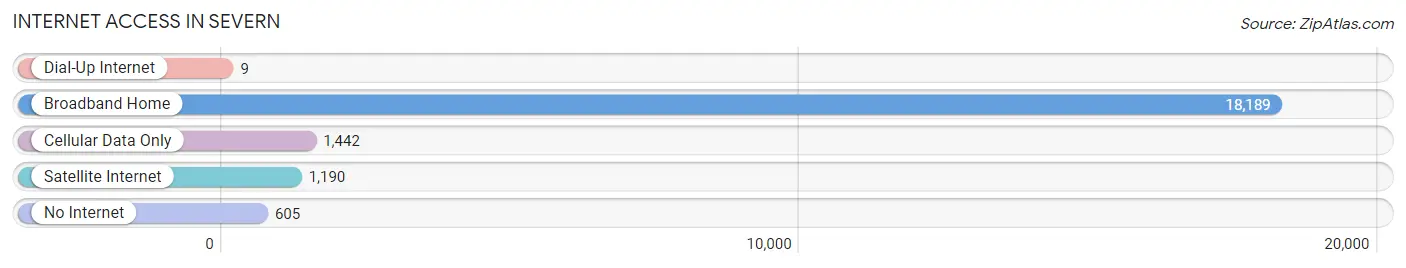
| Internet Type | # Households | % Households |
| Dial-Up Internet | 9 | 0.0% |
| Broadband Home | 18,189 | 87.7% |
| Cellular Data Only | 1,442 | 7.0% |
| Satellite Internet | 1,190 | 5.7% |
| No Internet | 605 | 2.9% |
| Total | 20,736 | 100.0% |
Severn Summary
Severn, Maryland is a census-designated place located in Anne Arundel County, Maryland. It is situated on the Severn River, which is a tributary of the Chesapeake Bay. The population of Severn was 41,441 at the 2010 census.
History
The area that is now Severn was first settled in 1649 by a group of English settlers led by Richard Warfield. The settlement was originally known as “Warfield’s Range” and was located on the Severn River. The settlement was later renamed “Severn” after the river.
In the late 1700s, the area was home to a large tobacco plantation owned by the Warfield family. The plantation was eventually sold to the Hammond family, who owned it until the early 1900s.
In the early 1900s, the area began to develop as a residential community. The first subdivision was built in 1906 and was named “Severn Park”. The area continued to grow and by the 1950s, it had become a thriving community.
Geography
Severn is located at 39°6′N 76°41′W (39.097, -76.683). It is situated on the Severn River, which is a tributary of the Chesapeake Bay. The area is mostly flat and is located at an elevation of approximately 20 feet above sea level.
The climate in Severn is classified as humid subtropical. The average temperature in the summer is around 80°F and the average temperature in the winter is around 40°F. The area receives an average of 44 inches of precipitation per year.
Economy
The economy of Severn is largely based on the service industry. The area is home to several large employers, including the U.S. Naval Academy, Northrop Grumman, and the Anne Arundel Medical Center.
The area is also home to several shopping centers, including the Severn Square Shopping Center and the Severna Park Mall. There are also several restaurants and other businesses located in the area.
Demographics
As of the 2010 census, the population of Severn was 41,441. The racial makeup of the area was 68.3% White, 22.2% African American, 0.4% Native American, 4.2% Asian, and 4.9% from other races.
The median household income in Severn was $76,845 in 2010. The median age of the population was 37.7 years. The median home value was $346,000 in 2010.
Severn is served by the Anne Arundel County Public Schools system. The area is home to several schools, including Severn Elementary School, Severna Park High School, and Old Mill High School.
Severn is a vibrant and diverse community that is home to a variety of people from all walks of life. The area is known for its strong sense of community and its commitment to providing a high quality of life for its residents.
Common Questions
What is Per Capita Income in Severn?
Per Capita income in Severn is $54,186.
What is the Median Family Income in Severn?
Median Family Income in Severn is $135,797.
What is the Median Household income in Severn?
Median Household Income in Severn is $125,330.
What is Income or Wage Gap in Severn?
Income or Wage Gap in Severn is 30.1%.
Women in Severn earn 69.9 cents for every dollar earned by a man.
What is Inequality or Gini Index in Severn?
Inequality or Gini Index in Severn is 0.37.
What is the Total Population of Severn?
Total Population of Severn is 56,438.
What is the Total Male Population of Severn?
Total Male Population of Severn is 28,090.
What is the Total Female Population of Severn?
Total Female Population of Severn is 28,348.
What is the Ratio of Males per 100 Females in Severn?
There are 99.09 Males per 100 Females in Severn.
What is the Ratio of Females per 100 Males in Severn?
There are 100.92 Females per 100 Males in Severn.
What is the Median Population Age in Severn?
Median Population Age in Severn is 35.9 Years.
What is the Average Family Size in Severn
Average Family Size in Severn is 3.2 People.
What is the Average Household Size in Severn
Average Household Size in Severn is 2.7 People.
How Large is the Labor Force in Severn?
There are 32,193 People in the Labor Forcein in Severn.
What is the Percentage of People in the Labor Force in Severn?
72.1% of People are in the Labor Force in Severn.
What is the Unemployment Rate in Severn?
Unemployment Rate in Severn is 4.9%.