Hattiesburg, MS Map & Demographics
Hattiesburg Map
Hattiesburg Overview
$27,005
PER CAPITA INCOME
$53,116
AVG FAMILY INCOME
$41,024
AVG HOUSEHOLD INCOME
32.2%
WAGE / INCOME GAP [ % ]
67.8¢/ $1
WAGE / INCOME GAP [ $ ]
$13,040
FAMILY INCOME DEFICIT
0.54
INEQUALITY / GINI INDEX
48,466
TOTAL POPULATION
22,180
MALE POPULATION
26,286
FEMALE POPULATION
84.38
MALES / 100 FEMALES
118.51
FEMALES / 100 MALES
28.5
MEDIAN AGE
3.0
AVG FAMILY SIZE
2.2
AVG HOUSEHOLD SIZE
25,385
LABOR FORCE [ PEOPLE ]
63.6%
PERCENT IN LABOR FORCE
7.8%
UNEMPLOYMENT RATE
Income in Hattiesburg
Income Overview in Hattiesburg
Per Capita Income in Hattiesburg is $27,005, while median incomes of families and households are $53,116 and $41,024 respectively.
| Characteristic | Number | Measure |
| Per Capita Income | 48,466 | $27,005 |
| Median Family Income | 9,952 | $53,116 |
| Mean Family Income | 9,952 | $82,683 |
| Median Household Income | 19,787 | $41,024 |
| Mean Household Income | 19,787 | $62,931 |
| Income Deficit | 9,952 | $13,040 |
| Wage / Income Gap (%) | 48,466 | 32.21% |
| Wage / Income Gap ($) | 48,466 | 67.79¢ per $1 |
| Gini / Inequality Index | 48,466 | 0.54 |
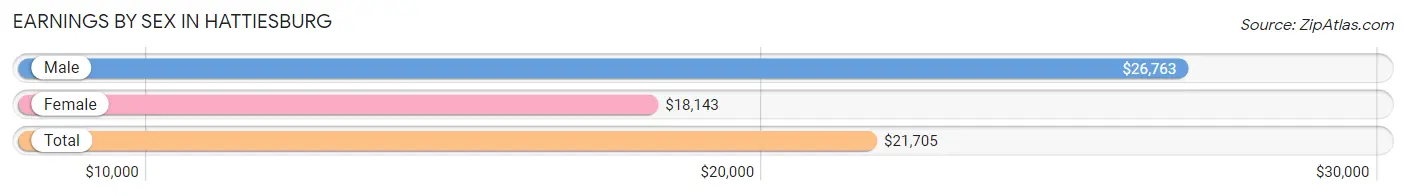
Earnings by Sex in Hattiesburg
Average Earnings in Hattiesburg are $21,705, $26,763 for men and $18,143 for women, a difference of 32.2%.
| Sex | Number | Average Earnings |
| Male | 12,594 (47.3%) | $26,763 |
| Female | 14,050 (52.7%) | $18,143 |
| Total | 26,644 (100.0%) | $21,705 |
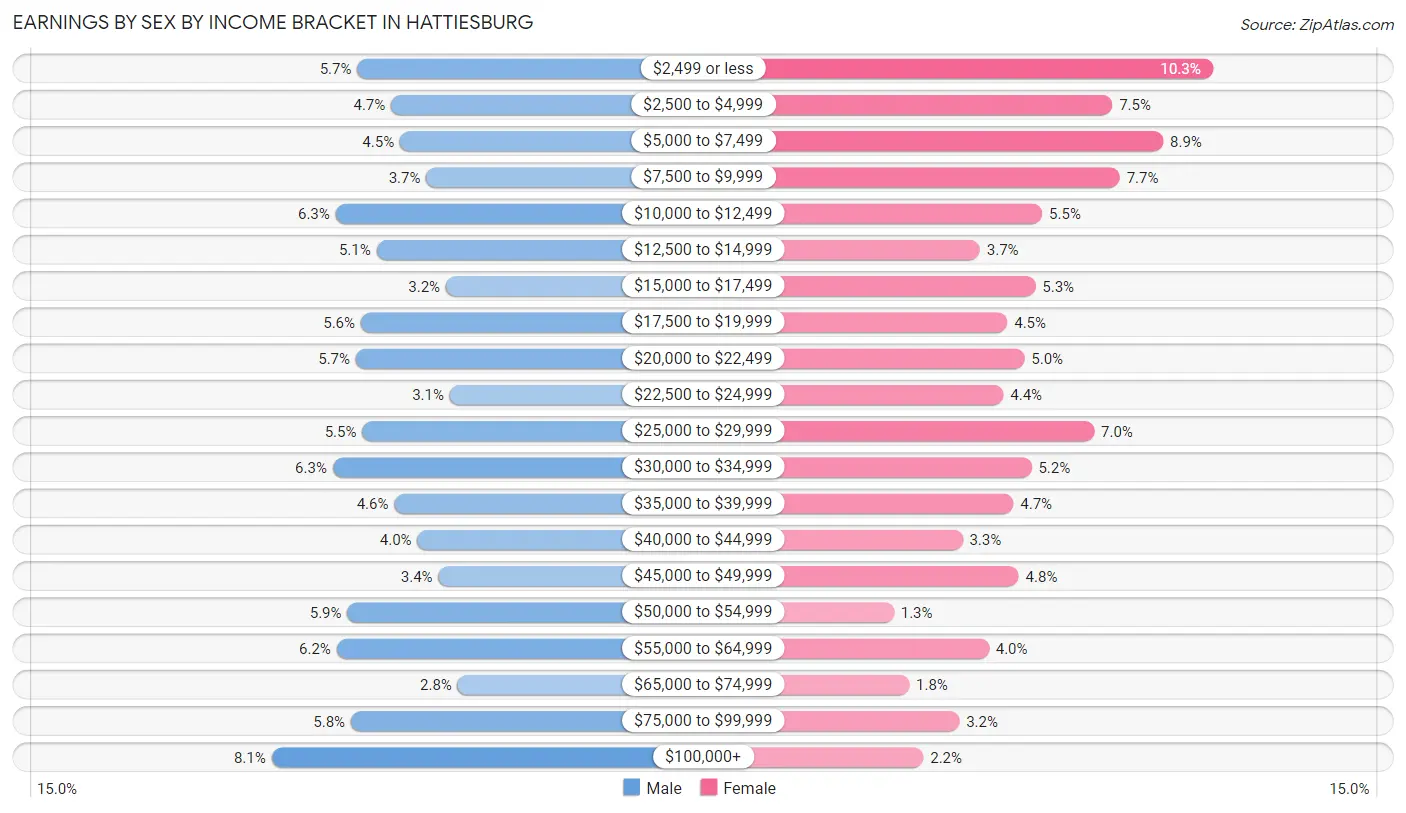
Earnings by Sex by Income Bracket in Hattiesburg
The most common earnings brackets in Hattiesburg are $100,000+ for men (1,015 | 8.1%) and $2,499 or less for women (1,445 | 10.3%).
| Income | Male | Female |
| $2,499 or less | 711 (5.7%) | 1,445 (10.3%) |
| $2,500 to $4,999 | 592 (4.7%) | 1,048 (7.5%) |
| $5,000 to $7,499 | 561 (4.4%) | 1,249 (8.9%) |
| $7,500 to $9,999 | 467 (3.7%) | 1,078 (7.7%) |
| $10,000 to $12,499 | 788 (6.3%) | 772 (5.5%) |
| $12,500 to $14,999 | 643 (5.1%) | 525 (3.7%) |
| $15,000 to $17,499 | 398 (3.2%) | 745 (5.3%) |
| $17,500 to $19,999 | 699 (5.6%) | 634 (4.5%) |
| $20,000 to $22,499 | 717 (5.7%) | 701 (5.0%) |
| $22,500 to $24,999 | 384 (3.0%) | 618 (4.4%) |
| $25,000 to $29,999 | 694 (5.5%) | 976 (7.0%) |
| $30,000 to $34,999 | 799 (6.3%) | 729 (5.2%) |
| $35,000 to $39,999 | 580 (4.6%) | 658 (4.7%) |
| $40,000 to $44,999 | 499 (4.0%) | 456 (3.3%) |
| $45,000 to $49,999 | 424 (3.4%) | 678 (4.8%) |
| $50,000 to $54,999 | 747 (5.9%) | 186 (1.3%) |
| $55,000 to $64,999 | 785 (6.2%) | 560 (4.0%) |
| $65,000 to $74,999 | 357 (2.8%) | 246 (1.8%) |
| $75,000 to $99,999 | 734 (5.8%) | 444 (3.2%) |
| $100,000+ | 1,015 (8.1%) | 302 (2.1%) |
| Total | 12,594 (100.0%) | 14,050 (100.0%) |
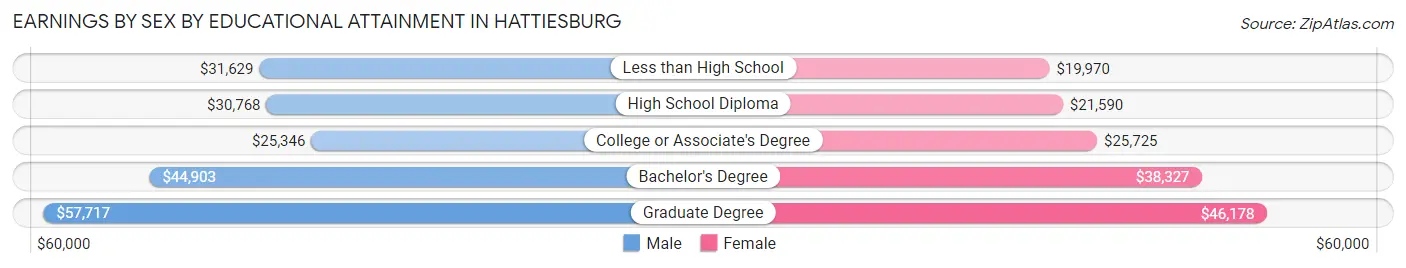
Earnings by Sex by Educational Attainment in Hattiesburg
Average earnings in Hattiesburg are $36,763 for men and $29,002 for women, a difference of 21.1%. Men with an educational attainment of graduate degree enjoy the highest average annual earnings of $57,717, while those with college or associate's degree education earn the least with $25,346. Women with an educational attainment of graduate degree earn the most with the average annual earnings of $46,178, while those with less than high school education have the smallest earnings of $19,970.
| Educational Attainment | Male Income | Female Income |
| Less than High School | $31,629 | $19,970 |
| High School Diploma | $30,768 | $21,590 |
| College or Associate's Degree | $25,346 | $25,725 |
| Bachelor's Degree | $44,903 | $38,327 |
| Graduate Degree | $57,717 | $46,178 |
| Total | $36,763 | $29,002 |
Family Income in Hattiesburg
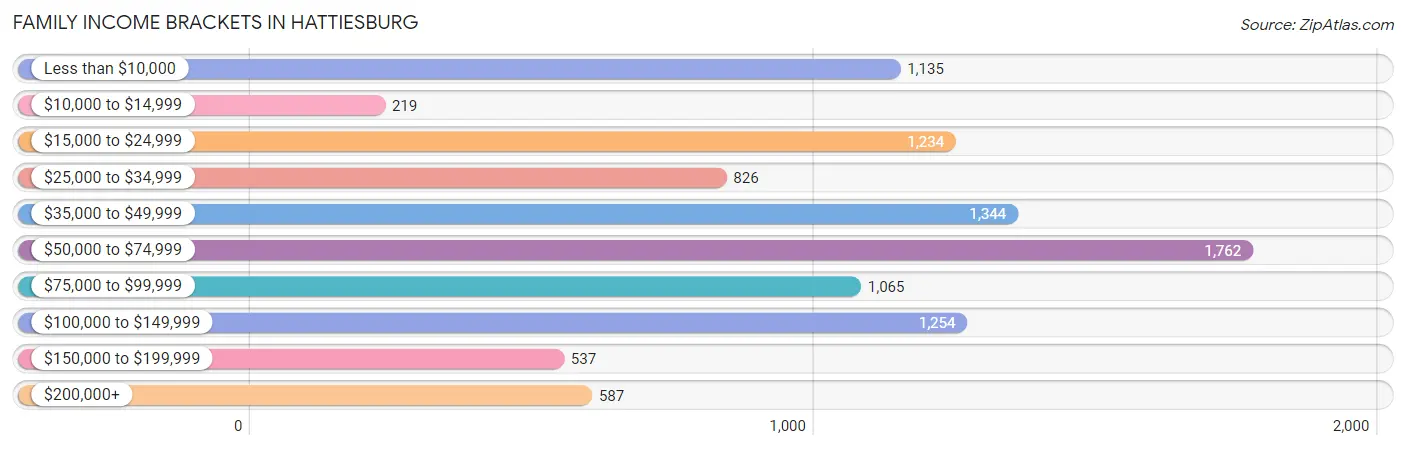
Family Income Brackets in Hattiesburg
According to the Hattiesburg family income data, there are 1,762 families falling into the $50,000 to $74,999 income range, which is the most common income bracket and makes up 17.7% of all families. Conversely, the $10,000 to $14,999 income bracket is the least frequent group with only 219 families (2.2%) belonging to this category.
| Income Bracket | # Families | % Families |
| Less than $10,000 | 1,135 | 11.4% |
| $10,000 to $14,999 | 219 | 2.2% |
| $15,000 to $24,999 | 1,234 | 12.4% |
| $25,000 to $34,999 | 826 | 8.3% |
| $35,000 to $49,999 | 1,344 | 13.5% |
| $50,000 to $74,999 | 1,762 | 17.7% |
| $75,000 to $99,999 | 1,065 | 10.7% |
| $100,000 to $149,999 | 1,254 | 12.6% |
| $150,000 to $199,999 | 537 | 5.4% |
| $200,000+ | 587 | 5.9% |
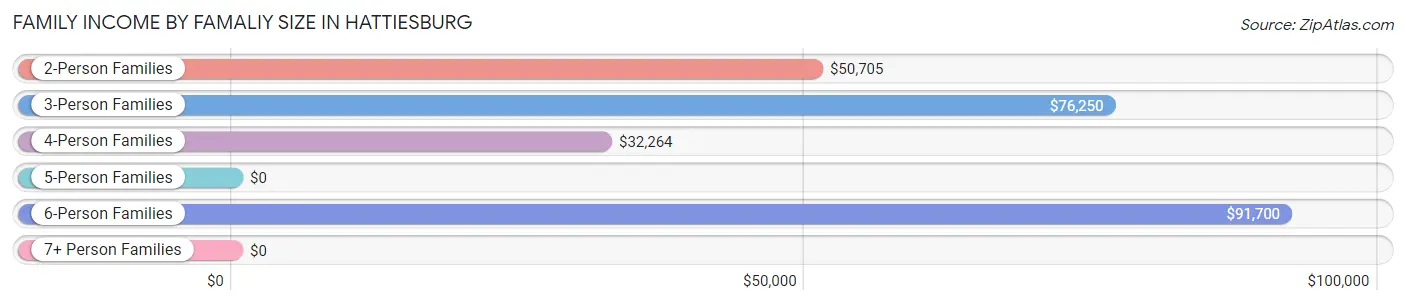
Family Income by Famaliy Size in Hattiesburg
6-person families (200 | 2.0%) account for the highest median family income in Hattiesburg with $91,700 per family, while 3-person families (1,877 | 18.9%) have the highest median income of $25,417 per family member.
| Income Bracket | # Families | Median Income |
| 2-Person Families | 5,140 (51.6%) | $50,705 |
| 3-Person Families | 1,877 (18.9%) | $76,250 |
| 4-Person Families | 1,905 (19.1%) | $32,264 |
| 5-Person Families | 744 (7.5%) | $0 |
| 6-Person Families | 200 (2.0%) | $91,700 |
| 7+ Person Families | 86 (0.9%) | $0 |
| Total | 9,952 (100.0%) | $53,116 |
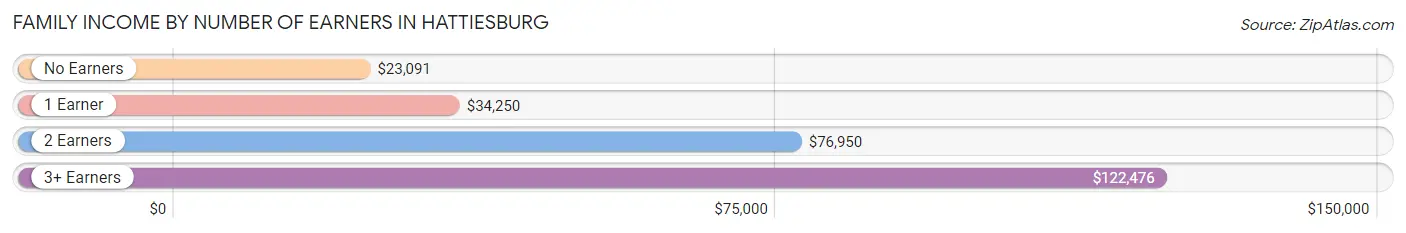
Family Income by Number of Earners in Hattiesburg
The median family income in Hattiesburg is $53,116, with families comprising 3+ earners (621) having the highest median family income of $122,476, while families with no earners (2,011) have the lowest median family income of $23,091, accounting for 6.2% and 20.2% of families, respectively.
| Number of Earners | # Families | Median Income |
| No Earners | 2,011 (20.2%) | $23,091 |
| 1 Earner | 3,652 (36.7%) | $34,250 |
| 2 Earners | 3,668 (36.9%) | $76,950 |
| 3+ Earners | 621 (6.2%) | $122,476 |
| Total | 9,952 (100.0%) | $53,116 |
Household Income in Hattiesburg
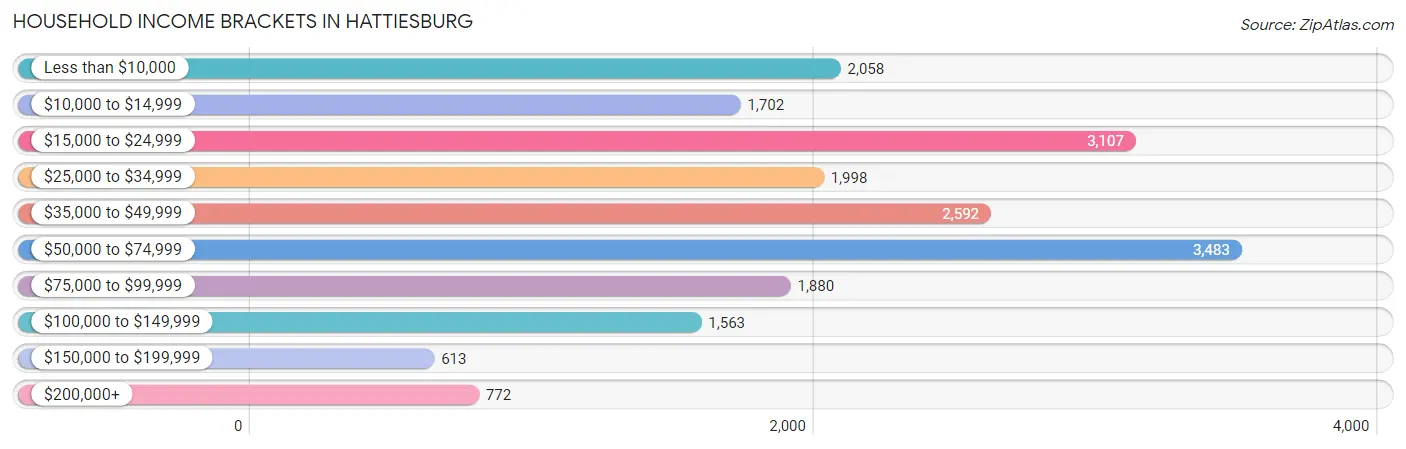
Household Income Brackets in Hattiesburg
With 3,483 households falling in the category, the $50,000 to $74,999 income range is the most frequent in Hattiesburg, accounting for 17.6% of all households. In contrast, only 613 households (3.1%) fall into the $150,000 to $199,999 income bracket, making it the least populous group.
| Income Bracket | # Households | % Households |
| Less than $10,000 | 2,058 | 10.4% |
| $10,000 to $14,999 | 1,702 | 8.6% |
| $15,000 to $24,999 | 3,107 | 15.7% |
| $25,000 to $34,999 | 1,998 | 10.1% |
| $35,000 to $49,999 | 2,592 | 13.1% |
| $50,000 to $74,999 | 3,483 | 17.6% |
| $75,000 to $99,999 | 1,880 | 9.5% |
| $100,000 to $149,999 | 1,563 | 7.9% |
| $150,000 to $199,999 | 613 | 3.1% |
| $200,000+ | 772 | 3.9% |
Household Income by Householder Age in Hattiesburg
The median household income in Hattiesburg is $41,024, with the highest median household income of $46,367 found in the 65+ years age bracket for the primary householder. A total of 3,848 households (19.5%) fall into this category. Meanwhile, the 15 to 24 years age bracket for the primary householder has the lowest median household income of $23,391, with 3,042 households (15.4%) in this group.
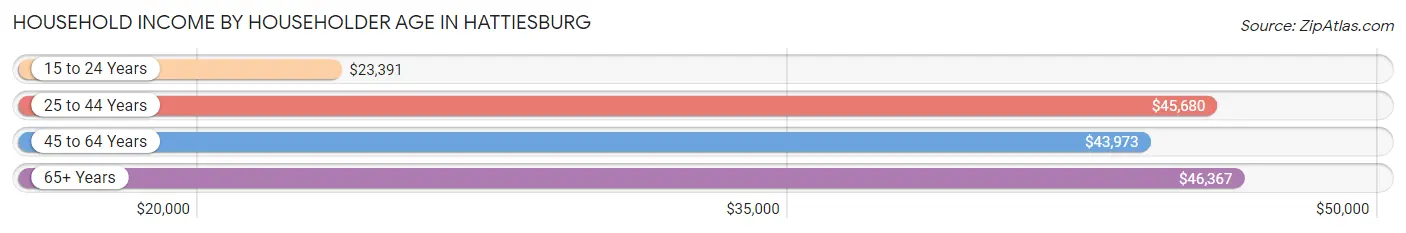
| Income Bracket | # Households | Median Income |
| 15 to 24 Years | 3,042 (15.4%) | $23,391 |
| 25 to 44 Years | 8,013 (40.5%) | $45,680 |
| 45 to 64 Years | 4,884 (24.7%) | $43,973 |
| 65+ Years | 3,848 (19.5%) | $46,367 |
| Total | 19,787 (100.0%) | $41,024 |
Poverty in Hattiesburg
Income Below Poverty by Sex and Age in Hattiesburg
With 26.9% poverty level for males and 36.3% for females among the residents of Hattiesburg, 16 and 17 year old males and 5 year old females are the most vulnerable to poverty, with 336 males (61.0%) and 299 females (67.0%) in their respective age groups living below the poverty level.
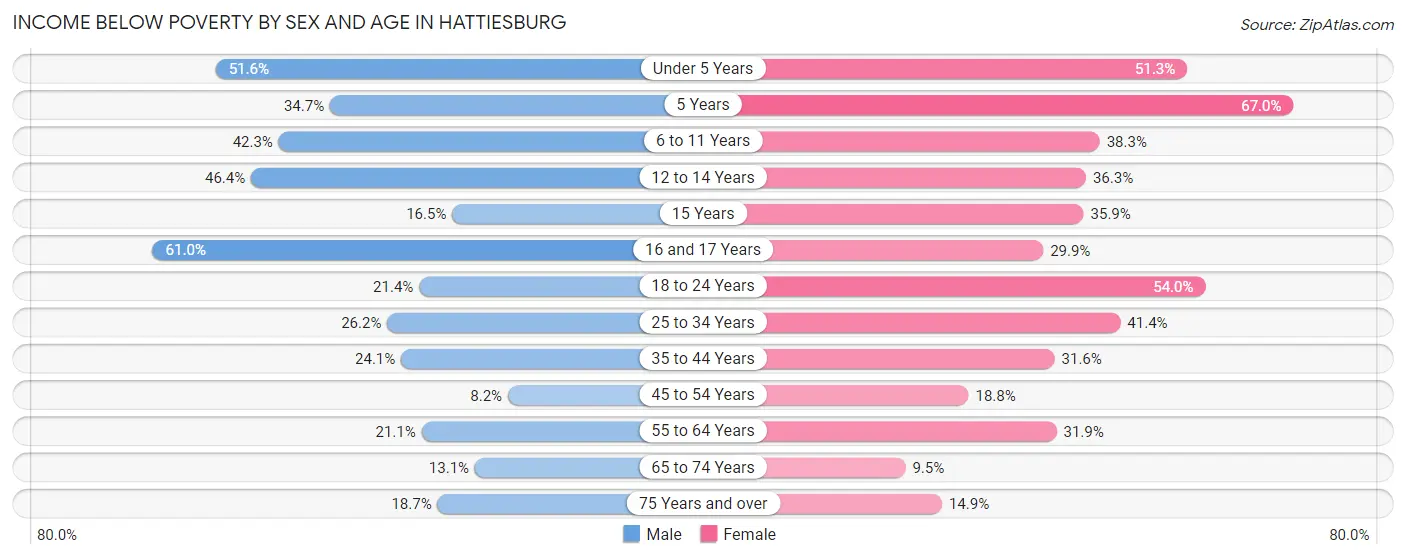
| Age Bracket | Male | Female |
| Under 5 Years | 868 (51.6%) | 729 (51.3%) |
| 5 Years | 44 (34.6%) | 299 (67.0%) |
| 6 to 11 Years | 629 (42.3%) | 584 (38.3%) |
| 12 to 14 Years | 282 (46.4%) | 223 (36.3%) |
| 15 Years | 33 (16.5%) | 65 (35.9%) |
| 16 and 17 Years | 336 (61.0%) | 134 (29.9%) |
| 18 to 24 Years | 635 (21.4%) | 2,639 (54.0%) |
| 25 to 34 Years | 1,213 (26.2%) | 1,736 (41.4%) |
| 35 to 44 Years | 560 (24.1%) | 748 (31.6%) |
| 45 to 54 Years | 125 (8.2%) | 372 (18.8%) |
| 55 to 64 Years | 421 (21.1%) | 780 (31.9%) |
| 65 to 74 Years | 193 (13.1%) | 166 (9.5%) |
| 75 Years and over | 180 (18.7%) | 263 (14.9%) |
| Total | 5,519 (26.9%) | 8,738 (36.3%) |
Income Above Poverty by Sex and Age in Hattiesburg
According to the poverty statistics in Hattiesburg, males aged 45 to 54 years and females aged 65 to 74 years are the age groups that are most secure financially, with 91.8% of males and 90.5% of females in these age groups living above the poverty line.
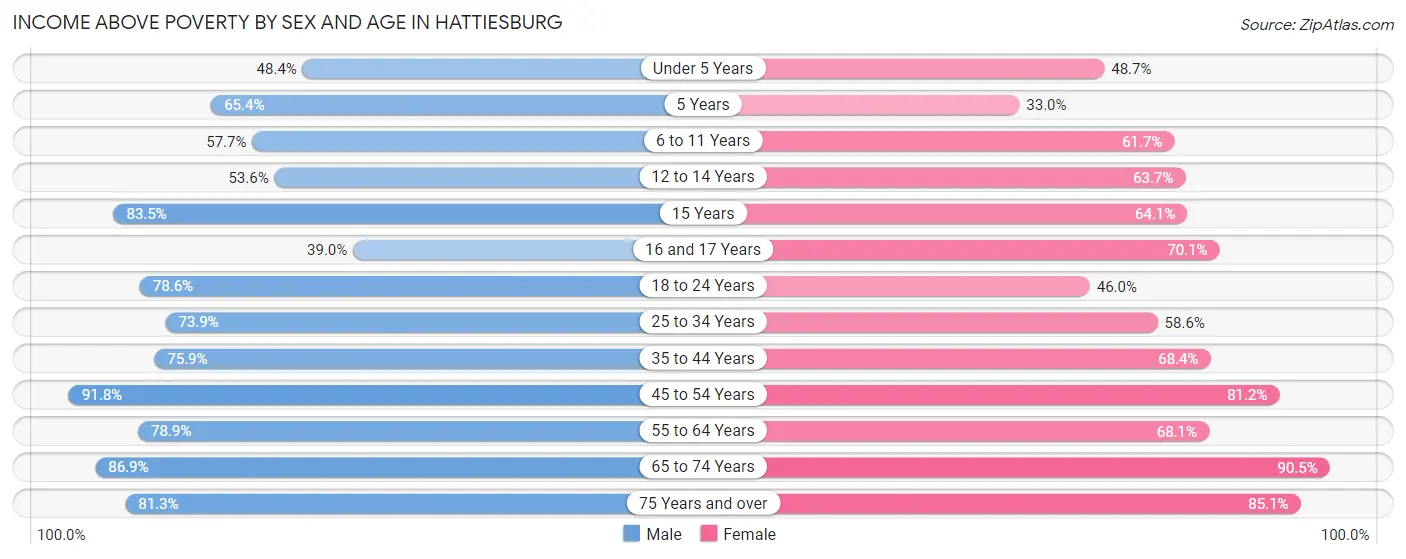
| Age Bracket | Male | Female |
| Under 5 Years | 814 (48.4%) | 693 (48.7%) |
| 5 Years | 83 (65.3%) | 147 (33.0%) |
| 6 to 11 Years | 859 (57.7%) | 941 (61.7%) |
| 12 to 14 Years | 326 (53.6%) | 392 (63.7%) |
| 15 Years | 167 (83.5%) | 116 (64.1%) |
| 16 and 17 Years | 215 (39.0%) | 314 (70.1%) |
| 18 to 24 Years | 2,331 (78.6%) | 2,251 (46.0%) |
| 25 to 34 Years | 3,426 (73.9%) | 2,460 (58.6%) |
| 35 to 44 Years | 1,765 (75.9%) | 1,619 (68.4%) |
| 45 to 54 Years | 1,394 (91.8%) | 1,605 (81.2%) |
| 55 to 64 Years | 1,578 (78.9%) | 1,666 (68.1%) |
| 65 to 74 Years | 1,277 (86.9%) | 1,589 (90.5%) |
| 75 Years and over | 783 (81.3%) | 1,505 (85.1%) |
| Total | 15,018 (73.1%) | 15,298 (63.6%) |
Income Below Poverty Among Married-Couple Families in Hattiesburg
The poverty statistics for married-couple families in Hattiesburg show that 8.8% or 474 of the total 5,367 families live below the poverty line. Families with 3 or 4 children have the highest poverty rate of 43.4%, comprising of 167 families. On the other hand, families with no children have the lowest poverty rate of 4.9%, which includes 163 families.
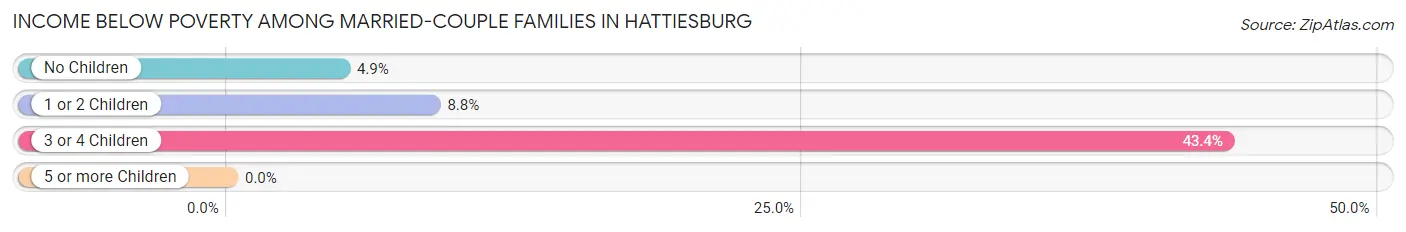
| Children | Above Poverty | Below Poverty |
| No Children | 3,184 (95.1%) | 163 (4.9%) |
| 1 or 2 Children | 1,491 (91.2%) | 144 (8.8%) |
| 3 or 4 Children | 218 (56.6%) | 167 (43.4%) |
| 5 or more Children | 0 (0.0%) | 0 (0.0%) |
| Total | 4,893 (91.2%) | 474 (8.8%) |
Income Below Poverty Among Single-Parent Households in Hattiesburg
According to the poverty data in Hattiesburg, 10.2% or 76 single-father households and 49.1% or 1,884 single-mother households are living below the poverty line. Among single-father households, those with 3 or 4 children have the highest poverty rate, with 48 households (100.0%) experiencing poverty. Likewise, among single-mother households, those with 5 or more children have the highest poverty rate, with 31 households (100.0%) falling below the poverty line.
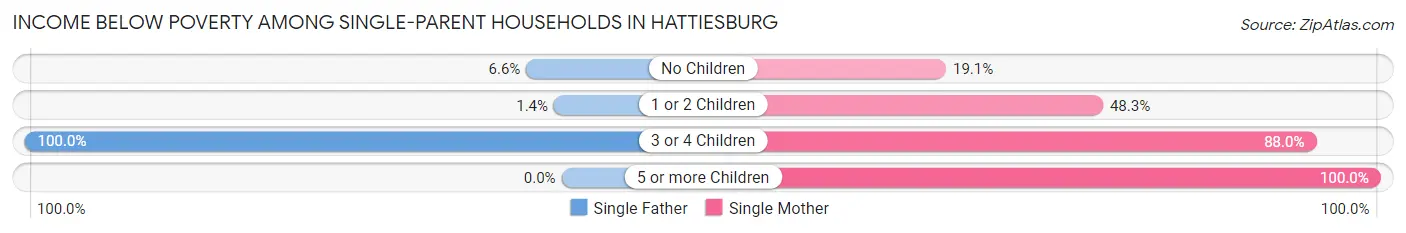
| Children | Single Father | Single Mother |
| No Children | 23 (6.6%) | 226 (19.1%) |
| 1 or 2 Children | 5 (1.4%) | 826 (48.3%) |
| 3 or 4 Children | 48 (100.0%) | 801 (88.0%) |
| 5 or more Children | 0 (0.0%) | 31 (100.0%) |
| Total | 76 (10.2%) | 1,884 (49.1%) |
Income Below Poverty Among Married-Couple vs Single-Parent Households in Hattiesburg
The poverty data for Hattiesburg shows that 474 of the married-couple family households (8.8%) and 1,960 of the single-parent households (42.7%) are living below the poverty level. Within the married-couple family households, those with 3 or 4 children have the highest poverty rate, with 167 households (43.4%) falling below the poverty line. Among the single-parent households, those with 5 or more children have the highest poverty rate, with 31 household (100.0%) living below poverty.
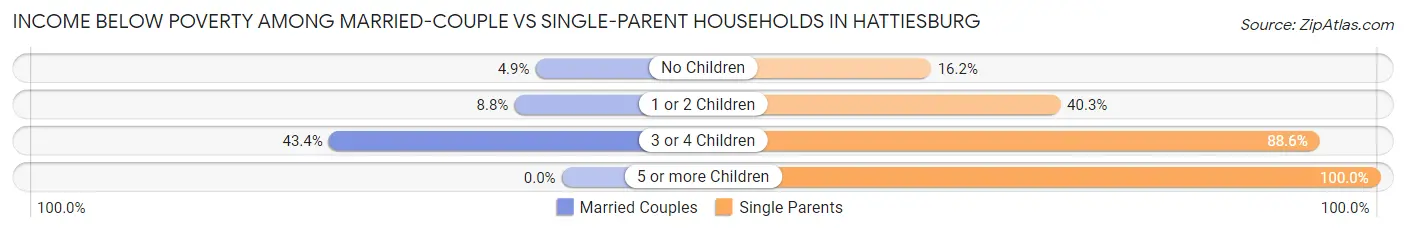
| Children | Married-Couple Families | Single-Parent Households |
| No Children | 163 (4.9%) | 249 (16.2%) |
| 1 or 2 Children | 144 (8.8%) | 831 (40.3%) |
| 3 or 4 Children | 167 (43.4%) | 849 (88.6%) |
| 5 or more Children | 0 (0.0%) | 31 (100.0%) |
| Total | 474 (8.8%) | 1,960 (42.7%) |
Race in Hattiesburg
The most populous races in Hattiesburg are Black / African American (24,983 | 51.5%), White / Caucasian (20,028 | 41.3%), and Two or more Races (2,417 | 5.0%).
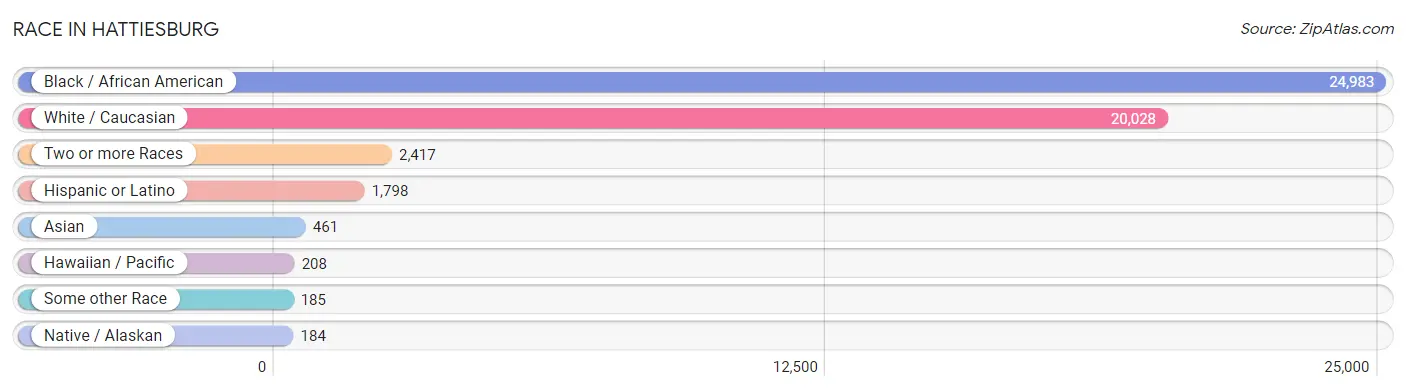
| Race | # Population | % Population |
| Asian | 461 | 0.9% |
| Black / African American | 24,983 | 51.5% |
| Hawaiian / Pacific | 208 | 0.4% |
| Hispanic or Latino | 1,798 | 3.7% |
| Native / Alaskan | 184 | 0.4% |
| White / Caucasian | 20,028 | 41.3% |
| Two or more Races | 2,417 | 5.0% |
| Some other Race | 185 | 0.4% |
| Total | 48,466 | 100.0% |
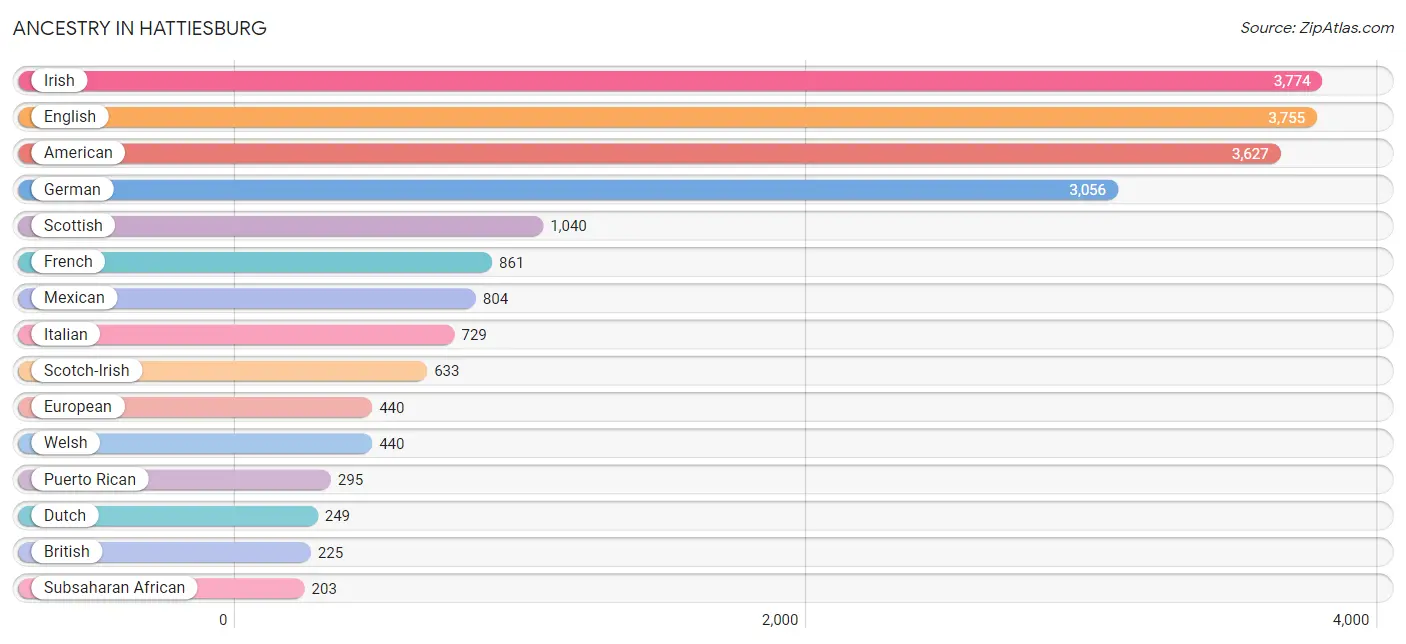
Ancestry in Hattiesburg
The most populous ancestries reported in Hattiesburg are Irish (3,774 | 7.8%), English (3,755 | 7.7%), American (3,627 | 7.5%), German (3,056 | 6.3%), and Scottish (1,040 | 2.1%), together accounting for 31.5% of all Hattiesburg residents.
| Ancestry | # Population | % Population |
| African | 164 | 0.3% |
| American | 3,627 | 7.5% |
| Arab | 38 | 0.1% |
| Australian | 39 | 0.1% |
| Austrian | 16 | 0.0% |
| Bahamian | 5 | 0.0% |
| Bhutanese | 130 | 0.3% |
| Blackfeet | 4 | 0.0% |
| Brazilian | 37 | 0.1% |
| British | 225 | 0.5% |
| Burmese | 182 | 0.4% |
| Cajun | 29 | 0.1% |
| Canadian | 15 | 0.0% |
| Celtic | 4 | 0.0% |
| Central American | 151 | 0.3% |
| Cherokee | 189 | 0.4% |
| Chickasaw | 11 | 0.0% |
| Choctaw | 171 | 0.4% |
| Colombian | 73 | 0.2% |
| Croatian | 32 | 0.1% |
| Cuban | 94 | 0.2% |
| Czech | 49 | 0.1% |
| Czechoslovakian | 11 | 0.0% |
| Danish | 12 | 0.0% |
| Dominican | 10 | 0.0% |
| Dutch | 249 | 0.5% |
| Dutch West Indian | 37 | 0.1% |
| Eastern European | 52 | 0.1% |
| Ecuadorian | 12 | 0.0% |
| Egyptian | 26 | 0.1% |
| English | 3,755 | 7.7% |
| European | 440 | 0.9% |
| Fijian | 155 | 0.3% |
| Finnish | 19 | 0.0% |
| French | 861 | 1.8% |
| French Canadian | 21 | 0.0% |
| German | 3,056 | 6.3% |
| Ghanaian | 16 | 0.0% |
| Greek | 109 | 0.2% |
| Guatemalan | 68 | 0.1% |
| Honduran | 56 | 0.1% |
| Hungarian | 65 | 0.1% |
| Indian (Asian) | 181 | 0.4% |
| Iranian | 20 | 0.0% |
| Irish | 3,774 | 7.8% |
| Israeli | 7 | 0.0% |
| Italian | 729 | 1.5% |
| Jamaican | 82 | 0.2% |
| Japanese | 36 | 0.1% |
| Korean | 138 | 0.3% |
| Laotian | 4 | 0.0% |
| Lebanese | 7 | 0.0% |
| Lithuanian | 7 | 0.0% |
| Mexican | 804 | 1.7% |
| Native Hawaiian | 52 | 0.1% |
| Nigerian | 23 | 0.1% |
| Northern European | 16 | 0.0% |
| Norwegian | 125 | 0.3% |
| Panamanian | 12 | 0.0% |
| Polish | 147 | 0.3% |
| Portuguese | 29 | 0.1% |
| Puerto Rican | 295 | 0.6% |
| Russian | 23 | 0.1% |
| Salvadoran | 15 | 0.0% |
| Samoan | 7 | 0.0% |
| Scandinavian | 116 | 0.2% |
| Scotch-Irish | 633 | 1.3% |
| Scottish | 1,040 | 2.1% |
| Sioux | 2 | 0.0% |
| Slovak | 40 | 0.1% |
| South American | 92 | 0.2% |
| South American Indian | 5 | 0.0% |
| Spaniard | 138 | 0.3% |
| Spanish | 79 | 0.2% |
| Spanish American | 29 | 0.1% |
| Sri Lankan | 117 | 0.2% |
| Subsaharan African | 203 | 0.4% |
| Swedish | 80 | 0.2% |
| Swiss | 14 | 0.0% |
| Syrian | 5 | 0.0% |
| Thai | 110 | 0.2% |
| Ukrainian | 20 | 0.0% |
| Venezuelan | 7 | 0.0% |
| Welsh | 440 | 0.9% |
| West Indian | 4 | 0.0% |
| Yugoslavian | 5 | 0.0% | View All 86 Rows |
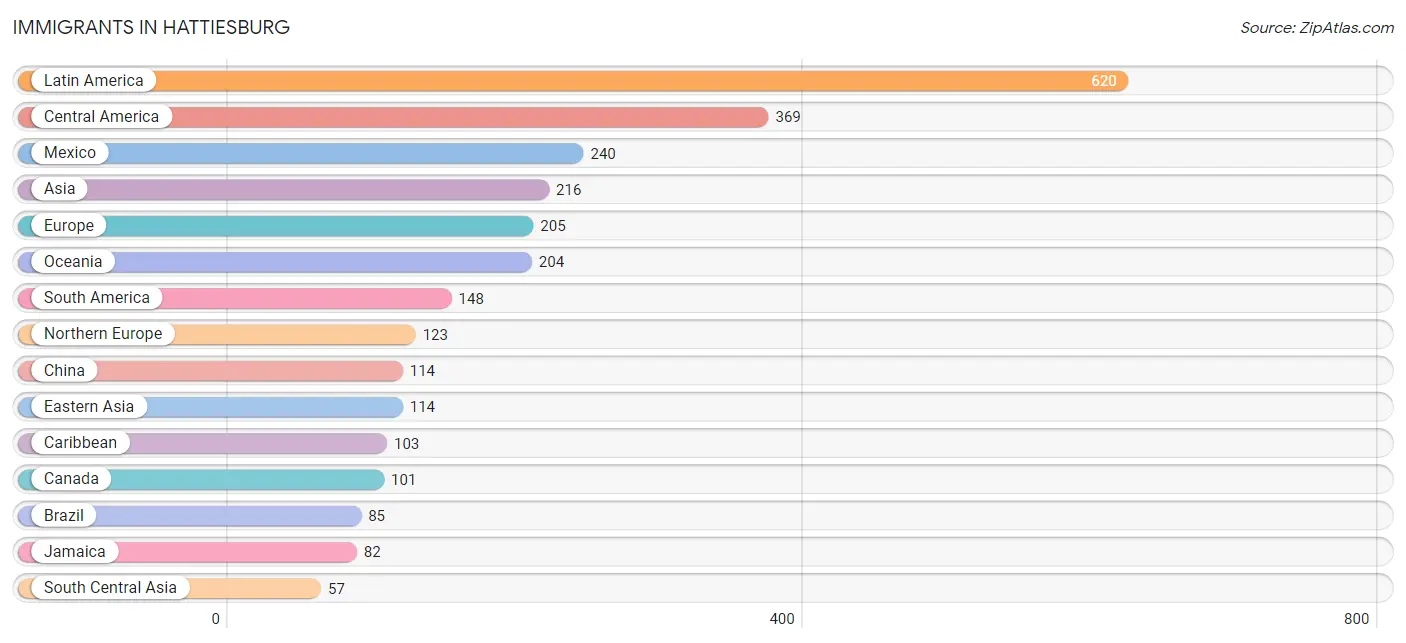
Immigrants in Hattiesburg
The most numerous immigrant groups reported in Hattiesburg came from Latin America (620 | 1.3%), Central America (369 | 0.8%), Mexico (240 | 0.5%), Asia (216 | 0.4%), and Europe (205 | 0.4%), together accounting for 3.4% of all Hattiesburg residents.
| Immigration Origin | # Population | % Population |
| Africa | 30 | 0.1% |
| Asia | 216 | 0.4% |
| Australia | 39 | 0.1% |
| Bahamas | 5 | 0.0% |
| Brazil | 85 | 0.2% |
| Canada | 101 | 0.2% |
| Caribbean | 103 | 0.2% |
| Central America | 369 | 0.8% |
| China | 114 | 0.2% |
| Colombia | 56 | 0.1% |
| Congo | 1 | 0.0% |
| Cuba | 6 | 0.0% |
| Dominican Republic | 10 | 0.0% |
| Eastern Africa | 1 | 0.0% |
| Eastern Asia | 114 | 0.2% |
| Eastern Europe | 4 | 0.0% |
| El Salvador | 15 | 0.0% |
| England | 28 | 0.1% |
| Europe | 205 | 0.4% |
| France | 8 | 0.0% |
| Germany | 6 | 0.0% |
| Ghana | 16 | 0.0% |
| Guatemala | 56 | 0.1% |
| Honduras | 46 | 0.1% |
| India | 1 | 0.0% |
| Ireland | 55 | 0.1% |
| Italy | 39 | 0.1% |
| Jamaica | 82 | 0.2% |
| Latin America | 620 | 1.3% |
| Mexico | 240 | 0.5% |
| Middle Africa | 1 | 0.0% |
| Nepal | 56 | 0.1% |
| Netherlands | 17 | 0.0% |
| Nigeria | 12 | 0.0% |
| Northern Europe | 123 | 0.3% |
| Oceania | 204 | 0.4% |
| Panama | 12 | 0.0% |
| Philippines | 35 | 0.1% |
| South America | 148 | 0.3% |
| South Central Asia | 57 | 0.1% |
| South Eastern Asia | 40 | 0.1% |
| Southern Europe | 47 | 0.1% |
| Spain | 8 | 0.0% |
| Syria | 5 | 0.0% |
| Ukraine | 4 | 0.0% |
| Venezuela | 7 | 0.0% |
| Vietnam | 5 | 0.0% |
| Western Africa | 28 | 0.1% |
| Western Asia | 5 | 0.0% |
| Western Europe | 31 | 0.1% | View All 50 Rows |
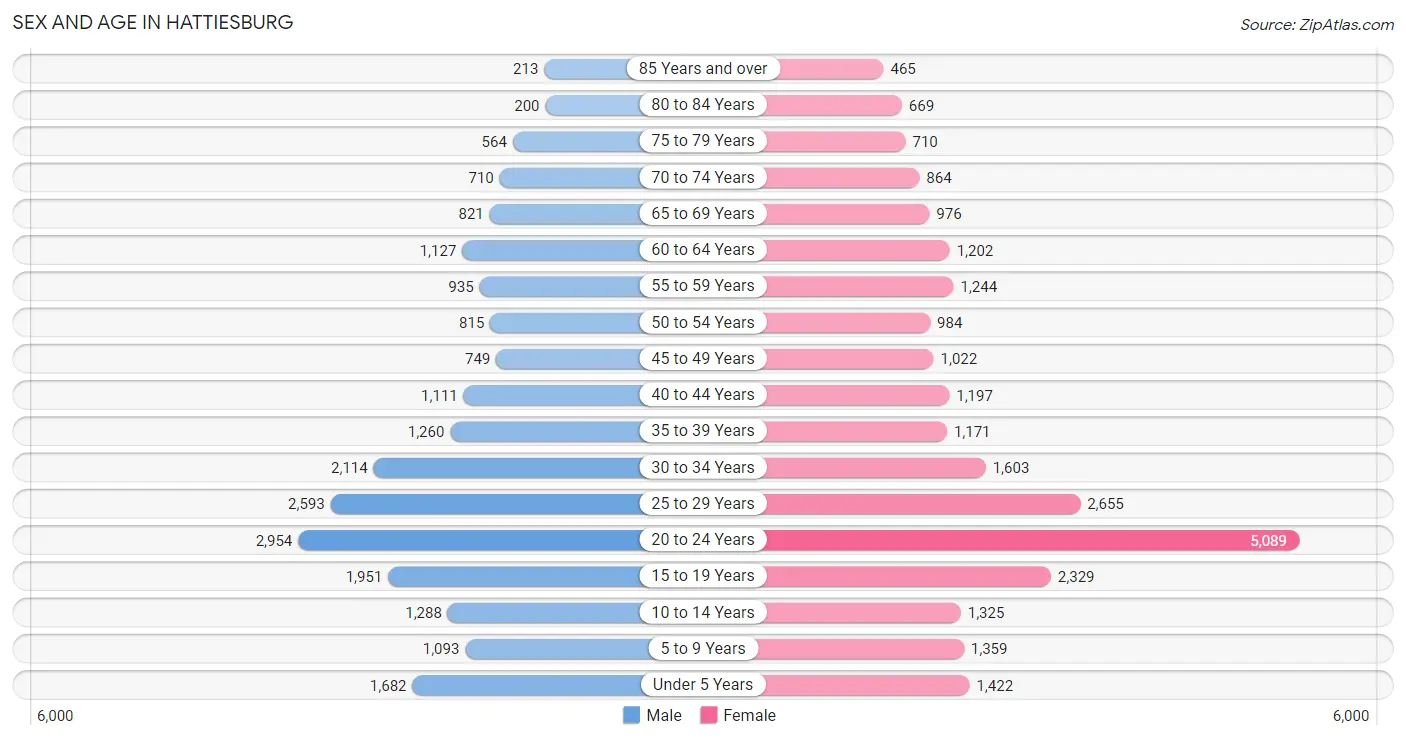
Sex and Age in Hattiesburg
Sex and Age in Hattiesburg
The most populous age groups in Hattiesburg are 20 to 24 Years (2,954 | 13.3%) for men and 20 to 24 Years (5,089 | 19.4%) for women.
| Age Bracket | Male | Female |
| Under 5 Years | 1,682 (7.6%) | 1,422 (5.4%) |
| 5 to 9 Years | 1,093 (4.9%) | 1,359 (5.2%) |
| 10 to 14 Years | 1,288 (5.8%) | 1,325 (5.0%) |
| 15 to 19 Years | 1,951 (8.8%) | 2,329 (8.9%) |
| 20 to 24 Years | 2,954 (13.3%) | 5,089 (19.4%) |
| 25 to 29 Years | 2,593 (11.7%) | 2,655 (10.1%) |
| 30 to 34 Years | 2,114 (9.5%) | 1,603 (6.1%) |
| 35 to 39 Years | 1,260 (5.7%) | 1,171 (4.4%) |
| 40 to 44 Years | 1,111 (5.0%) | 1,197 (4.5%) |
| 45 to 49 Years | 749 (3.4%) | 1,022 (3.9%) |
| 50 to 54 Years | 815 (3.7%) | 984 (3.7%) |
| 55 to 59 Years | 935 (4.2%) | 1,244 (4.7%) |
| 60 to 64 Years | 1,127 (5.1%) | 1,202 (4.6%) |
| 65 to 69 Years | 821 (3.7%) | 976 (3.7%) |
| 70 to 74 Years | 710 (3.2%) | 864 (3.3%) |
| 75 to 79 Years | 564 (2.5%) | 710 (2.7%) |
| 80 to 84 Years | 200 (0.9%) | 669 (2.5%) |
| 85 Years and over | 213 (1.0%) | 465 (1.8%) |
| Total | 22,180 (100.0%) | 26,286 (100.0%) |
Families and Households in Hattiesburg
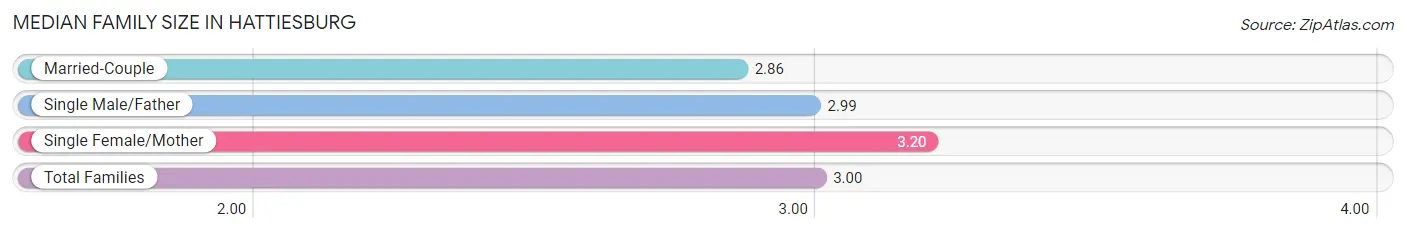
Median Family Size in Hattiesburg
The median family size in Hattiesburg is 3.00 persons per family, with single female/mother families (3,836 | 38.6%) accounting for the largest median family size of 3.2 persons per family. On the other hand, married-couple families (5,367 | 53.9%) represent the smallest median family size with 2.86 persons per family.
| Family Type | # Families | Family Size |
| Married-Couple | 5,367 (53.9%) | 2.86 |
| Single Male/Father | 749 (7.5%) | 2.99 |
| Single Female/Mother | 3,836 (38.6%) | 3.20 |
| Total Families | 9,952 (100.0%) | 3.00 |
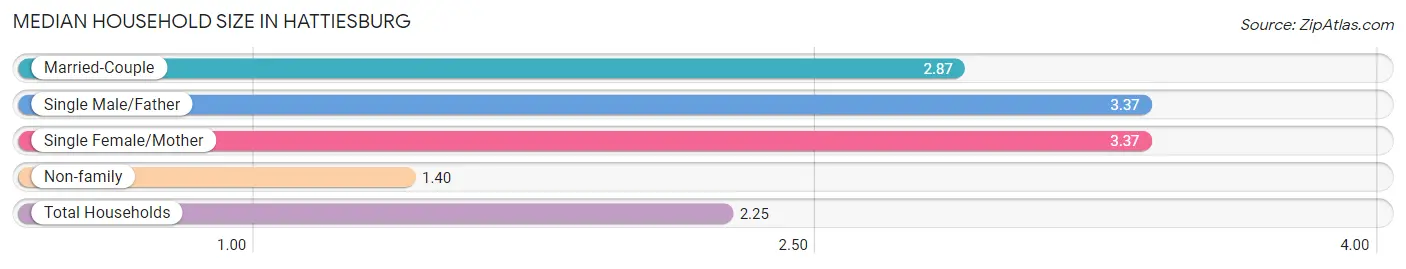
Median Household Size in Hattiesburg
The median household size in Hattiesburg is 2.25 persons per household, with single male/father households (749 | 3.8%) accounting for the largest median household size of 3.37 persons per household. non-family households (9,835 | 49.7%) represent the smallest median household size with 1.40 persons per household.
| Household Type | # Households | Household Size |
| Married-Couple | 5,367 (27.1%) | 2.87 |
| Single Male/Father | 749 (3.8%) | 3.37 |
| Single Female/Mother | 3,836 (19.4%) | 3.37 |
| Non-family | 9,835 (49.7%) | 1.40 |
| Total Households | 19,787 (100.0%) | 2.25 |
Household Size by Marriage Status in Hattiesburg
Out of a total of 19,787 households in Hattiesburg, 9,952 (50.3%) are family households, while 9,835 (49.7%) are nonfamily households. The most numerous type of family households are 2-person households, comprising 4,828, and the most common type of nonfamily households are 1-person households, comprising 7,406.
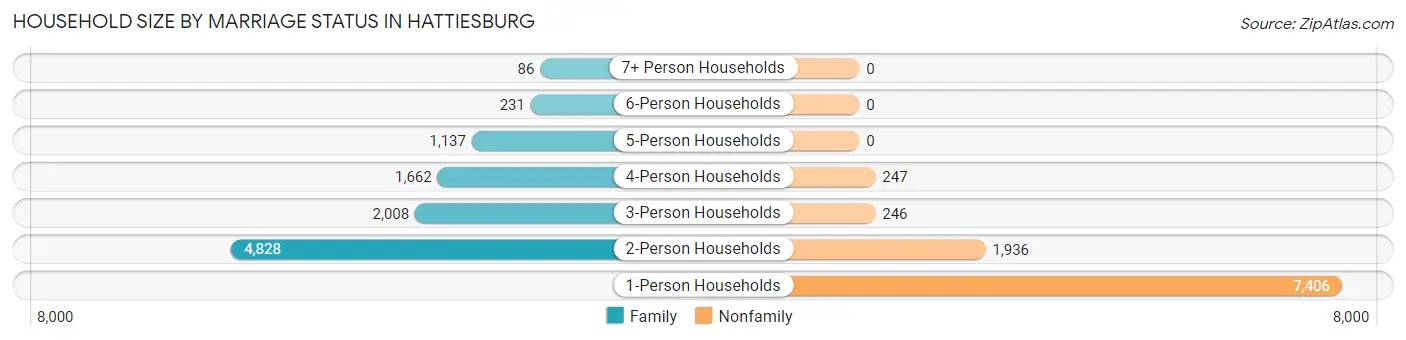
| Household Size | Family Households | Nonfamily Households |
| 1-Person Households | - | 7,406 (37.4%) |
| 2-Person Households | 4,828 (24.4%) | 1,936 (9.8%) |
| 3-Person Households | 2,008 (10.2%) | 246 (1.2%) |
| 4-Person Households | 1,662 (8.4%) | 247 (1.3%) |
| 5-Person Households | 1,137 (5.8%) | 0 (0.0%) |
| 6-Person Households | 231 (1.2%) | 0 (0.0%) |
| 7+ Person Households | 86 (0.4%) | 0 (0.0%) |
| Total | 9,952 (50.3%) | 9,835 (49.7%) |
Female Fertility in Hattiesburg
Fertility by Age in Hattiesburg
Average fertility rate in Hattiesburg is 67.0 births per 1,000 women. Women in the age bracket of 20 to 34 years have the highest fertility rate with 98.0 births per 1,000 women. Women in the age bracket of 20 to 34 years acount for 89.4% of all women with births.
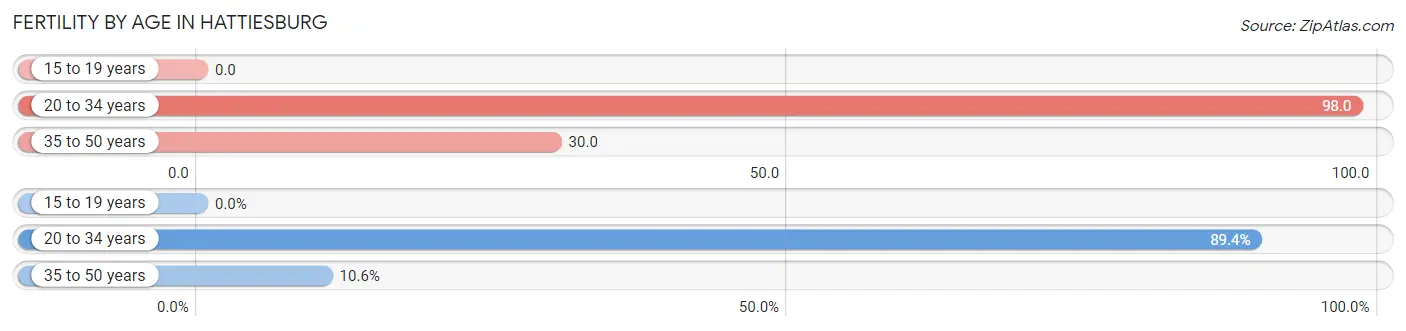
| Age Bracket | Women with Births | Births / 1,000 Women |
| 15 to 19 years | 0 (0.0%) | 0.0 |
| 20 to 34 years | 914 (89.4%) | 98.0 |
| 35 to 50 years | 108 (10.6%) | 30.0 |
| Total | 1,022 (100.0%) | 67.0 |
Fertility by Age by Marriage Status in Hattiesburg
39.7% of women with births (1,022) in Hattiesburg are married. The highest percentage of unmarried women with births falls into 20 to 34 years age bracket with 61.3% of them unmarried at the time of birth, while the lowest percentage of unmarried women with births belong to 35 to 50 years age bracket with 51.8% of them unmarried.
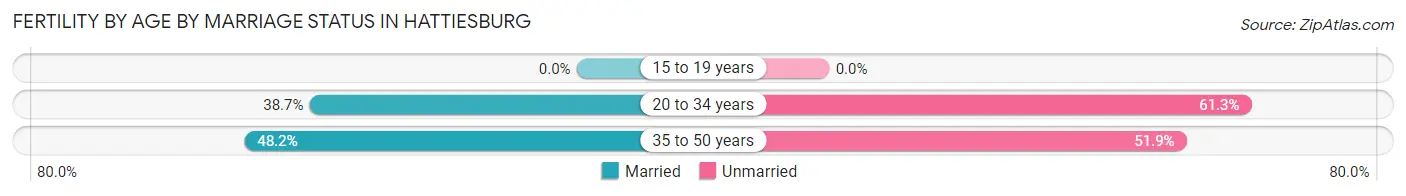
| Age Bracket | Married | Unmarried |
| 15 to 19 years | 0 (0.0%) | 0 (0.0%) |
| 20 to 34 years | 354 (38.7%) | 560 (61.3%) |
| 35 to 50 years | 52 (48.1%) | 56 (51.8%) |
| Total | 406 (39.7%) | 616 (60.3%) |
Fertility by Education in Hattiesburg
Average fertility rate in Hattiesburg is 67.0 births per 1,000 women. Women with the education attainment of graduate degree have the highest fertility rate of 147.0 births per 1,000 women, while women with the education attainment of less than high school have the lowest fertility at 5.0 births per 1,000 women. Women with the education attainment of college or associate's degree represent 62.8% of all women with births.
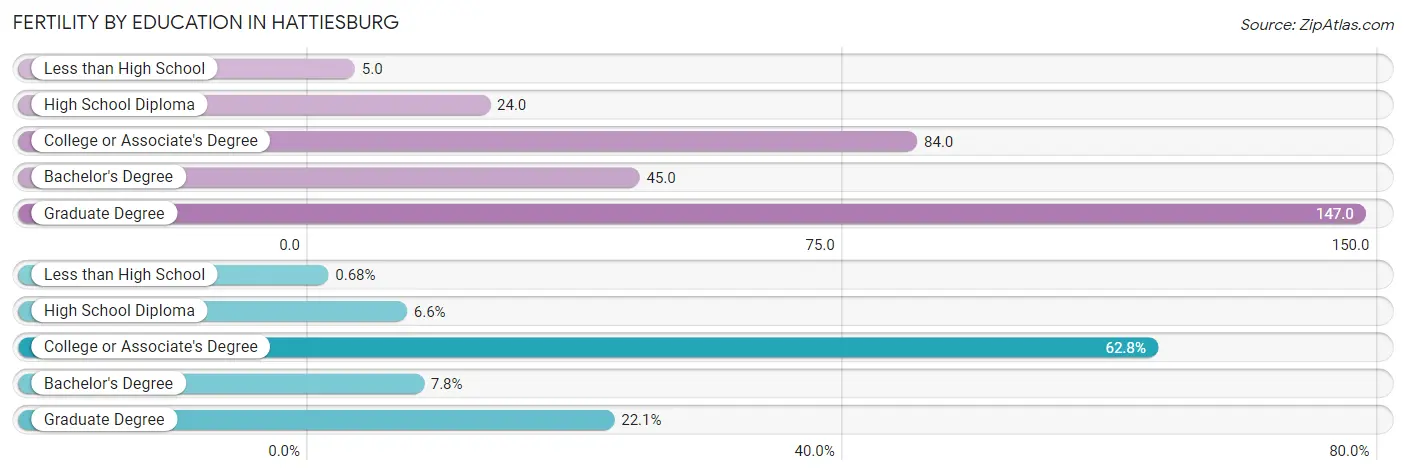
| Educational Attainment | Women with Births | Births / 1,000 Women |
| Less than High School | 7 (0.7%) | 5.0 |
| High School Diploma | 67 (6.6%) | 24.0 |
| College or Associate's Degree | 642 (62.8%) | 84.0 |
| Bachelor's Degree | 80 (7.8%) | 45.0 |
| Graduate Degree | 226 (22.1%) | 147.0 |
| Total | 1,022 (100.0%) | 67.0 |
Fertility by Education by Marriage Status in Hattiesburg
60.3% of women with births in Hattiesburg are unmarried. Women with the educational attainment of high school diploma are most likely to be married with 70.2% of them married at childbirth, while women with the educational attainment of less than high school are least likely to be married with 100.0% of them unmarried at childbirth.
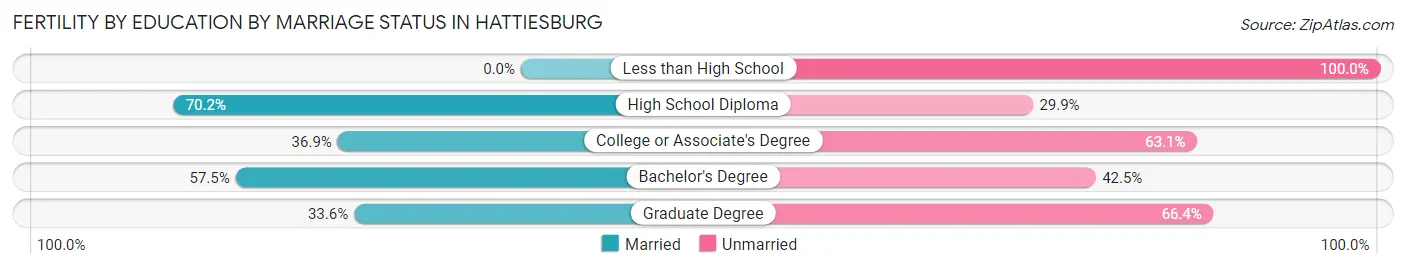
| Educational Attainment | Married | Unmarried |
| Less than High School | 0 (0.0%) | 7 (100.0%) |
| High School Diploma | 47 (70.2%) | 20 (29.8%) |
| College or Associate's Degree | 237 (36.9%) | 405 (63.1%) |
| Bachelor's Degree | 46 (57.5%) | 34 (42.5%) |
| Graduate Degree | 76 (33.6%) | 150 (66.4%) |
| Total | 406 (39.7%) | 616 (60.3%) |
Employment Characteristics in Hattiesburg
Employment by Class of Employer in Hattiesburg
Among the 22,820 employed individuals in Hattiesburg, private company employees (15,323 | 67.1%), state government employees (2,563 | 11.2%), and local government employees (1,579 | 6.9%) make up the most common classes of employment.
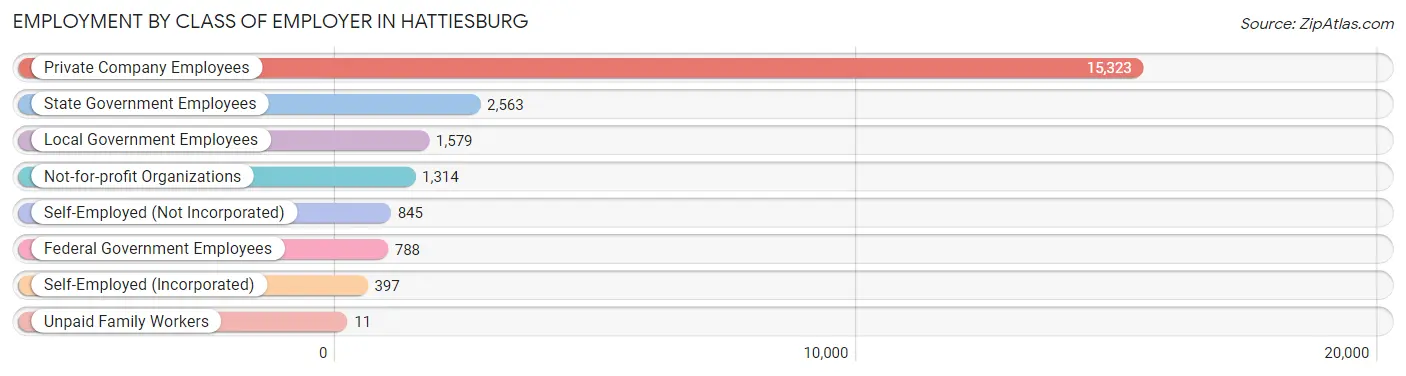
| Employer Class | # Employees | % Employees |
| Private Company Employees | 15,323 | 67.1% |
| Self-Employed (Incorporated) | 397 | 1.7% |
| Self-Employed (Not Incorporated) | 845 | 3.7% |
| Not-for-profit Organizations | 1,314 | 5.8% |
| Local Government Employees | 1,579 | 6.9% |
| State Government Employees | 2,563 | 11.2% |
| Federal Government Employees | 788 | 3.5% |
| Unpaid Family Workers | 11 | 0.1% |
| Total | 22,820 | 100.0% |
Employment Status by Age in Hattiesburg
According to the labor force statistics for Hattiesburg, out of the total population over 16 years of age (39,913), 63.6% or 25,385 individuals are in the labor force, with 7.8% or 1,980 of them unemployed. The age group with the highest labor force participation rate is 35 to 44 years, with 84.3% or 3,995 individuals in the labor force. Within the labor force, the 16 to 19 years age range has the highest percentage of unemployed individuals, with 15.3% or 284 of them being unemployed.
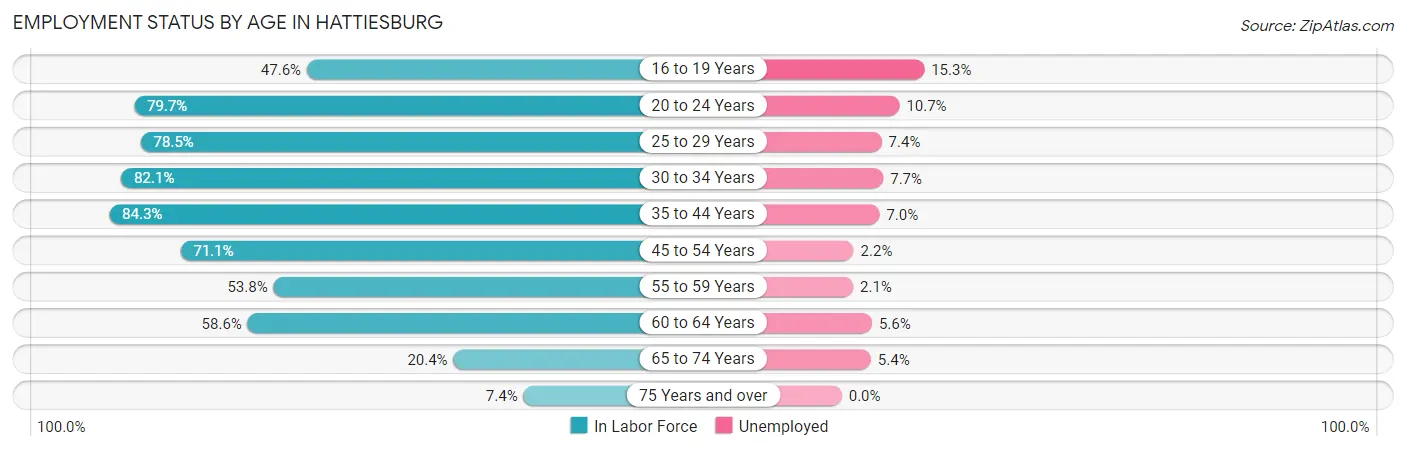
| Age Bracket | In Labor Force | Unemployed |
| 16 to 19 Years | 1,854 (47.6%) | 284 (15.3%) |
| 20 to 24 Years | 6,410 (79.7%) | 686 (10.7%) |
| 25 to 29 Years | 4,120 (78.5%) | 305 (7.4%) |
| 30 to 34 Years | 3,052 (82.1%) | 235 (7.7%) |
| 35 to 44 Years | 3,995 (84.3%) | 280 (7.0%) |
| 45 to 54 Years | 2,538 (71.1%) | 56 (2.2%) |
| 55 to 59 Years | 1,172 (53.8%) | 25 (2.1%) |
| 60 to 64 Years | 1,365 (58.6%) | 76 (5.6%) |
| 65 to 74 Years | 688 (20.4%) | 37 (5.4%) |
| 75 Years and over | 209 (7.4%) | 0 (0.0%) |
| Total | 25,385 (63.6%) | 1,980 (7.8%) |
Employment Status by Educational Attainment in Hattiesburg
According to labor force statistics for Hattiesburg, 74.6% of individuals (16,249) out of the total population between 25 and 64 years of age (21,782) are in the labor force, with 6.0% or 975 of them being unemployed. The group with the highest labor force participation rate are those with the educational attainment of bachelor's degree or higher, with 85.8% or 6,467 individuals in the labor force. Within the labor force, individuals with less than high school education have the highest percentage of unemployment, with 13.8% or 144 of them being unemployed.
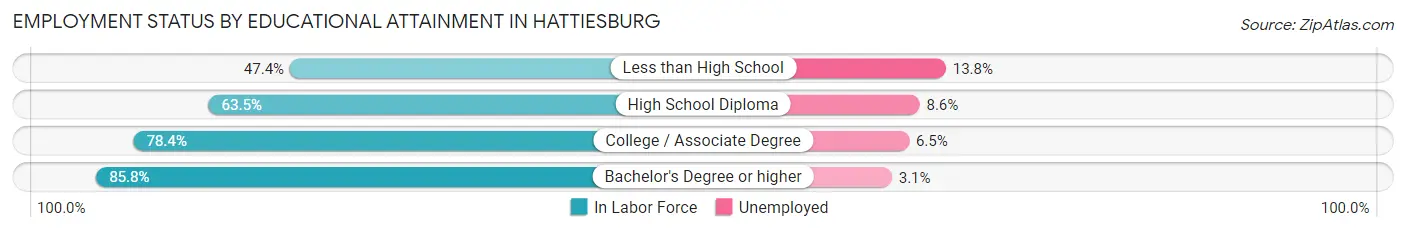
| Educational Attainment | In Labor Force | Unemployed |
| Less than High School | 1,046 (47.4%) | 304 (13.8%) |
| High School Diploma | 3,003 (63.5%) | 407 (8.6%) |
| College / Associate Degree | 5,731 (78.4%) | 475 (6.5%) |
| Bachelor's Degree or higher | 6,467 (85.8%) | 234 (3.1%) |
| Total | 16,249 (74.6%) | 1,307 (6.0%) |
Employment Occupations by Sex in Hattiesburg
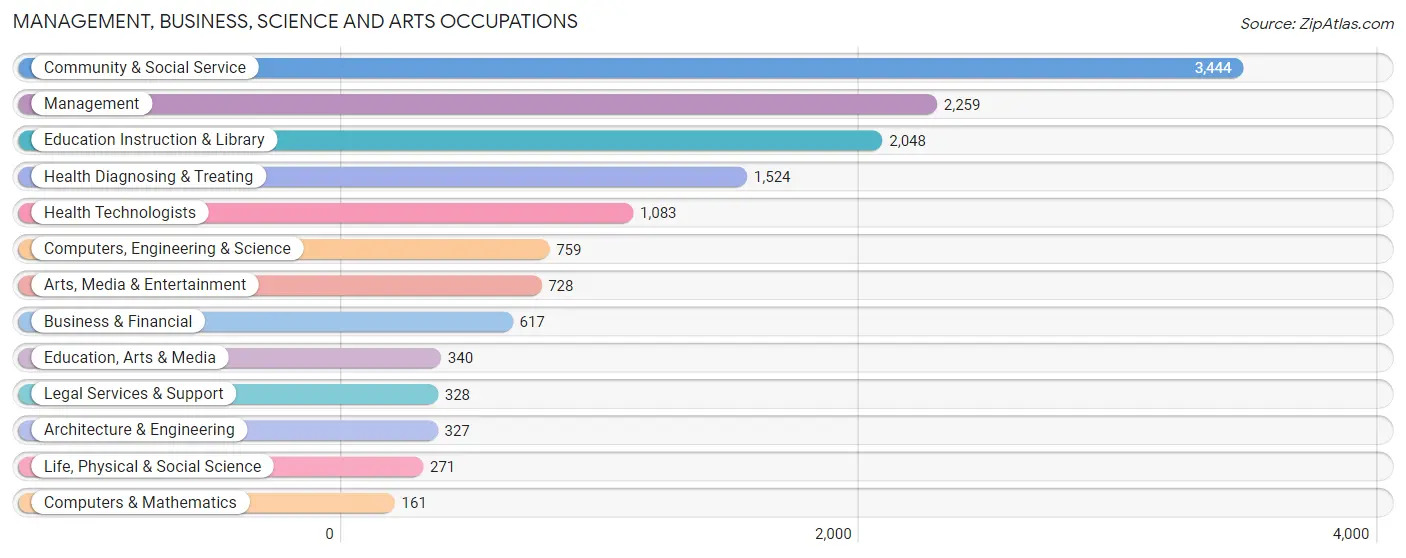
Management, Business, Science and Arts Occupations
The most common Management, Business, Science and Arts occupations in Hattiesburg are Community & Social Service (3,444 | 14.9%), Management (2,259 | 9.7%), Education Instruction & Library (2,048 | 8.8%), Health Diagnosing & Treating (1,524 | 6.6%), and Health Technologists (1,083 | 4.7%).
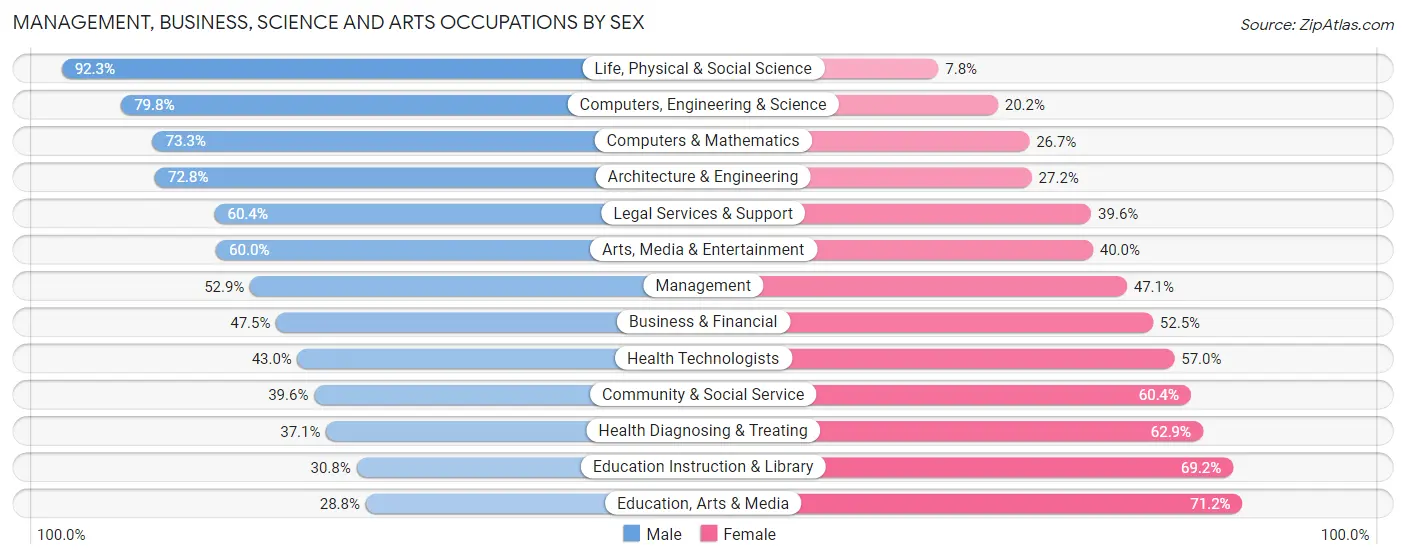
Management, Business, Science and Arts Occupations by Sex
Within the Management, Business, Science and Arts occupations in Hattiesburg, the most male-oriented occupations are Life, Physical & Social Science (92.2%), Computers, Engineering & Science (79.8%), and Computers & Mathematics (73.3%), while the most female-oriented occupations are Education, Arts & Media (71.2%), Education Instruction & Library (69.2%), and Health Diagnosing & Treating (62.9%).
| Occupation | Male | Female |
| Management | 1,196 (52.9%) | 1,063 (47.1%) |
| Business & Financial | 293 (47.5%) | 324 (52.5%) |
| Computers, Engineering & Science | 606 (79.8%) | 153 (20.2%) |
| Computers & Mathematics | 118 (73.3%) | 43 (26.7%) |
| Architecture & Engineering | 238 (72.8%) | 89 (27.2%) |
| Life, Physical & Social Science | 250 (92.2%) | 21 (7.7%) |
| Community & Social Service | 1,363 (39.6%) | 2,081 (60.4%) |
| Education, Arts & Media | 98 (28.8%) | 242 (71.2%) |
| Legal Services & Support | 198 (60.4%) | 130 (39.6%) |
| Education Instruction & Library | 630 (30.8%) | 1,418 (69.2%) |
| Arts, Media & Entertainment | 437 (60.0%) | 291 (40.0%) |
| Health Diagnosing & Treating | 565 (37.1%) | 959 (62.9%) |
| Health Technologists | 466 (43.0%) | 617 (57.0%) |
| Total (Category) | 4,023 (46.8%) | 4,580 (53.2%) |
| Total (Overall) | 10,951 (47.2%) | 12,231 (52.8%) |
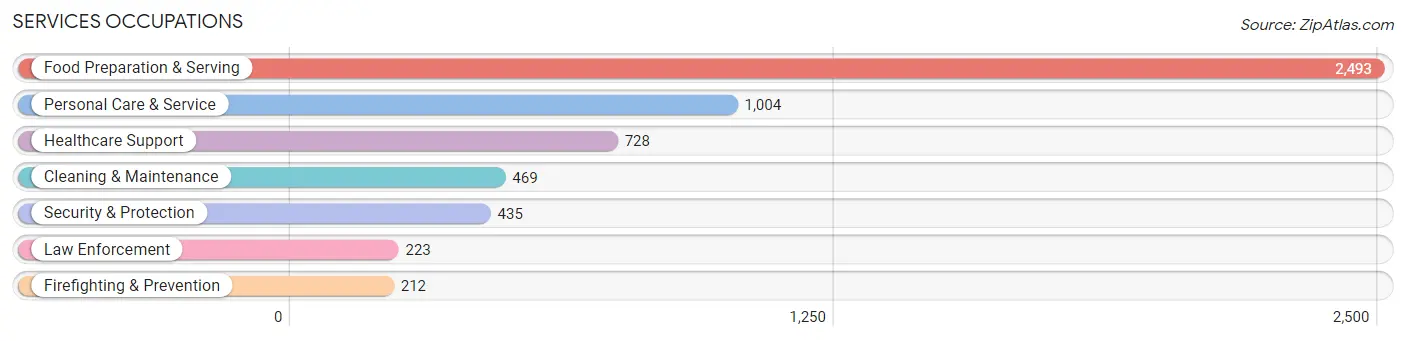
Services Occupations
The most common Services occupations in Hattiesburg are Food Preparation & Serving (2,493 | 10.7%), Personal Care & Service (1,004 | 4.3%), Healthcare Support (728 | 3.1%), Cleaning & Maintenance (469 | 2.0%), and Security & Protection (435 | 1.9%).
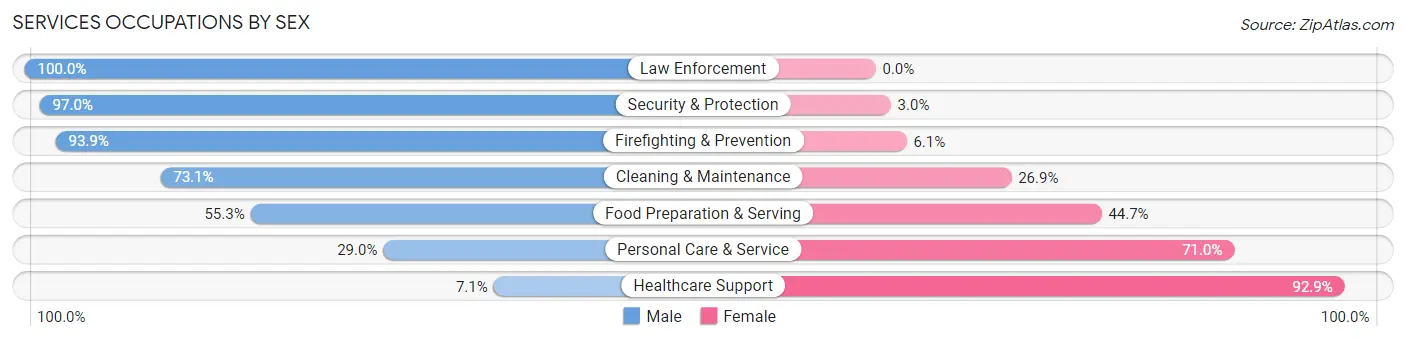
Services Occupations by Sex
Within the Services occupations in Hattiesburg, the most male-oriented occupations are Law Enforcement (100.0%), Security & Protection (97.0%), and Firefighting & Prevention (93.9%), while the most female-oriented occupations are Healthcare Support (92.9%), Personal Care & Service (71.0%), and Food Preparation & Serving (44.7%).
| Occupation | Male | Female |
| Healthcare Support | 52 (7.1%) | 676 (92.9%) |
| Security & Protection | 422 (97.0%) | 13 (3.0%) |
| Firefighting & Prevention | 199 (93.9%) | 13 (6.1%) |
| Law Enforcement | 223 (100.0%) | 0 (0.0%) |
| Food Preparation & Serving | 1,378 (55.3%) | 1,115 (44.7%) |
| Cleaning & Maintenance | 343 (73.1%) | 126 (26.9%) |
| Personal Care & Service | 291 (29.0%) | 713 (71.0%) |
| Total (Category) | 2,486 (48.5%) | 2,643 (51.5%) |
| Total (Overall) | 10,951 (47.2%) | 12,231 (52.8%) |
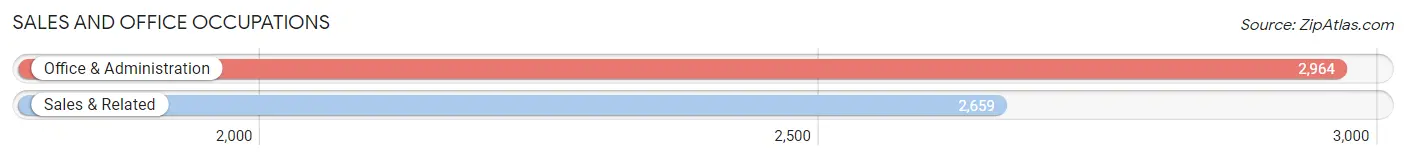
Sales and Office Occupations
The most common Sales and Office occupations in Hattiesburg are Office & Administration (2,964 | 12.8%), and Sales & Related (2,659 | 11.5%).
Sales and Office Occupations by Sex
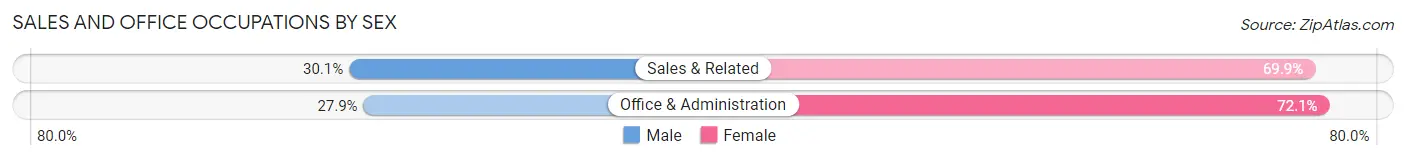
| Occupation | Male | Female |
| Sales & Related | 800 (30.1%) | 1,859 (69.9%) |
| Office & Administration | 826 (27.9%) | 2,138 (72.1%) |
| Total (Category) | 1,626 (28.9%) | 3,997 (71.1%) |
| Total (Overall) | 10,951 (47.2%) | 12,231 (52.8%) |
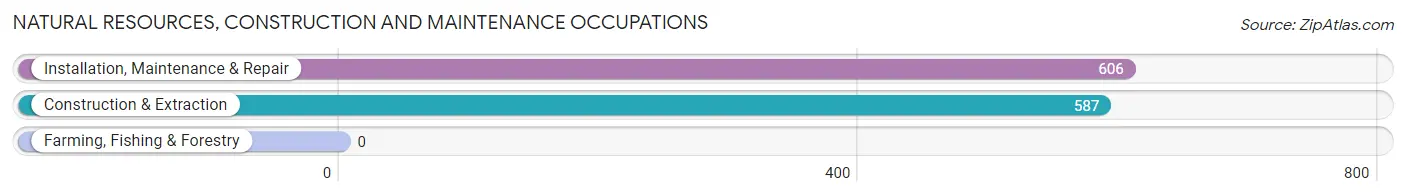
Natural Resources, Construction and Maintenance Occupations
The most common Natural Resources, Construction and Maintenance occupations in Hattiesburg are Installation, Maintenance & Repair (606 | 2.6%), and Construction & Extraction (587 | 2.5%).
Natural Resources, Construction and Maintenance Occupations by Sex
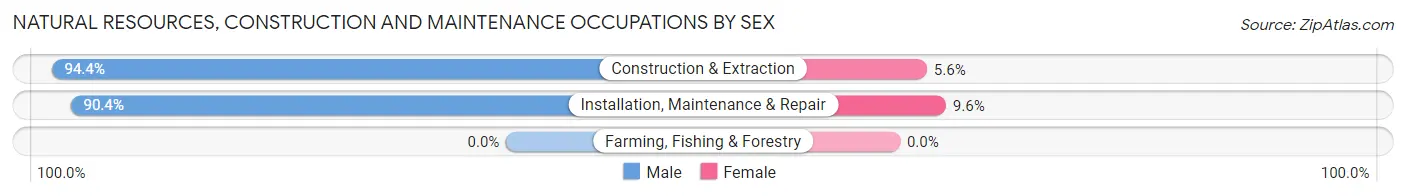
| Occupation | Male | Female |
| Farming, Fishing & Forestry | 0 (0.0%) | 0 (0.0%) |
| Construction & Extraction | 554 (94.4%) | 33 (5.6%) |
| Installation, Maintenance & Repair | 548 (90.4%) | 58 (9.6%) |
| Total (Category) | 1,102 (92.4%) | 91 (7.6%) |
| Total (Overall) | 10,951 (47.2%) | 12,231 (52.8%) |
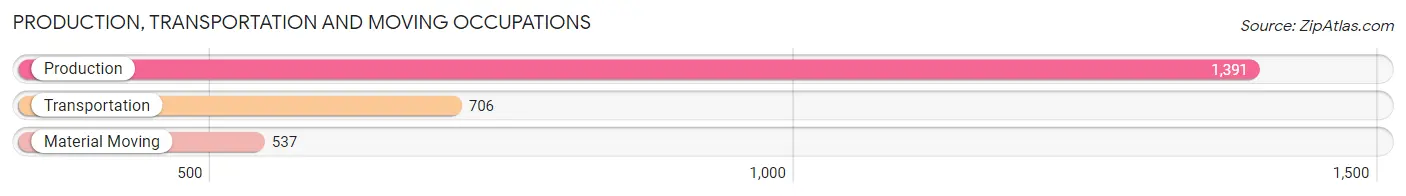
Production, Transportation and Moving Occupations
The most common Production, Transportation and Moving occupations in Hattiesburg are Production (1,391 | 6.0%), Transportation (706 | 3.0%), and Material Moving (537 | 2.3%).
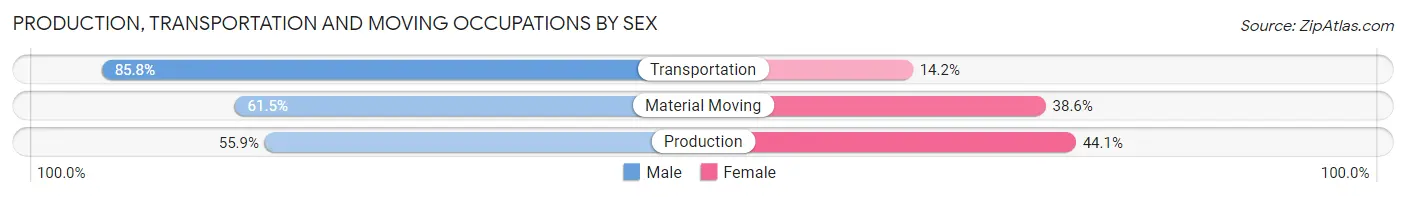
Production, Transportation and Moving Occupations by Sex
| Occupation | Male | Female |
| Production | 778 (55.9%) | 613 (44.1%) |
| Transportation | 606 (85.8%) | 100 (14.2%) |
| Material Moving | 330 (61.5%) | 207 (38.6%) |
| Total (Category) | 1,714 (65.1%) | 920 (34.9%) |
| Total (Overall) | 10,951 (47.2%) | 12,231 (52.8%) |
Employment Industries by Sex in Hattiesburg
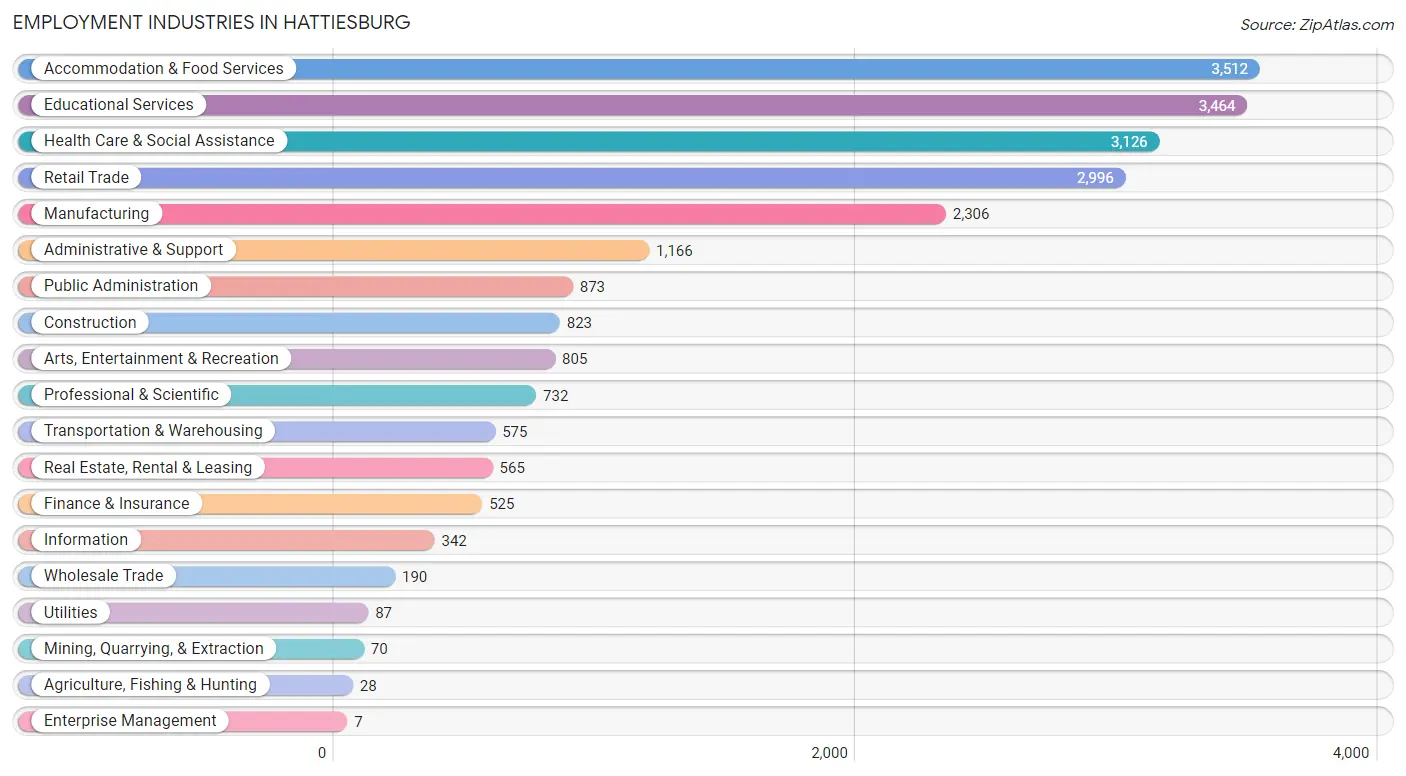
Employment Industries in Hattiesburg
The major employment industries in Hattiesburg include Accommodation & Food Services (3,512 | 15.1%), Educational Services (3,464 | 14.9%), Health Care & Social Assistance (3,126 | 13.5%), Retail Trade (2,996 | 12.9%), and Manufacturing (2,306 | 10.0%).
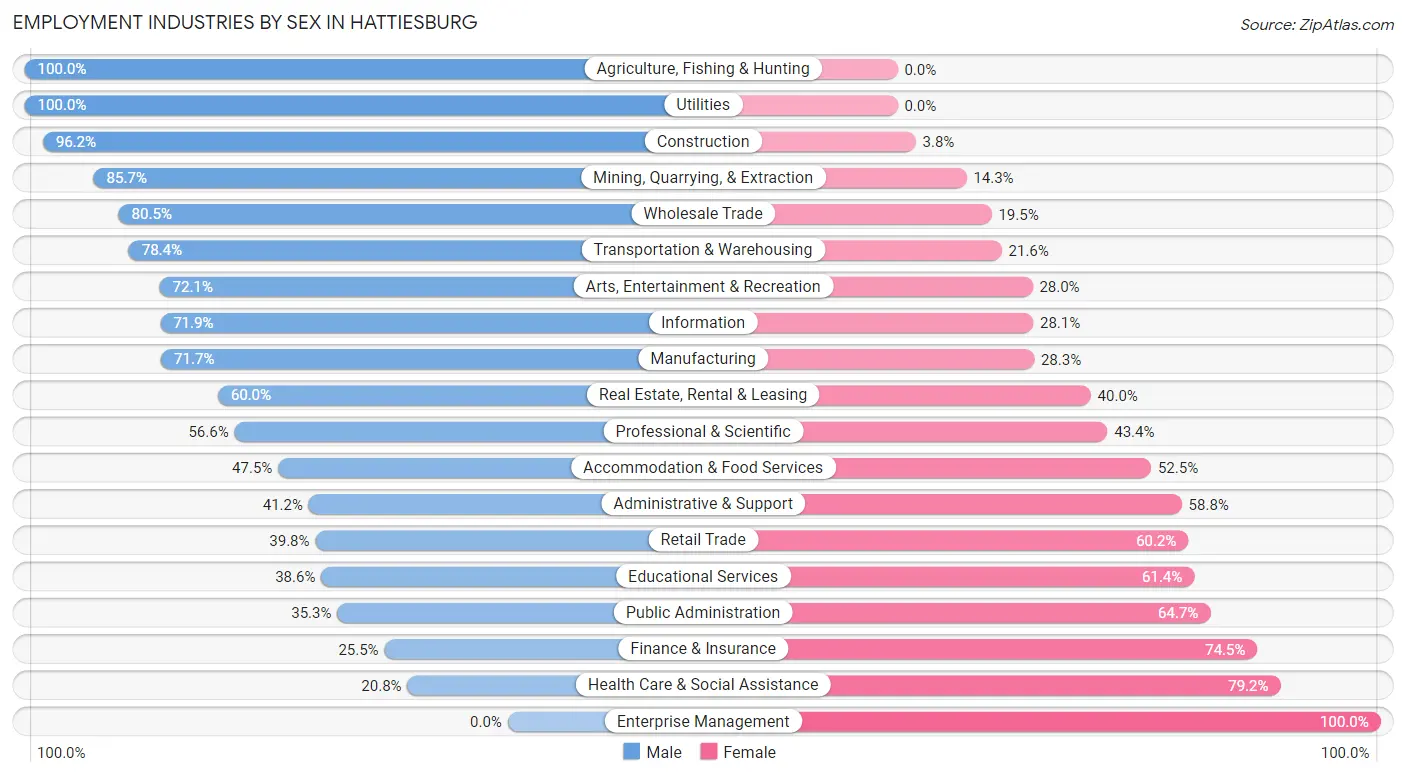
Employment Industries by Sex in Hattiesburg
The Hattiesburg industries that see more men than women are Agriculture, Fishing & Hunting (100.0%), Utilities (100.0%), and Construction (96.2%), whereas the industries that tend to have a higher number of women are Enterprise Management (100.0%), Health Care & Social Assistance (79.2%), and Finance & Insurance (74.5%).
| Industry | Male | Female |
| Agriculture, Fishing & Hunting | 28 (100.0%) | 0 (0.0%) |
| Mining, Quarrying, & Extraction | 60 (85.7%) | 10 (14.3%) |
| Construction | 792 (96.2%) | 31 (3.8%) |
| Manufacturing | 1,654 (71.7%) | 652 (28.3%) |
| Wholesale Trade | 153 (80.5%) | 37 (19.5%) |
| Retail Trade | 1,193 (39.8%) | 1,803 (60.2%) |
| Transportation & Warehousing | 451 (78.4%) | 124 (21.6%) |
| Utilities | 87 (100.0%) | 0 (0.0%) |
| Information | 246 (71.9%) | 96 (28.1%) |
| Finance & Insurance | 134 (25.5%) | 391 (74.5%) |
| Real Estate, Rental & Leasing | 339 (60.0%) | 226 (40.0%) |
| Professional & Scientific | 414 (56.6%) | 318 (43.4%) |
| Enterprise Management | 0 (0.0%) | 7 (100.0%) |
| Administrative & Support | 480 (41.2%) | 686 (58.8%) |
| Educational Services | 1,337 (38.6%) | 2,127 (61.4%) |
| Health Care & Social Assistance | 649 (20.8%) | 2,477 (79.2%) |
| Arts, Entertainment & Recreation | 580 (72.1%) | 225 (28.0%) |
| Accommodation & Food Services | 1,669 (47.5%) | 1,843 (52.5%) |
| Public Administration | 308 (35.3%) | 565 (64.7%) |
| Total | 10,951 (47.2%) | 12,231 (52.8%) |
Education in Hattiesburg
School Enrollment in Hattiesburg
The most common levels of schooling among the 16,414 students in Hattiesburg are college / undergraduate (7,856 | 47.9%), elementary school (2,160 | 13.2%), and high school (1,777 | 10.8%).
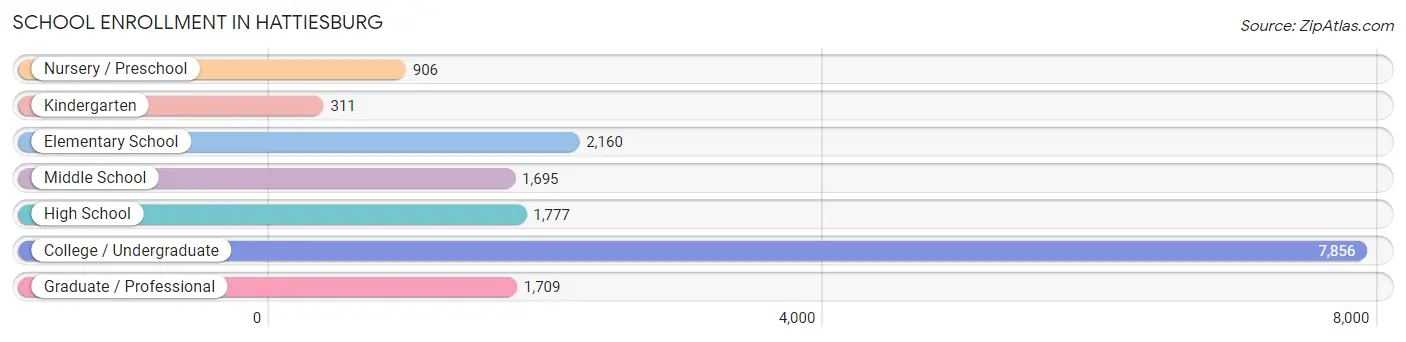
| School Level | # Students | % Students |
| Nursery / Preschool | 906 | 5.5% |
| Kindergarten | 311 | 1.9% |
| Elementary School | 2,160 | 13.2% |
| Middle School | 1,695 | 10.3% |
| High School | 1,777 | 10.8% |
| College / Undergraduate | 7,856 | 47.9% |
| Graduate / Professional | 1,709 | 10.4% |
| Total | 16,414 | 100.0% |
School Enrollment by Age by Funding Source in Hattiesburg
Out of a total of 16,414 students who are enrolled in schools in Hattiesburg, 2,544 (15.5%) attend a private institution, while the remaining 13,870 (84.5%) are enrolled in public schools. The age group of 35 years and over has the highest likelihood of being enrolled in private schools, with 132 (39.4% in the age bracket) enrolled. Conversely, the age group of 10 to 14 year olds has the lowest likelihood of being enrolled in a private school, with 2,209 (89.5% in the age bracket) attending a public institution.
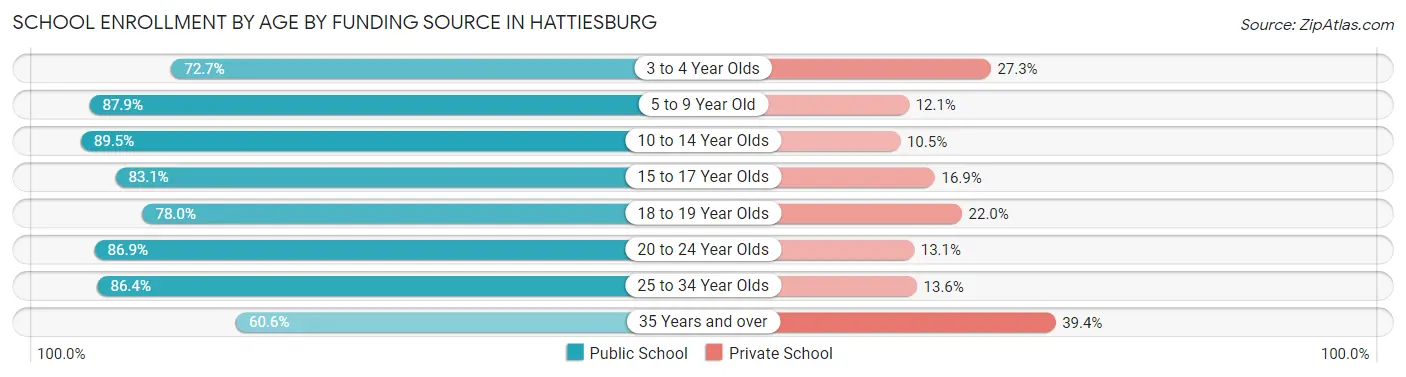
| Age Bracket | Public School | Private School |
| 3 to 4 Year Olds | 582 (72.7%) | 219 (27.3%) |
| 5 to 9 Year Old | 1,727 (87.9%) | 238 (12.1%) |
| 10 to 14 Year Olds | 2,209 (89.5%) | 259 (10.5%) |
| 15 to 17 Year Olds | 1,104 (83.1%) | 225 (16.9%) |
| 18 to 19 Year Olds | 1,914 (78.0%) | 539 (22.0%) |
| 20 to 24 Year Olds | 4,241 (86.9%) | 637 (13.1%) |
| 25 to 34 Year Olds | 1,888 (86.4%) | 297 (13.6%) |
| 35 Years and over | 203 (60.6%) | 132 (39.4%) |
| Total | 13,870 (84.5%) | 2,544 (15.5%) |
Educational Attainment by Field of Study in Hattiesburg
Education (1,818 | 16.7%), business (1,807 | 16.6%), science & technology (1,144 | 10.5%), liberal arts & history (816 | 7.5%), and psychology (775 | 7.1%) are the most common fields of study among 10,904 individuals in Hattiesburg who have obtained a bachelor's degree or higher.
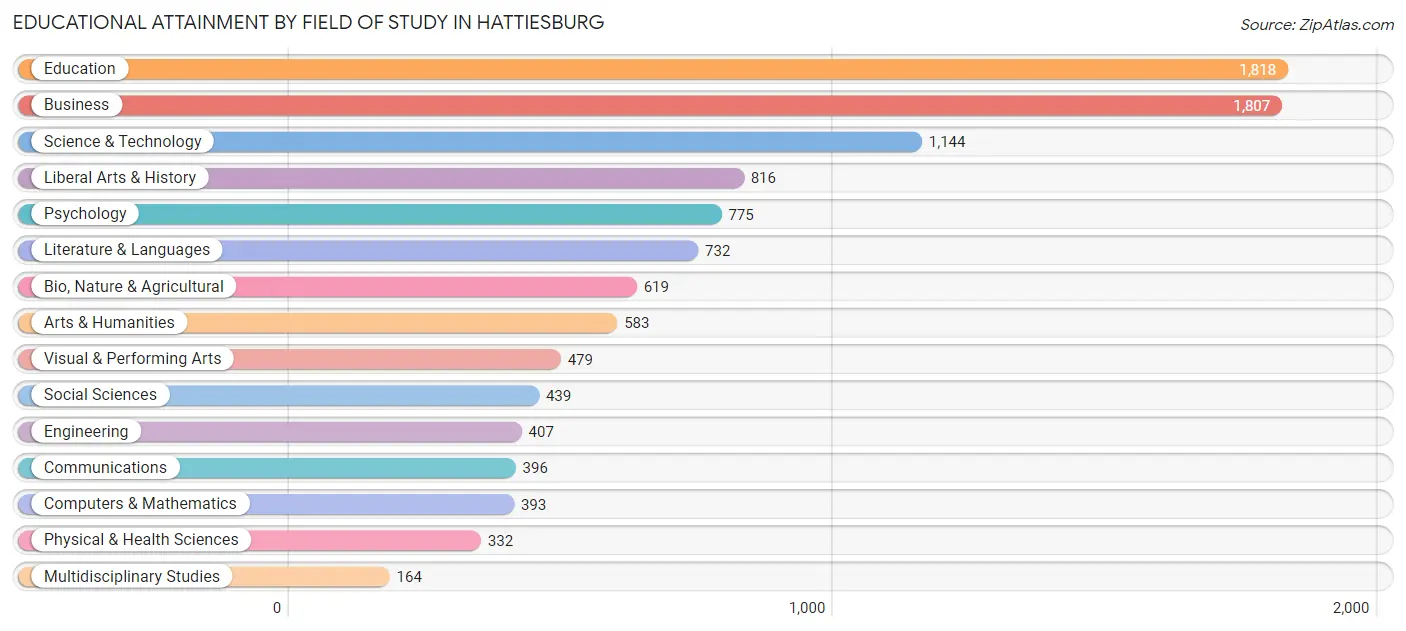
| Field of Study | # Graduates | % Graduates |
| Computers & Mathematics | 393 | 3.6% |
| Bio, Nature & Agricultural | 619 | 5.7% |
| Physical & Health Sciences | 332 | 3.0% |
| Psychology | 775 | 7.1% |
| Social Sciences | 439 | 4.0% |
| Engineering | 407 | 3.7% |
| Multidisciplinary Studies | 164 | 1.5% |
| Science & Technology | 1,144 | 10.5% |
| Business | 1,807 | 16.6% |
| Education | 1,818 | 16.7% |
| Literature & Languages | 732 | 6.7% |
| Liberal Arts & History | 816 | 7.5% |
| Visual & Performing Arts | 479 | 4.4% |
| Communications | 396 | 3.6% |
| Arts & Humanities | 583 | 5.3% |
| Total | 10,904 | 100.0% |
Transportation & Commute in Hattiesburg
Vehicle Availability by Sex in Hattiesburg
The most prevalent vehicle ownership categories in Hattiesburg are males with 2 vehicles (4,539, accounting for 43.5%) and females with 2 vehicles (5,170, making up 41.5%).
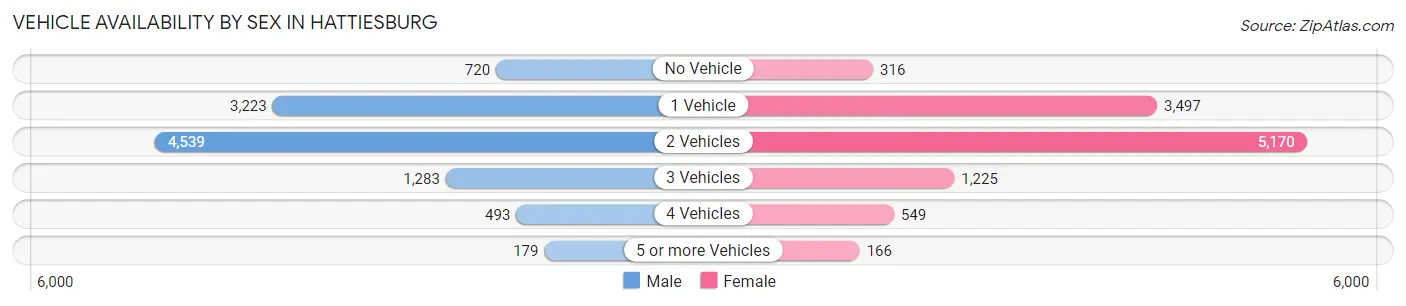
| Vehicles Available | Male | Female |
| No Vehicle | 720 (6.9%) | 316 (2.9%) |
| 1 Vehicle | 3,223 (30.9%) | 3,497 (32.0%) |
| 2 Vehicles | 4,539 (43.5%) | 5,170 (47.3%) |
| 3 Vehicles | 1,283 (12.3%) | 1,225 (11.2%) |
| 4 Vehicles | 493 (4.7%) | 549 (5.0%) |
| 5 or more Vehicles | 179 (1.7%) | 166 (1.5%) |
| Total | 10,437 (100.0%) | 10,923 (100.0%) |
Commute Time in Hattiesburg
The most frequently occuring commute durations in Hattiesburg are 10 to 14 minutes (6,553 commuters, 29.4%), 5 to 9 minutes (4,672 commuters, 21.0%), and 15 to 19 minutes (4,288 commuters, 19.3%).
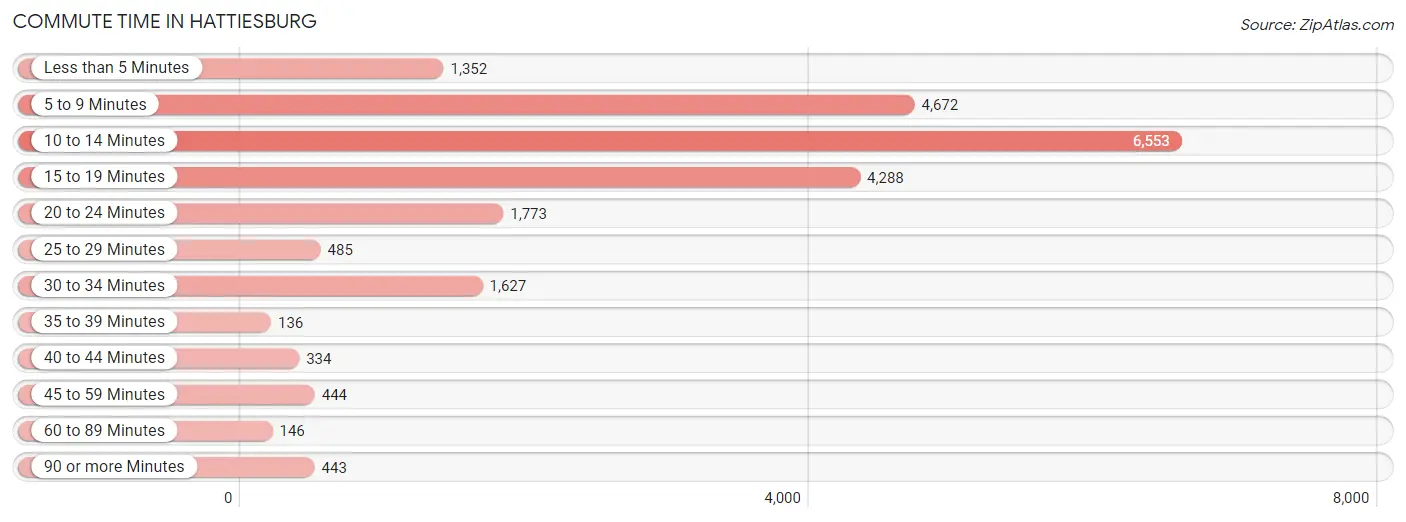
| Commute Time | # Commuters | % Commuters |
| Less than 5 Minutes | 1,352 | 6.1% |
| 5 to 9 Minutes | 4,672 | 21.0% |
| 10 to 14 Minutes | 6,553 | 29.4% |
| 15 to 19 Minutes | 4,288 | 19.3% |
| 20 to 24 Minutes | 1,773 | 8.0% |
| 25 to 29 Minutes | 485 | 2.2% |
| 30 to 34 Minutes | 1,627 | 7.3% |
| 35 to 39 Minutes | 136 | 0.6% |
| 40 to 44 Minutes | 334 | 1.5% |
| 45 to 59 Minutes | 444 | 2.0% |
| 60 to 89 Minutes | 146 | 0.7% |
| 90 or more Minutes | 443 | 2.0% |
Commute Time by Sex in Hattiesburg
The most common commute times in Hattiesburg are 10 to 14 minutes (3,241 commuters, 30.2%) for males and 10 to 14 minutes (3,312 commuters, 28.7%) for females.
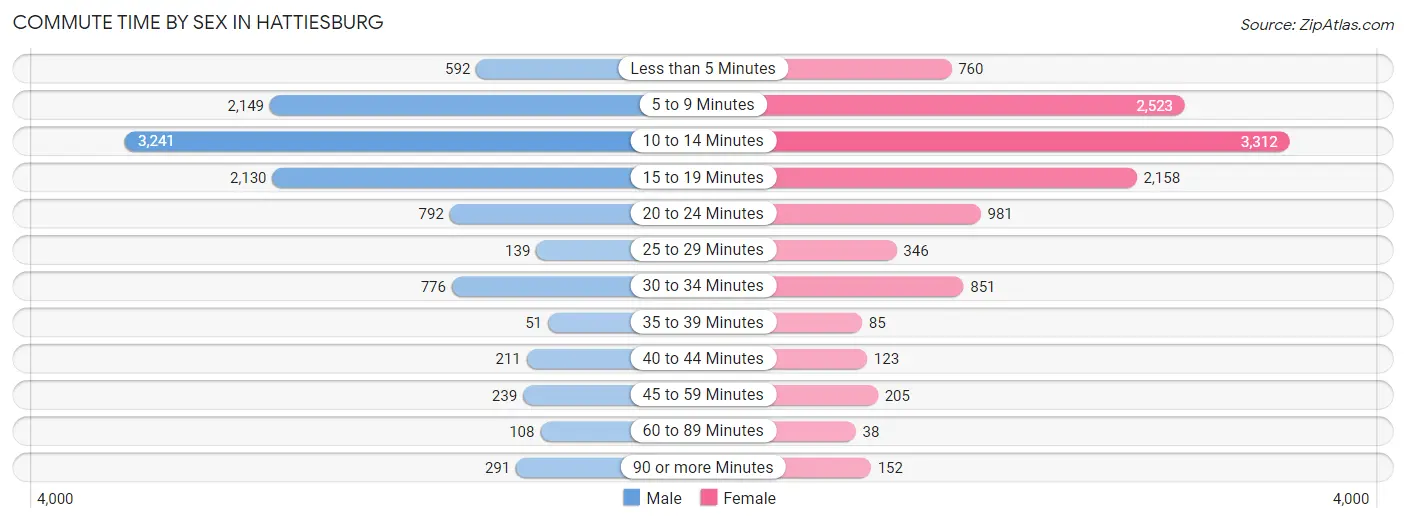
| Commute Time | Male | Female |
| Less than 5 Minutes | 592 (5.5%) | 760 (6.6%) |
| 5 to 9 Minutes | 2,149 (20.1%) | 2,523 (21.9%) |
| 10 to 14 Minutes | 3,241 (30.2%) | 3,312 (28.7%) |
| 15 to 19 Minutes | 2,130 (19.9%) | 2,158 (18.7%) |
| 20 to 24 Minutes | 792 (7.4%) | 981 (8.5%) |
| 25 to 29 Minutes | 139 (1.3%) | 346 (3.0%) |
| 30 to 34 Minutes | 776 (7.2%) | 851 (7.4%) |
| 35 to 39 Minutes | 51 (0.5%) | 85 (0.7%) |
| 40 to 44 Minutes | 211 (2.0%) | 123 (1.1%) |
| 45 to 59 Minutes | 239 (2.2%) | 205 (1.8%) |
| 60 to 89 Minutes | 108 (1.0%) | 38 (0.3%) |
| 90 or more Minutes | 291 (2.7%) | 152 (1.3%) |
Time of Departure to Work by Sex in Hattiesburg
The most frequent times of departure to work in Hattiesburg are 7:00 AM to 7:29 AM (1,325, 12.4%) for males and 7:30 AM to 7:59 AM (2,681, 23.2%) for females.
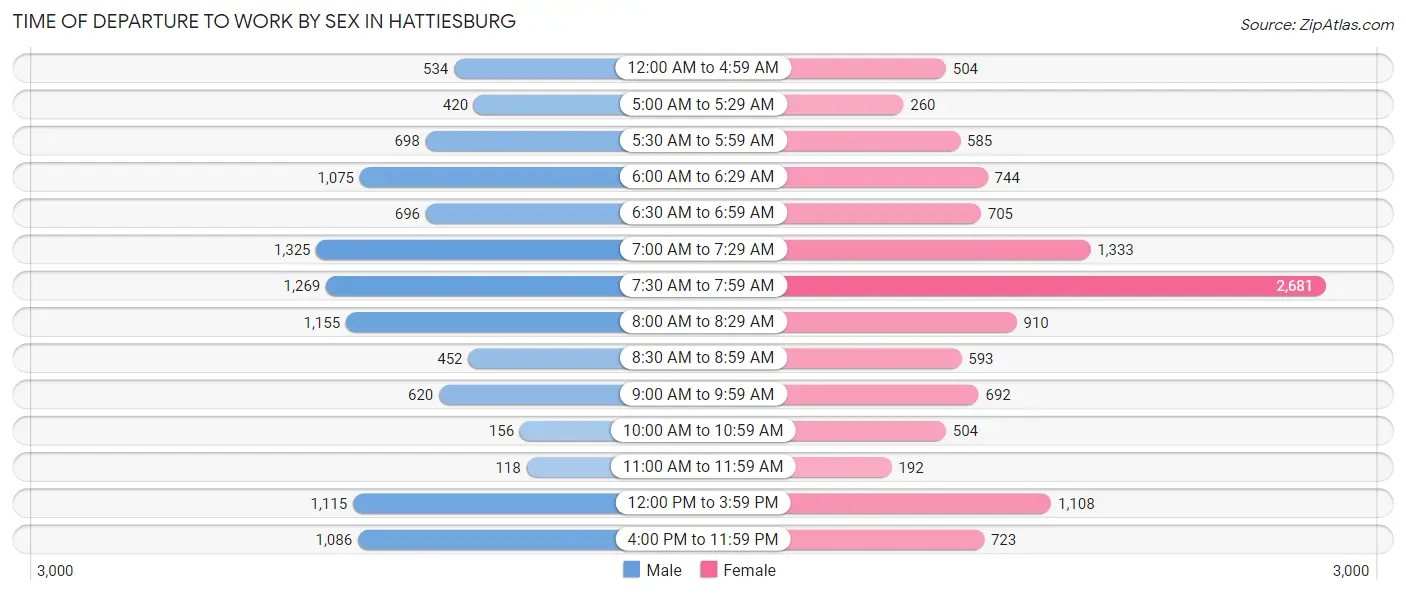
| Time of Departure | Male | Female |
| 12:00 AM to 4:59 AM | 534 (5.0%) | 504 (4.4%) |
| 5:00 AM to 5:29 AM | 420 (3.9%) | 260 (2.2%) |
| 5:30 AM to 5:59 AM | 698 (6.5%) | 585 (5.1%) |
| 6:00 AM to 6:29 AM | 1,075 (10.0%) | 744 (6.5%) |
| 6:30 AM to 6:59 AM | 696 (6.5%) | 705 (6.1%) |
| 7:00 AM to 7:29 AM | 1,325 (12.4%) | 1,333 (11.6%) |
| 7:30 AM to 7:59 AM | 1,269 (11.8%) | 2,681 (23.2%) |
| 8:00 AM to 8:29 AM | 1,155 (10.8%) | 910 (7.9%) |
| 8:30 AM to 8:59 AM | 452 (4.2%) | 593 (5.1%) |
| 9:00 AM to 9:59 AM | 620 (5.8%) | 692 (6.0%) |
| 10:00 AM to 10:59 AM | 156 (1.5%) | 504 (4.4%) |
| 11:00 AM to 11:59 AM | 118 (1.1%) | 192 (1.7%) |
| 12:00 PM to 3:59 PM | 1,115 (10.4%) | 1,108 (9.6%) |
| 4:00 PM to 11:59 PM | 1,086 (10.1%) | 723 (6.3%) |
| Total | 10,719 (100.0%) | 11,534 (100.0%) |
Housing Occupancy in Hattiesburg
Occupancy by Ownership in Hattiesburg
Of the total 19,787 dwellings in Hattiesburg, owner-occupied units account for 7,094 (35.8%), while renter-occupied units make up 12,693 (64.1%).
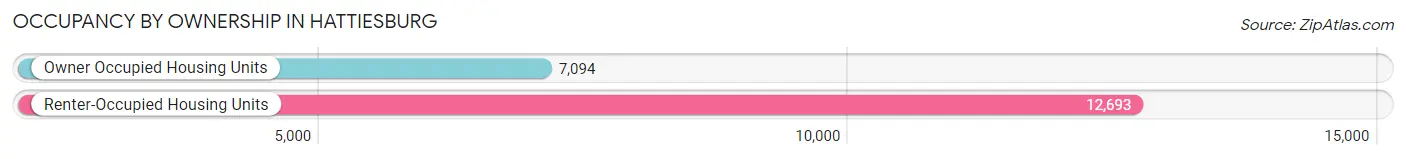
| Occupancy | # Housing Units | % Housing Units |
| Owner Occupied Housing Units | 7,094 | 35.8% |
| Renter-Occupied Housing Units | 12,693 | 64.1% |
| Total Occupied Housing Units | 19,787 | 100.0% |
Occupancy by Household Size in Hattiesburg
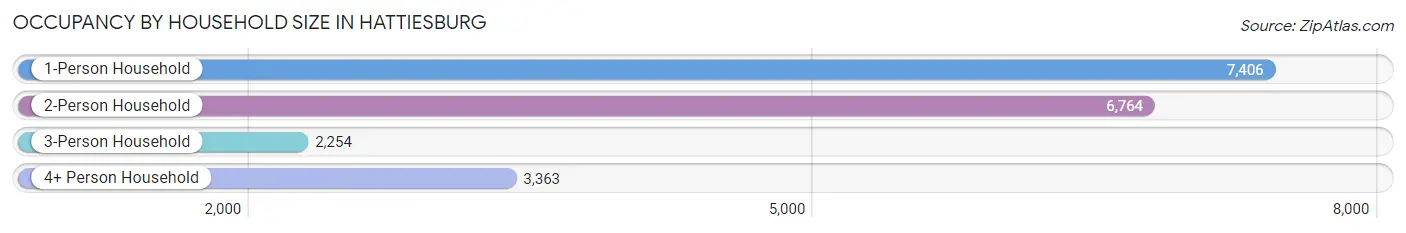
| Household Size | # Housing Units | % Housing Units |
| 1-Person Household | 7,406 | 37.4% |
| 2-Person Household | 6,764 | 34.2% |
| 3-Person Household | 2,254 | 11.4% |
| 4+ Person Household | 3,363 | 17.0% |
| Total Housing Units | 19,787 | 100.0% |
Occupancy by Ownership by Household Size in Hattiesburg
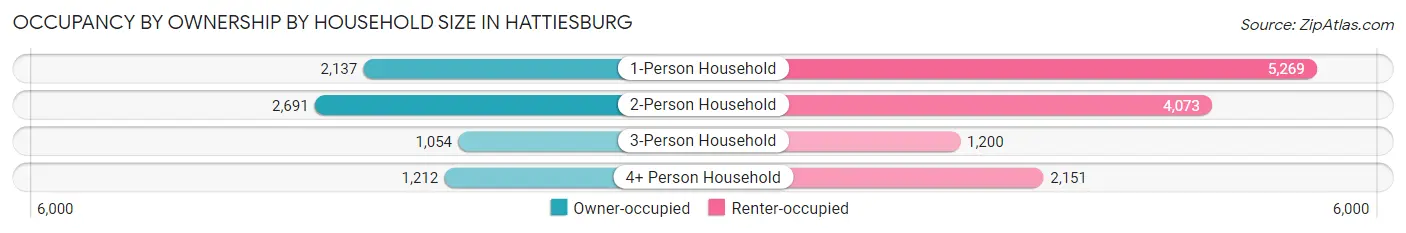
| Household Size | Owner-occupied | Renter-occupied |
| 1-Person Household | 2,137 (28.8%) | 5,269 (71.2%) |
| 2-Person Household | 2,691 (39.8%) | 4,073 (60.2%) |
| 3-Person Household | 1,054 (46.8%) | 1,200 (53.2%) |
| 4+ Person Household | 1,212 (36.0%) | 2,151 (64.0%) |
| Total Housing Units | 7,094 (35.8%) | 12,693 (64.1%) |
Occupancy by Educational Attainment in Hattiesburg
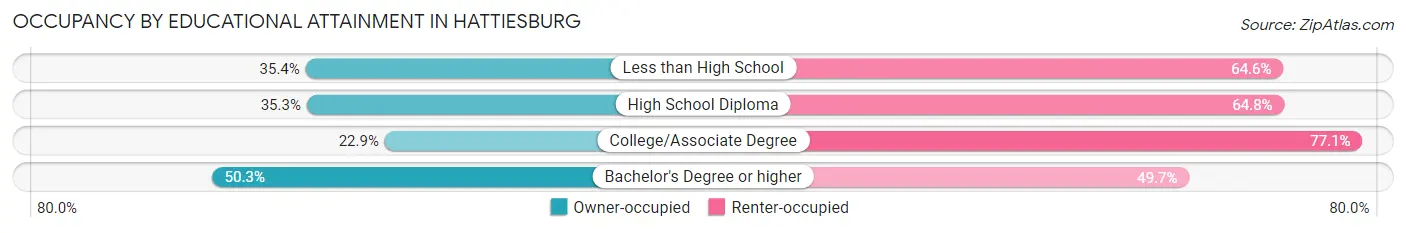
| Household Size | Owner-occupied | Renter-occupied |
| Less than High School | 587 (35.4%) | 1,070 (64.6%) |
| High School Diploma | 1,215 (35.2%) | 2,232 (64.7%) |
| College/Associate Degree | 1,748 (22.9%) | 5,893 (77.1%) |
| Bachelor's Degree or higher | 3,544 (50.3%) | 3,498 (49.7%) |
Occupancy by Age of Householder in Hattiesburg
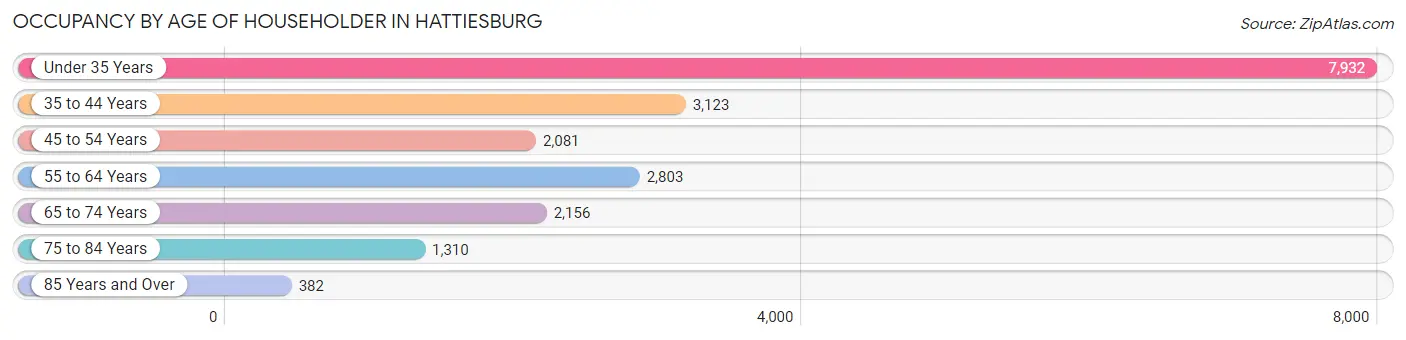
| Age Bracket | # Households | % Households |
| Under 35 Years | 7,932 | 40.1% |
| 35 to 44 Years | 3,123 | 15.8% |
| 45 to 54 Years | 2,081 | 10.5% |
| 55 to 64 Years | 2,803 | 14.2% |
| 65 to 74 Years | 2,156 | 10.9% |
| 75 to 84 Years | 1,310 | 6.6% |
| 85 Years and Over | 382 | 1.9% |
| Total | 19,787 | 100.0% |
Housing Finances in Hattiesburg
Median Income by Occupancy in Hattiesburg
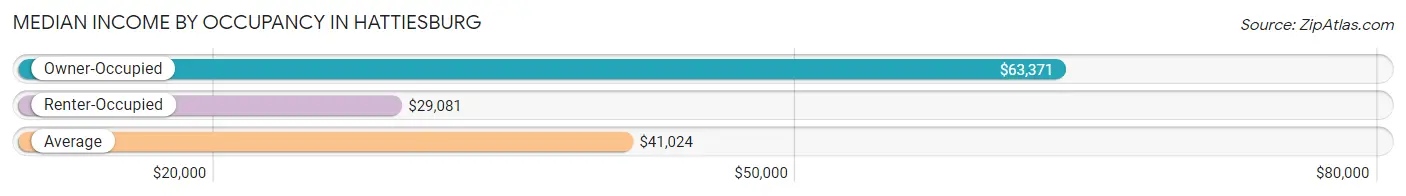
| Occupancy Type | # Households | Median Income |
| Owner-Occupied | 7,094 (35.8%) | $63,371 |
| Renter-Occupied | 12,693 (64.1%) | $29,081 |
| Average | 19,787 (100.0%) | $41,024 |
Occupancy by Householder Income Bracket in Hattiesburg
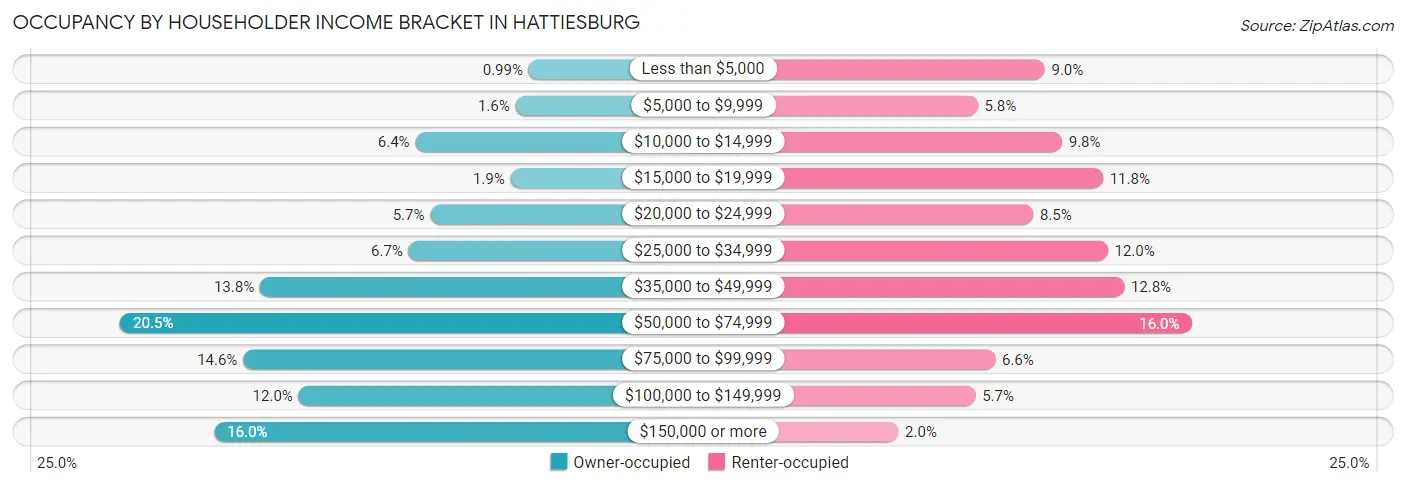
| Income Bracket | Owner-occupied | Renter-occupied |
| Less than $5,000 | 70 (1.0%) | 1,143 (9.0%) |
| $5,000 to $9,999 | 115 (1.6%) | 737 (5.8%) |
| $10,000 to $14,999 | 453 (6.4%) | 1,246 (9.8%) |
| $15,000 to $19,999 | 132 (1.9%) | 1,494 (11.8%) |
| $20,000 to $24,999 | 403 (5.7%) | 1,073 (8.5%) |
| $25,000 to $34,999 | 476 (6.7%) | 1,523 (12.0%) |
| $35,000 to $49,999 | 978 (13.8%) | 1,622 (12.8%) |
| $50,000 to $74,999 | 1,451 (20.4%) | 2,030 (16.0%) |
| $75,000 to $99,999 | 1,035 (14.6%) | 843 (6.6%) |
| $100,000 to $149,999 | 848 (11.9%) | 724 (5.7%) |
| $150,000 or more | 1,133 (16.0%) | 258 (2.0%) |
| Total | 7,094 (100.0%) | 12,693 (100.0%) |
Monthly Housing Cost Tiers in Hattiesburg
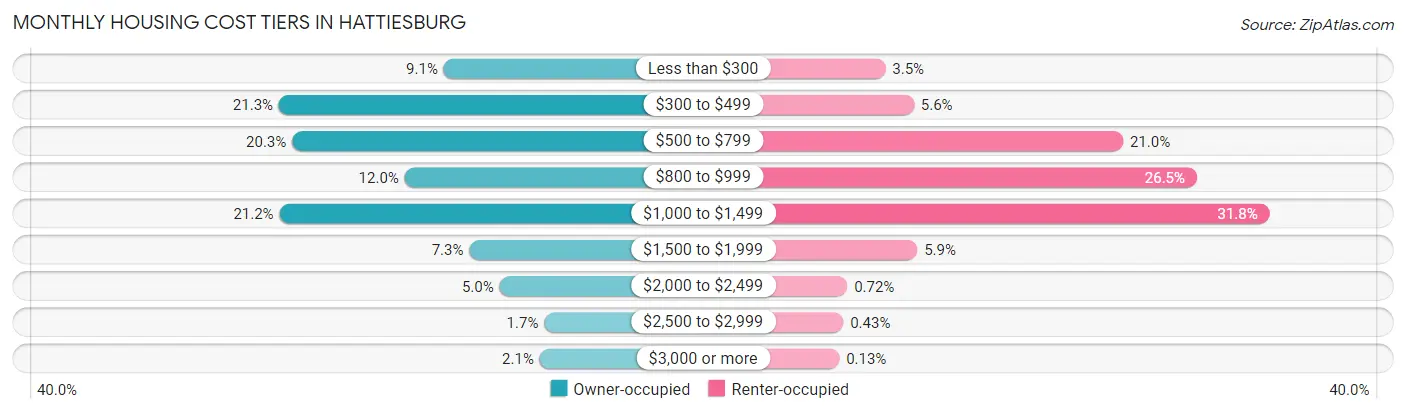
| Monthly Cost | Owner-occupied | Renter-occupied |
| Less than $300 | 648 (9.1%) | 448 (3.5%) |
| $300 to $499 | 1,509 (21.3%) | 714 (5.6%) |
| $500 to $799 | 1,440 (20.3%) | 2,669 (21.0%) |
| $800 to $999 | 852 (12.0%) | 3,360 (26.5%) |
| $1,000 to $1,499 | 1,506 (21.2%) | 4,039 (31.8%) |
| $1,500 to $1,999 | 514 (7.2%) | 746 (5.9%) |
| $2,000 to $2,499 | 356 (5.0%) | 91 (0.7%) |
| $2,500 to $2,999 | 123 (1.7%) | 55 (0.4%) |
| $3,000 or more | 146 (2.1%) | 17 (0.1%) |
| Total | 7,094 (100.0%) | 12,693 (100.0%) |
Physical Housing Characteristics in Hattiesburg
Housing Structures in Hattiesburg
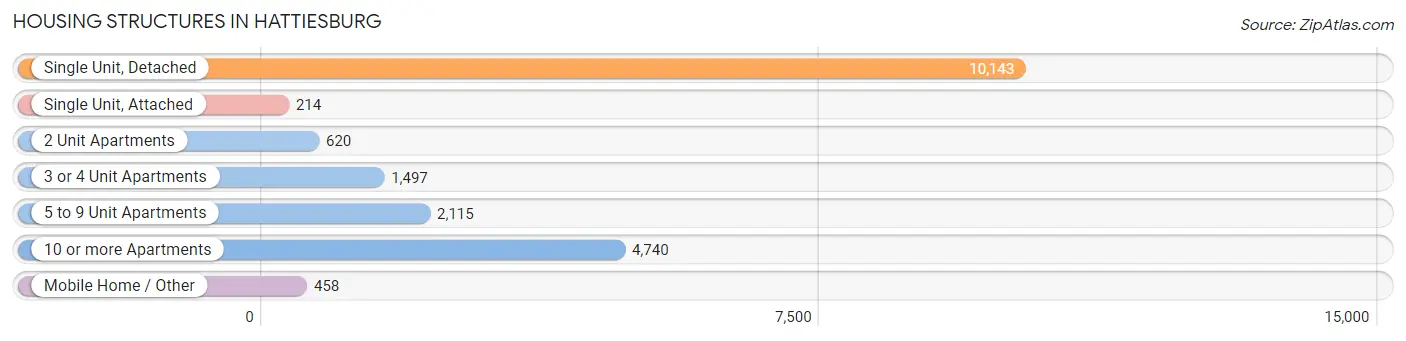
| Structure Type | # Housing Units | % Housing Units |
| Single Unit, Detached | 10,143 | 51.3% |
| Single Unit, Attached | 214 | 1.1% |
| 2 Unit Apartments | 620 | 3.1% |
| 3 or 4 Unit Apartments | 1,497 | 7.6% |
| 5 to 9 Unit Apartments | 2,115 | 10.7% |
| 10 or more Apartments | 4,740 | 24.0% |
| Mobile Home / Other | 458 | 2.3% |
| Total | 19,787 | 100.0% |
Housing Structures by Occupancy in Hattiesburg
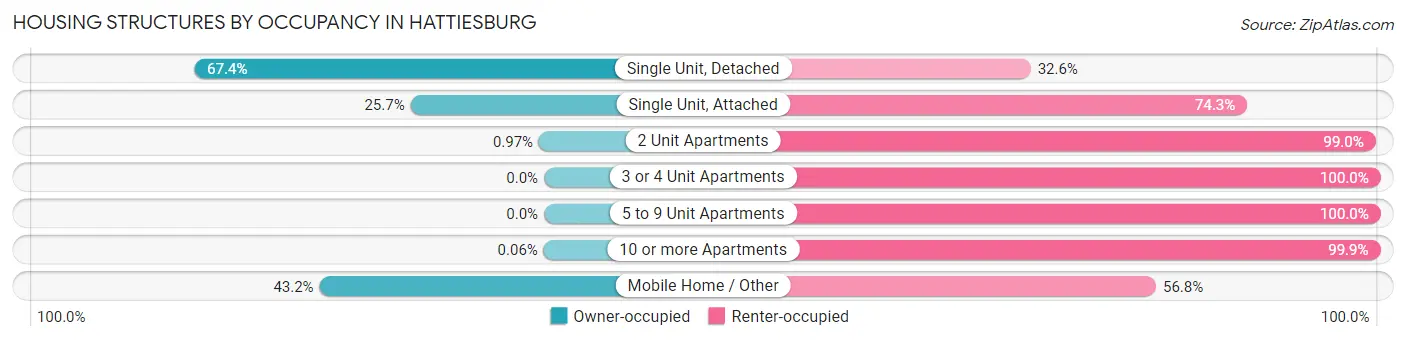
| Structure Type | Owner-occupied | Renter-occupied |
| Single Unit, Detached | 6,832 (67.4%) | 3,311 (32.6%) |
| Single Unit, Attached | 55 (25.7%) | 159 (74.3%) |
| 2 Unit Apartments | 6 (1.0%) | 614 (99.0%) |
| 3 or 4 Unit Apartments | 0 (0.0%) | 1,497 (100.0%) |
| 5 to 9 Unit Apartments | 0 (0.0%) | 2,115 (100.0%) |
| 10 or more Apartments | 3 (0.1%) | 4,737 (99.9%) |
| Mobile Home / Other | 198 (43.2%) | 260 (56.8%) |
| Total | 7,094 (35.8%) | 12,693 (64.1%) |
Housing Structures by Number of Rooms in Hattiesburg
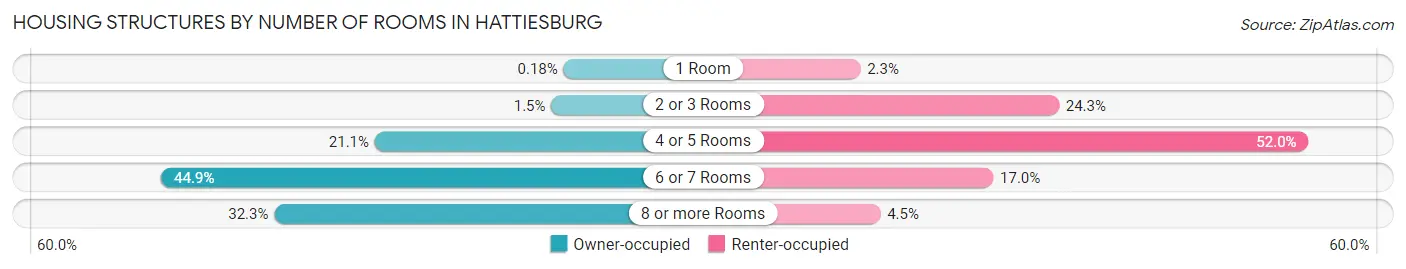
| Number of Rooms | Owner-occupied | Renter-occupied |
| 1 Room | 13 (0.2%) | 285 (2.2%) |
| 2 or 3 Rooms | 109 (1.5%) | 3,083 (24.3%) |
| 4 or 5 Rooms | 1,499 (21.1%) | 6,599 (52.0%) |
| 6 or 7 Rooms | 3,182 (44.9%) | 2,158 (17.0%) |
| 8 or more Rooms | 2,291 (32.3%) | 568 (4.5%) |
| Total | 7,094 (100.0%) | 12,693 (100.0%) |
Housing Structure by Heating Type in Hattiesburg
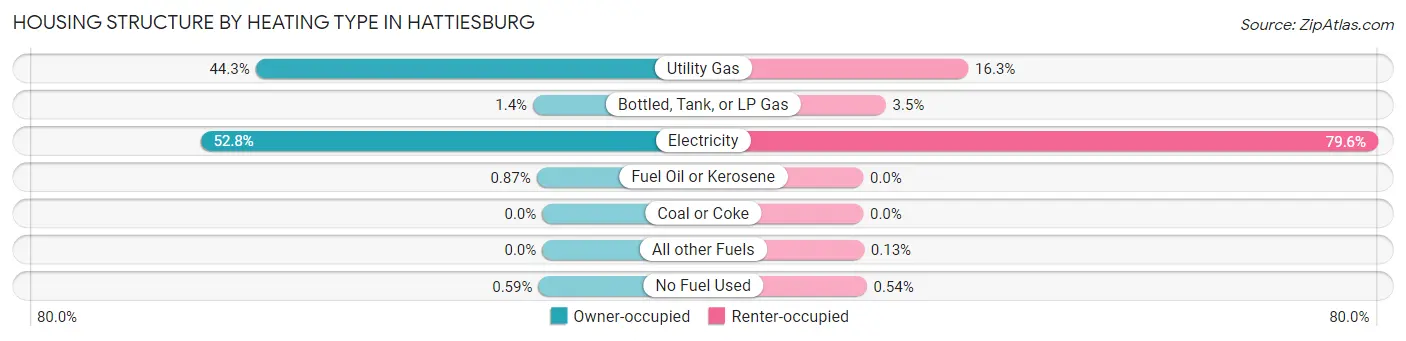
| Heating Type | Owner-occupied | Renter-occupied |
| Utility Gas | 3,143 (44.3%) | 2,063 (16.3%) |
| Bottled, Tank, or LP Gas | 101 (1.4%) | 443 (3.5%) |
| Electricity | 3,746 (52.8%) | 10,101 (79.6%) |
| Fuel Oil or Kerosene | 62 (0.9%) | 0 (0.0%) |
| Coal or Coke | 0 (0.0%) | 0 (0.0%) |
| All other Fuels | 0 (0.0%) | 17 (0.1%) |
| No Fuel Used | 42 (0.6%) | 69 (0.5%) |
| Total | 7,094 (100.0%) | 12,693 (100.0%) |
Household Vehicle Usage in Hattiesburg
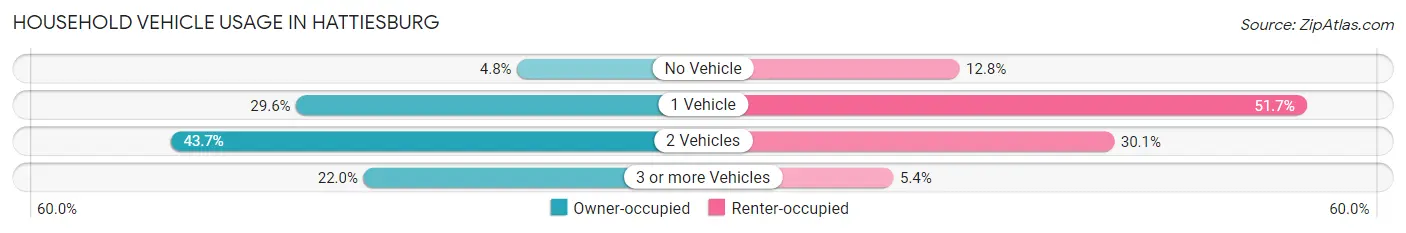
| Vehicles per Household | Owner-occupied | Renter-occupied |
| No Vehicle | 340 (4.8%) | 1,623 (12.8%) |
| 1 Vehicle | 2,096 (29.5%) | 6,563 (51.7%) |
| 2 Vehicles | 3,097 (43.7%) | 3,823 (30.1%) |
| 3 or more Vehicles | 1,561 (22.0%) | 684 (5.4%) |
| Total | 7,094 (100.0%) | 12,693 (100.0%) |
Real Estate & Mortgages in Hattiesburg
Real Estate and Mortgage Overview in Hattiesburg
| Characteristic | Without Mortgage | With Mortgage |
| Housing Units | 3,299 | 3,795 |
| Median Property Value | $143,100 | $147,900 |
| Median Household Income | $61,277 | $786 |
| Monthly Housing Costs | $448 | $141 |
| Real Estate Taxes | $1,127 | $776 |
Property Value by Mortgage Status in Hattiesburg
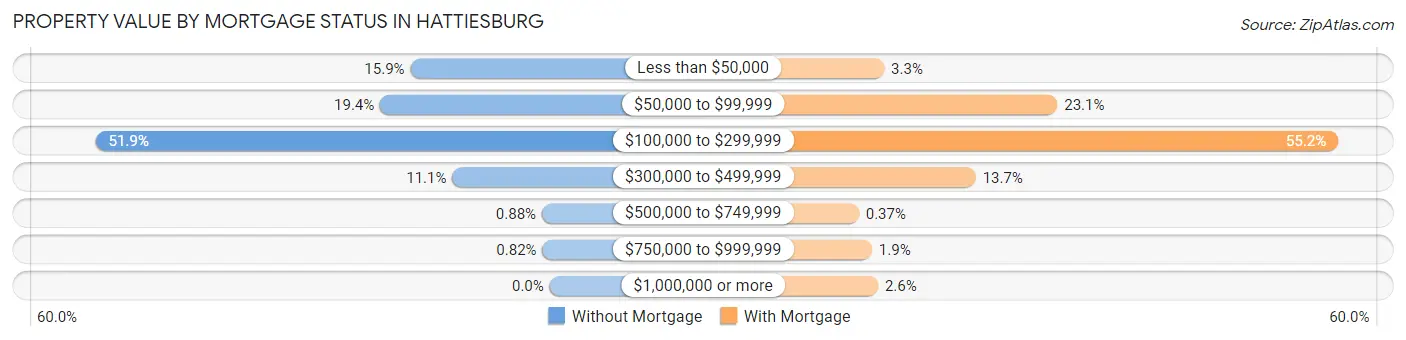
| Property Value | Without Mortgage | With Mortgage |
| Less than $50,000 | 525 (15.9%) | 124 (3.3%) |
| $50,000 to $99,999 | 639 (19.4%) | 875 (23.1%) |
| $100,000 to $299,999 | 1,712 (51.9%) | 2,093 (55.1%) |
| $300,000 to $499,999 | 367 (11.1%) | 521 (13.7%) |
| $500,000 to $749,999 | 29 (0.9%) | 14 (0.4%) |
| $750,000 to $999,999 | 27 (0.8%) | 71 (1.9%) |
| $1,000,000 or more | 0 (0.0%) | 97 (2.6%) |
| Total | 3,299 (100.0%) | 3,795 (100.0%) |
Household Income by Mortgage Status in Hattiesburg
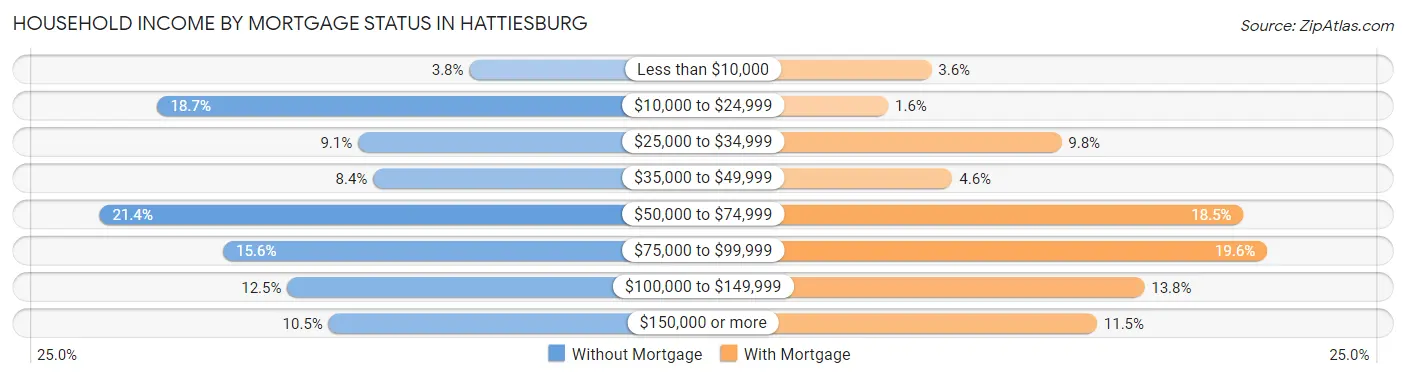
| Household Income | Without Mortgage | With Mortgage |
| Less than $10,000 | 126 (3.8%) | 137 (3.6%) |
| $10,000 to $24,999 | 616 (18.7%) | 59 (1.5%) |
| $25,000 to $34,999 | 301 (9.1%) | 372 (9.8%) |
| $35,000 to $49,999 | 277 (8.4%) | 175 (4.6%) |
| $50,000 to $74,999 | 707 (21.4%) | 701 (18.5%) |
| $75,000 to $99,999 | 513 (15.5%) | 744 (19.6%) |
| $100,000 to $149,999 | 412 (12.5%) | 522 (13.8%) |
| $150,000 or more | 347 (10.5%) | 436 (11.5%) |
| Total | 3,299 (100.0%) | 3,795 (100.0%) |
Property Value to Household Income Ratio in Hattiesburg
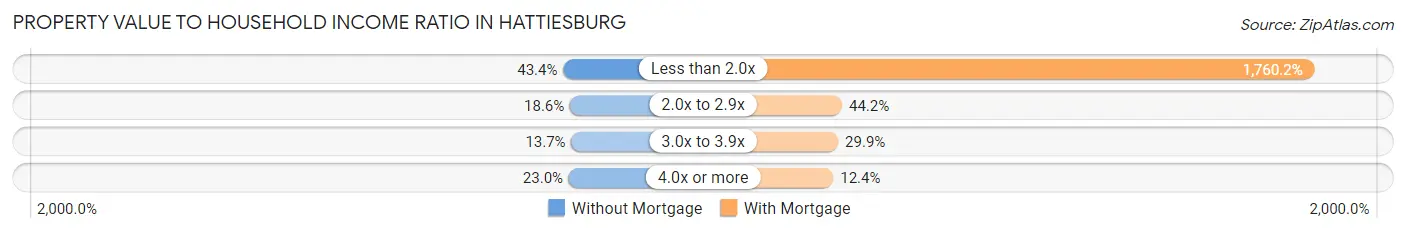
| Value-to-Income Ratio | Without Mortgage | With Mortgage |
| Less than 2.0x | 1,431 (43.4%) | 66,799 (1,760.2%) |
| 2.0x to 2.9x | 612 (18.5%) | 1,677 (44.2%) |
| 3.0x to 3.9x | 452 (13.7%) | 1,136 (29.9%) |
| 4.0x or more | 758 (23.0%) | 470 (12.4%) |
| Total | 3,299 (100.0%) | 3,795 (100.0%) |
Real Estate Taxes by Mortgage Status in Hattiesburg
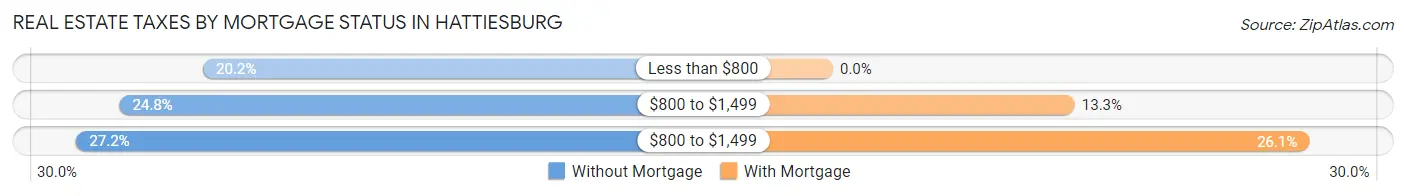
| Property Taxes | Without Mortgage | With Mortgage |
| Less than $800 | 667 (20.2%) | 0 (0.0%) |
| $800 to $1,499 | 818 (24.8%) | 503 (13.3%) |
| $800 to $1,499 | 896 (27.2%) | 990 (26.1%) |
| Total | 3,299 (100.0%) | 3,795 (100.0%) |
Health & Disability in Hattiesburg
Health Insurance Coverage by Age in Hattiesburg
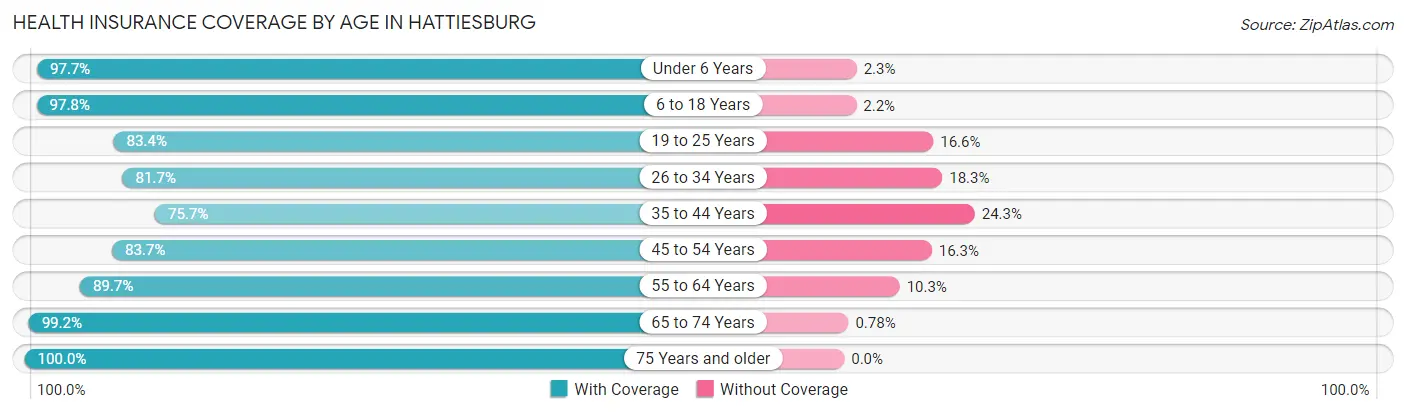
| Age Bracket | With Coverage | Without Coverage |
| Under 6 Years | 3,592 (97.7%) | 85 (2.3%) |
| 6 to 18 Years | 6,992 (97.8%) | 160 (2.2%) |
| 19 to 25 Years | 8,929 (83.4%) | 1,777 (16.6%) |
| 26 to 34 Years | 6,281 (81.7%) | 1,404 (18.3%) |
| 35 to 44 Years | 3,498 (75.7%) | 1,125 (24.3%) |
| 45 to 54 Years | 2,903 (83.7%) | 566 (16.3%) |
| 55 to 64 Years | 3,983 (89.7%) | 459 (10.3%) |
| 65 to 74 Years | 3,200 (99.2%) | 25 (0.8%) |
| 75 Years and older | 2,731 (100.0%) | 0 (0.0%) |
| Total | 42,109 (88.3%) | 5,601 (11.7%) |
Health Insurance Coverage by Citizenship Status in Hattiesburg
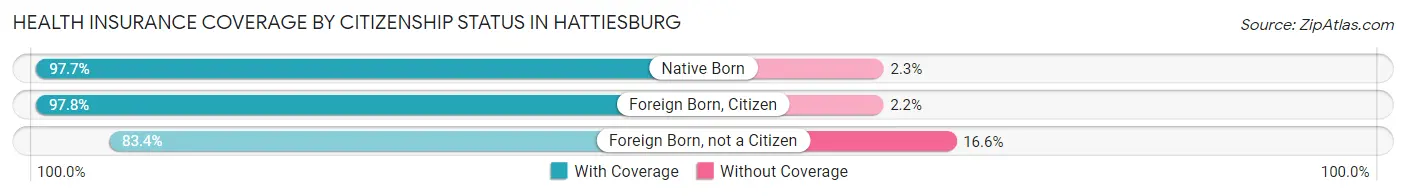
| Citizenship Status | With Coverage | Without Coverage |
| Native Born | 3,592 (97.7%) | 85 (2.3%) |
| Foreign Born, Citizen | 6,992 (97.8%) | 160 (2.2%) |
| Foreign Born, not a Citizen | 8,929 (83.4%) | 1,777 (16.6%) |
Health Insurance Coverage by Household Income in Hattiesburg
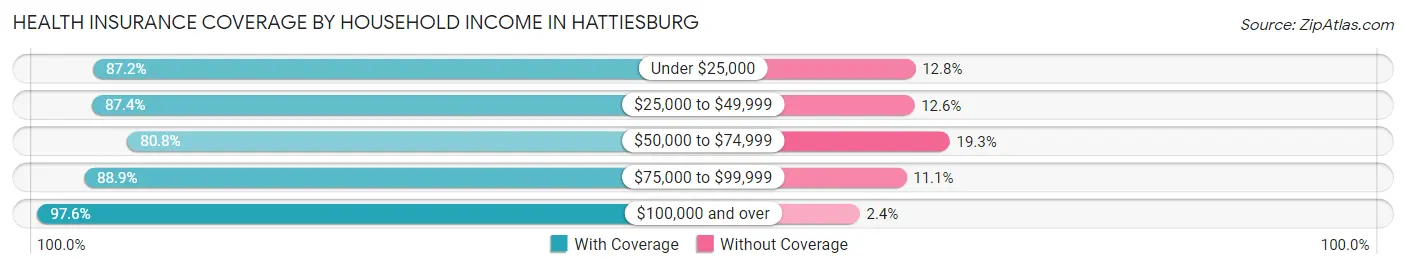
| Household Income | With Coverage | Without Coverage |
| Under $25,000 | 10,946 (87.2%) | 1,610 (12.8%) |
| $25,000 to $49,999 | 9,201 (87.4%) | 1,330 (12.6%) |
| $50,000 to $74,999 | 6,511 (80.7%) | 1,552 (19.3%) |
| $75,000 to $99,999 | 4,315 (88.9%) | 541 (11.1%) |
| $100,000 and over | 8,083 (97.6%) | 198 (2.4%) |
Public vs Private Health Insurance Coverage by Age in Hattiesburg
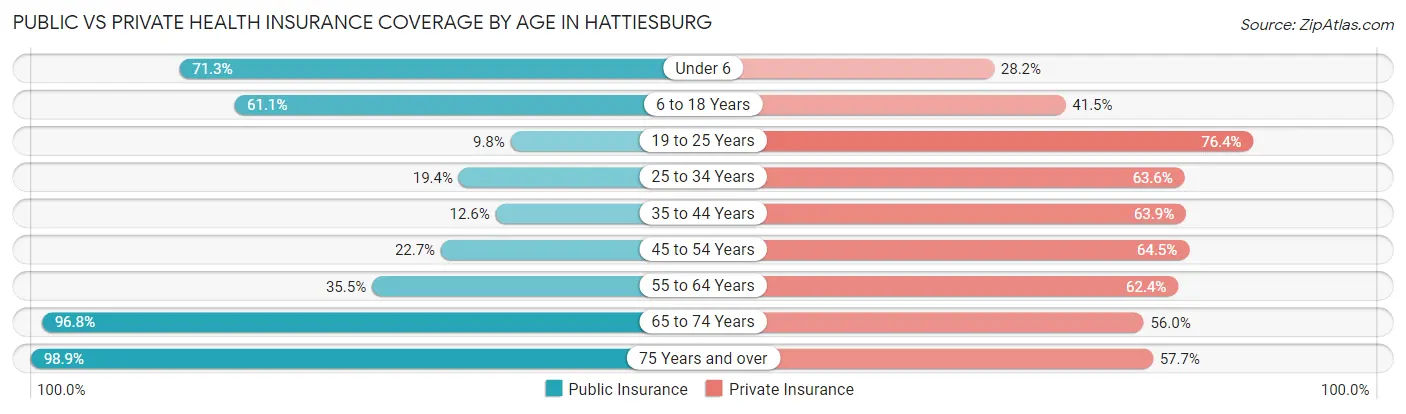
| Age Bracket | Public Insurance | Private Insurance |
| Under 6 | 2,621 (71.3%) | 1,038 (28.2%) |
| 6 to 18 Years | 4,371 (61.1%) | 2,968 (41.5%) |
| 19 to 25 Years | 1,048 (9.8%) | 8,179 (76.4%) |
| 25 to 34 Years | 1,491 (19.4%) | 4,891 (63.6%) |
| 35 to 44 Years | 581 (12.6%) | 2,953 (63.9%) |
| 45 to 54 Years | 788 (22.7%) | 2,236 (64.5%) |
| 55 to 64 Years | 1,578 (35.5%) | 2,773 (62.4%) |
| 65 to 74 Years | 3,122 (96.8%) | 1,806 (56.0%) |
| 75 Years and over | 2,700 (98.9%) | 1,576 (57.7%) |
| Total | 18,300 (38.4%) | 28,420 (59.6%) |
Disability Status by Sex by Age in Hattiesburg
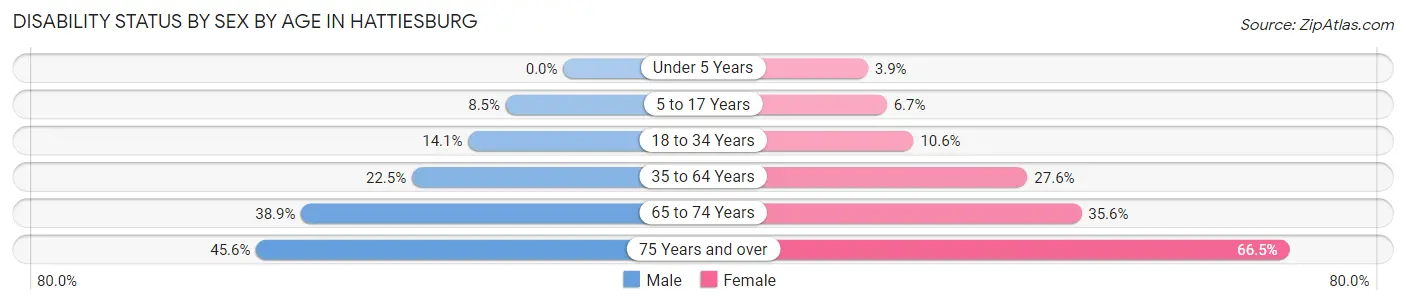
| Age Bracket | Male | Female |
| Under 5 Years | 0 (0.0%) | 55 (3.9%) |
| 5 to 17 Years | 268 (8.5%) | 222 (6.7%) |
| 18 to 34 Years | 1,224 (14.1%) | 1,169 (10.6%) |
| 35 to 64 Years | 1,297 (22.5%) | 1,864 (27.6%) |
| 65 to 74 Years | 572 (38.9%) | 624 (35.6%) |
| 75 Years and over | 439 (45.6%) | 1,175 (66.5%) |
Disability Class by Sex by Age in Hattiesburg
Disability Class: Hearing Difficulty
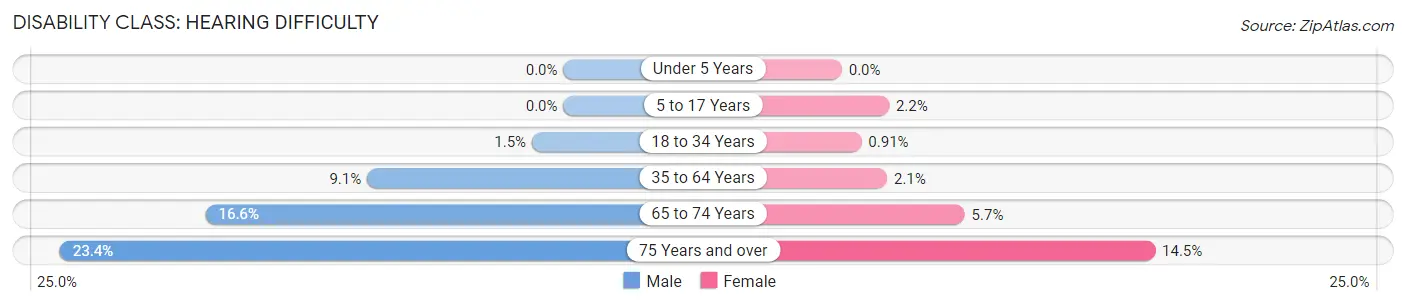
| Age Bracket | Male | Female |
| Under 5 Years | 0 (0.0%) | 0 (0.0%) |
| 5 to 17 Years | 0 (0.0%) | 73 (2.2%) |
| 18 to 34 Years | 127 (1.5%) | 100 (0.9%) |
| 35 to 64 Years | 526 (9.1%) | 142 (2.1%) |
| 65 to 74 Years | 244 (16.6%) | 100 (5.7%) |
| 75 Years and over | 225 (23.4%) | 257 (14.5%) |
Disability Class: Vision Difficulty
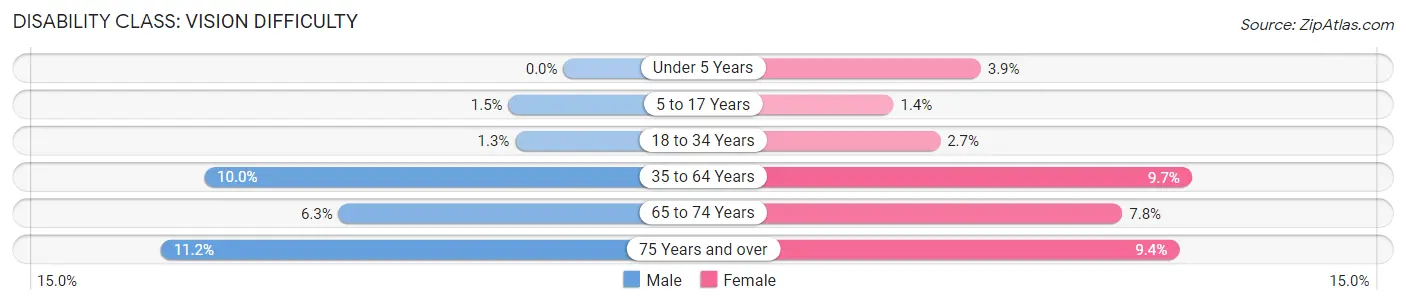
| Age Bracket | Male | Female |
| Under 5 Years | 0 (0.0%) | 55 (3.9%) |
| 5 to 17 Years | 48 (1.5%) | 48 (1.4%) |
| 18 to 34 Years | 116 (1.3%) | 301 (2.7%) |
| 35 to 64 Years | 577 (10.0%) | 659 (9.7%) |
| 65 to 74 Years | 92 (6.3%) | 137 (7.8%) |
| 75 Years and over | 108 (11.2%) | 166 (9.4%) |
Disability Class: Cognitive Difficulty
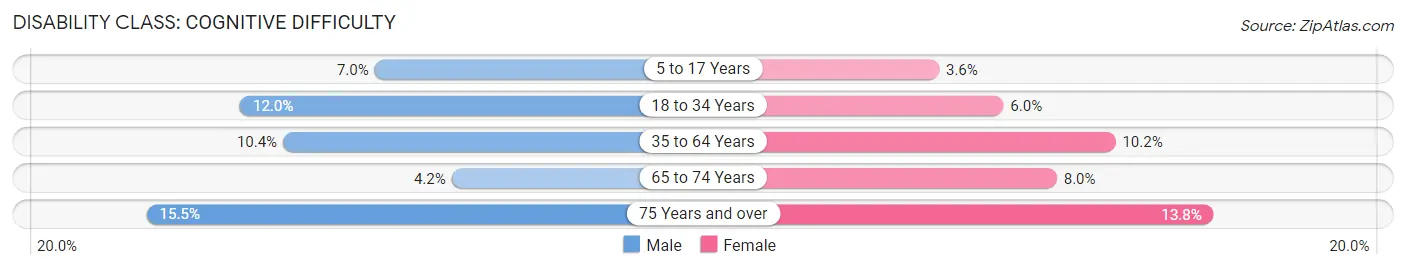
| Age Bracket | Male | Female |
| 5 to 17 Years | 220 (7.0%) | 120 (3.6%) |
| 18 to 34 Years | 1,040 (12.0%) | 659 (6.0%) |
| 35 to 64 Years | 601 (10.4%) | 687 (10.2%) |
| 65 to 74 Years | 61 (4.2%) | 140 (8.0%) |
| 75 Years and over | 149 (15.5%) | 244 (13.8%) |
Disability Class: Ambulatory Difficulty
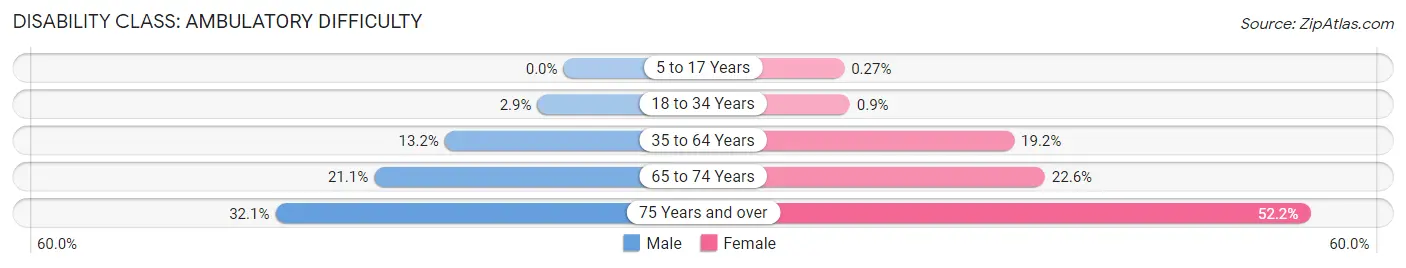
| Age Bracket | Male | Female |
| 5 to 17 Years | 0 (0.0%) | 9 (0.3%) |
| 18 to 34 Years | 251 (2.9%) | 99 (0.9%) |
| 35 to 64 Years | 763 (13.2%) | 1,298 (19.2%) |
| 65 to 74 Years | 310 (21.1%) | 397 (22.6%) |
| 75 Years and over | 309 (32.1%) | 922 (52.1%) |
Disability Class: Self-Care Difficulty
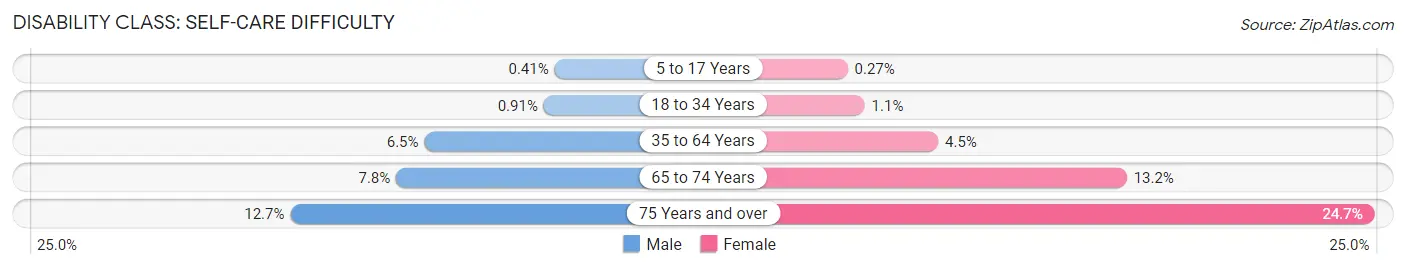
| Age Bracket | Male | Female |
| 5 to 17 Years | 13 (0.4%) | 9 (0.3%) |
| 18 to 34 Years | 79 (0.9%) | 116 (1.1%) |
| 35 to 64 Years | 372 (6.5%) | 302 (4.5%) |
| 65 to 74 Years | 114 (7.8%) | 232 (13.2%) |
| 75 Years and over | 122 (12.7%) | 437 (24.7%) |
Technology Access in Hattiesburg
Computing Device Access in Hattiesburg
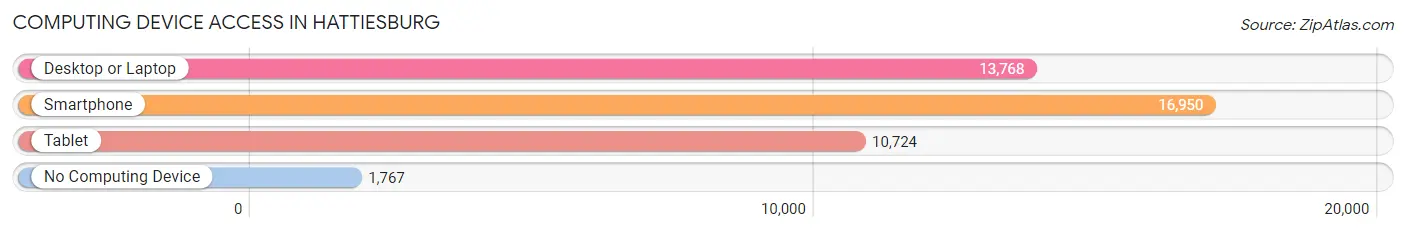
| Device Type | # Households | % Households |
| Desktop or Laptop | 13,768 | 69.6% |
| Smartphone | 16,950 | 85.7% |
| Tablet | 10,724 | 54.2% |
| No Computing Device | 1,767 | 8.9% |
| Total | 19,787 | 100.0% |
Internet Access in Hattiesburg
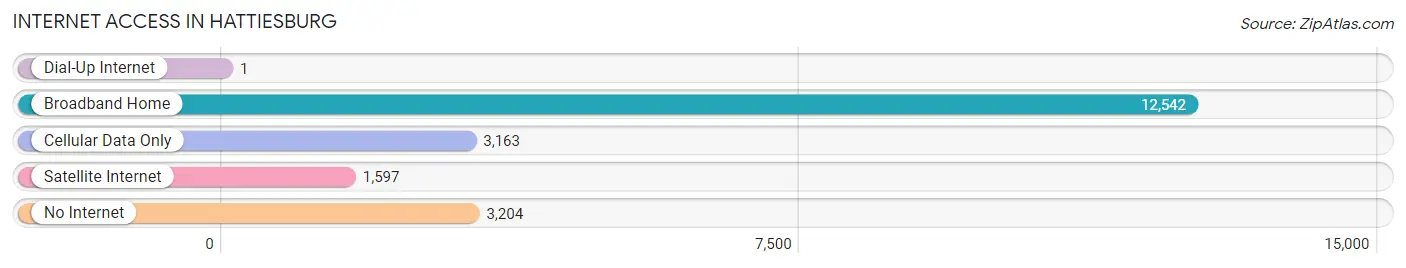
| Internet Type | # Households | % Households |
| Dial-Up Internet | 1 | 0.0% |
| Broadband Home | 12,542 | 63.4% |
| Cellular Data Only | 3,163 | 16.0% |
| Satellite Internet | 1,597 | 8.1% |
| No Internet | 3,204 | 16.2% |
| Total | 19,787 | 100.0% |
Hattiesburg Summary
Hattiesburg is a city located in Forrest County, Mississippi, United States. It is the county seat of Forrest County and the principal city of the Hattiesburg, Mississippi Metropolitan Statistical Area, which encompasses Forrest, Lamar and Perry counties. As of the 2010 census, the city had a total population of 45,989, with an estimated population of 46,805 in 2015. It is the second-largest city in Mississippi, after the state capital, Jackson.
History
Hattiesburg was founded in 1882 by William H. Hardy, who named the city after his wife, Hattie. The city was incorporated two years later with a population of 400. Hattiesburg's population first expanded as a center of the lumber and railroad industries, from which was derived the nickname “The Hub City.” It now attracts newcomers to the area because of the diversity of the economy, strong neighborhoods and the central location in South Mississippi.
Geography
Hattiesburg is located at the intersection of Interstate 59 and U.S. Highway 49. It is approximately 80 miles (130 km) north of the Gulf of Mexico and 90 miles (145 km) south of the state capital, Jackson. The city is located in the Pine Belt region of Mississippi, and is surrounded by the cities of Petal, Purvis, and Laurel.
The city has a total area of 40.8 square miles (105.8 km2), of which 40.7 square miles (105.5 km2) is land and 0.1 square miles (0.3 km2) (0.25%) is water.
Economy
Hattiesburg is a regional center of industry and business. The city's major employers include the University of Southern Mississippi, Camp Shelby, Forrest General Hospital, and the Hattiesburg Public School District. The city is also home to several large manufacturing and distribution companies, including Hub City, Inc., and the Coca-Cola Bottling Company.
The city's economy is also supported by a strong tourism industry. Hattiesburg is home to several attractions, including the Hattiesburg Zoo, the African American Military History Museum, and the Hattiesburg Historic Neighborhood.
Demographics
As of the 2010 census, there were 45,989 people, 18,841 households, and 10,845 families residing in the city. The population density was 1,132.2 people per square mile (437.7/km2). There were 20,844 housing units at an average density of 510.9 per square mile (197.2/km2). The racial makeup of the city was 57.2% White, 40.3% African American, 0.2% Native American, 1.1% Asian, 0.1% Pacific Islander, 0.7% from other races, and 0.5% from two or more races. Hispanic or Latino of any race were 1.7% of the population.
There were 18,841 households, out of which 28.2% had children under the age of 18 living with them, 34.2% were married couples living together, 21.2% had a female householder with no husband present, and 40.3% were non-families. 33.2% of all households were made up of individuals, and 11.3% had someone living alone who was 65 years of age or older. The average household size was 2.35 and the average family size was 3.00.
In the city, the population was spread out, with 24.1% under the age of 18, 17.8% from 18 to 24, 25.1% from 25 to 44, 20.2% from 45 to 64, and 12.8% who were 65 years of age or older. The median age was 32 years. For every 100 females, there were 88.3 males. For every 100 females age 18 and over, there were 83.2 males.
The median income for a household in the city was $27,837, and the median income for a family was $36,845. Males had a median income of $29,844 versus $21,845 for females. The per capita income for the city was $17,851. About 19.2% of families and 24.5% of the population were below the poverty line, including 33.3% of those under age 18 and 16.2% of those age 65 or over.
Common Questions
What is Per Capita Income in Hattiesburg?
Per Capita income in Hattiesburg is $27,005.
What is the Median Family Income in Hattiesburg?
Median Family Income in Hattiesburg is $53,116.
What is the Median Household income in Hattiesburg?
Median Household Income in Hattiesburg is $41,024.
What is Income or Wage Gap in Hattiesburg?
Income or Wage Gap in Hattiesburg is 32.2%.
Women in Hattiesburg earn 67.8 cents for every dollar earned by a man.
What is Family Income Deficit in Hattiesburg?
Family Income Deficit in Hattiesburg is $13,040.
Families that are below poverty line in Hattiesburg earn $13,040 less on average than the poverty threshold level.
What is Inequality or Gini Index in Hattiesburg?
Inequality or Gini Index in Hattiesburg is 0.54.
What is the Total Population of Hattiesburg?
Total Population of Hattiesburg is 48,466.
What is the Total Male Population of Hattiesburg?
Total Male Population of Hattiesburg is 22,180.
What is the Total Female Population of Hattiesburg?
Total Female Population of Hattiesburg is 26,286.
What is the Ratio of Males per 100 Females in Hattiesburg?
There are 84.38 Males per 100 Females in Hattiesburg.
What is the Ratio of Females per 100 Males in Hattiesburg?
There are 118.51 Females per 100 Males in Hattiesburg.
What is the Median Population Age in Hattiesburg?
Median Population Age in Hattiesburg is 28.5 Years.
What is the Average Family Size in Hattiesburg
Average Family Size in Hattiesburg is 3.0 People.
What is the Average Household Size in Hattiesburg
Average Household Size in Hattiesburg is 2.2 People.
How Large is the Labor Force in Hattiesburg?
There are 25,385 People in the Labor Forcein in Hattiesburg.
What is the Percentage of People in the Labor Force in Hattiesburg?
63.6% of People are in the Labor Force in Hattiesburg.
What is the Unemployment Rate in Hattiesburg?
Unemployment Rate in Hattiesburg is 7.8%.