Munster, IN Map & Demographics
Munster Map
Munster Overview
$53,245
PER CAPITA INCOME
$126,563
AVG FAMILY INCOME
$101,851
AVG HOUSEHOLD INCOME
39.0%
WAGE / INCOME GAP [ % ]
61.0¢/ $1
WAGE / INCOME GAP [ $ ]
0.47
INEQUALITY / GINI INDEX
23,731
TOTAL POPULATION
11,518
MALE POPULATION
12,213
FEMALE POPULATION
94.31
MALES / 100 FEMALES
106.03
FEMALES / 100 MALES
45.6
MEDIAN AGE
3.1
AVG FAMILY SIZE
2.5
AVG HOUSEHOLD SIZE
12,205
LABOR FORCE [ PEOPLE ]
61.5%
PERCENT IN LABOR FORCE
3.9%
UNEMPLOYMENT RATE
Munster Zip Codes
Munster Area Codes
Income in Munster
Income Overview in Munster
Per Capita Income in Munster is $53,245, while median incomes of families and households are $126,563 and $101,851 respectively.
| Characteristic | Number | Measure |
| Per Capita Income | 23,731 | $53,245 |
| Median Family Income | 6,363 | $126,563 |
| Mean Family Income | 6,363 | $154,964 |
| Median Household Income | 9,296 | $101,851 |
| Mean Household Income | 9,296 | $134,442 |
| Income Deficit | 6,363 | $0 |
| Wage / Income Gap (%) | 23,731 | 38.97% |
| Wage / Income Gap ($) | 23,731 | 61.03¢ per $1 |
| Gini / Inequality Index | 23,731 | 0.47 |
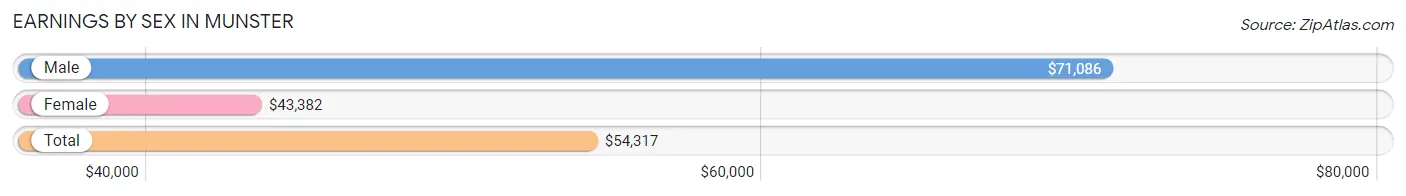
Earnings by Sex in Munster
Average Earnings in Munster are $54,317, $71,086 for men and $43,382 for women, a difference of 39.0%.
| Sex | Number | Average Earnings |
| Male | 6,443 (50.7%) | $71,086 |
| Female | 6,256 (49.3%) | $43,382 |
| Total | 12,699 (100.0%) | $54,317 |
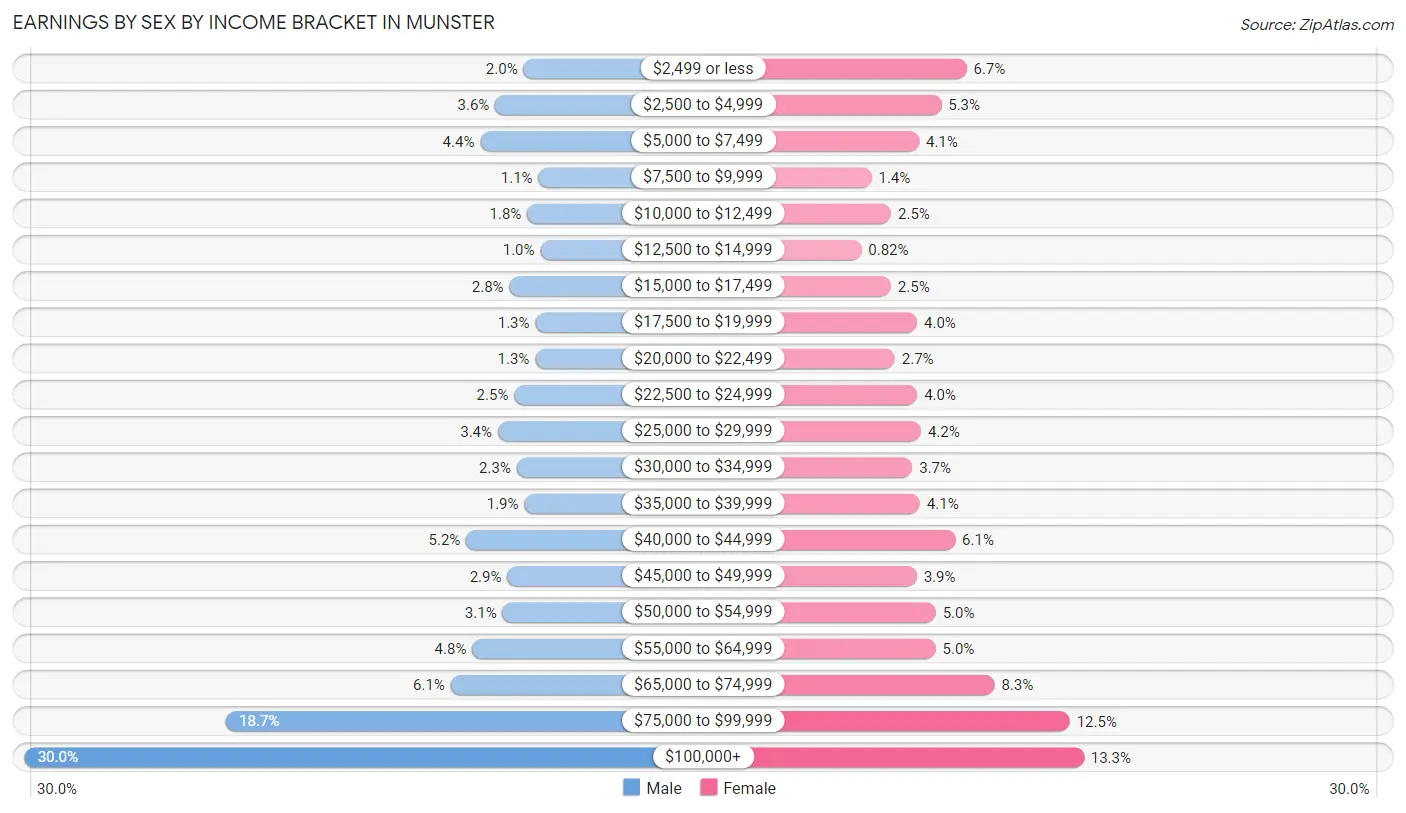
Earnings by Sex by Income Bracket in Munster
The most common earnings brackets in Munster are $100,000+ for men (1,932 | 30.0%) and $100,000+ for women (833 | 13.3%).
| Income | Male | Female |
| $2,499 or less | 126 (2.0%) | 421 (6.7%) |
| $2,500 to $4,999 | 229 (3.5%) | 332 (5.3%) |
| $5,000 to $7,499 | 283 (4.4%) | 254 (4.1%) |
| $7,500 to $9,999 | 72 (1.1%) | 87 (1.4%) |
| $10,000 to $12,499 | 113 (1.8%) | 156 (2.5%) |
| $12,500 to $14,999 | 65 (1.0%) | 51 (0.8%) |
| $15,000 to $17,499 | 177 (2.8%) | 155 (2.5%) |
| $17,500 to $19,999 | 83 (1.3%) | 247 (4.0%) |
| $20,000 to $22,499 | 84 (1.3%) | 169 (2.7%) |
| $22,500 to $24,999 | 160 (2.5%) | 248 (4.0%) |
| $25,000 to $29,999 | 219 (3.4%) | 261 (4.2%) |
| $30,000 to $34,999 | 151 (2.3%) | 230 (3.7%) |
| $35,000 to $39,999 | 123 (1.9%) | 257 (4.1%) |
| $40,000 to $44,999 | 334 (5.2%) | 381 (6.1%) |
| $45,000 to $49,999 | 185 (2.9%) | 246 (3.9%) |
| $50,000 to $54,999 | 202 (3.1%) | 313 (5.0%) |
| $55,000 to $64,999 | 312 (4.8%) | 312 (5.0%) |
| $65,000 to $74,999 | 390 (6.0%) | 519 (8.3%) |
| $75,000 to $99,999 | 1,203 (18.7%) | 784 (12.5%) |
| $100,000+ | 1,932 (30.0%) | 833 (13.3%) |
| Total | 6,443 (100.0%) | 6,256 (100.0%) |
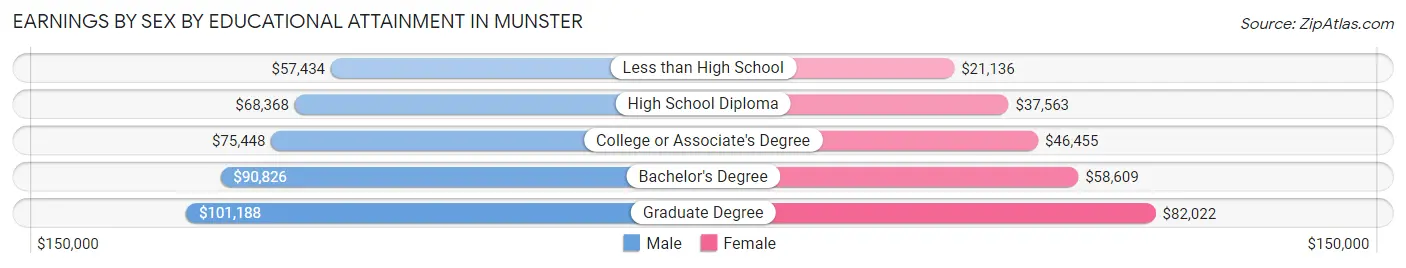
Earnings by Sex by Educational Attainment in Munster
Average earnings in Munster are $86,098 for men and $51,787 for women, a difference of 39.9%. Men with an educational attainment of graduate degree enjoy the highest average annual earnings of $101,188, while those with less than high school education earn the least with $57,434. Women with an educational attainment of graduate degree earn the most with the average annual earnings of $82,022, while those with less than high school education have the smallest earnings of $21,136.
| Educational Attainment | Male Income | Female Income |
| Less than High School | $57,434 | $21,136 |
| High School Diploma | $68,368 | $37,563 |
| College or Associate's Degree | $75,448 | $46,455 |
| Bachelor's Degree | $90,826 | $58,609 |
| Graduate Degree | $101,188 | $82,022 |
| Total | $86,098 | $51,787 |
Family Income in Munster
Family Income Brackets in Munster
According to the Munster family income data, there are 1,667 families falling into the $100,000 to $149,999 income range, which is the most common income bracket and makes up 26.2% of all families. Conversely, the $10,000 to $14,999 income bracket is the least frequent group with only 38 families (0.6%) belonging to this category.
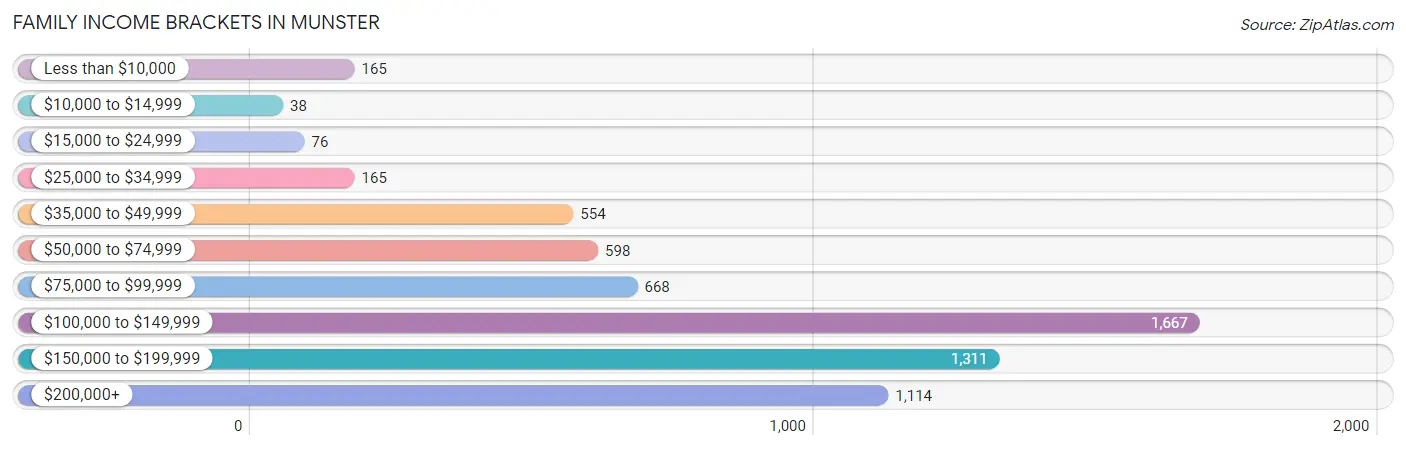
| Income Bracket | # Families | % Families |
| Less than $10,000 | 165 | 2.6% |
| $10,000 to $14,999 | 38 | 0.6% |
| $15,000 to $24,999 | 76 | 1.2% |
| $25,000 to $34,999 | 165 | 2.6% |
| $35,000 to $49,999 | 554 | 8.7% |
| $50,000 to $74,999 | 598 | 9.4% |
| $75,000 to $99,999 | 668 | 10.5% |
| $100,000 to $149,999 | 1,667 | 26.2% |
| $150,000 to $199,999 | 1,311 | 20.6% |
| $200,000+ | 1,114 | 17.5% |
Family Income by Famaliy Size in Munster
6-person families (77 | 1.2%) account for the highest median family income in Munster with $190,625 per family, while 2-person families (2,858 | 44.9%) have the highest median income of $48,522 per family member.
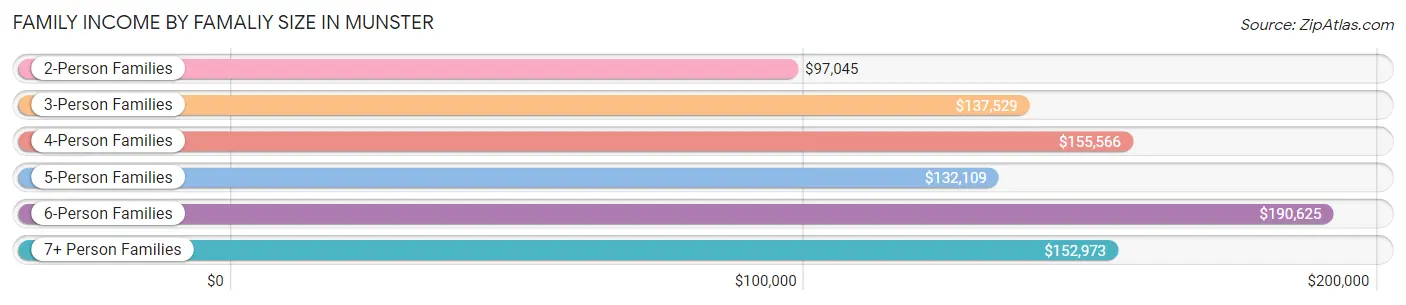
| Income Bracket | # Families | Median Income |
| 2-Person Families | 2,858 (44.9%) | $97,045 |
| 3-Person Families | 1,677 (26.4%) | $137,529 |
| 4-Person Families | 1,234 (19.4%) | $155,566 |
| 5-Person Families | 457 (7.2%) | $132,109 |
| 6-Person Families | 77 (1.2%) | $190,625 |
| 7+ Person Families | 60 (0.9%) | $152,973 |
| Total | 6,363 (100.0%) | $126,563 |
Family Income by Number of Earners in Munster
The median family income in Munster is $126,563, with families comprising 2 earners (2,712) having the highest median family income of $156,651, while families with no earners (892) have the lowest median family income of $71,100, accounting for 42.6% and 14.0% of families, respectively.
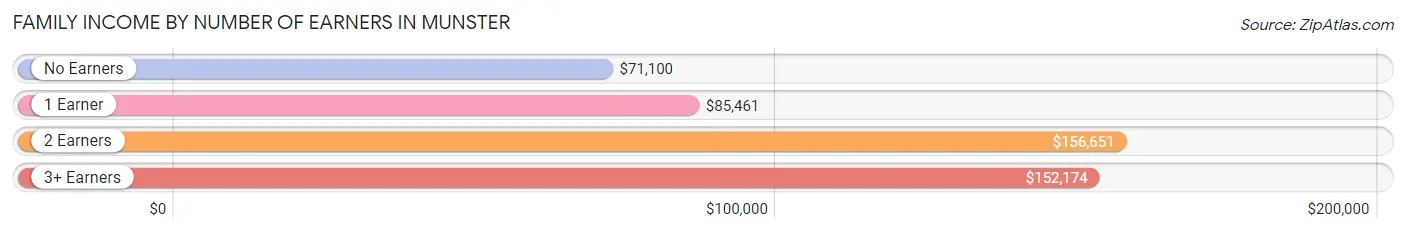
| Number of Earners | # Families | Median Income |
| No Earners | 892 (14.0%) | $71,100 |
| 1 Earner | 1,767 (27.8%) | $85,461 |
| 2 Earners | 2,712 (42.6%) | $156,651 |
| 3+ Earners | 992 (15.6%) | $152,174 |
| Total | 6,363 (100.0%) | $126,563 |
Household Income in Munster
Household Income Brackets in Munster
With 2,045 households falling in the category, the $100,000 to $149,999 income range is the most frequent in Munster, accounting for 22.0% of all households. In contrast, only 93 households (1.0%) fall into the $10,000 to $14,999 income bracket, making it the least populous group.
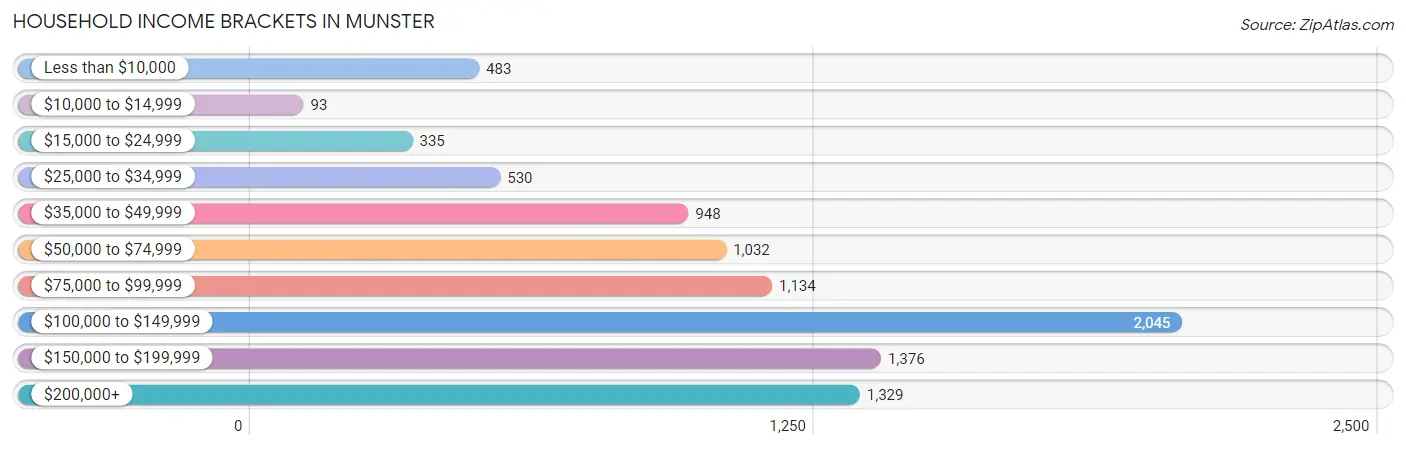
| Income Bracket | # Households | % Households |
| Less than $10,000 | 483 | 5.2% |
| $10,000 to $14,999 | 93 | 1.0% |
| $15,000 to $24,999 | 335 | 3.6% |
| $25,000 to $34,999 | 530 | 5.7% |
| $35,000 to $49,999 | 948 | 10.2% |
| $50,000 to $74,999 | 1,032 | 11.1% |
| $75,000 to $99,999 | 1,134 | 12.2% |
| $100,000 to $149,999 | 2,045 | 22.0% |
| $150,000 to $199,999 | 1,376 | 14.8% |
| $200,000+ | 1,329 | 14.3% |
Household Income by Householder Age in Munster
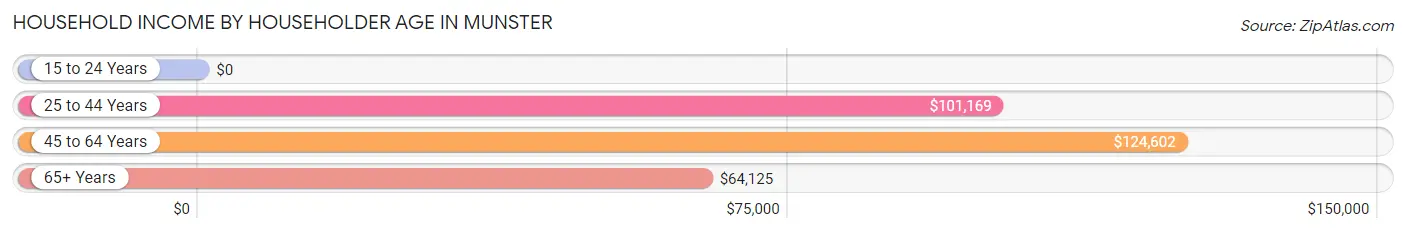
The median household income in Munster is $101,851, with the highest median household income of $124,602 found in the 45 to 64 years age bracket for the primary householder. A total of 4,116 households (44.3%) fall into this category. Meanwhile, the 15 to 24 years age bracket for the primary householder has the lowest median household income of $0, with 66 households (0.7%) in this group.
| Income Bracket | # Households | Median Income |
| 15 to 24 Years | 66 (0.7%) | $0 |
| 25 to 44 Years | 2,243 (24.1%) | $101,169 |
| 45 to 64 Years | 4,116 (44.3%) | $124,602 |
| 65+ Years | 2,871 (30.9%) | $64,125 |
| Total | 9,296 (100.0%) | $101,851 |
Poverty in Munster
Income Below Poverty by Sex and Age in Munster
With 8.4% poverty level for males and 6.4% for females among the residents of Munster, 15 year old males and under 5 year old females are the most vulnerable to poverty, with 37 males (33.3%) and 108 females (21.4%) in their respective age groups living below the poverty level.
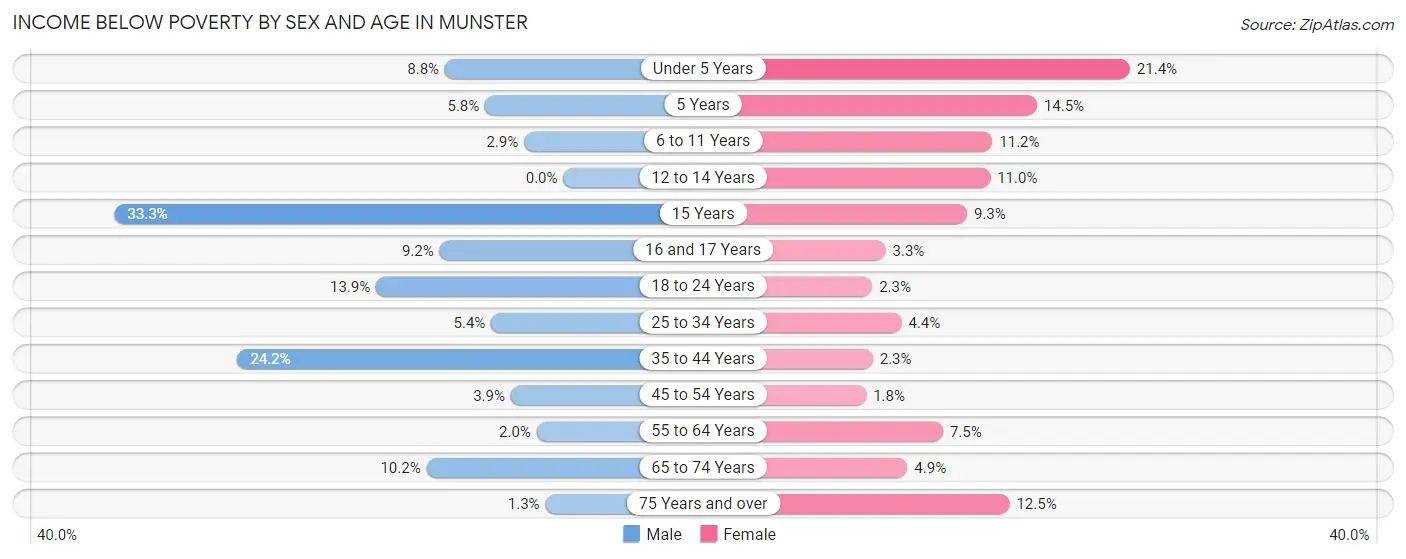
| Age Bracket | Male | Female |
| Under 5 Years | 50 (8.8%) | 108 (21.4%) |
| 5 Years | 10 (5.8%) | 20 (14.5%) |
| 6 to 11 Years | 23 (2.9%) | 74 (11.2%) |
| 12 to 14 Years | 0 (0.0%) | 42 (11.0%) |
| 15 Years | 37 (33.3%) | 28 (9.3%) |
| 16 and 17 Years | 25 (9.2%) | 11 (3.3%) |
| 18 to 24 Years | 128 (13.9%) | 28 (2.3%) |
| 25 to 34 Years | 57 (5.4%) | 48 (4.4%) |
| 35 to 44 Years | 377 (24.2%) | 30 (2.3%) |
| 45 to 54 Years | 74 (3.9%) | 33 (1.8%) |
| 55 to 64 Years | 33 (2.0%) | 143 (7.5%) |
| 65 to 74 Years | 128 (10.2%) | 56 (4.9%) |
| 75 Years and over | 12 (1.3%) | 138 (12.4%) |
| Total | 954 (8.4%) | 759 (6.4%) |
Income Above Poverty by Sex and Age in Munster
According to the poverty statistics in Munster, males aged 12 to 14 years and females aged 45 to 54 years are the age groups that are most secure financially, with 100.0% of males and 98.2% of females in these age groups living above the poverty line.
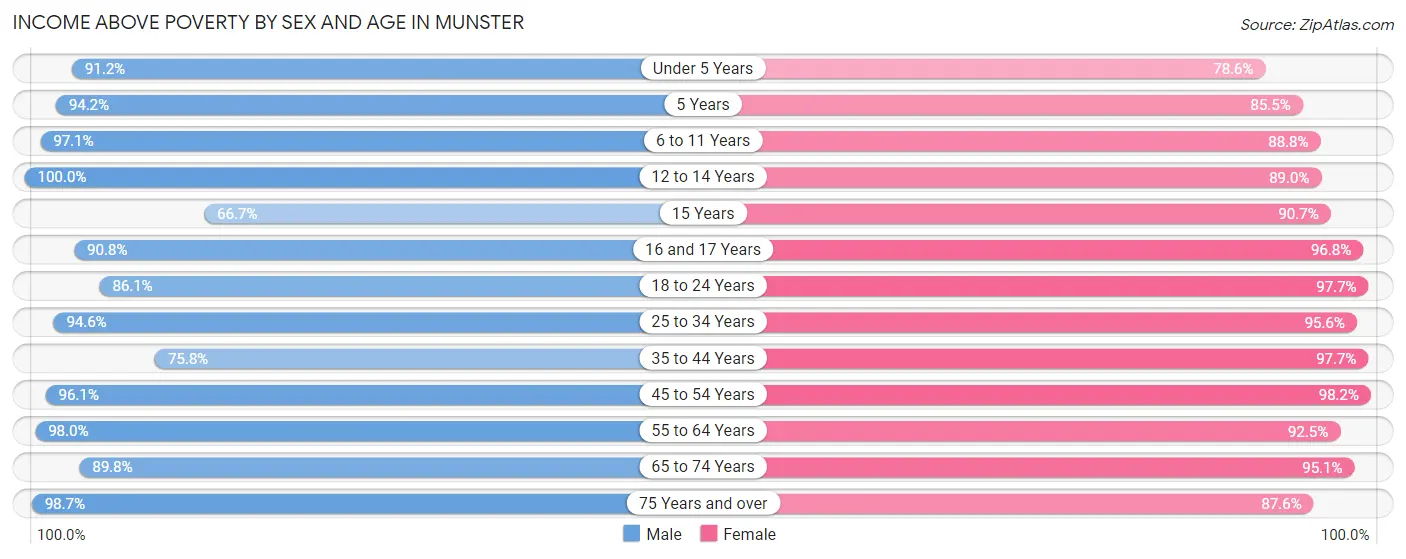
| Age Bracket | Male | Female |
| Under 5 Years | 519 (91.2%) | 397 (78.6%) |
| 5 Years | 162 (94.2%) | 118 (85.5%) |
| 6 to 11 Years | 764 (97.1%) | 588 (88.8%) |
| 12 to 14 Years | 187 (100.0%) | 339 (89.0%) |
| 15 Years | 74 (66.7%) | 273 (90.7%) |
| 16 and 17 Years | 247 (90.8%) | 327 (96.8%) |
| 18 to 24 Years | 793 (86.1%) | 1,213 (97.7%) |
| 25 to 34 Years | 1,007 (94.6%) | 1,035 (95.6%) |
| 35 to 44 Years | 1,181 (75.8%) | 1,272 (97.7%) |
| 45 to 54 Years | 1,823 (96.1%) | 1,794 (98.2%) |
| 55 to 64 Years | 1,636 (98.0%) | 1,760 (92.5%) |
| 65 to 74 Years | 1,132 (89.8%) | 1,095 (95.1%) |
| 75 Years and over | 888 (98.7%) | 970 (87.5%) |
| Total | 10,413 (91.6%) | 11,181 (93.6%) |
Income Below Poverty Among Married-Couple Families in Munster
The poverty statistics for married-couple families in Munster show that 2.7% or 145 of the total 5,396 families live below the poverty line. Families with 3 or 4 children have the highest poverty rate of 10.7%, comprising of 39 families. On the other hand, families with 5 or more children have the lowest poverty rate of 0.0%, which includes 0 families.
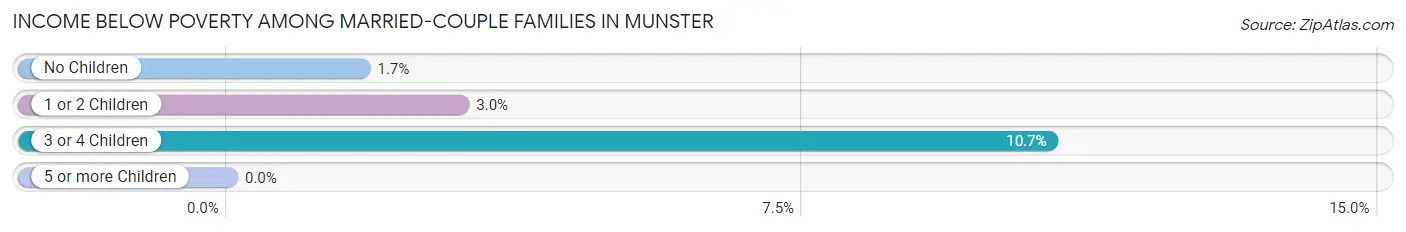
| Children | Above Poverty | Below Poverty |
| No Children | 3,470 (98.3%) | 61 (1.7%) |
| 1 or 2 Children | 1,445 (97.0%) | 45 (3.0%) |
| 3 or 4 Children | 325 (89.3%) | 39 (10.7%) |
| 5 or more Children | 11 (100.0%) | 0 (0.0%) |
| Total | 5,251 (97.3%) | 145 (2.7%) |
Income Below Poverty Among Single-Parent Households in Munster
According to the poverty data in Munster, 32.4% or 72 single-father households and 8.9% or 66 single-mother households are living below the poverty line. Among single-father households, those with 1 or 2 children have the highest poverty rate, with 72 households (55.8%) experiencing poverty. Likewise, among single-mother households, those with 1 or 2 children have the highest poverty rate, with 43 households (10.5%) falling below the poverty line.
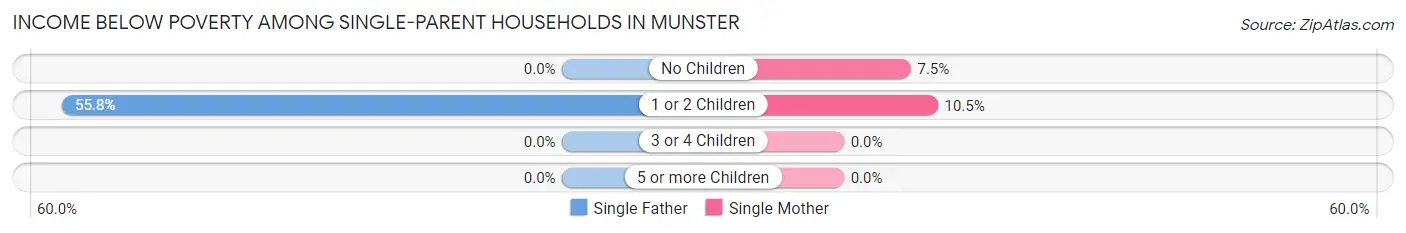
| Children | Single Father | Single Mother |
| No Children | 0 (0.0%) | 23 (7.5%) |
| 1 or 2 Children | 72 (55.8%) | 43 (10.5%) |
| 3 or 4 Children | 0 (0.0%) | 0 (0.0%) |
| 5 or more Children | 0 (0.0%) | 0 (0.0%) |
| Total | 72 (32.4%) | 66 (8.9%) |
Income Below Poverty Among Married-Couple vs Single-Parent Households in Munster
The poverty data for Munster shows that 145 of the married-couple family households (2.7%) and 138 of the single-parent households (14.3%) are living below the poverty level. Within the married-couple family households, those with 3 or 4 children have the highest poverty rate, with 39 households (10.7%) falling below the poverty line. Among the single-parent households, those with 1 or 2 children have the highest poverty rate, with 115 household (21.3%) living below poverty.
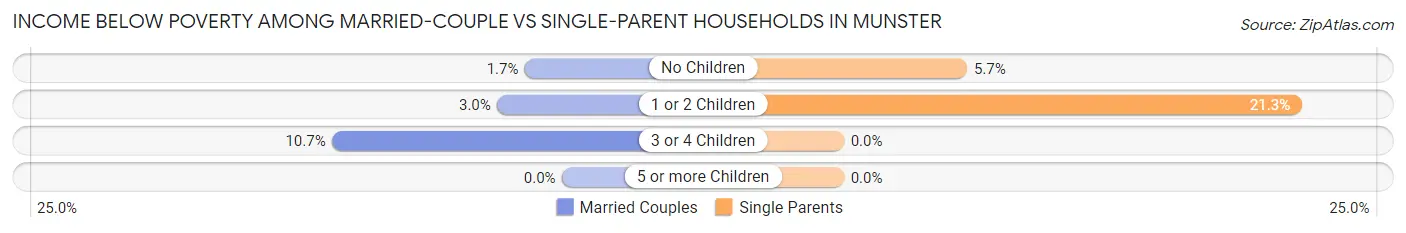
| Children | Married-Couple Families | Single-Parent Households |
| No Children | 61 (1.7%) | 23 (5.7%) |
| 1 or 2 Children | 45 (3.0%) | 115 (21.3%) |
| 3 or 4 Children | 39 (10.7%) | 0 (0.0%) |
| 5 or more Children | 0 (0.0%) | 0 (0.0%) |
| Total | 145 (2.7%) | 138 (14.3%) |
Race in Munster
The most populous races in Munster are White / Caucasian (18,290 | 77.1%), Hispanic or Latino (3,295 | 13.9%), and Two or more Races (1,624 | 6.8%).
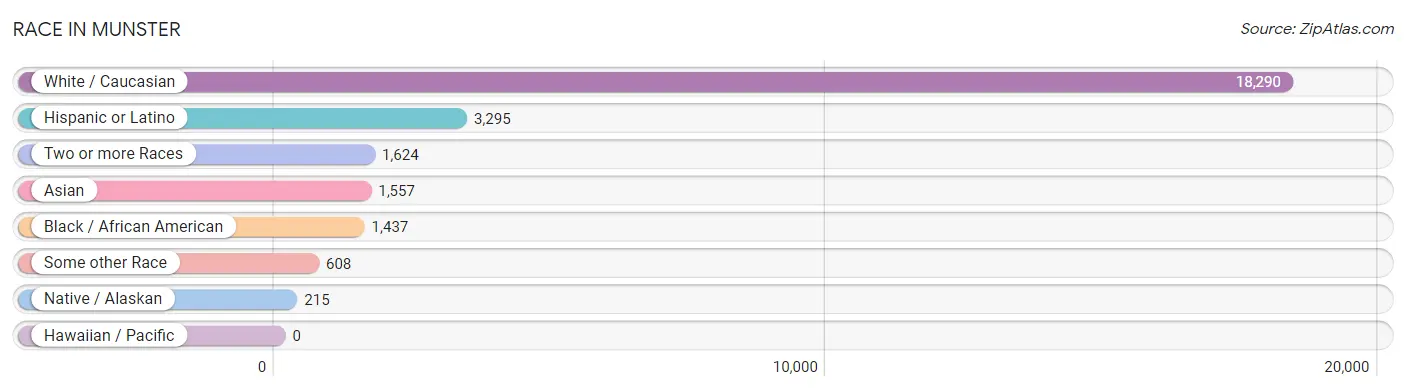
| Race | # Population | % Population |
| Asian | 1,557 | 6.6% |
| Black / African American | 1,437 | 6.1% |
| Hawaiian / Pacific | 0 | 0.0% |
| Hispanic or Latino | 3,295 | 13.9% |
| Native / Alaskan | 215 | 0.9% |
| White / Caucasian | 18,290 | 77.1% |
| Two or more Races | 1,624 | 6.8% |
| Some other Race | 608 | 2.6% |
| Total | 23,731 | 100.0% |
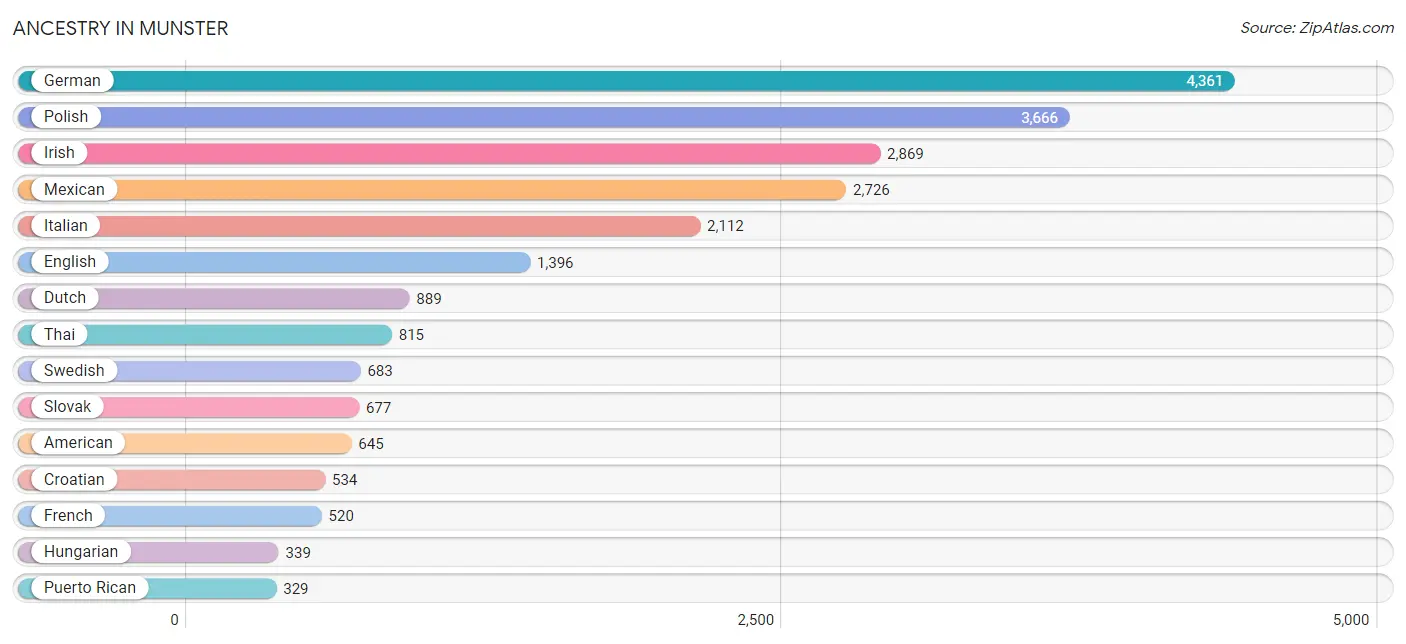
Ancestry in Munster
The most populous ancestries reported in Munster are German (4,361 | 18.4%), Polish (3,666 | 15.4%), Irish (2,869 | 12.1%), Mexican (2,726 | 11.5%), and Italian (2,112 | 8.9%), together accounting for 66.3% of all Munster residents.
| Ancestry | # Population | % Population |
| African | 51 | 0.2% |
| American | 645 | 2.7% |
| Arab | 142 | 0.6% |
| Armenian | 99 | 0.4% |
| Assyrian / Chaldean / Syriac | 26 | 0.1% |
| Austrian | 78 | 0.3% |
| Belgian | 9 | 0.0% |
| Bhutanese | 79 | 0.3% |
| Blackfeet | 21 | 0.1% |
| Brazilian | 22 | 0.1% |
| British | 100 | 0.4% |
| Bulgarian | 47 | 0.2% |
| Burmese | 284 | 1.2% |
| Central American | 147 | 0.6% |
| Central American Indian | 42 | 0.2% |
| Cherokee | 126 | 0.5% |
| Chippewa | 8 | 0.0% |
| Choctaw | 43 | 0.2% |
| Colombian | 49 | 0.2% |
| Comanche | 17 | 0.1% |
| Costa Rican | 30 | 0.1% |
| Croatian | 534 | 2.2% |
| Cuban | 10 | 0.0% |
| Czech | 233 | 1.0% |
| Czechoslovakian | 59 | 0.3% |
| Danish | 33 | 0.1% |
| Dutch | 889 | 3.7% |
| Eastern European | 63 | 0.3% |
| Egyptian | 19 | 0.1% |
| English | 1,396 | 5.9% |
| European | 214 | 0.9% |
| French | 520 | 2.2% |
| French Canadian | 46 | 0.2% |
| German | 4,361 | 18.4% |
| Ghanaian | 19 | 0.1% |
| Greek | 299 | 1.3% |
| Guatemalan | 57 | 0.2% |
| Haitian | 15 | 0.1% |
| Hungarian | 339 | 1.4% |
| Indian (Asian) | 167 | 0.7% |
| Irish | 2,869 | 12.1% |
| Italian | 2,112 | 8.9% |
| Jamaican | 33 | 0.1% |
| Jordanian | 51 | 0.2% |
| Korean | 119 | 0.5% |
| Lebanese | 48 | 0.2% |
| Liberian | 6 | 0.0% |
| Lithuanian | 237 | 1.0% |
| Macedonian | 66 | 0.3% |
| Mexican | 2,726 | 11.5% |
| Mexican American Indian | 23 | 0.1% |
| Navajo | 2 | 0.0% |
| Nicaraguan | 14 | 0.1% |
| Nigerian | 150 | 0.6% |
| Northern European | 23 | 0.1% |
| Norwegian | 125 | 0.5% |
| Osage | 6 | 0.0% |
| Peruvian | 7 | 0.0% |
| Polish | 3,666 | 15.4% |
| Portuguese | 51 | 0.2% |
| Pueblo | 53 | 0.2% |
| Puerto Rican | 329 | 1.4% |
| Romanian | 93 | 0.4% |
| Russian | 325 | 1.4% |
| Salvadoran | 46 | 0.2% |
| Samoan | 11 | 0.1% |
| Scandinavian | 16 | 0.1% |
| Scotch-Irish | 104 | 0.4% |
| Scottish | 204 | 0.9% |
| Serbian | 283 | 1.2% |
| Slavic | 92 | 0.4% |
| Slovak | 677 | 2.9% |
| Slovene | 40 | 0.2% |
| South American | 56 | 0.2% |
| Sri Lankan | 53 | 0.2% |
| Subsaharan African | 226 | 0.9% |
| Swedish | 683 | 2.9% |
| Swiss | 49 | 0.2% |
| Syrian | 12 | 0.1% |
| Thai | 815 | 3.4% |
| Trinidadian and Tobagonian | 33 | 0.1% |
| Ukrainian | 235 | 1.0% |
| Welsh | 154 | 0.6% | View All 83 Rows |
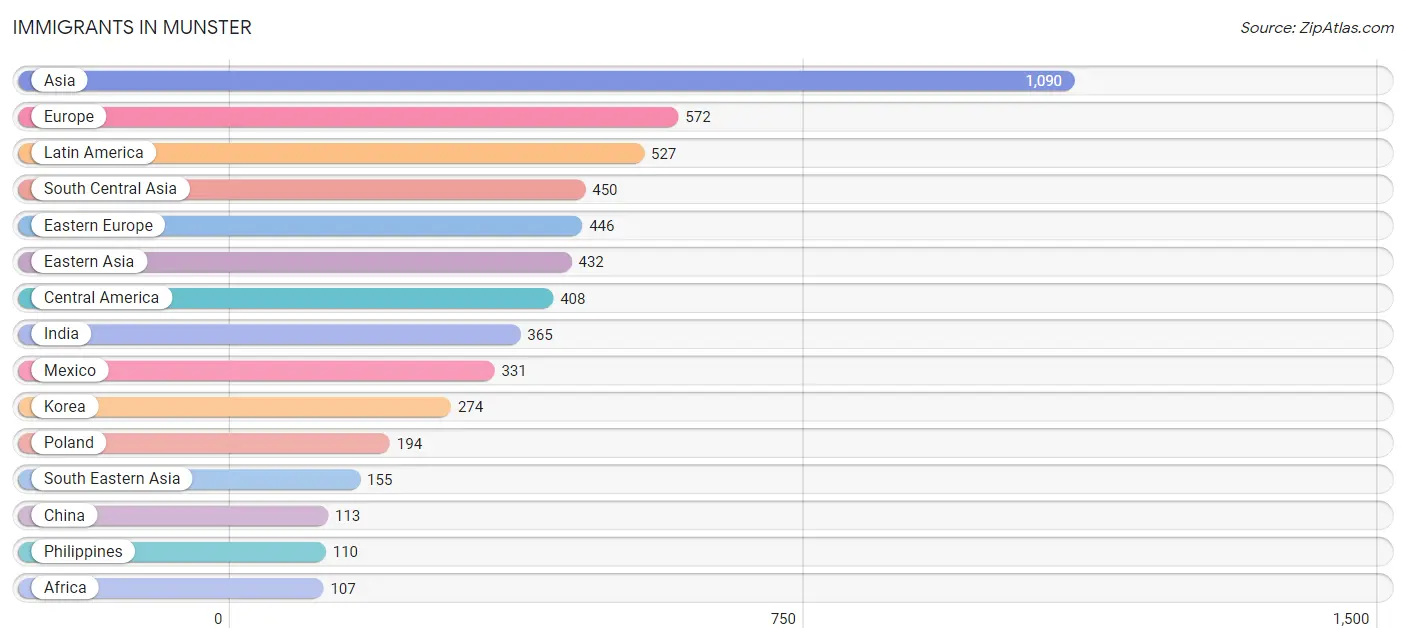
Immigrants in Munster
The most numerous immigrant groups reported in Munster came from Asia (1,090 | 4.6%), Europe (572 | 2.4%), Latin America (527 | 2.2%), South Central Asia (450 | 1.9%), and Eastern Europe (446 | 1.9%), together accounting for 13.0% of all Munster residents.
| Immigration Origin | # Population | % Population |
| Africa | 107 | 0.4% |
| Asia | 1,090 | 4.6% |
| Bosnia and Herzegovina | 82 | 0.4% |
| Brazil | 22 | 0.1% |
| Bulgaria | 15 | 0.1% |
| Canada | 12 | 0.1% |
| Caribbean | 97 | 0.4% |
| Central America | 408 | 1.7% |
| China | 113 | 0.5% |
| Costa Rica | 21 | 0.1% |
| Croatia | 42 | 0.2% |
| Czechoslovakia | 9 | 0.0% |
| Eastern Africa | 7 | 0.0% |
| Eastern Asia | 432 | 1.8% |
| Eastern Europe | 446 | 1.9% |
| Egypt | 19 | 0.1% |
| England | 14 | 0.1% |
| Europe | 572 | 2.4% |
| Germany | 48 | 0.2% |
| Ghana | 34 | 0.1% |
| Guatemala | 56 | 0.2% |
| Haiti | 6 | 0.0% |
| Hungary | 9 | 0.0% |
| India | 365 | 1.5% |
| Iran | 9 | 0.0% |
| Ireland | 15 | 0.1% |
| Jamaica | 70 | 0.3% |
| Japan | 45 | 0.2% |
| Jordan | 32 | 0.1% |
| Korea | 274 | 1.1% |
| Latin America | 527 | 2.2% |
| Lebanon | 9 | 0.0% |
| Mexico | 331 | 1.4% |
| Nepal | 7 | 0.0% |
| Netherlands | 26 | 0.1% |
| Nigeria | 47 | 0.2% |
| North Macedonia | 23 | 0.1% |
| Northern Africa | 19 | 0.1% |
| Northern Europe | 52 | 0.2% |
| Pakistan | 69 | 0.3% |
| Philippines | 110 | 0.5% |
| Poland | 194 | 0.8% |
| Russia | 49 | 0.2% |
| Serbia | 7 | 0.0% |
| South America | 22 | 0.1% |
| South Central Asia | 450 | 1.9% |
| South Eastern Asia | 155 | 0.6% |
| Syria | 12 | 0.1% |
| Taiwan | 20 | 0.1% |
| Trinidad and Tobago | 21 | 0.1% |
| Ukraine | 16 | 0.1% |
| Vietnam | 45 | 0.2% |
| Western Africa | 81 | 0.3% |
| Western Asia | 53 | 0.2% |
| Western Europe | 74 | 0.3% | View All 55 Rows |
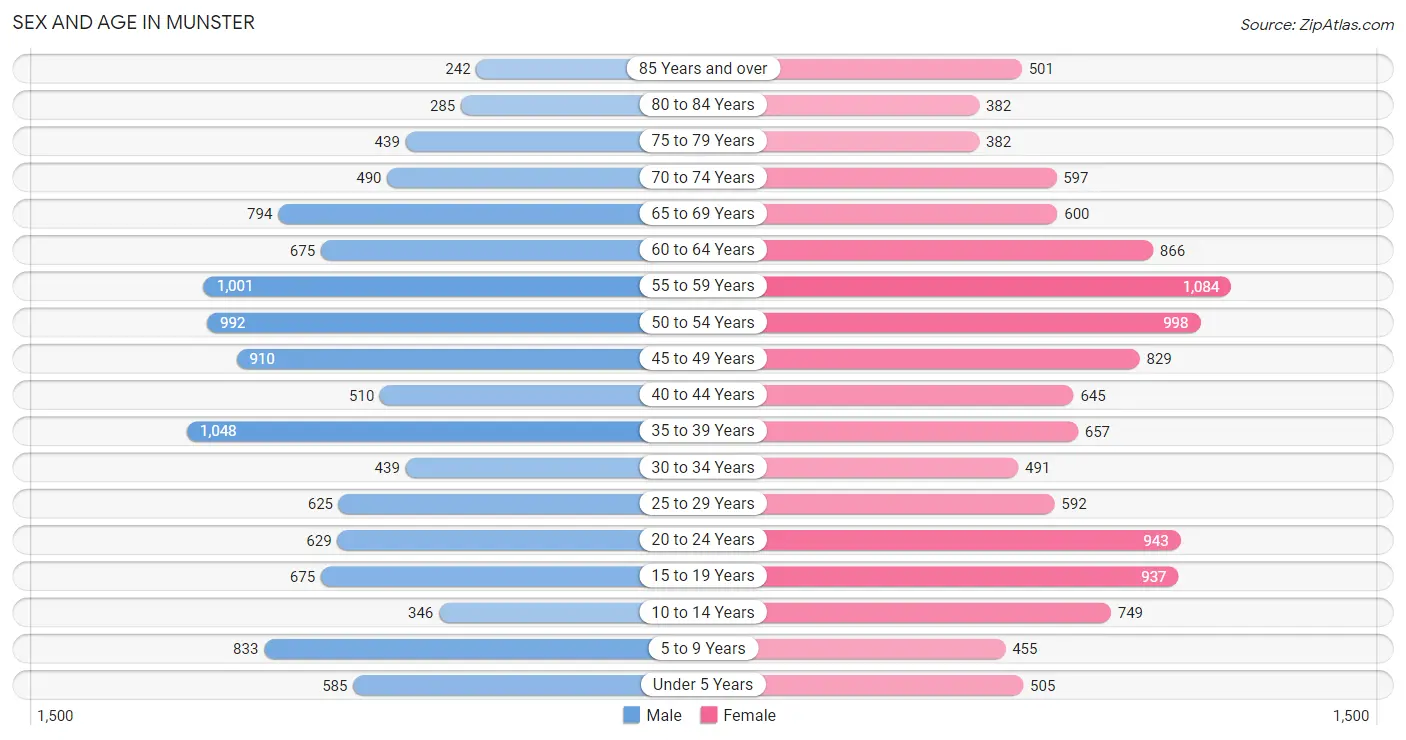
Sex and Age in Munster
Sex and Age in Munster
The most populous age groups in Munster are 35 to 39 Years (1,048 | 9.1%) for men and 55 to 59 Years (1,084 | 8.9%) for women.
| Age Bracket | Male | Female |
| Under 5 Years | 585 (5.1%) | 505 (4.1%) |
| 5 to 9 Years | 833 (7.2%) | 455 (3.7%) |
| 10 to 14 Years | 346 (3.0%) | 749 (6.1%) |
| 15 to 19 Years | 675 (5.9%) | 937 (7.7%) |
| 20 to 24 Years | 629 (5.5%) | 943 (7.7%) |
| 25 to 29 Years | 625 (5.4%) | 592 (4.9%) |
| 30 to 34 Years | 439 (3.8%) | 491 (4.0%) |
| 35 to 39 Years | 1,048 (9.1%) | 657 (5.4%) |
| 40 to 44 Years | 510 (4.4%) | 645 (5.3%) |
| 45 to 49 Years | 910 (7.9%) | 829 (6.8%) |
| 50 to 54 Years | 992 (8.6%) | 998 (8.2%) |
| 55 to 59 Years | 1,001 (8.7%) | 1,084 (8.9%) |
| 60 to 64 Years | 675 (5.9%) | 866 (7.1%) |
| 65 to 69 Years | 794 (6.9%) | 600 (4.9%) |
| 70 to 74 Years | 490 (4.3%) | 597 (4.9%) |
| 75 to 79 Years | 439 (3.8%) | 382 (3.1%) |
| 80 to 84 Years | 285 (2.5%) | 382 (3.1%) |
| 85 Years and over | 242 (2.1%) | 501 (4.1%) |
| Total | 11,518 (100.0%) | 12,213 (100.0%) |
Families and Households in Munster
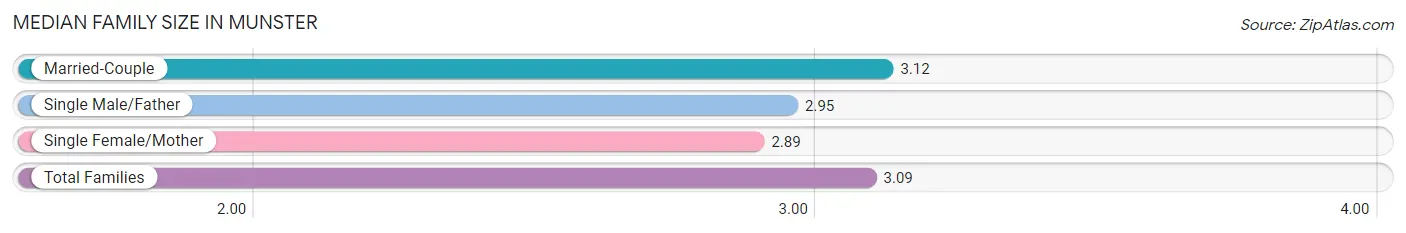
Median Family Size in Munster
The median family size in Munster is 3.09 persons per family, with married-couple families (5,396 | 84.8%) accounting for the largest median family size of 3.12 persons per family. On the other hand, single female/mother families (745 | 11.7%) represent the smallest median family size with 2.89 persons per family.
| Family Type | # Families | Family Size |
| Married-Couple | 5,396 (84.8%) | 3.12 |
| Single Male/Father | 222 (3.5%) | 2.95 |
| Single Female/Mother | 745 (11.7%) | 2.89 |
| Total Families | 6,363 (100.0%) | 3.09 |
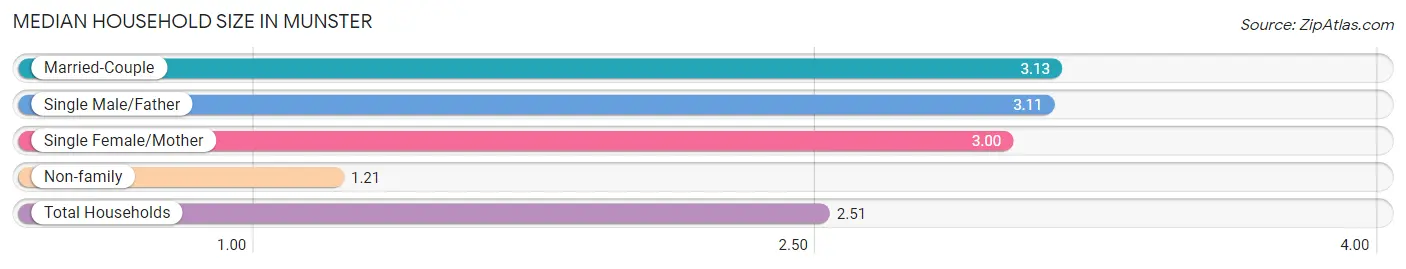
Median Household Size in Munster
The median household size in Munster is 2.51 persons per household, with married-couple households (5,396 | 58.1%) accounting for the largest median household size of 3.13 persons per household. non-family households (2,933 | 31.6%) represent the smallest median household size with 1.21 persons per household.
| Household Type | # Households | Household Size |
| Married-Couple | 5,396 (58.1%) | 3.13 |
| Single Male/Father | 222 (2.4%) | 3.11 |
| Single Female/Mother | 745 (8.0%) | 3.00 |
| Non-family | 2,933 (31.6%) | 1.21 |
| Total Households | 9,296 (100.0%) | 2.51 |
Household Size by Marriage Status in Munster
Out of a total of 9,296 households in Munster, 6,363 (68.4%) are family households, while 2,933 (31.6%) are nonfamily households. The most numerous type of family households are 2-person households, comprising 2,846, and the most common type of nonfamily households are 1-person households, comprising 2,541.
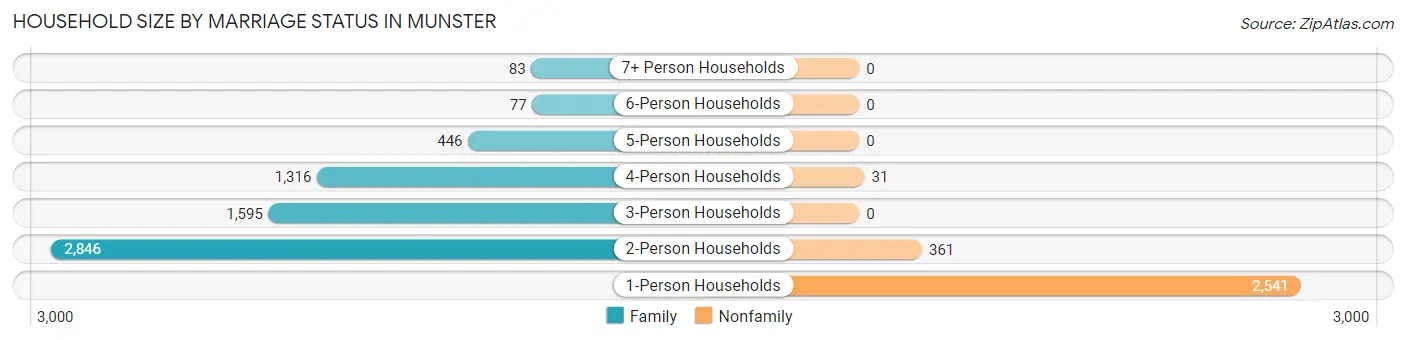
| Household Size | Family Households | Nonfamily Households |
| 1-Person Households | - | 2,541 (27.3%) |
| 2-Person Households | 2,846 (30.6%) | 361 (3.9%) |
| 3-Person Households | 1,595 (17.2%) | 0 (0.0%) |
| 4-Person Households | 1,316 (14.2%) | 31 (0.3%) |
| 5-Person Households | 446 (4.8%) | 0 (0.0%) |
| 6-Person Households | 77 (0.8%) | 0 (0.0%) |
| 7+ Person Households | 83 (0.9%) | 0 (0.0%) |
| Total | 6,363 (68.4%) | 2,933 (31.6%) |
Female Fertility in Munster
Fertility by Age in Munster
Average fertility rate in Munster is 18.0 births per 1,000 women. Women in the age bracket of 20 to 34 years have the highest fertility rate with 23.0 births per 1,000 women. Women in the age bracket of 35 to 50 years acount for 52.0% of all women with births.
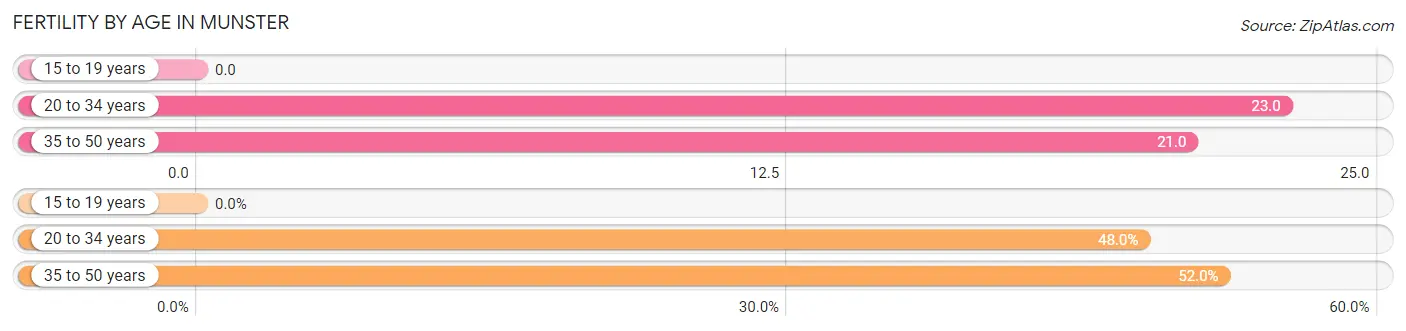
| Age Bracket | Women with Births | Births / 1,000 Women |
| 15 to 19 years | 0 (0.0%) | 0.0 |
| 20 to 34 years | 47 (48.0%) | 23.0 |
| 35 to 50 years | 51 (52.0%) | 21.0 |
| Total | 98 (100.0%) | 18.0 |
Fertility by Age by Marriage Status in Munster
85.7% of women with births (98) in Munster are married. The highest percentage of unmarried women with births falls into 20 to 34 years age bracket with 29.8% of them unmarried at the time of birth, while the lowest percentage of unmarried women with births belong to 35 to 50 years age bracket with 0.0% of them unmarried.
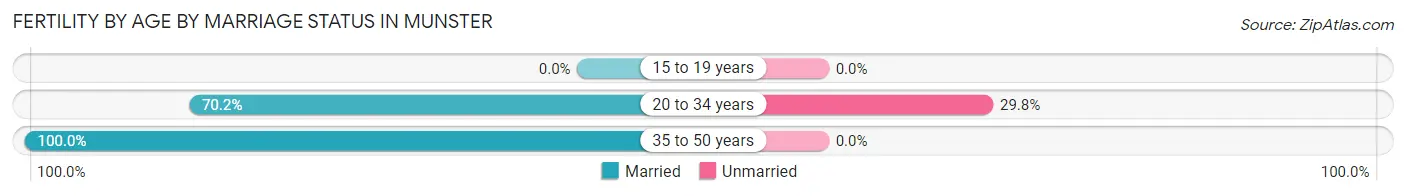
| Age Bracket | Married | Unmarried |
| 15 to 19 years | 0 (0.0%) | 0 (0.0%) |
| 20 to 34 years | 33 (70.2%) | 14 (29.8%) |
| 35 to 50 years | 51 (100.0%) | 0 (0.0%) |
| Total | 84 (85.7%) | 14 (14.3%) |
Fertility by Education in Munster
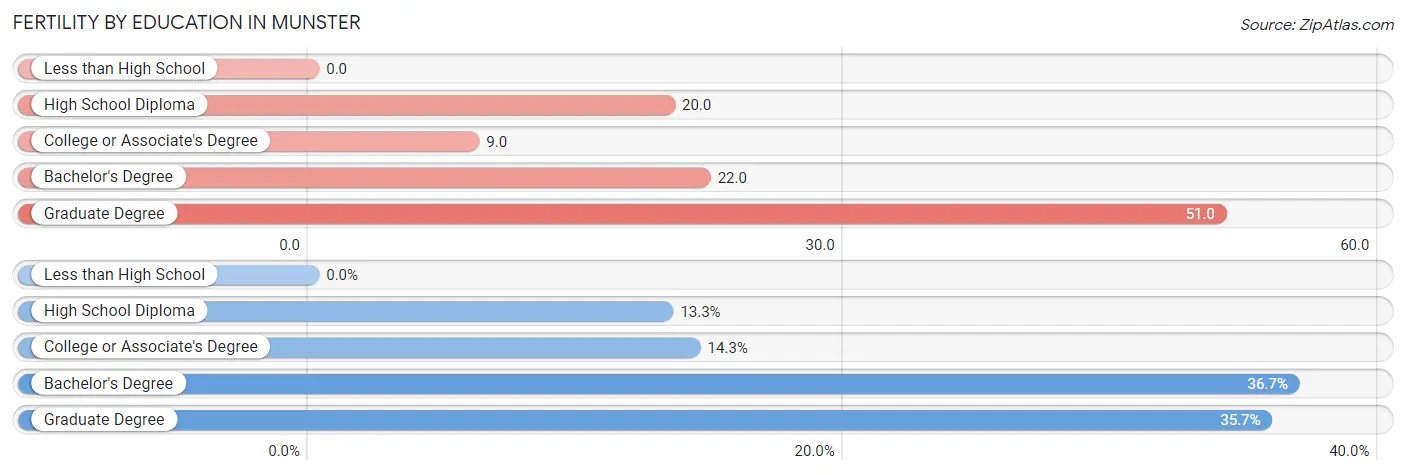
| Educational Attainment | Women with Births | Births / 1,000 Women |
| Less than High School | 0 (0.0%) | 0.0 |
| High School Diploma | 13 (13.3%) | 20.0 |
| College or Associate's Degree | 14 (14.3%) | 9.0 |
| Bachelor's Degree | 36 (36.7%) | 22.0 |
| Graduate Degree | 35 (35.7%) | 51.0 |
| Total | 98 (100.0%) | 18.0 |
Fertility by Education by Marriage Status in Munster
14.3% of women with births in Munster are unmarried. Women with the educational attainment of high school diploma are most likely to be married with 100.0% of them married at childbirth, while women with the educational attainment of college or associate's degree are least likely to be married with 100.0% of them unmarried at childbirth.
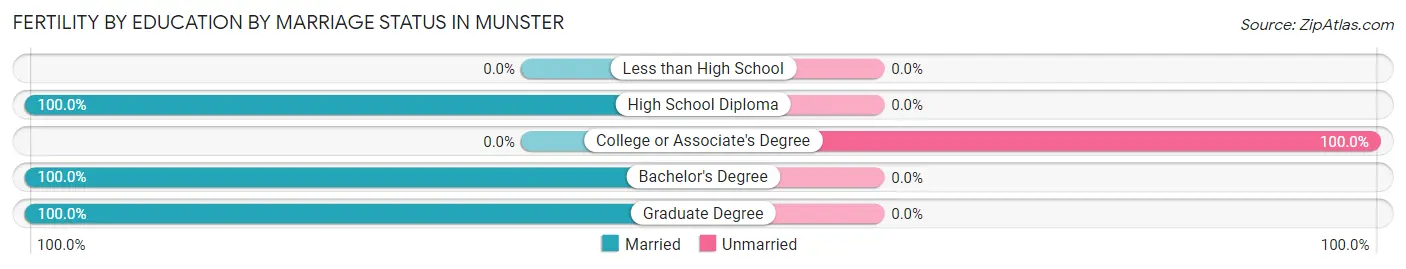
| Educational Attainment | Married | Unmarried |
| Less than High School | 0 (0.0%) | 0 (0.0%) |
| High School Diploma | 13 (100.0%) | 0 (0.0%) |
| College or Associate's Degree | 0 (0.0%) | 14 (100.0%) |
| Bachelor's Degree | 36 (100.0%) | 0 (0.0%) |
| Graduate Degree | 35 (100.0%) | 0 (0.0%) |
| Total | 84 (85.7%) | 14 (14.3%) |
Employment Characteristics in Munster
Employment by Class of Employer in Munster
Among the 11,526 employed individuals in Munster, private company employees (8,222 | 71.3%), not-for-profit organizations (1,060 | 9.2%), and self-employed (incorporated) (749 | 6.5%) make up the most common classes of employment.
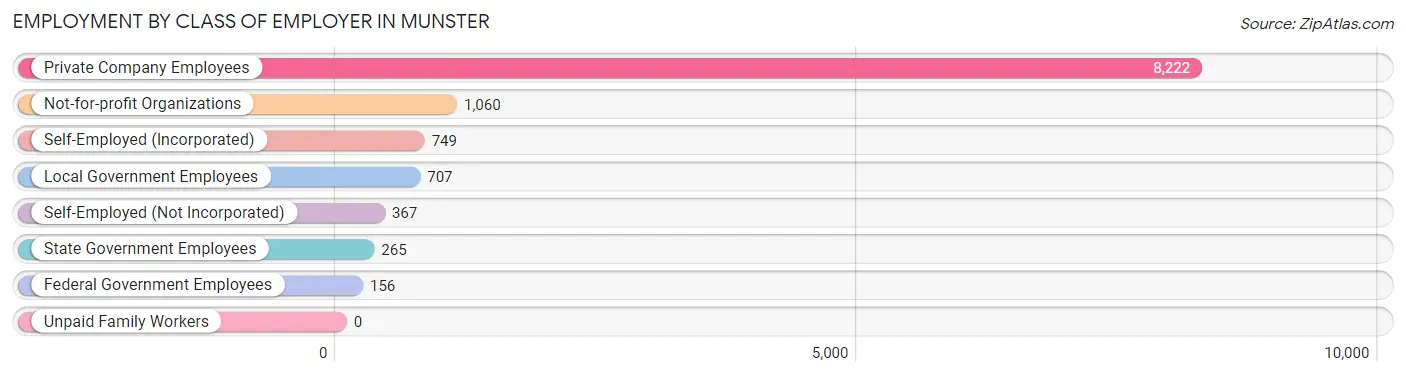
| Employer Class | # Employees | % Employees |
| Private Company Employees | 8,222 | 71.3% |
| Self-Employed (Incorporated) | 749 | 6.5% |
| Self-Employed (Not Incorporated) | 367 | 3.2% |
| Not-for-profit Organizations | 1,060 | 9.2% |
| Local Government Employees | 707 | 6.1% |
| State Government Employees | 265 | 2.3% |
| Federal Government Employees | 156 | 1.3% |
| Unpaid Family Workers | 0 | 0.0% |
| Total | 11,526 | 100.0% |
Employment Status by Age in Munster
According to the labor force statistics for Munster, out of the total population over 16 years of age (19,846), 61.5% or 12,205 individuals are in the labor force, with 3.9% or 476 of them unemployed. The age group with the highest labor force participation rate is 30 to 34 years, with 92.9% or 864 individuals in the labor force. Within the labor force, the 20 to 24 years age range has the highest percentage of unemployed individuals, with 11.7% or 137 of them being unemployed.
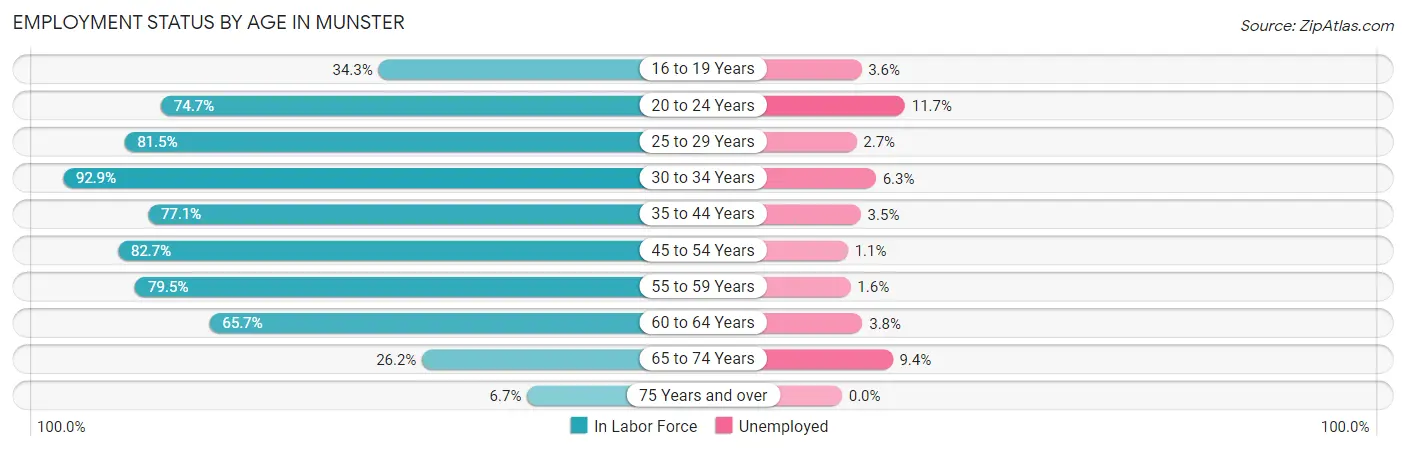
| Age Bracket | In Labor Force | Unemployed |
| 16 to 19 Years | 412 (34.3%) | 15 (3.6%) |
| 20 to 24 Years | 1,174 (74.7%) | 137 (11.7%) |
| 25 to 29 Years | 992 (81.5%) | 27 (2.7%) |
| 30 to 34 Years | 864 (92.9%) | 54 (6.3%) |
| 35 to 44 Years | 2,205 (77.1%) | 77 (3.5%) |
| 45 to 54 Years | 3,084 (82.7%) | 34 (1.1%) |
| 55 to 59 Years | 1,658 (79.5%) | 27 (1.6%) |
| 60 to 64 Years | 1,012 (65.7%) | 38 (3.8%) |
| 65 to 74 Years | 650 (26.2%) | 61 (9.4%) |
| 75 Years and over | 149 (6.7%) | 0 (0.0%) |
| Total | 12,205 (61.5%) | 476 (3.9%) |
Employment Status by Educational Attainment in Munster
According to labor force statistics for Munster, 79.4% of individuals (9,815) out of the total population between 25 and 64 years of age (12,362) are in the labor force, with 2.6% or 255 of them being unemployed. The group with the highest labor force participation rate are those with the educational attainment of bachelor's degree or higher, with 87.8% or 5,489 individuals in the labor force. Within the labor force, individuals with college / associate degree education have the highest percentage of unemployment, with 4.1% or 95 of them being unemployed.
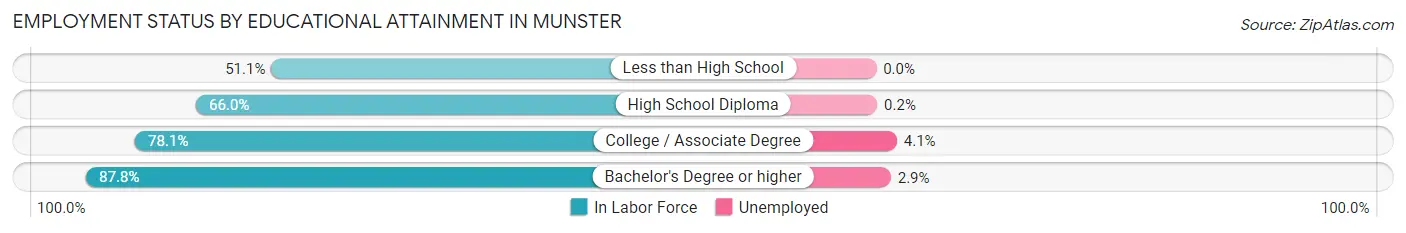
| Educational Attainment | In Labor Force | Unemployed |
| Less than High School | 218 (51.1%) | 0 (0.0%) |
| High School Diploma | 1,790 (66.0%) | 5 (0.2%) |
| College / Associate Degree | 2,320 (78.1%) | 122 (4.1%) |
| Bachelor's Degree or higher | 5,489 (87.8%) | 181 (2.9%) |
| Total | 9,815 (79.4%) | 321 (2.6%) |
Employment Occupations by Sex in Munster
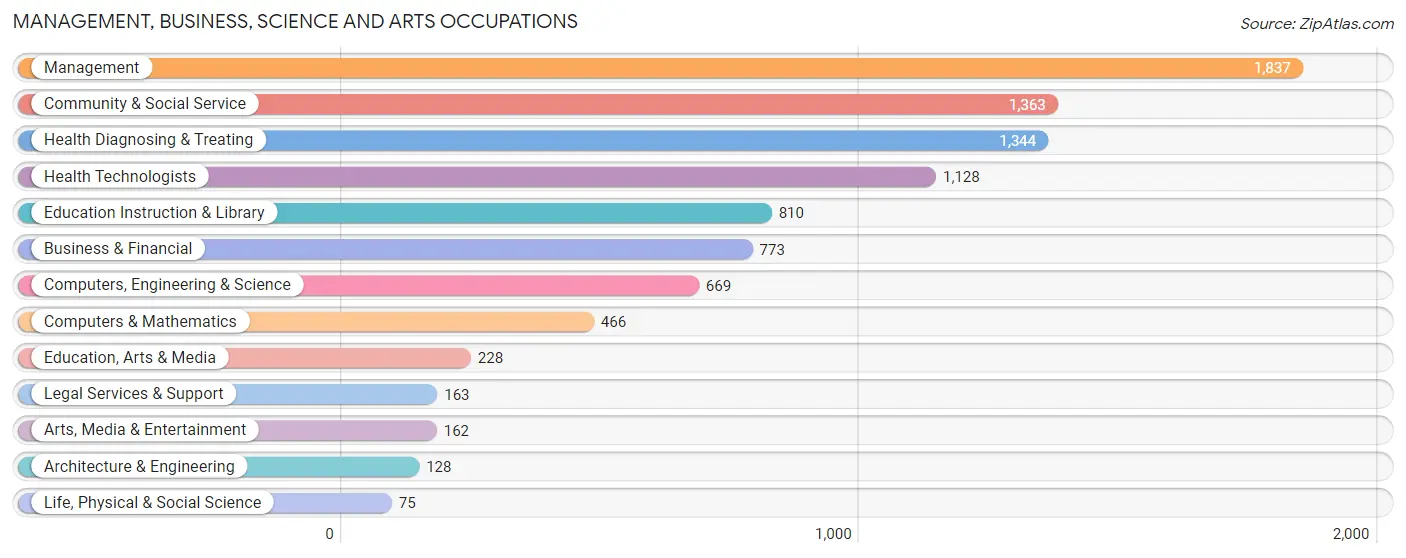
Management, Business, Science and Arts Occupations
The most common Management, Business, Science and Arts occupations in Munster are Management (1,837 | 15.7%), Community & Social Service (1,363 | 11.6%), Health Diagnosing & Treating (1,344 | 11.5%), Health Technologists (1,128 | 9.6%), and Education Instruction & Library (810 | 6.9%).
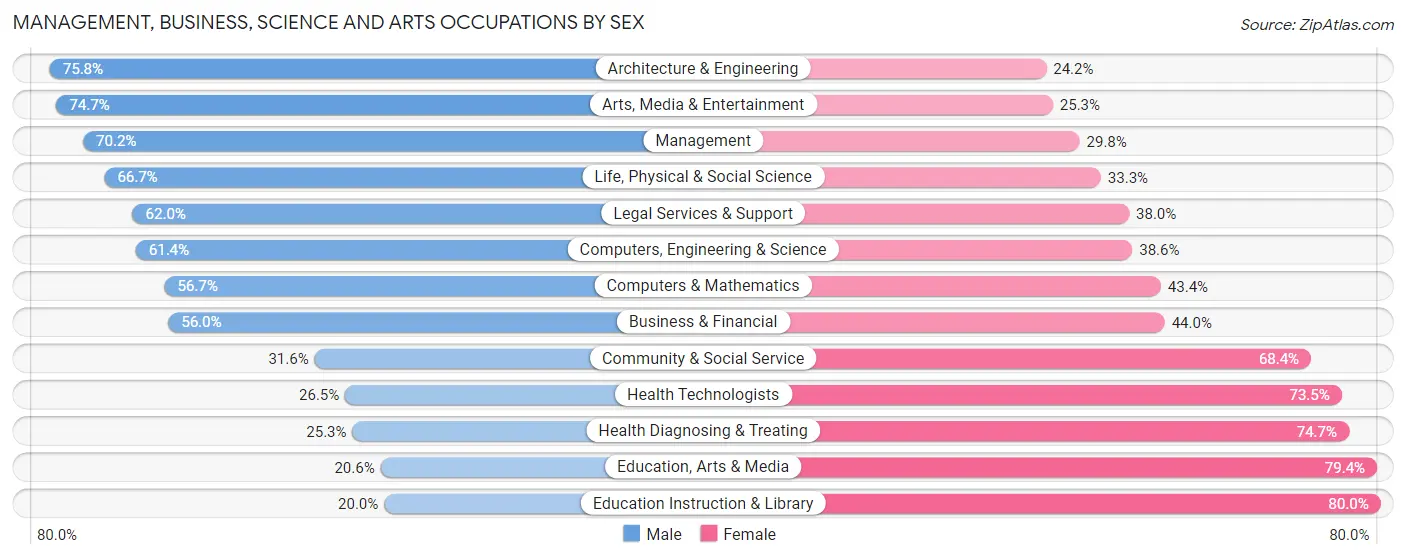
Management, Business, Science and Arts Occupations by Sex
Within the Management, Business, Science and Arts occupations in Munster, the most male-oriented occupations are Architecture & Engineering (75.8%), Arts, Media & Entertainment (74.7%), and Management (70.2%), while the most female-oriented occupations are Education Instruction & Library (80.0%), Education, Arts & Media (79.4%), and Health Diagnosing & Treating (74.7%).
| Occupation | Male | Female |
| Management | 1,290 (70.2%) | 547 (29.8%) |
| Business & Financial | 433 (56.0%) | 340 (44.0%) |
| Computers, Engineering & Science | 411 (61.4%) | 258 (38.6%) |
| Computers & Mathematics | 264 (56.7%) | 202 (43.3%) |
| Architecture & Engineering | 97 (75.8%) | 31 (24.2%) |
| Life, Physical & Social Science | 50 (66.7%) | 25 (33.3%) |
| Community & Social Service | 431 (31.6%) | 932 (68.4%) |
| Education, Arts & Media | 47 (20.6%) | 181 (79.4%) |
| Legal Services & Support | 101 (62.0%) | 62 (38.0%) |
| Education Instruction & Library | 162 (20.0%) | 648 (80.0%) |
| Arts, Media & Entertainment | 121 (74.7%) | 41 (25.3%) |
| Health Diagnosing & Treating | 340 (25.3%) | 1,004 (74.7%) |
| Health Technologists | 299 (26.5%) | 829 (73.5%) |
| Total (Category) | 2,905 (48.5%) | 3,081 (51.5%) |
| Total (Overall) | 5,959 (50.8%) | 5,771 (49.2%) |
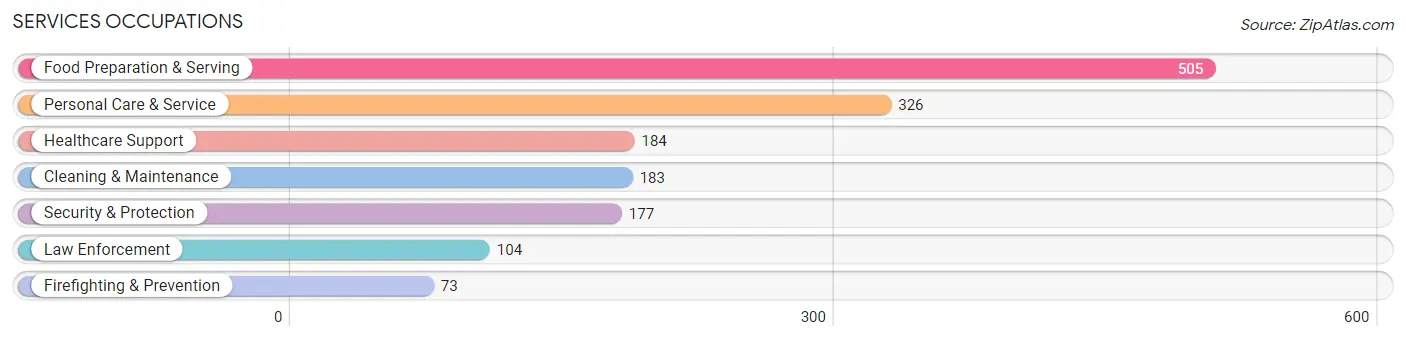
Services Occupations
The most common Services occupations in Munster are Food Preparation & Serving (505 | 4.3%), Personal Care & Service (326 | 2.8%), Healthcare Support (184 | 1.6%), Cleaning & Maintenance (183 | 1.6%), and Security & Protection (177 | 1.5%).
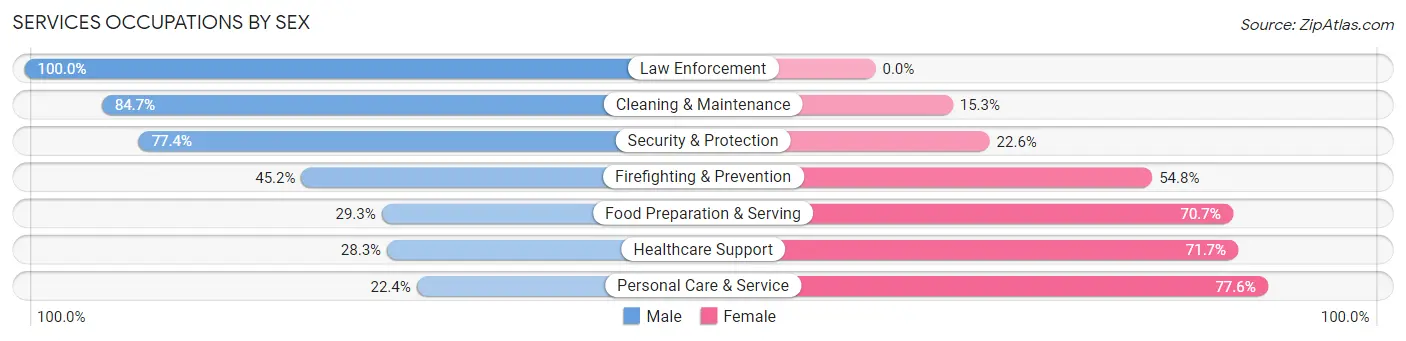
Services Occupations by Sex
Within the Services occupations in Munster, the most male-oriented occupations are Law Enforcement (100.0%), Cleaning & Maintenance (84.7%), and Security & Protection (77.4%), while the most female-oriented occupations are Personal Care & Service (77.6%), Healthcare Support (71.7%), and Food Preparation & Serving (70.7%).
| Occupation | Male | Female |
| Healthcare Support | 52 (28.3%) | 132 (71.7%) |
| Security & Protection | 137 (77.4%) | 40 (22.6%) |
| Firefighting & Prevention | 33 (45.2%) | 40 (54.8%) |
| Law Enforcement | 104 (100.0%) | 0 (0.0%) |
| Food Preparation & Serving | 148 (29.3%) | 357 (70.7%) |
| Cleaning & Maintenance | 155 (84.7%) | 28 (15.3%) |
| Personal Care & Service | 73 (22.4%) | 253 (77.6%) |
| Total (Category) | 565 (41.1%) | 810 (58.9%) |
| Total (Overall) | 5,959 (50.8%) | 5,771 (49.2%) |
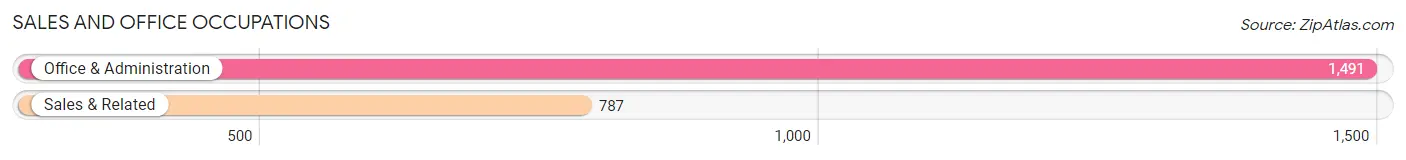
Sales and Office Occupations
The most common Sales and Office occupations in Munster are Office & Administration (1,491 | 12.7%), and Sales & Related (787 | 6.7%).
Sales and Office Occupations by Sex
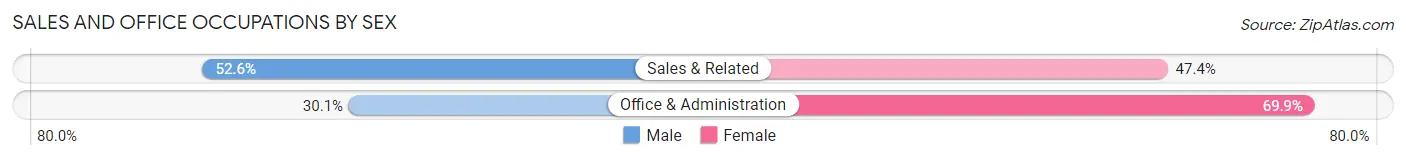
| Occupation | Male | Female |
| Sales & Related | 414 (52.6%) | 373 (47.4%) |
| Office & Administration | 449 (30.1%) | 1,042 (69.9%) |
| Total (Category) | 863 (37.9%) | 1,415 (62.1%) |
| Total (Overall) | 5,959 (50.8%) | 5,771 (49.2%) |
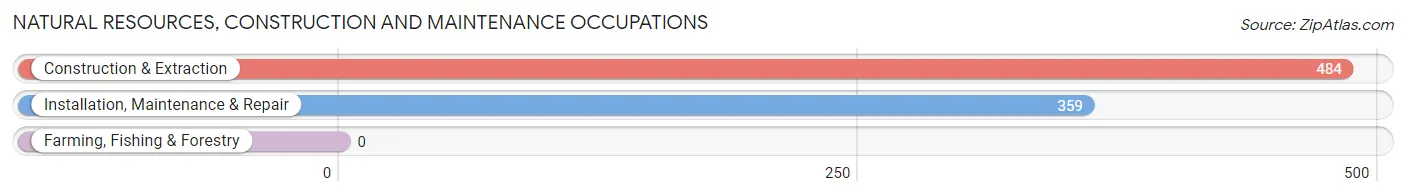
Natural Resources, Construction and Maintenance Occupations
The most common Natural Resources, Construction and Maintenance occupations in Munster are Construction & Extraction (484 | 4.1%), and Installation, Maintenance & Repair (359 | 3.1%).
Natural Resources, Construction and Maintenance Occupations by Sex
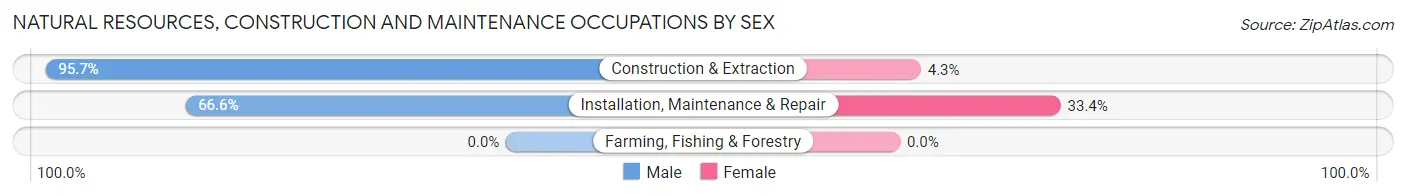
| Occupation | Male | Female |
| Farming, Fishing & Forestry | 0 (0.0%) | 0 (0.0%) |
| Construction & Extraction | 463 (95.7%) | 21 (4.3%) |
| Installation, Maintenance & Repair | 239 (66.6%) | 120 (33.4%) |
| Total (Category) | 702 (83.3%) | 141 (16.7%) |
| Total (Overall) | 5,959 (50.8%) | 5,771 (49.2%) |
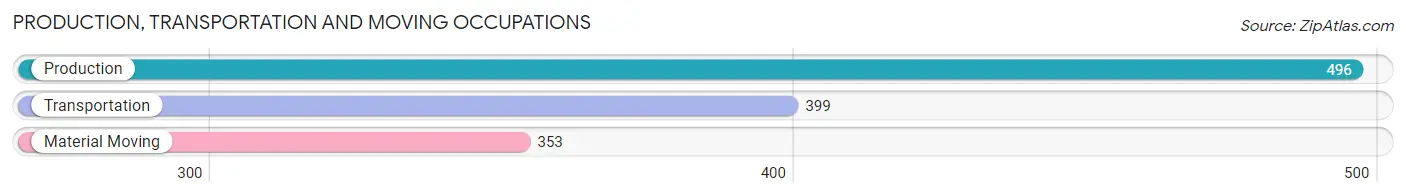
Production, Transportation and Moving Occupations
The most common Production, Transportation and Moving occupations in Munster are Production (496 | 4.2%), Transportation (399 | 3.4%), and Material Moving (353 | 3.0%).
Production, Transportation and Moving Occupations by Sex
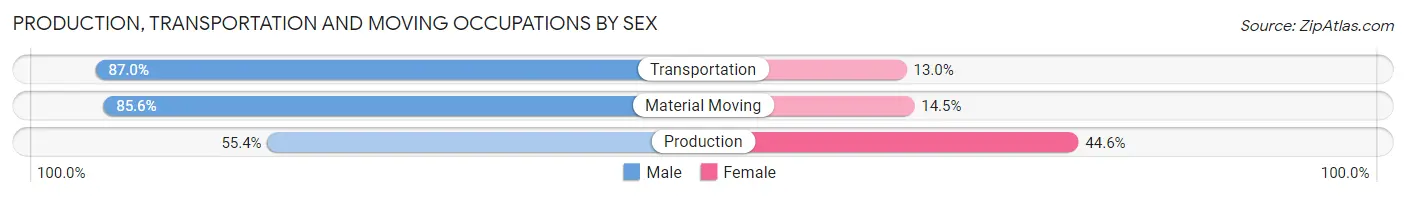
| Occupation | Male | Female |
| Production | 275 (55.4%) | 221 (44.6%) |
| Transportation | 347 (87.0%) | 52 (13.0%) |
| Material Moving | 302 (85.6%) | 51 (14.4%) |
| Total (Category) | 924 (74.0%) | 324 (26.0%) |
| Total (Overall) | 5,959 (50.8%) | 5,771 (49.2%) |
Employment Industries by Sex in Munster
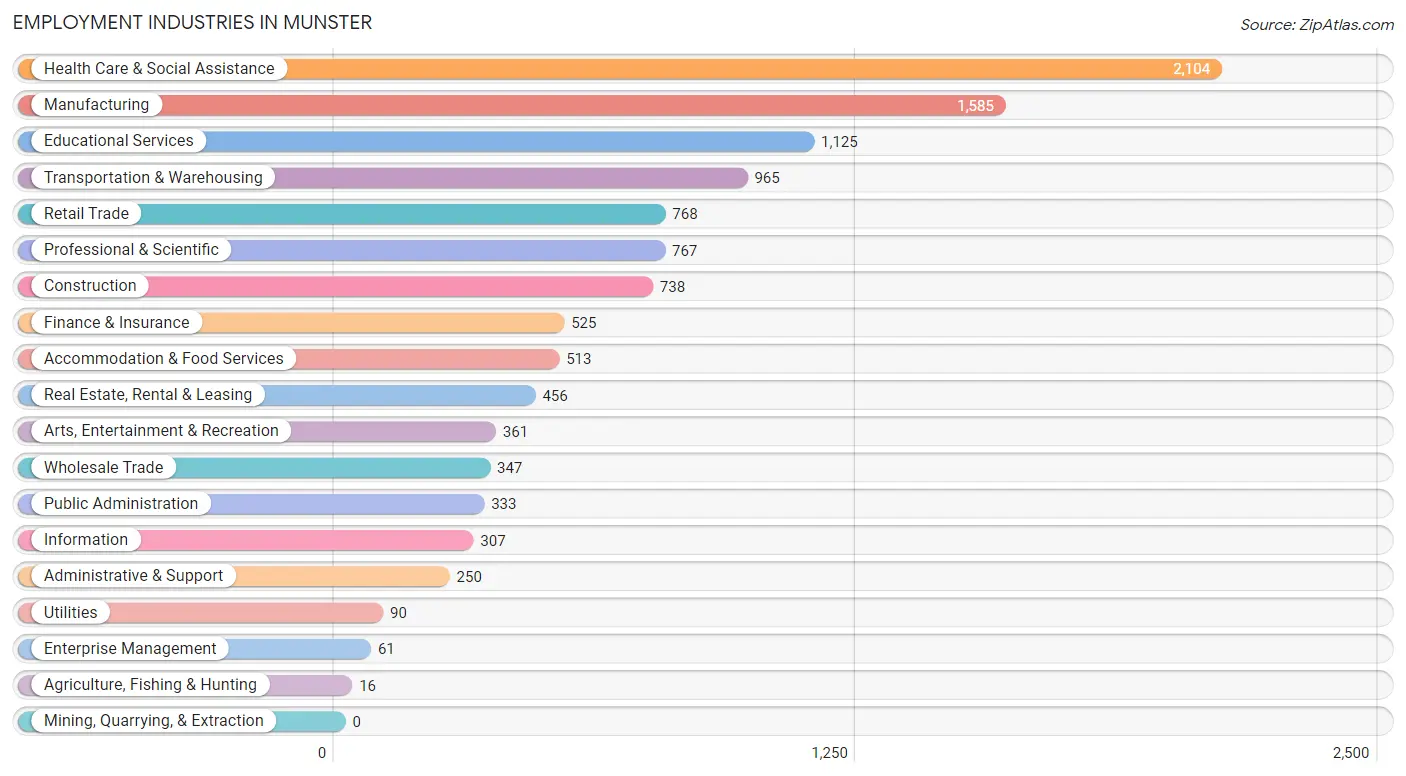
Employment Industries in Munster
The major employment industries in Munster include Health Care & Social Assistance (2,104 | 17.9%), Manufacturing (1,585 | 13.5%), Educational Services (1,125 | 9.6%), Transportation & Warehousing (965 | 8.2%), and Retail Trade (768 | 6.6%).
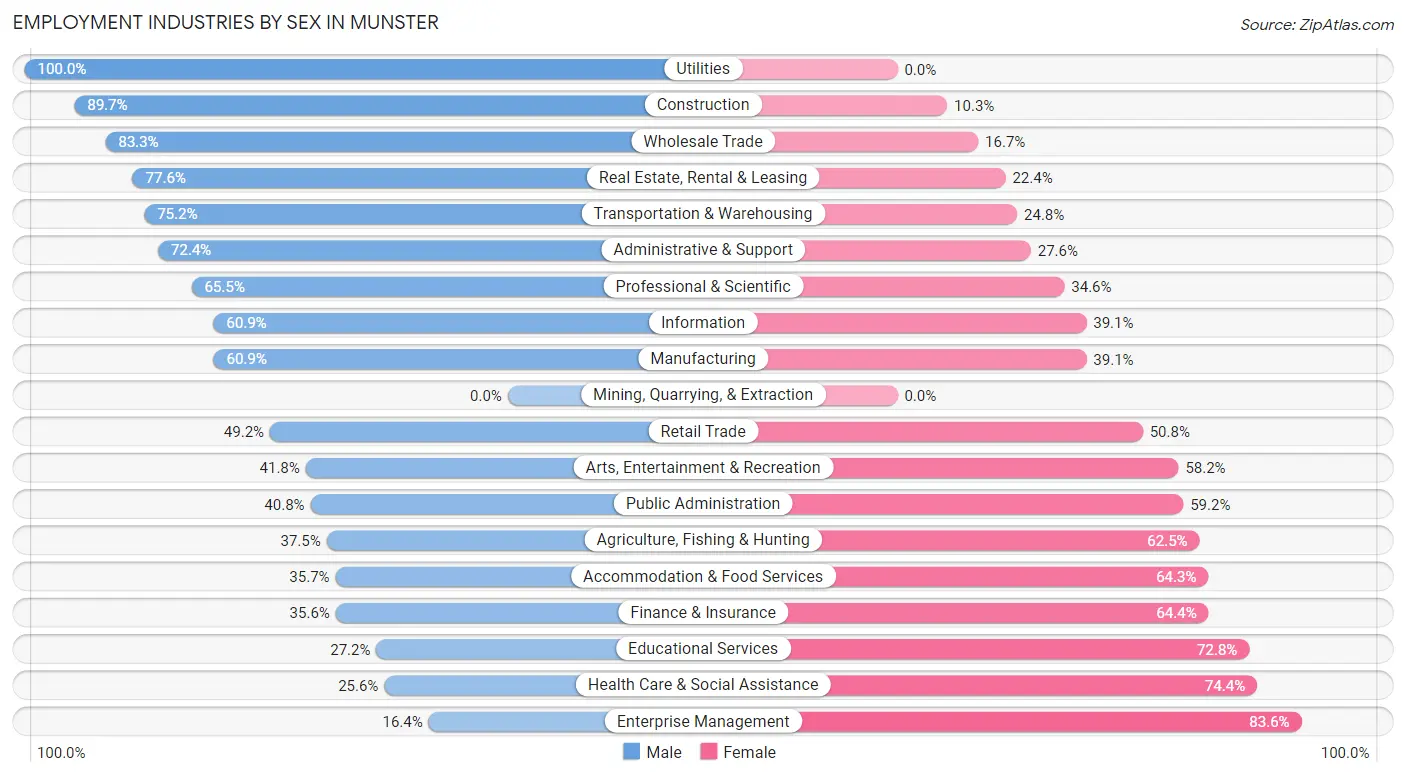
Employment Industries by Sex in Munster
The Munster industries that see more men than women are Utilities (100.0%), Construction (89.7%), and Wholesale Trade (83.3%), whereas the industries that tend to have a higher number of women are Enterprise Management (83.6%), Health Care & Social Assistance (74.4%), and Educational Services (72.8%).
| Industry | Male | Female |
| Agriculture, Fishing & Hunting | 6 (37.5%) | 10 (62.5%) |
| Mining, Quarrying, & Extraction | 0 (0.0%) | 0 (0.0%) |
| Construction | 662 (89.7%) | 76 (10.3%) |
| Manufacturing | 965 (60.9%) | 620 (39.1%) |
| Wholesale Trade | 289 (83.3%) | 58 (16.7%) |
| Retail Trade | 378 (49.2%) | 390 (50.8%) |
| Transportation & Warehousing | 726 (75.2%) | 239 (24.8%) |
| Utilities | 90 (100.0%) | 0 (0.0%) |
| Information | 187 (60.9%) | 120 (39.1%) |
| Finance & Insurance | 187 (35.6%) | 338 (64.4%) |
| Real Estate, Rental & Leasing | 354 (77.6%) | 102 (22.4%) |
| Professional & Scientific | 502 (65.4%) | 265 (34.5%) |
| Enterprise Management | 10 (16.4%) | 51 (83.6%) |
| Administrative & Support | 181 (72.4%) | 69 (27.6%) |
| Educational Services | 306 (27.2%) | 819 (72.8%) |
| Health Care & Social Assistance | 538 (25.6%) | 1,566 (74.4%) |
| Arts, Entertainment & Recreation | 151 (41.8%) | 210 (58.2%) |
| Accommodation & Food Services | 183 (35.7%) | 330 (64.3%) |
| Public Administration | 136 (40.8%) | 197 (59.2%) |
| Total | 5,959 (50.8%) | 5,771 (49.2%) |
Education in Munster
School Enrollment in Munster
The most common levels of schooling among the 5,495 students in Munster are college / undergraduate (1,438 | 26.2%), high school (1,355 | 24.7%), and middle school (891 | 16.2%).
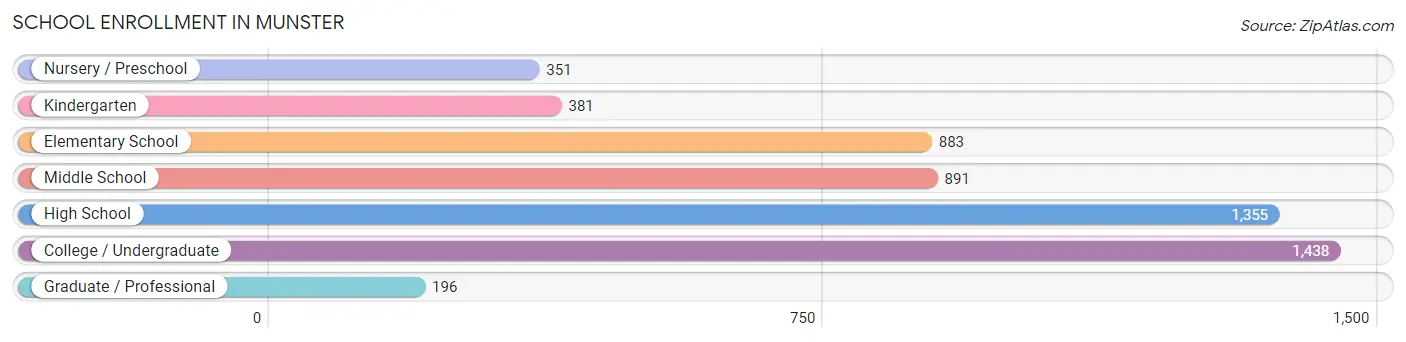
| School Level | # Students | % Students |
| Nursery / Preschool | 351 | 6.4% |
| Kindergarten | 381 | 6.9% |
| Elementary School | 883 | 16.1% |
| Middle School | 891 | 16.2% |
| High School | 1,355 | 24.7% |
| College / Undergraduate | 1,438 | 26.2% |
| Graduate / Professional | 196 | 3.6% |
| Total | 5,495 | 100.0% |
School Enrollment by Age by Funding Source in Munster
Out of a total of 5,495 students who are enrolled in schools in Munster, 681 (12.4%) attend a private institution, while the remaining 4,814 (87.6%) are enrolled in public schools. The age group of 3 to 4 year olds has the highest likelihood of being enrolled in private schools, with 101 (40.1% in the age bracket) enrolled. Conversely, the age group of 18 to 19 year olds has the lowest likelihood of being enrolled in a private school, with 524 (96.3% in the age bracket) attending a public institution.
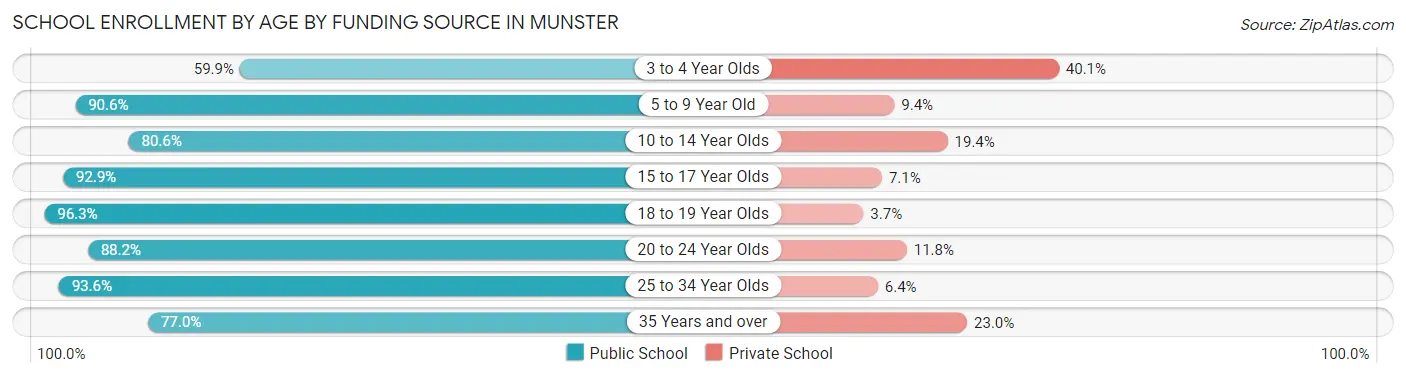
| Age Bracket | Public School | Private School |
| 3 to 4 Year Olds | 151 (59.9%) | 101 (40.1%) |
| 5 to 9 Year Old | 1,151 (90.6%) | 120 (9.4%) |
| 10 to 14 Year Olds | 883 (80.6%) | 212 (19.4%) |
| 15 to 17 Year Olds | 949 (92.9%) | 73 (7.1%) |
| 18 to 19 Year Olds | 524 (96.3%) | 20 (3.7%) |
| 20 to 24 Year Olds | 698 (88.2%) | 93 (11.8%) |
| 25 to 34 Year Olds | 324 (93.6%) | 22 (6.4%) |
| 35 Years and over | 134 (77.0%) | 40 (23.0%) |
| Total | 4,814 (87.6%) | 681 (12.4%) |
Educational Attainment by Field of Study in Munster
Business (2,335 | 26.6%), science & technology (1,255 | 14.3%), education (1,153 | 13.2%), engineering (486 | 5.5%), and social sciences (482 | 5.5%) are the most common fields of study among 8,766 individuals in Munster who have obtained a bachelor's degree or higher.
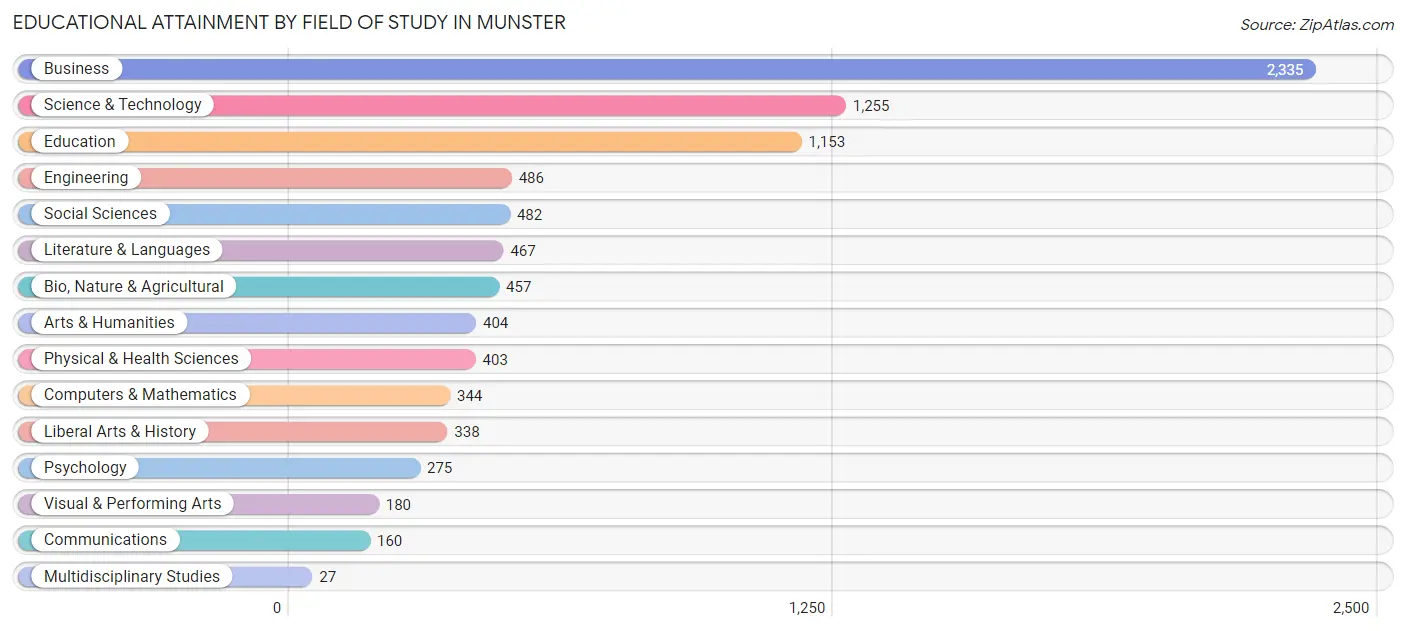
| Field of Study | # Graduates | % Graduates |
| Computers & Mathematics | 344 | 3.9% |
| Bio, Nature & Agricultural | 457 | 5.2% |
| Physical & Health Sciences | 403 | 4.6% |
| Psychology | 275 | 3.1% |
| Social Sciences | 482 | 5.5% |
| Engineering | 486 | 5.5% |
| Multidisciplinary Studies | 27 | 0.3% |
| Science & Technology | 1,255 | 14.3% |
| Business | 2,335 | 26.6% |
| Education | 1,153 | 13.2% |
| Literature & Languages | 467 | 5.3% |
| Liberal Arts & History | 338 | 3.9% |
| Visual & Performing Arts | 180 | 2.1% |
| Communications | 160 | 1.8% |
| Arts & Humanities | 404 | 4.6% |
| Total | 8,766 | 100.0% |
Transportation & Commute in Munster
Vehicle Availability by Sex in Munster
The most prevalent vehicle ownership categories in Munster are males with 2 vehicles (2,936, accounting for 49.5%) and females with 2 vehicles (2,603, making up 52.5%).
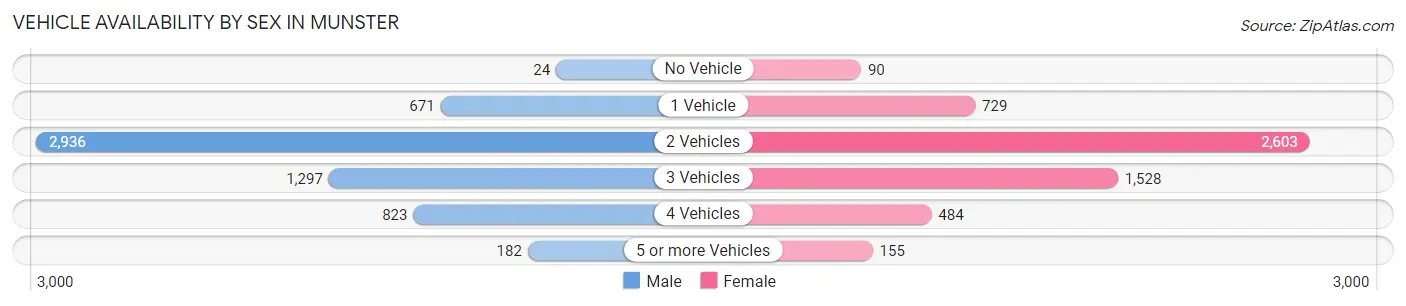
| Vehicles Available | Male | Female |
| No Vehicle | 24 (0.4%) | 90 (1.6%) |
| 1 Vehicle | 671 (11.3%) | 729 (13.0%) |
| 2 Vehicles | 2,936 (49.5%) | 2,603 (46.6%) |
| 3 Vehicles | 1,297 (21.9%) | 1,528 (27.3%) |
| 4 Vehicles | 823 (13.9%) | 484 (8.7%) |
| 5 or more Vehicles | 182 (3.1%) | 155 (2.8%) |
| Total | 5,933 (100.0%) | 5,589 (100.0%) |
Commute Time in Munster
The most frequently occuring commute durations in Munster are 5 to 9 minutes (1,431 commuters, 13.9%), 10 to 14 minutes (1,364 commuters, 13.2%), and 15 to 19 minutes (1,210 commuters, 11.7%).
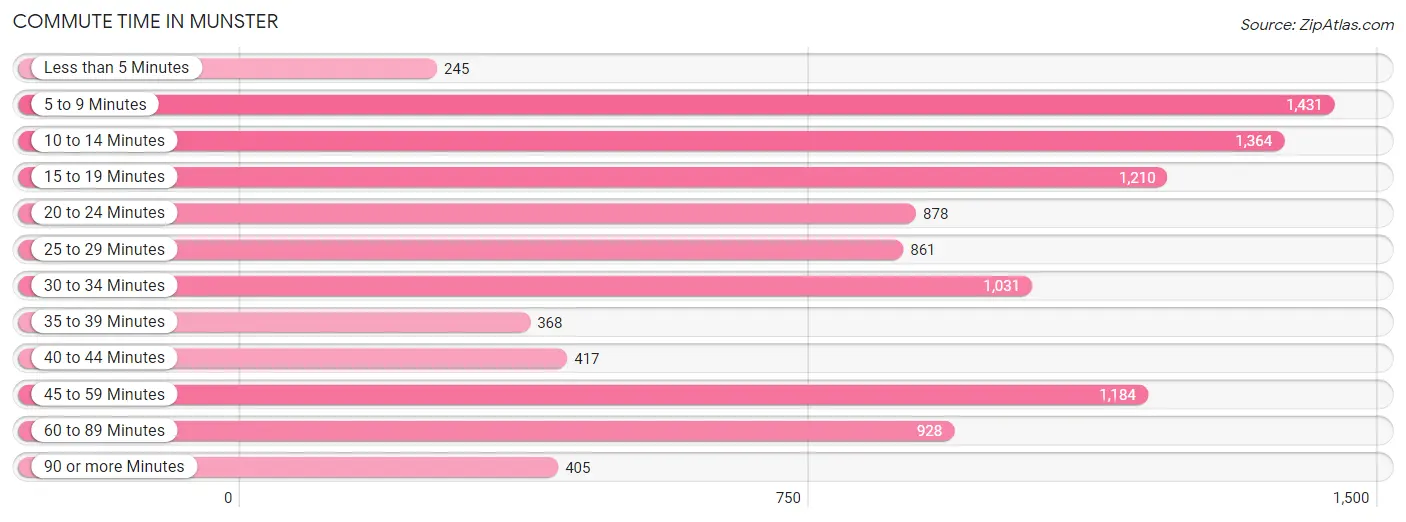
| Commute Time | # Commuters | % Commuters |
| Less than 5 Minutes | 245 | 2.4% |
| 5 to 9 Minutes | 1,431 | 13.9% |
| 10 to 14 Minutes | 1,364 | 13.2% |
| 15 to 19 Minutes | 1,210 | 11.7% |
| 20 to 24 Minutes | 878 | 8.5% |
| 25 to 29 Minutes | 861 | 8.3% |
| 30 to 34 Minutes | 1,031 | 10.0% |
| 35 to 39 Minutes | 368 | 3.6% |
| 40 to 44 Minutes | 417 | 4.0% |
| 45 to 59 Minutes | 1,184 | 11.5% |
| 60 to 89 Minutes | 928 | 9.0% |
| 90 or more Minutes | 405 | 3.9% |
Commute Time by Sex in Munster
The most common commute times in Munster are 45 to 59 minutes (715 commuters, 13.4%) for males and 10 to 14 minutes (882 commuters, 17.7%) for females.
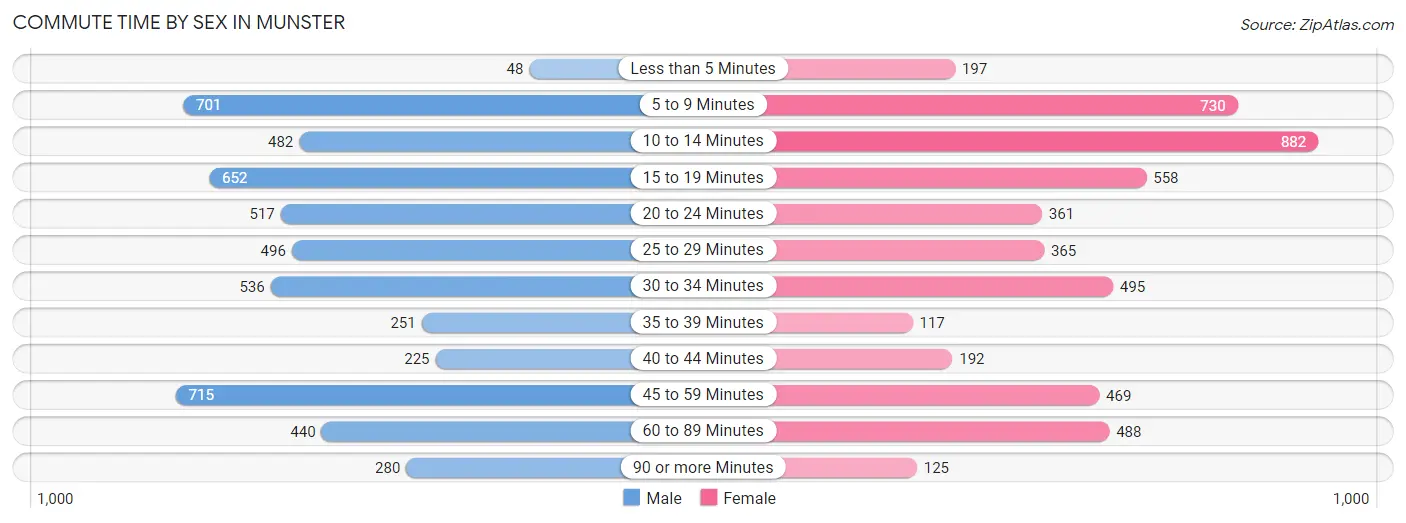
| Commute Time | Male | Female |
| Less than 5 Minutes | 48 (0.9%) | 197 (4.0%) |
| 5 to 9 Minutes | 701 (13.1%) | 730 (14.7%) |
| 10 to 14 Minutes | 482 (9.0%) | 882 (17.7%) |
| 15 to 19 Minutes | 652 (12.2%) | 558 (11.2%) |
| 20 to 24 Minutes | 517 (9.7%) | 361 (7.2%) |
| 25 to 29 Minutes | 496 (9.3%) | 365 (7.3%) |
| 30 to 34 Minutes | 536 (10.0%) | 495 (9.9%) |
| 35 to 39 Minutes | 251 (4.7%) | 117 (2.4%) |
| 40 to 44 Minutes | 225 (4.2%) | 192 (3.9%) |
| 45 to 59 Minutes | 715 (13.4%) | 469 (9.4%) |
| 60 to 89 Minutes | 440 (8.2%) | 488 (9.8%) |
| 90 or more Minutes | 280 (5.2%) | 125 (2.5%) |
Time of Departure to Work by Sex in Munster
The most frequent times of departure to work in Munster are 7:00 AM to 7:29 AM (768, 14.4%) for males and 7:00 AM to 7:29 AM (744, 14.9%) for females.
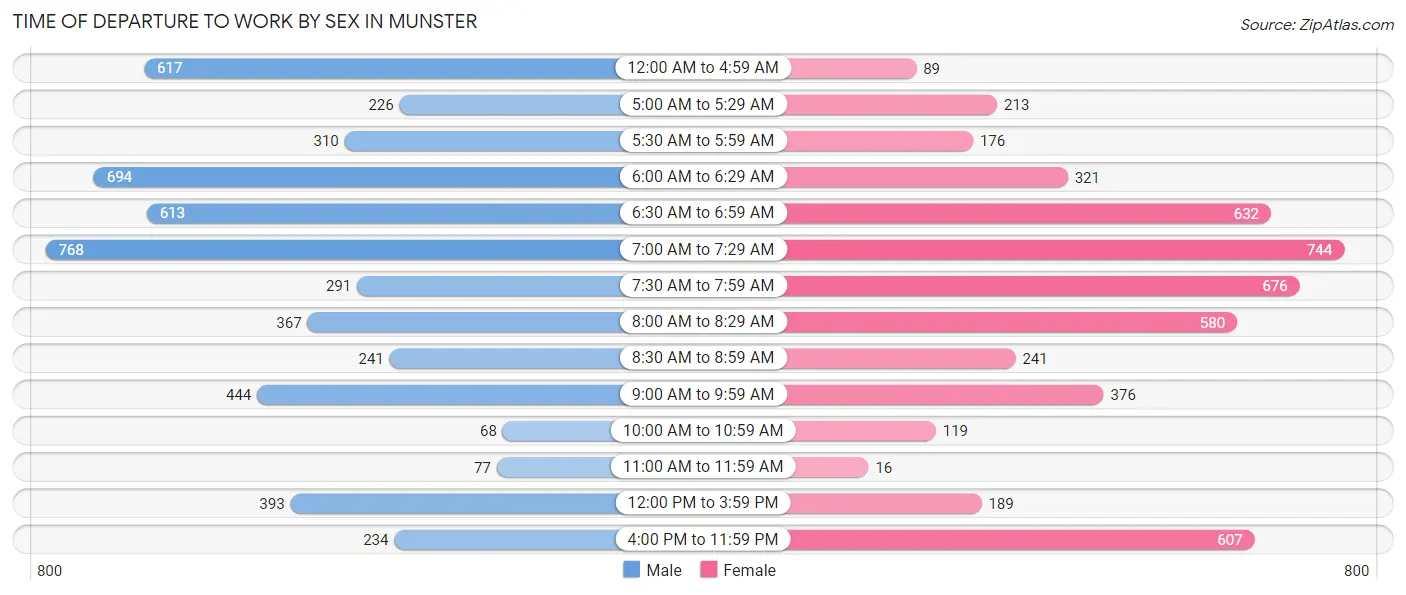
| Time of Departure | Male | Female |
| 12:00 AM to 4:59 AM | 617 (11.6%) | 89 (1.8%) |
| 5:00 AM to 5:29 AM | 226 (4.2%) | 213 (4.3%) |
| 5:30 AM to 5:59 AM | 310 (5.8%) | 176 (3.5%) |
| 6:00 AM to 6:29 AM | 694 (13.0%) | 321 (6.5%) |
| 6:30 AM to 6:59 AM | 613 (11.5%) | 632 (12.7%) |
| 7:00 AM to 7:29 AM | 768 (14.4%) | 744 (14.9%) |
| 7:30 AM to 7:59 AM | 291 (5.4%) | 676 (13.6%) |
| 8:00 AM to 8:29 AM | 367 (6.9%) | 580 (11.7%) |
| 8:30 AM to 8:59 AM | 241 (4.5%) | 241 (4.8%) |
| 9:00 AM to 9:59 AM | 444 (8.3%) | 376 (7.5%) |
| 10:00 AM to 10:59 AM | 68 (1.3%) | 119 (2.4%) |
| 11:00 AM to 11:59 AM | 77 (1.4%) | 16 (0.3%) |
| 12:00 PM to 3:59 PM | 393 (7.4%) | 189 (3.8%) |
| 4:00 PM to 11:59 PM | 234 (4.4%) | 607 (12.2%) |
| Total | 5,343 (100.0%) | 4,979 (100.0%) |
Housing Occupancy in Munster
Occupancy by Ownership in Munster
Of the total 9,296 dwellings in Munster, owner-occupied units account for 8,044 (86.5%), while renter-occupied units make up 1,252 (13.5%).
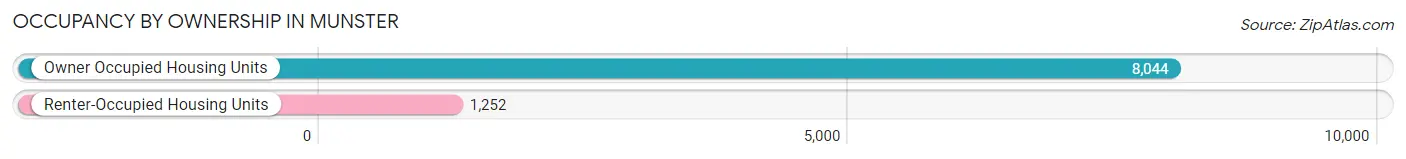
| Occupancy | # Housing Units | % Housing Units |
| Owner Occupied Housing Units | 8,044 | 86.5% |
| Renter-Occupied Housing Units | 1,252 | 13.5% |
| Total Occupied Housing Units | 9,296 | 100.0% |
Occupancy by Household Size in Munster
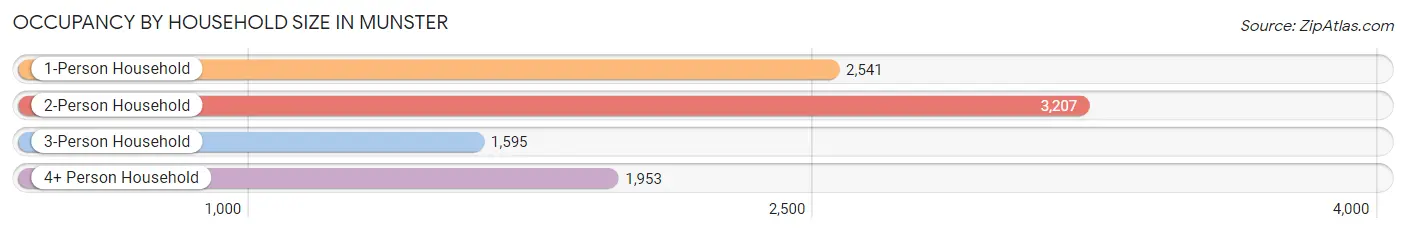
| Household Size | # Housing Units | % Housing Units |
| 1-Person Household | 2,541 | 27.3% |
| 2-Person Household | 3,207 | 34.5% |
| 3-Person Household | 1,595 | 17.2% |
| 4+ Person Household | 1,953 | 21.0% |
| Total Housing Units | 9,296 | 100.0% |
Occupancy by Ownership by Household Size in Munster
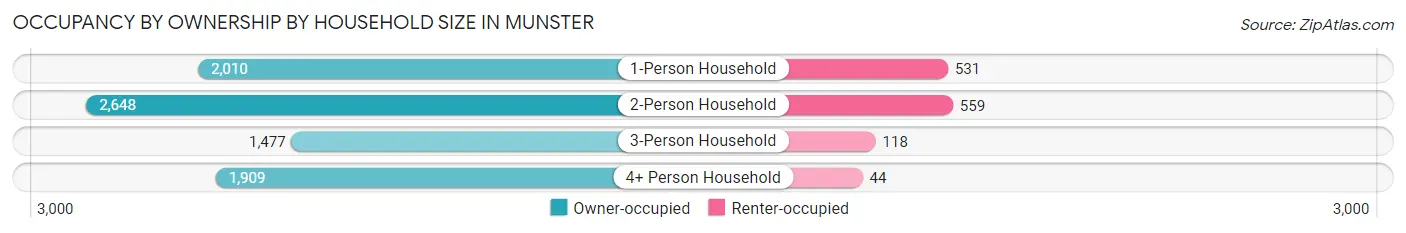
| Household Size | Owner-occupied | Renter-occupied |
| 1-Person Household | 2,010 (79.1%) | 531 (20.9%) |
| 2-Person Household | 2,648 (82.6%) | 559 (17.4%) |
| 3-Person Household | 1,477 (92.6%) | 118 (7.4%) |
| 4+ Person Household | 1,909 (97.8%) | 44 (2.2%) |
| Total Housing Units | 8,044 (86.5%) | 1,252 (13.5%) |
Occupancy by Educational Attainment in Munster
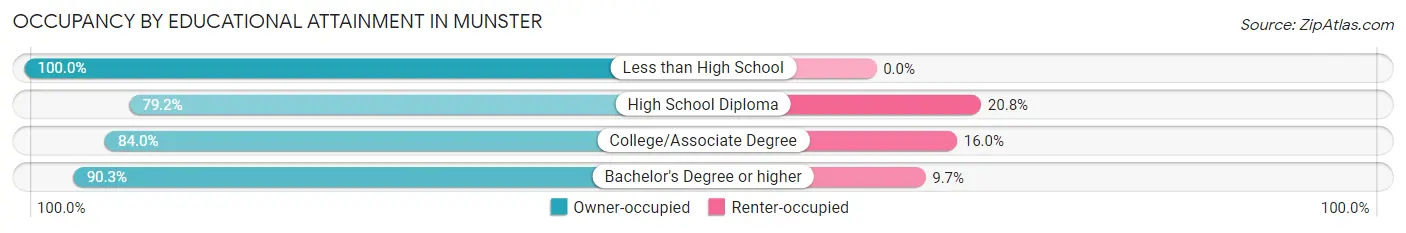
| Household Size | Owner-occupied | Renter-occupied |
| Less than High School | 186 (100.0%) | 0 (0.0%) |
| High School Diploma | 1,637 (79.2%) | 429 (20.8%) |
| College/Associate Degree | 1,845 (84.0%) | 351 (16.0%) |
| Bachelor's Degree or higher | 4,376 (90.3%) | 472 (9.7%) |
Occupancy by Age of Householder in Munster
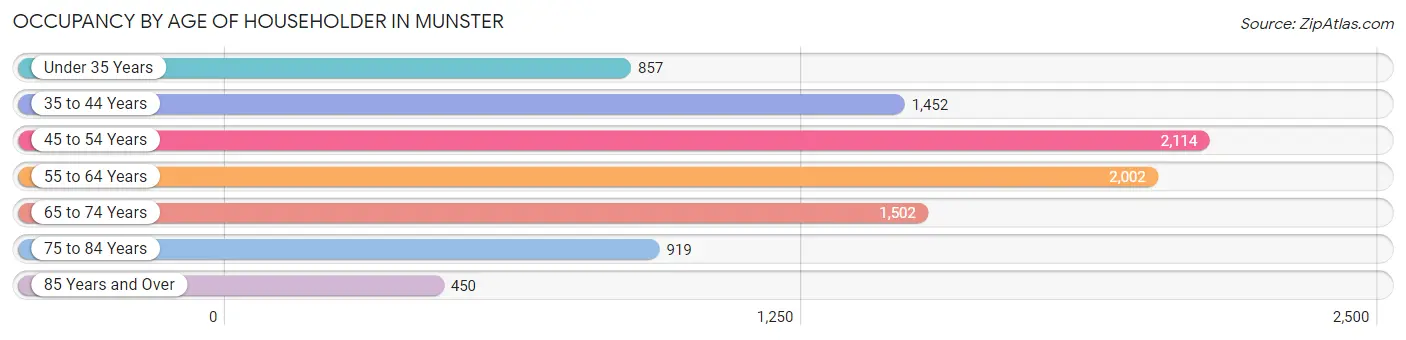
| Age Bracket | # Households | % Households |
| Under 35 Years | 857 | 9.2% |
| 35 to 44 Years | 1,452 | 15.6% |
| 45 to 54 Years | 2,114 | 22.7% |
| 55 to 64 Years | 2,002 | 21.5% |
| 65 to 74 Years | 1,502 | 16.2% |
| 75 to 84 Years | 919 | 9.9% |
| 85 Years and Over | 450 | 4.8% |
| Total | 9,296 | 100.0% |
Housing Finances in Munster
Median Income by Occupancy in Munster
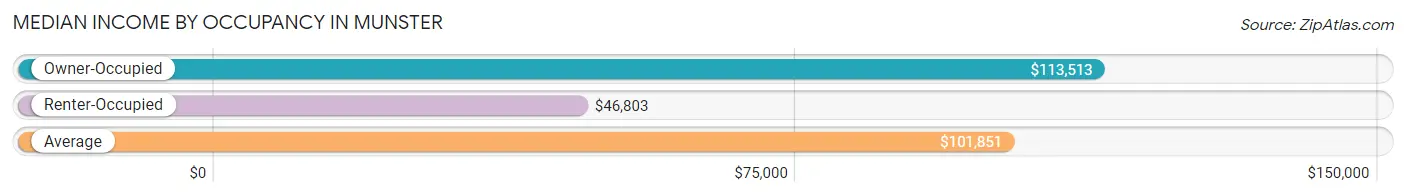
| Occupancy Type | # Households | Median Income |
| Owner-Occupied | 8,044 (86.5%) | $113,513 |
| Renter-Occupied | 1,252 (13.5%) | $46,803 |
| Average | 9,296 (100.0%) | $101,851 |
Occupancy by Householder Income Bracket in Munster
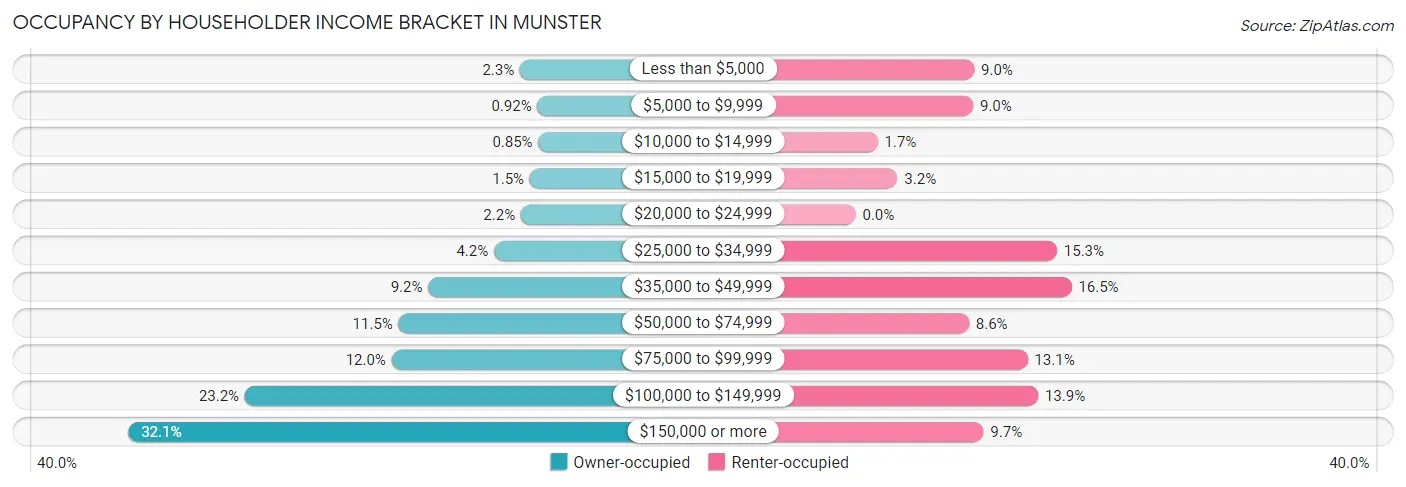
| Income Bracket | Owner-occupied | Renter-occupied |
| Less than $5,000 | 181 (2.2%) | 113 (9.0%) |
| $5,000 to $9,999 | 74 (0.9%) | 112 (8.9%) |
| $10,000 to $14,999 | 68 (0.9%) | 21 (1.7%) |
| $15,000 to $19,999 | 121 (1.5%) | 40 (3.2%) |
| $20,000 to $24,999 | 175 (2.2%) | 0 (0.0%) |
| $25,000 to $34,999 | 340 (4.2%) | 192 (15.3%) |
| $35,000 to $49,999 | 743 (9.2%) | 206 (16.5%) |
| $50,000 to $74,999 | 925 (11.5%) | 108 (8.6%) |
| $75,000 to $99,999 | 968 (12.0%) | 164 (13.1%) |
| $100,000 to $149,999 | 1,867 (23.2%) | 174 (13.9%) |
| $150,000 or more | 2,582 (32.1%) | 122 (9.7%) |
| Total | 8,044 (100.0%) | 1,252 (100.0%) |
Monthly Housing Cost Tiers in Munster
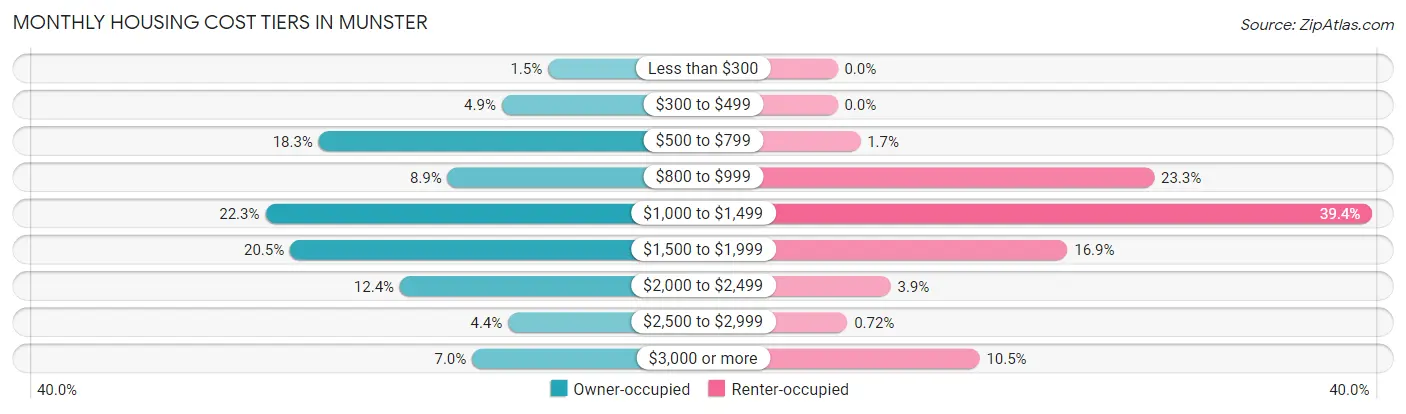
| Monthly Cost | Owner-occupied | Renter-occupied |
| Less than $300 | 117 (1.5%) | 0 (0.0%) |
| $300 to $499 | 391 (4.9%) | 0 (0.0%) |
| $500 to $799 | 1,475 (18.3%) | 21 (1.7%) |
| $800 to $999 | 712 (8.8%) | 292 (23.3%) |
| $1,000 to $1,499 | 1,791 (22.3%) | 493 (39.4%) |
| $1,500 to $1,999 | 1,645 (20.4%) | 212 (16.9%) |
| $2,000 to $2,499 | 994 (12.4%) | 49 (3.9%) |
| $2,500 to $2,999 | 353 (4.4%) | 9 (0.7%) |
| $3,000 or more | 566 (7.0%) | 131 (10.5%) |
| Total | 8,044 (100.0%) | 1,252 (100.0%) |
Physical Housing Characteristics in Munster
Housing Structures in Munster
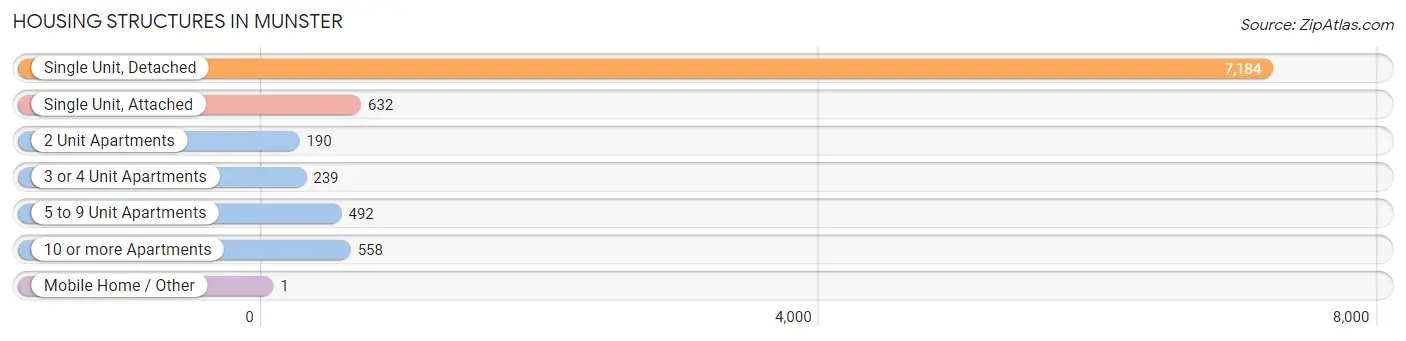
| Structure Type | # Housing Units | % Housing Units |
| Single Unit, Detached | 7,184 | 77.3% |
| Single Unit, Attached | 632 | 6.8% |
| 2 Unit Apartments | 190 | 2.0% |
| 3 or 4 Unit Apartments | 239 | 2.6% |
| 5 to 9 Unit Apartments | 492 | 5.3% |
| 10 or more Apartments | 558 | 6.0% |
| Mobile Home / Other | 1 | 0.0% |
| Total | 9,296 | 100.0% |
Housing Structures by Occupancy in Munster
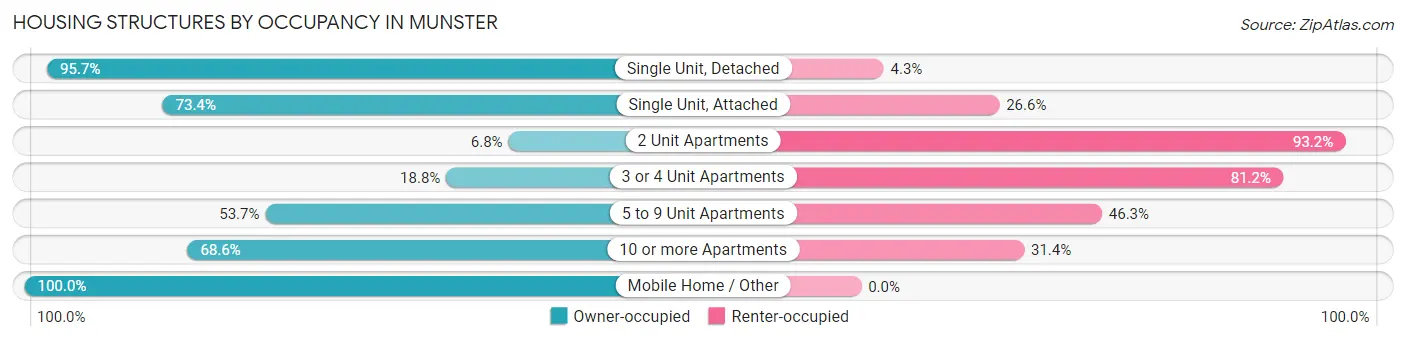
| Structure Type | Owner-occupied | Renter-occupied |
| Single Unit, Detached | 6,874 (95.7%) | 310 (4.3%) |
| Single Unit, Attached | 464 (73.4%) | 168 (26.6%) |
| 2 Unit Apartments | 13 (6.8%) | 177 (93.2%) |
| 3 or 4 Unit Apartments | 45 (18.8%) | 194 (81.2%) |
| 5 to 9 Unit Apartments | 264 (53.7%) | 228 (46.3%) |
| 10 or more Apartments | 383 (68.6%) | 175 (31.4%) |
| Mobile Home / Other | 1 (100.0%) | 0 (0.0%) |
| Total | 8,044 (86.5%) | 1,252 (13.5%) |
Housing Structures by Number of Rooms in Munster
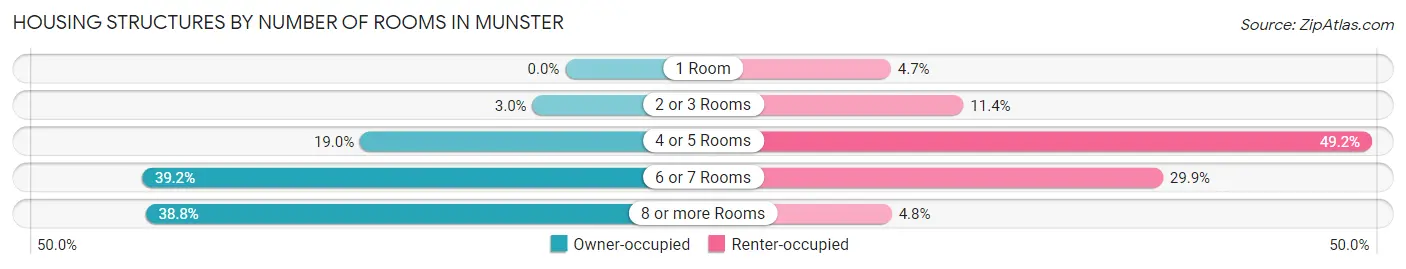
| Number of Rooms | Owner-occupied | Renter-occupied |
| 1 Room | 0 (0.0%) | 59 (4.7%) |
| 2 or 3 Rooms | 244 (3.0%) | 143 (11.4%) |
| 4 or 5 Rooms | 1,527 (19.0%) | 616 (49.2%) |
| 6 or 7 Rooms | 3,150 (39.2%) | 374 (29.9%) |
| 8 or more Rooms | 3,123 (38.8%) | 60 (4.8%) |
| Total | 8,044 (100.0%) | 1,252 (100.0%) |
Housing Structure by Heating Type in Munster
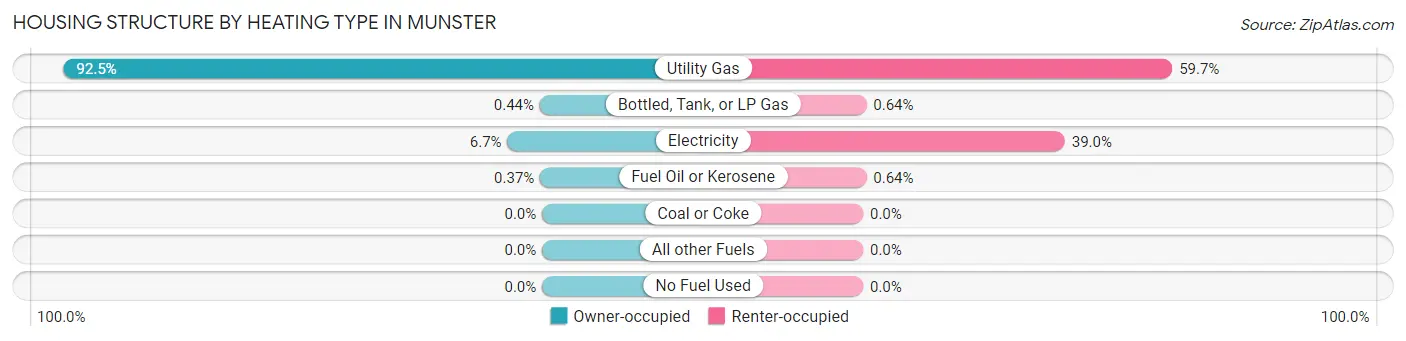
| Heating Type | Owner-occupied | Renter-occupied |
| Utility Gas | 7,440 (92.5%) | 748 (59.7%) |
| Bottled, Tank, or LP Gas | 35 (0.4%) | 8 (0.6%) |
| Electricity | 539 (6.7%) | 488 (39.0%) |
| Fuel Oil or Kerosene | 30 (0.4%) | 8 (0.6%) |
| Coal or Coke | 0 (0.0%) | 0 (0.0%) |
| All other Fuels | 0 (0.0%) | 0 (0.0%) |
| No Fuel Used | 0 (0.0%) | 0 (0.0%) |
| Total | 8,044 (100.0%) | 1,252 (100.0%) |
Household Vehicle Usage in Munster
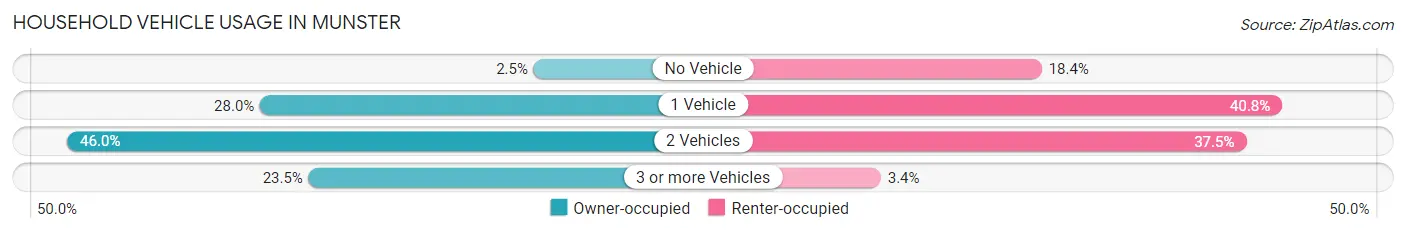
| Vehicles per Household | Owner-occupied | Renter-occupied |
| No Vehicle | 199 (2.5%) | 230 (18.4%) |
| 1 Vehicle | 2,253 (28.0%) | 511 (40.8%) |
| 2 Vehicles | 3,703 (46.0%) | 469 (37.5%) |
| 3 or more Vehicles | 1,889 (23.5%) | 42 (3.4%) |
| Total | 8,044 (100.0%) | 1,252 (100.0%) |
Real Estate & Mortgages in Munster
Real Estate and Mortgage Overview in Munster
| Characteristic | Without Mortgage | With Mortgage |
| Housing Units | 2,897 | 5,147 |
| Median Property Value | $256,000 | $294,500 |
| Median Household Income | $80,633 | $2,051 |
| Monthly Housing Costs | $688 | $549 |
| Real Estate Taxes | $3,593 | $61 |
Property Value by Mortgage Status in Munster
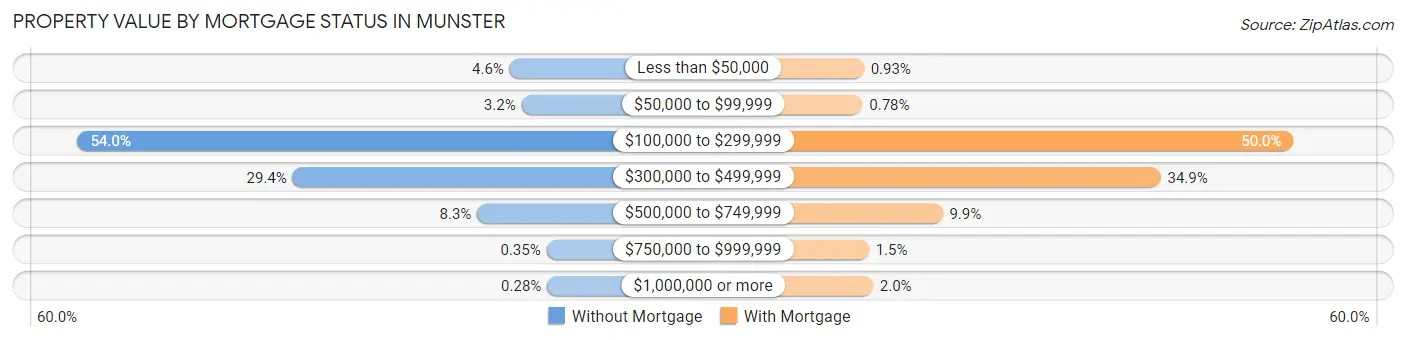
| Property Value | Without Mortgage | With Mortgage |
| Less than $50,000 | 132 (4.6%) | 48 (0.9%) |
| $50,000 to $99,999 | 93 (3.2%) | 40 (0.8%) |
| $100,000 to $299,999 | 1,563 (53.9%) | 2,575 (50.0%) |
| $300,000 to $499,999 | 851 (29.4%) | 1,794 (34.9%) |
| $500,000 to $749,999 | 240 (8.3%) | 511 (9.9%) |
| $750,000 to $999,999 | 10 (0.4%) | 77 (1.5%) |
| $1,000,000 or more | 8 (0.3%) | 102 (2.0%) |
| Total | 2,897 (100.0%) | 5,147 (100.0%) |
Household Income by Mortgage Status in Munster
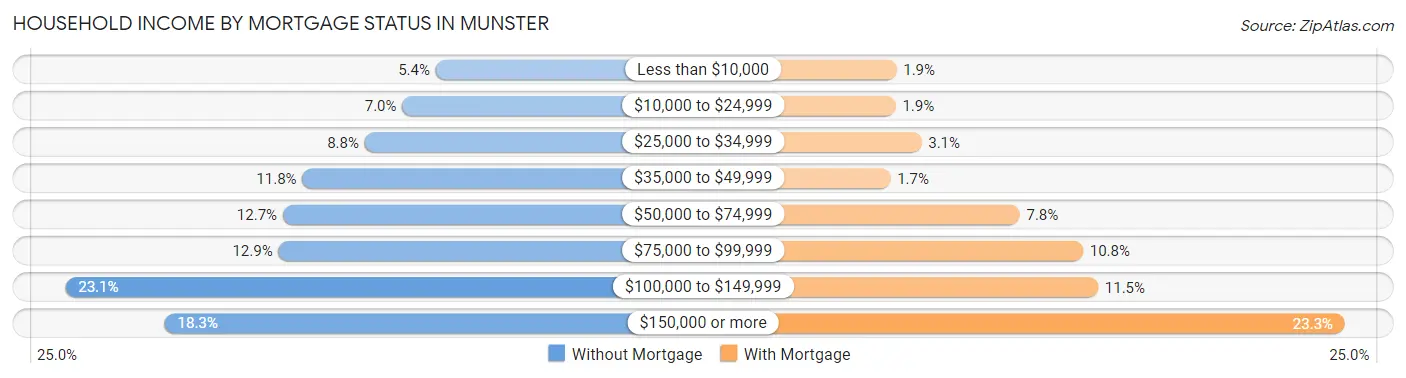
| Household Income | Without Mortgage | With Mortgage |
| Less than $10,000 | 157 (5.4%) | 100 (1.9%) |
| $10,000 to $24,999 | 203 (7.0%) | 98 (1.9%) |
| $25,000 to $34,999 | 255 (8.8%) | 161 (3.1%) |
| $35,000 to $49,999 | 341 (11.8%) | 85 (1.7%) |
| $50,000 to $74,999 | 368 (12.7%) | 402 (7.8%) |
| $75,000 to $99,999 | 374 (12.9%) | 557 (10.8%) |
| $100,000 to $149,999 | 668 (23.1%) | 594 (11.5%) |
| $150,000 or more | 531 (18.3%) | 1,199 (23.3%) |
| Total | 2,897 (100.0%) | 5,147 (100.0%) |
Property Value to Household Income Ratio in Munster
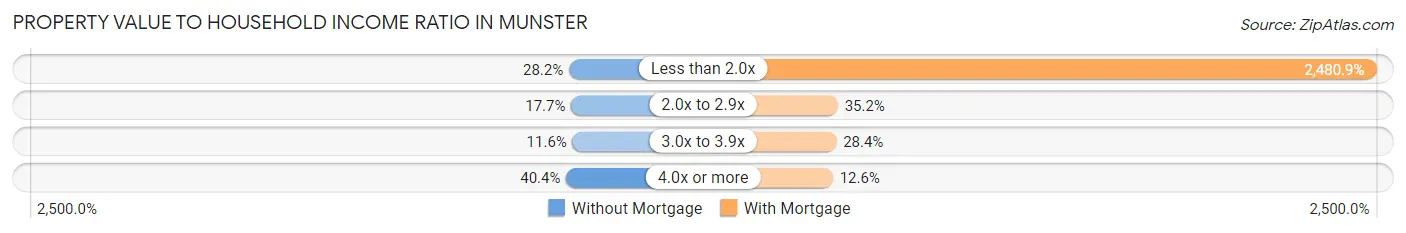
| Value-to-Income Ratio | Without Mortgage | With Mortgage |
| Less than 2.0x | 816 (28.2%) | 127,693 (2,480.9%) |
| 2.0x to 2.9x | 513 (17.7%) | 1,814 (35.2%) |
| 3.0x to 3.9x | 336 (11.6%) | 1,464 (28.4%) |
| 4.0x or more | 1,171 (40.4%) | 650 (12.6%) |
| Total | 2,897 (100.0%) | 5,147 (100.0%) |
Real Estate Taxes by Mortgage Status in Munster
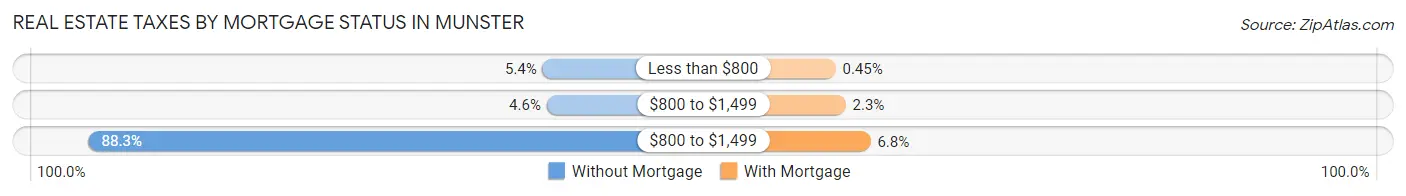
| Property Taxes | Without Mortgage | With Mortgage |
| Less than $800 | 156 (5.4%) | 23 (0.4%) |
| $800 to $1,499 | 134 (4.6%) | 118 (2.3%) |
| $800 to $1,499 | 2,558 (88.3%) | 352 (6.8%) |
| Total | 2,897 (100.0%) | 5,147 (100.0%) |
Health & Disability in Munster
Health Insurance Coverage by Age in Munster
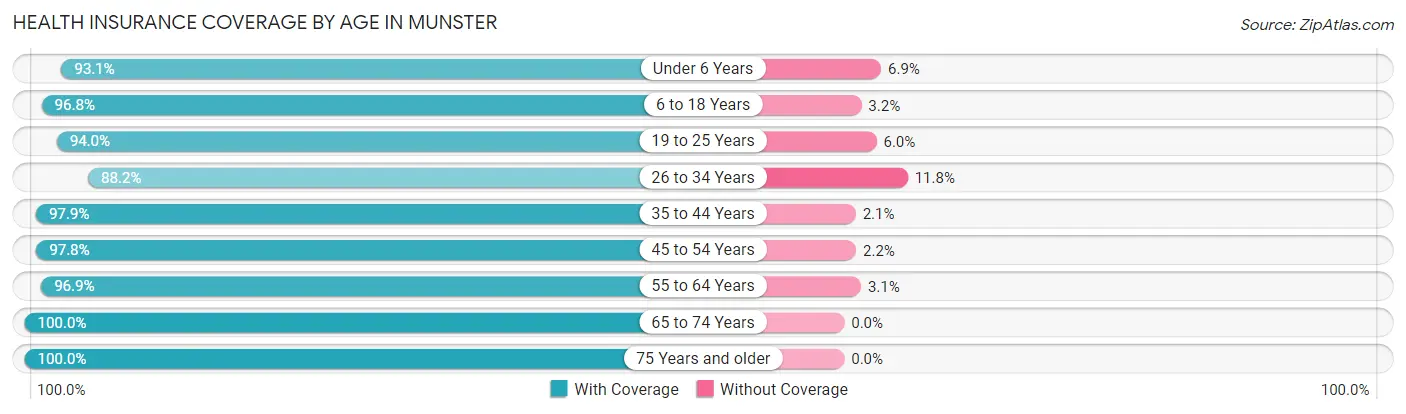
| Age Bracket | With Coverage | Without Coverage |
| Under 6 Years | 1,304 (93.1%) | 96 (6.9%) |
| 6 to 18 Years | 3,219 (96.8%) | 106 (3.2%) |
| 19 to 25 Years | 2,094 (94.0%) | 134 (6.0%) |
| 26 to 34 Years | 1,632 (88.2%) | 219 (11.8%) |
| 35 to 44 Years | 2,799 (97.9%) | 61 (2.1%) |
| 45 to 54 Years | 3,642 (97.8%) | 82 (2.2%) |
| 55 to 64 Years | 3,461 (96.9%) | 111 (3.1%) |
| 65 to 74 Years | 2,411 (100.0%) | 0 (0.0%) |
| 75 Years and older | 2,008 (100.0%) | 0 (0.0%) |
| Total | 22,570 (96.5%) | 809 (3.5%) |
Health Insurance Coverage by Citizenship Status in Munster
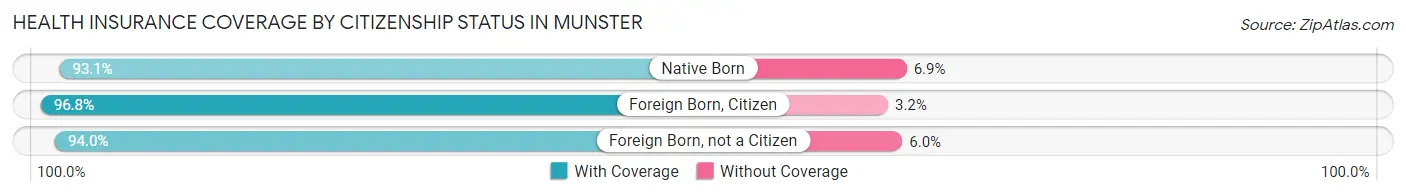
| Citizenship Status | With Coverage | Without Coverage |
| Native Born | 1,304 (93.1%) | 96 (6.9%) |
| Foreign Born, Citizen | 3,219 (96.8%) | 106 (3.2%) |
| Foreign Born, not a Citizen | 2,094 (94.0%) | 134 (6.0%) |
Health Insurance Coverage by Household Income in Munster
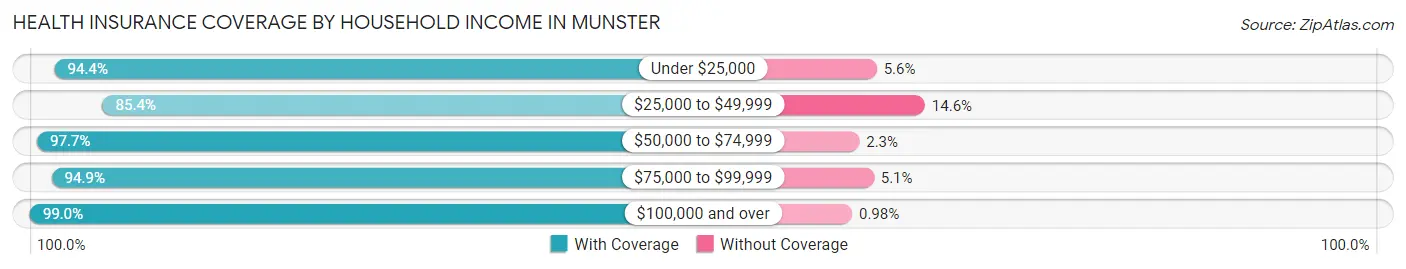
| Household Income | With Coverage | Without Coverage |
| Under $25,000 | 1,363 (94.4%) | 81 (5.6%) |
| $25,000 to $49,999 | 2,410 (85.4%) | 413 (14.6%) |
| $50,000 to $74,999 | 2,124 (97.7%) | 51 (2.3%) |
| $75,000 to $99,999 | 2,253 (94.9%) | 120 (5.1%) |
| $100,000 and over | 14,412 (99.0%) | 143 (1.0%) |
Public vs Private Health Insurance Coverage by Age in Munster
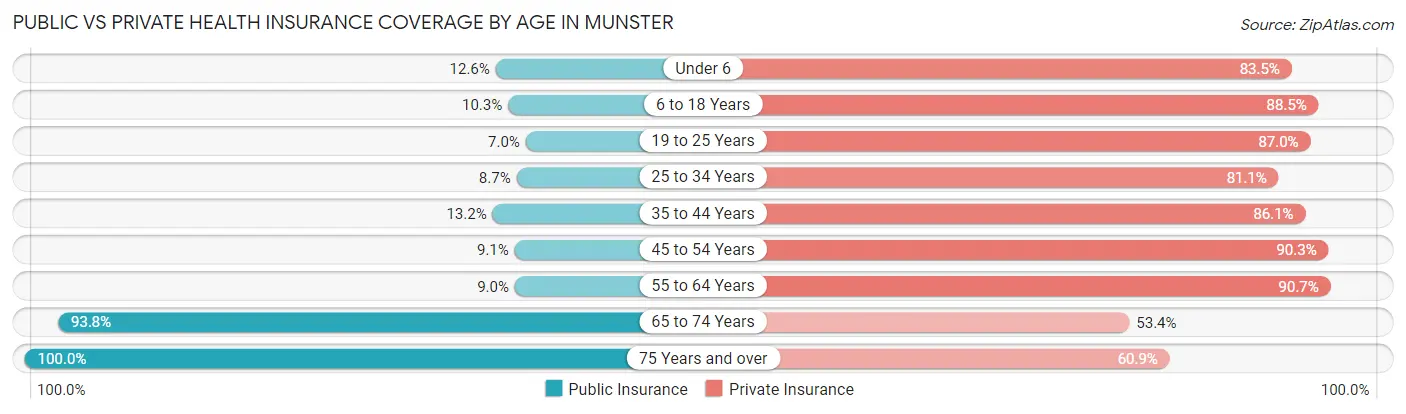
| Age Bracket | Public Insurance | Private Insurance |
| Under 6 | 176 (12.6%) | 1,169 (83.5%) |
| 6 to 18 Years | 341 (10.3%) | 2,943 (88.5%) |
| 19 to 25 Years | 156 (7.0%) | 1,938 (87.0%) |
| 25 to 34 Years | 161 (8.7%) | 1,501 (81.1%) |
| 35 to 44 Years | 376 (13.2%) | 2,461 (86.1%) |
| 45 to 54 Years | 337 (9.0%) | 3,364 (90.3%) |
| 55 to 64 Years | 322 (9.0%) | 3,241 (90.7%) |
| 65 to 74 Years | 2,262 (93.8%) | 1,287 (53.4%) |
| 75 Years and over | 2,008 (100.0%) | 1,222 (60.9%) |
| Total | 6,139 (26.3%) | 19,126 (81.8%) |
Disability Status by Sex by Age in Munster
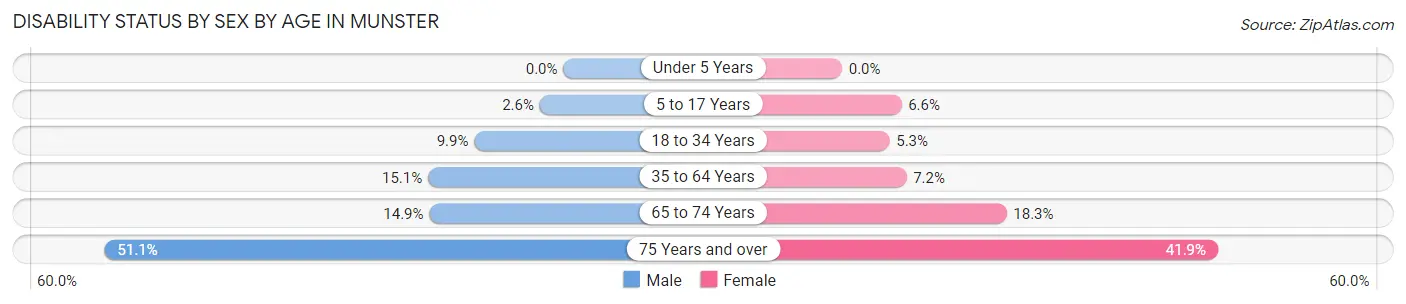
| Age Bracket | Male | Female |
| Under 5 Years | 0 (0.0%) | 0 (0.0%) |
| 5 to 17 Years | 41 (2.6%) | 122 (6.6%) |
| 18 to 34 Years | 197 (9.9%) | 123 (5.3%) |
| 35 to 64 Years | 772 (15.1%) | 361 (7.2%) |
| 65 to 74 Years | 188 (14.9%) | 211 (18.3%) |
| 75 Years and over | 460 (51.1%) | 464 (41.9%) |
Disability Class by Sex by Age in Munster
Disability Class: Hearing Difficulty
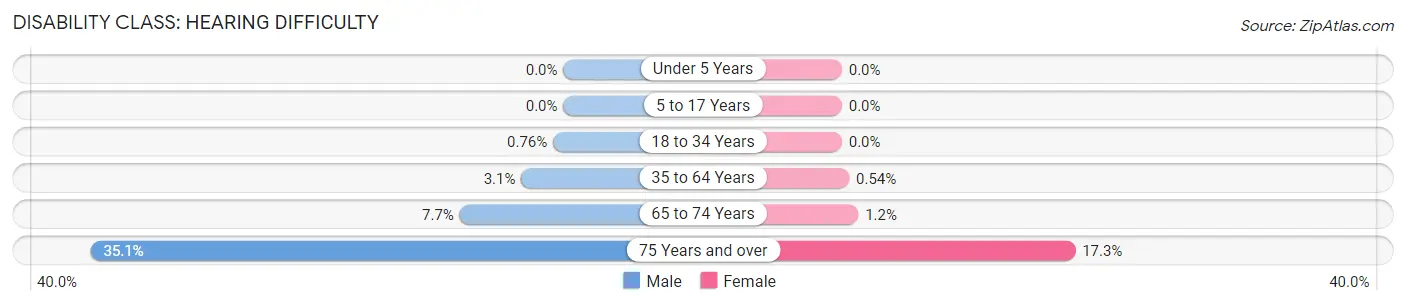
| Age Bracket | Male | Female |
| Under 5 Years | 0 (0.0%) | 0 (0.0%) |
| 5 to 17 Years | 0 (0.0%) | 0 (0.0%) |
| 18 to 34 Years | 15 (0.8%) | 0 (0.0%) |
| 35 to 64 Years | 160 (3.1%) | 27 (0.5%) |
| 65 to 74 Years | 97 (7.7%) | 14 (1.2%) |
| 75 Years and over | 316 (35.1%) | 192 (17.3%) |
Disability Class: Vision Difficulty
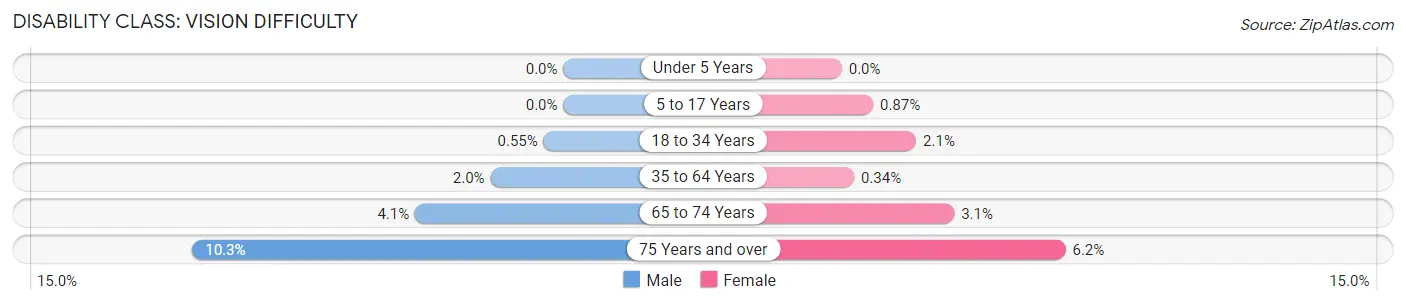
| Age Bracket | Male | Female |
| Under 5 Years | 0 (0.0%) | 0 (0.0%) |
| 5 to 17 Years | 0 (0.0%) | 16 (0.9%) |
| 18 to 34 Years | 11 (0.5%) | 48 (2.1%) |
| 35 to 64 Years | 104 (2.0%) | 17 (0.3%) |
| 65 to 74 Years | 52 (4.1%) | 36 (3.1%) |
| 75 Years and over | 93 (10.3%) | 69 (6.2%) |
Disability Class: Cognitive Difficulty
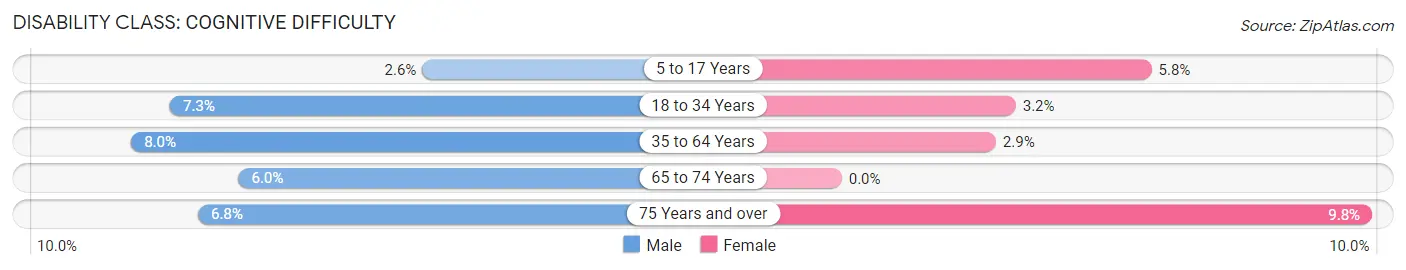
| Age Bracket | Male | Female |
| 5 to 17 Years | 41 (2.6%) | 106 (5.8%) |
| 18 to 34 Years | 145 (7.3%) | 75 (3.2%) |
| 35 to 64 Years | 411 (8.0%) | 144 (2.9%) |
| 65 to 74 Years | 76 (6.0%) | 0 (0.0%) |
| 75 Years and over | 61 (6.8%) | 109 (9.8%) |
Disability Class: Ambulatory Difficulty
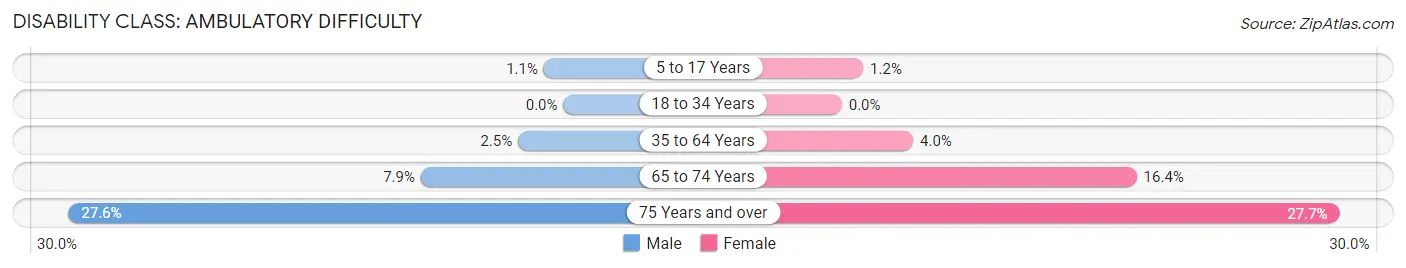
| Age Bracket | Male | Female |
| 5 to 17 Years | 17 (1.1%) | 22 (1.2%) |
| 18 to 34 Years | 0 (0.0%) | 0 (0.0%) |
| 35 to 64 Years | 129 (2.5%) | 200 (4.0%) |
| 65 to 74 Years | 100 (7.9%) | 189 (16.4%) |
| 75 Years and over | 248 (27.6%) | 307 (27.7%) |
Disability Class: Self-Care Difficulty
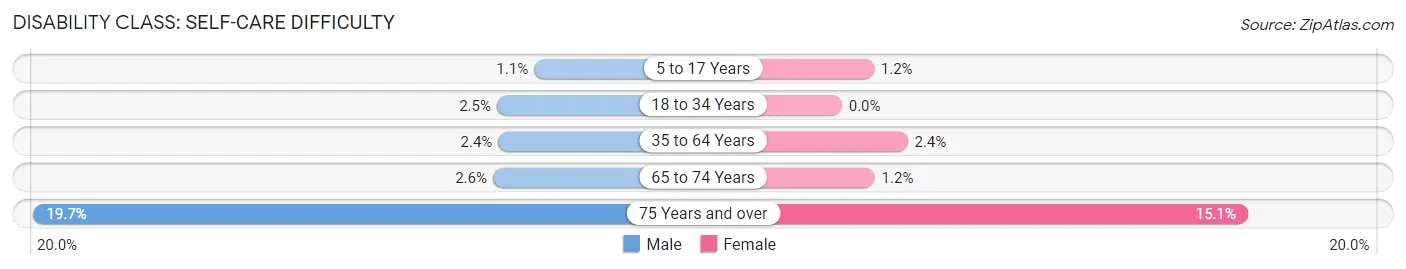
| Age Bracket | Male | Female |
| 5 to 17 Years | 17 (1.1%) | 22 (1.2%) |
| 18 to 34 Years | 49 (2.5%) | 0 (0.0%) |
| 35 to 64 Years | 124 (2.4%) | 123 (2.4%) |
| 65 to 74 Years | 33 (2.6%) | 14 (1.2%) |
| 75 Years and over | 177 (19.7%) | 167 (15.1%) |
Technology Access in Munster
Computing Device Access in Munster
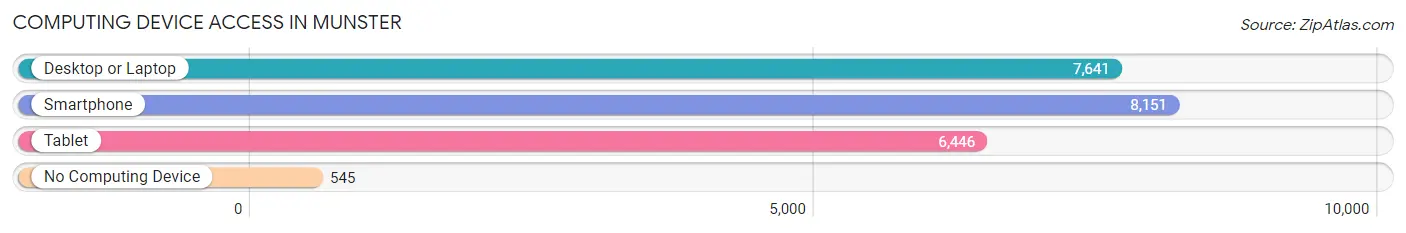
| Device Type | # Households | % Households |
| Desktop or Laptop | 7,641 | 82.2% |
| Smartphone | 8,151 | 87.7% |
| Tablet | 6,446 | 69.3% |
| No Computing Device | 545 | 5.9% |
| Total | 9,296 | 100.0% |
Internet Access in Munster
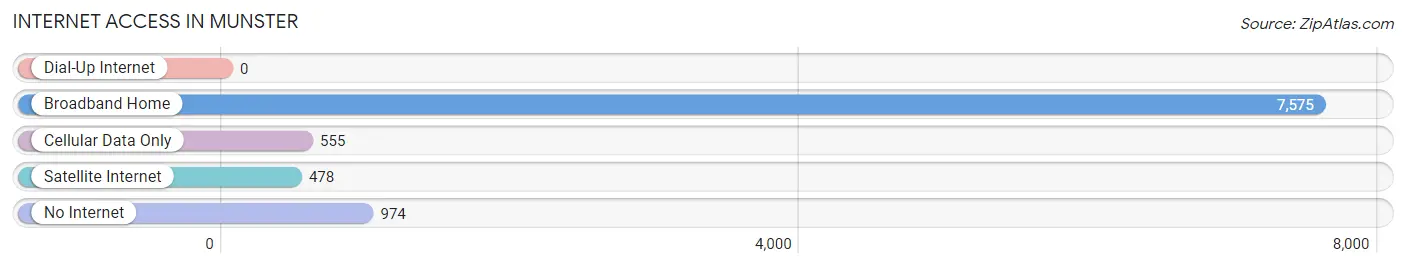
| Internet Type | # Households | % Households |
| Dial-Up Internet | 0 | 0.0% |
| Broadband Home | 7,575 | 81.5% |
| Cellular Data Only | 555 | 6.0% |
| Satellite Internet | 478 | 5.1% |
| No Internet | 974 | 10.5% |
| Total | 9,296 | 100.0% |
Munster Summary
Munster, Indiana is a town located in Lake County, Indiana, United States. It is part of the Chicago metropolitan area and is located approximately 25 miles southeast of downtown Chicago. The population of Munster was 23,603 at the 2010 census.
History
Munster was founded in 1849 by German immigrants who named the town after the city of Munster in Germany. The town was incorporated in 1907 and has since grown to become a thriving community.
Munster was the site of the first successful transatlantic radio transmission in 1901. The transmission was sent from the town's Galvin Manufacturing Company, which later became Motorola.
Geography
Munster is located at 41°37′N 87°29′W (41.619, -87.485). According to the 2010 census, Munster has a total area of 8.9 square miles (23.1 km2), of which 8.8 square miles (22.8 km2) is land and 0.1 square miles (0.3 km2) is water.
Economy
Munster is home to a variety of businesses, including manufacturing, retail, and healthcare. The town is also home to a number of corporate headquarters, including the headquarters of the Galvin Manufacturing Company, which later became Motorola.
The town is also home to a number of educational institutions, including Purdue University Northwest, Indiana University Northwest, and Calumet College of St. Joseph.
Demographics
As of the 2010 census, there were 23,603 people, 9,845 households, and 6,717 families residing in the town. The population density was 2,664.3 people per square mile (1,030.2/km2). There were 10,541 housing units at an average density of 1,190.2 per square mile (459.7/km2). The racial makeup of the town was 87.2% White, 4.2% African American, 0.2% Native American, 4.7% Asian, 0.1% Pacific Islander, 1.7% from other races, and 2.0% from two or more races. Hispanic or Latino of any race were 6.3% of the population.
There were 9,845 households, out of which 30.2% had children under the age of 18 living with them, 54.2% were married couples living together, 10.2% had a female householder with no husband present, and 31.2% were non-families. 25.7% of all households were made up of individuals, and 10.2% had someone living alone who was 65 years of age or older. The average household size was 2.41 and the average family size was 2.90.
In the town, the population was spread out, with 22.7% under the age of 18, 7.2% from 18 to 24, 28.2% from 25 to 44, 25.3% from 45 to 64, and 16.6% who were 65 years of age or older. The median age was 40 years. For every 100 females, there were 92.3 males. For every 100 females age 18 and over, there were 88.7 males.
The median income for a household in the town was $60,945, and the median income for a family was $72,917. Males had a median income of $51,945 versus $37,917 for females. The per capita income for the town was $30,945. About 3.2% of families and 4.7% of the population were below the poverty line, including 5.2% of those under age 18 and 4.3% of those age 65 or over.
Common Questions
What is Per Capita Income in Munster?
Per Capita income in Munster is $53,245.
What is the Median Family Income in Munster?
Median Family Income in Munster is $126,563.
What is the Median Household income in Munster?
Median Household Income in Munster is $101,851.
What is Income or Wage Gap in Munster?
Income or Wage Gap in Munster is 39.0%.
Women in Munster earn 61.0 cents for every dollar earned by a man.
What is Inequality or Gini Index in Munster?
Inequality or Gini Index in Munster is 0.47.
What is the Total Population of Munster?
Total Population of Munster is 23,731.
What is the Total Male Population of Munster?
Total Male Population of Munster is 11,518.
What is the Total Female Population of Munster?
Total Female Population of Munster is 12,213.
What is the Ratio of Males per 100 Females in Munster?
There are 94.31 Males per 100 Females in Munster.
What is the Ratio of Females per 100 Males in Munster?
There are 106.03 Females per 100 Males in Munster.
What is the Median Population Age in Munster?
Median Population Age in Munster is 45.6 Years.
What is the Average Family Size in Munster
Average Family Size in Munster is 3.1 People.
What is the Average Household Size in Munster
Average Household Size in Munster is 2.5 People.
How Large is the Labor Force in Munster?
There are 12,205 People in the Labor Forcein in Munster.
What is the Percentage of People in the Labor Force in Munster?
61.5% of People are in the Labor Force in Munster.
What is the Unemployment Rate in Munster?
Unemployment Rate in Munster is 3.9%.