Aliquippa, PA Map & Demographics
Aliquippa Map
Aliquippa Overview
$27,636
PER CAPITA INCOME
$65,814
AVG FAMILY INCOME
$42,601
AVG HOUSEHOLD INCOME
13.0%
WAGE / INCOME GAP [ % ]
87.0¢/ $1
WAGE / INCOME GAP [ $ ]
0.45
INEQUALITY / GINI INDEX
9,198
TOTAL POPULATION
4,287
MALE POPULATION
4,911
FEMALE POPULATION
87.29
MALES / 100 FEMALES
114.56
FEMALES / 100 MALES
49.0
MEDIAN AGE
2.8
AVG FAMILY SIZE
2.0
AVG HOUSEHOLD SIZE
4,355
LABOR FORCE [ PEOPLE ]
55.2%
PERCENT IN LABOR FORCE
8.4%
UNEMPLOYMENT RATE
Aliquippa Zip Codes
Aliquippa Area Codes
Income in Aliquippa
Income Overview in Aliquippa
Per Capita Income in Aliquippa is $27,636, while median incomes of families and households are $65,814 and $42,601 respectively.
| Characteristic | Number | Measure |
| Per Capita Income | 9,198 | $27,636 |
| Median Family Income | 2,283 | $65,814 |
| Mean Family Income | 2,283 | $75,203 |
| Median Household Income | 4,555 | $42,601 |
| Mean Household Income | 4,555 | $54,700 |
| Income Deficit | 2,283 | $0 |
| Wage / Income Gap (%) | 9,198 | 12.98% |
| Wage / Income Gap ($) | 9,198 | 87.02¢ per $1 |
| Gini / Inequality Index | 9,198 | 0.45 |
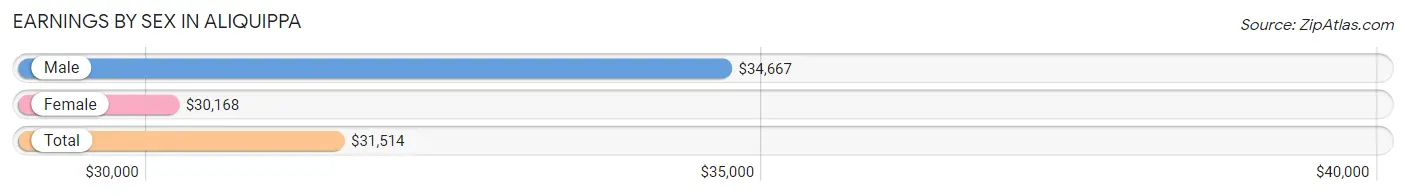
Earnings by Sex in Aliquippa
Average Earnings in Aliquippa are $31,514, $34,667 for men and $30,168 for women, a difference of 13.0%.
| Sex | Number | Average Earnings |
| Male | 2,062 (45.0%) | $34,667 |
| Female | 2,517 (55.0%) | $30,168 |
| Total | 4,579 (100.0%) | $31,514 |
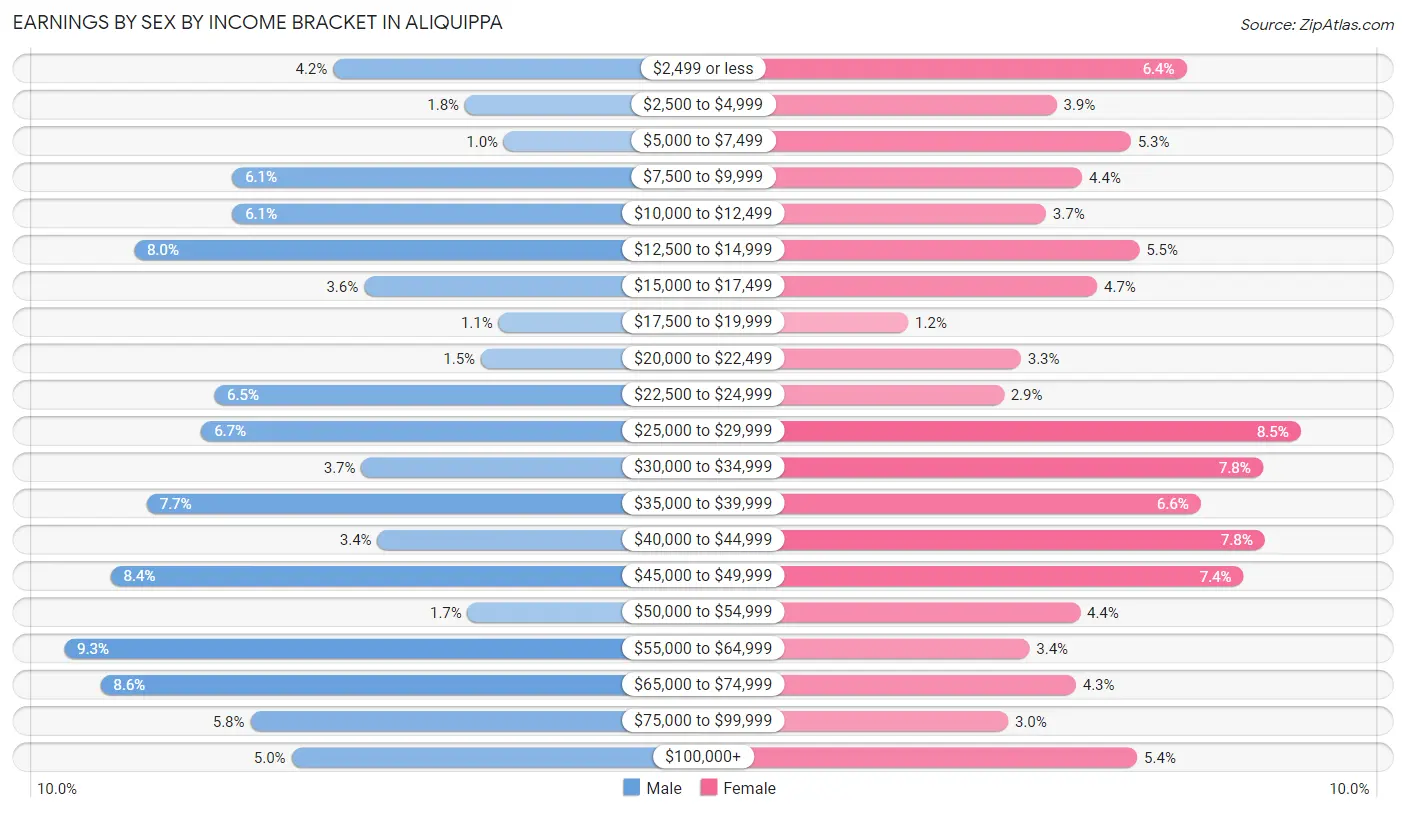
Earnings by Sex by Income Bracket in Aliquippa
The most common earnings brackets in Aliquippa are $55,000 to $64,999 for men (191 | 9.3%) and $25,000 to $29,999 for women (214 | 8.5%).
| Income | Male | Female |
| $2,499 or less | 87 (4.2%) | 160 (6.4%) |
| $2,500 to $4,999 | 36 (1.8%) | 99 (3.9%) |
| $5,000 to $7,499 | 21 (1.0%) | 134 (5.3%) |
| $7,500 to $9,999 | 126 (6.1%) | 111 (4.4%) |
| $10,000 to $12,499 | 126 (6.1%) | 94 (3.7%) |
| $12,500 to $14,999 | 164 (8.0%) | 138 (5.5%) |
| $15,000 to $17,499 | 75 (3.6%) | 118 (4.7%) |
| $17,500 to $19,999 | 23 (1.1%) | 29 (1.1%) |
| $20,000 to $22,499 | 30 (1.5%) | 82 (3.3%) |
| $22,500 to $24,999 | 133 (6.5%) | 74 (2.9%) |
| $25,000 to $29,999 | 138 (6.7%) | 214 (8.5%) |
| $30,000 to $34,999 | 76 (3.7%) | 196 (7.8%) |
| $35,000 to $39,999 | 159 (7.7%) | 167 (6.6%) |
| $40,000 to $44,999 | 70 (3.4%) | 197 (7.8%) |
| $45,000 to $49,999 | 173 (8.4%) | 187 (7.4%) |
| $50,000 to $54,999 | 35 (1.7%) | 110 (4.4%) |
| $55,000 to $64,999 | 191 (9.3%) | 86 (3.4%) |
| $65,000 to $74,999 | 177 (8.6%) | 108 (4.3%) |
| $75,000 to $99,999 | 119 (5.8%) | 76 (3.0%) |
| $100,000+ | 103 (5.0%) | 137 (5.4%) |
| Total | 2,062 (100.0%) | 2,517 (100.0%) |
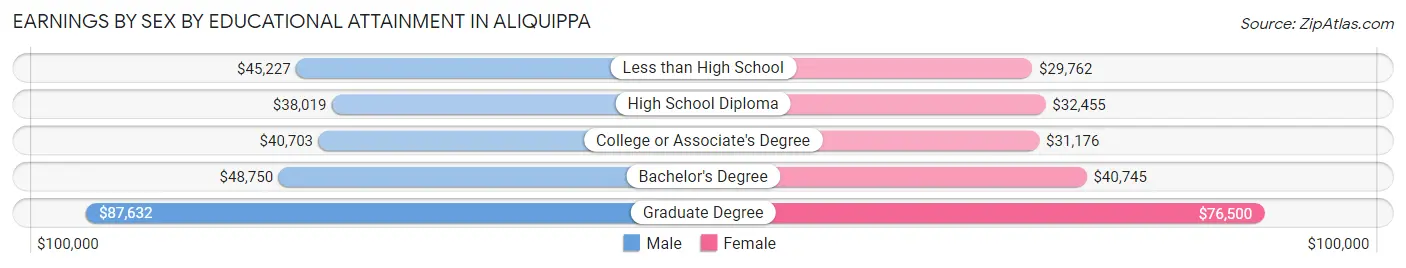
Earnings by Sex by Educational Attainment in Aliquippa
Average earnings in Aliquippa are $42,368 for men and $34,408 for women, a difference of 18.8%. Men with an educational attainment of graduate degree enjoy the highest average annual earnings of $87,632, while those with high school diploma education earn the least with $38,019. Women with an educational attainment of graduate degree earn the most with the average annual earnings of $76,500, while those with less than high school education have the smallest earnings of $29,762.
| Educational Attainment | Male Income | Female Income |
| Less than High School | $45,227 | $29,762 |
| High School Diploma | $38,019 | $32,455 |
| College or Associate's Degree | $40,703 | $31,176 |
| Bachelor's Degree | $48,750 | $40,745 |
| Graduate Degree | $87,632 | $76,500 |
| Total | $42,368 | $34,408 |
Family Income in Aliquippa
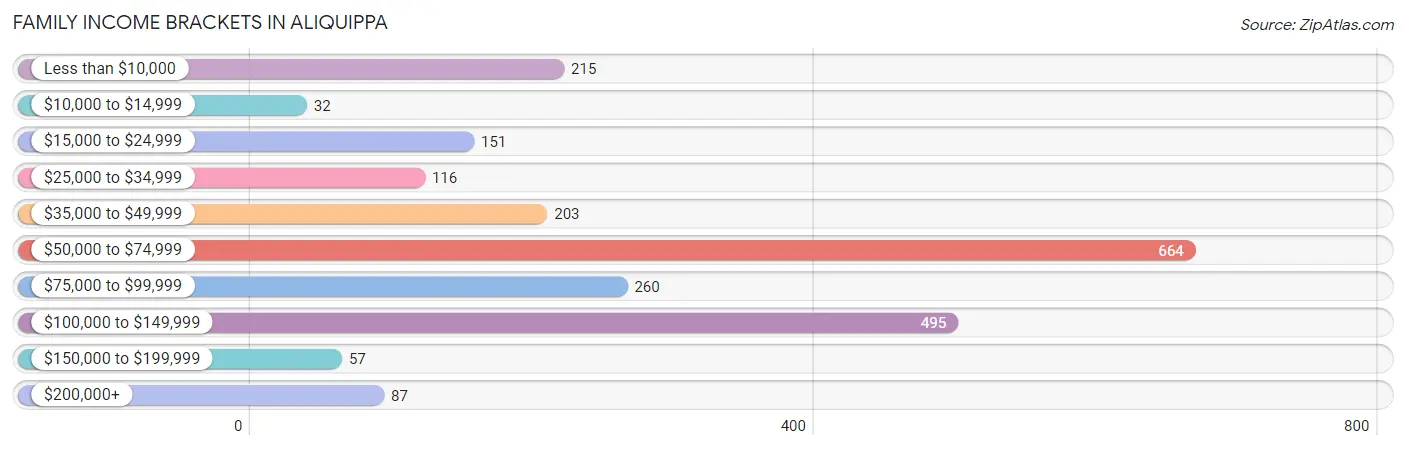
Family Income Brackets in Aliquippa
According to the Aliquippa family income data, there are 664 families falling into the $50,000 to $74,999 income range, which is the most common income bracket and makes up 29.1% of all families. Conversely, the $10,000 to $14,999 income bracket is the least frequent group with only 32 families (1.4%) belonging to this category.
| Income Bracket | # Families | % Families |
| Less than $10,000 | 215 | 9.4% |
| $10,000 to $14,999 | 32 | 1.4% |
| $15,000 to $24,999 | 151 | 6.6% |
| $25,000 to $34,999 | 116 | 5.1% |
| $35,000 to $49,999 | 203 | 8.9% |
| $50,000 to $74,999 | 664 | 29.1% |
| $75,000 to $99,999 | 260 | 11.4% |
| $100,000 to $149,999 | 495 | 21.7% |
| $150,000 to $199,999 | 57 | 2.5% |
| $200,000+ | 87 | 3.8% |
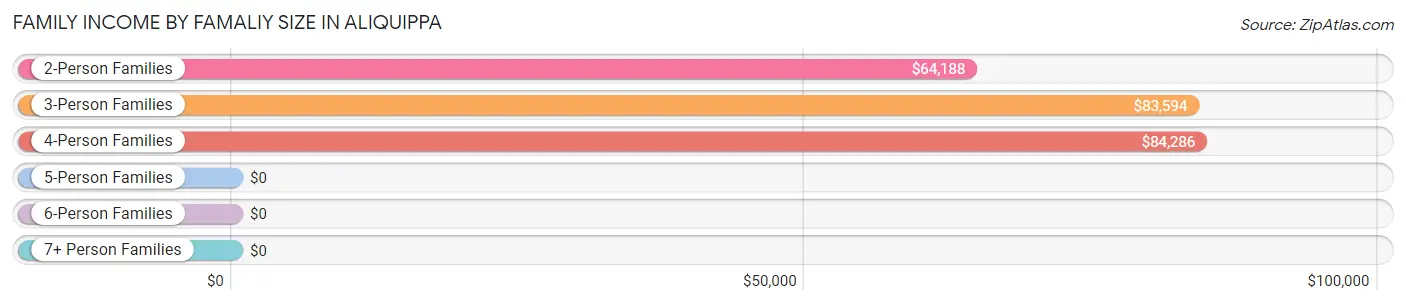
Family Income by Famaliy Size in Aliquippa
4-person families (248 | 10.9%) account for the highest median family income in Aliquippa with $84,286 per family, while 2-person families (1,391 | 60.9%) have the highest median income of $32,094 per family member.
| Income Bracket | # Families | Median Income |
| 2-Person Families | 1,391 (60.9%) | $64,188 |
| 3-Person Families | 413 (18.1%) | $83,594 |
| 4-Person Families | 248 (10.9%) | $84,286 |
| 5-Person Families | 180 (7.9%) | $0 |
| 6-Person Families | 2 (0.1%) | $0 |
| 7+ Person Families | 49 (2.1%) | $0 |
| Total | 2,283 (100.0%) | $65,814 |
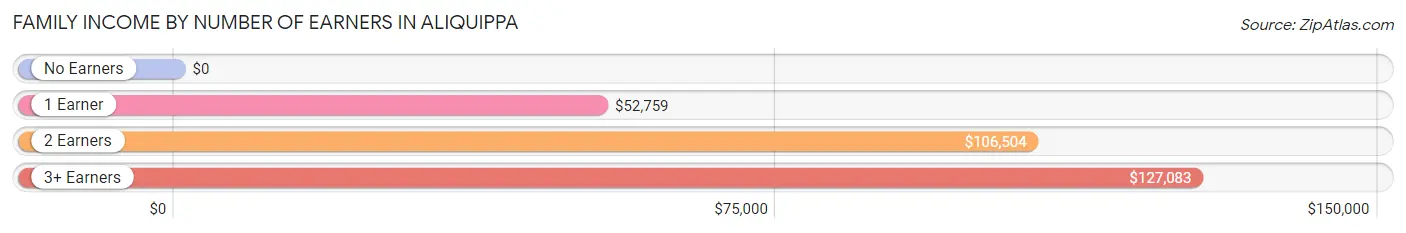
Family Income by Number of Earners in Aliquippa
| Number of Earners | # Families | Median Income |
| No Earners | 403 (17.6%) | $0 |
| 1 Earner | 1,068 (46.8%) | $52,759 |
| 2 Earners | 541 (23.7%) | $106,504 |
| 3+ Earners | 271 (11.9%) | $127,083 |
| Total | 2,283 (100.0%) | $65,814 |
Household Income in Aliquippa
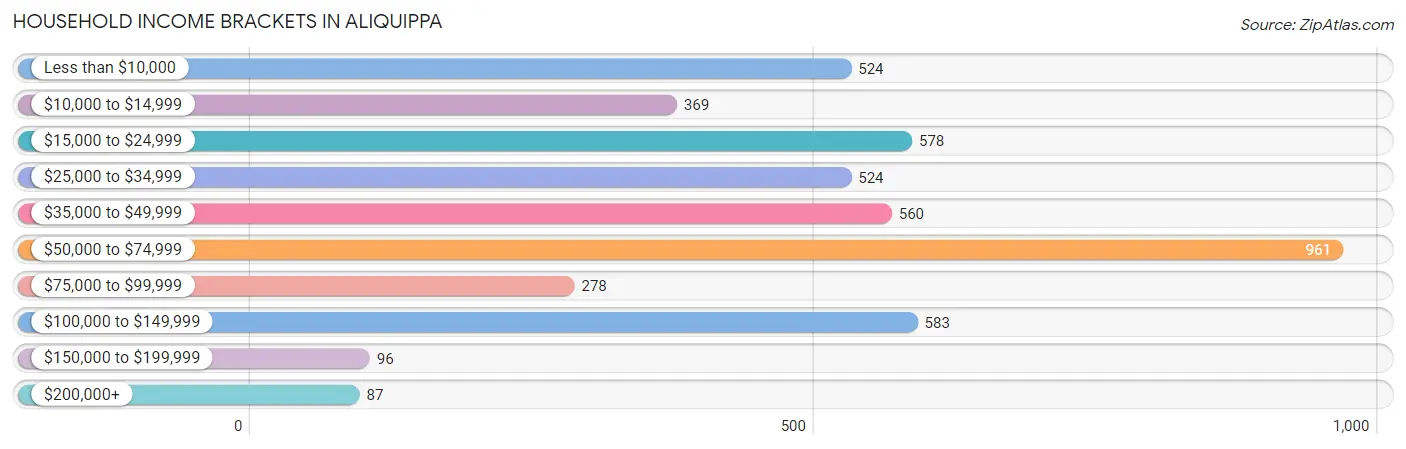
Household Income Brackets in Aliquippa
With 961 households falling in the category, the $50,000 to $74,999 income range is the most frequent in Aliquippa, accounting for 21.1% of all households. In contrast, only 87 households (1.9%) fall into the $200,000+ income bracket, making it the least populous group.
| Income Bracket | # Households | % Households |
| Less than $10,000 | 524 | 11.5% |
| $10,000 to $14,999 | 369 | 8.1% |
| $15,000 to $24,999 | 578 | 12.7% |
| $25,000 to $34,999 | 524 | 11.5% |
| $35,000 to $49,999 | 560 | 12.3% |
| $50,000 to $74,999 | 961 | 21.1% |
| $75,000 to $99,999 | 278 | 6.1% |
| $100,000 to $149,999 | 583 | 12.8% |
| $150,000 to $199,999 | 96 | 2.1% |
| $200,000+ | 87 | 1.9% |
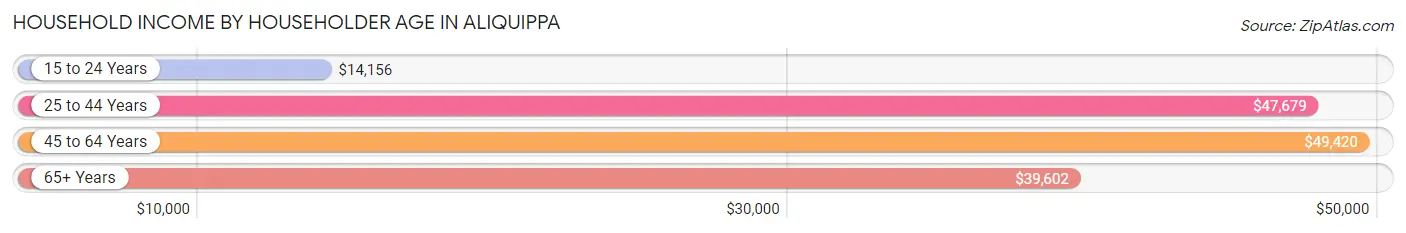
Household Income by Householder Age in Aliquippa
The median household income in Aliquippa is $42,601, with the highest median household income of $49,420 found in the 45 to 64 years age bracket for the primary householder. A total of 1,854 households (40.7%) fall into this category. Meanwhile, the 15 to 24 years age bracket for the primary householder has the lowest median household income of $14,156, with 334 households (7.3%) in this group.
| Income Bracket | # Households | Median Income |
| 15 to 24 Years | 334 (7.3%) | $14,156 |
| 25 to 44 Years | 950 (20.9%) | $47,679 |
| 45 to 64 Years | 1,854 (40.7%) | $49,420 |
| 65+ Years | 1,417 (31.1%) | $39,602 |
| Total | 4,555 (100.0%) | $42,601 |
Poverty in Aliquippa
Income Below Poverty by Sex and Age in Aliquippa
With 26.4% poverty level for males and 20.8% for females among the residents of Aliquippa, 5 year old males and 15 year old females are the most vulnerable to poverty, with 55 males (85.9%) and 29 females (76.3%) in their respective age groups living below the poverty level.
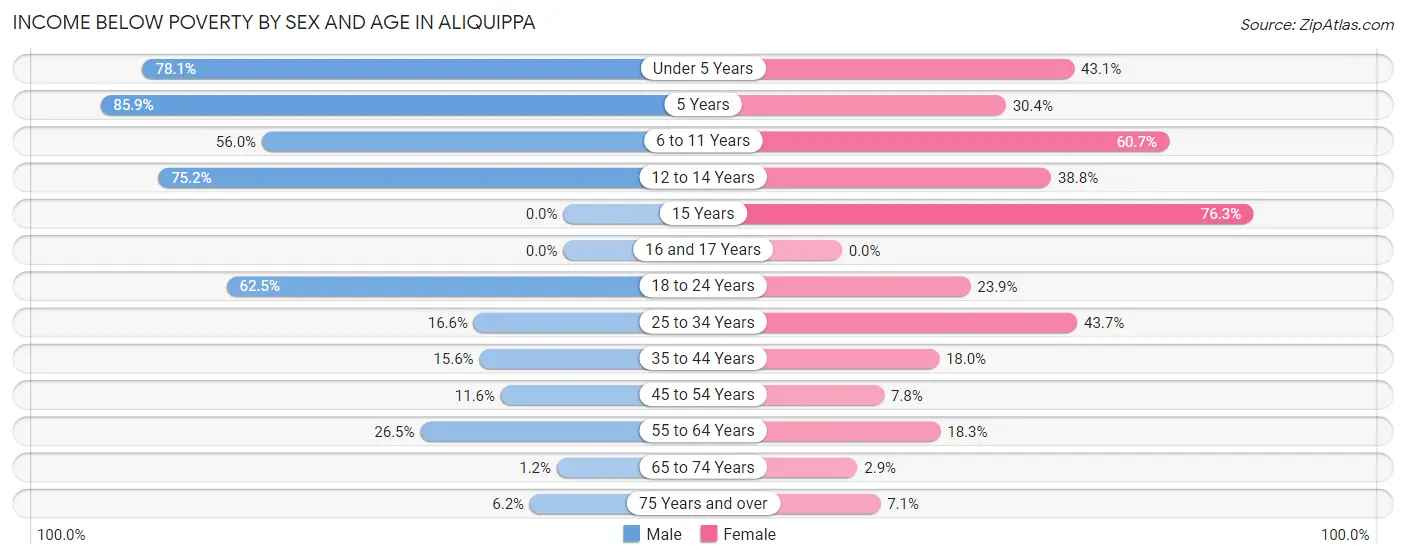
| Age Bracket | Male | Female |
| Under 5 Years | 114 (78.1%) | 47 (43.1%) |
| 5 Years | 55 (85.9%) | 7 (30.4%) |
| 6 to 11 Years | 174 (55.9%) | 213 (60.7%) |
| 12 to 14 Years | 97 (75.2%) | 40 (38.8%) |
| 15 Years | 0 (0.0%) | 29 (76.3%) |
| 16 and 17 Years | 0 (0.0%) | 0 (0.0%) |
| 18 to 24 Years | 265 (62.5%) | 94 (23.9%) |
| 25 to 34 Years | 58 (16.6%) | 203 (43.7%) |
| 35 to 44 Years | 88 (15.6%) | 110 (18.0%) |
| 45 to 54 Years | 61 (11.6%) | 51 (7.8%) |
| 55 to 64 Years | 190 (26.5%) | 157 (18.3%) |
| 65 to 74 Years | 7 (1.2%) | 15 (2.9%) |
| 75 Years and over | 22 (6.2%) | 48 (7.1%) |
| Total | 1,131 (26.4%) | 1,014 (20.8%) |
Income Above Poverty by Sex and Age in Aliquippa
According to the poverty statistics in Aliquippa, males aged 15 years and females aged 16 and 17 years are the age groups that are most secure financially, with 100.0% of males and 100.0% of females in these age groups living above the poverty line.
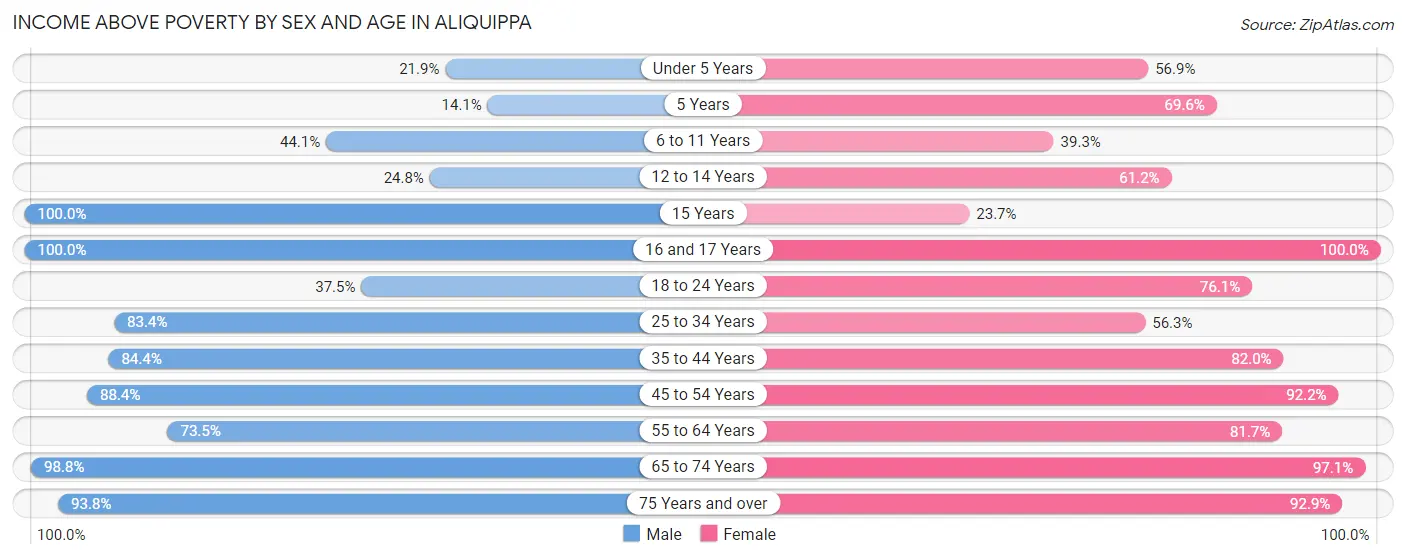
| Age Bracket | Male | Female |
| Under 5 Years | 32 (21.9%) | 62 (56.9%) |
| 5 Years | 9 (14.1%) | 16 (69.6%) |
| 6 to 11 Years | 137 (44.1%) | 138 (39.3%) |
| 12 to 14 Years | 32 (24.8%) | 63 (61.2%) |
| 15 Years | 17 (100.0%) | 9 (23.7%) |
| 16 and 17 Years | 93 (100.0%) | 71 (100.0%) |
| 18 to 24 Years | 159 (37.5%) | 300 (76.1%) |
| 25 to 34 Years | 291 (83.4%) | 262 (56.3%) |
| 35 to 44 Years | 477 (84.4%) | 500 (82.0%) |
| 45 to 54 Years | 465 (88.4%) | 600 (92.2%) |
| 55 to 64 Years | 526 (73.5%) | 702 (81.7%) |
| 65 to 74 Years | 578 (98.8%) | 504 (97.1%) |
| 75 Years and over | 332 (93.8%) | 625 (92.9%) |
| Total | 3,148 (73.6%) | 3,852 (79.2%) |
Income Below Poverty Among Married-Couple Families in Aliquippa
The poverty statistics for married-couple families in Aliquippa show that 3.6% or 46 of the total 1,291 families live below the poverty line. Families with 1 or 2 children have the highest poverty rate of 4.6%, comprising of 7 families. On the other hand, families with 3 or 4 children have the lowest poverty rate of 0.0%, which includes 0 families.
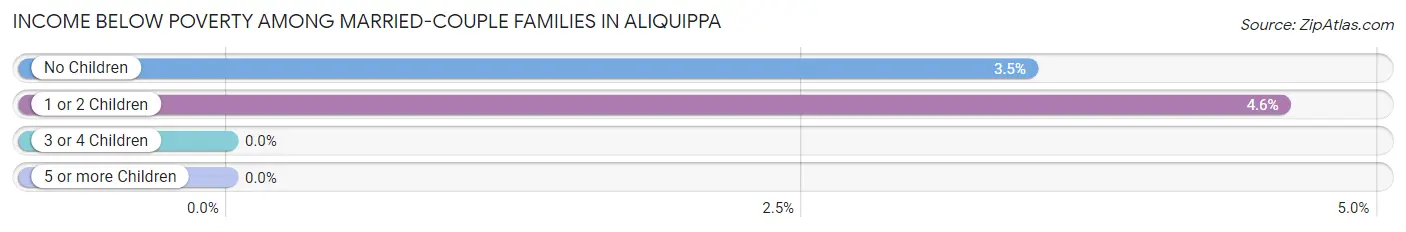
| Children | Above Poverty | Below Poverty |
| No Children | 1,081 (96.5%) | 39 (3.5%) |
| 1 or 2 Children | 146 (95.4%) | 7 (4.6%) |
| 3 or 4 Children | 18 (100.0%) | 0 (0.0%) |
| 5 or more Children | 0 (0.0%) | 0 (0.0%) |
| Total | 1,245 (96.4%) | 46 (3.6%) |
Income Below Poverty Among Single-Parent Households in Aliquippa
According to the poverty data in Aliquippa, 26.7% or 35 single-father households and 34.8% or 300 single-mother households are living below the poverty line. Among single-father households, those with 3 or 4 children have the highest poverty rate, with 35 households (100.0%) experiencing poverty. Likewise, among single-mother households, those with 5 or more children have the highest poverty rate, with 40 households (100.0%) falling below the poverty line.
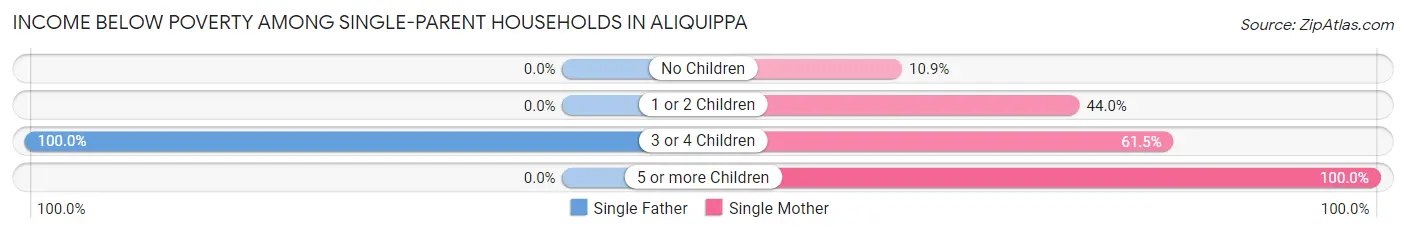
| Children | Single Father | Single Mother |
| No Children | 0 (0.0%) | 38 (10.9%) |
| 1 or 2 Children | 0 (0.0%) | 171 (44.0%) |
| 3 or 4 Children | 35 (100.0%) | 51 (61.5%) |
| 5 or more Children | 0 (0.0%) | 40 (100.0%) |
| Total | 35 (26.7%) | 300 (34.8%) |
Income Below Poverty Among Married-Couple vs Single-Parent Households in Aliquippa
The poverty data for Aliquippa shows that 46 of the married-couple family households (3.6%) and 335 of the single-parent households (33.8%) are living below the poverty level. Within the married-couple family households, those with 1 or 2 children have the highest poverty rate, with 7 households (4.6%) falling below the poverty line. Among the single-parent households, those with 5 or more children have the highest poverty rate, with 40 household (100.0%) living below poverty.
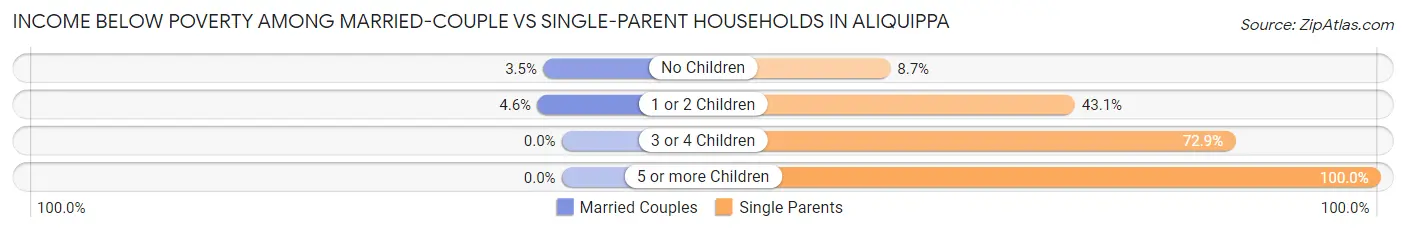
| Children | Married-Couple Families | Single-Parent Households |
| No Children | 39 (3.5%) | 38 (8.7%) |
| 1 or 2 Children | 7 (4.6%) | 171 (43.1%) |
| 3 or 4 Children | 0 (0.0%) | 86 (72.9%) |
| 5 or more Children | 0 (0.0%) | 40 (100.0%) |
| Total | 46 (3.6%) | 335 (33.8%) |
Race in Aliquippa
The most populous races in Aliquippa are White / Caucasian (5,206 | 56.6%), Black / African American (3,317 | 36.1%), and Two or more Races (446 | 4.9%).
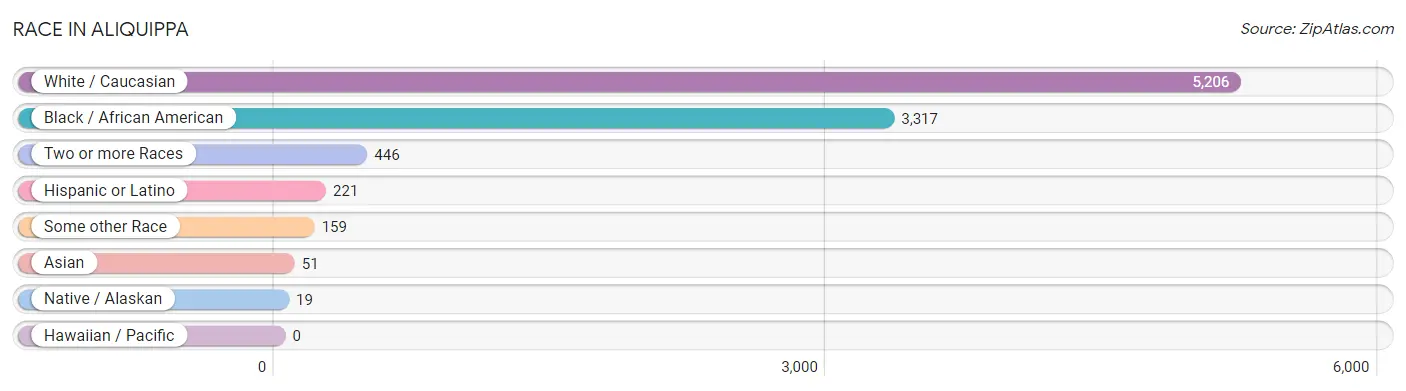
| Race | # Population | % Population |
| Asian | 51 | 0.5% |
| Black / African American | 3,317 | 36.1% |
| Hawaiian / Pacific | 0 | 0.0% |
| Hispanic or Latino | 221 | 2.4% |
| Native / Alaskan | 19 | 0.2% |
| White / Caucasian | 5,206 | 56.6% |
| Two or more Races | 446 | 4.9% |
| Some other Race | 159 | 1.7% |
| Total | 9,198 | 100.0% |
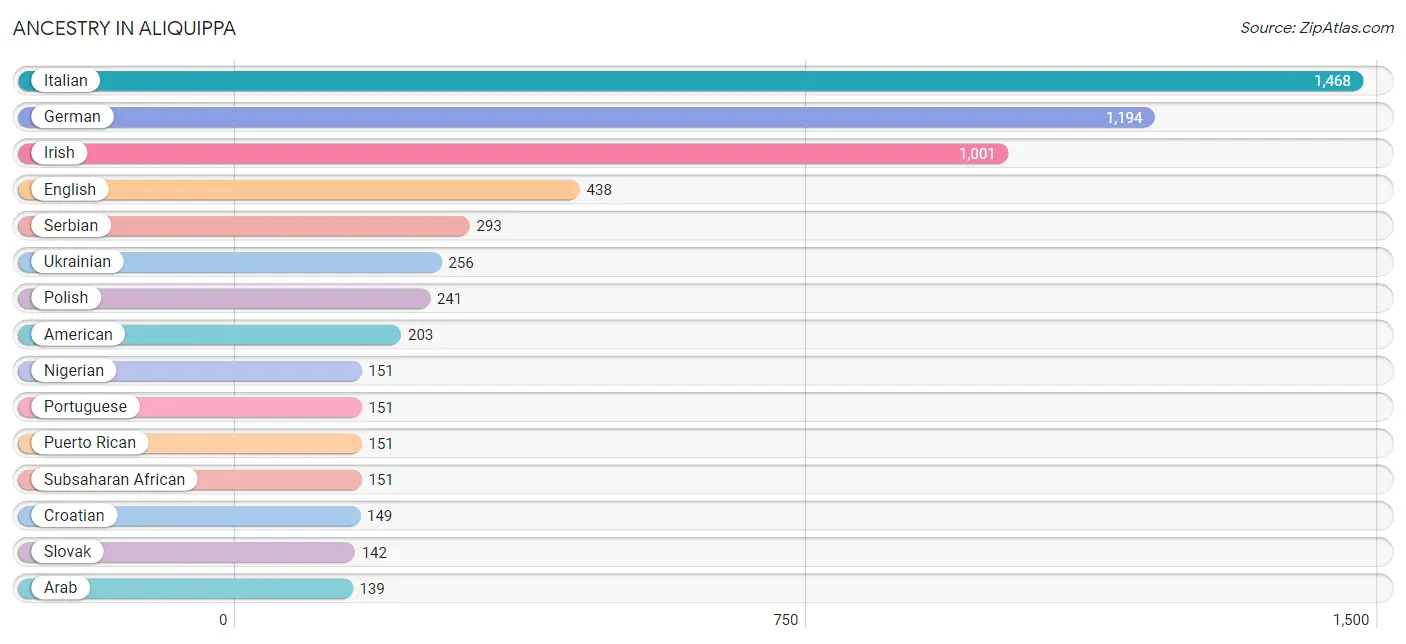
Ancestry in Aliquippa
The most populous ancestries reported in Aliquippa are Italian (1,468 | 16.0%), German (1,194 | 13.0%), Irish (1,001 | 10.9%), English (438 | 4.8%), and Serbian (293 | 3.2%), together accounting for 47.8% of all Aliquippa residents.
| Ancestry | # Population | % Population |
| American | 203 | 2.2% |
| Arab | 139 | 1.5% |
| Argentinean | 15 | 0.2% |
| Belgian | 25 | 0.3% |
| Brazilian | 8 | 0.1% |
| British | 34 | 0.4% |
| British West Indian | 33 | 0.4% |
| Central American | 36 | 0.4% |
| Cherokee | 100 | 1.1% |
| Croatian | 149 | 1.6% |
| Czech | 67 | 0.7% |
| Danish | 8 | 0.1% |
| Eastern European | 7 | 0.1% |
| English | 438 | 4.8% |
| European | 33 | 0.4% |
| French | 57 | 0.6% |
| French Canadian | 15 | 0.2% |
| German | 1,194 | 13.0% |
| Greek | 112 | 1.2% |
| Guatemalan | 36 | 0.4% |
| Hungarian | 32 | 0.4% |
| Indian (Asian) | 24 | 0.3% |
| Irish | 1,001 | 10.9% |
| Italian | 1,468 | 16.0% |
| Jamaican | 25 | 0.3% |
| Lebanese | 139 | 1.5% |
| Lithuanian | 1 | 0.0% |
| Mexican | 6 | 0.1% |
| Nigerian | 151 | 1.6% |
| Northern European | 21 | 0.2% |
| Norwegian | 26 | 0.3% |
| Polish | 241 | 2.6% |
| Portuguese | 151 | 1.6% |
| Puerto Rican | 151 | 1.6% |
| Russian | 122 | 1.3% |
| Scotch-Irish | 75 | 0.8% |
| Scottish | 104 | 1.1% |
| Serbian | 293 | 3.2% |
| Slavic | 7 | 0.1% |
| Slovak | 142 | 1.5% |
| Slovene | 15 | 0.2% |
| South American | 15 | 0.2% |
| Spaniard | 1 | 0.0% |
| Spanish American Indian | 5 | 0.1% |
| Sri Lankan | 9 | 0.1% |
| Subsaharan African | 151 | 1.6% |
| Swedish | 31 | 0.3% |
| Turkish | 4 | 0.0% |
| Ukrainian | 256 | 2.8% |
| Welsh | 64 | 0.7% |
| Yugoslavian | 90 | 1.0% | View All 51 Rows |
Immigrants in Aliquippa
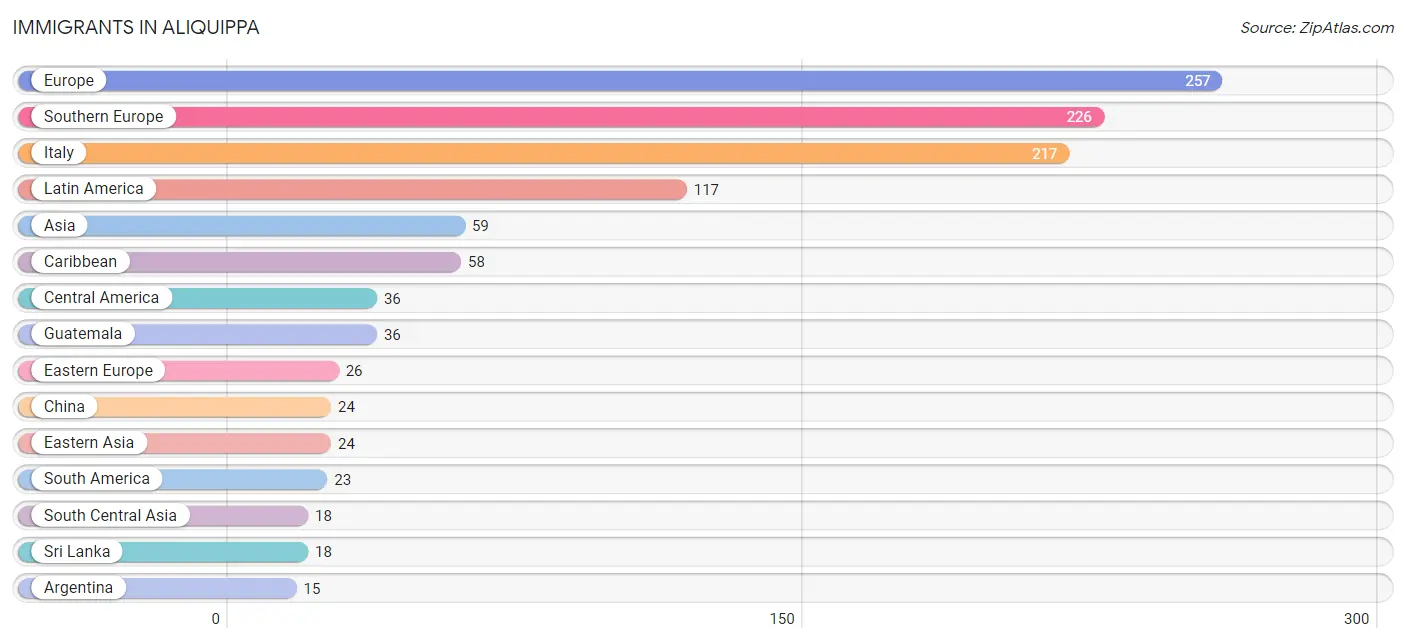
The most numerous immigrant groups reported in Aliquippa came from Europe (257 | 2.8%), Southern Europe (226 | 2.5%), Italy (217 | 2.4%), Latin America (117 | 1.3%), and Asia (59 | 0.6%), together accounting for 9.5% of all Aliquippa residents.
| Immigration Origin | # Population | % Population |
| Argentina | 15 | 0.2% |
| Asia | 59 | 0.6% |
| Brazil | 8 | 0.1% |
| Caribbean | 58 | 0.6% |
| Central America | 36 | 0.4% |
| China | 24 | 0.3% |
| Eastern Asia | 24 | 0.3% |
| Eastern Europe | 26 | 0.3% |
| Europe | 257 | 2.8% |
| Germany | 5 | 0.1% |
| Greece | 9 | 0.1% |
| Guatemala | 36 | 0.4% |
| Italy | 217 | 2.4% |
| Latin America | 117 | 1.3% |
| South America | 23 | 0.3% |
| South Central Asia | 18 | 0.2% |
| South Eastern Asia | 9 | 0.1% |
| Southern Europe | 226 | 2.5% |
| Sri Lanka | 18 | 0.2% |
| Vietnam | 9 | 0.1% |
| Western Asia | 8 | 0.1% |
| Western Europe | 5 | 0.1% | View All 22 Rows |
Sex and Age in Aliquippa
Sex and Age in Aliquippa
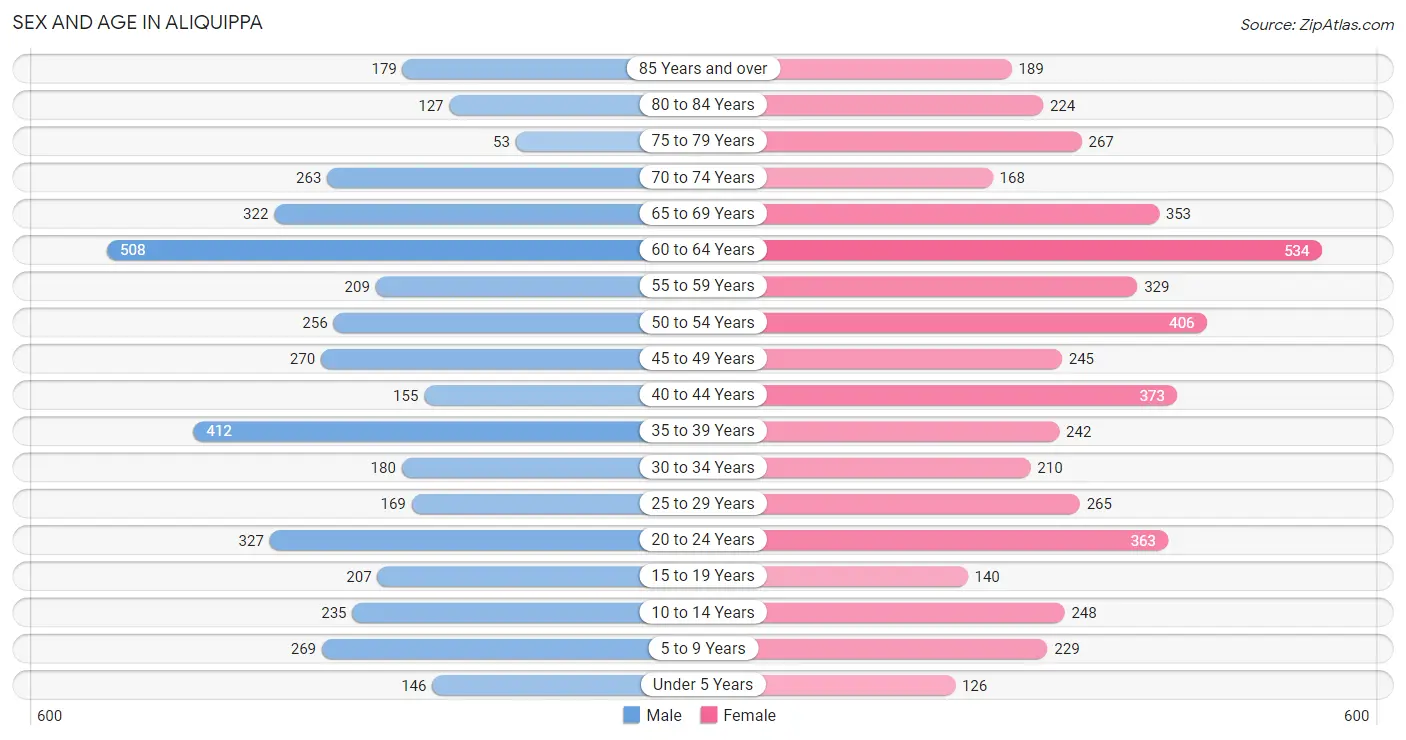
The most populous age groups in Aliquippa are 60 to 64 Years (508 | 11.8%) for men and 60 to 64 Years (534 | 10.9%) for women.
| Age Bracket | Male | Female |
| Under 5 Years | 146 (3.4%) | 126 (2.6%) |
| 5 to 9 Years | 269 (6.3%) | 229 (4.7%) |
| 10 to 14 Years | 235 (5.5%) | 248 (5.1%) |
| 15 to 19 Years | 207 (4.8%) | 140 (2.9%) |
| 20 to 24 Years | 327 (7.6%) | 363 (7.4%) |
| 25 to 29 Years | 169 (3.9%) | 265 (5.4%) |
| 30 to 34 Years | 180 (4.2%) | 210 (4.3%) |
| 35 to 39 Years | 412 (9.6%) | 242 (4.9%) |
| 40 to 44 Years | 155 (3.6%) | 373 (7.6%) |
| 45 to 49 Years | 270 (6.3%) | 245 (5.0%) |
| 50 to 54 Years | 256 (6.0%) | 406 (8.3%) |
| 55 to 59 Years | 209 (4.9%) | 329 (6.7%) |
| 60 to 64 Years | 508 (11.8%) | 534 (10.9%) |
| 65 to 69 Years | 322 (7.5%) | 353 (7.2%) |
| 70 to 74 Years | 263 (6.1%) | 168 (3.4%) |
| 75 to 79 Years | 53 (1.2%) | 267 (5.4%) |
| 80 to 84 Years | 127 (3.0%) | 224 (4.6%) |
| 85 Years and over | 179 (4.2%) | 189 (3.8%) |
| Total | 4,287 (100.0%) | 4,911 (100.0%) |
Families and Households in Aliquippa
Median Family Size in Aliquippa
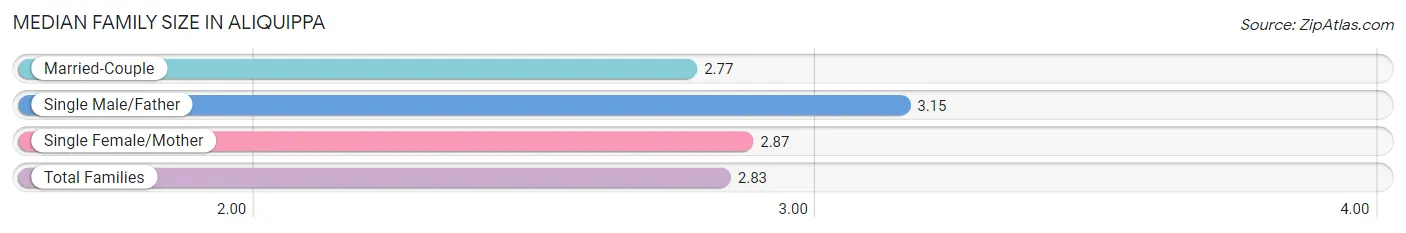
The median family size in Aliquippa is 2.83 persons per family, with single male/father families (131 | 5.7%) accounting for the largest median family size of 3.15 persons per family. On the other hand, married-couple families (1,291 | 56.6%) represent the smallest median family size with 2.77 persons per family.
| Family Type | # Families | Family Size |
| Married-Couple | 1,291 (56.6%) | 2.77 |
| Single Male/Father | 131 (5.7%) | 3.15 |
| Single Female/Mother | 861 (37.7%) | 2.87 |
| Total Families | 2,283 (100.0%) | 2.83 |
Median Household Size in Aliquippa
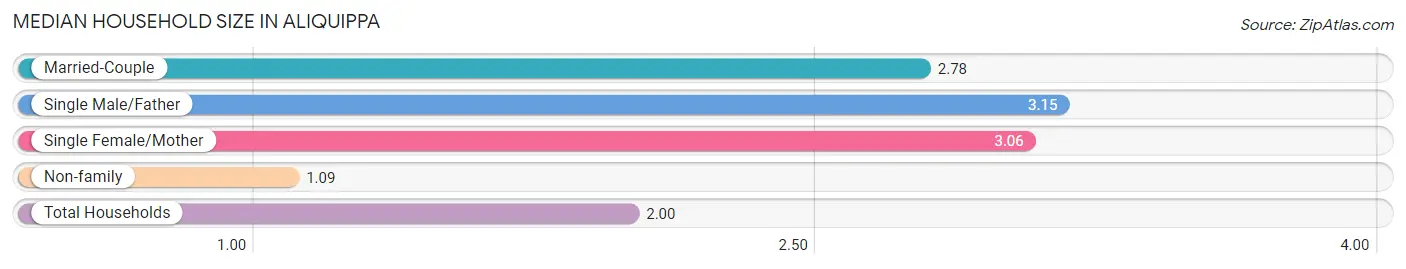
The median household size in Aliquippa is 2.00 persons per household, with single male/father households (131 | 2.9%) accounting for the largest median household size of 3.15 persons per household. non-family households (2,272 | 49.9%) represent the smallest median household size with 1.09 persons per household.
| Household Type | # Households | Household Size |
| Married-Couple | 1,291 (28.3%) | 2.78 |
| Single Male/Father | 131 (2.9%) | 3.15 |
| Single Female/Mother | 861 (18.9%) | 3.06 |
| Non-family | 2,272 (49.9%) | 1.09 |
| Total Households | 4,555 (100.0%) | 2.00 |
Household Size by Marriage Status in Aliquippa
Out of a total of 4,555 households in Aliquippa, 2,283 (50.1%) are family households, while 2,272 (49.9%) are nonfamily households. The most numerous type of family households are 2-person households, comprising 1,314, and the most common type of nonfamily households are 1-person households, comprising 2,119.
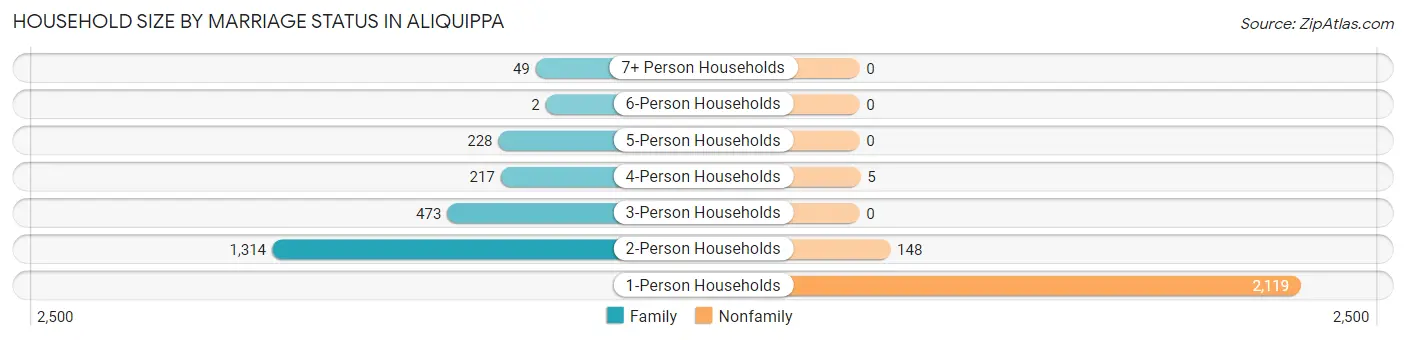
| Household Size | Family Households | Nonfamily Households |
| 1-Person Households | - | 2,119 (46.5%) |
| 2-Person Households | 1,314 (28.8%) | 148 (3.3%) |
| 3-Person Households | 473 (10.4%) | 0 (0.0%) |
| 4-Person Households | 217 (4.8%) | 5 (0.1%) |
| 5-Person Households | 228 (5.0%) | 0 (0.0%) |
| 6-Person Households | 2 (0.0%) | 0 (0.0%) |
| 7+ Person Households | 49 (1.1%) | 0 (0.0%) |
| Total | 2,283 (50.1%) | 2,272 (49.9%) |
Female Fertility in Aliquippa
Fertility by Age in Aliquippa
Average fertility rate in Aliquippa is 4.0 births per 1,000 women. Women in the age bracket of 20 to 34 years have the highest fertility rate with 8.0 births per 1,000 women. Women in the age bracket of 20 to 34 years acount for 100.0% of all women with births.
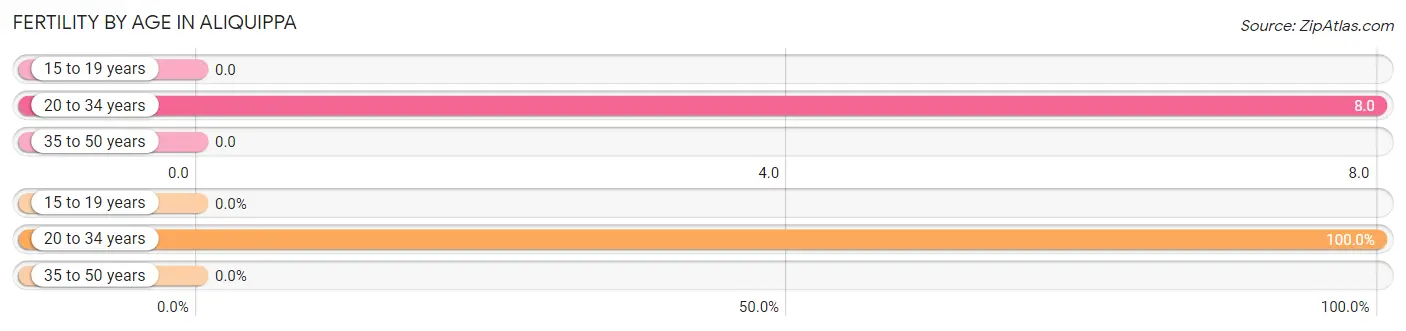
| Age Bracket | Women with Births | Births / 1,000 Women |
| 15 to 19 years | 0 (0.0%) | 0.0 |
| 20 to 34 years | 7 (100.0%) | 8.0 |
| 35 to 50 years | 0 (0.0%) | 0.0 |
| Total | 7 (100.0%) | 4.0 |
Fertility by Age by Marriage Status in Aliquippa
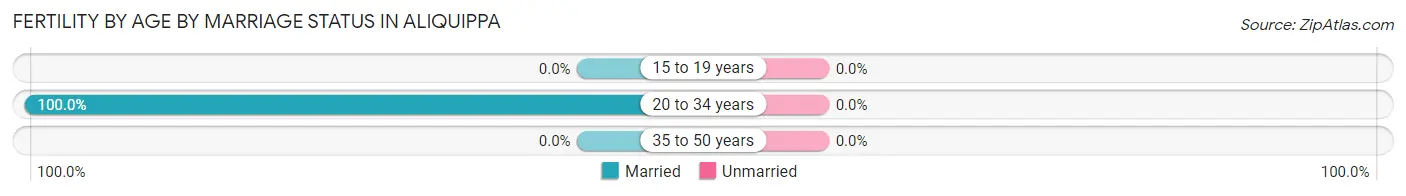
| Age Bracket | Married | Unmarried |
| 15 to 19 years | 0 (0.0%) | 0 (0.0%) |
| 20 to 34 years | 7 (100.0%) | 0 (0.0%) |
| 35 to 50 years | 0 (0.0%) | 0 (0.0%) |
| Total | 7 (100.0%) | 0 (0.0%) |
Fertility by Education in Aliquippa
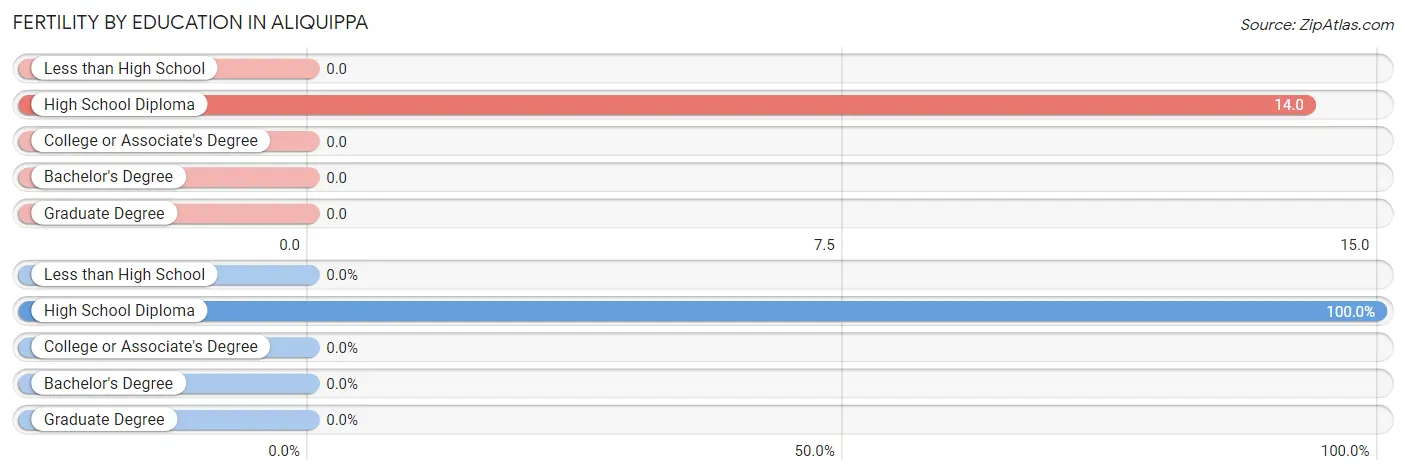
| Educational Attainment | Women with Births | Births / 1,000 Women |
| Less than High School | 0 (0.0%) | 0.0 |
| High School Diploma | 7 (100.0%) | 14.0 |
| College or Associate's Degree | 0 (0.0%) | 0.0 |
| Bachelor's Degree | 0 (0.0%) | 0.0 |
| Graduate Degree | 0 (0.0%) | 0.0 |
| Total | 7 (100.0%) | 4.0 |
Fertility by Education by Marriage Status in Aliquippa
| Educational Attainment | Married | Unmarried |
| Less than High School | 0 (0.0%) | 0 (0.0%) |
| High School Diploma | 7 (100.0%) | 0 (0.0%) |
| College or Associate's Degree | 0 (0.0%) | 0 (0.0%) |
| Bachelor's Degree | 0 (0.0%) | 0 (0.0%) |
| Graduate Degree | 0 (0.0%) | 0 (0.0%) |
| Total | 7 (100.0%) | 0 (0.0%) |
Employment Characteristics in Aliquippa
Employment by Class of Employer in Aliquippa
Among the 3,889 employed individuals in Aliquippa, private company employees (2,729 | 70.2%), not-for-profit organizations (537 | 13.8%), and local government employees (272 | 7.0%) make up the most common classes of employment.
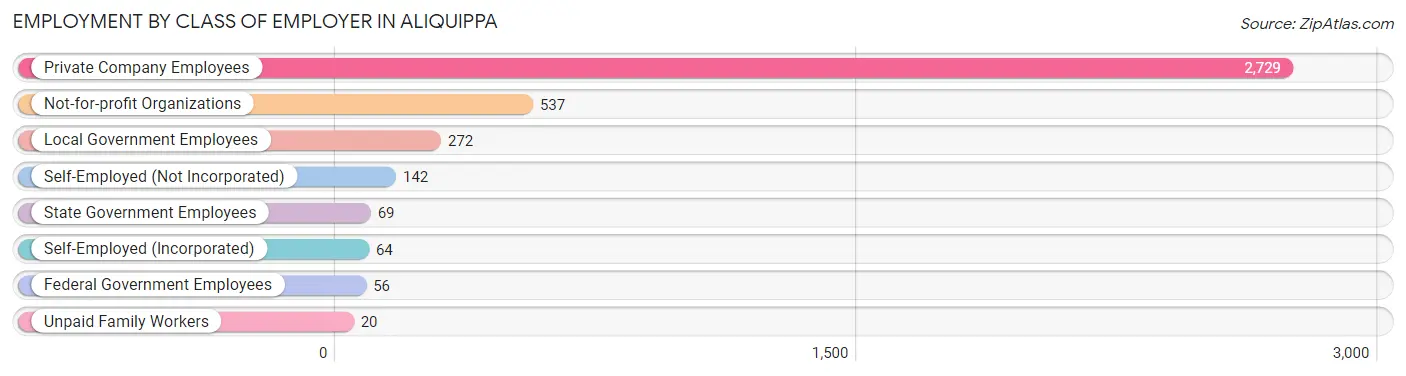
| Employer Class | # Employees | % Employees |
| Private Company Employees | 2,729 | 70.2% |
| Self-Employed (Incorporated) | 64 | 1.7% |
| Self-Employed (Not Incorporated) | 142 | 3.6% |
| Not-for-profit Organizations | 537 | 13.8% |
| Local Government Employees | 272 | 7.0% |
| State Government Employees | 69 | 1.8% |
| Federal Government Employees | 56 | 1.4% |
| Unpaid Family Workers | 20 | 0.5% |
| Total | 3,889 | 100.0% |
Employment Status by Age in Aliquippa
According to the labor force statistics for Aliquippa, out of the total population over 16 years of age (7,890), 55.2% or 4,355 individuals are in the labor force, with 8.4% or 366 of them unemployed. The age group with the highest labor force participation rate is 20 to 24 years, with 93.0% or 642 individuals in the labor force. Within the labor force, the 16 to 19 years age range has the highest percentage of unemployed individuals, with 43.2% or 60 of them being unemployed.
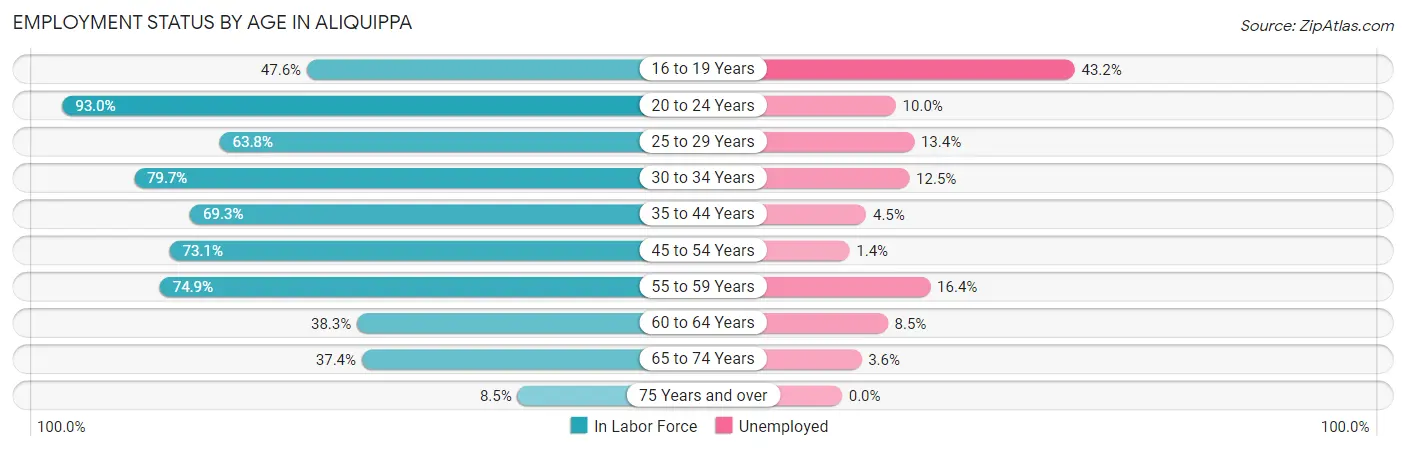
| Age Bracket | In Labor Force | Unemployed |
| 16 to 19 Years | 139 (47.6%) | 60 (43.2%) |
| 20 to 24 Years | 642 (93.0%) | 64 (10.0%) |
| 25 to 29 Years | 277 (63.8%) | 37 (13.4%) |
| 30 to 34 Years | 311 (79.7%) | 39 (12.5%) |
| 35 to 44 Years | 819 (69.3%) | 37 (4.5%) |
| 45 to 54 Years | 860 (73.1%) | 12 (1.4%) |
| 55 to 59 Years | 403 (74.9%) | 66 (16.4%) |
| 60 to 64 Years | 399 (38.3%) | 34 (8.5%) |
| 65 to 74 Years | 414 (37.4%) | 15 (3.6%) |
| 75 Years and over | 88 (8.5%) | 0 (0.0%) |
| Total | 4,355 (55.2%) | 366 (8.4%) |
Employment Status by Educational Attainment in Aliquippa
According to labor force statistics for Aliquippa, 64.4% of individuals (3,067) out of the total population between 25 and 64 years of age (4,763) are in the labor force, with 7.3% or 224 of them being unemployed. The group with the highest labor force participation rate are those with the educational attainment of bachelor's degree or higher, with 70.9% or 804 individuals in the labor force. Within the labor force, individuals with college / associate degree education have the highest percentage of unemployment, with 11.4% or 124 of them being unemployed.
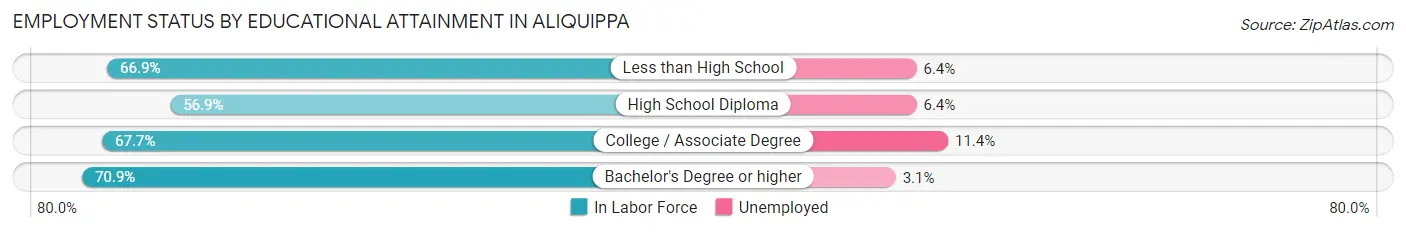
| Educational Attainment | In Labor Force | Unemployed |
| Less than High School | 172 (66.9%) | 16 (6.4%) |
| High School Diploma | 1,007 (56.9%) | 113 (6.4%) |
| College / Associate Degree | 1,085 (67.7%) | 183 (11.4%) |
| Bachelor's Degree or higher | 804 (70.9%) | 35 (3.1%) |
| Total | 3,067 (64.4%) | 348 (7.3%) |
Employment Occupations by Sex in Aliquippa
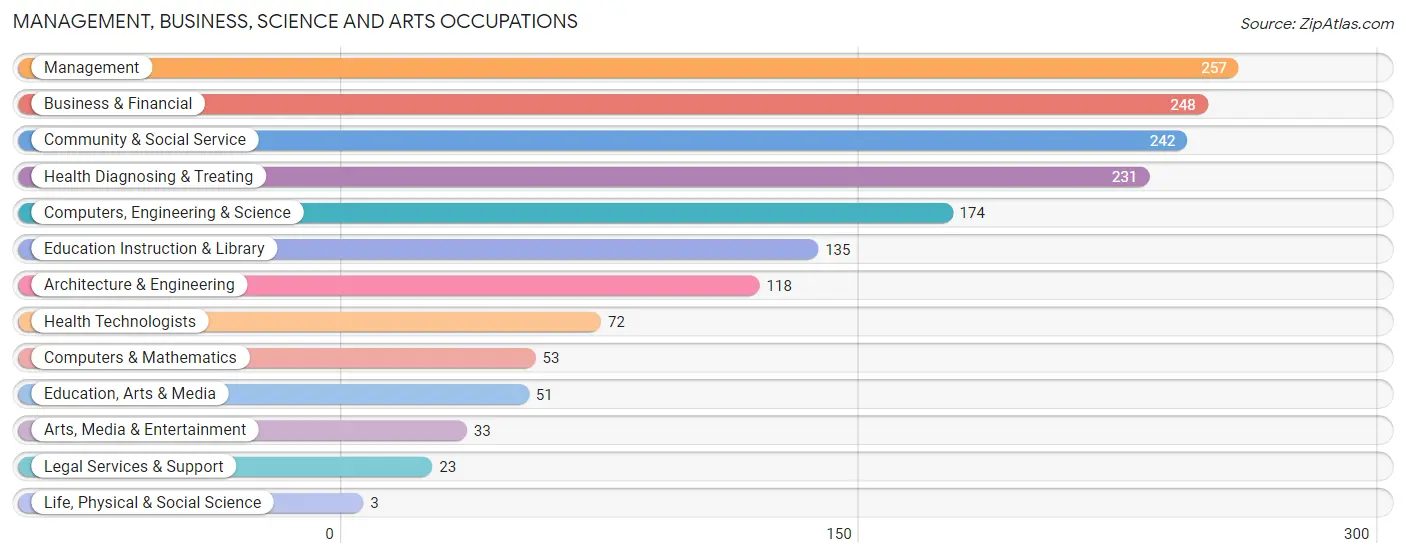
Management, Business, Science and Arts Occupations
The most common Management, Business, Science and Arts occupations in Aliquippa are Management (257 | 6.4%), Business & Financial (248 | 6.2%), Community & Social Service (242 | 6.1%), Health Diagnosing & Treating (231 | 5.8%), and Computers, Engineering & Science (174 | 4.4%).
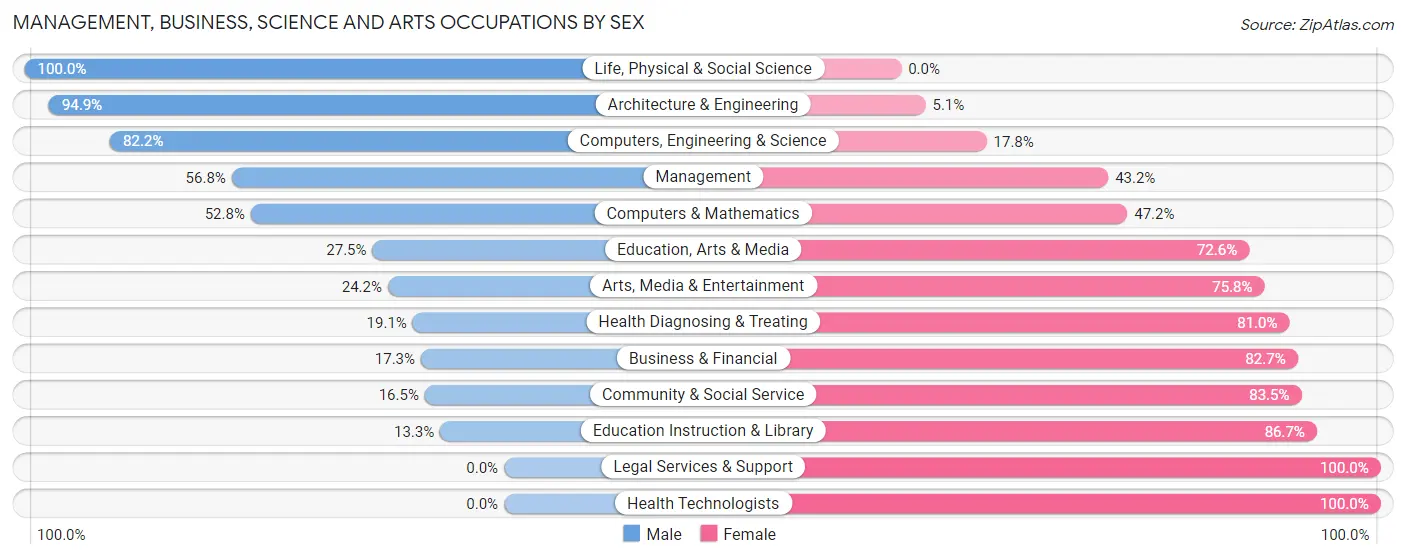
Management, Business, Science and Arts Occupations by Sex
Within the Management, Business, Science and Arts occupations in Aliquippa, the most male-oriented occupations are Life, Physical & Social Science (100.0%), Architecture & Engineering (94.9%), and Computers, Engineering & Science (82.2%), while the most female-oriented occupations are Legal Services & Support (100.0%), Health Technologists (100.0%), and Education Instruction & Library (86.7%).
| Occupation | Male | Female |
| Management | 146 (56.8%) | 111 (43.2%) |
| Business & Financial | 43 (17.3%) | 205 (82.7%) |
| Computers, Engineering & Science | 143 (82.2%) | 31 (17.8%) |
| Computers & Mathematics | 28 (52.8%) | 25 (47.2%) |
| Architecture & Engineering | 112 (94.9%) | 6 (5.1%) |
| Life, Physical & Social Science | 3 (100.0%) | 0 (0.0%) |
| Community & Social Service | 40 (16.5%) | 202 (83.5%) |
| Education, Arts & Media | 14 (27.5%) | 37 (72.6%) |
| Legal Services & Support | 0 (0.0%) | 23 (100.0%) |
| Education Instruction & Library | 18 (13.3%) | 117 (86.7%) |
| Arts, Media & Entertainment | 8 (24.2%) | 25 (75.8%) |
| Health Diagnosing & Treating | 44 (19.1%) | 187 (80.9%) |
| Health Technologists | 0 (0.0%) | 72 (100.0%) |
| Total (Category) | 416 (36.1%) | 736 (63.9%) |
| Total (Overall) | 1,879 (47.1%) | 2,109 (52.9%) |
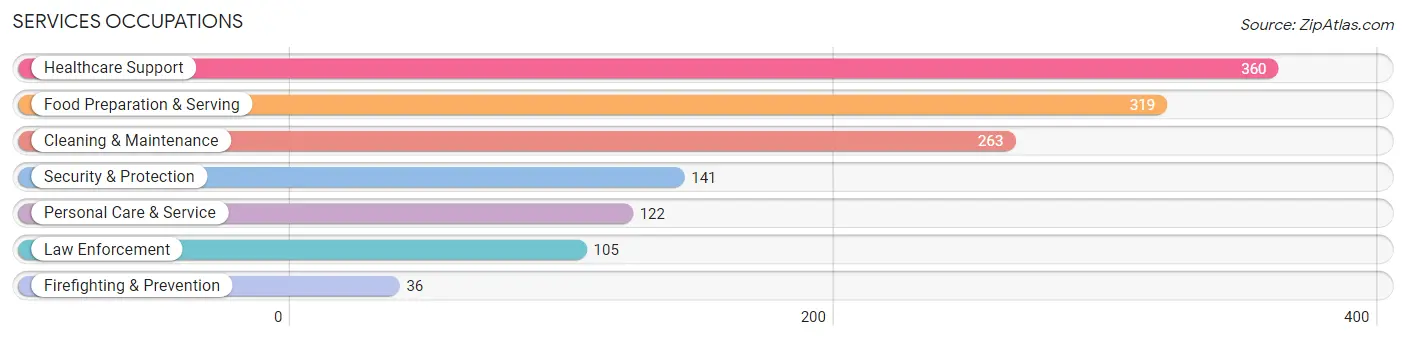
Services Occupations
The most common Services occupations in Aliquippa are Healthcare Support (360 | 9.0%), Food Preparation & Serving (319 | 8.0%), Cleaning & Maintenance (263 | 6.6%), Security & Protection (141 | 3.5%), and Personal Care & Service (122 | 3.1%).
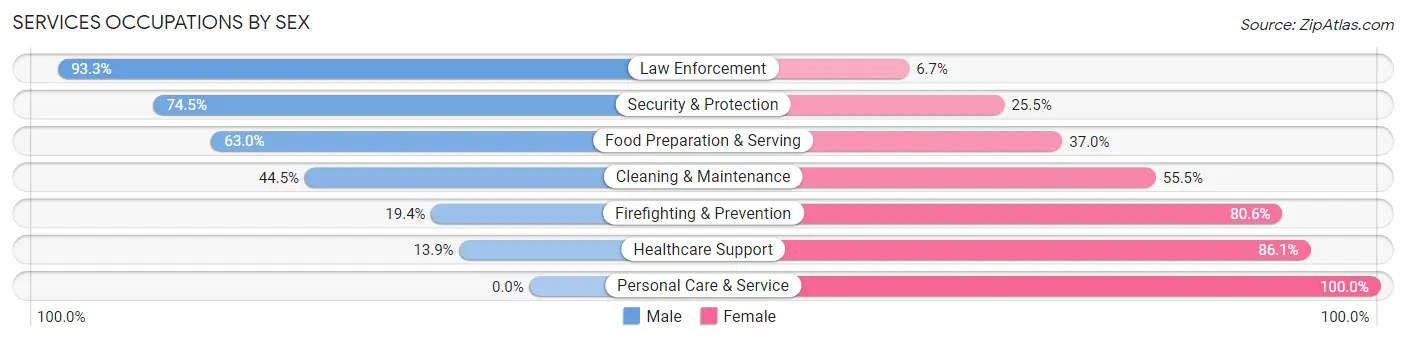
Services Occupations by Sex
Within the Services occupations in Aliquippa, the most male-oriented occupations are Law Enforcement (93.3%), Security & Protection (74.5%), and Food Preparation & Serving (63.0%), while the most female-oriented occupations are Personal Care & Service (100.0%), Healthcare Support (86.1%), and Firefighting & Prevention (80.6%).
| Occupation | Male | Female |
| Healthcare Support | 50 (13.9%) | 310 (86.1%) |
| Security & Protection | 105 (74.5%) | 36 (25.5%) |
| Firefighting & Prevention | 7 (19.4%) | 29 (80.6%) |
| Law Enforcement | 98 (93.3%) | 7 (6.7%) |
| Food Preparation & Serving | 201 (63.0%) | 118 (37.0%) |
| Cleaning & Maintenance | 117 (44.5%) | 146 (55.5%) |
| Personal Care & Service | 0 (0.0%) | 122 (100.0%) |
| Total (Category) | 473 (39.3%) | 732 (60.8%) |
| Total (Overall) | 1,879 (47.1%) | 2,109 (52.9%) |
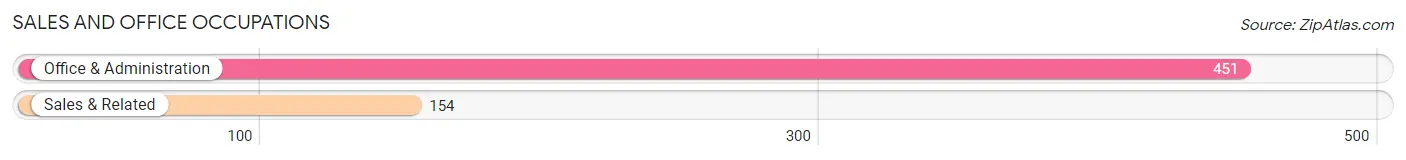
Sales and Office Occupations
The most common Sales and Office occupations in Aliquippa are Office & Administration (451 | 11.3%), and Sales & Related (154 | 3.9%).
Sales and Office Occupations by Sex
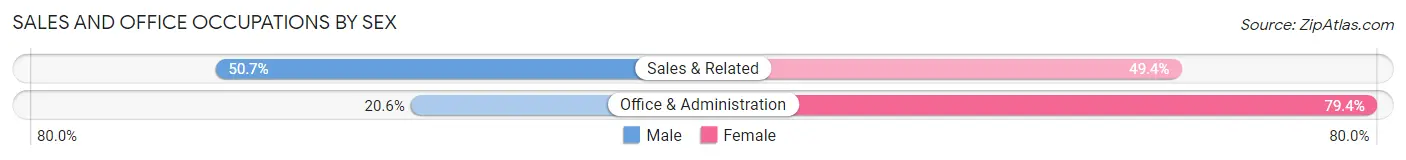
| Occupation | Male | Female |
| Sales & Related | 78 (50.6%) | 76 (49.3%) |
| Office & Administration | 93 (20.6%) | 358 (79.4%) |
| Total (Category) | 171 (28.3%) | 434 (71.7%) |
| Total (Overall) | 1,879 (47.1%) | 2,109 (52.9%) |
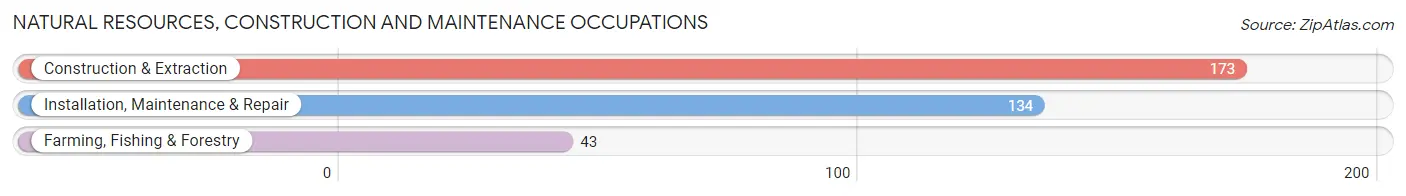
Natural Resources, Construction and Maintenance Occupations
The most common Natural Resources, Construction and Maintenance occupations in Aliquippa are Construction & Extraction (173 | 4.3%), Installation, Maintenance & Repair (134 | 3.4%), and Farming, Fishing & Forestry (43 | 1.1%).
Natural Resources, Construction and Maintenance Occupations by Sex
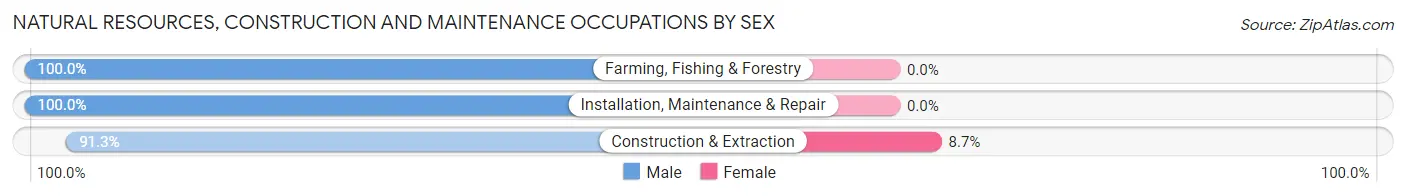
| Occupation | Male | Female |
| Farming, Fishing & Forestry | 43 (100.0%) | 0 (0.0%) |
| Construction & Extraction | 158 (91.3%) | 15 (8.7%) |
| Installation, Maintenance & Repair | 134 (100.0%) | 0 (0.0%) |
| Total (Category) | 335 (95.7%) | 15 (4.3%) |
| Total (Overall) | 1,879 (47.1%) | 2,109 (52.9%) |
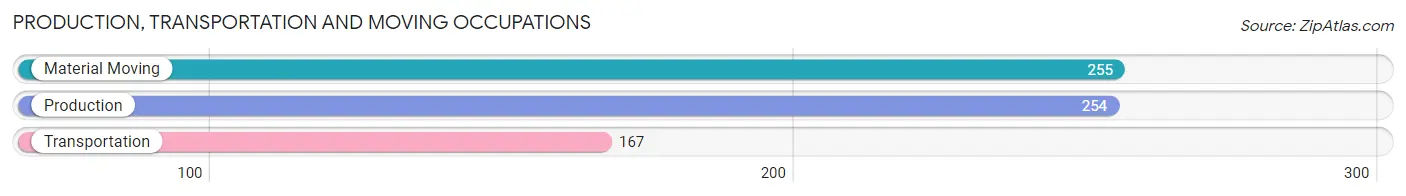
Production, Transportation and Moving Occupations
The most common Production, Transportation and Moving occupations in Aliquippa are Material Moving (255 | 6.4%), Production (254 | 6.4%), and Transportation (167 | 4.2%).
Production, Transportation and Moving Occupations by Sex
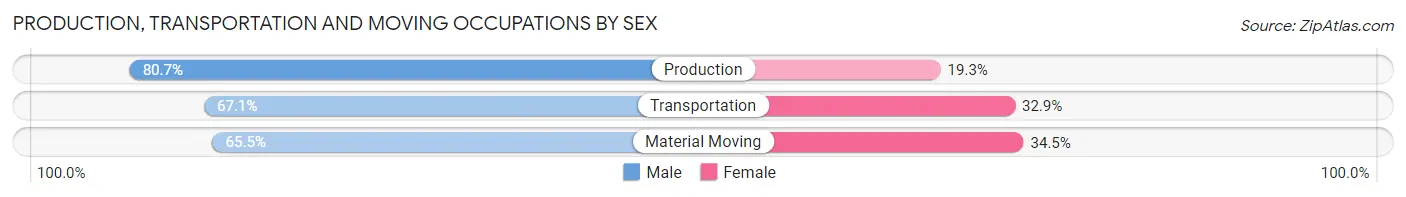
| Occupation | Male | Female |
| Production | 205 (80.7%) | 49 (19.3%) |
| Transportation | 112 (67.1%) | 55 (32.9%) |
| Material Moving | 167 (65.5%) | 88 (34.5%) |
| Total (Category) | 484 (71.6%) | 192 (28.4%) |
| Total (Overall) | 1,879 (47.1%) | 2,109 (52.9%) |
Employment Industries by Sex in Aliquippa
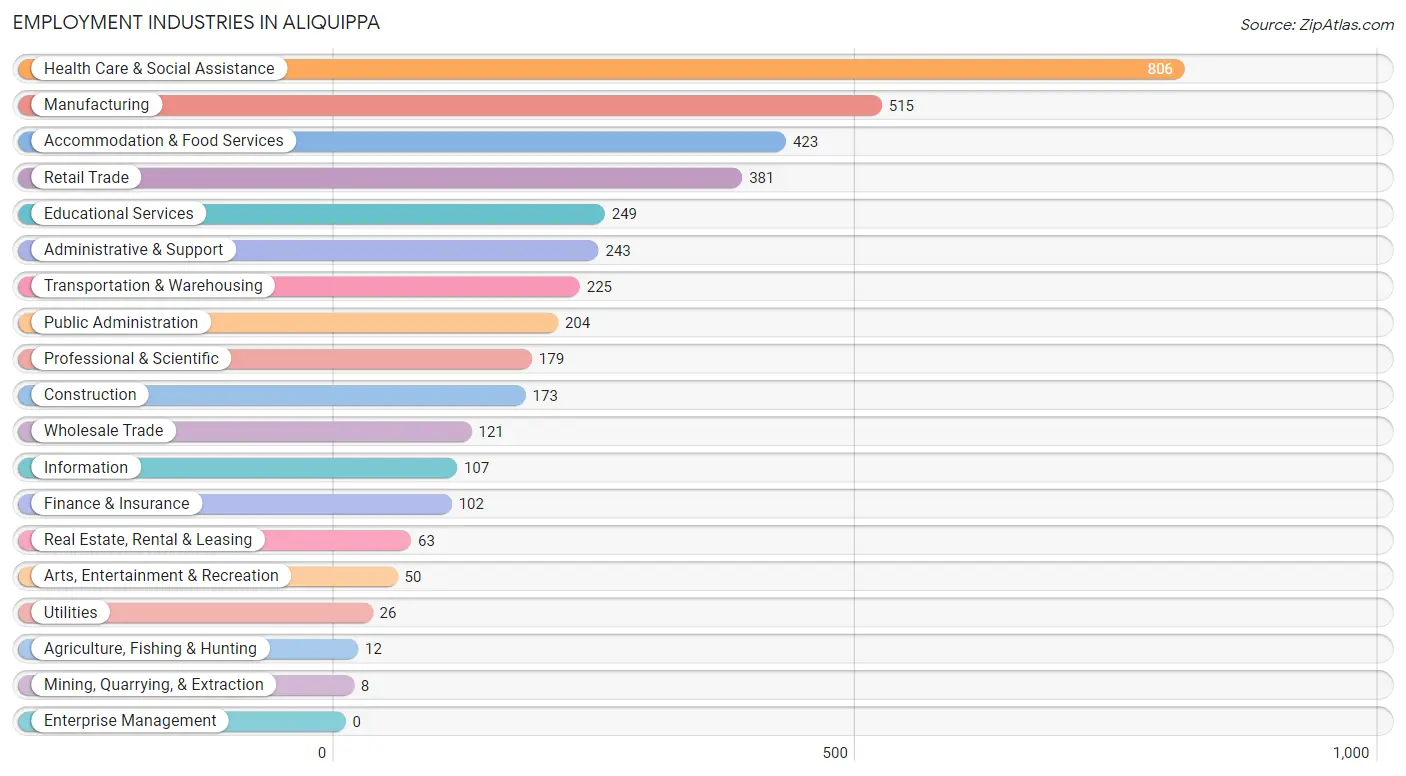
Employment Industries in Aliquippa
The major employment industries in Aliquippa include Health Care & Social Assistance (806 | 20.2%), Manufacturing (515 | 12.9%), Accommodation & Food Services (423 | 10.6%), Retail Trade (381 | 9.6%), and Educational Services (249 | 6.2%).
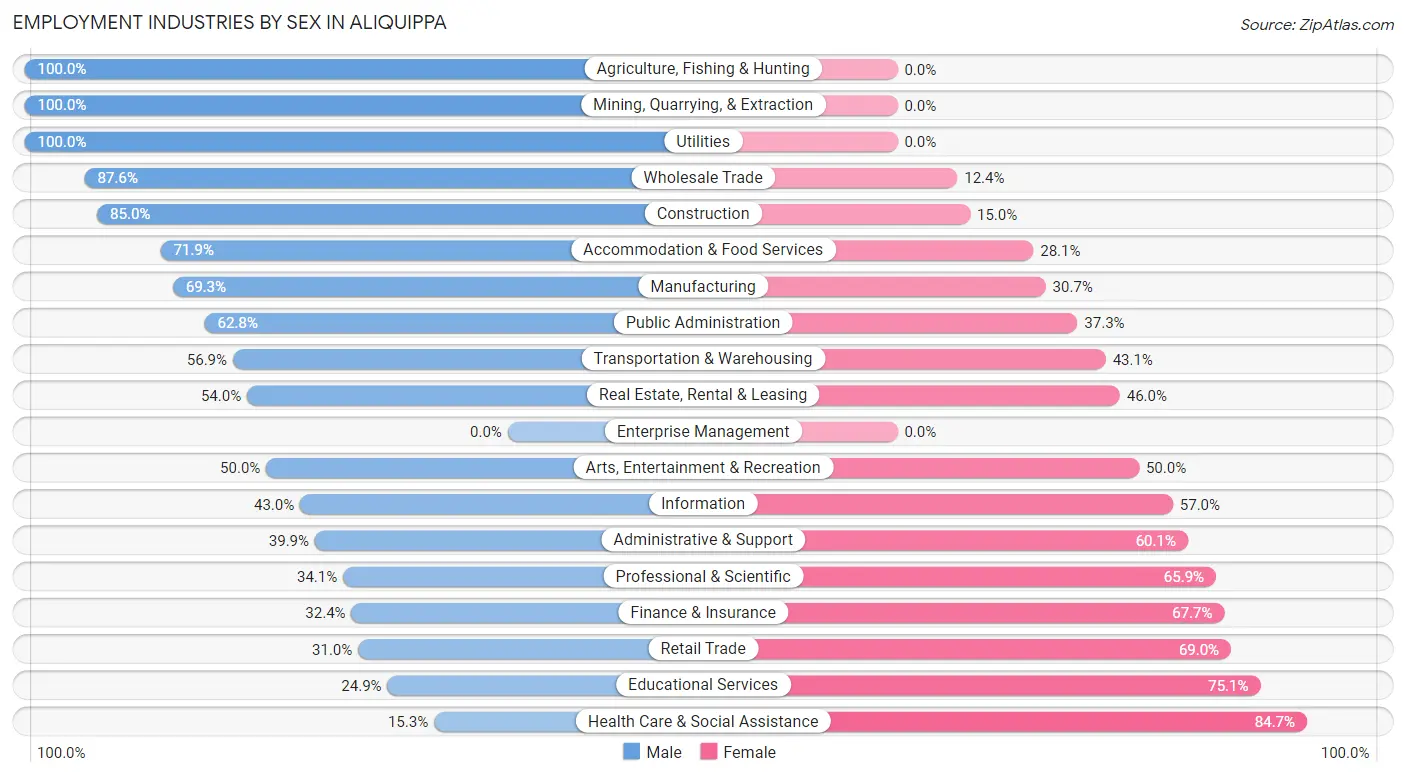
Employment Industries by Sex in Aliquippa
The Aliquippa industries that see more men than women are Agriculture, Fishing & Hunting (100.0%), Mining, Quarrying, & Extraction (100.0%), and Utilities (100.0%), whereas the industries that tend to have a higher number of women are Health Care & Social Assistance (84.7%), Educational Services (75.1%), and Retail Trade (69.0%).
| Industry | Male | Female |
| Agriculture, Fishing & Hunting | 12 (100.0%) | 0 (0.0%) |
| Mining, Quarrying, & Extraction | 8 (100.0%) | 0 (0.0%) |
| Construction | 147 (85.0%) | 26 (15.0%) |
| Manufacturing | 357 (69.3%) | 158 (30.7%) |
| Wholesale Trade | 106 (87.6%) | 15 (12.4%) |
| Retail Trade | 118 (31.0%) | 263 (69.0%) |
| Transportation & Warehousing | 128 (56.9%) | 97 (43.1%) |
| Utilities | 26 (100.0%) | 0 (0.0%) |
| Information | 46 (43.0%) | 61 (57.0%) |
| Finance & Insurance | 33 (32.4%) | 69 (67.6%) |
| Real Estate, Rental & Leasing | 34 (54.0%) | 29 (46.0%) |
| Professional & Scientific | 61 (34.1%) | 118 (65.9%) |
| Enterprise Management | 0 (0.0%) | 0 (0.0%) |
| Administrative & Support | 97 (39.9%) | 146 (60.1%) |
| Educational Services | 62 (24.9%) | 187 (75.1%) |
| Health Care & Social Assistance | 123 (15.3%) | 683 (84.7%) |
| Arts, Entertainment & Recreation | 25 (50.0%) | 25 (50.0%) |
| Accommodation & Food Services | 304 (71.9%) | 119 (28.1%) |
| Public Administration | 128 (62.7%) | 76 (37.2%) |
| Total | 1,879 (47.1%) | 2,109 (52.9%) |
Education in Aliquippa
School Enrollment in Aliquippa
The most common levels of schooling among the 1,663 students in Aliquippa are elementary school (451 | 27.1%), college / undergraduate (356 | 21.4%), and high school (331 | 19.9%).
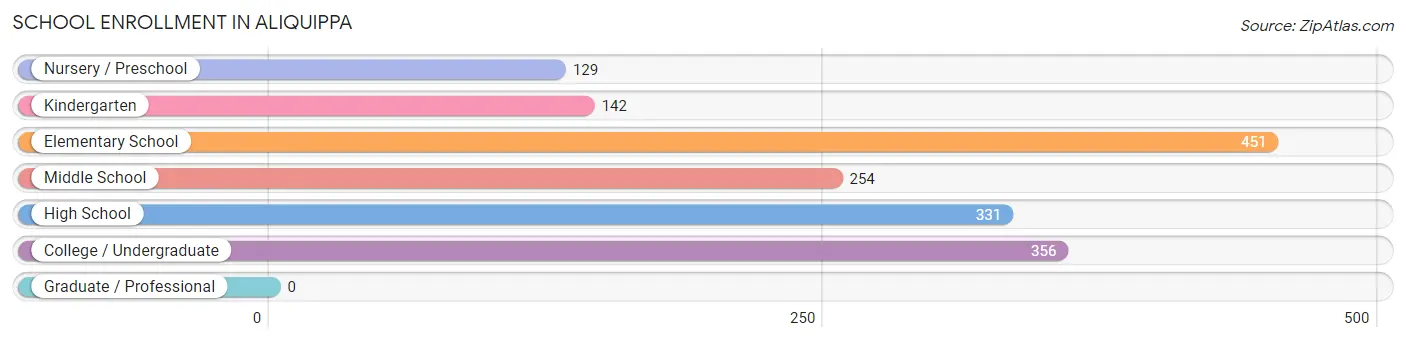
| School Level | # Students | % Students |
| Nursery / Preschool | 129 | 7.8% |
| Kindergarten | 142 | 8.5% |
| Elementary School | 451 | 27.1% |
| Middle School | 254 | 15.3% |
| High School | 331 | 19.9% |
| College / Undergraduate | 356 | 21.4% |
| Graduate / Professional | 0 | 0.0% |
| Total | 1,663 | 100.0% |
School Enrollment by Age by Funding Source in Aliquippa
Out of a total of 1,663 students who are enrolled in schools in Aliquippa, 196 (11.8%) attend a private institution, while the remaining 1,467 (88.2%) are enrolled in public schools. The age group of 15 to 17 year olds has the highest likelihood of being enrolled in private schools, with 56 (25.6% in the age bracket) enrolled. Conversely, the age group of 5 to 9 year old has the lowest likelihood of being enrolled in a private school, with 466 (100.0% in the age bracket) attending a public institution.
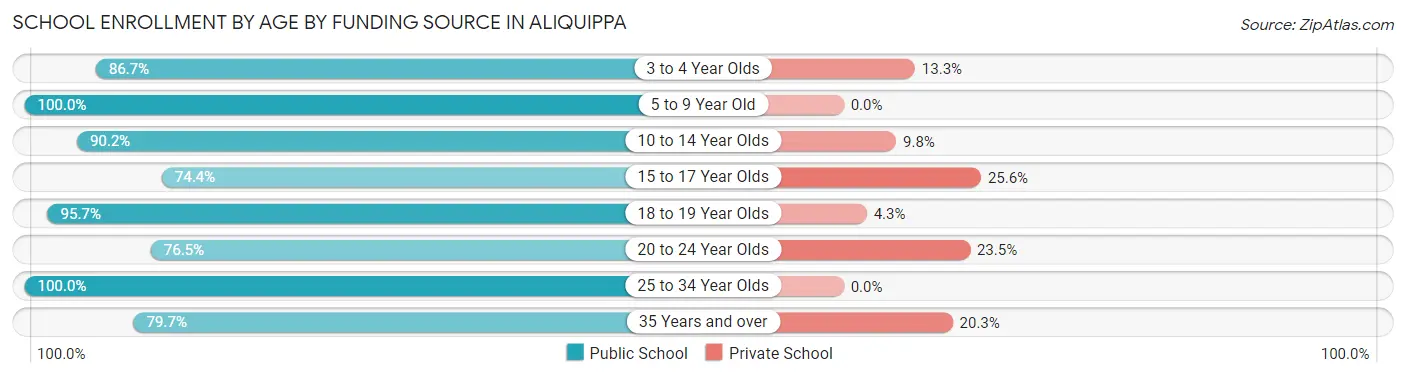
| Age Bracket | Public School | Private School |
| 3 to 4 Year Olds | 98 (86.7%) | 15 (13.3%) |
| 5 to 9 Year Old | 466 (100.0%) | 0 (0.0%) |
| 10 to 14 Year Olds | 407 (90.2%) | 44 (9.8%) |
| 15 to 17 Year Olds | 163 (74.4%) | 56 (25.6%) |
| 18 to 19 Year Olds | 67 (95.7%) | 3 (4.3%) |
| 20 to 24 Year Olds | 208 (76.5%) | 64 (23.5%) |
| 25 to 34 Year Olds | 3 (100.0%) | 0 (0.0%) |
| 35 Years and over | 55 (79.7%) | 14 (20.3%) |
| Total | 1,467 (88.2%) | 196 (11.8%) |
Educational Attainment by Field of Study in Aliquippa
Business (555 | 38.1%), science & technology (165 | 11.3%), education (165 | 11.3%), arts & humanities (125 | 8.6%), and psychology (91 | 6.2%) are the most common fields of study among 1,456 individuals in Aliquippa who have obtained a bachelor's degree or higher.
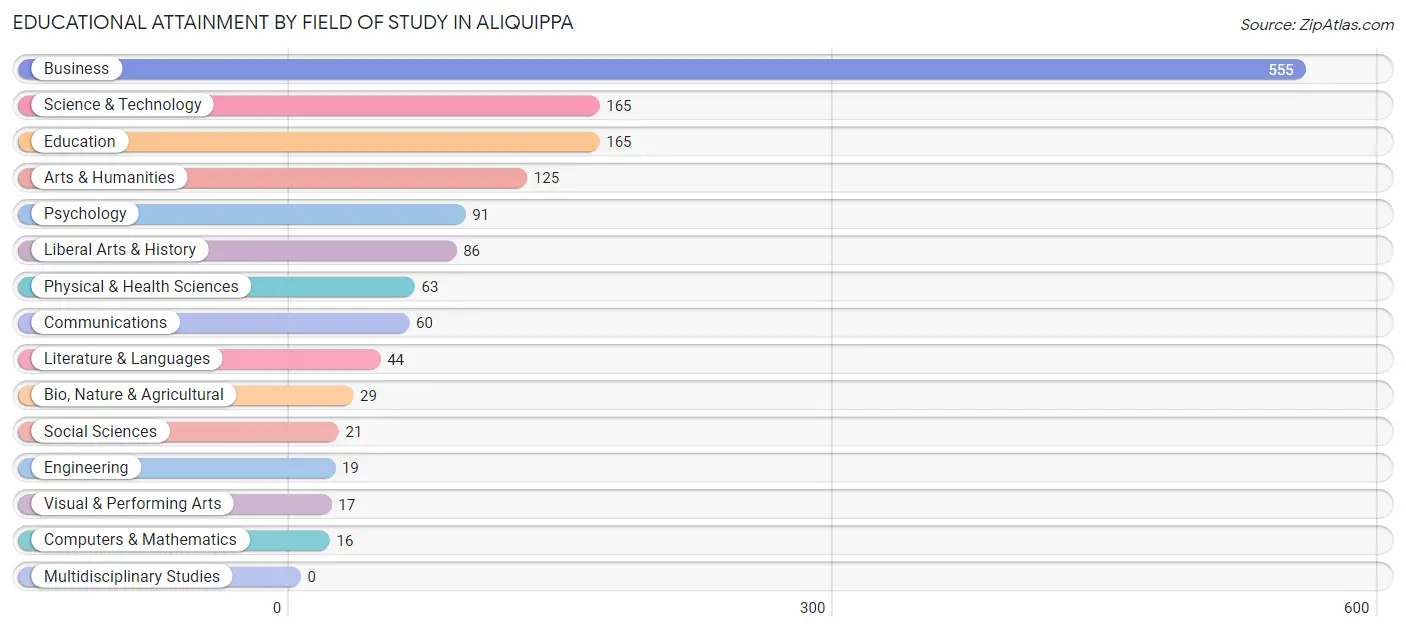
| Field of Study | # Graduates | % Graduates |
| Computers & Mathematics | 16 | 1.1% |
| Bio, Nature & Agricultural | 29 | 2.0% |
| Physical & Health Sciences | 63 | 4.3% |
| Psychology | 91 | 6.2% |
| Social Sciences | 21 | 1.4% |
| Engineering | 19 | 1.3% |
| Multidisciplinary Studies | 0 | 0.0% |
| Science & Technology | 165 | 11.3% |
| Business | 555 | 38.1% |
| Education | 165 | 11.3% |
| Literature & Languages | 44 | 3.0% |
| Liberal Arts & History | 86 | 5.9% |
| Visual & Performing Arts | 17 | 1.2% |
| Communications | 60 | 4.1% |
| Arts & Humanities | 125 | 8.6% |
| Total | 1,456 | 100.0% |
Transportation & Commute in Aliquippa
Vehicle Availability by Sex in Aliquippa
The most prevalent vehicle ownership categories in Aliquippa are males with 2 vehicles (853, accounting for 46.7%) and females with 2 vehicles (962, making up 41.9%).
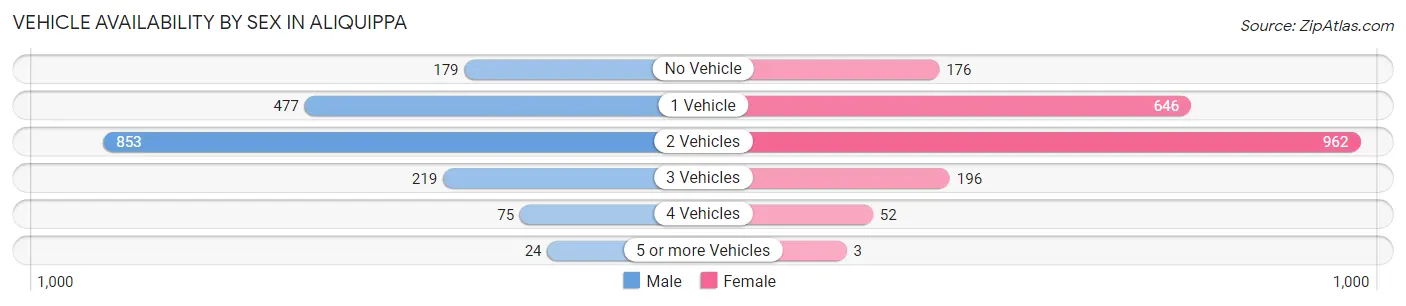
| Vehicles Available | Male | Female |
| No Vehicle | 179 (9.8%) | 176 (8.6%) |
| 1 Vehicle | 477 (26.1%) | 646 (31.7%) |
| 2 Vehicles | 853 (46.7%) | 962 (47.3%) |
| 3 Vehicles | 219 (12.0%) | 196 (9.6%) |
| 4 Vehicles | 75 (4.1%) | 52 (2.6%) |
| 5 or more Vehicles | 24 (1.3%) | 3 (0.2%) |
| Total | 1,827 (100.0%) | 2,035 (100.0%) |
Commute Time in Aliquippa
The most frequently occuring commute durations in Aliquippa are 20 to 24 minutes (560 commuters, 16.8%), 15 to 19 minutes (532 commuters, 15.9%), and 10 to 14 minutes (477 commuters, 14.3%).
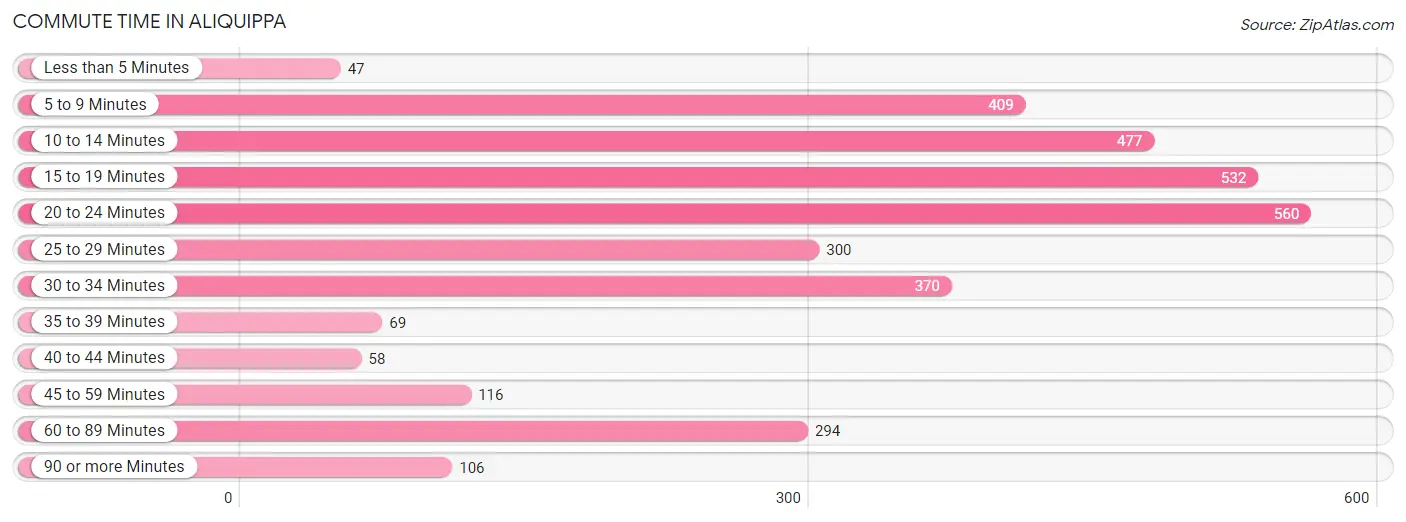
| Commute Time | # Commuters | % Commuters |
| Less than 5 Minutes | 47 | 1.4% |
| 5 to 9 Minutes | 409 | 12.2% |
| 10 to 14 Minutes | 477 | 14.3% |
| 15 to 19 Minutes | 532 | 15.9% |
| 20 to 24 Minutes | 560 | 16.8% |
| 25 to 29 Minutes | 300 | 9.0% |
| 30 to 34 Minutes | 370 | 11.1% |
| 35 to 39 Minutes | 69 | 2.1% |
| 40 to 44 Minutes | 58 | 1.7% |
| 45 to 59 Minutes | 116 | 3.5% |
| 60 to 89 Minutes | 294 | 8.8% |
| 90 or more Minutes | 106 | 3.2% |
Commute Time by Sex in Aliquippa
The most common commute times in Aliquippa are 15 to 19 minutes (297 commuters, 18.0%) for males and 30 to 34 minutes (285 commuters, 16.8%) for females.
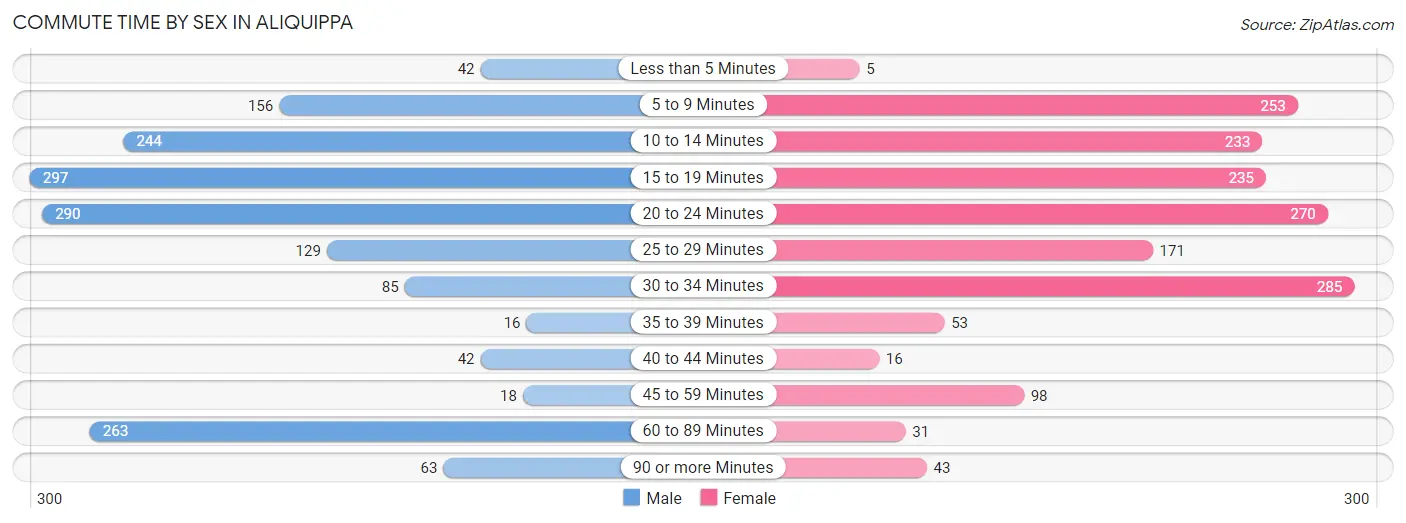
| Commute Time | Male | Female |
| Less than 5 Minutes | 42 (2.5%) | 5 (0.3%) |
| 5 to 9 Minutes | 156 (9.5%) | 253 (14.9%) |
| 10 to 14 Minutes | 244 (14.8%) | 233 (13.8%) |
| 15 to 19 Minutes | 297 (18.0%) | 235 (13.9%) |
| 20 to 24 Minutes | 290 (17.6%) | 270 (16.0%) |
| 25 to 29 Minutes | 129 (7.8%) | 171 (10.1%) |
| 30 to 34 Minutes | 85 (5.2%) | 285 (16.8%) |
| 35 to 39 Minutes | 16 (1.0%) | 53 (3.1%) |
| 40 to 44 Minutes | 42 (2.5%) | 16 (0.9%) |
| 45 to 59 Minutes | 18 (1.1%) | 98 (5.8%) |
| 60 to 89 Minutes | 263 (16.0%) | 31 (1.8%) |
| 90 or more Minutes | 63 (3.8%) | 43 (2.5%) |
Time of Departure to Work by Sex in Aliquippa
The most frequent times of departure to work in Aliquippa are 5:00 AM to 5:29 AM (202, 12.3%) for males and 7:30 AM to 7:59 AM (278, 16.4%) for females.
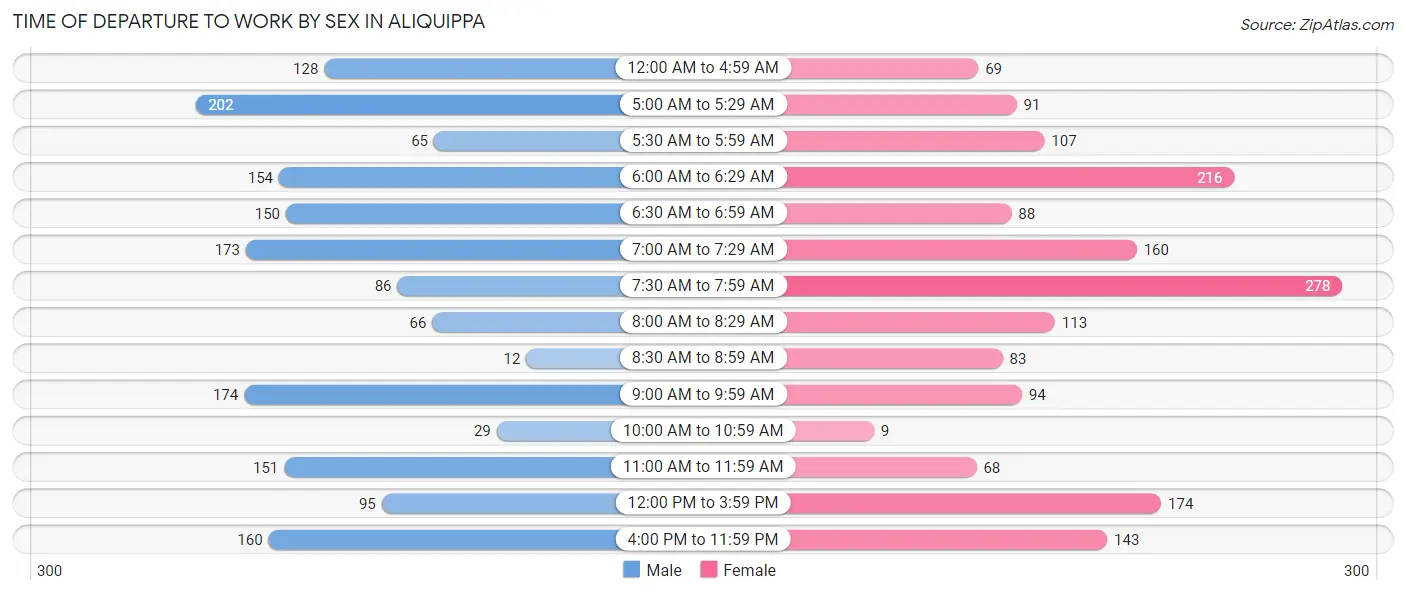
| Time of Departure | Male | Female |
| 12:00 AM to 4:59 AM | 128 (7.8%) | 69 (4.1%) |
| 5:00 AM to 5:29 AM | 202 (12.3%) | 91 (5.4%) |
| 5:30 AM to 5:59 AM | 65 (4.0%) | 107 (6.3%) |
| 6:00 AM to 6:29 AM | 154 (9.4%) | 216 (12.8%) |
| 6:30 AM to 6:59 AM | 150 (9.1%) | 88 (5.2%) |
| 7:00 AM to 7:29 AM | 173 (10.5%) | 160 (9.5%) |
| 7:30 AM to 7:59 AM | 86 (5.2%) | 278 (16.4%) |
| 8:00 AM to 8:29 AM | 66 (4.0%) | 113 (6.7%) |
| 8:30 AM to 8:59 AM | 12 (0.7%) | 83 (4.9%) |
| 9:00 AM to 9:59 AM | 174 (10.6%) | 94 (5.6%) |
| 10:00 AM to 10:59 AM | 29 (1.8%) | 9 (0.5%) |
| 11:00 AM to 11:59 AM | 151 (9.2%) | 68 (4.0%) |
| 12:00 PM to 3:59 PM | 95 (5.8%) | 174 (10.3%) |
| 4:00 PM to 11:59 PM | 160 (9.7%) | 143 (8.5%) |
| Total | 1,645 (100.0%) | 1,693 (100.0%) |
Housing Occupancy in Aliquippa
Occupancy by Ownership in Aliquippa
Of the total 4,555 dwellings in Aliquippa, owner-occupied units account for 2,691 (59.1%), while renter-occupied units make up 1,864 (40.9%).
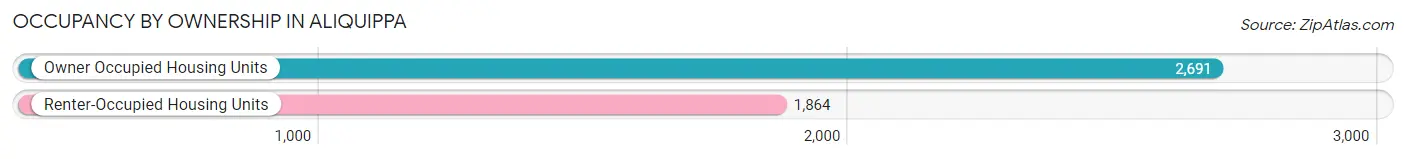
| Occupancy | # Housing Units | % Housing Units |
| Owner Occupied Housing Units | 2,691 | 59.1% |
| Renter-Occupied Housing Units | 1,864 | 40.9% |
| Total Occupied Housing Units | 4,555 | 100.0% |
Occupancy by Household Size in Aliquippa
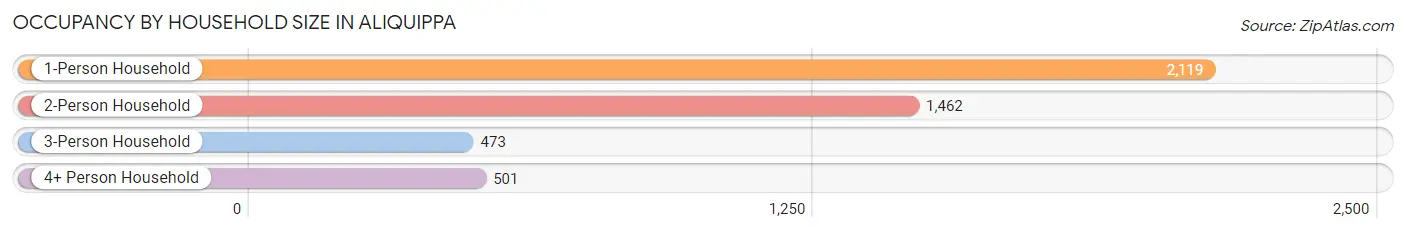
| Household Size | # Housing Units | % Housing Units |
| 1-Person Household | 2,119 | 46.5% |
| 2-Person Household | 1,462 | 32.1% |
| 3-Person Household | 473 | 10.4% |
| 4+ Person Household | 501 | 11.0% |
| Total Housing Units | 4,555 | 100.0% |
Occupancy by Ownership by Household Size in Aliquippa
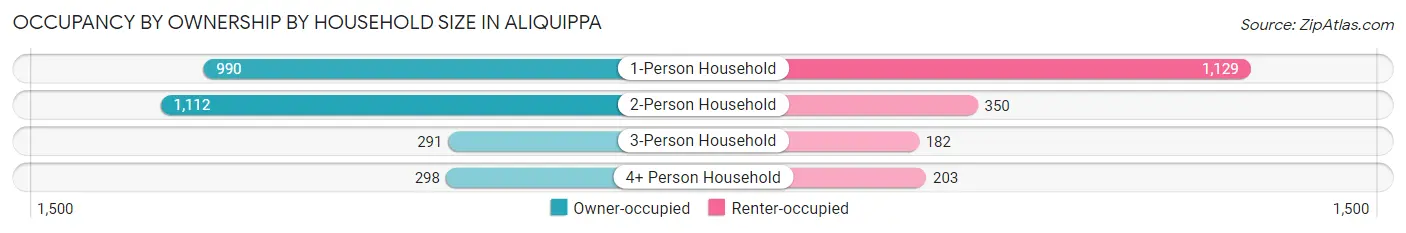
| Household Size | Owner-occupied | Renter-occupied |
| 1-Person Household | 990 (46.7%) | 1,129 (53.3%) |
| 2-Person Household | 1,112 (76.1%) | 350 (23.9%) |
| 3-Person Household | 291 (61.5%) | 182 (38.5%) |
| 4+ Person Household | 298 (59.5%) | 203 (40.5%) |
| Total Housing Units | 2,691 (59.1%) | 1,864 (40.9%) |
Occupancy by Educational Attainment in Aliquippa
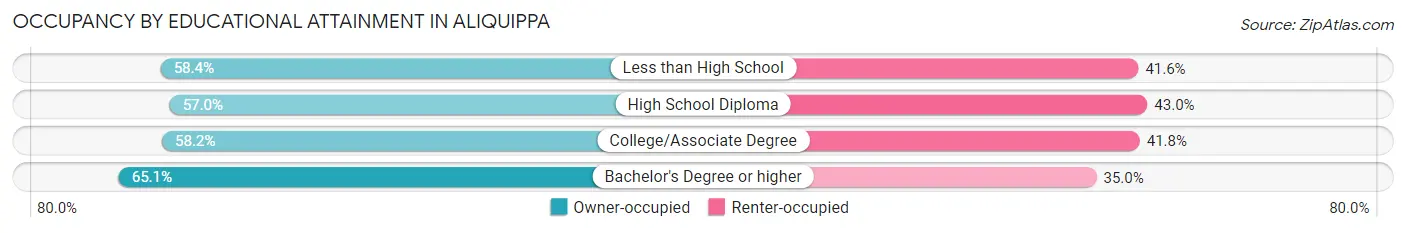
| Household Size | Owner-occupied | Renter-occupied |
| Less than High School | 233 (58.4%) | 166 (41.6%) |
| High School Diploma | 927 (57.0%) | 700 (43.0%) |
| College/Associate Degree | 967 (58.2%) | 695 (41.8%) |
| Bachelor's Degree or higher | 564 (65.0%) | 303 (34.9%) |
Occupancy by Age of Householder in Aliquippa
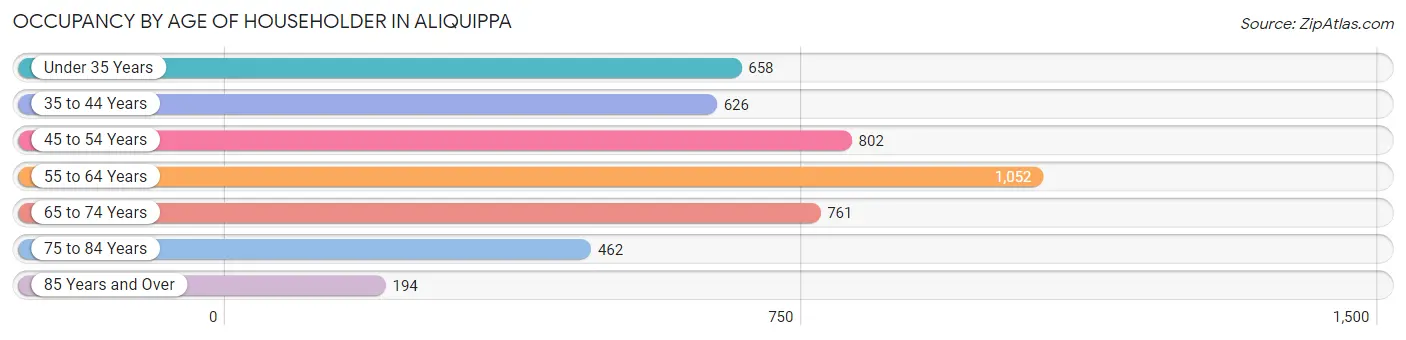
| Age Bracket | # Households | % Households |
| Under 35 Years | 658 | 14.4% |
| 35 to 44 Years | 626 | 13.7% |
| 45 to 54 Years | 802 | 17.6% |
| 55 to 64 Years | 1,052 | 23.1% |
| 65 to 74 Years | 761 | 16.7% |
| 75 to 84 Years | 462 | 10.1% |
| 85 Years and Over | 194 | 4.3% |
| Total | 4,555 | 100.0% |
Housing Finances in Aliquippa
Median Income by Occupancy in Aliquippa
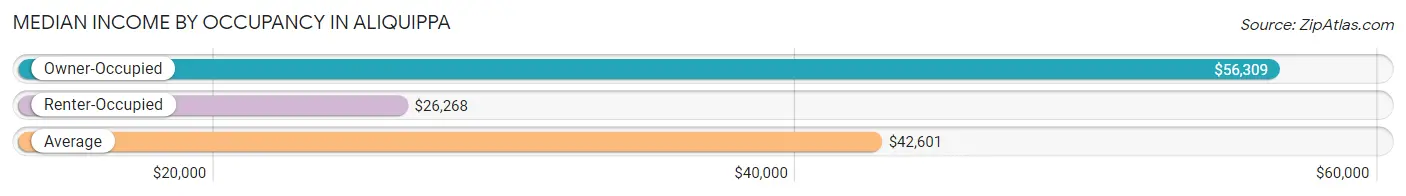
| Occupancy Type | # Households | Median Income |
| Owner-Occupied | 2,691 (59.1%) | $56,309 |
| Renter-Occupied | 1,864 (40.9%) | $26,268 |
| Average | 4,555 (100.0%) | $42,601 |
Occupancy by Householder Income Bracket in Aliquippa
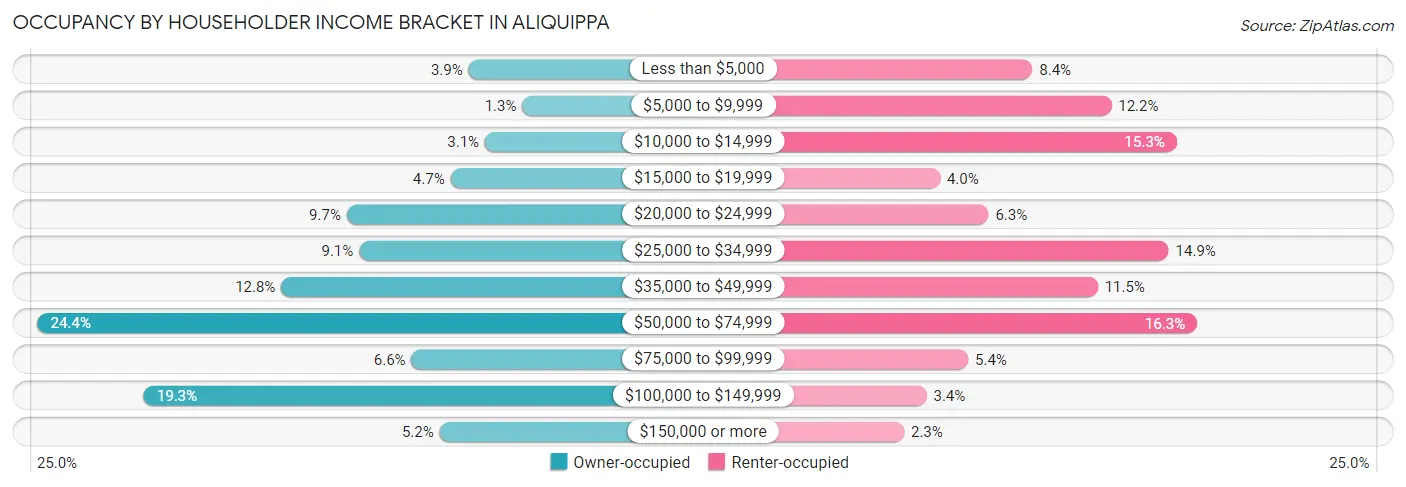
| Income Bracket | Owner-occupied | Renter-occupied |
| Less than $5,000 | 104 (3.9%) | 157 (8.4%) |
| $5,000 to $9,999 | 35 (1.3%) | 227 (12.2%) |
| $10,000 to $14,999 | 83 (3.1%) | 285 (15.3%) |
| $15,000 to $19,999 | 127 (4.7%) | 75 (4.0%) |
| $20,000 to $24,999 | 260 (9.7%) | 118 (6.3%) |
| $25,000 to $34,999 | 244 (9.1%) | 278 (14.9%) |
| $35,000 to $49,999 | 344 (12.8%) | 215 (11.5%) |
| $50,000 to $74,999 | 656 (24.4%) | 303 (16.3%) |
| $75,000 to $99,999 | 177 (6.6%) | 100 (5.4%) |
| $100,000 to $149,999 | 520 (19.3%) | 63 (3.4%) |
| $150,000 or more | 141 (5.2%) | 43 (2.3%) |
| Total | 2,691 (100.0%) | 1,864 (100.0%) |
Monthly Housing Cost Tiers in Aliquippa
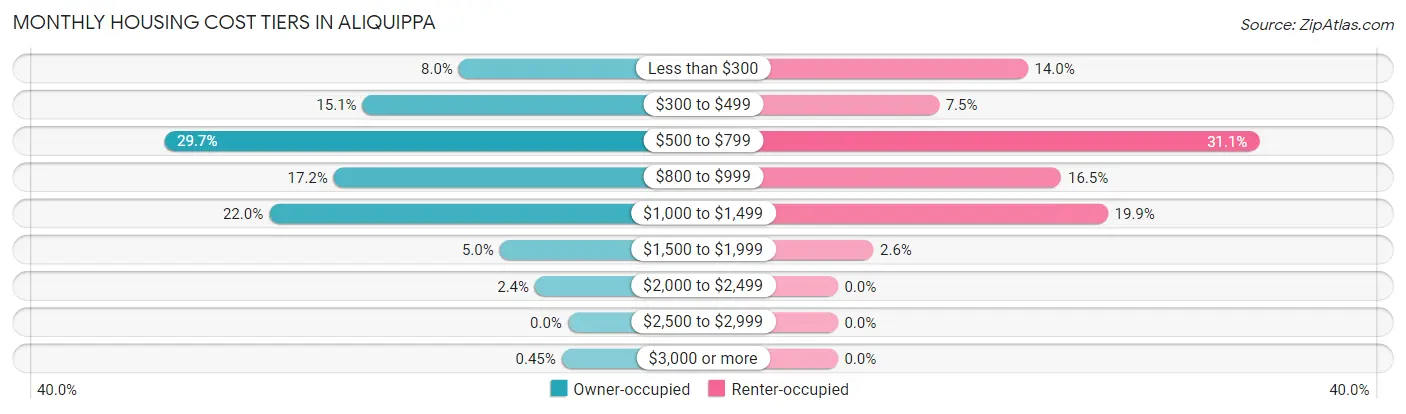
| Monthly Cost | Owner-occupied | Renter-occupied |
| Less than $300 | 216 (8.0%) | 261 (14.0%) |
| $300 to $499 | 407 (15.1%) | 139 (7.5%) |
| $500 to $799 | 800 (29.7%) | 579 (31.1%) |
| $800 to $999 | 464 (17.2%) | 307 (16.5%) |
| $1,000 to $1,499 | 592 (22.0%) | 371 (19.9%) |
| $1,500 to $1,999 | 135 (5.0%) | 49 (2.6%) |
| $2,000 to $2,499 | 65 (2.4%) | 0 (0.0%) |
| $2,500 to $2,999 | 0 (0.0%) | 0 (0.0%) |
| $3,000 or more | 12 (0.4%) | 0 (0.0%) |
| Total | 2,691 (100.0%) | 1,864 (100.0%) |
Physical Housing Characteristics in Aliquippa
Housing Structures in Aliquippa
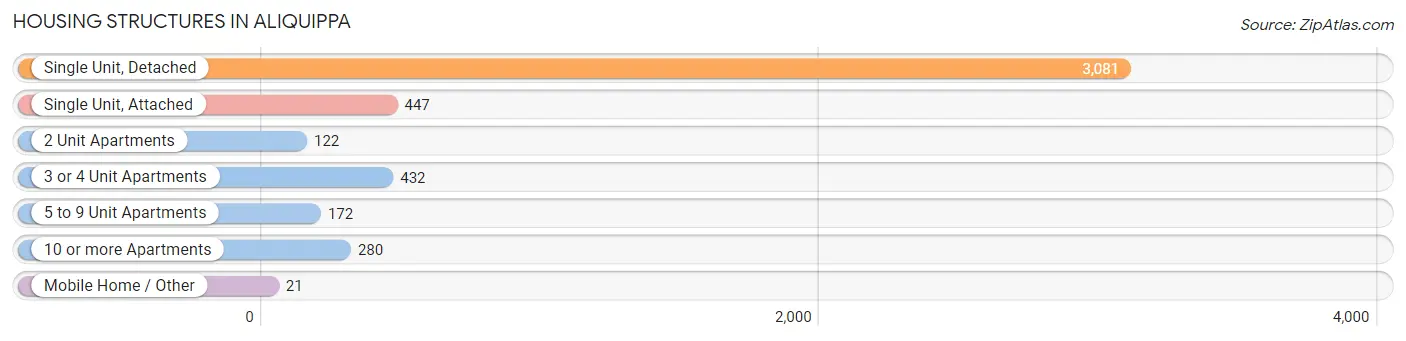
| Structure Type | # Housing Units | % Housing Units |
| Single Unit, Detached | 3,081 | 67.6% |
| Single Unit, Attached | 447 | 9.8% |
| 2 Unit Apartments | 122 | 2.7% |
| 3 or 4 Unit Apartments | 432 | 9.5% |
| 5 to 9 Unit Apartments | 172 | 3.8% |
| 10 or more Apartments | 280 | 6.1% |
| Mobile Home / Other | 21 | 0.5% |
| Total | 4,555 | 100.0% |
Housing Structures by Occupancy in Aliquippa
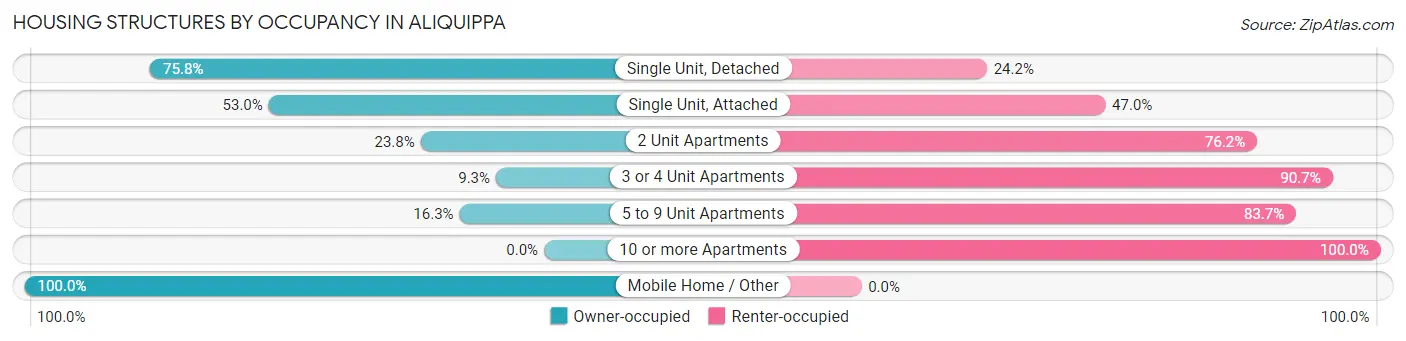
| Structure Type | Owner-occupied | Renter-occupied |
| Single Unit, Detached | 2,336 (75.8%) | 745 (24.2%) |
| Single Unit, Attached | 237 (53.0%) | 210 (47.0%) |
| 2 Unit Apartments | 29 (23.8%) | 93 (76.2%) |
| 3 or 4 Unit Apartments | 40 (9.3%) | 392 (90.7%) |
| 5 to 9 Unit Apartments | 28 (16.3%) | 144 (83.7%) |
| 10 or more Apartments | 0 (0.0%) | 280 (100.0%) |
| Mobile Home / Other | 21 (100.0%) | 0 (0.0%) |
| Total | 2,691 (59.1%) | 1,864 (40.9%) |
Housing Structures by Number of Rooms in Aliquippa
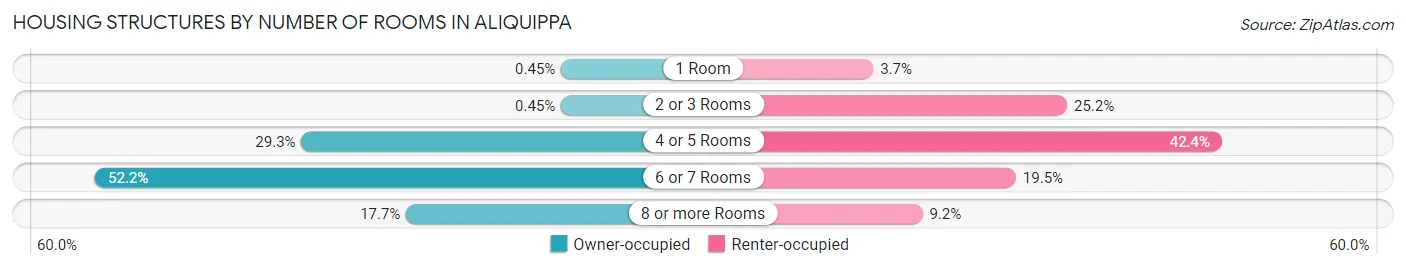
| Number of Rooms | Owner-occupied | Renter-occupied |
| 1 Room | 12 (0.4%) | 69 (3.7%) |
| 2 or 3 Rooms | 12 (0.4%) | 470 (25.2%) |
| 4 or 5 Rooms | 788 (29.3%) | 790 (42.4%) |
| 6 or 7 Rooms | 1,404 (52.2%) | 364 (19.5%) |
| 8 or more Rooms | 475 (17.6%) | 171 (9.2%) |
| Total | 2,691 (100.0%) | 1,864 (100.0%) |
Housing Structure by Heating Type in Aliquippa
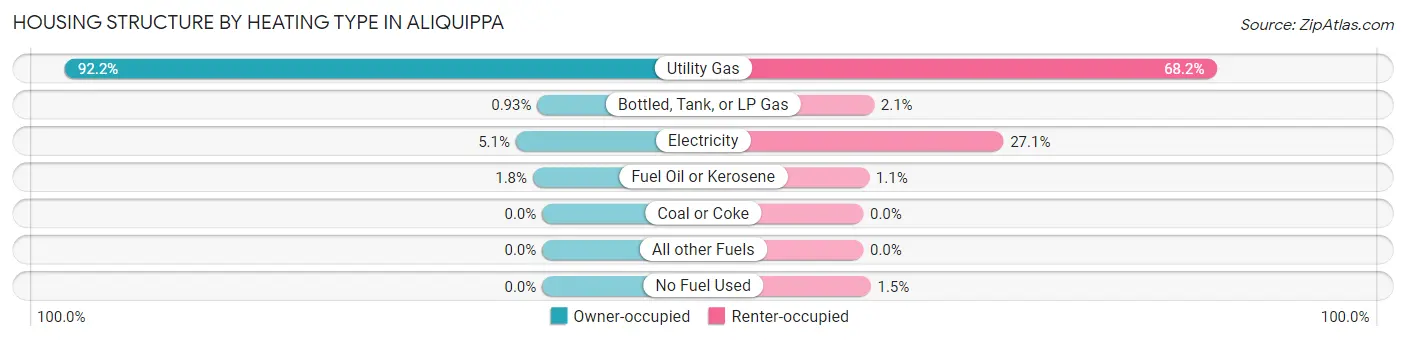
| Heating Type | Owner-occupied | Renter-occupied |
| Utility Gas | 2,481 (92.2%) | 1,272 (68.2%) |
| Bottled, Tank, or LP Gas | 25 (0.9%) | 39 (2.1%) |
| Electricity | 137 (5.1%) | 505 (27.1%) |
| Fuel Oil or Kerosene | 48 (1.8%) | 21 (1.1%) |
| Coal or Coke | 0 (0.0%) | 0 (0.0%) |
| All other Fuels | 0 (0.0%) | 0 (0.0%) |
| No Fuel Used | 0 (0.0%) | 27 (1.5%) |
| Total | 2,691 (100.0%) | 1,864 (100.0%) |
Household Vehicle Usage in Aliquippa
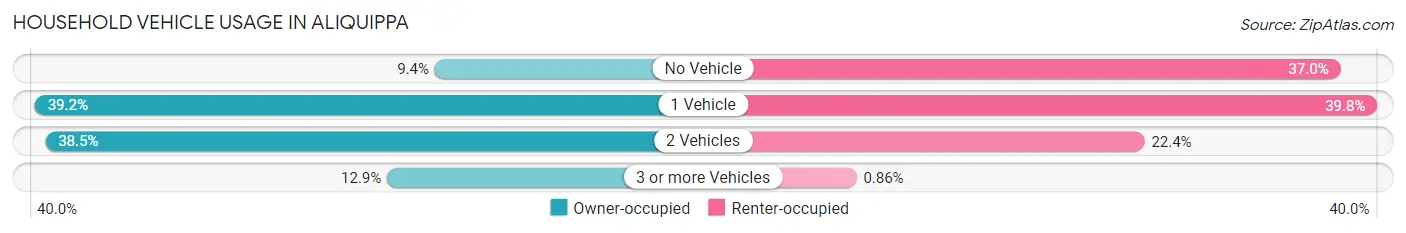
| Vehicles per Household | Owner-occupied | Renter-occupied |
| No Vehicle | 252 (9.4%) | 690 (37.0%) |
| 1 Vehicle | 1,056 (39.2%) | 741 (39.8%) |
| 2 Vehicles | 1,035 (38.5%) | 417 (22.4%) |
| 3 or more Vehicles | 348 (12.9%) | 16 (0.9%) |
| Total | 2,691 (100.0%) | 1,864 (100.0%) |
Real Estate & Mortgages in Aliquippa
Real Estate and Mortgage Overview in Aliquippa
| Characteristic | Without Mortgage | With Mortgage |
| Housing Units | 1,344 | 1,347 |
| Median Property Value | $91,100 | $89,600 |
| Median Household Income | $47,937 | $33 |
| Monthly Housing Costs | $561 | $12 |
| Real Estate Taxes | $1,741 | $119 |
Property Value by Mortgage Status in Aliquippa
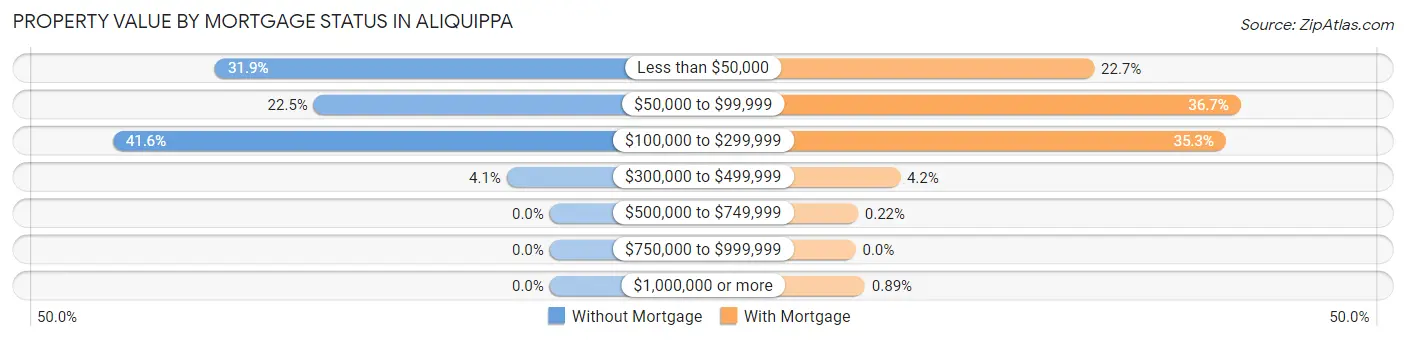
| Property Value | Without Mortgage | With Mortgage |
| Less than $50,000 | 428 (31.9%) | 306 (22.7%) |
| $50,000 to $99,999 | 302 (22.5%) | 494 (36.7%) |
| $100,000 to $299,999 | 559 (41.6%) | 475 (35.3%) |
| $300,000 to $499,999 | 55 (4.1%) | 57 (4.2%) |
| $500,000 to $749,999 | 0 (0.0%) | 3 (0.2%) |
| $750,000 to $999,999 | 0 (0.0%) | 0 (0.0%) |
| $1,000,000 or more | 0 (0.0%) | 12 (0.9%) |
| Total | 1,344 (100.0%) | 1,347 (100.0%) |
Household Income by Mortgage Status in Aliquippa
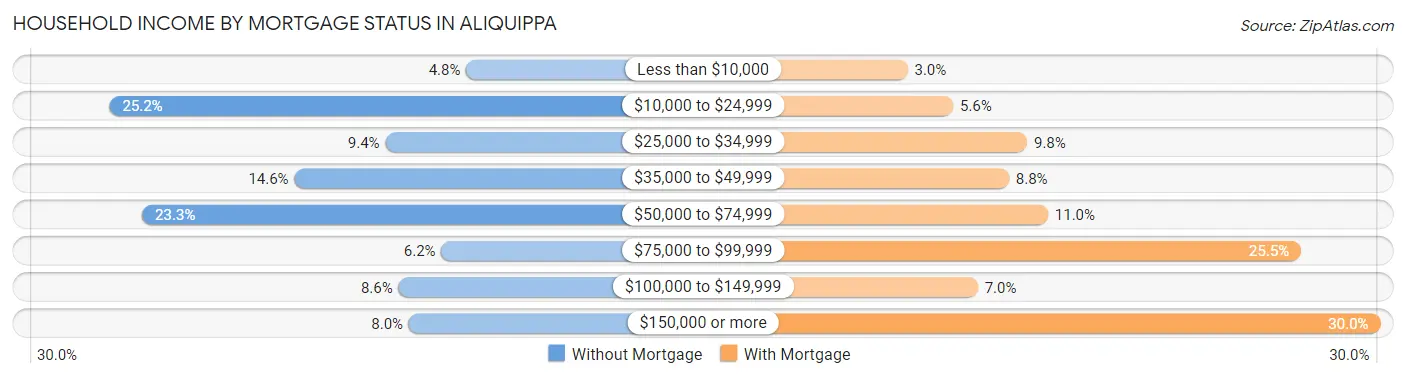
| Household Income | Without Mortgage | With Mortgage |
| Less than $10,000 | 64 (4.8%) | 40 (3.0%) |
| $10,000 to $24,999 | 338 (25.2%) | 75 (5.6%) |
| $25,000 to $34,999 | 126 (9.4%) | 132 (9.8%) |
| $35,000 to $49,999 | 196 (14.6%) | 118 (8.8%) |
| $50,000 to $74,999 | 313 (23.3%) | 148 (11.0%) |
| $75,000 to $99,999 | 83 (6.2%) | 343 (25.5%) |
| $100,000 to $149,999 | 116 (8.6%) | 94 (7.0%) |
| $150,000 or more | 108 (8.0%) | 404 (30.0%) |
| Total | 1,344 (100.0%) | 1,347 (100.0%) |
Property Value to Household Income Ratio in Aliquippa
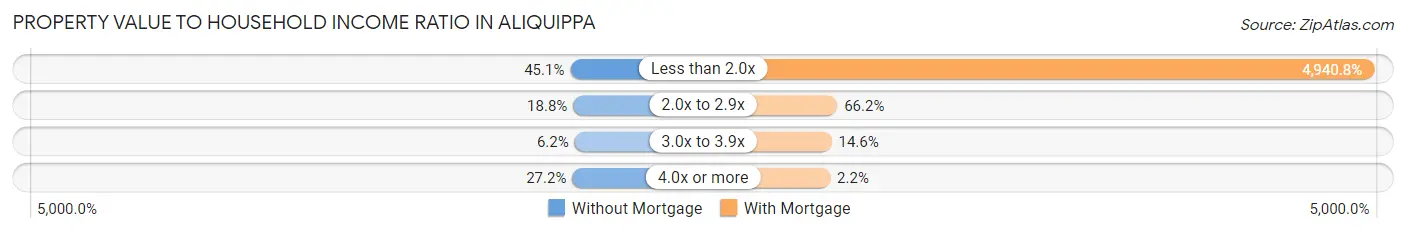
| Value-to-Income Ratio | Without Mortgage | With Mortgage |
| Less than 2.0x | 606 (45.1%) | 66,552 (4,940.8%) |
| 2.0x to 2.9x | 252 (18.8%) | 892 (66.2%) |
| 3.0x to 3.9x | 83 (6.2%) | 196 (14.5%) |
| 4.0x or more | 365 (27.2%) | 29 (2.1%) |
| Total | 1,344 (100.0%) | 1,347 (100.0%) |
Real Estate Taxes by Mortgage Status in Aliquippa
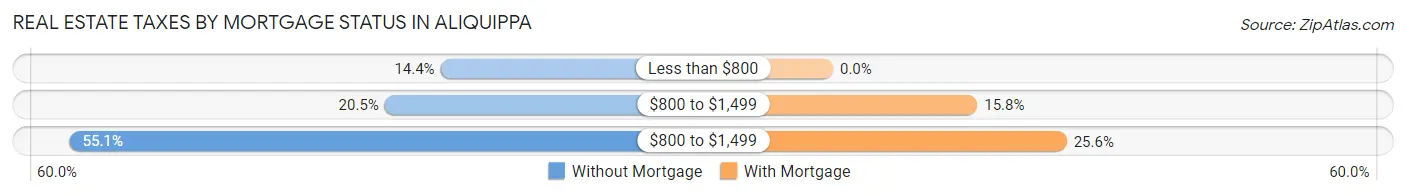
| Property Taxes | Without Mortgage | With Mortgage |
| Less than $800 | 194 (14.4%) | 0 (0.0%) |
| $800 to $1,499 | 276 (20.5%) | 213 (15.8%) |
| $800 to $1,499 | 740 (55.1%) | 345 (25.6%) |
| Total | 1,344 (100.0%) | 1,347 (100.0%) |
Health & Disability in Aliquippa
Health Insurance Coverage by Age in Aliquippa
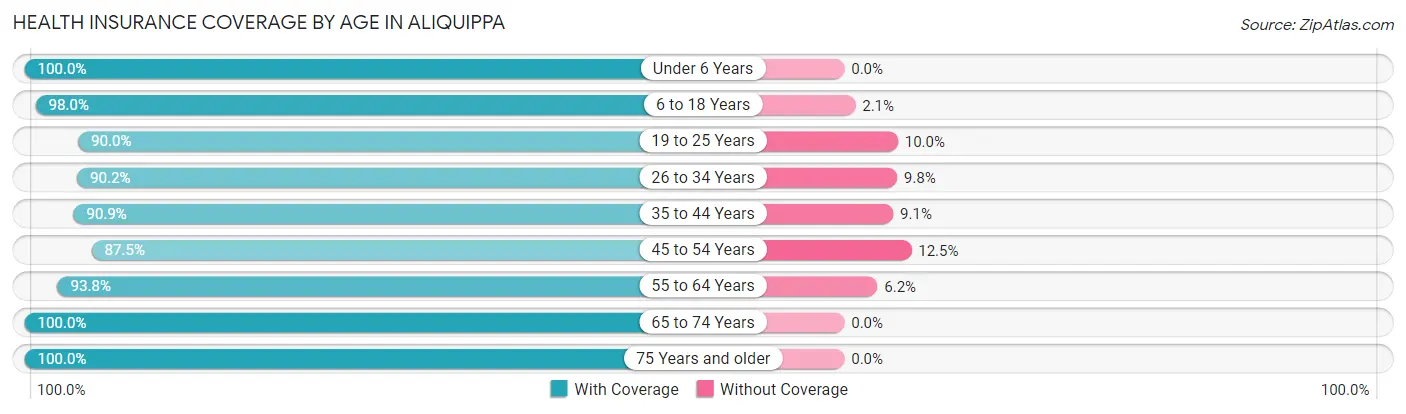
| Age Bracket | With Coverage | Without Coverage |
| Under 6 Years | 359 (100.0%) | 0 (0.0%) |
| 6 to 18 Years | 1,144 (98.0%) | 24 (2.1%) |
| 19 to 25 Years | 722 (90.0%) | 80 (10.0%) |
| 26 to 34 Years | 699 (90.2%) | 76 (9.8%) |
| 35 to 44 Years | 1,068 (90.9%) | 107 (9.1%) |
| 45 to 54 Years | 1,030 (87.5%) | 147 (12.5%) |
| 55 to 64 Years | 1,478 (93.8%) | 97 (6.2%) |
| 65 to 74 Years | 1,104 (100.0%) | 0 (0.0%) |
| 75 Years and older | 1,027 (100.0%) | 0 (0.0%) |
| Total | 8,631 (94.2%) | 531 (5.8%) |
Health Insurance Coverage by Citizenship Status in Aliquippa
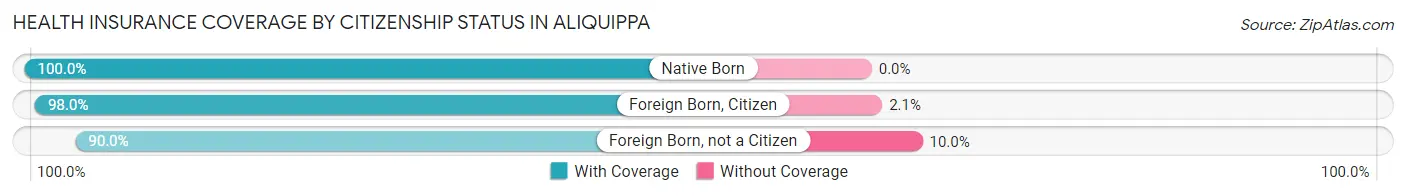
| Citizenship Status | With Coverage | Without Coverage |
| Native Born | 359 (100.0%) | 0 (0.0%) |
| Foreign Born, Citizen | 1,144 (98.0%) | 24 (2.1%) |
| Foreign Born, not a Citizen | 722 (90.0%) | 80 (10.0%) |
Health Insurance Coverage by Household Income in Aliquippa
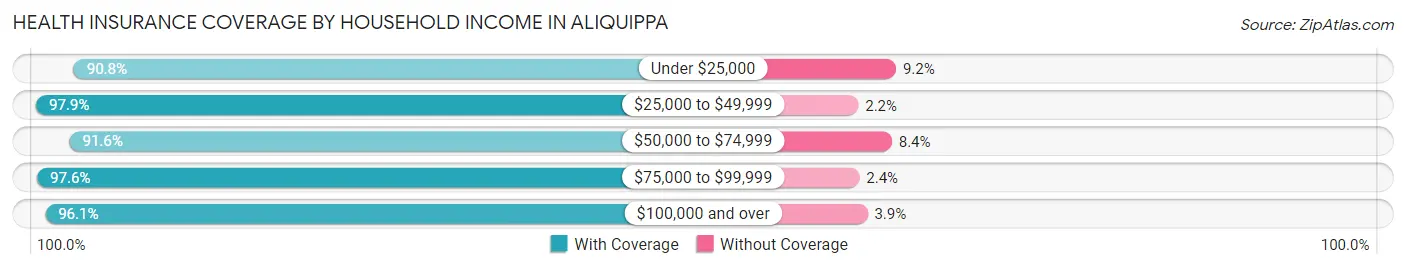
| Household Income | With Coverage | Without Coverage |
| Under $25,000 | 2,009 (90.8%) | 204 (9.2%) |
| $25,000 to $49,999 | 1,729 (97.9%) | 38 (2.1%) |
| $50,000 to $74,999 | 2,065 (91.6%) | 190 (8.4%) |
| $75,000 to $99,999 | 746 (97.6%) | 18 (2.4%) |
| $100,000 and over | 2,014 (96.1%) | 81 (3.9%) |
Public vs Private Health Insurance Coverage by Age in Aliquippa
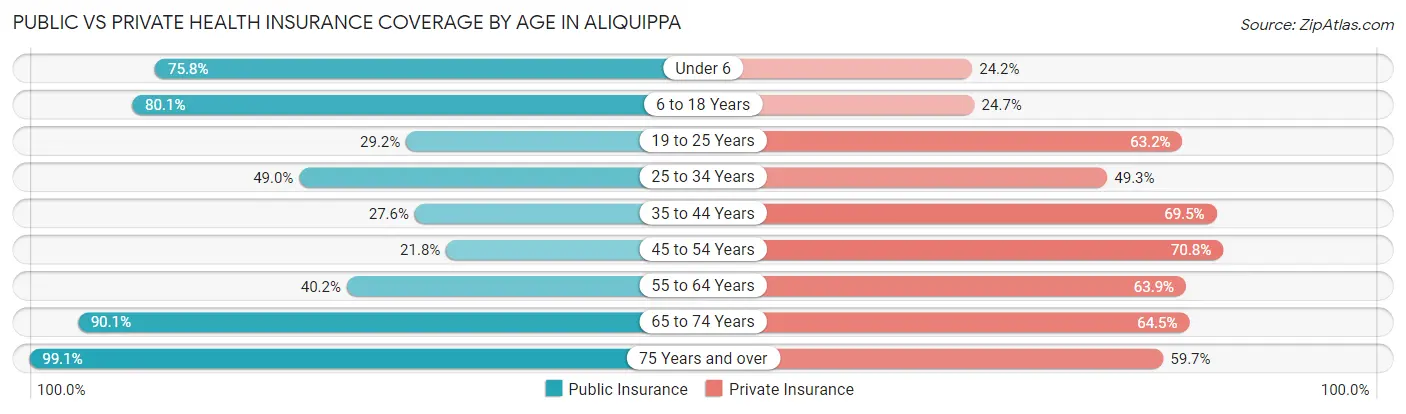
| Age Bracket | Public Insurance | Private Insurance |
| Under 6 | 272 (75.8%) | 87 (24.2%) |
| 6 to 18 Years | 935 (80.0%) | 288 (24.7%) |
| 19 to 25 Years | 234 (29.2%) | 507 (63.2%) |
| 25 to 34 Years | 380 (49.0%) | 382 (49.3%) |
| 35 to 44 Years | 324 (27.6%) | 817 (69.5%) |
| 45 to 54 Years | 256 (21.7%) | 833 (70.8%) |
| 55 to 64 Years | 633 (40.2%) | 1,006 (63.9%) |
| 65 to 74 Years | 995 (90.1%) | 712 (64.5%) |
| 75 Years and over | 1,018 (99.1%) | 613 (59.7%) |
| Total | 5,047 (55.1%) | 5,245 (57.3%) |
Disability Status by Sex by Age in Aliquippa
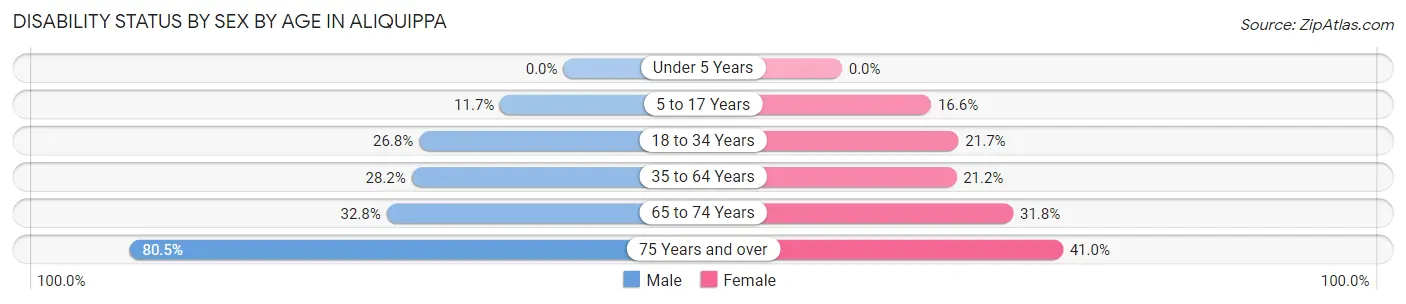
| Age Bracket | Male | Female |
| Under 5 Years | 0 (0.0%) | 0 (0.0%) |
| 5 to 17 Years | 72 (11.7%) | 97 (16.6%) |
| 18 to 34 Years | 207 (26.8%) | 186 (21.6%) |
| 35 to 64 Years | 509 (28.2%) | 450 (21.2%) |
| 65 to 74 Years | 192 (32.8%) | 165 (31.8%) |
| 75 Years and over | 285 (80.5%) | 276 (41.0%) |
Disability Class by Sex by Age in Aliquippa
Disability Class: Hearing Difficulty
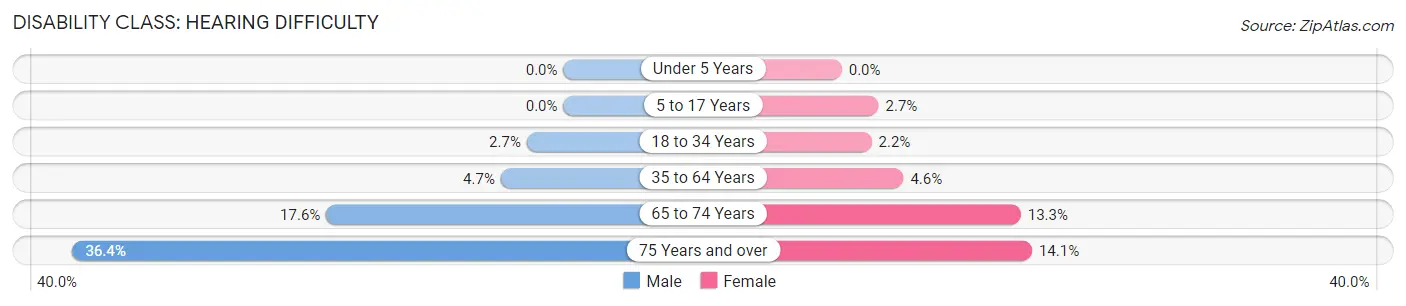
| Age Bracket | Male | Female |
| Under 5 Years | 0 (0.0%) | 0 (0.0%) |
| 5 to 17 Years | 0 (0.0%) | 16 (2.7%) |
| 18 to 34 Years | 21 (2.7%) | 19 (2.2%) |
| 35 to 64 Years | 84 (4.6%) | 97 (4.6%) |
| 65 to 74 Years | 103 (17.6%) | 69 (13.3%) |
| 75 Years and over | 129 (36.4%) | 95 (14.1%) |
Disability Class: Vision Difficulty
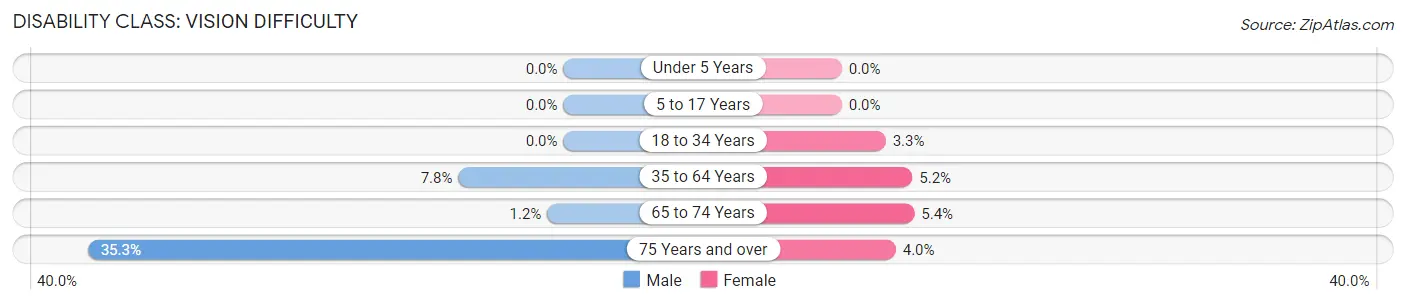
| Age Bracket | Male | Female |
| Under 5 Years | 0 (0.0%) | 0 (0.0%) |
| 5 to 17 Years | 0 (0.0%) | 0 (0.0%) |
| 18 to 34 Years | 0 (0.0%) | 28 (3.3%) |
| 35 to 64 Years | 141 (7.8%) | 111 (5.2%) |
| 65 to 74 Years | 7 (1.2%) | 28 (5.4%) |
| 75 Years and over | 125 (35.3%) | 27 (4.0%) |
Disability Class: Cognitive Difficulty
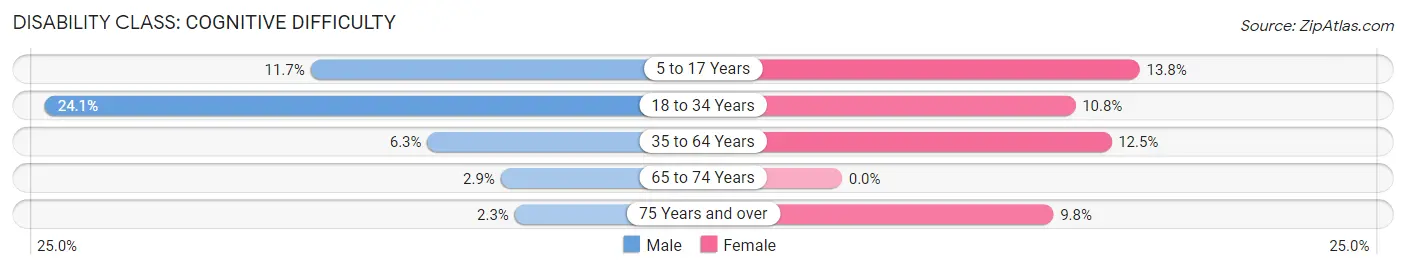
| Age Bracket | Male | Female |
| 5 to 17 Years | 72 (11.7%) | 81 (13.8%) |
| 18 to 34 Years | 186 (24.1%) | 93 (10.8%) |
| 35 to 64 Years | 114 (6.3%) | 265 (12.5%) |
| 65 to 74 Years | 17 (2.9%) | 0 (0.0%) |
| 75 Years and over | 8 (2.3%) | 66 (9.8%) |
Disability Class: Ambulatory Difficulty
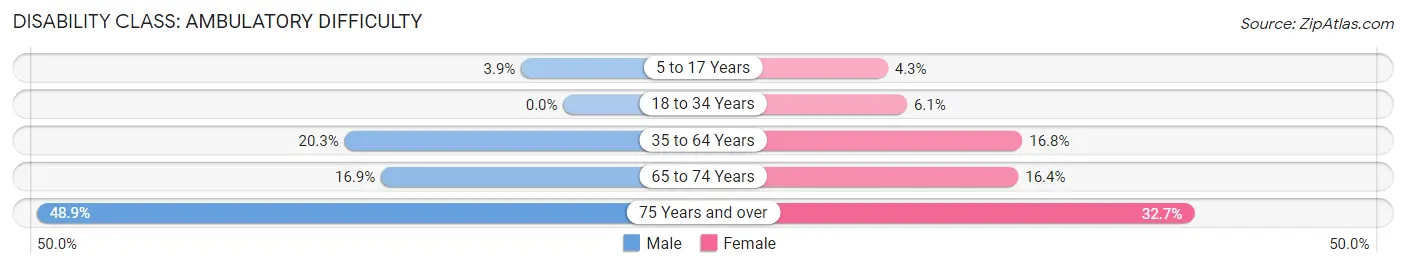
| Age Bracket | Male | Female |
| 5 to 17 Years | 24 (3.9%) | 25 (4.3%) |
| 18 to 34 Years | 0 (0.0%) | 52 (6.0%) |
| 35 to 64 Years | 367 (20.3%) | 355 (16.8%) |
| 65 to 74 Years | 99 (16.9%) | 85 (16.4%) |
| 75 Years and over | 173 (48.9%) | 220 (32.7%) |
Disability Class: Self-Care Difficulty
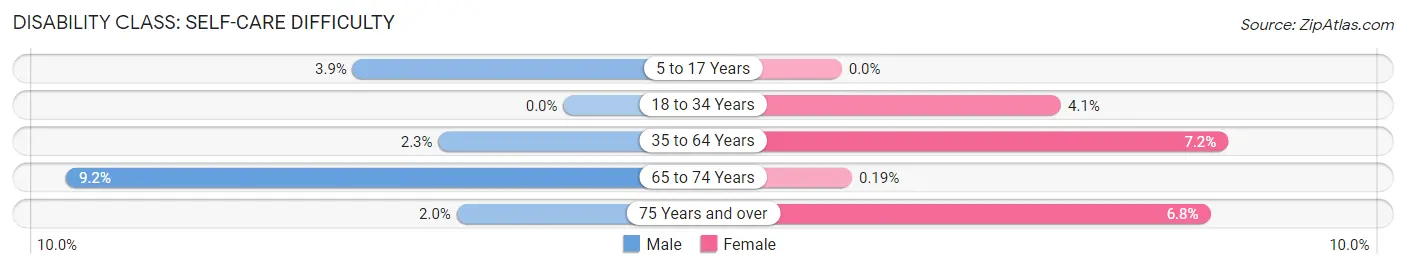
| Age Bracket | Male | Female |
| 5 to 17 Years | 24 (3.9%) | 0 (0.0%) |
| 18 to 34 Years | 0 (0.0%) | 35 (4.1%) |
| 35 to 64 Years | 42 (2.3%) | 152 (7.2%) |
| 65 to 74 Years | 54 (9.2%) | 1 (0.2%) |
| 75 Years and over | 7 (2.0%) | 46 (6.8%) |
Technology Access in Aliquippa
Computing Device Access in Aliquippa
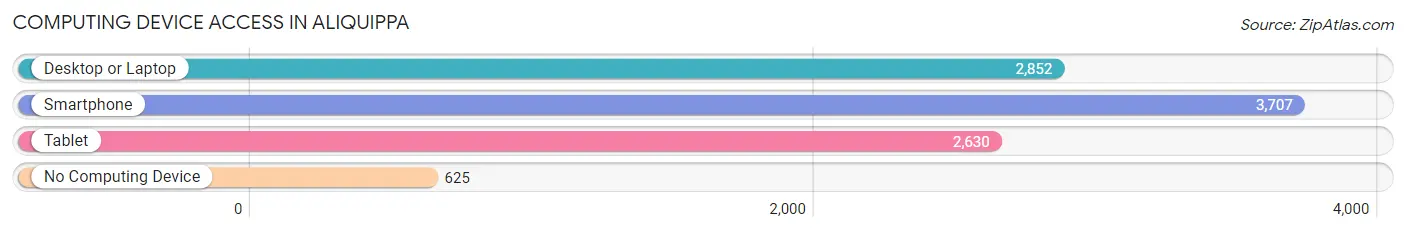
| Device Type | # Households | % Households |
| Desktop or Laptop | 2,852 | 62.6% |
| Smartphone | 3,707 | 81.4% |
| Tablet | 2,630 | 57.7% |
| No Computing Device | 625 | 13.7% |
| Total | 4,555 | 100.0% |
Internet Access in Aliquippa
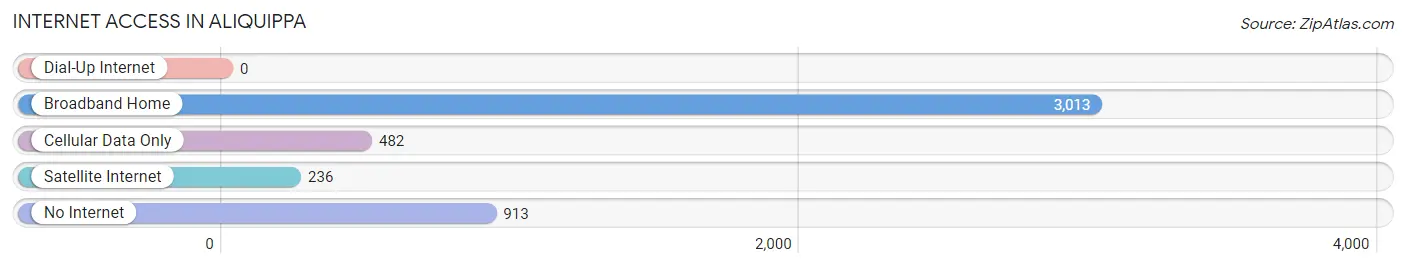
| Internet Type | # Households | % Households |
| Dial-Up Internet | 0 | 0.0% |
| Broadband Home | 3,013 | 66.1% |
| Cellular Data Only | 482 | 10.6% |
| Satellite Internet | 236 | 5.2% |
| No Internet | 913 | 20.0% |
| Total | 4,555 | 100.0% |
Aliquippa Summary
Aliquippa, Pennsylvania is a small city located in Beaver County, Pennsylvania. It is situated along the Ohio River, approximately 25 miles northwest of Pittsburgh. The city has a population of approximately 9,000 people and is part of the Pittsburgh metropolitan area.
History
Aliquippa was founded in 1793 by James Hillman, a Revolutionary War veteran. The city was originally known as Logstown, but was renamed Aliquippa in 1892 after the Native American tribe of the same name. The city was incorporated in 1905 and has since grown to become a major industrial center.
The city was home to the Jones and Laughlin Steel Company, which was one of the largest steel producers in the United States. The company employed thousands of people in the city and was a major contributor to the local economy. The company closed in 1985, leaving the city with a large number of unemployed workers.
Geography
Aliquippa is located in Beaver County, Pennsylvania. It is situated along the Ohio River, approximately 25 miles northwest of Pittsburgh. The city has a total area of 4.2 square miles, all of which is land. The city is located in the Allegheny Plateau region of Pennsylvania and is surrounded by rolling hills and forests.
Economy
Aliquippa’s economy is largely based on manufacturing and services. The city is home to several large manufacturing companies, including the Aliquippa Works of U.S. Steel, which produces steel products. Other major employers in the city include the Aliquippa Hospital, the Aliquippa School District, and the Aliquippa Post Office.
The city also has a large retail sector, with several shopping centers and stores located in the city. The city is also home to several restaurants, bars, and other entertainment venues.
Demographics
As of the 2010 census, Aliquippa had a population of 9,438 people. The racial makeup of the city was 79.3% White, 15.2% African American, 0.3% Native American, 0.7% Asian, 0.1% Pacific Islander, and 4.4% from other races. Hispanic or Latino of any race were 2.2% of the population.
The median household income in Aliquippa was $30,945, and the median family income was $37,945. The per capita income for the city was $17,845. About 17.2% of families and 20.3% of the population were below the poverty line, including 28.3% of those under age 18 and 11.2% of those age 65 or over.
Common Questions
What is Per Capita Income in Aliquippa?
Per Capita income in Aliquippa is $27,636.
What is the Median Family Income in Aliquippa?
Median Family Income in Aliquippa is $65,814.
What is the Median Household income in Aliquippa?
Median Household Income in Aliquippa is $42,601.
What is Income or Wage Gap in Aliquippa?
Income or Wage Gap in Aliquippa is 13.0%.
Women in Aliquippa earn 87.0 cents for every dollar earned by a man.
What is Inequality or Gini Index in Aliquippa?
Inequality or Gini Index in Aliquippa is 0.45.
What is the Total Population of Aliquippa?
Total Population of Aliquippa is 9,198.
What is the Total Male Population of Aliquippa?
Total Male Population of Aliquippa is 4,287.
What is the Total Female Population of Aliquippa?
Total Female Population of Aliquippa is 4,911.
What is the Ratio of Males per 100 Females in Aliquippa?
There are 87.29 Males per 100 Females in Aliquippa.
What is the Ratio of Females per 100 Males in Aliquippa?
There are 114.56 Females per 100 Males in Aliquippa.
What is the Median Population Age in Aliquippa?
Median Population Age in Aliquippa is 49.0 Years.
What is the Average Family Size in Aliquippa
Average Family Size in Aliquippa is 2.8 People.
What is the Average Household Size in Aliquippa
Average Household Size in Aliquippa is 2.0 People.
How Large is the Labor Force in Aliquippa?
There are 4,355 People in the Labor Forcein in Aliquippa.
What is the Percentage of People in the Labor Force in Aliquippa?
55.2% of People are in the Labor Force in Aliquippa.
What is the Unemployment Rate in Aliquippa?
Unemployment Rate in Aliquippa is 8.4%.